Conway, AR Map & Demographics
Conway Map
Conway Overview
$31,301
PER CAPITA INCOME
$77,689
AVG FAMILY INCOME
$54,036
AVG HOUSEHOLD INCOME
23.4%
WAGE / INCOME GAP [ % ]
76.6¢/ $1
WAGE / INCOME GAP [ $ ]
$10,603
FAMILY INCOME DEFICIT
0.50
INEQUALITY / GINI INDEX
65,159
TOTAL POPULATION
30,836
MALE POPULATION
34,323
FEMALE POPULATION
89.84
MALES / 100 FEMALES
111.31
FEMALES / 100 MALES
29.0
MEDIAN AGE
3.0
AVG FAMILY SIZE
2.4
AVG HOUSEHOLD SIZE
33,066
LABOR FORCE [ PEOPLE ]
62.2%
PERCENT IN LABOR FORCE
3.0%
UNEMPLOYMENT RATE
Conway Area Codes
Income in Conway
Income Overview in Conway
Per Capita Income in Conway is $31,301, while median incomes of families and households are $77,689 and $54,036 respectively.
| Characteristic | Number | Measure |
| Per Capita Income | 65,159 | $31,301 |
| Median Family Income | 14,234 | $77,689 |
| Mean Family Income | 14,234 | $104,998 |
| Median Household Income | 25,451 | $54,036 |
| Mean Household Income | 25,451 | $78,367 |
| Income Deficit | 14,234 | $10,603 |
| Wage / Income Gap (%) | 65,159 | 23.45% |
| Wage / Income Gap ($) | 65,159 | 76.55¢ per $1 |
| Gini / Inequality Index | 65,159 | 0.50 |
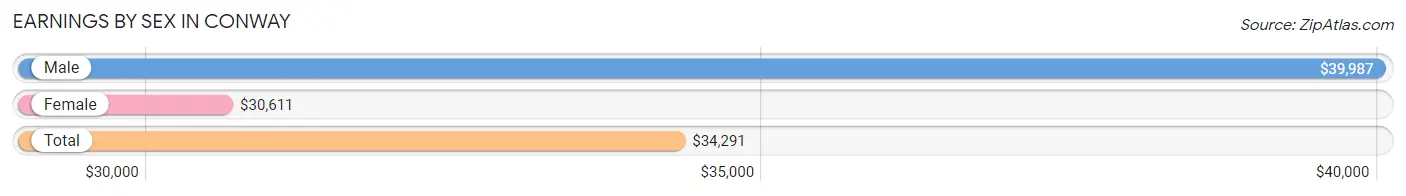
Earnings by Sex in Conway
Average Earnings in Conway are $34,291, $39,987 for men and $30,611 for women, a difference of 23.4%.
| Sex | Number | Average Earnings |
| Male | 17,387 (49.6%) | $39,987 |
| Female | 17,660 (50.4%) | $30,611 |
| Total | 35,047 (100.0%) | $34,291 |
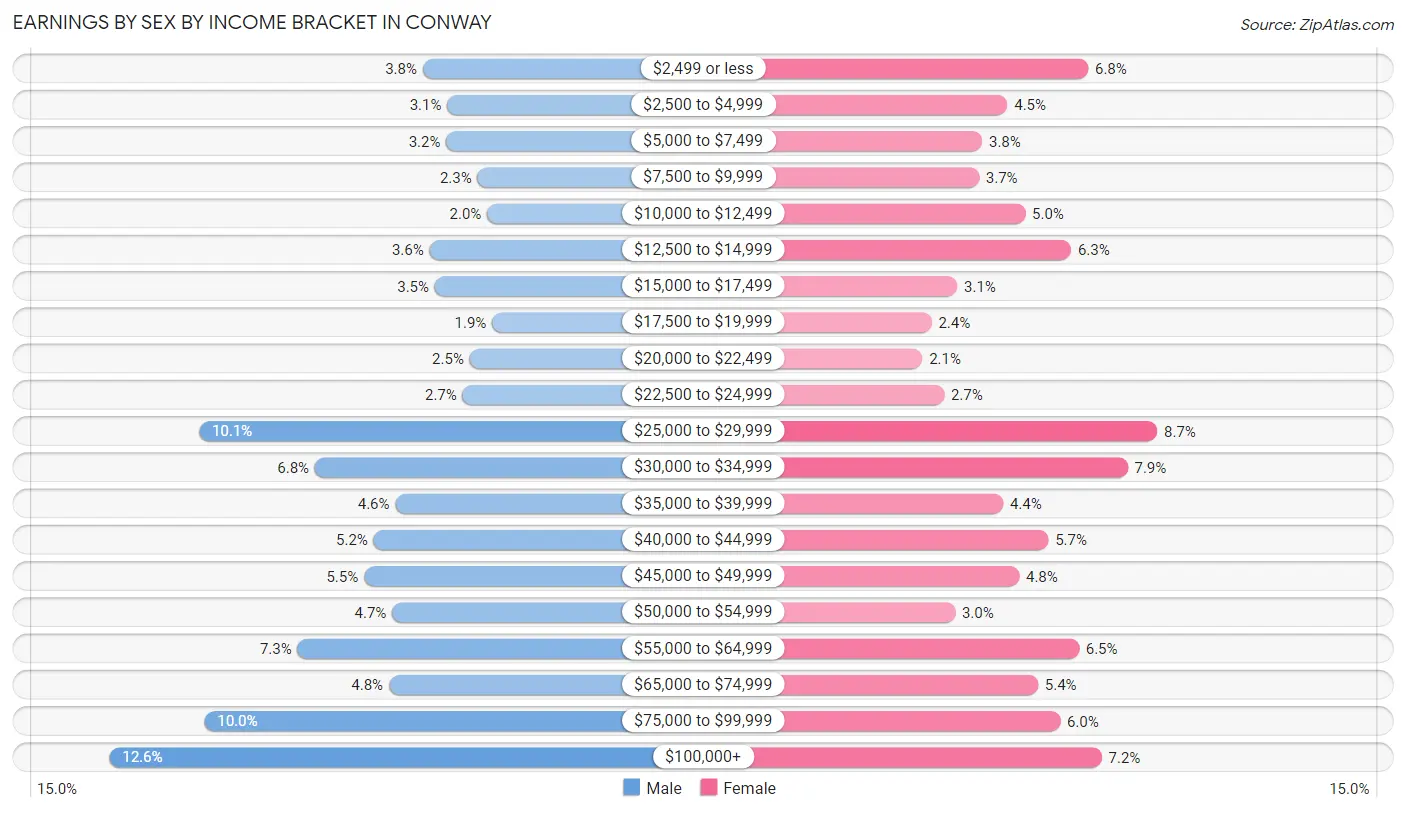
Earnings by Sex by Income Bracket in Conway
The most common earnings brackets in Conway are $100,000+ for men (2,195 | 12.6%) and $25,000 to $29,999 for women (1,540 | 8.7%).
| Income | Male | Female |
| $2,499 or less | 663 (3.8%) | 1,198 (6.8%) |
| $2,500 to $4,999 | 543 (3.1%) | 796 (4.5%) |
| $5,000 to $7,499 | 548 (3.2%) | 671 (3.8%) |
| $7,500 to $9,999 | 395 (2.3%) | 655 (3.7%) |
| $10,000 to $12,499 | 348 (2.0%) | 884 (5.0%) |
| $12,500 to $14,999 | 629 (3.6%) | 1,112 (6.3%) |
| $15,000 to $17,499 | 603 (3.5%) | 547 (3.1%) |
| $17,500 to $19,999 | 324 (1.9%) | 421 (2.4%) |
| $20,000 to $22,499 | 433 (2.5%) | 374 (2.1%) |
| $22,500 to $24,999 | 467 (2.7%) | 482 (2.7%) |
| $25,000 to $29,999 | 1,756 (10.1%) | 1,540 (8.7%) |
| $30,000 to $34,999 | 1,190 (6.8%) | 1,394 (7.9%) |
| $35,000 to $39,999 | 797 (4.6%) | 776 (4.4%) |
| $40,000 to $44,999 | 903 (5.2%) | 999 (5.7%) |
| $45,000 to $49,999 | 950 (5.5%) | 854 (4.8%) |
| $50,000 to $54,999 | 812 (4.7%) | 536 (3.0%) |
| $55,000 to $64,999 | 1,274 (7.3%) | 1,152 (6.5%) |
| $65,000 to $74,999 | 827 (4.8%) | 948 (5.4%) |
| $75,000 to $99,999 | 1,730 (10.0%) | 1,057 (6.0%) |
| $100,000+ | 2,195 (12.6%) | 1,264 (7.2%) |
| Total | 17,387 (100.0%) | 17,660 (100.0%) |
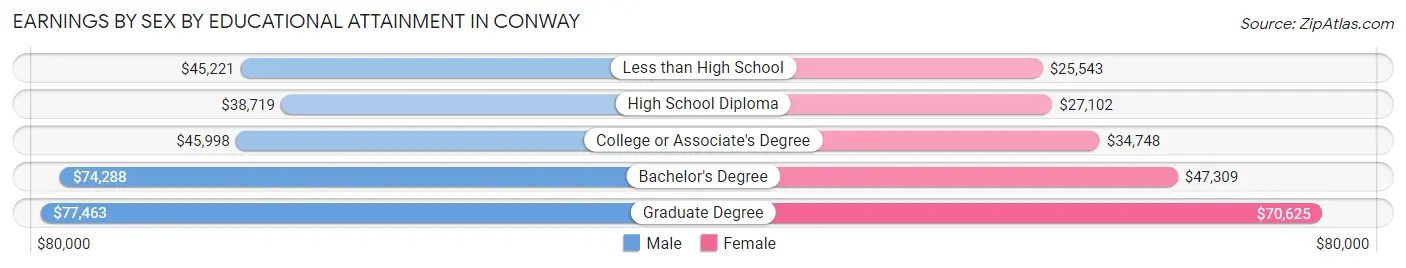
Earnings by Sex by Educational Attainment in Conway
Average earnings in Conway are $51,975 for men and $38,889 for women, a difference of 25.2%. Men with an educational attainment of graduate degree enjoy the highest average annual earnings of $77,463, while those with high school diploma education earn the least with $38,719. Women with an educational attainment of graduate degree earn the most with the average annual earnings of $70,625, while those with less than high school education have the smallest earnings of $25,543.
| Educational Attainment | Male Income | Female Income |
| Less than High School | $45,221 | $25,543 |
| High School Diploma | $38,719 | $27,102 |
| College or Associate's Degree | $45,998 | $34,748 |
| Bachelor's Degree | $74,288 | $47,309 |
| Graduate Degree | $77,463 | $70,625 |
| Total | $51,975 | $38,889 |
Family Income in Conway
Family Income Brackets in Conway
According to the Conway family income data, there are 2,591 families falling into the $100,000 to $149,999 income range, which is the most common income bracket and makes up 18.2% of all families. Conversely, the $10,000 to $14,999 income bracket is the least frequent group with only 356 families (2.5%) belonging to this category.
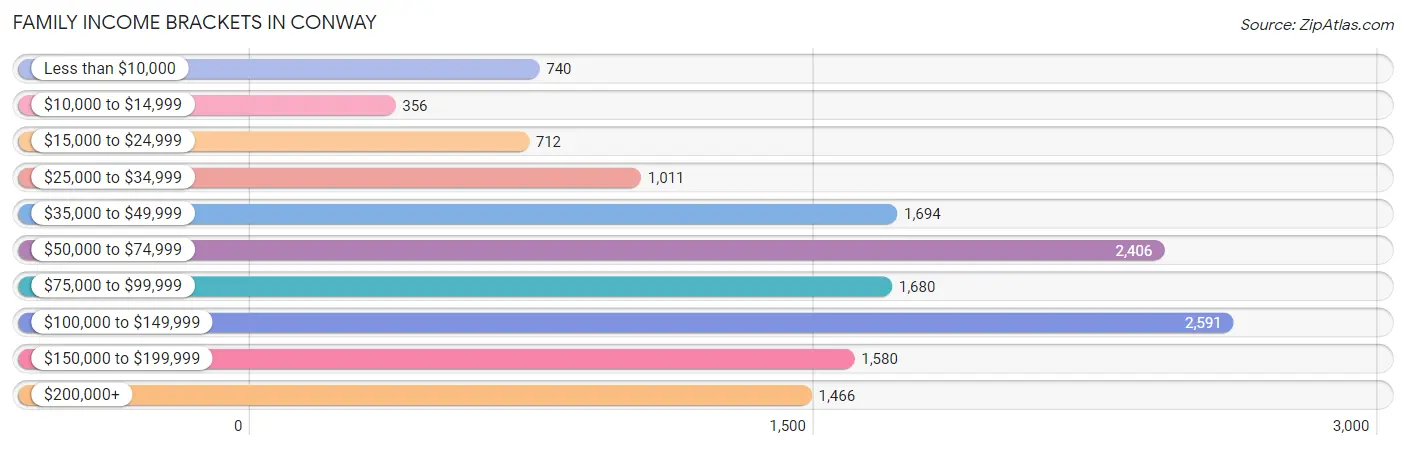
| Income Bracket | # Families | % Families |
| Less than $10,000 | 740 | 5.2% |
| $10,000 to $14,999 | 356 | 2.5% |
| $15,000 to $24,999 | 712 | 5.0% |
| $25,000 to $34,999 | 1,011 | 7.1% |
| $35,000 to $49,999 | 1,694 | 11.9% |
| $50,000 to $74,999 | 2,406 | 16.9% |
| $75,000 to $99,999 | 1,680 | 11.8% |
| $100,000 to $149,999 | 2,591 | 18.2% |
| $150,000 to $199,999 | 1,580 | 11.1% |
| $200,000+ | 1,466 | 10.3% |
Family Income by Famaliy Size in Conway
4-person families (2,902 | 20.4%) account for the highest median family income in Conway with $110,254 per family, while 2-person families (7,120 | 50.0%) have the highest median income of $32,261 per family member.
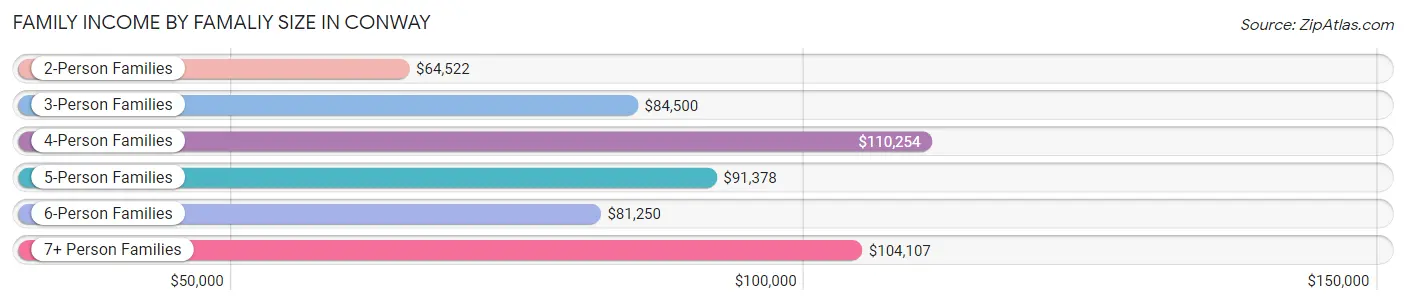
| Income Bracket | # Families | Median Income |
| 2-Person Families | 7,120 (50.0%) | $64,522 |
| 3-Person Families | 2,660 (18.7%) | $84,500 |
| 4-Person Families | 2,902 (20.4%) | $110,254 |
| 5-Person Families | 1,259 (8.8%) | $91,378 |
| 6-Person Families | 240 (1.7%) | $81,250 |
| 7+ Person Families | 53 (0.4%) | $104,107 |
| Total | 14,234 (100.0%) | $77,689 |
Family Income by Number of Earners in Conway
The median family income in Conway is $77,689, with families comprising 3+ earners (879) having the highest median family income of $138,964, while families with no earners (1,989) have the lowest median family income of $39,617, accounting for 6.2% and 14.0% of families, respectively.
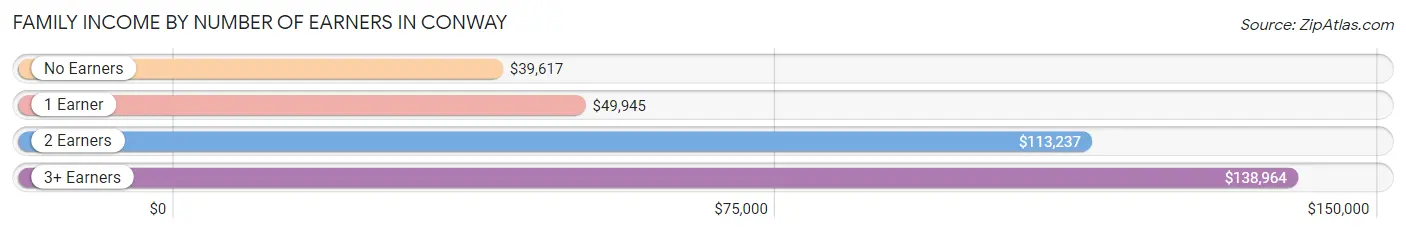
| Number of Earners | # Families | Median Income |
| No Earners | 1,989 (14.0%) | $39,617 |
| 1 Earner | 4,788 (33.6%) | $49,945 |
| 2 Earners | 6,578 (46.2%) | $113,237 |
| 3+ Earners | 879 (6.2%) | $138,964 |
| Total | 14,234 (100.0%) | $77,689 |
Household Income in Conway
Household Income Brackets in Conway
With 4,250 households falling in the category, the $50,000 to $74,999 income range is the most frequent in Conway, accounting for 16.7% of all households. In contrast, only 1,043 households (4.1%) fall into the $10,000 to $14,999 income bracket, making it the least populous group.
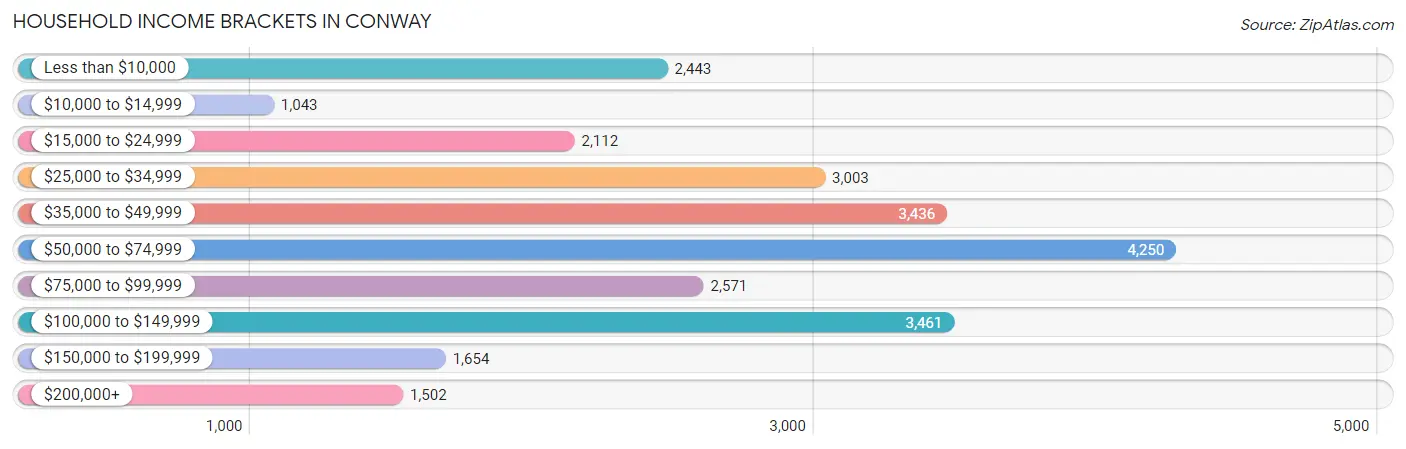
| Income Bracket | # Households | % Households |
| Less than $10,000 | 2,443 | 9.6% |
| $10,000 to $14,999 | 1,043 | 4.1% |
| $15,000 to $24,999 | 2,112 | 8.3% |
| $25,000 to $34,999 | 3,003 | 11.8% |
| $35,000 to $49,999 | 3,436 | 13.5% |
| $50,000 to $74,999 | 4,250 | 16.7% |
| $75,000 to $99,999 | 2,571 | 10.1% |
| $100,000 to $149,999 | 3,461 | 13.6% |
| $150,000 to $199,999 | 1,654 | 6.5% |
| $200,000+ | 1,502 | 5.9% |
Household Income by Householder Age in Conway
The median household income in Conway is $54,036, with the highest median household income of $70,437 found in the 45 to 64 years age bracket for the primary householder. A total of 7,080 households (27.8%) fall into this category. Meanwhile, the 15 to 24 years age bracket for the primary householder has the lowest median household income of $29,725, with 4,423 households (17.4%) in this group.
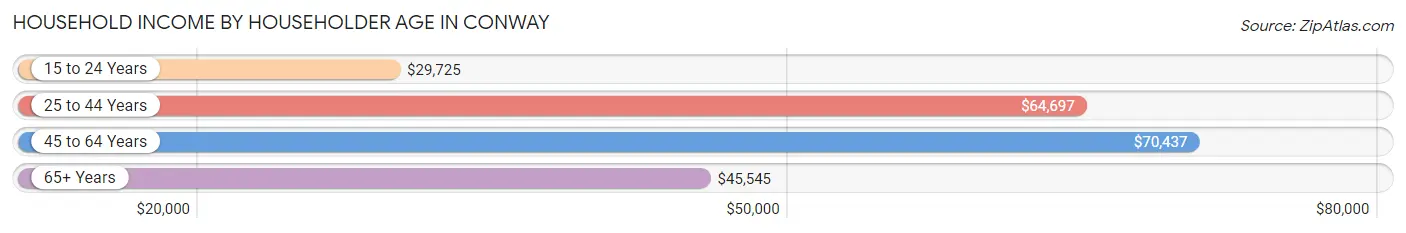
| Income Bracket | # Households | Median Income |
| 15 to 24 Years | 4,423 (17.4%) | $29,725 |
| 25 to 44 Years | 9,500 (37.3%) | $64,697 |
| 45 to 64 Years | 7,080 (27.8%) | $70,437 |
| 65+ Years | 4,448 (17.5%) | $45,545 |
| Total | 25,451 (100.0%) | $54,036 |
Poverty in Conway
Income Below Poverty by Sex and Age in Conway
With 16.7% poverty level for males and 21.3% for females among the residents of Conway, 18 to 24 year old males and 18 to 24 year old females are the most vulnerable to poverty, with 2,117 males (38.9%) and 2,555 females (46.0%) in their respective age groups living below the poverty level.
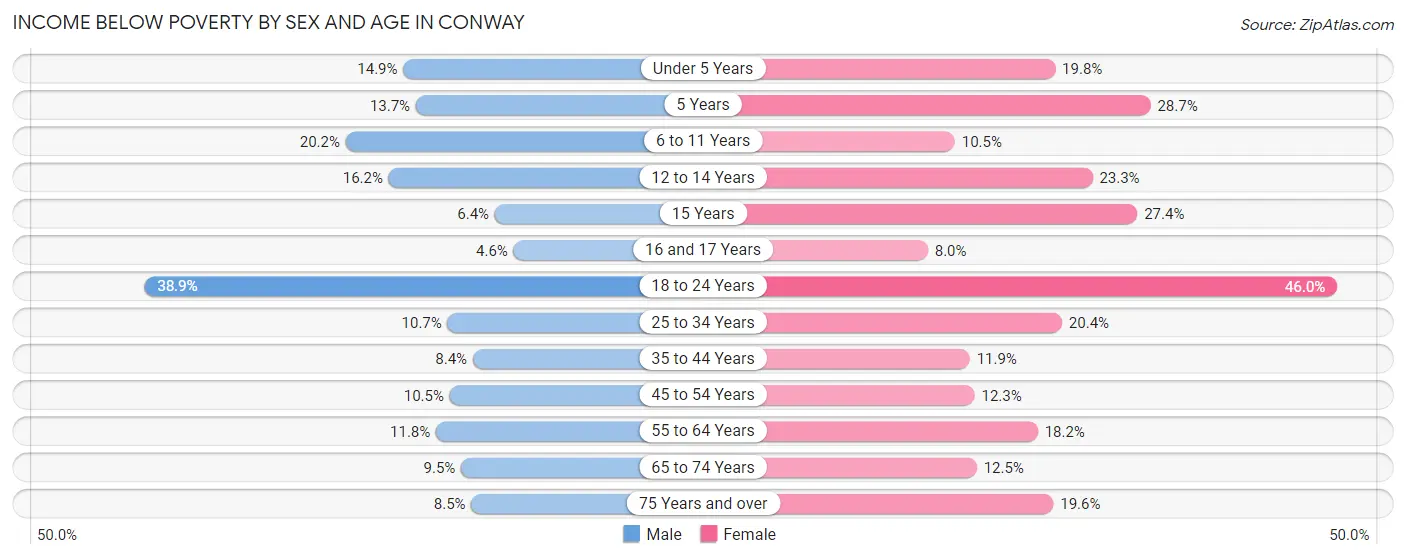
| Age Bracket | Male | Female |
| Under 5 Years | 280 (14.8%) | 314 (19.8%) |
| 5 Years | 87 (13.7%) | 98 (28.6%) |
| 6 to 11 Years | 422 (20.2%) | 285 (10.5%) |
| 12 to 14 Years | 162 (16.2%) | 217 (23.3%) |
| 15 Years | 20 (6.4%) | 122 (27.4%) |
| 16 and 17 Years | 31 (4.6%) | 53 (8.0%) |
| 18 to 24 Years | 2,117 (38.9%) | 2,555 (46.0%) |
| 25 to 34 Years | 484 (10.7%) | 1,018 (20.4%) |
| 35 to 44 Years | 328 (8.4%) | 495 (11.9%) |
| 45 to 54 Years | 293 (10.5%) | 393 (12.3%) |
| 55 to 64 Years | 328 (11.8%) | 516 (18.2%) |
| 65 to 74 Years | 139 (9.5%) | 269 (12.5%) |
| 75 Years and over | 97 (8.5%) | 384 (19.6%) |
| Total | 4,788 (16.7%) | 6,719 (21.3%) |
Income Above Poverty by Sex and Age in Conway
According to the poverty statistics in Conway, males aged 16 and 17 years and females aged 16 and 17 years are the age groups that are most secure financially, with 95.4% of males and 92.0% of females in these age groups living above the poverty line.
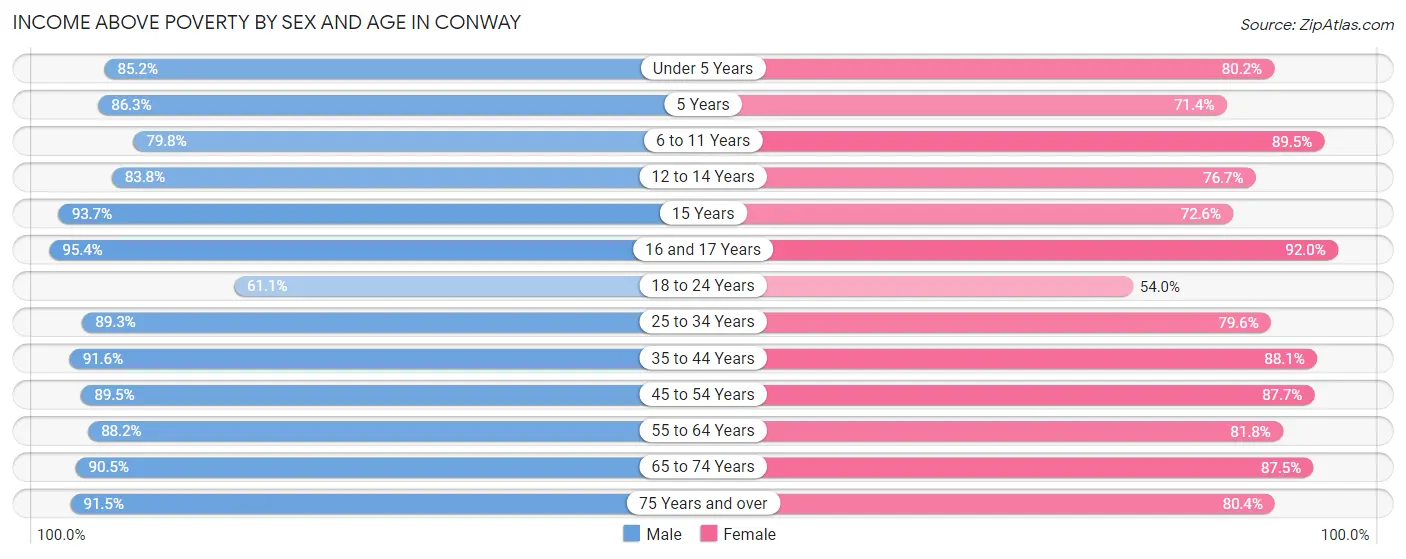
| Age Bracket | Male | Female |
| Under 5 Years | 1,606 (85.2%) | 1,272 (80.2%) |
| 5 Years | 549 (86.3%) | 244 (71.4%) |
| 6 to 11 Years | 1,668 (79.8%) | 2,431 (89.5%) |
| 12 to 14 Years | 838 (83.8%) | 716 (76.7%) |
| 15 Years | 295 (93.6%) | 323 (72.6%) |
| 16 and 17 Years | 641 (95.4%) | 611 (92.0%) |
| 18 to 24 Years | 3,326 (61.1%) | 3,003 (54.0%) |
| 25 to 34 Years | 4,021 (89.3%) | 3,965 (79.6%) |
| 35 to 44 Years | 3,580 (91.6%) | 3,674 (88.1%) |
| 45 to 54 Years | 2,486 (89.5%) | 2,798 (87.7%) |
| 55 to 64 Years | 2,450 (88.2%) | 2,322 (81.8%) |
| 65 to 74 Years | 1,327 (90.5%) | 1,879 (87.5%) |
| 75 Years and over | 1,040 (91.5%) | 1,572 (80.4%) |
| Total | 23,827 (83.3%) | 24,810 (78.7%) |
Income Below Poverty Among Married-Couple Families in Conway
The poverty statistics for married-couple families in Conway show that 5.0% or 508 of the total 10,181 families live below the poverty line. Families with 5 or more children have the highest poverty rate of 21.9%, comprising of 7 families. On the other hand, families with 1 or 2 children have the lowest poverty rate of 3.7%, which includes 131 families.
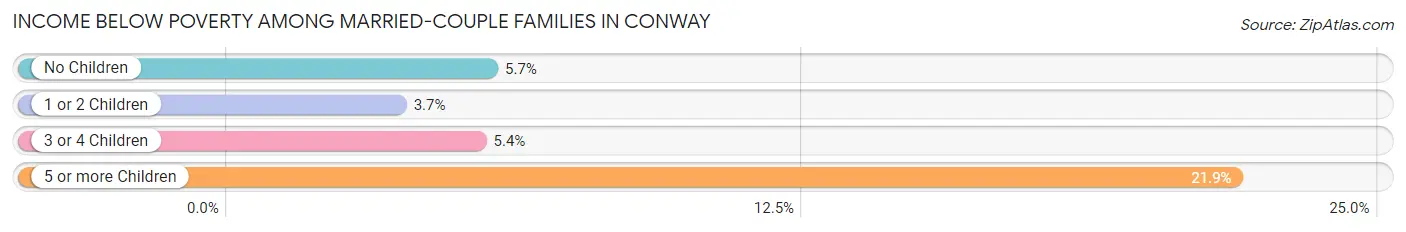
| Children | Above Poverty | Below Poverty |
| No Children | 5,335 (94.3%) | 320 (5.7%) |
| 1 or 2 Children | 3,439 (96.3%) | 131 (3.7%) |
| 3 or 4 Children | 874 (94.6%) | 50 (5.4%) |
| 5 or more Children | 25 (78.1%) | 7 (21.9%) |
| Total | 9,673 (95.0%) | 508 (5.0%) |
Income Below Poverty Among Single-Parent Households in Conway
According to the poverty data in Conway, 10.6% or 101 single-father households and 34.1% or 1,057 single-mother households are living below the poverty line. Among single-father households, those with 3 or 4 children have the highest poverty rate, with 33 households (35.5%) experiencing poverty. Likewise, among single-mother households, those with 5 or more children have the highest poverty rate, with 9 households (100.0%) falling below the poverty line.
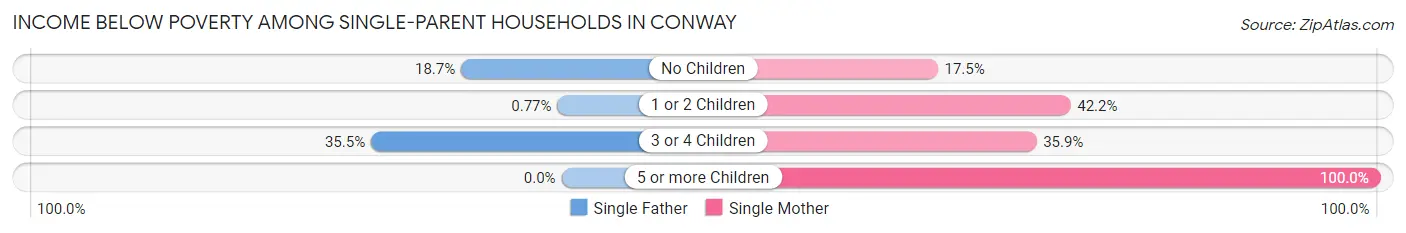
| Children | Single Father | Single Mother |
| No Children | 64 (18.7%) | 169 (17.5%) |
| 1 or 2 Children | 4 (0.8%) | 775 (42.2%) |
| 3 or 4 Children | 33 (35.5%) | 104 (35.9%) |
| 5 or more Children | 0 (0.0%) | 9 (100.0%) |
| Total | 101 (10.6%) | 1,057 (34.1%) |
Income Below Poverty Among Married-Couple vs Single-Parent Households in Conway
The poverty data for Conway shows that 508 of the married-couple family households (5.0%) and 1,158 of the single-parent households (28.6%) are living below the poverty level. Within the married-couple family households, those with 5 or more children have the highest poverty rate, with 7 households (21.9%) falling below the poverty line. Among the single-parent households, those with 5 or more children have the highest poverty rate, with 9 household (100.0%) living below poverty.
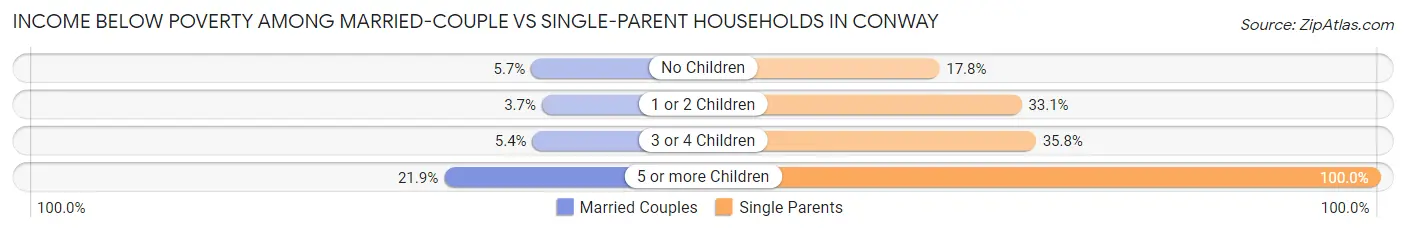
| Children | Married-Couple Families | Single-Parent Households |
| No Children | 320 (5.7%) | 233 (17.8%) |
| 1 or 2 Children | 131 (3.7%) | 779 (33.1%) |
| 3 or 4 Children | 50 (5.4%) | 137 (35.8%) |
| 5 or more Children | 7 (21.9%) | 9 (100.0%) |
| Total | 508 (5.0%) | 1,158 (28.6%) |
Race in Conway
The most populous races in Conway are White / Caucasian (46,808 | 71.8%), Black / African American (12,101 | 18.6%), and Hispanic or Latino (3,345 | 5.1%).
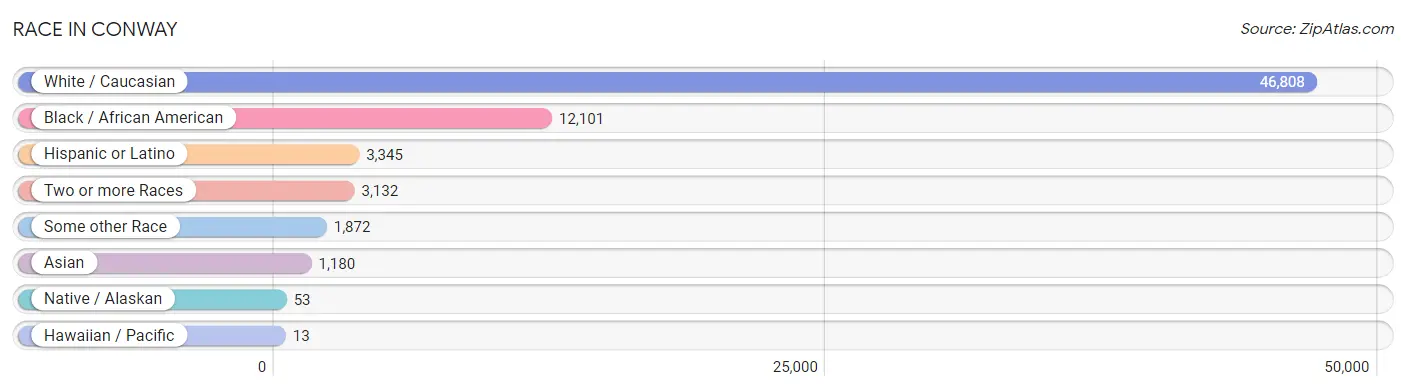
| Race | # Population | % Population |
| Asian | 1,180 | 1.8% |
| Black / African American | 12,101 | 18.6% |
| Hawaiian / Pacific | 13 | 0.0% |
| Hispanic or Latino | 3,345 | 5.1% |
| Native / Alaskan | 53 | 0.1% |
| White / Caucasian | 46,808 | 71.8% |
| Two or more Races | 3,132 | 4.8% |
| Some other Race | 1,872 | 2.9% |
| Total | 65,159 | 100.0% |
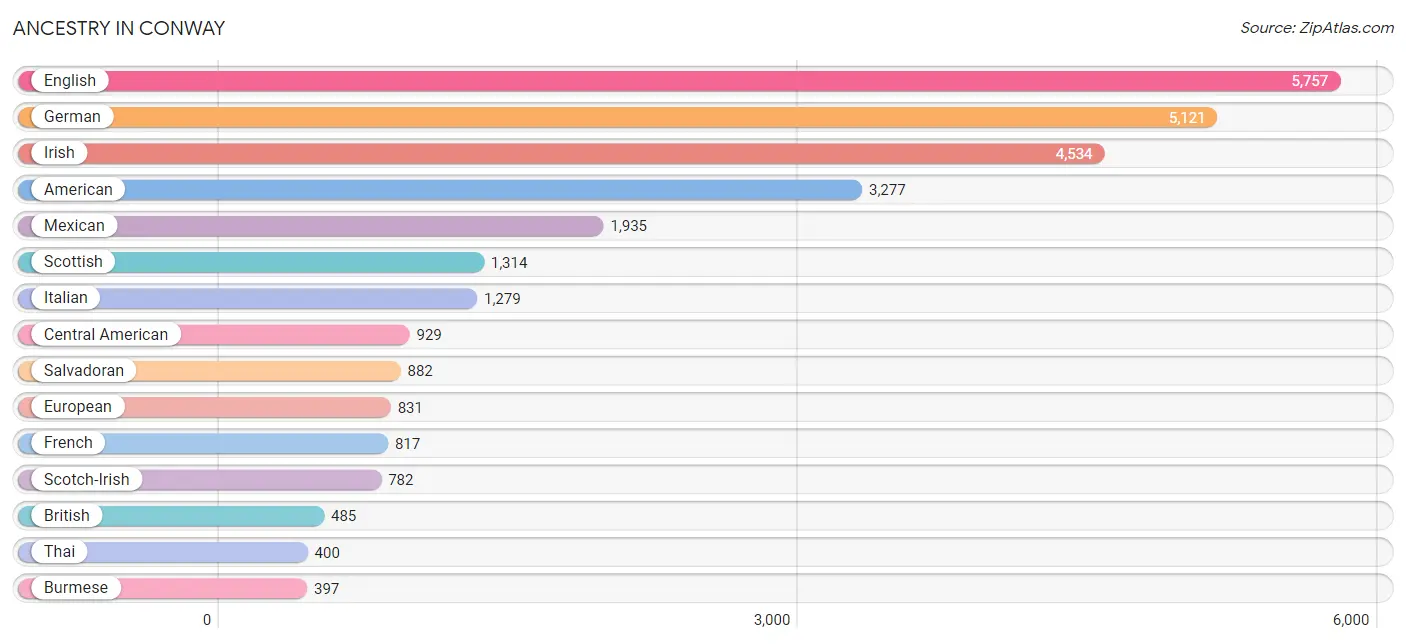
Ancestry in Conway
The most populous ancestries reported in Conway are English (5,757 | 8.8%), German (5,121 | 7.9%), Irish (4,534 | 7.0%), American (3,277 | 5.0%), and Mexican (1,935 | 3.0%), together accounting for 31.7% of all Conway residents.
| Ancestry | # Population | % Population |
| African | 154 | 0.2% |
| American | 3,277 | 5.0% |
| Arab | 46 | 0.1% |
| Argentinean | 38 | 0.1% |
| Austrian | 33 | 0.1% |
| Bahamian | 23 | 0.0% |
| Belgian | 5 | 0.0% |
| Bhutanese | 82 | 0.1% |
| Blackfeet | 16 | 0.0% |
| Bolivian | 5 | 0.0% |
| Brazilian | 9 | 0.0% |
| British | 485 | 0.7% |
| Burmese | 397 | 0.6% |
| Cajun | 8 | 0.0% |
| Canadian | 11 | 0.0% |
| Central American | 929 | 1.4% |
| Cherokee | 396 | 0.6% |
| Choctaw | 56 | 0.1% |
| Colombian | 26 | 0.0% |
| Creek | 1 | 0.0% |
| Cuban | 10 | 0.0% |
| Czech | 146 | 0.2% |
| Czechoslovakian | 6 | 0.0% |
| Danish | 18 | 0.0% |
| Dutch | 233 | 0.4% |
| Eastern European | 128 | 0.2% |
| English | 5,757 | 8.8% |
| European | 831 | 1.3% |
| Finnish | 40 | 0.1% |
| French | 817 | 1.3% |
| French Canadian | 47 | 0.1% |
| German | 5,121 | 7.9% |
| Ghanaian | 42 | 0.1% |
| Greek | 97 | 0.2% |
| Guatemalan | 12 | 0.0% |
| Hungarian | 37 | 0.1% |
| Indian (Asian) | 316 | 0.5% |
| Iranian | 51 | 0.1% |
| Irish | 4,534 | 7.0% |
| Iroquois | 32 | 0.1% |
| Italian | 1,279 | 2.0% |
| Japanese | 148 | 0.2% |
| Korean | 250 | 0.4% |
| Lebanese | 41 | 0.1% |
| Lithuanian | 95 | 0.2% |
| Mexican | 1,935 | 3.0% |
| Native Hawaiian | 13 | 0.0% |
| Nigerian | 20 | 0.0% |
| Northern European | 16 | 0.0% |
| Norwegian | 117 | 0.2% |
| Pakistani | 16 | 0.0% |
| Panamanian | 10 | 0.0% |
| Polish | 297 | 0.5% |
| Portuguese | 64 | 0.1% |
| Puerto Rican | 142 | 0.2% |
| Russian | 138 | 0.2% |
| Salvadoran | 882 | 1.3% |
| Scandinavian | 247 | 0.4% |
| Scotch-Irish | 782 | 1.2% |
| Scottish | 1,314 | 2.0% |
| Serbian | 16 | 0.0% |
| Slavic | 9 | 0.0% |
| Slovak | 64 | 0.1% |
| Slovene | 30 | 0.1% |
| South African | 28 | 0.0% |
| South American | 71 | 0.1% |
| Spaniard | 41 | 0.1% |
| Spanish | 68 | 0.1% |
| Sri Lankan | 70 | 0.1% |
| Subsaharan African | 250 | 0.4% |
| Swedish | 297 | 0.5% |
| Swiss | 166 | 0.3% |
| Thai | 400 | 0.6% |
| Venezuelan | 2 | 0.0% |
| Welsh | 236 | 0.4% | View All 75 Rows |
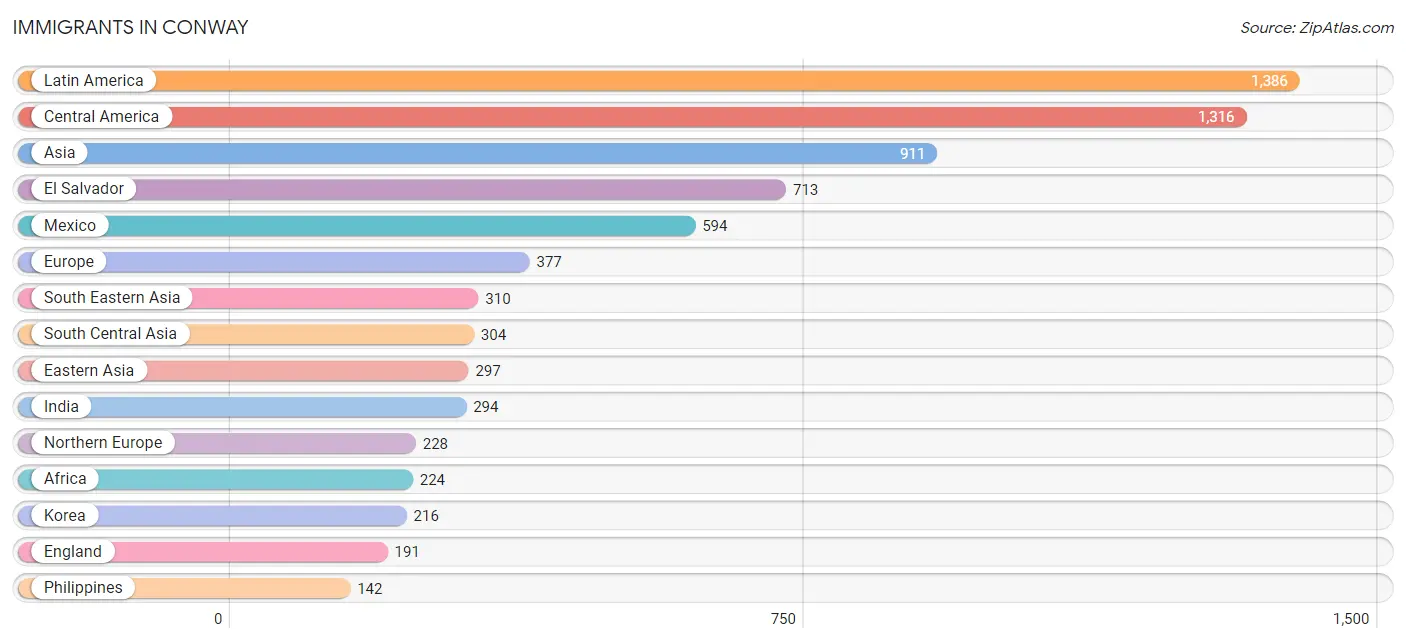
Immigrants in Conway
The most numerous immigrant groups reported in Conway came from Latin America (1,386 | 2.1%), Central America (1,316 | 2.0%), Asia (911 | 1.4%), El Salvador (713 | 1.1%), and Mexico (594 | 0.9%), together accounting for 7.5% of all Conway residents.
| Immigration Origin | # Population | % Population |
| Africa | 224 | 0.3% |
| Asia | 911 | 1.4% |
| Australia | 8 | 0.0% |
| Bahamas | 29 | 0.0% |
| Bolivia | 14 | 0.0% |
| Brazil | 9 | 0.0% |
| Cambodia | 82 | 0.1% |
| Canada | 44 | 0.1% |
| Caribbean | 29 | 0.0% |
| Central America | 1,316 | 2.0% |
| China | 81 | 0.1% |
| Colombia | 18 | 0.0% |
| Eastern Africa | 6 | 0.0% |
| Eastern Asia | 297 | 0.5% |
| Eastern Europe | 83 | 0.1% |
| El Salvador | 713 | 1.1% |
| England | 191 | 0.3% |
| Europe | 377 | 0.6% |
| Germany | 41 | 0.1% |
| Ghana | 62 | 0.1% |
| Guatemala | 9 | 0.0% |
| India | 294 | 0.4% |
| Italy | 13 | 0.0% |
| Korea | 216 | 0.3% |
| Latin America | 1,386 | 2.1% |
| Mexico | 594 | 0.9% |
| Middle Africa | 17 | 0.0% |
| Nigeria | 36 | 0.1% |
| Northern Europe | 228 | 0.4% |
| Oceania | 8 | 0.0% |
| Pakistan | 10 | 0.0% |
| Philippines | 142 | 0.2% |
| Russia | 67 | 0.1% |
| Serbia | 16 | 0.0% |
| South Africa | 37 | 0.1% |
| South America | 41 | 0.1% |
| South Central Asia | 304 | 0.5% |
| South Eastern Asia | 310 | 0.5% |
| Southern Europe | 25 | 0.0% |
| Spain | 12 | 0.0% |
| Thailand | 16 | 0.0% |
| Vietnam | 70 | 0.1% |
| Western Africa | 98 | 0.2% |
| Western Europe | 41 | 0.1% |
| Zaire | 17 | 0.0% | View All 45 Rows |
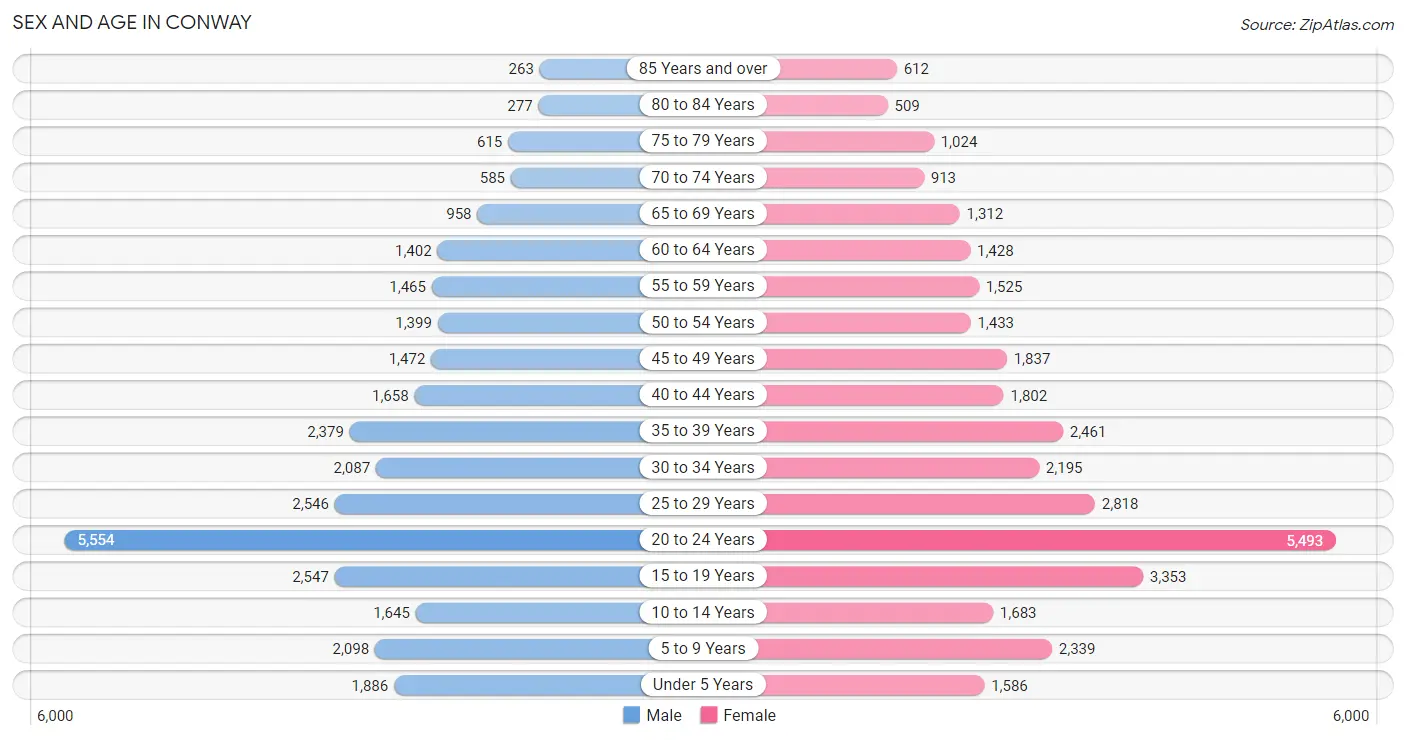
Sex and Age in Conway
Sex and Age in Conway
The most populous age groups in Conway are 20 to 24 Years (5,554 | 18.0%) for men and 20 to 24 Years (5,493 | 16.0%) for women.
| Age Bracket | Male | Female |
| Under 5 Years | 1,886 (6.1%) | 1,586 (4.6%) |
| 5 to 9 Years | 2,098 (6.8%) | 2,339 (6.8%) |
| 10 to 14 Years | 1,645 (5.3%) | 1,683 (4.9%) |
| 15 to 19 Years | 2,547 (8.3%) | 3,353 (9.8%) |
| 20 to 24 Years | 5,554 (18.0%) | 5,493 (16.0%) |
| 25 to 29 Years | 2,546 (8.3%) | 2,818 (8.2%) |
| 30 to 34 Years | 2,087 (6.8%) | 2,195 (6.4%) |
| 35 to 39 Years | 2,379 (7.7%) | 2,461 (7.2%) |
| 40 to 44 Years | 1,658 (5.4%) | 1,802 (5.2%) |
| 45 to 49 Years | 1,472 (4.8%) | 1,837 (5.3%) |
| 50 to 54 Years | 1,399 (4.5%) | 1,433 (4.2%) |
| 55 to 59 Years | 1,465 (4.8%) | 1,525 (4.4%) |
| 60 to 64 Years | 1,402 (4.5%) | 1,428 (4.2%) |
| 65 to 69 Years | 958 (3.1%) | 1,312 (3.8%) |
| 70 to 74 Years | 585 (1.9%) | 913 (2.7%) |
| 75 to 79 Years | 615 (2.0%) | 1,024 (3.0%) |
| 80 to 84 Years | 277 (0.9%) | 509 (1.5%) |
| 85 Years and over | 263 (0.9%) | 612 (1.8%) |
| Total | 30,836 (100.0%) | 34,323 (100.0%) |
Families and Households in Conway
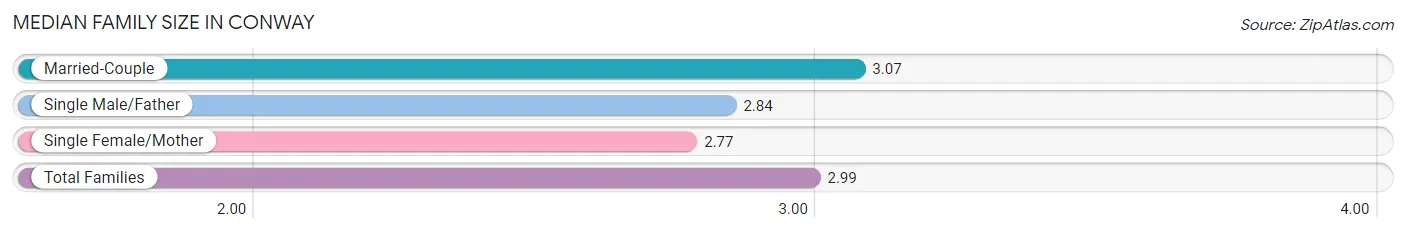
Median Family Size in Conway
The median family size in Conway is 2.99 persons per family, with married-couple families (10,181 | 71.5%) accounting for the largest median family size of 3.07 persons per family. On the other hand, single female/mother families (3,101 | 21.8%) represent the smallest median family size with 2.77 persons per family.
| Family Type | # Families | Family Size |
| Married-Couple | 10,181 (71.5%) | 3.07 |
| Single Male/Father | 952 (6.7%) | 2.84 |
| Single Female/Mother | 3,101 (21.8%) | 2.77 |
| Total Families | 14,234 (100.0%) | 2.99 |
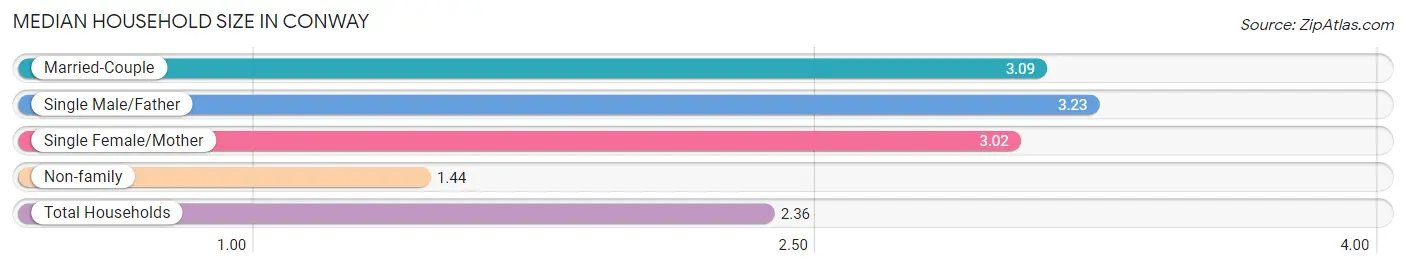
Median Household Size in Conway
The median household size in Conway is 2.36 persons per household, with single male/father households (952 | 3.7%) accounting for the largest median household size of 3.23 persons per household. non-family households (11,217 | 44.1%) represent the smallest median household size with 1.44 persons per household.
| Household Type | # Households | Household Size |
| Married-Couple | 10,181 (40.0%) | 3.09 |
| Single Male/Father | 952 (3.7%) | 3.23 |
| Single Female/Mother | 3,101 (12.2%) | 3.02 |
| Non-family | 11,217 (44.1%) | 1.44 |
| Total Households | 25,451 (100.0%) | 2.36 |
Household Size by Marriage Status in Conway
Out of a total of 25,451 households in Conway, 14,234 (55.9%) are family households, while 11,217 (44.1%) are nonfamily households. The most numerous type of family households are 2-person households, comprising 6,547, and the most common type of nonfamily households are 1-person households, comprising 7,461.
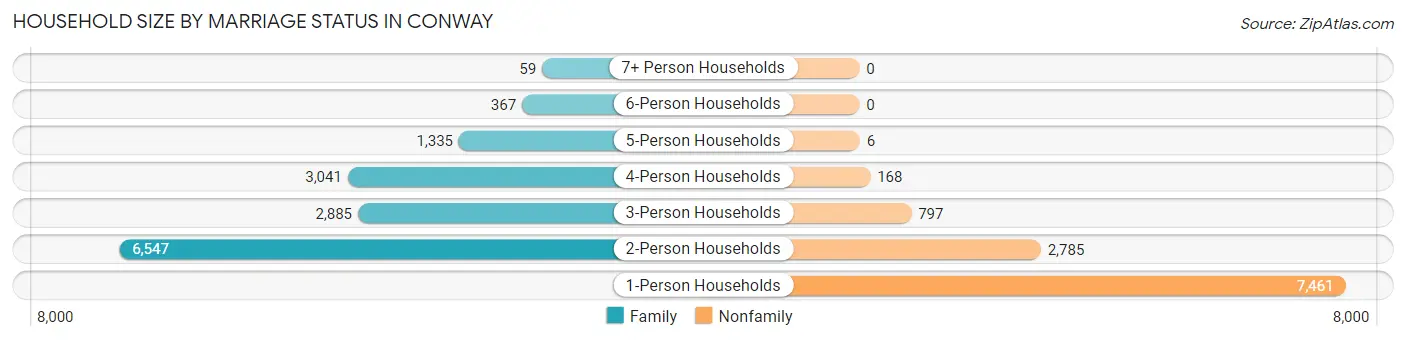
| Household Size | Family Households | Nonfamily Households |
| 1-Person Households | - | 7,461 (29.3%) |
| 2-Person Households | 6,547 (25.7%) | 2,785 (10.9%) |
| 3-Person Households | 2,885 (11.3%) | 797 (3.1%) |
| 4-Person Households | 3,041 (11.9%) | 168 (0.7%) |
| 5-Person Households | 1,335 (5.2%) | 6 (0.0%) |
| 6-Person Households | 367 (1.4%) | 0 (0.0%) |
| 7+ Person Households | 59 (0.2%) | 0 (0.0%) |
| Total | 14,234 (55.9%) | 11,217 (44.1%) |
Female Fertility in Conway
Fertility by Age in Conway
Average fertility rate in Conway is 33.0 births per 1,000 women. Women in the age bracket of 20 to 34 years have the highest fertility rate with 52.0 births per 1,000 women. Women in the age bracket of 20 to 34 years acount for 82.4% of all women with births.
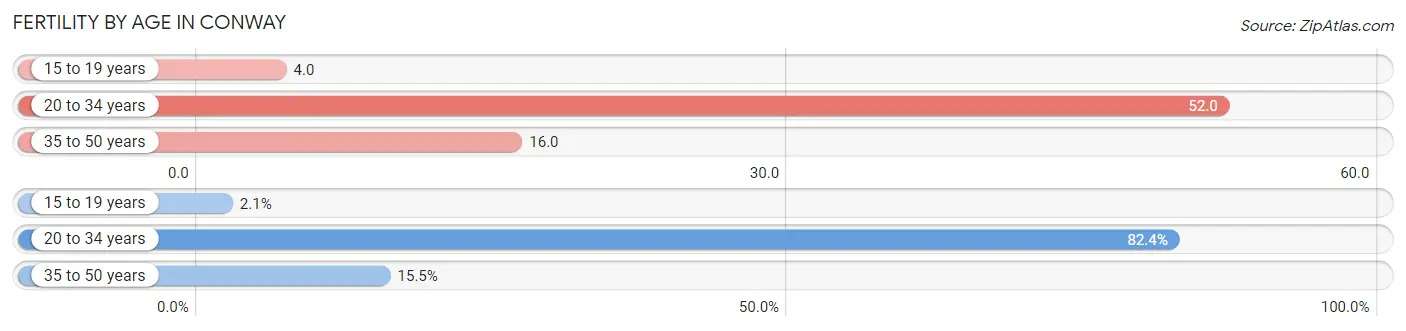
| Age Bracket | Women with Births | Births / 1,000 Women |
| 15 to 19 years | 14 (2.1%) | 4.0 |
| 20 to 34 years | 548 (82.4%) | 52.0 |
| 35 to 50 years | 103 (15.5%) | 16.0 |
| Total | 665 (100.0%) | 33.0 |
Fertility by Age by Marriage Status in Conway
54.3% of women with births (665) in Conway are married. The highest percentage of unmarried women with births falls into 15 to 19 years age bracket with 100.0% of them unmarried at the time of birth, while the lowest percentage of unmarried women with births belong to 35 to 50 years age bracket with 14.6% of them unmarried.
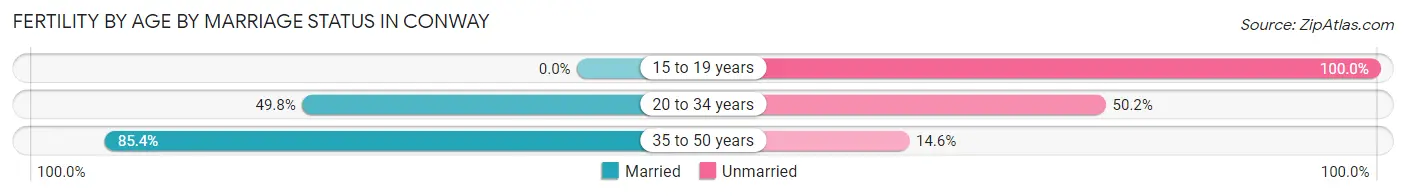
| Age Bracket | Married | Unmarried |
| 15 to 19 years | 0 (0.0%) | 14 (100.0%) |
| 20 to 34 years | 273 (49.8%) | 275 (50.2%) |
| 35 to 50 years | 88 (85.4%) | 15 (14.6%) |
| Total | 361 (54.3%) | 304 (45.7%) |
Fertility by Education in Conway
Average fertility rate in Conway is 33.0 births per 1,000 women. Women with the education attainment of high school diploma have the highest fertility rate of 51.0 births per 1,000 women, while women with the education attainment of less than high school have the lowest fertility at 21.0 births per 1,000 women. Women with the education attainment of college or associate's degree represent 41.5% of all women with births.
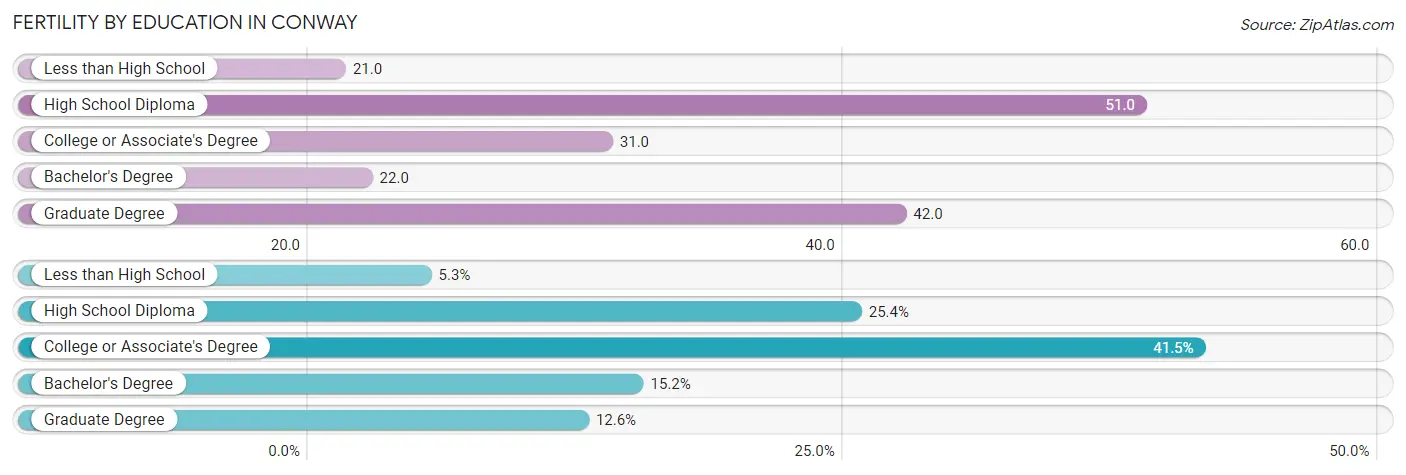
| Educational Attainment | Women with Births | Births / 1,000 Women |
| Less than High School | 35 (5.3%) | 21.0 |
| High School Diploma | 169 (25.4%) | 51.0 |
| College or Associate's Degree | 276 (41.5%) | 31.0 |
| Bachelor's Degree | 101 (15.2%) | 22.0 |
| Graduate Degree | 84 (12.6%) | 42.0 |
| Total | 665 (100.0%) | 33.0 |
Fertility by Education by Marriage Status in Conway
45.7% of women with births in Conway are unmarried. Women with the educational attainment of graduate degree are most likely to be married with 86.9% of them married at childbirth, while women with the educational attainment of college or associate's degree are least likely to be married with 73.6% of them unmarried at childbirth.
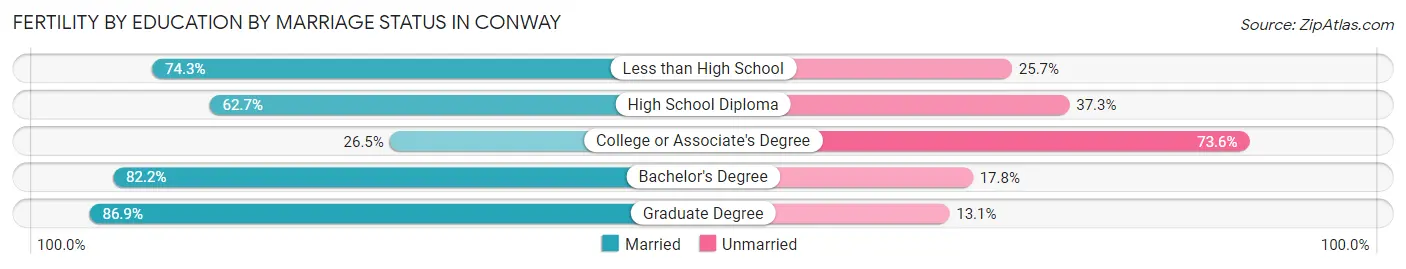
| Educational Attainment | Married | Unmarried |
| Less than High School | 26 (74.3%) | 9 (25.7%) |
| High School Diploma | 106 (62.7%) | 63 (37.3%) |
| College or Associate's Degree | 73 (26.5%) | 203 (73.6%) |
| Bachelor's Degree | 83 (82.2%) | 18 (17.8%) |
| Graduate Degree | 73 (86.9%) | 11 (13.1%) |
| Total | 361 (54.3%) | 304 (45.7%) |
Employment Characteristics in Conway
Employment by Class of Employer in Conway
Among the 31,732 employed individuals in Conway, private company employees (20,902 | 65.9%), not-for-profit organizations (4,128 | 13.0%), and state government employees (2,136 | 6.7%) make up the most common classes of employment.
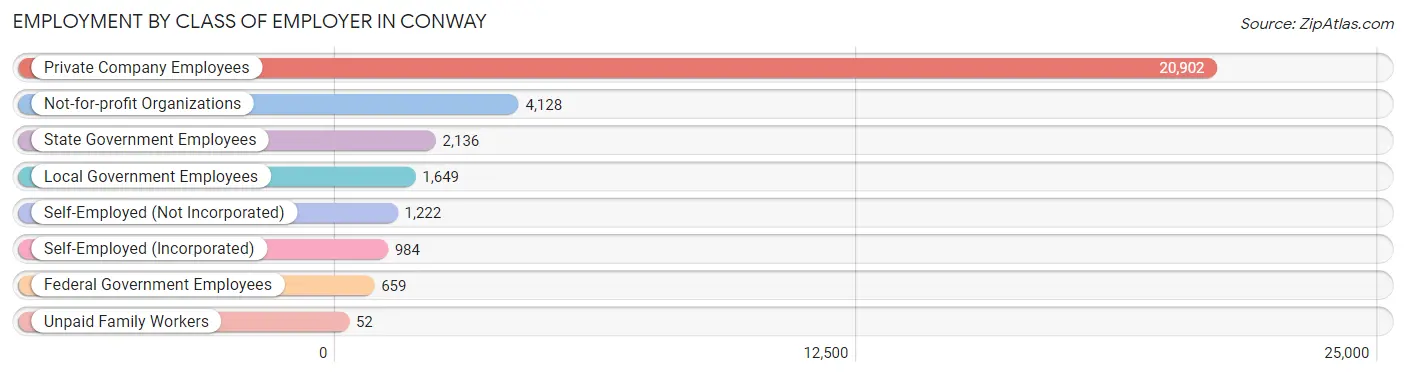
| Employer Class | # Employees | % Employees |
| Private Company Employees | 20,902 | 65.9% |
| Self-Employed (Incorporated) | 984 | 3.1% |
| Self-Employed (Not Incorporated) | 1,222 | 3.8% |
| Not-for-profit Organizations | 4,128 | 13.0% |
| Local Government Employees | 1,649 | 5.2% |
| State Government Employees | 2,136 | 6.7% |
| Federal Government Employees | 659 | 2.1% |
| Unpaid Family Workers | 52 | 0.2% |
| Total | 31,732 | 100.0% |
Employment Status by Age in Conway
According to the labor force statistics for Conway, out of the total population over 16 years of age (53,160), 62.2% or 33,066 individuals are in the labor force, with 3.0% or 992 of them unemployed. The age group with the highest labor force participation rate is 30 to 34 years, with 85.8% or 3,674 individuals in the labor force. Within the labor force, the 16 to 19 years age range has the highest percentage of unemployed individuals, with 16.8% or 180 of them being unemployed.
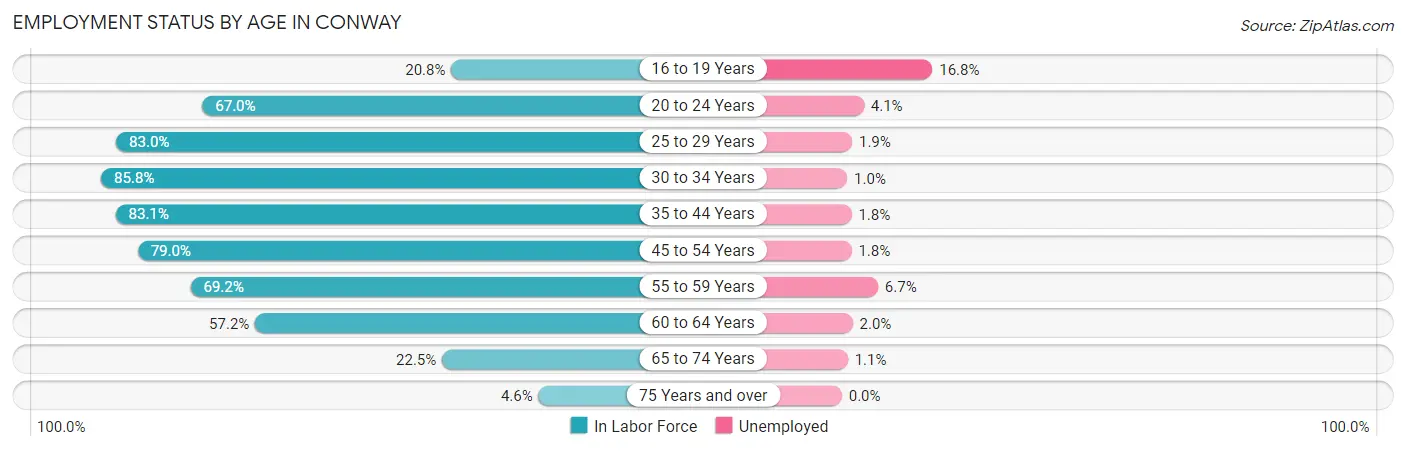
| Age Bracket | In Labor Force | Unemployed |
| 16 to 19 Years | 1,069 (20.8%) | 180 (16.8%) |
| 20 to 24 Years | 7,401 (67.0%) | 303 (4.1%) |
| 25 to 29 Years | 4,452 (83.0%) | 85 (1.9%) |
| 30 to 34 Years | 3,674 (85.8%) | 37 (1.0%) |
| 35 to 44 Years | 6,897 (83.1%) | 124 (1.8%) |
| 45 to 54 Years | 4,851 (79.0%) | 87 (1.8%) |
| 55 to 59 Years | 2,069 (69.2%) | 139 (6.7%) |
| 60 to 64 Years | 1,619 (57.2%) | 32 (2.0%) |
| 65 to 74 Years | 848 (22.5%) | 9 (1.1%) |
| 75 Years and over | 152 (4.6%) | 0 (0.0%) |
| Total | 33,066 (62.2%) | 992 (3.0%) |
Employment Status by Educational Attainment in Conway
According to labor force statistics for Conway, 78.8% of individuals (23,567) out of the total population between 25 and 64 years of age (29,907) are in the labor force, with 2.1% or 495 of them being unemployed. The group with the highest labor force participation rate are those with the educational attainment of bachelor's degree or higher, with 87.0% or 10,820 individuals in the labor force. Within the labor force, individuals with high school diploma education have the highest percentage of unemployment, with 4.3% or 189 of them being unemployed.
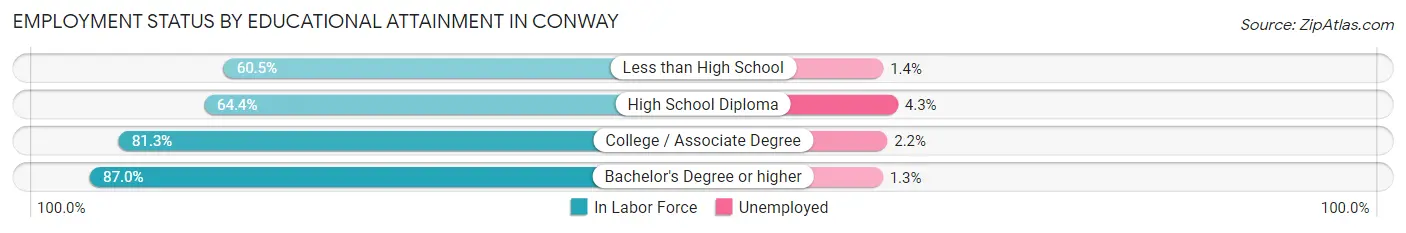
| Educational Attainment | In Labor Force | Unemployed |
| Less than High School | 904 (60.5%) | 21 (1.4%) |
| High School Diploma | 4,388 (64.4%) | 293 (4.3%) |
| College / Associate Degree | 7,450 (81.3%) | 202 (2.2%) |
| Bachelor's Degree or higher | 10,820 (87.0%) | 162 (1.3%) |
| Total | 23,567 (78.8%) | 628 (2.1%) |
Employment Occupations by Sex in Conway
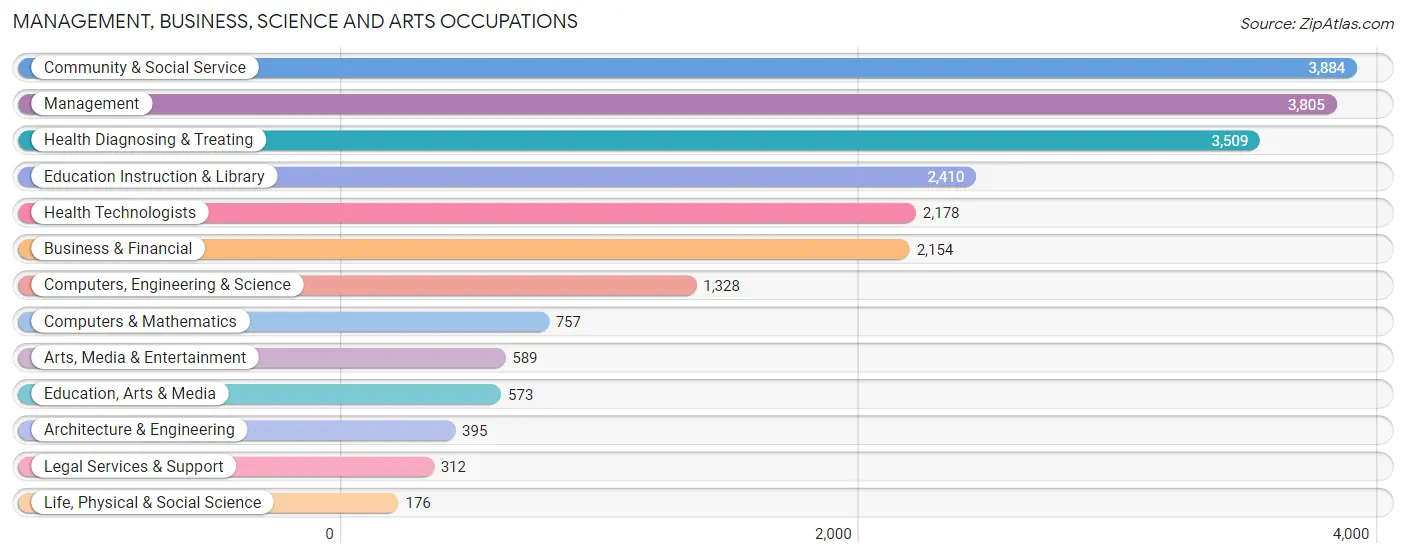
Management, Business, Science and Arts Occupations
The most common Management, Business, Science and Arts occupations in Conway are Community & Social Service (3,884 | 12.2%), Management (3,805 | 11.9%), Health Diagnosing & Treating (3,509 | 11.0%), Education Instruction & Library (2,410 | 7.5%), and Health Technologists (2,178 | 6.8%).
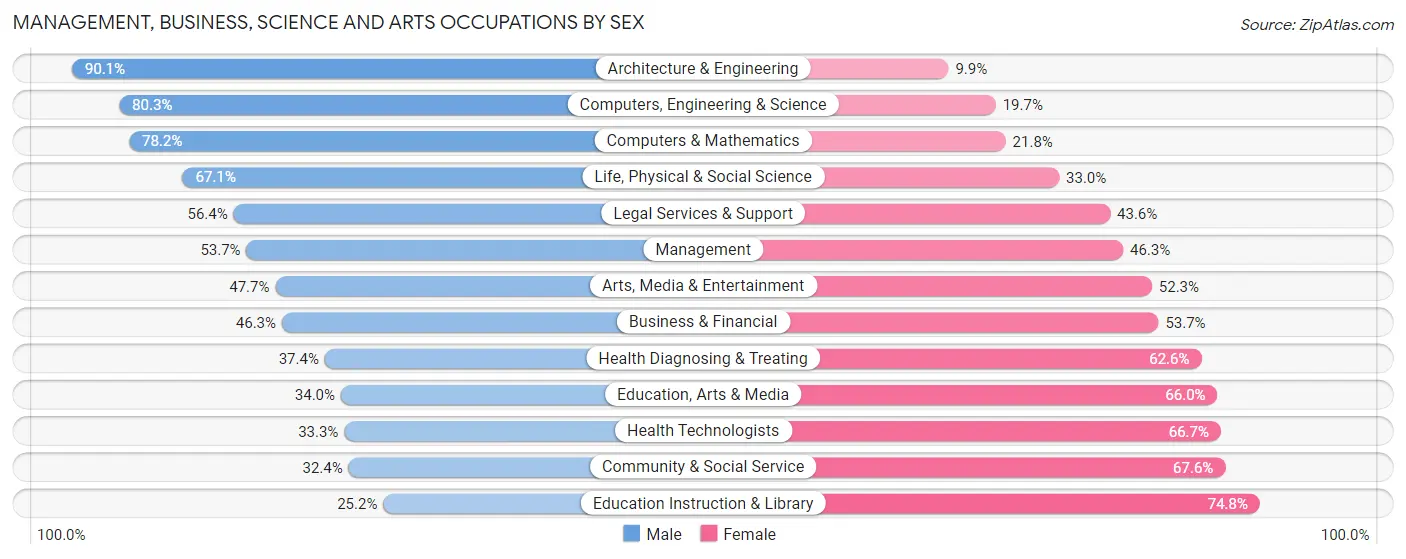
Management, Business, Science and Arts Occupations by Sex
Within the Management, Business, Science and Arts occupations in Conway, the most male-oriented occupations are Architecture & Engineering (90.1%), Computers, Engineering & Science (80.3%), and Computers & Mathematics (78.2%), while the most female-oriented occupations are Education Instruction & Library (74.8%), Community & Social Service (67.6%), and Health Technologists (66.7%).
| Occupation | Male | Female |
| Management | 2,044 (53.7%) | 1,761 (46.3%) |
| Business & Financial | 998 (46.3%) | 1,156 (53.7%) |
| Computers, Engineering & Science | 1,066 (80.3%) | 262 (19.7%) |
| Computers & Mathematics | 592 (78.2%) | 165 (21.8%) |
| Architecture & Engineering | 356 (90.1%) | 39 (9.9%) |
| Life, Physical & Social Science | 118 (67.0%) | 58 (33.0%) |
| Community & Social Service | 1,259 (32.4%) | 2,625 (67.6%) |
| Education, Arts & Media | 195 (34.0%) | 378 (66.0%) |
| Legal Services & Support | 176 (56.4%) | 136 (43.6%) |
| Education Instruction & Library | 607 (25.2%) | 1,803 (74.8%) |
| Arts, Media & Entertainment | 281 (47.7%) | 308 (52.3%) |
| Health Diagnosing & Treating | 1,312 (37.4%) | 2,197 (62.6%) |
| Health Technologists | 726 (33.3%) | 1,452 (66.7%) |
| Total (Category) | 6,679 (45.5%) | 8,001 (54.5%) |
| Total (Overall) | 15,952 (50.0%) | 15,963 (50.0%) |
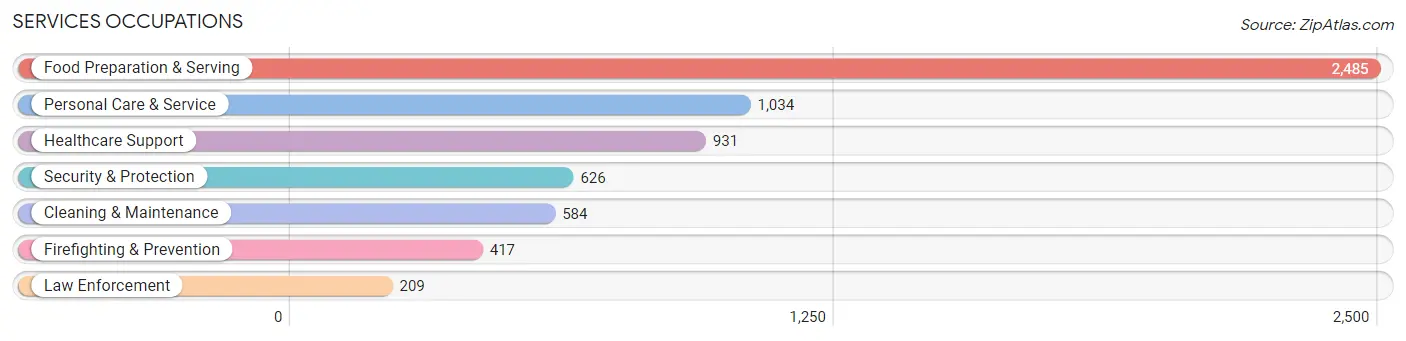
Services Occupations
The most common Services occupations in Conway are Food Preparation & Serving (2,485 | 7.8%), Personal Care & Service (1,034 | 3.2%), Healthcare Support (931 | 2.9%), Security & Protection (626 | 2.0%), and Cleaning & Maintenance (584 | 1.8%).
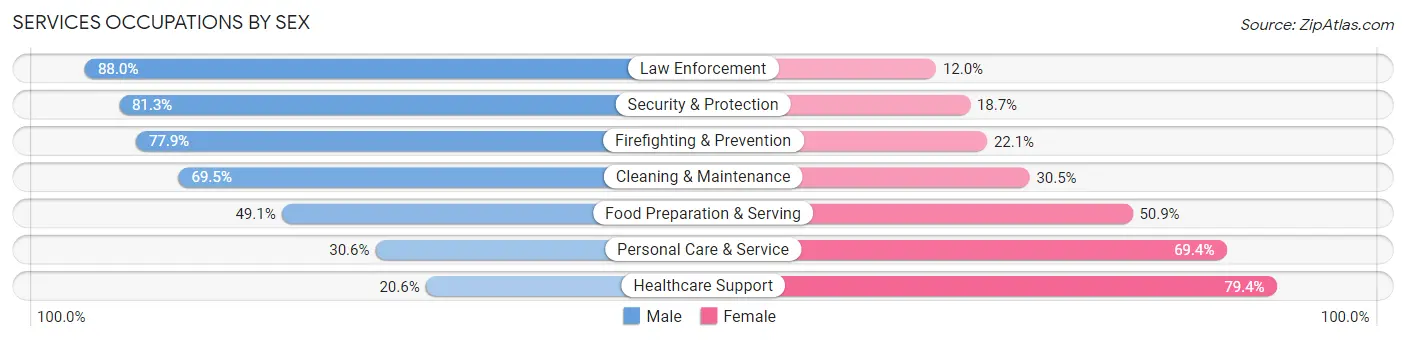
Services Occupations by Sex
Within the Services occupations in Conway, the most male-oriented occupations are Law Enforcement (88.0%), Security & Protection (81.3%), and Firefighting & Prevention (77.9%), while the most female-oriented occupations are Healthcare Support (79.4%), Personal Care & Service (69.4%), and Food Preparation & Serving (50.9%).
| Occupation | Male | Female |
| Healthcare Support | 192 (20.6%) | 739 (79.4%) |
| Security & Protection | 509 (81.3%) | 117 (18.7%) |
| Firefighting & Prevention | 325 (77.9%) | 92 (22.1%) |
| Law Enforcement | 184 (88.0%) | 25 (12.0%) |
| Food Preparation & Serving | 1,221 (49.1%) | 1,264 (50.9%) |
| Cleaning & Maintenance | 406 (69.5%) | 178 (30.5%) |
| Personal Care & Service | 316 (30.6%) | 718 (69.4%) |
| Total (Category) | 2,644 (46.7%) | 3,016 (53.3%) |
| Total (Overall) | 15,952 (50.0%) | 15,963 (50.0%) |
Sales and Office Occupations
The most common Sales and Office occupations in Conway are Office & Administration (3,314 | 10.4%), and Sales & Related (3,050 | 9.6%).

Sales and Office Occupations by Sex
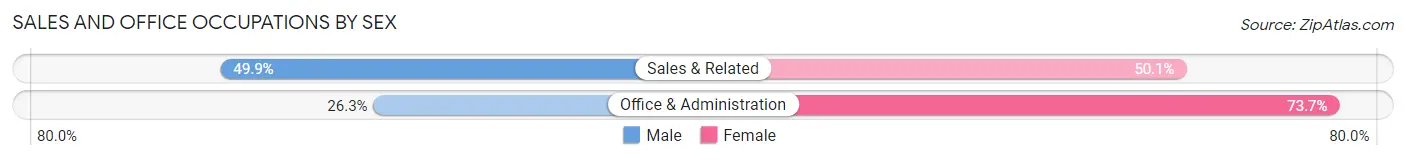
| Occupation | Male | Female |
| Sales & Related | 1,521 (49.9%) | 1,529 (50.1%) |
| Office & Administration | 873 (26.3%) | 2,441 (73.7%) |
| Total (Category) | 2,394 (37.6%) | 3,970 (62.4%) |
| Total (Overall) | 15,952 (50.0%) | 15,963 (50.0%) |
Natural Resources, Construction and Maintenance Occupations
The most common Natural Resources, Construction and Maintenance occupations in Conway are Construction & Extraction (1,072 | 3.4%), and Installation, Maintenance & Repair (662 | 2.1%).

Natural Resources, Construction and Maintenance Occupations by Sex
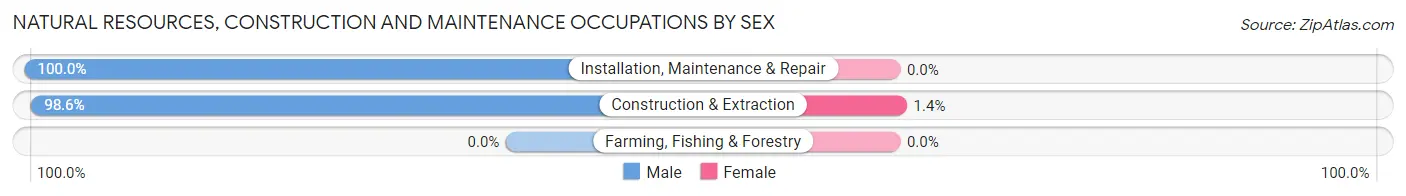
| Occupation | Male | Female |
| Farming, Fishing & Forestry | 0 (0.0%) | 0 (0.0%) |
| Construction & Extraction | 1,057 (98.6%) | 15 (1.4%) |
| Installation, Maintenance & Repair | 662 (100.0%) | 0 (0.0%) |
| Total (Category) | 1,719 (99.1%) | 15 (0.9%) |
| Total (Overall) | 15,952 (50.0%) | 15,963 (50.0%) |
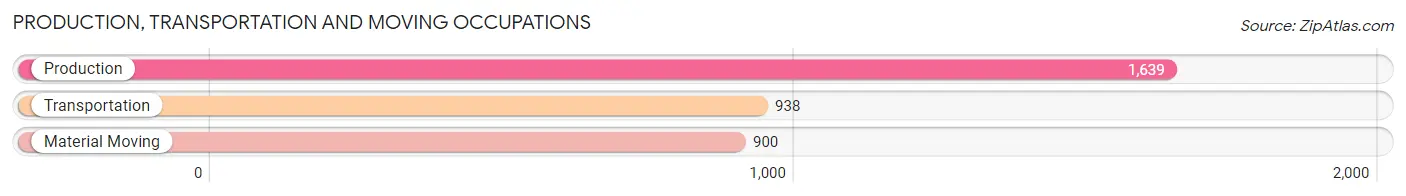
Production, Transportation and Moving Occupations
The most common Production, Transportation and Moving occupations in Conway are Production (1,639 | 5.1%), Transportation (938 | 2.9%), and Material Moving (900 | 2.8%).
Production, Transportation and Moving Occupations by Sex
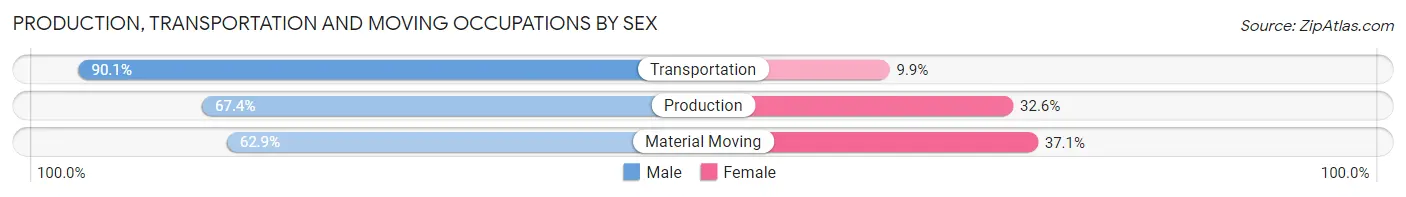
| Occupation | Male | Female |
| Production | 1,105 (67.4%) | 534 (32.6%) |
| Transportation | 845 (90.1%) | 93 (9.9%) |
| Material Moving | 566 (62.9%) | 334 (37.1%) |
| Total (Category) | 2,516 (72.4%) | 961 (27.6%) |
| Total (Overall) | 15,952 (50.0%) | 15,963 (50.0%) |
Employment Industries by Sex in Conway
Employment Industries in Conway
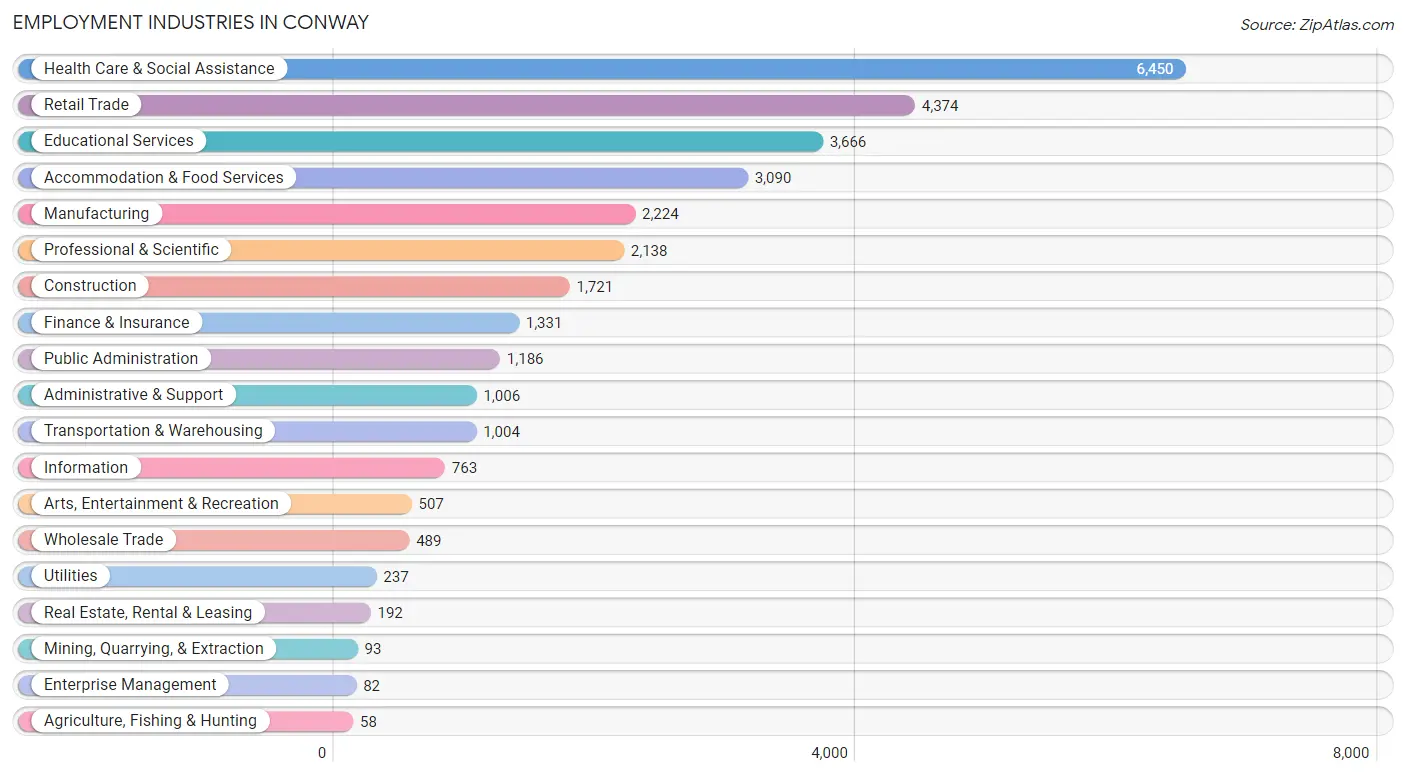
The major employment industries in Conway include Health Care & Social Assistance (6,450 | 20.2%), Retail Trade (4,374 | 13.7%), Educational Services (3,666 | 11.5%), Accommodation & Food Services (3,090 | 9.7%), and Manufacturing (2,224 | 7.0%).
Employment Industries by Sex in Conway
The Conway industries that see more men than women are Agriculture, Fishing & Hunting (100.0%), Mining, Quarrying, & Extraction (100.0%), and Construction (92.7%), whereas the industries that tend to have a higher number of women are Enterprise Management (82.9%), Health Care & Social Assistance (70.4%), and Real Estate, Rental & Leasing (68.2%).
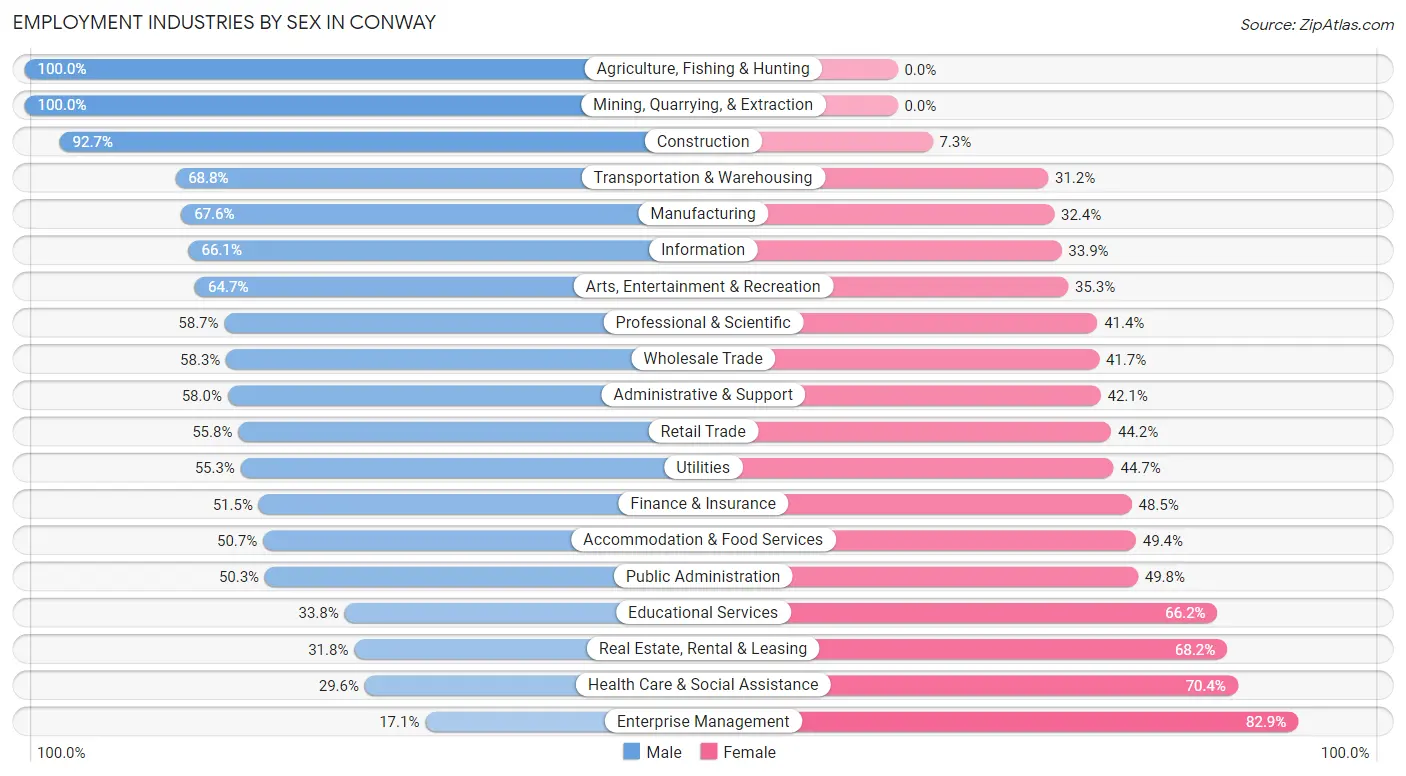
| Industry | Male | Female |
| Agriculture, Fishing & Hunting | 58 (100.0%) | 0 (0.0%) |
| Mining, Quarrying, & Extraction | 93 (100.0%) | 0 (0.0%) |
| Construction | 1,596 (92.7%) | 125 (7.3%) |
| Manufacturing | 1,503 (67.6%) | 721 (32.4%) |
| Wholesale Trade | 285 (58.3%) | 204 (41.7%) |
| Retail Trade | 2,440 (55.8%) | 1,934 (44.2%) |
| Transportation & Warehousing | 691 (68.8%) | 313 (31.2%) |
| Utilities | 131 (55.3%) | 106 (44.7%) |
| Information | 504 (66.1%) | 259 (33.9%) |
| Finance & Insurance | 686 (51.5%) | 645 (48.5%) |
| Real Estate, Rental & Leasing | 61 (31.8%) | 131 (68.2%) |
| Professional & Scientific | 1,254 (58.7%) | 884 (41.3%) |
| Enterprise Management | 14 (17.1%) | 68 (82.9%) |
| Administrative & Support | 583 (58.0%) | 423 (42.0%) |
| Educational Services | 1,238 (33.8%) | 2,428 (66.2%) |
| Health Care & Social Assistance | 1,908 (29.6%) | 4,542 (70.4%) |
| Arts, Entertainment & Recreation | 328 (64.7%) | 179 (35.3%) |
| Accommodation & Food Services | 1,565 (50.6%) | 1,525 (49.3%) |
| Public Administration | 596 (50.2%) | 590 (49.7%) |
| Total | 15,952 (50.0%) | 15,963 (50.0%) |
Education in Conway
School Enrollment in Conway
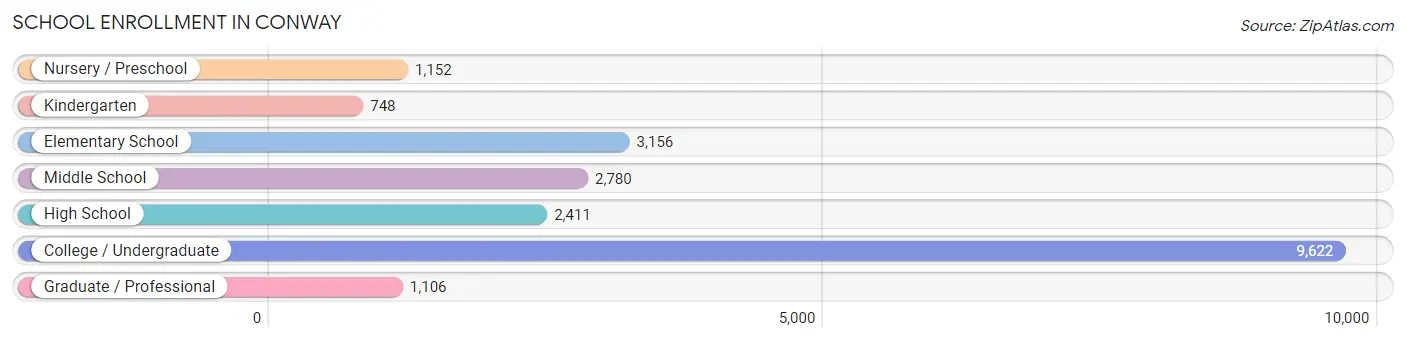
The most common levels of schooling among the 20,975 students in Conway are college / undergraduate (9,622 | 45.9%), elementary school (3,156 | 15.0%), and middle school (2,780 | 13.3%).
| School Level | # Students | % Students |
| Nursery / Preschool | 1,152 | 5.5% |
| Kindergarten | 748 | 3.6% |
| Elementary School | 3,156 | 15.0% |
| Middle School | 2,780 | 13.3% |
| High School | 2,411 | 11.5% |
| College / Undergraduate | 9,622 | 45.9% |
| Graduate / Professional | 1,106 | 5.3% |
| Total | 20,975 | 100.0% |
School Enrollment by Age by Funding Source in Conway
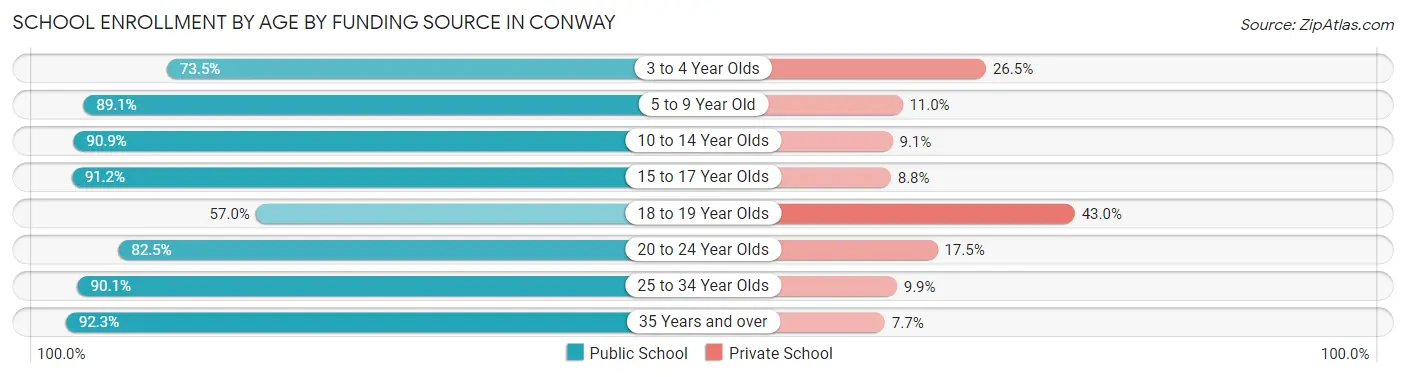
Out of a total of 20,975 students who are enrolled in schools in Conway, 3,755 (17.9%) attend a private institution, while the remaining 17,220 (82.1%) are enrolled in public schools. The age group of 18 to 19 year olds has the highest likelihood of being enrolled in private schools, with 1,477 (43.0% in the age bracket) enrolled. Conversely, the age group of 35 years and over has the lowest likelihood of being enrolled in a private school, with 577 (92.3% in the age bracket) attending a public institution.
| Age Bracket | Public School | Private School |
| 3 to 4 Year Olds | 510 (73.5%) | 184 (26.5%) |
| 5 to 9 Year Old | 3,650 (89.0%) | 449 (11.0%) |
| 10 to 14 Year Olds | 2,857 (90.9%) | 286 (9.1%) |
| 15 to 17 Year Olds | 1,871 (91.2%) | 180 (8.8%) |
| 18 to 19 Year Olds | 1,955 (57.0%) | 1,477 (43.0%) |
| 20 to 24 Year Olds | 4,902 (82.5%) | 1,038 (17.5%) |
| 25 to 34 Year Olds | 893 (90.1%) | 98 (9.9%) |
| 35 Years and over | 577 (92.3%) | 48 (7.7%) |
| Total | 17,220 (82.1%) | 3,755 (17.9%) |
Educational Attainment by Field of Study in Conway
Business (3,492 | 21.4%), science & technology (2,648 | 16.2%), education (2,125 | 13.0%), arts & humanities (1,136 | 7.0%), and social sciences (982 | 6.0%) are the most common fields of study among 16,350 individuals in Conway who have obtained a bachelor's degree or higher.
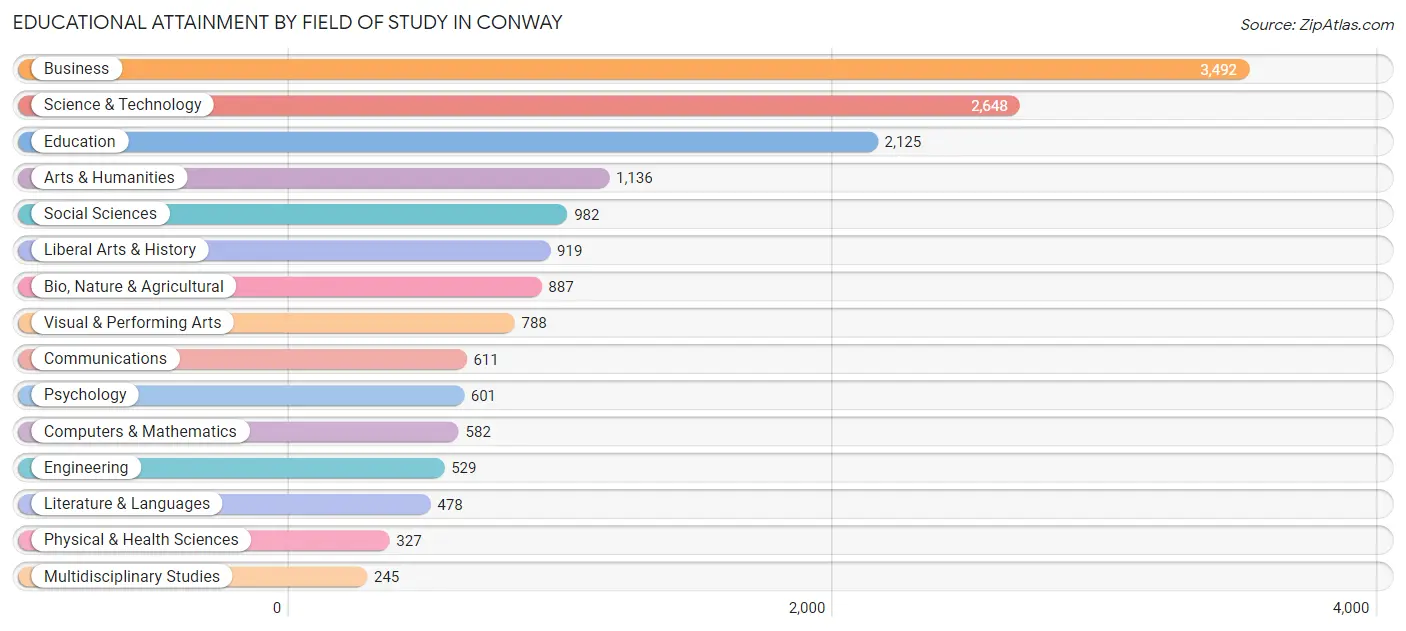
| Field of Study | # Graduates | % Graduates |
| Computers & Mathematics | 582 | 3.6% |
| Bio, Nature & Agricultural | 887 | 5.4% |
| Physical & Health Sciences | 327 | 2.0% |
| Psychology | 601 | 3.7% |
| Social Sciences | 982 | 6.0% |
| Engineering | 529 | 3.2% |
| Multidisciplinary Studies | 245 | 1.5% |
| Science & Technology | 2,648 | 16.2% |
| Business | 3,492 | 21.4% |
| Education | 2,125 | 13.0% |
| Literature & Languages | 478 | 2.9% |
| Liberal Arts & History | 919 | 5.6% |
| Visual & Performing Arts | 788 | 4.8% |
| Communications | 611 | 3.7% |
| Arts & Humanities | 1,136 | 7.0% |
| Total | 16,350 | 100.0% |
Transportation & Commute in Conway
Vehicle Availability by Sex in Conway
The most prevalent vehicle ownership categories in Conway are males with 2 vehicles (8,320, accounting for 53.4%) and females with 2 vehicles (6,918, making up 53.1%).
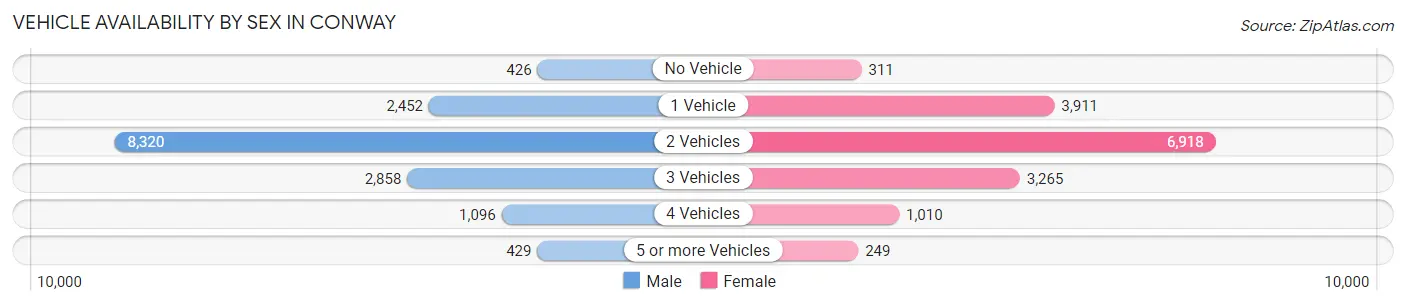
| Vehicles Available | Male | Female |
| No Vehicle | 426 (2.7%) | 311 (2.0%) |
| 1 Vehicle | 2,452 (15.7%) | 3,911 (25.0%) |
| 2 Vehicles | 8,320 (53.4%) | 6,918 (44.2%) |
| 3 Vehicles | 2,858 (18.3%) | 3,265 (20.8%) |
| 4 Vehicles | 1,096 (7.0%) | 1,010 (6.5%) |
| 5 or more Vehicles | 429 (2.8%) | 249 (1.6%) |
| Total | 15,581 (100.0%) | 15,664 (100.0%) |
Commute Time in Conway
The most frequently occuring commute durations in Conway are 10 to 14 minutes (6,833 commuters, 23.3%), 5 to 9 minutes (5,141 commuters, 17.5%), and 15 to 19 minutes (3,847 commuters, 13.1%).
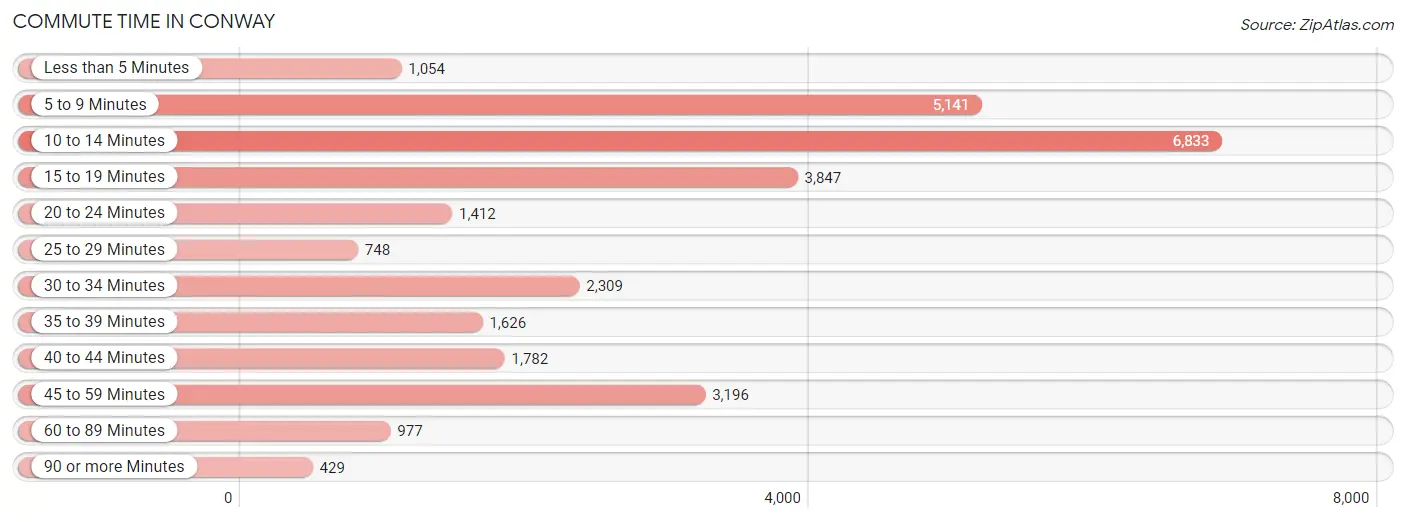
| Commute Time | # Commuters | % Commuters |
| Less than 5 Minutes | 1,054 | 3.6% |
| 5 to 9 Minutes | 5,141 | 17.5% |
| 10 to 14 Minutes | 6,833 | 23.3% |
| 15 to 19 Minutes | 3,847 | 13.1% |
| 20 to 24 Minutes | 1,412 | 4.8% |
| 25 to 29 Minutes | 748 | 2.5% |
| 30 to 34 Minutes | 2,309 | 7.9% |
| 35 to 39 Minutes | 1,626 | 5.5% |
| 40 to 44 Minutes | 1,782 | 6.1% |
| 45 to 59 Minutes | 3,196 | 10.9% |
| 60 to 89 Minutes | 977 | 3.3% |
| 90 or more Minutes | 429 | 1.5% |
Commute Time by Sex in Conway
The most common commute times in Conway are 10 to 14 minutes (4,010 commuters, 27.2%) for males and 5 to 9 minutes (3,241 commuters, 22.2%) for females.
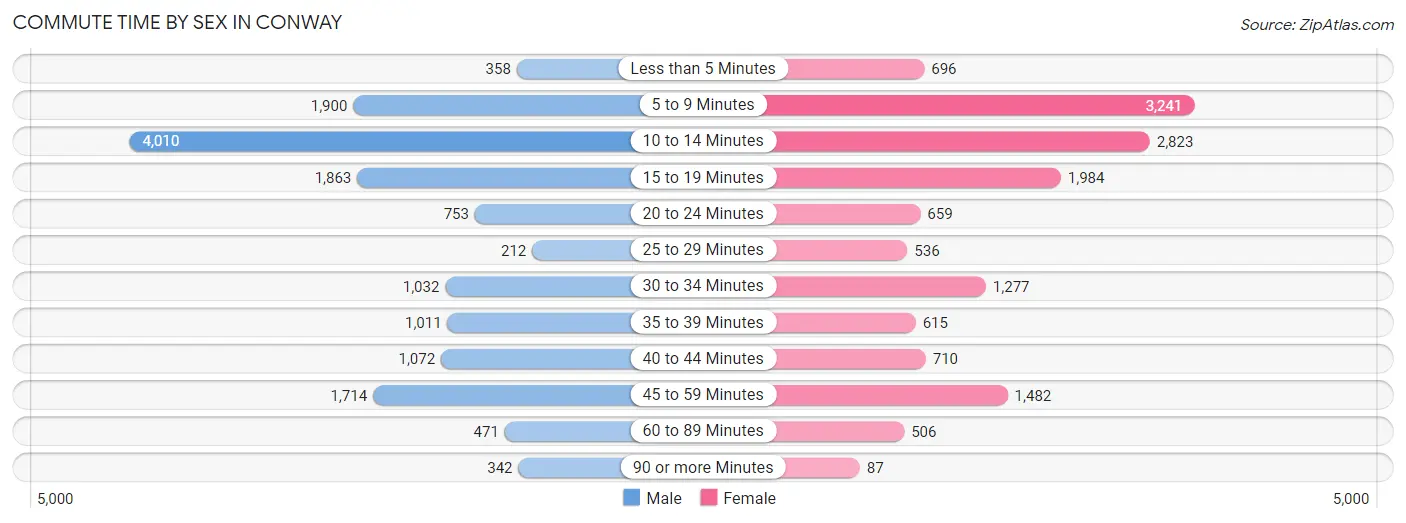
| Commute Time | Male | Female |
| Less than 5 Minutes | 358 (2.4%) | 696 (4.8%) |
| 5 to 9 Minutes | 1,900 (12.9%) | 3,241 (22.2%) |
| 10 to 14 Minutes | 4,010 (27.2%) | 2,823 (19.3%) |
| 15 to 19 Minutes | 1,863 (12.6%) | 1,984 (13.6%) |
| 20 to 24 Minutes | 753 (5.1%) | 659 (4.5%) |
| 25 to 29 Minutes | 212 (1.4%) | 536 (3.7%) |
| 30 to 34 Minutes | 1,032 (7.0%) | 1,277 (8.7%) |
| 35 to 39 Minutes | 1,011 (6.9%) | 615 (4.2%) |
| 40 to 44 Minutes | 1,072 (7.3%) | 710 (4.9%) |
| 45 to 59 Minutes | 1,714 (11.6%) | 1,482 (10.1%) |
| 60 to 89 Minutes | 471 (3.2%) | 506 (3.5%) |
| 90 or more Minutes | 342 (2.3%) | 87 (0.6%) |
Time of Departure to Work by Sex in Conway
The most frequent times of departure to work in Conway are 7:00 AM to 7:29 AM (2,055, 13.9%) for males and 7:00 AM to 7:29 AM (2,911, 19.9%) for females.
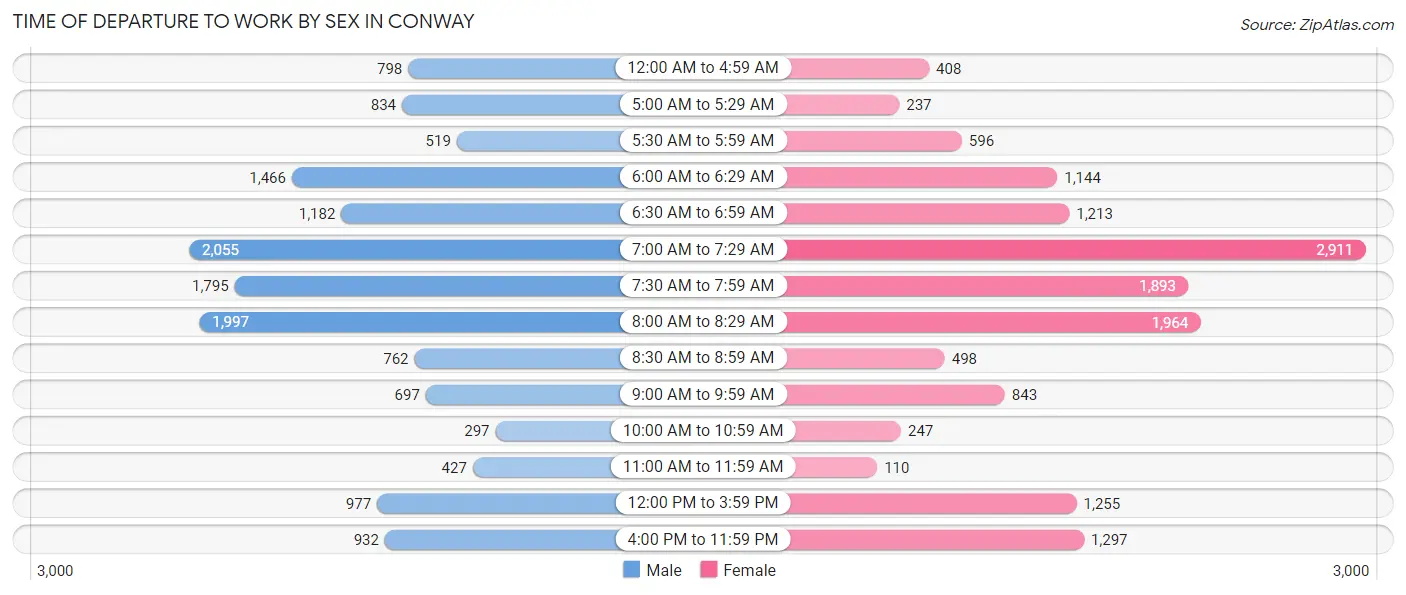
| Time of Departure | Male | Female |
| 12:00 AM to 4:59 AM | 798 (5.4%) | 408 (2.8%) |
| 5:00 AM to 5:29 AM | 834 (5.7%) | 237 (1.6%) |
| 5:30 AM to 5:59 AM | 519 (3.5%) | 596 (4.1%) |
| 6:00 AM to 6:29 AM | 1,466 (10.0%) | 1,144 (7.8%) |
| 6:30 AM to 6:59 AM | 1,182 (8.0%) | 1,213 (8.3%) |
| 7:00 AM to 7:29 AM | 2,055 (13.9%) | 2,911 (19.9%) |
| 7:30 AM to 7:59 AM | 1,795 (12.2%) | 1,893 (13.0%) |
| 8:00 AM to 8:29 AM | 1,997 (13.6%) | 1,964 (13.4%) |
| 8:30 AM to 8:59 AM | 762 (5.2%) | 498 (3.4%) |
| 9:00 AM to 9:59 AM | 697 (4.7%) | 843 (5.8%) |
| 10:00 AM to 10:59 AM | 297 (2.0%) | 247 (1.7%) |
| 11:00 AM to 11:59 AM | 427 (2.9%) | 110 (0.7%) |
| 12:00 PM to 3:59 PM | 977 (6.6%) | 1,255 (8.6%) |
| 4:00 PM to 11:59 PM | 932 (6.3%) | 1,297 (8.9%) |
| Total | 14,738 (100.0%) | 14,616 (100.0%) |
Housing Occupancy in Conway
Occupancy by Ownership in Conway
Of the total 25,451 dwellings in Conway, owner-occupied units account for 11,186 (44.0%), while renter-occupied units make up 14,265 (56.0%).
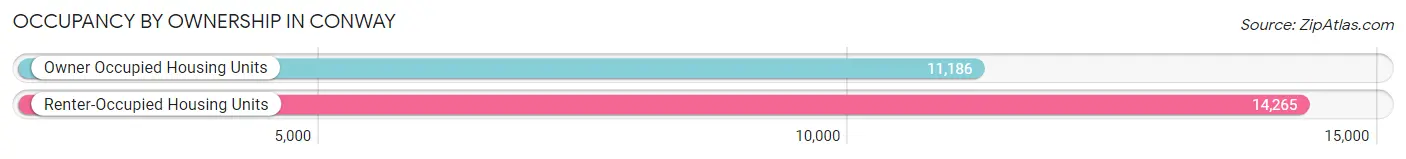
| Occupancy | # Housing Units | % Housing Units |
| Owner Occupied Housing Units | 11,186 | 44.0% |
| Renter-Occupied Housing Units | 14,265 | 56.0% |
| Total Occupied Housing Units | 25,451 | 100.0% |
Occupancy by Household Size in Conway
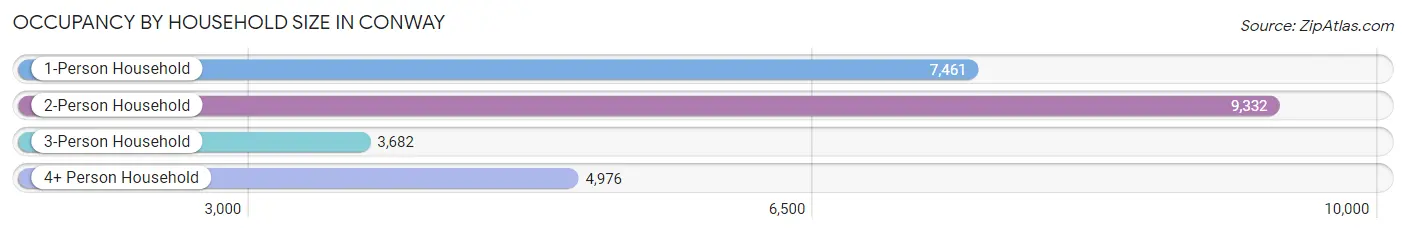
| Household Size | # Housing Units | % Housing Units |
| 1-Person Household | 7,461 | 29.3% |
| 2-Person Household | 9,332 | 36.7% |
| 3-Person Household | 3,682 | 14.5% |
| 4+ Person Household | 4,976 | 19.6% |
| Total Housing Units | 25,451 | 100.0% |
Occupancy by Ownership by Household Size in Conway
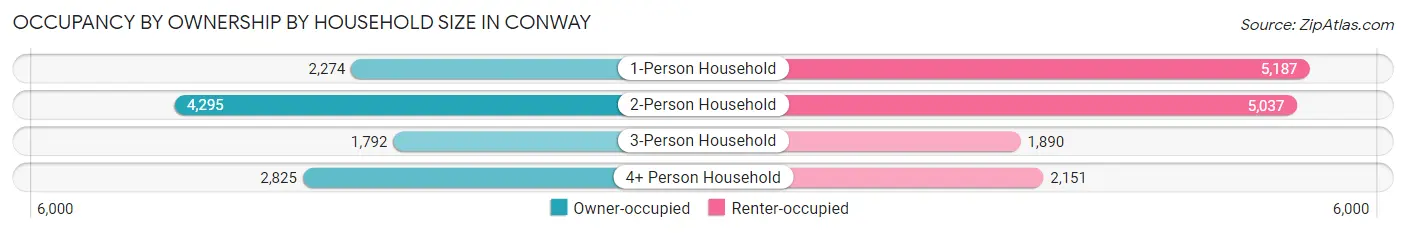
| Household Size | Owner-occupied | Renter-occupied |
| 1-Person Household | 2,274 (30.5%) | 5,187 (69.5%) |
| 2-Person Household | 4,295 (46.0%) | 5,037 (54.0%) |
| 3-Person Household | 1,792 (48.7%) | 1,890 (51.3%) |
| 4+ Person Household | 2,825 (56.8%) | 2,151 (43.2%) |
| Total Housing Units | 11,186 (44.0%) | 14,265 (56.0%) |
Occupancy by Educational Attainment in Conway
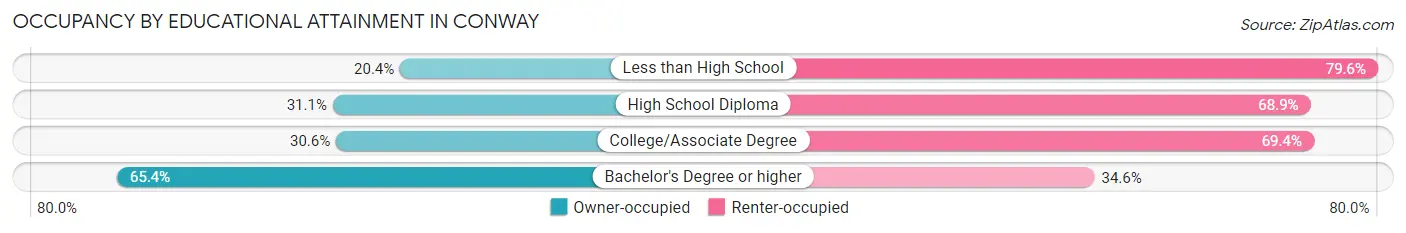
| Household Size | Owner-occupied | Renter-occupied |
| Less than High School | 216 (20.4%) | 841 (79.6%) |
| High School Diploma | 1,578 (31.1%) | 3,491 (68.9%) |
| College/Associate Degree | 2,852 (30.6%) | 6,467 (69.4%) |
| Bachelor's Degree or higher | 6,540 (65.4%) | 3,466 (34.6%) |
Occupancy by Age of Householder in Conway
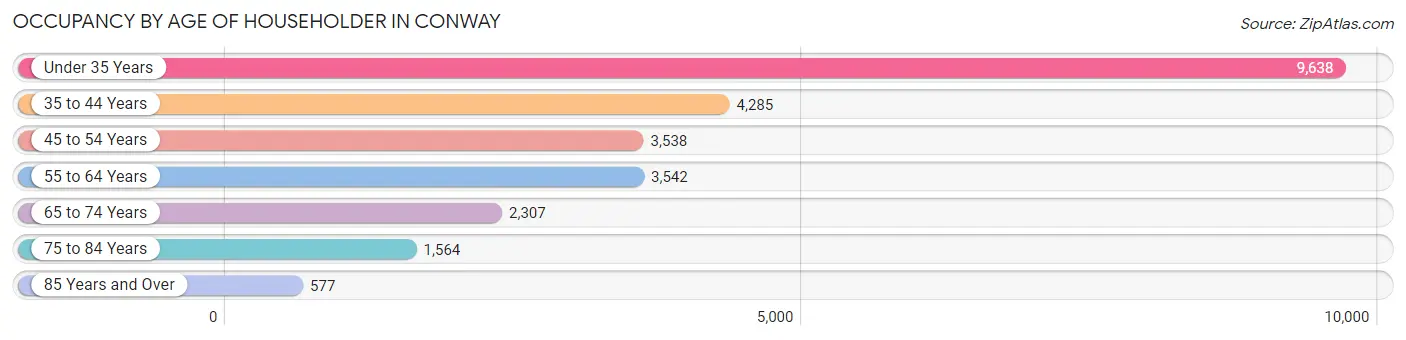
| Age Bracket | # Households | % Households |
| Under 35 Years | 9,638 | 37.9% |
| 35 to 44 Years | 4,285 | 16.8% |
| 45 to 54 Years | 3,538 | 13.9% |
| 55 to 64 Years | 3,542 | 13.9% |
| 65 to 74 Years | 2,307 | 9.1% |
| 75 to 84 Years | 1,564 | 6.1% |
| 85 Years and Over | 577 | 2.3% |
| Total | 25,451 | 100.0% |
Housing Finances in Conway
Median Income by Occupancy in Conway
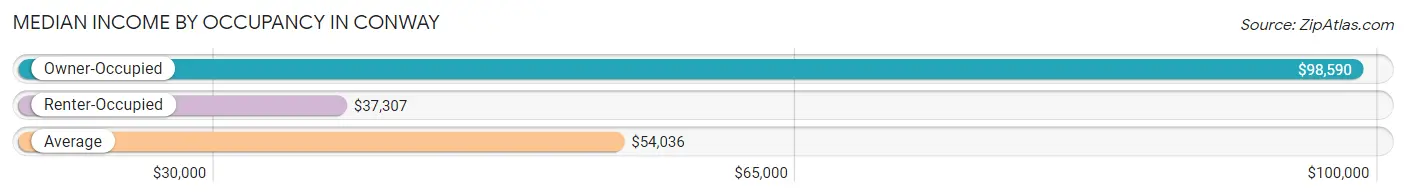
| Occupancy Type | # Households | Median Income |
| Owner-Occupied | 11,186 (44.0%) | $98,590 |
| Renter-Occupied | 14,265 (56.0%) | $37,307 |
| Average | 25,451 (100.0%) | $54,036 |
Occupancy by Householder Income Bracket in Conway
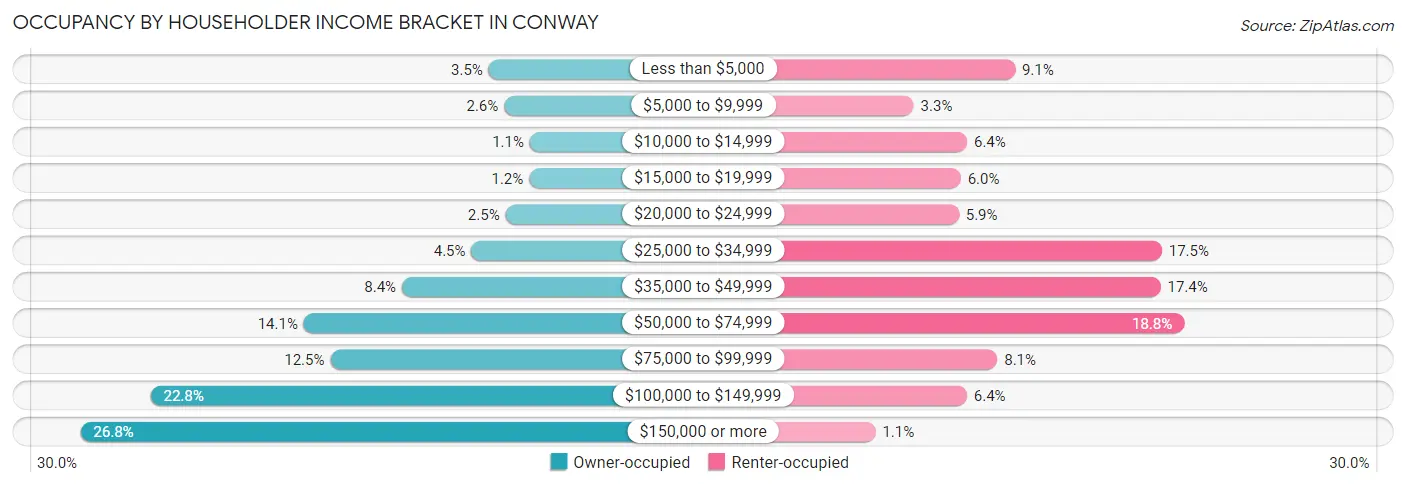
| Income Bracket | Owner-occupied | Renter-occupied |
| Less than $5,000 | 389 (3.5%) | 1,299 (9.1%) |
| $5,000 to $9,999 | 291 (2.6%) | 473 (3.3%) |
| $10,000 to $14,999 | 126 (1.1%) | 908 (6.4%) |
| $15,000 to $19,999 | 131 (1.2%) | 858 (6.0%) |
| $20,000 to $24,999 | 282 (2.5%) | 841 (5.9%) |
| $25,000 to $34,999 | 500 (4.5%) | 2,497 (17.5%) |
| $35,000 to $49,999 | 944 (8.4%) | 2,486 (17.4%) |
| $50,000 to $74,999 | 1,572 (14.1%) | 2,677 (18.8%) |
| $75,000 to $99,999 | 1,402 (12.5%) | 1,156 (8.1%) |
| $100,000 to $149,999 | 2,550 (22.8%) | 907 (6.4%) |
| $150,000 or more | 2,999 (26.8%) | 163 (1.1%) |
| Total | 11,186 (100.0%) | 14,265 (100.0%) |
Monthly Housing Cost Tiers in Conway
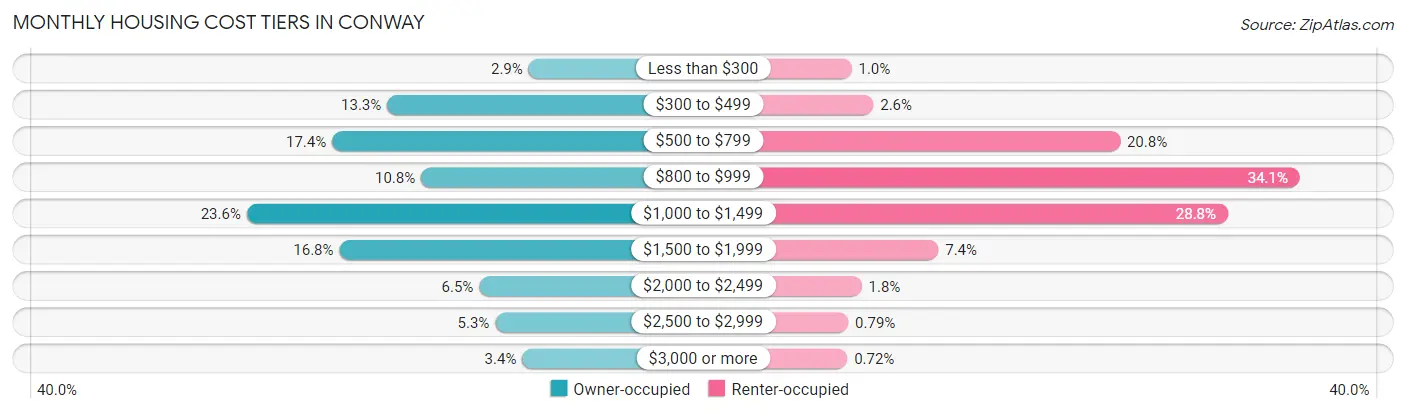
| Monthly Cost | Owner-occupied | Renter-occupied |
| Less than $300 | 322 (2.9%) | 149 (1.0%) |
| $300 to $499 | 1,488 (13.3%) | 376 (2.6%) |
| $500 to $799 | 1,942 (17.4%) | 2,969 (20.8%) |
| $800 to $999 | 1,208 (10.8%) | 4,857 (34.1%) |
| $1,000 to $1,499 | 2,644 (23.6%) | 4,101 (28.7%) |
| $1,500 to $1,999 | 1,881 (16.8%) | 1,060 (7.4%) |
| $2,000 to $2,499 | 729 (6.5%) | 254 (1.8%) |
| $2,500 to $2,999 | 597 (5.3%) | 112 (0.8%) |
| $3,000 or more | 375 (3.4%) | 102 (0.7%) |
| Total | 11,186 (100.0%) | 14,265 (100.0%) |
Physical Housing Characteristics in Conway
Housing Structures in Conway
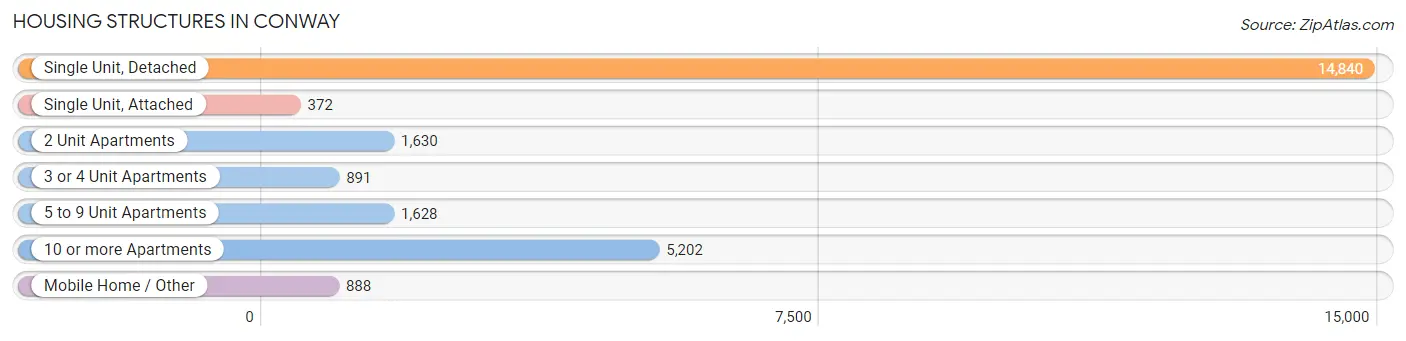
| Structure Type | # Housing Units | % Housing Units |
| Single Unit, Detached | 14,840 | 58.3% |
| Single Unit, Attached | 372 | 1.5% |
| 2 Unit Apartments | 1,630 | 6.4% |
| 3 or 4 Unit Apartments | 891 | 3.5% |
| 5 to 9 Unit Apartments | 1,628 | 6.4% |
| 10 or more Apartments | 5,202 | 20.4% |
| Mobile Home / Other | 888 | 3.5% |
| Total | 25,451 | 100.0% |
Housing Structures by Occupancy in Conway
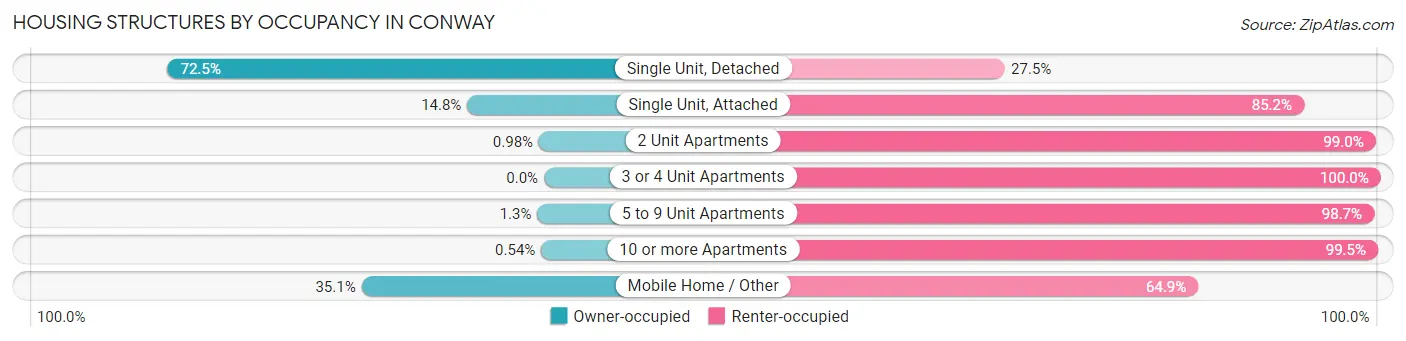
| Structure Type | Owner-occupied | Renter-occupied |
| Single Unit, Detached | 10,754 (72.5%) | 4,086 (27.5%) |
| Single Unit, Attached | 55 (14.8%) | 317 (85.2%) |
| 2 Unit Apartments | 16 (1.0%) | 1,614 (99.0%) |
| 3 or 4 Unit Apartments | 0 (0.0%) | 891 (100.0%) |
| 5 to 9 Unit Apartments | 21 (1.3%) | 1,607 (98.7%) |
| 10 or more Apartments | 28 (0.5%) | 5,174 (99.5%) |
| Mobile Home / Other | 312 (35.1%) | 576 (64.9%) |
| Total | 11,186 (44.0%) | 14,265 (56.0%) |
Housing Structures by Number of Rooms in Conway
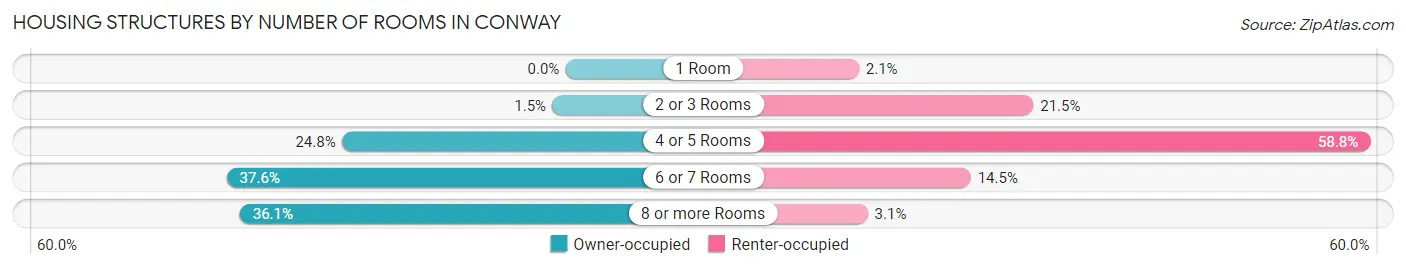
| Number of Rooms | Owner-occupied | Renter-occupied |
| 1 Room | 0 (0.0%) | 300 (2.1%) |
| 2 or 3 Rooms | 166 (1.5%) | 3,061 (21.5%) |
| 4 or 5 Rooms | 2,778 (24.8%) | 8,394 (58.8%) |
| 6 or 7 Rooms | 4,203 (37.6%) | 2,071 (14.5%) |
| 8 or more Rooms | 4,039 (36.1%) | 439 (3.1%) |
| Total | 11,186 (100.0%) | 14,265 (100.0%) |
Housing Structure by Heating Type in Conway
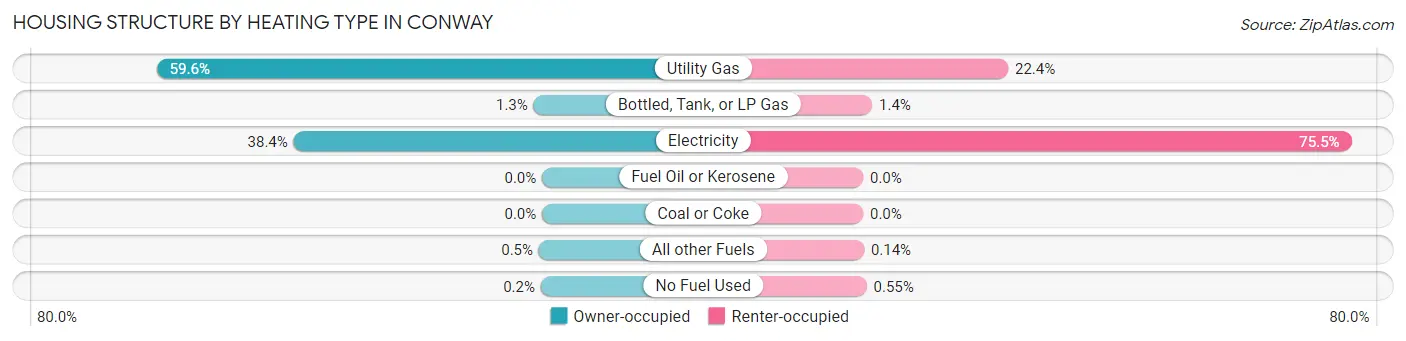
| Heating Type | Owner-occupied | Renter-occupied |
| Utility Gas | 6,665 (59.6%) | 3,198 (22.4%) |
| Bottled, Tank, or LP Gas | 146 (1.3%) | 200 (1.4%) |
| Electricity | 4,297 (38.4%) | 10,769 (75.5%) |
| Fuel Oil or Kerosene | 0 (0.0%) | 0 (0.0%) |
| Coal or Coke | 0 (0.0%) | 0 (0.0%) |
| All other Fuels | 56 (0.5%) | 20 (0.1%) |
| No Fuel Used | 22 (0.2%) | 78 (0.5%) |
| Total | 11,186 (100.0%) | 14,265 (100.0%) |
Household Vehicle Usage in Conway
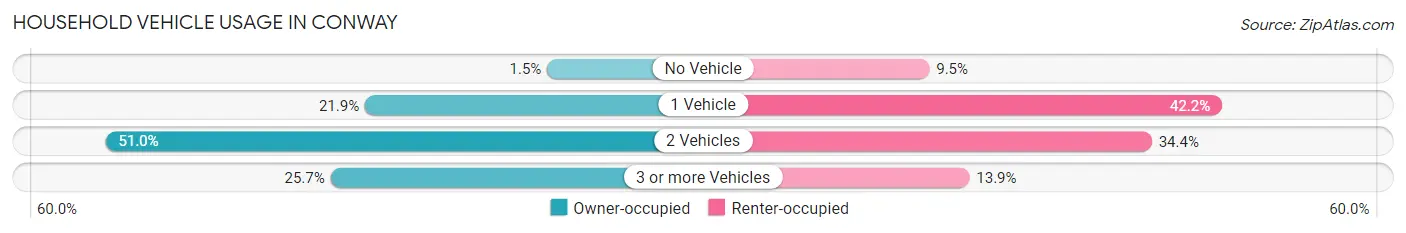
| Vehicles per Household | Owner-occupied | Renter-occupied |
| No Vehicle | 163 (1.5%) | 1,348 (9.5%) |
| 1 Vehicle | 2,446 (21.9%) | 6,025 (42.2%) |
| 2 Vehicles | 5,699 (50.9%) | 4,903 (34.4%) |
| 3 or more Vehicles | 2,878 (25.7%) | 1,989 (13.9%) |
| Total | 11,186 (100.0%) | 14,265 (100.0%) |
Real Estate & Mortgages in Conway
Real Estate and Mortgage Overview in Conway
| Characteristic | Without Mortgage | With Mortgage |
| Housing Units | 3,718 | 7,468 |
| Median Property Value | $221,600 | $224,800 |
| Median Household Income | $73,839 | $2,268 |
| Monthly Housing Costs | $530 | $368 |
| Real Estate Taxes | $1,435 | $220 |
Property Value by Mortgage Status in Conway
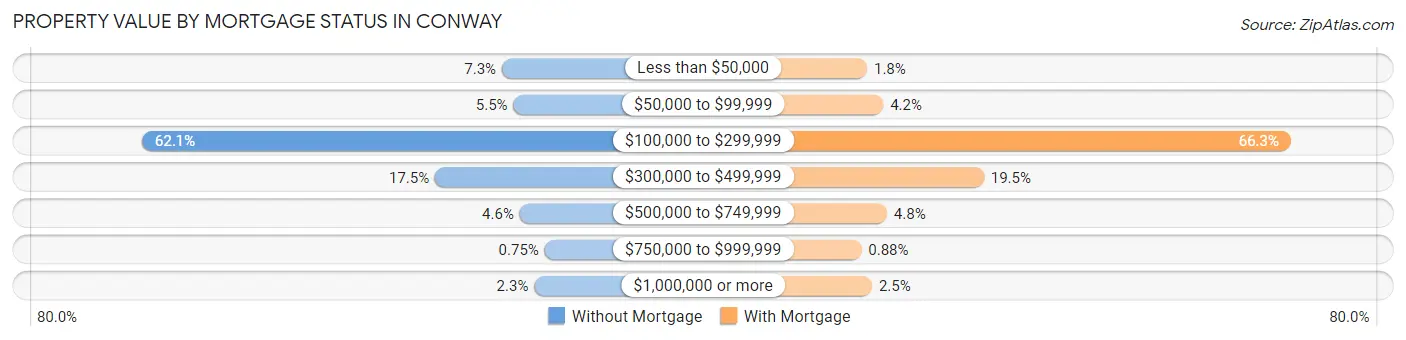
| Property Value | Without Mortgage | With Mortgage |
| Less than $50,000 | 270 (7.3%) | 131 (1.8%) |
| $50,000 to $99,999 | 205 (5.5%) | 315 (4.2%) |
| $100,000 to $299,999 | 2,310 (62.1%) | 4,953 (66.3%) |
| $300,000 to $499,999 | 649 (17.5%) | 1,459 (19.5%) |
| $500,000 to $749,999 | 169 (4.5%) | 357 (4.8%) |
| $750,000 to $999,999 | 28 (0.7%) | 66 (0.9%) |
| $1,000,000 or more | 87 (2.3%) | 187 (2.5%) |
| Total | 3,718 (100.0%) | 7,468 (100.0%) |
Household Income by Mortgage Status in Conway
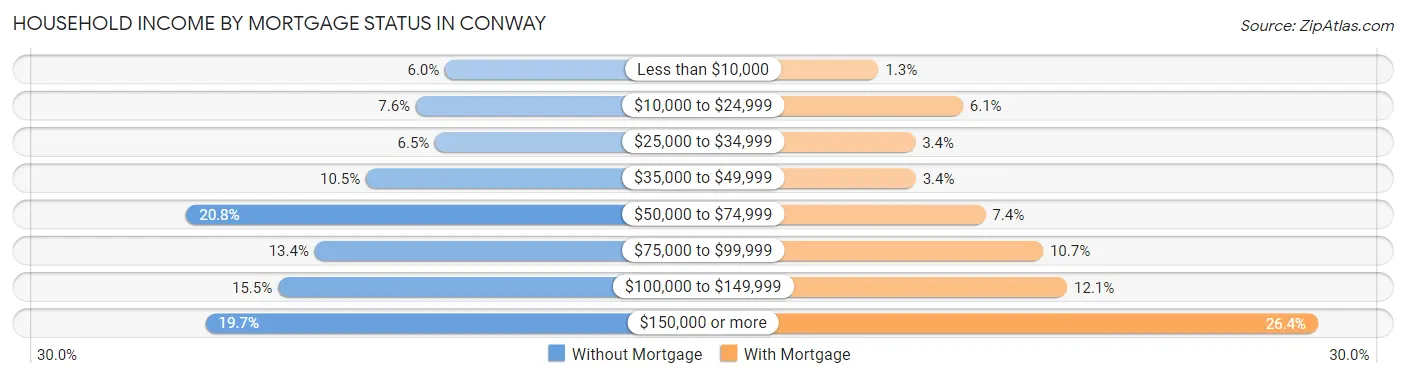
| Household Income | Without Mortgage | With Mortgage |
| Less than $10,000 | 222 (6.0%) | 98 (1.3%) |
| $10,000 to $24,999 | 284 (7.6%) | 458 (6.1%) |
| $25,000 to $34,999 | 243 (6.5%) | 255 (3.4%) |
| $35,000 to $49,999 | 390 (10.5%) | 257 (3.4%) |
| $50,000 to $74,999 | 772 (20.8%) | 554 (7.4%) |
| $75,000 to $99,999 | 499 (13.4%) | 800 (10.7%) |
| $100,000 to $149,999 | 577 (15.5%) | 903 (12.1%) |
| $150,000 or more | 731 (19.7%) | 1,973 (26.4%) |
| Total | 3,718 (100.0%) | 7,468 (100.0%) |
Property Value to Household Income Ratio in Conway
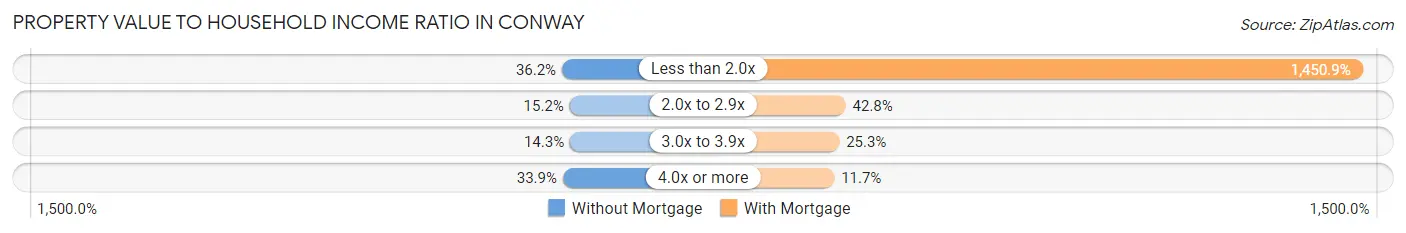
| Value-to-Income Ratio | Without Mortgage | With Mortgage |
| Less than 2.0x | 1,345 (36.2%) | 108,351 (1,450.9%) |
| 2.0x to 2.9x | 565 (15.2%) | 3,195 (42.8%) |
| 3.0x to 3.9x | 530 (14.2%) | 1,887 (25.3%) |
| 4.0x or more | 1,259 (33.9%) | 871 (11.7%) |
| Total | 3,718 (100.0%) | 7,468 (100.0%) |
Real Estate Taxes by Mortgage Status in Conway
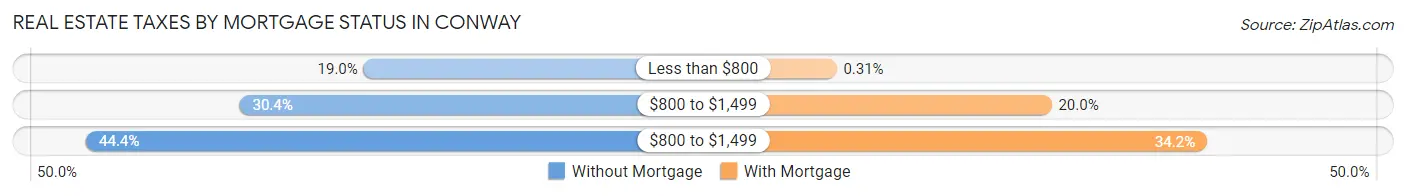
| Property Taxes | Without Mortgage | With Mortgage |
| Less than $800 | 708 (19.0%) | 23 (0.3%) |
| $800 to $1,499 | 1,129 (30.4%) | 1,490 (20.0%) |
| $800 to $1,499 | 1,650 (44.4%) | 2,550 (34.2%) |
| Total | 3,718 (100.0%) | 7,468 (100.0%) |
Health & Disability in Conway
Health Insurance Coverage by Age in Conway
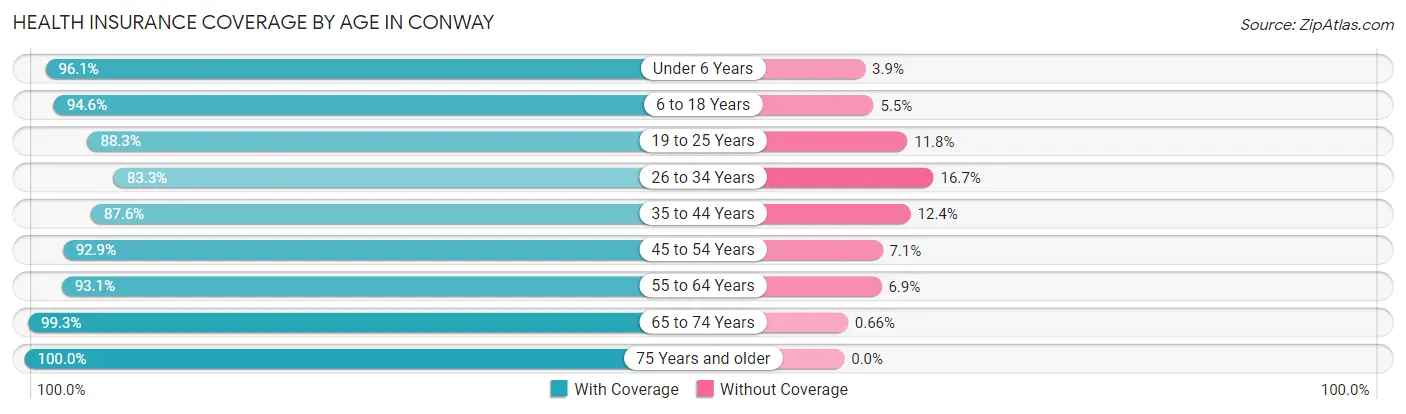
| Age Bracket | With Coverage | Without Coverage |
| Under 6 Years | 4,277 (96.1%) | 173 (3.9%) |
| 6 to 18 Years | 10,294 (94.6%) | 593 (5.4%) |
| 19 to 25 Years | 12,140 (88.2%) | 1,616 (11.7%) |
| 26 to 34 Years | 6,938 (83.3%) | 1,387 (16.7%) |
| 35 to 44 Years | 7,063 (87.6%) | 997 (12.4%) |
| 45 to 54 Years | 5,545 (92.9%) | 425 (7.1%) |
| 55 to 64 Years | 5,227 (93.1%) | 389 (6.9%) |
| 65 to 74 Years | 3,590 (99.3%) | 24 (0.7%) |
| 75 Years and older | 3,093 (100.0%) | 0 (0.0%) |
| Total | 58,167 (91.2%) | 5,604 (8.8%) |
Health Insurance Coverage by Citizenship Status in Conway
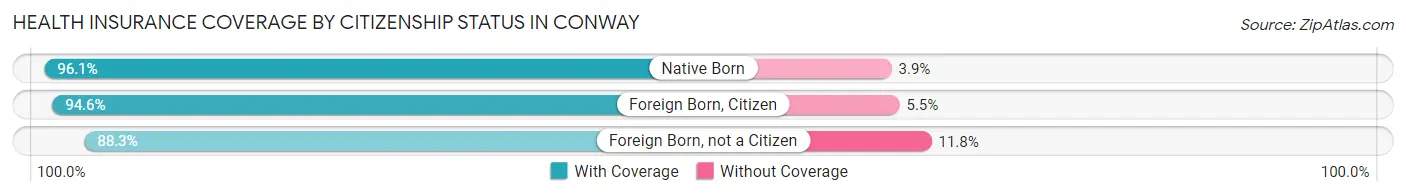
| Citizenship Status | With Coverage | Without Coverage |
| Native Born | 4,277 (96.1%) | 173 (3.9%) |
| Foreign Born, Citizen | 10,294 (94.6%) | 593 (5.4%) |
| Foreign Born, not a Citizen | 12,140 (88.2%) | 1,616 (11.7%) |
Health Insurance Coverage by Household Income in Conway
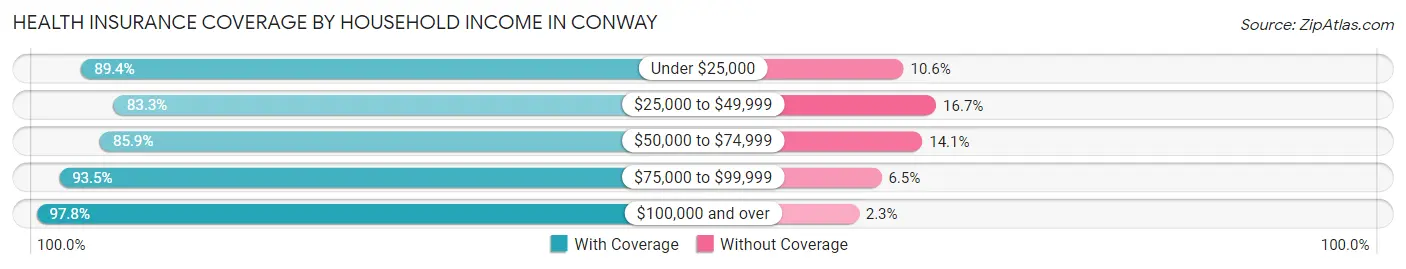
| Household Income | With Coverage | Without Coverage |
| Under $25,000 | 8,418 (89.4%) | 1,002 (10.6%) |
| $25,000 to $49,999 | 10,820 (83.3%) | 2,176 (16.7%) |
| $50,000 to $74,999 | 8,459 (85.9%) | 1,393 (14.1%) |
| $75,000 to $99,999 | 6,439 (93.5%) | 447 (6.5%) |
| $100,000 and over | 20,301 (97.8%) | 468 (2.2%) |
Public vs Private Health Insurance Coverage by Age in Conway
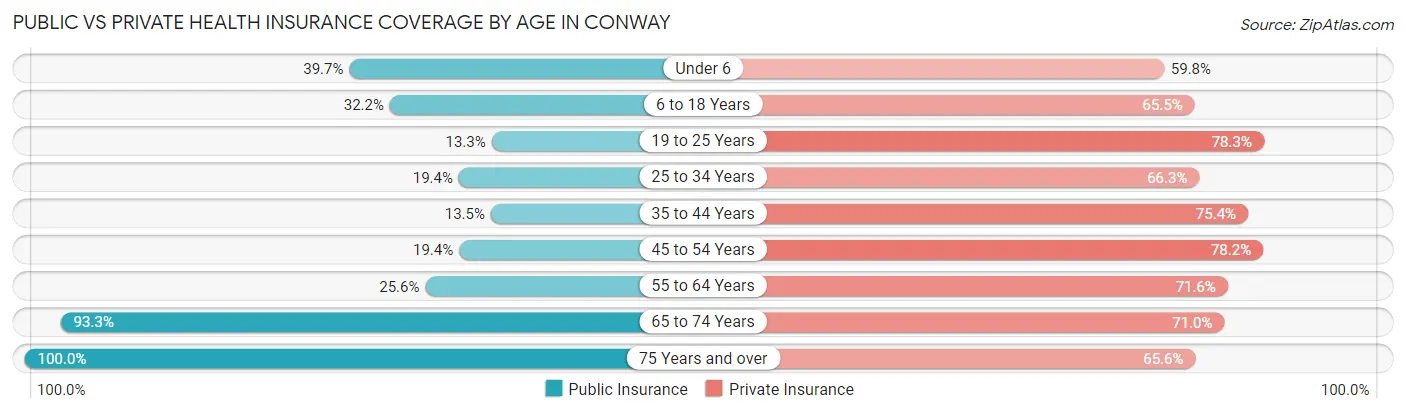
| Age Bracket | Public Insurance | Private Insurance |
| Under 6 | 1,768 (39.7%) | 2,660 (59.8%) |
| 6 to 18 Years | 3,508 (32.2%) | 7,130 (65.5%) |
| 19 to 25 Years | 1,832 (13.3%) | 10,772 (78.3%) |
| 25 to 34 Years | 1,615 (19.4%) | 5,523 (66.3%) |
| 35 to 44 Years | 1,086 (13.5%) | 6,075 (75.4%) |
| 45 to 54 Years | 1,156 (19.4%) | 4,667 (78.2%) |
| 55 to 64 Years | 1,439 (25.6%) | 4,022 (71.6%) |
| 65 to 74 Years | 3,373 (93.3%) | 2,566 (71.0%) |
| 75 Years and over | 3,093 (100.0%) | 2,029 (65.6%) |
| Total | 18,870 (29.6%) | 45,444 (71.3%) |
Disability Status by Sex by Age in Conway
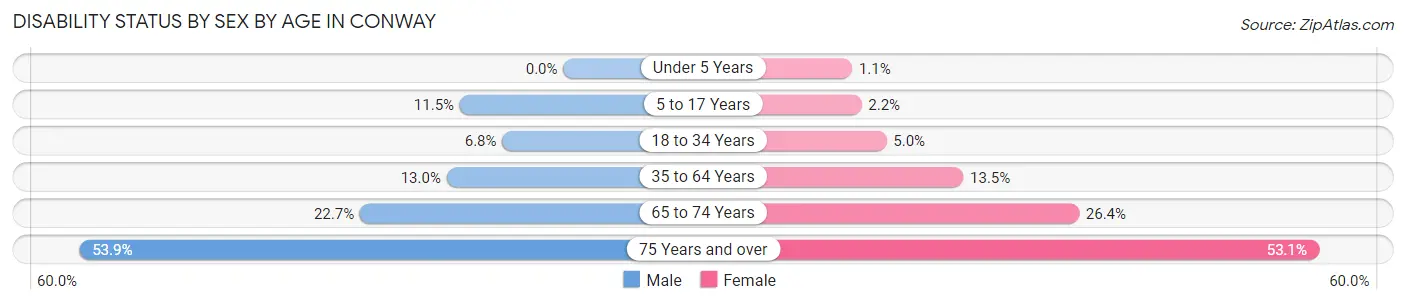
| Age Bracket | Male | Female |
| Under 5 Years | 0 (0.0%) | 18 (1.1%) |
| 5 to 17 Years | 545 (11.5%) | 112 (2.2%) |
| 18 to 34 Years | 780 (6.8%) | 625 (5.0%) |
| 35 to 64 Years | 1,227 (13.0%) | 1,378 (13.5%) |
| 65 to 74 Years | 332 (22.7%) | 567 (26.4%) |
| 75 Years and over | 613 (53.9%) | 1,039 (53.1%) |
Disability Class by Sex by Age in Conway
Disability Class: Hearing Difficulty
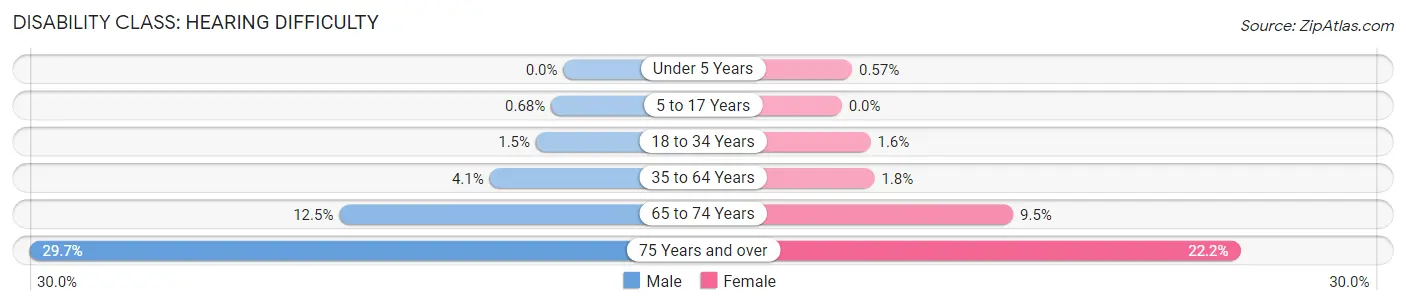
| Age Bracket | Male | Female |
| Under 5 Years | 0 (0.0%) | 9 (0.6%) |
| 5 to 17 Years | 32 (0.7%) | 0 (0.0%) |
| 18 to 34 Years | 176 (1.5%) | 202 (1.6%) |
| 35 to 64 Years | 388 (4.1%) | 186 (1.8%) |
| 65 to 74 Years | 183 (12.5%) | 205 (9.5%) |
| 75 Years and over | 338 (29.7%) | 434 (22.2%) |
Disability Class: Vision Difficulty
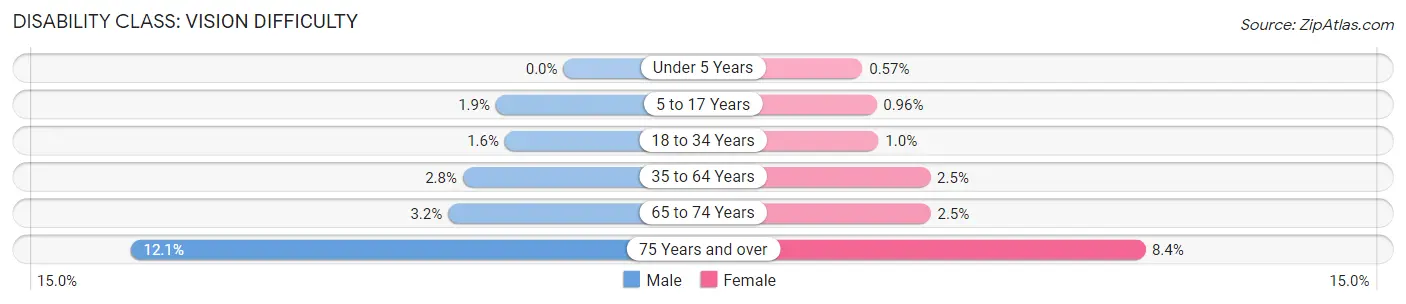
| Age Bracket | Male | Female |
| Under 5 Years | 0 (0.0%) | 9 (0.6%) |
| 5 to 17 Years | 89 (1.9%) | 49 (1.0%) |
| 18 to 34 Years | 187 (1.6%) | 129 (1.0%) |
| 35 to 64 Years | 265 (2.8%) | 251 (2.5%) |
| 65 to 74 Years | 47 (3.2%) | 53 (2.5%) |
| 75 Years and over | 137 (12.0%) | 165 (8.4%) |
Disability Class: Cognitive Difficulty
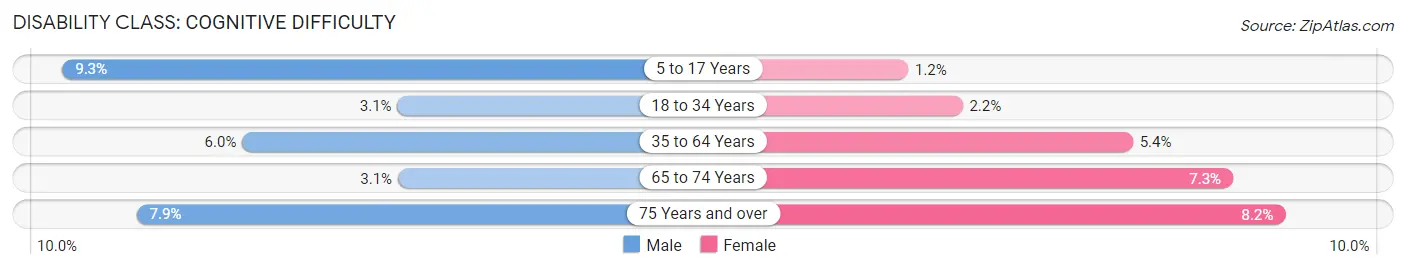
| Age Bracket | Male | Female |
| 5 to 17 Years | 440 (9.3%) | 63 (1.2%) |
| 18 to 34 Years | 354 (3.1%) | 282 (2.2%) |
| 35 to 64 Years | 563 (6.0%) | 551 (5.4%) |
| 65 to 74 Years | 45 (3.1%) | 156 (7.3%) |
| 75 Years and over | 90 (7.9%) | 161 (8.2%) |
Disability Class: Ambulatory Difficulty
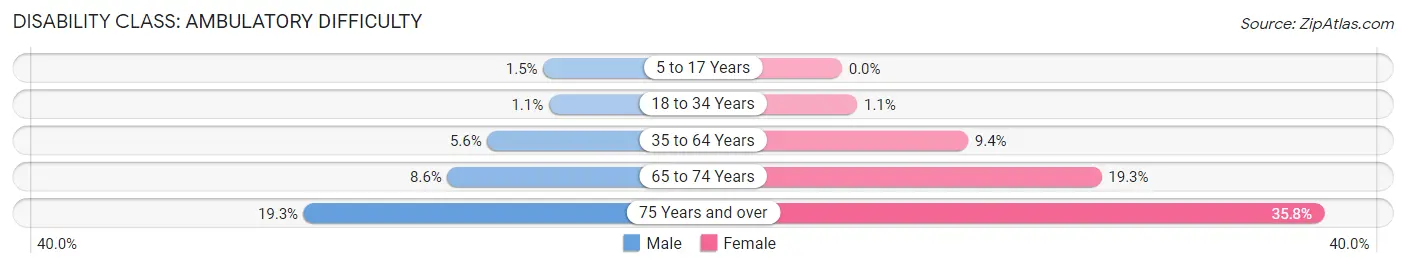
| Age Bracket | Male | Female |
| 5 to 17 Years | 70 (1.5%) | 0 (0.0%) |
| 18 to 34 Years | 122 (1.1%) | 142 (1.1%) |
| 35 to 64 Years | 532 (5.6%) | 955 (9.4%) |
| 65 to 74 Years | 126 (8.6%) | 414 (19.3%) |
| 75 Years and over | 219 (19.3%) | 700 (35.8%) |
Disability Class: Self-Care Difficulty
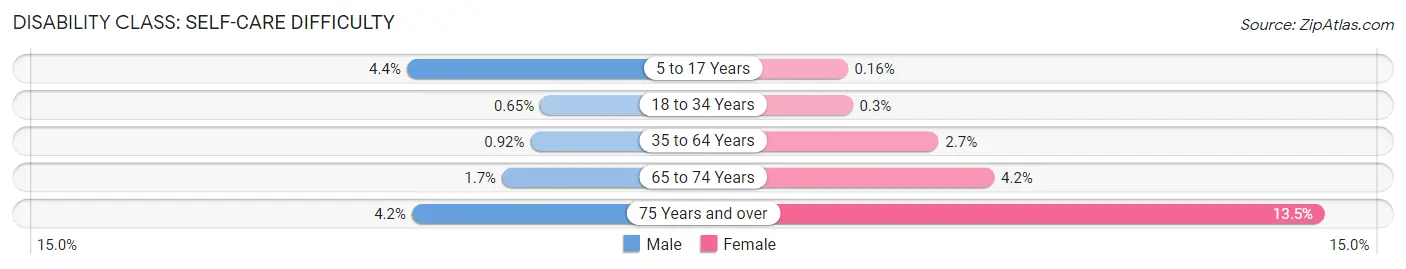
| Age Bracket | Male | Female |
| 5 to 17 Years | 206 (4.4%) | 8 (0.2%) |
| 18 to 34 Years | 75 (0.6%) | 38 (0.3%) |
| 35 to 64 Years | 87 (0.9%) | 274 (2.7%) |
| 65 to 74 Years | 25 (1.7%) | 91 (4.2%) |
| 75 Years and over | 48 (4.2%) | 263 (13.5%) |
Technology Access in Conway
Computing Device Access in Conway
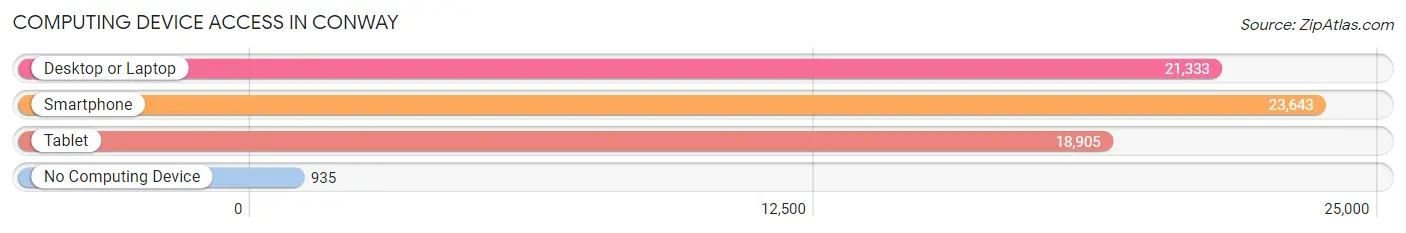
| Device Type | # Households | % Households |
| Desktop or Laptop | 21,333 | 83.8% |
| Smartphone | 23,643 | 92.9% |
| Tablet | 18,905 | 74.3% |
| No Computing Device | 935 | 3.7% |
| Total | 25,451 | 100.0% |
Internet Access in Conway
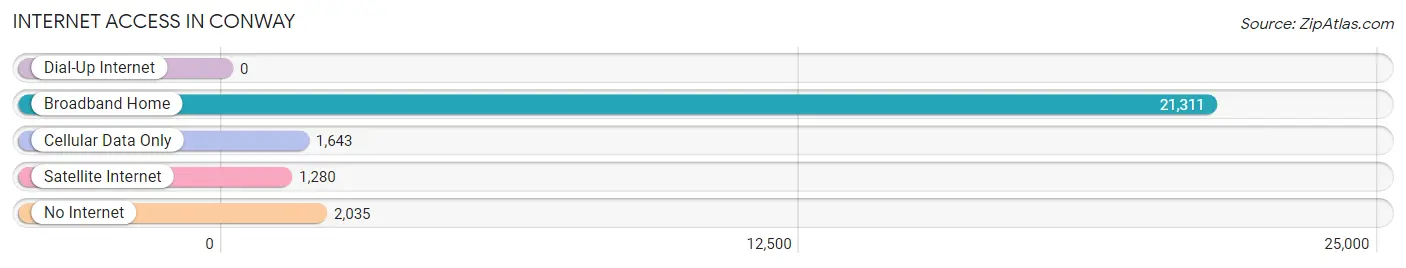
| Internet Type | # Households | % Households |
| Dial-Up Internet | 0 | 0.0% |
| Broadband Home | 21,311 | 83.7% |
| Cellular Data Only | 1,643 | 6.5% |
| Satellite Internet | 1,280 | 5.0% |
| No Internet | 2,035 | 8.0% |
| Total | 25,451 | 100.0% |
Conway Summary
Conway, Arkansas is a city located in Faulkner County, Arkansas. It is the county seat of Faulkner County and the seventh largest city in the state. The city is situated in the foothills of the Ouachita Mountains and is located about 30 miles north of Little Rock, the state capital.
History
The area that is now Conway was first settled in 1825 by William Lewis, who established a trading post near the Cadron Creek. The area was known as Lewisburg until 1845 when it was renamed Conwayborough in honor of Henry Wharton Conway, a prominent Arkansas politician. In 1853, the town was incorporated as Conway.
The city was an important center for the Confederate Army during the Civil War. In 1863, the Battle of Conway was fought in the city, resulting in a Confederate victory. After the war, the city experienced a period of growth and development, becoming an important center for the timber and railroad industries.
Geography
Conway is located in the foothills of the Ouachita Mountains in central Arkansas. The city is situated at the intersection of Interstate 40 and U.S. Route 65. The city covers an area of 24.3 square miles and has an elevation of 441 feet.
The city is located in the Arkansas River Valley and is surrounded by the Ozark Mountains to the north and the Ouachita Mountains to the south. The city is located about 30 miles north of Little Rock, the state capital.
Economy
Conway is an important economic center for the region. The city is home to several major employers, including Acxiom Corporation, Hewlett Packard, and the University of Central Arkansas. The city is also home to several major retail stores, including Walmart, Target, and Kohl’s.
The city is also home to several major manufacturing companies, including Tyson Foods, ConAgra Foods, and Simmons Foods. The city is also home to several major healthcare providers, including Conway Regional Medical Center and Conway Behavioral Health.
Demographics
As of the 2010 census, the city had a population of 58,908. The racial makeup of the city was 75.3% White, 17.3% African American, 0.7% Native American, 2.3% Asian, 0.1% Pacific Islander, 1.7% from other races, and 2.9% from two or more races. Hispanic or Latino of any race were 5.2% of the population.
The median income for a household in the city was $41,945 and the median income for a family was $50,867. The per capita income for the city was $20,945. About 11.3% of families and 15.2% of the population were below the poverty line, including 22.2% of those under age 18 and 8.7% of those age 65 or over.
Conway is a vibrant and growing city with a diverse economy and a rich history. The city is home to several major employers and is an important economic center for the region. The city is also home to several major retail stores and manufacturing companies. The city has a diverse population and a median income that is slightly higher than the national average.
Common Questions
What is Per Capita Income in Conway?
Per Capita income in Conway is $31,301.
What is the Median Family Income in Conway?
Median Family Income in Conway is $77,689.
What is the Median Household income in Conway?
Median Household Income in Conway is $54,036.
What is Income or Wage Gap in Conway?
Income or Wage Gap in Conway is 23.4%.
Women in Conway earn 76.6 cents for every dollar earned by a man.
What is Family Income Deficit in Conway?
Family Income Deficit in Conway is $10,603.
Families that are below poverty line in Conway earn $10,603 less on average than the poverty threshold level.
What is Inequality or Gini Index in Conway?
Inequality or Gini Index in Conway is 0.50.
What is the Total Population of Conway?
Total Population of Conway is 65,159.
What is the Total Male Population of Conway?
Total Male Population of Conway is 30,836.
What is the Total Female Population of Conway?
Total Female Population of Conway is 34,323.
What is the Ratio of Males per 100 Females in Conway?
There are 89.84 Males per 100 Females in Conway.
What is the Ratio of Females per 100 Males in Conway?
There are 111.31 Females per 100 Males in Conway.
What is the Median Population Age in Conway?
Median Population Age in Conway is 29.0 Years.
What is the Average Family Size in Conway
Average Family Size in Conway is 3.0 People.
What is the Average Household Size in Conway
Average Household Size in Conway is 2.4 People.
How Large is the Labor Force in Conway?
There are 33,066 People in the Labor Forcein in Conway.
What is the Percentage of People in the Labor Force in Conway?
62.2% of People are in the Labor Force in Conway.
What is the Unemployment Rate in Conway?
Unemployment Rate in Conway is 3.0%.