Russellville, AR Map & Demographics
Russellville Map
Russellville Overview
$25,477
PER CAPITA INCOME
$56,529
AVG FAMILY INCOME
$43,669
AVG HOUSEHOLD INCOME
35.7%
WAGE / INCOME GAP [ % ]
64.3¢/ $1
WAGE / INCOME GAP [ $ ]
$8,666
FAMILY INCOME DEFICIT
0.49
INEQUALITY / GINI INDEX
28,946
TOTAL POPULATION
13,873
MALE POPULATION
15,073
FEMALE POPULATION
92.04
MALES / 100 FEMALES
108.65
FEMALES / 100 MALES
29.9
MEDIAN AGE
3.1
AVG FAMILY SIZE
2.5
AVG HOUSEHOLD SIZE
13,722
LABOR FORCE [ PEOPLE ]
59.4%
PERCENT IN LABOR FORCE
5.3%
UNEMPLOYMENT RATE
Russellville Area Codes
Income in Russellville
Income Overview in Russellville
Per Capita Income in Russellville is $25,477, while median incomes of families and households are $56,529 and $43,669 respectively.
| Characteristic | Number | Measure |
| Per Capita Income | 28,946 | $25,477 |
| Median Family Income | 6,130 | $56,529 |
| Mean Family Income | 6,130 | $86,335 |
| Median Household Income | 10,424 | $43,669 |
| Mean Household Income | 10,424 | $66,619 |
| Income Deficit | 6,130 | $8,666 |
| Wage / Income Gap (%) | 28,946 | 35.73% |
| Wage / Income Gap ($) | 28,946 | 64.27¢ per $1 |
| Gini / Inequality Index | 28,946 | 0.49 |
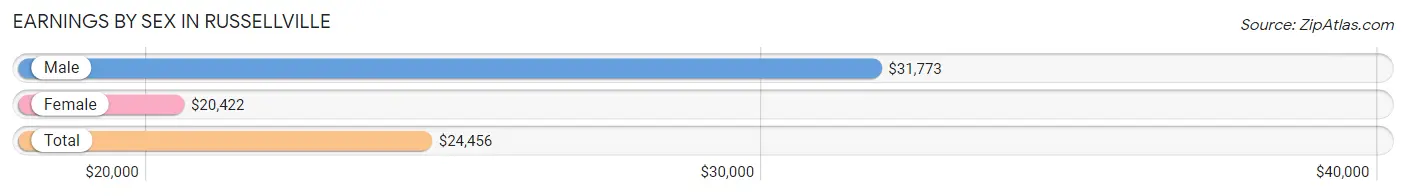
Earnings by Sex in Russellville
Average Earnings in Russellville are $24,456, $31,773 for men and $20,422 for women, a difference of 35.7%.
| Sex | Number | Average Earnings |
| Male | 7,771 (51.5%) | $31,773 |
| Female | 7,330 (48.5%) | $20,422 |
| Total | 15,101 (100.0%) | $24,456 |
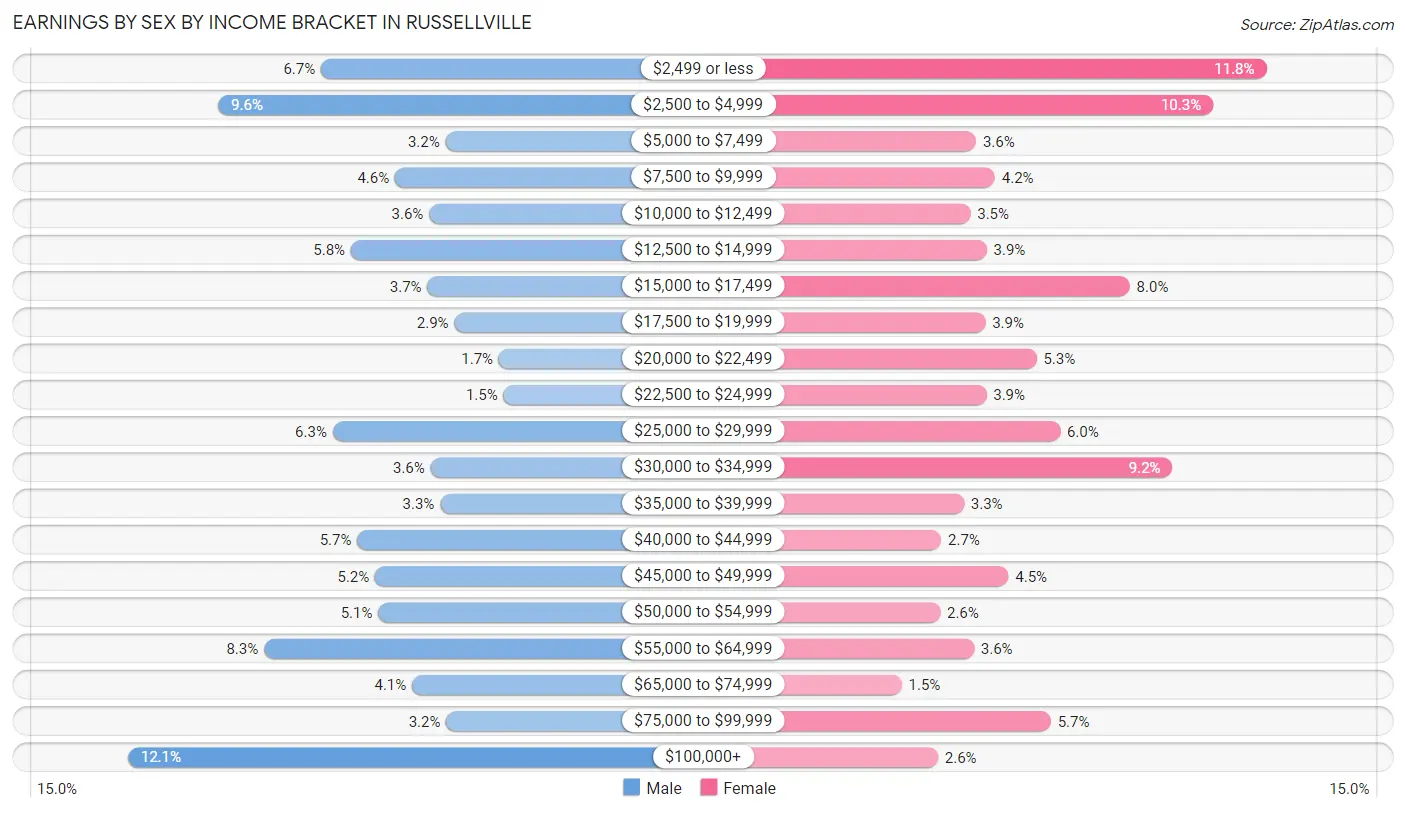
Earnings by Sex by Income Bracket in Russellville
The most common earnings brackets in Russellville are $100,000+ for men (940 | 12.1%) and $2,499 or less for women (864 | 11.8%).
| Income | Male | Female |
| $2,499 or less | 518 (6.7%) | 864 (11.8%) |
| $2,500 to $4,999 | 743 (9.6%) | 754 (10.3%) |
| $5,000 to $7,499 | 246 (3.2%) | 266 (3.6%) |
| $7,500 to $9,999 | 357 (4.6%) | 305 (4.2%) |
| $10,000 to $12,499 | 282 (3.6%) | 254 (3.5%) |
| $12,500 to $14,999 | 453 (5.8%) | 288 (3.9%) |
| $15,000 to $17,499 | 286 (3.7%) | 583 (8.0%) |
| $17,500 to $19,999 | 227 (2.9%) | 285 (3.9%) |
| $20,000 to $22,499 | 130 (1.7%) | 391 (5.3%) |
| $22,500 to $24,999 | 120 (1.5%) | 287 (3.9%) |
| $25,000 to $29,999 | 493 (6.3%) | 439 (6.0%) |
| $30,000 to $34,999 | 279 (3.6%) | 671 (9.1%) |
| $35,000 to $39,999 | 258 (3.3%) | 241 (3.3%) |
| $40,000 to $44,999 | 439 (5.7%) | 194 (2.6%) |
| $45,000 to $49,999 | 400 (5.1%) | 333 (4.5%) |
| $50,000 to $54,999 | 393 (5.1%) | 192 (2.6%) |
| $55,000 to $64,999 | 643 (8.3%) | 262 (3.6%) |
| $65,000 to $74,999 | 319 (4.1%) | 113 (1.5%) |
| $75,000 to $99,999 | 245 (3.2%) | 420 (5.7%) |
| $100,000+ | 940 (12.1%) | 188 (2.6%) |
| Total | 7,771 (100.0%) | 7,330 (100.0%) |
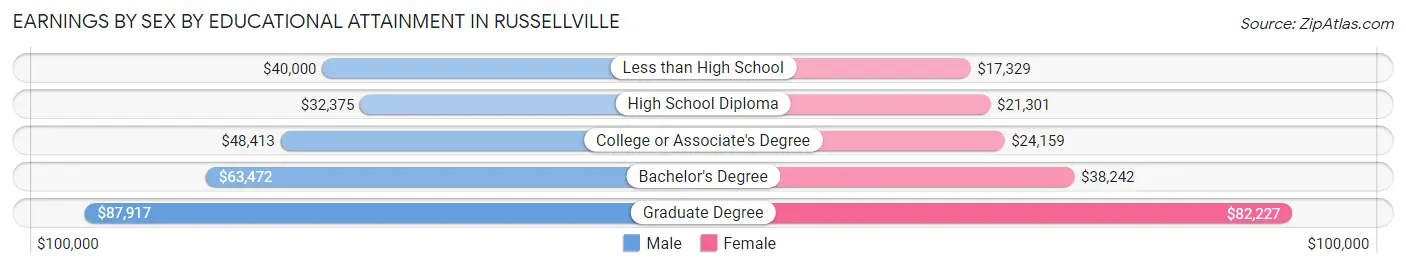
Earnings by Sex by Educational Attainment in Russellville
Average earnings in Russellville are $47,990 for men and $29,911 for women, a difference of 37.7%. Men with an educational attainment of graduate degree enjoy the highest average annual earnings of $87,917, while those with high school diploma education earn the least with $32,375. Women with an educational attainment of graduate degree earn the most with the average annual earnings of $82,227, while those with less than high school education have the smallest earnings of $17,329.
| Educational Attainment | Male Income | Female Income |
| Less than High School | $40,000 | $17,329 |
| High School Diploma | $32,375 | $21,301 |
| College or Associate's Degree | $48,413 | $24,159 |
| Bachelor's Degree | $63,472 | $38,242 |
| Graduate Degree | $87,917 | $82,227 |
| Total | $47,990 | $29,911 |
Family Income in Russellville
Family Income Brackets in Russellville
According to the Russellville family income data, there are 1,116 families falling into the $35,000 to $49,999 income range, which is the most common income bracket and makes up 18.2% of all families. Conversely, the $10,000 to $14,999 income bracket is the least frequent group with only 227 families (3.7%) belonging to this category.
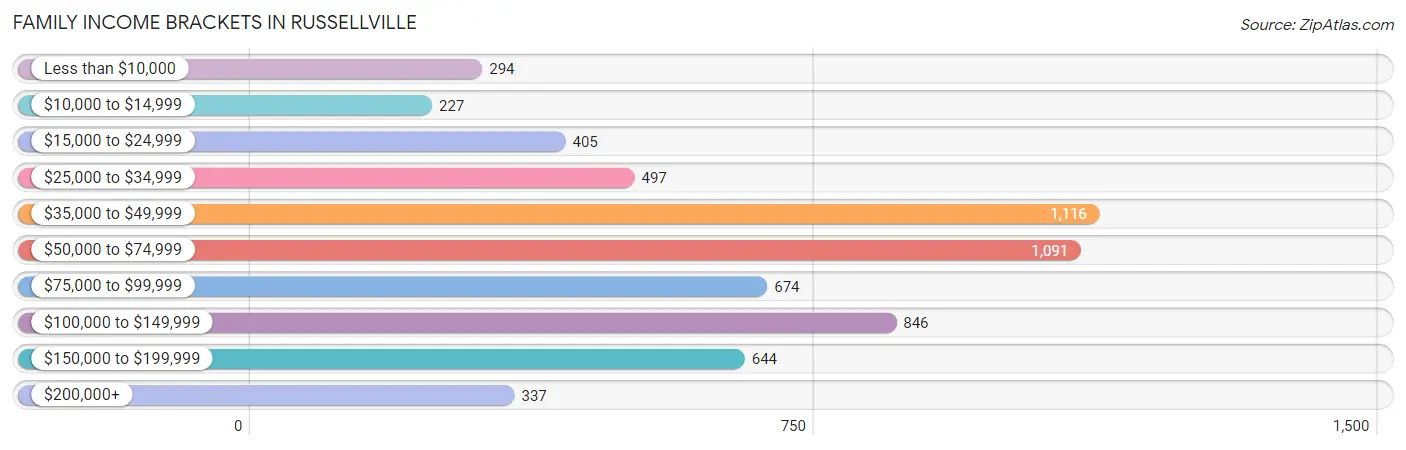
| Income Bracket | # Families | % Families |
| Less than $10,000 | 294 | 4.8% |
| $10,000 to $14,999 | 227 | 3.7% |
| $15,000 to $24,999 | 405 | 6.6% |
| $25,000 to $34,999 | 497 | 8.1% |
| $35,000 to $49,999 | 1,116 | 18.2% |
| $50,000 to $74,999 | 1,091 | 17.8% |
| $75,000 to $99,999 | 674 | 11.0% |
| $100,000 to $149,999 | 846 | 13.8% |
| $150,000 to $199,999 | 644 | 10.5% |
| $200,000+ | 337 | 5.5% |
Family Income by Famaliy Size in Russellville
5-person families (356 | 5.8%) account for the highest median family income in Russellville with $105,342 per family, while 2-person families (2,958 | 48.2%) have the highest median income of $27,232 per family member.
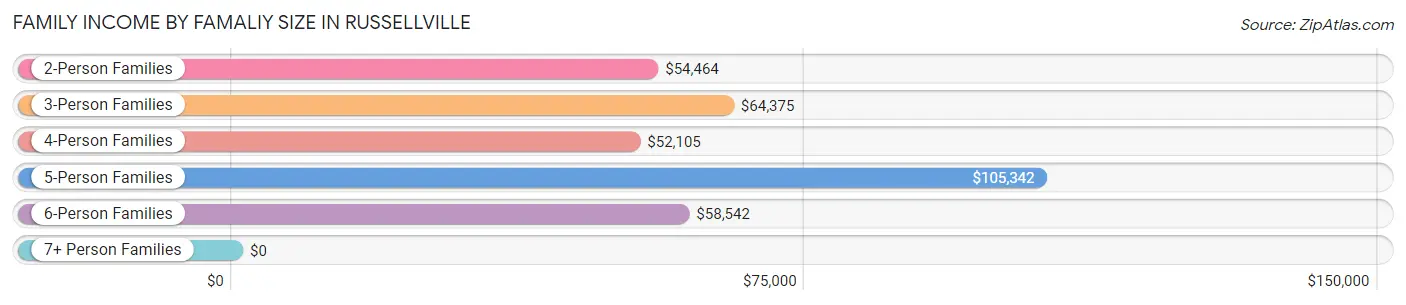
| Income Bracket | # Families | Median Income |
| 2-Person Families | 2,958 (48.2%) | $54,464 |
| 3-Person Families | 1,211 (19.8%) | $64,375 |
| 4-Person Families | 1,328 (21.7%) | $52,105 |
| 5-Person Families | 356 (5.8%) | $105,342 |
| 6-Person Families | 167 (2.7%) | $58,542 |
| 7+ Person Families | 110 (1.8%) | $0 |
| Total | 6,130 (100.0%) | $56,529 |
Family Income by Number of Earners in Russellville
The median family income in Russellville is $56,529, with families comprising 3+ earners (422) having the highest median family income of $95,000, while families with no earners (989) have the lowest median family income of $36,036, accounting for 6.9% and 16.1% of families, respectively.
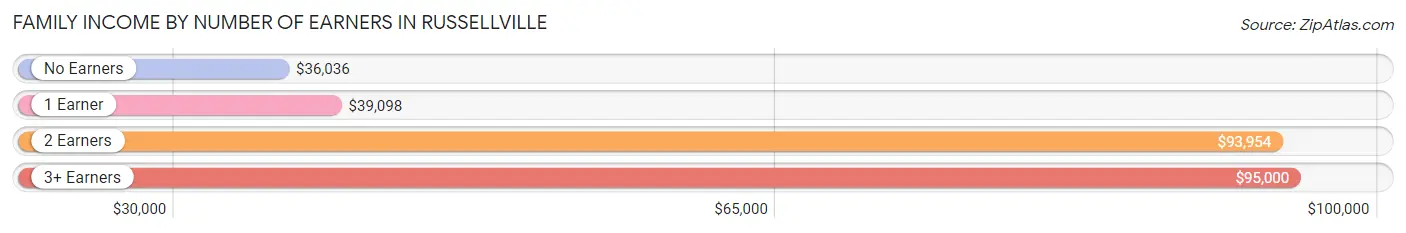
| Number of Earners | # Families | Median Income |
| No Earners | 989 (16.1%) | $36,036 |
| 1 Earner | 1,973 (32.2%) | $39,098 |
| 2 Earners | 2,746 (44.8%) | $93,954 |
| 3+ Earners | 422 (6.9%) | $95,000 |
| Total | 6,130 (100.0%) | $56,529 |
Household Income in Russellville
Household Income Brackets in Russellville
With 1,845 households falling in the category, the $35,000 to $49,999 income range is the most frequent in Russellville, accounting for 17.7% of all households. In contrast, only 344 households (3.3%) fall into the $200,000+ income bracket, making it the least populous group.
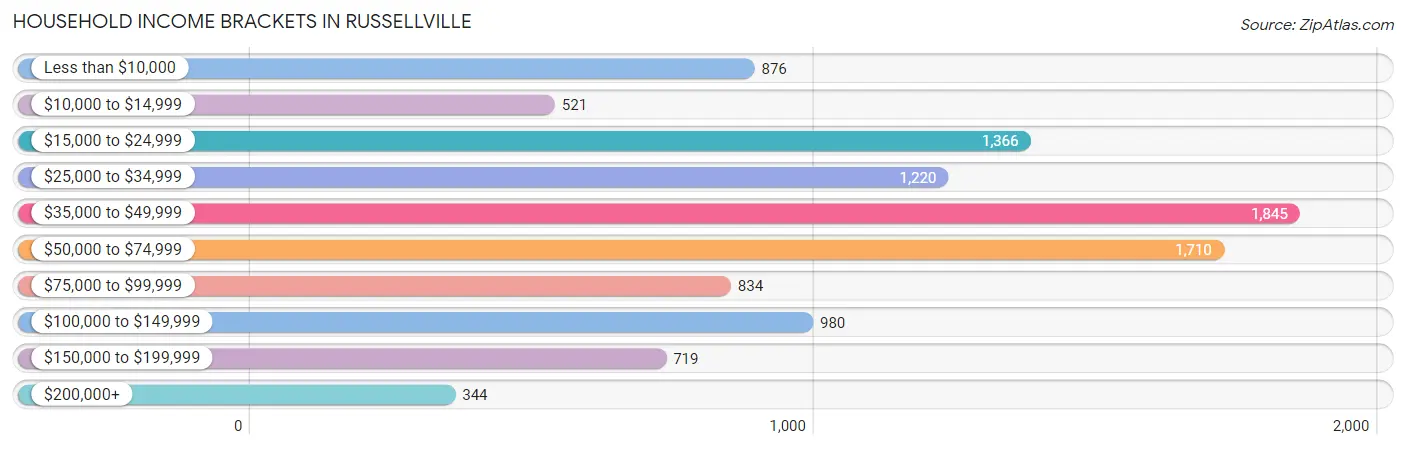
| Income Bracket | # Households | % Households |
| Less than $10,000 | 876 | 8.4% |
| $10,000 to $14,999 | 521 | 5.0% |
| $15,000 to $24,999 | 1,366 | 13.1% |
| $25,000 to $34,999 | 1,220 | 11.7% |
| $35,000 to $49,999 | 1,845 | 17.7% |
| $50,000 to $74,999 | 1,710 | 16.4% |
| $75,000 to $99,999 | 834 | 8.0% |
| $100,000 to $149,999 | 980 | 9.4% |
| $150,000 to $199,999 | 719 | 6.9% |
| $200,000+ | 344 | 3.3% |
Household Income by Householder Age in Russellville
The median household income in Russellville is $43,669, with the highest median household income of $51,242 found in the 45 to 64 years age bracket for the primary householder. A total of 3,607 households (34.6%) fall into this category. Meanwhile, the 15 to 24 years age bracket for the primary householder has the lowest median household income of $29,075, with 1,019 households (9.8%) in this group.
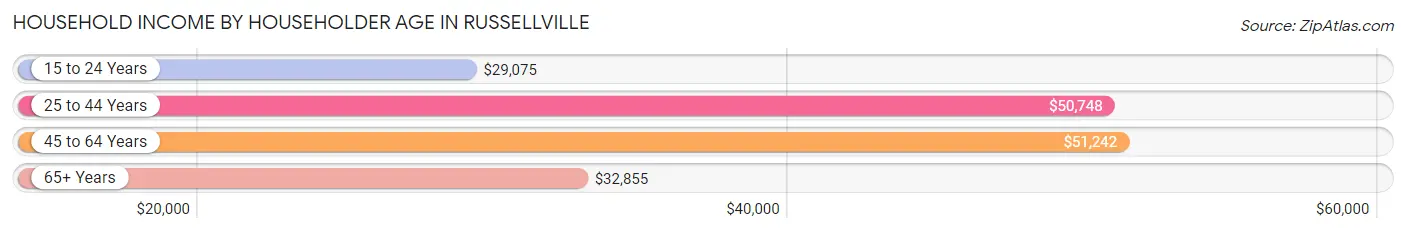
| Income Bracket | # Households | Median Income |
| 15 to 24 Years | 1,019 (9.8%) | $29,075 |
| 25 to 44 Years | 3,512 (33.7%) | $50,748 |
| 45 to 64 Years | 3,607 (34.6%) | $51,242 |
| 65+ Years | 2,286 (21.9%) | $32,855 |
| Total | 10,424 (100.0%) | $43,669 |
Poverty in Russellville
Income Below Poverty by Sex and Age in Russellville
With 16.6% poverty level for males and 24.8% for females among the residents of Russellville, 18 to 24 year old males and 18 to 24 year old females are the most vulnerable to poverty, with 421 males (26.5%) and 900 females (51.8%) in their respective age groups living below the poverty level.
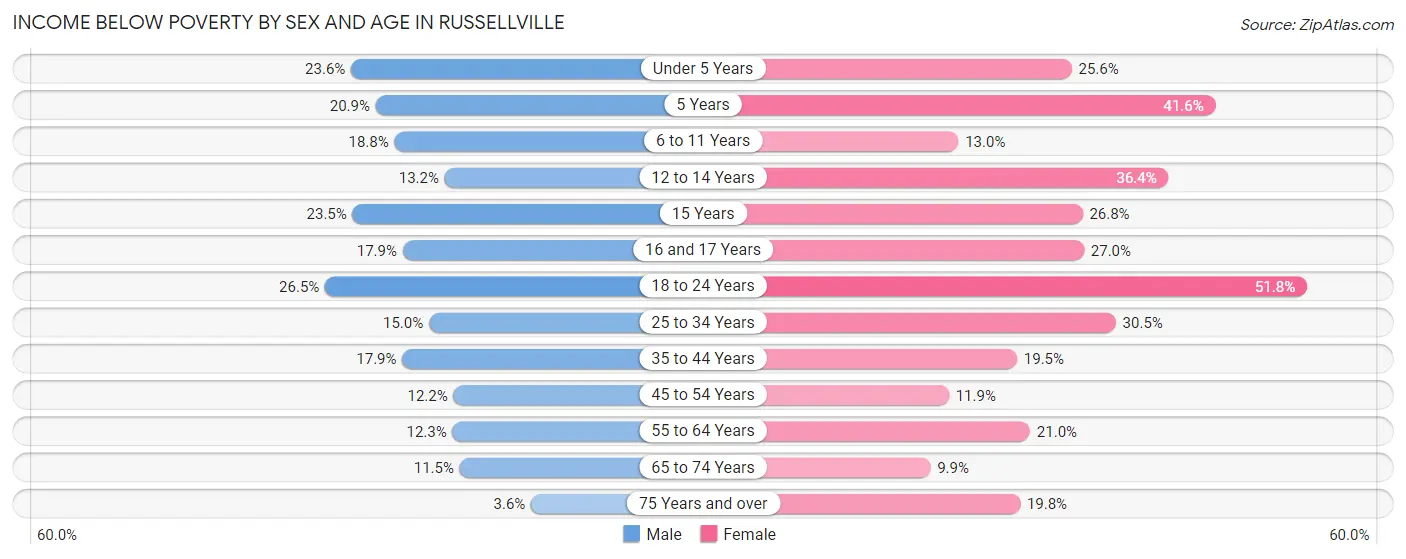
| Age Bracket | Male | Female |
| Under 5 Years | 207 (23.6%) | 250 (25.6%) |
| 5 Years | 33 (20.9%) | 72 (41.6%) |
| 6 to 11 Years | 217 (18.8%) | 162 (13.0%) |
| 12 to 14 Years | 61 (13.2%) | 135 (36.4%) |
| 15 Years | 23 (23.5%) | 26 (26.8%) |
| 16 and 17 Years | 27 (17.9%) | 103 (27.0%) |
| 18 to 24 Years | 421 (26.5%) | 900 (51.8%) |
| 25 to 34 Years | 315 (15.0%) | 620 (30.5%) |
| 35 to 44 Years | 255 (17.9%) | 334 (19.5%) |
| 45 to 54 Years | 164 (12.2%) | 169 (11.9%) |
| 55 to 64 Years | 172 (12.3%) | 334 (20.9%) |
| 65 to 74 Years | 79 (11.5%) | 97 (9.9%) |
| 75 Years and over | 21 (3.6%) | 194 (19.8%) |
| Total | 1,995 (16.6%) | 3,396 (24.8%) |
Income Above Poverty by Sex and Age in Russellville
According to the poverty statistics in Russellville, males aged 75 years and over and females aged 65 to 74 years are the age groups that are most secure financially, with 96.4% of males and 90.1% of females in these age groups living above the poverty line.
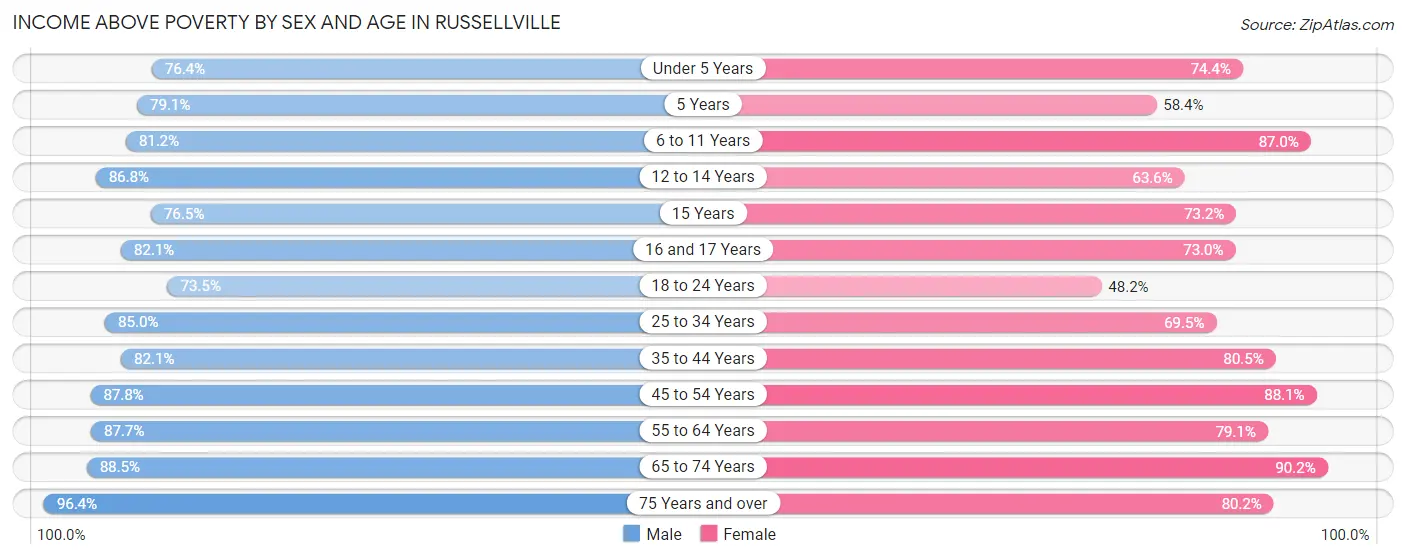
| Age Bracket | Male | Female |
| Under 5 Years | 669 (76.4%) | 727 (74.4%) |
| 5 Years | 125 (79.1%) | 101 (58.4%) |
| 6 to 11 Years | 937 (81.2%) | 1,087 (87.0%) |
| 12 to 14 Years | 401 (86.8%) | 236 (63.6%) |
| 15 Years | 75 (76.5%) | 71 (73.2%) |
| 16 and 17 Years | 124 (82.1%) | 279 (73.0%) |
| 18 to 24 Years | 1,166 (73.5%) | 837 (48.2%) |
| 25 to 34 Years | 1,790 (85.0%) | 1,413 (69.5%) |
| 35 to 44 Years | 1,167 (82.1%) | 1,379 (80.5%) |
| 45 to 54 Years | 1,177 (87.8%) | 1,250 (88.1%) |
| 55 to 64 Years | 1,222 (87.7%) | 1,260 (79.0%) |
| 65 to 74 Years | 606 (88.5%) | 888 (90.1%) |
| 75 Years and over | 565 (96.4%) | 784 (80.2%) |
| Total | 10,024 (83.4%) | 10,312 (75.2%) |
Income Below Poverty Among Married-Couple Families in Russellville
The poverty statistics for married-couple families in Russellville show that 6.0% or 253 of the total 4,240 families live below the poverty line. Families with 3 or 4 children have the highest poverty rate of 9.3%, comprising of 43 families. On the other hand, families with 5 or more children have the lowest poverty rate of 0.0%, which includes 0 families.
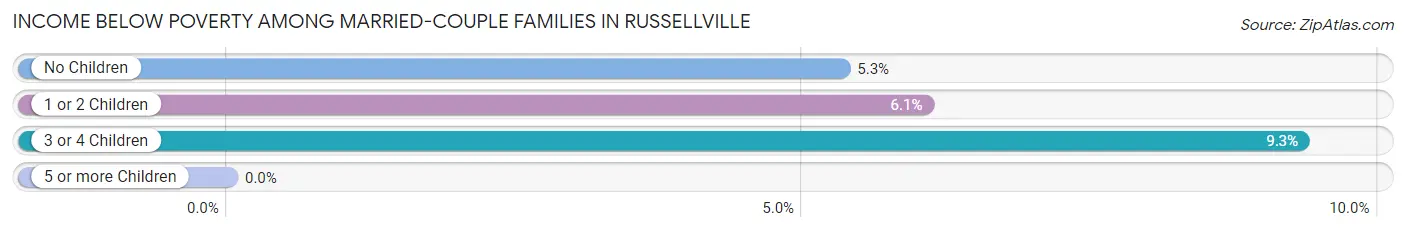
| Children | Above Poverty | Below Poverty |
| No Children | 2,239 (94.7%) | 126 (5.3%) |
| 1 or 2 Children | 1,302 (93.9%) | 84 (6.1%) |
| 3 or 4 Children | 418 (90.7%) | 43 (9.3%) |
| 5 or more Children | 28 (100.0%) | 0 (0.0%) |
| Total | 3,987 (94.0%) | 253 (6.0%) |
Income Below Poverty Among Single-Parent Households in Russellville
According to the poverty data in Russellville, 28.0% or 79 single-father households and 38.7% or 623 single-mother households are living below the poverty line. Among single-father households, those with no children have the highest poverty rate, with 79 households (46.8%) experiencing poverty. Likewise, among single-mother households, those with 3 or 4 children have the highest poverty rate, with 164 households (53.2%) falling below the poverty line.
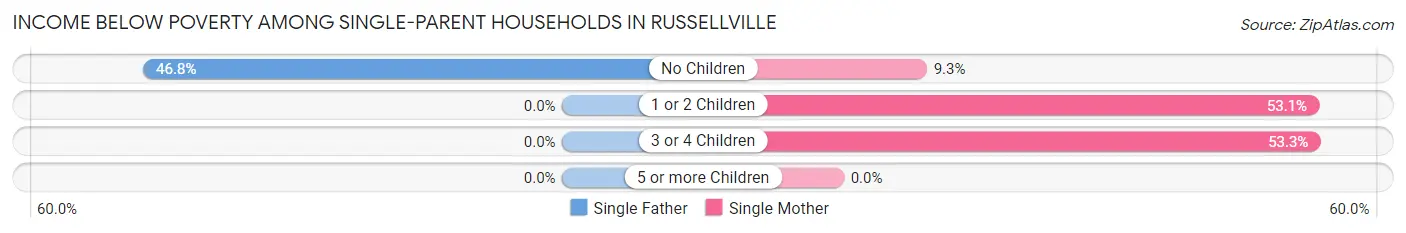
| Children | Single Father | Single Mother |
| No Children | 79 (46.8%) | 49 (9.3%) |
| 1 or 2 Children | 0 (0.0%) | 410 (53.1%) |
| 3 or 4 Children | 0 (0.0%) | 164 (53.2%) |
| 5 or more Children | 0 (0.0%) | 0 (0.0%) |
| Total | 79 (28.0%) | 623 (38.7%) |
Income Below Poverty Among Married-Couple vs Single-Parent Households in Russellville
The poverty data for Russellville shows that 253 of the married-couple family households (6.0%) and 702 of the single-parent households (37.1%) are living below the poverty level. Within the married-couple family households, those with 3 or 4 children have the highest poverty rate, with 43 households (9.3%) falling below the poverty line. Among the single-parent households, those with 3 or 4 children have the highest poverty rate, with 164 household (51.1%) living below poverty.
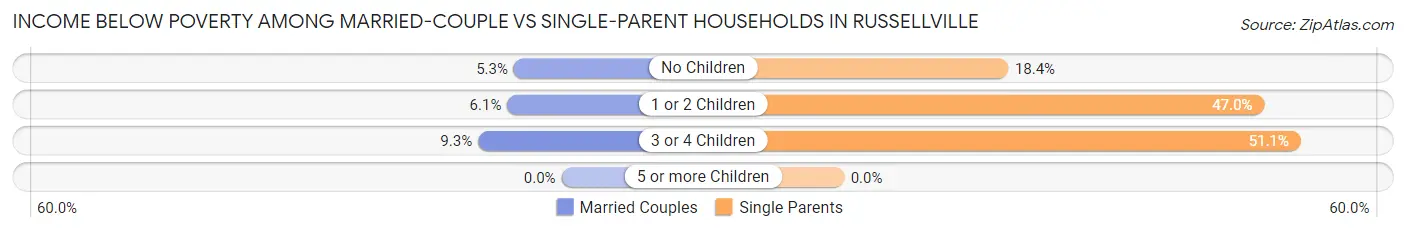
| Children | Married-Couple Families | Single-Parent Households |
| No Children | 126 (5.3%) | 128 (18.4%) |
| 1 or 2 Children | 84 (6.1%) | 410 (47.0%) |
| 3 or 4 Children | 43 (9.3%) | 164 (51.1%) |
| 5 or more Children | 0 (0.0%) | 0 (0.0%) |
| Total | 253 (6.0%) | 702 (37.1%) |
Race in Russellville
The most populous races in Russellville are White / Caucasian (21,987 | 76.0%), Hispanic or Latino (4,880 | 16.9%), and Two or more Races (2,376 | 8.2%).
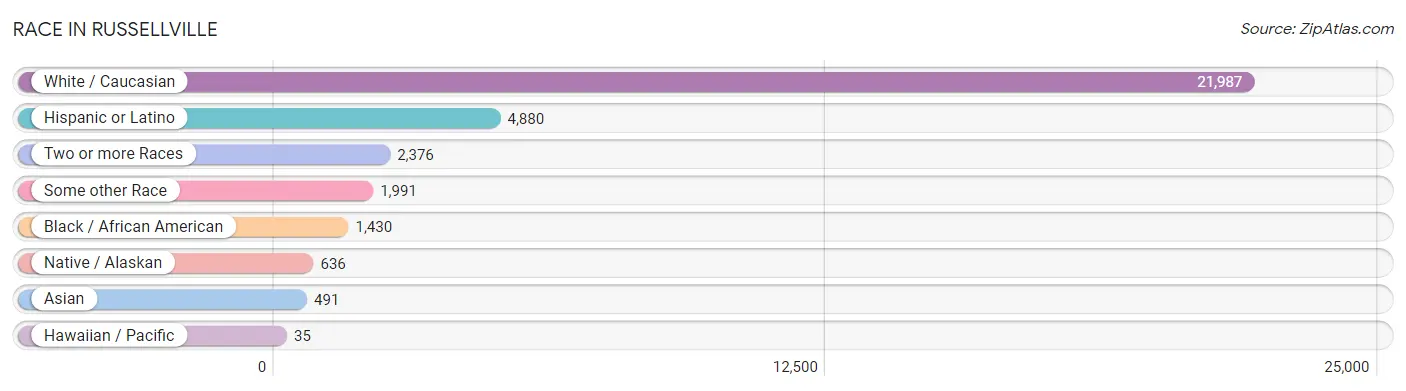
| Race | # Population | % Population |
| Asian | 491 | 1.7% |
| Black / African American | 1,430 | 4.9% |
| Hawaiian / Pacific | 35 | 0.1% |
| Hispanic or Latino | 4,880 | 16.9% |
| Native / Alaskan | 636 | 2.2% |
| White / Caucasian | 21,987 | 76.0% |
| Two or more Races | 2,376 | 8.2% |
| Some other Race | 1,991 | 6.9% |
| Total | 28,946 | 100.0% |
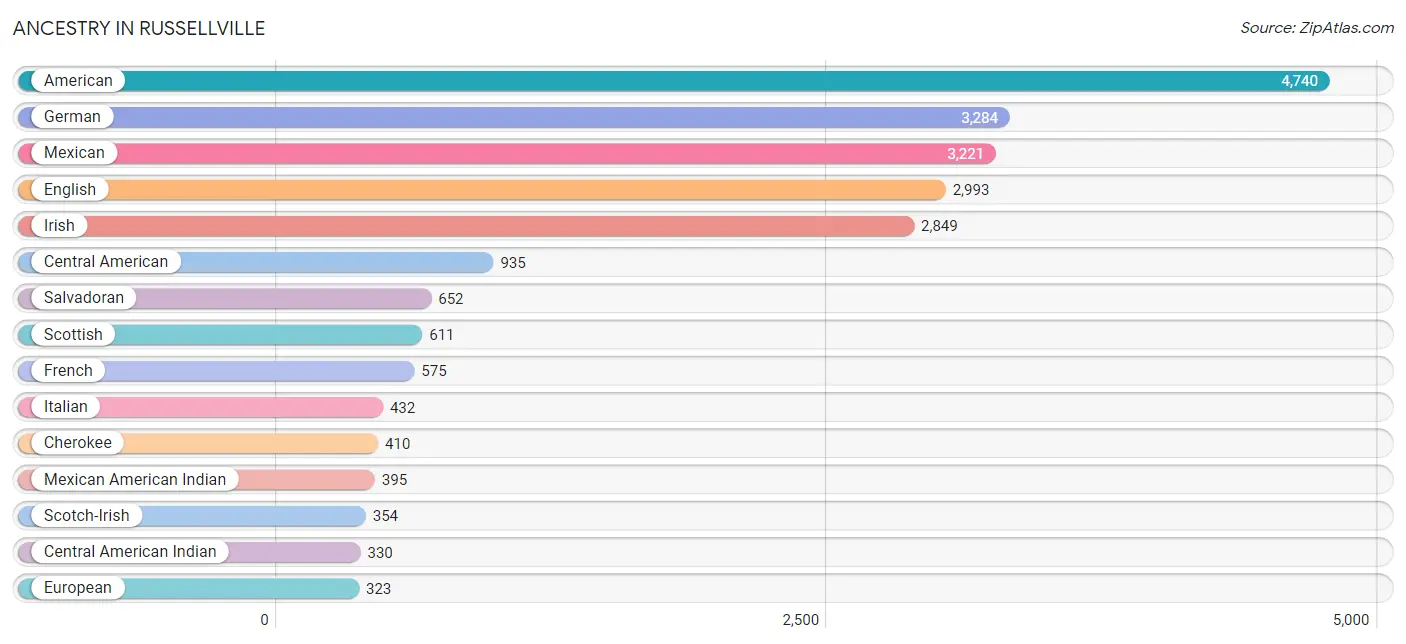
Ancestry in Russellville
The most populous ancestries reported in Russellville are American (4,740 | 16.4%), German (3,284 | 11.4%), Mexican (3,221 | 11.1%), English (2,993 | 10.3%), and Irish (2,849 | 9.8%), together accounting for 59.0% of all Russellville residents.
| Ancestry | # Population | % Population |
| African | 22 | 0.1% |
| American | 4,740 | 16.4% |
| Arab | 7 | 0.0% |
| Bhutanese | 37 | 0.1% |
| Brazilian | 48 | 0.2% |
| British | 97 | 0.3% |
| Burmese | 101 | 0.4% |
| Celtic | 16 | 0.1% |
| Central American | 935 | 3.2% |
| Central American Indian | 330 | 1.1% |
| Cherokee | 410 | 1.4% |
| Choctaw | 29 | 0.1% |
| Colombian | 42 | 0.2% |
| Creek | 7 | 0.0% |
| Cuban | 59 | 0.2% |
| Czech | 22 | 0.1% |
| Czechoslovakian | 20 | 0.1% |
| Danish | 10 | 0.0% |
| Dominican | 27 | 0.1% |
| Dutch | 195 | 0.7% |
| Eastern European | 15 | 0.1% |
| English | 2,993 | 10.3% |
| European | 323 | 1.1% |
| French | 575 | 2.0% |
| French Canadian | 65 | 0.2% |
| German | 3,284 | 11.4% |
| Guatemalan | 67 | 0.2% |
| Honduran | 216 | 0.7% |
| Hungarian | 39 | 0.1% |
| Indian (Asian) | 180 | 0.6% |
| Iranian | 67 | 0.2% |
| Irish | 2,849 | 9.8% |
| Italian | 432 | 1.5% |
| Korean | 41 | 0.1% |
| Laotian | 26 | 0.1% |
| Malaysian | 34 | 0.1% |
| Mexican | 3,221 | 11.1% |
| Mexican American Indian | 395 | 1.4% |
| Native Hawaiian | 20 | 0.1% |
| Northern European | 51 | 0.2% |
| Norwegian | 250 | 0.9% |
| Osage | 18 | 0.1% |
| Pakistani | 25 | 0.1% |
| Peruvian | 18 | 0.1% |
| Polish | 121 | 0.4% |
| Portuguese | 24 | 0.1% |
| Puerto Rican | 140 | 0.5% |
| Russian | 27 | 0.1% |
| Salvadoran | 652 | 2.2% |
| Scandinavian | 116 | 0.4% |
| Scotch-Irish | 354 | 1.2% |
| Scottish | 611 | 2.1% |
| South African | 37 | 0.1% |
| South American | 308 | 1.1% |
| Spaniard | 59 | 0.2% |
| Spanish | 24 | 0.1% |
| Sri Lankan | 243 | 0.8% |
| Subsaharan African | 66 | 0.2% |
| Swedish | 213 | 0.7% |
| Thai | 82 | 0.3% |
| Tongan | 110 | 0.4% |
| Ugandan | 7 | 0.0% |
| Venezuelan | 248 | 0.9% |
| Welsh | 186 | 0.6% |
| West Indian | 65 | 0.2% |
| Yugoslavian | 11 | 0.0% | View All 66 Rows |
Immigrants in Russellville
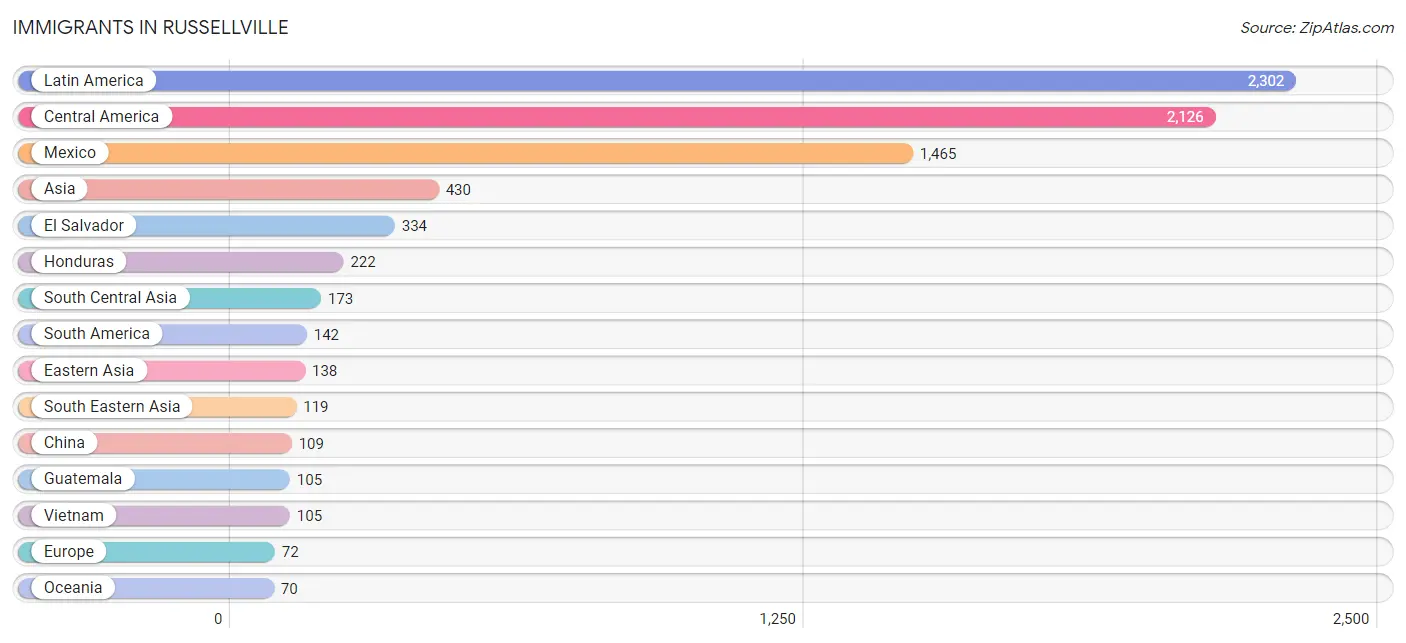
The most numerous immigrant groups reported in Russellville came from Latin America (2,302 | 8.0%), Central America (2,126 | 7.3%), Mexico (1,465 | 5.1%), Asia (430 | 1.5%), and El Salvador (334 | 1.1%), together accounting for 23.0% of all Russellville residents.
| Immigration Origin | # Population | % Population |
| Africa | 47 | 0.2% |
| Asia | 430 | 1.5% |
| Brazil | 48 | 0.2% |
| Caribbean | 34 | 0.1% |
| Central America | 2,126 | 7.3% |
| China | 109 | 0.4% |
| Colombia | 42 | 0.2% |
| Cuba | 15 | 0.1% |
| Eastern Africa | 7 | 0.0% |
| Eastern Asia | 138 | 0.5% |
| Eastern Europe | 15 | 0.1% |
| El Salvador | 334 | 1.1% |
| England | 14 | 0.1% |
| Europe | 72 | 0.3% |
| Grenada | 19 | 0.1% |
| Guatemala | 105 | 0.4% |
| Honduras | 222 | 0.8% |
| India | 64 | 0.2% |
| Iran | 67 | 0.2% |
| Ireland | 19 | 0.1% |
| Japan | 3 | 0.0% |
| Korea | 26 | 0.1% |
| Latin America | 2,302 | 8.0% |
| Mexico | 1,465 | 5.1% |
| Nigeria | 3 | 0.0% |
| Northern Europe | 57 | 0.2% |
| Oceania | 70 | 0.2% |
| Pakistan | 42 | 0.2% |
| Philippines | 14 | 0.1% |
| South Africa | 37 | 0.1% |
| South America | 142 | 0.5% |
| South Central Asia | 173 | 0.6% |
| South Eastern Asia | 119 | 0.4% |
| Uganda | 7 | 0.0% |
| Venezuela | 52 | 0.2% |
| Vietnam | 105 | 0.4% |
| Western Africa | 3 | 0.0% | View All 37 Rows |
Sex and Age in Russellville
Sex and Age in Russellville
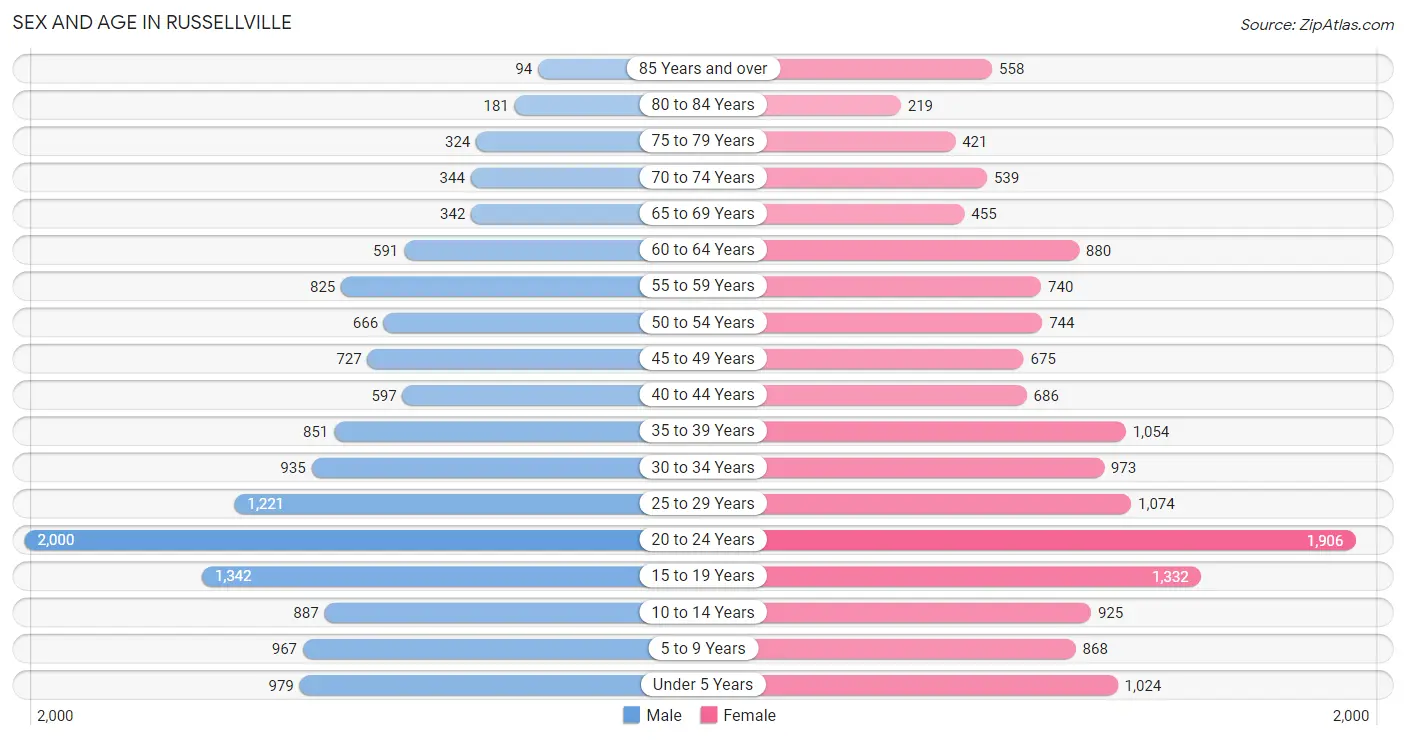
The most populous age groups in Russellville are 20 to 24 Years (2,000 | 14.4%) for men and 20 to 24 Years (1,906 | 12.7%) for women.
| Age Bracket | Male | Female |
| Under 5 Years | 979 (7.1%) | 1,024 (6.8%) |
| 5 to 9 Years | 967 (7.0%) | 868 (5.8%) |
| 10 to 14 Years | 887 (6.4%) | 925 (6.1%) |
| 15 to 19 Years | 1,342 (9.7%) | 1,332 (8.8%) |
| 20 to 24 Years | 2,000 (14.4%) | 1,906 (12.7%) |
| 25 to 29 Years | 1,221 (8.8%) | 1,074 (7.1%) |
| 30 to 34 Years | 935 (6.7%) | 973 (6.5%) |
| 35 to 39 Years | 851 (6.1%) | 1,054 (7.0%) |
| 40 to 44 Years | 597 (4.3%) | 686 (4.5%) |
| 45 to 49 Years | 727 (5.2%) | 675 (4.5%) |
| 50 to 54 Years | 666 (4.8%) | 744 (4.9%) |
| 55 to 59 Years | 825 (5.9%) | 740 (4.9%) |
| 60 to 64 Years | 591 (4.3%) | 880 (5.8%) |
| 65 to 69 Years | 342 (2.5%) | 455 (3.0%) |
| 70 to 74 Years | 344 (2.5%) | 539 (3.6%) |
| 75 to 79 Years | 324 (2.3%) | 421 (2.8%) |
| 80 to 84 Years | 181 (1.3%) | 219 (1.5%) |
| 85 Years and over | 94 (0.7%) | 558 (3.7%) |
| Total | 13,873 (100.0%) | 15,073 (100.0%) |
Families and Households in Russellville
Median Family Size in Russellville
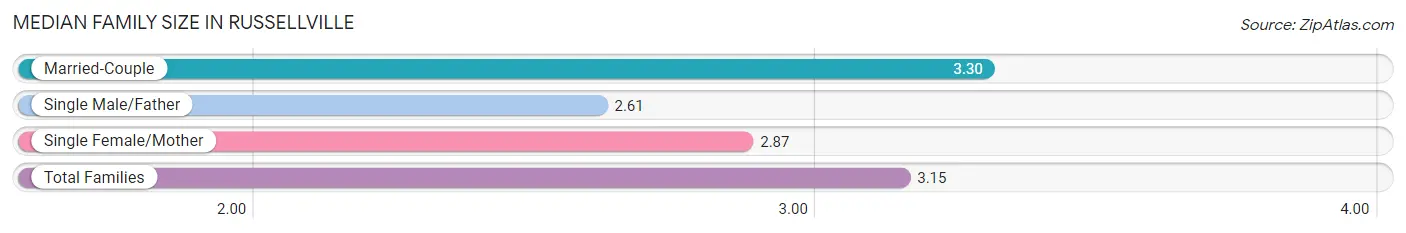
The median family size in Russellville is 3.15 persons per family, with married-couple families (4,240 | 69.2%) accounting for the largest median family size of 3.3 persons per family. On the other hand, single male/father families (282 | 4.6%) represent the smallest median family size with 2.61 persons per family.
| Family Type | # Families | Family Size |
| Married-Couple | 4,240 (69.2%) | 3.30 |
| Single Male/Father | 282 (4.6%) | 2.61 |
| Single Female/Mother | 1,608 (26.2%) | 2.87 |
| Total Families | 6,130 (100.0%) | 3.15 |
Median Household Size in Russellville
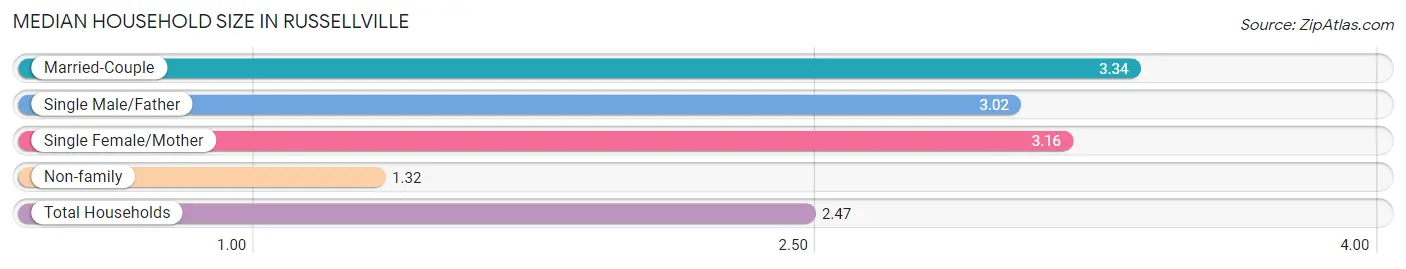
The median household size in Russellville is 2.47 persons per household, with married-couple households (4,240 | 40.7%) accounting for the largest median household size of 3.34 persons per household. non-family households (4,294 | 41.2%) represent the smallest median household size with 1.32 persons per household.
| Household Type | # Households | Household Size |
| Married-Couple | 4,240 (40.7%) | 3.34 |
| Single Male/Father | 282 (2.7%) | 3.02 |
| Single Female/Mother | 1,608 (15.4%) | 3.16 |
| Non-family | 4,294 (41.2%) | 1.32 |
| Total Households | 10,424 (100.0%) | 2.47 |
Household Size by Marriage Status in Russellville
Out of a total of 10,424 households in Russellville, 6,130 (58.8%) are family households, while 4,294 (41.2%) are nonfamily households. The most numerous type of family households are 2-person households, comprising 2,634, and the most common type of nonfamily households are 1-person households, comprising 3,455.
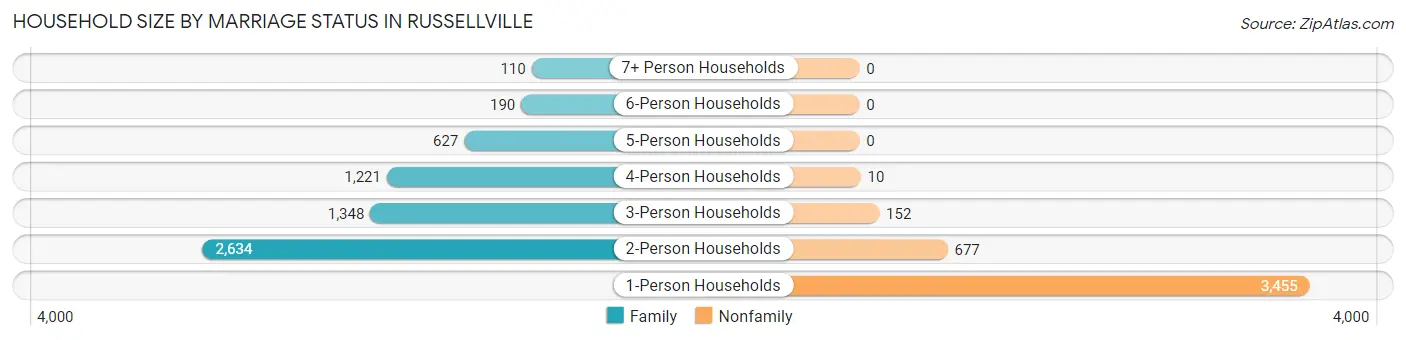
| Household Size | Family Households | Nonfamily Households |
| 1-Person Households | - | 3,455 (33.1%) |
| 2-Person Households | 2,634 (25.3%) | 677 (6.5%) |
| 3-Person Households | 1,348 (12.9%) | 152 (1.5%) |
| 4-Person Households | 1,221 (11.7%) | 10 (0.1%) |
| 5-Person Households | 627 (6.0%) | 0 (0.0%) |
| 6-Person Households | 190 (1.8%) | 0 (0.0%) |
| 7+ Person Households | 110 (1.1%) | 0 (0.0%) |
| Total | 6,130 (58.8%) | 4,294 (41.2%) |
Female Fertility in Russellville
Fertility by Age in Russellville
Average fertility rate in Russellville is 39.0 births per 1,000 women. Women in the age bracket of 20 to 34 years have the highest fertility rate with 74.0 births per 1,000 women. Women in the age bracket of 20 to 34 years acount for 95.4% of all women with births.
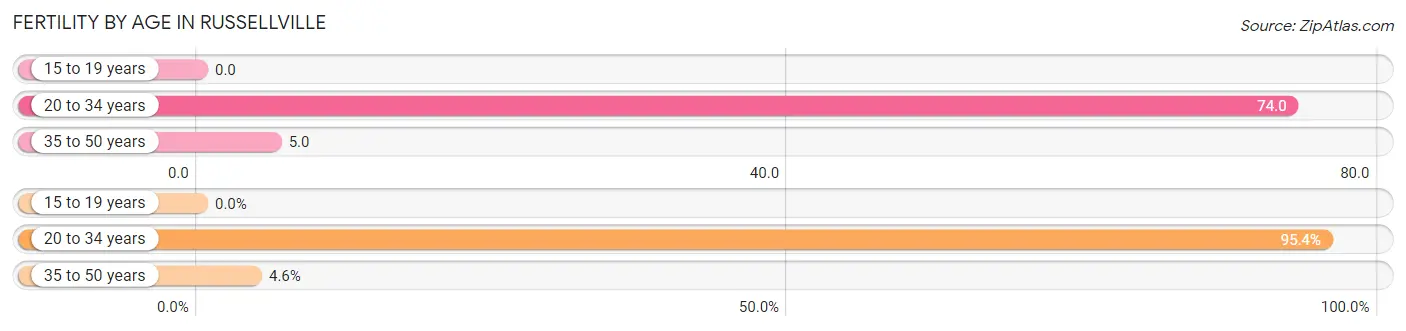
| Age Bracket | Women with Births | Births / 1,000 Women |
| 15 to 19 years | 0 (0.0%) | 0.0 |
| 20 to 34 years | 292 (95.4%) | 74.0 |
| 35 to 50 years | 14 (4.6%) | 5.0 |
| Total | 306 (100.0%) | 39.0 |
Fertility by Age by Marriage Status in Russellville
51.3% of women with births (306) in Russellville are married. The highest percentage of unmarried women with births falls into 20 to 34 years age bracket with 51.0% of them unmarried at the time of birth, while the lowest percentage of unmarried women with births belong to 35 to 50 years age bracket with 0.0% of them unmarried.
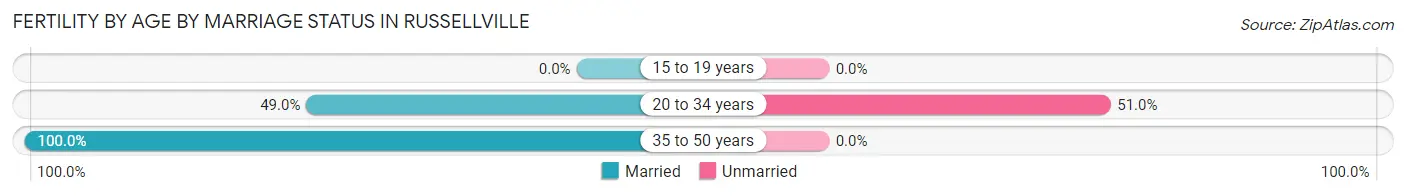
| Age Bracket | Married | Unmarried |
| 15 to 19 years | 0 (0.0%) | 0 (0.0%) |
| 20 to 34 years | 143 (49.0%) | 149 (51.0%) |
| 35 to 50 years | 14 (100.0%) | 0 (0.0%) |
| Total | 157 (51.3%) | 149 (48.7%) |
Fertility by Education in Russellville
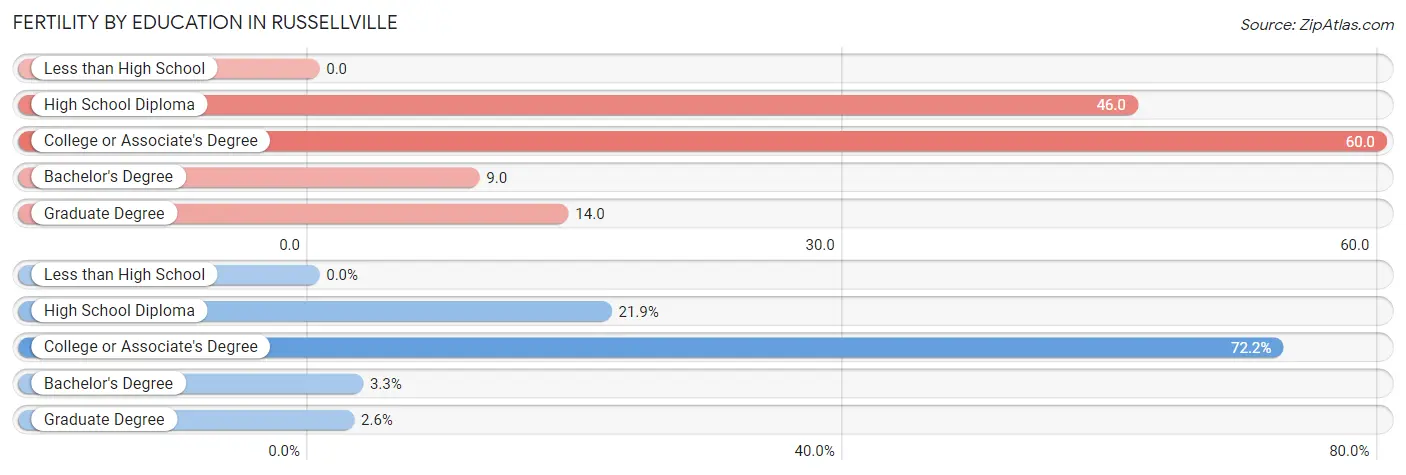
| Educational Attainment | Women with Births | Births / 1,000 Women |
| Less than High School | 0 (0.0%) | 0.0 |
| High School Diploma | 67 (21.9%) | 46.0 |
| College or Associate's Degree | 221 (72.2%) | 60.0 |
| Bachelor's Degree | 10 (3.3%) | 9.0 |
| Graduate Degree | 8 (2.6%) | 14.0 |
| Total | 306 (100.0%) | 39.0 |
Fertility by Education by Marriage Status in Russellville
48.7% of women with births in Russellville are unmarried. Women with the educational attainment of bachelor's degree are most likely to be married with 100.0% of them married at childbirth, while women with the educational attainment of high school diploma are least likely to be married with 52.2% of them unmarried at childbirth.
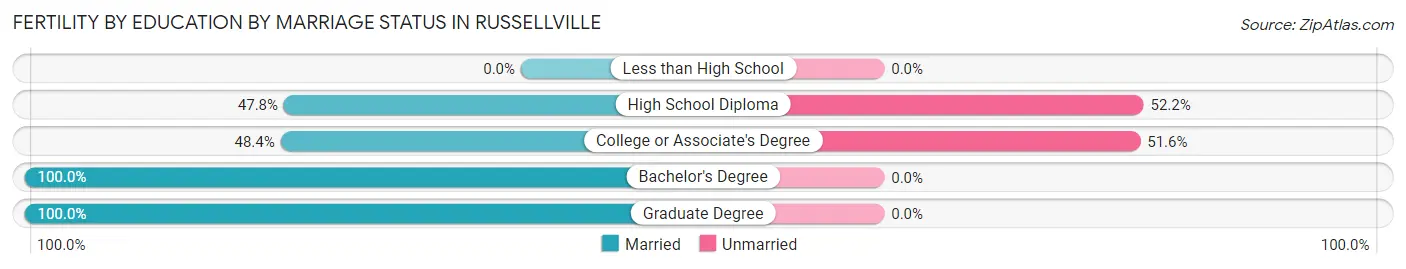
| Educational Attainment | Married | Unmarried |
| Less than High School | 0 (0.0%) | 0 (0.0%) |
| High School Diploma | 32 (47.8%) | 35 (52.2%) |
| College or Associate's Degree | 107 (48.4%) | 114 (51.6%) |
| Bachelor's Degree | 10 (100.0%) | 0 (0.0%) |
| Graduate Degree | 8 (100.0%) | 0 (0.0%) |
| Total | 157 (51.3%) | 149 (48.7%) |
Employment Characteristics in Russellville
Employment by Class of Employer in Russellville
Among the 12,826 employed individuals in Russellville, private company employees (8,619 | 67.2%), not-for-profit organizations (1,033 | 8.1%), and self-employed (not incorporated) (1,031 | 8.0%) make up the most common classes of employment.
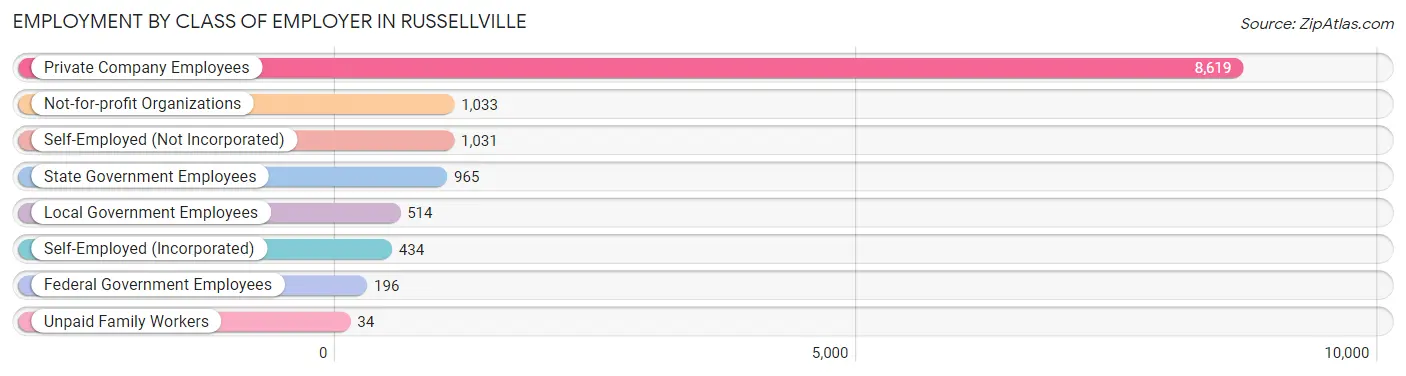
| Employer Class | # Employees | % Employees |
| Private Company Employees | 8,619 | 67.2% |
| Self-Employed (Incorporated) | 434 | 3.4% |
| Self-Employed (Not Incorporated) | 1,031 | 8.0% |
| Not-for-profit Organizations | 1,033 | 8.1% |
| Local Government Employees | 514 | 4.0% |
| State Government Employees | 965 | 7.5% |
| Federal Government Employees | 196 | 1.5% |
| Unpaid Family Workers | 34 | 0.3% |
| Total | 12,826 | 100.0% |
Employment Status by Age in Russellville
According to the labor force statistics for Russellville, out of the total population over 16 years of age (23,101), 59.4% or 13,722 individuals are in the labor force, with 5.3% or 727 of them unemployed. The age group with the highest labor force participation rate is 25 to 29 years, with 81.2% or 1,864 individuals in the labor force. Within the labor force, the 75 years and over age range has the highest percentage of unemployed individuals, with 45.2% or 70 of them being unemployed.
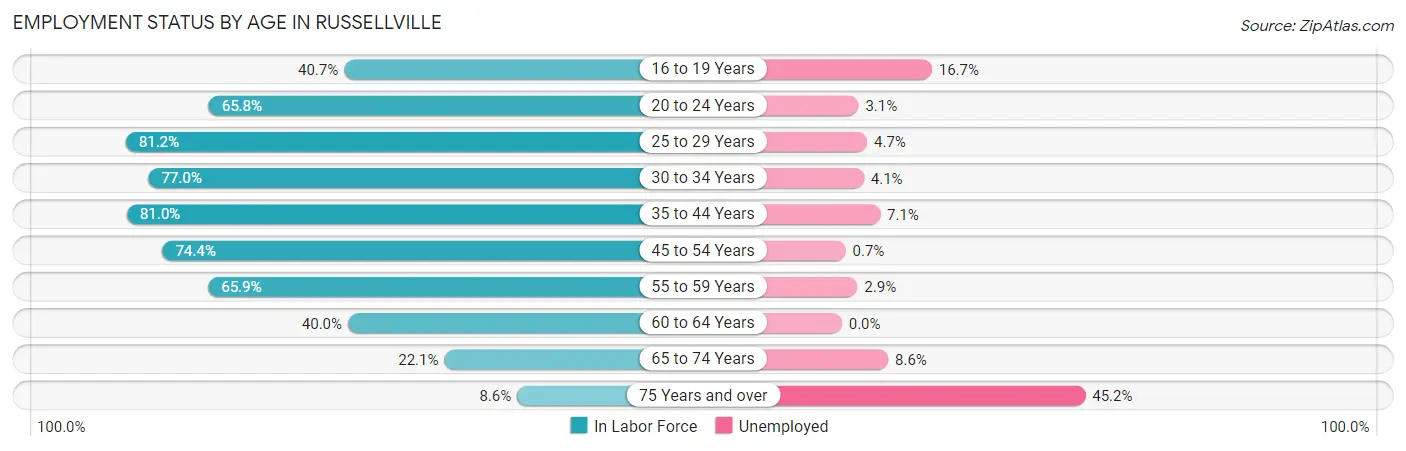
| Age Bracket | In Labor Force | Unemployed |
| 16 to 19 Years | 1,009 (40.7%) | 169 (16.7%) |
| 20 to 24 Years | 2,570 (65.8%) | 80 (3.1%) |
| 25 to 29 Years | 1,864 (81.2%) | 88 (4.7%) |
| 30 to 34 Years | 1,469 (77.0%) | 60 (4.1%) |
| 35 to 44 Years | 2,582 (81.0%) | 183 (7.1%) |
| 45 to 54 Years | 2,092 (74.4%) | 15 (0.7%) |
| 55 to 59 Years | 1,031 (65.9%) | 30 (2.9%) |
| 60 to 64 Years | 588 (40.0%) | 0 (0.0%) |
| 65 to 74 Years | 371 (22.1%) | 32 (8.6%) |
| 75 Years and over | 155 (8.6%) | 70 (45.2%) |
| Total | 13,722 (59.4%) | 727 (5.3%) |
Employment Status by Educational Attainment in Russellville
According to labor force statistics for Russellville, 72.7% of individuals (9,625) out of the total population between 25 and 64 years of age (13,239) are in the labor force, with 3.9% or 375 of them being unemployed. The group with the highest labor force participation rate are those with the educational attainment of bachelor's degree or higher, with 90.6% or 3,301 individuals in the labor force. Within the labor force, individuals with less than high school education have the highest percentage of unemployment, with 6.5% or 81 of them being unemployed.
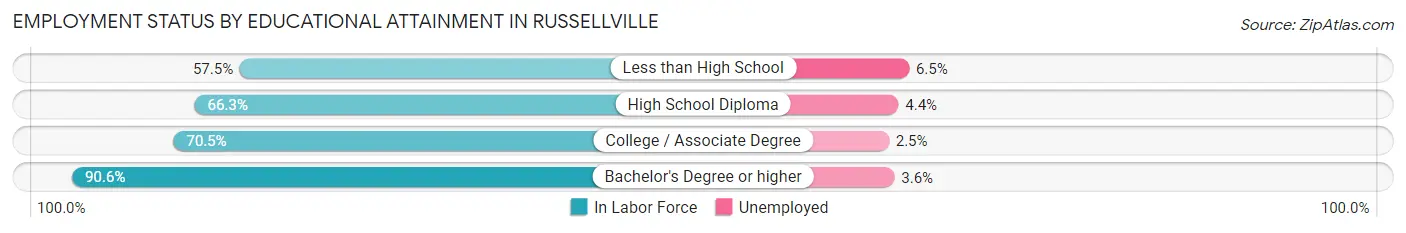
| Educational Attainment | In Labor Force | Unemployed |
| Less than High School | 1,241 (57.5%) | 140 (6.5%) |
| High School Diploma | 2,591 (66.3%) | 172 (4.4%) |
| College / Associate Degree | 2,488 (70.5%) | 88 (2.5%) |
| Bachelor's Degree or higher | 3,301 (90.6%) | 131 (3.6%) |
| Total | 9,625 (72.7%) | 516 (3.9%) |
Employment Occupations by Sex in Russellville
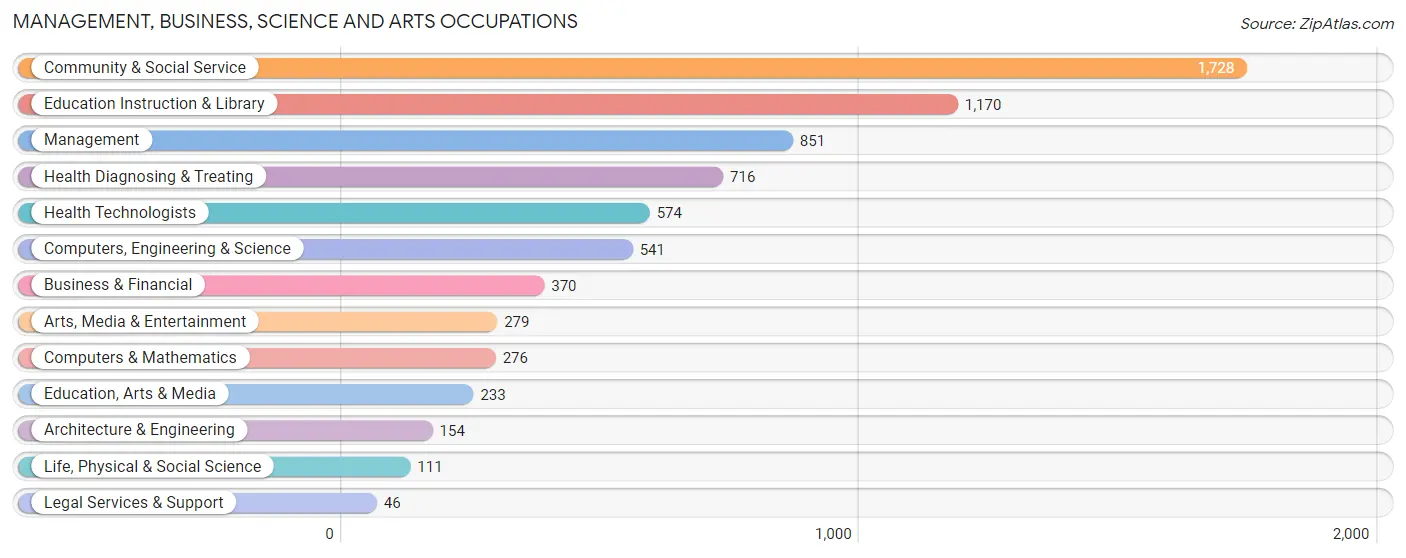
Management, Business, Science and Arts Occupations
The most common Management, Business, Science and Arts occupations in Russellville are Community & Social Service (1,728 | 13.3%), Education Instruction & Library (1,170 | 9.0%), Management (851 | 6.6%), Health Diagnosing & Treating (716 | 5.5%), and Health Technologists (574 | 4.4%).
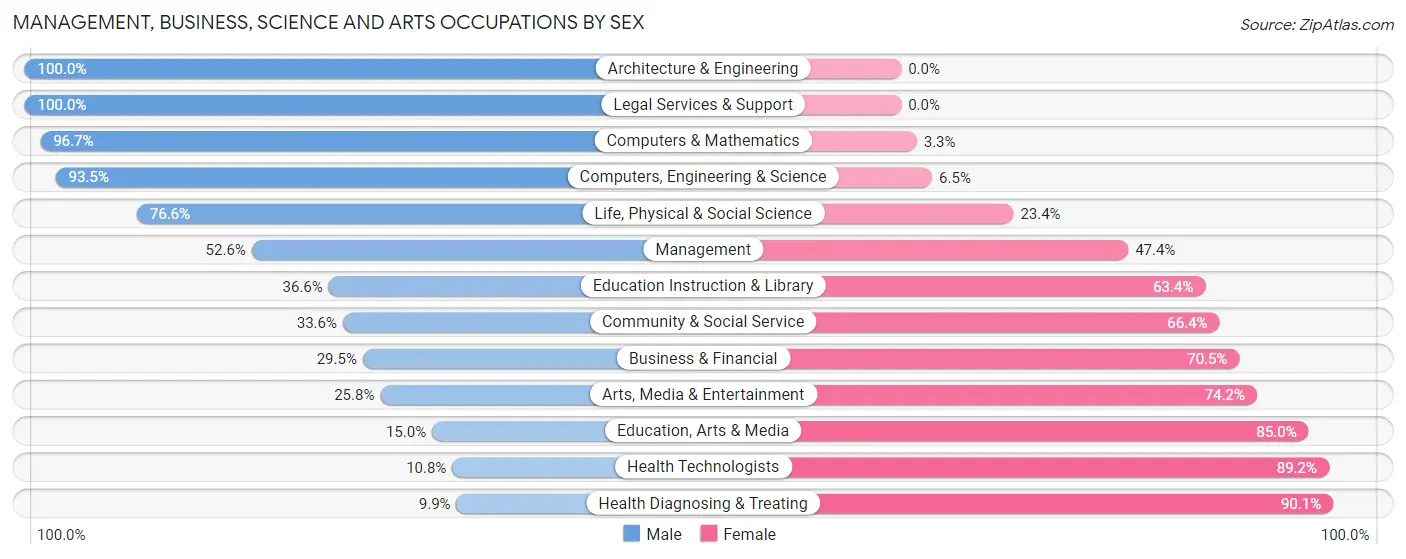
Management, Business, Science and Arts Occupations by Sex
Within the Management, Business, Science and Arts occupations in Russellville, the most male-oriented occupations are Architecture & Engineering (100.0%), Legal Services & Support (100.0%), and Computers & Mathematics (96.7%), while the most female-oriented occupations are Health Diagnosing & Treating (90.1%), Health Technologists (89.2%), and Education, Arts & Media (85.0%).
| Occupation | Male | Female |
| Management | 448 (52.6%) | 403 (47.4%) |
| Business & Financial | 109 (29.5%) | 261 (70.5%) |
| Computers, Engineering & Science | 506 (93.5%) | 35 (6.5%) |
| Computers & Mathematics | 267 (96.7%) | 9 (3.3%) |
| Architecture & Engineering | 154 (100.0%) | 0 (0.0%) |
| Life, Physical & Social Science | 85 (76.6%) | 26 (23.4%) |
| Community & Social Service | 581 (33.6%) | 1,147 (66.4%) |
| Education, Arts & Media | 35 (15.0%) | 198 (85.0%) |
| Legal Services & Support | 46 (100.0%) | 0 (0.0%) |
| Education Instruction & Library | 428 (36.6%) | 742 (63.4%) |
| Arts, Media & Entertainment | 72 (25.8%) | 207 (74.2%) |
| Health Diagnosing & Treating | 71 (9.9%) | 645 (90.1%) |
| Health Technologists | 62 (10.8%) | 512 (89.2%) |
| Total (Category) | 1,715 (40.8%) | 2,491 (59.2%) |
| Total (Overall) | 6,641 (51.3%) | 6,311 (48.7%) |
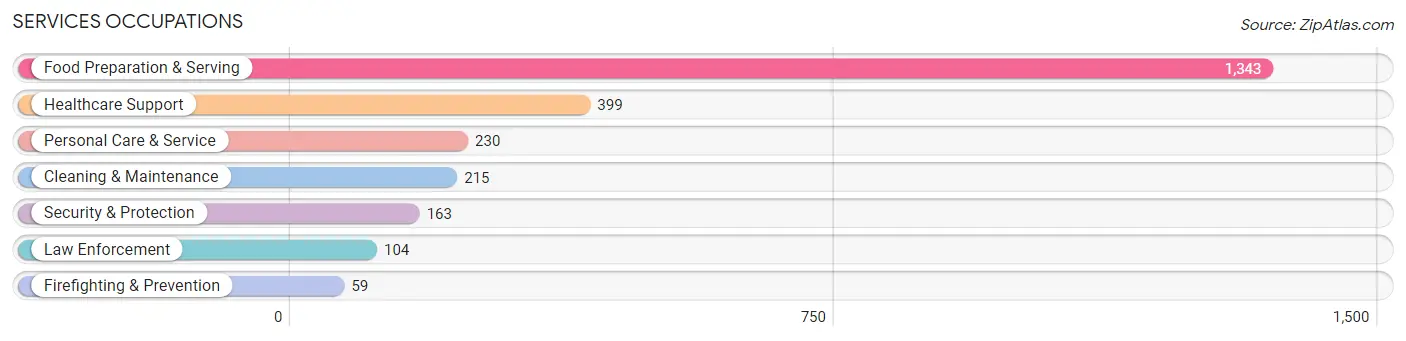
Services Occupations
The most common Services occupations in Russellville are Food Preparation & Serving (1,343 | 10.4%), Healthcare Support (399 | 3.1%), Personal Care & Service (230 | 1.8%), Cleaning & Maintenance (215 | 1.7%), and Security & Protection (163 | 1.3%).
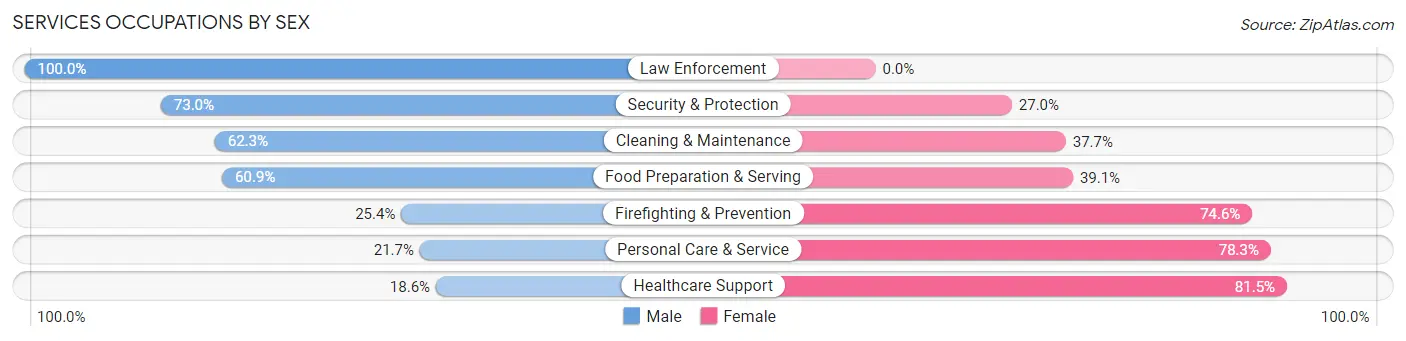
Services Occupations by Sex
Within the Services occupations in Russellville, the most male-oriented occupations are Law Enforcement (100.0%), Security & Protection (73.0%), and Cleaning & Maintenance (62.3%), while the most female-oriented occupations are Healthcare Support (81.5%), Personal Care & Service (78.3%), and Firefighting & Prevention (74.6%).
| Occupation | Male | Female |
| Healthcare Support | 74 (18.5%) | 325 (81.5%) |
| Security & Protection | 119 (73.0%) | 44 (27.0%) |
| Firefighting & Prevention | 15 (25.4%) | 44 (74.6%) |
| Law Enforcement | 104 (100.0%) | 0 (0.0%) |
| Food Preparation & Serving | 818 (60.9%) | 525 (39.1%) |
| Cleaning & Maintenance | 134 (62.3%) | 81 (37.7%) |
| Personal Care & Service | 50 (21.7%) | 180 (78.3%) |
| Total (Category) | 1,195 (50.8%) | 1,155 (49.1%) |
| Total (Overall) | 6,641 (51.3%) | 6,311 (48.7%) |
Sales and Office Occupations
The most common Sales and Office occupations in Russellville are Sales & Related (1,247 | 9.6%), and Office & Administration (1,099 | 8.5%).

Sales and Office Occupations by Sex

| Occupation | Male | Female |
| Sales & Related | 680 (54.5%) | 567 (45.5%) |
| Office & Administration | 194 (17.6%) | 905 (82.4%) |
| Total (Category) | 874 (37.2%) | 1,472 (62.7%) |
| Total (Overall) | 6,641 (51.3%) | 6,311 (48.7%) |
Natural Resources, Construction and Maintenance Occupations
The most common Natural Resources, Construction and Maintenance occupations in Russellville are Construction & Extraction (530 | 4.1%), Installation, Maintenance & Repair (350 | 2.7%), and Farming, Fishing & Forestry (53 | 0.4%).
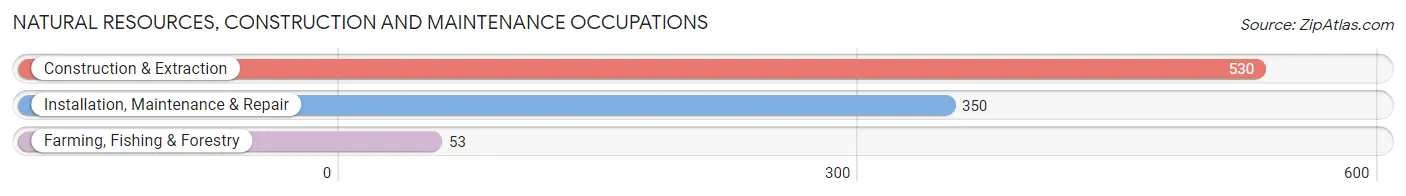
Natural Resources, Construction and Maintenance Occupations by Sex
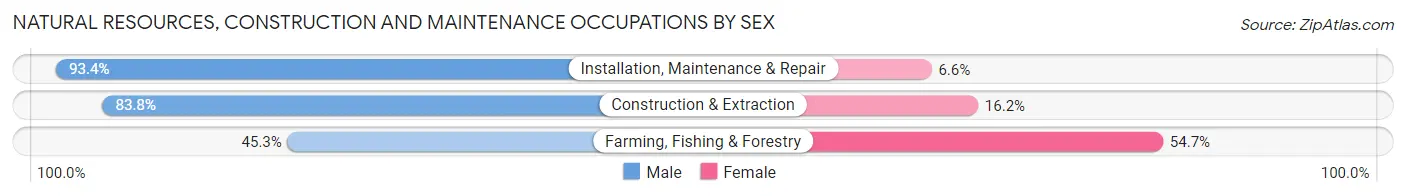
| Occupation | Male | Female |
| Farming, Fishing & Forestry | 24 (45.3%) | 29 (54.7%) |
| Construction & Extraction | 444 (83.8%) | 86 (16.2%) |
| Installation, Maintenance & Repair | 327 (93.4%) | 23 (6.6%) |
| Total (Category) | 795 (85.2%) | 138 (14.8%) |
| Total (Overall) | 6,641 (51.3%) | 6,311 (48.7%) |
Production, Transportation and Moving Occupations
The most common Production, Transportation and Moving occupations in Russellville are Production (1,857 | 14.3%), Material Moving (932 | 7.2%), and Transportation (328 | 2.5%).
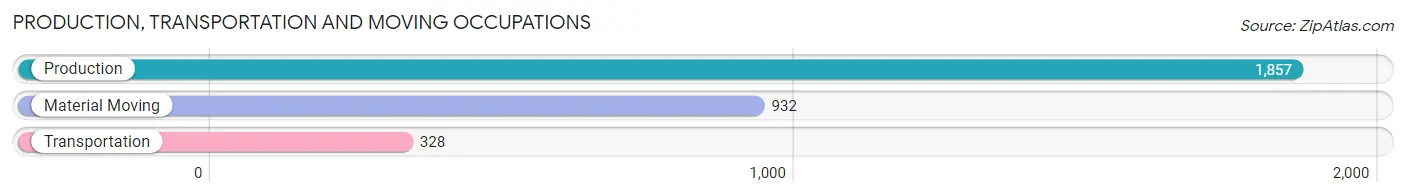
Production, Transportation and Moving Occupations by Sex
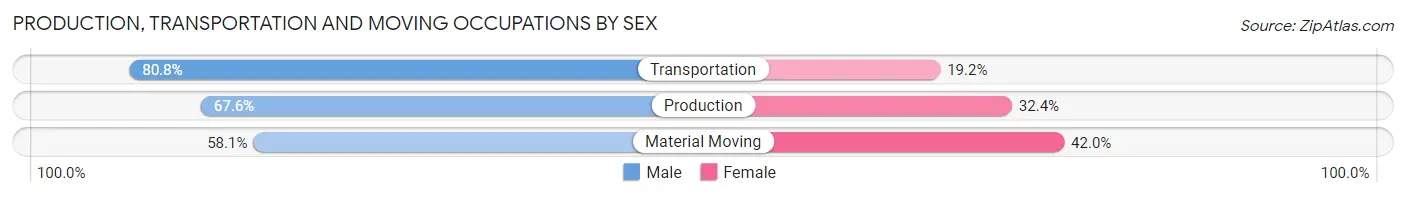
| Occupation | Male | Female |
| Production | 1,256 (67.6%) | 601 (32.4%) |
| Transportation | 265 (80.8%) | 63 (19.2%) |
| Material Moving | 541 (58.1%) | 391 (41.9%) |
| Total (Category) | 2,062 (66.1%) | 1,055 (33.9%) |
| Total (Overall) | 6,641 (51.3%) | 6,311 (48.7%) |
Employment Industries by Sex in Russellville
Employment Industries in Russellville
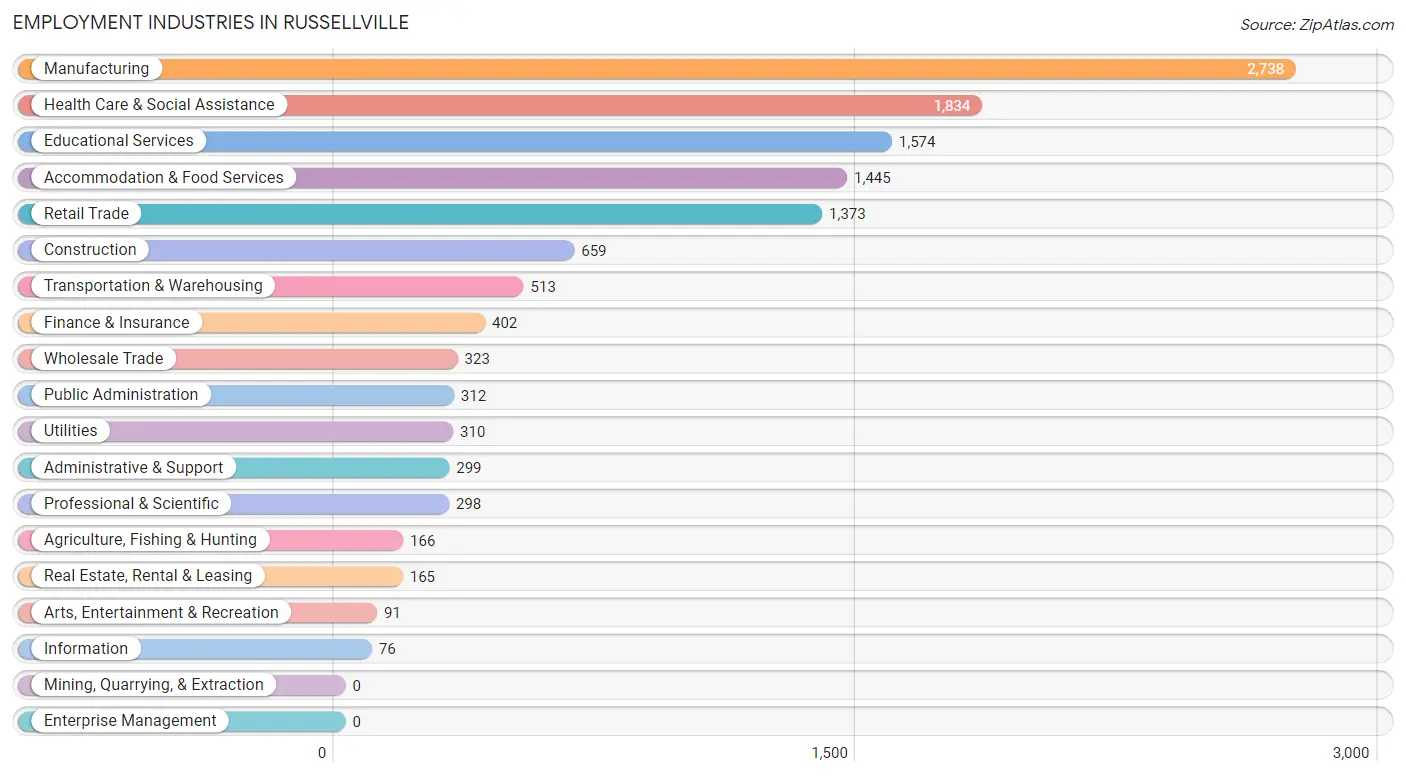
The major employment industries in Russellville include Manufacturing (2,738 | 21.1%), Health Care & Social Assistance (1,834 | 14.2%), Educational Services (1,574 | 12.1%), Accommodation & Food Services (1,445 | 11.2%), and Retail Trade (1,373 | 10.6%).
Employment Industries by Sex in Russellville
The Russellville industries that see more men than women are Utilities (90.3%), Wholesale Trade (80.8%), and Construction (79.7%), whereas the industries that tend to have a higher number of women are Health Care & Social Assistance (86.9%), Educational Services (60.3%), and Arts, Entertainment & Recreation (59.3%).
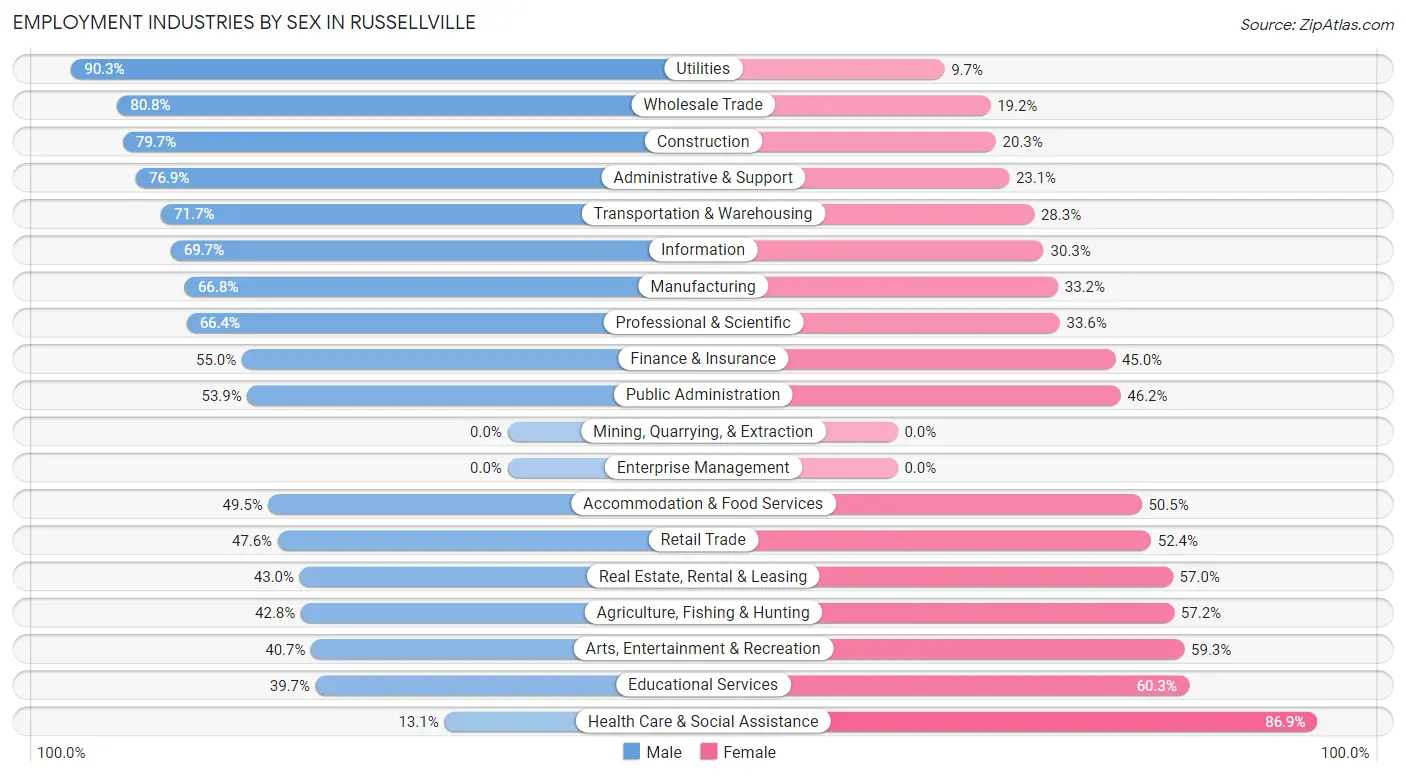
| Industry | Male | Female |
| Agriculture, Fishing & Hunting | 71 (42.8%) | 95 (57.2%) |
| Mining, Quarrying, & Extraction | 0 (0.0%) | 0 (0.0%) |
| Construction | 525 (79.7%) | 134 (20.3%) |
| Manufacturing | 1,829 (66.8%) | 909 (33.2%) |
| Wholesale Trade | 261 (80.8%) | 62 (19.2%) |
| Retail Trade | 653 (47.6%) | 720 (52.4%) |
| Transportation & Warehousing | 368 (71.7%) | 145 (28.3%) |
| Utilities | 280 (90.3%) | 30 (9.7%) |
| Information | 53 (69.7%) | 23 (30.3%) |
| Finance & Insurance | 221 (55.0%) | 181 (45.0%) |
| Real Estate, Rental & Leasing | 71 (43.0%) | 94 (57.0%) |
| Professional & Scientific | 198 (66.4%) | 100 (33.6%) |
| Enterprise Management | 0 (0.0%) | 0 (0.0%) |
| Administrative & Support | 230 (76.9%) | 69 (23.1%) |
| Educational Services | 625 (39.7%) | 949 (60.3%) |
| Health Care & Social Assistance | 240 (13.1%) | 1,594 (86.9%) |
| Arts, Entertainment & Recreation | 37 (40.7%) | 54 (59.3%) |
| Accommodation & Food Services | 715 (49.5%) | 730 (50.5%) |
| Public Administration | 168 (53.8%) | 144 (46.2%) |
| Total | 6,641 (51.3%) | 6,311 (48.7%) |
Education in Russellville
School Enrollment in Russellville
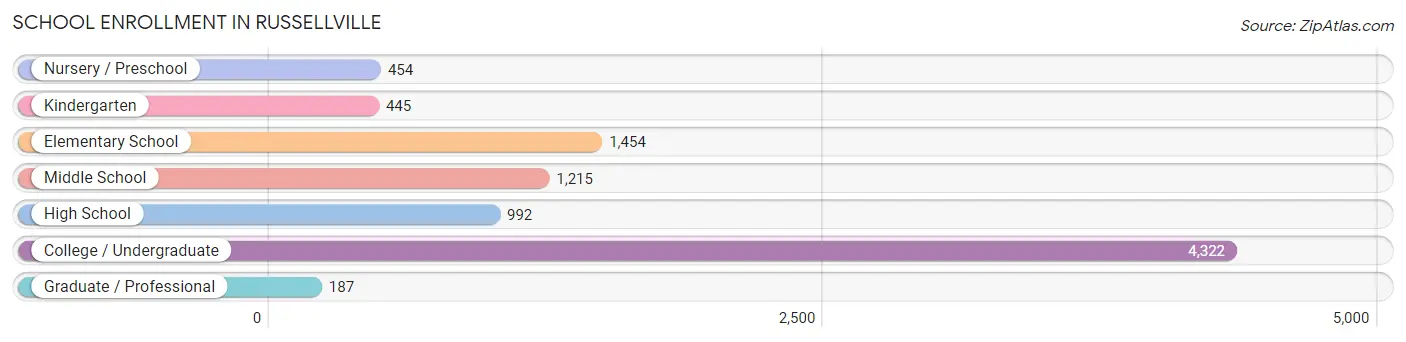
The most common levels of schooling among the 9,069 students in Russellville are college / undergraduate (4,322 | 47.7%), elementary school (1,454 | 16.0%), and middle school (1,215 | 13.4%).
| School Level | # Students | % Students |
| Nursery / Preschool | 454 | 5.0% |
| Kindergarten | 445 | 4.9% |
| Elementary School | 1,454 | 16.0% |
| Middle School | 1,215 | 13.4% |
| High School | 992 | 10.9% |
| College / Undergraduate | 4,322 | 47.7% |
| Graduate / Professional | 187 | 2.1% |
| Total | 9,069 | 100.0% |
School Enrollment by Age by Funding Source in Russellville
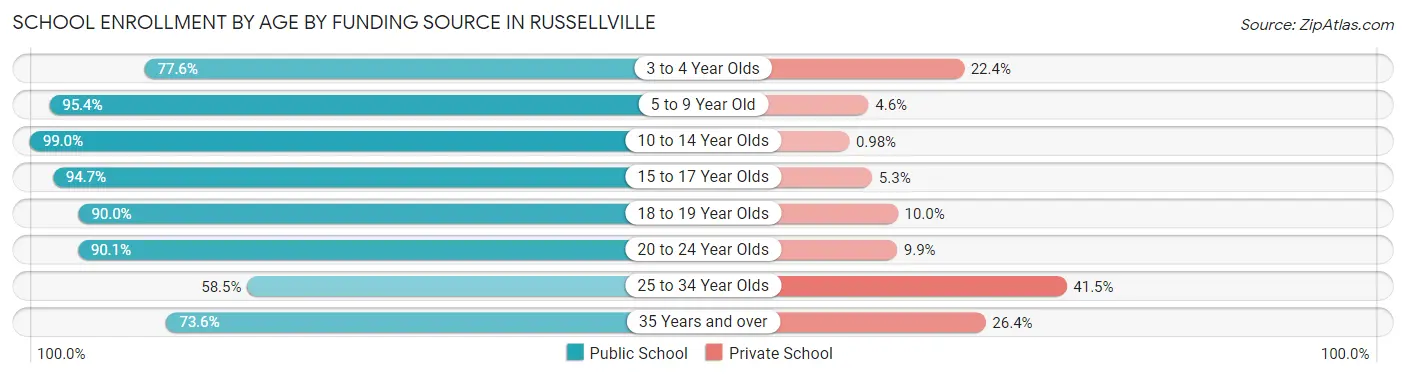
Out of a total of 9,069 students who are enrolled in schools in Russellville, 816 (9.0%) attend a private institution, while the remaining 8,253 (91.0%) are enrolled in public schools. The age group of 25 to 34 year olds has the highest likelihood of being enrolled in private schools, with 151 (41.5% in the age bracket) enrolled. Conversely, the age group of 10 to 14 year olds has the lowest likelihood of being enrolled in a private school, with 1,722 (99.0% in the age bracket) attending a public institution.
| Age Bracket | Public School | Private School |
| 3 to 4 Year Olds | 316 (77.6%) | 91 (22.4%) |
| 5 to 9 Year Old | 1,536 (95.4%) | 74 (4.6%) |
| 10 to 14 Year Olds | 1,722 (99.0%) | 17 (1.0%) |
| 15 to 17 Year Olds | 613 (94.7%) | 34 (5.3%) |
| 18 to 19 Year Olds | 1,533 (90.0%) | 171 (10.0%) |
| 20 to 24 Year Olds | 2,228 (90.1%) | 245 (9.9%) |
| 25 to 34 Year Olds | 213 (58.5%) | 151 (41.5%) |
| 35 Years and over | 92 (73.6%) | 33 (26.4%) |
| Total | 8,253 (91.0%) | 816 (9.0%) |
Educational Attainment by Field of Study in Russellville
Education (918 | 18.0%), business (855 | 16.8%), science & technology (561 | 11.0%), engineering (420 | 8.3%), and bio, nature & agricultural (410 | 8.1%) are the most common fields of study among 5,087 individuals in Russellville who have obtained a bachelor's degree or higher.
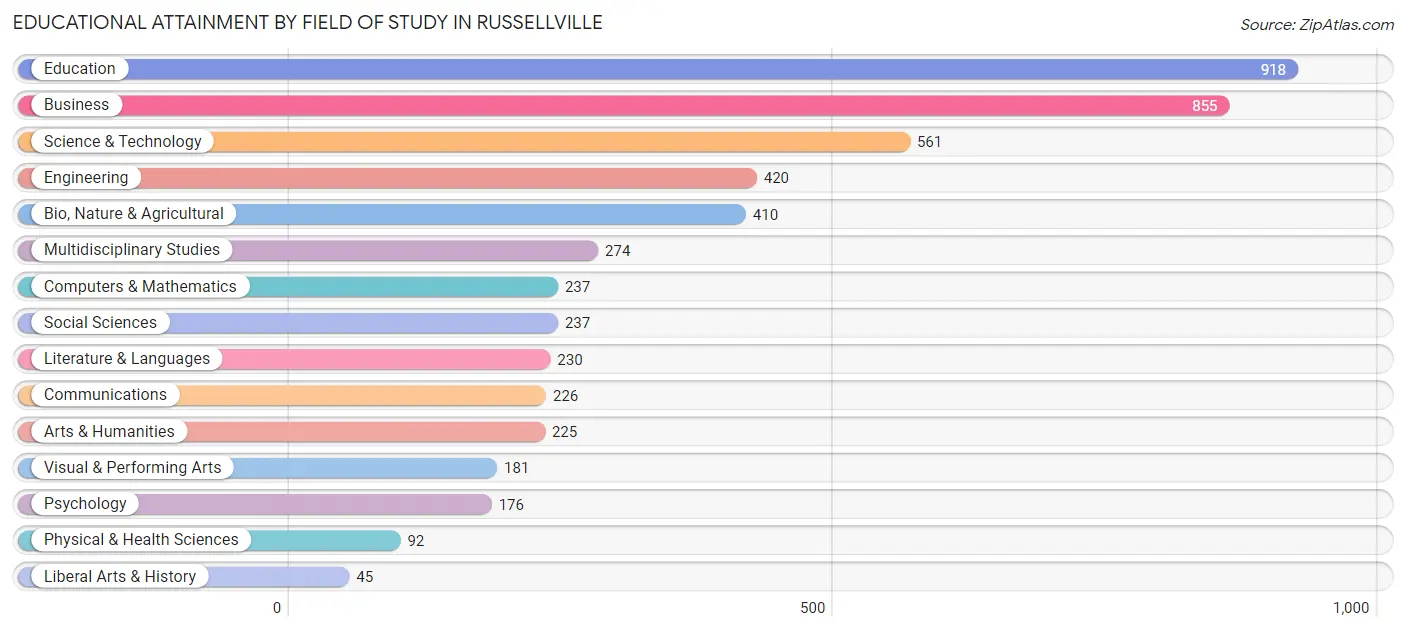
| Field of Study | # Graduates | % Graduates |
| Computers & Mathematics | 237 | 4.7% |
| Bio, Nature & Agricultural | 410 | 8.1% |
| Physical & Health Sciences | 92 | 1.8% |
| Psychology | 176 | 3.5% |
| Social Sciences | 237 | 4.7% |
| Engineering | 420 | 8.3% |
| Multidisciplinary Studies | 274 | 5.4% |
| Science & Technology | 561 | 11.0% |
| Business | 855 | 16.8% |
| Education | 918 | 18.0% |
| Literature & Languages | 230 | 4.5% |
| Liberal Arts & History | 45 | 0.9% |
| Visual & Performing Arts | 181 | 3.6% |
| Communications | 226 | 4.4% |
| Arts & Humanities | 225 | 4.4% |
| Total | 5,087 | 100.0% |
Transportation & Commute in Russellville
Vehicle Availability by Sex in Russellville
The most prevalent vehicle ownership categories in Russellville are males with 2 vehicles (2,705, accounting for 44.9%) and females with 2 vehicles (2,402, making up 46.9%).
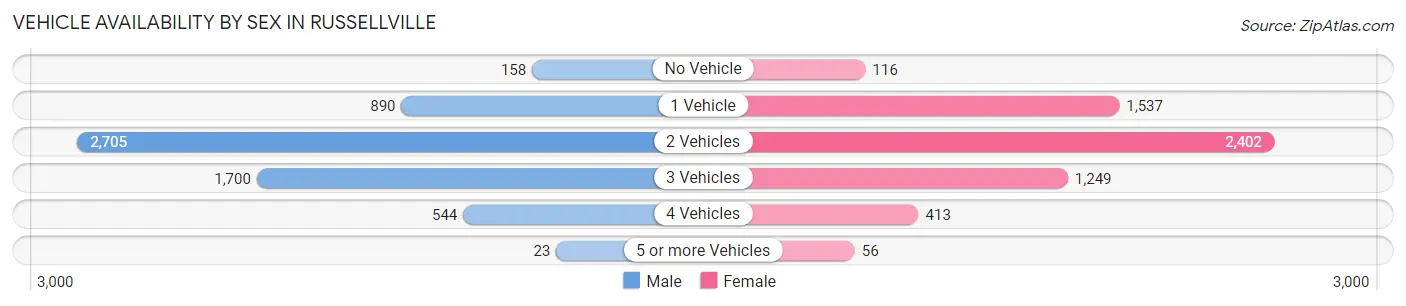
| Vehicles Available | Male | Female |
| No Vehicle | 158 (2.6%) | 116 (2.0%) |
| 1 Vehicle | 890 (14.8%) | 1,537 (26.6%) |
| 2 Vehicles | 2,705 (44.9%) | 2,402 (41.6%) |
| 3 Vehicles | 1,700 (28.2%) | 1,249 (21.6%) |
| 4 Vehicles | 544 (9.0%) | 413 (7.1%) |
| 5 or more Vehicles | 23 (0.4%) | 56 (1.0%) |
| Total | 6,020 (100.0%) | 5,773 (100.0%) |
Commute Time in Russellville
The most frequently occuring commute durations in Russellville are 5 to 9 minutes (3,613 commuters, 29.2%), 10 to 14 minutes (3,473 commuters, 28.1%), and 15 to 19 minutes (2,149 commuters, 17.4%).
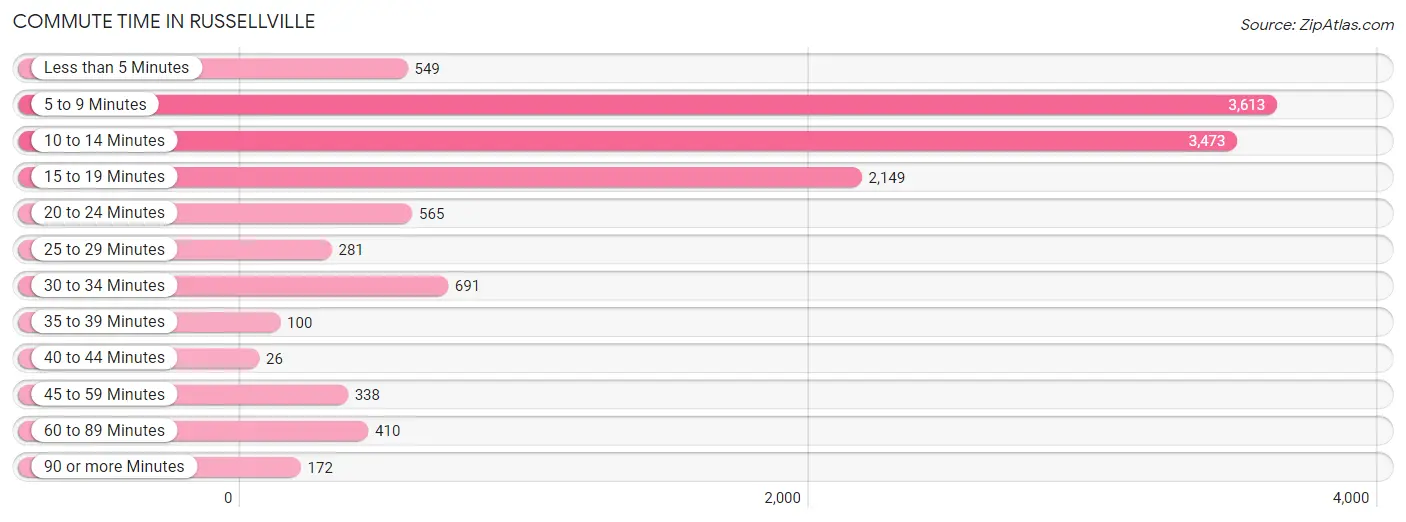
| Commute Time | # Commuters | % Commuters |
| Less than 5 Minutes | 549 | 4.4% |
| 5 to 9 Minutes | 3,613 | 29.2% |
| 10 to 14 Minutes | 3,473 | 28.1% |
| 15 to 19 Minutes | 2,149 | 17.4% |
| 20 to 24 Minutes | 565 | 4.6% |
| 25 to 29 Minutes | 281 | 2.3% |
| 30 to 34 Minutes | 691 | 5.6% |
| 35 to 39 Minutes | 100 | 0.8% |
| 40 to 44 Minutes | 26 | 0.2% |
| 45 to 59 Minutes | 338 | 2.7% |
| 60 to 89 Minutes | 410 | 3.3% |
| 90 or more Minutes | 172 | 1.4% |
Commute Time by Sex in Russellville
The most common commute times in Russellville are 5 to 9 minutes (1,828 commuters, 28.5%) for males and 5 to 9 minutes (1,785 commuters, 30.0%) for females.
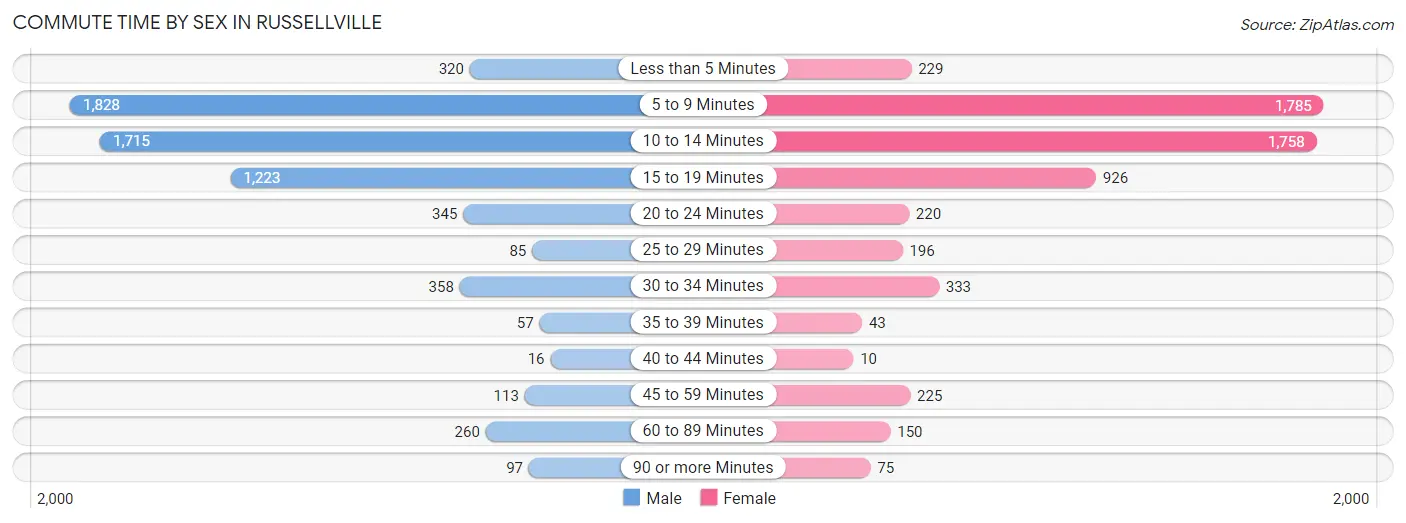
| Commute Time | Male | Female |
| Less than 5 Minutes | 320 (5.0%) | 229 (3.8%) |
| 5 to 9 Minutes | 1,828 (28.5%) | 1,785 (30.0%) |
| 10 to 14 Minutes | 1,715 (26.7%) | 1,758 (29.5%) |
| 15 to 19 Minutes | 1,223 (19.1%) | 926 (15.6%) |
| 20 to 24 Minutes | 345 (5.4%) | 220 (3.7%) |
| 25 to 29 Minutes | 85 (1.3%) | 196 (3.3%) |
| 30 to 34 Minutes | 358 (5.6%) | 333 (5.6%) |
| 35 to 39 Minutes | 57 (0.9%) | 43 (0.7%) |
| 40 to 44 Minutes | 16 (0.3%) | 10 (0.2%) |
| 45 to 59 Minutes | 113 (1.8%) | 225 (3.8%) |
| 60 to 89 Minutes | 260 (4.1%) | 150 (2.5%) |
| 90 or more Minutes | 97 (1.5%) | 75 (1.3%) |
Time of Departure to Work by Sex in Russellville
The most frequent times of departure to work in Russellville are 7:30 AM to 7:59 AM (1,047, 16.3%) for males and 7:30 AM to 7:59 AM (1,192, 20.0%) for females.
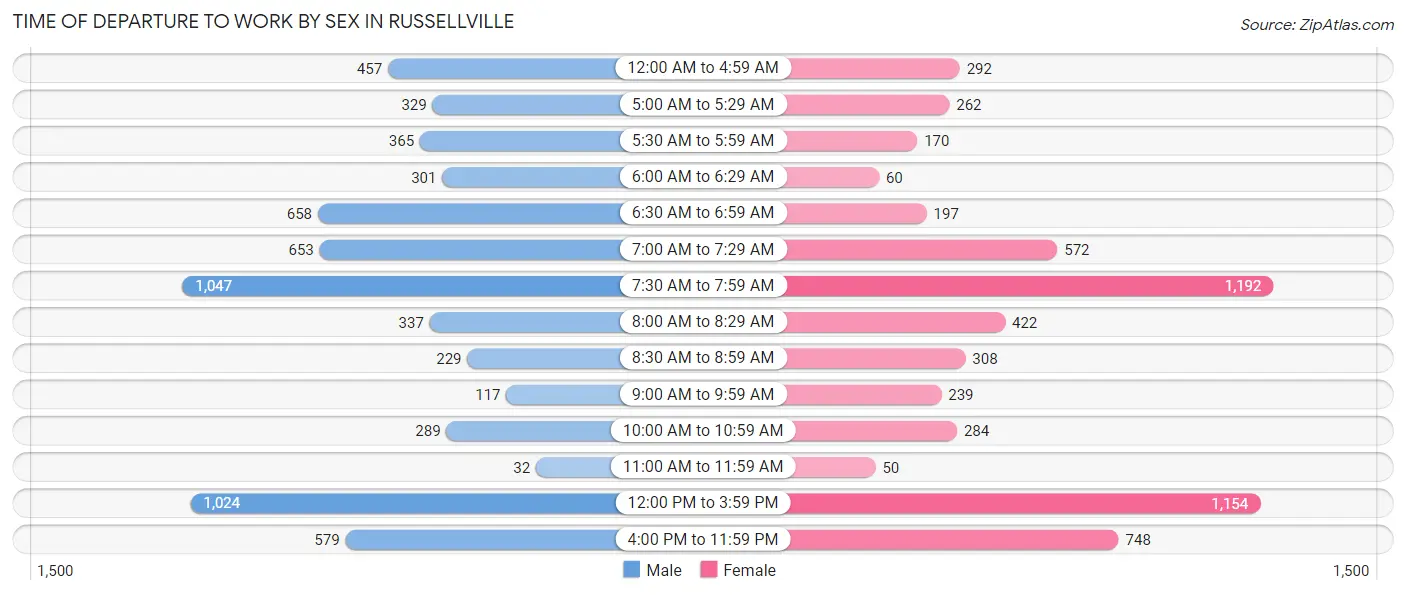
| Time of Departure | Male | Female |
| 12:00 AM to 4:59 AM | 457 (7.1%) | 292 (4.9%) |
| 5:00 AM to 5:29 AM | 329 (5.1%) | 262 (4.4%) |
| 5:30 AM to 5:59 AM | 365 (5.7%) | 170 (2.9%) |
| 6:00 AM to 6:29 AM | 301 (4.7%) | 60 (1.0%) |
| 6:30 AM to 6:59 AM | 658 (10.2%) | 197 (3.3%) |
| 7:00 AM to 7:29 AM | 653 (10.2%) | 572 (9.6%) |
| 7:30 AM to 7:59 AM | 1,047 (16.3%) | 1,192 (20.0%) |
| 8:00 AM to 8:29 AM | 337 (5.2%) | 422 (7.1%) |
| 8:30 AM to 8:59 AM | 229 (3.6%) | 308 (5.2%) |
| 9:00 AM to 9:59 AM | 117 (1.8%) | 239 (4.0%) |
| 10:00 AM to 10:59 AM | 289 (4.5%) | 284 (4.8%) |
| 11:00 AM to 11:59 AM | 32 (0.5%) | 50 (0.8%) |
| 12:00 PM to 3:59 PM | 1,024 (16.0%) | 1,154 (19.4%) |
| 4:00 PM to 11:59 PM | 579 (9.0%) | 748 (12.6%) |
| Total | 6,417 (100.0%) | 5,950 (100.0%) |
Housing Occupancy in Russellville
Occupancy by Ownership in Russellville
Of the total 10,424 dwellings in Russellville, owner-occupied units account for 6,132 (58.8%), while renter-occupied units make up 4,292 (41.2%).
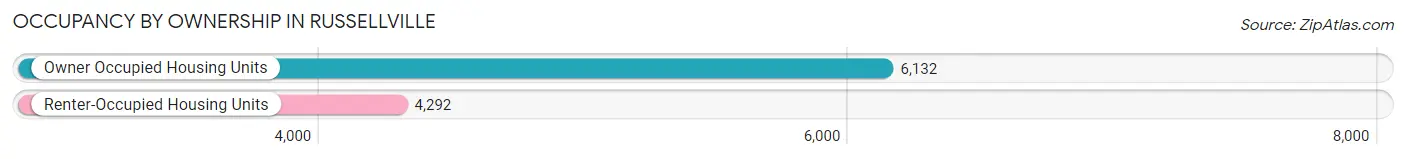
| Occupancy | # Housing Units | % Housing Units |
| Owner Occupied Housing Units | 6,132 | 58.8% |
| Renter-Occupied Housing Units | 4,292 | 41.2% |
| Total Occupied Housing Units | 10,424 | 100.0% |
Occupancy by Household Size in Russellville
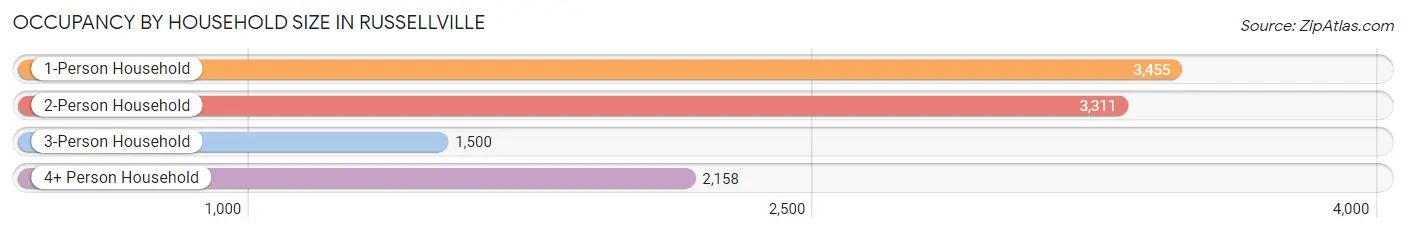
| Household Size | # Housing Units | % Housing Units |
| 1-Person Household | 3,455 | 33.1% |
| 2-Person Household | 3,311 | 31.8% |
| 3-Person Household | 1,500 | 14.4% |
| 4+ Person Household | 2,158 | 20.7% |
| Total Housing Units | 10,424 | 100.0% |
Occupancy by Ownership by Household Size in Russellville
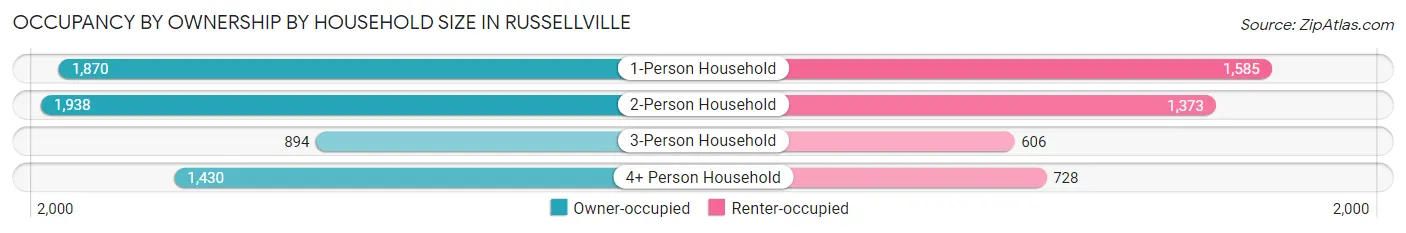
| Household Size | Owner-occupied | Renter-occupied |
| 1-Person Household | 1,870 (54.1%) | 1,585 (45.9%) |
| 2-Person Household | 1,938 (58.5%) | 1,373 (41.5%) |
| 3-Person Household | 894 (59.6%) | 606 (40.4%) |
| 4+ Person Household | 1,430 (66.3%) | 728 (33.7%) |
| Total Housing Units | 6,132 (58.8%) | 4,292 (41.2%) |
Occupancy by Educational Attainment in Russellville
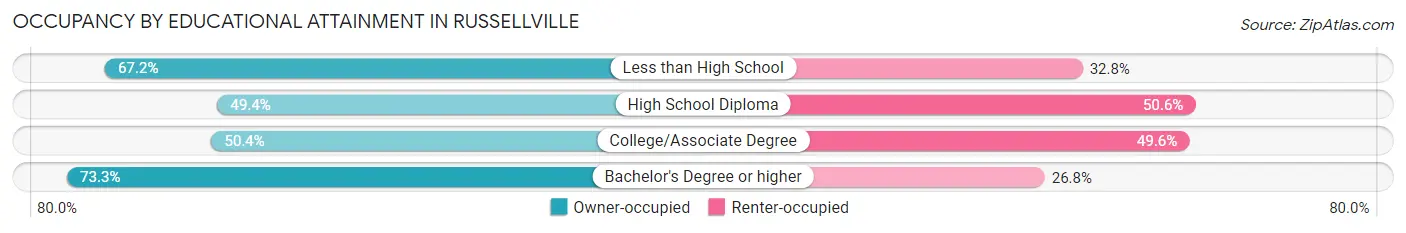
| Household Size | Owner-occupied | Renter-occupied |
| Less than High School | 778 (67.2%) | 379 (32.8%) |
| High School Diploma | 1,249 (49.4%) | 1,279 (50.6%) |
| College/Associate Degree | 1,830 (50.4%) | 1,803 (49.6%) |
| Bachelor's Degree or higher | 2,275 (73.3%) | 831 (26.8%) |
Occupancy by Age of Householder in Russellville
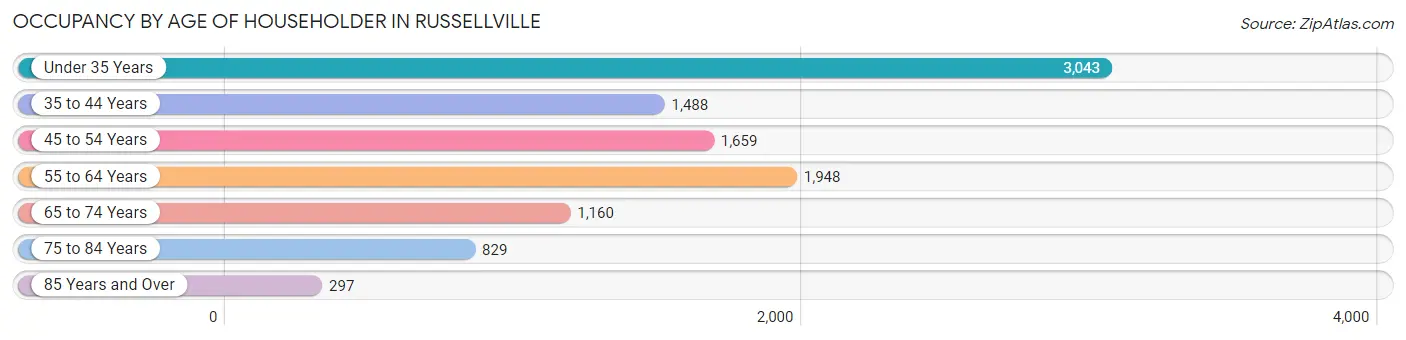
| Age Bracket | # Households | % Households |
| Under 35 Years | 3,043 | 29.2% |
| 35 to 44 Years | 1,488 | 14.3% |
| 45 to 54 Years | 1,659 | 15.9% |
| 55 to 64 Years | 1,948 | 18.7% |
| 65 to 74 Years | 1,160 | 11.1% |
| 75 to 84 Years | 829 | 8.0% |
| 85 Years and Over | 297 | 2.9% |
| Total | 10,424 | 100.0% |
Housing Finances in Russellville
Median Income by Occupancy in Russellville
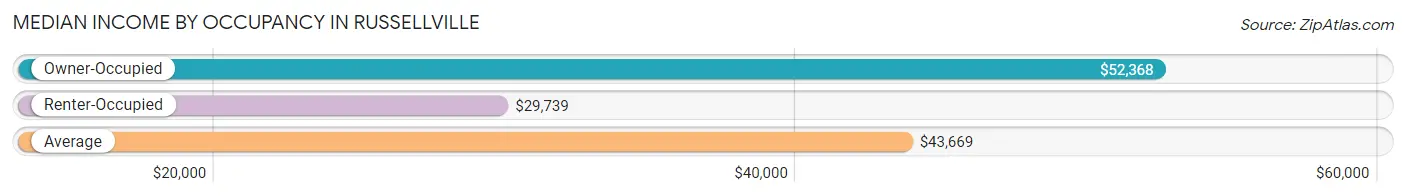
| Occupancy Type | # Households | Median Income |
| Owner-Occupied | 6,132 (58.8%) | $52,368 |
| Renter-Occupied | 4,292 (41.2%) | $29,739 |
| Average | 10,424 (100.0%) | $43,669 |
Occupancy by Householder Income Bracket in Russellville
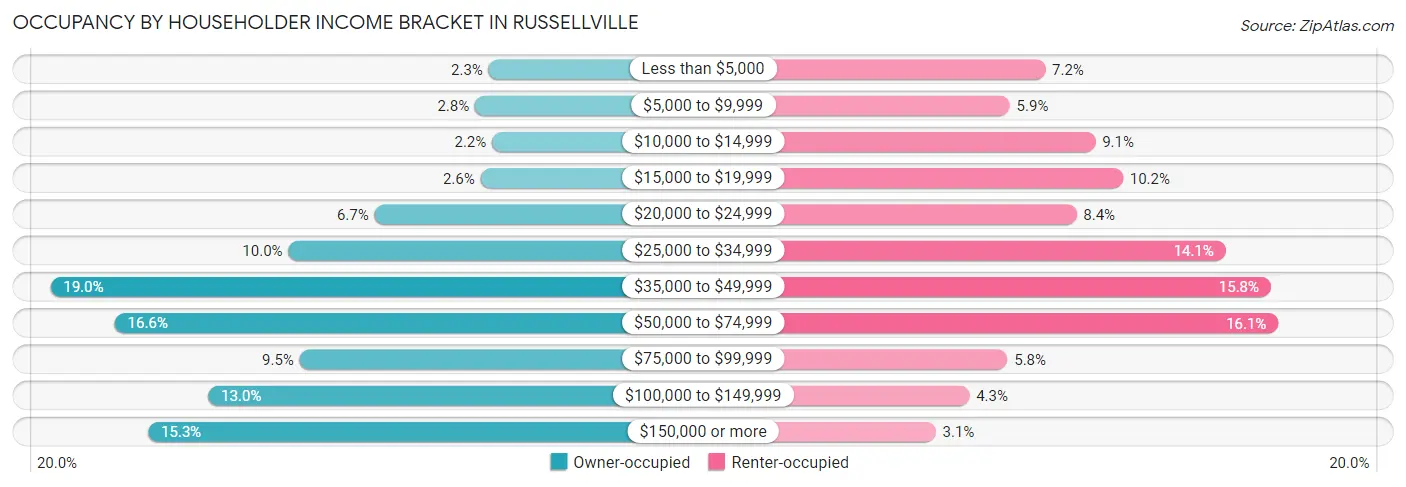
| Income Bracket | Owner-occupied | Renter-occupied |
| Less than $5,000 | 142 (2.3%) | 310 (7.2%) |
| $5,000 to $9,999 | 174 (2.8%) | 252 (5.9%) |
| $10,000 to $14,999 | 134 (2.2%) | 392 (9.1%) |
| $15,000 to $19,999 | 161 (2.6%) | 437 (10.2%) |
| $20,000 to $24,999 | 409 (6.7%) | 361 (8.4%) |
| $25,000 to $34,999 | 610 (10.0%) | 605 (14.1%) |
| $35,000 to $49,999 | 1,166 (19.0%) | 679 (15.8%) |
| $50,000 to $74,999 | 1,016 (16.6%) | 691 (16.1%) |
| $75,000 to $99,999 | 584 (9.5%) | 248 (5.8%) |
| $100,000 to $149,999 | 798 (13.0%) | 186 (4.3%) |
| $150,000 or more | 938 (15.3%) | 131 (3.0%) |
| Total | 6,132 (100.0%) | 4,292 (100.0%) |
Monthly Housing Cost Tiers in Russellville
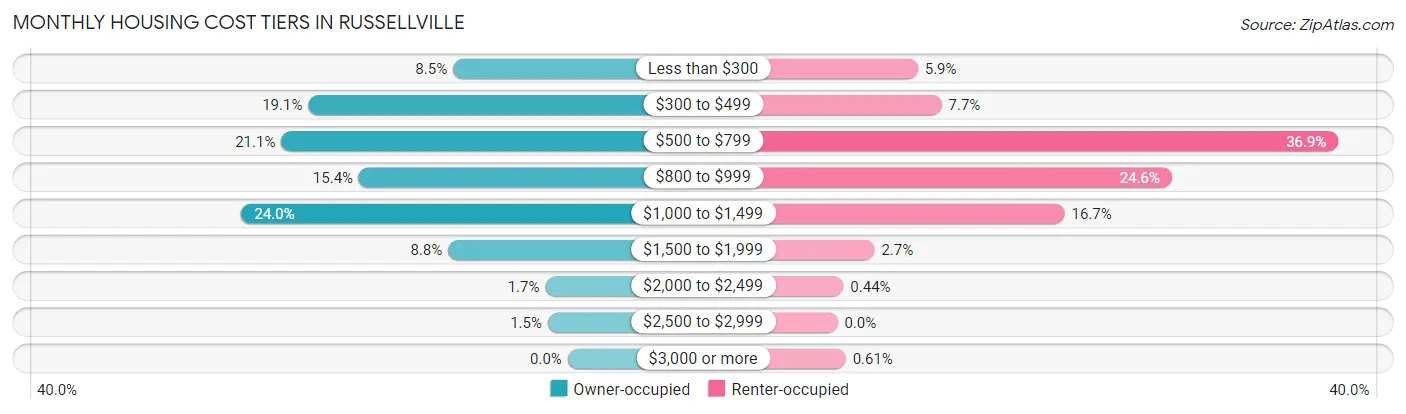
| Monthly Cost | Owner-occupied | Renter-occupied |
| Less than $300 | 518 (8.5%) | 254 (5.9%) |
| $300 to $499 | 1,172 (19.1%) | 329 (7.7%) |
| $500 to $799 | 1,294 (21.1%) | 1,583 (36.9%) |
| $800 to $999 | 943 (15.4%) | 1,057 (24.6%) |
| $1,000 to $1,499 | 1,474 (24.0%) | 718 (16.7%) |
| $1,500 to $1,999 | 540 (8.8%) | 117 (2.7%) |
| $2,000 to $2,499 | 101 (1.7%) | 19 (0.4%) |
| $2,500 to $2,999 | 90 (1.5%) | 0 (0.0%) |
| $3,000 or more | 0 (0.0%) | 26 (0.6%) |
| Total | 6,132 (100.0%) | 4,292 (100.0%) |
Physical Housing Characteristics in Russellville
Housing Structures in Russellville
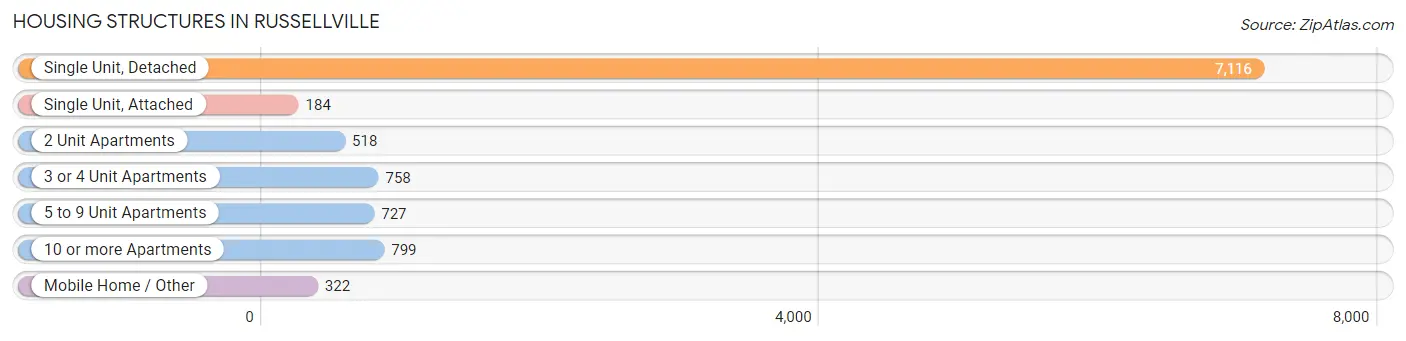
| Structure Type | # Housing Units | % Housing Units |
| Single Unit, Detached | 7,116 | 68.3% |
| Single Unit, Attached | 184 | 1.8% |
| 2 Unit Apartments | 518 | 5.0% |
| 3 or 4 Unit Apartments | 758 | 7.3% |
| 5 to 9 Unit Apartments | 727 | 7.0% |
| 10 or more Apartments | 799 | 7.7% |
| Mobile Home / Other | 322 | 3.1% |
| Total | 10,424 | 100.0% |
Housing Structures by Occupancy in Russellville
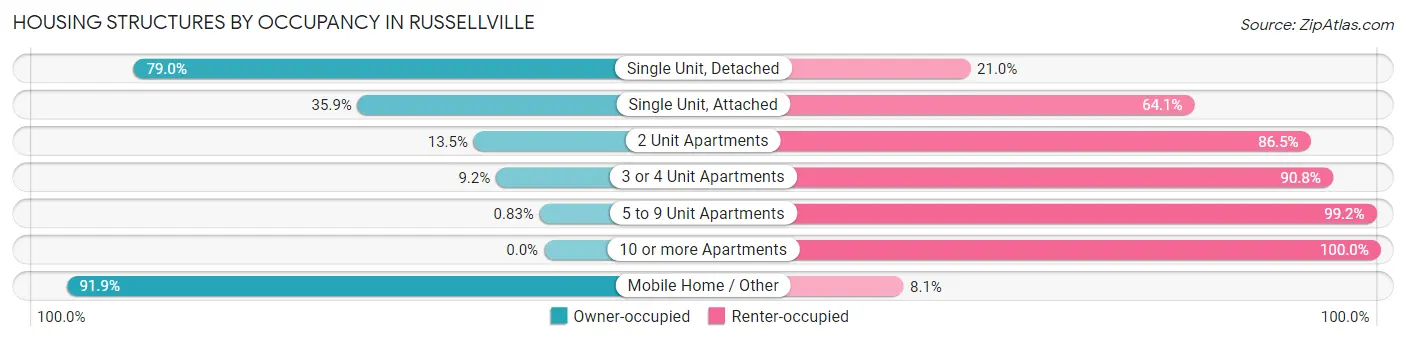
| Structure Type | Owner-occupied | Renter-occupied |
| Single Unit, Detached | 5,624 (79.0%) | 1,492 (21.0%) |
| Single Unit, Attached | 66 (35.9%) | 118 (64.1%) |
| 2 Unit Apartments | 70 (13.5%) | 448 (86.5%) |
| 3 or 4 Unit Apartments | 70 (9.2%) | 688 (90.8%) |
| 5 to 9 Unit Apartments | 6 (0.8%) | 721 (99.2%) |
| 10 or more Apartments | 0 (0.0%) | 799 (100.0%) |
| Mobile Home / Other | 296 (91.9%) | 26 (8.1%) |
| Total | 6,132 (58.8%) | 4,292 (41.2%) |
Housing Structures by Number of Rooms in Russellville
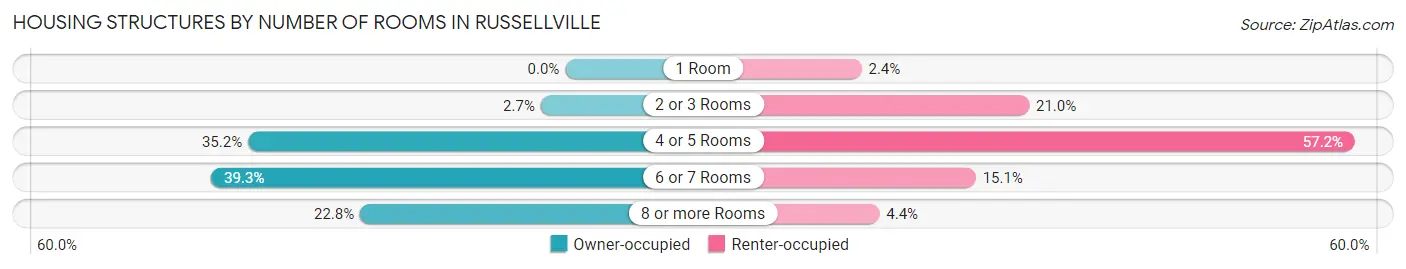
| Number of Rooms | Owner-occupied | Renter-occupied |
| 1 Room | 0 (0.0%) | 103 (2.4%) |
| 2 or 3 Rooms | 167 (2.7%) | 901 (21.0%) |
| 4 or 5 Rooms | 2,159 (35.2%) | 2,453 (57.2%) |
| 6 or 7 Rooms | 2,410 (39.3%) | 647 (15.1%) |
| 8 or more Rooms | 1,396 (22.8%) | 188 (4.4%) |
| Total | 6,132 (100.0%) | 4,292 (100.0%) |
Housing Structure by Heating Type in Russellville
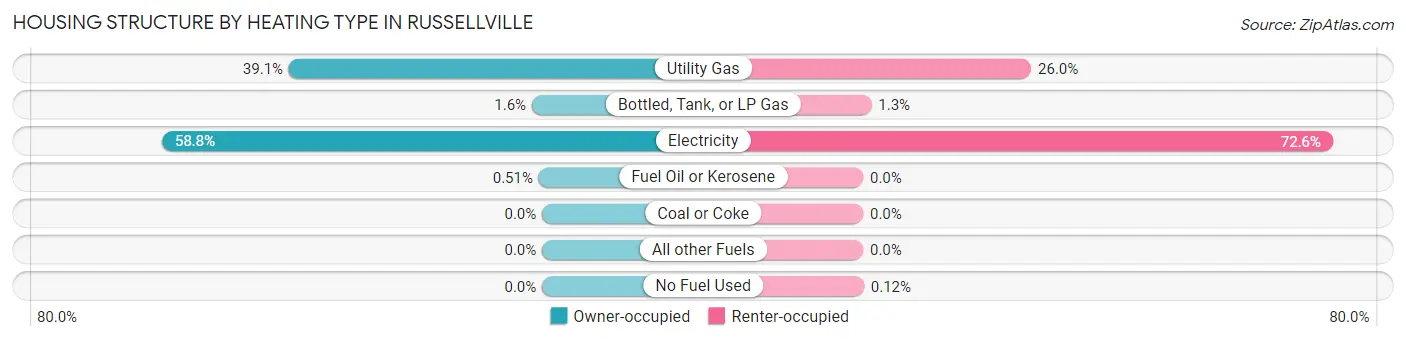
| Heating Type | Owner-occupied | Renter-occupied |
| Utility Gas | 2,400 (39.1%) | 1,115 (26.0%) |
| Bottled, Tank, or LP Gas | 96 (1.6%) | 55 (1.3%) |
| Electricity | 3,605 (58.8%) | 3,117 (72.6%) |
| Fuel Oil or Kerosene | 31 (0.5%) | 0 (0.0%) |
| Coal or Coke | 0 (0.0%) | 0 (0.0%) |
| All other Fuels | 0 (0.0%) | 0 (0.0%) |
| No Fuel Used | 0 (0.0%) | 5 (0.1%) |
| Total | 6,132 (100.0%) | 4,292 (100.0%) |
Household Vehicle Usage in Russellville
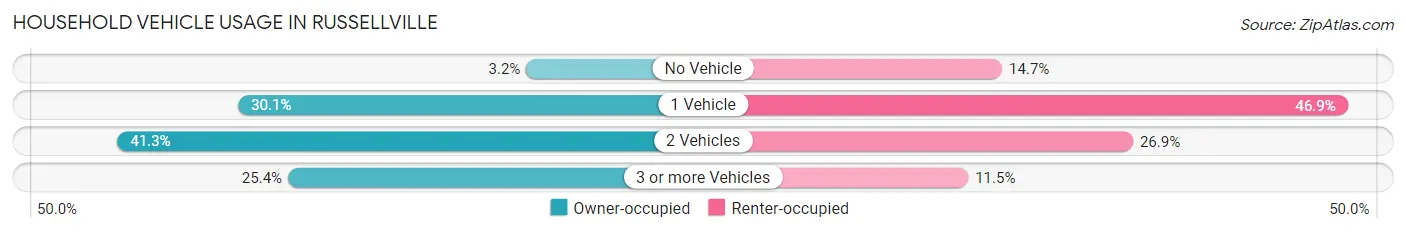
| Vehicles per Household | Owner-occupied | Renter-occupied |
| No Vehicle | 195 (3.2%) | 630 (14.7%) |
| 1 Vehicle | 1,843 (30.1%) | 2,014 (46.9%) |
| 2 Vehicles | 2,535 (41.3%) | 1,154 (26.9%) |
| 3 or more Vehicles | 1,559 (25.4%) | 494 (11.5%) |
| Total | 6,132 (100.0%) | 4,292 (100.0%) |
Real Estate & Mortgages in Russellville
Real Estate and Mortgage Overview in Russellville
| Characteristic | Without Mortgage | With Mortgage |
| Housing Units | 2,264 | 3,868 |
| Median Property Value | $164,000 | $153,200 |
| Median Household Income | $44,926 | $670 |
| Monthly Housing Costs | $396 | $0 |
| Real Estate Taxes | $861 | $173 |
Property Value by Mortgage Status in Russellville
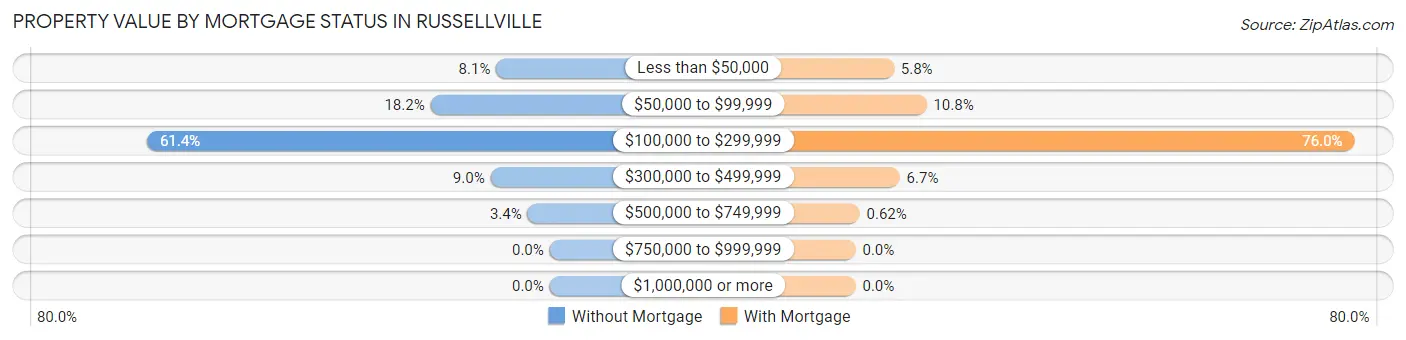
| Property Value | Without Mortgage | With Mortgage |
| Less than $50,000 | 184 (8.1%) | 226 (5.8%) |
| $50,000 to $99,999 | 411 (18.1%) | 418 (10.8%) |
| $100,000 to $299,999 | 1,389 (61.4%) | 2,940 (76.0%) |
| $300,000 to $499,999 | 204 (9.0%) | 260 (6.7%) |
| $500,000 to $749,999 | 76 (3.4%) | 24 (0.6%) |
| $750,000 to $999,999 | 0 (0.0%) | 0 (0.0%) |
| $1,000,000 or more | 0 (0.0%) | 0 (0.0%) |
| Total | 2,264 (100.0%) | 3,868 (100.0%) |
Household Income by Mortgage Status in Russellville
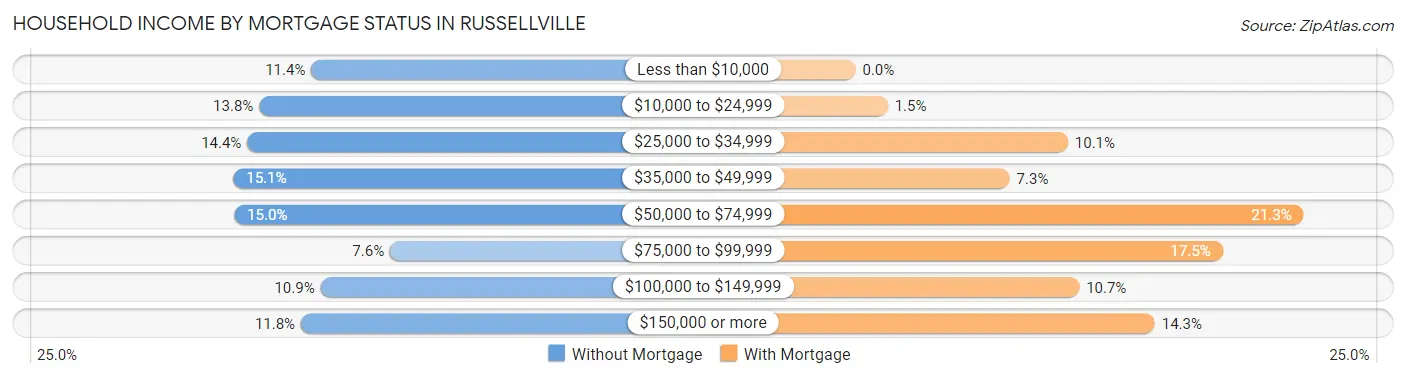
| Household Income | Without Mortgage | With Mortgage |
| Less than $10,000 | 257 (11.4%) | 0 (0.0%) |
| $10,000 to $24,999 | 313 (13.8%) | 59 (1.5%) |
| $25,000 to $34,999 | 326 (14.4%) | 391 (10.1%) |
| $35,000 to $49,999 | 341 (15.1%) | 284 (7.3%) |
| $50,000 to $74,999 | 340 (15.0%) | 825 (21.3%) |
| $75,000 to $99,999 | 172 (7.6%) | 676 (17.5%) |
| $100,000 to $149,999 | 247 (10.9%) | 412 (10.6%) |
| $150,000 or more | 268 (11.8%) | 551 (14.2%) |
| Total | 2,264 (100.0%) | 3,868 (100.0%) |
Property Value to Household Income Ratio in Russellville
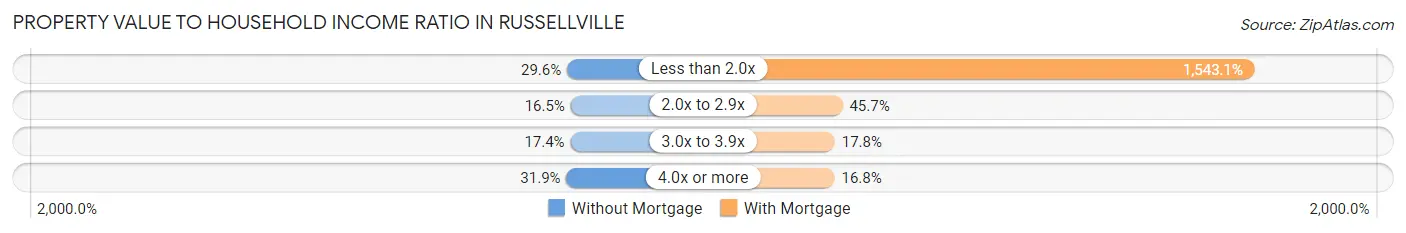
| Value-to-Income Ratio | Without Mortgage | With Mortgage |
| Less than 2.0x | 670 (29.6%) | 59,688 (1,543.1%) |
| 2.0x to 2.9x | 374 (16.5%) | 1,766 (45.7%) |
| 3.0x to 3.9x | 394 (17.4%) | 689 (17.8%) |
| 4.0x or more | 723 (31.9%) | 649 (16.8%) |
| Total | 2,264 (100.0%) | 3,868 (100.0%) |
Real Estate Taxes by Mortgage Status in Russellville
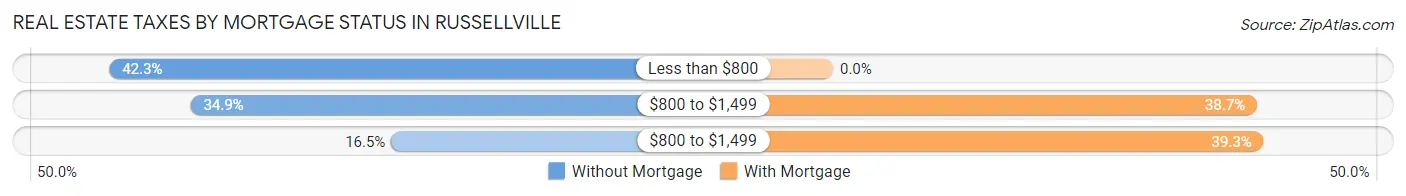
| Property Taxes | Without Mortgage | With Mortgage |
| Less than $800 | 957 (42.3%) | 0 (0.0%) |
| $800 to $1,499 | 789 (34.8%) | 1,498 (38.7%) |
| $800 to $1,499 | 374 (16.5%) | 1,521 (39.3%) |
| Total | 2,264 (100.0%) | 3,868 (100.0%) |
Health & Disability in Russellville
Health Insurance Coverage by Age in Russellville
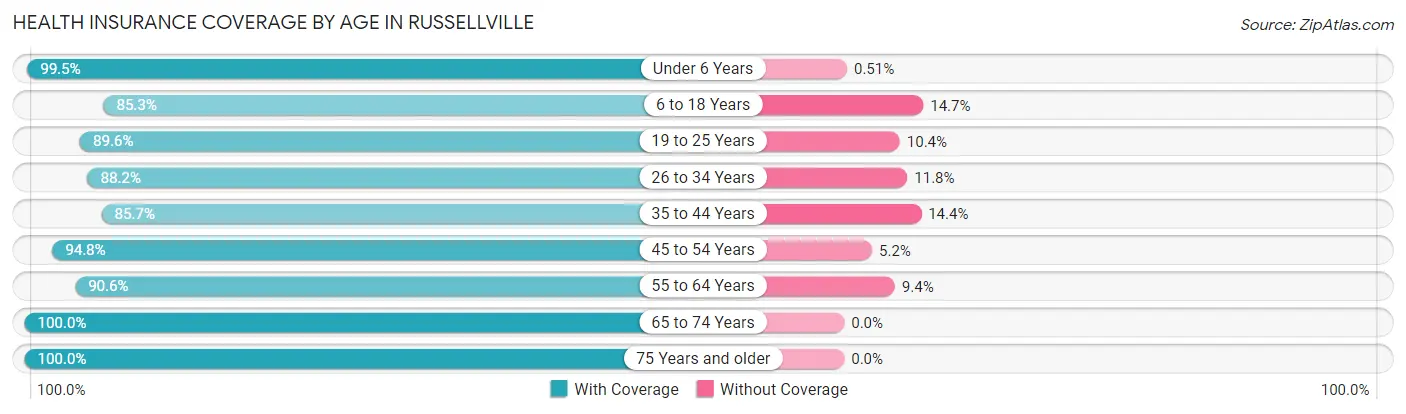
| Age Bracket | With Coverage | Without Coverage |
| Under 6 Years | 2,322 (99.5%) | 12 (0.5%) |
| 6 to 18 Years | 4,110 (85.3%) | 710 (14.7%) |
| 19 to 25 Years | 5,120 (89.6%) | 592 (10.4%) |
| 26 to 34 Years | 3,030 (88.2%) | 404 (11.8%) |
| 35 to 44 Years | 2,685 (85.7%) | 450 (14.3%) |
| 45 to 54 Years | 2,617 (94.8%) | 143 (5.2%) |
| 55 to 64 Years | 2,706 (90.6%) | 282 (9.4%) |
| 65 to 74 Years | 1,670 (100.0%) | 0 (0.0%) |
| 75 Years and older | 1,564 (100.0%) | 0 (0.0%) |
| Total | 25,824 (90.9%) | 2,593 (9.1%) |
Health Insurance Coverage by Citizenship Status in Russellville
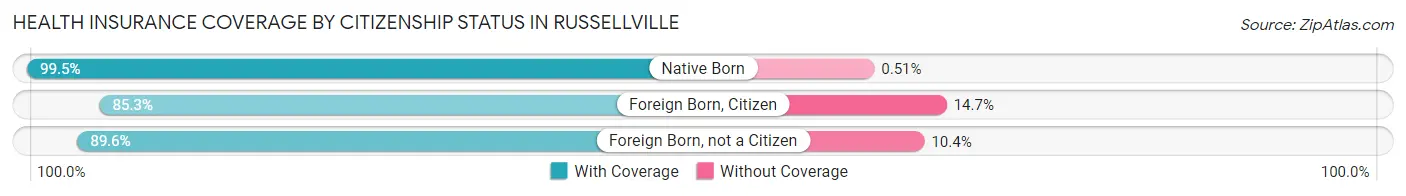
| Citizenship Status | With Coverage | Without Coverage |
| Native Born | 2,322 (99.5%) | 12 (0.5%) |
| Foreign Born, Citizen | 4,110 (85.3%) | 710 (14.7%) |
| Foreign Born, not a Citizen | 5,120 (89.6%) | 592 (10.4%) |
Health Insurance Coverage by Household Income in Russellville
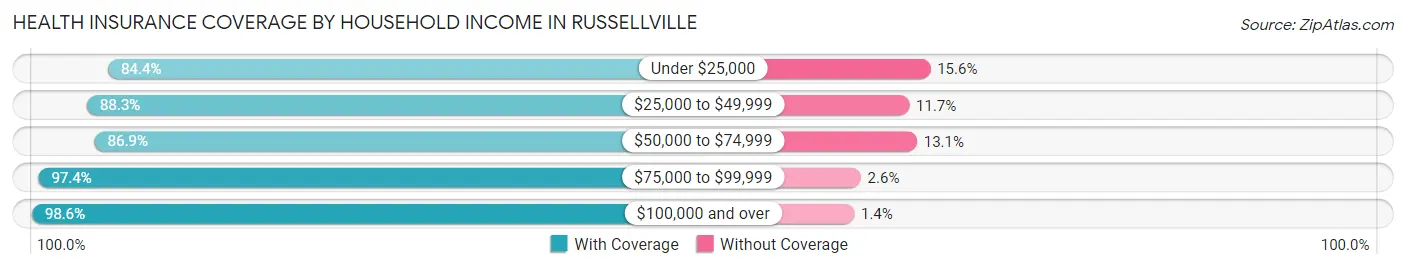
| Household Income | With Coverage | Without Coverage |
| Under $25,000 | 4,027 (84.4%) | 746 (15.6%) |
| $25,000 to $49,999 | 5,986 (88.3%) | 792 (11.7%) |
| $50,000 to $74,999 | 4,489 (86.9%) | 678 (13.1%) |
| $75,000 to $99,999 | 2,133 (97.4%) | 57 (2.6%) |
| $100,000 and over | 6,735 (98.6%) | 93 (1.4%) |
Public vs Private Health Insurance Coverage by Age in Russellville
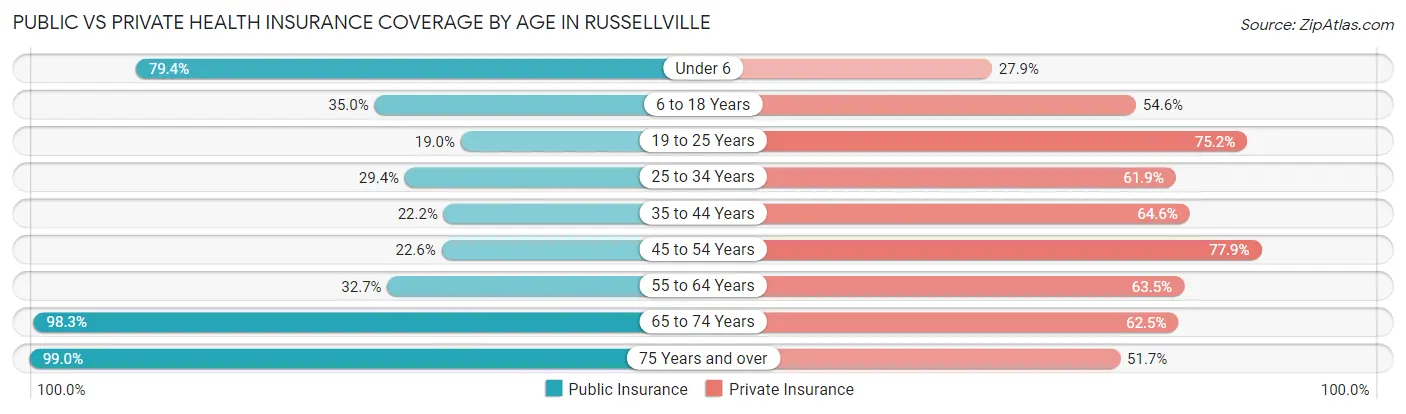
| Age Bracket | Public Insurance | Private Insurance |
| Under 6 | 1,852 (79.3%) | 650 (27.9%) |
| 6 to 18 Years | 1,689 (35.0%) | 2,631 (54.6%) |
| 19 to 25 Years | 1,087 (19.0%) | 4,297 (75.2%) |
| 25 to 34 Years | 1,010 (29.4%) | 2,127 (61.9%) |
| 35 to 44 Years | 696 (22.2%) | 2,024 (64.6%) |
| 45 to 54 Years | 624 (22.6%) | 2,149 (77.9%) |
| 55 to 64 Years | 976 (32.7%) | 1,897 (63.5%) |
| 65 to 74 Years | 1,642 (98.3%) | 1,043 (62.5%) |
| 75 Years and over | 1,549 (99.0%) | 808 (51.7%) |
| Total | 11,125 (39.2%) | 17,626 (62.0%) |
Disability Status by Sex by Age in Russellville
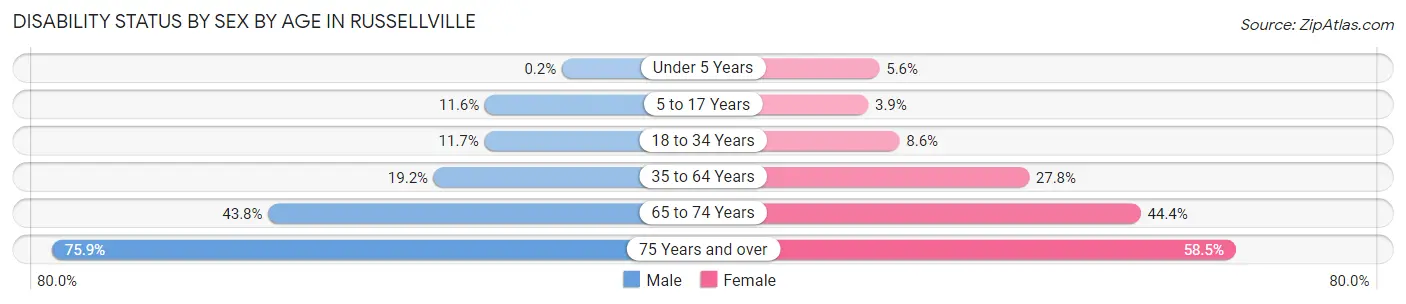
| Age Bracket | Male | Female |
| Under 5 Years | 2 (0.2%) | 57 (5.6%) |
| 5 to 17 Years | 247 (11.6%) | 89 (3.9%) |
| 18 to 34 Years | 597 (11.7%) | 409 (8.6%) |
| 35 to 64 Years | 799 (19.2%) | 1,313 (27.8%) |
| 65 to 74 Years | 300 (43.8%) | 437 (44.4%) |
| 75 Years and over | 445 (75.9%) | 572 (58.5%) |
Disability Class by Sex by Age in Russellville
Disability Class: Hearing Difficulty
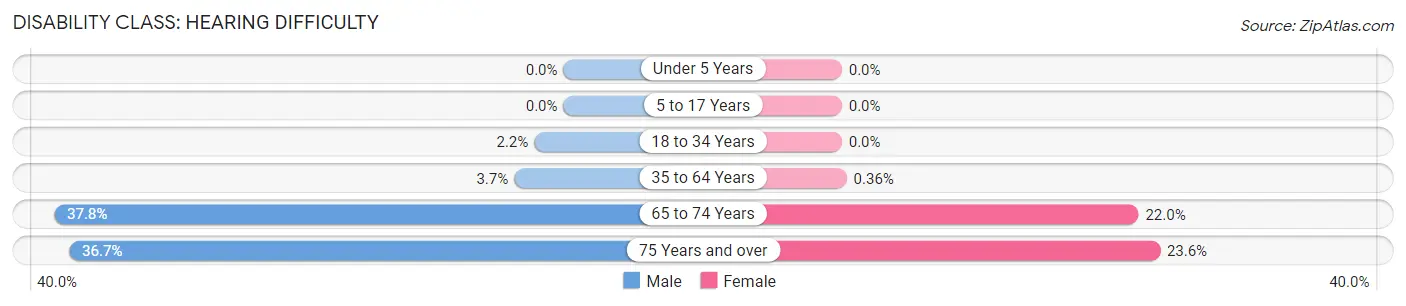
| Age Bracket | Male | Female |
| Under 5 Years | 0 (0.0%) | 0 (0.0%) |
| 5 to 17 Years | 0 (0.0%) | 0 (0.0%) |
| 18 to 34 Years | 111 (2.2%) | 0 (0.0%) |
| 35 to 64 Years | 152 (3.7%) | 17 (0.4%) |
| 65 to 74 Years | 259 (37.8%) | 217 (22.0%) |
| 75 Years and over | 215 (36.7%) | 231 (23.6%) |
Disability Class: Vision Difficulty
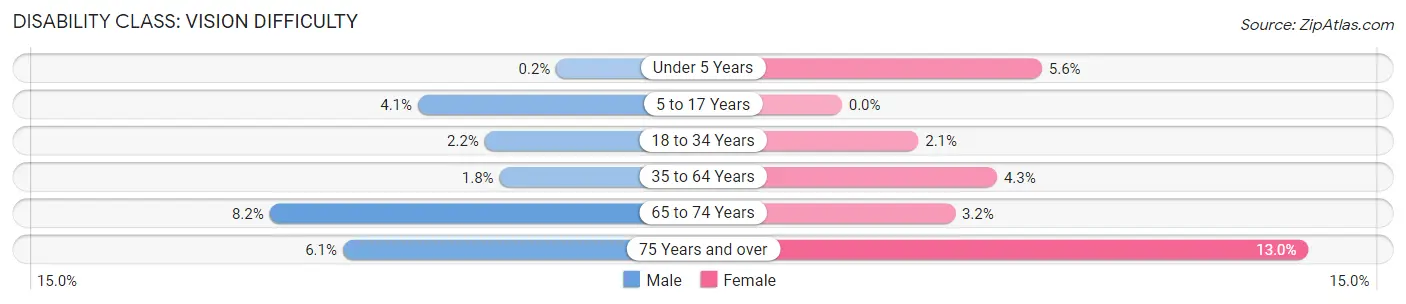
| Age Bracket | Male | Female |
| Under 5 Years | 2 (0.2%) | 57 (5.6%) |
| 5 to 17 Years | 86 (4.1%) | 0 (0.0%) |
| 18 to 34 Years | 112 (2.2%) | 102 (2.1%) |
| 35 to 64 Years | 74 (1.8%) | 204 (4.3%) |
| 65 to 74 Years | 56 (8.2%) | 31 (3.2%) |
| 75 Years and over | 36 (6.1%) | 127 (13.0%) |
Disability Class: Cognitive Difficulty
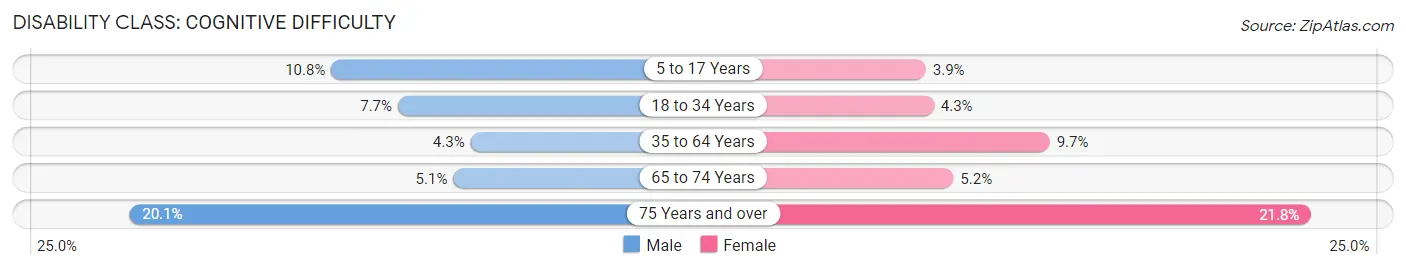
| Age Bracket | Male | Female |
| 5 to 17 Years | 229 (10.8%) | 89 (3.9%) |
| 18 to 34 Years | 392 (7.7%) | 204 (4.3%) |
| 35 to 64 Years | 179 (4.3%) | 456 (9.7%) |
| 65 to 74 Years | 35 (5.1%) | 51 (5.2%) |
| 75 Years and over | 118 (20.1%) | 213 (21.8%) |
Disability Class: Ambulatory Difficulty
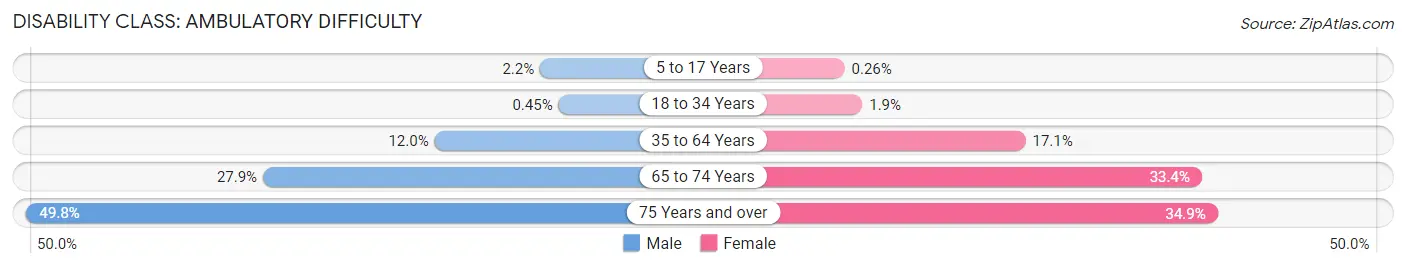
| Age Bracket | Male | Female |
| 5 to 17 Years | 46 (2.2%) | 6 (0.3%) |
| 18 to 34 Years | 23 (0.4%) | 91 (1.9%) |
| 35 to 64 Years | 497 (12.0%) | 806 (17.1%) |
| 65 to 74 Years | 191 (27.9%) | 329 (33.4%) |
| 75 Years and over | 292 (49.8%) | 341 (34.9%) |
Disability Class: Self-Care Difficulty
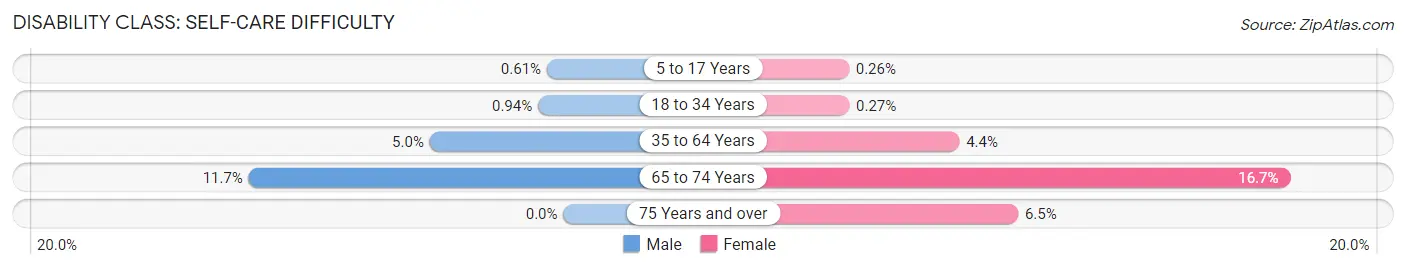
| Age Bracket | Male | Female |
| 5 to 17 Years | 13 (0.6%) | 6 (0.3%) |
| 18 to 34 Years | 48 (0.9%) | 13 (0.3%) |
| 35 to 64 Years | 206 (5.0%) | 206 (4.4%) |
| 65 to 74 Years | 80 (11.7%) | 164 (16.7%) |
| 75 Years and over | 0 (0.0%) | 64 (6.5%) |
Technology Access in Russellville
Computing Device Access in Russellville
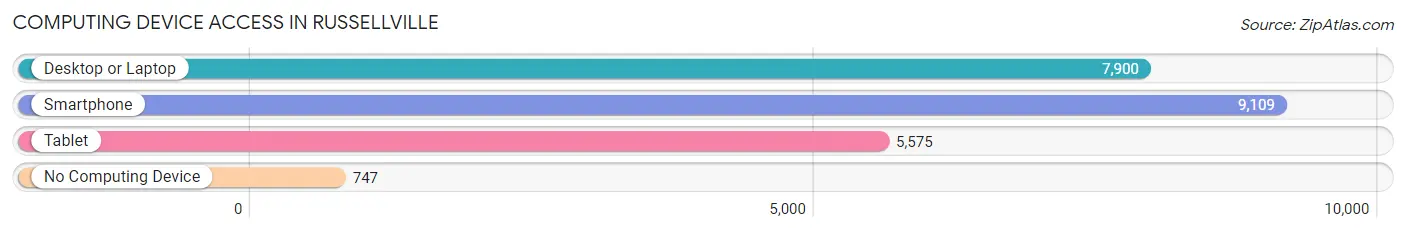
| Device Type | # Households | % Households |
| Desktop or Laptop | 7,900 | 75.8% |
| Smartphone | 9,109 | 87.4% |
| Tablet | 5,575 | 53.5% |
| No Computing Device | 747 | 7.2% |
| Total | 10,424 | 100.0% |
Internet Access in Russellville
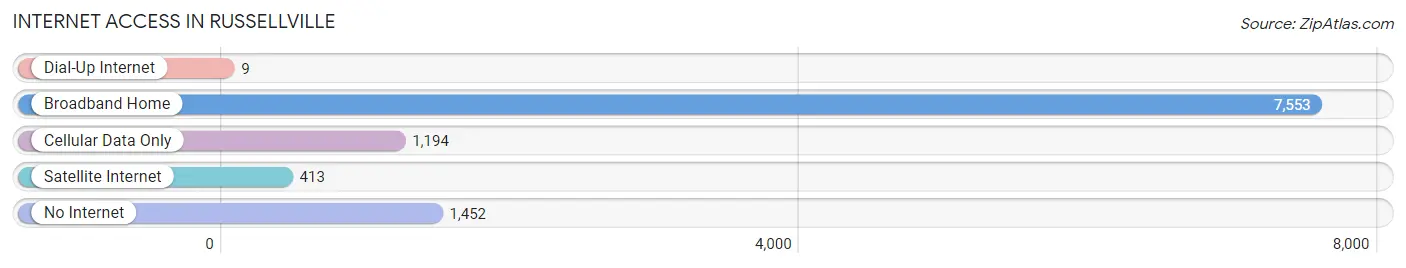
| Internet Type | # Households | % Households |
| Dial-Up Internet | 9 | 0.1% |
| Broadband Home | 7,553 | 72.5% |
| Cellular Data Only | 1,194 | 11.5% |
| Satellite Internet | 413 | 4.0% |
| No Internet | 1,452 | 13.9% |
| Total | 10,424 | 100.0% |
Russellville Summary
Introduction
Russellville, Arkansas is a city located in the northwest corner of the state, in Pope County. It is the county seat and the largest city in the county. The city is situated on the Arkansas River and is home to Arkansas Tech University. The city has a population of 28,307 as of the 2010 census, making it the seventh largest city in the state.
History
The area that is now Russellville was first settled in the early 1800s by the Osage Indians. The first white settlers arrived in the area in 1817, and the town was officially founded in 1834. The town was named after Dr. Thomas Russell, a prominent local doctor.
In 1881, the St. Louis, Iron Mountain and Southern Railway built a line through the town, connecting it to the rest of the state. This allowed for the growth of the town, and it soon became a major center for trade and commerce.
In the early 1900s, the town was home to several large industries, including a cotton mill, a lumber mill, and a brick factory. The town also had a thriving agricultural industry, with cotton, corn, and wheat being the main crops.
In the late 1940s, Arkansas Tech University was founded in Russellville. This brought a new wave of growth to the town, and it soon became a major educational center.
Geography
Russellville is located in the northwest corner of Arkansas, in Pope County. It is situated on the Arkansas River, and is about 60 miles northwest of Little Rock. The city has a total area of 16.2 square miles, of which 16.1 square miles is land and 0.1 square miles is water.
The city is located in a hilly region, with the Ozark Mountains to the north and the Ouachita Mountains to the south. The climate is humid subtropical, with hot, humid summers and mild winters.
Economy
The economy of Russellville is largely based on education, manufacturing, and agriculture. Arkansas Tech University is the largest employer in the city, with over 3,000 employees. Other major employers include Tyson Foods, Inc., Russellville School District, and the Arkansas Department of Corrections.
The city is also home to several manufacturing companies, including a paper mill, a steel mill, and a plastics plant. Agriculture is also an important part of the economy, with cotton, corn, and wheat being the main crops.
Demographics
As of the 2010 census, Russellville had a population of 28,307. The racial makeup of the city was 79.2% White, 15.3% African American, 0.7% Native American, 1.2% Asian, 0.1% Pacific Islander, 1.7% from other races, and 1.8% from two or more races. Hispanic or Latino of any race were 4.2% of the population.
The median income for a household in the city was $32,917, and the median income for a family was $41,945. The per capita income for the city was $17,845. About 15.2% of families and 19.3% of the population were below the poverty line, including 25.2% of those under age 18 and 11.2% of those age 65 or over.
Conclusion
Russellville, Arkansas is a city located in the northwest corner of the state, in Pope County. It is the county seat and the largest city in the county. The city is situated on the Arkansas River and is home to Arkansas Tech University. The city has a population of 28,307 as of the 2010 census, making it the seventh largest city in the state. The economy of Russellville is largely based on education, manufacturing, and agriculture. The racial makeup of the city is 79.2% White, 15.3% African American, 0.7% Native American, 1.2% Asian, 0.1% Pacific Islander, 1.7% from other races, and 1.8% from two or more races. The median income for a household in the city was $32,917, and the median income for a family was $41,945.
Common Questions
What is Per Capita Income in Russellville?
Per Capita income in Russellville is $25,477.
What is the Median Family Income in Russellville?
Median Family Income in Russellville is $56,529.
What is the Median Household income in Russellville?
Median Household Income in Russellville is $43,669.
What is Income or Wage Gap in Russellville?
Income or Wage Gap in Russellville is 35.7%.
Women in Russellville earn 64.3 cents for every dollar earned by a man.
What is Family Income Deficit in Russellville?
Family Income Deficit in Russellville is $8,666.
Families that are below poverty line in Russellville earn $8,666 less on average than the poverty threshold level.
What is Inequality or Gini Index in Russellville?
Inequality or Gini Index in Russellville is 0.49.
What is the Total Population of Russellville?
Total Population of Russellville is 28,946.
What is the Total Male Population of Russellville?
Total Male Population of Russellville is 13,873.
What is the Total Female Population of Russellville?
Total Female Population of Russellville is 15,073.
What is the Ratio of Males per 100 Females in Russellville?
There are 92.04 Males per 100 Females in Russellville.
What is the Ratio of Females per 100 Males in Russellville?
There are 108.65 Females per 100 Males in Russellville.
What is the Median Population Age in Russellville?
Median Population Age in Russellville is 29.9 Years.
What is the Average Family Size in Russellville
Average Family Size in Russellville is 3.1 People.
What is the Average Household Size in Russellville
Average Household Size in Russellville is 2.5 People.
How Large is the Labor Force in Russellville?
There are 13,722 People in the Labor Forcein in Russellville.
What is the Percentage of People in the Labor Force in Russellville?
59.4% of People are in the Labor Force in Russellville.
What is the Unemployment Rate in Russellville?
Unemployment Rate in Russellville is 5.3%.