Sebastian County, AR Map & Demographics
Sebastian County Overview
$32,577
PER CAPITA INCOME
$67,102
AVG FAMILY INCOME
$54,047
AVG HOUSEHOLD INCOME
25.8%
WAGE / INCOME GAP [ % ]
74.2¢/ $1
WAGE / INCOME GAP [ $ ]
$10,516
FAMILY INCOME DEFICIT
0.50
INEQUALITY / GINI INDEX
128,184
TOTAL POPULATION
63,156
MALE POPULATION
65,028
FEMALE POPULATION
97.12
MALES / 100 FEMALES
102.96
FEMALES / 100 MALES
38.0
MEDIAN AGE
3.0
AVG FAMILY SIZE
2.4
AVG HOUSEHOLD SIZE
61,327
LABOR FORCE [ PEOPLE ]
60.5%
PERCENT IN LABOR FORCE
5.2%
UNEMPLOYMENT RATE
Sebastian County Area Codes
Income in Sebastian County
Income Overview in Sebastian County
Per Capita Income in Sebastian County is $32,577, while median incomes of families and households are $67,102 and $54,047 respectively.
| Characteristic | Number | Measure |
| Per Capita Income | 128,184 | $32,577 |
| Median Family Income | 33,718 | $67,102 |
| Mean Family Income | 33,718 | $99,896 |
| Median Household Income | 51,862 | $54,047 |
| Mean Household Income | 51,862 | $81,552 |
| Income Deficit | 33,718 | $10,516 |
| Wage / Income Gap (%) | 128,184 | 25.75% |
| Wage / Income Gap ($) | 128,184 | 74.25¢ per $1 |
| Gini / Inequality Index | 128,184 | 0.50 |
Earnings by Sex in Sebastian County
Average Earnings in Sebastian County are $34,083, $40,059 for men and $29,742 for women, a difference of 25.8%.
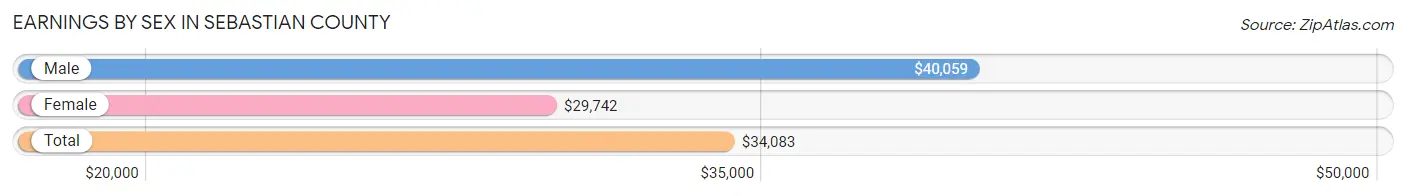
| Sex | Number | Average Earnings |
| Male | 33,710 (52.6%) | $40,059 |
| Female | 30,314 (47.3%) | $29,742 |
| Total | 64,024 (100.0%) | $34,083 |
Earnings by Sex by Income Bracket in Sebastian County
The most common earnings brackets in Sebastian County are $100,000+ for men (4,407 | 13.1%) and $25,000 to $29,999 for women (3,150 | 10.4%).
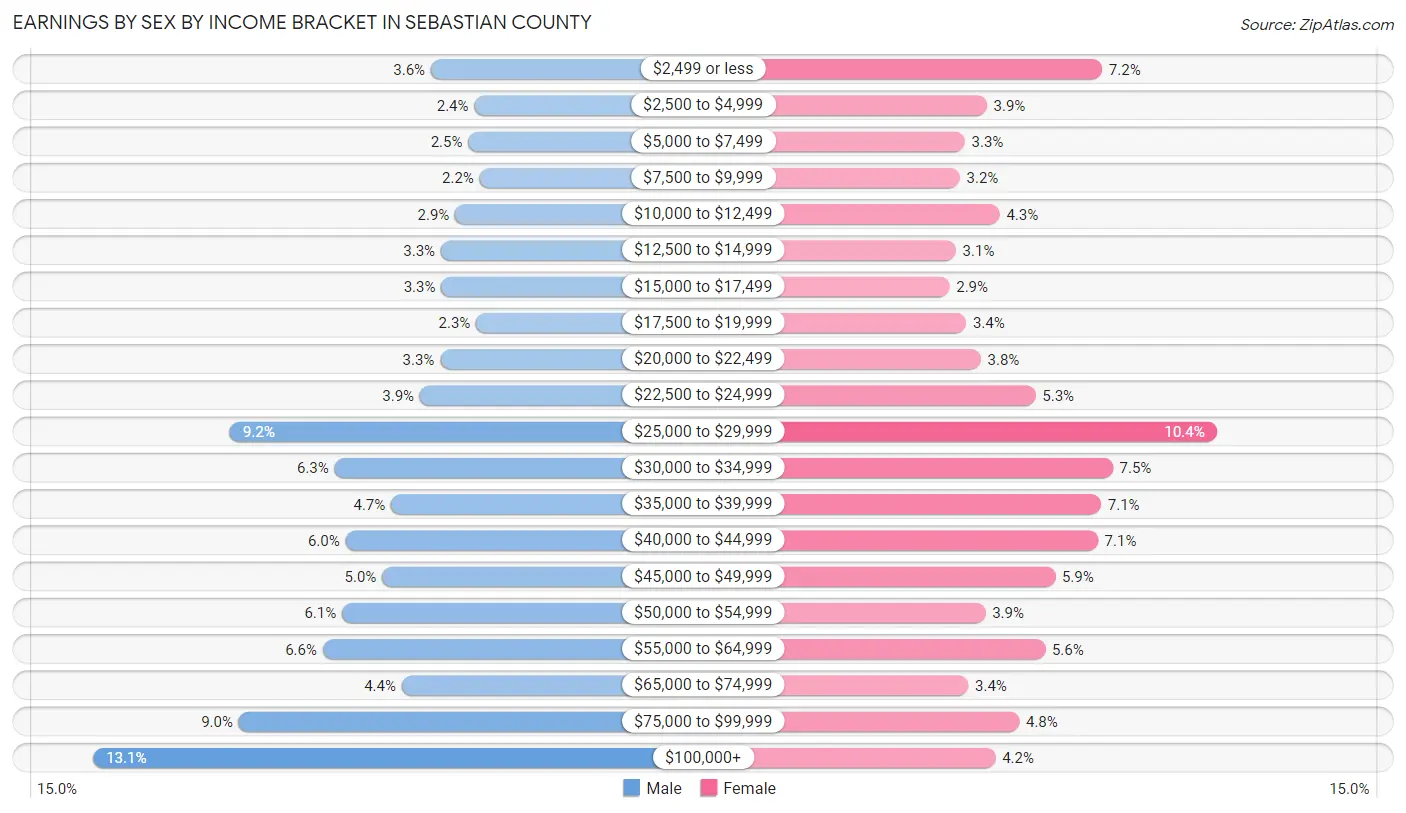
| Income | Male | Female |
| $2,499 or less | 1,206 (3.6%) | 2,175 (7.2%) |
| $2,500 to $4,999 | 794 (2.4%) | 1,191 (3.9%) |
| $5,000 to $7,499 | 854 (2.5%) | 1,003 (3.3%) |
| $7,500 to $9,999 | 744 (2.2%) | 961 (3.2%) |
| $10,000 to $12,499 | 978 (2.9%) | 1,301 (4.3%) |
| $12,500 to $14,999 | 1,111 (3.3%) | 928 (3.1%) |
| $15,000 to $17,499 | 1,109 (3.3%) | 873 (2.9%) |
| $17,500 to $19,999 | 779 (2.3%) | 1,016 (3.4%) |
| $20,000 to $22,499 | 1,120 (3.3%) | 1,141 (3.8%) |
| $22,500 to $24,999 | 1,313 (3.9%) | 1,607 (5.3%) |
| $25,000 to $29,999 | 3,112 (9.2%) | 3,150 (10.4%) |
| $30,000 to $34,999 | 2,121 (6.3%) | 2,263 (7.5%) |
| $35,000 to $39,999 | 1,584 (4.7%) | 2,165 (7.1%) |
| $40,000 to $44,999 | 2,016 (6.0%) | 2,138 (7.0%) |
| $45,000 to $49,999 | 1,669 (5.0%) | 1,773 (5.9%) |
| $50,000 to $54,999 | 2,051 (6.1%) | 1,178 (3.9%) |
| $55,000 to $64,999 | 2,231 (6.6%) | 1,687 (5.6%) |
| $65,000 to $74,999 | 1,484 (4.4%) | 1,034 (3.4%) |
| $75,000 to $99,999 | 3,027 (9.0%) | 1,466 (4.8%) |
| $100,000+ | 4,407 (13.1%) | 1,264 (4.2%) |
| Total | 33,710 (100.0%) | 30,314 (100.0%) |
Earnings by Sex by Educational Attainment in Sebastian County
Average earnings in Sebastian County are $45,623 for men and $33,320 for women, a difference of 27.0%. Men with an educational attainment of graduate degree enjoy the highest average annual earnings of $86,661, while those with less than high school education earn the least with $35,119. Women with an educational attainment of graduate degree earn the most with the average annual earnings of $57,602, while those with less than high school education have the smallest earnings of $24,849.
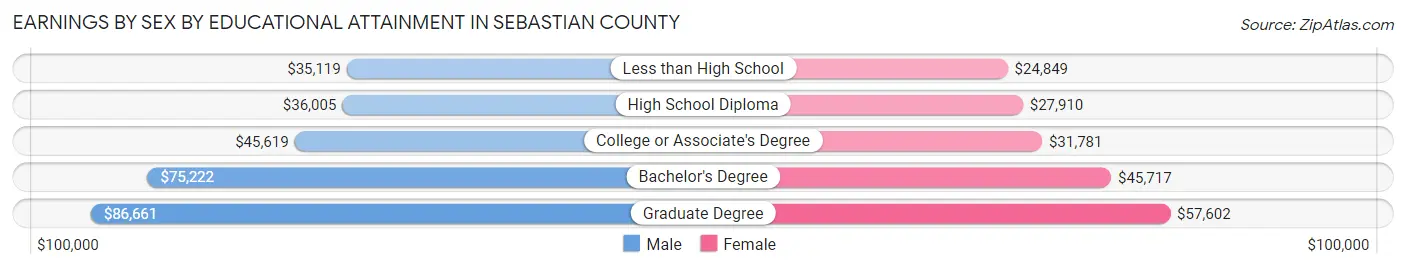
| Educational Attainment | Male Income | Female Income |
| Less than High School | $35,119 | $24,849 |
| High School Diploma | $36,005 | $27,910 |
| College or Associate's Degree | $45,619 | $31,781 |
| Bachelor's Degree | $75,222 | $45,717 |
| Graduate Degree | $86,661 | $57,602 |
| Total | $45,623 | $33,320 |
Family Income in Sebastian County
Family Income Brackets in Sebastian County
According to the Sebastian County family income data, there are 6,609 families falling into the $50,000 to $74,999 income range, which is the most common income bracket and makes up 19.6% of all families. Conversely, the $10,000 to $14,999 income bracket is the least frequent group with only 641 families (1.9%) belonging to this category.
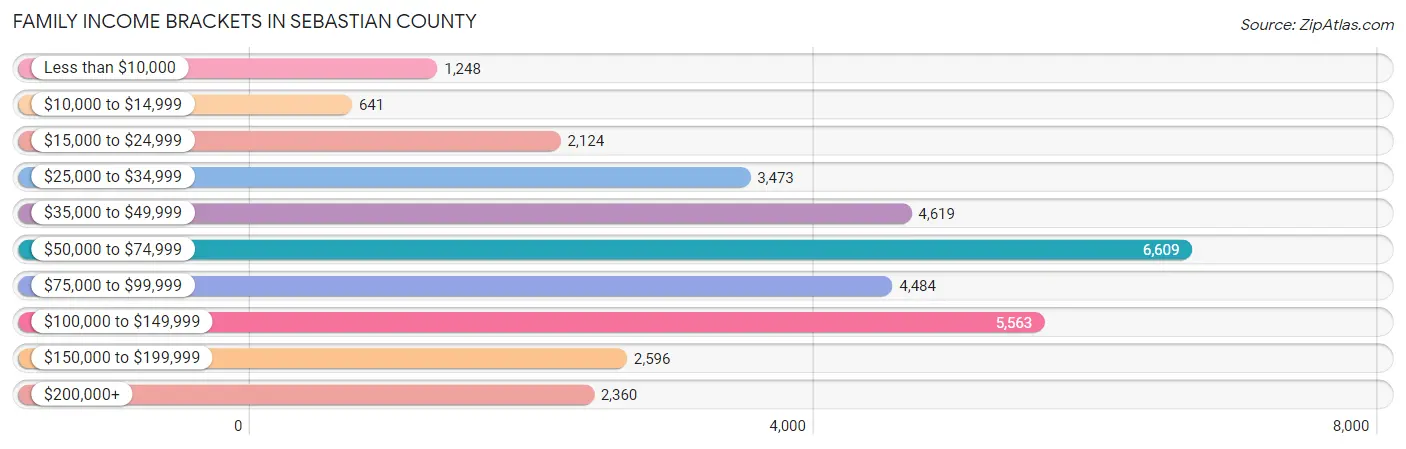
| Income Bracket | # Families | % Families |
| Less than $10,000 | 1,248 | 3.7% |
| $10,000 to $14,999 | 641 | 1.9% |
| $15,000 to $24,999 | 2,124 | 6.3% |
| $25,000 to $34,999 | 3,473 | 10.3% |
| $35,000 to $49,999 | 4,619 | 13.7% |
| $50,000 to $74,999 | 6,609 | 19.6% |
| $75,000 to $99,999 | 4,484 | 13.3% |
| $100,000 to $149,999 | 5,563 | 16.5% |
| $150,000 to $199,999 | 2,596 | 7.7% |
| $200,000+ | 2,360 | 7.0% |
Family Income by Famaliy Size in Sebastian County
7+ person families (472 | 1.4%) account for the highest median family income in Sebastian County with $87,692 per family, while 2-person families (16,218 | 48.1%) have the highest median income of $31,570 per family member.
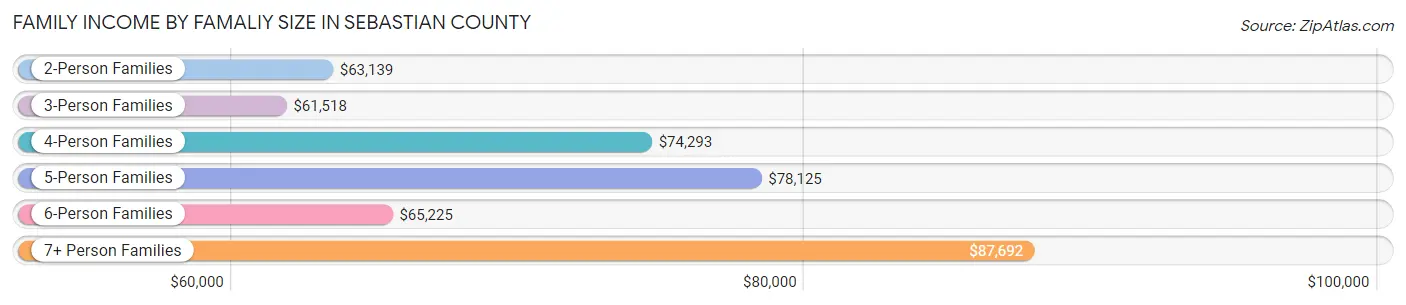
| Income Bracket | # Families | Median Income |
| 2-Person Families | 16,218 (48.1%) | $63,139 |
| 3-Person Families | 7,361 (21.8%) | $61,518 |
| 4-Person Families | 5,597 (16.6%) | $74,293 |
| 5-Person Families | 2,939 (8.7%) | $78,125 |
| 6-Person Families | 1,131 (3.4%) | $65,225 |
| 7+ Person Families | 472 (1.4%) | $87,692 |
| Total | 33,718 (100.0%) | $67,102 |
Family Income by Number of Earners in Sebastian County
The median family income in Sebastian County is $67,102, with families comprising 3+ earners (2,731) having the highest median family income of $117,909, while families with no earners (5,337) have the lowest median family income of $38,562, accounting for 8.1% and 15.8% of families, respectively.
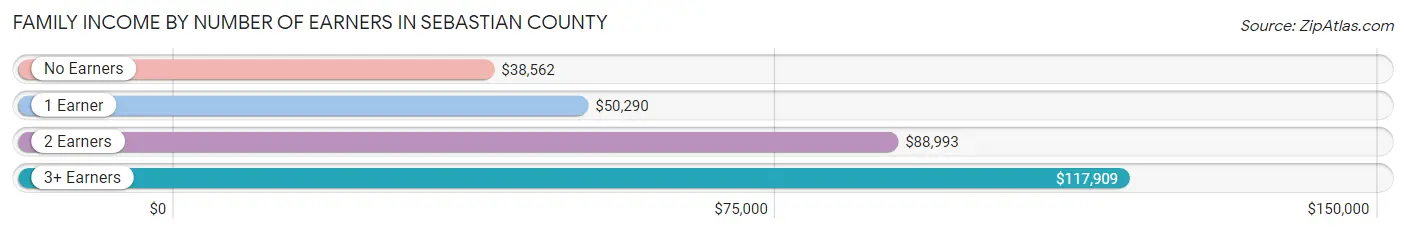
| Number of Earners | # Families | Median Income |
| No Earners | 5,337 (15.8%) | $38,562 |
| 1 Earner | 11,602 (34.4%) | $50,290 |
| 2 Earners | 14,048 (41.7%) | $88,993 |
| 3+ Earners | 2,731 (8.1%) | $117,909 |
| Total | 33,718 (100.0%) | $67,102 |
Household Income in Sebastian County
Household Income Brackets in Sebastian County
With 9,439 households falling in the category, the $50,000 to $74,999 income range is the most frequent in Sebastian County, accounting for 18.2% of all households. In contrast, only 2,593 households (5.0%) fall into the $200,000+ income bracket, making it the least populous group.
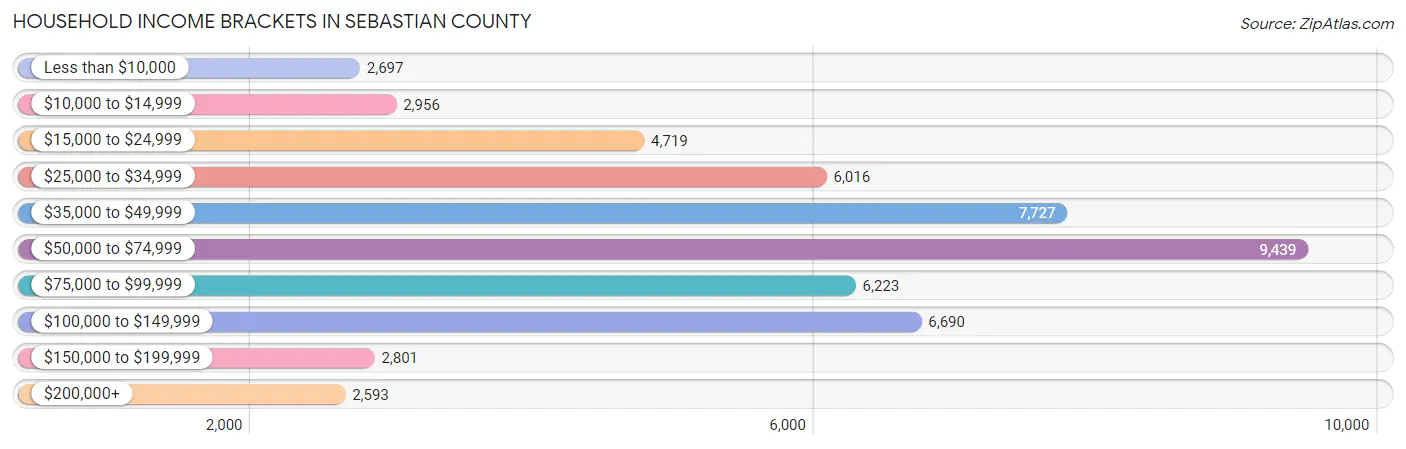
| Income Bracket | # Households | % Households |
| Less than $10,000 | 2,697 | 5.2% |
| $10,000 to $14,999 | 2,956 | 5.7% |
| $15,000 to $24,999 | 4,719 | 9.1% |
| $25,000 to $34,999 | 6,016 | 11.6% |
| $35,000 to $49,999 | 7,727 | 14.9% |
| $50,000 to $74,999 | 9,439 | 18.2% |
| $75,000 to $99,999 | 6,223 | 12.0% |
| $100,000 to $149,999 | 6,690 | 12.9% |
| $150,000 to $199,999 | 2,801 | 5.4% |
| $200,000+ | 2,593 | 5.0% |
Household Income by Householder Age in Sebastian County
The median household income in Sebastian County is $54,047, with the highest median household income of $66,132 found in the 45 to 64 years age bracket for the primary householder. A total of 18,401 households (35.5%) fall into this category. Meanwhile, the 15 to 24 years age bracket for the primary householder has the lowest median household income of $38,142, with 3,252 households (6.3%) in this group.
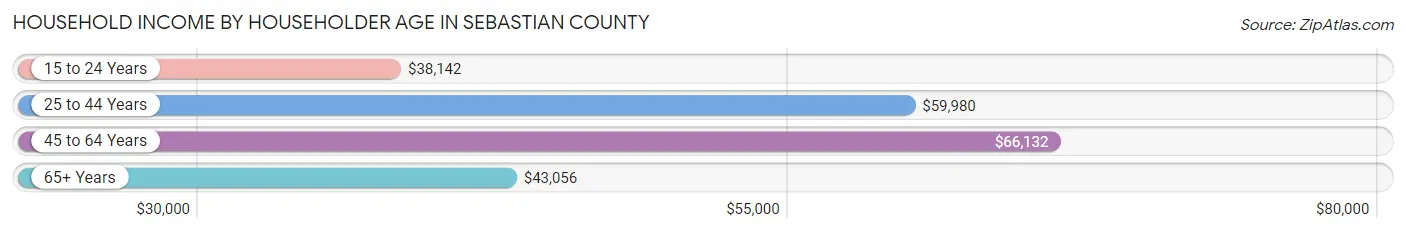
| Income Bracket | # Households | Median Income |
| 15 to 24 Years | 3,252 (6.3%) | $38,142 |
| 25 to 44 Years | 16,454 (31.7%) | $59,980 |
| 45 to 64 Years | 18,401 (35.5%) | $66,132 |
| 65+ Years | 13,755 (26.5%) | $43,056 |
| Total | 51,862 (100.0%) | $54,047 |
Poverty in Sebastian County
Income Below Poverty by Sex and Age in Sebastian County
With 15.1% poverty level for males and 17.8% for females among the residents of Sebastian County, 5 year old males and 5 year old females are the most vulnerable to poverty, with 236 males (29.7%) and 236 females (27.8%) in their respective age groups living below the poverty level.
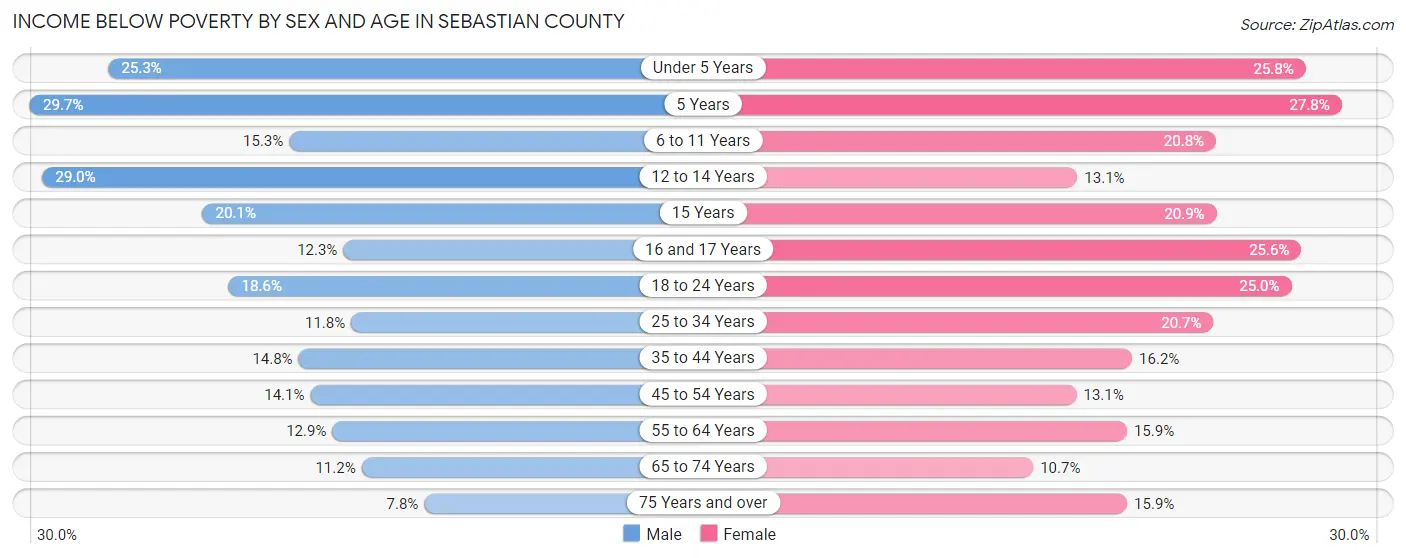
| Age Bracket | Male | Female |
| Under 5 Years | 1,031 (25.3%) | 980 (25.8%) |
| 5 Years | 236 (29.7%) | 236 (27.8%) |
| 6 to 11 Years | 842 (15.3%) | 1,023 (20.8%) |
| 12 to 14 Years | 627 (29.0%) | 332 (13.1%) |
| 15 Years | 176 (20.1%) | 155 (20.9%) |
| 16 and 17 Years | 213 (12.3%) | 487 (25.6%) |
| 18 to 24 Years | 1,089 (18.6%) | 1,377 (25.0%) |
| 25 to 34 Years | 991 (11.8%) | 1,748 (20.7%) |
| 35 to 44 Years | 1,149 (14.7%) | 1,288 (16.2%) |
| 45 to 54 Years | 1,107 (14.1%) | 1,006 (13.1%) |
| 55 to 64 Years | 1,039 (12.9%) | 1,303 (15.9%) |
| 65 to 74 Years | 645 (11.2%) | 693 (10.7%) |
| 75 Years and over | 252 (7.7%) | 793 (15.9%) |
| Total | 9,397 (15.1%) | 11,421 (17.8%) |
Income Above Poverty by Sex and Age in Sebastian County
According to the poverty statistics in Sebastian County, males aged 75 years and over and females aged 65 to 74 years are the age groups that are most secure financially, with 92.2% of males and 89.3% of females in these age groups living above the poverty line.
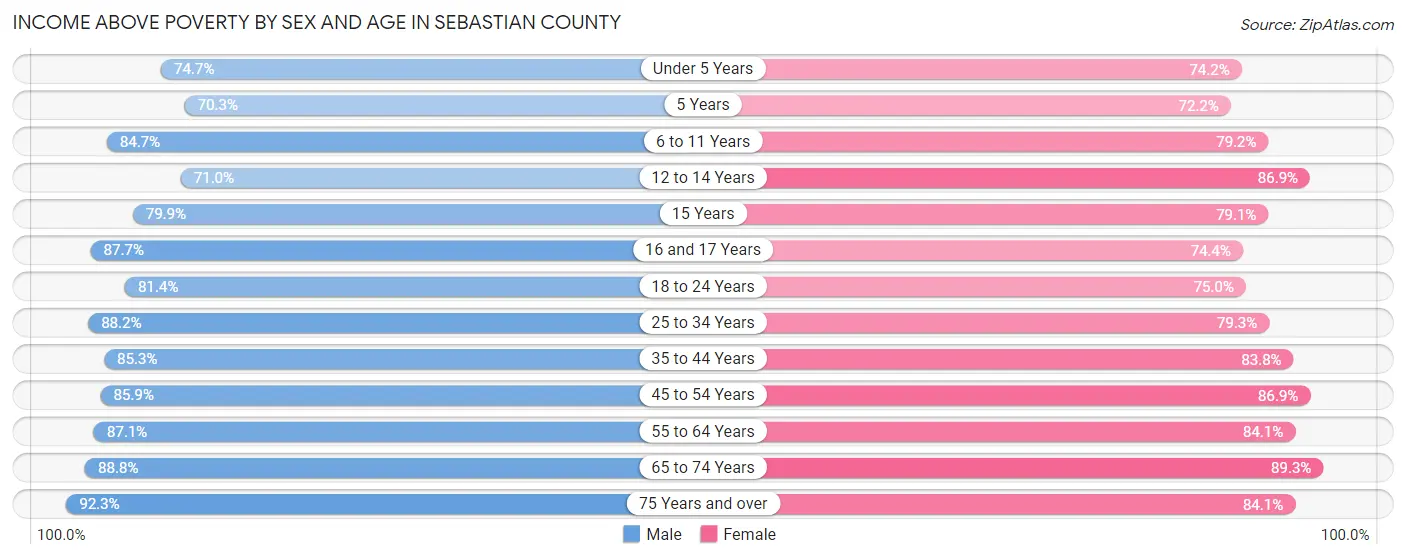
| Age Bracket | Male | Female |
| Under 5 Years | 3,040 (74.7%) | 2,815 (74.2%) |
| 5 Years | 559 (70.3%) | 612 (72.2%) |
| 6 to 11 Years | 4,671 (84.7%) | 3,888 (79.2%) |
| 12 to 14 Years | 1,534 (71.0%) | 2,198 (86.9%) |
| 15 Years | 700 (79.9%) | 588 (79.1%) |
| 16 and 17 Years | 1,525 (87.7%) | 1,417 (74.4%) |
| 18 to 24 Years | 4,752 (81.4%) | 4,124 (75.0%) |
| 25 to 34 Years | 7,394 (88.2%) | 6,701 (79.3%) |
| 35 to 44 Years | 6,643 (85.3%) | 6,675 (83.8%) |
| 45 to 54 Years | 6,749 (85.9%) | 6,691 (86.9%) |
| 55 to 64 Years | 7,035 (87.1%) | 6,900 (84.1%) |
| 65 to 74 Years | 5,095 (88.8%) | 5,810 (89.3%) |
| 75 Years and over | 2,999 (92.2%) | 4,199 (84.1%) |
| Total | 52,696 (84.9%) | 52,618 (82.2%) |
Income Below Poverty Among Married-Couple Families in Sebastian County
The poverty statistics for married-couple families in Sebastian County show that 5.7% or 1,351 of the total 23,869 families live below the poverty line. Families with 3 or 4 children have the highest poverty rate of 16.0%, comprising of 362 families. On the other hand, families with no children have the lowest poverty rate of 3.5%, which includes 481 families.
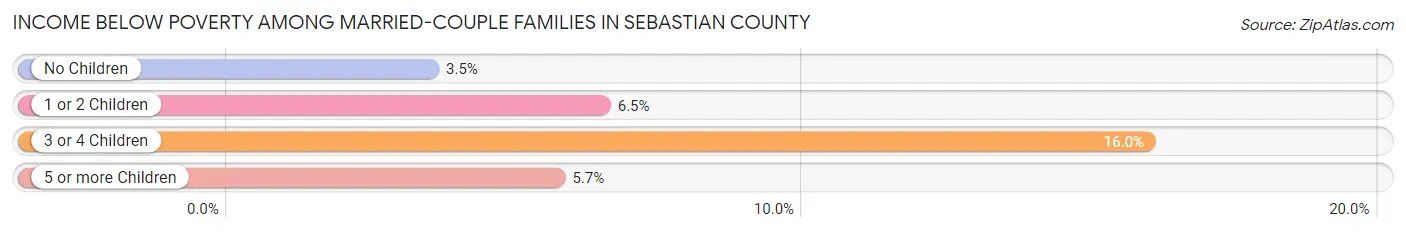
| Children | Above Poverty | Below Poverty |
| No Children | 13,278 (96.5%) | 481 (3.5%) |
| 1 or 2 Children | 7,187 (93.5%) | 499 (6.5%) |
| 3 or 4 Children | 1,904 (84.0%) | 362 (16.0%) |
| 5 or more Children | 149 (94.3%) | 9 (5.7%) |
| Total | 22,518 (94.3%) | 1,351 (5.7%) |
Income Below Poverty Among Single-Parent Households in Sebastian County
According to the poverty data in Sebastian County, 12.1% or 294 single-father households and 28.8% or 2,137 single-mother households are living below the poverty line. Among single-father households, those with 3 or 4 children have the highest poverty rate, with 32 households (17.5%) experiencing poverty. Likewise, among single-mother households, those with 3 or 4 children have the highest poverty rate, with 716 households (65.4%) falling below the poverty line.
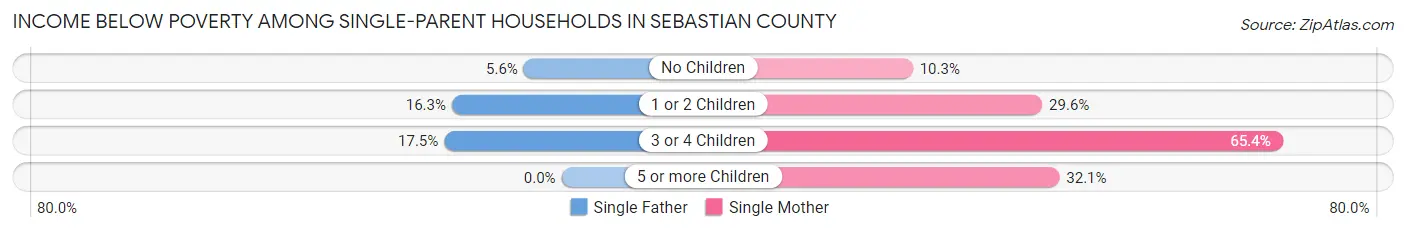
| Children | Single Father | Single Mother |
| No Children | 56 (5.6%) | 239 (10.3%) |
| 1 or 2 Children | 206 (16.3%) | 1,173 (29.6%) |
| 3 or 4 Children | 32 (17.5%) | 716 (65.4%) |
| 5 or more Children | 0 (0.0%) | 9 (32.1%) |
| Total | 294 (12.1%) | 2,137 (28.8%) |
Income Below Poverty Among Married-Couple vs Single-Parent Households in Sebastian County
The poverty data for Sebastian County shows that 1,351 of the married-couple family households (5.7%) and 2,431 of the single-parent households (24.7%) are living below the poverty level. Within the married-couple family households, those with 3 or 4 children have the highest poverty rate, with 362 households (16.0%) falling below the poverty line. Among the single-parent households, those with 3 or 4 children have the highest poverty rate, with 748 household (58.5%) living below poverty.
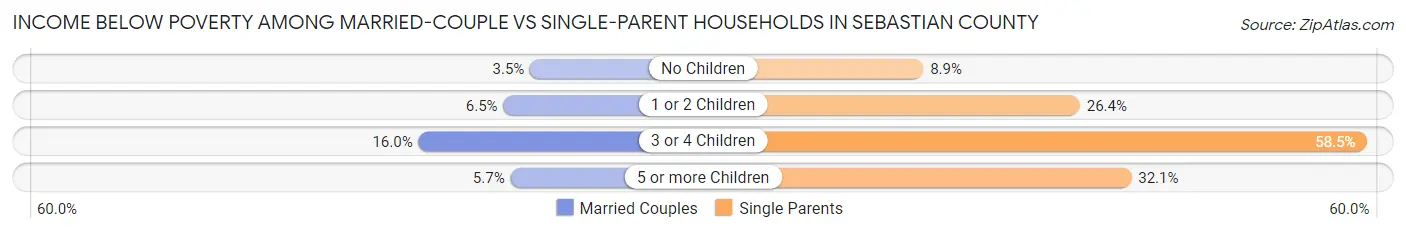
| Children | Married-Couple Families | Single-Parent Households |
| No Children | 481 (3.5%) | 295 (8.9%) |
| 1 or 2 Children | 499 (6.5%) | 1,379 (26.4%) |
| 3 or 4 Children | 362 (16.0%) | 748 (58.5%) |
| 5 or more Children | 9 (5.7%) | 9 (32.1%) |
| Total | 1,351 (5.7%) | 2,431 (24.7%) |
Race in Sebastian County
The most populous races in Sebastian County are White / Caucasian (90,210 | 70.4%), Hispanic or Latino (19,387 | 15.1%), and Some other Race (12,162 | 9.5%).
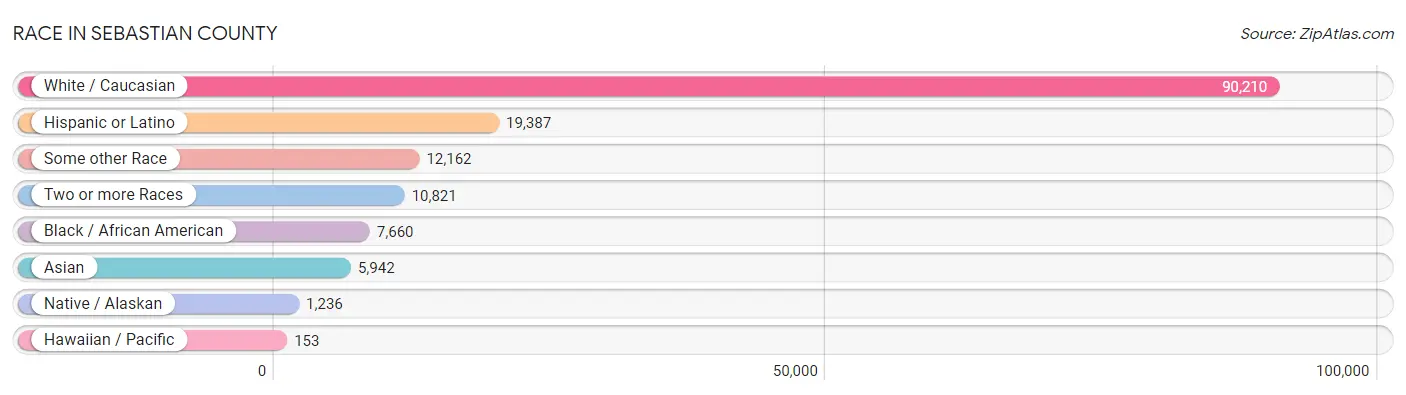
| Race | # Population | % Population |
| Asian | 5,942 | 4.6% |
| Black / African American | 7,660 | 6.0% |
| Hawaiian / Pacific | 153 | 0.1% |
| Hispanic or Latino | 19,387 | 15.1% |
| Native / Alaskan | 1,236 | 1.0% |
| White / Caucasian | 90,210 | 70.4% |
| Two or more Races | 10,821 | 8.4% |
| Some other Race | 12,162 | 9.5% |
| Total | 128,184 | 100.0% |
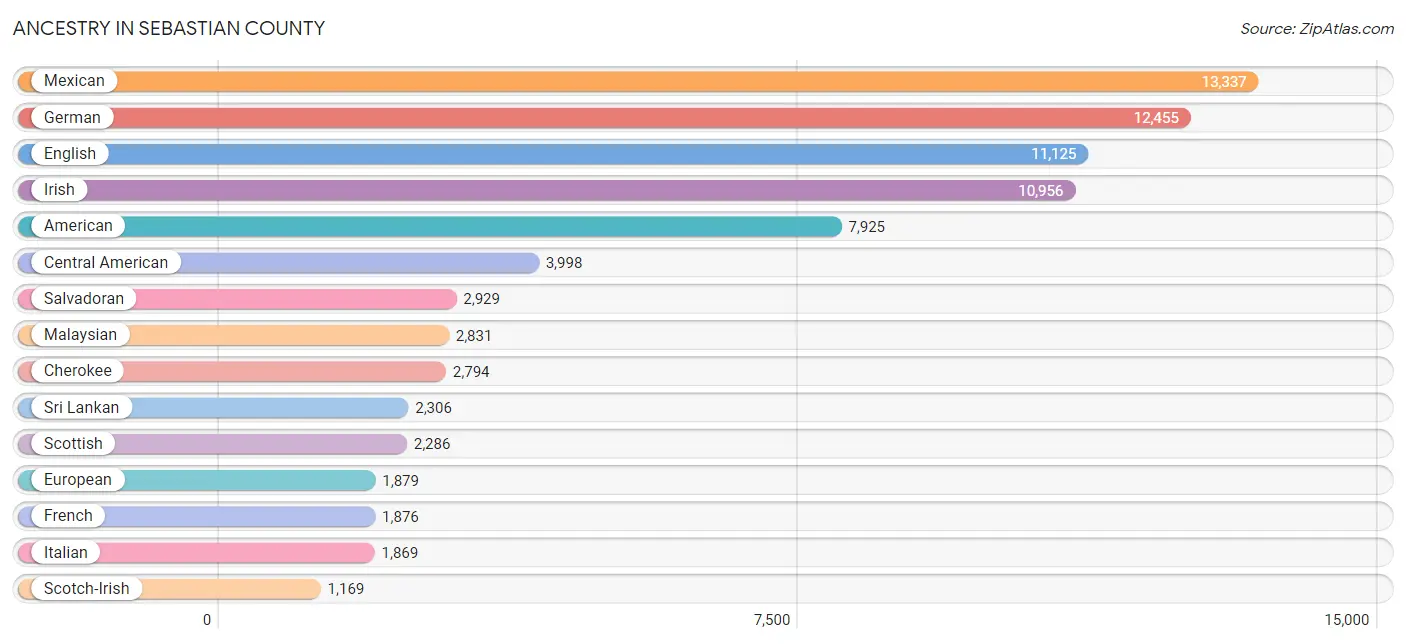
Ancestry in Sebastian County
The most populous ancestries reported in Sebastian County are Mexican (13,337 | 10.4%), German (12,455 | 9.7%), English (11,125 | 8.7%), Irish (10,956 | 8.6%), and American (7,925 | 6.2%), together accounting for 43.5% of all Sebastian County residents.
| Ancestry | # Population | % Population |
| African | 214 | 0.2% |
| Alaska Native | 12 | 0.0% |
| Albanian | 5 | 0.0% |
| American | 7,925 | 6.2% |
| Apache | 45 | 0.0% |
| Arab | 260 | 0.2% |
| Arapaho | 2 | 0.0% |
| Austrian | 139 | 0.1% |
| Bangladeshi | 221 | 0.2% |
| Belizean | 70 | 0.1% |
| Bhutanese | 192 | 0.2% |
| Blackfeet | 141 | 0.1% |
| Brazilian | 59 | 0.1% |
| British | 829 | 0.6% |
| Burmese | 185 | 0.1% |
| Cajun | 24 | 0.0% |
| Canadian | 89 | 0.1% |
| Celtic | 72 | 0.1% |
| Central American | 3,998 | 3.1% |
| Central American Indian | 46 | 0.0% |
| Cherokee | 2,794 | 2.2% |
| Cheyenne | 15 | 0.0% |
| Chickasaw | 41 | 0.0% |
| Choctaw | 1,121 | 0.9% |
| Colombian | 69 | 0.1% |
| Comanche | 5 | 0.0% |
| Costa Rican | 270 | 0.2% |
| Creek | 65 | 0.1% |
| Cuban | 108 | 0.1% |
| Czech | 290 | 0.2% |
| Czechoslovakian | 34 | 0.0% |
| Danish | 54 | 0.0% |
| Delaware | 8 | 0.0% |
| Dominican | 73 | 0.1% |
| Dutch | 1,045 | 0.8% |
| Dutch West Indian | 185 | 0.1% |
| Eastern European | 339 | 0.3% |
| Ecuadorian | 21 | 0.0% |
| English | 11,125 | 8.7% |
| European | 1,879 | 1.5% |
| Fijian | 142 | 0.1% |
| Finnish | 98 | 0.1% |
| French | 1,876 | 1.5% |
| French Canadian | 230 | 0.2% |
| German | 12,455 | 9.7% |
| Greek | 49 | 0.0% |
| Guatemalan | 525 | 0.4% |
| Honduran | 269 | 0.2% |
| Houma | 15 | 0.0% |
| Hungarian | 342 | 0.3% |
| Indian (Asian) | 353 | 0.3% |
| Irish | 10,956 | 8.6% |
| Iroquois | 7 | 0.0% |
| Israeli | 34 | 0.0% |
| Italian | 1,869 | 1.5% |
| Jordanian | 11 | 0.0% |
| Korean | 576 | 0.4% |
| Laotian | 25 | 0.0% |
| Lebanese | 29 | 0.0% |
| Lithuanian | 12 | 0.0% |
| Malaysian | 2,831 | 2.2% |
| Mexican | 13,337 | 10.4% |
| Mexican American Indian | 135 | 0.1% |
| Native Hawaiian | 40 | 0.0% |
| Navajo | 10 | 0.0% |
| Northern European | 111 | 0.1% |
| Norwegian | 409 | 0.3% |
| Osage | 12 | 0.0% |
| Ottawa | 18 | 0.0% |
| Paiute | 31 | 0.0% |
| Pakistani | 145 | 0.1% |
| Palestinian | 28 | 0.0% |
| Panamanian | 5 | 0.0% |
| Pennsylvania German | 101 | 0.1% |
| Peruvian | 15 | 0.0% |
| Polish | 619 | 0.5% |
| Portuguese | 83 | 0.1% |
| Potawatomi | 68 | 0.1% |
| Pueblo | 10 | 0.0% |
| Puerto Rican | 468 | 0.4% |
| Romanian | 247 | 0.2% |
| Russian | 141 | 0.1% |
| Salvadoran | 2,929 | 2.3% |
| Samoan | 58 | 0.1% |
| Scandinavian | 296 | 0.2% |
| Scotch-Irish | 1,169 | 0.9% |
| Scottish | 2,286 | 1.8% |
| Seminole | 98 | 0.1% |
| Serbian | 27 | 0.0% |
| Shoshone | 2 | 0.0% |
| Sioux | 76 | 0.1% |
| Slavic | 10 | 0.0% |
| Slovak | 13 | 0.0% |
| South African | 124 | 0.1% |
| South American | 118 | 0.1% |
| Spaniard | 397 | 0.3% |
| Spanish | 102 | 0.1% |
| Sri Lankan | 2,306 | 1.8% |
| Subsaharan African | 341 | 0.3% |
| Swedish | 885 | 0.7% |
| Swiss | 211 | 0.2% |
| Syrian | 64 | 0.1% |
| Thai | 156 | 0.1% |
| Tlingit-Haida | 5 | 0.0% |
| Venezuelan | 13 | 0.0% |
| Welsh | 941 | 0.7% | View All 106 Rows |
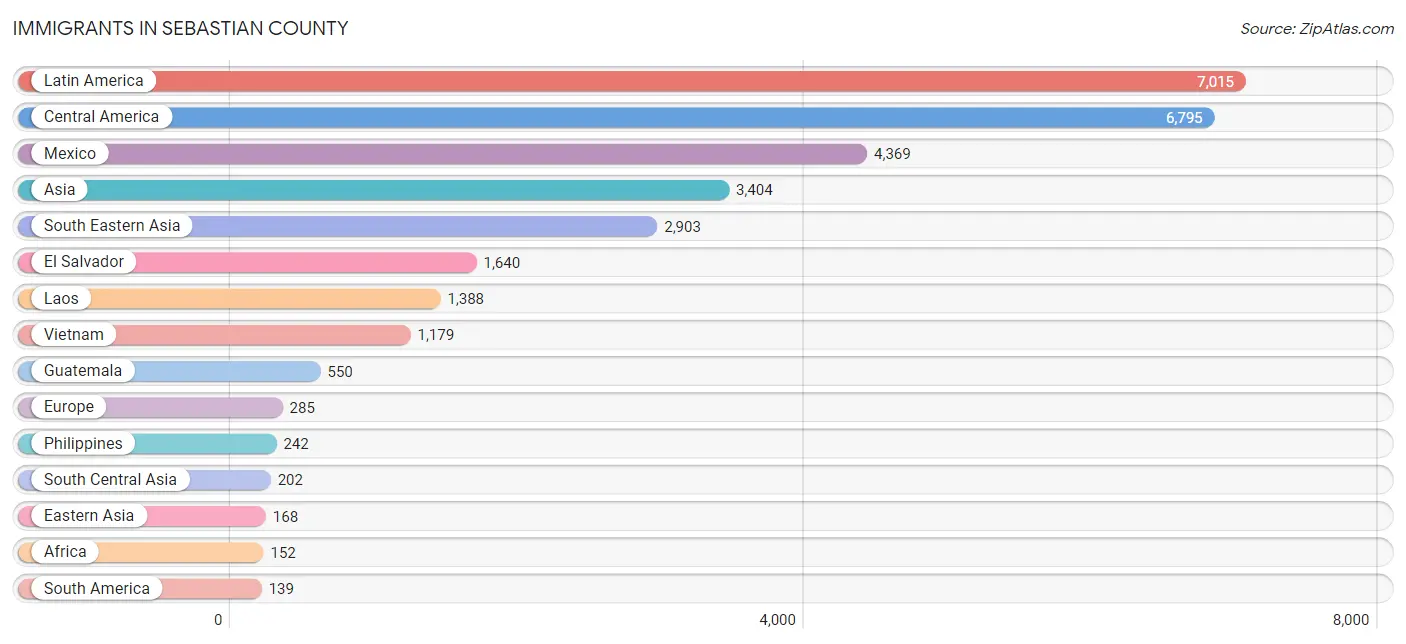
Immigrants in Sebastian County
The most numerous immigrant groups reported in Sebastian County came from Latin America (7,015 | 5.5%), Central America (6,795 | 5.3%), Mexico (4,369 | 3.4%), Asia (3,404 | 2.7%), and South Eastern Asia (2,903 | 2.3%), together accounting for 19.1% of all Sebastian County residents.
| Immigration Origin | # Population | % Population |
| Africa | 152 | 0.1% |
| Asia | 3,404 | 2.7% |
| Australia | 14 | 0.0% |
| Brazil | 64 | 0.1% |
| Canada | 82 | 0.1% |
| Caribbean | 81 | 0.1% |
| Central America | 6,795 | 5.3% |
| China | 79 | 0.1% |
| Colombia | 35 | 0.0% |
| Costa Rica | 136 | 0.1% |
| Cuba | 58 | 0.1% |
| Dominican Republic | 23 | 0.0% |
| Eastern Africa | 8 | 0.0% |
| Eastern Asia | 168 | 0.1% |
| Eastern Europe | 67 | 0.1% |
| Ecuador | 21 | 0.0% |
| El Salvador | 1,640 | 1.3% |
| England | 13 | 0.0% |
| Europe | 285 | 0.2% |
| France | 18 | 0.0% |
| Germany | 40 | 0.0% |
| Guatemala | 550 | 0.4% |
| Honduras | 95 | 0.1% |
| Hungary | 15 | 0.0% |
| India | 130 | 0.1% |
| Italy | 45 | 0.0% |
| Japan | 36 | 0.0% |
| Jordan | 66 | 0.1% |
| Korea | 53 | 0.0% |
| Laos | 1,388 | 1.1% |
| Latin America | 7,015 | 5.5% |
| Malaysia | 7 | 0.0% |
| Mexico | 4,369 | 3.4% |
| Netherlands | 25 | 0.0% |
| Northern Africa | 20 | 0.0% |
| Northern Europe | 54 | 0.0% |
| Oceania | 127 | 0.1% |
| Pakistan | 72 | 0.1% |
| Panama | 5 | 0.0% |
| Peru | 6 | 0.0% |
| Philippines | 242 | 0.2% |
| Poland | 34 | 0.0% |
| Russia | 13 | 0.0% |
| Saudi Arabia | 65 | 0.1% |
| Scotland | 6 | 0.0% |
| South Africa | 124 | 0.1% |
| South America | 139 | 0.1% |
| South Central Asia | 202 | 0.2% |
| South Eastern Asia | 2,903 | 2.3% |
| Southern Europe | 75 | 0.1% |
| Spain | 30 | 0.0% |
| Sweden | 11 | 0.0% |
| Taiwan | 11 | 0.0% |
| Thailand | 87 | 0.1% |
| Venezuela | 13 | 0.0% |
| Vietnam | 1,179 | 0.9% |
| Western Asia | 131 | 0.1% |
| Western Europe | 83 | 0.1% | View All 58 Rows |
Sex and Age in Sebastian County
Sex and Age in Sebastian County
The most populous age groups in Sebastian County are 5 to 9 Years (4,774 | 7.6%) for men and 10 to 14 Years (4,547 | 7.0%) for women.
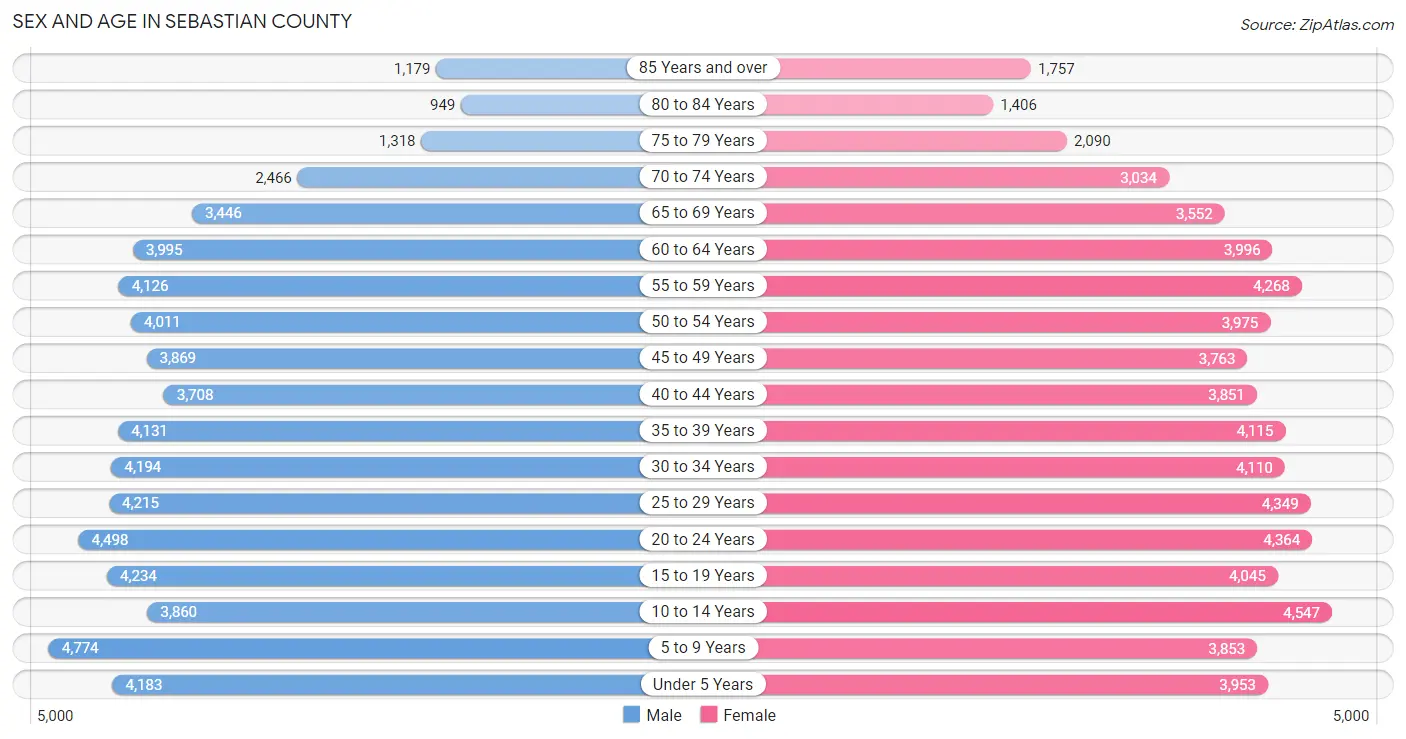
| Age Bracket | Male | Female |
| Under 5 Years | 4,183 (6.6%) | 3,953 (6.1%) |
| 5 to 9 Years | 4,774 (7.6%) | 3,853 (5.9%) |
| 10 to 14 Years | 3,860 (6.1%) | 4,547 (7.0%) |
| 15 to 19 Years | 4,234 (6.7%) | 4,045 (6.2%) |
| 20 to 24 Years | 4,498 (7.1%) | 4,364 (6.7%) |
| 25 to 29 Years | 4,215 (6.7%) | 4,349 (6.7%) |
| 30 to 34 Years | 4,194 (6.6%) | 4,110 (6.3%) |
| 35 to 39 Years | 4,131 (6.5%) | 4,115 (6.3%) |
| 40 to 44 Years | 3,708 (5.9%) | 3,851 (5.9%) |
| 45 to 49 Years | 3,869 (6.1%) | 3,763 (5.8%) |
| 50 to 54 Years | 4,011 (6.4%) | 3,975 (6.1%) |
| 55 to 59 Years | 4,126 (6.5%) | 4,268 (6.6%) |
| 60 to 64 Years | 3,995 (6.3%) | 3,996 (6.1%) |
| 65 to 69 Years | 3,446 (5.5%) | 3,552 (5.5%) |
| 70 to 74 Years | 2,466 (3.9%) | 3,034 (4.7%) |
| 75 to 79 Years | 1,318 (2.1%) | 2,090 (3.2%) |
| 80 to 84 Years | 949 (1.5%) | 1,406 (2.2%) |
| 85 Years and over | 1,179 (1.9%) | 1,757 (2.7%) |
| Total | 63,156 (100.0%) | 65,028 (100.0%) |
Families and Households in Sebastian County
Median Family Size in Sebastian County
The median family size in Sebastian County is 2.98 persons per family, with married-couple families (23,869 | 70.8%) accounting for the largest median family size of 3.07 persons per family. On the other hand, single male/father families (2,438 | 7.2%) represent the smallest median family size with 2.68 persons per family.
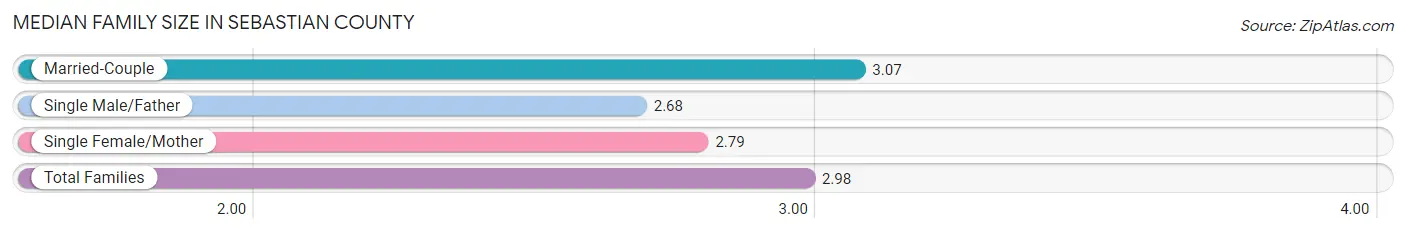
| Family Type | # Families | Family Size |
| Married-Couple | 23,869 (70.8%) | 3.07 |
| Single Male/Father | 2,438 (7.2%) | 2.68 |
| Single Female/Mother | 7,411 (22.0%) | 2.79 |
| Total Families | 33,718 (100.0%) | 2.98 |
Median Household Size in Sebastian County
The median household size in Sebastian County is 2.43 persons per household, with married-couple households (23,869 | 46.0%) accounting for the largest median household size of 3.09 persons per household. non-family households (18,144 | 35.0%) represent the smallest median household size with 1.23 persons per household.
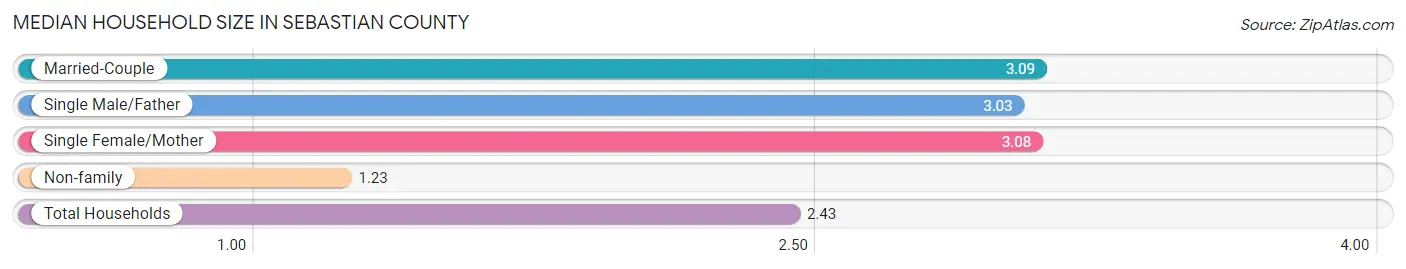
| Household Type | # Households | Household Size |
| Married-Couple | 23,869 (46.0%) | 3.09 |
| Single Male/Father | 2,438 (4.7%) | 3.03 |
| Single Female/Mother | 7,411 (14.3%) | 3.08 |
| Non-family | 18,144 (35.0%) | 1.23 |
| Total Households | 51,862 (100.0%) | 2.43 |
Household Size by Marriage Status in Sebastian County
Out of a total of 51,862 households in Sebastian County, 33,718 (65.0%) are family households, while 18,144 (35.0%) are nonfamily households. The most numerous type of family households are 2-person households, comprising 15,150, and the most common type of nonfamily households are 1-person households, comprising 14,769.
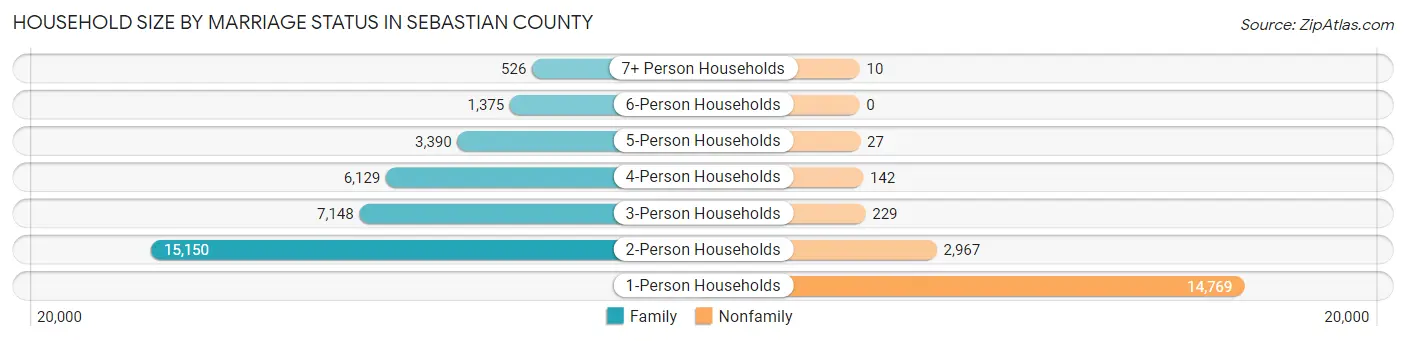
| Household Size | Family Households | Nonfamily Households |
| 1-Person Households | - | 14,769 (28.5%) |
| 2-Person Households | 15,150 (29.2%) | 2,967 (5.7%) |
| 3-Person Households | 7,148 (13.8%) | 229 (0.4%) |
| 4-Person Households | 6,129 (11.8%) | 142 (0.3%) |
| 5-Person Households | 3,390 (6.5%) | 27 (0.1%) |
| 6-Person Households | 1,375 (2.6%) | 0 (0.0%) |
| 7+ Person Households | 526 (1.0%) | 10 (0.0%) |
| Total | 33,718 (65.0%) | 18,144 (35.0%) |
Female Fertility in Sebastian County
Fertility by Age in Sebastian County
Average fertility rate in Sebastian County is 65.0 births per 1,000 women. Women in the age bracket of 20 to 34 years have the highest fertility rate with 124.0 births per 1,000 women. Women in the age bracket of 20 to 34 years acount for 82.4% of all women with births.
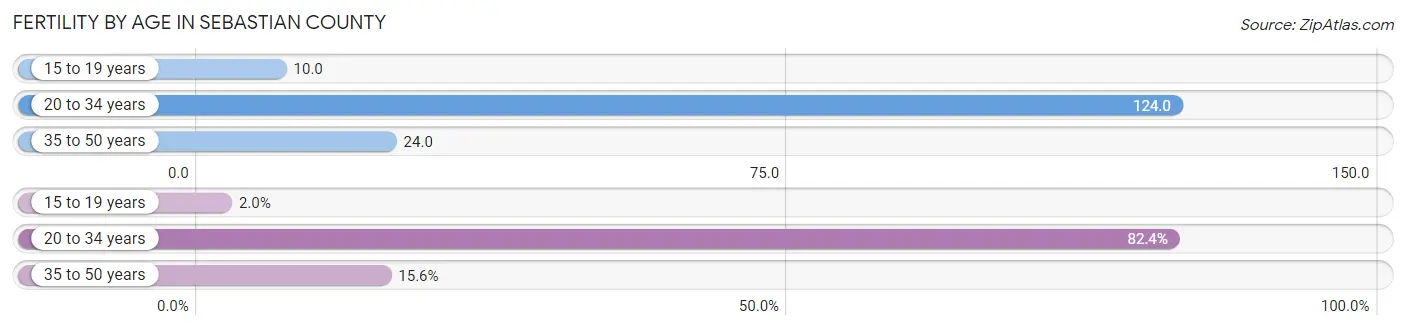
| Age Bracket | Women with Births | Births / 1,000 Women |
| 15 to 19 years | 39 (2.0%) | 10.0 |
| 20 to 34 years | 1,585 (82.4%) | 124.0 |
| 35 to 50 years | 299 (15.5%) | 24.0 |
| Total | 1,923 (100.0%) | 65.0 |
Fertility by Age by Marriage Status in Sebastian County
52.1% of women with births (1,923) in Sebastian County are married. The highest percentage of unmarried women with births falls into 35 to 50 years age bracket with 62.2% of them unmarried at the time of birth, while the lowest percentage of unmarried women with births belong to 15 to 19 years age bracket with 41.0% of them unmarried.
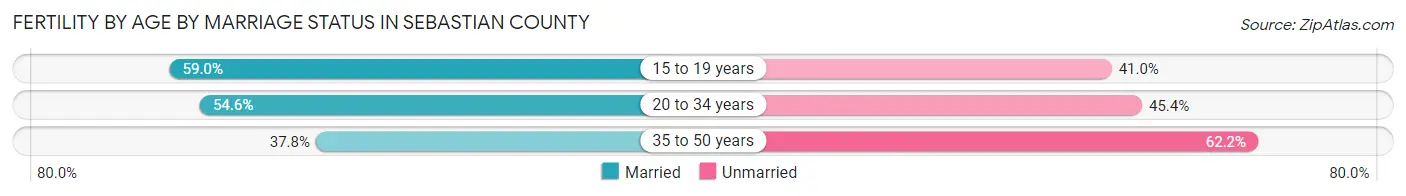
| Age Bracket | Married | Unmarried |
| 15 to 19 years | 23 (59.0%) | 16 (41.0%) |
| 20 to 34 years | 865 (54.6%) | 720 (45.4%) |
| 35 to 50 years | 113 (37.8%) | 186 (62.2%) |
| Total | 1,002 (52.1%) | 921 (47.9%) |
Fertility by Education in Sebastian County
Average fertility rate in Sebastian County is 65.0 births per 1,000 women. Women with the education attainment of high school diploma have the highest fertility rate of 119.0 births per 1,000 women, while women with the education attainment of less than high school have the lowest fertility at 18.0 births per 1,000 women. Women with the education attainment of high school diploma represent 51.2% of all women with births.
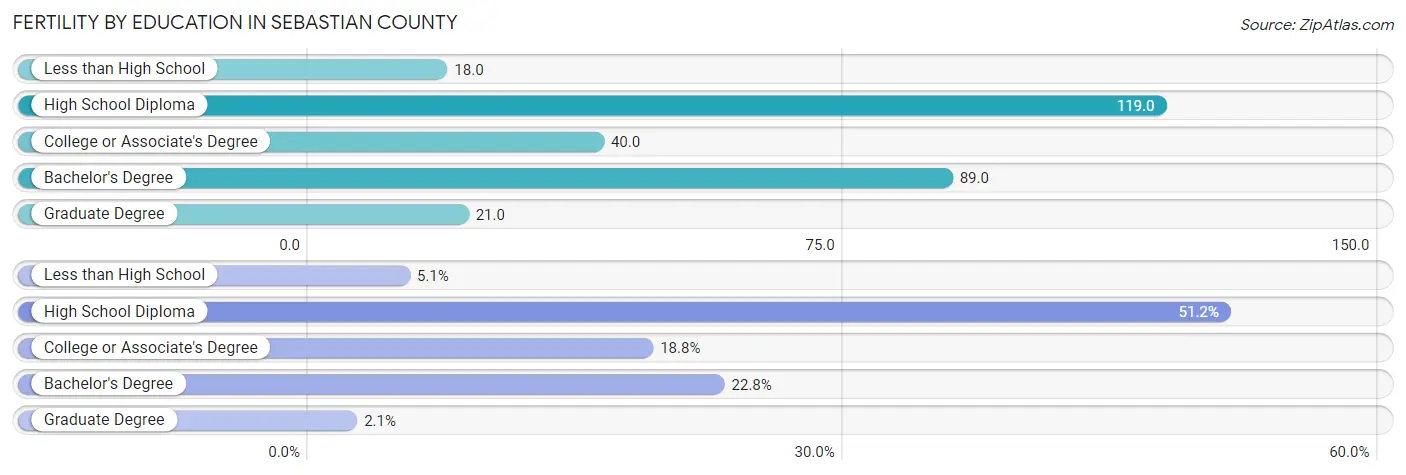
| Educational Attainment | Women with Births | Births / 1,000 Women |
| Less than High School | 98 (5.1%) | 18.0 |
| High School Diploma | 985 (51.2%) | 119.0 |
| College or Associate's Degree | 361 (18.8%) | 40.0 |
| Bachelor's Degree | 438 (22.8%) | 89.0 |
| Graduate Degree | 41 (2.1%) | 21.0 |
| Total | 1,923 (100.0%) | 65.0 |
Fertility by Education by Marriage Status in Sebastian County
47.9% of women with births in Sebastian County are unmarried. Women with the educational attainment of bachelor's degree are most likely to be married with 91.3% of them married at childbirth, while women with the educational attainment of high school diploma are least likely to be married with 81.8% of them unmarried at childbirth.
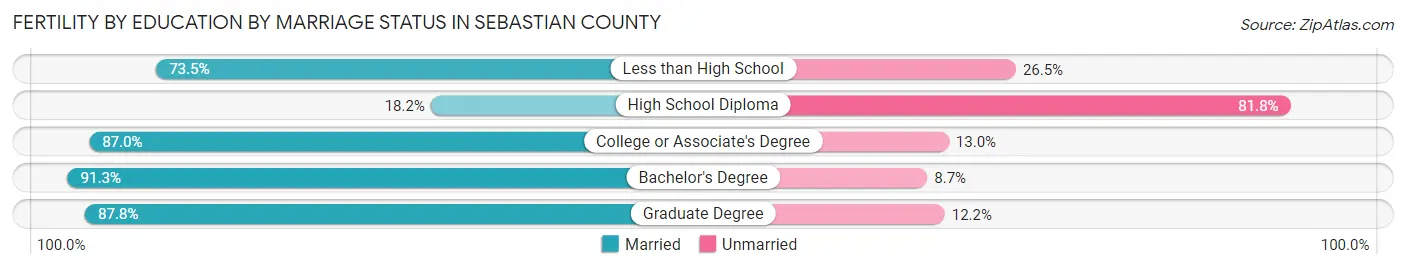
| Educational Attainment | Married | Unmarried |
| Less than High School | 72 (73.5%) | 26 (26.5%) |
| High School Diploma | 179 (18.2%) | 806 (81.8%) |
| College or Associate's Degree | 314 (87.0%) | 47 (13.0%) |
| Bachelor's Degree | 400 (91.3%) | 38 (8.7%) |
| Graduate Degree | 36 (87.8%) | 5 (12.2%) |
| Total | 1,002 (52.1%) | 921 (47.9%) |
Employment Characteristics in Sebastian County
Employment by Class of Employer in Sebastian County
Among the 56,890 employed individuals in Sebastian County, private company employees (39,629 | 69.7%), not-for-profit organizations (4,321 | 7.6%), and local government employees (3,429 | 6.0%) make up the most common classes of employment.
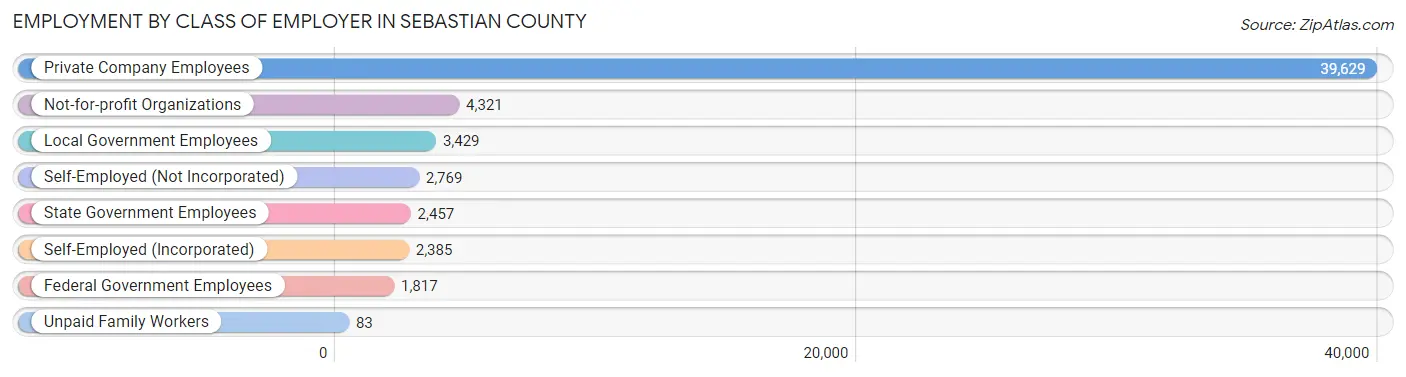
| Employer Class | # Employees | % Employees |
| Private Company Employees | 39,629 | 69.7% |
| Self-Employed (Incorporated) | 2,385 | 4.2% |
| Self-Employed (Not Incorporated) | 2,769 | 4.9% |
| Not-for-profit Organizations | 4,321 | 7.6% |
| Local Government Employees | 3,429 | 6.0% |
| State Government Employees | 2,457 | 4.3% |
| Federal Government Employees | 1,817 | 3.2% |
| Unpaid Family Workers | 83 | 0.2% |
| Total | 56,890 | 100.0% |
Employment Status by Age in Sebastian County
According to the labor force statistics for Sebastian County, out of the total population over 16 years of age (101,367), 60.5% or 61,327 individuals are in the labor force, with 5.2% or 3,189 of them unemployed. The age group with the highest labor force participation rate is 20 to 24 years, with 85.9% or 7,612 individuals in the labor force. Within the labor force, the 16 to 19 years age range has the highest percentage of unemployed individuals, with 19.8% or 481 of them being unemployed.
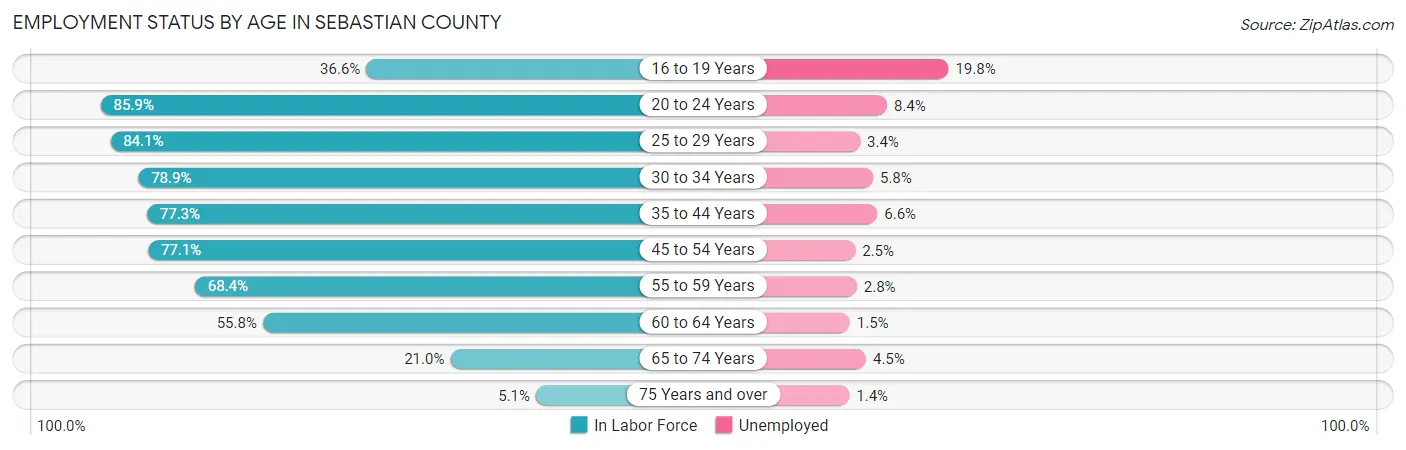
| Age Bracket | In Labor Force | Unemployed |
| 16 to 19 Years | 2,427 (36.6%) | 481 (19.8%) |
| 20 to 24 Years | 7,612 (85.9%) | 639 (8.4%) |
| 25 to 29 Years | 7,202 (84.1%) | 245 (3.4%) |
| 30 to 34 Years | 6,552 (78.9%) | 380 (5.8%) |
| 35 to 44 Years | 12,217 (77.3%) | 806 (6.6%) |
| 45 to 54 Years | 12,041 (77.1%) | 301 (2.5%) |
| 55 to 59 Years | 5,741 (68.4%) | 161 (2.8%) |
| 60 to 64 Years | 4,459 (55.8%) | 67 (1.5%) |
| 65 to 74 Years | 2,625 (21.0%) | 118 (4.5%) |
| 75 Years and over | 444 (5.1%) | 6 (1.4%) |
| Total | 61,327 (60.5%) | 3,189 (5.2%) |
Employment Status by Educational Attainment in Sebastian County
According to labor force statistics for Sebastian County, 74.5% of individuals (48,184) out of the total population between 25 and 64 years of age (64,676) are in the labor force, with 4.1% or 1,976 of them being unemployed. The group with the highest labor force participation rate are those with the educational attainment of bachelor's degree or higher, with 85.2% or 13,568 individuals in the labor force. Within the labor force, individuals with less than high school education have the highest percentage of unemployment, with 8.9% or 470 of them being unemployed.
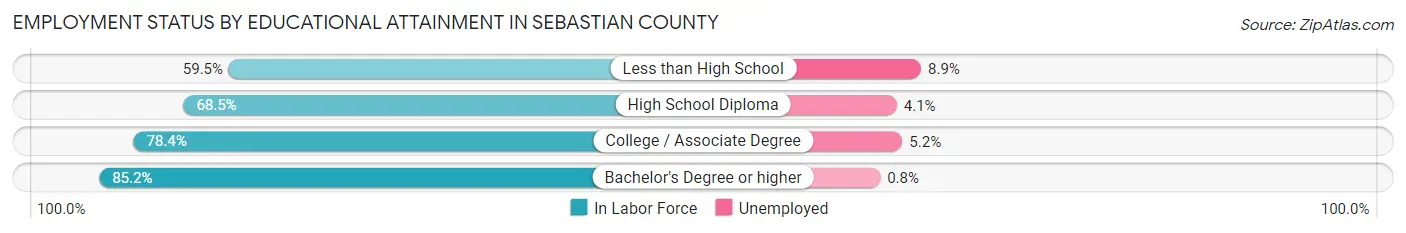
| Educational Attainment | In Labor Force | Unemployed |
| Less than High School | 5,284 (59.5%) | 790 (8.9%) |
| High School Diploma | 13,115 (68.5%) | 785 (4.1%) |
| College / Associate Degree | 16,248 (78.4%) | 1,078 (5.2%) |
| Bachelor's Degree or higher | 13,568 (85.2%) | 127 (0.8%) |
| Total | 48,184 (74.5%) | 2,652 (4.1%) |
Employment Occupations by Sex in Sebastian County
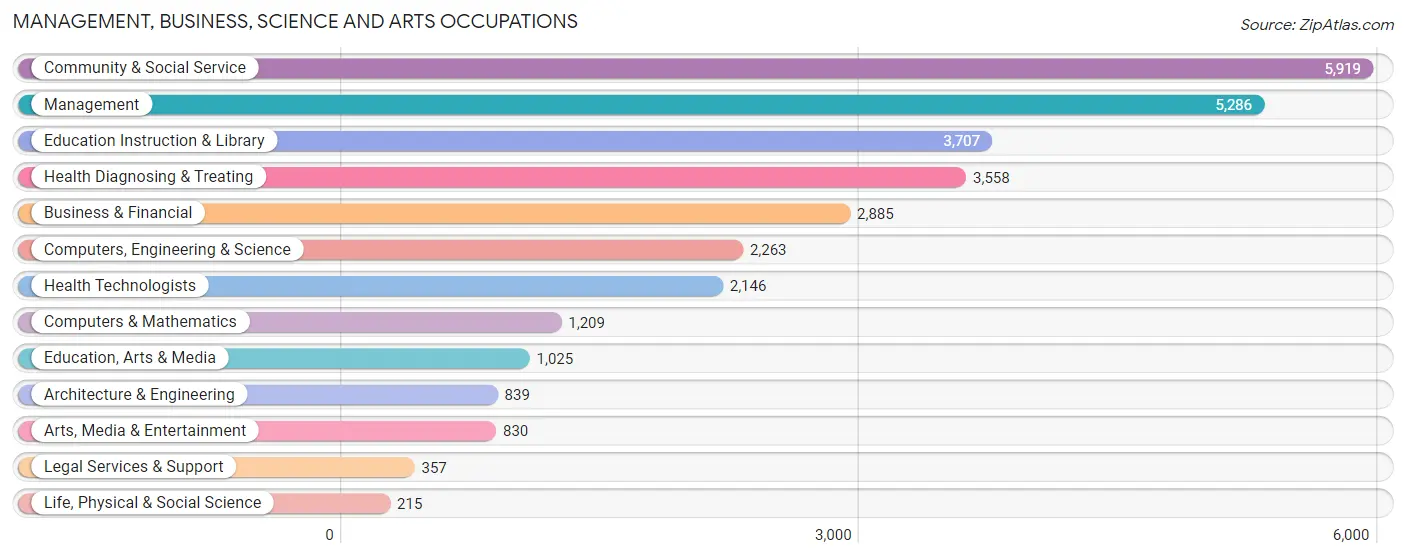
Management, Business, Science and Arts Occupations
The most common Management, Business, Science and Arts occupations in Sebastian County are Community & Social Service (5,919 | 10.3%), Management (5,286 | 9.2%), Education Instruction & Library (3,707 | 6.4%), Health Diagnosing & Treating (3,558 | 6.2%), and Business & Financial (2,885 | 5.0%).
Management, Business, Science and Arts Occupations by Sex
Within the Management, Business, Science and Arts occupations in Sebastian County, the most male-oriented occupations are Architecture & Engineering (81.0%), Computers & Mathematics (78.6%), and Computers, Engineering & Science (77.8%), while the most female-oriented occupations are Education Instruction & Library (82.8%), Health Diagnosing & Treating (76.0%), and Community & Social Service (71.2%).
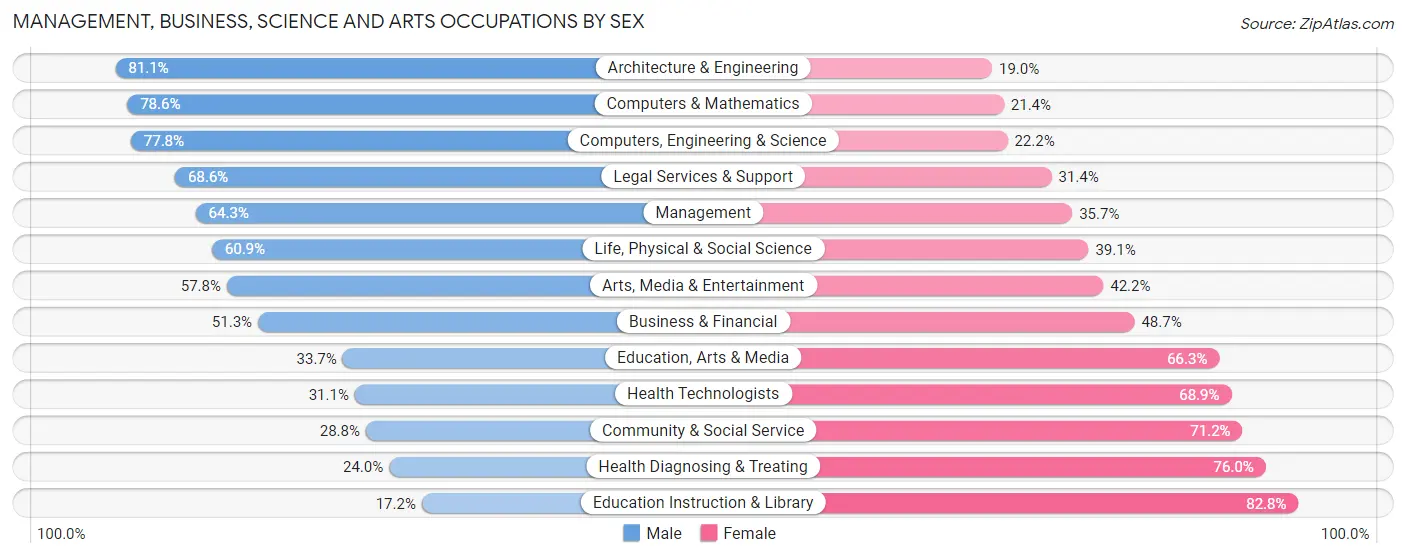
| Occupation | Male | Female |
| Management | 3,400 (64.3%) | 1,886 (35.7%) |
| Business & Financial | 1,481 (51.3%) | 1,404 (48.7%) |
| Computers, Engineering & Science | 1,761 (77.8%) | 502 (22.2%) |
| Computers & Mathematics | 950 (78.6%) | 259 (21.4%) |
| Architecture & Engineering | 680 (81.0%) | 159 (19.0%) |
| Life, Physical & Social Science | 131 (60.9%) | 84 (39.1%) |
| Community & Social Service | 1,706 (28.8%) | 4,213 (71.2%) |
| Education, Arts & Media | 345 (33.7%) | 680 (66.3%) |
| Legal Services & Support | 245 (68.6%) | 112 (31.4%) |
| Education Instruction & Library | 636 (17.2%) | 3,071 (82.8%) |
| Arts, Media & Entertainment | 480 (57.8%) | 350 (42.2%) |
| Health Diagnosing & Treating | 853 (24.0%) | 2,705 (76.0%) |
| Health Technologists | 668 (31.1%) | 1,478 (68.9%) |
| Total (Category) | 9,201 (46.2%) | 10,710 (53.8%) |
| Total (Overall) | 30,371 (52.6%) | 27,318 (47.3%) |
Services Occupations
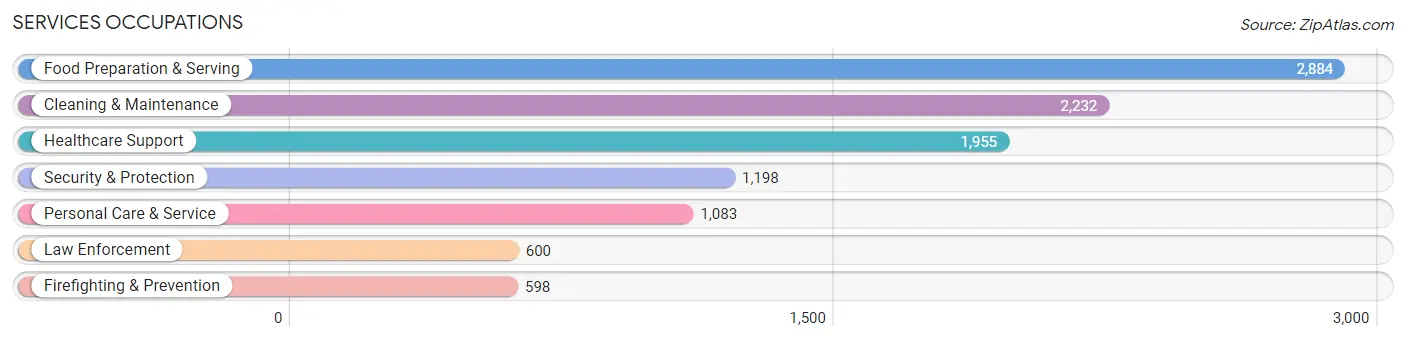
The most common Services occupations in Sebastian County are Food Preparation & Serving (2,884 | 5.0%), Cleaning & Maintenance (2,232 | 3.9%), Healthcare Support (1,955 | 3.4%), Security & Protection (1,198 | 2.1%), and Personal Care & Service (1,083 | 1.9%).
Services Occupations by Sex
Within the Services occupations in Sebastian County, the most male-oriented occupations are Law Enforcement (78.2%), Security & Protection (77.4%), and Firefighting & Prevention (76.6%), while the most female-oriented occupations are Healthcare Support (75.0%), Personal Care & Service (74.5%), and Food Preparation & Serving (61.3%).
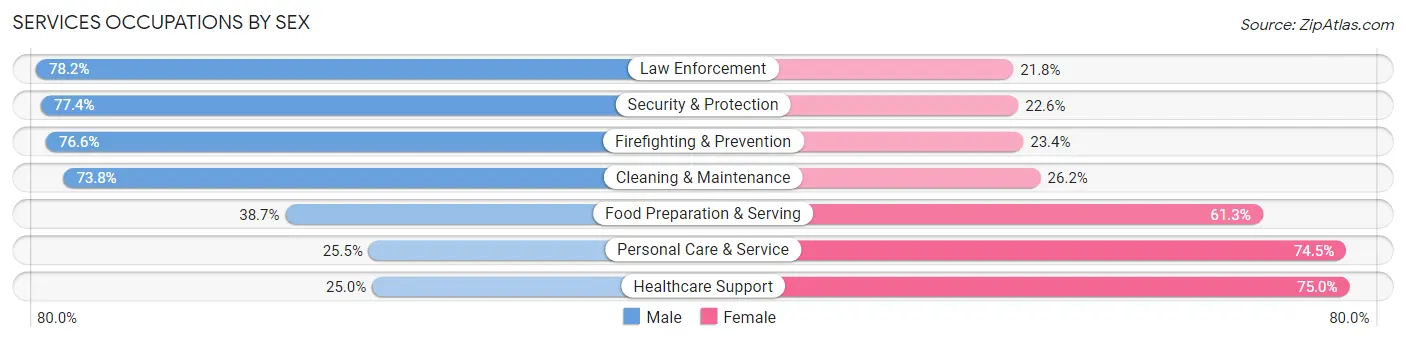
| Occupation | Male | Female |
| Healthcare Support | 488 (25.0%) | 1,467 (75.0%) |
| Security & Protection | 927 (77.4%) | 271 (22.6%) |
| Firefighting & Prevention | 458 (76.6%) | 140 (23.4%) |
| Law Enforcement | 469 (78.2%) | 131 (21.8%) |
| Food Preparation & Serving | 1,116 (38.7%) | 1,768 (61.3%) |
| Cleaning & Maintenance | 1,648 (73.8%) | 584 (26.2%) |
| Personal Care & Service | 276 (25.5%) | 807 (74.5%) |
| Total (Category) | 4,455 (47.6%) | 4,897 (52.4%) |
| Total (Overall) | 30,371 (52.6%) | 27,318 (47.3%) |
Sales and Office Occupations
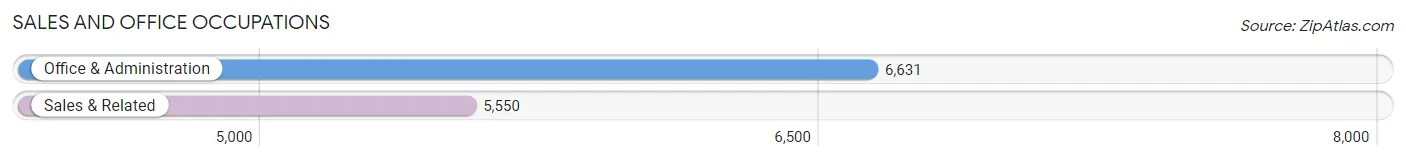
The most common Sales and Office occupations in Sebastian County are Office & Administration (6,631 | 11.5%), and Sales & Related (5,550 | 9.6%).
Sales and Office Occupations by Sex
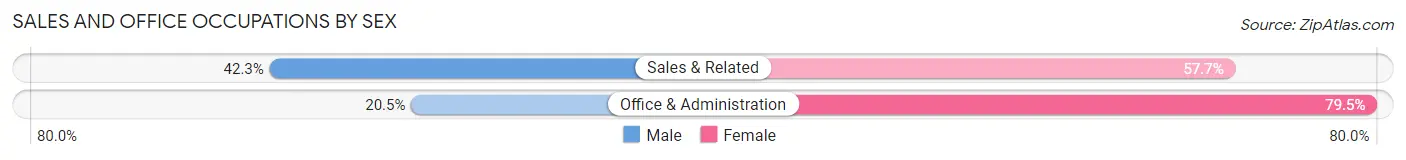
| Occupation | Male | Female |
| Sales & Related | 2,348 (42.3%) | 3,202 (57.7%) |
| Office & Administration | 1,360 (20.5%) | 5,271 (79.5%) |
| Total (Category) | 3,708 (30.4%) | 8,473 (69.6%) |
| Total (Overall) | 30,371 (52.6%) | 27,318 (47.3%) |
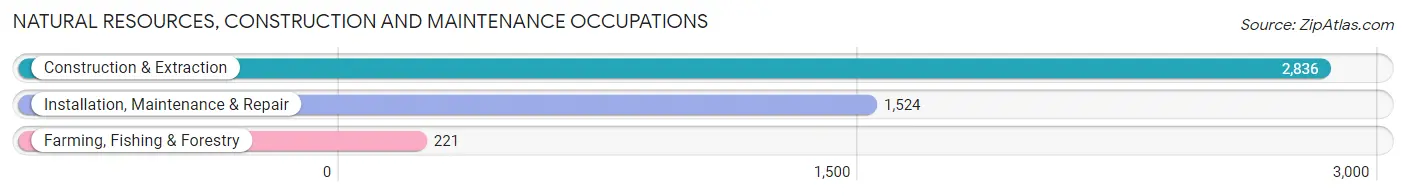
Natural Resources, Construction and Maintenance Occupations
The most common Natural Resources, Construction and Maintenance occupations in Sebastian County are Construction & Extraction (2,836 | 4.9%), Installation, Maintenance & Repair (1,524 | 2.6%), and Farming, Fishing & Forestry (221 | 0.4%).
Natural Resources, Construction and Maintenance Occupations by Sex
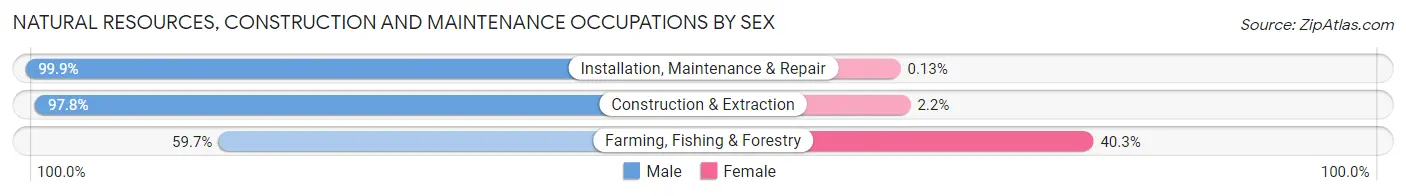
| Occupation | Male | Female |
| Farming, Fishing & Forestry | 132 (59.7%) | 89 (40.3%) |
| Construction & Extraction | 2,774 (97.8%) | 62 (2.2%) |
| Installation, Maintenance & Repair | 1,522 (99.9%) | 2 (0.1%) |
| Total (Category) | 4,428 (96.7%) | 153 (3.3%) |
| Total (Overall) | 30,371 (52.6%) | 27,318 (47.3%) |
Production, Transportation and Moving Occupations
The most common Production, Transportation and Moving occupations in Sebastian County are Production (5,772 | 10.0%), Material Moving (3,560 | 6.2%), and Transportation (2,332 | 4.0%).
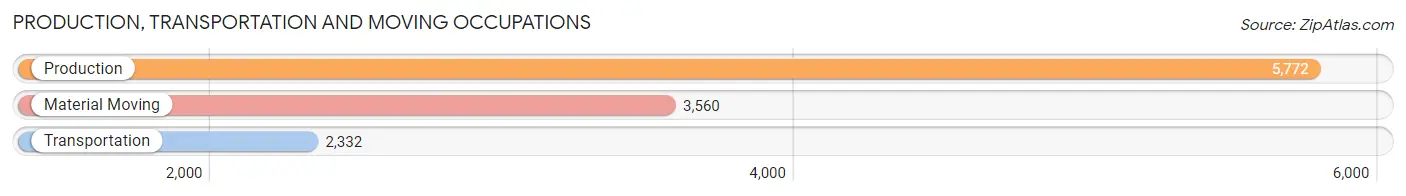
Production, Transportation and Moving Occupations by Sex
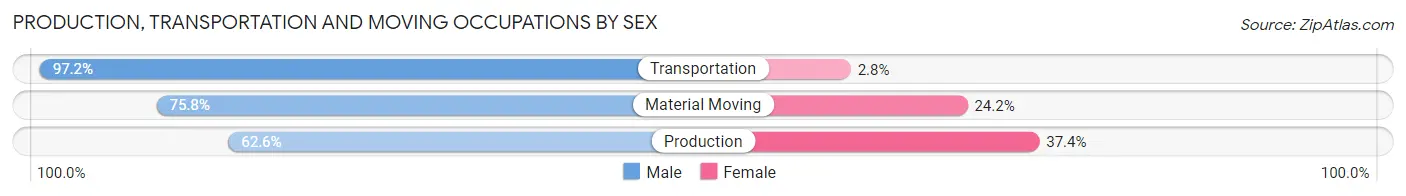
| Occupation | Male | Female |
| Production | 3,614 (62.6%) | 2,158 (37.4%) |
| Transportation | 2,267 (97.2%) | 65 (2.8%) |
| Material Moving | 2,698 (75.8%) | 862 (24.2%) |
| Total (Category) | 8,579 (73.6%) | 3,085 (26.5%) |
| Total (Overall) | 30,371 (52.6%) | 27,318 (47.3%) |
Employment Industries by Sex in Sebastian County
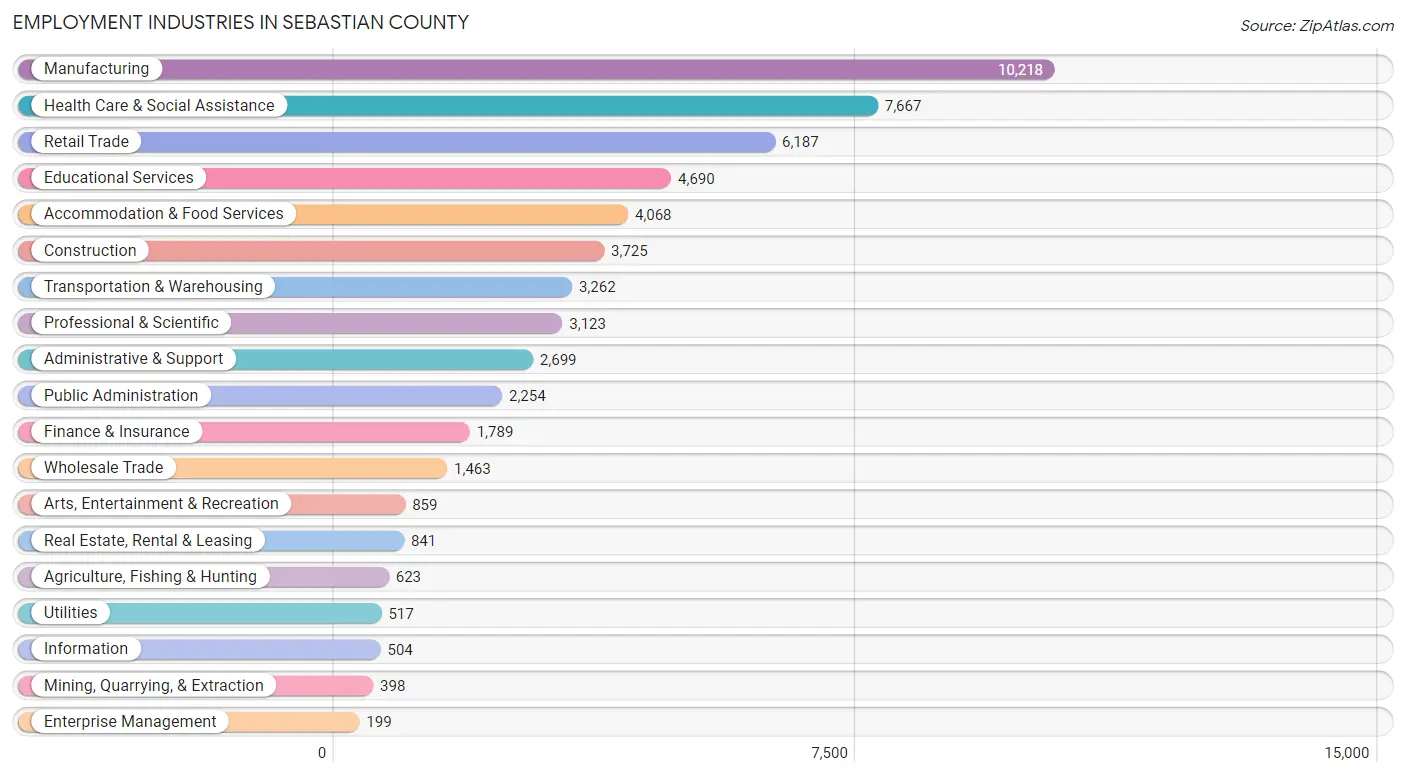
Employment Industries in Sebastian County
The major employment industries in Sebastian County include Manufacturing (10,218 | 17.7%), Health Care & Social Assistance (7,667 | 13.3%), Retail Trade (6,187 | 10.7%), Educational Services (4,690 | 8.1%), and Accommodation & Food Services (4,068 | 7.0%).
Employment Industries by Sex in Sebastian County
The Sebastian County industries that see more men than women are Mining, Quarrying, & Extraction (91.5%), Construction (89.8%), and Utilities (83.6%), whereas the industries that tend to have a higher number of women are Health Care & Social Assistance (76.6%), Educational Services (72.9%), and Accommodation & Food Services (64.5%).
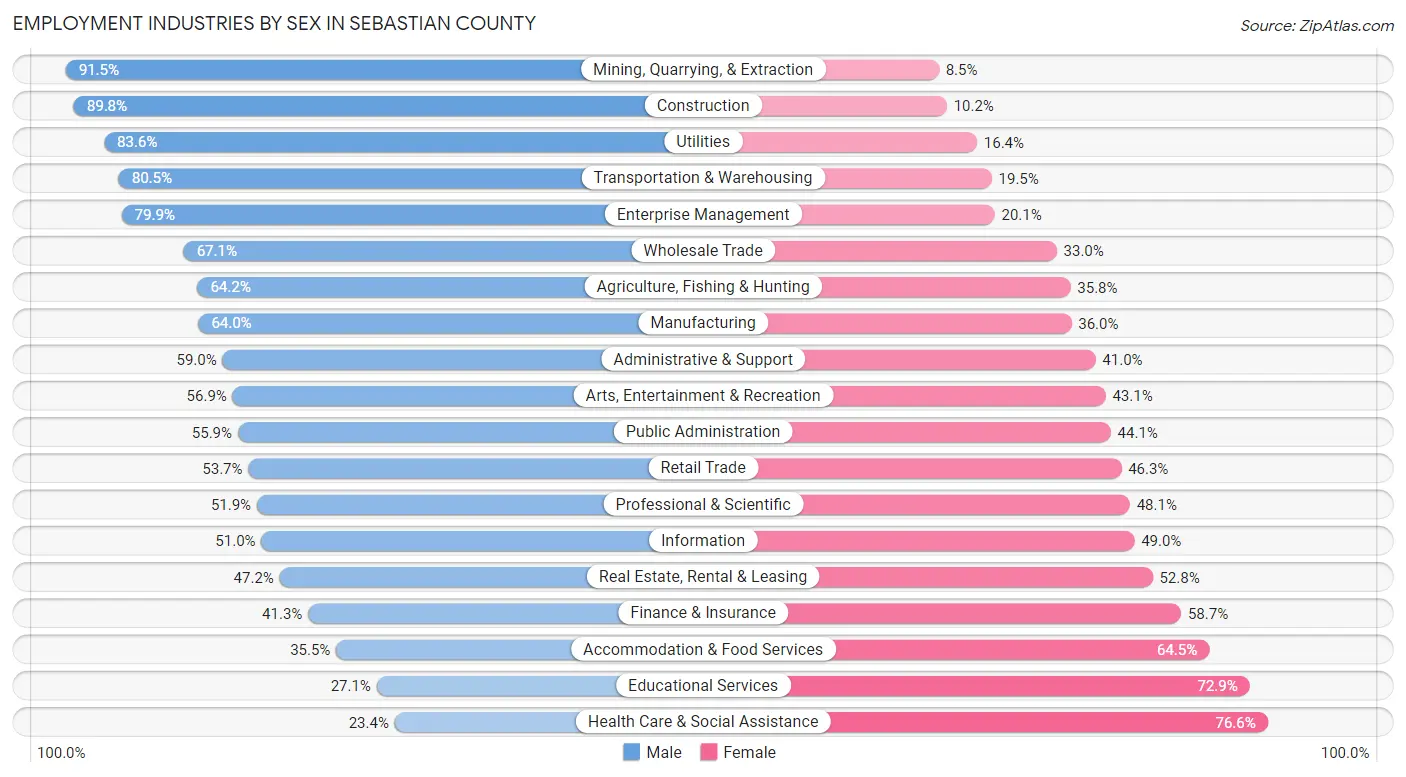
| Industry | Male | Female |
| Agriculture, Fishing & Hunting | 400 (64.2%) | 223 (35.8%) |
| Mining, Quarrying, & Extraction | 364 (91.5%) | 34 (8.5%) |
| Construction | 3,345 (89.8%) | 380 (10.2%) |
| Manufacturing | 6,541 (64.0%) | 3,677 (36.0%) |
| Wholesale Trade | 981 (67.0%) | 482 (33.0%) |
| Retail Trade | 3,321 (53.7%) | 2,866 (46.3%) |
| Transportation & Warehousing | 2,626 (80.5%) | 636 (19.5%) |
| Utilities | 432 (83.6%) | 85 (16.4%) |
| Information | 257 (51.0%) | 247 (49.0%) |
| Finance & Insurance | 739 (41.3%) | 1,050 (58.7%) |
| Real Estate, Rental & Leasing | 397 (47.2%) | 444 (52.8%) |
| Professional & Scientific | 1,621 (51.9%) | 1,502 (48.1%) |
| Enterprise Management | 159 (79.9%) | 40 (20.1%) |
| Administrative & Support | 1,593 (59.0%) | 1,106 (41.0%) |
| Educational Services | 1,272 (27.1%) | 3,418 (72.9%) |
| Health Care & Social Assistance | 1,793 (23.4%) | 5,874 (76.6%) |
| Arts, Entertainment & Recreation | 489 (56.9%) | 370 (43.1%) |
| Accommodation & Food Services | 1,444 (35.5%) | 2,624 (64.5%) |
| Public Administration | 1,259 (55.9%) | 995 (44.1%) |
| Total | 30,371 (52.6%) | 27,318 (47.3%) |
Education in Sebastian County
School Enrollment in Sebastian County
The most common levels of schooling among the 30,114 students in Sebastian County are elementary school (7,225 | 24.0%), middle school (6,564 | 21.8%), and high school (6,363 | 21.1%).
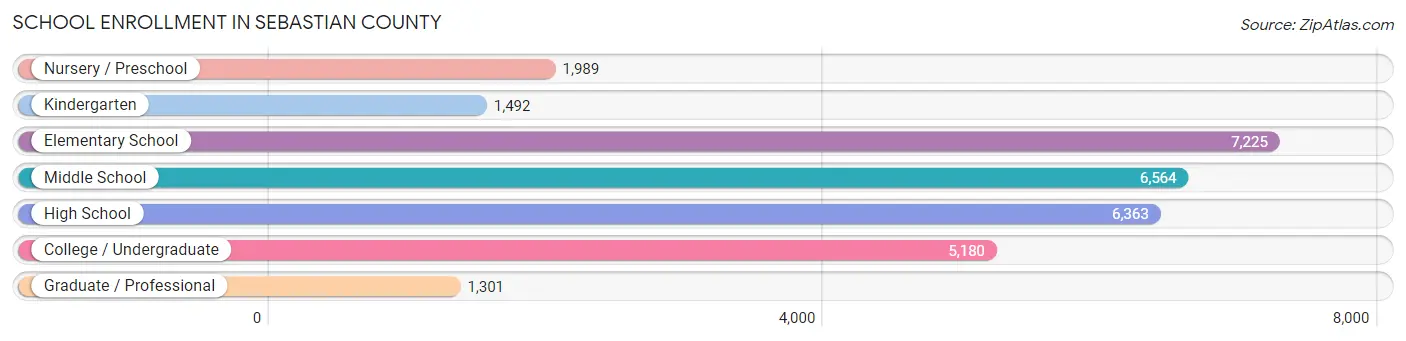
| School Level | # Students | % Students |
| Nursery / Preschool | 1,989 | 6.6% |
| Kindergarten | 1,492 | 5.0% |
| Elementary School | 7,225 | 24.0% |
| Middle School | 6,564 | 21.8% |
| High School | 6,363 | 21.1% |
| College / Undergraduate | 5,180 | 17.2% |
| Graduate / Professional | 1,301 | 4.3% |
| Total | 30,114 | 100.0% |
School Enrollment by Age by Funding Source in Sebastian County
Out of a total of 30,114 students who are enrolled in schools in Sebastian County, 4,427 (14.7%) attend a private institution, while the remaining 25,687 (85.3%) are enrolled in public schools. The age group of 3 to 4 year olds has the highest likelihood of being enrolled in private schools, with 482 (37.9% in the age bracket) enrolled. Conversely, the age group of 15 to 17 year olds has the lowest likelihood of being enrolled in a private school, with 4,883 (96.0% in the age bracket) attending a public institution.
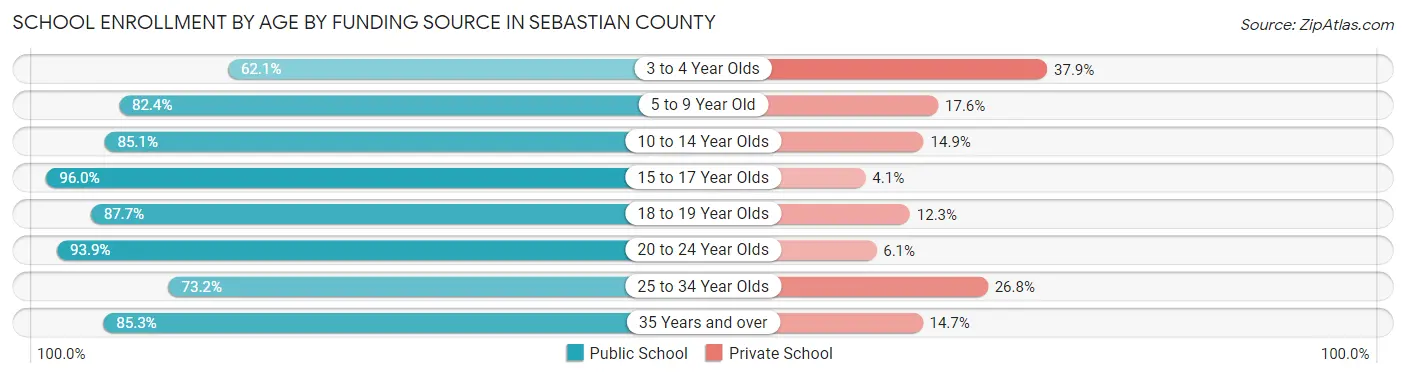
| Age Bracket | Public School | Private School |
| 3 to 4 Year Olds | 790 (62.1%) | 482 (37.9%) |
| 5 to 9 Year Old | 6,765 (82.4%) | 1,444 (17.6%) |
| 10 to 14 Year Olds | 7,052 (85.1%) | 1,235 (14.9%) |
| 15 to 17 Year Olds | 4,883 (96.0%) | 206 (4.1%) |
| 18 to 19 Year Olds | 1,444 (87.7%) | 203 (12.3%) |
| 20 to 24 Year Olds | 2,243 (93.9%) | 145 (6.1%) |
| 25 to 34 Year Olds | 1,366 (73.2%) | 501 (26.8%) |
| 35 Years and over | 1,156 (85.3%) | 199 (14.7%) |
| Total | 25,687 (85.3%) | 4,427 (14.7%) |
Educational Attainment by Field of Study in Sebastian County
Business (4,542 | 20.6%), education (4,113 | 18.7%), science & technology (2,440 | 11.1%), bio, nature & agricultural (1,558 | 7.1%), and arts & humanities (1,389 | 6.3%) are the most common fields of study among 22,025 individuals in Sebastian County who have obtained a bachelor's degree or higher.
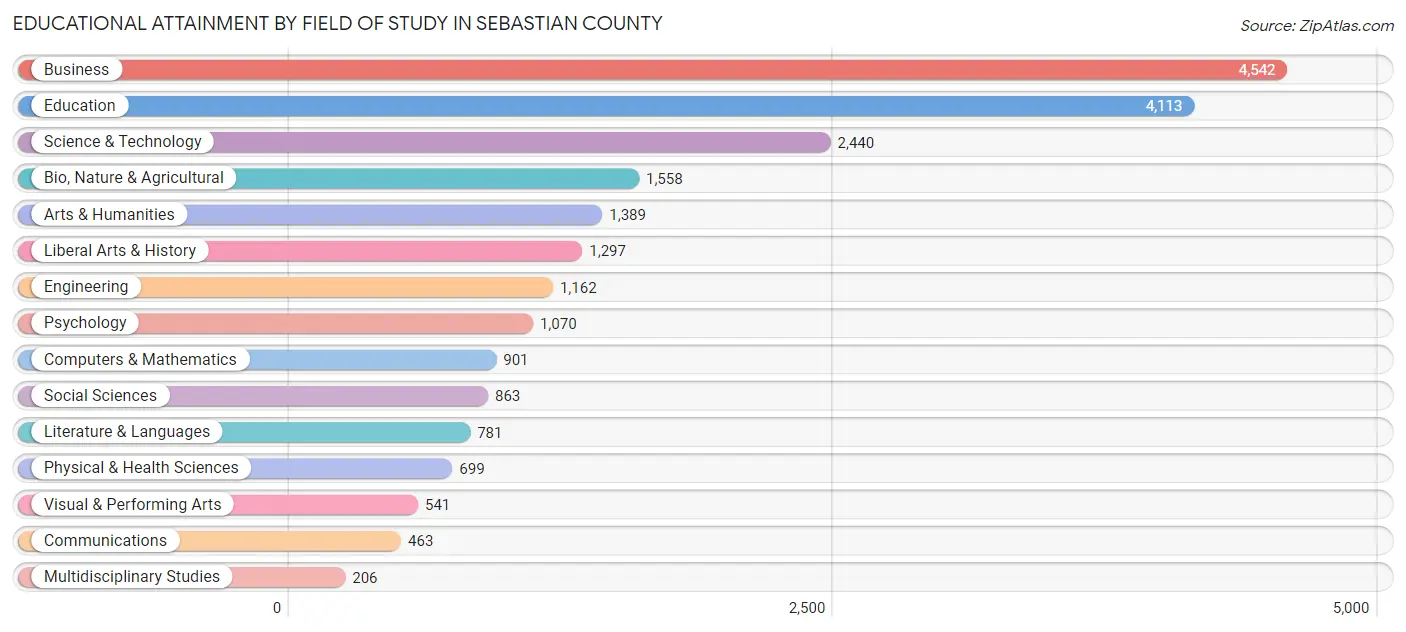
| Field of Study | # Graduates | % Graduates |
| Computers & Mathematics | 901 | 4.1% |
| Bio, Nature & Agricultural | 1,558 | 7.1% |
| Physical & Health Sciences | 699 | 3.2% |
| Psychology | 1,070 | 4.9% |
| Social Sciences | 863 | 3.9% |
| Engineering | 1,162 | 5.3% |
| Multidisciplinary Studies | 206 | 0.9% |
| Science & Technology | 2,440 | 11.1% |
| Business | 4,542 | 20.6% |
| Education | 4,113 | 18.7% |
| Literature & Languages | 781 | 3.5% |
| Liberal Arts & History | 1,297 | 5.9% |
| Visual & Performing Arts | 541 | 2.5% |
| Communications | 463 | 2.1% |
| Arts & Humanities | 1,389 | 6.3% |
| Total | 22,025 | 100.0% |
Transportation & Commute in Sebastian County
Vehicle Availability by Sex in Sebastian County
The most prevalent vehicle ownership categories in Sebastian County are males with 2 vehicles (12,982, accounting for 43.2%) and females with 2 vehicles (11,035, making up 48.8%).
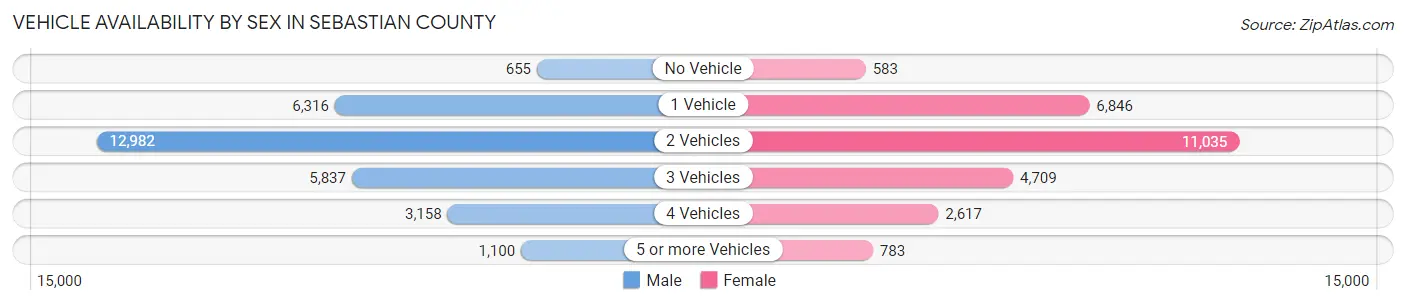
| Vehicles Available | Male | Female |
| No Vehicle | 655 (2.2%) | 583 (2.2%) |
| 1 Vehicle | 6,316 (21.0%) | 6,846 (25.8%) |
| 2 Vehicles | 12,982 (43.2%) | 11,035 (41.5%) |
| 3 Vehicles | 5,837 (19.4%) | 4,709 (17.7%) |
| 4 Vehicles | 3,158 (10.5%) | 2,617 (9.9%) |
| 5 or more Vehicles | 1,100 (3.7%) | 783 (2.9%) |
| Total | 30,048 (100.0%) | 26,573 (100.0%) |
Commute Time in Sebastian County
The most frequently occuring commute durations in Sebastian County are 10 to 14 minutes (11,365 commuters, 21.2%), 15 to 19 minutes (10,667 commuters, 19.9%), and 20 to 24 minutes (8,289 commuters, 15.5%).
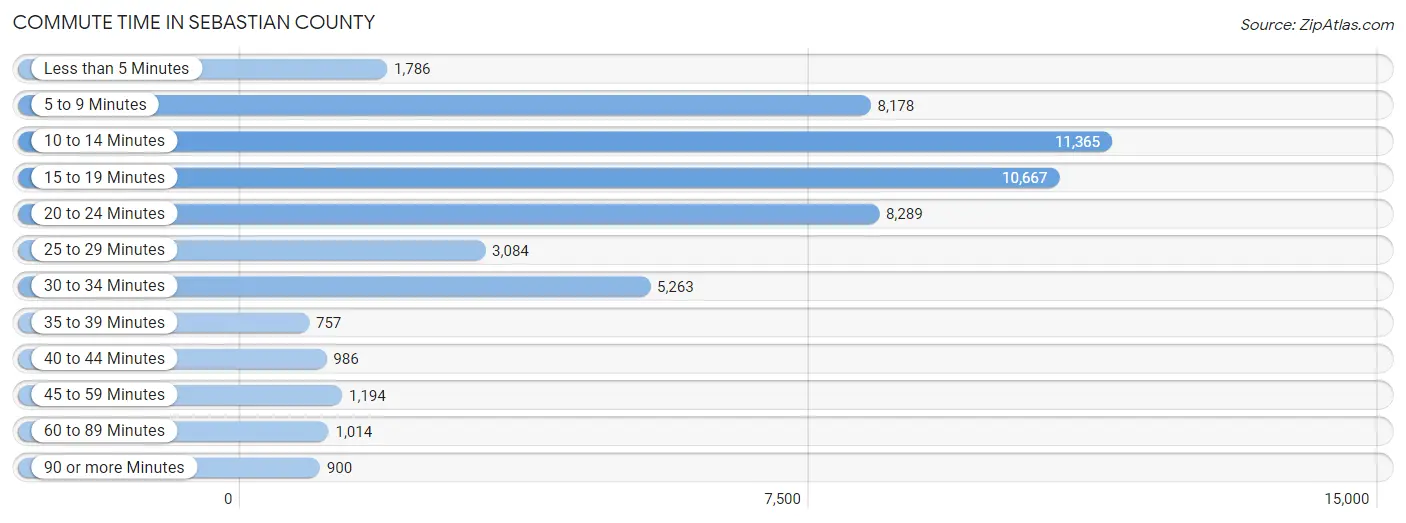
| Commute Time | # Commuters | % Commuters |
| Less than 5 Minutes | 1,786 | 3.3% |
| 5 to 9 Minutes | 8,178 | 15.3% |
| 10 to 14 Minutes | 11,365 | 21.2% |
| 15 to 19 Minutes | 10,667 | 19.9% |
| 20 to 24 Minutes | 8,289 | 15.5% |
| 25 to 29 Minutes | 3,084 | 5.8% |
| 30 to 34 Minutes | 5,263 | 9.8% |
| 35 to 39 Minutes | 757 | 1.4% |
| 40 to 44 Minutes | 986 | 1.8% |
| 45 to 59 Minutes | 1,194 | 2.2% |
| 60 to 89 Minutes | 1,014 | 1.9% |
| 90 or more Minutes | 900 | 1.7% |
Commute Time by Sex in Sebastian County
The most common commute times in Sebastian County are 10 to 14 minutes (6,200 commuters, 21.4%) for males and 15 to 19 minutes (5,382 commuters, 21.9%) for females.
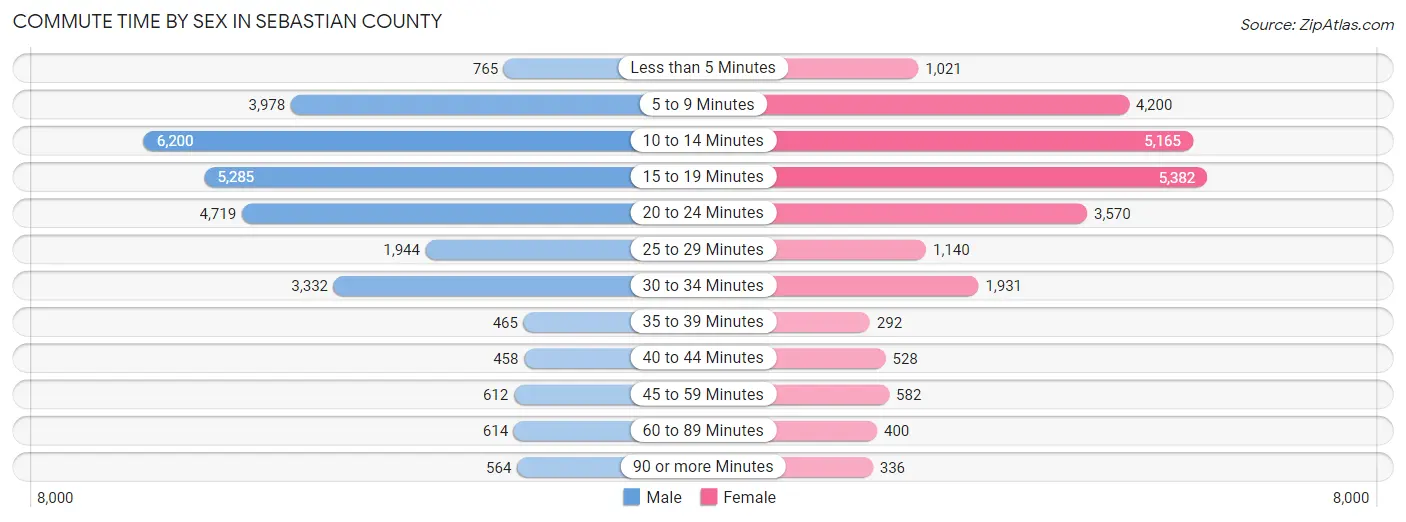
| Commute Time | Male | Female |
| Less than 5 Minutes | 765 (2.6%) | 1,021 (4.2%) |
| 5 to 9 Minutes | 3,978 (13.8%) | 4,200 (17.1%) |
| 10 to 14 Minutes | 6,200 (21.4%) | 5,165 (21.0%) |
| 15 to 19 Minutes | 5,285 (18.3%) | 5,382 (21.9%) |
| 20 to 24 Minutes | 4,719 (16.3%) | 3,570 (14.5%) |
| 25 to 29 Minutes | 1,944 (6.7%) | 1,140 (4.6%) |
| 30 to 34 Minutes | 3,332 (11.5%) | 1,931 (7.9%) |
| 35 to 39 Minutes | 465 (1.6%) | 292 (1.2%) |
| 40 to 44 Minutes | 458 (1.6%) | 528 (2.1%) |
| 45 to 59 Minutes | 612 (2.1%) | 582 (2.4%) |
| 60 to 89 Minutes | 614 (2.1%) | 400 (1.6%) |
| 90 or more Minutes | 564 (1.9%) | 336 (1.4%) |
Time of Departure to Work by Sex in Sebastian County
The most frequent times of departure to work in Sebastian County are 7:00 AM to 7:29 AM (4,363, 15.1%) for males and 7:30 AM to 7:59 AM (5,076, 20.7%) for females.
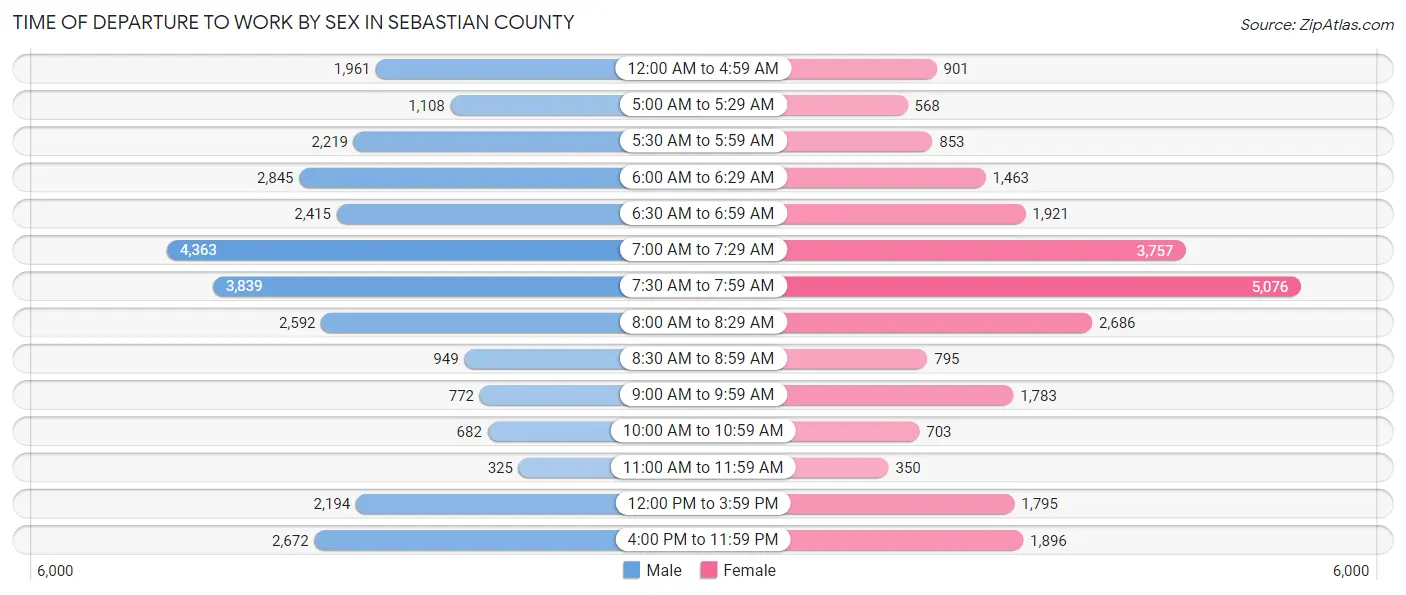
| Time of Departure | Male | Female |
| 12:00 AM to 4:59 AM | 1,961 (6.8%) | 901 (3.7%) |
| 5:00 AM to 5:29 AM | 1,108 (3.8%) | 568 (2.3%) |
| 5:30 AM to 5:59 AM | 2,219 (7.7%) | 853 (3.5%) |
| 6:00 AM to 6:29 AM | 2,845 (9.8%) | 1,463 (6.0%) |
| 6:30 AM to 6:59 AM | 2,415 (8.4%) | 1,921 (7.8%) |
| 7:00 AM to 7:29 AM | 4,363 (15.1%) | 3,757 (15.3%) |
| 7:30 AM to 7:59 AM | 3,839 (13.3%) | 5,076 (20.7%) |
| 8:00 AM to 8:29 AM | 2,592 (9.0%) | 2,686 (10.9%) |
| 8:30 AM to 8:59 AM | 949 (3.3%) | 795 (3.2%) |
| 9:00 AM to 9:59 AM | 772 (2.7%) | 1,783 (7.3%) |
| 10:00 AM to 10:59 AM | 682 (2.4%) | 703 (2.9%) |
| 11:00 AM to 11:59 AM | 325 (1.1%) | 350 (1.4%) |
| 12:00 PM to 3:59 PM | 2,194 (7.6%) | 1,795 (7.3%) |
| 4:00 PM to 11:59 PM | 2,672 (9.2%) | 1,896 (7.7%) |
| Total | 28,936 (100.0%) | 24,547 (100.0%) |
Housing Occupancy in Sebastian County
Occupancy by Ownership in Sebastian County
Of the total 51,862 dwellings in Sebastian County, owner-occupied units account for 31,168 (60.1%), while renter-occupied units make up 20,694 (39.9%).
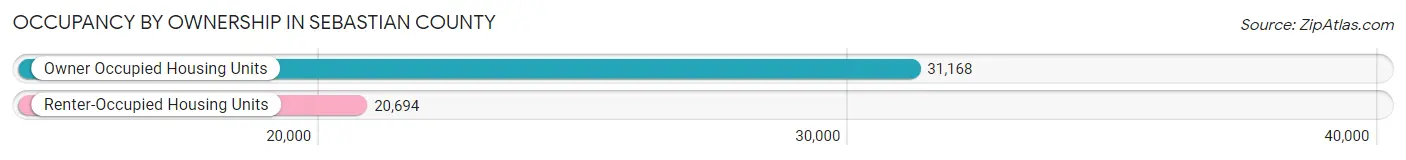
| Occupancy | # Housing Units | % Housing Units |
| Owner Occupied Housing Units | 31,168 | 60.1% |
| Renter-Occupied Housing Units | 20,694 | 39.9% |
| Total Occupied Housing Units | 51,862 | 100.0% |
Occupancy by Household Size in Sebastian County
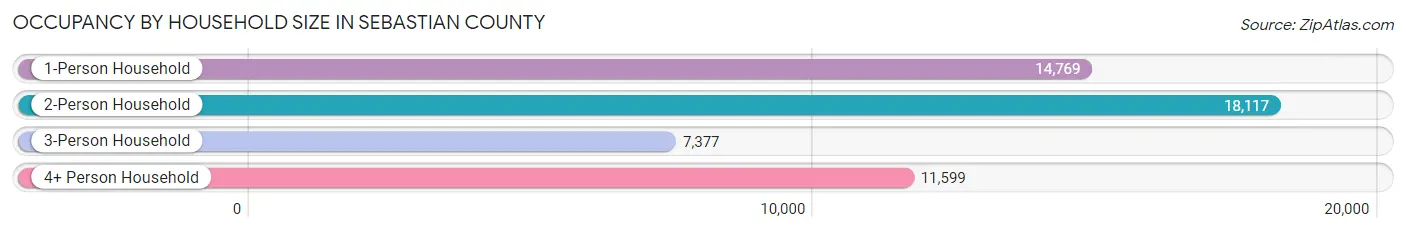
| Household Size | # Housing Units | % Housing Units |
| 1-Person Household | 14,769 | 28.5% |
| 2-Person Household | 18,117 | 34.9% |
| 3-Person Household | 7,377 | 14.2% |
| 4+ Person Household | 11,599 | 22.4% |
| Total Housing Units | 51,862 | 100.0% |
Occupancy by Ownership by Household Size in Sebastian County
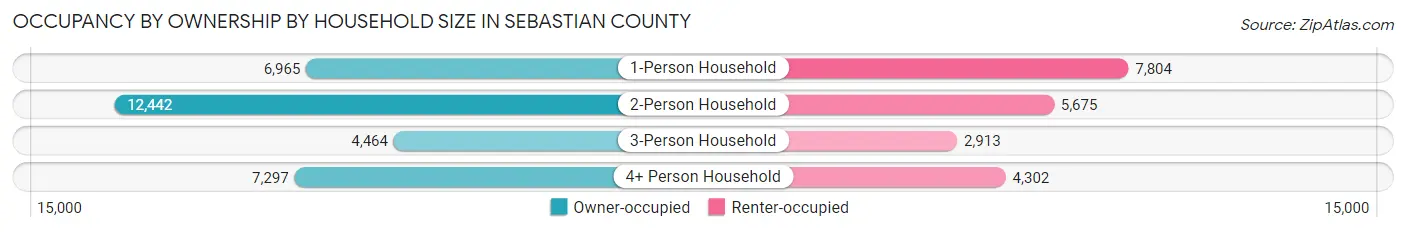
| Household Size | Owner-occupied | Renter-occupied |
| 1-Person Household | 6,965 (47.2%) | 7,804 (52.8%) |
| 2-Person Household | 12,442 (68.7%) | 5,675 (31.3%) |
| 3-Person Household | 4,464 (60.5%) | 2,913 (39.5%) |
| 4+ Person Household | 7,297 (62.9%) | 4,302 (37.1%) |
| Total Housing Units | 31,168 (60.1%) | 20,694 (39.9%) |
Occupancy by Educational Attainment in Sebastian County
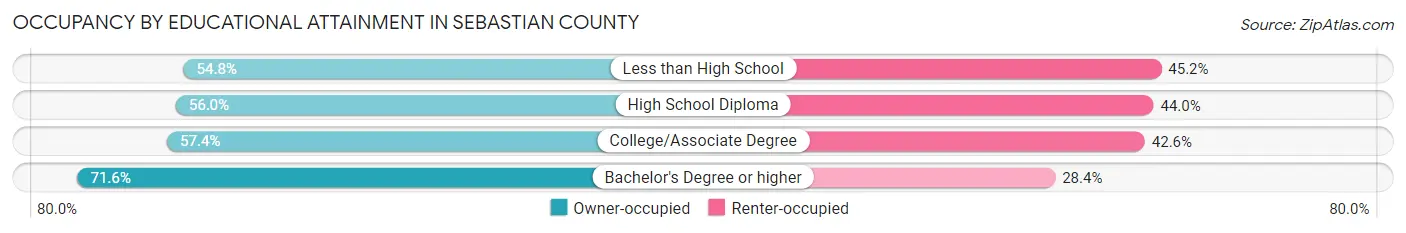
| Household Size | Owner-occupied | Renter-occupied |
| Less than High School | 3,601 (54.8%) | 2,974 (45.2%) |
| High School Diploma | 8,391 (56.0%) | 6,594 (44.0%) |
| College/Associate Degree | 10,169 (57.4%) | 7,553 (42.6%) |
| Bachelor's Degree or higher | 9,007 (71.6%) | 3,573 (28.4%) |
Occupancy by Age of Householder in Sebastian County
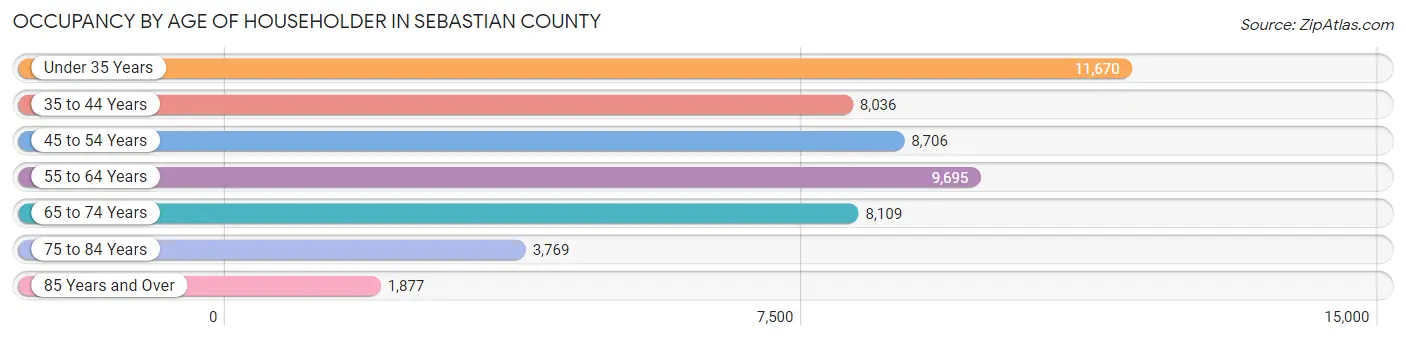
| Age Bracket | # Households | % Households |
| Under 35 Years | 11,670 | 22.5% |
| 35 to 44 Years | 8,036 | 15.5% |
| 45 to 54 Years | 8,706 | 16.8% |
| 55 to 64 Years | 9,695 | 18.7% |
| 65 to 74 Years | 8,109 | 15.6% |
| 75 to 84 Years | 3,769 | 7.3% |
| 85 Years and Over | 1,877 | 3.6% |
| Total | 51,862 | 100.0% |
Housing Finances in Sebastian County
Median Income by Occupancy in Sebastian County
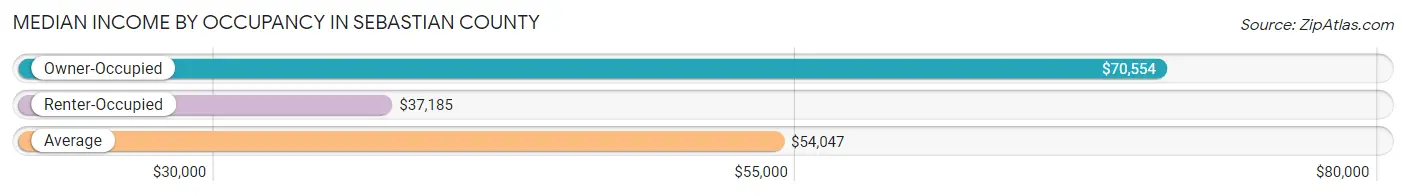
| Occupancy Type | # Households | Median Income |
| Owner-Occupied | 31,168 (60.1%) | $70,554 |
| Renter-Occupied | 20,694 (39.9%) | $37,185 |
| Average | 51,862 (100.0%) | $54,047 |
Occupancy by Householder Income Bracket in Sebastian County
| Income Bracket | Owner-occupied | Renter-occupied |
| Less than $5,000 | 728 (2.3%) | 1,244 (6.0%) |
| $5,000 to $9,999 | 295 (0.9%) | 450 (2.2%) |
| $10,000 to $14,999 | 834 (2.7%) | 2,125 (10.3%) |
| $15,000 to $19,999 | 1,150 (3.7%) | 1,102 (5.3%) |
| $20,000 to $24,999 | 1,152 (3.7%) | 1,330 (6.4%) |
| $25,000 to $34,999 | 2,573 (8.3%) | 3,451 (16.7%) |
| $35,000 to $49,999 | 3,833 (12.3%) | 3,904 (18.9%) |
| $50,000 to $74,999 | 5,825 (18.7%) | 3,625 (17.5%) |
| $75,000 to $99,999 | 4,406 (14.1%) | 1,801 (8.7%) |
| $100,000 to $149,999 | 5,556 (17.8%) | 1,110 (5.4%) |
| $150,000 or more | 4,816 (15.4%) | 552 (2.7%) |
| Total | 31,168 (100.0%) | 20,694 (100.0%) |
Monthly Housing Cost Tiers in Sebastian County
| Monthly Cost | Owner-occupied | Renter-occupied |
| Less than $300 | 3,087 (9.9%) | 549 (2.6%) |
| $300 to $499 | 6,686 (21.4%) | 1,369 (6.6%) |
| $500 to $799 | 5,744 (18.4%) | 7,817 (37.8%) |
| $800 to $999 | 3,451 (11.1%) | 4,604 (22.3%) |
| $1,000 to $1,499 | 6,793 (21.8%) | 4,112 (19.9%) |
| $1,500 to $1,999 | 2,975 (9.6%) | 886 (4.3%) |
| $2,000 to $2,499 | 1,018 (3.3%) | 127 (0.6%) |
| $2,500 to $2,999 | 802 (2.6%) | 11 (0.1%) |
| $3,000 or more | 612 (2.0%) | 235 (1.1%) |
| Total | 31,168 (100.0%) | 20,694 (100.0%) |
Physical Housing Characteristics in Sebastian County
Housing Structures in Sebastian County
| Structure Type | # Housing Units | % Housing Units |
| Single Unit, Detached | 37,030 | 71.4% |
| Single Unit, Attached | 1,306 | 2.5% |
| 2 Unit Apartments | 3,645 | 7.0% |
| 3 or 4 Unit Apartments | 2,300 | 4.4% |
| 5 to 9 Unit Apartments | 1,745 | 3.4% |
| 10 or more Apartments | 4,233 | 8.2% |
| Mobile Home / Other | 1,603 | 3.1% |
| Total | 51,862 | 100.0% |
Housing Structures by Occupancy in Sebastian County
| Structure Type | Owner-occupied | Renter-occupied |
| Single Unit, Detached | 29,202 (78.9%) | 7,828 (21.1%) |
| Single Unit, Attached | 480 (36.7%) | 826 (63.2%) |
| 2 Unit Apartments | 207 (5.7%) | 3,438 (94.3%) |
| 3 or 4 Unit Apartments | 17 (0.7%) | 2,283 (99.3%) |
| 5 to 9 Unit Apartments | 12 (0.7%) | 1,733 (99.3%) |
| 10 or more Apartments | 11 (0.3%) | 4,222 (99.7%) |
| Mobile Home / Other | 1,239 (77.3%) | 364 (22.7%) |
| Total | 31,168 (60.1%) | 20,694 (39.9%) |
Housing Structures by Number of Rooms in Sebastian County
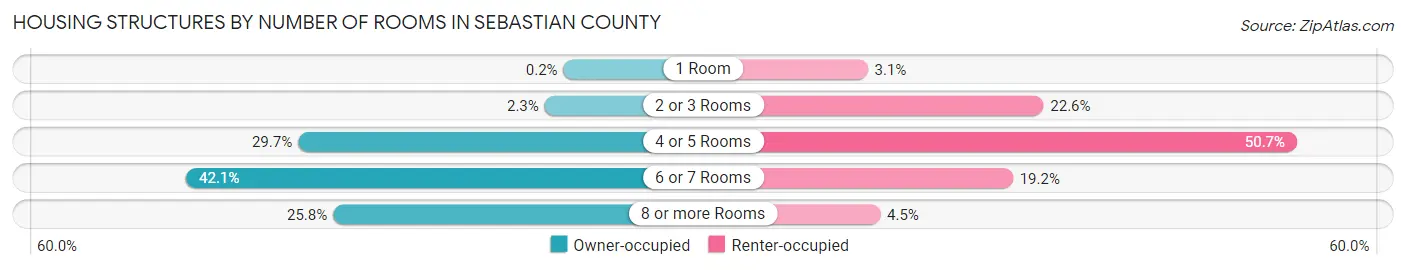
| Number of Rooms | Owner-occupied | Renter-occupied |
| 1 Room | 63 (0.2%) | 636 (3.1%) |
| 2 or 3 Rooms | 714 (2.3%) | 4,673 (22.6%) |
| 4 or 5 Rooms | 9,245 (29.7%) | 10,494 (50.7%) |
| 6 or 7 Rooms | 13,114 (42.1%) | 3,969 (19.2%) |
| 8 or more Rooms | 8,032 (25.8%) | 922 (4.5%) |
| Total | 31,168 (100.0%) | 20,694 (100.0%) |
Housing Structure by Heating Type in Sebastian County
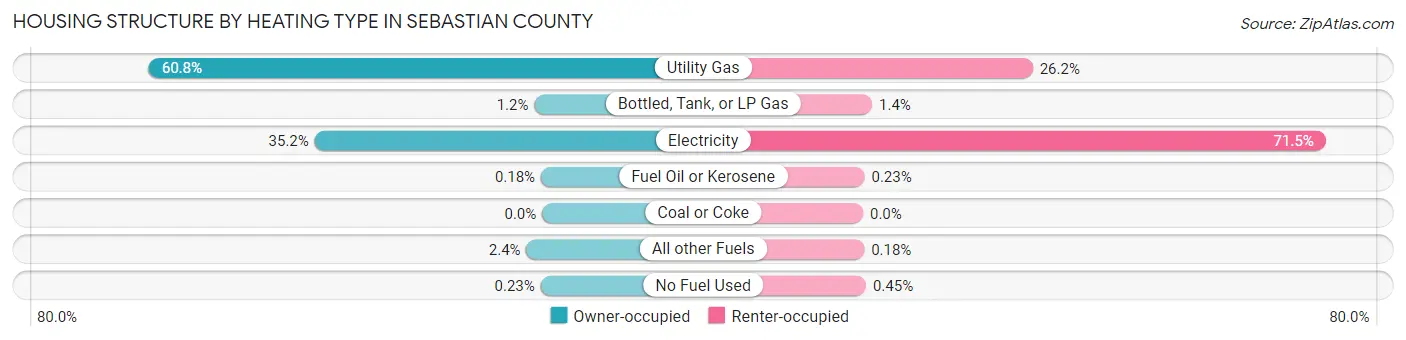
| Heating Type | Owner-occupied | Renter-occupied |
| Utility Gas | 18,948 (60.8%) | 5,428 (26.2%) |
| Bottled, Tank, or LP Gas | 378 (1.2%) | 290 (1.4%) |
| Electricity | 10,962 (35.2%) | 14,798 (71.5%) |
| Fuel Oil or Kerosene | 55 (0.2%) | 47 (0.2%) |
| Coal or Coke | 0 (0.0%) | 0 (0.0%) |
| All other Fuels | 753 (2.4%) | 37 (0.2%) |
| No Fuel Used | 72 (0.2%) | 94 (0.4%) |
| Total | 31,168 (100.0%) | 20,694 (100.0%) |
Household Vehicle Usage in Sebastian County
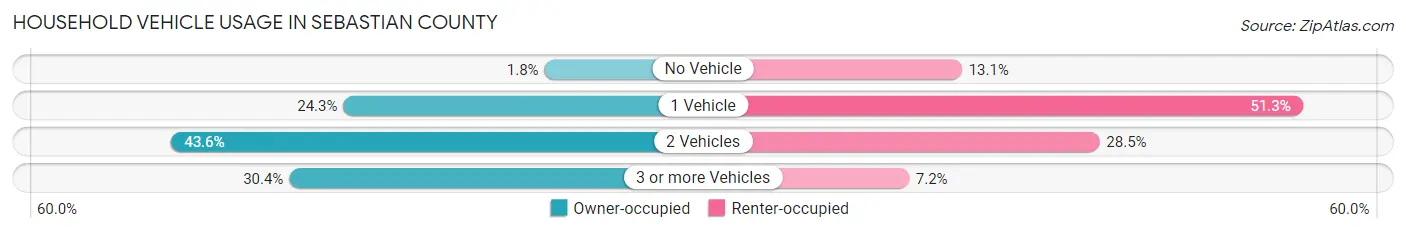
| Vehicles per Household | Owner-occupied | Renter-occupied |
| No Vehicle | 551 (1.8%) | 2,706 (13.1%) |
| 1 Vehicle | 7,575 (24.3%) | 10,607 (51.3%) |
| 2 Vehicles | 13,578 (43.6%) | 5,899 (28.5%) |
| 3 or more Vehicles | 9,464 (30.4%) | 1,482 (7.2%) |
| Total | 31,168 (100.0%) | 20,694 (100.0%) |
Real Estate & Mortgages in Sebastian County
Real Estate and Mortgage Overview in Sebastian County
| Characteristic | Without Mortgage | With Mortgage |
| Housing Units | 14,492 | 16,676 |
| Median Property Value | $139,400 | $167,600 |
| Median Household Income | $55,344 | $3,277 |
| Monthly Housing Costs | $427 | $596 |
| Real Estate Taxes | $895 | $1,015 |
Property Value by Mortgage Status in Sebastian County
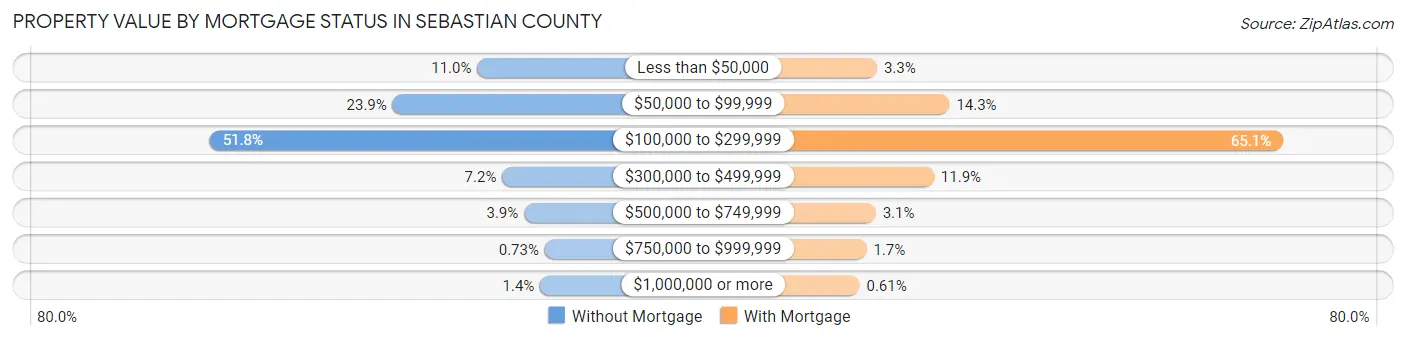
| Property Value | Without Mortgage | With Mortgage |
| Less than $50,000 | 1,597 (11.0%) | 544 (3.3%) |
| $50,000 to $99,999 | 3,466 (23.9%) | 2,387 (14.3%) |
| $100,000 to $299,999 | 7,506 (51.8%) | 10,863 (65.1%) |
| $300,000 to $499,999 | 1,047 (7.2%) | 1,991 (11.9%) |
| $500,000 to $749,999 | 562 (3.9%) | 513 (3.1%) |
| $750,000 to $999,999 | 106 (0.7%) | 276 (1.7%) |
| $1,000,000 or more | 208 (1.4%) | 102 (0.6%) |
| Total | 14,492 (100.0%) | 16,676 (100.0%) |
Household Income by Mortgage Status in Sebastian County
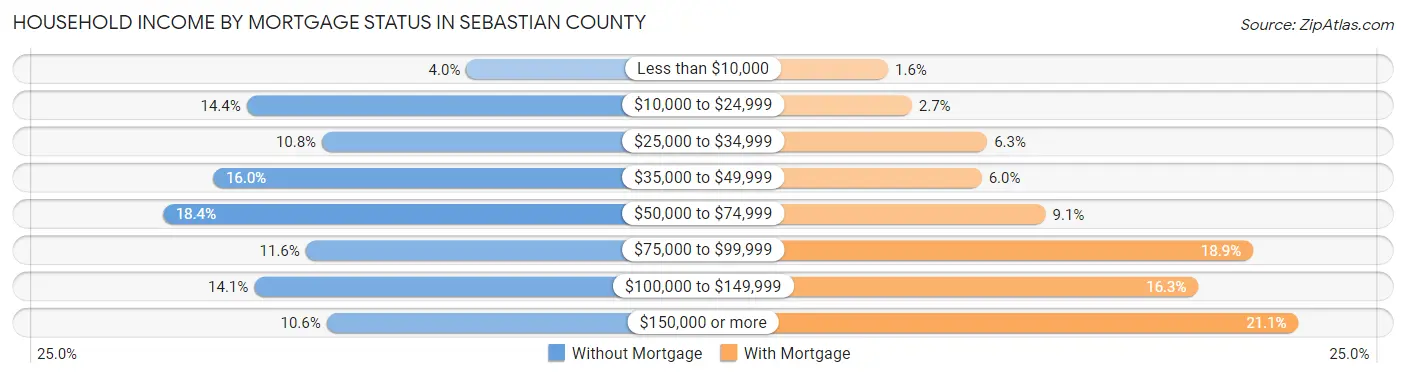
| Household Income | Without Mortgage | With Mortgage |
| Less than $10,000 | 576 (4.0%) | 259 (1.5%) |
| $10,000 to $24,999 | 2,091 (14.4%) | 447 (2.7%) |
| $25,000 to $34,999 | 1,571 (10.8%) | 1,045 (6.3%) |
| $35,000 to $49,999 | 2,323 (16.0%) | 1,002 (6.0%) |
| $50,000 to $74,999 | 2,669 (18.4%) | 1,510 (9.0%) |
| $75,000 to $99,999 | 1,684 (11.6%) | 3,156 (18.9%) |
| $100,000 to $149,999 | 2,039 (14.1%) | 2,722 (16.3%) |
| $150,000 or more | 1,539 (10.6%) | 3,517 (21.1%) |
| Total | 14,492 (100.0%) | 16,676 (100.0%) |
Property Value to Household Income Ratio in Sebastian County
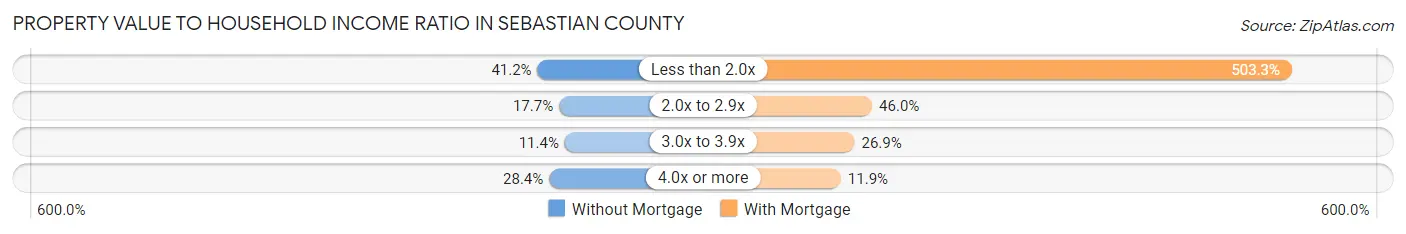
| Value-to-Income Ratio | Without Mortgage | With Mortgage |
| Less than 2.0x | 5,967 (41.2%) | 83,933 (503.3%) |
| 2.0x to 2.9x | 2,566 (17.7%) | 7,675 (46.0%) |
| 3.0x to 3.9x | 1,654 (11.4%) | 4,480 (26.9%) |
| 4.0x or more | 4,122 (28.4%) | 1,991 (11.9%) |
| Total | 14,492 (100.0%) | 16,676 (100.0%) |
Real Estate Taxes by Mortgage Status in Sebastian County
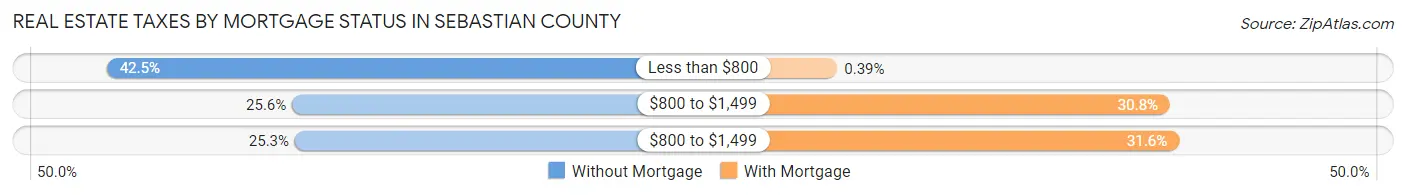
| Property Taxes | Without Mortgage | With Mortgage |
| Less than $800 | 6,159 (42.5%) | 65 (0.4%) |
| $800 to $1,499 | 3,706 (25.6%) | 5,129 (30.8%) |
| $800 to $1,499 | 3,669 (25.3%) | 5,269 (31.6%) |
| Total | 14,492 (100.0%) | 16,676 (100.0%) |
Health & Disability in Sebastian County
Health Insurance Coverage by Age in Sebastian County
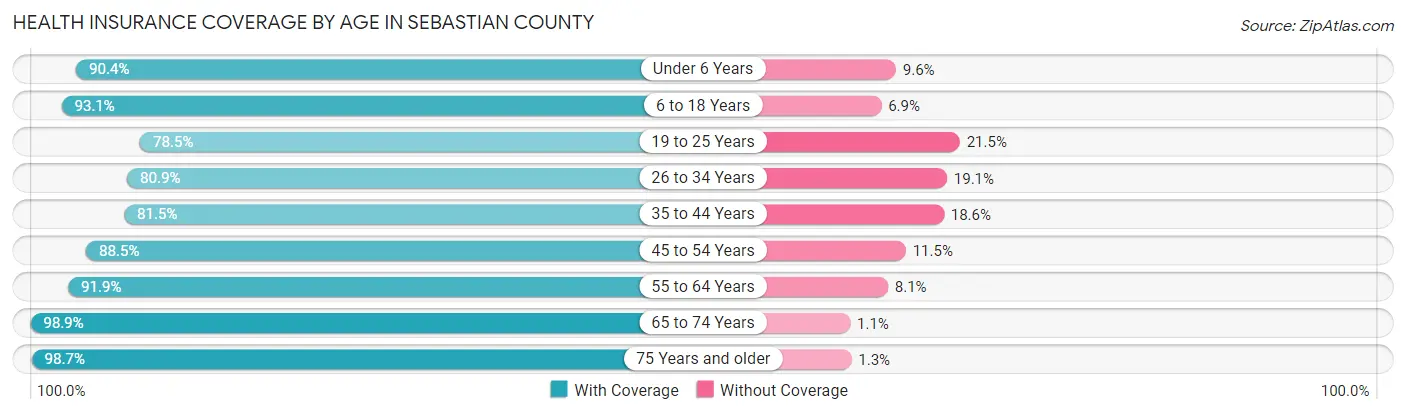
| Age Bracket | With Coverage | Without Coverage |
| Under 6 Years | 8,882 (90.4%) | 944 (9.6%) |
| 6 to 18 Years | 20,580 (93.1%) | 1,520 (6.9%) |
| 19 to 25 Years | 9,797 (78.5%) | 2,688 (21.5%) |
| 26 to 34 Years | 11,678 (80.9%) | 2,763 (19.1%) |
| 35 to 44 Years | 12,631 (81.5%) | 2,876 (18.5%) |
| 45 to 54 Years | 13,771 (88.5%) | 1,782 (11.5%) |
| 55 to 64 Years | 14,955 (91.9%) | 1,322 (8.1%) |
| 65 to 74 Years | 12,111 (98.9%) | 132 (1.1%) |
| 75 Years and older | 8,135 (98.7%) | 108 (1.3%) |
| Total | 112,540 (88.8%) | 14,135 (11.2%) |
Health Insurance Coverage by Citizenship Status in Sebastian County
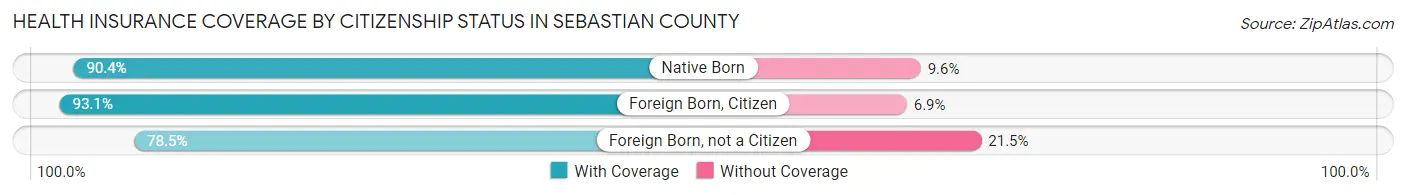
| Citizenship Status | With Coverage | Without Coverage |
| Native Born | 8,882 (90.4%) | 944 (9.6%) |
| Foreign Born, Citizen | 20,580 (93.1%) | 1,520 (6.9%) |
| Foreign Born, not a Citizen | 9,797 (78.5%) | 2,688 (21.5%) |
Health Insurance Coverage by Household Income in Sebastian County
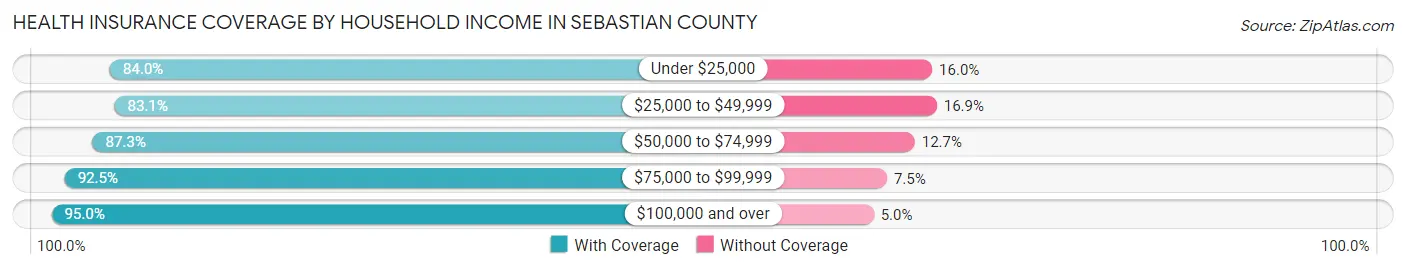
| Household Income | With Coverage | Without Coverage |
| Under $25,000 | 14,537 (84.0%) | 2,766 (16.0%) |
| $25,000 to $49,999 | 24,591 (83.1%) | 4,988 (16.9%) |
| $50,000 to $74,999 | 21,999 (87.3%) | 3,212 (12.7%) |
| $75,000 to $99,999 | 16,186 (92.5%) | 1,317 (7.5%) |
| $100,000 and over | 34,406 (95.0%) | 1,826 (5.0%) |
Public vs Private Health Insurance Coverage by Age in Sebastian County
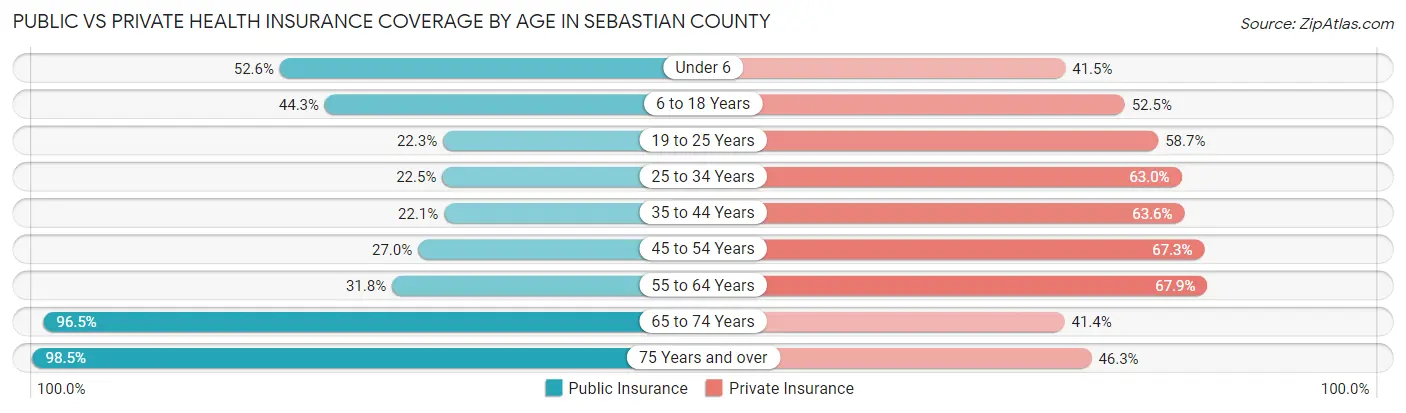
| Age Bracket | Public Insurance | Private Insurance |
| Under 6 | 5,171 (52.6%) | 4,077 (41.5%) |
| 6 to 18 Years | 9,784 (44.3%) | 11,606 (52.5%) |
| 19 to 25 Years | 2,789 (22.3%) | 7,334 (58.7%) |
| 25 to 34 Years | 3,246 (22.5%) | 9,103 (63.0%) |
| 35 to 44 Years | 3,431 (22.1%) | 9,859 (63.6%) |
| 45 to 54 Years | 4,195 (27.0%) | 10,465 (67.3%) |
| 55 to 64 Years | 5,177 (31.8%) | 11,044 (67.8%) |
| 65 to 74 Years | 11,815 (96.5%) | 5,063 (41.3%) |
| 75 Years and over | 8,119 (98.5%) | 3,820 (46.3%) |
| Total | 53,727 (42.4%) | 72,371 (57.1%) |
Disability Status by Sex by Age in Sebastian County
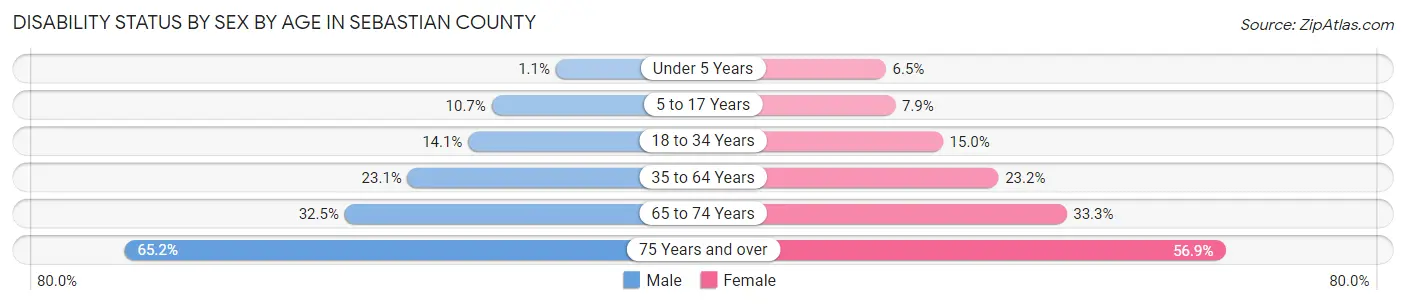
| Age Bracket | Male | Female |
| Under 5 Years | 47 (1.1%) | 257 (6.5%) |
| 5 to 17 Years | 1,198 (10.6%) | 870 (7.9%) |
| 18 to 34 Years | 2,015 (14.1%) | 2,122 (15.0%) |
| 35 to 64 Years | 5,429 (23.1%) | 5,542 (23.2%) |
| 65 to 74 Years | 1,863 (32.5%) | 2,168 (33.3%) |
| 75 Years and over | 2,118 (65.1%) | 2,842 (56.9%) |
Disability Class by Sex by Age in Sebastian County
Disability Class: Hearing Difficulty
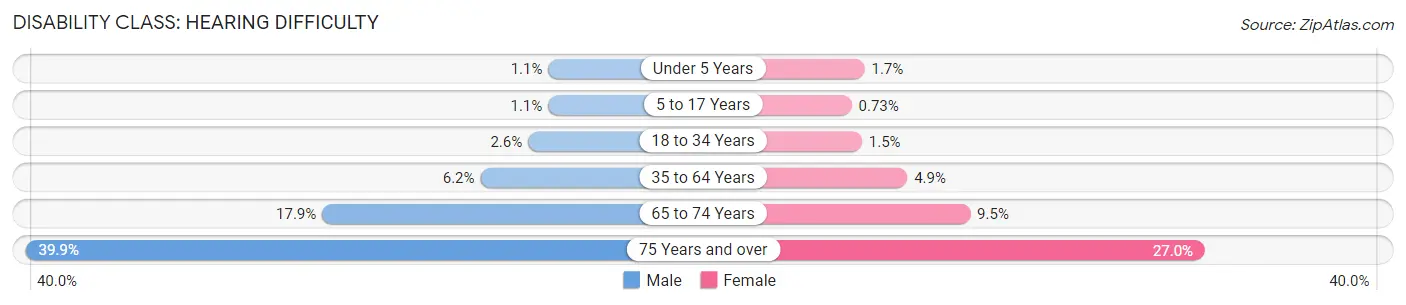
| Age Bracket | Male | Female |
| Under 5 Years | 47 (1.1%) | 67 (1.7%) |
| 5 to 17 Years | 127 (1.1%) | 81 (0.7%) |
| 18 to 34 Years | 374 (2.6%) | 211 (1.5%) |
| 35 to 64 Years | 1,446 (6.2%) | 1,160 (4.9%) |
| 65 to 74 Years | 1,028 (17.9%) | 620 (9.5%) |
| 75 Years and over | 1,298 (39.9%) | 1,346 (27.0%) |
Disability Class: Vision Difficulty
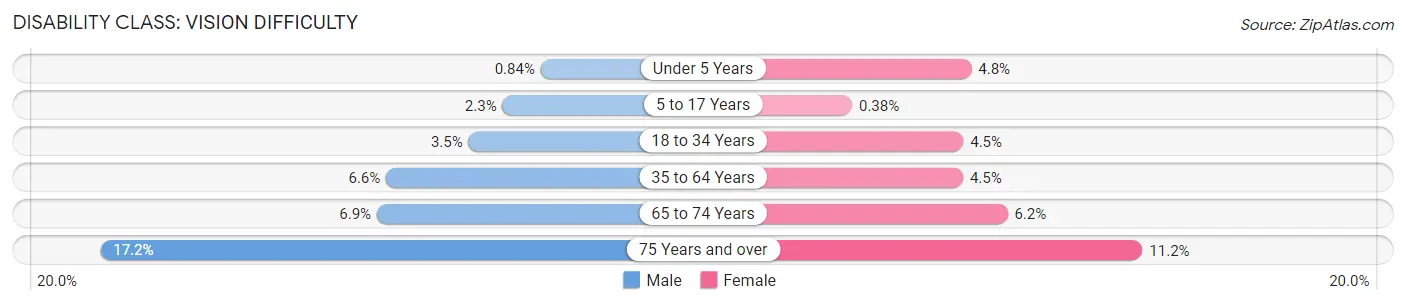
| Age Bracket | Male | Female |
| Under 5 Years | 35 (0.8%) | 190 (4.8%) |
| 5 to 17 Years | 254 (2.3%) | 42 (0.4%) |
| 18 to 34 Years | 502 (3.5%) | 639 (4.5%) |
| 35 to 64 Years | 1,546 (6.6%) | 1,073 (4.5%) |
| 65 to 74 Years | 397 (6.9%) | 400 (6.1%) |
| 75 Years and over | 559 (17.2%) | 557 (11.2%) |
Disability Class: Cognitive Difficulty
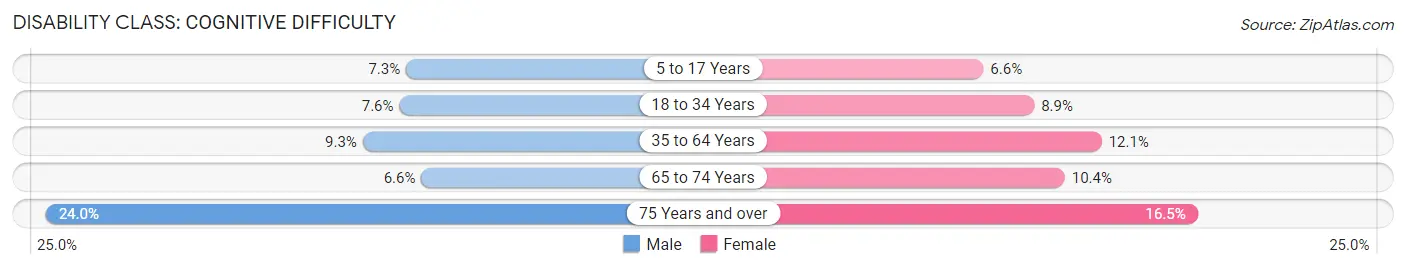
| Age Bracket | Male | Female |
| 5 to 17 Years | 821 (7.3%) | 725 (6.6%) |
| 18 to 34 Years | 1,085 (7.6%) | 1,266 (8.9%) |
| 35 to 64 Years | 2,185 (9.3%) | 2,876 (12.1%) |
| 65 to 74 Years | 378 (6.6%) | 673 (10.3%) |
| 75 Years and over | 781 (24.0%) | 824 (16.5%) |
Disability Class: Ambulatory Difficulty
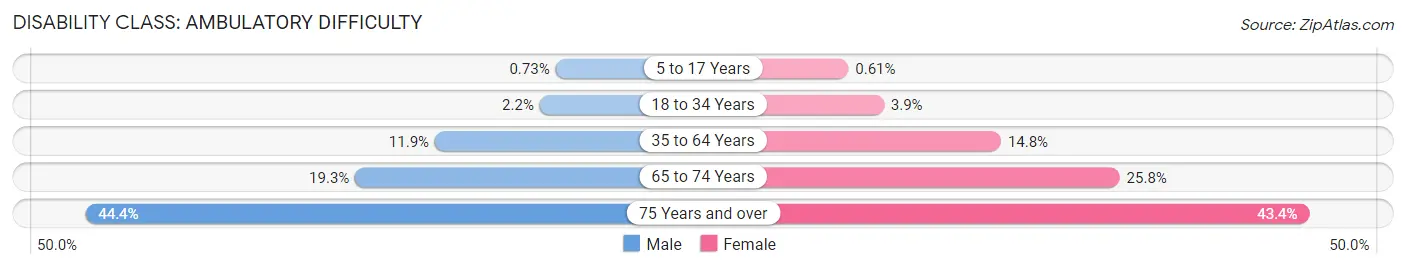
| Age Bracket | Male | Female |
| 5 to 17 Years | 82 (0.7%) | 67 (0.6%) |
| 18 to 34 Years | 312 (2.2%) | 553 (3.9%) |
| 35 to 64 Years | 2,799 (11.9%) | 3,524 (14.8%) |
| 65 to 74 Years | 1,109 (19.3%) | 1,677 (25.8%) |
| 75 Years and over | 1,442 (44.4%) | 2,166 (43.4%) |
Disability Class: Self-Care Difficulty
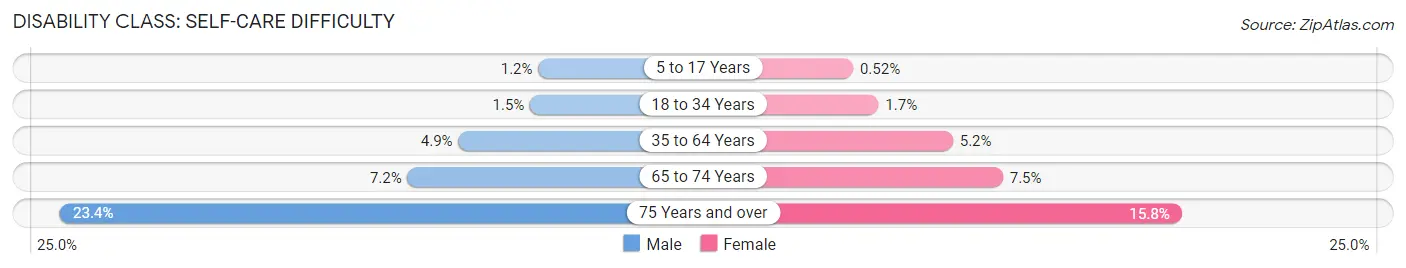
| Age Bracket | Male | Female |
| 5 to 17 Years | 131 (1.2%) | 57 (0.5%) |
| 18 to 34 Years | 220 (1.5%) | 241 (1.7%) |
| 35 to 64 Years | 1,144 (4.9%) | 1,229 (5.1%) |
| 65 to 74 Years | 415 (7.2%) | 486 (7.5%) |
| 75 Years and over | 759 (23.4%) | 787 (15.8%) |
Technology Access in Sebastian County
Computing Device Access in Sebastian County
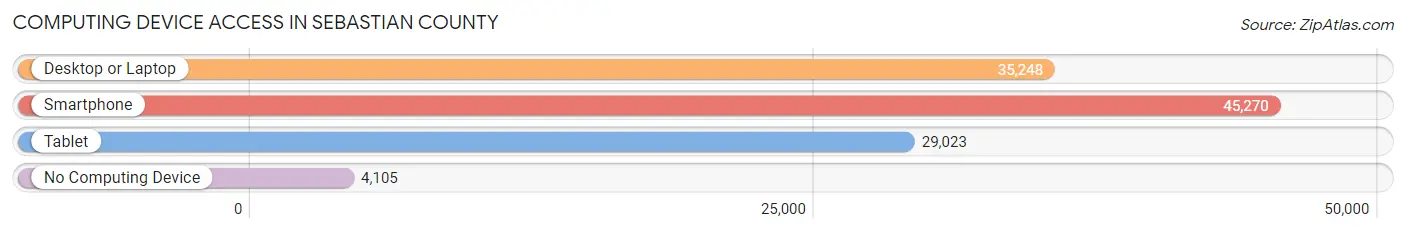
| Device Type | # Households | % Households |
| Desktop or Laptop | 35,248 | 68.0% |
| Smartphone | 45,270 | 87.3% |
| Tablet | 29,023 | 56.0% |
| No Computing Device | 4,105 | 7.9% |
| Total | 51,862 | 100.0% |
Internet Access in Sebastian County
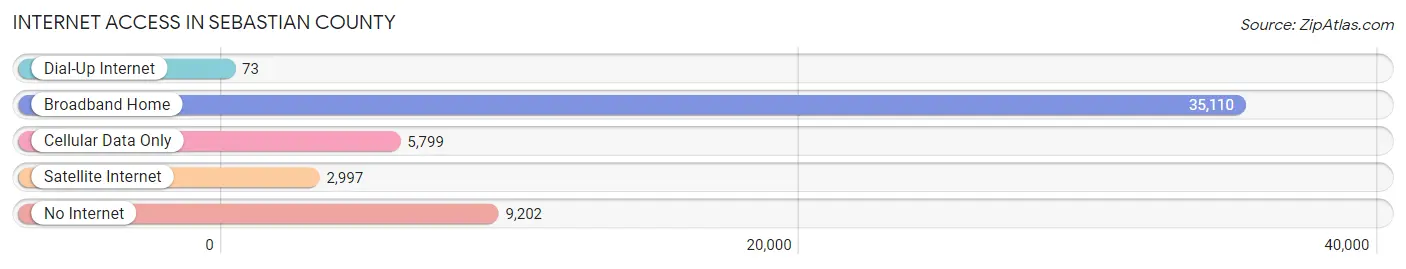
| Internet Type | # Households | % Households |
| Dial-Up Internet | 73 | 0.1% |
| Broadband Home | 35,110 | 67.7% |
| Cellular Data Only | 5,799 | 11.2% |
| Satellite Internet | 2,997 | 5.8% |
| No Internet | 9,202 | 17.7% |
| Total | 51,862 | 100.0% |
Sebastian County Summary
Sebastian County is located in the western part of Arkansas, and is bordered by Crawford County to the north, Scott County to the east, Polk County to the south, and Le Flore County, Oklahoma to the west. The county seat is Fort Smith, which is the second largest city in the state. The county was established in 1851 and named after William K. Sebastian, a United States Senator from Arkansas.
Geography
Sebastian County covers an area of 576 square miles, of which 574 square miles is land and 2 square miles is water. The county is located in the Arkansas River Valley, and is part of the Ozark Mountains. The terrain is mostly hilly, with some flat areas in the northern part of the county. The highest point in the county is Mount Magazine, which is 2,753 feet above sea level. The county is home to several rivers, including the Arkansas River, Poteau River, and Lee Creek.
Demographics
As of the 2010 census, the population of Sebastian County was 125,744, making it the fourth most populous county in Arkansas. The population density was 217 people per square mile. The racial makeup of the county was 79.2% White, 14.3% Black or African American, 0.7% Native American, 1.3% Asian, 0.1% Pacific Islander, 2.2% from other races, and 2.2% from two or more races. Hispanic or Latino of any race were 4.7% of the population.
The median income for a household in the county was $41,945, and the median income for a family was $50,919. The per capita income for the county was $21,845. About 11.2% of families and 14.7% of the population were below the poverty line, including 20.2% of those under age 18 and 9.7% of those age 65 or over.
Economy
Sebastian County is home to a diverse economy, with a variety of industries providing employment opportunities. The largest employers in the county are the Fort Smith Public Schools, Mercy Hospital, and the City of Fort Smith. Other major employers include the University of Arkansas at Fort Smith, the Fort Smith Regional Airport, and the Fort Chaffee Military Reservation.
Agriculture is also an important part of the county’s economy, with soybeans, corn, wheat, and hay being the primary crops. Livestock production is also important, with cattle, hogs, and poultry being the main animals raised.
The county is also home to several manufacturing companies, including Gerber Products, Georgia-Pacific, and Whirlpool. The county is also home to several retail stores, including Walmart, Target, and Lowe’s.
Conclusion
Sebastian County is a diverse and vibrant county located in the western part of Arkansas. The county is home to a variety of industries, including agriculture, manufacturing, and retail. The county is also home to several major employers, including the Fort Smith Public Schools, Mercy Hospital, and the City of Fort Smith. The county has a population of 125,744, and the median income for a household is $41,945.
Common Questions
What is Per Capita Income in Sebastian County?
Per Capita income in Sebastian County is $32,577.
What is the Median Family Income in Sebastian County?
Median Family Income in Sebastian County is $67,102.
What is the Median Household income in Sebastian County?
Median Household Income in Sebastian County is $54,047.
What is Income or Wage Gap in Sebastian County?
Income or Wage Gap in Sebastian County is 25.8%.
Women in Sebastian County earn 74.2 cents for every dollar earned by a man.
What is Family Income Deficit in Sebastian County?
Family Income Deficit in Sebastian County is $10,516.
Families that are below poverty line in Sebastian County earn $10,516 less on average than the poverty threshold level.
What is Inequality or Gini Index in Sebastian County?
Inequality or Gini Index in Sebastian County is 0.50.
What is the Total Population of Sebastian County?
Total Population of Sebastian County is 128,184.
What is the Total Male Population of Sebastian County?
Total Male Population of Sebastian County is 63,156.
What is the Total Female Population of Sebastian County?
Total Female Population of Sebastian County is 65,028.
What is the Ratio of Males per 100 Females in Sebastian County?
There are 97.12 Males per 100 Females in Sebastian County.
What is the Ratio of Females per 100 Males in Sebastian County?
There are 102.96 Females per 100 Males in Sebastian County.
What is the Median Population Age in Sebastian County?
Median Population Age in Sebastian County is 38.0 Years.
What is the Average Family Size in Sebastian County
Average Family Size in Sebastian County is 3.0 People.
What is the Average Household Size in Sebastian County
Average Household Size in Sebastian County is 2.4 People.
How Large is the Labor Force in Sebastian County?
There are 61,327 People in the Labor Forcein in Sebastian County.
What is the Percentage of People in the Labor Force in Sebastian County?
60.5% of People are in the Labor Force in Sebastian County.
What is the Unemployment Rate in Sebastian County?
Unemployment Rate in Sebastian County is 5.2%.