Benton County, AR Map & Demographics
Benton County Map
Benton County Overview
$43,359
PER CAPITA INCOME
$97,168
AVG FAMILY INCOME
$85,269
AVG HOUSEHOLD INCOME
27.9%
WAGE / INCOME GAP [ % ]
72.1¢/ $1
WAGE / INCOME GAP [ $ ]
$12,344
FAMILY INCOME DEFICIT
0.46
INEQUALITY / GINI INDEX
286,528
TOTAL POPULATION
144,085
MALE POPULATION
142,443
FEMALE POPULATION
101.15
MALES / 100 FEMALES
98.86
FEMALES / 100 MALES
35.7
MEDIAN AGE
3.2
AVG FAMILY SIZE
2.7
AVG HOUSEHOLD SIZE
147,324
LABOR FORCE [ PEOPLE ]
66.6%
PERCENT IN LABOR FORCE
2.9%
UNEMPLOYMENT RATE
Benton County Area Codes
Income in Benton County
Income Overview in Benton County
Per Capita Income in Benton County is $43,359, while median incomes of families and households are $97,168 and $85,269 respectively.
| Characteristic | Number | Measure |
| Per Capita Income | 286,528 | $43,359 |
| Median Family Income | 76,216 | $97,168 |
| Mean Family Income | 76,216 | $130,785 |
| Median Household Income | 104,164 | $85,269 |
| Mean Household Income | 104,164 | $116,152 |
| Income Deficit | 76,216 | $12,344 |
| Wage / Income Gap (%) | 286,528 | 27.93% |
| Wage / Income Gap ($) | 286,528 | 72.07¢ per $1 |
| Gini / Inequality Index | 286,528 | 0.46 |
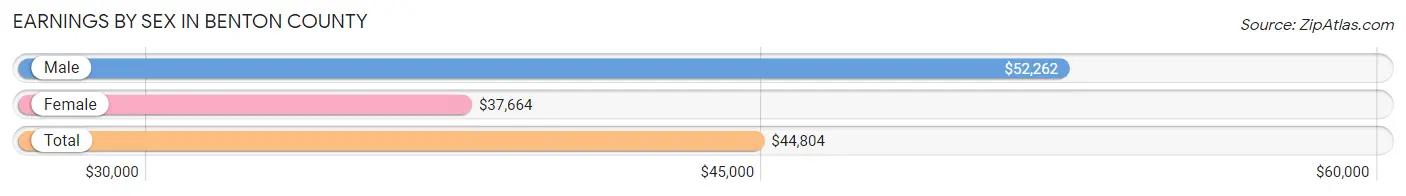
Earnings by Sex in Benton County
Average Earnings in Benton County are $44,804, $52,262 for men and $37,664 for women, a difference of 27.9%.
| Sex | Number | Average Earnings |
| Male | 82,921 (54.7%) | $52,262 |
| Female | 68,644 (45.3%) | $37,664 |
| Total | 151,565 (100.0%) | $44,804 |
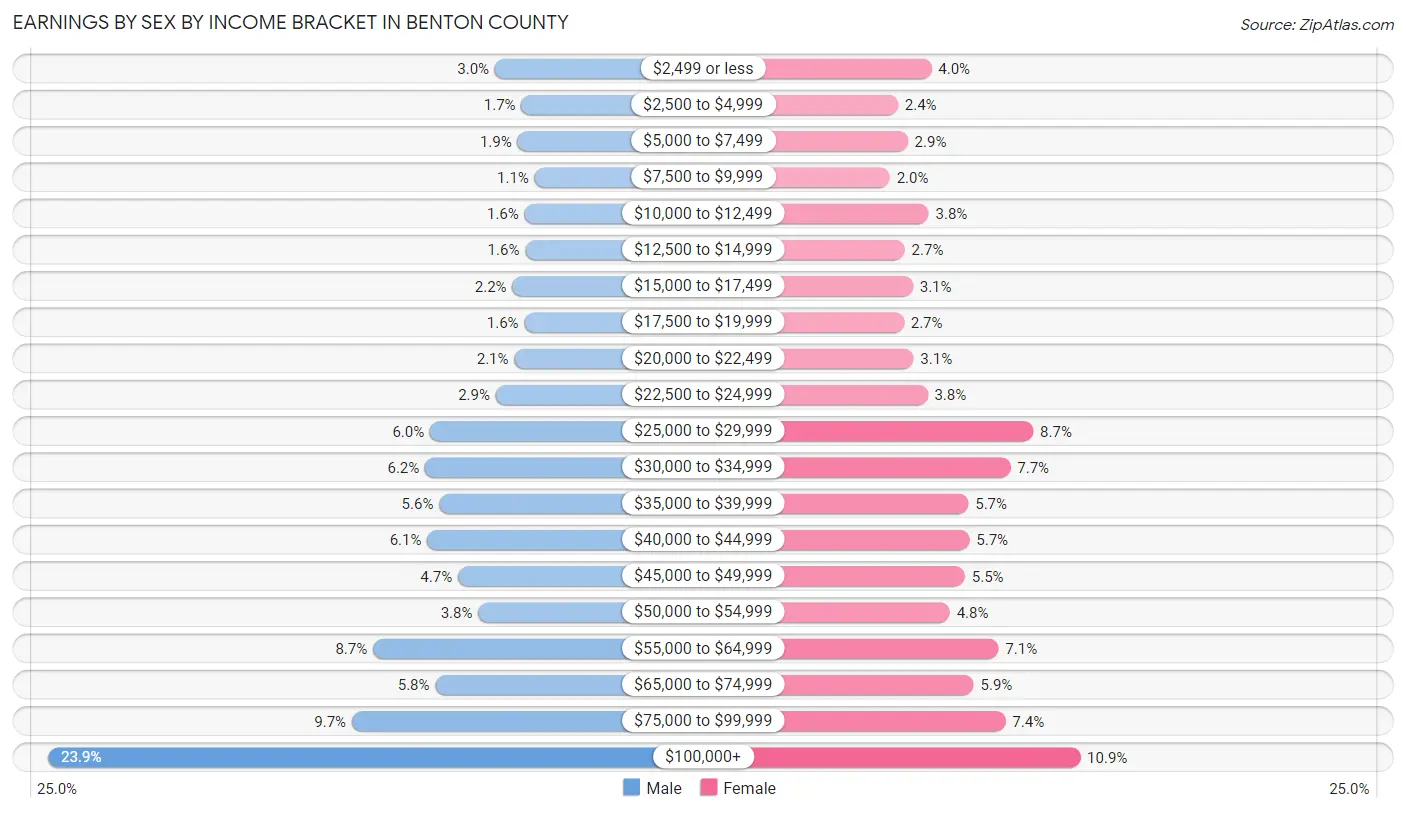
Earnings by Sex by Income Bracket in Benton County
The most common earnings brackets in Benton County are $100,000+ for men (19,821 | 23.9%) and $100,000+ for women (7,504 | 10.9%).
| Income | Male | Female |
| $2,499 or less | 2,464 (3.0%) | 2,717 (4.0%) |
| $2,500 to $4,999 | 1,432 (1.7%) | 1,644 (2.4%) |
| $5,000 to $7,499 | 1,582 (1.9%) | 1,959 (2.9%) |
| $7,500 to $9,999 | 919 (1.1%) | 1,383 (2.0%) |
| $10,000 to $12,499 | 1,307 (1.6%) | 2,626 (3.8%) |
| $12,500 to $14,999 | 1,285 (1.5%) | 1,863 (2.7%) |
| $15,000 to $17,499 | 1,785 (2.1%) | 2,122 (3.1%) |
| $17,500 to $19,999 | 1,315 (1.6%) | 1,833 (2.7%) |
| $20,000 to $22,499 | 1,708 (2.1%) | 2,145 (3.1%) |
| $22,500 to $24,999 | 2,433 (2.9%) | 2,596 (3.8%) |
| $25,000 to $29,999 | 4,980 (6.0%) | 5,991 (8.7%) |
| $30,000 to $34,999 | 5,174 (6.2%) | 5,259 (7.7%) |
| $35,000 to $39,999 | 4,630 (5.6%) | 3,905 (5.7%) |
| $40,000 to $44,999 | 5,091 (6.1%) | 3,940 (5.7%) |
| $45,000 to $49,999 | 3,895 (4.7%) | 3,793 (5.5%) |
| $50,000 to $54,999 | 3,113 (3.7%) | 3,310 (4.8%) |
| $55,000 to $64,999 | 7,197 (8.7%) | 4,875 (7.1%) |
| $65,000 to $74,999 | 4,774 (5.8%) | 4,079 (5.9%) |
| $75,000 to $99,999 | 8,016 (9.7%) | 5,100 (7.4%) |
| $100,000+ | 19,821 (23.9%) | 7,504 (10.9%) |
| Total | 82,921 (100.0%) | 68,644 (100.0%) |
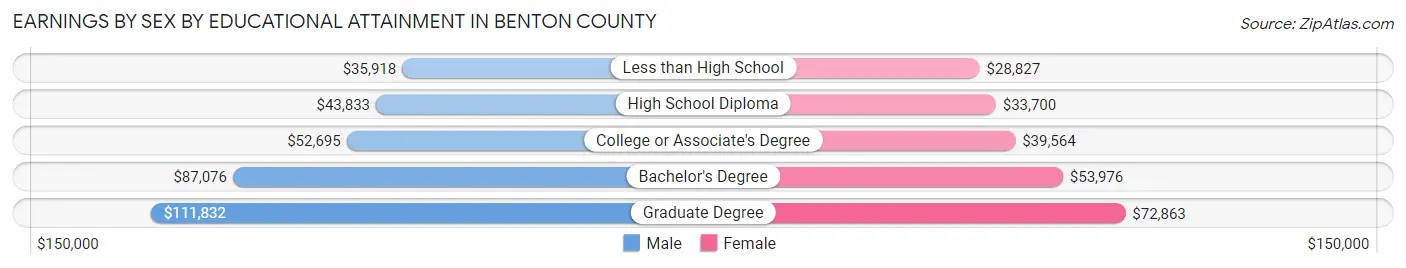
Earnings by Sex by Educational Attainment in Benton County
Average earnings in Benton County are $58,703 for men and $42,549 for women, a difference of 27.5%. Men with an educational attainment of graduate degree enjoy the highest average annual earnings of $111,832, while those with less than high school education earn the least with $35,918. Women with an educational attainment of graduate degree earn the most with the average annual earnings of $72,863, while those with less than high school education have the smallest earnings of $28,827.
| Educational Attainment | Male Income | Female Income |
| Less than High School | $35,918 | $28,827 |
| High School Diploma | $43,833 | $33,700 |
| College or Associate's Degree | $52,695 | $39,564 |
| Bachelor's Degree | $87,076 | $53,976 |
| Graduate Degree | $111,832 | $72,863 |
| Total | $58,703 | $42,549 |
Family Income in Benton County
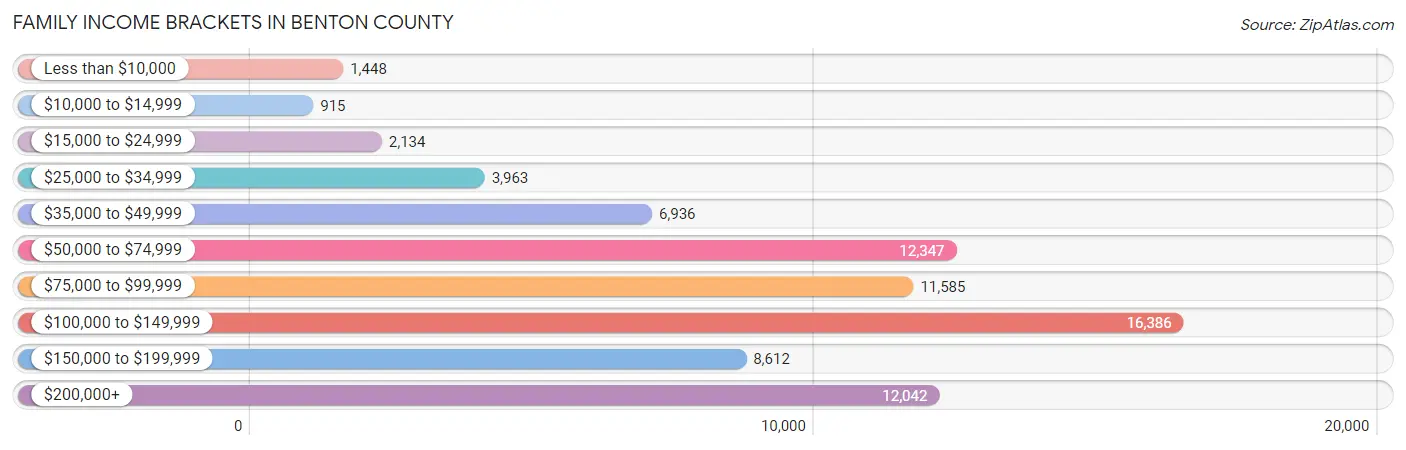
Family Income Brackets in Benton County
According to the Benton County family income data, there are 16,386 families falling into the $100,000 to $149,999 income range, which is the most common income bracket and makes up 21.5% of all families. Conversely, the $10,000 to $14,999 income bracket is the least frequent group with only 915 families (1.2%) belonging to this category.
| Income Bracket | # Families | % Families |
| Less than $10,000 | 1,448 | 1.9% |
| $10,000 to $14,999 | 915 | 1.2% |
| $15,000 to $24,999 | 2,134 | 2.8% |
| $25,000 to $34,999 | 3,963 | 5.2% |
| $35,000 to $49,999 | 6,936 | 9.1% |
| $50,000 to $74,999 | 12,347 | 16.2% |
| $75,000 to $99,999 | 11,585 | 15.2% |
| $100,000 to $149,999 | 16,386 | 21.5% |
| $150,000 to $199,999 | 8,612 | 11.3% |
| $200,000+ | 12,042 | 15.8% |
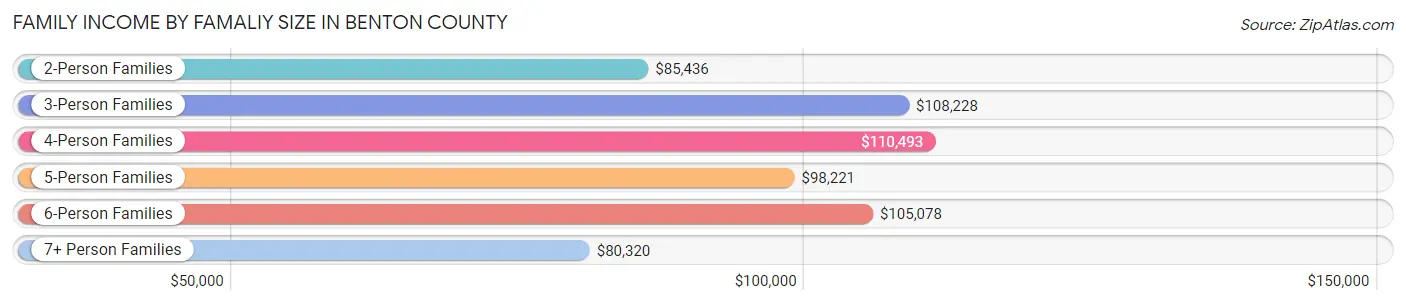
Family Income by Famaliy Size in Benton County
4-person families (14,938 | 19.6%) account for the highest median family income in Benton County with $110,493 per family, while 2-person families (32,673 | 42.9%) have the highest median income of $42,718 per family member.
| Income Bracket | # Families | Median Income |
| 2-Person Families | 32,673 (42.9%) | $85,436 |
| 3-Person Families | 16,627 (21.8%) | $108,228 |
| 4-Person Families | 14,938 (19.6%) | $110,493 |
| 5-Person Families | 7,130 (9.3%) | $98,221 |
| 6-Person Families | 3,199 (4.2%) | $105,078 |
| 7+ Person Families | 1,649 (2.2%) | $80,320 |
| Total | 76,216 (100.0%) | $97,168 |
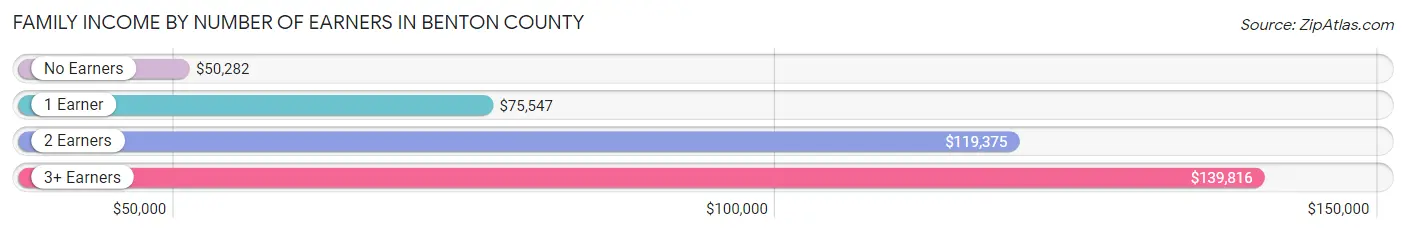
Family Income by Number of Earners in Benton County
The median family income in Benton County is $97,168, with families comprising 3+ earners (7,908) having the highest median family income of $139,816, while families with no earners (9,764) have the lowest median family income of $50,282, accounting for 10.4% and 12.8% of families, respectively.
| Number of Earners | # Families | Median Income |
| No Earners | 9,764 (12.8%) | $50,282 |
| 1 Earner | 24,806 (32.6%) | $75,547 |
| 2 Earners | 33,738 (44.3%) | $119,375 |
| 3+ Earners | 7,908 (10.4%) | $139,816 |
| Total | 76,216 (100.0%) | $97,168 |
Household Income in Benton County
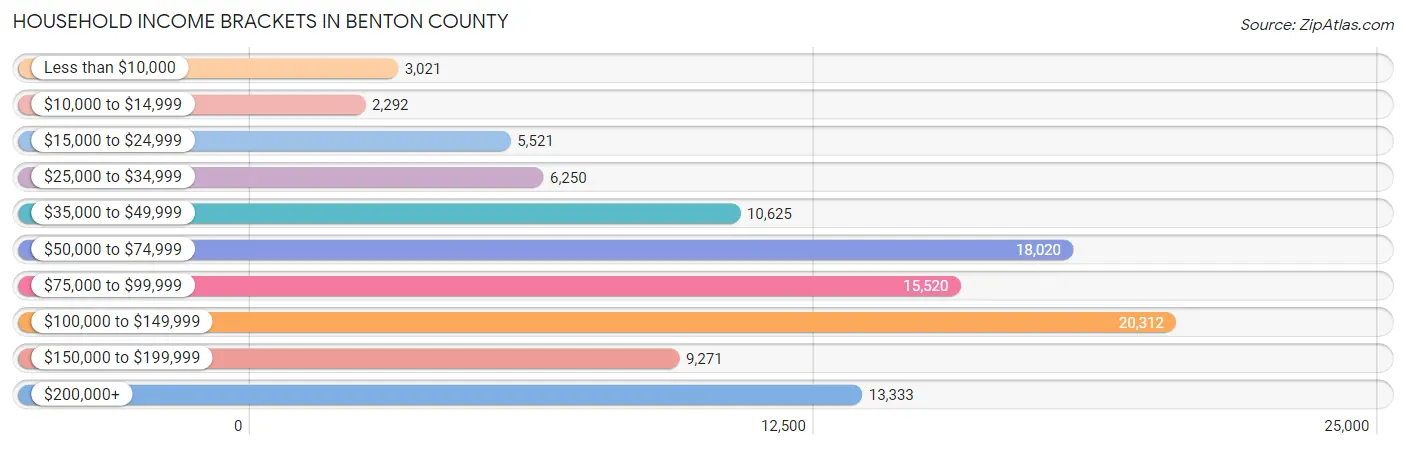
Household Income Brackets in Benton County
With 20,312 households falling in the category, the $100,000 to $149,999 income range is the most frequent in Benton County, accounting for 19.5% of all households. In contrast, only 2,292 households (2.2%) fall into the $10,000 to $14,999 income bracket, making it the least populous group.
| Income Bracket | # Households | % Households |
| Less than $10,000 | 3,021 | 2.9% |
| $10,000 to $14,999 | 2,292 | 2.2% |
| $15,000 to $24,999 | 5,521 | 5.3% |
| $25,000 to $34,999 | 6,250 | 6.0% |
| $35,000 to $49,999 | 10,625 | 10.2% |
| $50,000 to $74,999 | 18,020 | 17.3% |
| $75,000 to $99,999 | 15,520 | 14.9% |
| $100,000 to $149,999 | 20,312 | 19.5% |
| $150,000 to $199,999 | 9,271 | 8.9% |
| $200,000+ | 13,333 | 12.8% |
Household Income by Householder Age in Benton County
The median household income in Benton County is $85,269, with the highest median household income of $98,870 found in the 45 to 64 years age bracket for the primary householder. A total of 36,115 households (34.7%) fall into this category. Meanwhile, the 65+ years age bracket for the primary householder has the lowest median household income of $56,712, with 22,618 households (21.7%) in this group.
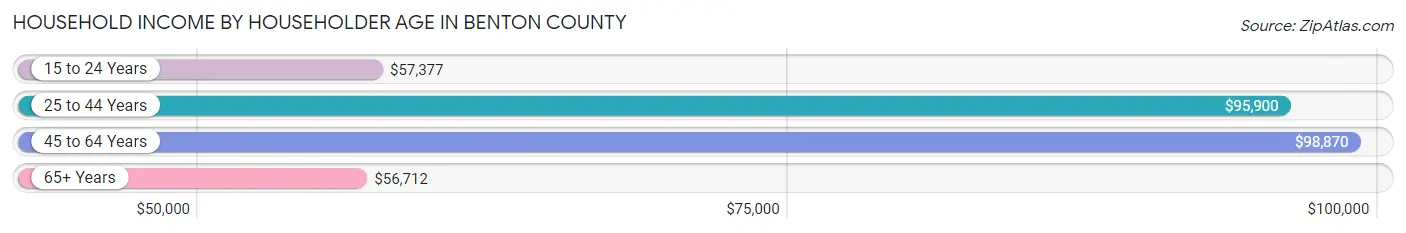
| Income Bracket | # Households | Median Income |
| 15 to 24 Years | 4,012 (3.8%) | $57,377 |
| 25 to 44 Years | 41,419 (39.8%) | $95,900 |
| 45 to 64 Years | 36,115 (34.7%) | $98,870 |
| 65+ Years | 22,618 (21.7%) | $56,712 |
| Total | 104,164 (100.0%) | $85,269 |
Poverty in Benton County
Income Below Poverty by Sex and Age in Benton County
With 7.1% poverty level for males and 8.6% for females among the residents of Benton County, under 5 year old males and under 5 year old females are the most vulnerable to poverty, with 1,502 males (15.5%) and 1,365 females (15.2%) in their respective age groups living below the poverty level.
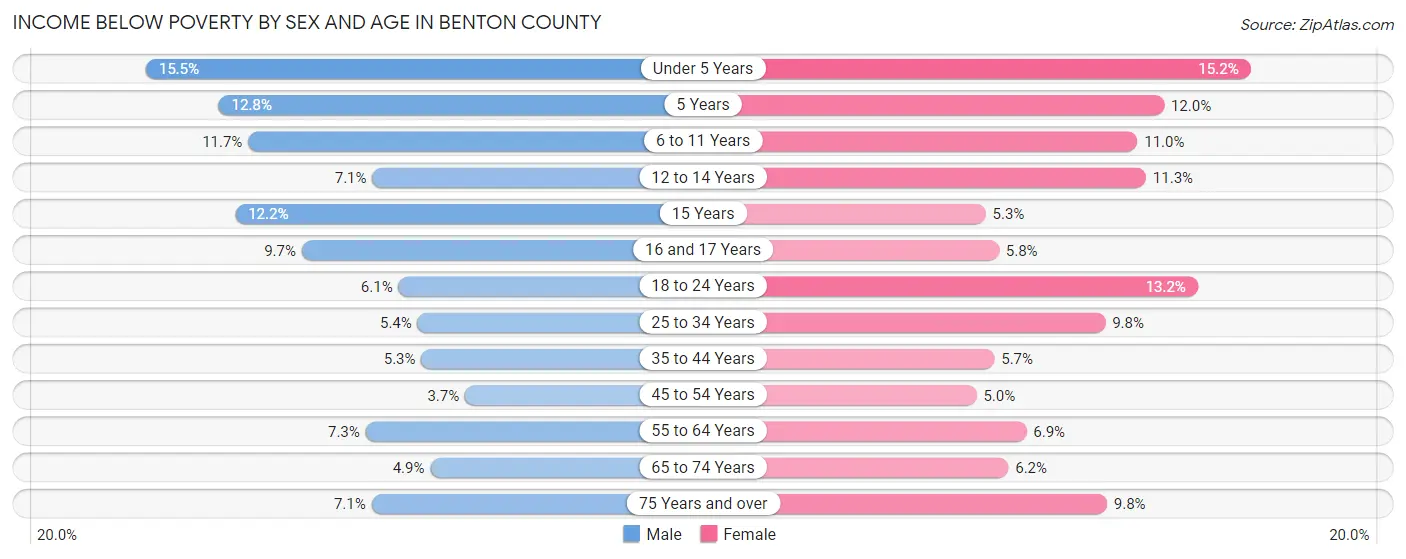
| Age Bracket | Male | Female |
| Under 5 Years | 1,502 (15.5%) | 1,365 (15.2%) |
| 5 Years | 273 (12.8%) | 206 (12.0%) |
| 6 to 11 Years | 1,512 (11.7%) | 1,371 (11.0%) |
| 12 to 14 Years | 436 (7.1%) | 667 (11.3%) |
| 15 Years | 254 (12.2%) | 115 (5.3%) |
| 16 and 17 Years | 429 (9.7%) | 230 (5.8%) |
| 18 to 24 Years | 723 (6.1%) | 1,487 (13.2%) |
| 25 to 34 Years | 1,151 (5.4%) | 2,005 (9.8%) |
| 35 to 44 Years | 1,148 (5.3%) | 1,141 (5.7%) |
| 45 to 54 Years | 646 (3.6%) | 855 (5.0%) |
| 55 to 64 Years | 1,104 (7.3%) | 1,068 (6.9%) |
| 65 to 74 Years | 526 (4.9%) | 737 (6.2%) |
| 75 Years and over | 458 (7.1%) | 880 (9.8%) |
| Total | 10,162 (7.1%) | 12,127 (8.6%) |
Income Above Poverty by Sex and Age in Benton County
According to the poverty statistics in Benton County, males aged 45 to 54 years and females aged 45 to 54 years are the age groups that are most secure financially, with 96.4% of males and 95.0% of females in these age groups living above the poverty line.
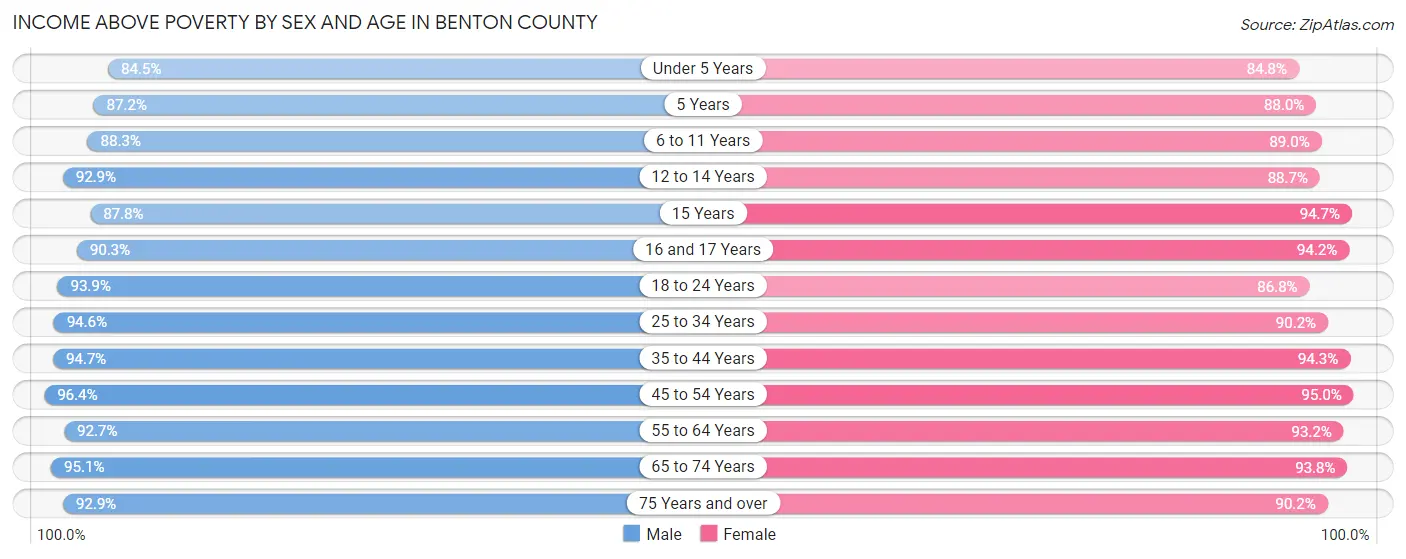
| Age Bracket | Male | Female |
| Under 5 Years | 8,190 (84.5%) | 7,632 (84.8%) |
| 5 Years | 1,860 (87.2%) | 1,517 (88.0%) |
| 6 to 11 Years | 11,406 (88.3%) | 11,128 (89.0%) |
| 12 to 14 Years | 5,710 (92.9%) | 5,242 (88.7%) |
| 15 Years | 1,831 (87.8%) | 2,038 (94.7%) |
| 16 and 17 Years | 3,988 (90.3%) | 3,714 (94.2%) |
| 18 to 24 Years | 11,088 (93.9%) | 9,771 (86.8%) |
| 25 to 34 Years | 20,143 (94.6%) | 18,506 (90.2%) |
| 35 to 44 Years | 20,623 (94.7%) | 19,011 (94.3%) |
| 45 to 54 Years | 17,033 (96.4%) | 16,258 (95.0%) |
| 55 to 64 Years | 13,947 (92.7%) | 14,521 (93.1%) |
| 65 to 74 Years | 10,125 (95.1%) | 11,181 (93.8%) |
| 75 Years and over | 5,977 (92.9%) | 8,064 (90.2%) |
| Total | 131,921 (92.8%) | 128,583 (91.4%) |
Income Below Poverty Among Married-Couple Families in Benton County
The poverty statistics for married-couple families in Benton County show that 3.6% or 2,206 of the total 61,165 families live below the poverty line. Families with 5 or more children have the highest poverty rate of 17.6%, comprising of 134 families. On the other hand, families with no children have the lowest poverty rate of 2.4%, which includes 764 families.
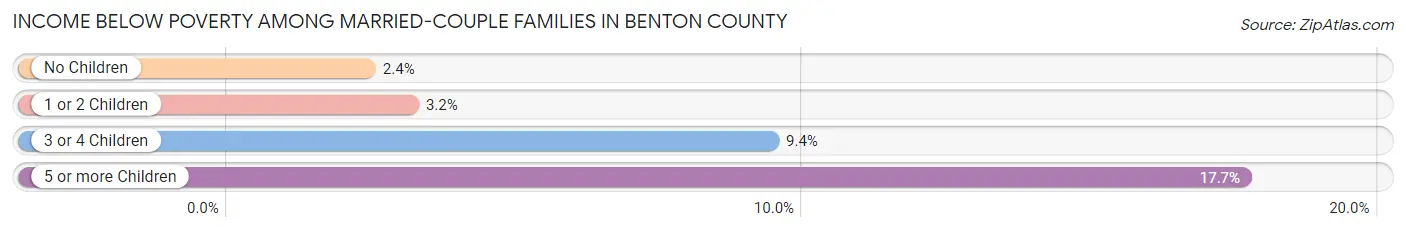
| Children | Above Poverty | Below Poverty |
| No Children | 31,068 (97.6%) | 764 (2.4%) |
| 1 or 2 Children | 21,382 (96.9%) | 696 (3.2%) |
| 3 or 4 Children | 5,884 (90.6%) | 612 (9.4%) |
| 5 or more Children | 625 (82.4%) | 134 (17.6%) |
| Total | 58,959 (96.4%) | 2,206 (3.6%) |
Income Below Poverty Among Single-Parent Households in Benton County
According to the poverty data in Benton County, 12.2% or 565 single-father households and 16.3% or 1,691 single-mother households are living below the poverty line. Among single-father households, those with 5 or more children have the highest poverty rate, with 158 households (67.5%) experiencing poverty. Likewise, among single-mother households, those with 5 or more children have the highest poverty rate, with 179 households (68.1%) falling below the poverty line.
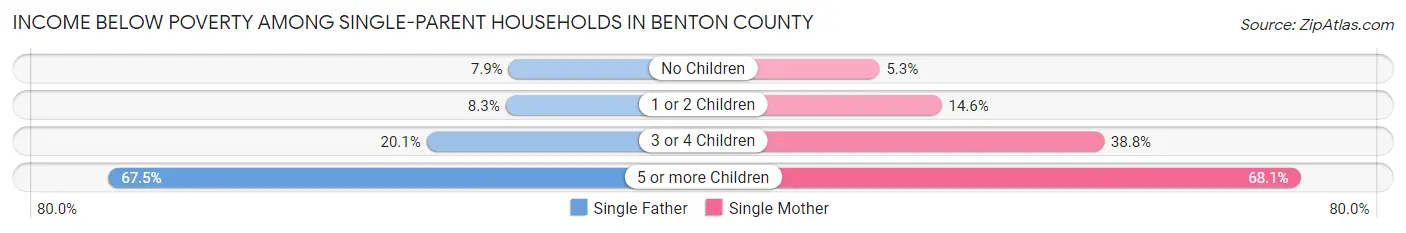
| Children | Single Father | Single Mother |
| No Children | 144 (7.9%) | 162 (5.3%) |
| 1 or 2 Children | 183 (8.3%) | 847 (14.6%) |
| 3 or 4 Children | 80 (20.1%) | 503 (38.8%) |
| 5 or more Children | 158 (67.5%) | 179 (68.1%) |
| Total | 565 (12.2%) | 1,691 (16.3%) |
Income Below Poverty Among Married-Couple vs Single-Parent Households in Benton County
The poverty data for Benton County shows that 2,206 of the married-couple family households (3.6%) and 2,256 of the single-parent households (15.0%) are living below the poverty level. Within the married-couple family households, those with 5 or more children have the highest poverty rate, with 134 households (17.6%) falling below the poverty line. Among the single-parent households, those with 5 or more children have the highest poverty rate, with 337 household (67.8%) living below poverty.
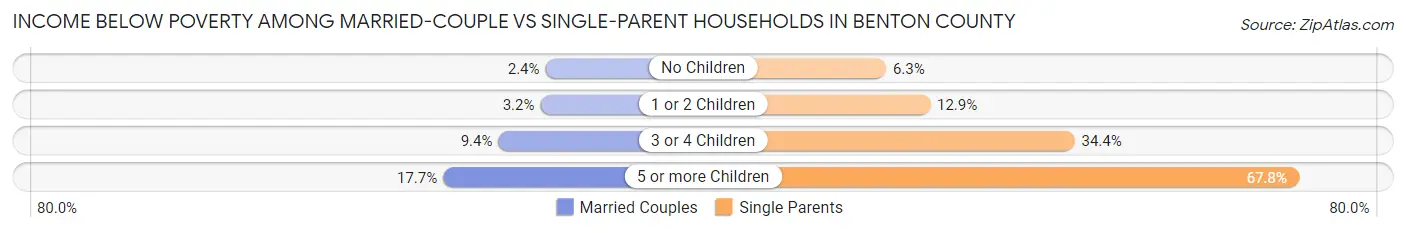
| Children | Married-Couple Families | Single-Parent Households |
| No Children | 764 (2.4%) | 306 (6.3%) |
| 1 or 2 Children | 696 (3.2%) | 1,030 (12.9%) |
| 3 or 4 Children | 612 (9.4%) | 583 (34.4%) |
| 5 or more Children | 134 (17.6%) | 337 (67.8%) |
| Total | 2,206 (3.6%) | 2,256 (15.0%) |
Race in Benton County
The most populous races in Benton County are White / Caucasian (205,967 | 71.9%), Hispanic or Latino (49,721 | 17.3%), and Two or more Races (47,441 | 16.6%).
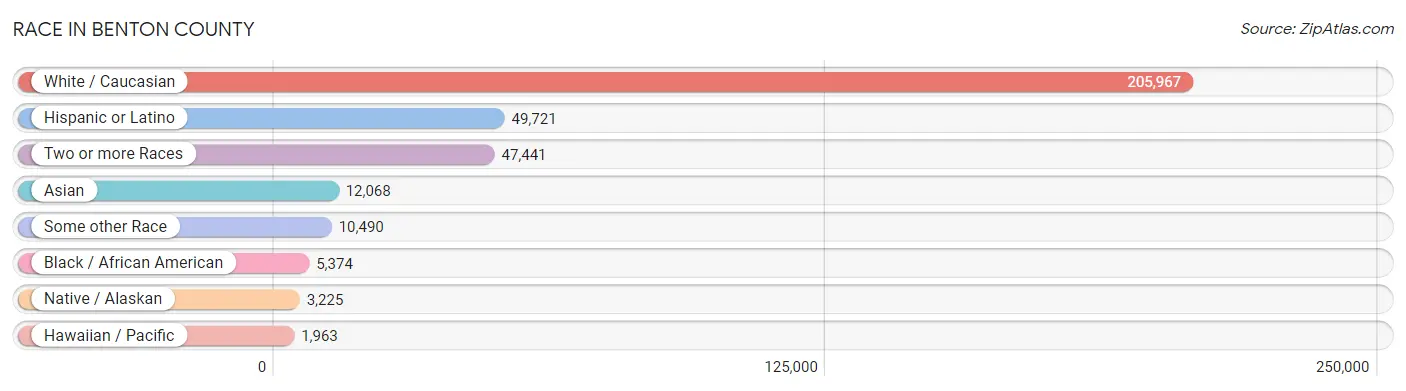
| Race | # Population | % Population |
| Asian | 12,068 | 4.2% |
| Black / African American | 5,374 | 1.9% |
| Hawaiian / Pacific | 1,963 | 0.7% |
| Hispanic or Latino | 49,721 | 17.3% |
| Native / Alaskan | 3,225 | 1.1% |
| White / Caucasian | 205,967 | 71.9% |
| Two or more Races | 47,441 | 16.6% |
| Some other Race | 10,490 | 3.7% |
| Total | 286,528 | 100.0% |
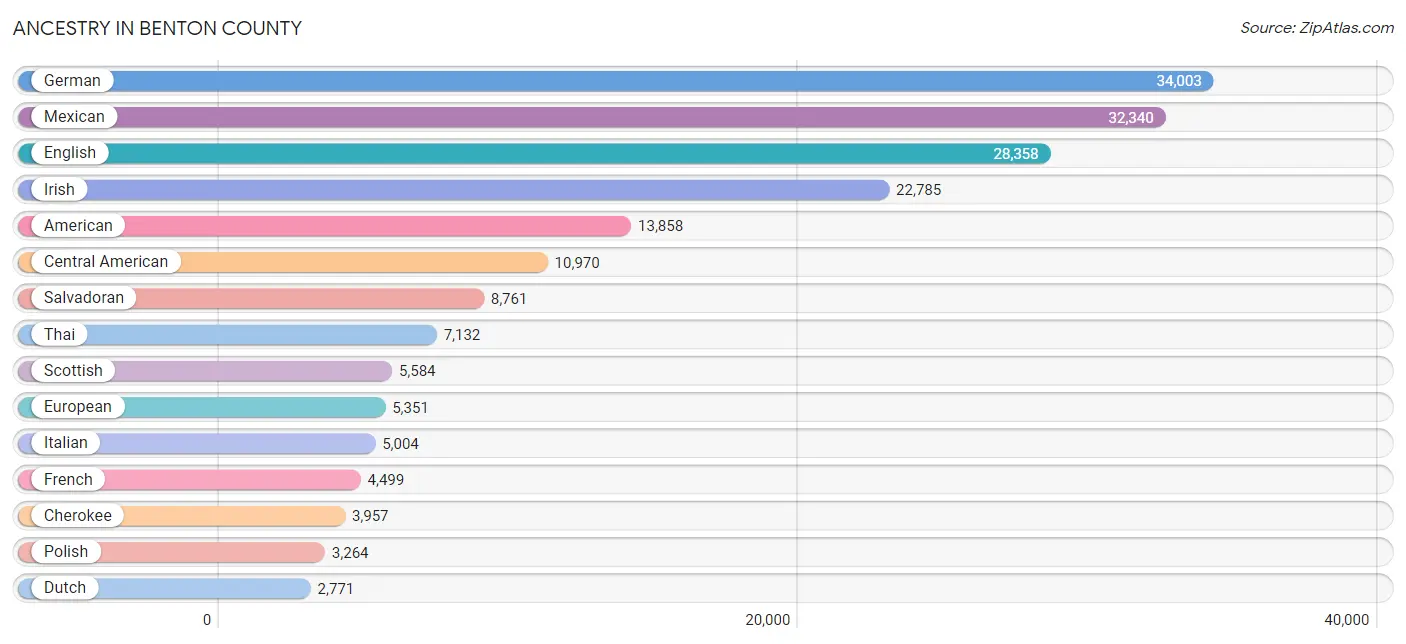
Ancestry in Benton County
The most populous ancestries reported in Benton County are German (34,003 | 11.9%), Mexican (32,340 | 11.3%), English (28,358 | 9.9%), Irish (22,785 | 8.0%), and American (13,858 | 4.8%), together accounting for 45.9% of all Benton County residents.
| Ancestry | # Population | % Population |
| African | 236 | 0.1% |
| Alaskan Athabascan | 12 | 0.0% |
| Albanian | 14 | 0.0% |
| Aleut | 256 | 0.1% |
| American | 13,858 | 4.8% |
| Apache | 190 | 0.1% |
| Arab | 618 | 0.2% |
| Argentinean | 79 | 0.0% |
| Armenian | 24 | 0.0% |
| Australian | 121 | 0.0% |
| Austrian | 457 | 0.2% |
| Bahamian | 8 | 0.0% |
| Bangladeshi | 669 | 0.2% |
| Belgian | 154 | 0.1% |
| Bermudan | 9 | 0.0% |
| Bhutanese | 612 | 0.2% |
| Blackfeet | 29 | 0.0% |
| Bolivian | 41 | 0.0% |
| Brazilian | 373 | 0.1% |
| British | 2,230 | 0.8% |
| Bulgarian | 32 | 0.0% |
| Burmese | 756 | 0.3% |
| Cajun | 205 | 0.1% |
| Canadian | 356 | 0.1% |
| Celtic | 45 | 0.0% |
| Central American | 10,970 | 3.8% |
| Central American Indian | 167 | 0.1% |
| Cherokee | 3,957 | 1.4% |
| Cheyenne | 6 | 0.0% |
| Chickasaw | 86 | 0.0% |
| Chilean | 52 | 0.0% |
| Chinese | 59 | 0.0% |
| Chippewa | 73 | 0.0% |
| Choctaw | 700 | 0.2% |
| Colombian | 347 | 0.1% |
| Comanche | 50 | 0.0% |
| Costa Rican | 53 | 0.0% |
| Creek | 236 | 0.1% |
| Croatian | 52 | 0.0% |
| Cuban | 554 | 0.2% |
| Czech | 674 | 0.2% |
| Czechoslovakian | 166 | 0.1% |
| Danish | 986 | 0.3% |
| Delaware | 6 | 0.0% |
| Dominican | 687 | 0.2% |
| Dutch | 2,771 | 1.0% |
| Dutch West Indian | 29 | 0.0% |
| Eastern European | 354 | 0.1% |
| Ecuadorian | 162 | 0.1% |
| Egyptian | 190 | 0.1% |
| English | 28,358 | 9.9% |
| Estonian | 32 | 0.0% |
| Ethiopian | 24 | 0.0% |
| European | 5,351 | 1.9% |
| Fijian | 1,639 | 0.6% |
| Filipino | 116 | 0.0% |
| Finnish | 497 | 0.2% |
| French | 4,499 | 1.6% |
| French American Indian | 11 | 0.0% |
| French Canadian | 602 | 0.2% |
| German | 34,003 | 11.9% |
| Ghanaian | 114 | 0.0% |
| Greek | 298 | 0.1% |
| Guamanian / Chamorro | 67 | 0.0% |
| Guatemalan | 1,223 | 0.4% |
| Haitian | 69 | 0.0% |
| Honduran | 594 | 0.2% |
| Hopi | 1 | 0.0% |
| Hungarian | 408 | 0.1% |
| Icelander | 23 | 0.0% |
| Indian (Asian) | 1,133 | 0.4% |
| Indonesian | 12 | 0.0% |
| Inupiat | 17 | 0.0% |
| Iranian | 43 | 0.0% |
| Irish | 22,785 | 8.0% |
| Iroquois | 28 | 0.0% |
| Israeli | 52 | 0.0% |
| Italian | 5,004 | 1.8% |
| Jamaican | 88 | 0.0% |
| Japanese | 96 | 0.0% |
| Kenyan | 66 | 0.0% |
| Korean | 1,881 | 0.7% |
| Laotian | 8 | 0.0% |
| Latvian | 42 | 0.0% |
| Lebanese | 239 | 0.1% |
| Liberian | 20 | 0.0% |
| Lithuanian | 263 | 0.1% |
| Luxembourger | 7 | 0.0% |
| Macedonian | 6 | 0.0% |
| Malaysian | 732 | 0.3% |
| Maltese | 27 | 0.0% |
| Marshallese | 125 | 0.0% |
| Mexican | 32,340 | 11.3% |
| Mexican American Indian | 629 | 0.2% |
| Mongolian | 77 | 0.0% |
| Moroccan | 7 | 0.0% |
| Native Hawaiian | 206 | 0.1% |
| Navajo | 76 | 0.0% |
| New Zealander | 96 | 0.0% |
| Nicaraguan | 209 | 0.1% |
| Nigerian | 131 | 0.1% |
| Northern European | 445 | 0.2% |
| Norwegian | 2,505 | 0.9% |
| Osage | 84 | 0.0% |
| Pakistani | 149 | 0.1% |
| Palestinian | 53 | 0.0% |
| Panamanian | 130 | 0.1% |
| Pennsylvania German | 33 | 0.0% |
| Peruvian | 188 | 0.1% |
| Polish | 3,264 | 1.1% |
| Portuguese | 438 | 0.2% |
| Potawatomi | 266 | 0.1% |
| Puerto Rican | 1,566 | 0.5% |
| Romanian | 37 | 0.0% |
| Russian | 473 | 0.2% |
| Salvadoran | 8,761 | 3.1% |
| Samoan | 35 | 0.0% |
| Scandinavian | 924 | 0.3% |
| Scotch-Irish | 2,755 | 1.0% |
| Scottish | 5,584 | 1.9% |
| Seminole | 3 | 0.0% |
| Serbian | 51 | 0.0% |
| Shoshone | 26 | 0.0% |
| Sierra Leonean | 130 | 0.1% |
| Sioux | 12 | 0.0% |
| Slavic | 4 | 0.0% |
| Slovak | 32 | 0.0% |
| Slovene | 20 | 0.0% |
| South African | 36 | 0.0% |
| South American | 1,018 | 0.4% |
| South American Indian | 13 | 0.0% |
| Spaniard | 594 | 0.2% |
| Spanish | 283 | 0.1% |
| Spanish American | 118 | 0.0% |
| Sri Lankan | 1,438 | 0.5% |
| Subsaharan African | 983 | 0.3% |
| Swedish | 1,945 | 0.7% |
| Swiss | 755 | 0.3% |
| Syrian | 10 | 0.0% |
| Thai | 7,132 | 2.5% |
| Tlingit-Haida | 11 | 0.0% |
| Tohono O'Odham | 35 | 0.0% |
| Tongan | 29 | 0.0% |
| Trinidadian and Tobagonian | 354 | 0.1% |
| Turkish | 48 | 0.0% |
| Ukrainian | 320 | 0.1% |
| Venezuelan | 149 | 0.1% |
| Welsh | 1,072 | 0.4% |
| West Indian | 375 | 0.1% |
| Yakama | 10 | 0.0% |
| Yugoslavian | 95 | 0.0% |
| Yup'ik | 73 | 0.0% | View All 152 Rows |
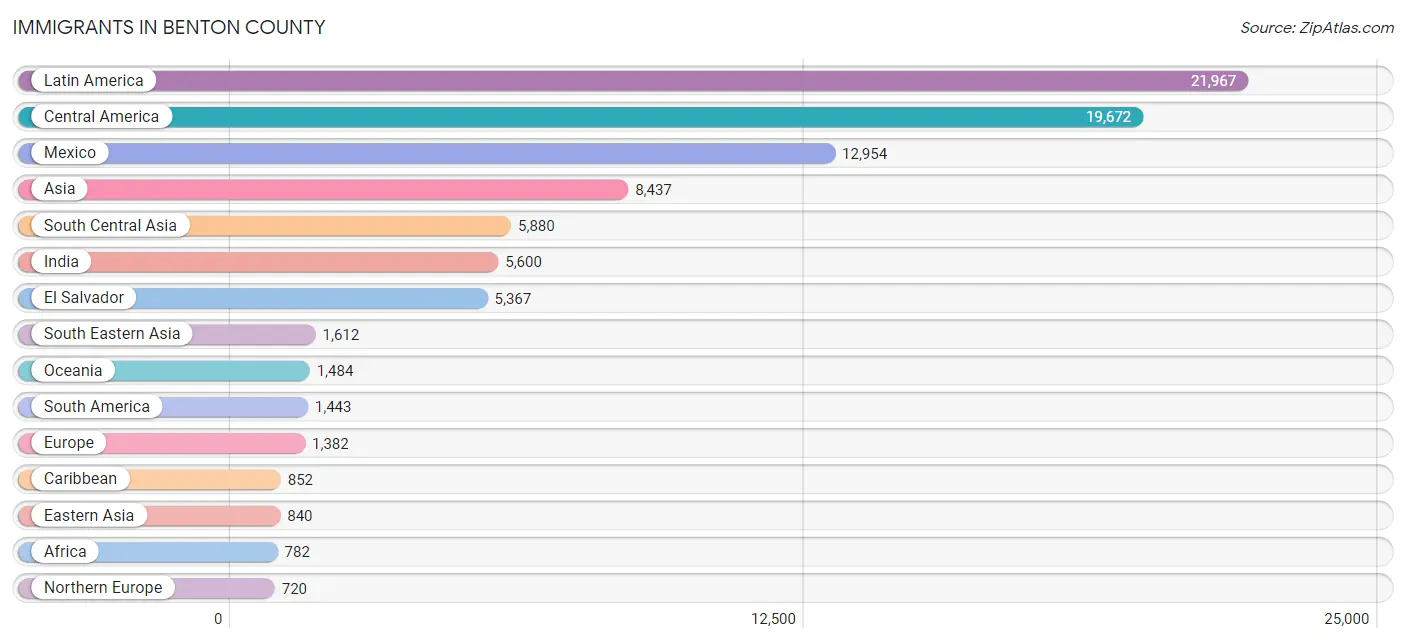
Immigrants in Benton County
The most numerous immigrant groups reported in Benton County came from Latin America (21,967 | 7.7%), Central America (19,672 | 6.9%), Mexico (12,954 | 4.5%), Asia (8,437 | 2.9%), and South Central Asia (5,880 | 2.1%), together accounting for 24.0% of all Benton County residents.
| Immigration Origin | # Population | % Population |
| Africa | 782 | 0.3% |
| Argentina | 61 | 0.0% |
| Asia | 8,437 | 2.9% |
| Australia | 213 | 0.1% |
| Austria | 45 | 0.0% |
| Bahamas | 8 | 0.0% |
| Bolivia | 13 | 0.0% |
| Bosnia and Herzegovina | 7 | 0.0% |
| Brazil | 653 | 0.2% |
| Cambodia | 93 | 0.0% |
| Canada | 225 | 0.1% |
| Caribbean | 852 | 0.3% |
| Central America | 19,672 | 6.9% |
| Chile | 32 | 0.0% |
| China | 450 | 0.2% |
| Colombia | 261 | 0.1% |
| Congo | 29 | 0.0% |
| Costa Rica | 309 | 0.1% |
| Cuba | 190 | 0.1% |
| Czechoslovakia | 14 | 0.0% |
| Dominican Republic | 298 | 0.1% |
| Eastern Africa | 131 | 0.1% |
| Eastern Asia | 840 | 0.3% |
| Eastern Europe | 156 | 0.1% |
| Ecuador | 154 | 0.1% |
| Egypt | 104 | 0.0% |
| El Salvador | 5,367 | 1.9% |
| England | 211 | 0.1% |
| Ethiopia | 24 | 0.0% |
| Europe | 1,382 | 0.5% |
| France | 49 | 0.0% |
| Germany | 259 | 0.1% |
| Ghana | 62 | 0.0% |
| Greece | 44 | 0.0% |
| Guatemala | 703 | 0.3% |
| Haiti | 10 | 0.0% |
| Honduras | 136 | 0.1% |
| Hungary | 13 | 0.0% |
| India | 5,600 | 1.9% |
| Indonesia | 43 | 0.0% |
| Iran | 18 | 0.0% |
| Ireland | 11 | 0.0% |
| Israel | 48 | 0.0% |
| Italy | 18 | 0.0% |
| Jamaica | 58 | 0.0% |
| Japan | 82 | 0.0% |
| Kenya | 66 | 0.0% |
| Korea | 308 | 0.1% |
| Kuwait | 9 | 0.0% |
| Laos | 338 | 0.1% |
| Latin America | 21,967 | 7.7% |
| Malaysia | 23 | 0.0% |
| Mexico | 12,954 | 4.5% |
| Micronesia | 54 | 0.0% |
| Middle Africa | 29 | 0.0% |
| Morocco | 7 | 0.0% |
| Nepal | 108 | 0.0% |
| Netherlands | 58 | 0.0% |
| Nicaragua | 143 | 0.1% |
| Nigeria | 137 | 0.1% |
| Northern Africa | 111 | 0.0% |
| Northern Europe | 720 | 0.3% |
| Oceania | 1,484 | 0.5% |
| Pakistan | 134 | 0.1% |
| Panama | 60 | 0.0% |
| Peru | 63 | 0.0% |
| Philippines | 367 | 0.1% |
| Poland | 54 | 0.0% |
| Portugal | 21 | 0.0% |
| Russia | 15 | 0.0% |
| Scotland | 68 | 0.0% |
| Sierra Leone | 53 | 0.0% |
| South Africa | 105 | 0.0% |
| South America | 1,443 | 0.5% |
| South Central Asia | 5,880 | 2.1% |
| South Eastern Asia | 1,612 | 0.6% |
| Southern Europe | 88 | 0.0% |
| Spain | 5 | 0.0% |
| Sri Lanka | 10 | 0.0% |
| Taiwan | 128 | 0.0% |
| Thailand | 42 | 0.0% |
| Trinidad and Tobago | 288 | 0.1% |
| Turkey | 48 | 0.0% |
| Ukraine | 12 | 0.0% |
| Uzbekistan | 10 | 0.0% |
| Venezuela | 206 | 0.1% |
| Vietnam | 700 | 0.2% |
| Western Africa | 305 | 0.1% |
| Western Asia | 105 | 0.0% |
| Western Europe | 411 | 0.1% |
| Zimbabwe | 33 | 0.0% | View All 91 Rows |
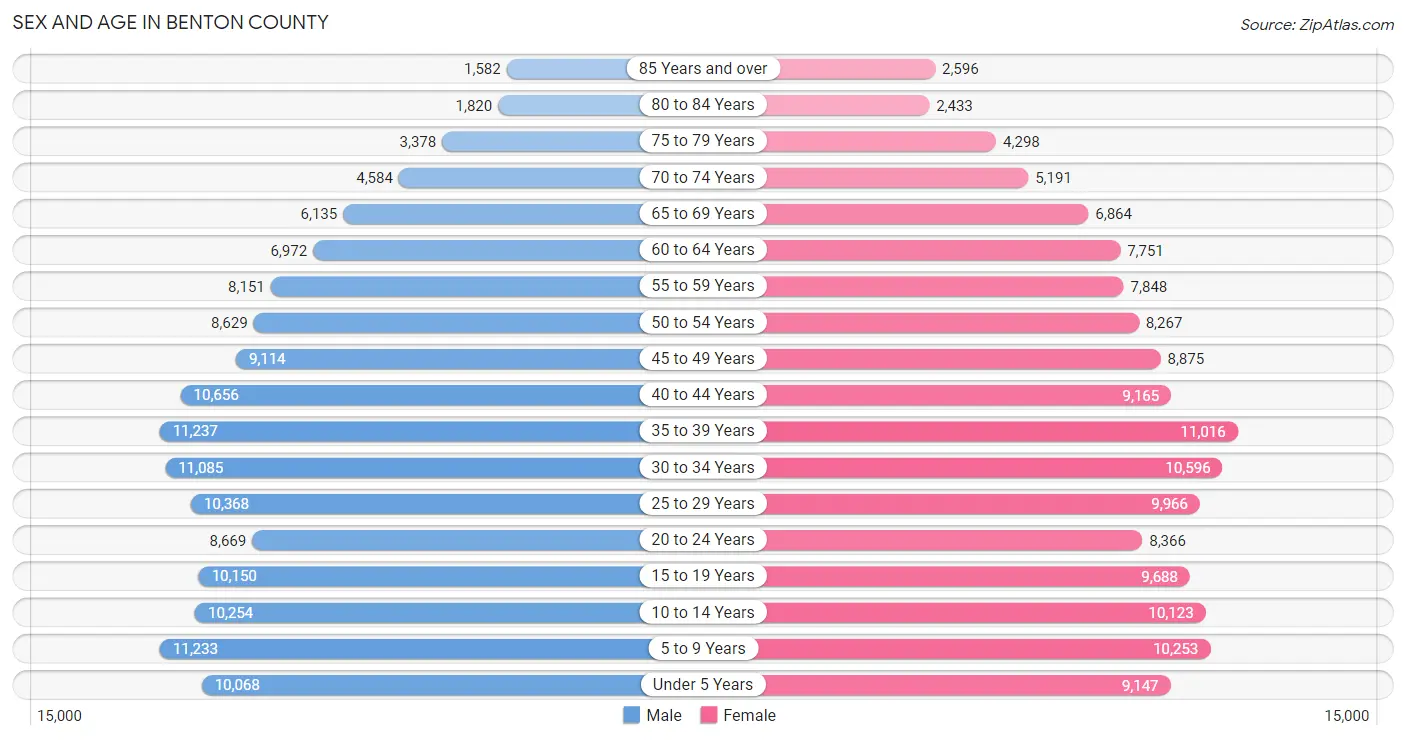
Sex and Age in Benton County
Sex and Age in Benton County
The most populous age groups in Benton County are 35 to 39 Years (11,237 | 7.8%) for men and 35 to 39 Years (11,016 | 7.7%) for women.
| Age Bracket | Male | Female |
| Under 5 Years | 10,068 (7.0%) | 9,147 (6.4%) |
| 5 to 9 Years | 11,233 (7.8%) | 10,253 (7.2%) |
| 10 to 14 Years | 10,254 (7.1%) | 10,123 (7.1%) |
| 15 to 19 Years | 10,150 (7.0%) | 9,688 (6.8%) |
| 20 to 24 Years | 8,669 (6.0%) | 8,366 (5.9%) |
| 25 to 29 Years | 10,368 (7.2%) | 9,966 (7.0%) |
| 30 to 34 Years | 11,085 (7.7%) | 10,596 (7.4%) |
| 35 to 39 Years | 11,237 (7.8%) | 11,016 (7.7%) |
| 40 to 44 Years | 10,656 (7.4%) | 9,165 (6.4%) |
| 45 to 49 Years | 9,114 (6.3%) | 8,875 (6.2%) |
| 50 to 54 Years | 8,629 (6.0%) | 8,267 (5.8%) |
| 55 to 59 Years | 8,151 (5.7%) | 7,848 (5.5%) |
| 60 to 64 Years | 6,972 (4.8%) | 7,751 (5.4%) |
| 65 to 69 Years | 6,135 (4.3%) | 6,864 (4.8%) |
| 70 to 74 Years | 4,584 (3.2%) | 5,191 (3.6%) |
| 75 to 79 Years | 3,378 (2.3%) | 4,298 (3.0%) |
| 80 to 84 Years | 1,820 (1.3%) | 2,433 (1.7%) |
| 85 Years and over | 1,582 (1.1%) | 2,596 (1.8%) |
| Total | 144,085 (100.0%) | 142,443 (100.0%) |
Families and Households in Benton County
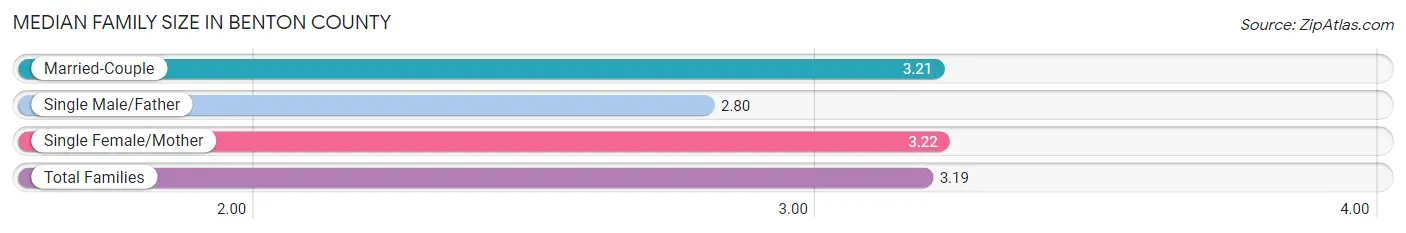
Median Family Size in Benton County
The median family size in Benton County is 3.19 persons per family, with single female/mother families (10,405 | 13.7%) accounting for the largest median family size of 3.22 persons per family. On the other hand, single male/father families (4,646 | 6.1%) represent the smallest median family size with 2.80 persons per family.
| Family Type | # Families | Family Size |
| Married-Couple | 61,165 (80.2%) | 3.21 |
| Single Male/Father | 4,646 (6.1%) | 2.80 |
| Single Female/Mother | 10,405 (13.7%) | 3.22 |
| Total Families | 76,216 (100.0%) | 3.19 |
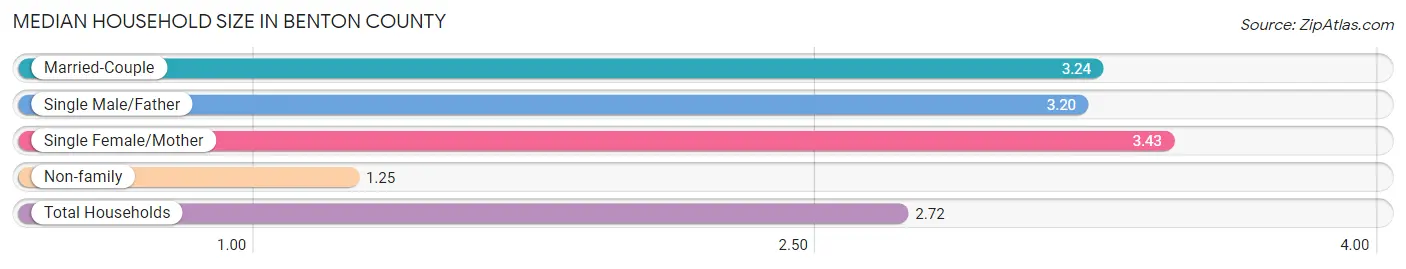
Median Household Size in Benton County
The median household size in Benton County is 2.72 persons per household, with single female/mother households (10,405 | 10.0%) accounting for the largest median household size of 3.43 persons per household. non-family households (27,948 | 26.8%) represent the smallest median household size with 1.25 persons per household.
| Household Type | # Households | Household Size |
| Married-Couple | 61,165 (58.7%) | 3.24 |
| Single Male/Father | 4,646 (4.5%) | 3.20 |
| Single Female/Mother | 10,405 (10.0%) | 3.43 |
| Non-family | 27,948 (26.8%) | 1.25 |
| Total Households | 104,164 (100.0%) | 2.72 |
Household Size by Marriage Status in Benton County
Out of a total of 104,164 households in Benton County, 76,216 (73.2%) are family households, while 27,948 (26.8%) are nonfamily households. The most numerous type of family households are 2-person households, comprising 30,995, and the most common type of nonfamily households are 1-person households, comprising 23,133.
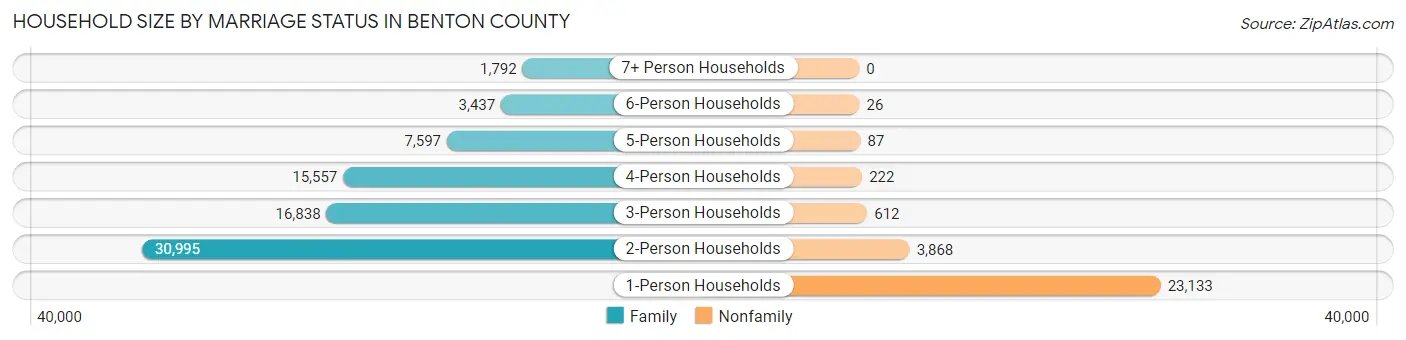
| Household Size | Family Households | Nonfamily Households |
| 1-Person Households | - | 23,133 (22.2%) |
| 2-Person Households | 30,995 (29.8%) | 3,868 (3.7%) |
| 3-Person Households | 16,838 (16.2%) | 612 (0.6%) |
| 4-Person Households | 15,557 (14.9%) | 222 (0.2%) |
| 5-Person Households | 7,597 (7.3%) | 87 (0.1%) |
| 6-Person Households | 3,437 (3.3%) | 26 (0.0%) |
| 7+ Person Households | 1,792 (1.7%) | 0 (0.0%) |
| Total | 76,216 (73.2%) | 27,948 (26.8%) |
Female Fertility in Benton County
Fertility by Age in Benton County
Average fertility rate in Benton County is 54.0 births per 1,000 women. Women in the age bracket of 20 to 34 years have the highest fertility rate with 96.0 births per 1,000 women. Women in the age bracket of 20 to 34 years acount for 73.6% of all women with births.
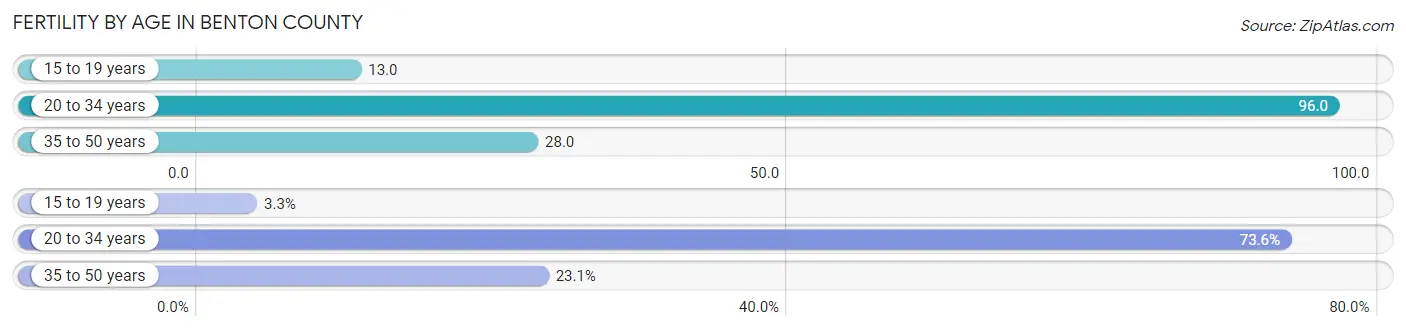
| Age Bracket | Women with Births | Births / 1,000 Women |
| 15 to 19 years | 126 (3.3%) | 13.0 |
| 20 to 34 years | 2,783 (73.6%) | 96.0 |
| 35 to 50 years | 875 (23.1%) | 28.0 |
| Total | 3,784 (100.0%) | 54.0 |
Fertility by Age by Marriage Status in Benton County
72.8% of women with births (3,784) in Benton County are married. The highest percentage of unmarried women with births falls into 15 to 19 years age bracket with 91.3% of them unmarried at the time of birth, while the lowest percentage of unmarried women with births belong to 35 to 50 years age bracket with 13.9% of them unmarried.
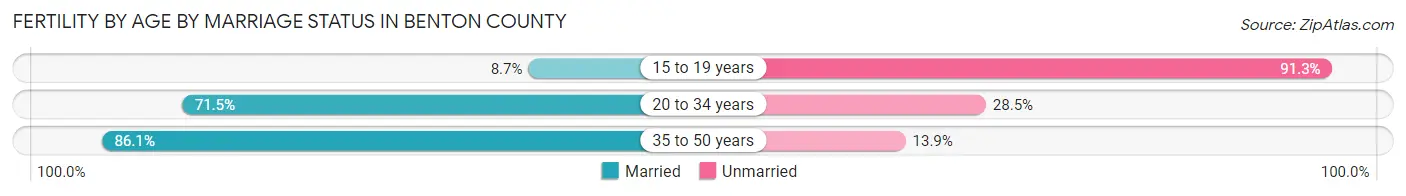
| Age Bracket | Married | Unmarried |
| 15 to 19 years | 11 (8.7%) | 115 (91.3%) |
| 20 to 34 years | 1,990 (71.5%) | 793 (28.5%) |
| 35 to 50 years | 753 (86.1%) | 122 (13.9%) |
| Total | 2,755 (72.8%) | 1,029 (27.2%) |
Fertility by Education in Benton County
Average fertility rate in Benton County is 54.0 births per 1,000 women. Women with the education attainment of bachelor's degree have the highest fertility rate of 64.0 births per 1,000 women, while women with the education attainment of less than high school have the lowest fertility at 29.0 births per 1,000 women. Women with the education attainment of college or associate's degree represent 29.1% of all women with births.
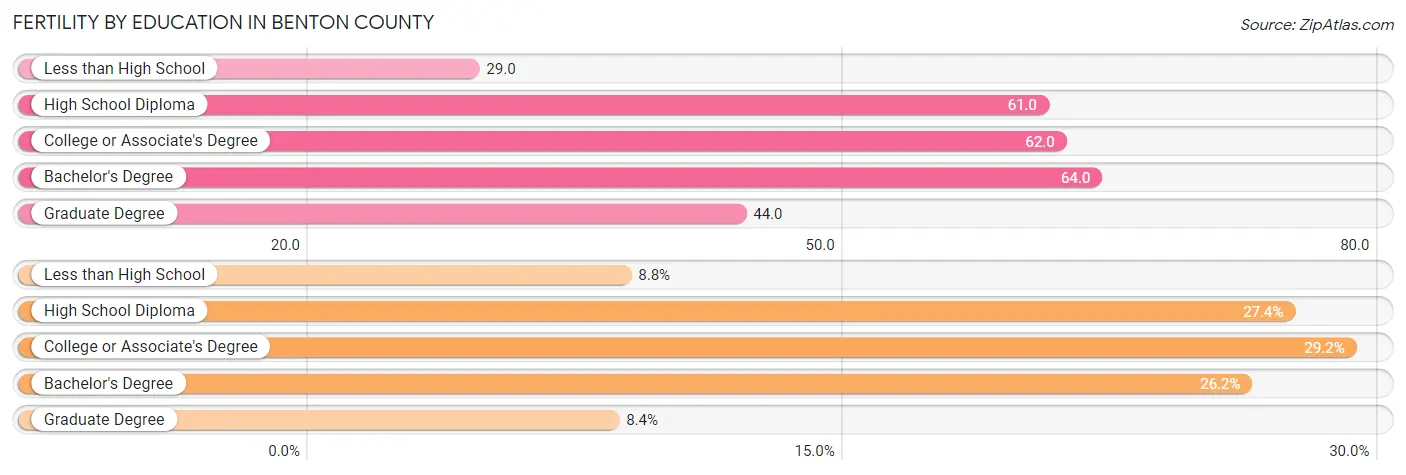
| Educational Attainment | Women with Births | Births / 1,000 Women |
| Less than High School | 332 (8.8%) | 29.0 |
| High School Diploma | 1,038 (27.4%) | 61.0 |
| College or Associate's Degree | 1,103 (29.1%) | 62.0 |
| Bachelor's Degree | 992 (26.2%) | 64.0 |
| Graduate Degree | 319 (8.4%) | 44.0 |
| Total | 3,784 (100.0%) | 54.0 |
Fertility by Education by Marriage Status in Benton County
27.2% of women with births in Benton County are unmarried. Women with the educational attainment of graduate degree are most likely to be married with 93.1% of them married at childbirth, while women with the educational attainment of less than high school are least likely to be married with 60.8% of them unmarried at childbirth.
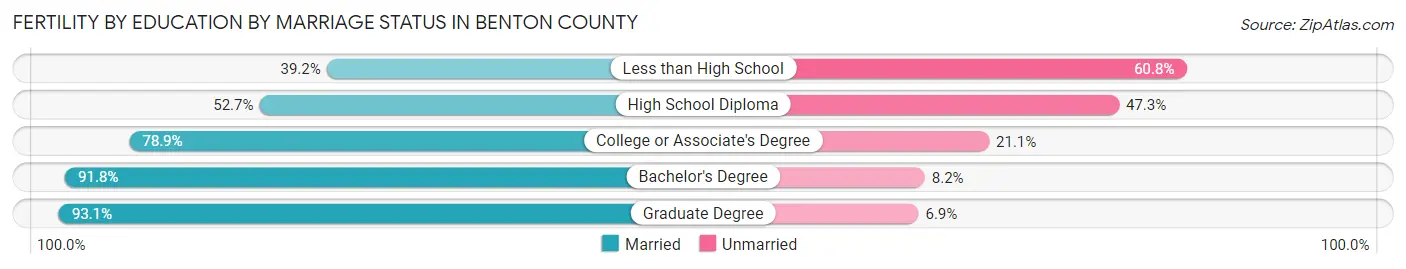
| Educational Attainment | Married | Unmarried |
| Less than High School | 130 (39.2%) | 202 (60.8%) |
| High School Diploma | 547 (52.7%) | 491 (47.3%) |
| College or Associate's Degree | 870 (78.9%) | 233 (21.1%) |
| Bachelor's Degree | 911 (91.8%) | 81 (8.2%) |
| Graduate Degree | 297 (93.1%) | 22 (6.9%) |
| Total | 2,755 (72.8%) | 1,029 (27.2%) |
Employment Characteristics in Benton County
Employment by Class of Employer in Benton County
Among the 141,682 employed individuals in Benton County, private company employees (104,186 | 73.5%), not-for-profit organizations (10,985 | 7.7%), and self-employed (not incorporated) (9,763 | 6.9%) make up the most common classes of employment.
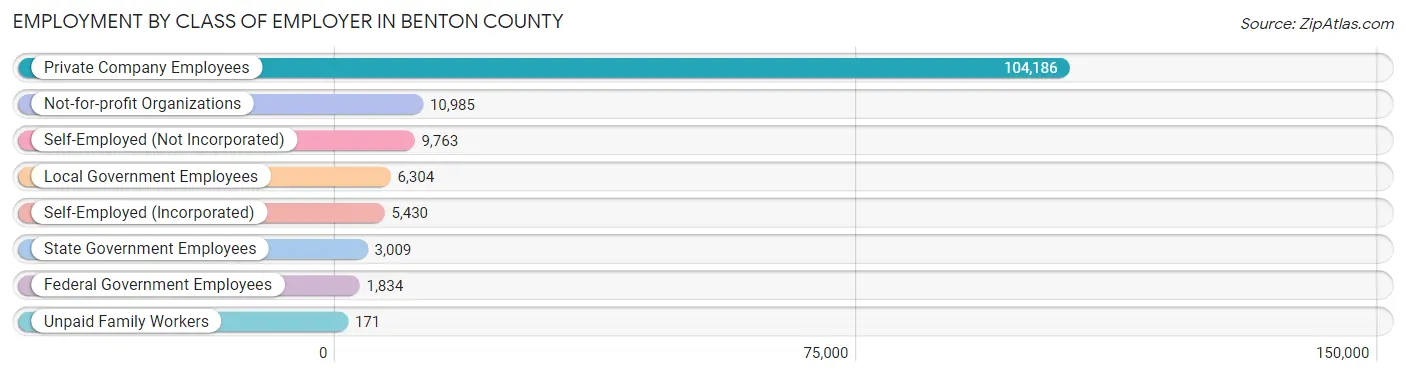
| Employer Class | # Employees | % Employees |
| Private Company Employees | 104,186 | 73.5% |
| Self-Employed (Incorporated) | 5,430 | 3.8% |
| Self-Employed (Not Incorporated) | 9,763 | 6.9% |
| Not-for-profit Organizations | 10,985 | 7.7% |
| Local Government Employees | 6,304 | 4.4% |
| State Government Employees | 3,009 | 2.1% |
| Federal Government Employees | 1,834 | 1.3% |
| Unpaid Family Workers | 171 | 0.1% |
| Total | 141,682 | 100.0% |
Employment Status by Age in Benton County
According to the labor force statistics for Benton County, out of the total population over 16 years of age (221,207), 66.6% or 147,324 individuals are in the labor force, with 2.9% or 4,272 of them unemployed. The age group with the highest labor force participation rate is 30 to 34 years, with 86.2% or 18,689 individuals in the labor force. Within the labor force, the 16 to 19 years age range has the highest percentage of unemployed individuals, with 9.6% or 551 of them being unemployed.
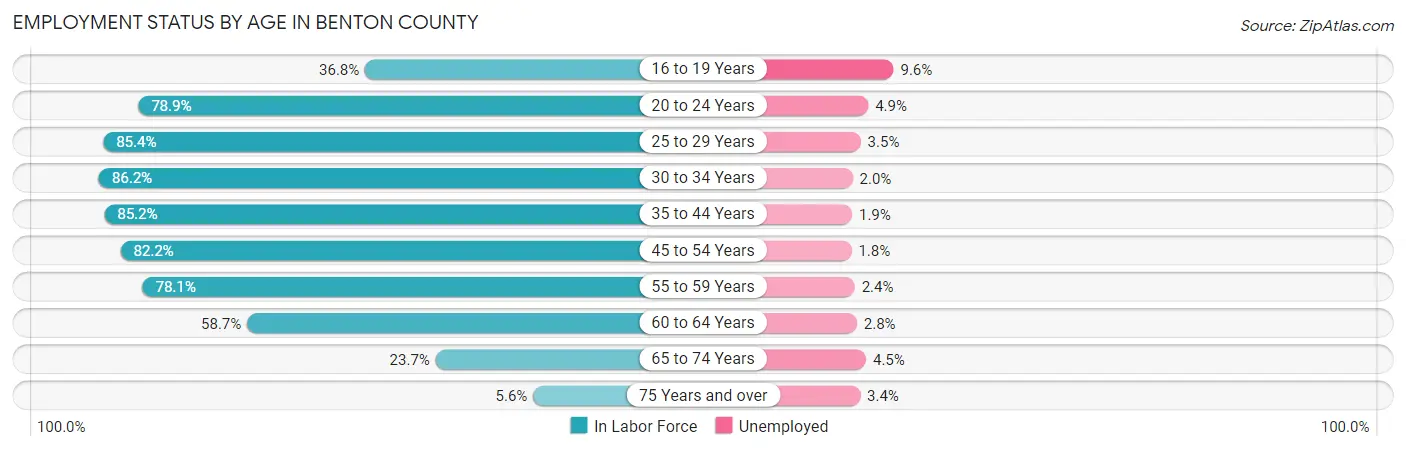
| Age Bracket | In Labor Force | Unemployed |
| 16 to 19 Years | 5,739 (36.8%) | 551 (9.6%) |
| 20 to 24 Years | 13,441 (78.9%) | 659 (4.9%) |
| 25 to 29 Years | 17,365 (85.4%) | 608 (3.5%) |
| 30 to 34 Years | 18,689 (86.2%) | 374 (2.0%) |
| 35 to 44 Years | 35,847 (85.2%) | 681 (1.9%) |
| 45 to 54 Years | 28,675 (82.2%) | 516 (1.8%) |
| 55 to 59 Years | 12,495 (78.1%) | 300 (2.4%) |
| 60 to 64 Years | 8,642 (58.7%) | 242 (2.8%) |
| 65 to 74 Years | 5,397 (23.7%) | 243 (4.5%) |
| 75 Years and over | 902 (5.6%) | 31 (3.4%) |
| Total | 147,324 (66.6%) | 4,272 (2.9%) |
Employment Status by Educational Attainment in Benton County
According to labor force statistics for Benton County, 81.3% of individuals (121,703) out of the total population between 25 and 64 years of age (149,696) are in the labor force, with 2.2% or 2,677 of them being unemployed. The group with the highest labor force participation rate are those with the educational attainment of bachelor's degree or higher, with 86.4% or 48,367 individuals in the labor force. Within the labor force, individuals with less than high school education have the highest percentage of unemployment, with 3.2% or 323 of them being unemployed.
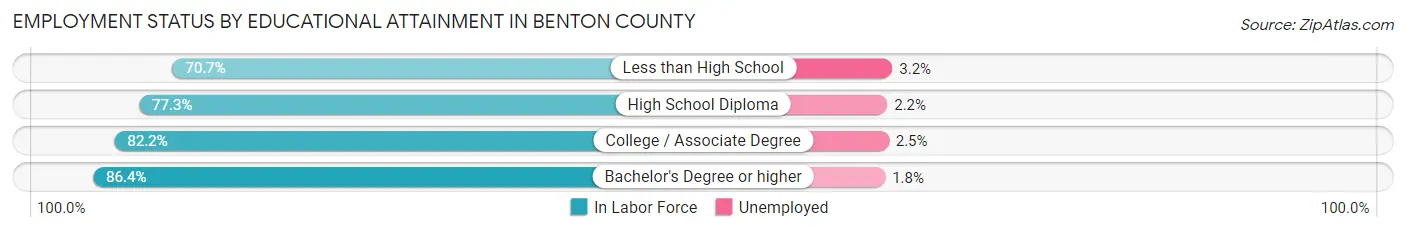
| Educational Attainment | In Labor Force | Unemployed |
| Less than High School | 10,091 (70.7%) | 457 (3.2%) |
| High School Diploma | 31,885 (77.3%) | 907 (2.2%) |
| College / Associate Degree | 31,395 (82.2%) | 955 (2.5%) |
| Bachelor's Degree or higher | 48,367 (86.4%) | 1,008 (1.8%) |
| Total | 121,703 (81.3%) | 3,293 (2.2%) |
Employment Occupations by Sex in Benton County
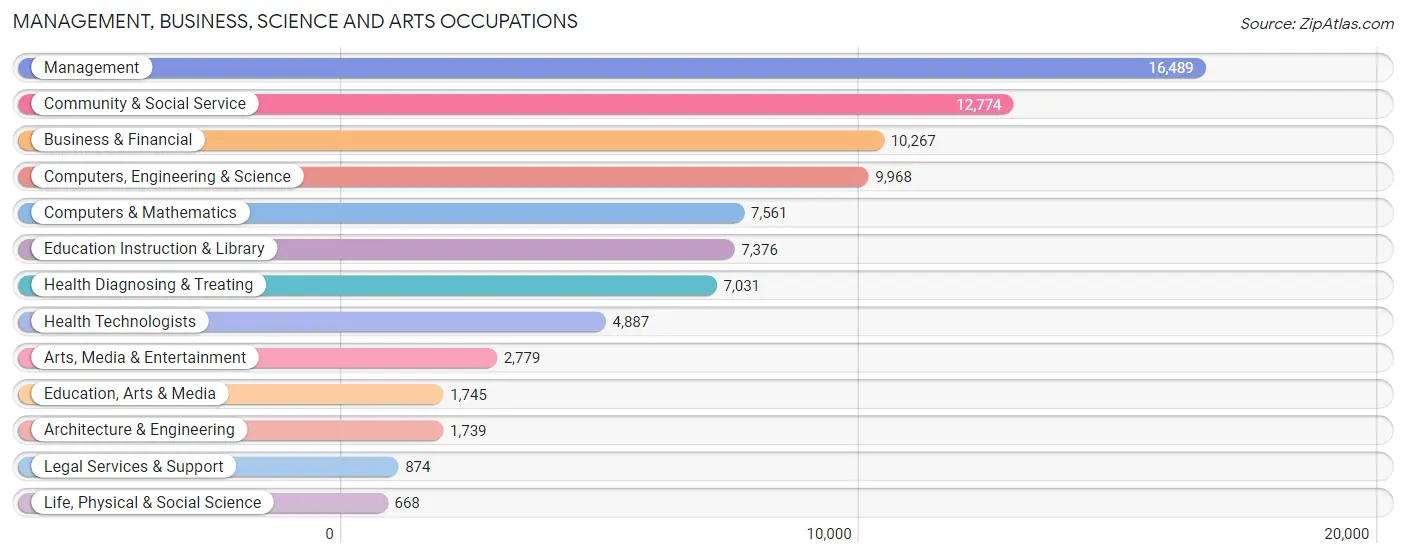
Management, Business, Science and Arts Occupations
The most common Management, Business, Science and Arts occupations in Benton County are Management (16,489 | 11.5%), Community & Social Service (12,774 | 8.9%), Business & Financial (10,267 | 7.2%), Computers, Engineering & Science (9,968 | 7.0%), and Computers & Mathematics (7,561 | 5.3%).
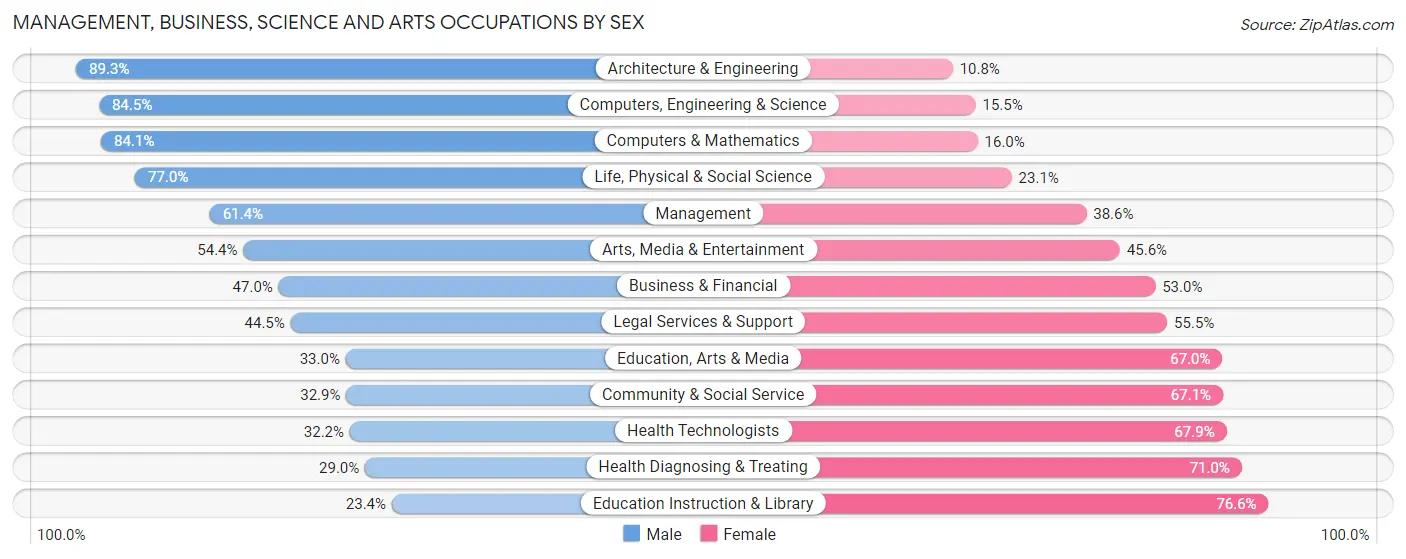
Management, Business, Science and Arts Occupations by Sex
Within the Management, Business, Science and Arts occupations in Benton County, the most male-oriented occupations are Architecture & Engineering (89.2%), Computers, Engineering & Science (84.5%), and Computers & Mathematics (84.1%), while the most female-oriented occupations are Education Instruction & Library (76.6%), Health Diagnosing & Treating (71.0%), and Health Technologists (67.8%).
| Occupation | Male | Female |
| Management | 10,121 (61.4%) | 6,368 (38.6%) |
| Business & Financial | 4,825 (47.0%) | 5,442 (53.0%) |
| Computers, Engineering & Science | 8,421 (84.5%) | 1,547 (15.5%) |
| Computers & Mathematics | 6,355 (84.1%) | 1,206 (16.0%) |
| Architecture & Engineering | 1,552 (89.2%) | 187 (10.7%) |
| Life, Physical & Social Science | 514 (76.9%) | 154 (23.1%) |
| Community & Social Service | 4,201 (32.9%) | 8,573 (67.1%) |
| Education, Arts & Media | 576 (33.0%) | 1,169 (67.0%) |
| Legal Services & Support | 389 (44.5%) | 485 (55.5%) |
| Education Instruction & Library | 1,725 (23.4%) | 5,651 (76.6%) |
| Arts, Media & Entertainment | 1,511 (54.4%) | 1,268 (45.6%) |
| Health Diagnosing & Treating | 2,037 (29.0%) | 4,994 (71.0%) |
| Health Technologists | 1,571 (32.2%) | 3,316 (67.8%) |
| Total (Category) | 29,605 (52.4%) | 26,924 (47.6%) |
| Total (Overall) | 78,588 (55.0%) | 64,326 (45.0%) |
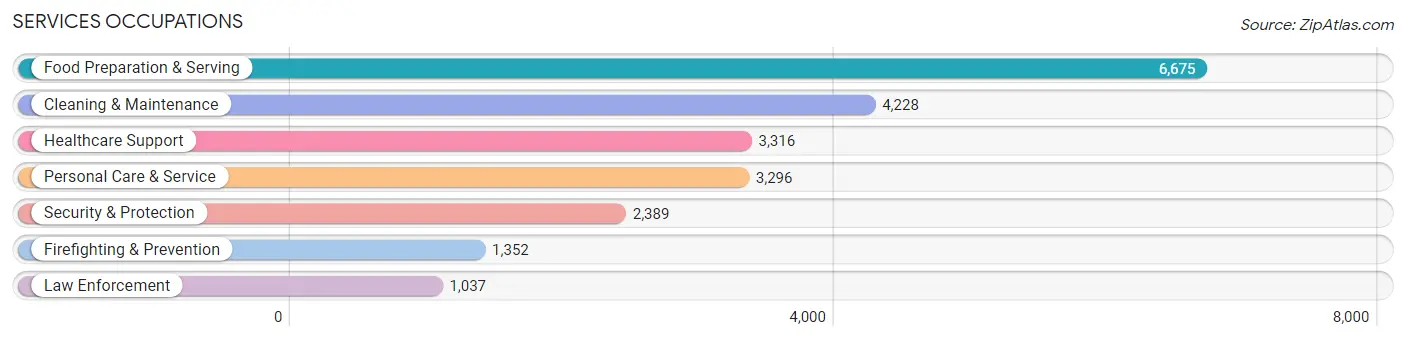
Services Occupations
The most common Services occupations in Benton County are Food Preparation & Serving (6,675 | 4.7%), Cleaning & Maintenance (4,228 | 3.0%), Healthcare Support (3,316 | 2.3%), Personal Care & Service (3,296 | 2.3%), and Security & Protection (2,389 | 1.7%).
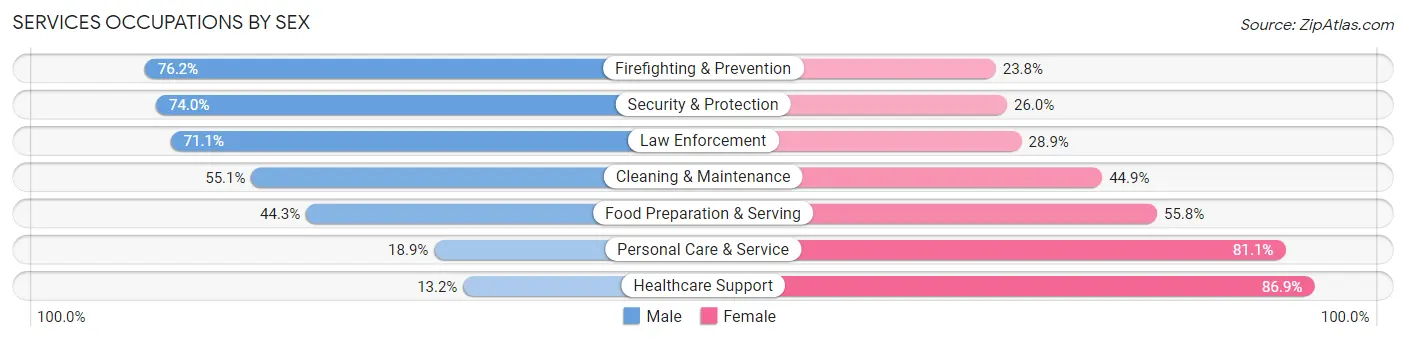
Services Occupations by Sex
Within the Services occupations in Benton County, the most male-oriented occupations are Firefighting & Prevention (76.2%), Security & Protection (74.0%), and Law Enforcement (71.1%), while the most female-oriented occupations are Healthcare Support (86.9%), Personal Care & Service (81.1%), and Food Preparation & Serving (55.7%).
| Occupation | Male | Female |
| Healthcare Support | 436 (13.2%) | 2,880 (86.9%) |
| Security & Protection | 1,767 (74.0%) | 622 (26.0%) |
| Firefighting & Prevention | 1,030 (76.2%) | 322 (23.8%) |
| Law Enforcement | 737 (71.1%) | 300 (28.9%) |
| Food Preparation & Serving | 2,954 (44.3%) | 3,721 (55.7%) |
| Cleaning & Maintenance | 2,330 (55.1%) | 1,898 (44.9%) |
| Personal Care & Service | 623 (18.9%) | 2,673 (81.1%) |
| Total (Category) | 8,110 (40.7%) | 11,794 (59.3%) |
| Total (Overall) | 78,588 (55.0%) | 64,326 (45.0%) |
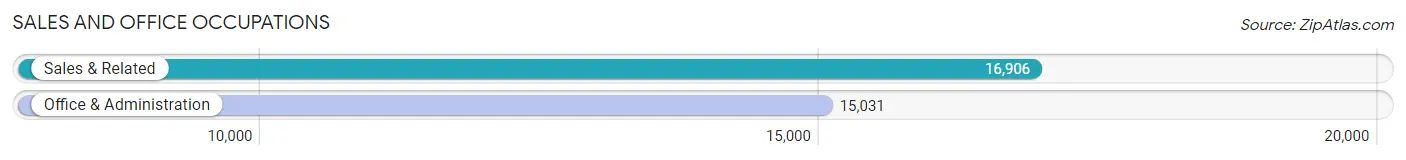
Sales and Office Occupations
The most common Sales and Office occupations in Benton County are Sales & Related (16,906 | 11.8%), and Office & Administration (15,031 | 10.5%).
Sales and Office Occupations by Sex
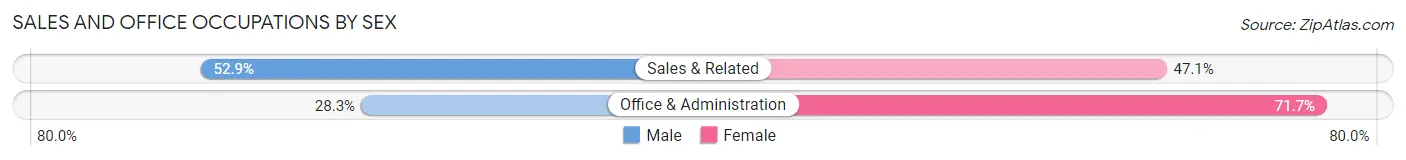
| Occupation | Male | Female |
| Sales & Related | 8,945 (52.9%) | 7,961 (47.1%) |
| Office & Administration | 4,248 (28.3%) | 10,783 (71.7%) |
| Total (Category) | 13,193 (41.3%) | 18,744 (58.7%) |
| Total (Overall) | 78,588 (55.0%) | 64,326 (45.0%) |
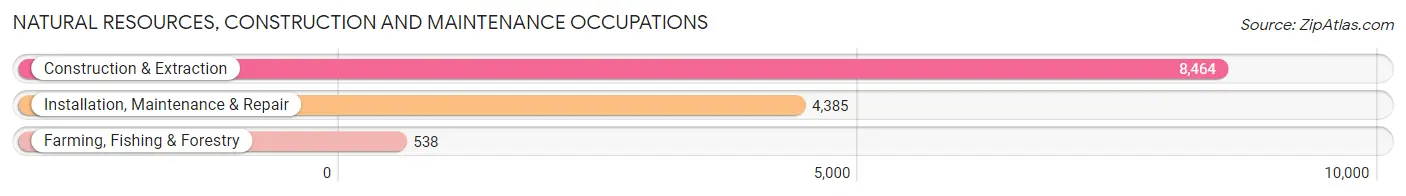
Natural Resources, Construction and Maintenance Occupations
The most common Natural Resources, Construction and Maintenance occupations in Benton County are Construction & Extraction (8,464 | 5.9%), Installation, Maintenance & Repair (4,385 | 3.1%), and Farming, Fishing & Forestry (538 | 0.4%).
Natural Resources, Construction and Maintenance Occupations by Sex
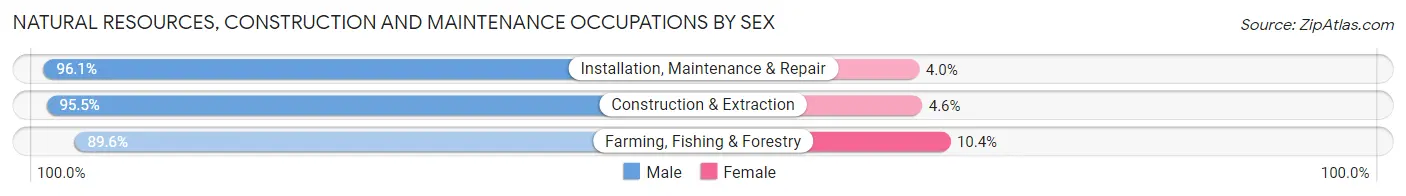
| Occupation | Male | Female |
| Farming, Fishing & Forestry | 482 (89.6%) | 56 (10.4%) |
| Construction & Extraction | 8,079 (95.5%) | 385 (4.5%) |
| Installation, Maintenance & Repair | 4,212 (96.1%) | 173 (4.0%) |
| Total (Category) | 12,773 (95.4%) | 614 (4.6%) |
| Total (Overall) | 78,588 (55.0%) | 64,326 (45.0%) |
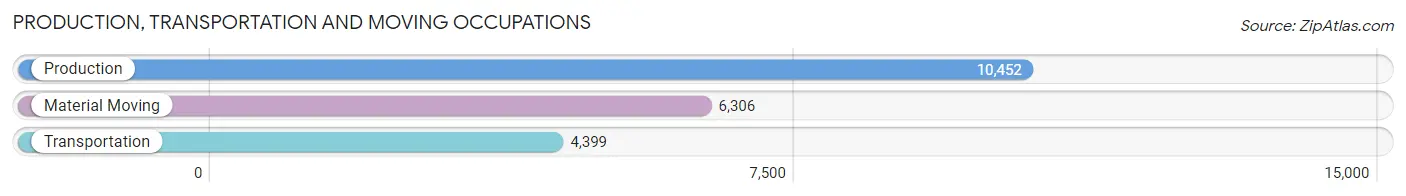
Production, Transportation and Moving Occupations
The most common Production, Transportation and Moving occupations in Benton County are Production (10,452 | 7.3%), Material Moving (6,306 | 4.4%), and Transportation (4,399 | 3.1%).
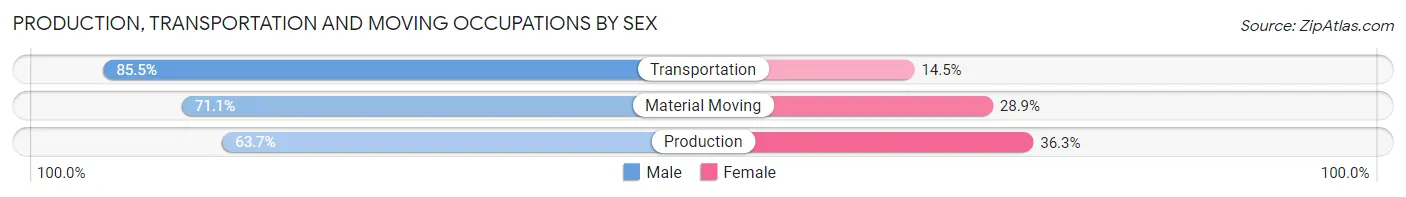
Production, Transportation and Moving Occupations by Sex
| Occupation | Male | Female |
| Production | 6,659 (63.7%) | 3,793 (36.3%) |
| Transportation | 3,762 (85.5%) | 637 (14.5%) |
| Material Moving | 4,486 (71.1%) | 1,820 (28.9%) |
| Total (Category) | 14,907 (70.5%) | 6,250 (29.5%) |
| Total (Overall) | 78,588 (55.0%) | 64,326 (45.0%) |
Employment Industries by Sex in Benton County
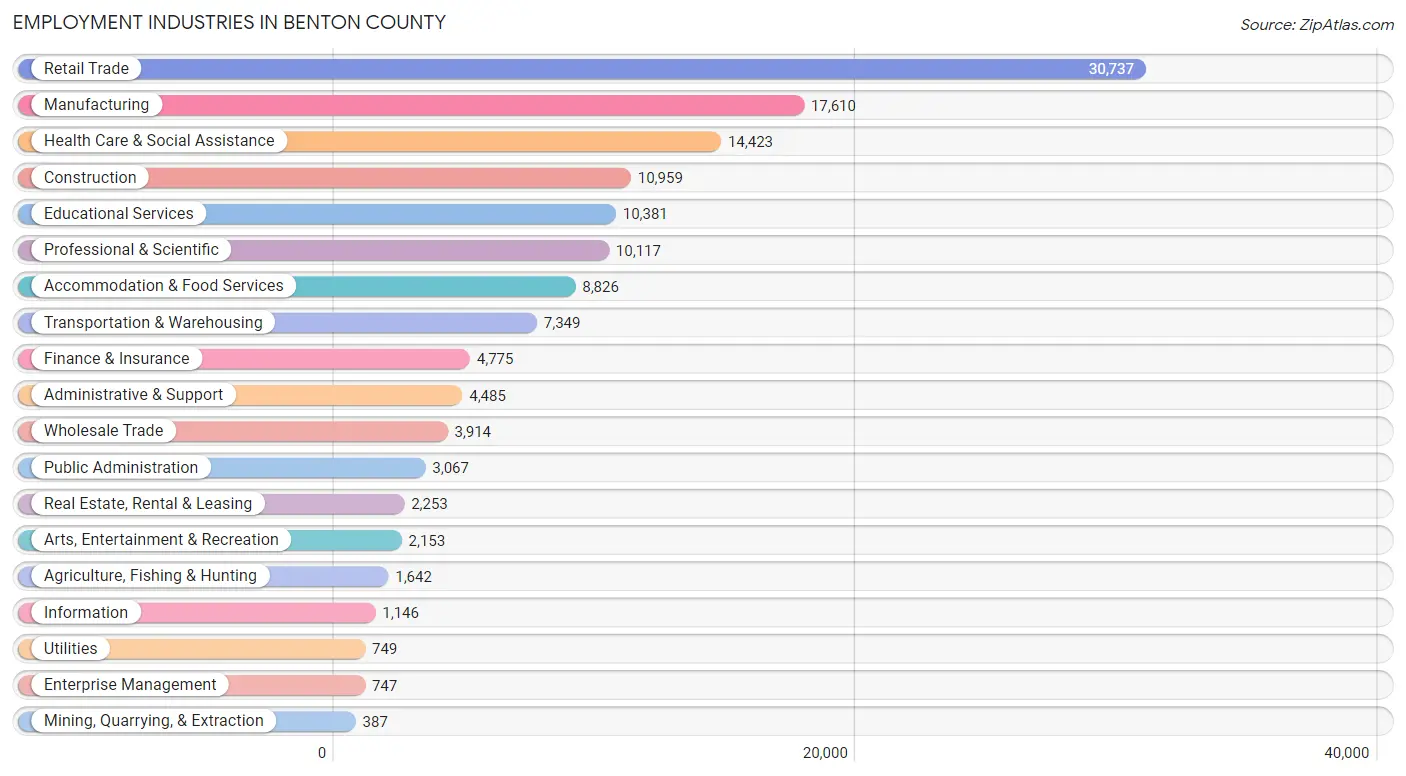
Employment Industries in Benton County
The major employment industries in Benton County include Retail Trade (30,737 | 21.5%), Manufacturing (17,610 | 12.3%), Health Care & Social Assistance (14,423 | 10.1%), Construction (10,959 | 7.7%), and Educational Services (10,381 | 7.3%).
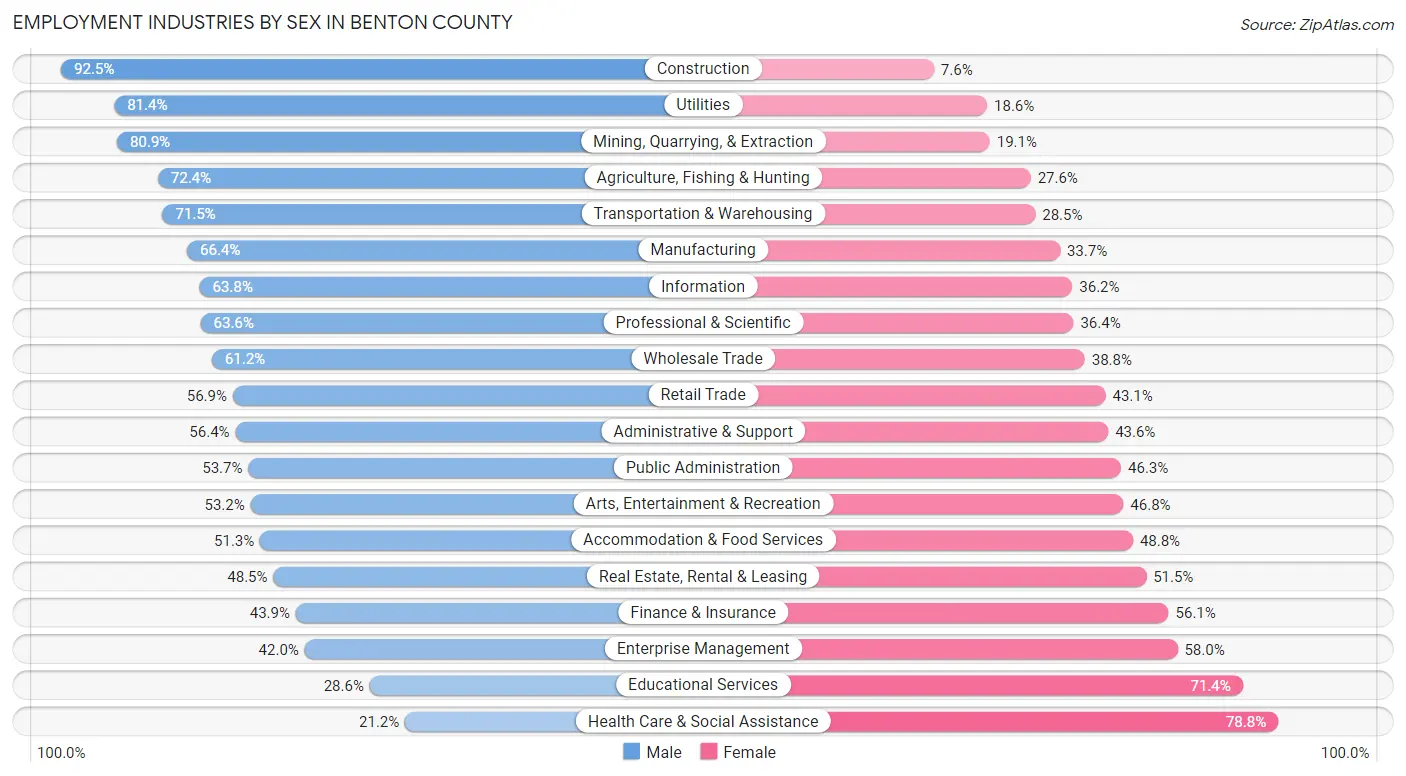
Employment Industries by Sex in Benton County
The Benton County industries that see more men than women are Construction (92.4%), Utilities (81.4%), and Mining, Quarrying, & Extraction (80.9%), whereas the industries that tend to have a higher number of women are Health Care & Social Assistance (78.8%), Educational Services (71.4%), and Enterprise Management (58.0%).
| Industry | Male | Female |
| Agriculture, Fishing & Hunting | 1,189 (72.4%) | 453 (27.6%) |
| Mining, Quarrying, & Extraction | 313 (80.9%) | 74 (19.1%) |
| Construction | 10,132 (92.4%) | 827 (7.5%) |
| Manufacturing | 11,685 (66.3%) | 5,925 (33.7%) |
| Wholesale Trade | 2,396 (61.2%) | 1,518 (38.8%) |
| Retail Trade | 17,492 (56.9%) | 13,245 (43.1%) |
| Transportation & Warehousing | 5,252 (71.5%) | 2,097 (28.5%) |
| Utilities | 610 (81.4%) | 139 (18.6%) |
| Information | 731 (63.8%) | 415 (36.2%) |
| Finance & Insurance | 2,095 (43.9%) | 2,680 (56.1%) |
| Real Estate, Rental & Leasing | 1,093 (48.5%) | 1,160 (51.5%) |
| Professional & Scientific | 6,430 (63.6%) | 3,687 (36.4%) |
| Enterprise Management | 314 (42.0%) | 433 (58.0%) |
| Administrative & Support | 2,528 (56.4%) | 1,957 (43.6%) |
| Educational Services | 2,965 (28.6%) | 7,416 (71.4%) |
| Health Care & Social Assistance | 3,063 (21.2%) | 11,360 (78.8%) |
| Arts, Entertainment & Recreation | 1,146 (53.2%) | 1,007 (46.8%) |
| Accommodation & Food Services | 4,523 (51.2%) | 4,303 (48.7%) |
| Public Administration | 1,647 (53.7%) | 1,420 (46.3%) |
| Total | 78,588 (55.0%) | 64,326 (45.0%) |
Education in Benton County
School Enrollment in Benton County
The most common levels of schooling among the 70,265 students in Benton County are elementary school (17,559 | 25.0%), high school (16,120 | 22.9%), and middle school (15,483 | 22.0%).
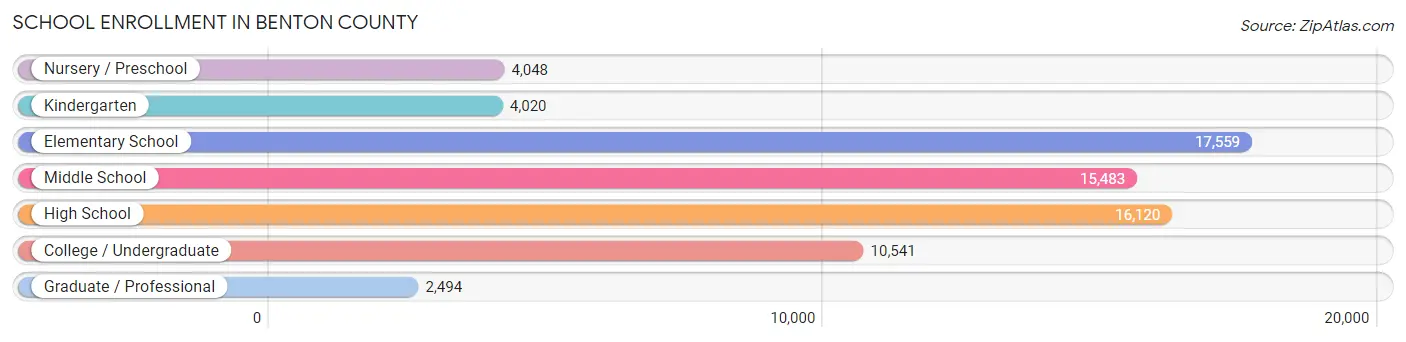
| School Level | # Students | % Students |
| Nursery / Preschool | 4,048 | 5.8% |
| Kindergarten | 4,020 | 5.7% |
| Elementary School | 17,559 | 25.0% |
| Middle School | 15,483 | 22.0% |
| High School | 16,120 | 22.9% |
| College / Undergraduate | 10,541 | 15.0% |
| Graduate / Professional | 2,494 | 3.5% |
| Total | 70,265 | 100.0% |
School Enrollment by Age by Funding Source in Benton County
Out of a total of 70,265 students who are enrolled in schools in Benton County, 11,313 (16.1%) attend a private institution, while the remaining 58,952 (83.9%) are enrolled in public schools. The age group of 3 to 4 year olds has the highest likelihood of being enrolled in private schools, with 1,704 (55.9% in the age bracket) enrolled. Conversely, the age group of 15 to 17 year olds has the lowest likelihood of being enrolled in a private school, with 11,047 (89.4% in the age bracket) attending a public institution.
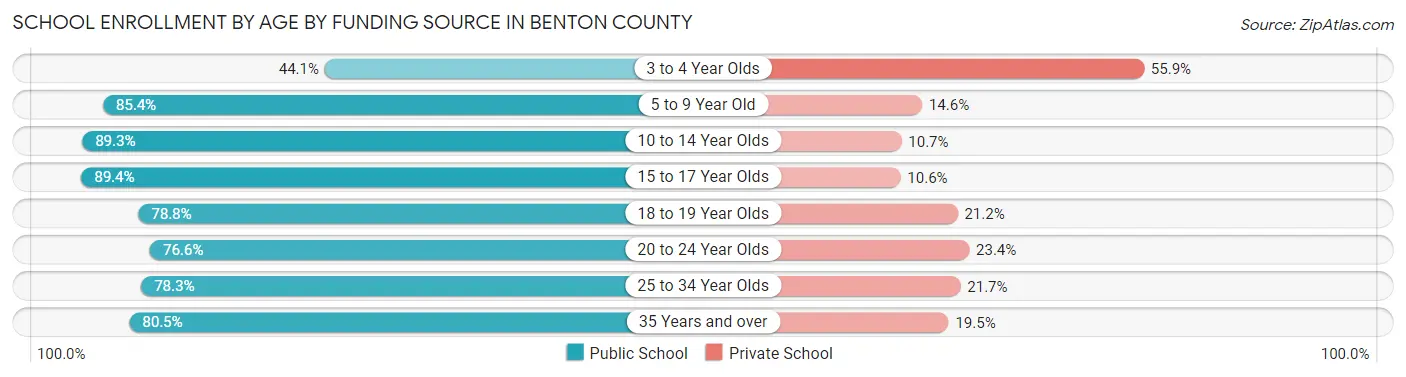
| Age Bracket | Public School | Private School |
| 3 to 4 Year Olds | 1,343 (44.1%) | 1,704 (55.9%) |
| 5 to 9 Year Old | 16,997 (85.4%) | 2,904 (14.6%) |
| 10 to 14 Year Olds | 17,940 (89.3%) | 2,159 (10.7%) |
| 15 to 17 Year Olds | 11,047 (89.4%) | 1,306 (10.6%) |
| 18 to 19 Year Olds | 3,435 (78.8%) | 924 (21.2%) |
| 20 to 24 Year Olds | 3,721 (76.6%) | 1,135 (23.4%) |
| 25 to 34 Year Olds | 2,453 (78.3%) | 681 (21.7%) |
| 35 Years and over | 2,025 (80.5%) | 491 (19.5%) |
| Total | 58,952 (83.9%) | 11,313 (16.1%) |
Educational Attainment by Field of Study in Benton County
Business (18,756 | 26.3%), education (8,330 | 11.7%), science & technology (6,806 | 9.6%), computers & mathematics (5,391 | 7.6%), and bio, nature & agricultural (4,703 | 6.6%) are the most common fields of study among 71,246 individuals in Benton County who have obtained a bachelor's degree or higher.
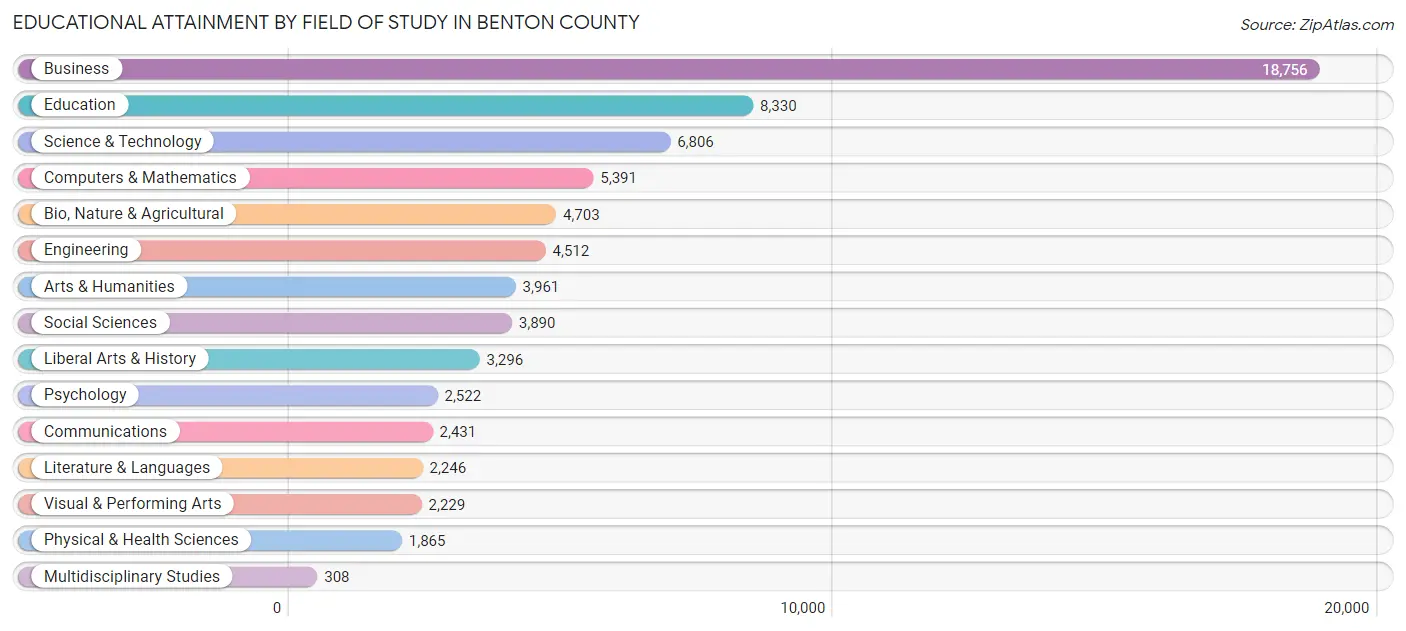
| Field of Study | # Graduates | % Graduates |
| Computers & Mathematics | 5,391 | 7.6% |
| Bio, Nature & Agricultural | 4,703 | 6.6% |
| Physical & Health Sciences | 1,865 | 2.6% |
| Psychology | 2,522 | 3.5% |
| Social Sciences | 3,890 | 5.5% |
| Engineering | 4,512 | 6.3% |
| Multidisciplinary Studies | 308 | 0.4% |
| Science & Technology | 6,806 | 9.6% |
| Business | 18,756 | 26.3% |
| Education | 8,330 | 11.7% |
| Literature & Languages | 2,246 | 3.2% |
| Liberal Arts & History | 3,296 | 4.6% |
| Visual & Performing Arts | 2,229 | 3.1% |
| Communications | 2,431 | 3.4% |
| Arts & Humanities | 3,961 | 5.6% |
| Total | 71,246 | 100.0% |
Transportation & Commute in Benton County
Vehicle Availability by Sex in Benton County
The most prevalent vehicle ownership categories in Benton County are males with 2 vehicles (34,401, accounting for 44.2%) and females with 2 vehicles (28,418, making up 54.2%).
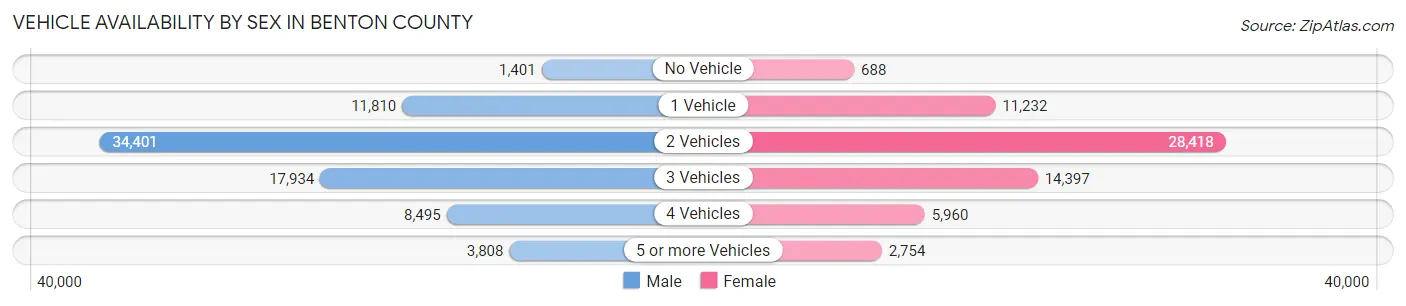
| Vehicles Available | Male | Female |
| No Vehicle | 1,401 (1.8%) | 688 (1.1%) |
| 1 Vehicle | 11,810 (15.2%) | 11,232 (17.7%) |
| 2 Vehicles | 34,401 (44.2%) | 28,418 (44.8%) |
| 3 Vehicles | 17,934 (23.0%) | 14,397 (22.7%) |
| 4 Vehicles | 8,495 (10.9%) | 5,960 (9.4%) |
| 5 or more Vehicles | 3,808 (4.9%) | 2,754 (4.3%) |
| Total | 77,849 (100.0%) | 63,449 (100.0%) |
Commute Time in Benton County
The most frequently occuring commute durations in Benton County are 15 to 19 minutes (23,988 commuters, 19.4%), 20 to 24 minutes (22,795 commuters, 18.4%), and 10 to 14 minutes (20,734 commuters, 16.8%).
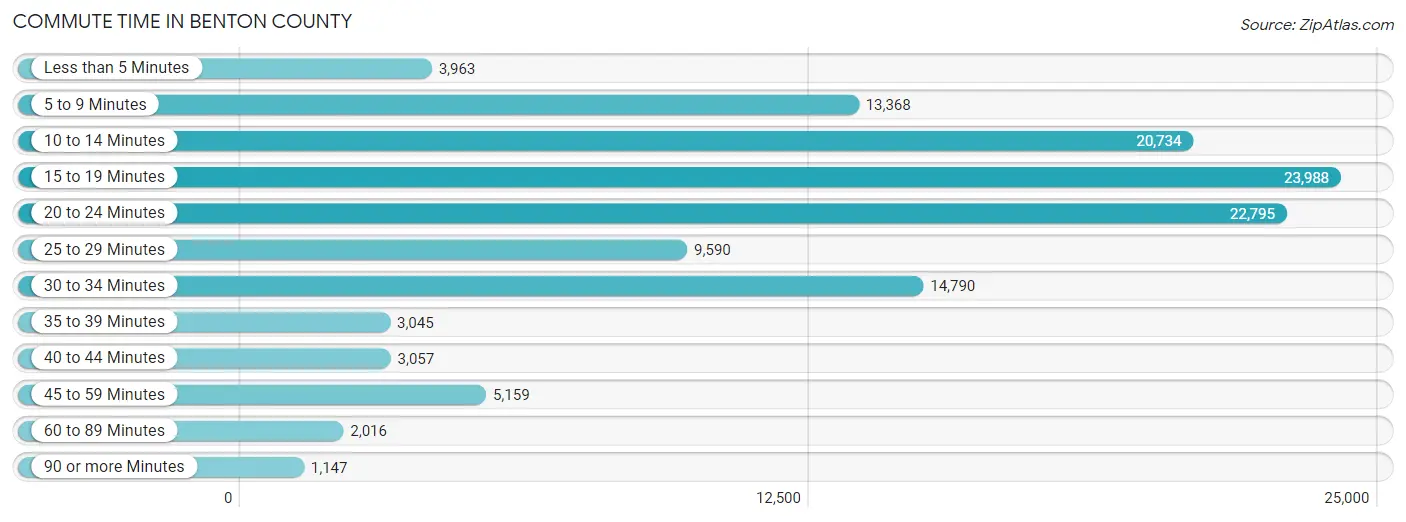
| Commute Time | # Commuters | % Commuters |
| Less than 5 Minutes | 3,963 | 3.2% |
| 5 to 9 Minutes | 13,368 | 10.8% |
| 10 to 14 Minutes | 20,734 | 16.8% |
| 15 to 19 Minutes | 23,988 | 19.4% |
| 20 to 24 Minutes | 22,795 | 18.4% |
| 25 to 29 Minutes | 9,590 | 7.8% |
| 30 to 34 Minutes | 14,790 | 12.0% |
| 35 to 39 Minutes | 3,045 | 2.5% |
| 40 to 44 Minutes | 3,057 | 2.5% |
| 45 to 59 Minutes | 5,159 | 4.2% |
| 60 to 89 Minutes | 2,016 | 1.6% |
| 90 or more Minutes | 1,147 | 0.9% |
Commute Time by Sex in Benton County
The most common commute times in Benton County are 15 to 19 minutes (13,788 commuters, 20.1%) for males and 20 to 24 minutes (10,353 commuters, 18.8%) for females.
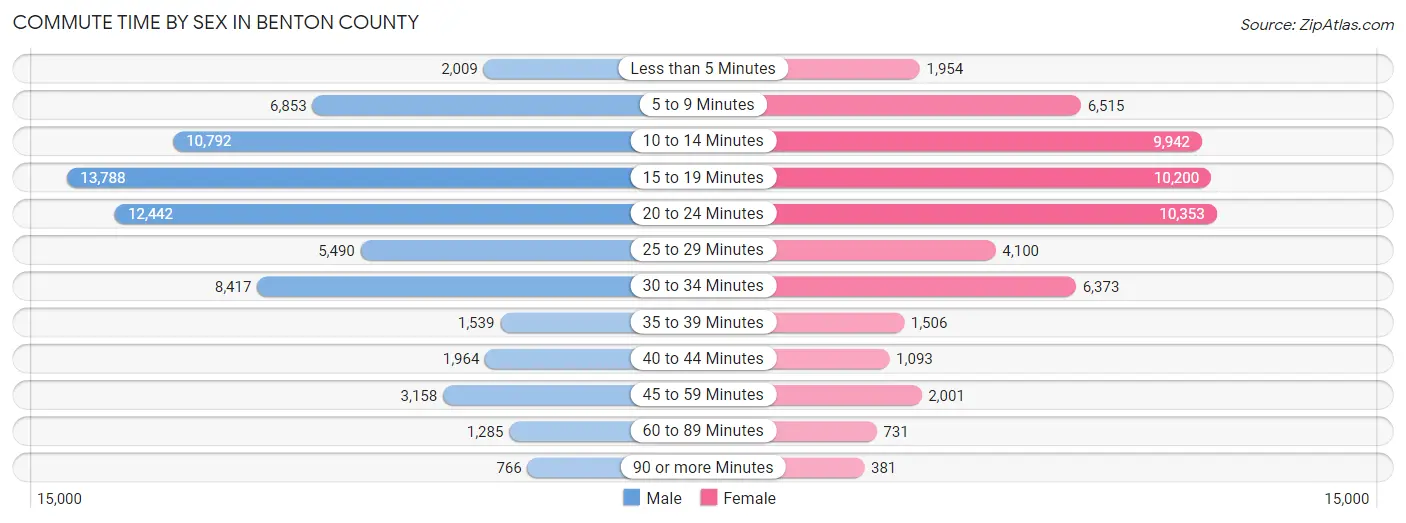
| Commute Time | Male | Female |
| Less than 5 Minutes | 2,009 (2.9%) | 1,954 (3.5%) |
| 5 to 9 Minutes | 6,853 (10.0%) | 6,515 (11.8%) |
| 10 to 14 Minutes | 10,792 (15.8%) | 9,942 (18.0%) |
| 15 to 19 Minutes | 13,788 (20.1%) | 10,200 (18.5%) |
| 20 to 24 Minutes | 12,442 (18.2%) | 10,353 (18.8%) |
| 25 to 29 Minutes | 5,490 (8.0%) | 4,100 (7.4%) |
| 30 to 34 Minutes | 8,417 (12.3%) | 6,373 (11.6%) |
| 35 to 39 Minutes | 1,539 (2.2%) | 1,506 (2.7%) |
| 40 to 44 Minutes | 1,964 (2.9%) | 1,093 (2.0%) |
| 45 to 59 Minutes | 3,158 (4.6%) | 2,001 (3.6%) |
| 60 to 89 Minutes | 1,285 (1.9%) | 731 (1.3%) |
| 90 or more Minutes | 766 (1.1%) | 381 (0.7%) |
Time of Departure to Work by Sex in Benton County
The most frequent times of departure to work in Benton County are 7:00 AM to 7:29 AM (15,682, 22.9%) for males and 7:00 AM to 7:29 AM (14,165, 25.7%) for females.
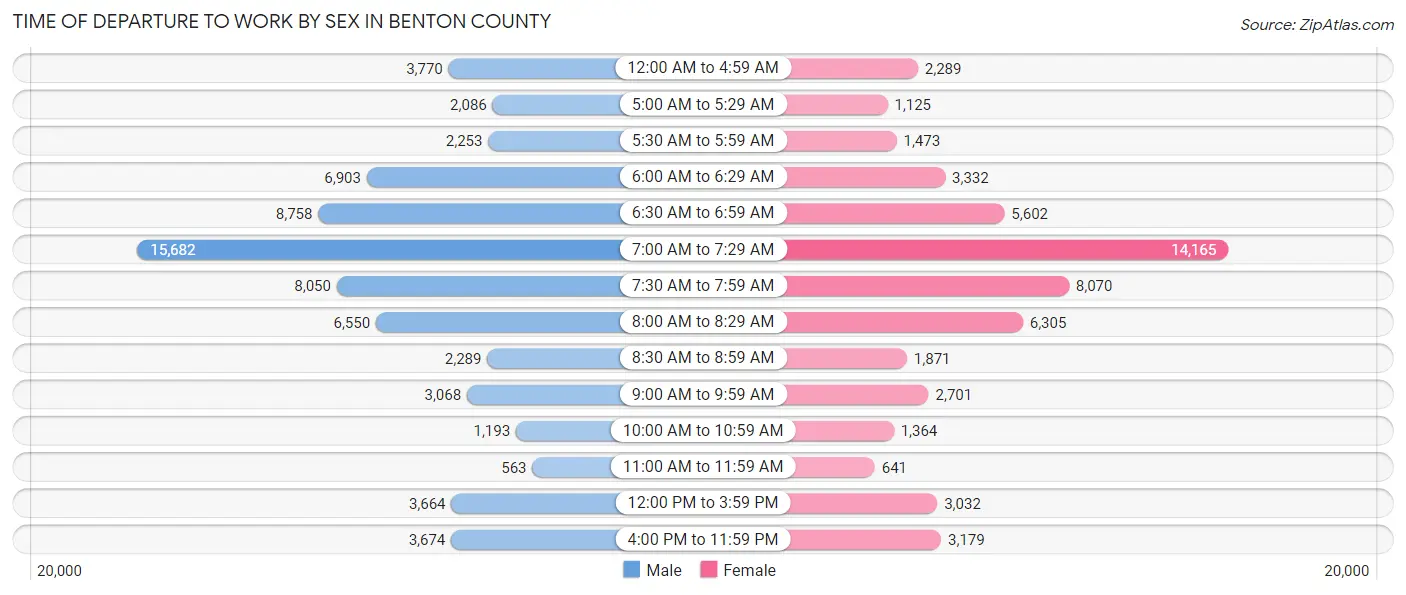
| Time of Departure | Male | Female |
| 12:00 AM to 4:59 AM | 3,770 (5.5%) | 2,289 (4.2%) |
| 5:00 AM to 5:29 AM | 2,086 (3.0%) | 1,125 (2.0%) |
| 5:30 AM to 5:59 AM | 2,253 (3.3%) | 1,473 (2.7%) |
| 6:00 AM to 6:29 AM | 6,903 (10.1%) | 3,332 (6.0%) |
| 6:30 AM to 6:59 AM | 8,758 (12.8%) | 5,602 (10.2%) |
| 7:00 AM to 7:29 AM | 15,682 (22.9%) | 14,165 (25.7%) |
| 7:30 AM to 7:59 AM | 8,050 (11.7%) | 8,070 (14.6%) |
| 8:00 AM to 8:29 AM | 6,550 (9.6%) | 6,305 (11.4%) |
| 8:30 AM to 8:59 AM | 2,289 (3.3%) | 1,871 (3.4%) |
| 9:00 AM to 9:59 AM | 3,068 (4.5%) | 2,701 (4.9%) |
| 10:00 AM to 10:59 AM | 1,193 (1.7%) | 1,364 (2.5%) |
| 11:00 AM to 11:59 AM | 563 (0.8%) | 641 (1.2%) |
| 12:00 PM to 3:59 PM | 3,664 (5.3%) | 3,032 (5.5%) |
| 4:00 PM to 11:59 PM | 3,674 (5.4%) | 3,179 (5.8%) |
| Total | 68,503 (100.0%) | 55,149 (100.0%) |
Housing Occupancy in Benton County
Occupancy by Ownership in Benton County
Of the total 104,164 dwellings in Benton County, owner-occupied units account for 70,667 (67.8%), while renter-occupied units make up 33,497 (32.2%).
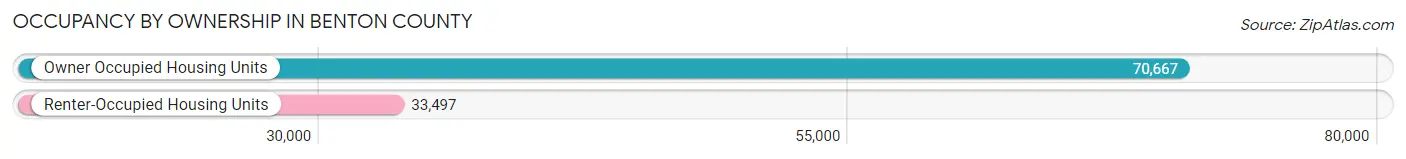
| Occupancy | # Housing Units | % Housing Units |
| Owner Occupied Housing Units | 70,667 | 67.8% |
| Renter-Occupied Housing Units | 33,497 | 32.2% |
| Total Occupied Housing Units | 104,164 | 100.0% |
Occupancy by Household Size in Benton County
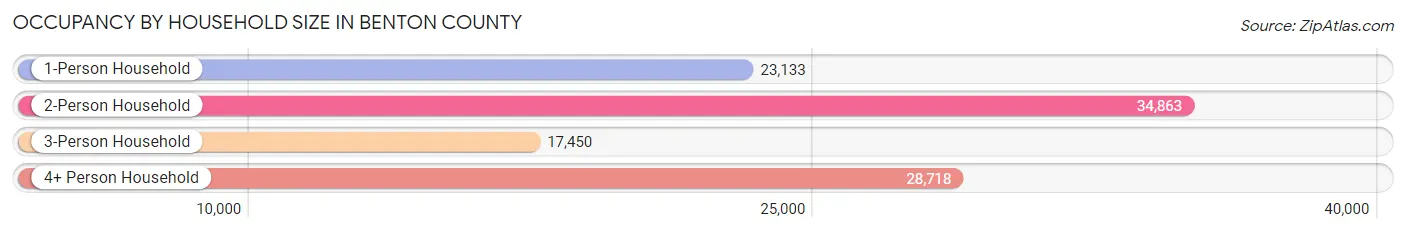
| Household Size | # Housing Units | % Housing Units |
| 1-Person Household | 23,133 | 22.2% |
| 2-Person Household | 34,863 | 33.5% |
| 3-Person Household | 17,450 | 16.8% |
| 4+ Person Household | 28,718 | 27.6% |
| Total Housing Units | 104,164 | 100.0% |
Occupancy by Ownership by Household Size in Benton County
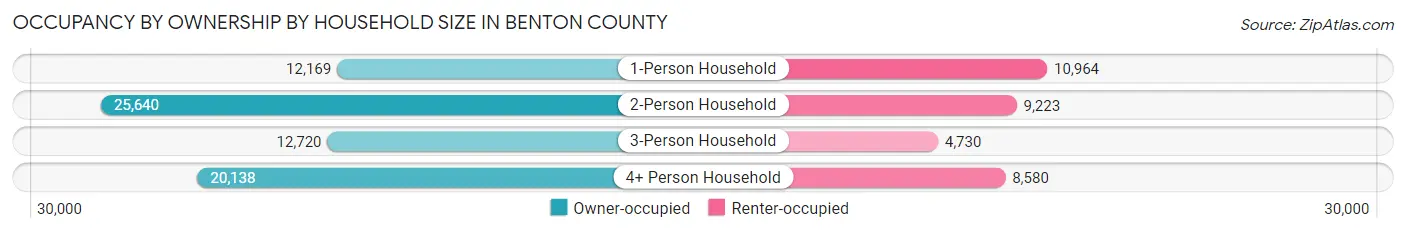
| Household Size | Owner-occupied | Renter-occupied |
| 1-Person Household | 12,169 (52.6%) | 10,964 (47.4%) |
| 2-Person Household | 25,640 (73.6%) | 9,223 (26.5%) |
| 3-Person Household | 12,720 (72.9%) | 4,730 (27.1%) |
| 4+ Person Household | 20,138 (70.1%) | 8,580 (29.9%) |
| Total Housing Units | 70,667 (67.8%) | 33,497 (32.2%) |
Occupancy by Educational Attainment in Benton County
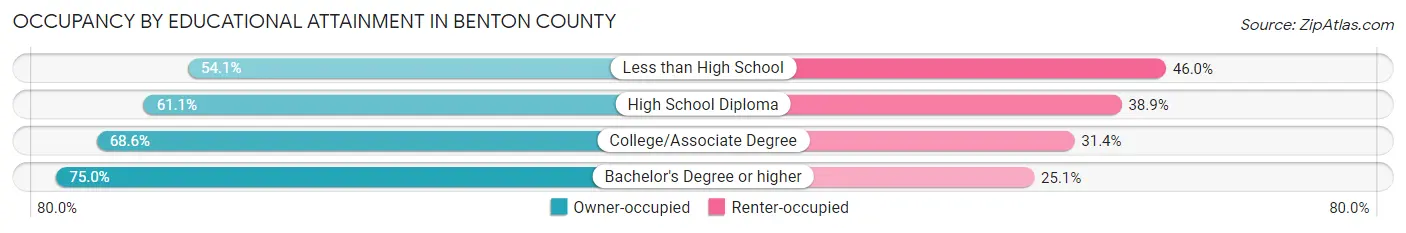
| Household Size | Owner-occupied | Renter-occupied |
| Less than High School | 4,910 (54.0%) | 4,174 (46.0%) |
| High School Diploma | 16,208 (61.1%) | 10,325 (38.9%) |
| College/Associate Degree | 19,605 (68.6%) | 8,990 (31.4%) |
| Bachelor's Degree or higher | 29,944 (75.0%) | 10,008 (25.1%) |
Occupancy by Age of Householder in Benton County
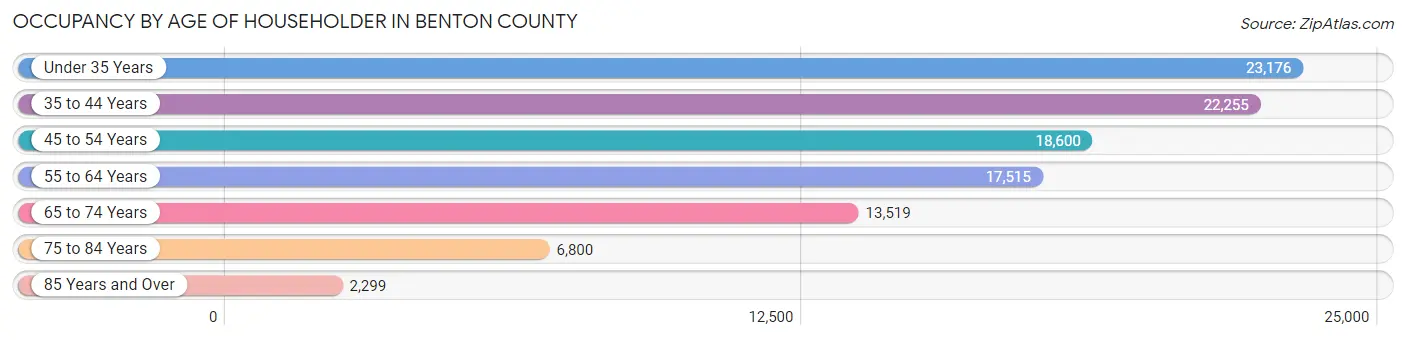
| Age Bracket | # Households | % Households |
| Under 35 Years | 23,176 | 22.3% |
| 35 to 44 Years | 22,255 | 21.4% |
| 45 to 54 Years | 18,600 | 17.9% |
| 55 to 64 Years | 17,515 | 16.8% |
| 65 to 74 Years | 13,519 | 13.0% |
| 75 to 84 Years | 6,800 | 6.5% |
| 85 Years and Over | 2,299 | 2.2% |
| Total | 104,164 | 100.0% |
Housing Finances in Benton County
Median Income by Occupancy in Benton County
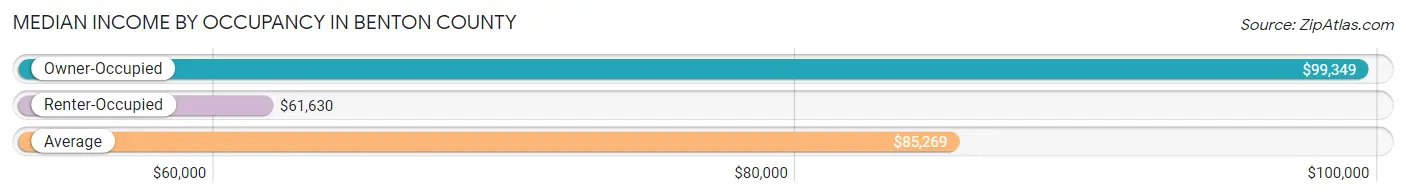
| Occupancy Type | # Households | Median Income |
| Owner-Occupied | 70,667 (67.8%) | $99,349 |
| Renter-Occupied | 33,497 (32.2%) | $61,630 |
| Average | 104,164 (100.0%) | $85,269 |
Occupancy by Householder Income Bracket in Benton County
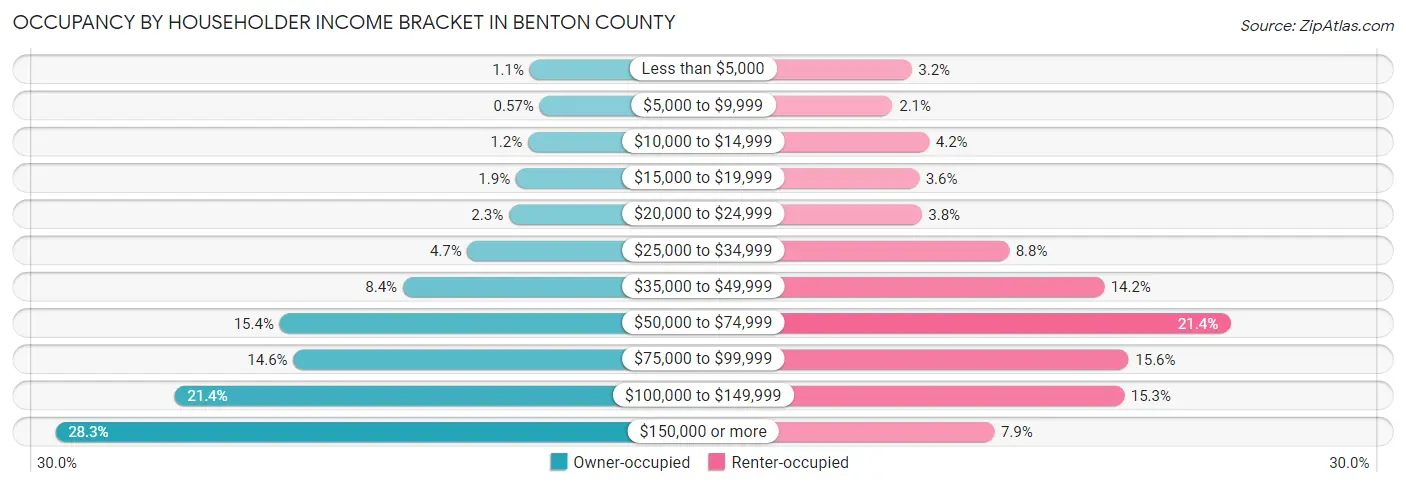
| Income Bracket | Owner-occupied | Renter-occupied |
| Less than $5,000 | 798 (1.1%) | 1,067 (3.2%) |
| $5,000 to $9,999 | 403 (0.6%) | 704 (2.1%) |
| $10,000 to $14,999 | 867 (1.2%) | 1,403 (4.2%) |
| $15,000 to $19,999 | 1,360 (1.9%) | 1,209 (3.6%) |
| $20,000 to $24,999 | 1,642 (2.3%) | 1,260 (3.8%) |
| $25,000 to $34,999 | 3,314 (4.7%) | 2,932 (8.7%) |
| $35,000 to $49,999 | 5,925 (8.4%) | 4,750 (14.2%) |
| $50,000 to $74,999 | 10,895 (15.4%) | 7,167 (21.4%) |
| $75,000 to $99,999 | 10,344 (14.6%) | 5,221 (15.6%) |
| $100,000 to $149,999 | 15,153 (21.4%) | 5,136 (15.3%) |
| $150,000 or more | 19,966 (28.2%) | 2,648 (7.9%) |
| Total | 70,667 (100.0%) | 33,497 (100.0%) |
Monthly Housing Cost Tiers in Benton County
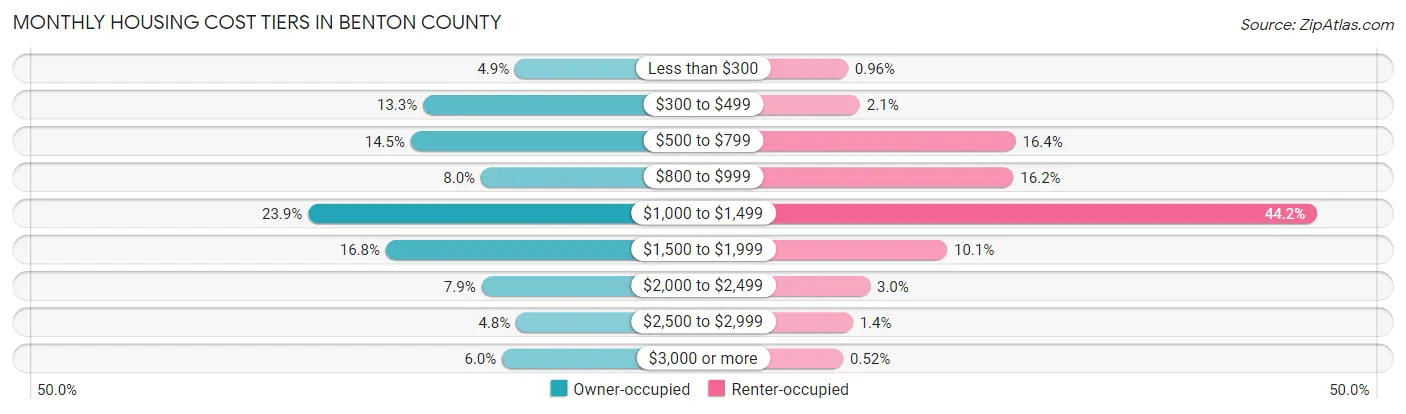
| Monthly Cost | Owner-occupied | Renter-occupied |
| Less than $300 | 3,426 (4.9%) | 323 (1.0%) |
| $300 to $499 | 9,416 (13.3%) | 695 (2.1%) |
| $500 to $799 | 10,214 (14.4%) | 5,494 (16.4%) |
| $800 to $999 | 5,643 (8.0%) | 5,428 (16.2%) |
| $1,000 to $1,499 | 16,897 (23.9%) | 14,789 (44.2%) |
| $1,500 to $1,999 | 11,834 (16.8%) | 3,379 (10.1%) |
| $2,000 to $2,499 | 5,612 (7.9%) | 1,005 (3.0%) |
| $2,500 to $2,999 | 3,358 (4.8%) | 472 (1.4%) |
| $3,000 or more | 4,267 (6.0%) | 174 (0.5%) |
| Total | 70,667 (100.0%) | 33,497 (100.0%) |
Physical Housing Characteristics in Benton County
Housing Structures in Benton County
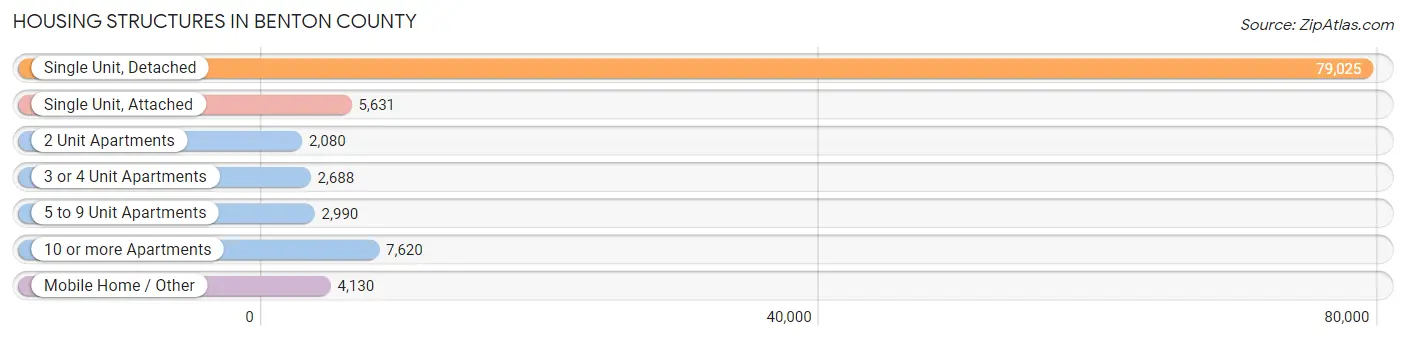
| Structure Type | # Housing Units | % Housing Units |
| Single Unit, Detached | 79,025 | 75.9% |
| Single Unit, Attached | 5,631 | 5.4% |
| 2 Unit Apartments | 2,080 | 2.0% |
| 3 or 4 Unit Apartments | 2,688 | 2.6% |
| 5 to 9 Unit Apartments | 2,990 | 2.9% |
| 10 or more Apartments | 7,620 | 7.3% |
| Mobile Home / Other | 4,130 | 4.0% |
| Total | 104,164 | 100.0% |
Housing Structures by Occupancy in Benton County
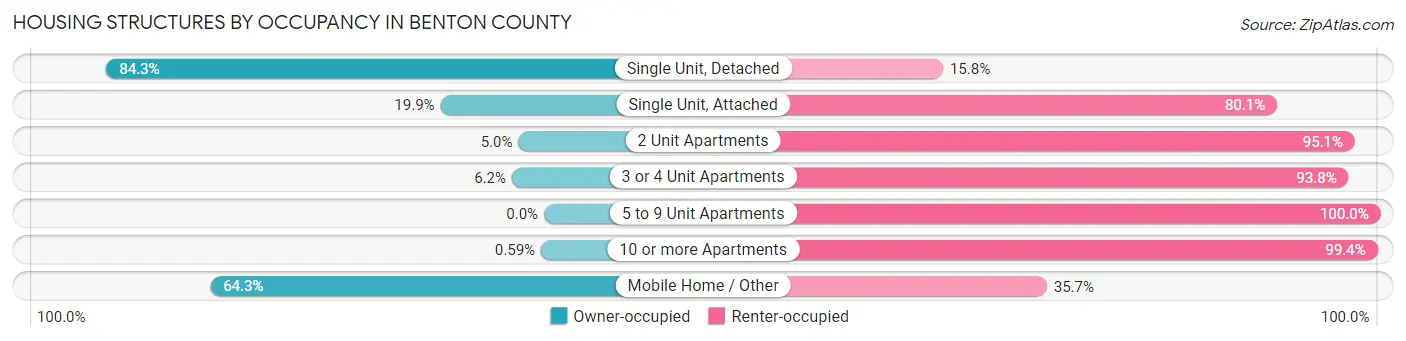
| Structure Type | Owner-occupied | Renter-occupied |
| Single Unit, Detached | 66,576 (84.3%) | 12,449 (15.8%) |
| Single Unit, Attached | 1,123 (19.9%) | 4,508 (80.1%) |
| 2 Unit Apartments | 103 (5.0%) | 1,977 (95.1%) |
| 3 or 4 Unit Apartments | 166 (6.2%) | 2,522 (93.8%) |
| 5 to 9 Unit Apartments | 0 (0.0%) | 2,990 (100.0%) |
| 10 or more Apartments | 45 (0.6%) | 7,575 (99.4%) |
| Mobile Home / Other | 2,654 (64.3%) | 1,476 (35.7%) |
| Total | 70,667 (67.8%) | 33,497 (32.2%) |
Housing Structures by Number of Rooms in Benton County
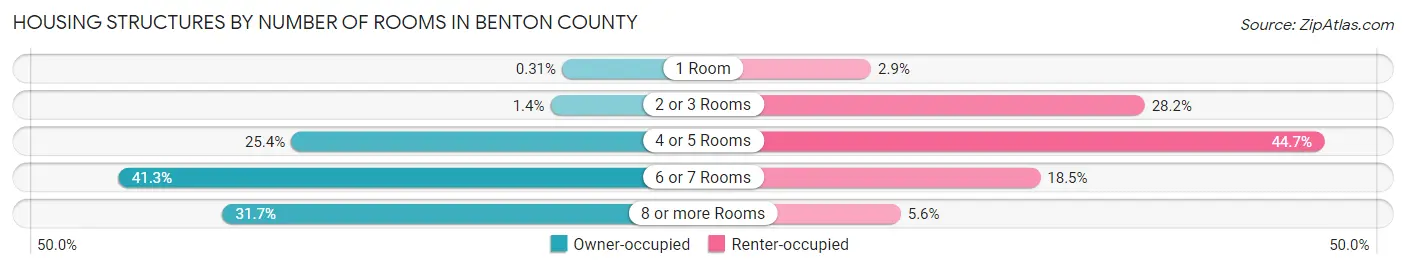
| Number of Rooms | Owner-occupied | Renter-occupied |
| 1 Room | 218 (0.3%) | 968 (2.9%) |
| 2 or 3 Rooms | 973 (1.4%) | 9,444 (28.2%) |
| 4 or 5 Rooms | 17,918 (25.4%) | 14,988 (44.7%) |
| 6 or 7 Rooms | 29,173 (41.3%) | 6,210 (18.5%) |
| 8 or more Rooms | 22,385 (31.7%) | 1,887 (5.6%) |
| Total | 70,667 (100.0%) | 33,497 (100.0%) |
Housing Structure by Heating Type in Benton County
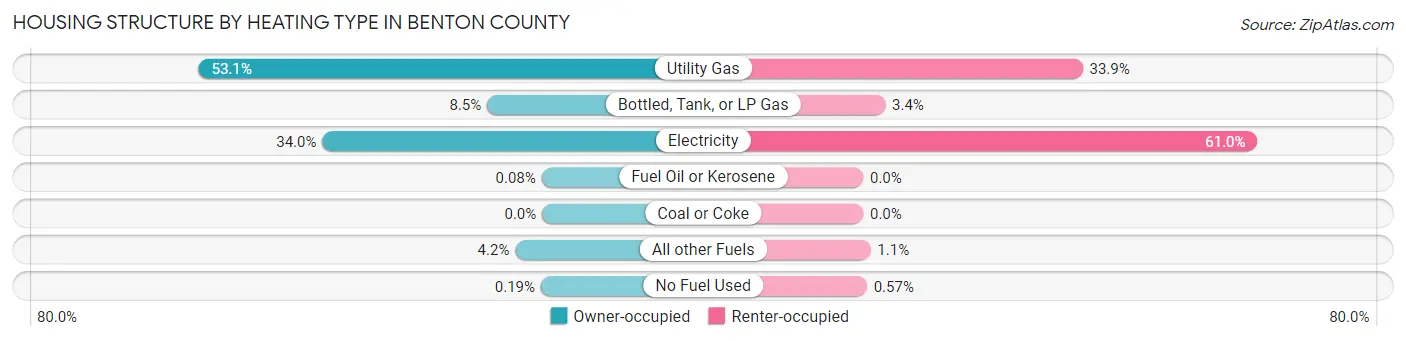
| Heating Type | Owner-occupied | Renter-occupied |
| Utility Gas | 37,521 (53.1%) | 11,366 (33.9%) |
| Bottled, Tank, or LP Gas | 6,007 (8.5%) | 1,142 (3.4%) |
| Electricity | 24,016 (34.0%) | 20,415 (61.0%) |
| Fuel Oil or Kerosene | 54 (0.1%) | 0 (0.0%) |
| Coal or Coke | 0 (0.0%) | 0 (0.0%) |
| All other Fuels | 2,935 (4.2%) | 383 (1.1%) |
| No Fuel Used | 134 (0.2%) | 191 (0.6%) |
| Total | 70,667 (100.0%) | 33,497 (100.0%) |
Household Vehicle Usage in Benton County
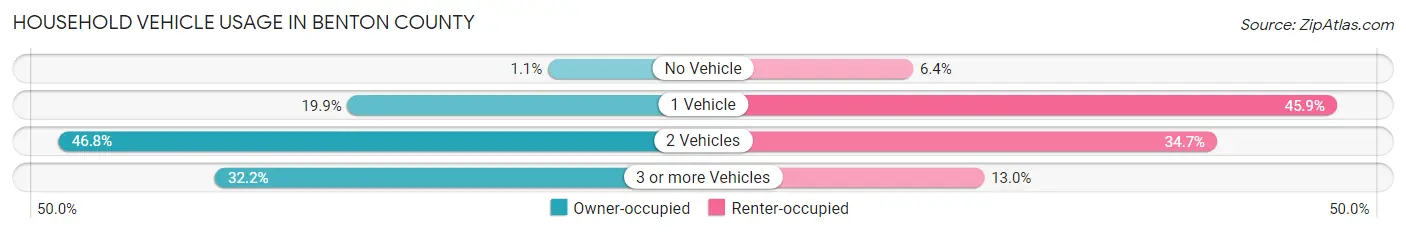
| Vehicles per Household | Owner-occupied | Renter-occupied |
| No Vehicle | 800 (1.1%) | 2,131 (6.4%) |
| 1 Vehicle | 14,032 (19.9%) | 15,380 (45.9%) |
| 2 Vehicles | 33,073 (46.8%) | 11,631 (34.7%) |
| 3 or more Vehicles | 22,762 (32.2%) | 4,355 (13.0%) |
| Total | 70,667 (100.0%) | 33,497 (100.0%) |
Real Estate & Mortgages in Benton County
Real Estate and Mortgage Overview in Benton County
| Characteristic | Without Mortgage | With Mortgage |
| Housing Units | 23,906 | 46,761 |
| Median Property Value | $239,500 | $261,600 |
| Median Household Income | $71,525 | $15,293 |
| Monthly Housing Costs | $489 | $4,218 |
| Real Estate Taxes | $1,404 | $1,035 |
Property Value by Mortgage Status in Benton County
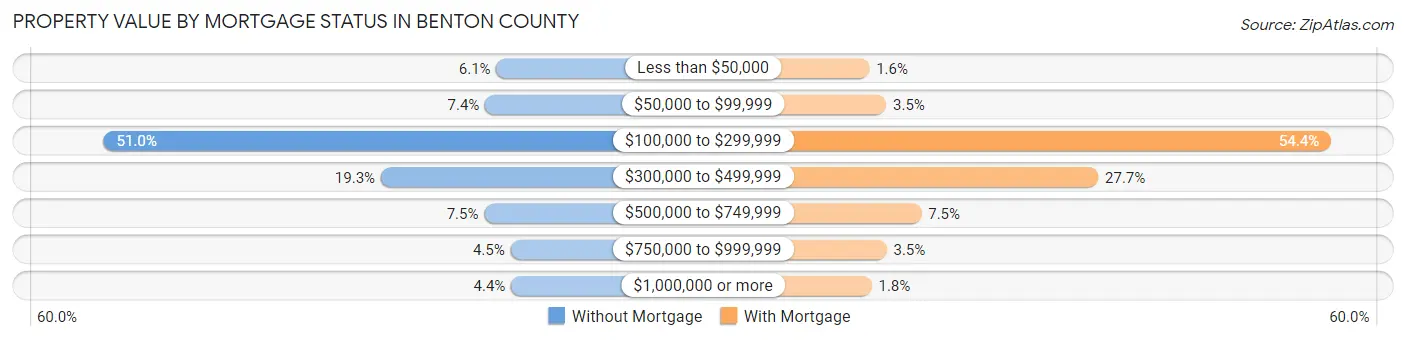
| Property Value | Without Mortgage | With Mortgage |
| Less than $50,000 | 1,453 (6.1%) | 729 (1.6%) |
| $50,000 to $99,999 | 1,760 (7.4%) | 1,634 (3.5%) |
| $100,000 to $299,999 | 12,185 (51.0%) | 25,416 (54.3%) |
| $300,000 to $499,999 | 4,608 (19.3%) | 12,961 (27.7%) |
| $500,000 to $749,999 | 1,784 (7.5%) | 3,510 (7.5%) |
| $750,000 to $999,999 | 1,066 (4.5%) | 1,654 (3.5%) |
| $1,000,000 or more | 1,050 (4.4%) | 857 (1.8%) |
| Total | 23,906 (100.0%) | 46,761 (100.0%) |
Household Income by Mortgage Status in Benton County
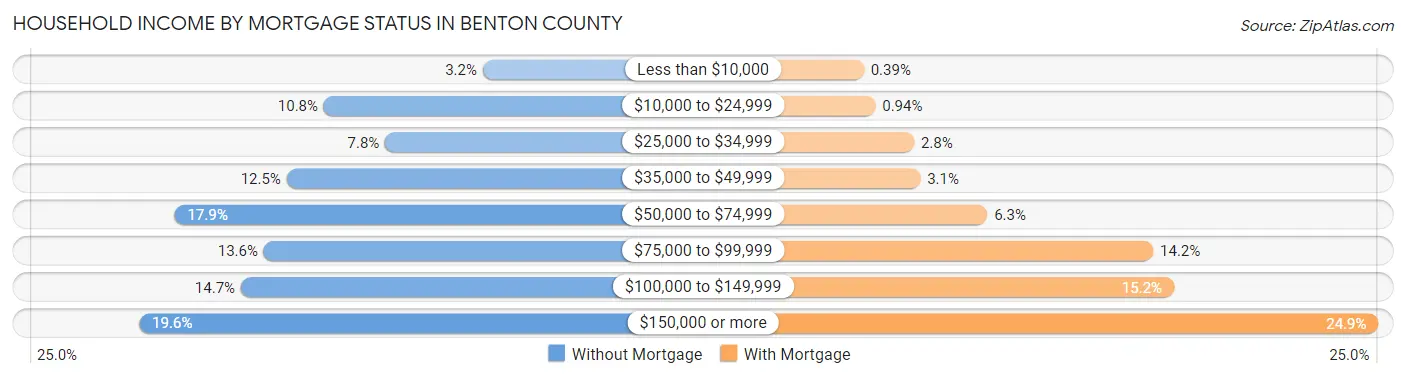
| Household Income | Without Mortgage | With Mortgage |
| Less than $10,000 | 761 (3.2%) | 181 (0.4%) |
| $10,000 to $24,999 | 2,570 (10.7%) | 440 (0.9%) |
| $25,000 to $34,999 | 1,872 (7.8%) | 1,299 (2.8%) |
| $35,000 to $49,999 | 2,993 (12.5%) | 1,442 (3.1%) |
| $50,000 to $74,999 | 4,270 (17.9%) | 2,932 (6.3%) |
| $75,000 to $99,999 | 3,254 (13.6%) | 6,625 (14.2%) |
| $100,000 to $149,999 | 3,513 (14.7%) | 7,090 (15.2%) |
| $150,000 or more | 4,673 (19.6%) | 11,640 (24.9%) |
| Total | 23,906 (100.0%) | 46,761 (100.0%) |
Property Value to Household Income Ratio in Benton County
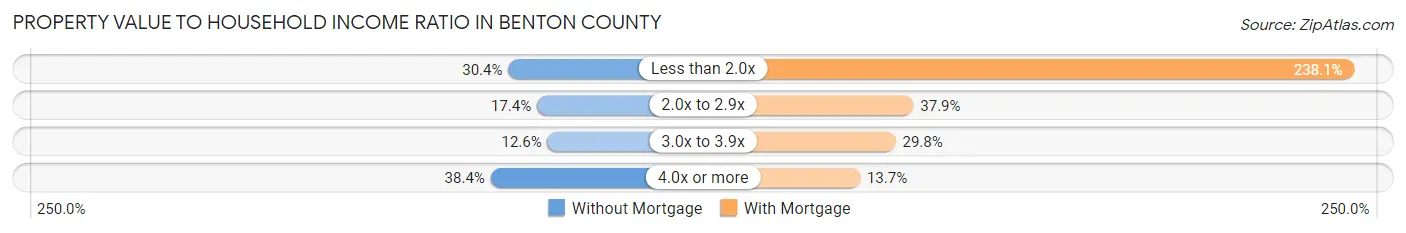
| Value-to-Income Ratio | Without Mortgage | With Mortgage |
| Less than 2.0x | 7,268 (30.4%) | 111,347 (238.1%) |
| 2.0x to 2.9x | 4,147 (17.3%) | 17,712 (37.9%) |
| 3.0x to 3.9x | 3,008 (12.6%) | 13,941 (29.8%) |
| 4.0x or more | 9,177 (38.4%) | 6,381 (13.7%) |
| Total | 23,906 (100.0%) | 46,761 (100.0%) |
Real Estate Taxes by Mortgage Status in Benton County
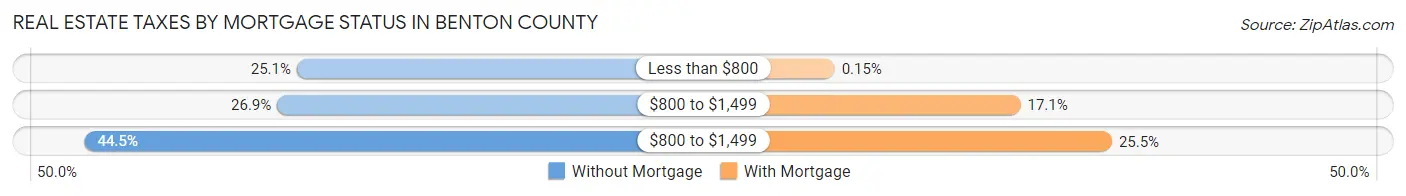
| Property Taxes | Without Mortgage | With Mortgage |
| Less than $800 | 6,010 (25.1%) | 70 (0.2%) |
| $800 to $1,499 | 6,441 (26.9%) | 8,004 (17.1%) |
| $800 to $1,499 | 10,643 (44.5%) | 11,911 (25.5%) |
| Total | 23,906 (100.0%) | 46,761 (100.0%) |
Health & Disability in Benton County
Health Insurance Coverage by Age in Benton County
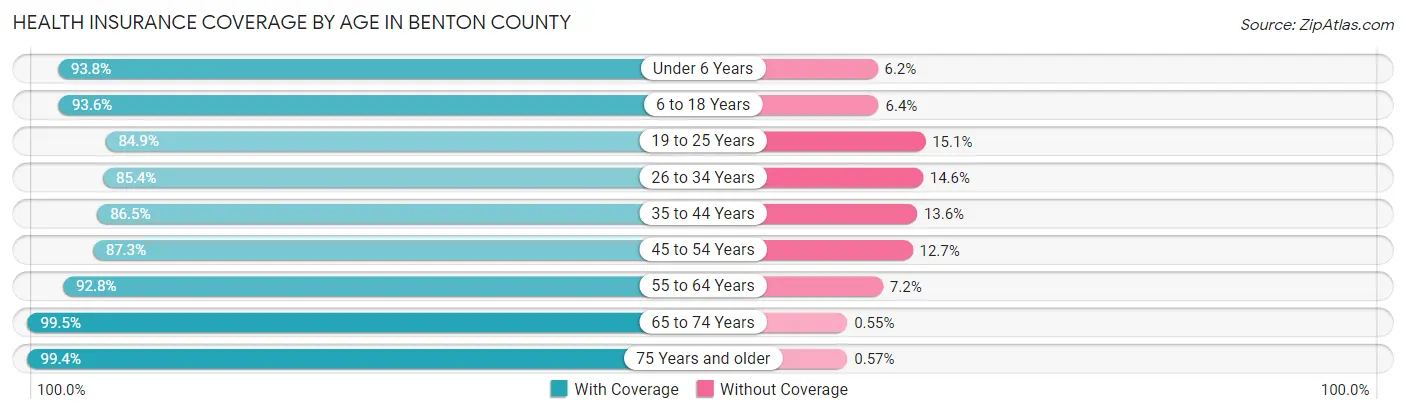
| Age Bracket | With Coverage | Without Coverage |
| Under 6 Years | 21,707 (93.8%) | 1,435 (6.2%) |
| 6 to 18 Years | 50,733 (93.6%) | 3,469 (6.4%) |
| 19 to 25 Years | 20,863 (84.9%) | 3,709 (15.1%) |
| 26 to 34 Years | 32,133 (85.4%) | 5,510 (14.6%) |
| 35 to 44 Years | 36,241 (86.5%) | 5,682 (13.6%) |
| 45 to 54 Years | 30,367 (87.3%) | 4,425 (12.7%) |
| 55 to 64 Years | 28,433 (92.8%) | 2,207 (7.2%) |
| 65 to 74 Years | 22,445 (99.5%) | 124 (0.5%) |
| 75 Years and older | 15,292 (99.4%) | 87 (0.6%) |
| Total | 258,214 (90.6%) | 26,648 (9.3%) |
Health Insurance Coverage by Citizenship Status in Benton County
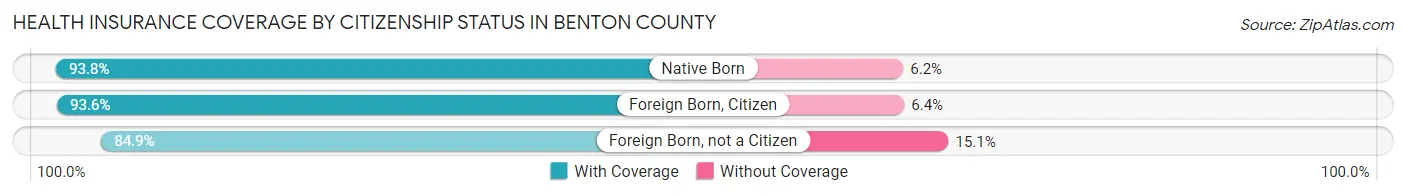
| Citizenship Status | With Coverage | Without Coverage |
| Native Born | 21,707 (93.8%) | 1,435 (6.2%) |
| Foreign Born, Citizen | 50,733 (93.6%) | 3,469 (6.4%) |
| Foreign Born, not a Citizen | 20,863 (84.9%) | 3,709 (15.1%) |
Health Insurance Coverage by Household Income in Benton County
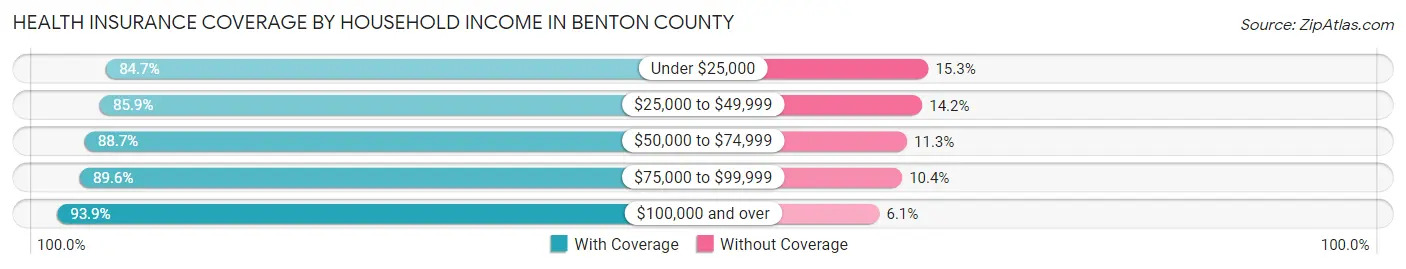
| Household Income | With Coverage | Without Coverage |
| Under $25,000 | 15,711 (84.7%) | 2,839 (15.3%) |
| $25,000 to $49,999 | 32,124 (85.9%) | 5,296 (14.1%) |
| $50,000 to $74,999 | 42,164 (88.7%) | 5,372 (11.3%) |
| $75,000 to $99,999 | 41,057 (89.6%) | 4,755 (10.4%) |
| $100,000 and over | 125,880 (93.9%) | 8,227 (6.1%) |
Public vs Private Health Insurance Coverage by Age in Benton County
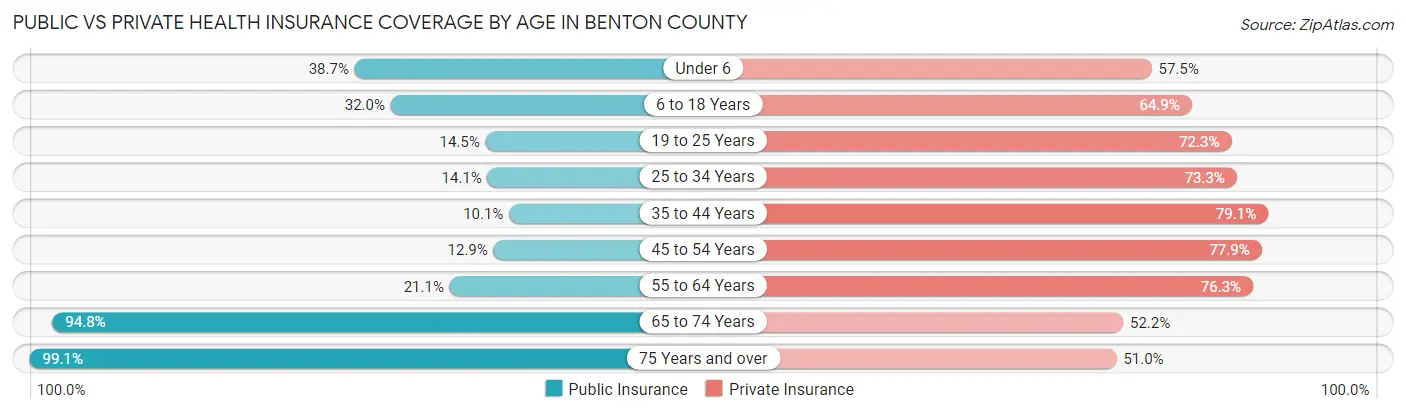
| Age Bracket | Public Insurance | Private Insurance |
| Under 6 | 8,961 (38.7%) | 13,306 (57.5%) |
| 6 to 18 Years | 17,362 (32.0%) | 35,189 (64.9%) |
| 19 to 25 Years | 3,550 (14.4%) | 17,761 (72.3%) |
| 25 to 34 Years | 5,297 (14.1%) | 27,588 (73.3%) |
| 35 to 44 Years | 4,213 (10.1%) | 33,163 (79.1%) |
| 45 to 54 Years | 4,501 (12.9%) | 27,100 (77.9%) |
| 55 to 64 Years | 6,461 (21.1%) | 23,379 (76.3%) |
| 65 to 74 Years | 21,402 (94.8%) | 11,781 (52.2%) |
| 75 Years and over | 15,234 (99.1%) | 7,840 (51.0%) |
| Total | 86,981 (30.5%) | 197,107 (69.2%) |
Disability Status by Sex by Age in Benton County
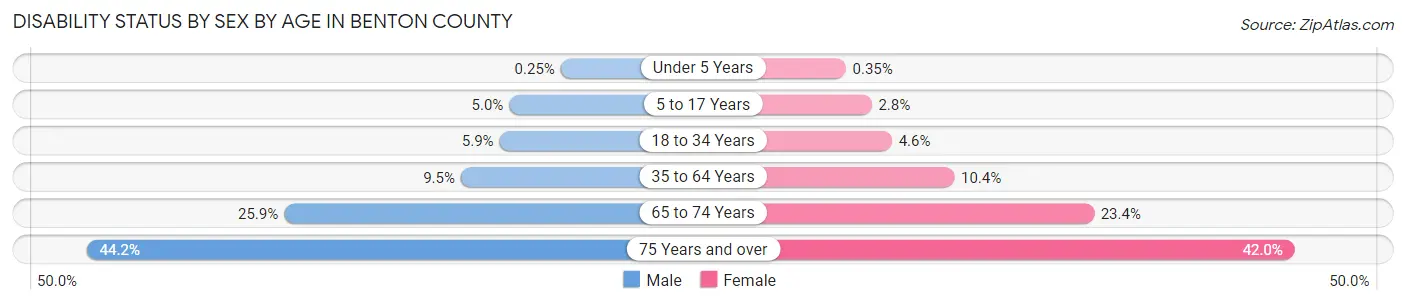
| Age Bracket | Male | Female |
| Under 5 Years | 25 (0.3%) | 32 (0.4%) |
| 5 to 17 Years | 1,409 (5.0%) | 729 (2.8%) |
| 18 to 34 Years | 1,983 (5.9%) | 1,498 (4.6%) |
| 35 to 64 Years | 5,189 (9.5%) | 5,509 (10.4%) |
| 65 to 74 Years | 2,761 (25.9%) | 2,787 (23.4%) |
| 75 Years and over | 2,847 (44.2%) | 3,759 (42.0%) |
Disability Class by Sex by Age in Benton County
Disability Class: Hearing Difficulty
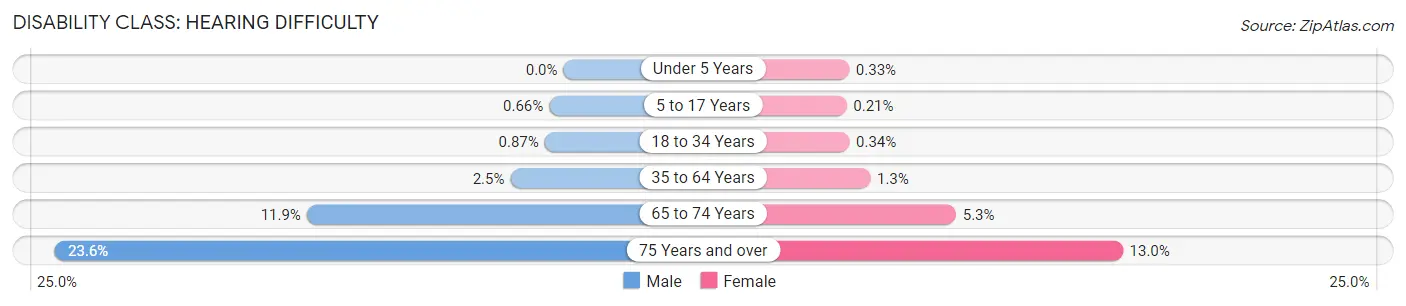
| Age Bracket | Male | Female |
| Under 5 Years | 0 (0.0%) | 30 (0.3%) |
| 5 to 17 Years | 184 (0.7%) | 57 (0.2%) |
| 18 to 34 Years | 290 (0.9%) | 111 (0.3%) |
| 35 to 64 Years | 1,342 (2.5%) | 693 (1.3%) |
| 65 to 74 Years | 1,269 (11.9%) | 631 (5.3%) |
| 75 Years and over | 1,518 (23.6%) | 1,165 (13.0%) |
Disability Class: Vision Difficulty
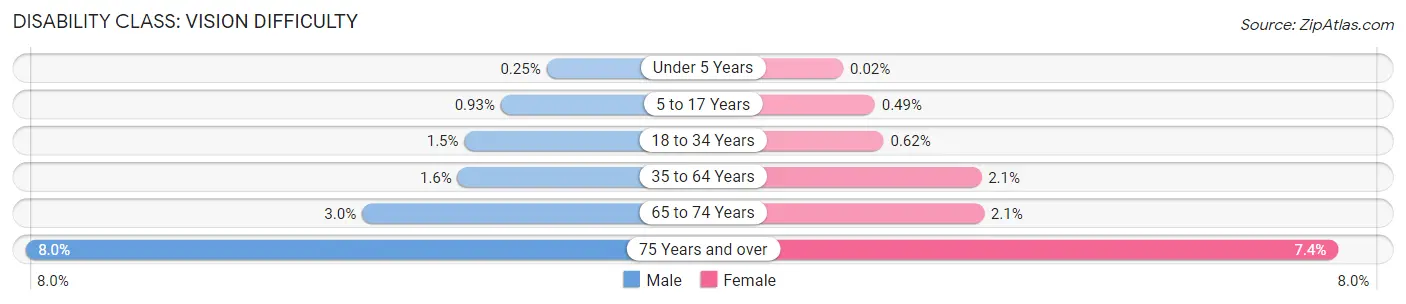
| Age Bracket | Male | Female |
| Under 5 Years | 25 (0.3%) | 2 (0.0%) |
| 5 to 17 Years | 260 (0.9%) | 131 (0.5%) |
| 18 to 34 Years | 493 (1.5%) | 202 (0.6%) |
| 35 to 64 Years | 853 (1.6%) | 1,094 (2.1%) |
| 65 to 74 Years | 318 (3.0%) | 252 (2.1%) |
| 75 Years and over | 514 (8.0%) | 659 (7.4%) |
Disability Class: Cognitive Difficulty
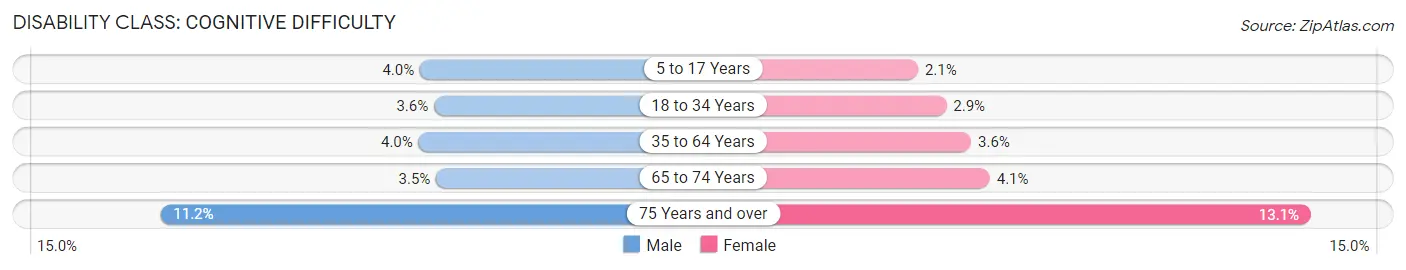
| Age Bracket | Male | Female |
| 5 to 17 Years | 1,116 (4.0%) | 561 (2.1%) |
| 18 to 34 Years | 1,205 (3.6%) | 942 (2.9%) |
| 35 to 64 Years | 2,199 (4.0%) | 1,902 (3.6%) |
| 65 to 74 Years | 377 (3.5%) | 491 (4.1%) |
| 75 Years and over | 722 (11.2%) | 1,168 (13.1%) |
Disability Class: Ambulatory Difficulty
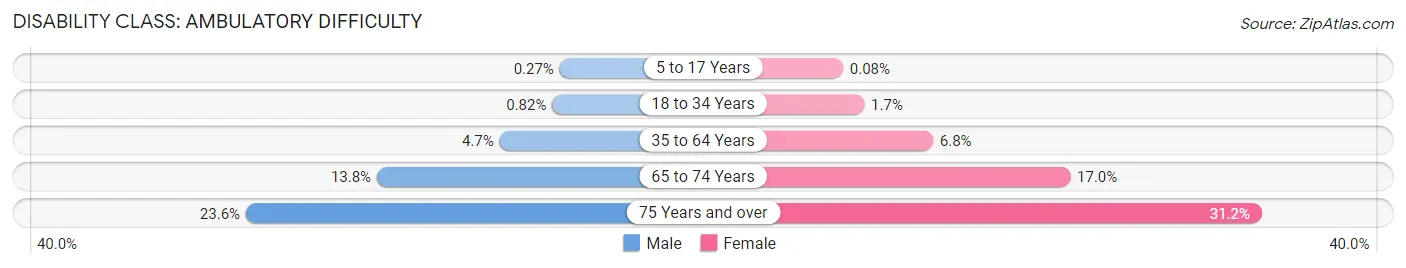
| Age Bracket | Male | Female |
| 5 to 17 Years | 75 (0.3%) | 22 (0.1%) |
| 18 to 34 Years | 274 (0.8%) | 539 (1.7%) |
| 35 to 64 Years | 2,585 (4.7%) | 3,571 (6.8%) |
| 65 to 74 Years | 1,474 (13.8%) | 2,020 (17.0%) |
| 75 Years and over | 1,517 (23.6%) | 2,789 (31.2%) |
Disability Class: Self-Care Difficulty
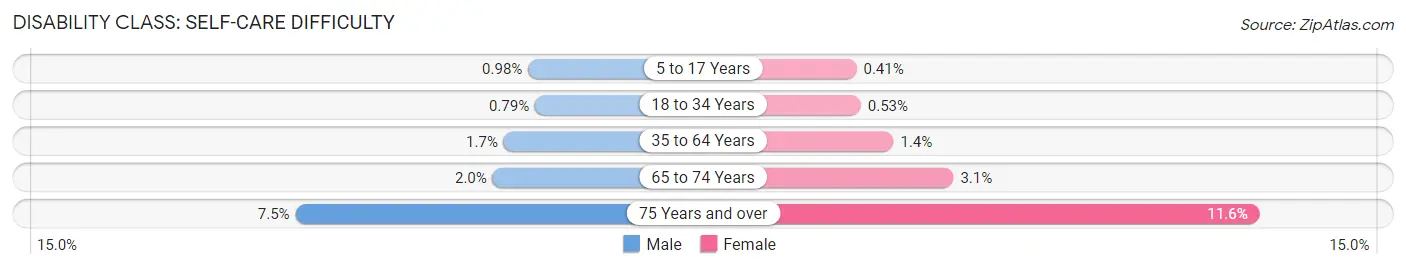
| Age Bracket | Male | Female |
| 5 to 17 Years | 274 (1.0%) | 108 (0.4%) |
| 18 to 34 Years | 264 (0.8%) | 170 (0.5%) |
| 35 to 64 Years | 907 (1.7%) | 763 (1.4%) |
| 65 to 74 Years | 210 (2.0%) | 371 (3.1%) |
| 75 Years and over | 480 (7.5%) | 1,040 (11.6%) |
Technology Access in Benton County
Computing Device Access in Benton County
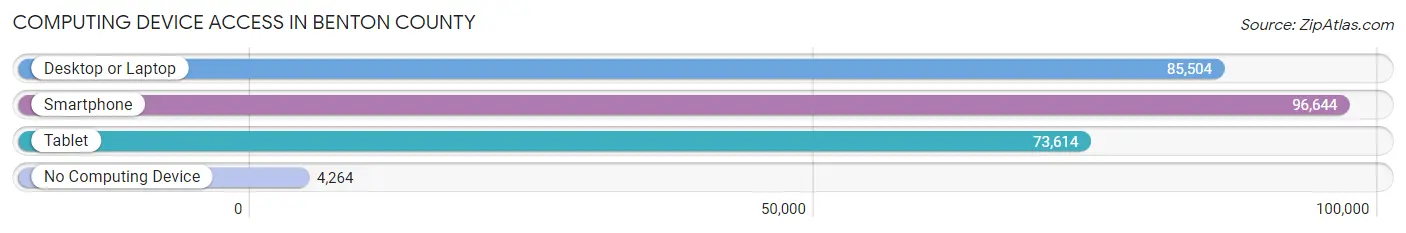
| Device Type | # Households | % Households |
| Desktop or Laptop | 85,504 | 82.1% |
| Smartphone | 96,644 | 92.8% |
| Tablet | 73,614 | 70.7% |
| No Computing Device | 4,264 | 4.1% |
| Total | 104,164 | 100.0% |
Internet Access in Benton County
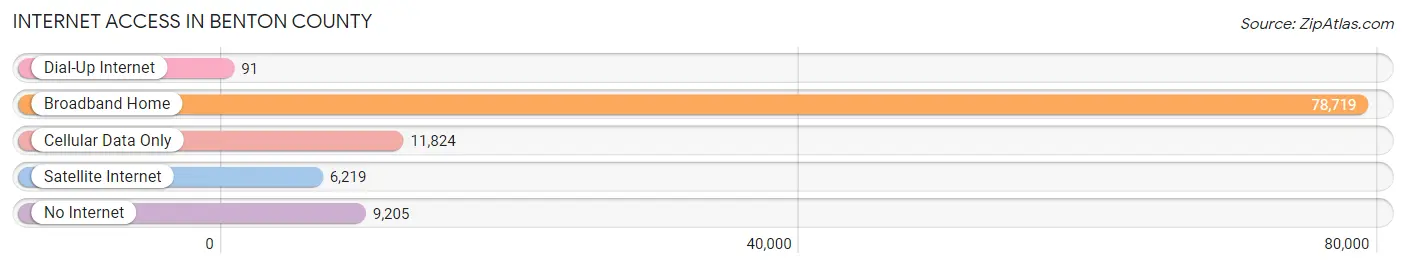
| Internet Type | # Households | % Households |
| Dial-Up Internet | 91 | 0.1% |
| Broadband Home | 78,719 | 75.6% |
| Cellular Data Only | 11,824 | 11.4% |
| Satellite Internet | 6,219 | 6.0% |
| No Internet | 9,205 | 8.8% |
| Total | 104,164 | 100.0% |
Benton County Summary
Benton County, Arkansas is located in the northwest corner of the state and is part of the Northwest Arkansas metropolitan area. The county is bordered by Washington County to the north, Madison County to the east, Carroll County to the south, and the state of Oklahoma to the west. Benton County is the second most populous county in Arkansas, with a population of 253,717 as of the 2020 census.
Geography
Benton County is located in the Ozark Mountains region of Arkansas. The county is mostly composed of rolling hills and valleys, with the highest point being Mount Sherman at 1,845 feet. The county is drained by the White River and its tributaries, including the Osage Creek, Little Osage Creek, and Big Sugar Creek. The county is also home to several natural lakes, including Beaver Lake, Lake Atalanta, and Lake Sequoyah.
The county is divided into two distinct regions: the Ozark Plateau in the north and the Arkansas River Valley in the south. The Ozark Plateau is characterized by steep hills and valleys, while the Arkansas River Valley is characterized by flat plains and rolling hills.
Economy
Benton County is home to a diverse economy, with a variety of industries providing employment opportunities. The county is home to several large employers, including Walmart, Tyson Foods, J.B. Hunt, and the University of Arkansas. The county is also home to a number of smaller businesses, including manufacturing, retail, and service industries.
The county is also home to a number of agricultural operations, including poultry, beef, and dairy farms. The county is also home to several wineries and vineyards, as well as a number of fruit and vegetable farms.
Demographics
As of the 2020 census, Benton County had a population of 253,717, making it the second most populous county in Arkansas. The population is spread out, with 48.3% of the population being male and 51.7% being female. The median age of the population is 36.7 years, with 24.3% of the population under the age of 18 and 11.2% over the age of 65.
The racial makeup of the county is 87.2% White, 5.3% Black or African American, 1.3% Native American, 2.2% Asian, 0.2% Pacific Islander, 1.7% from other races, and 2.3% from two or more races. The largest ancestry groups in the county are German (17.3%), Irish (14.2%), English (13.2%), and American (10.2%).
The median household income in Benton County is $60,845, and the median family income is $71,945. The per capita income is $30,845. The poverty rate in the county is 11.3%, with 15.3% of children under the age of 18 living in poverty.
Conclusion
Benton County, Arkansas is a diverse and vibrant county located in the northwest corner of the state. The county is home to a variety of industries, including retail, manufacturing, and agriculture. The county is also home to a diverse population, with a median age of 36.7 years and a median household income of $60,845. Benton County is an important part of the Northwest Arkansas metropolitan area and is an important contributor to the state’s economy.
Common Questions
What is Per Capita Income in Benton County?
Per Capita income in Benton County is $43,359.
What is the Median Family Income in Benton County?
Median Family Income in Benton County is $97,168.
What is the Median Household income in Benton County?
Median Household Income in Benton County is $85,269.
What is Income or Wage Gap in Benton County?
Income or Wage Gap in Benton County is 27.9%.
Women in Benton County earn 72.1 cents for every dollar earned by a man.
What is Family Income Deficit in Benton County?
Family Income Deficit in Benton County is $12,344.
Families that are below poverty line in Benton County earn $12,344 less on average than the poverty threshold level.
What is Inequality or Gini Index in Benton County?
Inequality or Gini Index in Benton County is 0.46.
What is the Total Population of Benton County?
Total Population of Benton County is 286,528.
What is the Total Male Population of Benton County?
Total Male Population of Benton County is 144,085.
What is the Total Female Population of Benton County?
Total Female Population of Benton County is 142,443.
What is the Ratio of Males per 100 Females in Benton County?
There are 101.15 Males per 100 Females in Benton County.
What is the Ratio of Females per 100 Males in Benton County?
There are 98.86 Females per 100 Males in Benton County.
What is the Median Population Age in Benton County?
Median Population Age in Benton County is 35.7 Years.
What is the Average Family Size in Benton County
Average Family Size in Benton County is 3.2 People.
What is the Average Household Size in Benton County
Average Household Size in Benton County is 2.7 People.
How Large is the Labor Force in Benton County?
There are 147,324 People in the Labor Forcein in Benton County.
What is the Percentage of People in the Labor Force in Benton County?
66.6% of People are in the Labor Force in Benton County.
What is the Unemployment Rate in Benton County?
Unemployment Rate in Benton County is 2.9%.