West Memphis, AR Map & Demographics
West Memphis Map
West Memphis Overview
$22,985
PER CAPITA INCOME
$46,603
AVG FAMILY INCOME
$40,904
AVG HOUSEHOLD INCOME
13.9%
WAGE / INCOME GAP [ % ]
86.1¢/ $1
WAGE / INCOME GAP [ $ ]
$11,702
FAMILY INCOME DEFICIT
0.47
INEQUALITY / GINI INDEX
24,351
TOTAL POPULATION
10,839
MALE POPULATION
13,512
FEMALE POPULATION
80.22
MALES / 100 FEMALES
124.66
FEMALES / 100 MALES
33.3
MEDIAN AGE
3.1
AVG FAMILY SIZE
2.5
AVG HOUSEHOLD SIZE
11,056
LABOR FORCE [ PEOPLE ]
59.8%
PERCENT IN LABOR FORCE
13.3%
UNEMPLOYMENT RATE
West Memphis Zip Codes
West Memphis Area Codes
Income in West Memphis
Income Overview in West Memphis
Per Capita Income in West Memphis is $22,985, while median incomes of families and households are $46,603 and $40,904 respectively.
| Characteristic | Number | Measure |
| Per Capita Income | 24,351 | $22,985 |
| Median Family Income | 5,942 | $46,603 |
| Mean Family Income | 5,942 | $61,704 |
| Median Household Income | 9,654 | $40,904 |
| Mean Household Income | 9,654 | $56,849 |
| Income Deficit | 5,942 | $11,702 |
| Wage / Income Gap (%) | 24,351 | 13.91% |
| Wage / Income Gap ($) | 24,351 | 86.09¢ per $1 |
| Gini / Inequality Index | 24,351 | 0.47 |
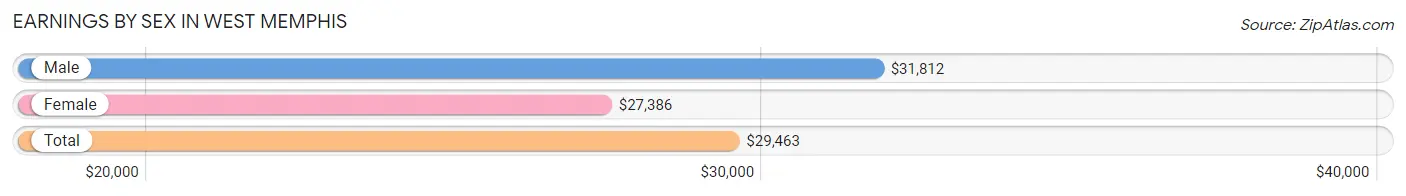
Earnings by Sex in West Memphis
Average Earnings in West Memphis are $29,463, $31,812 for men and $27,386 for women, a difference of 13.9%.
| Sex | Number | Average Earnings |
| Male | 4,941 (44.2%) | $31,812 |
| Female | 6,244 (55.8%) | $27,386 |
| Total | 11,185 (100.0%) | $29,463 |
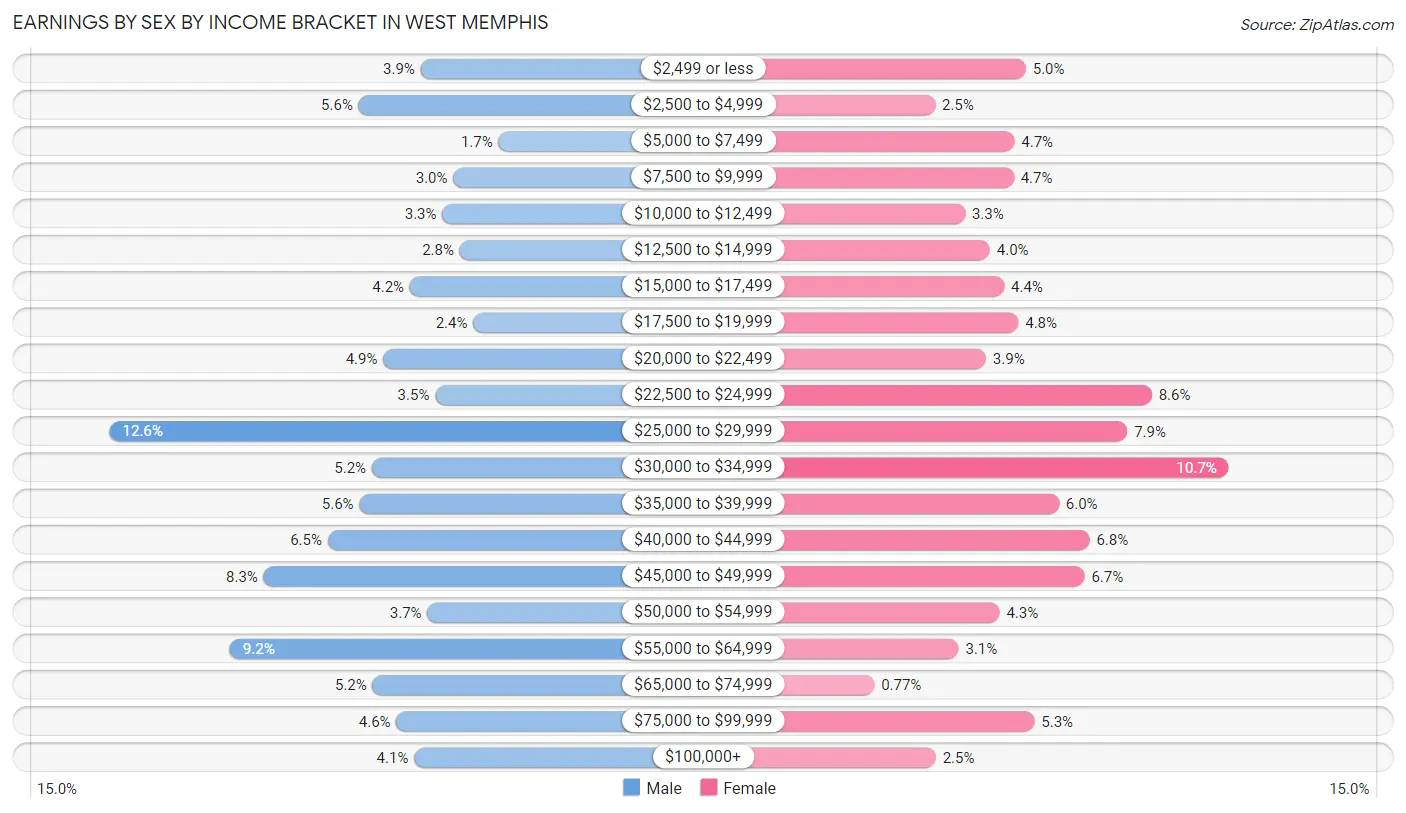
Earnings by Sex by Income Bracket in West Memphis
The most common earnings brackets in West Memphis are $25,000 to $29,999 for men (623 | 12.6%) and $30,000 to $34,999 for women (670 | 10.7%).
| Income | Male | Female |
| $2,499 or less | 191 (3.9%) | 314 (5.0%) |
| $2,500 to $4,999 | 277 (5.6%) | 155 (2.5%) |
| $5,000 to $7,499 | 83 (1.7%) | 294 (4.7%) |
| $7,500 to $9,999 | 146 (2.9%) | 293 (4.7%) |
| $10,000 to $12,499 | 161 (3.3%) | 207 (3.3%) |
| $12,500 to $14,999 | 137 (2.8%) | 251 (4.0%) |
| $15,000 to $17,499 | 206 (4.2%) | 276 (4.4%) |
| $17,500 to $19,999 | 118 (2.4%) | 301 (4.8%) |
| $20,000 to $22,499 | 243 (4.9%) | 244 (3.9%) |
| $22,500 to $24,999 | 171 (3.5%) | 535 (8.6%) |
| $25,000 to $29,999 | 623 (12.6%) | 492 (7.9%) |
| $30,000 to $34,999 | 259 (5.2%) | 670 (10.7%) |
| $35,000 to $39,999 | 276 (5.6%) | 372 (6.0%) |
| $40,000 to $44,999 | 320 (6.5%) | 426 (6.8%) |
| $45,000 to $49,999 | 409 (8.3%) | 417 (6.7%) |
| $50,000 to $54,999 | 182 (3.7%) | 268 (4.3%) |
| $55,000 to $64,999 | 456 (9.2%) | 196 (3.1%) |
| $65,000 to $74,999 | 258 (5.2%) | 48 (0.8%) |
| $75,000 to $99,999 | 225 (4.5%) | 329 (5.3%) |
| $100,000+ | 200 (4.1%) | 156 (2.5%) |
| Total | 4,941 (100.0%) | 6,244 (100.0%) |
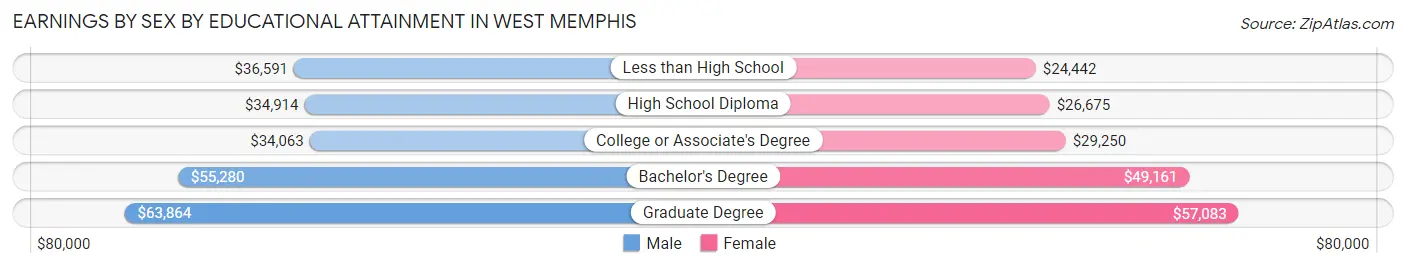
Earnings by Sex by Educational Attainment in West Memphis
Average earnings in West Memphis are $38,125 for men and $30,856 for women, a difference of 19.1%. Men with an educational attainment of graduate degree enjoy the highest average annual earnings of $63,864, while those with college or associate's degree education earn the least with $34,063. Women with an educational attainment of graduate degree earn the most with the average annual earnings of $57,083, while those with less than high school education have the smallest earnings of $24,442.
| Educational Attainment | Male Income | Female Income |
| Less than High School | $36,591 | $24,442 |
| High School Diploma | $34,914 | $26,675 |
| College or Associate's Degree | $34,063 | $29,250 |
| Bachelor's Degree | $55,280 | $49,161 |
| Graduate Degree | $63,864 | $57,083 |
| Total | $38,125 | $30,856 |
Family Income in West Memphis
Family Income Brackets in West Memphis
According to the West Memphis family income data, there are 1,111 families falling into the $50,000 to $74,999 income range, which is the most common income bracket and makes up 18.7% of all families. Conversely, the $200,000+ income bracket is the least frequent group with only 143 families (2.4%) belonging to this category.
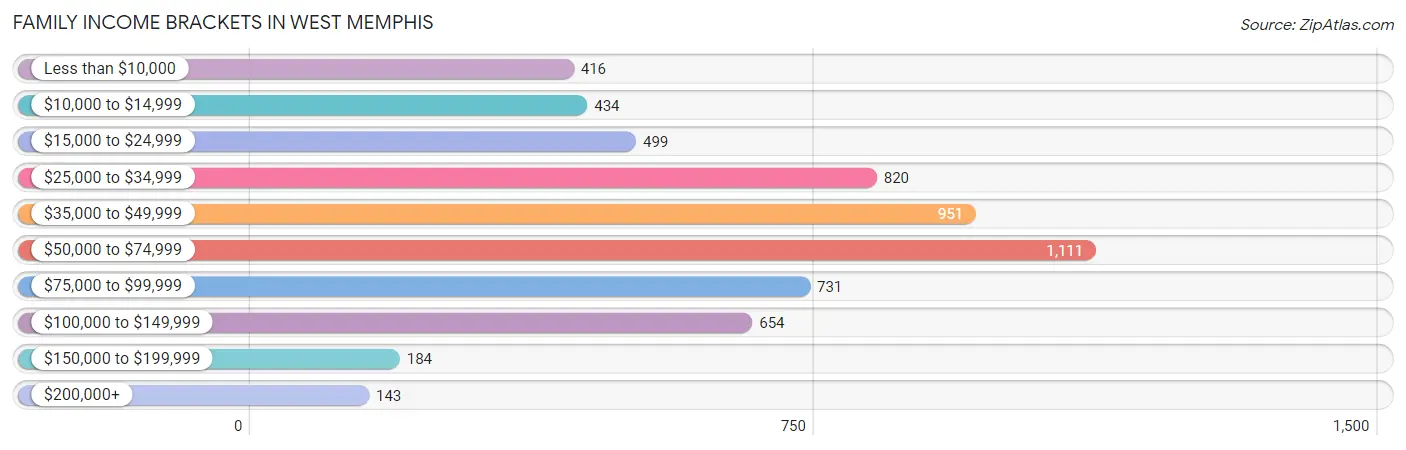
| Income Bracket | # Families | % Families |
| Less than $10,000 | 416 | 7.0% |
| $10,000 to $14,999 | 434 | 7.3% |
| $15,000 to $24,999 | 499 | 8.4% |
| $25,000 to $34,999 | 820 | 13.8% |
| $35,000 to $49,999 | 951 | 16.0% |
| $50,000 to $74,999 | 1,111 | 18.7% |
| $75,000 to $99,999 | 731 | 12.3% |
| $100,000 to $149,999 | 654 | 11.0% |
| $150,000 to $199,999 | 184 | 3.1% |
| $200,000+ | 143 | 2.4% |
Family Income by Famaliy Size in West Memphis
7+ person families (45 | 0.8%) account for the highest median family income in West Memphis with $88,242 per family, while 2-person families (3,102 | 52.2%) have the highest median income of $23,750 per family member.
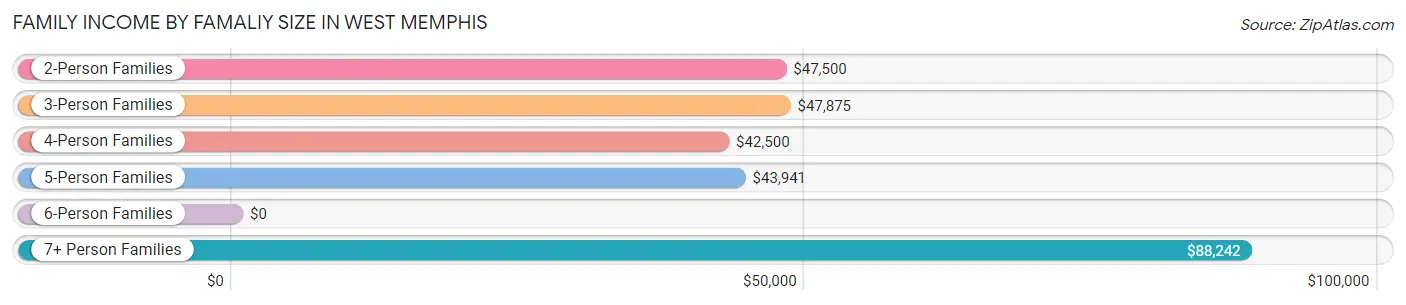
| Income Bracket | # Families | Median Income |
| 2-Person Families | 3,102 (52.2%) | $47,500 |
| 3-Person Families | 1,305 (22.0%) | $47,875 |
| 4-Person Families | 866 (14.6%) | $42,500 |
| 5-Person Families | 510 (8.6%) | $43,941 |
| 6-Person Families | 114 (1.9%) | $0 |
| 7+ Person Families | 45 (0.8%) | $88,242 |
| Total | 5,942 (100.0%) | $46,603 |
Family Income by Number of Earners in West Memphis
The median family income in West Memphis is $46,603, with families comprising 3+ earners (411) having the highest median family income of $106,050, while families with no earners (1,007) have the lowest median family income of $16,972, accounting for 6.9% and 17.0% of families, respectively.
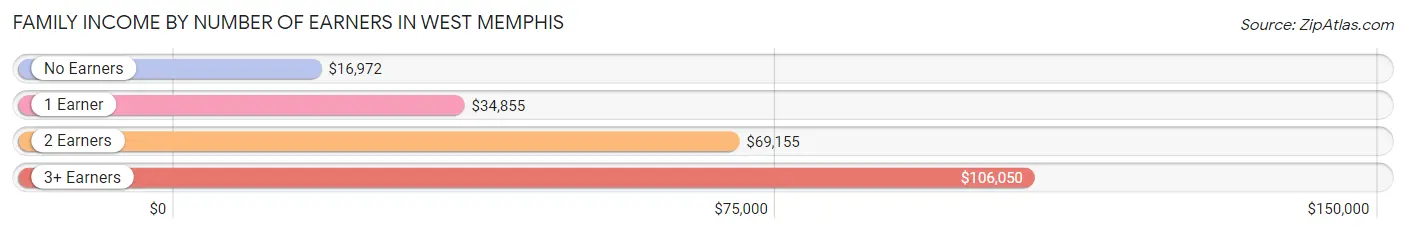
| Number of Earners | # Families | Median Income |
| No Earners | 1,007 (17.0%) | $16,972 |
| 1 Earner | 2,721 (45.8%) | $34,855 |
| 2 Earners | 1,803 (30.3%) | $69,155 |
| 3+ Earners | 411 (6.9%) | $106,050 |
| Total | 5,942 (100.0%) | $46,603 |
Household Income in West Memphis
Household Income Brackets in West Memphis
With 1,718 households falling in the category, the $50,000 to $74,999 income range is the most frequent in West Memphis, accounting for 17.8% of all households. In contrast, only 203 households (2.1%) fall into the $150,000 to $199,999 income bracket, making it the least populous group.
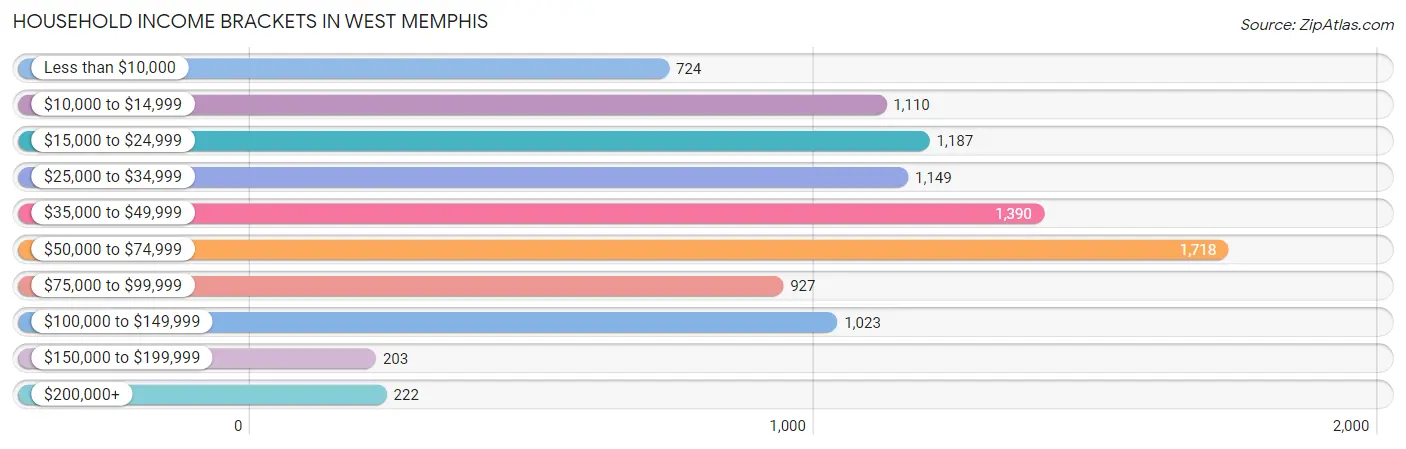
| Income Bracket | # Households | % Households |
| Less than $10,000 | 724 | 7.5% |
| $10,000 to $14,999 | 1,110 | 11.5% |
| $15,000 to $24,999 | 1,187 | 12.3% |
| $25,000 to $34,999 | 1,149 | 11.9% |
| $35,000 to $49,999 | 1,390 | 14.4% |
| $50,000 to $74,999 | 1,718 | 17.8% |
| $75,000 to $99,999 | 927 | 9.6% |
| $100,000 to $149,999 | 1,023 | 10.6% |
| $150,000 to $199,999 | 203 | 2.1% |
| $200,000+ | 222 | 2.3% |
Household Income by Householder Age in West Memphis
The median household income in West Memphis is $40,904, with the highest median household income of $49,676 found in the 65+ years age bracket for the primary householder. A total of 2,541 households (26.3%) fall into this category. Meanwhile, the 15 to 24 years age bracket for the primary householder has the lowest median household income of $33,269, with 650 households (6.7%) in this group.
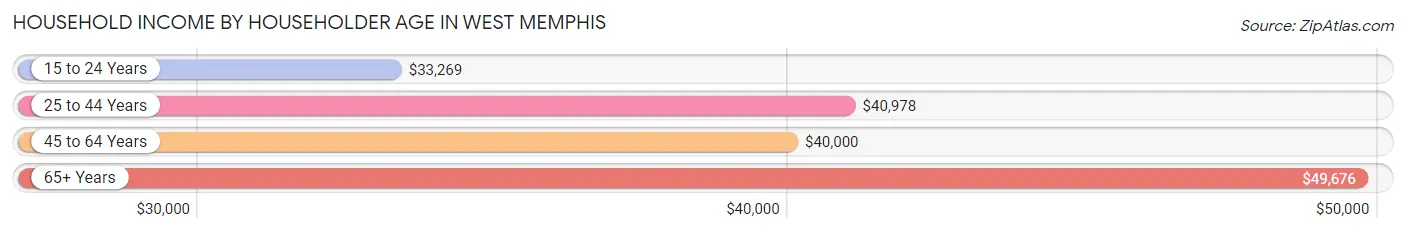
| Income Bracket | # Households | Median Income |
| 15 to 24 Years | 650 (6.7%) | $33,269 |
| 25 to 44 Years | 3,217 (33.3%) | $40,978 |
| 45 to 64 Years | 3,246 (33.6%) | $40,000 |
| 65+ Years | 2,541 (26.3%) | $49,676 |
| Total | 9,654 (100.0%) | $40,904 |
Poverty in West Memphis
Income Below Poverty by Sex and Age in West Memphis
With 21.4% poverty level for males and 27.3% for females among the residents of West Memphis, 5 year old males and under 5 year old females are the most vulnerable to poverty, with 116 males (41.9%) and 490 females (43.3%) in their respective age groups living below the poverty level.
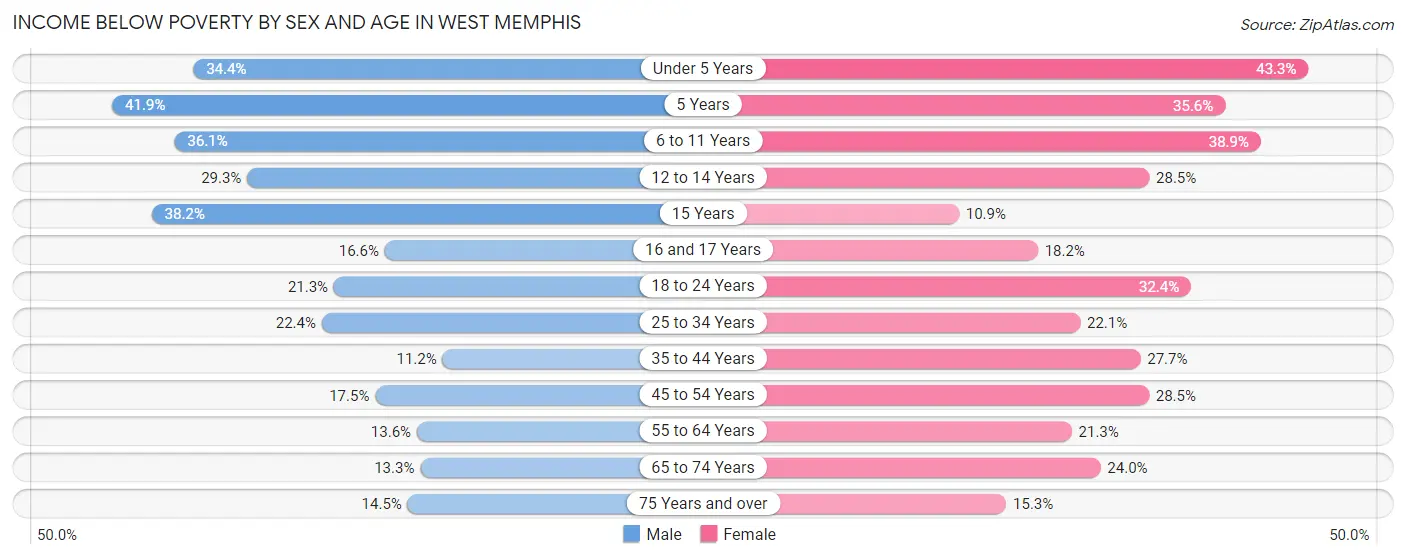
| Age Bracket | Male | Female |
| Under 5 Years | 350 (34.4%) | 490 (43.3%) |
| 5 Years | 116 (41.9%) | 69 (35.6%) |
| 6 to 11 Years | 322 (36.1%) | 402 (38.9%) |
| 12 to 14 Years | 125 (29.3%) | 148 (28.5%) |
| 15 Years | 47 (38.2%) | 19 (10.9%) |
| 16 and 17 Years | 55 (16.6%) | 62 (18.2%) |
| 18 to 24 Years | 257 (21.3%) | 410 (32.4%) |
| 25 to 34 Years | 324 (22.4%) | 450 (22.1%) |
| 35 to 44 Years | 142 (11.2%) | 431 (27.7%) |
| 45 to 54 Years | 162 (17.5%) | 412 (28.5%) |
| 55 to 64 Years | 183 (13.6%) | 311 (21.3%) |
| 65 to 74 Years | 102 (13.3%) | 269 (24.0%) |
| 75 Years and over | 88 (14.4%) | 149 (15.2%) |
| Total | 2,273 (21.4%) | 3,622 (27.3%) |
Income Above Poverty by Sex and Age in West Memphis
According to the poverty statistics in West Memphis, males aged 35 to 44 years and females aged 15 years are the age groups that are most secure financially, with 88.8% of males and 89.1% of females in these age groups living above the poverty line.
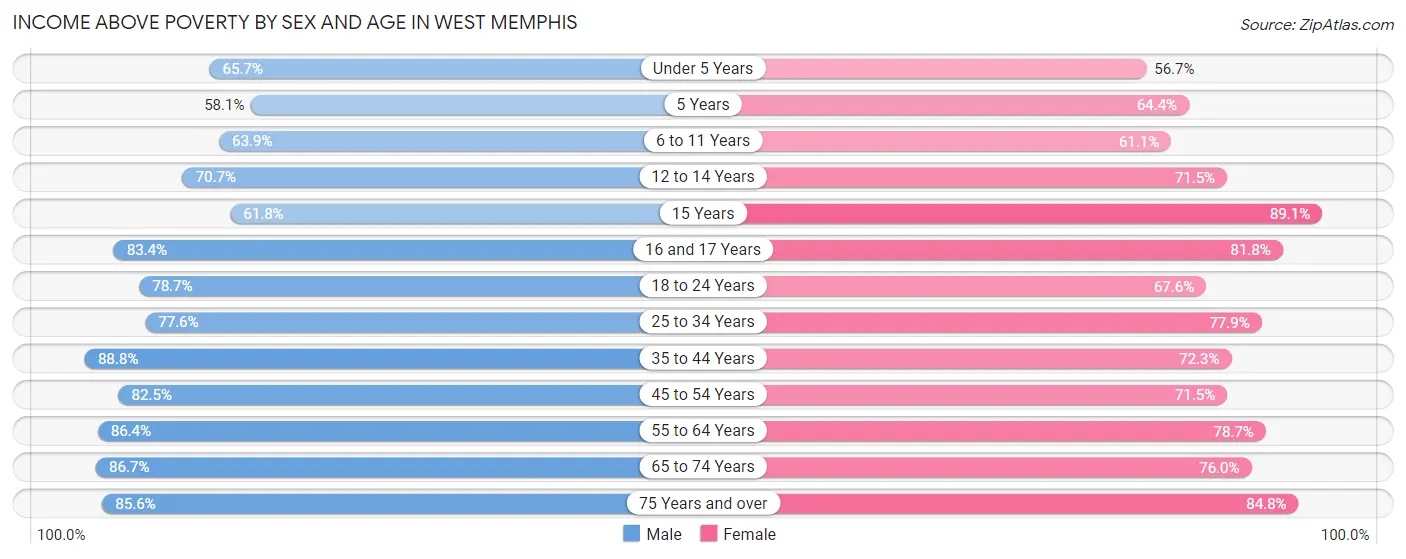
| Age Bracket | Male | Female |
| Under 5 Years | 669 (65.6%) | 642 (56.7%) |
| 5 Years | 161 (58.1%) | 125 (64.4%) |
| 6 to 11 Years | 570 (63.9%) | 632 (61.1%) |
| 12 to 14 Years | 301 (70.7%) | 371 (71.5%) |
| 15 Years | 76 (61.8%) | 156 (89.1%) |
| 16 and 17 Years | 277 (83.4%) | 279 (81.8%) |
| 18 to 24 Years | 950 (78.7%) | 855 (67.6%) |
| 25 to 34 Years | 1,121 (77.6%) | 1,585 (77.9%) |
| 35 to 44 Years | 1,125 (88.8%) | 1,125 (72.3%) |
| 45 to 54 Years | 766 (82.5%) | 1,034 (71.5%) |
| 55 to 64 Years | 1,164 (86.4%) | 1,147 (78.7%) |
| 65 to 74 Years | 666 (86.7%) | 852 (76.0%) |
| 75 Years and over | 521 (85.6%) | 828 (84.8%) |
| Total | 8,367 (78.6%) | 9,631 (72.7%) |
Income Below Poverty Among Married-Couple Families in West Memphis
The poverty statistics for married-couple families in West Memphis show that 4.3% or 107 of the total 2,506 families live below the poverty line. Families with 1 or 2 children have the highest poverty rate of 8.6%, comprising of 68 families. On the other hand, families with no children have the lowest poverty rate of 2.1%, which includes 35 families.
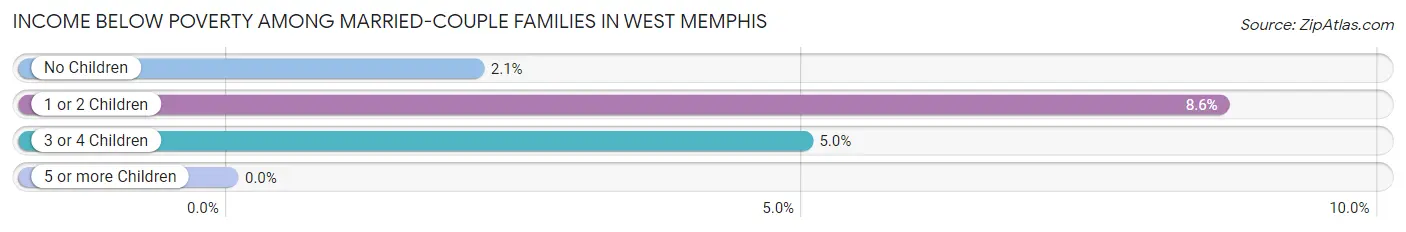
| Children | Above Poverty | Below Poverty |
| No Children | 1,603 (97.9%) | 35 (2.1%) |
| 1 or 2 Children | 720 (91.4%) | 68 (8.6%) |
| 3 or 4 Children | 76 (95.0%) | 4 (5.0%) |
| 5 or more Children | 0 (0.0%) | 0 (0.0%) |
| Total | 2,399 (95.7%) | 107 (4.3%) |
Income Below Poverty Among Single-Parent Households in West Memphis
According to the poverty data in West Memphis, 17.7% or 112 single-father households and 35.2% or 988 single-mother households are living below the poverty line. Among single-father households, those with 3 or 4 children have the highest poverty rate, with 28 households (100.0%) experiencing poverty. Likewise, among single-mother households, those with 3 or 4 children have the highest poverty rate, with 332 households (53.1%) falling below the poverty line.
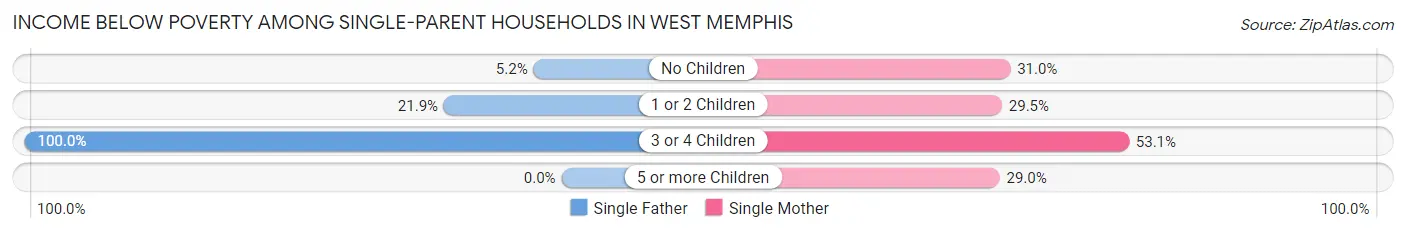
| Children | Single Father | Single Mother |
| No Children | 15 (5.2%) | 273 (31.0%) |
| 1 or 2 Children | 69 (21.9%) | 374 (29.5%) |
| 3 or 4 Children | 28 (100.0%) | 332 (53.1%) |
| 5 or more Children | 0 (0.0%) | 9 (29.0%) |
| Total | 112 (17.7%) | 988 (35.2%) |
Income Below Poverty Among Married-Couple vs Single-Parent Households in West Memphis
The poverty data for West Memphis shows that 107 of the married-couple family households (4.3%) and 1,100 of the single-parent households (32.0%) are living below the poverty level. Within the married-couple family households, those with 1 or 2 children have the highest poverty rate, with 68 households (8.6%) falling below the poverty line. Among the single-parent households, those with 3 or 4 children have the highest poverty rate, with 360 household (55.1%) living below poverty.
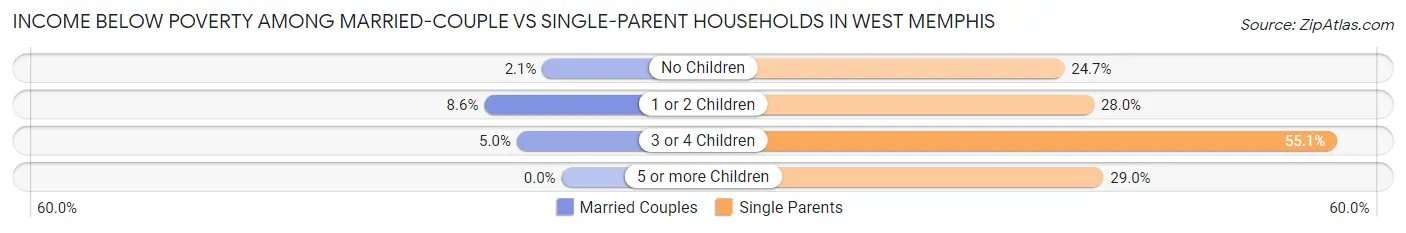
| Children | Married-Couple Families | Single-Parent Households |
| No Children | 35 (2.1%) | 288 (24.7%) |
| 1 or 2 Children | 68 (8.6%) | 443 (28.0%) |
| 3 or 4 Children | 4 (5.0%) | 360 (55.1%) |
| 5 or more Children | 0 (0.0%) | 9 (29.0%) |
| Total | 107 (4.3%) | 1,100 (32.0%) |
Race in West Memphis
The most populous races in West Memphis are Black / African American (15,177 | 62.3%), White / Caucasian (8,035 | 33.0%), and Two or more Races (929 | 3.8%).
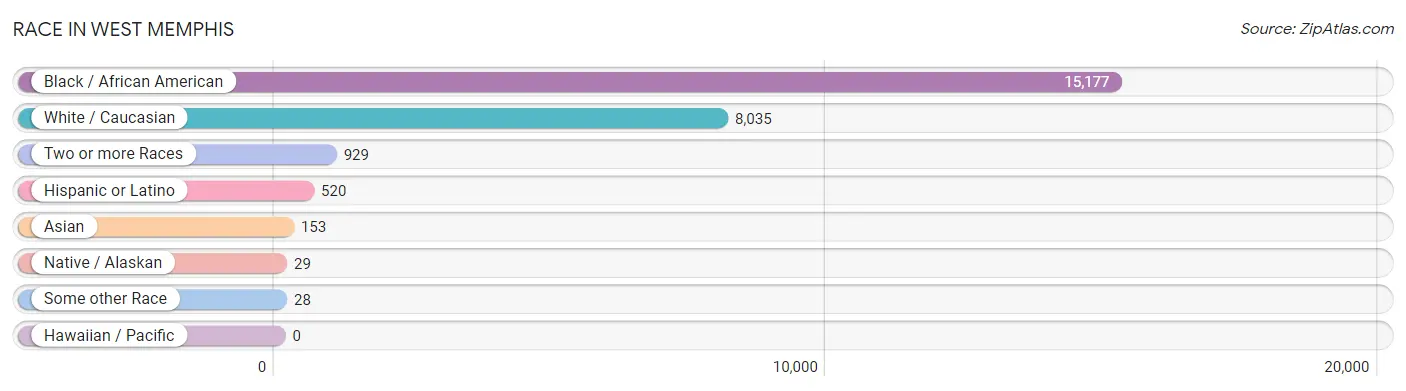
| Race | # Population | % Population |
| Asian | 153 | 0.6% |
| Black / African American | 15,177 | 62.3% |
| Hawaiian / Pacific | 0 | 0.0% |
| Hispanic or Latino | 520 | 2.1% |
| Native / Alaskan | 29 | 0.1% |
| White / Caucasian | 8,035 | 33.0% |
| Two or more Races | 929 | 3.8% |
| Some other Race | 28 | 0.1% |
| Total | 24,351 | 100.0% |
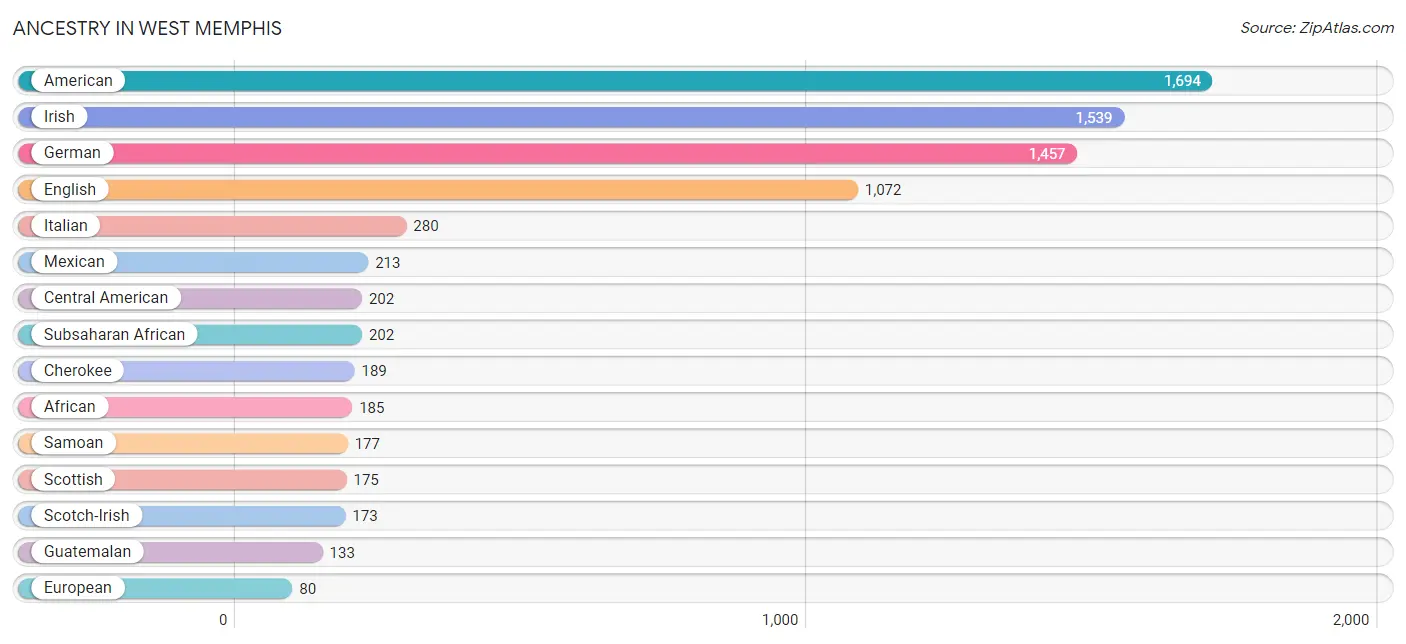
Ancestry in West Memphis
The most populous ancestries reported in West Memphis are American (1,694 | 7.0%), Irish (1,539 | 6.3%), German (1,457 | 6.0%), English (1,072 | 4.4%), and Italian (280 | 1.1%), together accounting for 24.8% of all West Memphis residents.
| Ancestry | # Population | % Population |
| African | 185 | 0.8% |
| American | 1,694 | 7.0% |
| Arab | 12 | 0.1% |
| British | 9 | 0.0% |
| Burmese | 21 | 0.1% |
| Central American | 202 | 0.8% |
| Central American Indian | 11 | 0.1% |
| Cherokee | 189 | 0.8% |
| Choctaw | 17 | 0.1% |
| Costa Rican | 23 | 0.1% |
| Cuban | 66 | 0.3% |
| Dutch | 66 | 0.3% |
| English | 1,072 | 4.4% |
| European | 80 | 0.3% |
| French | 47 | 0.2% |
| German | 1,457 | 6.0% |
| Guatemalan | 133 | 0.5% |
| Haitian | 5 | 0.0% |
| Honduran | 18 | 0.1% |
| Indian (Asian) | 40 | 0.2% |
| Irish | 1,539 | 6.3% |
| Iroquois | 20 | 0.1% |
| Italian | 280 | 1.1% |
| Jordanian | 12 | 0.1% |
| Korean | 19 | 0.1% |
| Mexican | 213 | 0.9% |
| Nigerian | 17 | 0.1% |
| Norwegian | 41 | 0.2% |
| Polish | 55 | 0.2% |
| Russian | 15 | 0.1% |
| Salvadoran | 28 | 0.1% |
| Samoan | 177 | 0.7% |
| Scandinavian | 1 | 0.0% |
| Scotch-Irish | 173 | 0.7% |
| Scottish | 175 | 0.7% |
| Spanish | 36 | 0.2% |
| Sri Lankan | 70 | 0.3% |
| Subsaharan African | 202 | 0.8% |
| Swedish | 12 | 0.1% |
| Swiss | 8 | 0.0% |
| Welsh | 18 | 0.1% |
| West Indian | 23 | 0.1% | View All 42 Rows |
Immigrants in West Memphis
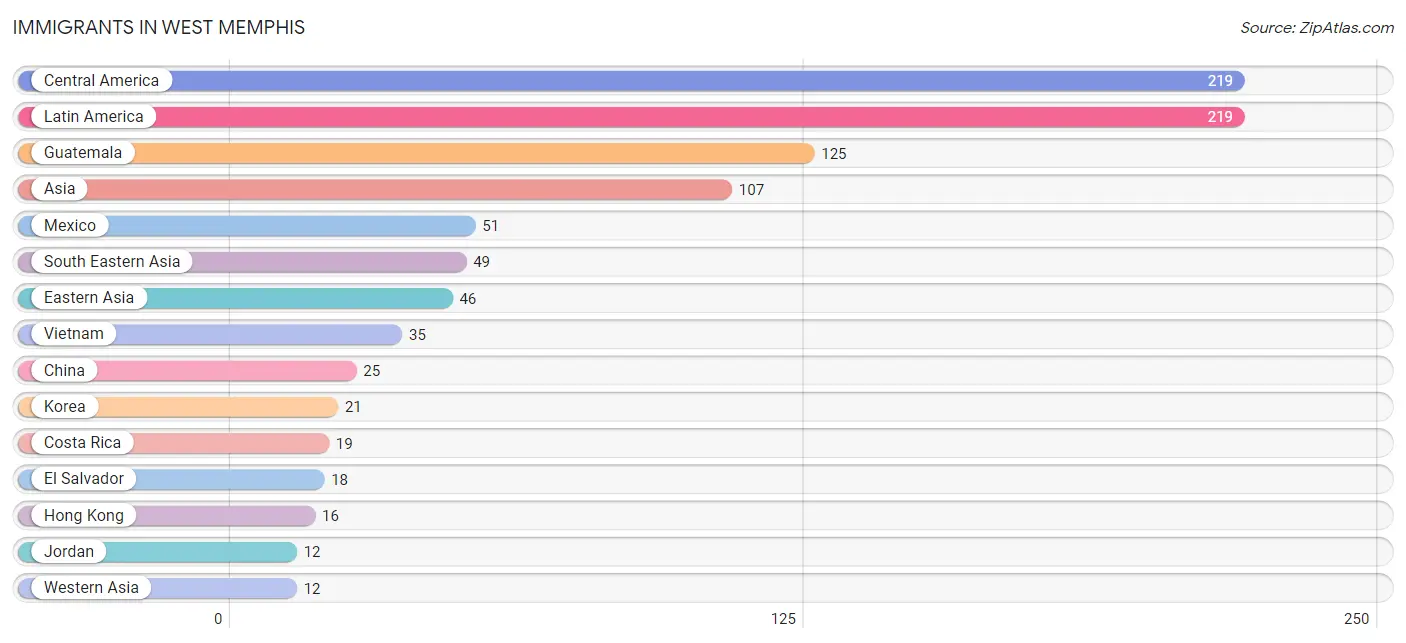
The most numerous immigrant groups reported in West Memphis came from Central America (219 | 0.9%), Latin America (219 | 0.9%), Guatemala (125 | 0.5%), Asia (107 | 0.4%), and Mexico (51 | 0.2%), together accounting for 3.0% of all West Memphis residents.
| Immigration Origin | # Population | % Population |
| Africa | 7 | 0.0% |
| Asia | 107 | 0.4% |
| Central America | 219 | 0.9% |
| China | 25 | 0.1% |
| Costa Rica | 19 | 0.1% |
| Eastern Asia | 46 | 0.2% |
| El Salvador | 18 | 0.1% |
| Guatemala | 125 | 0.5% |
| Honduras | 6 | 0.0% |
| Hong Kong | 16 | 0.1% |
| Indonesia | 9 | 0.0% |
| Jordan | 12 | 0.1% |
| Korea | 21 | 0.1% |
| Latin America | 219 | 0.9% |
| Mexico | 51 | 0.2% |
| Nigeria | 7 | 0.0% |
| Philippines | 5 | 0.0% |
| South Eastern Asia | 49 | 0.2% |
| Vietnam | 35 | 0.1% |
| Western Africa | 7 | 0.0% |
| Western Asia | 12 | 0.1% | View All 21 Rows |
Sex and Age in West Memphis
Sex and Age in West Memphis
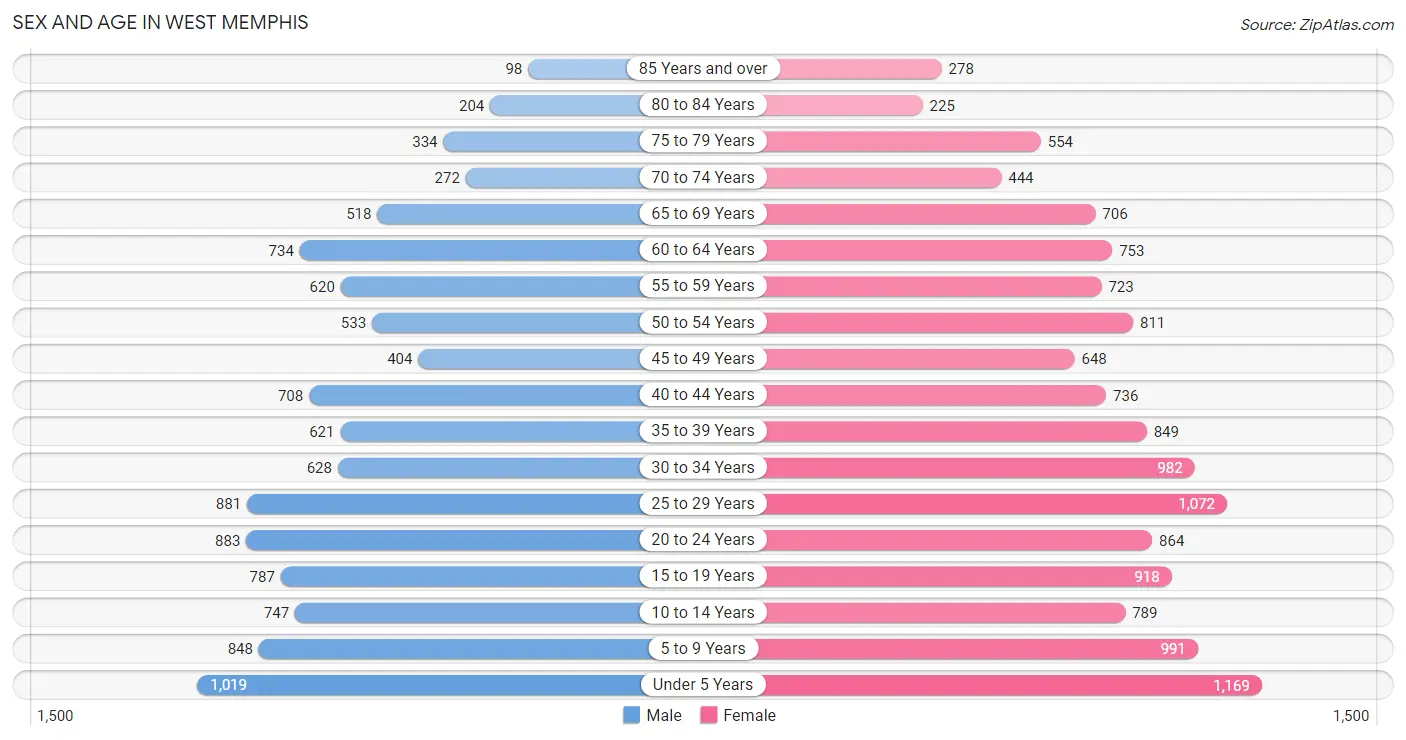
The most populous age groups in West Memphis are Under 5 Years (1,019 | 9.4%) for men and Under 5 Years (1,169 | 8.6%) for women.
| Age Bracket | Male | Female |
| Under 5 Years | 1,019 (9.4%) | 1,169 (8.6%) |
| 5 to 9 Years | 848 (7.8%) | 991 (7.3%) |
| 10 to 14 Years | 747 (6.9%) | 789 (5.8%) |
| 15 to 19 Years | 787 (7.3%) | 918 (6.8%) |
| 20 to 24 Years | 883 (8.2%) | 864 (6.4%) |
| 25 to 29 Years | 881 (8.1%) | 1,072 (7.9%) |
| 30 to 34 Years | 628 (5.8%) | 982 (7.3%) |
| 35 to 39 Years | 621 (5.7%) | 849 (6.3%) |
| 40 to 44 Years | 708 (6.5%) | 736 (5.4%) |
| 45 to 49 Years | 404 (3.7%) | 648 (4.8%) |
| 50 to 54 Years | 533 (4.9%) | 811 (6.0%) |
| 55 to 59 Years | 620 (5.7%) | 723 (5.3%) |
| 60 to 64 Years | 734 (6.8%) | 753 (5.6%) |
| 65 to 69 Years | 518 (4.8%) | 706 (5.2%) |
| 70 to 74 Years | 272 (2.5%) | 444 (3.3%) |
| 75 to 79 Years | 334 (3.1%) | 554 (4.1%) |
| 80 to 84 Years | 204 (1.9%) | 225 (1.7%) |
| 85 Years and over | 98 (0.9%) | 278 (2.1%) |
| Total | 10,839 (100.0%) | 13,512 (100.0%) |
Families and Households in West Memphis
Median Family Size in West Memphis
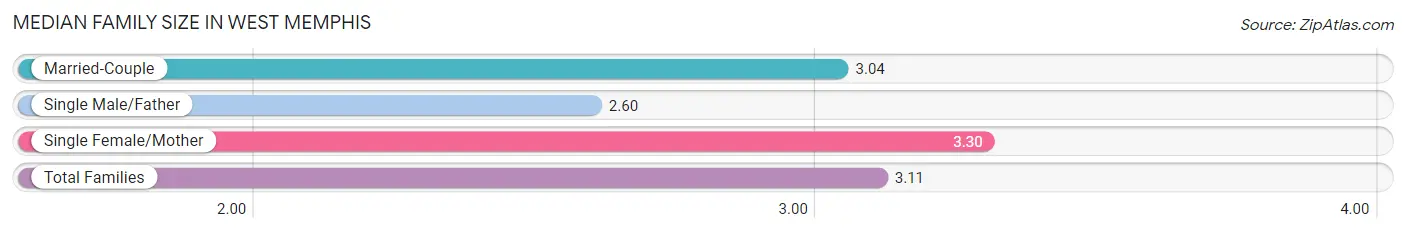
The median family size in West Memphis is 3.11 persons per family, with single female/mother families (2,805 | 47.2%) accounting for the largest median family size of 3.3 persons per family. On the other hand, single male/father families (631 | 10.6%) represent the smallest median family size with 2.60 persons per family.
| Family Type | # Families | Family Size |
| Married-Couple | 2,506 (42.2%) | 3.04 |
| Single Male/Father | 631 (10.6%) | 2.60 |
| Single Female/Mother | 2,805 (47.2%) | 3.30 |
| Total Families | 5,942 (100.0%) | 3.11 |
Median Household Size in West Memphis
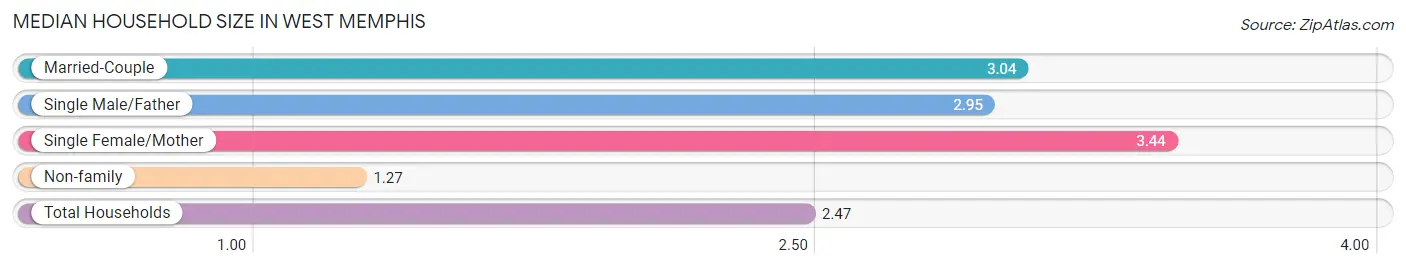
The median household size in West Memphis is 2.47 persons per household, with single female/mother households (2,805 | 29.1%) accounting for the largest median household size of 3.44 persons per household. non-family households (3,712 | 38.5%) represent the smallest median household size with 1.27 persons per household.
| Household Type | # Households | Household Size |
| Married-Couple | 2,506 (26.0%) | 3.04 |
| Single Male/Father | 631 (6.5%) | 2.95 |
| Single Female/Mother | 2,805 (29.1%) | 3.44 |
| Non-family | 3,712 (38.5%) | 1.27 |
| Total Households | 9,654 (100.0%) | 2.47 |
Household Size by Marriage Status in West Memphis
Out of a total of 9,654 households in West Memphis, 5,942 (61.6%) are family households, while 3,712 (38.5%) are nonfamily households. The most numerous type of family households are 2-person households, comprising 2,832, and the most common type of nonfamily households are 1-person households, comprising 3,005.
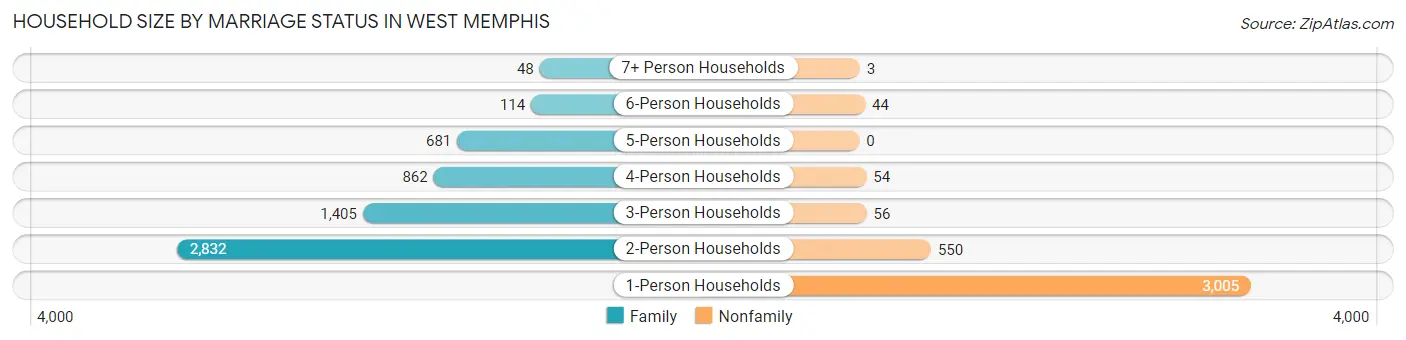
| Household Size | Family Households | Nonfamily Households |
| 1-Person Households | - | 3,005 (31.1%) |
| 2-Person Households | 2,832 (29.3%) | 550 (5.7%) |
| 3-Person Households | 1,405 (14.5%) | 56 (0.6%) |
| 4-Person Households | 862 (8.9%) | 54 (0.6%) |
| 5-Person Households | 681 (7.0%) | 0 (0.0%) |
| 6-Person Households | 114 (1.2%) | 44 (0.5%) |
| 7+ Person Households | 48 (0.5%) | 3 (0.0%) |
| Total | 5,942 (61.6%) | 3,712 (38.5%) |
Female Fertility in West Memphis
Fertility by Age in West Memphis
Average fertility rate in West Memphis is 66.0 births per 1,000 women. Women in the age bracket of 20 to 34 years have the highest fertility rate with 96.0 births per 1,000 women. Women in the age bracket of 20 to 34 years acount for 68.6% of all women with births.
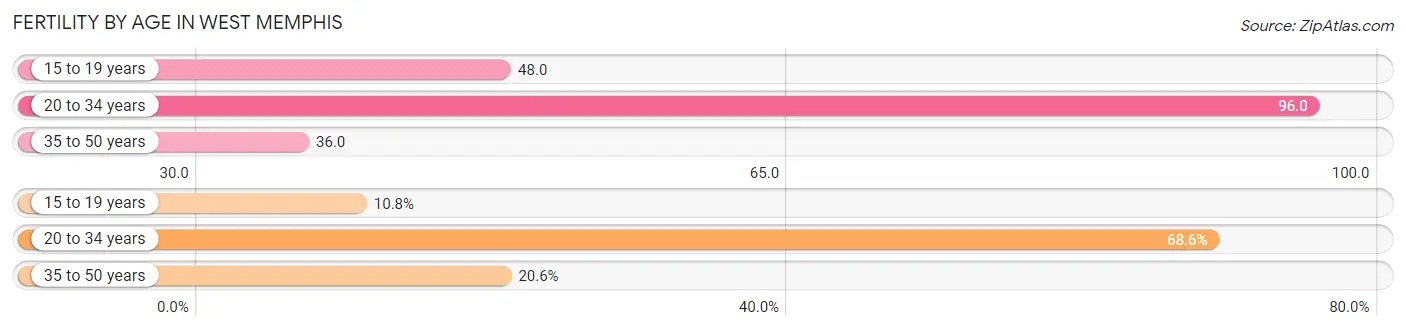
| Age Bracket | Women with Births | Births / 1,000 Women |
| 15 to 19 years | 44 (10.8%) | 48.0 |
| 20 to 34 years | 280 (68.6%) | 96.0 |
| 35 to 50 years | 84 (20.6%) | 36.0 |
| Total | 408 (100.0%) | 66.0 |
Fertility by Age by Marriage Status in West Memphis
9.3% of women with births (408) in West Memphis are married. The highest percentage of unmarried women with births falls into 15 to 19 years age bracket with 100.0% of them unmarried at the time of birth, while the lowest percentage of unmarried women with births belong to 20 to 34 years age bracket with 87.9% of them unmarried.
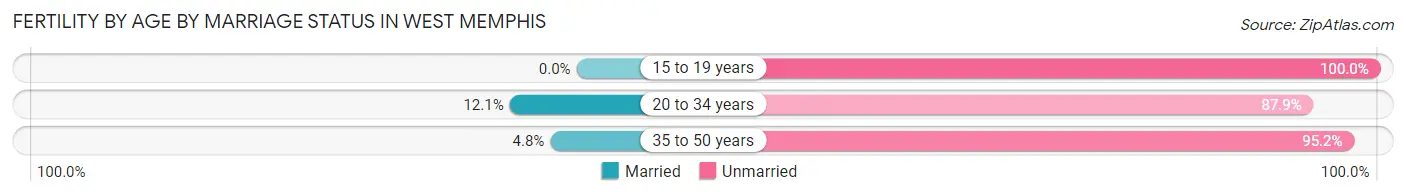
| Age Bracket | Married | Unmarried |
| 15 to 19 years | 0 (0.0%) | 44 (100.0%) |
| 20 to 34 years | 34 (12.1%) | 246 (87.9%) |
| 35 to 50 years | 4 (4.8%) | 80 (95.2%) |
| Total | 38 (9.3%) | 370 (90.7%) |
Fertility by Education in West Memphis
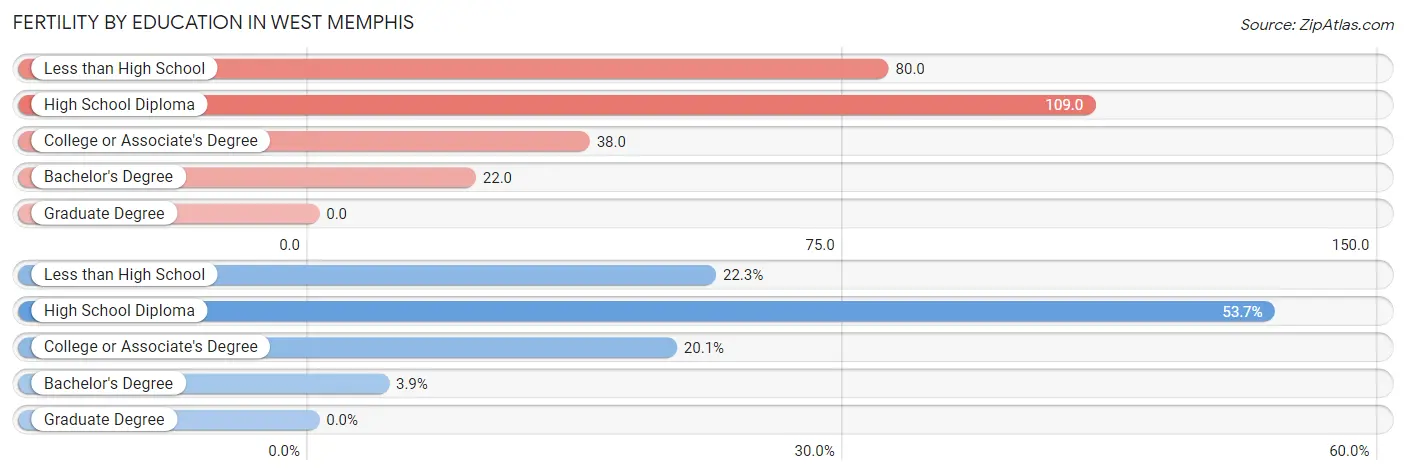
| Educational Attainment | Women with Births | Births / 1,000 Women |
| Less than High School | 91 (22.3%) | 80.0 |
| High School Diploma | 219 (53.7%) | 109.0 |
| College or Associate's Degree | 82 (20.1%) | 38.0 |
| Bachelor's Degree | 16 (3.9%) | 22.0 |
| Graduate Degree | 0 (0.0%) | 0.0 |
| Total | 408 (100.0%) | 66.0 |
Fertility by Education by Marriage Status in West Memphis
90.7% of women with births in West Memphis are unmarried. Women with the educational attainment of college or associate's degree are most likely to be married with 36.6% of them married at childbirth, while women with the educational attainment of less than high school are least likely to be married with 100.0% of them unmarried at childbirth.
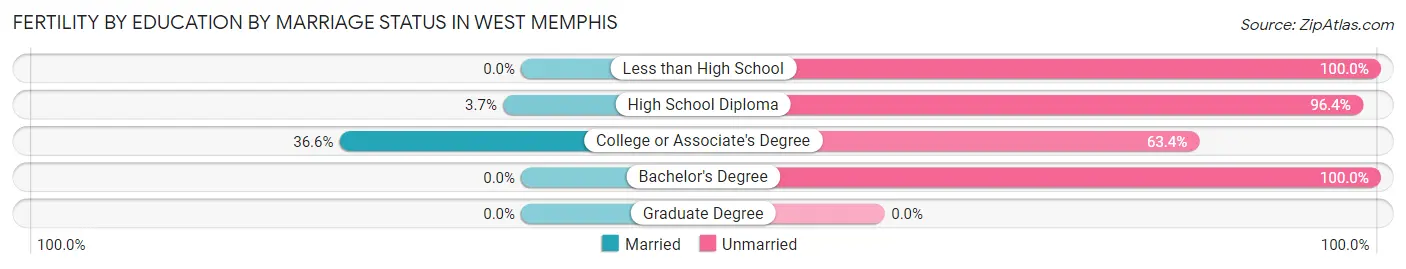
| Educational Attainment | Married | Unmarried |
| Less than High School | 0 (0.0%) | 91 (100.0%) |
| High School Diploma | 8 (3.6%) | 211 (96.4%) |
| College or Associate's Degree | 30 (36.6%) | 52 (63.4%) |
| Bachelor's Degree | 0 (0.0%) | 16 (100.0%) |
| Graduate Degree | 0 (0.0%) | 0 (0.0%) |
| Total | 38 (9.3%) | 370 (90.7%) |
Employment Characteristics in West Memphis
Employment by Class of Employer in West Memphis
Among the 9,240 employed individuals in West Memphis, private company employees (7,152 | 77.4%), local government employees (578 | 6.3%), and state government employees (474 | 5.1%) make up the most common classes of employment.
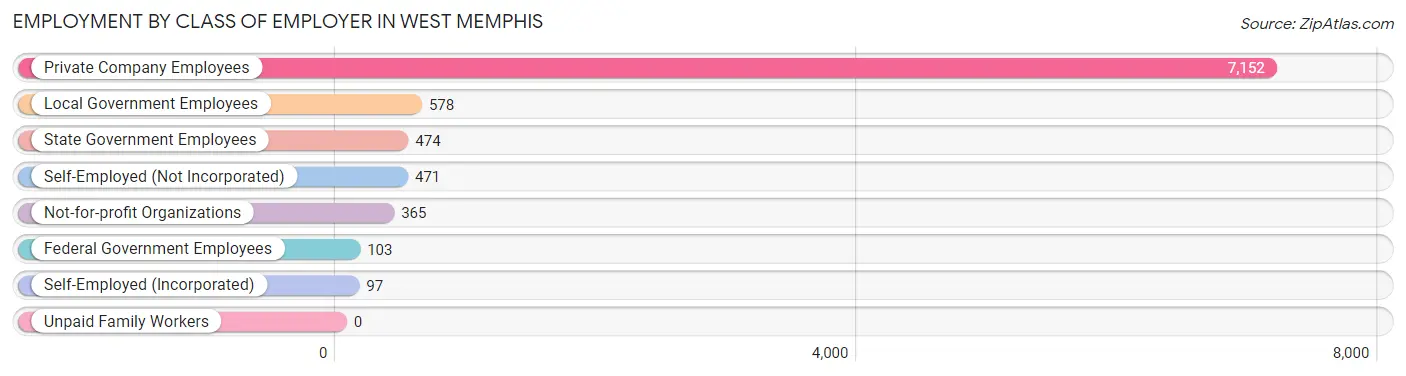
| Employer Class | # Employees | % Employees |
| Private Company Employees | 7,152 | 77.4% |
| Self-Employed (Incorporated) | 97 | 1.1% |
| Self-Employed (Not Incorporated) | 471 | 5.1% |
| Not-for-profit Organizations | 365 | 4.0% |
| Local Government Employees | 578 | 6.3% |
| State Government Employees | 474 | 5.1% |
| Federal Government Employees | 103 | 1.1% |
| Unpaid Family Workers | 0 | 0.0% |
| Total | 9,240 | 100.0% |
Employment Status by Age in West Memphis
According to the labor force statistics for West Memphis, out of the total population over 16 years of age (18,489), 59.8% or 11,056 individuals are in the labor force, with 13.3% or 1,470 of them unemployed. The age group with the highest labor force participation rate is 30 to 34 years, with 84.3% or 1,357 individuals in the labor force. Within the labor force, the 16 to 19 years age range has the highest percentage of unemployed individuals, with 41.1% or 254 of them being unemployed.
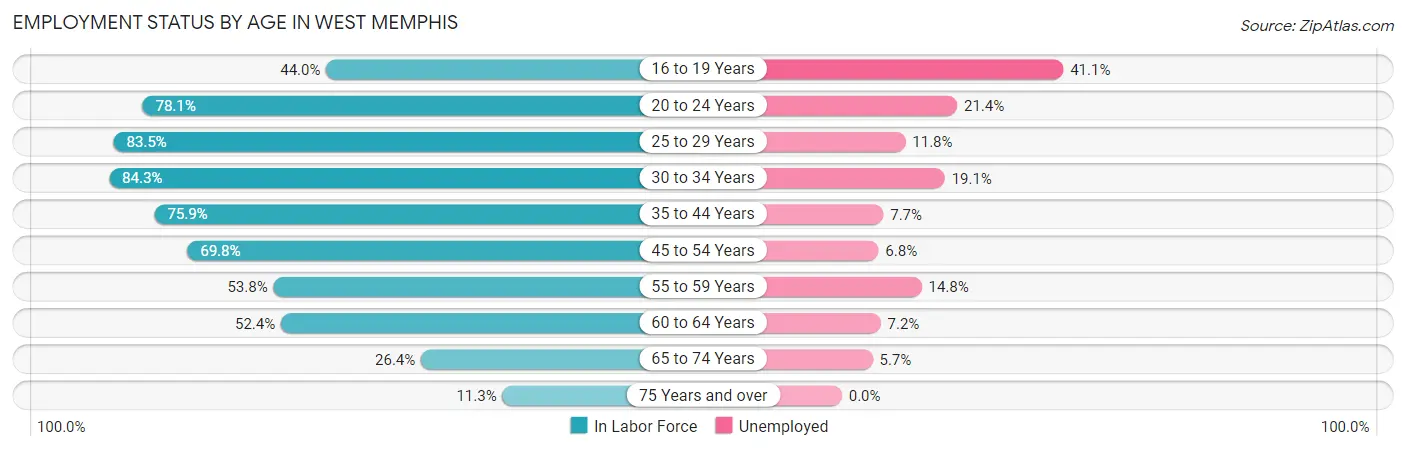
| Age Bracket | In Labor Force | Unemployed |
| 16 to 19 Years | 619 (44.0%) | 254 (41.1%) |
| 20 to 24 Years | 1,364 (78.1%) | 292 (21.4%) |
| 25 to 29 Years | 1,631 (83.5%) | 192 (11.8%) |
| 30 to 34 Years | 1,357 (84.3%) | 259 (19.1%) |
| 35 to 44 Years | 2,212 (75.9%) | 170 (7.7%) |
| 45 to 54 Years | 1,672 (69.8%) | 114 (6.8%) |
| 55 to 59 Years | 723 (53.8%) | 107 (14.8%) |
| 60 to 64 Years | 779 (52.4%) | 56 (7.2%) |
| 65 to 74 Years | 512 (26.4%) | 29 (5.7%) |
| 75 Years and over | 191 (11.3%) | 0 (0.0%) |
| Total | 11,056 (59.8%) | 1,470 (13.3%) |
Employment Status by Educational Attainment in West Memphis
According to labor force statistics for West Memphis, 71.6% of individuals (8,379) out of the total population between 25 and 64 years of age (11,703) are in the labor force, with 10.7% or 897 of them being unemployed. The group with the highest labor force participation rate are those with the educational attainment of bachelor's degree or higher, with 83.5% or 1,462 individuals in the labor force. Within the labor force, individuals with less than high school education have the highest percentage of unemployment, with 27.7% or 234 of them being unemployed.
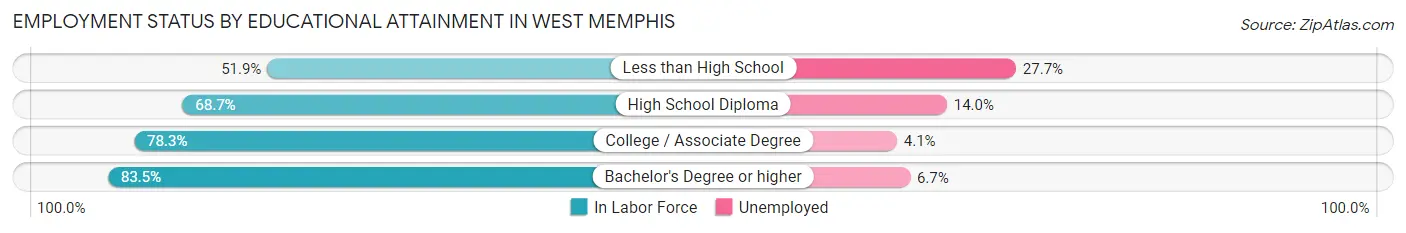
| Educational Attainment | In Labor Force | Unemployed |
| Less than High School | 845 (51.9%) | 451 (27.7%) |
| High School Diploma | 3,223 (68.7%) | 657 (14.0%) |
| College / Associate Degree | 2,844 (78.3%) | 149 (4.1%) |
| Bachelor's Degree or higher | 1,462 (83.5%) | 117 (6.7%) |
| Total | 8,379 (71.6%) | 1,252 (10.7%) |
Employment Occupations by Sex in West Memphis
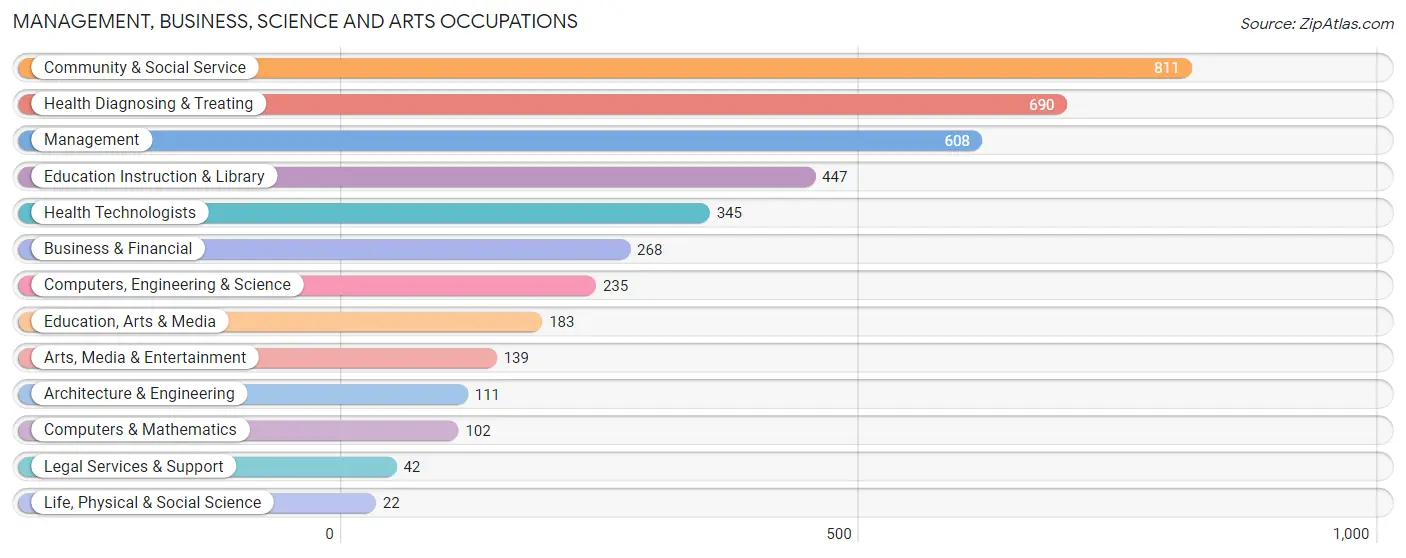
Management, Business, Science and Arts Occupations
The most common Management, Business, Science and Arts occupations in West Memphis are Community & Social Service (811 | 8.5%), Health Diagnosing & Treating (690 | 7.2%), Management (608 | 6.3%), Education Instruction & Library (447 | 4.7%), and Health Technologists (345 | 3.6%).
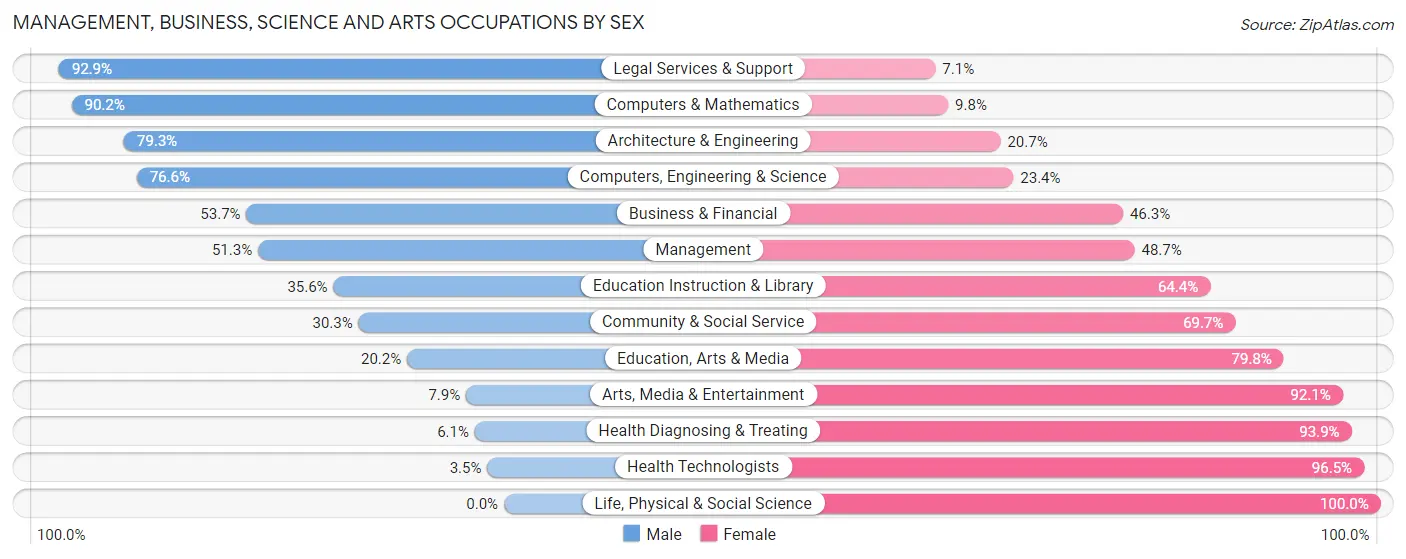
Management, Business, Science and Arts Occupations by Sex
Within the Management, Business, Science and Arts occupations in West Memphis, the most male-oriented occupations are Legal Services & Support (92.9%), Computers & Mathematics (90.2%), and Architecture & Engineering (79.3%), while the most female-oriented occupations are Life, Physical & Social Science (100.0%), Health Technologists (96.5%), and Health Diagnosing & Treating (93.9%).
| Occupation | Male | Female |
| Management | 312 (51.3%) | 296 (48.7%) |
| Business & Financial | 144 (53.7%) | 124 (46.3%) |
| Computers, Engineering & Science | 180 (76.6%) | 55 (23.4%) |
| Computers & Mathematics | 92 (90.2%) | 10 (9.8%) |
| Architecture & Engineering | 88 (79.3%) | 23 (20.7%) |
| Life, Physical & Social Science | 0 (0.0%) | 22 (100.0%) |
| Community & Social Service | 246 (30.3%) | 565 (69.7%) |
| Education, Arts & Media | 37 (20.2%) | 146 (79.8%) |
| Legal Services & Support | 39 (92.9%) | 3 (7.1%) |
| Education Instruction & Library | 159 (35.6%) | 288 (64.4%) |
| Arts, Media & Entertainment | 11 (7.9%) | 128 (92.1%) |
| Health Diagnosing & Treating | 42 (6.1%) | 648 (93.9%) |
| Health Technologists | 12 (3.5%) | 333 (96.5%) |
| Total (Category) | 924 (35.4%) | 1,688 (64.6%) |
| Total (Overall) | 4,266 (44.5%) | 5,321 (55.5%) |
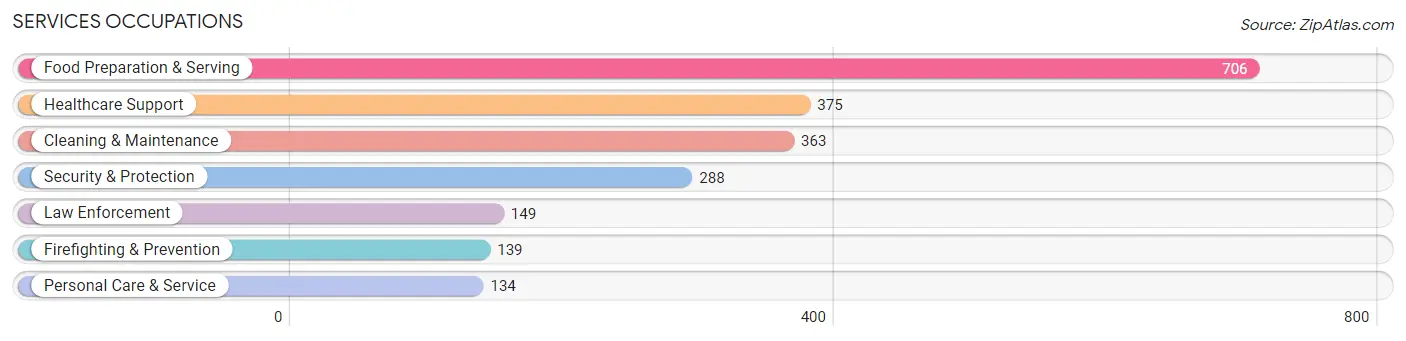
Services Occupations
The most common Services occupations in West Memphis are Food Preparation & Serving (706 | 7.4%), Healthcare Support (375 | 3.9%), Cleaning & Maintenance (363 | 3.8%), Security & Protection (288 | 3.0%), and Law Enforcement (149 | 1.5%).
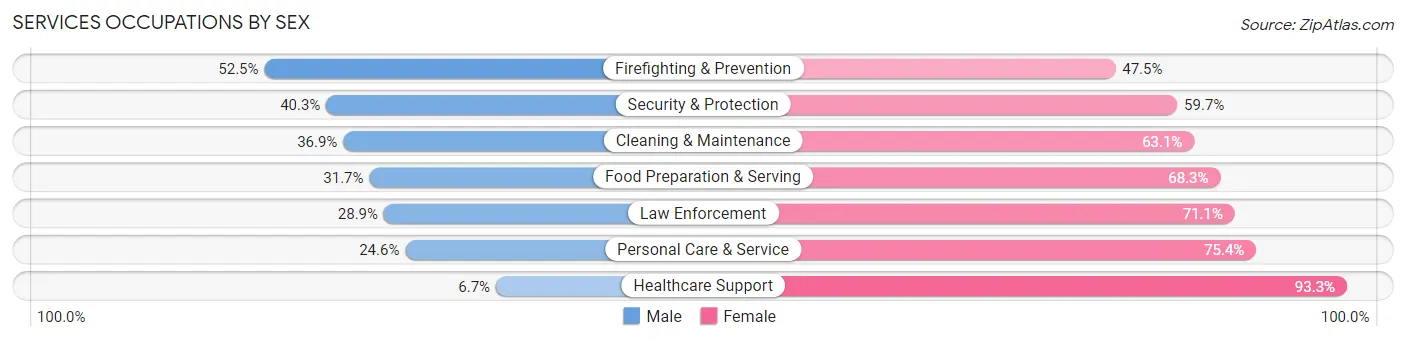
Services Occupations by Sex
Within the Services occupations in West Memphis, the most male-oriented occupations are Firefighting & Prevention (52.5%), Security & Protection (40.3%), and Cleaning & Maintenance (36.9%), while the most female-oriented occupations are Healthcare Support (93.3%), Personal Care & Service (75.4%), and Law Enforcement (71.1%).
| Occupation | Male | Female |
| Healthcare Support | 25 (6.7%) | 350 (93.3%) |
| Security & Protection | 116 (40.3%) | 172 (59.7%) |
| Firefighting & Prevention | 73 (52.5%) | 66 (47.5%) |
| Law Enforcement | 43 (28.9%) | 106 (71.1%) |
| Food Preparation & Serving | 224 (31.7%) | 482 (68.3%) |
| Cleaning & Maintenance | 134 (36.9%) | 229 (63.1%) |
| Personal Care & Service | 33 (24.6%) | 101 (75.4%) |
| Total (Category) | 532 (28.5%) | 1,334 (71.5%) |
| Total (Overall) | 4,266 (44.5%) | 5,321 (55.5%) |
Sales and Office Occupations
The most common Sales and Office occupations in West Memphis are Sales & Related (1,002 | 10.4%), and Office & Administration (794 | 8.3%).
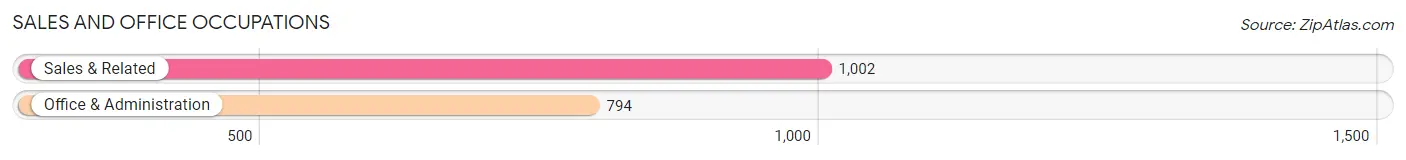
Sales and Office Occupations by Sex
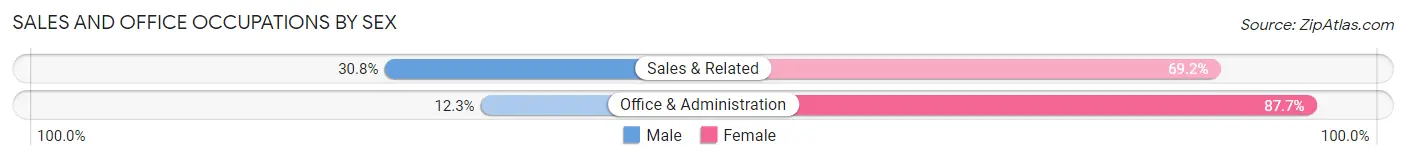
| Occupation | Male | Female |
| Sales & Related | 309 (30.8%) | 693 (69.2%) |
| Office & Administration | 98 (12.3%) | 696 (87.7%) |
| Total (Category) | 407 (22.7%) | 1,389 (77.3%) |
| Total (Overall) | 4,266 (44.5%) | 5,321 (55.5%) |
Natural Resources, Construction and Maintenance Occupations
The most common Natural Resources, Construction and Maintenance occupations in West Memphis are Installation, Maintenance & Repair (583 | 6.1%), Construction & Extraction (353 | 3.7%), and Farming, Fishing & Forestry (38 | 0.4%).
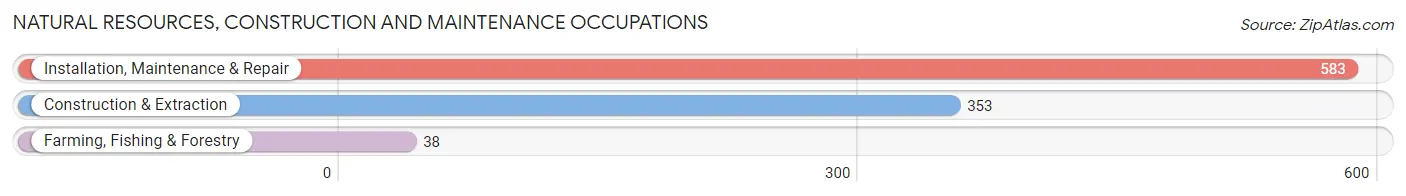
Natural Resources, Construction and Maintenance Occupations by Sex
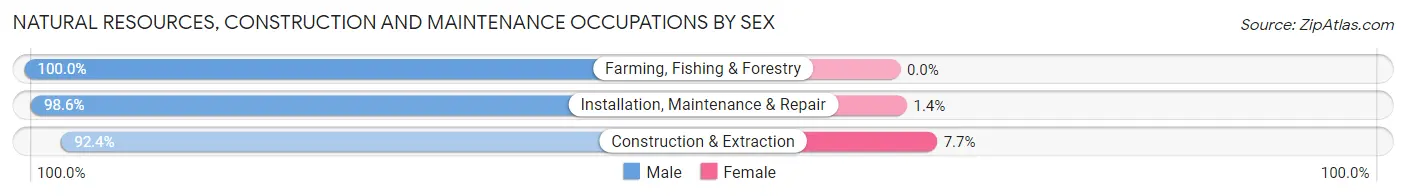
| Occupation | Male | Female |
| Farming, Fishing & Forestry | 38 (100.0%) | 0 (0.0%) |
| Construction & Extraction | 326 (92.3%) | 27 (7.6%) |
| Installation, Maintenance & Repair | 575 (98.6%) | 8 (1.4%) |
| Total (Category) | 939 (96.4%) | 35 (3.6%) |
| Total (Overall) | 4,266 (44.5%) | 5,321 (55.5%) |
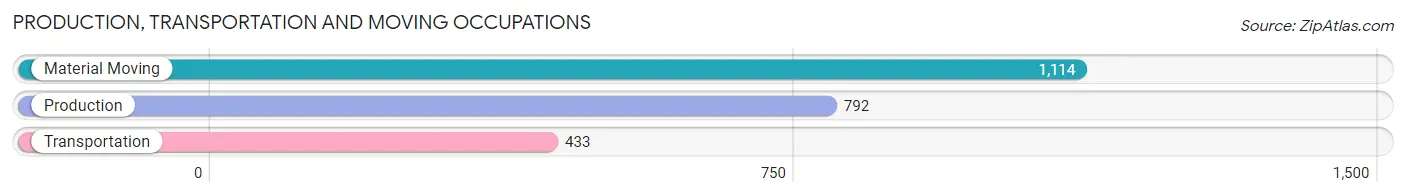
Production, Transportation and Moving Occupations
The most common Production, Transportation and Moving occupations in West Memphis are Material Moving (1,114 | 11.6%), Production (792 | 8.3%), and Transportation (433 | 4.5%).
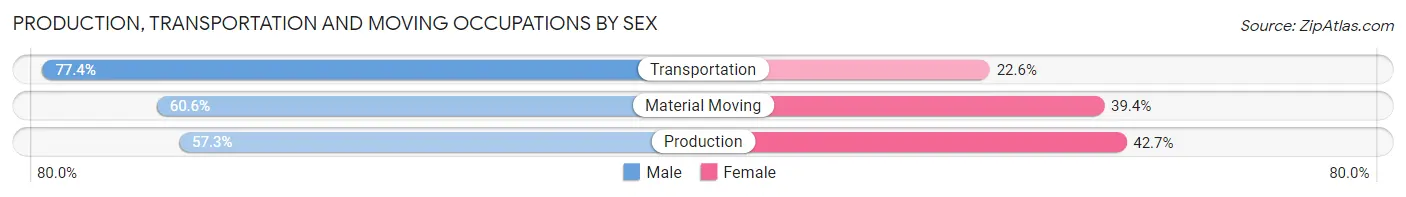
Production, Transportation and Moving Occupations by Sex
| Occupation | Male | Female |
| Production | 454 (57.3%) | 338 (42.7%) |
| Transportation | 335 (77.4%) | 98 (22.6%) |
| Material Moving | 675 (60.6%) | 439 (39.4%) |
| Total (Category) | 1,464 (62.6%) | 875 (37.4%) |
| Total (Overall) | 4,266 (44.5%) | 5,321 (55.5%) |
Employment Industries by Sex in West Memphis
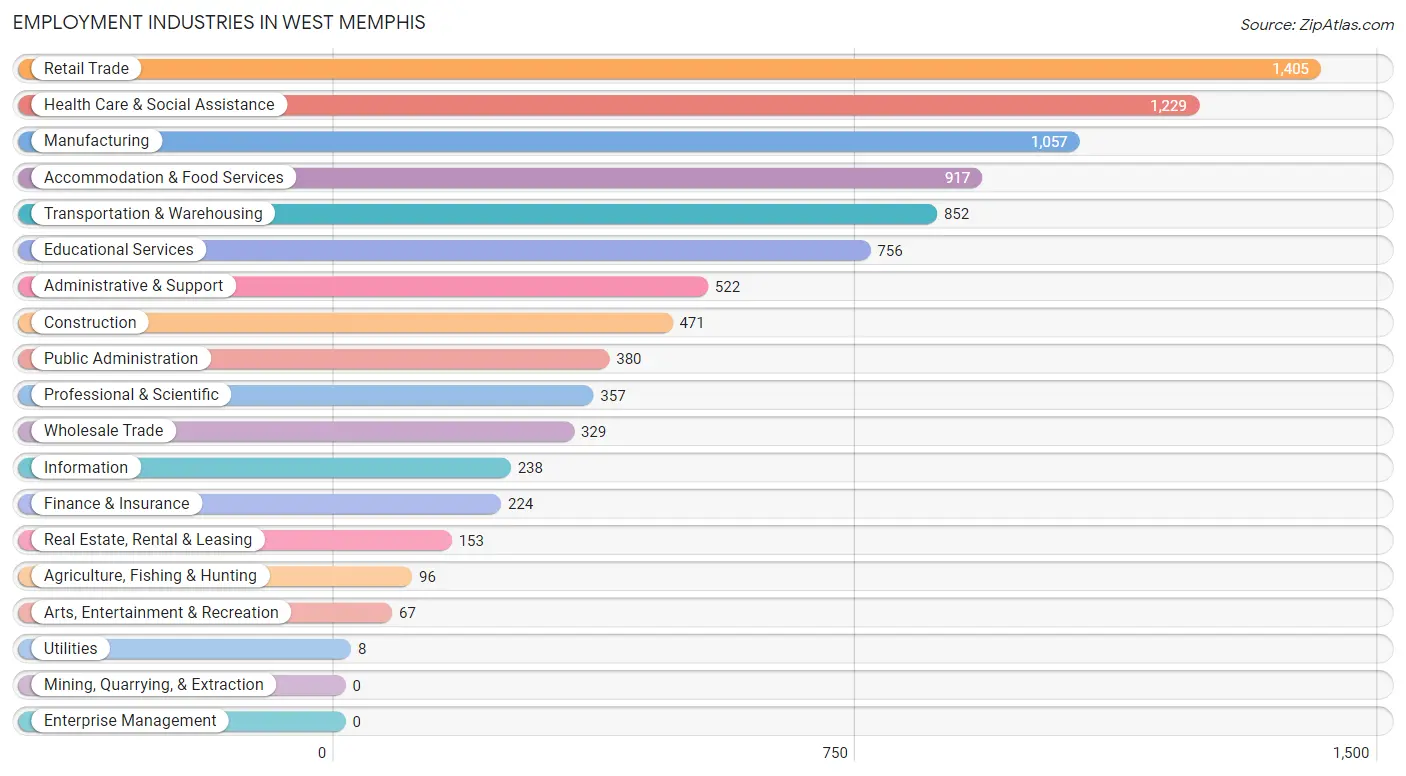
Employment Industries in West Memphis
The major employment industries in West Memphis include Retail Trade (1,405 | 14.7%), Health Care & Social Assistance (1,229 | 12.8%), Manufacturing (1,057 | 11.0%), Accommodation & Food Services (917 | 9.6%), and Transportation & Warehousing (852 | 8.9%).
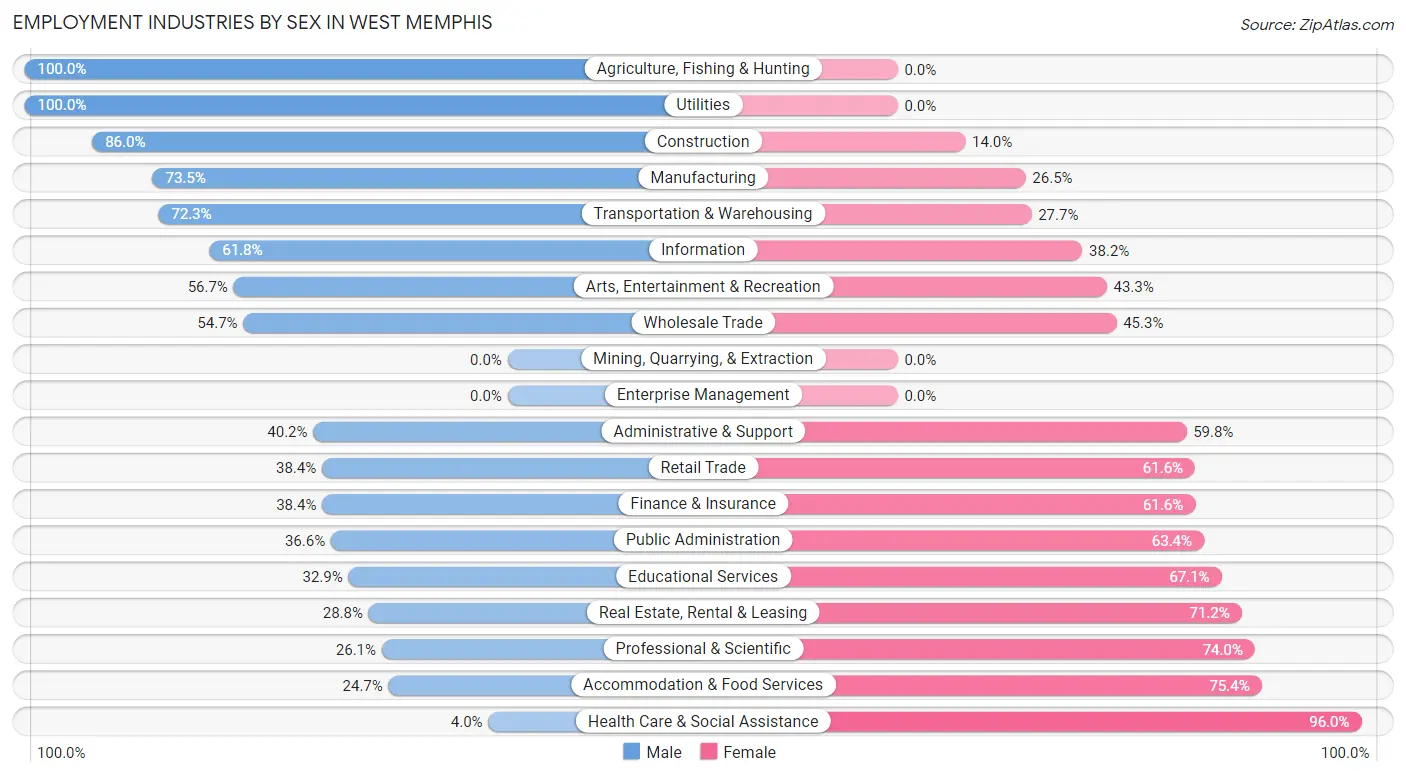
Employment Industries by Sex in West Memphis
The West Memphis industries that see more men than women are Agriculture, Fishing & Hunting (100.0%), Utilities (100.0%), and Construction (86.0%), whereas the industries that tend to have a higher number of women are Health Care & Social Assistance (96.0%), Accommodation & Food Services (75.3%), and Professional & Scientific (74.0%).
| Industry | Male | Female |
| Agriculture, Fishing & Hunting | 96 (100.0%) | 0 (0.0%) |
| Mining, Quarrying, & Extraction | 0 (0.0%) | 0 (0.0%) |
| Construction | 405 (86.0%) | 66 (14.0%) |
| Manufacturing | 777 (73.5%) | 280 (26.5%) |
| Wholesale Trade | 180 (54.7%) | 149 (45.3%) |
| Retail Trade | 540 (38.4%) | 865 (61.6%) |
| Transportation & Warehousing | 616 (72.3%) | 236 (27.7%) |
| Utilities | 8 (100.0%) | 0 (0.0%) |
| Information | 147 (61.8%) | 91 (38.2%) |
| Finance & Insurance | 86 (38.4%) | 138 (61.6%) |
| Real Estate, Rental & Leasing | 44 (28.8%) | 109 (71.2%) |
| Professional & Scientific | 93 (26.1%) | 264 (74.0%) |
| Enterprise Management | 0 (0.0%) | 0 (0.0%) |
| Administrative & Support | 210 (40.2%) | 312 (59.8%) |
| Educational Services | 249 (32.9%) | 507 (67.1%) |
| Health Care & Social Assistance | 49 (4.0%) | 1,180 (96.0%) |
| Arts, Entertainment & Recreation | 38 (56.7%) | 29 (43.3%) |
| Accommodation & Food Services | 226 (24.6%) | 691 (75.3%) |
| Public Administration | 139 (36.6%) | 241 (63.4%) |
| Total | 4,266 (44.5%) | 5,321 (55.5%) |
Education in West Memphis
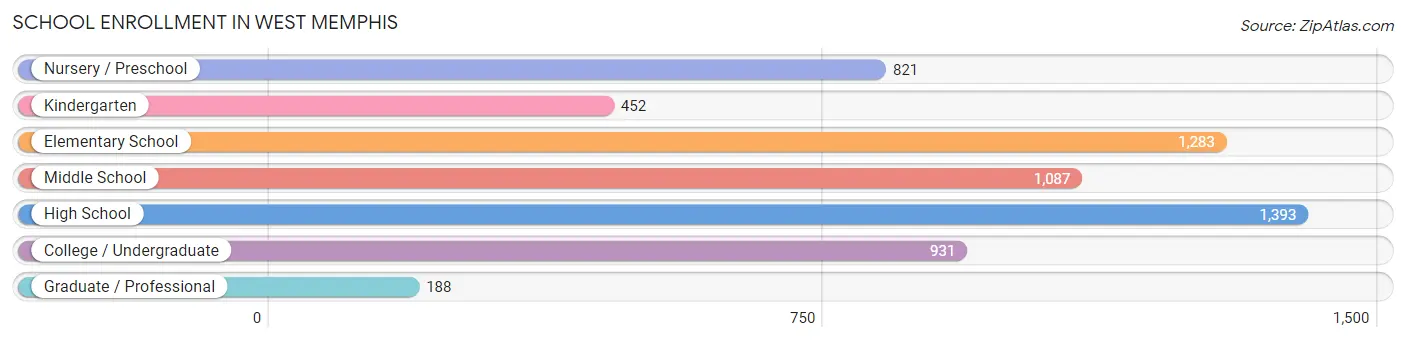
School Enrollment in West Memphis
The most common levels of schooling among the 6,155 students in West Memphis are high school (1,393 | 22.6%), elementary school (1,283 | 20.8%), and middle school (1,087 | 17.7%).
| School Level | # Students | % Students |
| Nursery / Preschool | 821 | 13.3% |
| Kindergarten | 452 | 7.3% |
| Elementary School | 1,283 | 20.8% |
| Middle School | 1,087 | 17.7% |
| High School | 1,393 | 22.6% |
| College / Undergraduate | 931 | 15.1% |
| Graduate / Professional | 188 | 3.0% |
| Total | 6,155 | 100.0% |
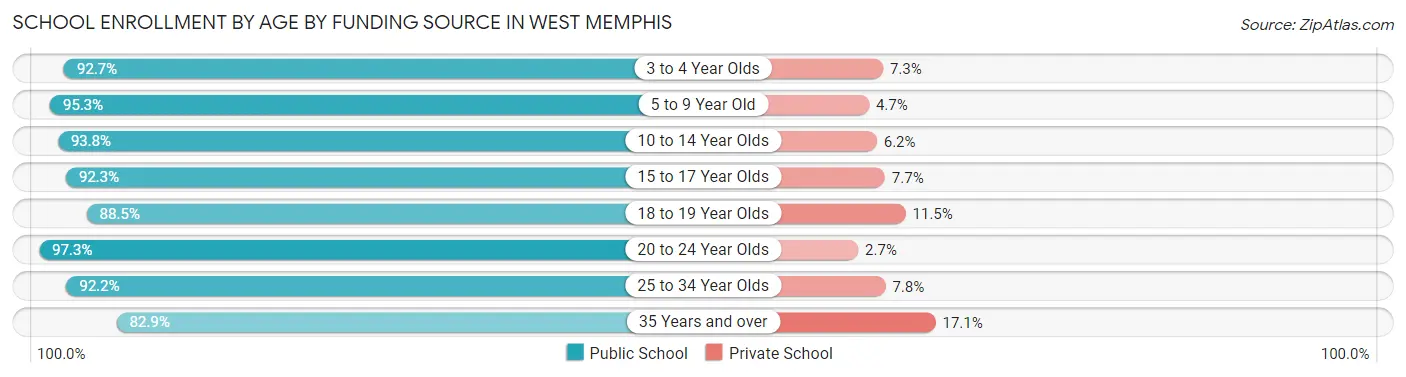
School Enrollment by Age by Funding Source in West Memphis
Out of a total of 6,155 students who are enrolled in schools in West Memphis, 419 (6.8%) attend a private institution, while the remaining 5,736 (93.2%) are enrolled in public schools. The age group of 35 years and over has the highest likelihood of being enrolled in private schools, with 57 (17.1% in the age bracket) enrolled. Conversely, the age group of 20 to 24 year olds has the lowest likelihood of being enrolled in a private school, with 396 (97.3% in the age bracket) attending a public institution.
| Age Bracket | Public School | Private School |
| 3 to 4 Year Olds | 557 (92.7%) | 44 (7.3%) |
| 5 to 9 Year Old | 1,659 (95.3%) | 82 (4.7%) |
| 10 to 14 Year Olds | 1,398 (93.8%) | 92 (6.2%) |
| 15 to 17 Year Olds | 865 (92.3%) | 72 (7.7%) |
| 18 to 19 Year Olds | 253 (88.5%) | 33 (11.5%) |
| 20 to 24 Year Olds | 396 (97.3%) | 11 (2.7%) |
| 25 to 34 Year Olds | 332 (92.2%) | 28 (7.8%) |
| 35 Years and over | 276 (82.9%) | 57 (17.1%) |
| Total | 5,736 (93.2%) | 419 (6.8%) |
Educational Attainment by Field of Study in West Memphis
Education (553 | 23.2%), business (488 | 20.5%), science & technology (408 | 17.1%), bio, nature & agricultural (189 | 7.9%), and social sciences (161 | 6.8%) are the most common fields of study among 2,382 individuals in West Memphis who have obtained a bachelor's degree or higher.
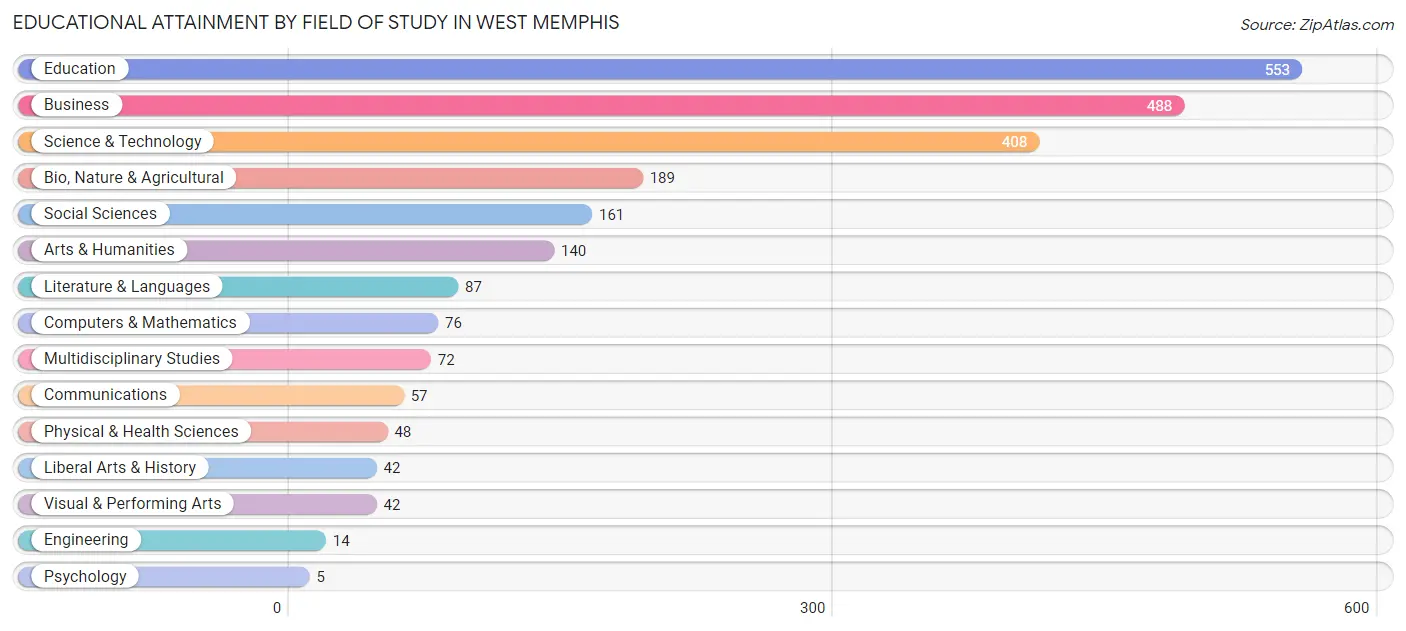
| Field of Study | # Graduates | % Graduates |
| Computers & Mathematics | 76 | 3.2% |
| Bio, Nature & Agricultural | 189 | 7.9% |
| Physical & Health Sciences | 48 | 2.0% |
| Psychology | 5 | 0.2% |
| Social Sciences | 161 | 6.8% |
| Engineering | 14 | 0.6% |
| Multidisciplinary Studies | 72 | 3.0% |
| Science & Technology | 408 | 17.1% |
| Business | 488 | 20.5% |
| Education | 553 | 23.2% |
| Literature & Languages | 87 | 3.6% |
| Liberal Arts & History | 42 | 1.8% |
| Visual & Performing Arts | 42 | 1.8% |
| Communications | 57 | 2.4% |
| Arts & Humanities | 140 | 5.9% |
| Total | 2,382 | 100.0% |
Transportation & Commute in West Memphis
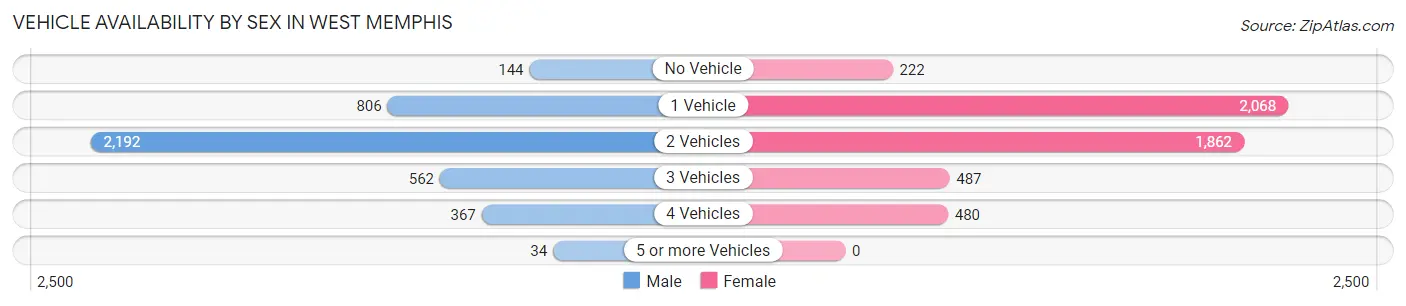
Vehicle Availability by Sex in West Memphis
The most prevalent vehicle ownership categories in West Memphis are males with 2 vehicles (2,192, accounting for 53.4%) and females with 2 vehicles (1,862, making up 42.8%).
| Vehicles Available | Male | Female |
| No Vehicle | 144 (3.5%) | 222 (4.3%) |
| 1 Vehicle | 806 (19.6%) | 2,068 (40.4%) |
| 2 Vehicles | 2,192 (53.4%) | 1,862 (36.4%) |
| 3 Vehicles | 562 (13.7%) | 487 (9.5%) |
| 4 Vehicles | 367 (8.9%) | 480 (9.4%) |
| 5 or more Vehicles | 34 (0.8%) | 0 (0.0%) |
| Total | 4,105 (100.0%) | 5,119 (100.0%) |
Commute Time in West Memphis
The most frequently occuring commute durations in West Memphis are 5 to 9 minutes (2,489 commuters, 28.4%), 10 to 14 minutes (1,371 commuters, 15.6%), and 20 to 24 minutes (947 commuters, 10.8%).
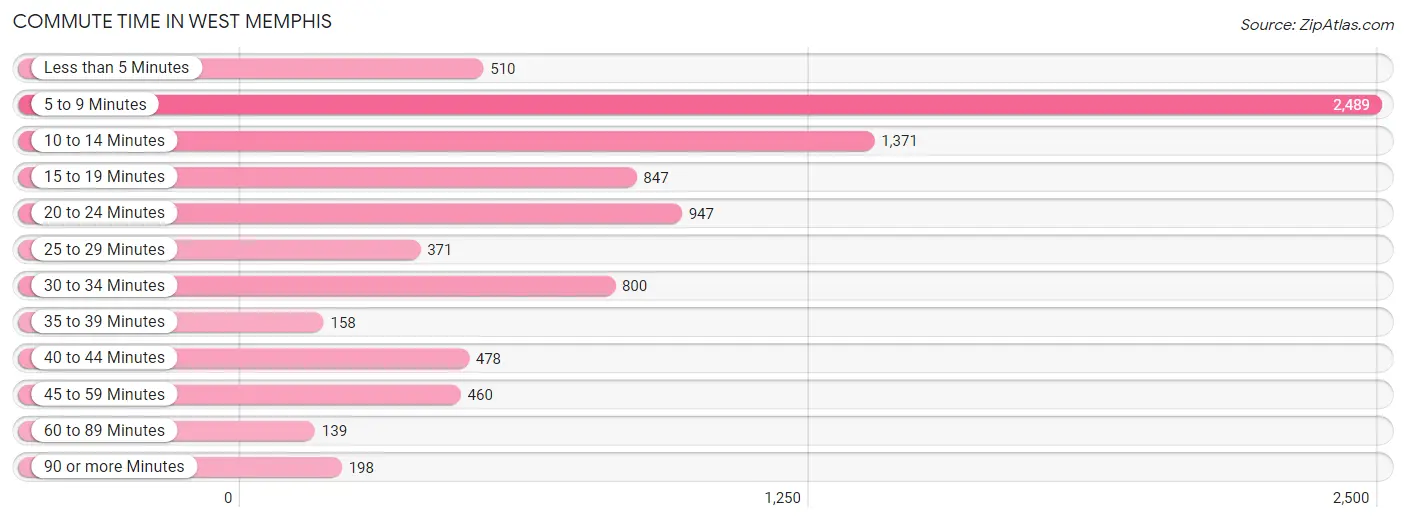
| Commute Time | # Commuters | % Commuters |
| Less than 5 Minutes | 510 | 5.8% |
| 5 to 9 Minutes | 2,489 | 28.4% |
| 10 to 14 Minutes | 1,371 | 15.6% |
| 15 to 19 Minutes | 847 | 9.7% |
| 20 to 24 Minutes | 947 | 10.8% |
| 25 to 29 Minutes | 371 | 4.2% |
| 30 to 34 Minutes | 800 | 9.1% |
| 35 to 39 Minutes | 158 | 1.8% |
| 40 to 44 Minutes | 478 | 5.4% |
| 45 to 59 Minutes | 460 | 5.2% |
| 60 to 89 Minutes | 139 | 1.6% |
| 90 or more Minutes | 198 | 2.3% |
Commute Time by Sex in West Memphis
The most common commute times in West Memphis are 5 to 9 minutes (1,055 commuters, 26.7%) for males and 5 to 9 minutes (1,434 commuters, 29.8%) for females.
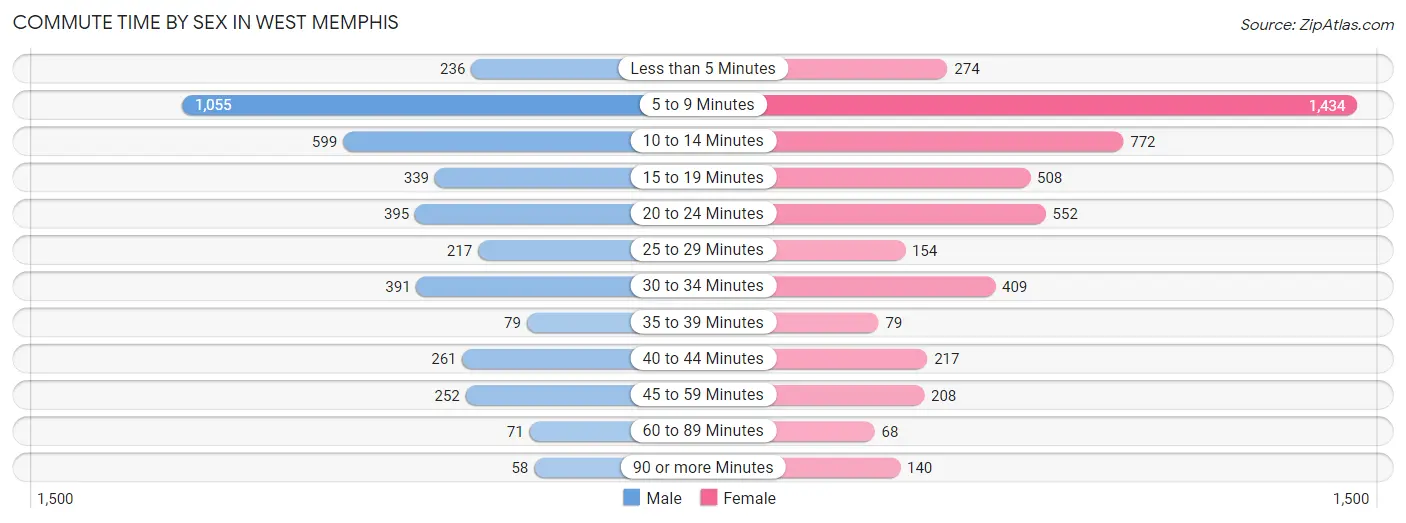
| Commute Time | Male | Female |
| Less than 5 Minutes | 236 (6.0%) | 274 (5.7%) |
| 5 to 9 Minutes | 1,055 (26.7%) | 1,434 (29.8%) |
| 10 to 14 Minutes | 599 (15.1%) | 772 (16.0%) |
| 15 to 19 Minutes | 339 (8.6%) | 508 (10.5%) |
| 20 to 24 Minutes | 395 (10.0%) | 552 (11.5%) |
| 25 to 29 Minutes | 217 (5.5%) | 154 (3.2%) |
| 30 to 34 Minutes | 391 (9.9%) | 409 (8.5%) |
| 35 to 39 Minutes | 79 (2.0%) | 79 (1.6%) |
| 40 to 44 Minutes | 261 (6.6%) | 217 (4.5%) |
| 45 to 59 Minutes | 252 (6.4%) | 208 (4.3%) |
| 60 to 89 Minutes | 71 (1.8%) | 68 (1.4%) |
| 90 or more Minutes | 58 (1.5%) | 140 (2.9%) |
Time of Departure to Work by Sex in West Memphis
The most frequent times of departure to work in West Memphis are 4:00 PM to 11:59 PM (554, 14.0%) for males and 7:30 AM to 7:59 AM (899, 18.7%) for females.
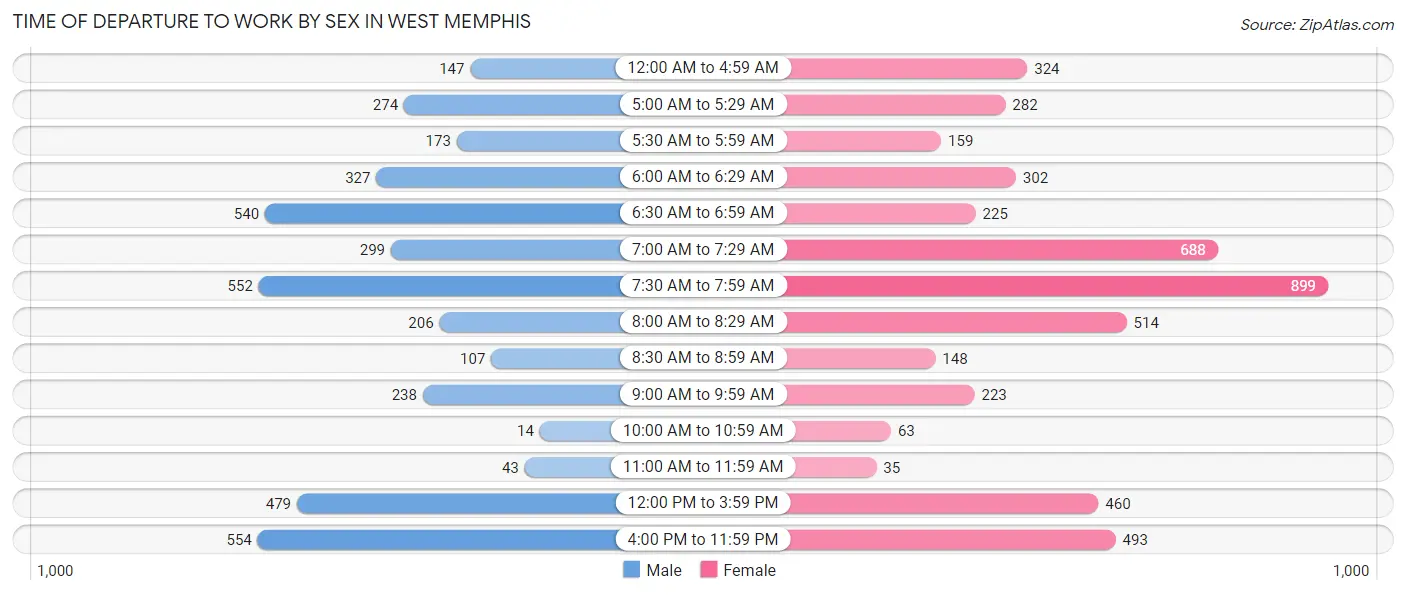
| Time of Departure | Male | Female |
| 12:00 AM to 4:59 AM | 147 (3.7%) | 324 (6.7%) |
| 5:00 AM to 5:29 AM | 274 (6.9%) | 282 (5.9%) |
| 5:30 AM to 5:59 AM | 173 (4.4%) | 159 (3.3%) |
| 6:00 AM to 6:29 AM | 327 (8.3%) | 302 (6.3%) |
| 6:30 AM to 6:59 AM | 540 (13.7%) | 225 (4.7%) |
| 7:00 AM to 7:29 AM | 299 (7.6%) | 688 (14.3%) |
| 7:30 AM to 7:59 AM | 552 (14.0%) | 899 (18.7%) |
| 8:00 AM to 8:29 AM | 206 (5.2%) | 514 (10.7%) |
| 8:30 AM to 8:59 AM | 107 (2.7%) | 148 (3.1%) |
| 9:00 AM to 9:59 AM | 238 (6.0%) | 223 (4.6%) |
| 10:00 AM to 10:59 AM | 14 (0.4%) | 63 (1.3%) |
| 11:00 AM to 11:59 AM | 43 (1.1%) | 35 (0.7%) |
| 12:00 PM to 3:59 PM | 479 (12.1%) | 460 (9.6%) |
| 4:00 PM to 11:59 PM | 554 (14.0%) | 493 (10.2%) |
| Total | 3,953 (100.0%) | 4,815 (100.0%) |
Housing Occupancy in West Memphis
Occupancy by Ownership in West Memphis
Of the total 9,654 dwellings in West Memphis, owner-occupied units account for 4,318 (44.7%), while renter-occupied units make up 5,336 (55.3%).
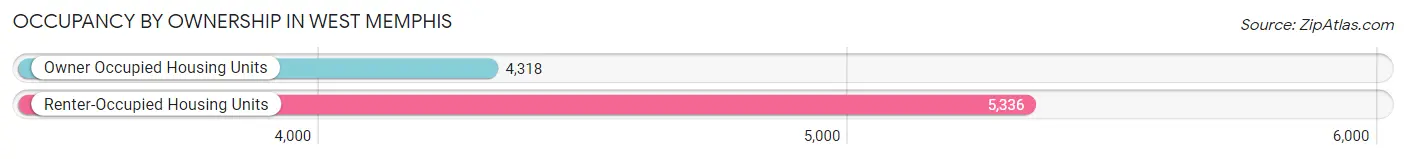
| Occupancy | # Housing Units | % Housing Units |
| Owner Occupied Housing Units | 4,318 | 44.7% |
| Renter-Occupied Housing Units | 5,336 | 55.3% |
| Total Occupied Housing Units | 9,654 | 100.0% |
Occupancy by Household Size in West Memphis
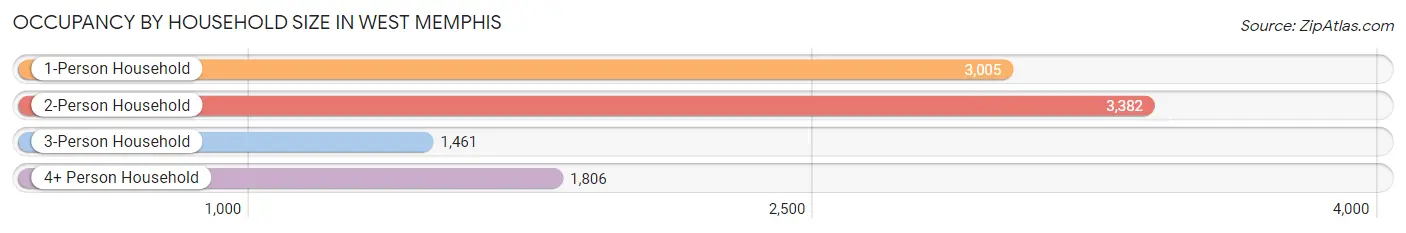
| Household Size | # Housing Units | % Housing Units |
| 1-Person Household | 3,005 | 31.1% |
| 2-Person Household | 3,382 | 35.0% |
| 3-Person Household | 1,461 | 15.1% |
| 4+ Person Household | 1,806 | 18.7% |
| Total Housing Units | 9,654 | 100.0% |
Occupancy by Ownership by Household Size in West Memphis
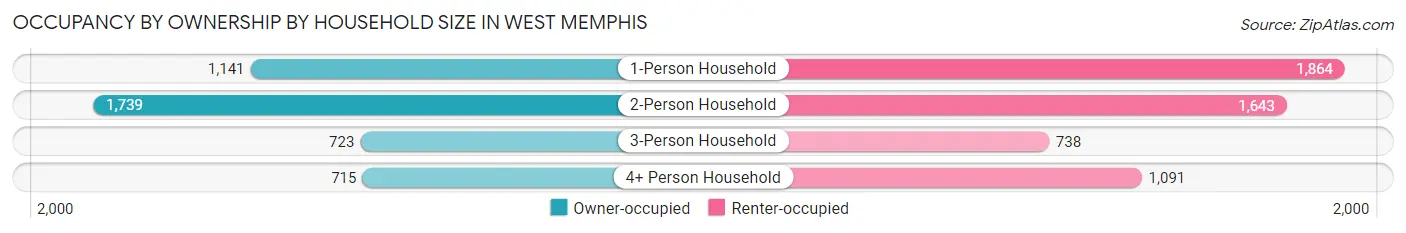
| Household Size | Owner-occupied | Renter-occupied |
| 1-Person Household | 1,141 (38.0%) | 1,864 (62.0%) |
| 2-Person Household | 1,739 (51.4%) | 1,643 (48.6%) |
| 3-Person Household | 723 (49.5%) | 738 (50.5%) |
| 4+ Person Household | 715 (39.6%) | 1,091 (60.4%) |
| Total Housing Units | 4,318 (44.7%) | 5,336 (55.3%) |
Occupancy by Educational Attainment in West Memphis
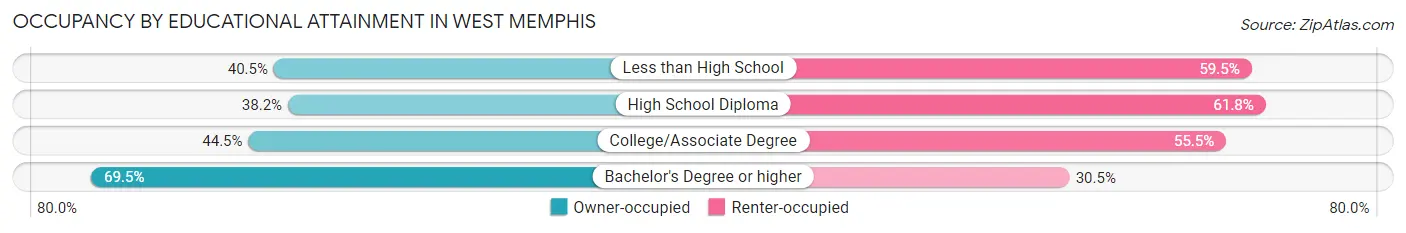
| Household Size | Owner-occupied | Renter-occupied |
| Less than High School | 640 (40.5%) | 941 (59.5%) |
| High School Diploma | 1,501 (38.2%) | 2,424 (61.8%) |
| College/Associate Degree | 1,256 (44.5%) | 1,566 (55.5%) |
| Bachelor's Degree or higher | 921 (69.5%) | 405 (30.5%) |
Occupancy by Age of Householder in West Memphis
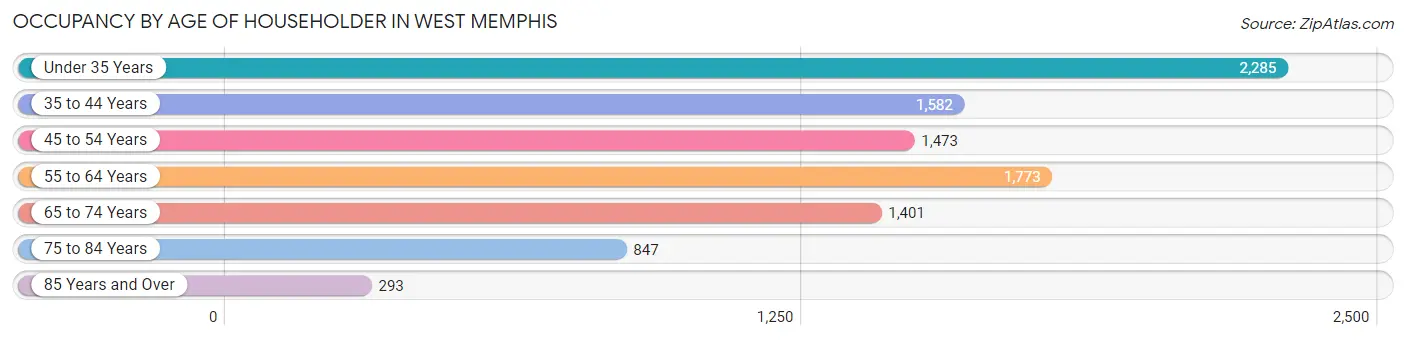
| Age Bracket | # Households | % Households |
| Under 35 Years | 2,285 | 23.7% |
| 35 to 44 Years | 1,582 | 16.4% |
| 45 to 54 Years | 1,473 | 15.3% |
| 55 to 64 Years | 1,773 | 18.4% |
| 65 to 74 Years | 1,401 | 14.5% |
| 75 to 84 Years | 847 | 8.8% |
| 85 Years and Over | 293 | 3.0% |
| Total | 9,654 | 100.0% |
Housing Finances in West Memphis
Median Income by Occupancy in West Memphis

| Occupancy Type | # Households | Median Income |
| Owner-Occupied | 4,318 (44.7%) | $58,552 |
| Renter-Occupied | 5,336 (55.3%) | $27,917 |
| Average | 9,654 (100.0%) | $40,904 |
Occupancy by Householder Income Bracket in West Memphis
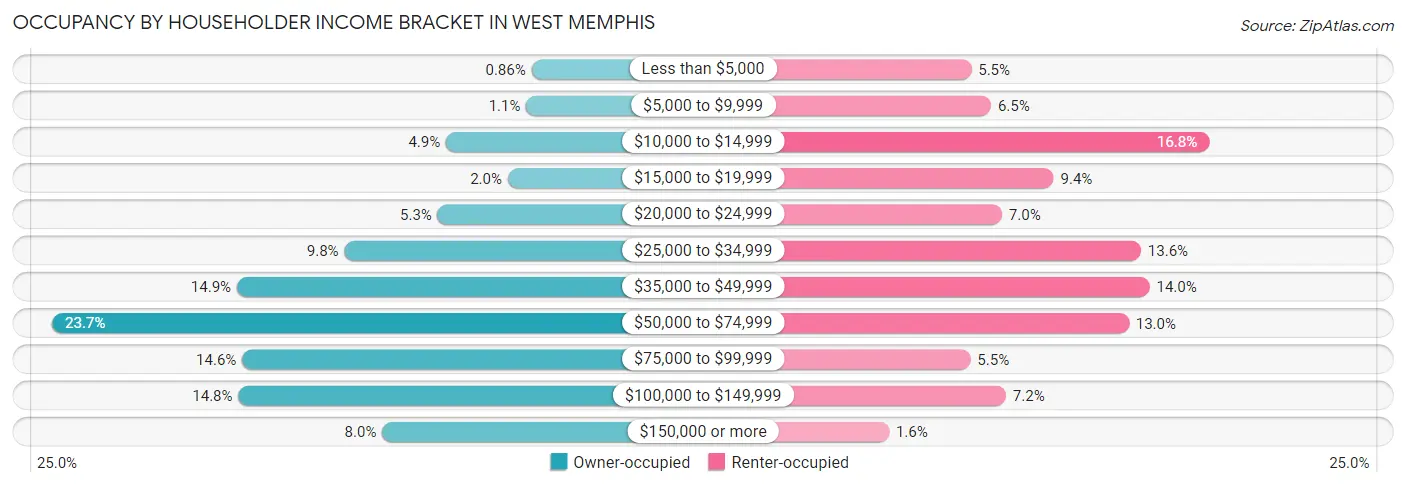
| Income Bracket | Owner-occupied | Renter-occupied |
| Less than $5,000 | 37 (0.9%) | 294 (5.5%) |
| $5,000 to $9,999 | 48 (1.1%) | 344 (6.5%) |
| $10,000 to $14,999 | 213 (4.9%) | 898 (16.8%) |
| $15,000 to $19,999 | 86 (2.0%) | 503 (9.4%) |
| $20,000 to $24,999 | 230 (5.3%) | 372 (7.0%) |
| $25,000 to $34,999 | 422 (9.8%) | 725 (13.6%) |
| $35,000 to $49,999 | 643 (14.9%) | 747 (14.0%) |
| $50,000 to $74,999 | 1,023 (23.7%) | 694 (13.0%) |
| $75,000 to $99,999 | 632 (14.6%) | 292 (5.5%) |
| $100,000 to $149,999 | 640 (14.8%) | 382 (7.2%) |
| $150,000 or more | 344 (8.0%) | 85 (1.6%) |
| Total | 4,318 (100.0%) | 5,336 (100.0%) |
Monthly Housing Cost Tiers in West Memphis
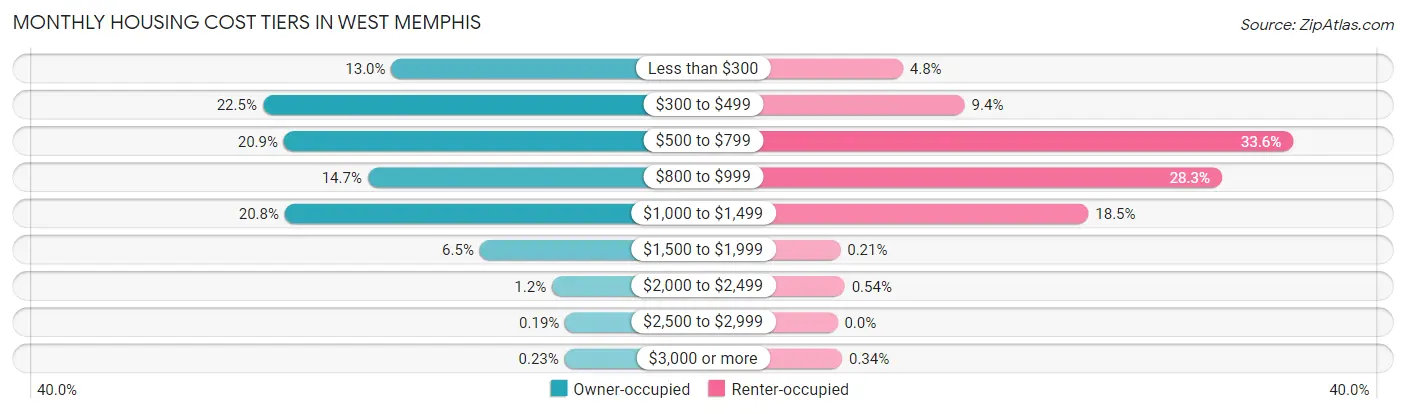
| Monthly Cost | Owner-occupied | Renter-occupied |
| Less than $300 | 561 (13.0%) | 257 (4.8%) |
| $300 to $499 | 970 (22.5%) | 500 (9.4%) |
| $500 to $799 | 903 (20.9%) | 1,791 (33.6%) |
| $800 to $999 | 636 (14.7%) | 1,510 (28.3%) |
| $1,000 to $1,499 | 900 (20.8%) | 986 (18.5%) |
| $1,500 to $1,999 | 280 (6.5%) | 11 (0.2%) |
| $2,000 to $2,499 | 50 (1.2%) | 29 (0.5%) |
| $2,500 to $2,999 | 8 (0.2%) | 0 (0.0%) |
| $3,000 or more | 10 (0.2%) | 18 (0.3%) |
| Total | 4,318 (100.0%) | 5,336 (100.0%) |
Physical Housing Characteristics in West Memphis
Housing Structures in West Memphis
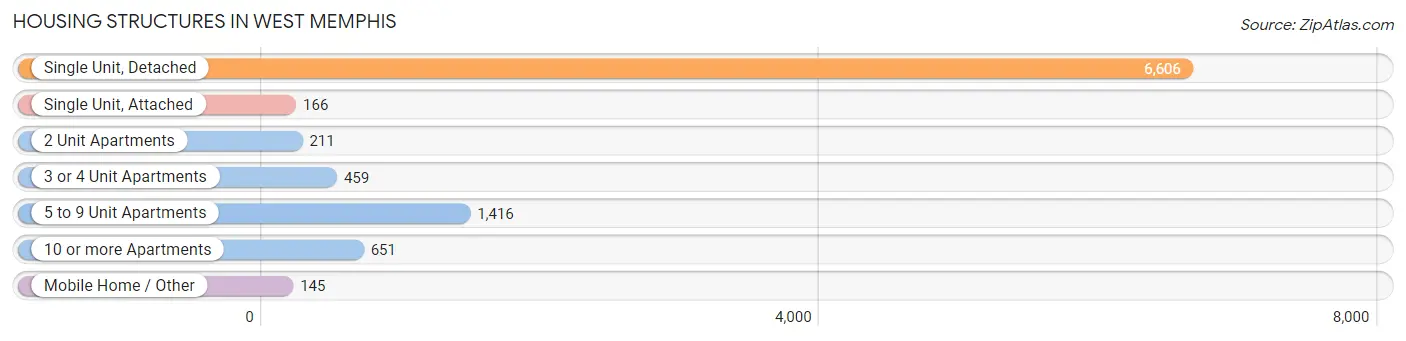
| Structure Type | # Housing Units | % Housing Units |
| Single Unit, Detached | 6,606 | 68.4% |
| Single Unit, Attached | 166 | 1.7% |
| 2 Unit Apartments | 211 | 2.2% |
| 3 or 4 Unit Apartments | 459 | 4.8% |
| 5 to 9 Unit Apartments | 1,416 | 14.7% |
| 10 or more Apartments | 651 | 6.7% |
| Mobile Home / Other | 145 | 1.5% |
| Total | 9,654 | 100.0% |
Housing Structures by Occupancy in West Memphis
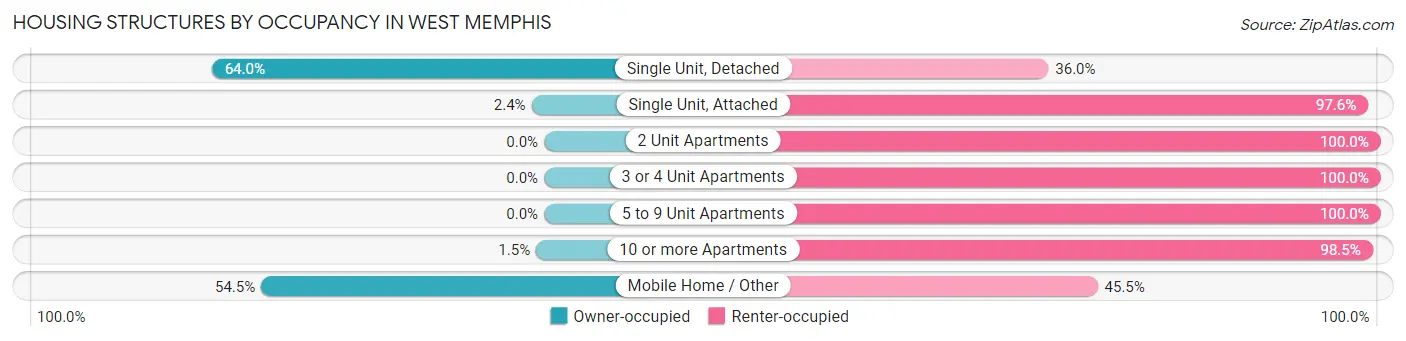
| Structure Type | Owner-occupied | Renter-occupied |
| Single Unit, Detached | 4,225 (64.0%) | 2,381 (36.0%) |
| Single Unit, Attached | 4 (2.4%) | 162 (97.6%) |
| 2 Unit Apartments | 0 (0.0%) | 211 (100.0%) |
| 3 or 4 Unit Apartments | 0 (0.0%) | 459 (100.0%) |
| 5 to 9 Unit Apartments | 0 (0.0%) | 1,416 (100.0%) |
| 10 or more Apartments | 10 (1.5%) | 641 (98.5%) |
| Mobile Home / Other | 79 (54.5%) | 66 (45.5%) |
| Total | 4,318 (44.7%) | 5,336 (55.3%) |
Housing Structures by Number of Rooms in West Memphis
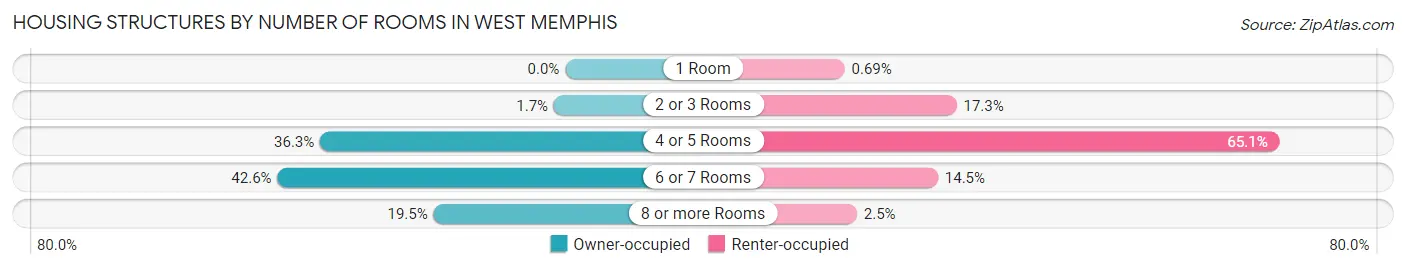
| Number of Rooms | Owner-occupied | Renter-occupied |
| 1 Room | 0 (0.0%) | 37 (0.7%) |
| 2 or 3 Rooms | 72 (1.7%) | 921 (17.3%) |
| 4 or 5 Rooms | 1,566 (36.3%) | 3,471 (65.0%) |
| 6 or 7 Rooms | 1,839 (42.6%) | 773 (14.5%) |
| 8 or more Rooms | 841 (19.5%) | 134 (2.5%) |
| Total | 4,318 (100.0%) | 5,336 (100.0%) |
Housing Structure by Heating Type in West Memphis
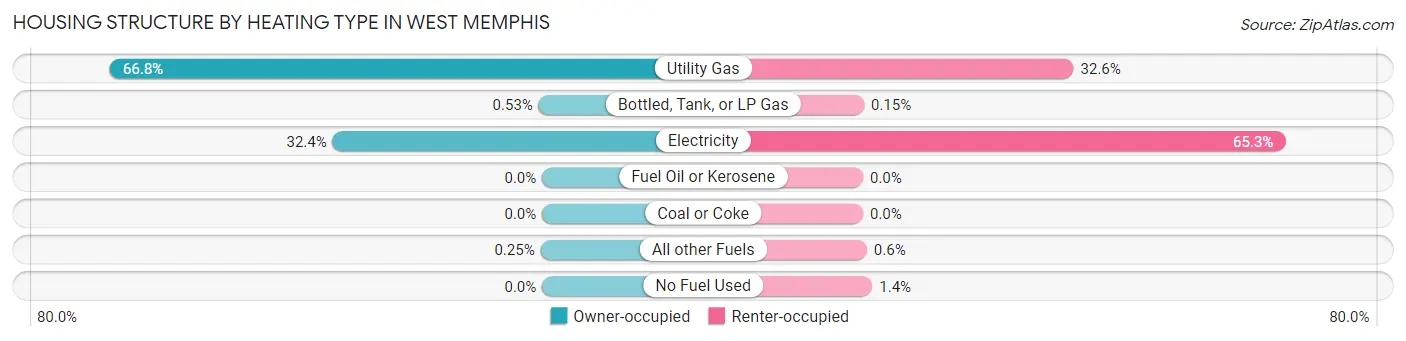
| Heating Type | Owner-occupied | Renter-occupied |
| Utility Gas | 2,885 (66.8%) | 1,737 (32.6%) |
| Bottled, Tank, or LP Gas | 23 (0.5%) | 8 (0.2%) |
| Electricity | 1,399 (32.4%) | 3,482 (65.2%) |
| Fuel Oil or Kerosene | 0 (0.0%) | 0 (0.0%) |
| Coal or Coke | 0 (0.0%) | 0 (0.0%) |
| All other Fuels | 11 (0.3%) | 32 (0.6%) |
| No Fuel Used | 0 (0.0%) | 77 (1.4%) |
| Total | 4,318 (100.0%) | 5,336 (100.0%) |
Household Vehicle Usage in West Memphis
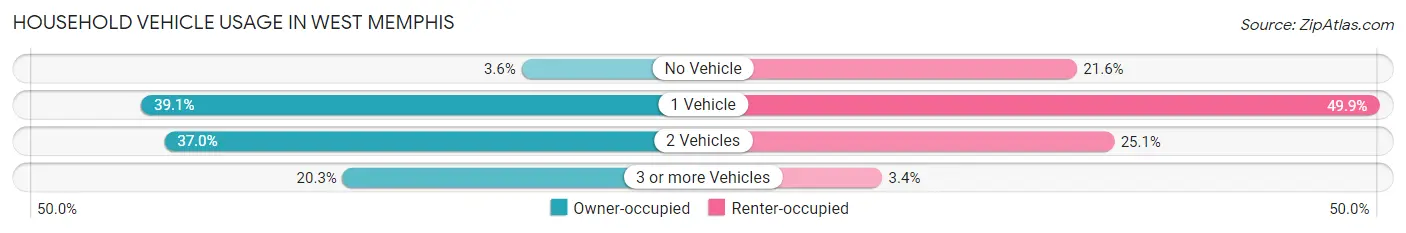
| Vehicles per Household | Owner-occupied | Renter-occupied |
| No Vehicle | 156 (3.6%) | 1,153 (21.6%) |
| 1 Vehicle | 1,689 (39.1%) | 2,661 (49.9%) |
| 2 Vehicles | 1,596 (37.0%) | 1,339 (25.1%) |
| 3 or more Vehicles | 877 (20.3%) | 183 (3.4%) |
| Total | 4,318 (100.0%) | 5,336 (100.0%) |
Real Estate & Mortgages in West Memphis
Real Estate and Mortgage Overview in West Memphis
| Characteristic | Without Mortgage | With Mortgage |
| Housing Units | 1,745 | 2,573 |
| Median Property Value | $96,000 | $118,300 |
| Median Household Income | $44,984 | $245 |
| Monthly Housing Costs | $341 | $10 |
| Real Estate Taxes | $457 | $238 |
Property Value by Mortgage Status in West Memphis
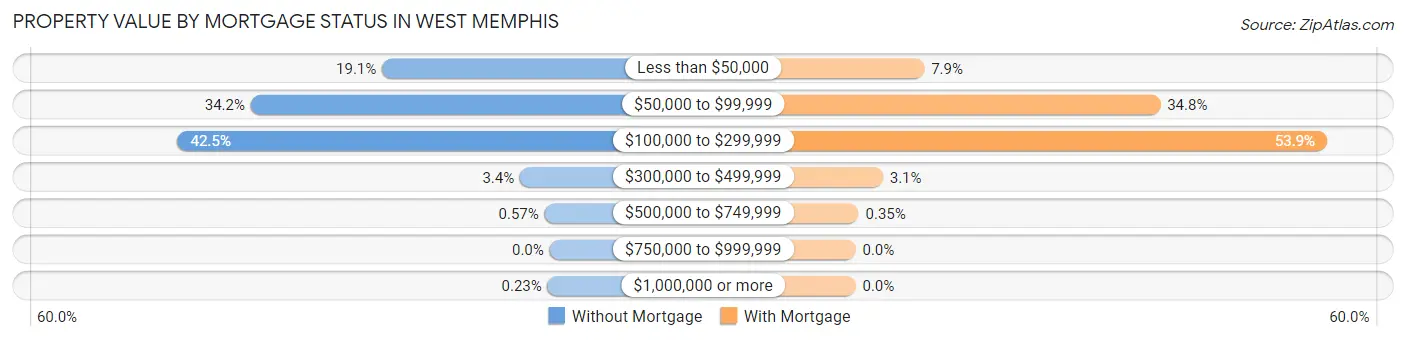
| Property Value | Without Mortgage | With Mortgage |
| Less than $50,000 | 334 (19.1%) | 202 (7.9%) |
| $50,000 to $99,999 | 596 (34.2%) | 896 (34.8%) |
| $100,000 to $299,999 | 742 (42.5%) | 1,386 (53.9%) |
| $300,000 to $499,999 | 59 (3.4%) | 80 (3.1%) |
| $500,000 to $749,999 | 10 (0.6%) | 9 (0.4%) |
| $750,000 to $999,999 | 0 (0.0%) | 0 (0.0%) |
| $1,000,000 or more | 4 (0.2%) | 0 (0.0%) |
| Total | 1,745 (100.0%) | 2,573 (100.0%) |
Household Income by Mortgage Status in West Memphis
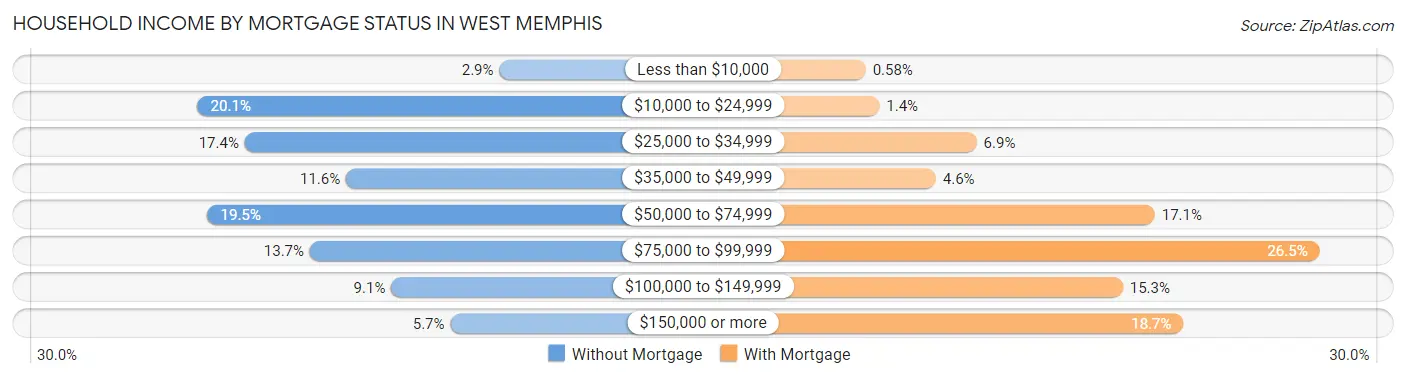
| Household Income | Without Mortgage | With Mortgage |
| Less than $10,000 | 50 (2.9%) | 15 (0.6%) |
| $10,000 to $24,999 | 351 (20.1%) | 35 (1.4%) |
| $25,000 to $34,999 | 304 (17.4%) | 178 (6.9%) |
| $35,000 to $49,999 | 203 (11.6%) | 118 (4.6%) |
| $50,000 to $74,999 | 341 (19.5%) | 440 (17.1%) |
| $75,000 to $99,999 | 239 (13.7%) | 682 (26.5%) |
| $100,000 to $149,999 | 158 (9.0%) | 393 (15.3%) |
| $150,000 or more | 99 (5.7%) | 482 (18.7%) |
| Total | 1,745 (100.0%) | 2,573 (100.0%) |
Property Value to Household Income Ratio in West Memphis
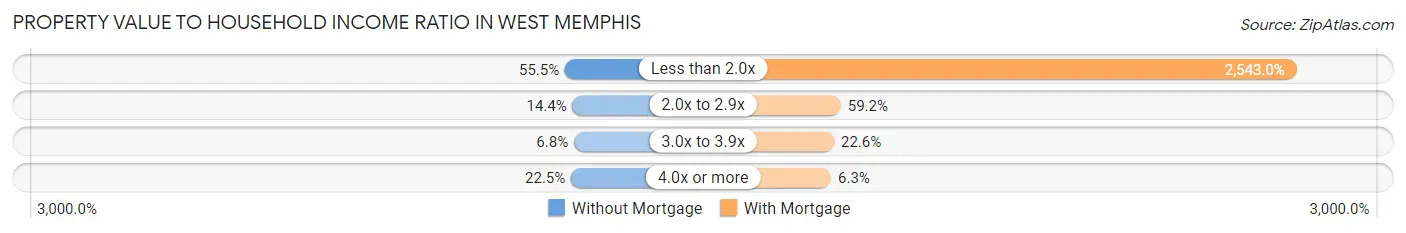
| Value-to-Income Ratio | Without Mortgage | With Mortgage |
| Less than 2.0x | 968 (55.5%) | 65,431 (2,543.0%) |
| 2.0x to 2.9x | 251 (14.4%) | 1,522 (59.2%) |
| 3.0x to 3.9x | 118 (6.8%) | 582 (22.6%) |
| 4.0x or more | 392 (22.5%) | 163 (6.3%) |
| Total | 1,745 (100.0%) | 2,573 (100.0%) |
Real Estate Taxes by Mortgage Status in West Memphis
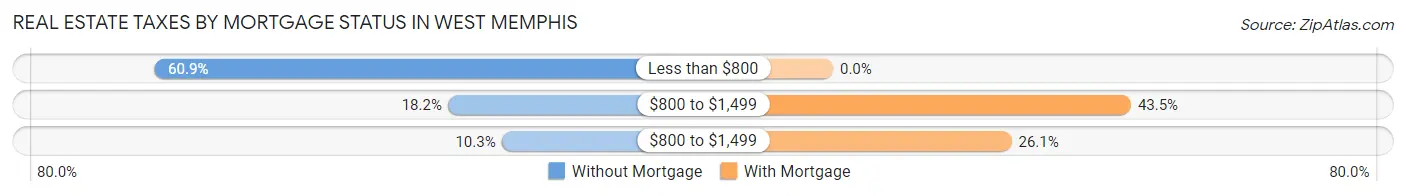
| Property Taxes | Without Mortgage | With Mortgage |
| Less than $800 | 1,063 (60.9%) | 0 (0.0%) |
| $800 to $1,499 | 317 (18.2%) | 1,120 (43.5%) |
| $800 to $1,499 | 180 (10.3%) | 671 (26.1%) |
| Total | 1,745 (100.0%) | 2,573 (100.0%) |
Health & Disability in West Memphis
Health Insurance Coverage by Age in West Memphis
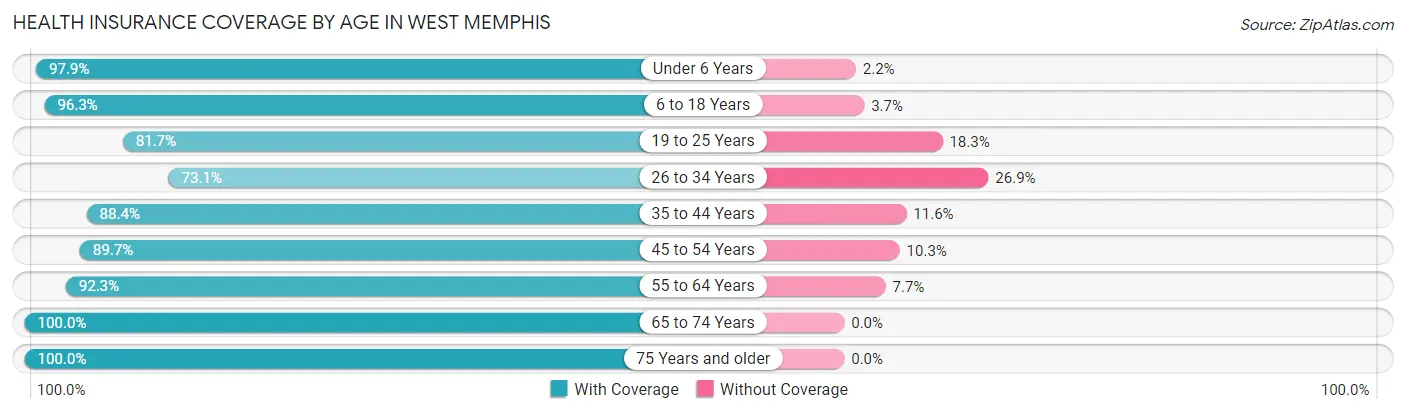
| Age Bracket | With Coverage | Without Coverage |
| Under 6 Years | 2,634 (97.9%) | 58 (2.1%) |
| 6 to 18 Years | 4,098 (96.3%) | 158 (3.7%) |
| 19 to 25 Years | 2,168 (81.7%) | 486 (18.3%) |
| 26 to 34 Years | 2,109 (73.1%) | 775 (26.9%) |
| 35 to 44 Years | 2,496 (88.4%) | 327 (11.6%) |
| 45 to 54 Years | 2,129 (89.7%) | 245 (10.3%) |
| 55 to 64 Years | 2,589 (92.3%) | 216 (7.7%) |
| 65 to 74 Years | 1,889 (100.0%) | 0 (0.0%) |
| 75 Years and older | 1,586 (100.0%) | 0 (0.0%) |
| Total | 21,698 (90.5%) | 2,265 (9.5%) |
Health Insurance Coverage by Citizenship Status in West Memphis
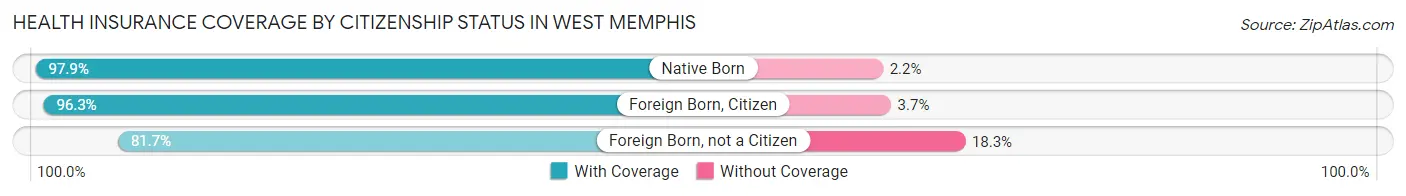
| Citizenship Status | With Coverage | Without Coverage |
| Native Born | 2,634 (97.9%) | 58 (2.1%) |
| Foreign Born, Citizen | 4,098 (96.3%) | 158 (3.7%) |
| Foreign Born, not a Citizen | 2,168 (81.7%) | 486 (18.3%) |
Health Insurance Coverage by Household Income in West Memphis
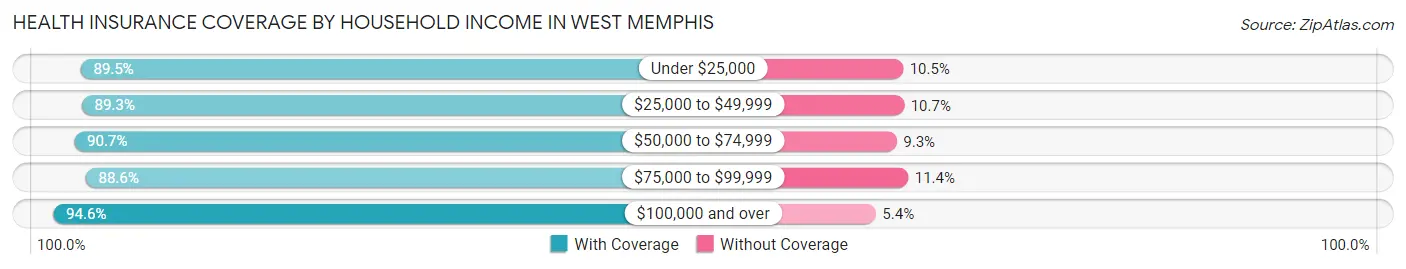
| Household Income | With Coverage | Without Coverage |
| Under $25,000 | 5,210 (89.5%) | 609 (10.5%) |
| $25,000 to $49,999 | 5,491 (89.3%) | 656 (10.7%) |
| $50,000 to $74,999 | 4,243 (90.7%) | 434 (9.3%) |
| $75,000 to $99,999 | 2,487 (88.6%) | 321 (11.4%) |
| $100,000 and over | 4,170 (94.6%) | 236 (5.4%) |
Public vs Private Health Insurance Coverage by Age in West Memphis
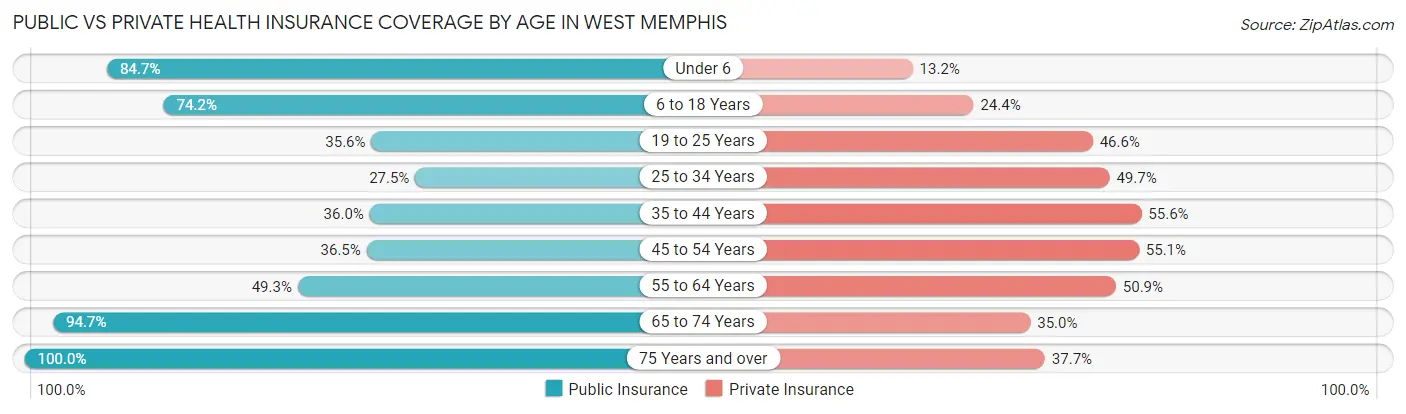
| Age Bracket | Public Insurance | Private Insurance |
| Under 6 | 2,280 (84.7%) | 354 (13.2%) |
| 6 to 18 Years | 3,158 (74.2%) | 1,040 (24.4%) |
| 19 to 25 Years | 946 (35.6%) | 1,236 (46.6%) |
| 25 to 34 Years | 793 (27.5%) | 1,433 (49.7%) |
| 35 to 44 Years | 1,015 (35.9%) | 1,570 (55.6%) |
| 45 to 54 Years | 867 (36.5%) | 1,309 (55.1%) |
| 55 to 64 Years | 1,383 (49.3%) | 1,427 (50.9%) |
| 65 to 74 Years | 1,789 (94.7%) | 661 (35.0%) |
| 75 Years and over | 1,586 (100.0%) | 598 (37.7%) |
| Total | 13,817 (57.7%) | 9,628 (40.2%) |
Disability Status by Sex by Age in West Memphis
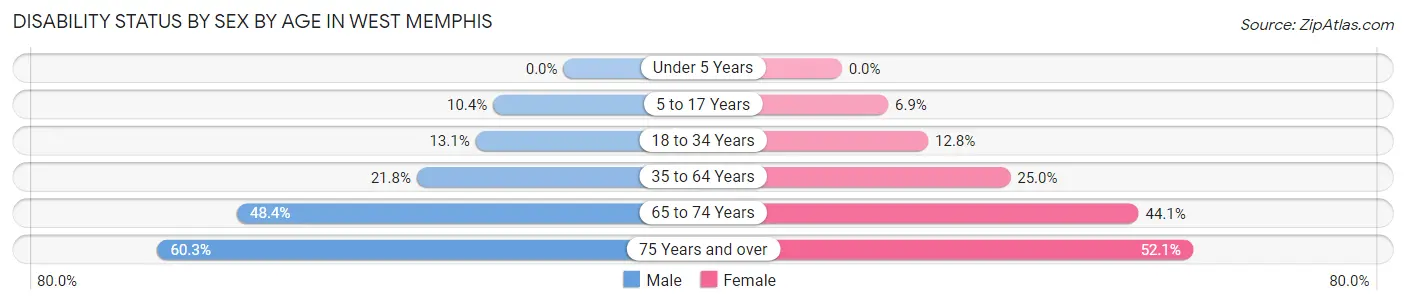
| Age Bracket | Male | Female |
| Under 5 Years | 0 (0.0%) | 0 (0.0%) |
| 5 to 17 Years | 214 (10.4%) | 158 (6.9%) |
| 18 to 34 Years | 346 (13.1%) | 423 (12.8%) |
| 35 to 64 Years | 771 (21.8%) | 1,116 (25.0%) |
| 65 to 74 Years | 372 (48.4%) | 494 (44.1%) |
| 75 Years and over | 367 (60.3%) | 509 (52.1%) |
Disability Class by Sex by Age in West Memphis
Disability Class: Hearing Difficulty
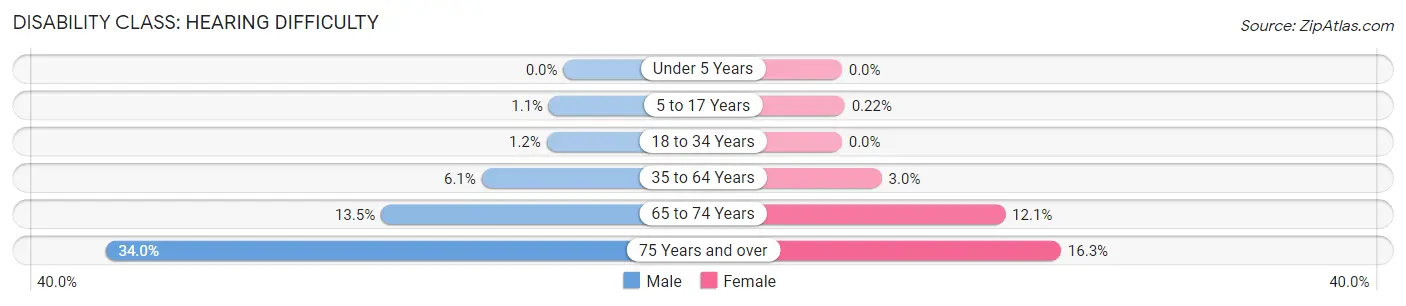
| Age Bracket | Male | Female |
| Under 5 Years | 0 (0.0%) | 0 (0.0%) |
| 5 to 17 Years | 22 (1.1%) | 5 (0.2%) |
| 18 to 34 Years | 33 (1.2%) | 0 (0.0%) |
| 35 to 64 Years | 215 (6.1%) | 132 (3.0%) |
| 65 to 74 Years | 104 (13.5%) | 136 (12.1%) |
| 75 Years and over | 207 (34.0%) | 159 (16.3%) |
Disability Class: Vision Difficulty
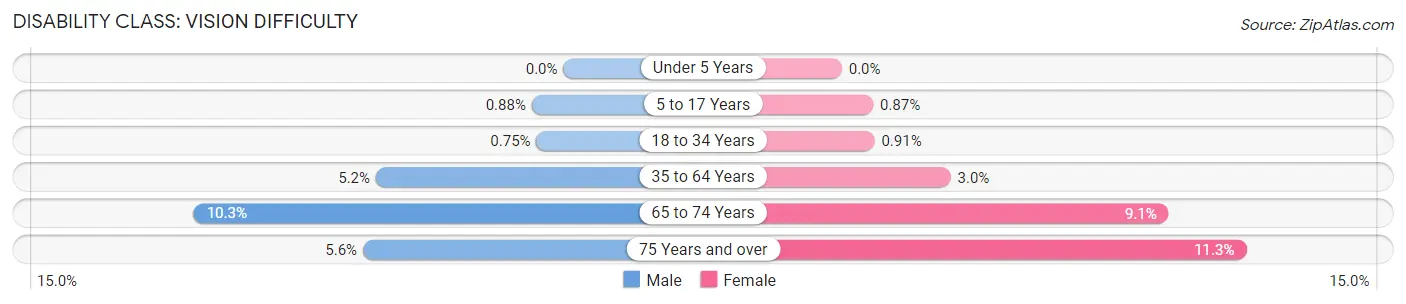
| Age Bracket | Male | Female |
| Under 5 Years | 0 (0.0%) | 0 (0.0%) |
| 5 to 17 Years | 18 (0.9%) | 20 (0.9%) |
| 18 to 34 Years | 20 (0.7%) | 30 (0.9%) |
| 35 to 64 Years | 185 (5.2%) | 135 (3.0%) |
| 65 to 74 Years | 79 (10.3%) | 102 (9.1%) |
| 75 Years and over | 34 (5.6%) | 110 (11.3%) |
Disability Class: Cognitive Difficulty
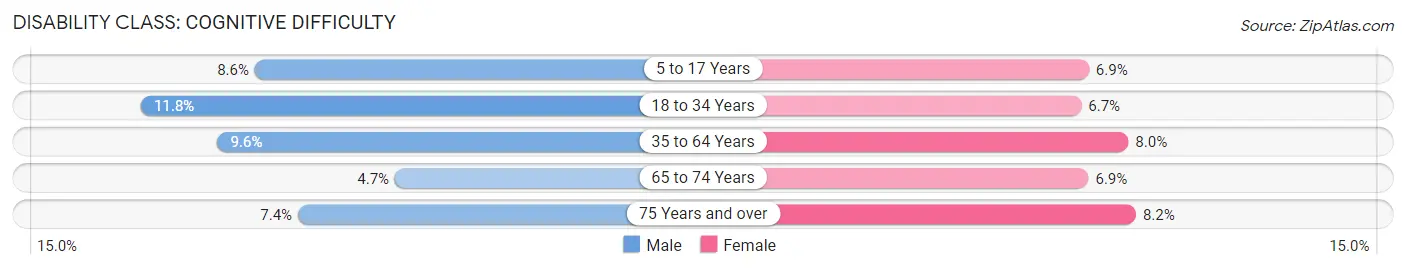
| Age Bracket | Male | Female |
| 5 to 17 Years | 176 (8.6%) | 158 (6.9%) |
| 18 to 34 Years | 312 (11.8%) | 220 (6.7%) |
| 35 to 64 Years | 341 (9.6%) | 356 (8.0%) |
| 65 to 74 Years | 36 (4.7%) | 77 (6.9%) |
| 75 Years and over | 45 (7.4%) | 80 (8.2%) |
Disability Class: Ambulatory Difficulty
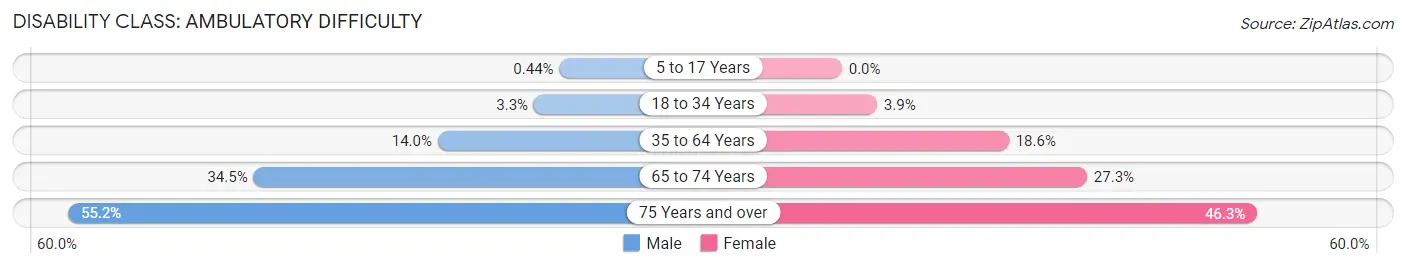
| Age Bracket | Male | Female |
| 5 to 17 Years | 9 (0.4%) | 0 (0.0%) |
| 18 to 34 Years | 87 (3.3%) | 129 (3.9%) |
| 35 to 64 Years | 495 (14.0%) | 829 (18.6%) |
| 65 to 74 Years | 265 (34.5%) | 306 (27.3%) |
| 75 Years and over | 336 (55.2%) | 452 (46.3%) |
Disability Class: Self-Care Difficulty
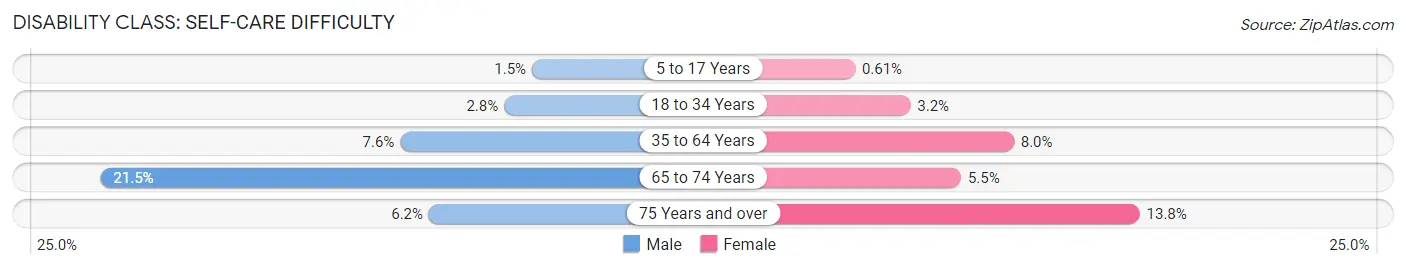
| Age Bracket | Male | Female |
| 5 to 17 Years | 30 (1.5%) | 14 (0.6%) |
| 18 to 34 Years | 73 (2.8%) | 105 (3.2%) |
| 35 to 64 Years | 268 (7.6%) | 356 (8.0%) |
| 65 to 74 Years | 165 (21.5%) | 62 (5.5%) |
| 75 Years and over | 38 (6.2%) | 135 (13.8%) |
Technology Access in West Memphis
Computing Device Access in West Memphis
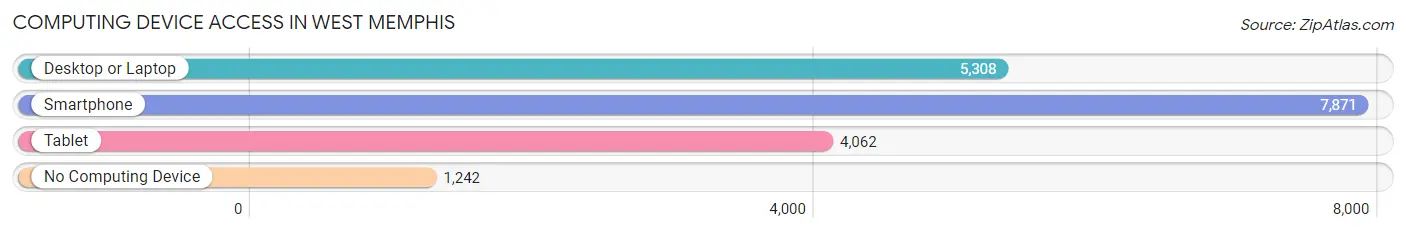
| Device Type | # Households | % Households |
| Desktop or Laptop | 5,308 | 55.0% |
| Smartphone | 7,871 | 81.5% |
| Tablet | 4,062 | 42.1% |
| No Computing Device | 1,242 | 12.9% |
| Total | 9,654 | 100.0% |
Internet Access in West Memphis
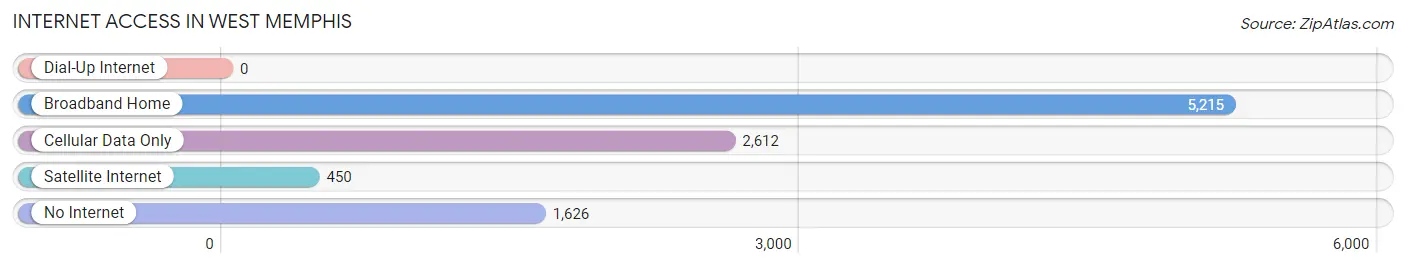
| Internet Type | # Households | % Households |
| Dial-Up Internet | 0 | 0.0% |
| Broadband Home | 5,215 | 54.0% |
| Cellular Data Only | 2,612 | 27.1% |
| Satellite Internet | 450 | 4.7% |
| No Internet | 1,626 | 16.8% |
| Total | 9,654 | 100.0% |
West Memphis Summary
History
West Memphis, Arkansas is located in the eastern part of the state, just across the Mississippi River from Memphis, Tennessee. The city was founded in 1883 and incorporated in 1889. It was originally known as “The Point” due to its location at the confluence of the St. Francis and Mississippi Rivers. The city was renamed West Memphis in 1895.
West Memphis has a long and varied history. It was a major cotton-producing center in the late 19th and early 20th centuries, and the city was home to several large cotton mills. The city was also a major hub for the railroad industry, with several major railroads running through the city.
In the 1950s, West Memphis began to experience a period of decline. The cotton mills closed, and the railroads began to move away. The city’s population began to decline, and the city’s economy suffered.
In the late 1960s, West Memphis began to experience a period of revitalization. The city was chosen as the site of a new bridge across the Mississippi River, and the bridge opened in 1973. This bridge connected West Memphis to Memphis, Tennessee, and the city began to experience a period of growth.
In 1993, West Memphis was the site of a horrific crime. Three young boys were brutally murdered, and the crime remains unsolved to this day. The murders gained national attention, and the city was thrust into the spotlight.
Geography
West Memphis is located in the eastern part of Arkansas, just across the Mississippi River from Memphis, Tennessee. The city is situated in the Mississippi Delta region, and is part of the larger Memphis metropolitan area.
The city is located at the confluence of the St. Francis and Mississippi Rivers. The city is located in the flat, alluvial plain of the Mississippi Delta, and is surrounded by agricultural land.
The climate of West Memphis is humid subtropical, with hot, humid summers and mild winters. The average annual temperature is around 64°F (18°C). The average annual precipitation is around 48 inches (122 cm).
Economy
West Memphis’ economy is largely based on agriculture and manufacturing. The city is home to several large agricultural operations, including poultry farms, cotton farms, and soybean farms.
The city is also home to several large manufacturing operations, including a Tyson Foods poultry processing plant, a Nestle Purina pet food plant, and a Procter & Gamble paper products plant.
The city is also home to several large retail operations, including a Walmart Supercenter, a Target, and a Lowe’s Home Improvement store.
Demographics
As of the 2010 census, West Memphis had a population of 26,245. The racial makeup of the city was 63.3% White, 32.2% African American, 0.4% Native American, 0.7% Asian, 0.1% Pacific Islander, 1.2% from other races, and 2.1% from two or more races. Hispanic or Latino of any race were 3.3% of the population.
The median household income in West Memphis was $31,945, and the median family income was $37,945. The per capita income was $17,845. About 20.3% of the population was below the poverty line.
Common Questions
What is Per Capita Income in West Memphis?
Per Capita income in West Memphis is $22,985.
What is the Median Family Income in West Memphis?
Median Family Income in West Memphis is $46,603.
What is the Median Household income in West Memphis?
Median Household Income in West Memphis is $40,904.
What is Income or Wage Gap in West Memphis?
Income or Wage Gap in West Memphis is 13.9%.
Women in West Memphis earn 86.1 cents for every dollar earned by a man.
What is Family Income Deficit in West Memphis?
Family Income Deficit in West Memphis is $11,702.
Families that are below poverty line in West Memphis earn $11,702 less on average than the poverty threshold level.
What is Inequality or Gini Index in West Memphis?
Inequality or Gini Index in West Memphis is 0.47.
What is the Total Population of West Memphis?
Total Population of West Memphis is 24,351.
What is the Total Male Population of West Memphis?
Total Male Population of West Memphis is 10,839.
What is the Total Female Population of West Memphis?
Total Female Population of West Memphis is 13,512.
What is the Ratio of Males per 100 Females in West Memphis?
There are 80.22 Males per 100 Females in West Memphis.
What is the Ratio of Females per 100 Males in West Memphis?
There are 124.66 Females per 100 Males in West Memphis.
What is the Median Population Age in West Memphis?
Median Population Age in West Memphis is 33.3 Years.
What is the Average Family Size in West Memphis
Average Family Size in West Memphis is 3.1 People.
What is the Average Household Size in West Memphis
Average Household Size in West Memphis is 2.5 People.
How Large is the Labor Force in West Memphis?
There are 11,056 People in the Labor Forcein in West Memphis.
What is the Percentage of People in the Labor Force in West Memphis?
59.8% of People are in the Labor Force in West Memphis.
What is the Unemployment Rate in West Memphis?
Unemployment Rate in West Memphis is 13.3%.