Fort Smith, AR Map & Demographics
Fort Smith Map
Fort Smith Overview
$32,809
PER CAPITA INCOME
$62,787
AVG FAMILY INCOME
$50,799
AVG HOUSEHOLD INCOME
20.1%
WAGE / INCOME GAP [ % ]
79.9¢/ $1
WAGE / INCOME GAP [ $ ]
$11,057
FAMILY INCOME DEFICIT
0.53
INEQUALITY / GINI INDEX
89,315
TOTAL POPULATION
44,101
MALE POPULATION
45,214
FEMALE POPULATION
97.54
MALES / 100 FEMALES
102.52
FEMALES / 100 MALES
36.4
MEDIAN AGE
3.0
AVG FAMILY SIZE
2.4
AVG HOUSEHOLD SIZE
43,302
LABOR FORCE [ PEOPLE ]
61.4%
PERCENT IN LABOR FORCE
6.1%
UNEMPLOYMENT RATE
Fort Smith Area Codes
Income in Fort Smith
Income Overview in Fort Smith
Per Capita Income in Fort Smith is $32,809, while median incomes of families and households are $62,787 and $50,799 respectively.
| Characteristic | Number | Measure |
| Per Capita Income | 89,315 | $32,809 |
| Median Family Income | 22,859 | $62,787 |
| Mean Family Income | 22,859 | $102,285 |
| Median Household Income | 36,373 | $50,799 |
| Mean Household Income | 36,373 | $81,694 |
| Income Deficit | 22,859 | $11,057 |
| Wage / Income Gap (%) | 89,315 | 20.12% |
| Wage / Income Gap ($) | 89,315 | 79.88¢ per $1 |
| Gini / Inequality Index | 89,315 | 0.53 |
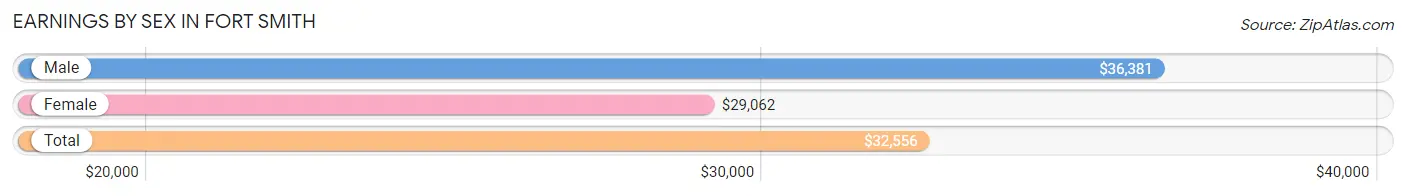
Earnings by Sex in Fort Smith
Average Earnings in Fort Smith are $32,556, $36,381 for men and $29,062 for women, a difference of 20.1%.
| Sex | Number | Average Earnings |
| Male | 23,411 (52.1%) | $36,381 |
| Female | 21,538 (47.9%) | $29,062 |
| Total | 44,949 (100.0%) | $32,556 |
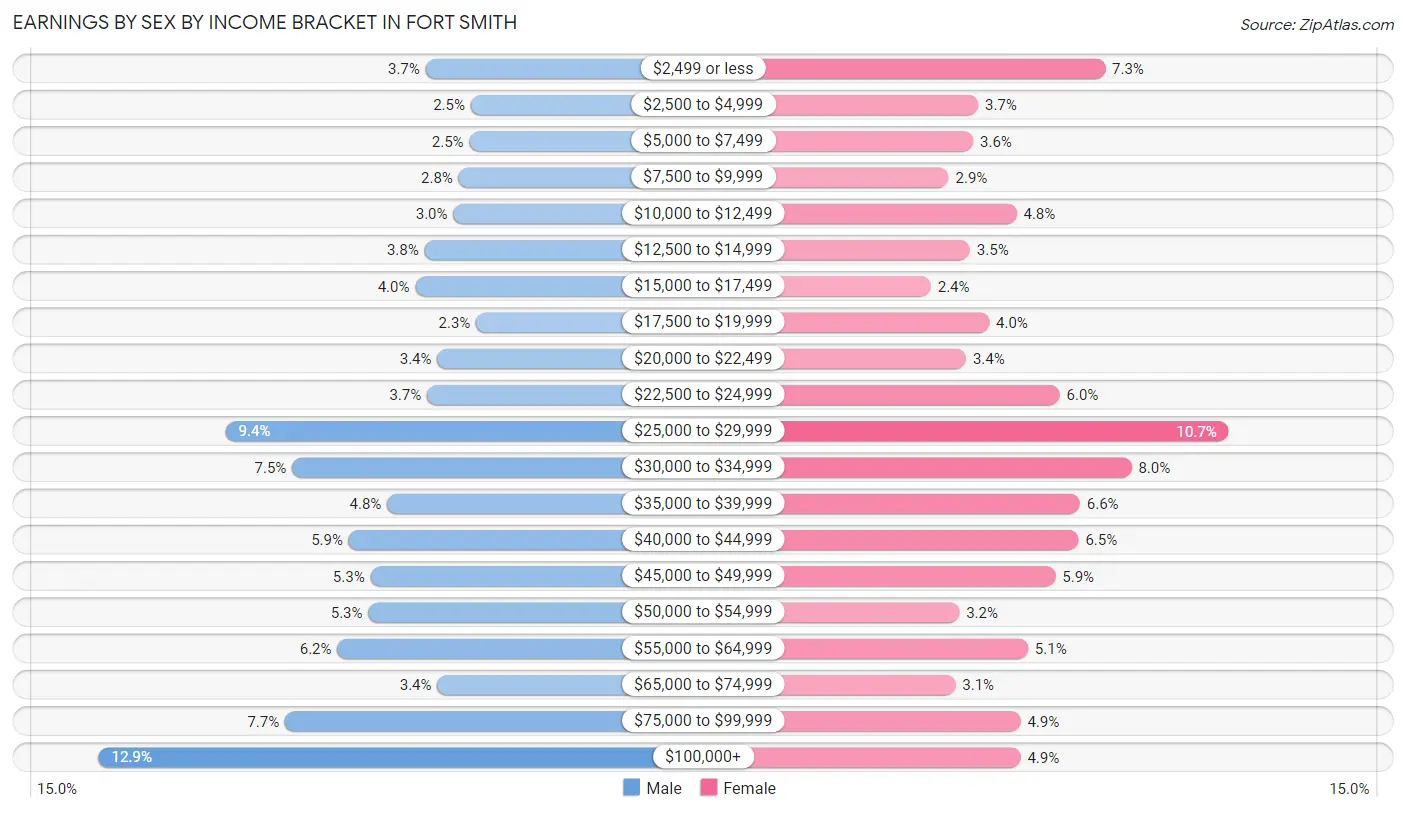
Earnings by Sex by Income Bracket in Fort Smith
The most common earnings brackets in Fort Smith are $100,000+ for men (3,025 | 12.9%) and $25,000 to $29,999 for women (2,312 | 10.7%).
| Income | Male | Female |
| $2,499 or less | 874 (3.7%) | 1,563 (7.3%) |
| $2,500 to $4,999 | 577 (2.5%) | 795 (3.7%) |
| $5,000 to $7,499 | 586 (2.5%) | 765 (3.5%) |
| $7,500 to $9,999 | 656 (2.8%) | 615 (2.9%) |
| $10,000 to $12,499 | 690 (2.9%) | 1,027 (4.8%) |
| $12,500 to $14,999 | 880 (3.8%) | 745 (3.5%) |
| $15,000 to $17,499 | 942 (4.0%) | 509 (2.4%) |
| $17,500 to $19,999 | 541 (2.3%) | 861 (4.0%) |
| $20,000 to $22,499 | 795 (3.4%) | 721 (3.4%) |
| $22,500 to $24,999 | 865 (3.7%) | 1,287 (6.0%) |
| $25,000 to $29,999 | 2,190 (9.3%) | 2,312 (10.7%) |
| $30,000 to $34,999 | 1,750 (7.5%) | 1,724 (8.0%) |
| $35,000 to $39,999 | 1,127 (4.8%) | 1,411 (6.6%) |
| $40,000 to $44,999 | 1,379 (5.9%) | 1,402 (6.5%) |
| $45,000 to $49,999 | 1,236 (5.3%) | 1,263 (5.9%) |
| $50,000 to $54,999 | 1,250 (5.3%) | 681 (3.2%) |
| $55,000 to $64,999 | 1,454 (6.2%) | 1,097 (5.1%) |
| $65,000 to $74,999 | 796 (3.4%) | 656 (3.0%) |
| $75,000 to $99,999 | 1,798 (7.7%) | 1,052 (4.9%) |
| $100,000+ | 3,025 (12.9%) | 1,052 (4.9%) |
| Total | 23,411 (100.0%) | 21,538 (100.0%) |
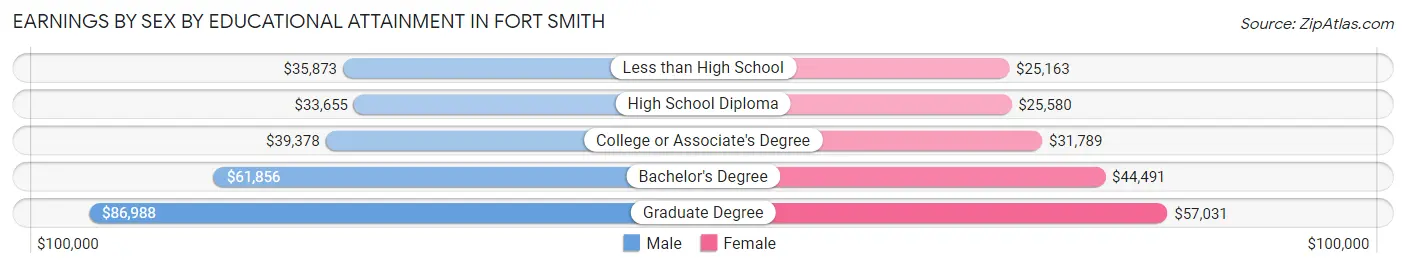
Earnings by Sex by Educational Attainment in Fort Smith
Average earnings in Fort Smith are $41,816 for men and $31,742 for women, a difference of 24.1%. Men with an educational attainment of graduate degree enjoy the highest average annual earnings of $86,988, while those with high school diploma education earn the least with $33,655. Women with an educational attainment of graduate degree earn the most with the average annual earnings of $57,031, while those with less than high school education have the smallest earnings of $25,163.
| Educational Attainment | Male Income | Female Income |
| Less than High School | $35,873 | $25,163 |
| High School Diploma | $33,655 | $25,580 |
| College or Associate's Degree | $39,378 | $31,789 |
| Bachelor's Degree | $61,856 | $44,491 |
| Graduate Degree | $86,988 | $57,031 |
| Total | $41,816 | $31,742 |
Family Income in Fort Smith
Family Income Brackets in Fort Smith
According to the Fort Smith family income data, there are 4,252 families falling into the $50,000 to $74,999 income range, which is the most common income bracket and makes up 18.6% of all families. Conversely, the $10,000 to $14,999 income bracket is the least frequent group with only 526 families (2.3%) belonging to this category.
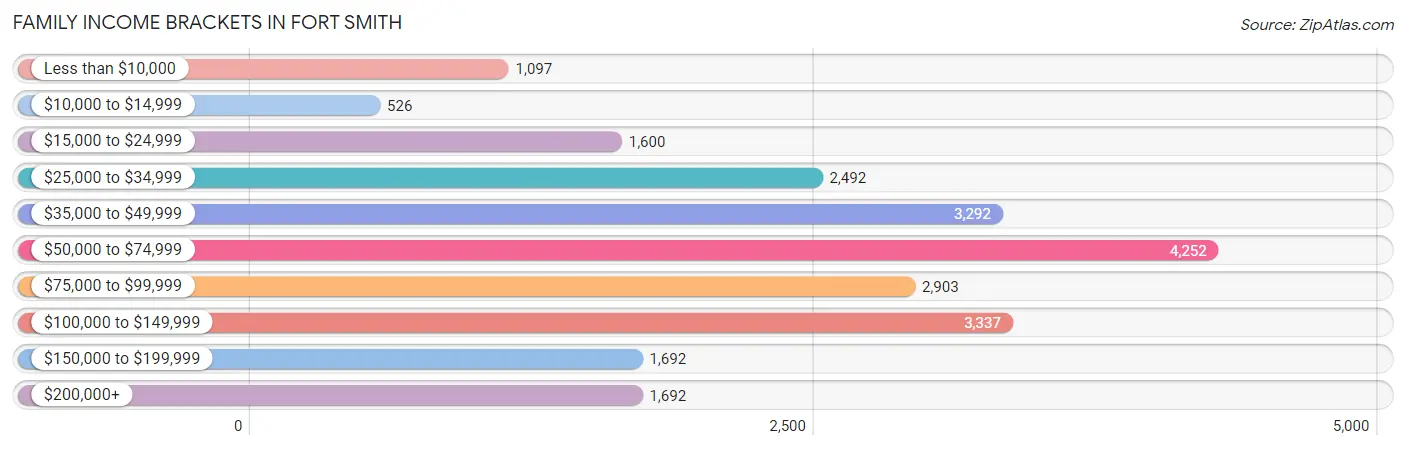
| Income Bracket | # Families | % Families |
| Less than $10,000 | 1,097 | 4.8% |
| $10,000 to $14,999 | 526 | 2.3% |
| $15,000 to $24,999 | 1,600 | 7.0% |
| $25,000 to $34,999 | 2,492 | 10.9% |
| $35,000 to $49,999 | 3,292 | 14.4% |
| $50,000 to $74,999 | 4,252 | 18.6% |
| $75,000 to $99,999 | 2,903 | 12.7% |
| $100,000 to $149,999 | 3,337 | 14.6% |
| $150,000 to $199,999 | 1,692 | 7.4% |
| $200,000+ | 1,692 | 7.4% |
Family Income by Famaliy Size in Fort Smith
7+ person families (280 | 1.2%) account for the highest median family income in Fort Smith with $112,727 per family, while 2-person families (10,723 | 46.9%) have the highest median income of $30,894 per family member.
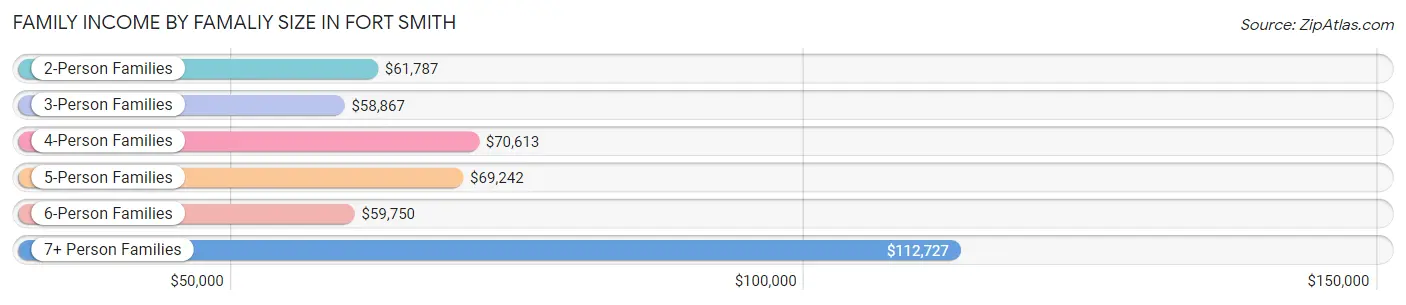
| Income Bracket | # Families | Median Income |
| 2-Person Families | 10,723 (46.9%) | $61,787 |
| 3-Person Families | 5,112 (22.4%) | $58,867 |
| 4-Person Families | 3,782 (16.5%) | $70,613 |
| 5-Person Families | 2,214 (9.7%) | $69,242 |
| 6-Person Families | 748 (3.3%) | $59,750 |
| 7+ Person Families | 280 (1.2%) | $112,727 |
| Total | 22,859 (100.0%) | $62,787 |
Family Income by Number of Earners in Fort Smith
The median family income in Fort Smith is $62,787, with families comprising 3+ earners (1,776) having the highest median family income of $113,636, while families with no earners (3,285) have the lowest median family income of $32,039, accounting for 7.8% and 14.4% of families, respectively.
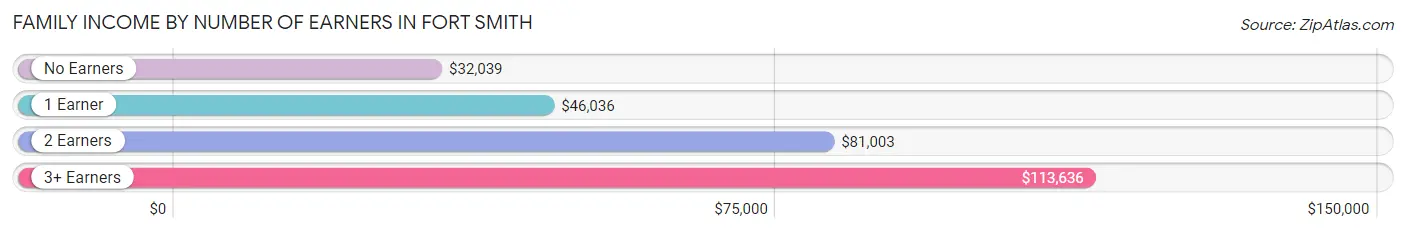
| Number of Earners | # Families | Median Income |
| No Earners | 3,285 (14.4%) | $32,039 |
| 1 Earner | 8,317 (36.4%) | $46,036 |
| 2 Earners | 9,481 (41.5%) | $81,003 |
| 3+ Earners | 1,776 (7.8%) | $113,636 |
| Total | 22,859 (100.0%) | $62,787 |
Household Income in Fort Smith
Household Income Brackets in Fort Smith
With 6,402 households falling in the category, the $50,000 to $74,999 income range is the most frequent in Fort Smith, accounting for 17.6% of all households. In contrast, only 1,819 households (5.0%) fall into the $200,000+ income bracket, making it the least populous group.
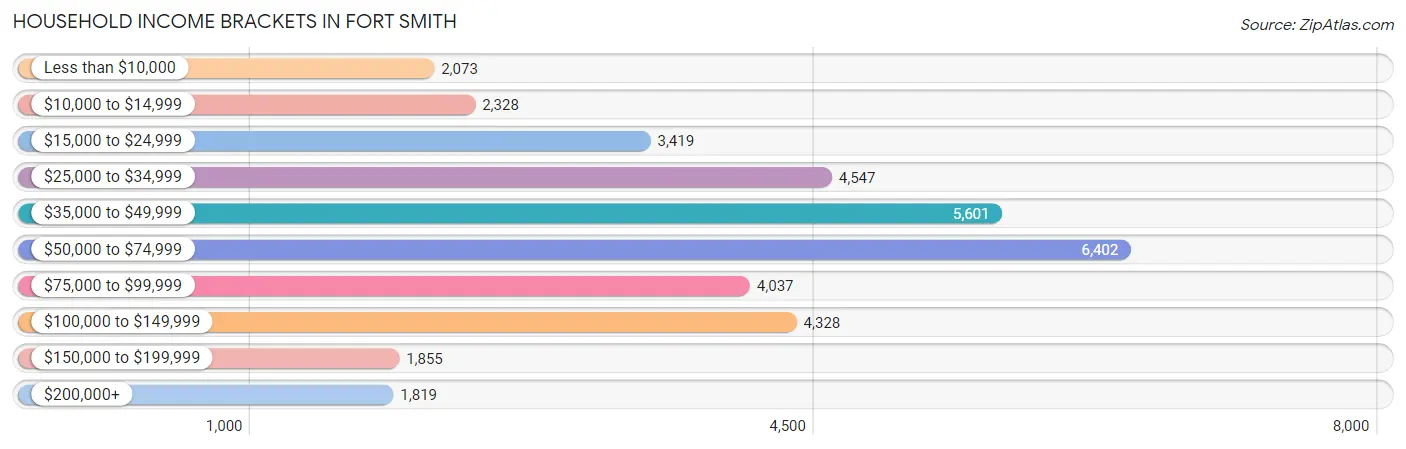
| Income Bracket | # Households | % Households |
| Less than $10,000 | 2,073 | 5.7% |
| $10,000 to $14,999 | 2,328 | 6.4% |
| $15,000 to $24,999 | 3,419 | 9.4% |
| $25,000 to $34,999 | 4,547 | 12.5% |
| $35,000 to $49,999 | 5,601 | 15.4% |
| $50,000 to $74,999 | 6,402 | 17.6% |
| $75,000 to $99,999 | 4,037 | 11.1% |
| $100,000 to $149,999 | 4,328 | 11.9% |
| $150,000 to $199,999 | 1,855 | 5.1% |
| $200,000+ | 1,819 | 5.0% |
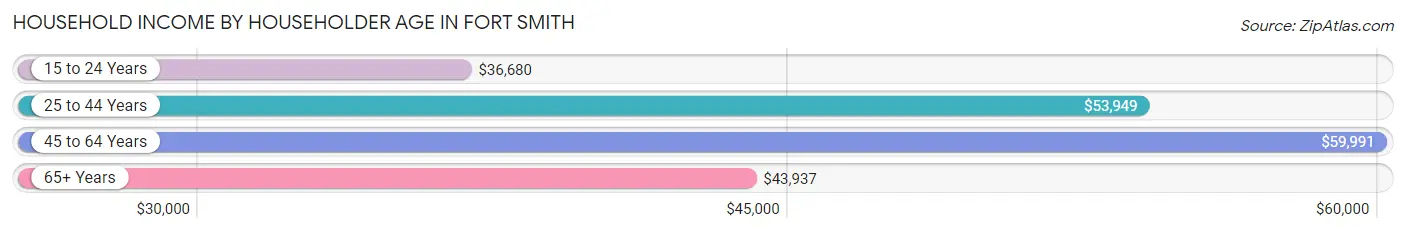
Household Income by Householder Age in Fort Smith
The median household income in Fort Smith is $50,799, with the highest median household income of $59,991 found in the 45 to 64 years age bracket for the primary householder. A total of 12,503 households (34.4%) fall into this category. Meanwhile, the 15 to 24 years age bracket for the primary householder has the lowest median household income of $36,680, with 2,543 households (7.0%) in this group.
| Income Bracket | # Households | Median Income |
| 15 to 24 Years | 2,543 (7.0%) | $36,680 |
| 25 to 44 Years | 12,388 (34.1%) | $53,949 |
| 45 to 64 Years | 12,503 (34.4%) | $59,991 |
| 65+ Years | 8,939 (24.6%) | $43,937 |
| Total | 36,373 (100.0%) | $50,799 |
Poverty in Fort Smith
Income Below Poverty by Sex and Age in Fort Smith
With 17.5% poverty level for males and 20.2% for females among the residents of Fort Smith, 12 to 14 year old males and 16 and 17 year old females are the most vulnerable to poverty, with 609 males (35.4%) and 444 females (31.4%) in their respective age groups living below the poverty level.
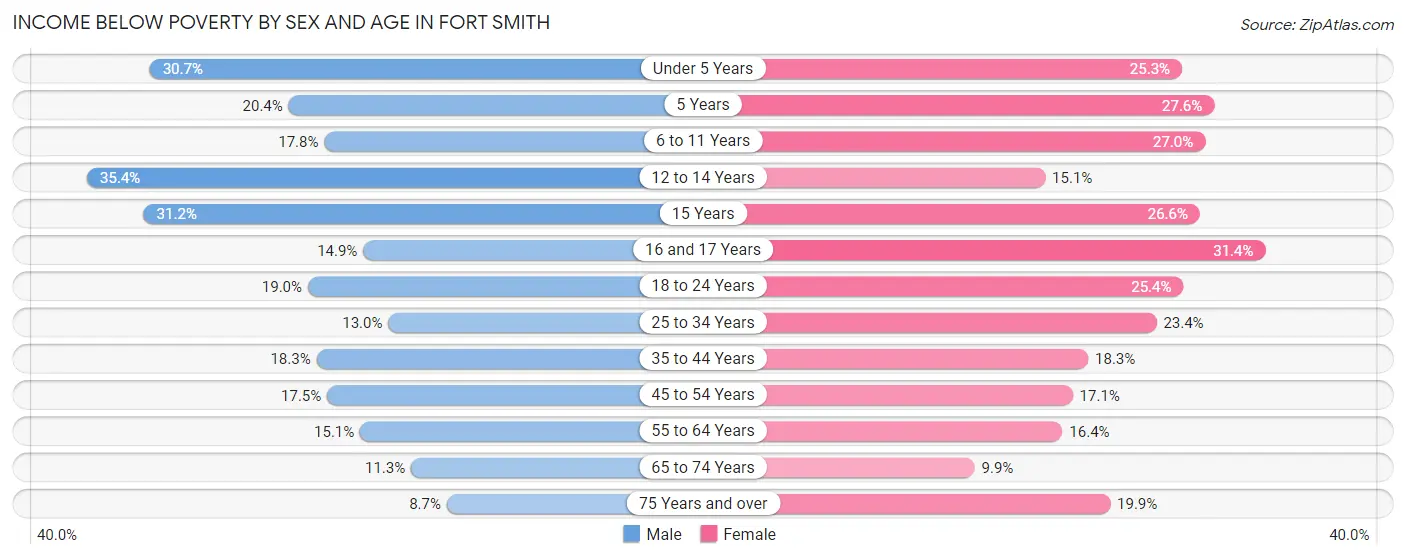
| Age Bracket | Male | Female |
| Under 5 Years | 867 (30.7%) | 728 (25.3%) |
| 5 Years | 111 (20.4%) | 183 (27.6%) |
| 6 to 11 Years | 700 (17.7%) | 905 (27.0%) |
| 12 to 14 Years | 609 (35.4%) | 224 (15.1%) |
| 15 Years | 148 (31.2%) | 122 (26.6%) |
| 16 and 17 Years | 175 (14.9%) | 444 (31.4%) |
| 18 to 24 Years | 827 (19.0%) | 1,004 (25.4%) |
| 25 to 34 Years | 827 (13.0%) | 1,541 (23.4%) |
| 35 to 44 Years | 996 (18.3%) | 1,049 (18.3%) |
| 45 to 54 Years | 841 (17.5%) | 834 (17.1%) |
| 55 to 64 Years | 865 (15.1%) | 933 (16.4%) |
| 65 to 74 Years | 438 (11.3%) | 424 (9.9%) |
| 75 Years and over | 171 (8.6%) | 611 (19.9%) |
| Total | 7,575 (17.5%) | 9,002 (20.2%) |
Income Above Poverty by Sex and Age in Fort Smith
According to the poverty statistics in Fort Smith, males aged 75 years and over and females aged 65 to 74 years are the age groups that are most secure financially, with 91.3% of males and 90.1% of females in these age groups living above the poverty line.
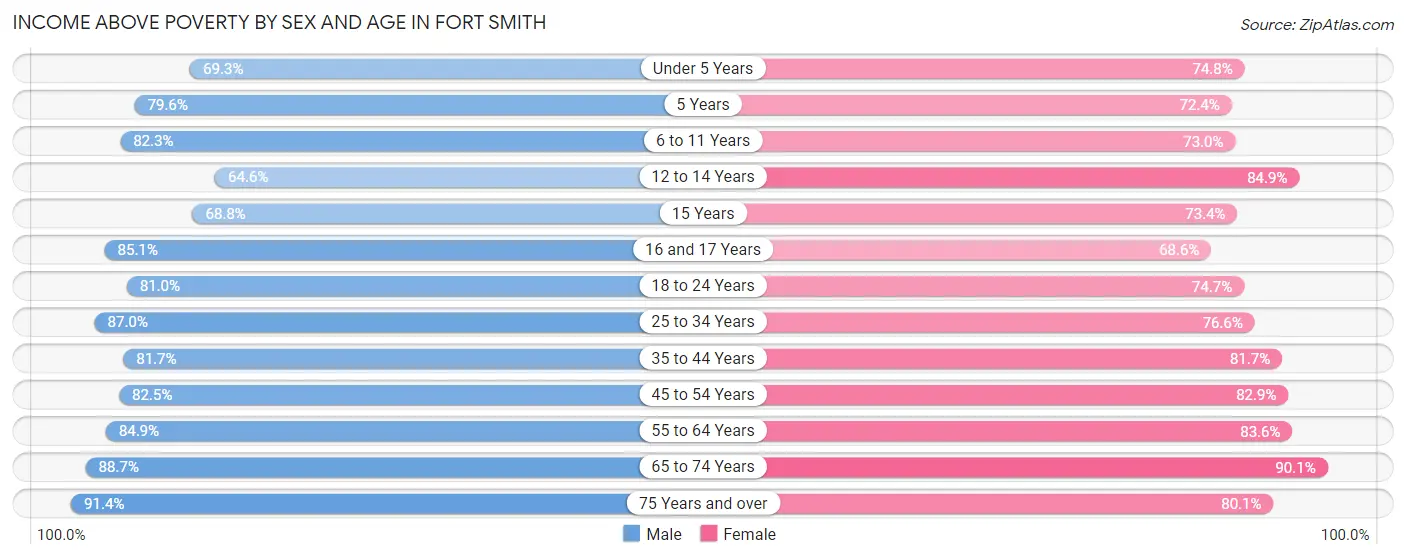
| Age Bracket | Male | Female |
| Under 5 Years | 1,956 (69.3%) | 2,155 (74.8%) |
| 5 Years | 433 (79.6%) | 479 (72.4%) |
| 6 to 11 Years | 3,244 (82.3%) | 2,451 (73.0%) |
| 12 to 14 Years | 1,113 (64.6%) | 1,259 (84.9%) |
| 15 Years | 327 (68.8%) | 337 (73.4%) |
| 16 and 17 Years | 1,003 (85.1%) | 968 (68.6%) |
| 18 to 24 Years | 3,532 (81.0%) | 2,956 (74.7%) |
| 25 to 34 Years | 5,535 (87.0%) | 5,056 (76.6%) |
| 35 to 44 Years | 4,437 (81.7%) | 4,685 (81.7%) |
| 45 to 54 Years | 3,953 (82.5%) | 4,033 (82.9%) |
| 55 to 64 Years | 4,867 (84.9%) | 4,762 (83.6%) |
| 65 to 74 Years | 3,436 (88.7%) | 3,875 (90.1%) |
| 75 Years and over | 1,805 (91.3%) | 2,457 (80.1%) |
| Total | 35,641 (82.5%) | 35,473 (79.8%) |
Income Below Poverty Among Married-Couple Families in Fort Smith
The poverty statistics for married-couple families in Fort Smith show that 7.0% or 1,038 of the total 14,946 families live below the poverty line. Families with 3 or 4 children have the highest poverty rate of 16.7%, comprising of 261 families. On the other hand, families with no children have the lowest poverty rate of 4.5%, which includes 379 families.
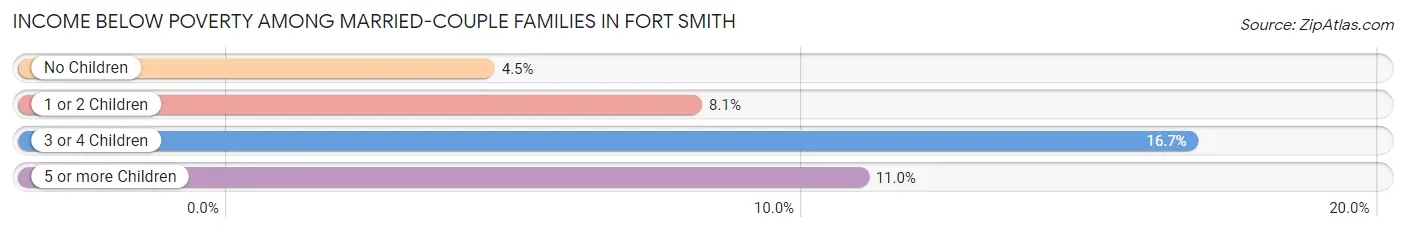
| Children | Above Poverty | Below Poverty |
| No Children | 8,109 (95.5%) | 379 (4.5%) |
| 1 or 2 Children | 4,426 (91.9%) | 389 (8.1%) |
| 3 or 4 Children | 1,300 (83.3%) | 261 (16.7%) |
| 5 or more Children | 73 (89.0%) | 9 (11.0%) |
| Total | 13,908 (93.0%) | 1,038 (7.0%) |
Income Below Poverty Among Single-Parent Households in Fort Smith
According to the poverty data in Fort Smith, 12.0% or 215 single-father households and 30.2% or 1,847 single-mother households are living below the poverty line. Among single-father households, those with 3 or 4 children have the highest poverty rate, with 31 households (25.4%) experiencing poverty. Likewise, among single-mother households, those with 5 or more children have the highest poverty rate, with 3 households (100.0%) falling below the poverty line.
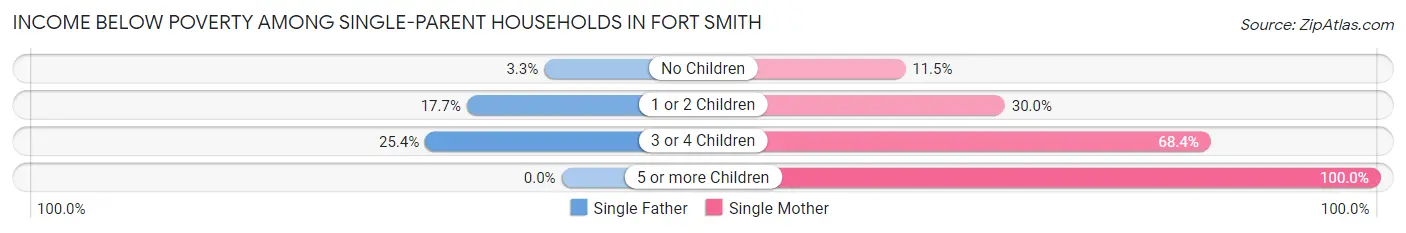
| Children | Single Father | Single Mother |
| No Children | 25 (3.3%) | 221 (11.5%) |
| 1 or 2 Children | 159 (17.6%) | 973 (30.0%) |
| 3 or 4 Children | 31 (25.4%) | 650 (68.3%) |
| 5 or more Children | 0 (0.0%) | 3 (100.0%) |
| Total | 215 (12.0%) | 1,847 (30.2%) |
Income Below Poverty Among Married-Couple vs Single-Parent Households in Fort Smith
The poverty data for Fort Smith shows that 1,038 of the married-couple family households (7.0%) and 2,062 of the single-parent households (26.1%) are living below the poverty level. Within the married-couple family households, those with 3 or 4 children have the highest poverty rate, with 261 households (16.7%) falling below the poverty line. Among the single-parent households, those with 5 or more children have the highest poverty rate, with 3 household (100.0%) living below poverty.
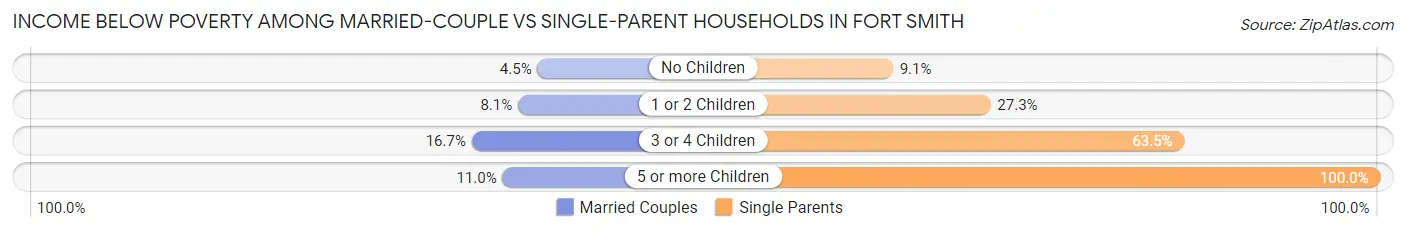
| Children | Married-Couple Families | Single-Parent Households |
| No Children | 379 (4.5%) | 246 (9.1%) |
| 1 or 2 Children | 389 (8.1%) | 1,132 (27.3%) |
| 3 or 4 Children | 261 (16.7%) | 681 (63.5%) |
| 5 or more Children | 9 (11.0%) | 3 (100.0%) |
| Total | 1,038 (7.0%) | 2,062 (26.1%) |
Race in Fort Smith
The most populous races in Fort Smith are White / Caucasian (55,982 | 62.7%), Hispanic or Latino (17,521 | 19.6%), and Some other Race (11,395 | 12.8%).
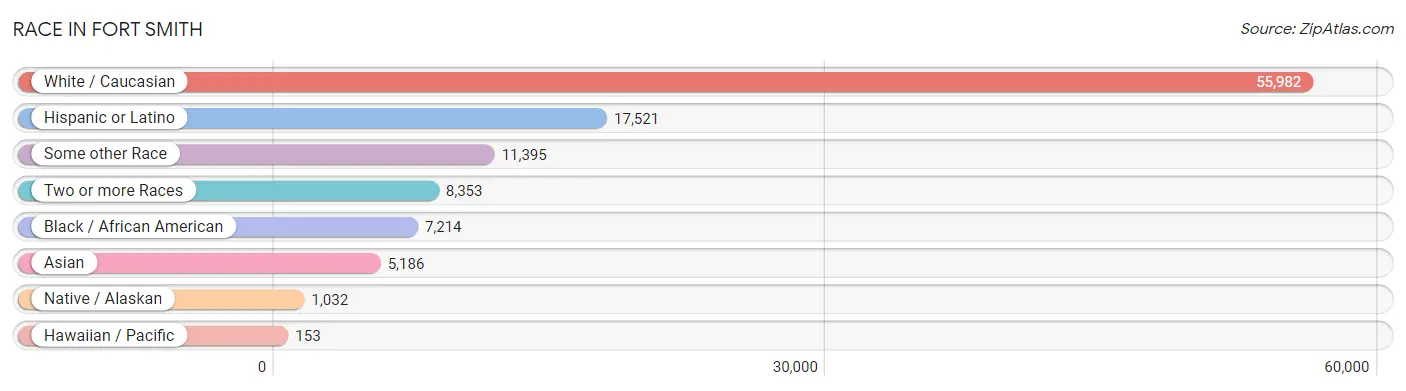
| Race | # Population | % Population |
| Asian | 5,186 | 5.8% |
| Black / African American | 7,214 | 8.1% |
| Hawaiian / Pacific | 153 | 0.2% |
| Hispanic or Latino | 17,521 | 19.6% |
| Native / Alaskan | 1,032 | 1.2% |
| White / Caucasian | 55,982 | 62.7% |
| Two or more Races | 8,353 | 9.3% |
| Some other Race | 11,395 | 12.8% |
| Total | 89,315 | 100.0% |
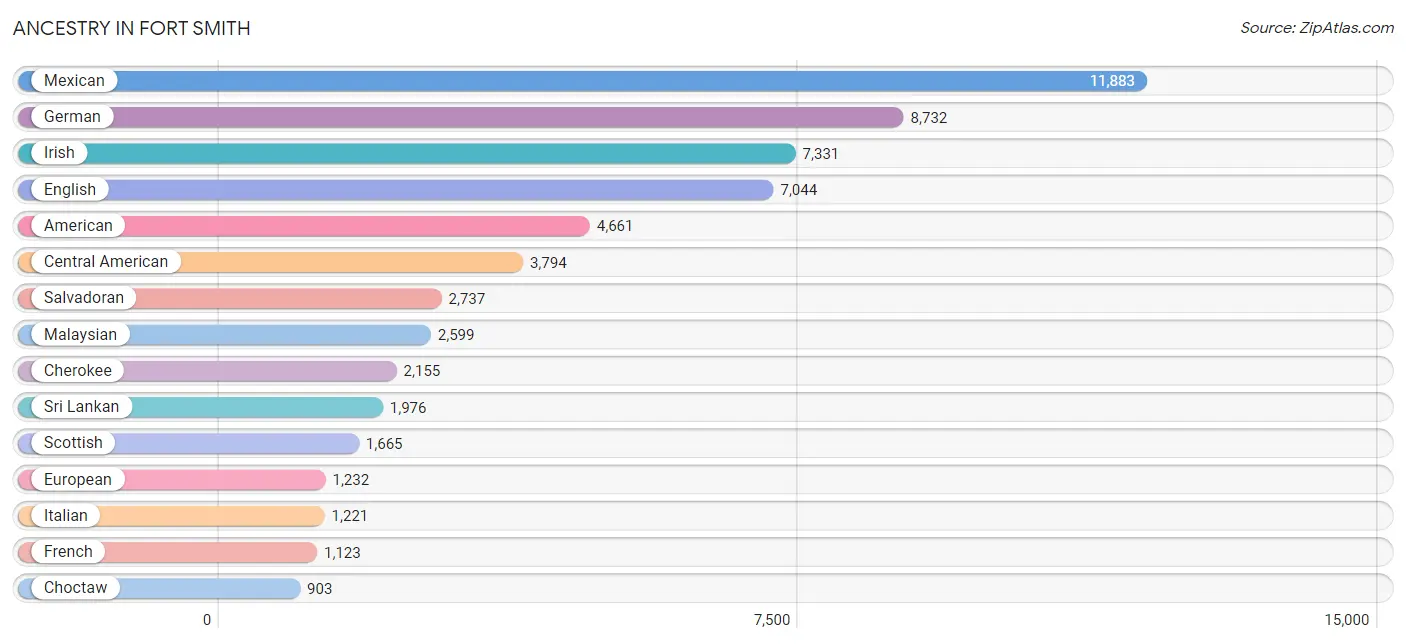
Ancestry in Fort Smith
The most populous ancestries reported in Fort Smith are Mexican (11,883 | 13.3%), German (8,732 | 9.8%), Irish (7,331 | 8.2%), English (7,044 | 7.9%), and American (4,661 | 5.2%), together accounting for 44.4% of all Fort Smith residents.
| Ancestry | # Population | % Population |
| African | 144 | 0.2% |
| Alaska Native | 12 | 0.0% |
| Albanian | 5 | 0.0% |
| American | 4,661 | 5.2% |
| Apache | 35 | 0.0% |
| Arab | 109 | 0.1% |
| Arapaho | 2 | 0.0% |
| Austrian | 37 | 0.0% |
| Bangladeshi | 209 | 0.2% |
| Belizean | 70 | 0.1% |
| Bhutanese | 144 | 0.2% |
| Blackfeet | 117 | 0.1% |
| Brazilian | 59 | 0.1% |
| British | 792 | 0.9% |
| Burmese | 148 | 0.2% |
| Cajun | 24 | 0.0% |
| Canadian | 89 | 0.1% |
| Celtic | 29 | 0.0% |
| Central American | 3,794 | 4.3% |
| Central American Indian | 13 | 0.0% |
| Cherokee | 2,155 | 2.4% |
| Cheyenne | 15 | 0.0% |
| Chickasaw | 33 | 0.0% |
| Choctaw | 903 | 1.0% |
| Colombian | 34 | 0.0% |
| Comanche | 5 | 0.0% |
| Costa Rican | 270 | 0.3% |
| Creek | 47 | 0.1% |
| Cuban | 108 | 0.1% |
| Czech | 38 | 0.0% |
| Danish | 46 | 0.1% |
| Delaware | 8 | 0.0% |
| Dominican | 73 | 0.1% |
| Dutch | 798 | 0.9% |
| Dutch West Indian | 75 | 0.1% |
| Eastern European | 305 | 0.3% |
| Ecuadorian | 21 | 0.0% |
| English | 7,044 | 7.9% |
| European | 1,232 | 1.4% |
| Fijian | 142 | 0.2% |
| French | 1,123 | 1.3% |
| French Canadian | 180 | 0.2% |
| German | 8,732 | 9.8% |
| Greek | 49 | 0.1% |
| Guatemalan | 513 | 0.6% |
| Honduran | 269 | 0.3% |
| Houma | 15 | 0.0% |
| Hungarian | 316 | 0.4% |
| Indian (Asian) | 262 | 0.3% |
| Irish | 7,331 | 8.2% |
| Iroquois | 7 | 0.0% |
| Israeli | 34 | 0.0% |
| Italian | 1,221 | 1.4% |
| Jordanian | 11 | 0.0% |
| Korean | 461 | 0.5% |
| Laotian | 25 | 0.0% |
| Lebanese | 25 | 0.0% |
| Malaysian | 2,599 | 2.9% |
| Mexican | 11,883 | 13.3% |
| Mexican American Indian | 85 | 0.1% |
| Native Hawaiian | 21 | 0.0% |
| Northern European | 44 | 0.1% |
| Norwegian | 282 | 0.3% |
| Osage | 10 | 0.0% |
| Ottawa | 18 | 0.0% |
| Paiute | 31 | 0.0% |
| Pakistani | 145 | 0.2% |
| Palestinian | 28 | 0.0% |
| Panamanian | 5 | 0.0% |
| Pennsylvania German | 101 | 0.1% |
| Polish | 408 | 0.5% |
| Portuguese | 8 | 0.0% |
| Pueblo | 10 | 0.0% |
| Puerto Rican | 402 | 0.4% |
| Russian | 80 | 0.1% |
| Salvadoran | 2,737 | 3.1% |
| Scandinavian | 188 | 0.2% |
| Scotch-Irish | 618 | 0.7% |
| Scottish | 1,665 | 1.9% |
| Seminole | 85 | 0.1% |
| Serbian | 6 | 0.0% |
| Sioux | 50 | 0.1% |
| Slavic | 10 | 0.0% |
| Slovak | 13 | 0.0% |
| South African | 124 | 0.1% |
| South American | 68 | 0.1% |
| Spaniard | 358 | 0.4% |
| Spanish | 87 | 0.1% |
| Sri Lankan | 1,976 | 2.2% |
| Subsaharan African | 271 | 0.3% |
| Swedish | 755 | 0.9% |
| Swiss | 93 | 0.1% |
| Thai | 145 | 0.2% |
| Tlingit-Haida | 5 | 0.0% |
| Venezuelan | 13 | 0.0% |
| Welsh | 669 | 0.7% | View All 96 Rows |
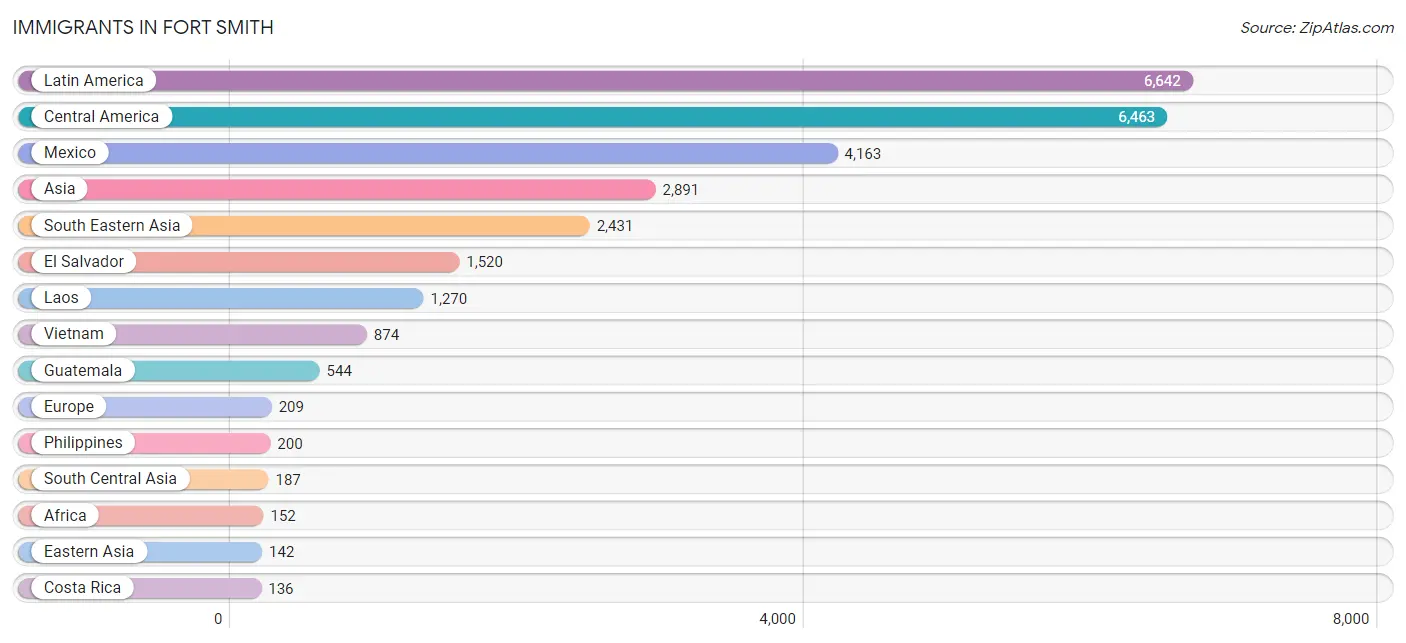
Immigrants in Fort Smith
The most numerous immigrant groups reported in Fort Smith came from Latin America (6,642 | 7.4%), Central America (6,463 | 7.2%), Mexico (4,163 | 4.7%), Asia (2,891 | 3.2%), and South Eastern Asia (2,431 | 2.7%), together accounting for 25.3% of all Fort Smith residents.
| Immigration Origin | # Population | % Population |
| Africa | 152 | 0.2% |
| Asia | 2,891 | 3.2% |
| Australia | 14 | 0.0% |
| Brazil | 64 | 0.1% |
| Canada | 78 | 0.1% |
| Caribbean | 81 | 0.1% |
| Central America | 6,463 | 7.2% |
| China | 68 | 0.1% |
| Costa Rica | 136 | 0.2% |
| Cuba | 58 | 0.1% |
| Dominican Republic | 23 | 0.0% |
| Eastern Africa | 8 | 0.0% |
| Eastern Asia | 142 | 0.2% |
| Eastern Europe | 65 | 0.1% |
| Ecuador | 21 | 0.0% |
| El Salvador | 1,520 | 1.7% |
| England | 11 | 0.0% |
| Europe | 209 | 0.2% |
| France | 10 | 0.0% |
| Germany | 32 | 0.0% |
| Guatemala | 544 | 0.6% |
| Honduras | 95 | 0.1% |
| Hungary | 15 | 0.0% |
| India | 130 | 0.2% |
| Italy | 9 | 0.0% |
| Japan | 32 | 0.0% |
| Jordan | 66 | 0.1% |
| Korea | 42 | 0.1% |
| Laos | 1,270 | 1.4% |
| Latin America | 6,642 | 7.4% |
| Mexico | 4,163 | 4.7% |
| Netherlands | 25 | 0.0% |
| Northern Africa | 20 | 0.0% |
| Northern Europe | 32 | 0.0% |
| Oceania | 127 | 0.1% |
| Pakistan | 57 | 0.1% |
| Panama | 5 | 0.0% |
| Philippines | 200 | 0.2% |
| Poland | 34 | 0.0% |
| Russia | 11 | 0.0% |
| Saudi Arabia | 65 | 0.1% |
| Scotland | 5 | 0.0% |
| South Africa | 124 | 0.1% |
| South America | 98 | 0.1% |
| South Central Asia | 187 | 0.2% |
| South Eastern Asia | 2,431 | 2.7% |
| Southern Europe | 39 | 0.0% |
| Spain | 30 | 0.0% |
| Sweden | 11 | 0.0% |
| Thailand | 87 | 0.1% |
| Venezuela | 13 | 0.0% |
| Vietnam | 874 | 1.0% |
| Western Asia | 131 | 0.2% |
| Western Europe | 67 | 0.1% | View All 54 Rows |
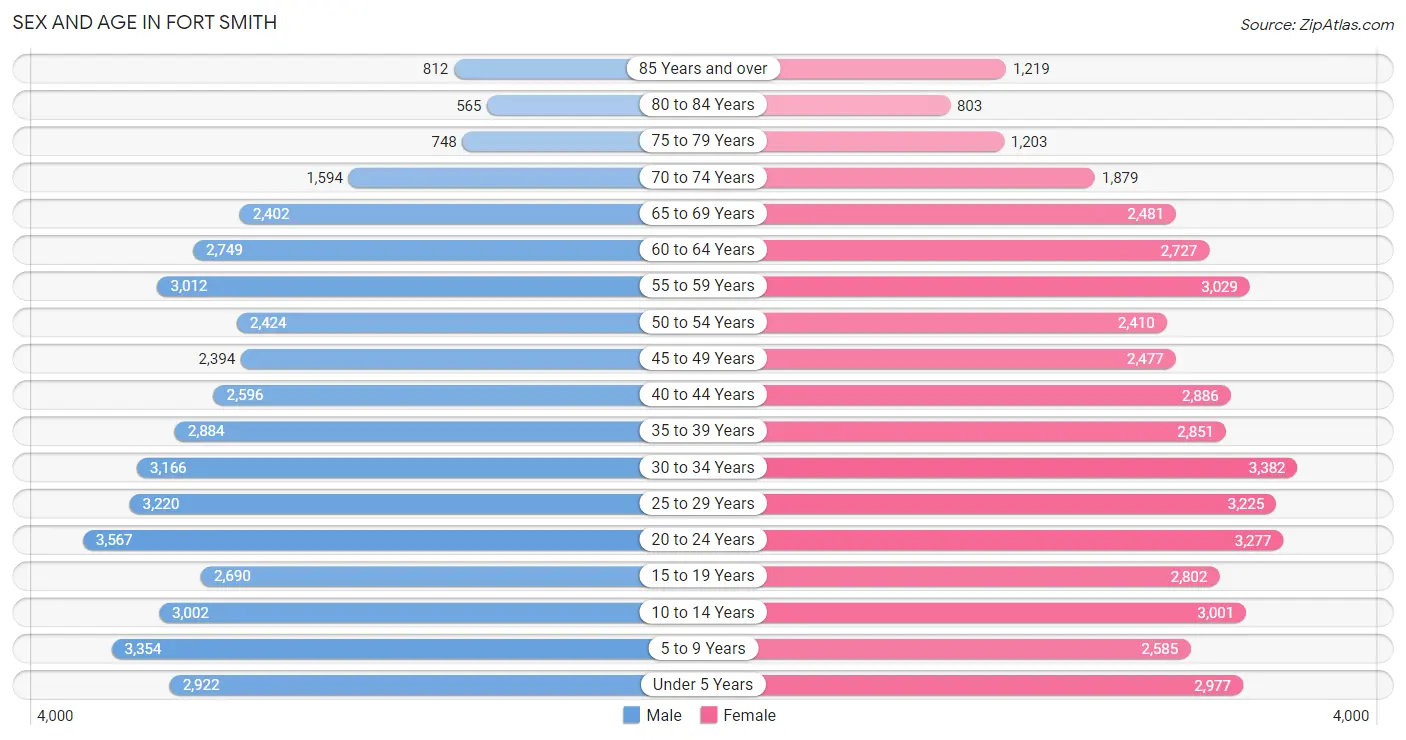
Sex and Age in Fort Smith
Sex and Age in Fort Smith
The most populous age groups in Fort Smith are 20 to 24 Years (3,567 | 8.1%) for men and 30 to 34 Years (3,382 | 7.5%) for women.
| Age Bracket | Male | Female |
| Under 5 Years | 2,922 (6.6%) | 2,977 (6.6%) |
| 5 to 9 Years | 3,354 (7.6%) | 2,585 (5.7%) |
| 10 to 14 Years | 3,002 (6.8%) | 3,001 (6.6%) |
| 15 to 19 Years | 2,690 (6.1%) | 2,802 (6.2%) |
| 20 to 24 Years | 3,567 (8.1%) | 3,277 (7.2%) |
| 25 to 29 Years | 3,220 (7.3%) | 3,225 (7.1%) |
| 30 to 34 Years | 3,166 (7.2%) | 3,382 (7.5%) |
| 35 to 39 Years | 2,884 (6.5%) | 2,851 (6.3%) |
| 40 to 44 Years | 2,596 (5.9%) | 2,886 (6.4%) |
| 45 to 49 Years | 2,394 (5.4%) | 2,477 (5.5%) |
| 50 to 54 Years | 2,424 (5.5%) | 2,410 (5.3%) |
| 55 to 59 Years | 3,012 (6.8%) | 3,029 (6.7%) |
| 60 to 64 Years | 2,749 (6.2%) | 2,727 (6.0%) |
| 65 to 69 Years | 2,402 (5.4%) | 2,481 (5.5%) |
| 70 to 74 Years | 1,594 (3.6%) | 1,879 (4.2%) |
| 75 to 79 Years | 748 (1.7%) | 1,203 (2.7%) |
| 80 to 84 Years | 565 (1.3%) | 803 (1.8%) |
| 85 Years and over | 812 (1.8%) | 1,219 (2.7%) |
| Total | 44,101 (100.0%) | 45,214 (100.0%) |
Families and Households in Fort Smith
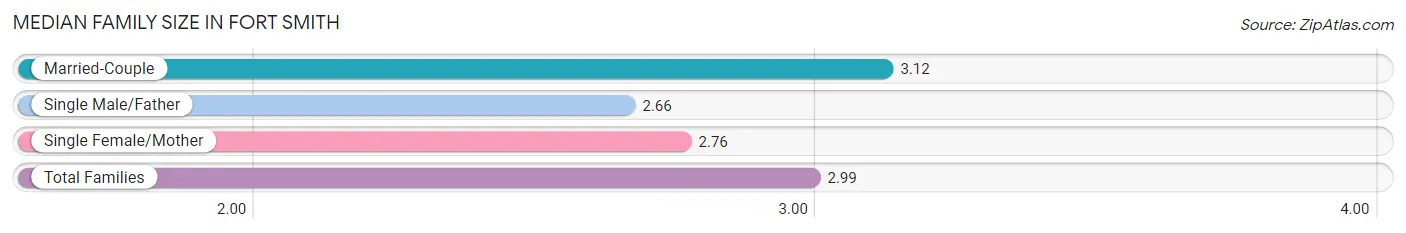
Median Family Size in Fort Smith
The median family size in Fort Smith is 2.99 persons per family, with married-couple families (14,946 | 65.4%) accounting for the largest median family size of 3.12 persons per family. On the other hand, single male/father families (1,793 | 7.8%) represent the smallest median family size with 2.66 persons per family.
| Family Type | # Families | Family Size |
| Married-Couple | 14,946 (65.4%) | 3.12 |
| Single Male/Father | 1,793 (7.8%) | 2.66 |
| Single Female/Mother | 6,120 (26.8%) | 2.76 |
| Total Families | 22,859 (100.0%) | 2.99 |
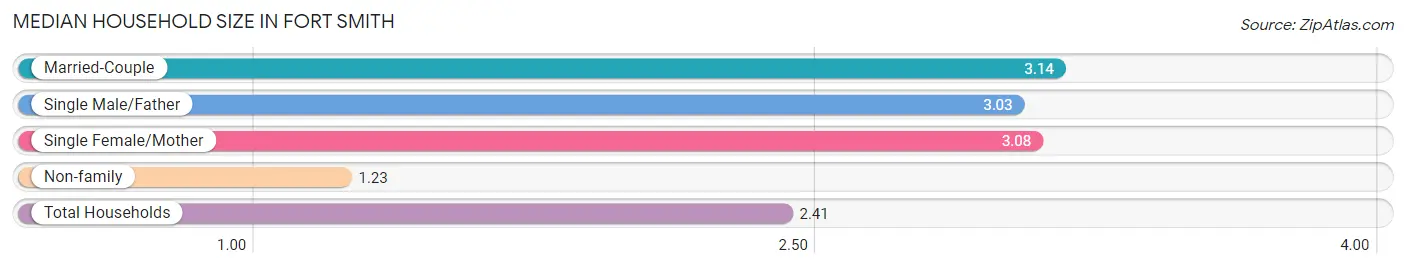
Median Household Size in Fort Smith
The median household size in Fort Smith is 2.41 persons per household, with married-couple households (14,946 | 41.1%) accounting for the largest median household size of 3.14 persons per household. non-family households (13,514 | 37.1%) represent the smallest median household size with 1.23 persons per household.
| Household Type | # Households | Household Size |
| Married-Couple | 14,946 (41.1%) | 3.14 |
| Single Male/Father | 1,793 (4.9%) | 3.03 |
| Single Female/Mother | 6,120 (16.8%) | 3.08 |
| Non-family | 13,514 (37.1%) | 1.23 |
| Total Households | 36,373 (100.0%) | 2.41 |
Household Size by Marriage Status in Fort Smith
Out of a total of 36,373 households in Fort Smith, 22,859 (62.8%) are family households, while 13,514 (37.1%) are nonfamily households. The most numerous type of family households are 2-person households, comprising 9,765, and the most common type of nonfamily households are 1-person households, comprising 10,996.
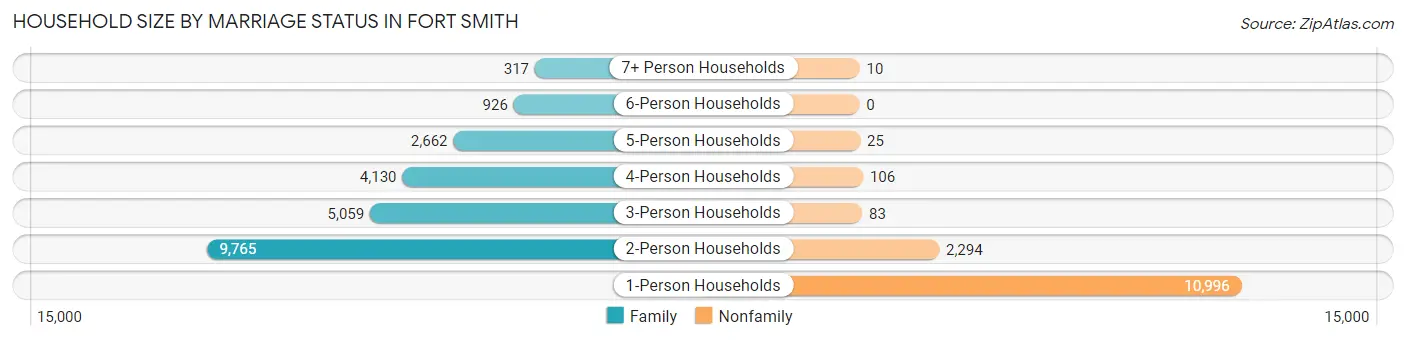
| Household Size | Family Households | Nonfamily Households |
| 1-Person Households | - | 10,996 (30.2%) |
| 2-Person Households | 9,765 (26.9%) | 2,294 (6.3%) |
| 3-Person Households | 5,059 (13.9%) | 83 (0.2%) |
| 4-Person Households | 4,130 (11.4%) | 106 (0.3%) |
| 5-Person Households | 2,662 (7.3%) | 25 (0.1%) |
| 6-Person Households | 926 (2.5%) | 0 (0.0%) |
| 7+ Person Households | 317 (0.9%) | 10 (0.0%) |
| Total | 22,859 (62.8%) | 13,514 (37.1%) |
Female Fertility in Fort Smith
Fertility by Age in Fort Smith
Average fertility rate in Fort Smith is 73.0 births per 1,000 women. Women in the age bracket of 20 to 34 years have the highest fertility rate with 131.0 births per 1,000 women. Women in the age bracket of 20 to 34 years acount for 82.9% of all women with births.
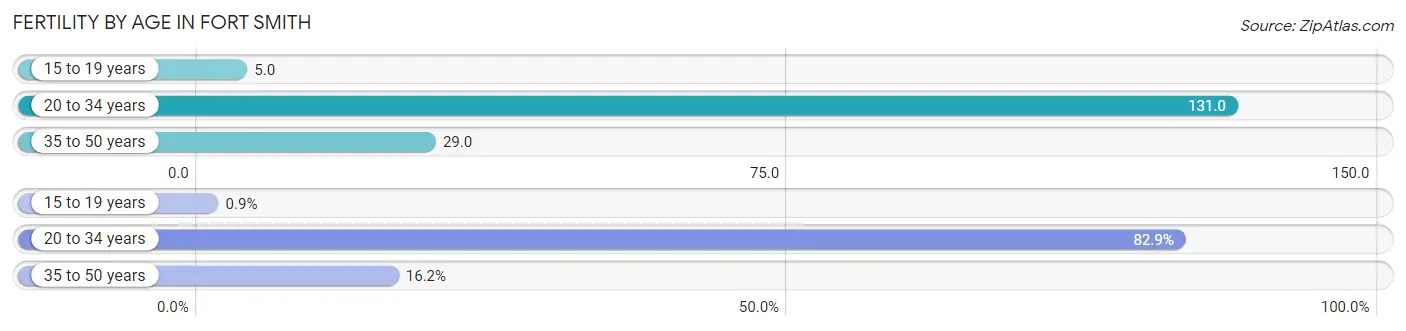
| Age Bracket | Women with Births | Births / 1,000 Women |
| 15 to 19 years | 14 (0.9%) | 5.0 |
| 20 to 34 years | 1,296 (82.9%) | 131.0 |
| 35 to 50 years | 253 (16.2%) | 29.0 |
| Total | 1,563 (100.0%) | 73.0 |
Fertility by Age by Marriage Status in Fort Smith
49.1% of women with births (1,563) in Fort Smith are married. The highest percentage of unmarried women with births falls into 15 to 19 years age bracket with 100.0% of them unmarried at the time of birth, while the lowest percentage of unmarried women with births belong to 20 to 34 years age bracket with 47.8% of them unmarried.
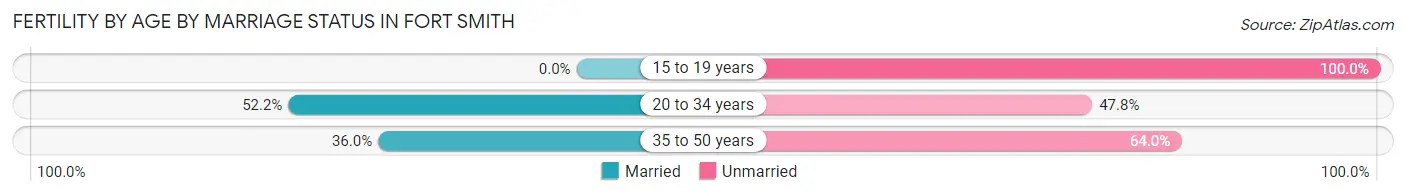
| Age Bracket | Married | Unmarried |
| 15 to 19 years | 0 (0.0%) | 14 (100.0%) |
| 20 to 34 years | 677 (52.2%) | 619 (47.8%) |
| 35 to 50 years | 91 (36.0%) | 162 (64.0%) |
| Total | 767 (49.1%) | 796 (50.9%) |
Fertility by Education in Fort Smith
Average fertility rate in Fort Smith is 73.0 births per 1,000 women. Women with the education attainment of high school diploma have the highest fertility rate of 133.0 births per 1,000 women, while women with the education attainment of less than high school have the lowest fertility at 17.0 births per 1,000 women. Women with the education attainment of high school diploma represent 54.4% of all women with births.
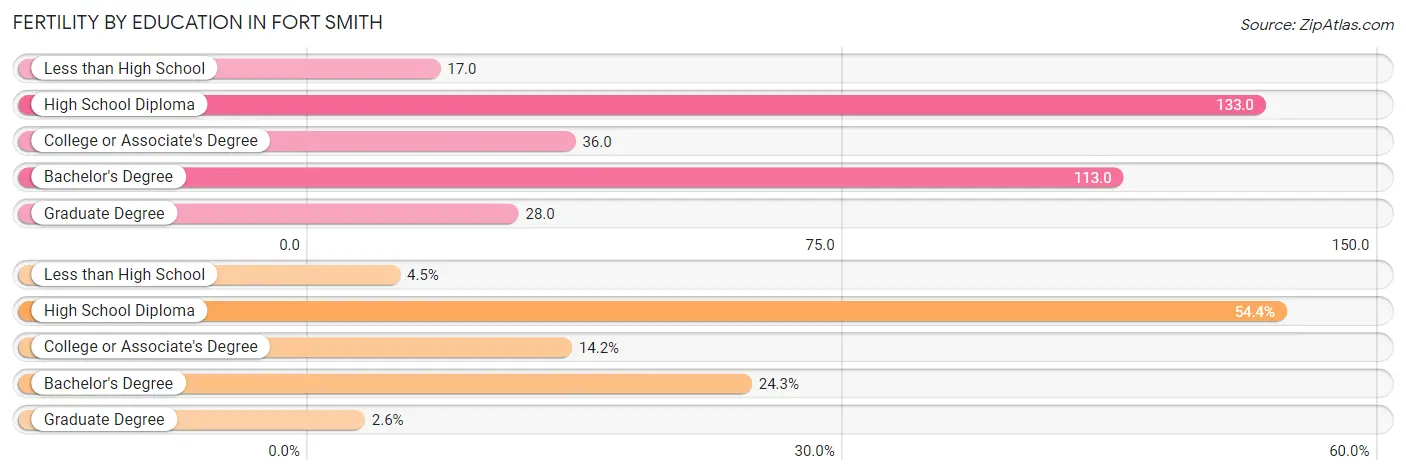
| Educational Attainment | Women with Births | Births / 1,000 Women |
| Less than High School | 71 (4.5%) | 17.0 |
| High School Diploma | 850 (54.4%) | 133.0 |
| College or Associate's Degree | 222 (14.2%) | 36.0 |
| Bachelor's Degree | 380 (24.3%) | 113.0 |
| Graduate Degree | 40 (2.6%) | 28.0 |
| Total | 1,563 (100.0%) | 73.0 |
Fertility by Education by Marriage Status in Fort Smith
50.9% of women with births in Fort Smith are unmarried. Women with the educational attainment of bachelor's degree are most likely to be married with 90.0% of them married at childbirth, while women with the educational attainment of high school diploma are least likely to be married with 83.5% of them unmarried at childbirth.
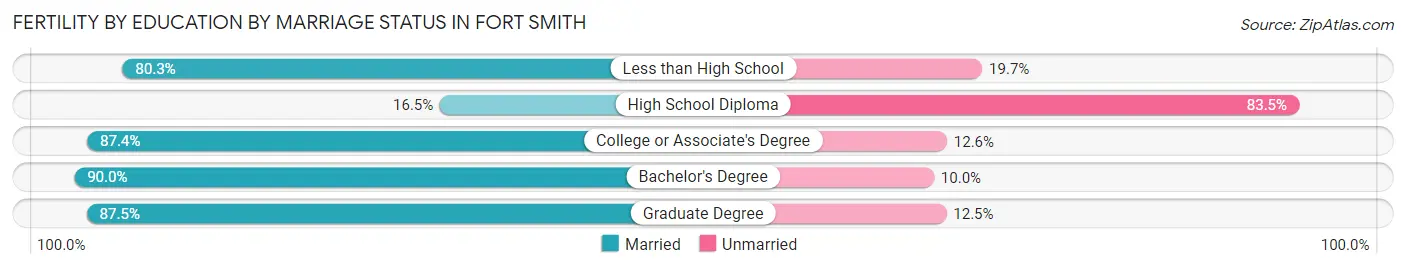
| Educational Attainment | Married | Unmarried |
| Less than High School | 57 (80.3%) | 14 (19.7%) |
| High School Diploma | 140 (16.5%) | 710 (83.5%) |
| College or Associate's Degree | 194 (87.4%) | 28 (12.6%) |
| Bachelor's Degree | 342 (90.0%) | 38 (10.0%) |
| Graduate Degree | 35 (87.5%) | 5 (12.5%) |
| Total | 767 (49.1%) | 796 (50.9%) |
Employment Characteristics in Fort Smith
Employment by Class of Employer in Fort Smith
Among the 39,940 employed individuals in Fort Smith, private company employees (28,351 | 71.0%), not-for-profit organizations (3,267 | 8.2%), and self-employed (incorporated) (1,968 | 4.9%) make up the most common classes of employment.
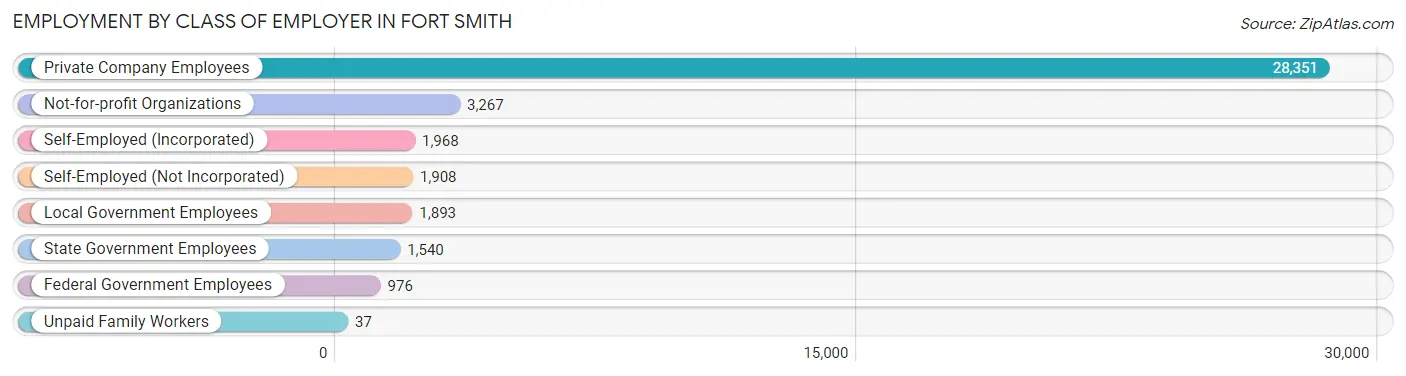
| Employer Class | # Employees | % Employees |
| Private Company Employees | 28,351 | 71.0% |
| Self-Employed (Incorporated) | 1,968 | 4.9% |
| Self-Employed (Not Incorporated) | 1,908 | 4.8% |
| Not-for-profit Organizations | 3,267 | 8.2% |
| Local Government Employees | 1,893 | 4.7% |
| State Government Employees | 1,540 | 3.9% |
| Federal Government Employees | 976 | 2.4% |
| Unpaid Family Workers | 37 | 0.1% |
| Total | 39,940 | 100.0% |
Employment Status by Age in Fort Smith
According to the labor force statistics for Fort Smith, out of the total population over 16 years of age (70,525), 61.4% or 43,302 individuals are in the labor force, with 6.1% or 2,641 of them unemployed. The age group with the highest labor force participation rate is 20 to 24 years, with 85.7% or 5,865 individuals in the labor force. Within the labor force, the 16 to 19 years age range has the highest percentage of unemployed individuals, with 28.2% or 455 of them being unemployed.
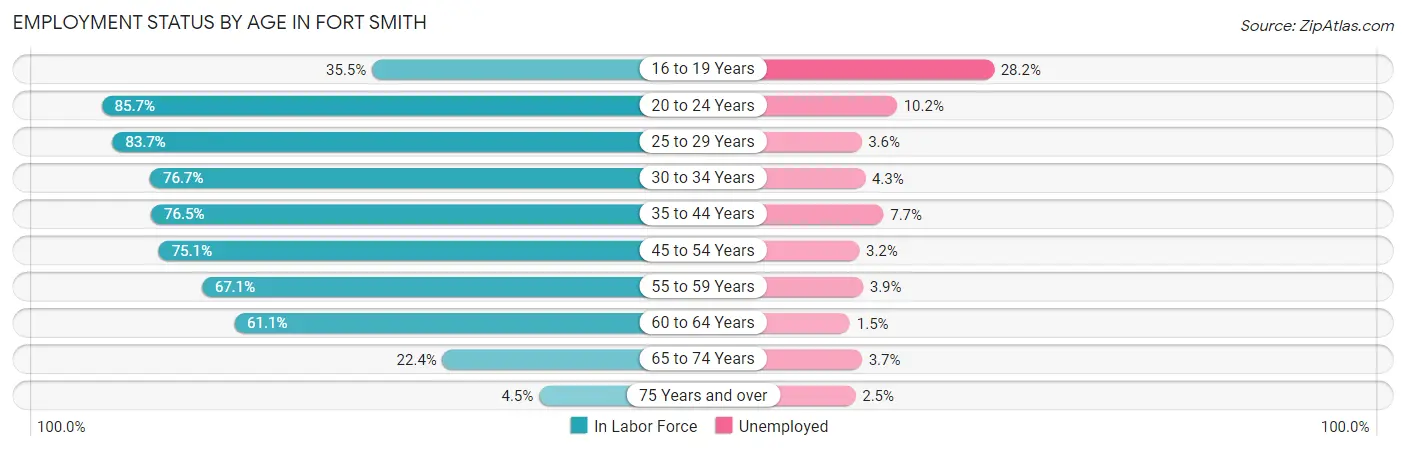
| Age Bracket | In Labor Force | Unemployed |
| 16 to 19 Years | 1,613 (35.5%) | 455 (28.2%) |
| 20 to 24 Years | 5,865 (85.7%) | 598 (10.2%) |
| 25 to 29 Years | 5,394 (83.7%) | 194 (3.6%) |
| 30 to 34 Years | 5,022 (76.7%) | 216 (4.3%) |
| 35 to 44 Years | 8,581 (76.5%) | 661 (7.7%) |
| 45 to 54 Years | 7,288 (75.1%) | 233 (3.2%) |
| 55 to 59 Years | 4,054 (67.1%) | 158 (3.9%) |
| 60 to 64 Years | 3,346 (61.1%) | 50 (1.5%) |
| 65 to 74 Years | 1,872 (22.4%) | 69 (3.7%) |
| 75 Years and over | 241 (4.5%) | 6 (2.5%) |
| Total | 43,302 (61.4%) | 2,641 (6.1%) |
Employment Status by Educational Attainment in Fort Smith
According to labor force statistics for Fort Smith, 74.2% of individuals (33,711) out of the total population between 25 and 64 years of age (45,432) are in the labor force, with 4.5% or 1,517 of them being unemployed. The group with the highest labor force participation rate are those with the educational attainment of bachelor's degree or higher, with 84.4% or 9,360 individuals in the labor force. Within the labor force, individuals with less than high school education have the highest percentage of unemployment, with 9.5% or 448 of them being unemployed.
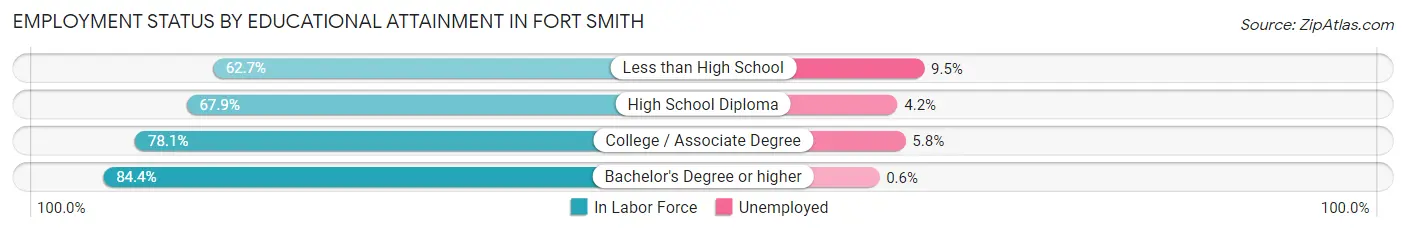
| Educational Attainment | In Labor Force | Unemployed |
| Less than High School | 4,714 (62.7%) | 714 (9.5%) |
| High School Diploma | 8,809 (67.9%) | 545 (4.2%) |
| College / Associate Degree | 10,817 (78.1%) | 803 (5.8%) |
| Bachelor's Degree or higher | 9,360 (84.4%) | 67 (0.6%) |
| Total | 33,711 (74.2%) | 2,044 (4.5%) |
Employment Occupations by Sex in Fort Smith
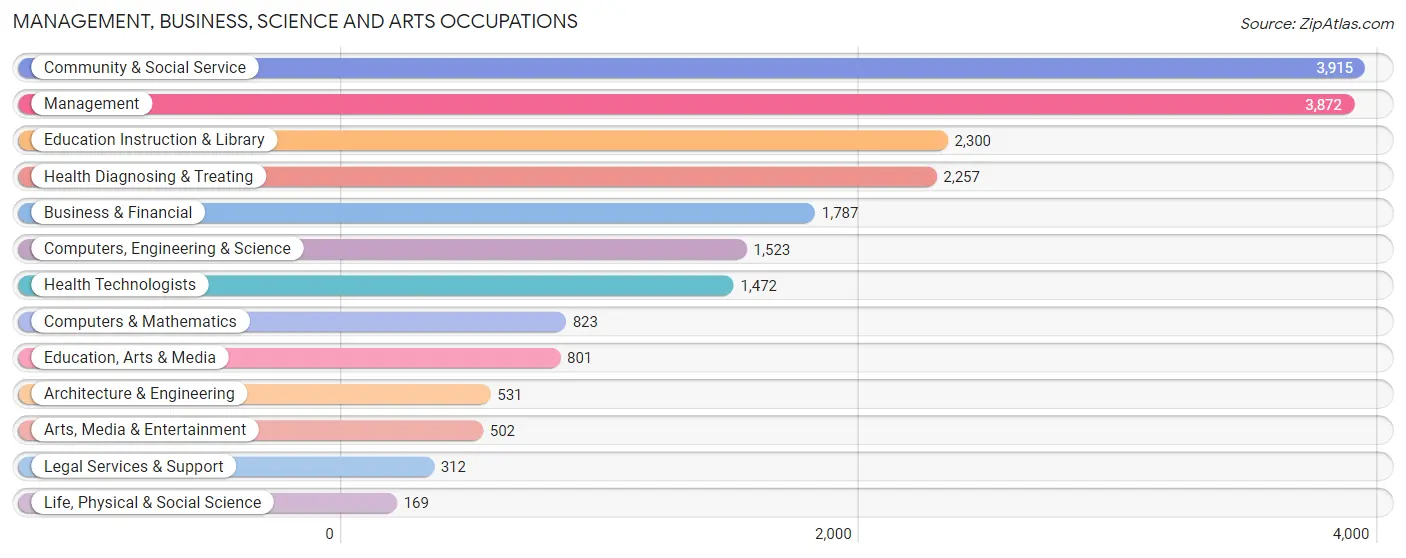
Management, Business, Science and Arts Occupations
The most common Management, Business, Science and Arts occupations in Fort Smith are Community & Social Service (3,915 | 9.7%), Management (3,872 | 9.6%), Education Instruction & Library (2,300 | 5.7%), Health Diagnosing & Treating (2,257 | 5.6%), and Business & Financial (1,787 | 4.4%).
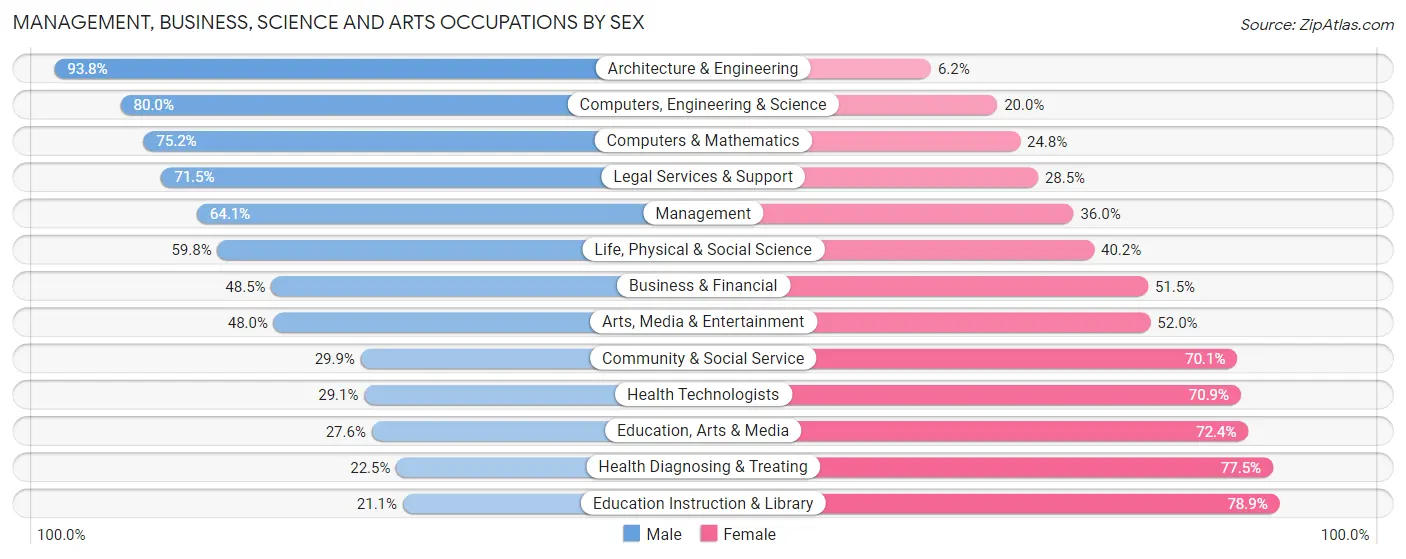
Management, Business, Science and Arts Occupations by Sex
Within the Management, Business, Science and Arts occupations in Fort Smith, the most male-oriented occupations are Architecture & Engineering (93.8%), Computers, Engineering & Science (80.0%), and Computers & Mathematics (75.2%), while the most female-oriented occupations are Education Instruction & Library (78.9%), Health Diagnosing & Treating (77.5%), and Education, Arts & Media (72.4%).
| Occupation | Male | Female |
| Management | 2,480 (64.0%) | 1,392 (35.9%) |
| Business & Financial | 867 (48.5%) | 920 (51.5%) |
| Computers, Engineering & Science | 1,218 (80.0%) | 305 (20.0%) |
| Computers & Mathematics | 619 (75.2%) | 204 (24.8%) |
| Architecture & Engineering | 498 (93.8%) | 33 (6.2%) |
| Life, Physical & Social Science | 101 (59.8%) | 68 (40.2%) |
| Community & Social Service | 1,170 (29.9%) | 2,745 (70.1%) |
| Education, Arts & Media | 221 (27.6%) | 580 (72.4%) |
| Legal Services & Support | 223 (71.5%) | 89 (28.5%) |
| Education Instruction & Library | 485 (21.1%) | 1,815 (78.9%) |
| Arts, Media & Entertainment | 241 (48.0%) | 261 (52.0%) |
| Health Diagnosing & Treating | 507 (22.5%) | 1,750 (77.5%) |
| Health Technologists | 429 (29.1%) | 1,043 (70.9%) |
| Total (Category) | 6,242 (46.7%) | 7,112 (53.3%) |
| Total (Overall) | 21,194 (52.2%) | 19,367 (47.7%) |
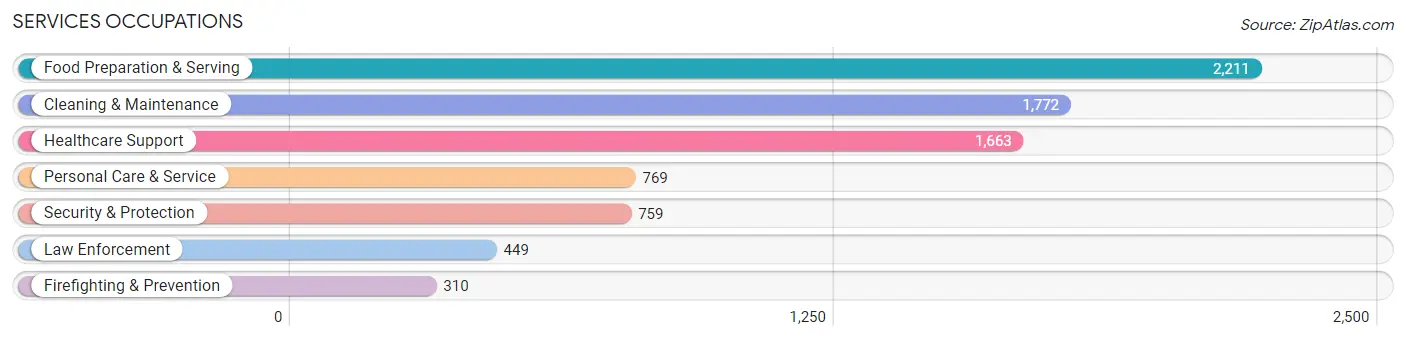
Services Occupations
The most common Services occupations in Fort Smith are Food Preparation & Serving (2,211 | 5.4%), Cleaning & Maintenance (1,772 | 4.4%), Healthcare Support (1,663 | 4.1%), Personal Care & Service (769 | 1.9%), and Security & Protection (759 | 1.9%).
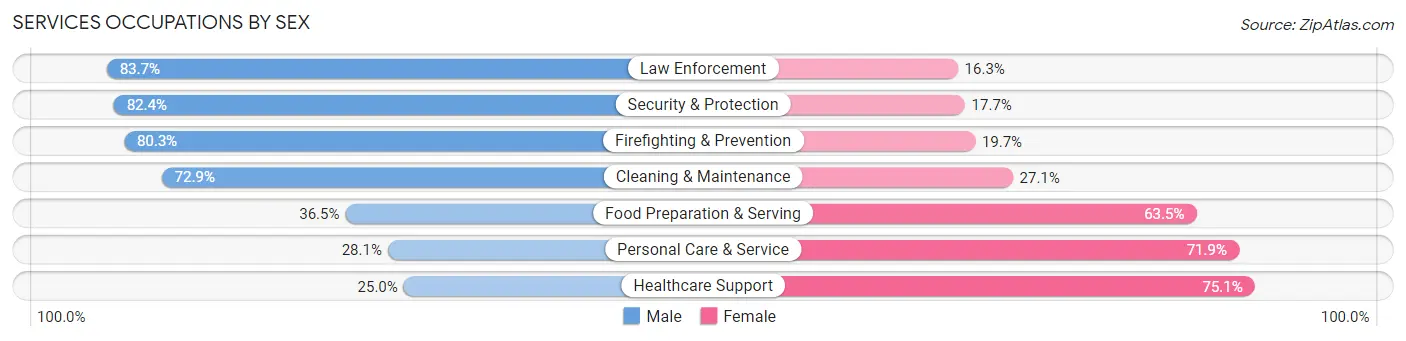
Services Occupations by Sex
Within the Services occupations in Fort Smith, the most male-oriented occupations are Law Enforcement (83.7%), Security & Protection (82.4%), and Firefighting & Prevention (80.3%), while the most female-oriented occupations are Healthcare Support (75.0%), Personal Care & Service (71.9%), and Food Preparation & Serving (63.5%).
| Occupation | Male | Female |
| Healthcare Support | 415 (24.9%) | 1,248 (75.0%) |
| Security & Protection | 625 (82.4%) | 134 (17.6%) |
| Firefighting & Prevention | 249 (80.3%) | 61 (19.7%) |
| Law Enforcement | 376 (83.7%) | 73 (16.3%) |
| Food Preparation & Serving | 807 (36.5%) | 1,404 (63.5%) |
| Cleaning & Maintenance | 1,291 (72.9%) | 481 (27.1%) |
| Personal Care & Service | 216 (28.1%) | 553 (71.9%) |
| Total (Category) | 3,354 (46.8%) | 3,820 (53.2%) |
| Total (Overall) | 21,194 (52.2%) | 19,367 (47.7%) |
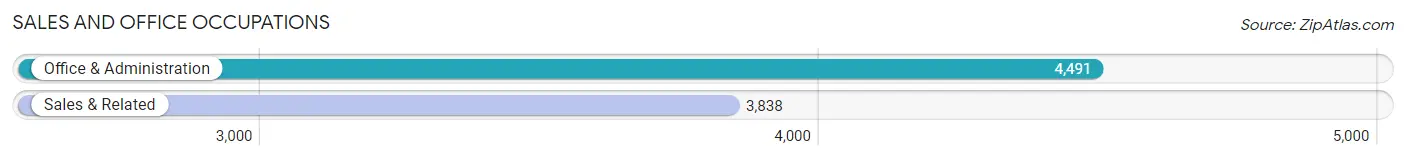
Sales and Office Occupations
The most common Sales and Office occupations in Fort Smith are Office & Administration (4,491 | 11.1%), and Sales & Related (3,838 | 9.5%).
Sales and Office Occupations by Sex
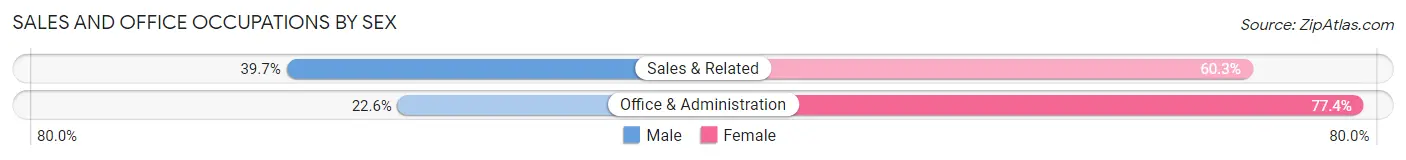
| Occupation | Male | Female |
| Sales & Related | 1,524 (39.7%) | 2,314 (60.3%) |
| Office & Administration | 1,015 (22.6%) | 3,476 (77.4%) |
| Total (Category) | 2,539 (30.5%) | 5,790 (69.5%) |
| Total (Overall) | 21,194 (52.2%) | 19,367 (47.7%) |
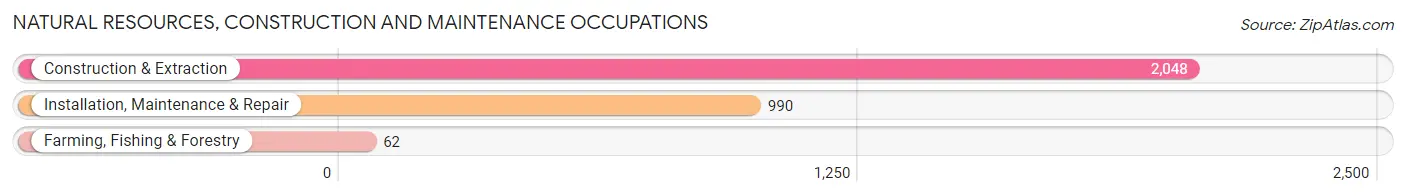
Natural Resources, Construction and Maintenance Occupations
The most common Natural Resources, Construction and Maintenance occupations in Fort Smith are Construction & Extraction (2,048 | 5.1%), Installation, Maintenance & Repair (990 | 2.4%), and Farming, Fishing & Forestry (62 | 0.2%).
Natural Resources, Construction and Maintenance Occupations by Sex
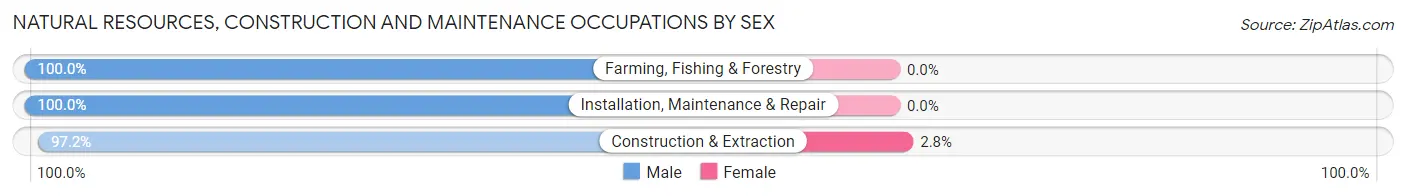
| Occupation | Male | Female |
| Farming, Fishing & Forestry | 62 (100.0%) | 0 (0.0%) |
| Construction & Extraction | 1,991 (97.2%) | 57 (2.8%) |
| Installation, Maintenance & Repair | 990 (100.0%) | 0 (0.0%) |
| Total (Category) | 3,043 (98.2%) | 57 (1.8%) |
| Total (Overall) | 21,194 (52.2%) | 19,367 (47.7%) |
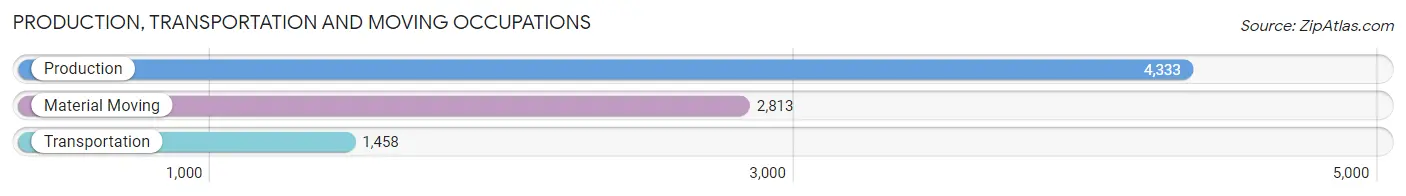
Production, Transportation and Moving Occupations
The most common Production, Transportation and Moving occupations in Fort Smith are Production (4,333 | 10.7%), Material Moving (2,813 | 6.9%), and Transportation (1,458 | 3.6%).
Production, Transportation and Moving Occupations by Sex
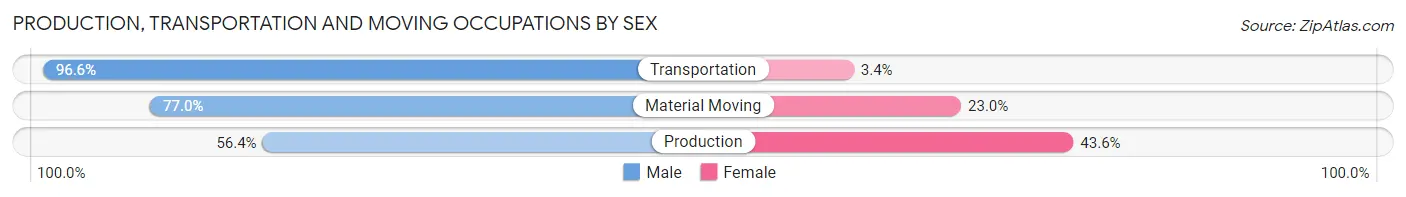
| Occupation | Male | Female |
| Production | 2,442 (56.4%) | 1,891 (43.6%) |
| Transportation | 1,409 (96.6%) | 49 (3.4%) |
| Material Moving | 2,165 (77.0%) | 648 (23.0%) |
| Total (Category) | 6,016 (69.9%) | 2,588 (30.1%) |
| Total (Overall) | 21,194 (52.2%) | 19,367 (47.7%) |
Employment Industries by Sex in Fort Smith
Employment Industries in Fort Smith
The major employment industries in Fort Smith include Manufacturing (6,993 | 17.2%), Health Care & Social Assistance (5,639 | 13.9%), Retail Trade (4,253 | 10.5%), Accommodation & Food Services (3,339 | 8.2%), and Educational Services (2,818 | 7.0%).

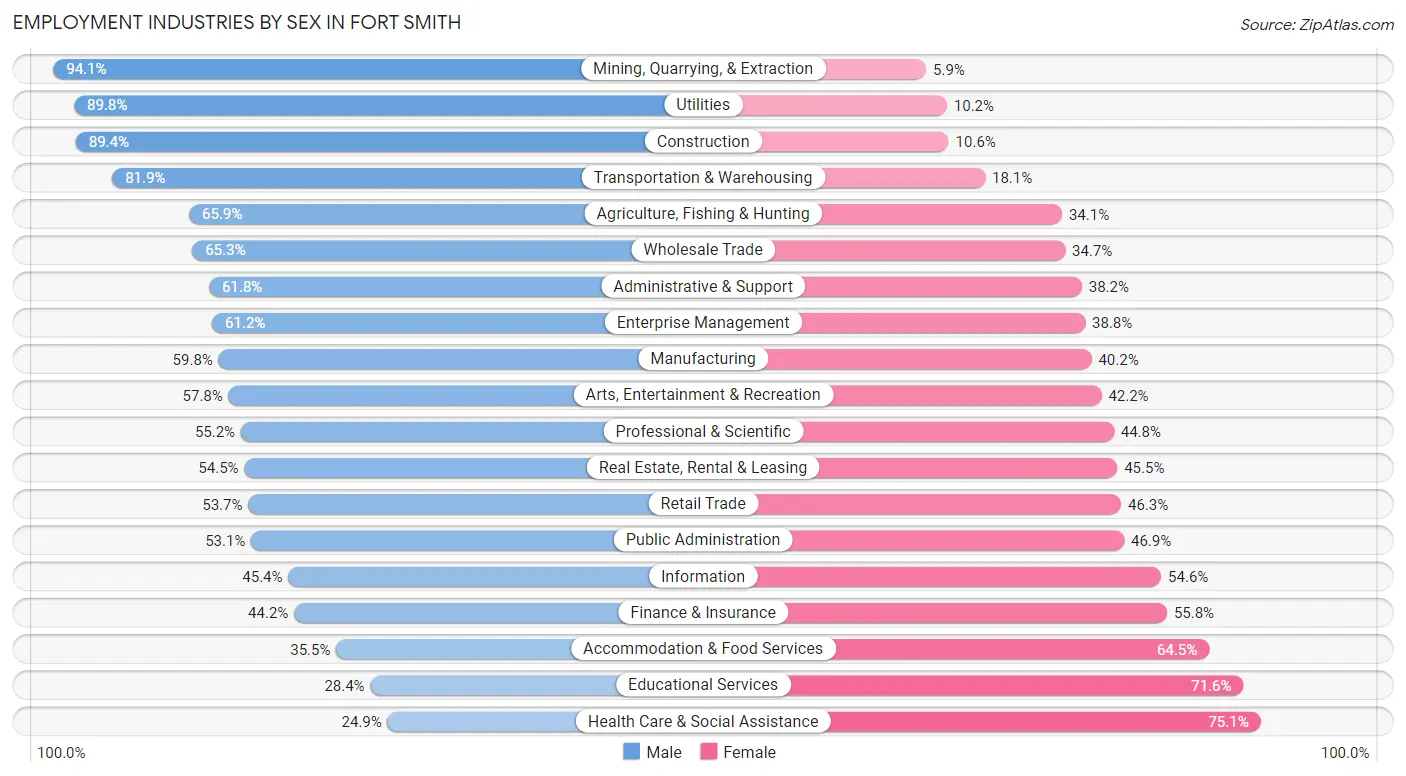
Employment Industries by Sex in Fort Smith
The Fort Smith industries that see more men than women are Mining, Quarrying, & Extraction (94.1%), Utilities (89.8%), and Construction (89.4%), whereas the industries that tend to have a higher number of women are Health Care & Social Assistance (75.1%), Educational Services (71.6%), and Accommodation & Food Services (64.5%).
| Industry | Male | Female |
| Agriculture, Fishing & Hunting | 211 (65.9%) | 109 (34.1%) |
| Mining, Quarrying, & Extraction | 285 (94.1%) | 18 (5.9%) |
| Construction | 2,319 (89.4%) | 275 (10.6%) |
| Manufacturing | 4,184 (59.8%) | 2,809 (40.2%) |
| Wholesale Trade | 666 (65.3%) | 354 (34.7%) |
| Retail Trade | 2,284 (53.7%) | 1,969 (46.3%) |
| Transportation & Warehousing | 1,859 (81.9%) | 412 (18.1%) |
| Utilities | 263 (89.8%) | 30 (10.2%) |
| Information | 168 (45.4%) | 202 (54.6%) |
| Finance & Insurance | 603 (44.2%) | 761 (55.8%) |
| Real Estate, Rental & Leasing | 339 (54.5%) | 283 (45.5%) |
| Professional & Scientific | 1,206 (55.2%) | 978 (44.8%) |
| Enterprise Management | 63 (61.2%) | 40 (38.8%) |
| Administrative & Support | 1,280 (61.8%) | 790 (38.2%) |
| Educational Services | 801 (28.4%) | 2,017 (71.6%) |
| Health Care & Social Assistance | 1,402 (24.9%) | 4,237 (75.1%) |
| Arts, Entertainment & Recreation | 357 (57.8%) | 261 (42.2%) |
| Accommodation & Food Services | 1,185 (35.5%) | 2,154 (64.5%) |
| Public Administration | 788 (53.1%) | 696 (46.9%) |
| Total | 21,194 (52.2%) | 19,367 (47.7%) |
Education in Fort Smith
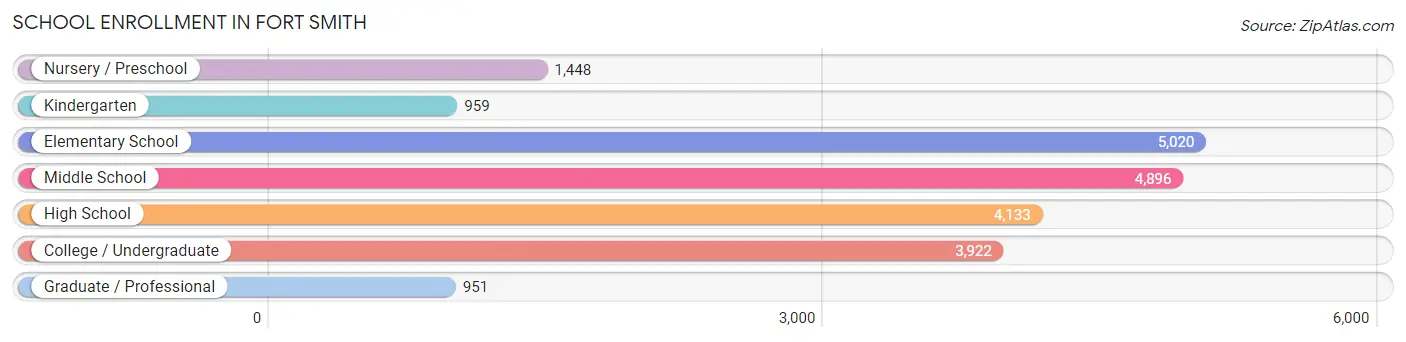
School Enrollment in Fort Smith
The most common levels of schooling among the 21,329 students in Fort Smith are elementary school (5,020 | 23.5%), middle school (4,896 | 23.0%), and high school (4,133 | 19.4%).
| School Level | # Students | % Students |
| Nursery / Preschool | 1,448 | 6.8% |
| Kindergarten | 959 | 4.5% |
| Elementary School | 5,020 | 23.5% |
| Middle School | 4,896 | 23.0% |
| High School | 4,133 | 19.4% |
| College / Undergraduate | 3,922 | 18.4% |
| Graduate / Professional | 951 | 4.5% |
| Total | 21,329 | 100.0% |
School Enrollment by Age by Funding Source in Fort Smith
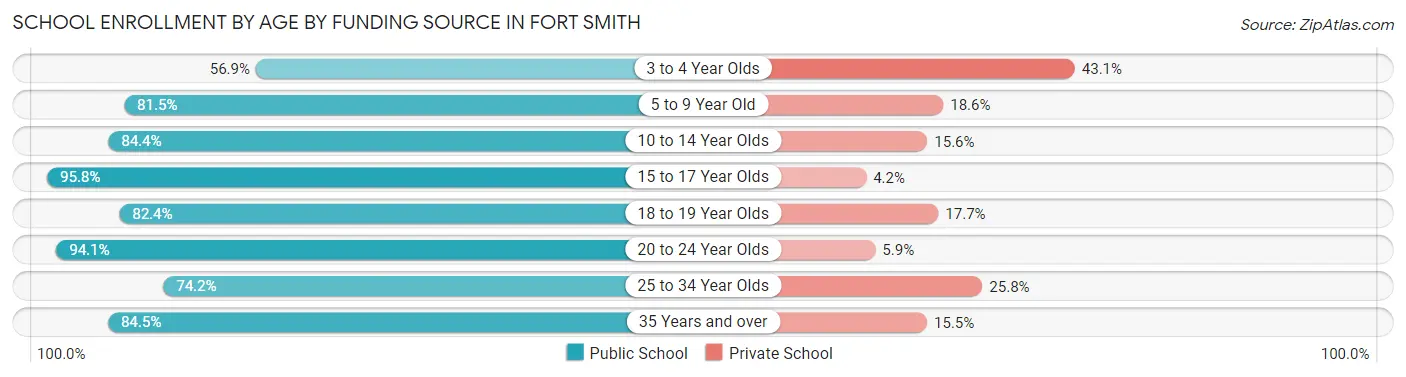
Out of a total of 21,329 students who are enrolled in schools in Fort Smith, 3,370 (15.8%) attend a private institution, while the remaining 17,959 (84.2%) are enrolled in public schools. The age group of 3 to 4 year olds has the highest likelihood of being enrolled in private schools, with 397 (43.1% in the age bracket) enrolled. Conversely, the age group of 15 to 17 year olds has the lowest likelihood of being enrolled in a private school, with 3,191 (95.8% in the age bracket) attending a public institution.
| Age Bracket | Public School | Private School |
| 3 to 4 Year Olds | 525 (56.9%) | 397 (43.1%) |
| 5 to 9 Year Old | 4,631 (81.5%) | 1,055 (18.5%) |
| 10 to 14 Year Olds | 5,057 (84.4%) | 934 (15.6%) |
| 15 to 17 Year Olds | 3,191 (95.8%) | 140 (4.2%) |
| 18 to 19 Year Olds | 779 (82.4%) | 167 (17.6%) |
| 20 to 24 Year Olds | 1,814 (94.1%) | 114 (5.9%) |
| 25 to 34 Year Olds | 1,171 (74.2%) | 408 (25.8%) |
| 35 Years and over | 799 (84.5%) | 147 (15.5%) |
| Total | 17,959 (84.2%) | 3,370 (15.8%) |
Educational Attainment by Field of Study in Fort Smith
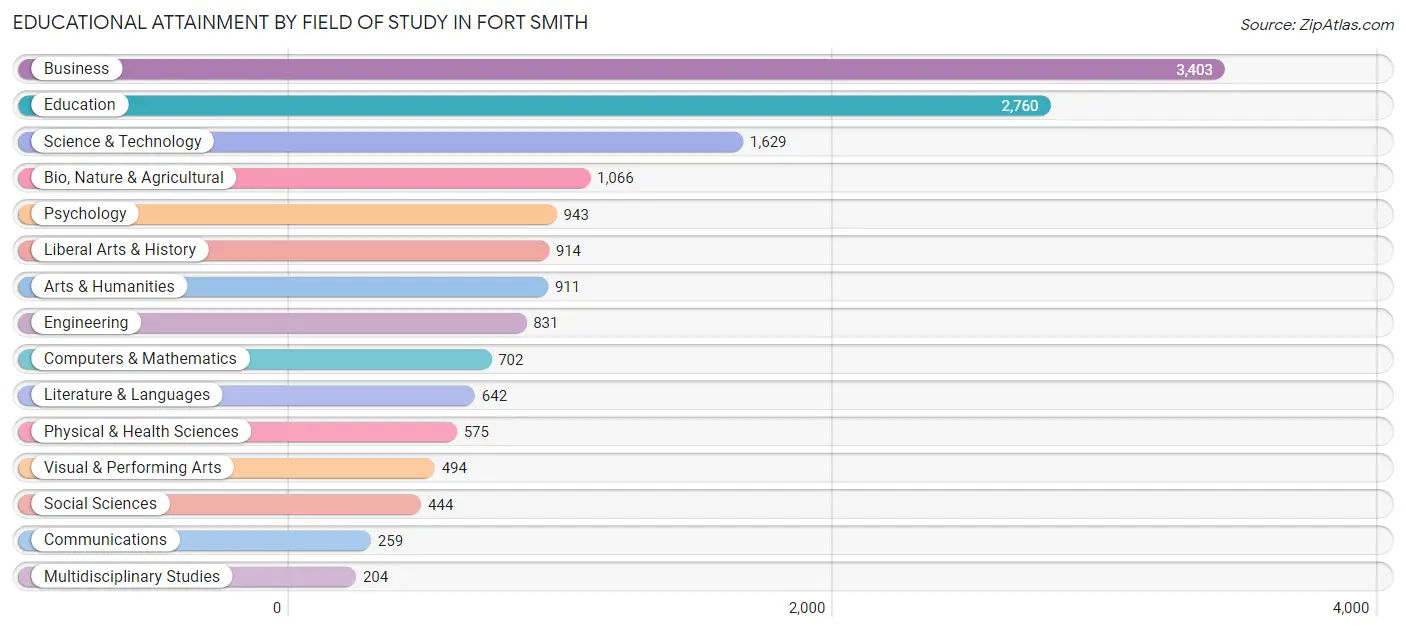
Business (3,403 | 21.6%), education (2,760 | 17.5%), science & technology (1,629 | 10.3%), bio, nature & agricultural (1,066 | 6.8%), and psychology (943 | 6.0%) are the most common fields of study among 15,777 individuals in Fort Smith who have obtained a bachelor's degree or higher.
| Field of Study | # Graduates | % Graduates |
| Computers & Mathematics | 702 | 4.4% |
| Bio, Nature & Agricultural | 1,066 | 6.8% |
| Physical & Health Sciences | 575 | 3.6% |
| Psychology | 943 | 6.0% |
| Social Sciences | 444 | 2.8% |
| Engineering | 831 | 5.3% |
| Multidisciplinary Studies | 204 | 1.3% |
| Science & Technology | 1,629 | 10.3% |
| Business | 3,403 | 21.6% |
| Education | 2,760 | 17.5% |
| Literature & Languages | 642 | 4.1% |
| Liberal Arts & History | 914 | 5.8% |
| Visual & Performing Arts | 494 | 3.1% |
| Communications | 259 | 1.6% |
| Arts & Humanities | 911 | 5.8% |
| Total | 15,777 | 100.0% |
Transportation & Commute in Fort Smith
Vehicle Availability by Sex in Fort Smith
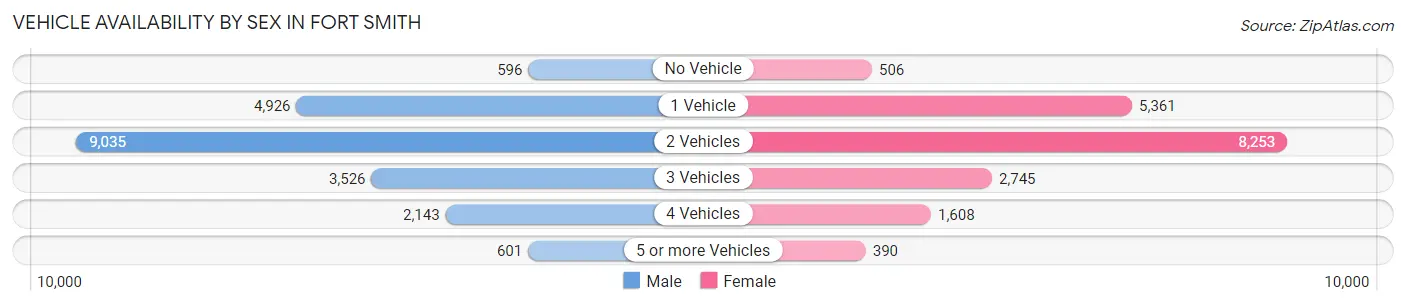
The most prevalent vehicle ownership categories in Fort Smith are males with 2 vehicles (9,035, accounting for 43.4%) and females with 2 vehicles (8,253, making up 47.9%).
| Vehicles Available | Male | Female |
| No Vehicle | 596 (2.9%) | 506 (2.7%) |
| 1 Vehicle | 4,926 (23.6%) | 5,361 (28.4%) |
| 2 Vehicles | 9,035 (43.4%) | 8,253 (43.8%) |
| 3 Vehicles | 3,526 (16.9%) | 2,745 (14.5%) |
| 4 Vehicles | 2,143 (10.3%) | 1,608 (8.5%) |
| 5 or more Vehicles | 601 (2.9%) | 390 (2.1%) |
| Total | 20,827 (100.0%) | 18,863 (100.0%) |
Commute Time in Fort Smith
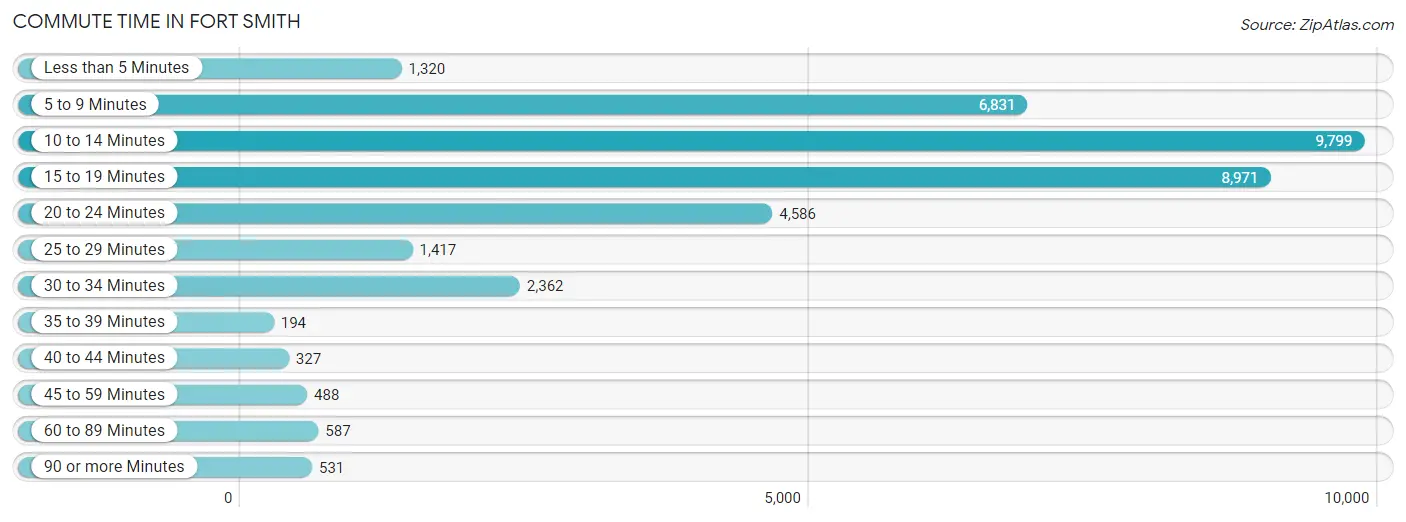
The most frequently occuring commute durations in Fort Smith are 10 to 14 minutes (9,799 commuters, 26.2%), 15 to 19 minutes (8,971 commuters, 24.0%), and 5 to 9 minutes (6,831 commuters, 18.3%).
| Commute Time | # Commuters | % Commuters |
| Less than 5 Minutes | 1,320 | 3.5% |
| 5 to 9 Minutes | 6,831 | 18.3% |
| 10 to 14 Minutes | 9,799 | 26.2% |
| 15 to 19 Minutes | 8,971 | 24.0% |
| 20 to 24 Minutes | 4,586 | 12.3% |
| 25 to 29 Minutes | 1,417 | 3.8% |
| 30 to 34 Minutes | 2,362 | 6.3% |
| 35 to 39 Minutes | 194 | 0.5% |
| 40 to 44 Minutes | 327 | 0.9% |
| 45 to 59 Minutes | 488 | 1.3% |
| 60 to 89 Minutes | 587 | 1.6% |
| 90 or more Minutes | 531 | 1.4% |
Commute Time by Sex in Fort Smith
The most common commute times in Fort Smith are 10 to 14 minutes (5,333 commuters, 26.7%) for males and 15 to 19 minutes (4,555 commuters, 26.2%) for females.
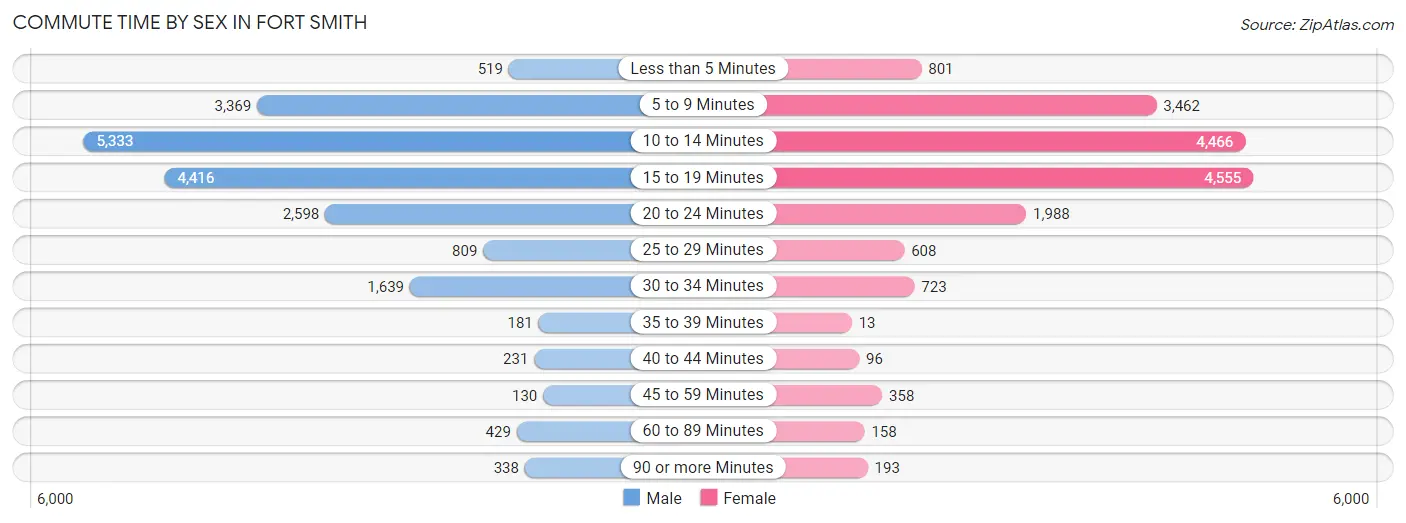
| Commute Time | Male | Female |
| Less than 5 Minutes | 519 (2.6%) | 801 (4.6%) |
| 5 to 9 Minutes | 3,369 (16.9%) | 3,462 (19.9%) |
| 10 to 14 Minutes | 5,333 (26.7%) | 4,466 (25.6%) |
| 15 to 19 Minutes | 4,416 (22.1%) | 4,555 (26.2%) |
| 20 to 24 Minutes | 2,598 (13.0%) | 1,988 (11.4%) |
| 25 to 29 Minutes | 809 (4.1%) | 608 (3.5%) |
| 30 to 34 Minutes | 1,639 (8.2%) | 723 (4.2%) |
| 35 to 39 Minutes | 181 (0.9%) | 13 (0.1%) |
| 40 to 44 Minutes | 231 (1.2%) | 96 (0.5%) |
| 45 to 59 Minutes | 130 (0.6%) | 358 (2.1%) |
| 60 to 89 Minutes | 429 (2.1%) | 158 (0.9%) |
| 90 or more Minutes | 338 (1.7%) | 193 (1.1%) |
Time of Departure to Work by Sex in Fort Smith
The most frequent times of departure to work in Fort Smith are 7:30 AM to 7:59 AM (2,961, 14.8%) for males and 7:30 AM to 7:59 AM (3,773, 21.7%) for females.
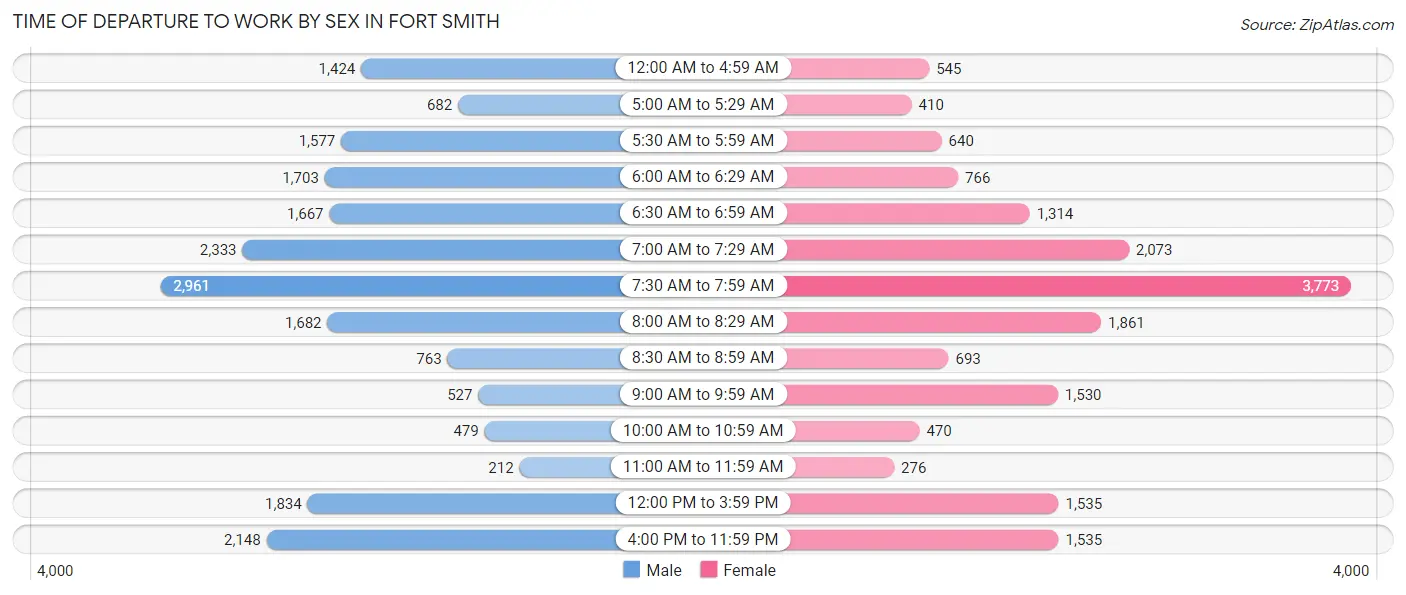
| Time of Departure | Male | Female |
| 12:00 AM to 4:59 AM | 1,424 (7.1%) | 545 (3.1%) |
| 5:00 AM to 5:29 AM | 682 (3.4%) | 410 (2.4%) |
| 5:30 AM to 5:59 AM | 1,577 (7.9%) | 640 (3.7%) |
| 6:00 AM to 6:29 AM | 1,703 (8.5%) | 766 (4.4%) |
| 6:30 AM to 6:59 AM | 1,667 (8.3%) | 1,314 (7.5%) |
| 7:00 AM to 7:29 AM | 2,333 (11.7%) | 2,073 (11.9%) |
| 7:30 AM to 7:59 AM | 2,961 (14.8%) | 3,773 (21.7%) |
| 8:00 AM to 8:29 AM | 1,682 (8.4%) | 1,861 (10.7%) |
| 8:30 AM to 8:59 AM | 763 (3.8%) | 693 (4.0%) |
| 9:00 AM to 9:59 AM | 527 (2.6%) | 1,530 (8.8%) |
| 10:00 AM to 10:59 AM | 479 (2.4%) | 470 (2.7%) |
| 11:00 AM to 11:59 AM | 212 (1.1%) | 276 (1.6%) |
| 12:00 PM to 3:59 PM | 1,834 (9.2%) | 1,535 (8.8%) |
| 4:00 PM to 11:59 PM | 2,148 (10.7%) | 1,535 (8.8%) |
| Total | 19,992 (100.0%) | 17,421 (100.0%) |
Housing Occupancy in Fort Smith
Occupancy by Ownership in Fort Smith
Of the total 36,373 dwellings in Fort Smith, owner-occupied units account for 18,690 (51.4%), while renter-occupied units make up 17,683 (48.6%).
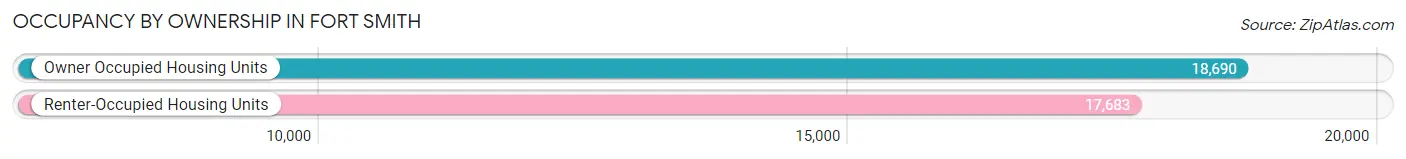
| Occupancy | # Housing Units | % Housing Units |
| Owner Occupied Housing Units | 18,690 | 51.4% |
| Renter-Occupied Housing Units | 17,683 | 48.6% |
| Total Occupied Housing Units | 36,373 | 100.0% |
Occupancy by Household Size in Fort Smith
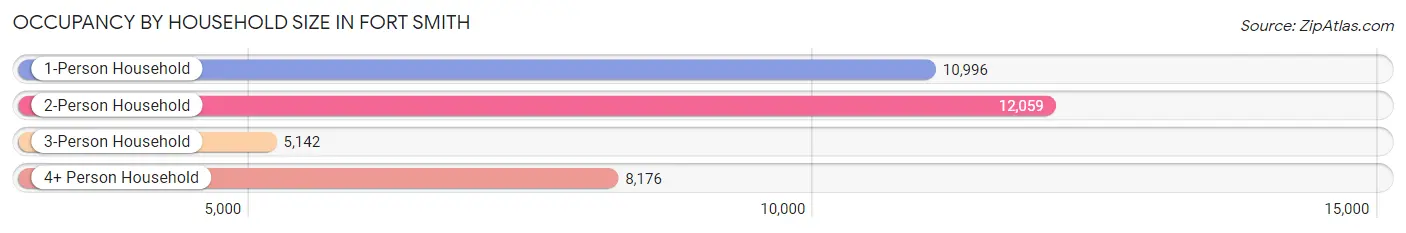
| Household Size | # Housing Units | % Housing Units |
| 1-Person Household | 10,996 | 30.2% |
| 2-Person Household | 12,059 | 33.2% |
| 3-Person Household | 5,142 | 14.1% |
| 4+ Person Household | 8,176 | 22.5% |
| Total Housing Units | 36,373 | 100.0% |
Occupancy by Ownership by Household Size in Fort Smith
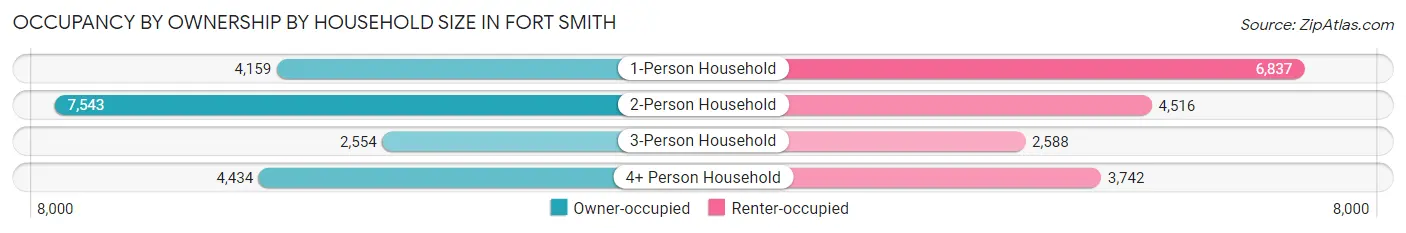
| Household Size | Owner-occupied | Renter-occupied |
| 1-Person Household | 4,159 (37.8%) | 6,837 (62.2%) |
| 2-Person Household | 7,543 (62.5%) | 4,516 (37.4%) |
| 3-Person Household | 2,554 (49.7%) | 2,588 (50.3%) |
| 4+ Person Household | 4,434 (54.2%) | 3,742 (45.8%) |
| Total Housing Units | 18,690 (51.4%) | 17,683 (48.6%) |
Occupancy by Educational Attainment in Fort Smith
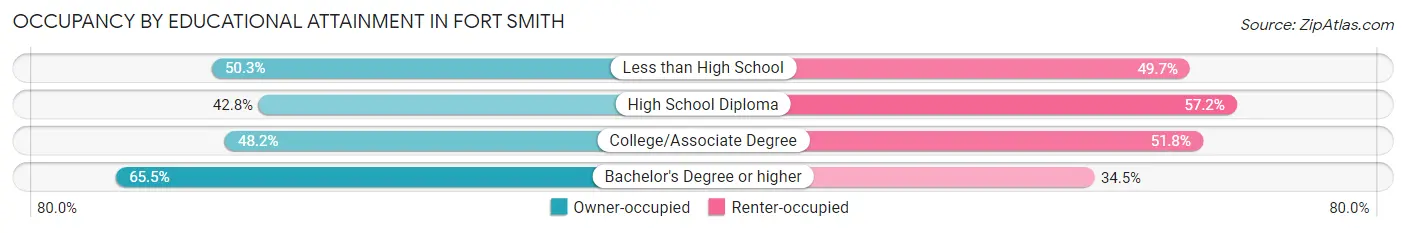
| Household Size | Owner-occupied | Renter-occupied |
| Less than High School | 2,555 (50.3%) | 2,528 (49.7%) |
| High School Diploma | 4,297 (42.8%) | 5,733 (57.2%) |
| College/Associate Degree | 5,806 (48.2%) | 6,239 (51.8%) |
| Bachelor's Degree or higher | 6,032 (65.5%) | 3,183 (34.5%) |
Occupancy by Age of Householder in Fort Smith
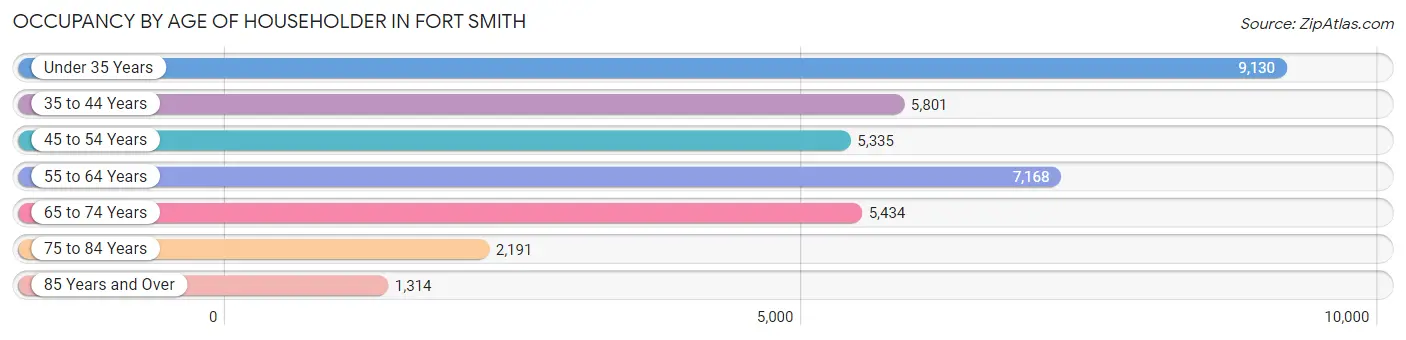
| Age Bracket | # Households | % Households |
| Under 35 Years | 9,130 | 25.1% |
| 35 to 44 Years | 5,801 | 16.0% |
| 45 to 54 Years | 5,335 | 14.7% |
| 55 to 64 Years | 7,168 | 19.7% |
| 65 to 74 Years | 5,434 | 14.9% |
| 75 to 84 Years | 2,191 | 6.0% |
| 85 Years and Over | 1,314 | 3.6% |
| Total | 36,373 | 100.0% |
Housing Finances in Fort Smith
Median Income by Occupancy in Fort Smith
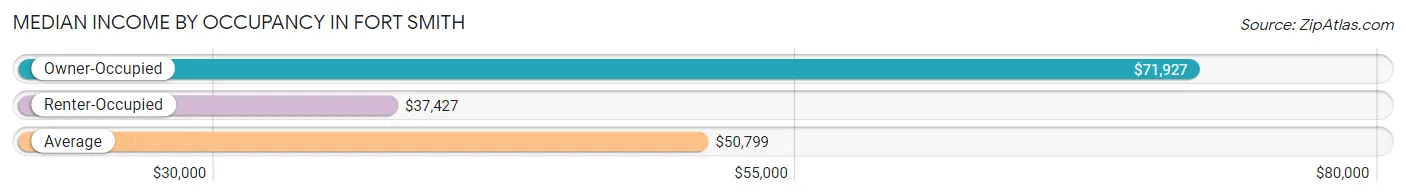
| Occupancy Type | # Households | Median Income |
| Owner-Occupied | 18,690 (51.4%) | $71,927 |
| Renter-Occupied | 17,683 (48.6%) | $37,427 |
| Average | 36,373 (100.0%) | $50,799 |
Occupancy by Householder Income Bracket in Fort Smith
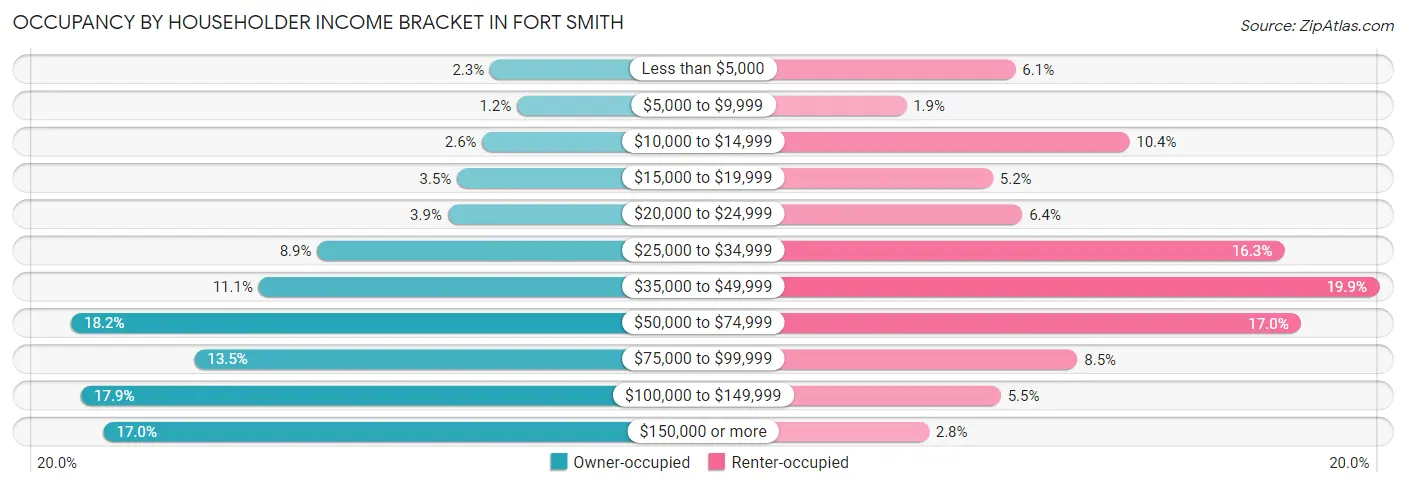
| Income Bracket | Owner-occupied | Renter-occupied |
| Less than $5,000 | 424 (2.3%) | 1,077 (6.1%) |
| $5,000 to $9,999 | 231 (1.2%) | 341 (1.9%) |
| $10,000 to $14,999 | 479 (2.6%) | 1,845 (10.4%) |
| $15,000 to $19,999 | 657 (3.5%) | 924 (5.2%) |
| $20,000 to $24,999 | 725 (3.9%) | 1,123 (6.4%) |
| $25,000 to $34,999 | 1,654 (8.8%) | 2,885 (16.3%) |
| $35,000 to $49,999 | 2,070 (11.1%) | 3,525 (19.9%) |
| $50,000 to $74,999 | 3,408 (18.2%) | 2,998 (17.0%) |
| $75,000 to $99,999 | 2,529 (13.5%) | 1,494 (8.5%) |
| $100,000 to $149,999 | 3,337 (17.8%) | 978 (5.5%) |
| $150,000 or more | 3,176 (17.0%) | 493 (2.8%) |
| Total | 18,690 (100.0%) | 17,683 (100.0%) |
Monthly Housing Cost Tiers in Fort Smith
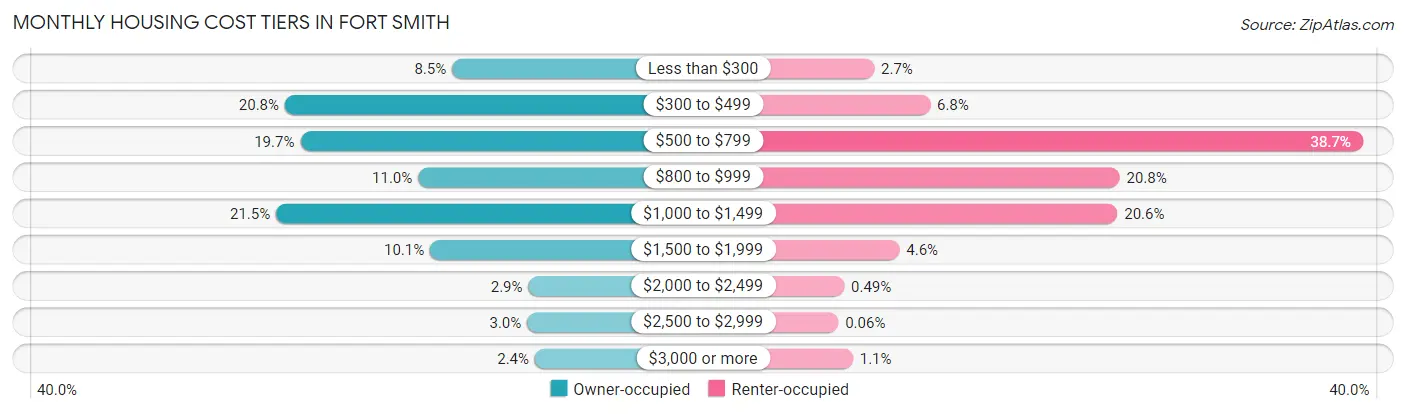
| Monthly Cost | Owner-occupied | Renter-occupied |
| Less than $300 | 1,592 (8.5%) | 478 (2.7%) |
| $300 to $499 | 3,893 (20.8%) | 1,206 (6.8%) |
| $500 to $799 | 3,682 (19.7%) | 6,840 (38.7%) |
| $800 to $999 | 2,059 (11.0%) | 3,674 (20.8%) |
| $1,000 to $1,499 | 4,015 (21.5%) | 3,645 (20.6%) |
| $1,500 to $1,999 | 1,895 (10.1%) | 806 (4.6%) |
| $2,000 to $2,499 | 542 (2.9%) | 86 (0.5%) |
| $2,500 to $2,999 | 559 (3.0%) | 11 (0.1%) |
| $3,000 or more | 453 (2.4%) | 199 (1.1%) |
| Total | 18,690 (100.0%) | 17,683 (100.0%) |
Physical Housing Characteristics in Fort Smith
Housing Structures in Fort Smith
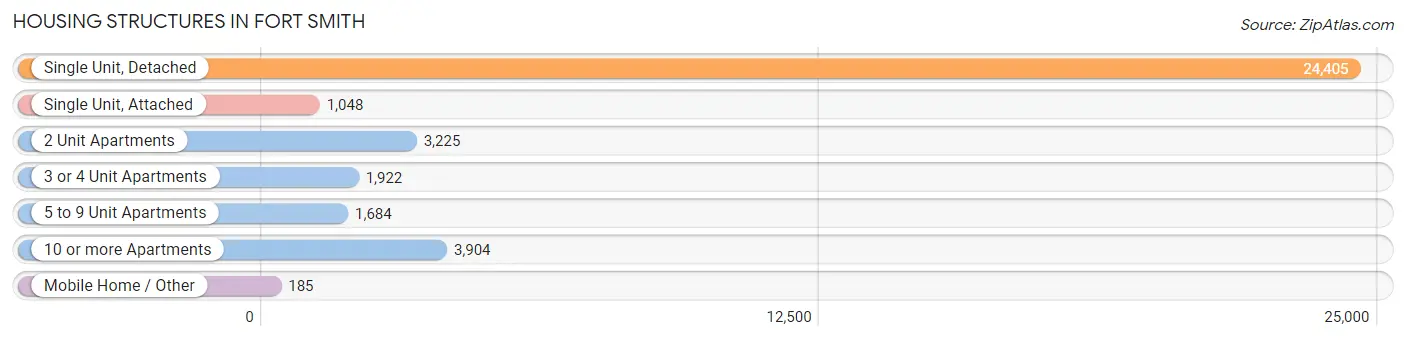
| Structure Type | # Housing Units | % Housing Units |
| Single Unit, Detached | 24,405 | 67.1% |
| Single Unit, Attached | 1,048 | 2.9% |
| 2 Unit Apartments | 3,225 | 8.9% |
| 3 or 4 Unit Apartments | 1,922 | 5.3% |
| 5 to 9 Unit Apartments | 1,684 | 4.6% |
| 10 or more Apartments | 3,904 | 10.7% |
| Mobile Home / Other | 185 | 0.5% |
| Total | 36,373 | 100.0% |
Housing Structures by Occupancy in Fort Smith
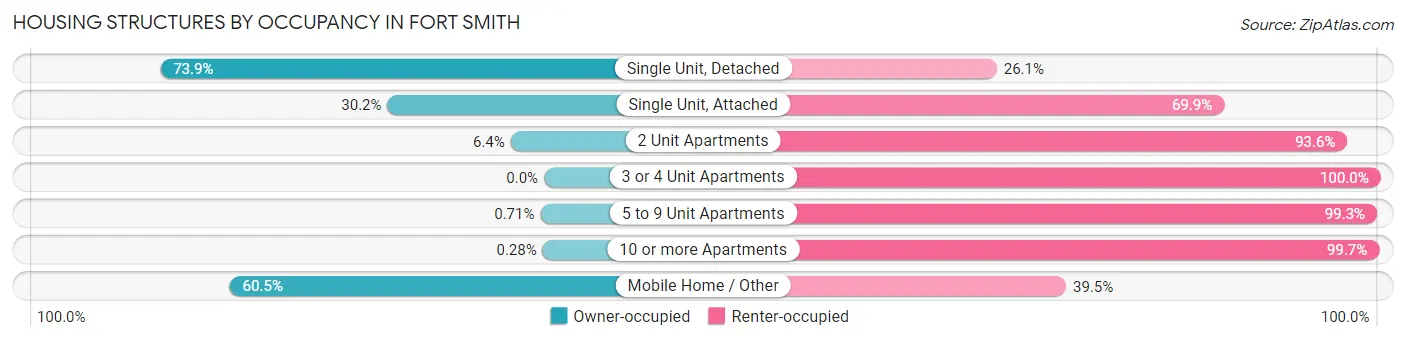
| Structure Type | Owner-occupied | Renter-occupied |
| Single Unit, Detached | 18,032 (73.9%) | 6,373 (26.1%) |
| Single Unit, Attached | 316 (30.1%) | 732 (69.9%) |
| 2 Unit Apartments | 207 (6.4%) | 3,018 (93.6%) |
| 3 or 4 Unit Apartments | 0 (0.0%) | 1,922 (100.0%) |
| 5 to 9 Unit Apartments | 12 (0.7%) | 1,672 (99.3%) |
| 10 or more Apartments | 11 (0.3%) | 3,893 (99.7%) |
| Mobile Home / Other | 112 (60.5%) | 73 (39.5%) |
| Total | 18,690 (51.4%) | 17,683 (48.6%) |
Housing Structures by Number of Rooms in Fort Smith
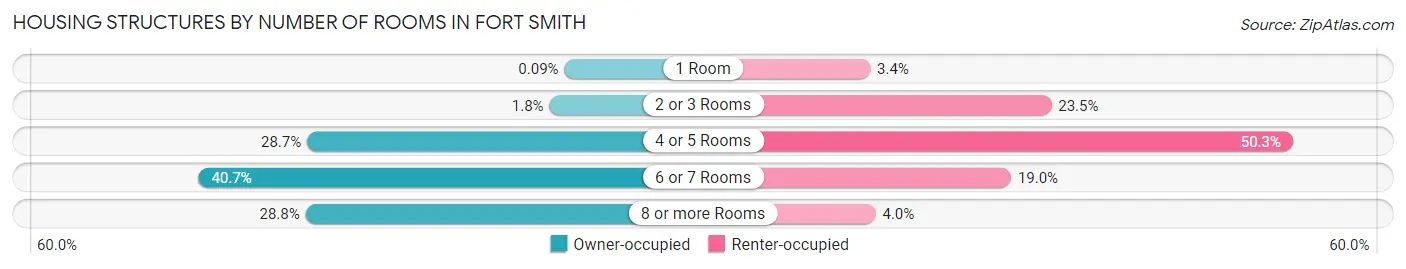
| Number of Rooms | Owner-occupied | Renter-occupied |
| 1 Room | 16 (0.1%) | 592 (3.4%) |
| 2 or 3 Rooms | 327 (1.8%) | 4,148 (23.5%) |
| 4 or 5 Rooms | 5,354 (28.6%) | 8,887 (50.3%) |
| 6 or 7 Rooms | 7,607 (40.7%) | 3,357 (19.0%) |
| 8 or more Rooms | 5,386 (28.8%) | 699 (4.0%) |
| Total | 18,690 (100.0%) | 17,683 (100.0%) |
Housing Structure by Heating Type in Fort Smith
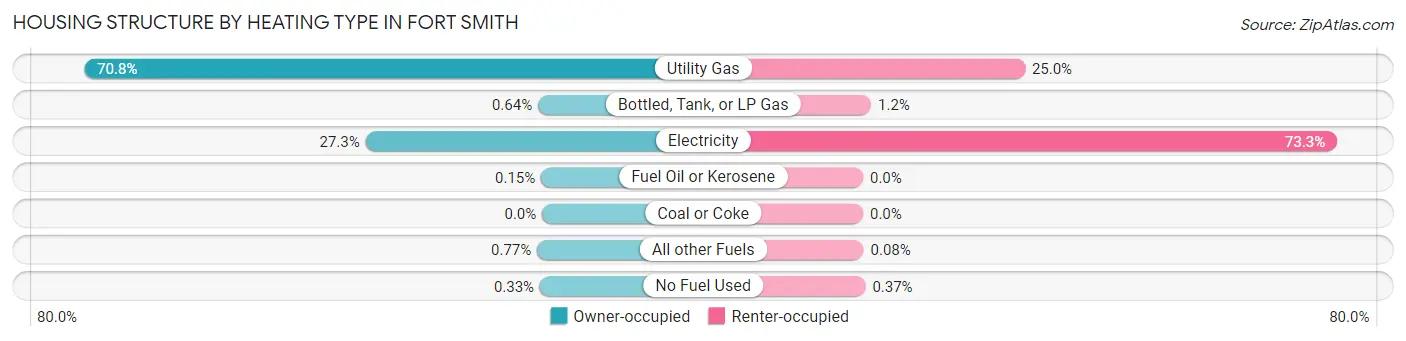
| Heating Type | Owner-occupied | Renter-occupied |
| Utility Gas | 13,235 (70.8%) | 4,426 (25.0%) |
| Bottled, Tank, or LP Gas | 120 (0.6%) | 219 (1.2%) |
| Electricity | 5,102 (27.3%) | 12,958 (73.3%) |
| Fuel Oil or Kerosene | 28 (0.2%) | 0 (0.0%) |
| Coal or Coke | 0 (0.0%) | 0 (0.0%) |
| All other Fuels | 143 (0.8%) | 14 (0.1%) |
| No Fuel Used | 62 (0.3%) | 66 (0.4%) |
| Total | 18,690 (100.0%) | 17,683 (100.0%) |
Household Vehicle Usage in Fort Smith
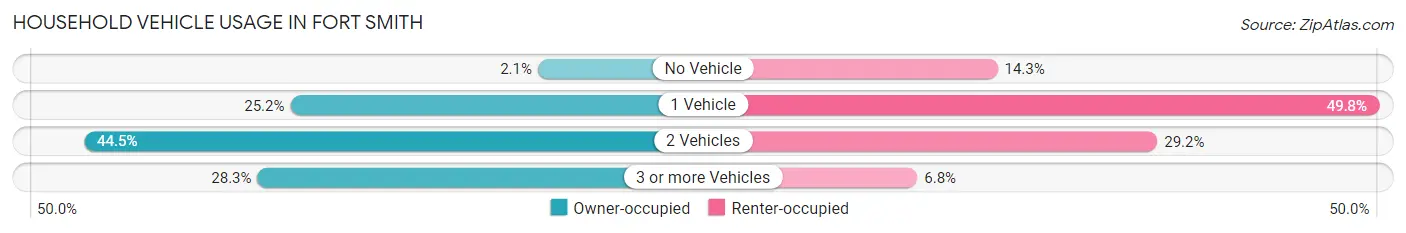
| Vehicles per Household | Owner-occupied | Renter-occupied |
| No Vehicle | 390 (2.1%) | 2,519 (14.2%) |
| 1 Vehicle | 4,709 (25.2%) | 8,813 (49.8%) |
| 2 Vehicles | 8,308 (44.5%) | 5,156 (29.2%) |
| 3 or more Vehicles | 5,283 (28.3%) | 1,195 (6.8%) |
| Total | 18,690 (100.0%) | 17,683 (100.0%) |
Real Estate & Mortgages in Fort Smith
Real Estate and Mortgage Overview in Fort Smith
| Characteristic | Without Mortgage | With Mortgage |
| Housing Units | 8,487 | 10,203 |
| Median Property Value | $137,900 | $169,700 |
| Median Household Income | $59,133 | $2,201 |
| Monthly Housing Costs | $439 | $437 |
| Real Estate Taxes | $933 | $538 |
Property Value by Mortgage Status in Fort Smith
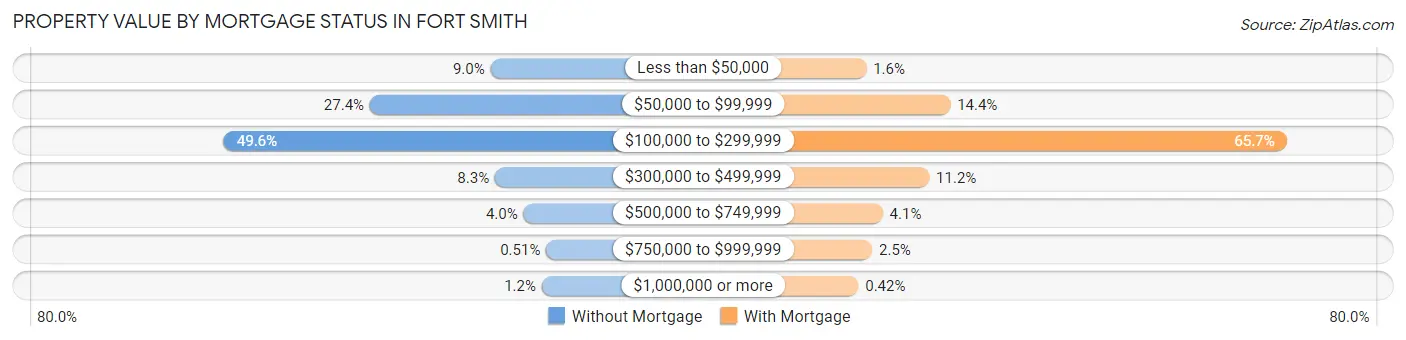
| Property Value | Without Mortgage | With Mortgage |
| Less than $50,000 | 764 (9.0%) | 165 (1.6%) |
| $50,000 to $99,999 | 2,324 (27.4%) | 1,471 (14.4%) |
| $100,000 to $299,999 | 4,212 (49.6%) | 6,701 (65.7%) |
| $300,000 to $499,999 | 706 (8.3%) | 1,145 (11.2%) |
| $500,000 to $749,999 | 337 (4.0%) | 421 (4.1%) |
| $750,000 to $999,999 | 43 (0.5%) | 257 (2.5%) |
| $1,000,000 or more | 101 (1.2%) | 43 (0.4%) |
| Total | 8,487 (100.0%) | 10,203 (100.0%) |
Household Income by Mortgage Status in Fort Smith
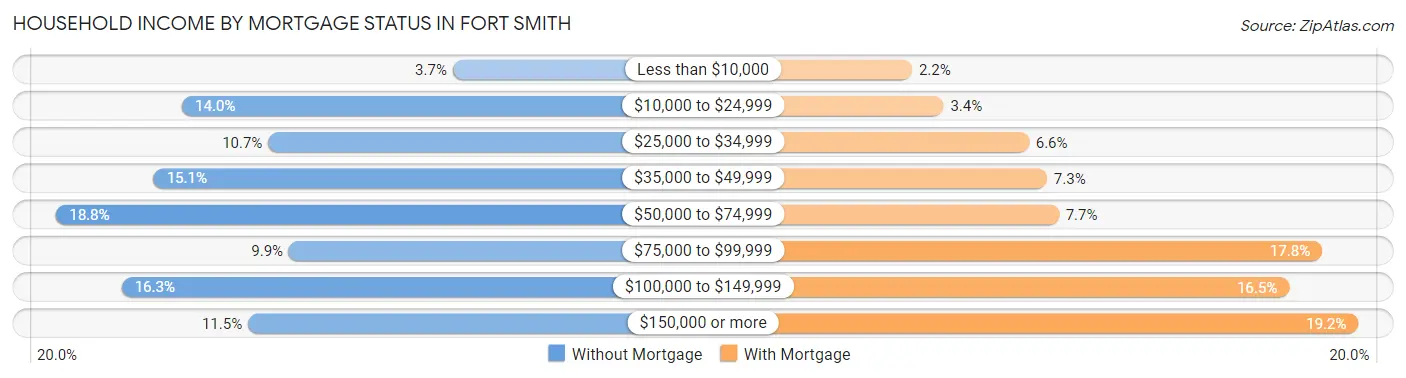
| Household Income | Without Mortgage | With Mortgage |
| Less than $10,000 | 313 (3.7%) | 219 (2.1%) |
| $10,000 to $24,999 | 1,188 (14.0%) | 342 (3.4%) |
| $25,000 to $34,999 | 910 (10.7%) | 673 (6.6%) |
| $35,000 to $49,999 | 1,280 (15.1%) | 744 (7.3%) |
| $50,000 to $74,999 | 1,595 (18.8%) | 790 (7.7%) |
| $75,000 to $99,999 | 843 (9.9%) | 1,813 (17.8%) |
| $100,000 to $149,999 | 1,383 (16.3%) | 1,686 (16.5%) |
| $150,000 or more | 975 (11.5%) | 1,954 (19.2%) |
| Total | 8,487 (100.0%) | 10,203 (100.0%) |
Property Value to Household Income Ratio in Fort Smith
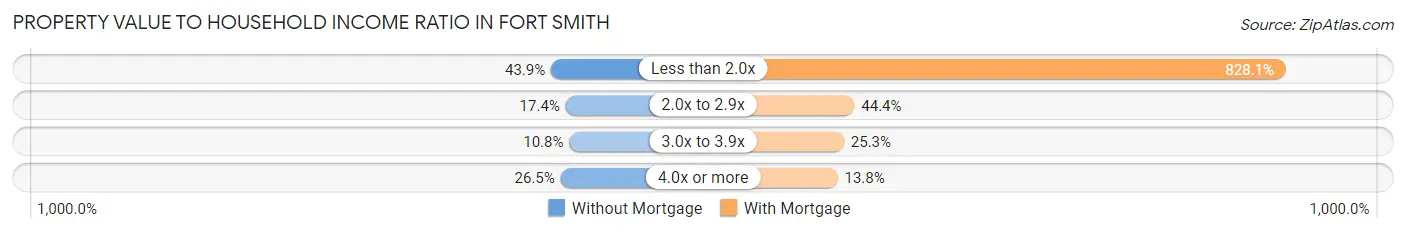
| Value-to-Income Ratio | Without Mortgage | With Mortgage |
| Less than 2.0x | 3,725 (43.9%) | 84,494 (828.1%) |
| 2.0x to 2.9x | 1,474 (17.4%) | 4,534 (44.4%) |
| 3.0x to 3.9x | 920 (10.8%) | 2,579 (25.3%) |
| 4.0x or more | 2,251 (26.5%) | 1,409 (13.8%) |
| Total | 8,487 (100.0%) | 10,203 (100.0%) |
Real Estate Taxes by Mortgage Status in Fort Smith
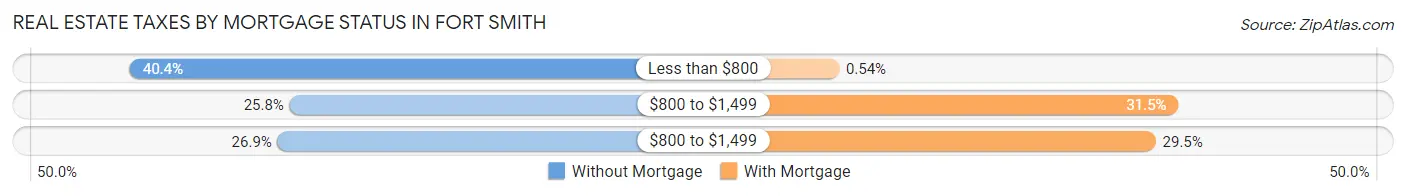
| Property Taxes | Without Mortgage | With Mortgage |
| Less than $800 | 3,428 (40.4%) | 55 (0.5%) |
| $800 to $1,499 | 2,189 (25.8%) | 3,218 (31.5%) |
| $800 to $1,499 | 2,282 (26.9%) | 3,006 (29.5%) |
| Total | 8,487 (100.0%) | 10,203 (100.0%) |
Health & Disability in Fort Smith
Health Insurance Coverage by Age in Fort Smith
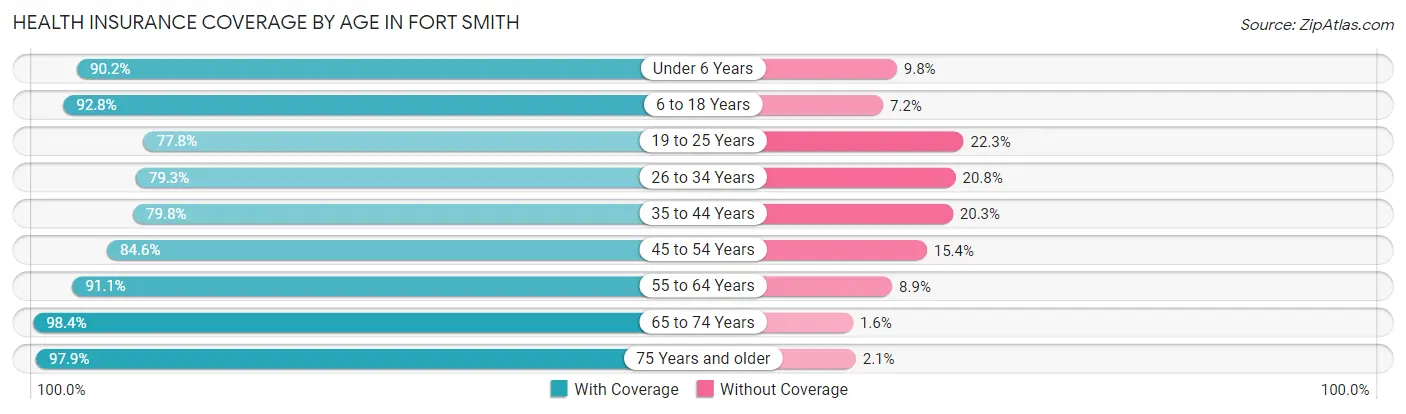
| Age Bracket | With Coverage | Without Coverage |
| Under 6 Years | 6,442 (90.2%) | 700 (9.8%) |
| 6 to 18 Years | 14,080 (92.8%) | 1,097 (7.2%) |
| 19 to 25 Years | 7,383 (77.7%) | 2,113 (22.3%) |
| 26 to 34 Years | 8,899 (79.2%) | 2,330 (20.7%) |
| 35 to 44 Years | 8,864 (79.7%) | 2,251 (20.3%) |
| 45 to 54 Years | 8,174 (84.6%) | 1,487 (15.4%) |
| 55 to 64 Years | 10,407 (91.1%) | 1,020 (8.9%) |
| 65 to 74 Years | 8,041 (98.4%) | 132 (1.6%) |
| 75 Years and older | 4,936 (97.9%) | 108 (2.1%) |
| Total | 77,226 (87.3%) | 11,238 (12.7%) |
Health Insurance Coverage by Citizenship Status in Fort Smith
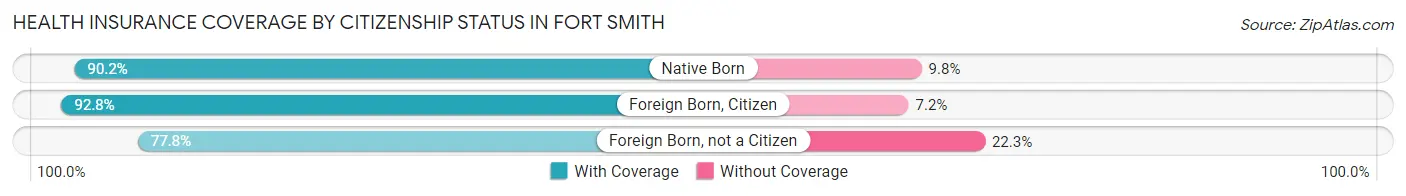
| Citizenship Status | With Coverage | Without Coverage |
| Native Born | 6,442 (90.2%) | 700 (9.8%) |
| Foreign Born, Citizen | 14,080 (92.8%) | 1,097 (7.2%) |
| Foreign Born, not a Citizen | 7,383 (77.7%) | 2,113 (22.3%) |
Health Insurance Coverage by Household Income in Fort Smith
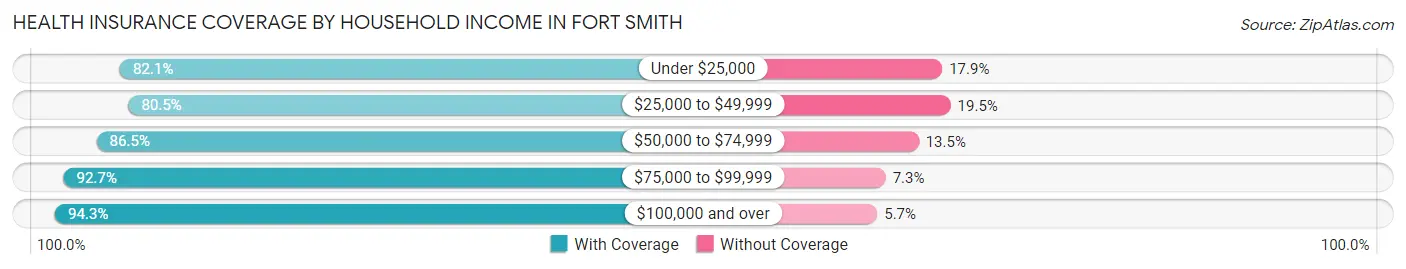
| Household Income | With Coverage | Without Coverage |
| Under $25,000 | 11,065 (82.1%) | 2,410 (17.9%) |
| $25,000 to $49,999 | 17,904 (80.5%) | 4,326 (19.5%) |
| $50,000 to $74,999 | 14,758 (86.5%) | 2,299 (13.5%) |
| $75,000 to $99,999 | 10,664 (92.7%) | 840 (7.3%) |
| $100,000 and over | 22,145 (94.3%) | 1,342 (5.7%) |
Public vs Private Health Insurance Coverage by Age in Fort Smith
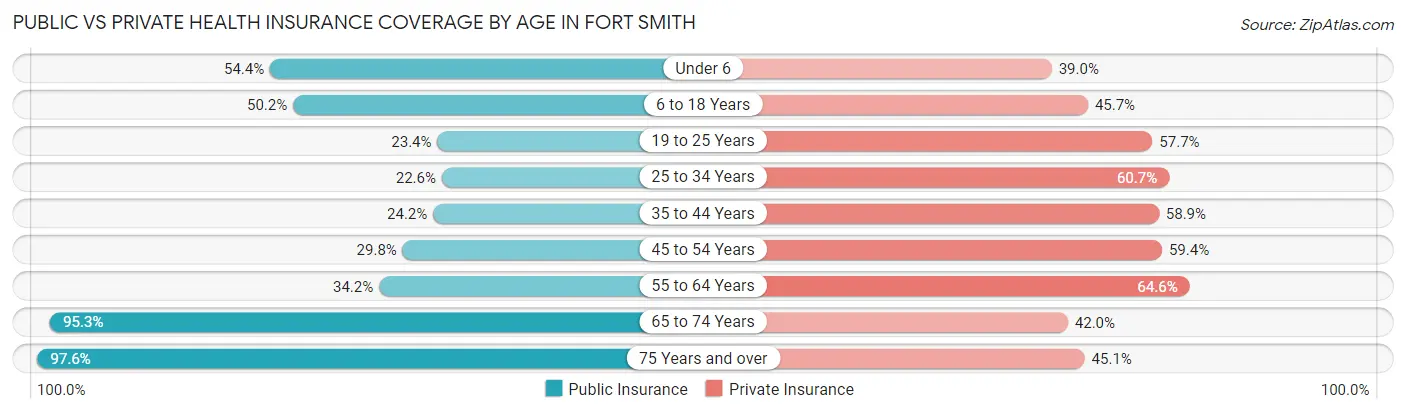
| Age Bracket | Public Insurance | Private Insurance |
| Under 6 | 3,888 (54.4%) | 2,783 (39.0%) |
| 6 to 18 Years | 7,616 (50.2%) | 6,934 (45.7%) |
| 19 to 25 Years | 2,221 (23.4%) | 5,474 (57.7%) |
| 25 to 34 Years | 2,534 (22.6%) | 6,821 (60.7%) |
| 35 to 44 Years | 2,686 (24.2%) | 6,541 (58.9%) |
| 45 to 54 Years | 2,882 (29.8%) | 5,742 (59.4%) |
| 55 to 64 Years | 3,909 (34.2%) | 7,376 (64.5%) |
| 65 to 74 Years | 7,787 (95.3%) | 3,429 (42.0%) |
| 75 Years and over | 4,924 (97.6%) | 2,274 (45.1%) |
| Total | 38,447 (43.5%) | 47,374 (53.5%) |
Disability Status by Sex by Age in Fort Smith
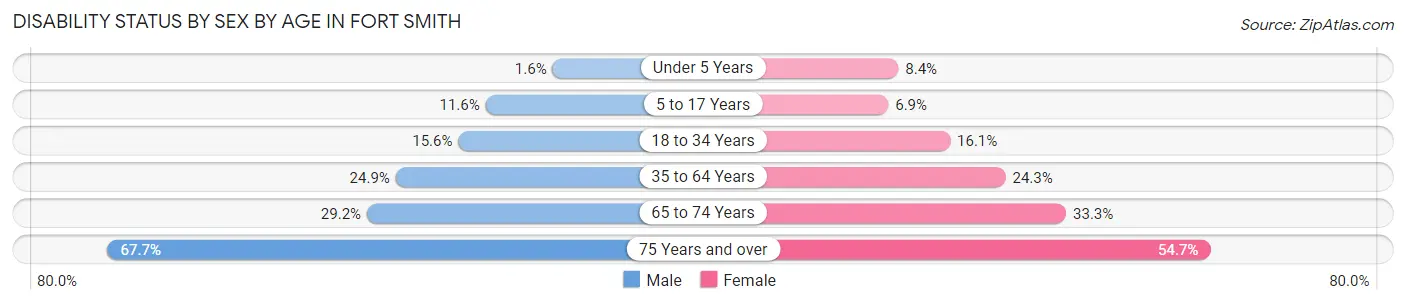
| Age Bracket | Male | Female |
| Under 5 Years | 47 (1.6%) | 250 (8.4%) |
| 5 to 17 Years | 926 (11.6%) | 513 (6.9%) |
| 18 to 34 Years | 1,703 (15.6%) | 1,734 (16.1%) |
| 35 to 64 Years | 3,961 (24.9%) | 3,962 (24.3%) |
| 65 to 74 Years | 1,130 (29.2%) | 1,432 (33.3%) |
| 75 Years and over | 1,337 (67.7%) | 1,678 (54.7%) |
Disability Class by Sex by Age in Fort Smith
Disability Class: Hearing Difficulty
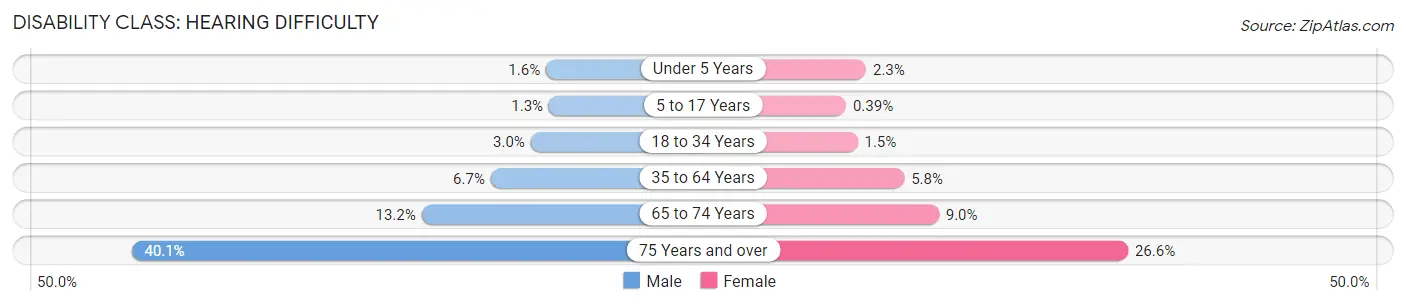
| Age Bracket | Male | Female |
| Under 5 Years | 47 (1.6%) | 67 (2.2%) |
| 5 to 17 Years | 107 (1.3%) | 29 (0.4%) |
| 18 to 34 Years | 331 (3.0%) | 157 (1.5%) |
| 35 to 64 Years | 1,072 (6.7%) | 943 (5.8%) |
| 65 to 74 Years | 510 (13.2%) | 387 (9.0%) |
| 75 Years and over | 792 (40.1%) | 815 (26.6%) |
Disability Class: Vision Difficulty
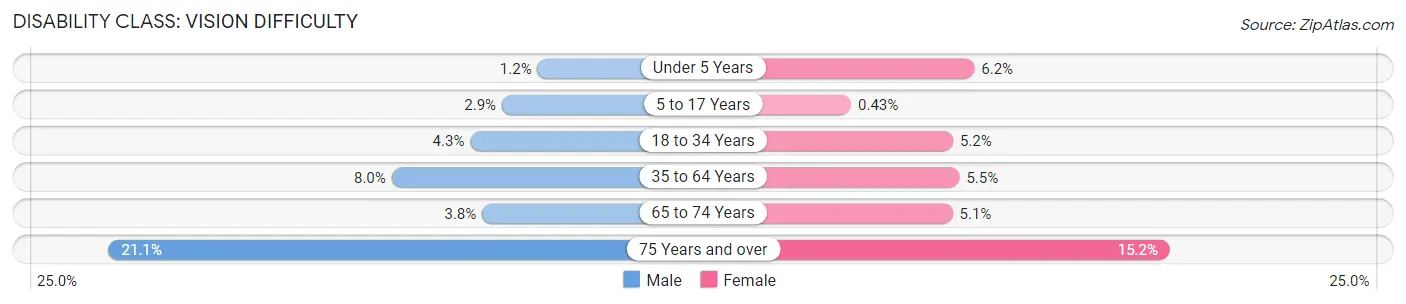
| Age Bracket | Male | Female |
| Under 5 Years | 35 (1.2%) | 183 (6.1%) |
| 5 to 17 Years | 228 (2.9%) | 32 (0.4%) |
| 18 to 34 Years | 472 (4.3%) | 556 (5.2%) |
| 35 to 64 Years | 1,268 (8.0%) | 889 (5.5%) |
| 65 to 74 Years | 146 (3.8%) | 221 (5.1%) |
| 75 Years and over | 417 (21.1%) | 467 (15.2%) |
Disability Class: Cognitive Difficulty
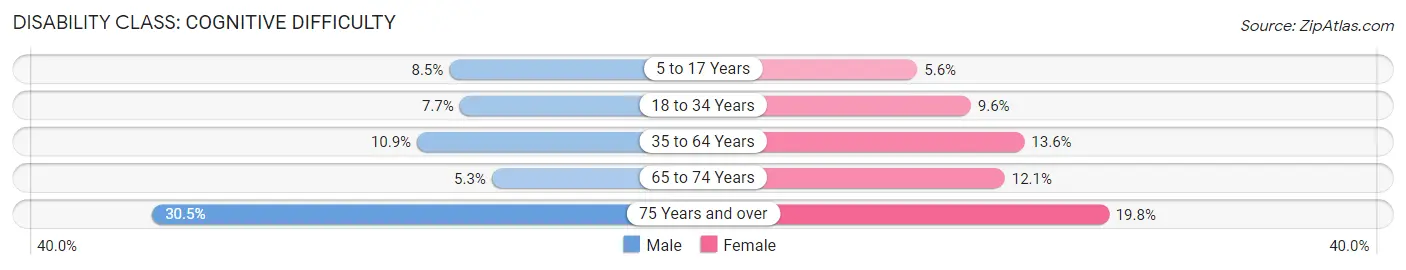
| Age Bracket | Male | Female |
| 5 to 17 Years | 679 (8.5%) | 417 (5.6%) |
| 18 to 34 Years | 841 (7.7%) | 1,033 (9.6%) |
| 35 to 64 Years | 1,729 (10.9%) | 2,210 (13.6%) |
| 65 to 74 Years | 206 (5.3%) | 520 (12.1%) |
| 75 Years and over | 603 (30.5%) | 608 (19.8%) |
Disability Class: Ambulatory Difficulty
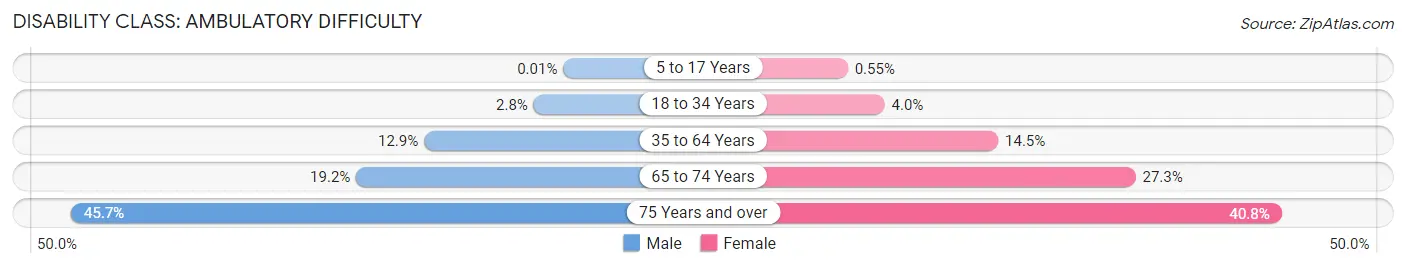
| Age Bracket | Male | Female |
| 5 to 17 Years | 1 (0.0%) | 41 (0.5%) |
| 18 to 34 Years | 300 (2.8%) | 428 (4.0%) |
| 35 to 64 Years | 2,057 (12.9%) | 2,365 (14.5%) |
| 65 to 74 Years | 745 (19.2%) | 1,172 (27.3%) |
| 75 Years and over | 903 (45.7%) | 1,252 (40.8%) |
Disability Class: Self-Care Difficulty
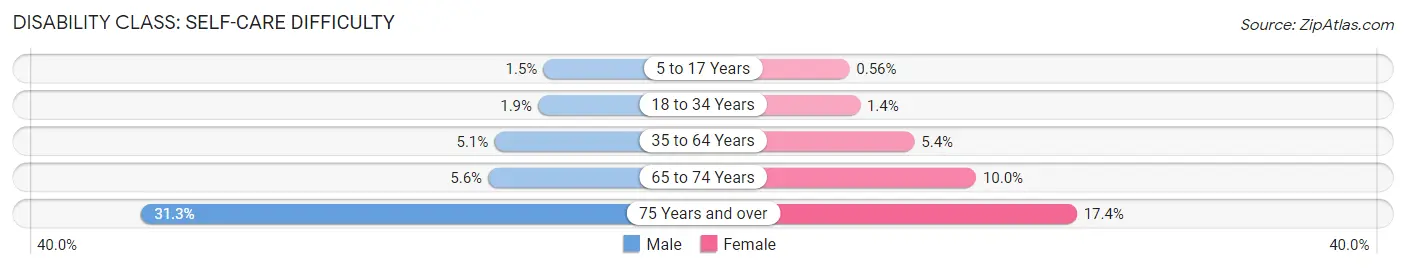
| Age Bracket | Male | Female |
| 5 to 17 Years | 120 (1.5%) | 42 (0.6%) |
| 18 to 34 Years | 206 (1.9%) | 146 (1.3%) |
| 35 to 64 Years | 818 (5.1%) | 879 (5.4%) |
| 65 to 74 Years | 217 (5.6%) | 428 (10.0%) |
| 75 Years and over | 619 (31.3%) | 535 (17.4%) |
Technology Access in Fort Smith
Computing Device Access in Fort Smith
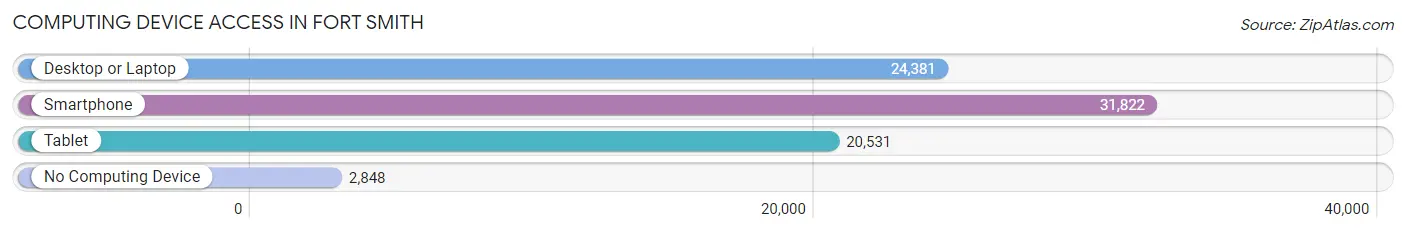
| Device Type | # Households | % Households |
| Desktop or Laptop | 24,381 | 67.0% |
| Smartphone | 31,822 | 87.5% |
| Tablet | 20,531 | 56.5% |
| No Computing Device | 2,848 | 7.8% |
| Total | 36,373 | 100.0% |
Internet Access in Fort Smith
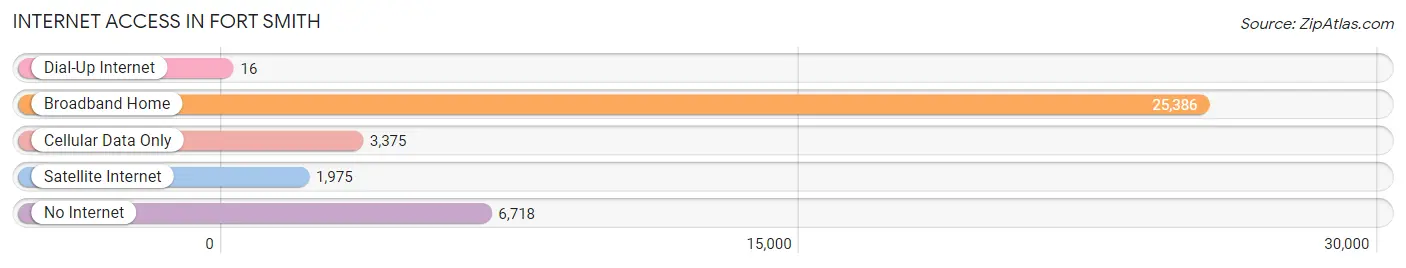
| Internet Type | # Households | % Households |
| Dial-Up Internet | 16 | 0.0% |
| Broadband Home | 25,386 | 69.8% |
| Cellular Data Only | 3,375 | 9.3% |
| Satellite Internet | 1,975 | 5.4% |
| No Internet | 6,718 | 18.5% |
| Total | 36,373 | 100.0% |
Fort Smith Summary
Fort Smith, Arkansas is a city located in Sebastian County in the western part of the state. It is the second-largest city in the state, with a population of 87,443 as of the 2010 census. The city is situated on the Arkansas-Oklahoma border, and is the county seat of Sebastian County.
History
Fort Smith was founded in 1817 as a military post by the United States Army. The post was named after General Thomas Adams Smith, who was the commander of the United States Army's Western Division. The post was established to protect the western border of the United States from Native American tribes. The post was also used to keep the peace between the Native American tribes and the settlers who were moving into the area.
In 1842, the post was designated as a federal court, and the first federal judge was appointed. The court was responsible for trying cases involving Native American tribes, and it was the first federal court west of the Mississippi River.
In 1851, the city was incorporated, and the name was changed to Fort Smith. The city grew rapidly, and by the end of the 19th century, it was the largest city in the state.
Geography
Fort Smith is located in the western part of the state, on the Arkansas-Oklahoma border. The city is situated on the Arkansas River, and is surrounded by the Ozark Mountains. The city has a total area of 64.9 square miles, of which 64.2 square miles is land and 0.7 square miles is water.
The climate in Fort Smith is humid subtropical, with hot, humid summers and mild winters. The average annual temperature is 63.2°F, and the average annual precipitation is 45.2 inches.
Economy
Fort Smith is a major economic center in the region. The city is home to several large companies, including Baldor Electric Company, Gerber Products Company, and Tyson Foods. The city is also home to the University of Arkansas at Fort Smith, which is the second-largest university in the state.
The city's economy is also supported by tourism, as it is home to several attractions, including the Fort Smith National Historic Site, the Fort Smith Museum of History, and the Fort Smith Trolley Museum.
Demographics
As of the 2010 census, the population of Fort Smith was 87,443. The racial makeup of the city was 75.3% White, 15.2% African American, 0.7% Native American, 1.7% Asian, 0.1% Pacific Islander, 4.2% from other races, and 2.9% from two or more races. Hispanic or Latino of any race were 8.3% of the population.
The median income for a household in the city was $35,945, and the median income for a family was $43,945. The per capita income for the city was $20,845. About 17.2% of the population was below the poverty line.
Common Questions
What is Per Capita Income in Fort Smith?
Per Capita income in Fort Smith is $32,809.
What is the Median Family Income in Fort Smith?
Median Family Income in Fort Smith is $62,787.
What is the Median Household income in Fort Smith?
Median Household Income in Fort Smith is $50,799.
What is Income or Wage Gap in Fort Smith?
Income or Wage Gap in Fort Smith is 20.1%.
Women in Fort Smith earn 79.9 cents for every dollar earned by a man.
What is Family Income Deficit in Fort Smith?
Family Income Deficit in Fort Smith is $11,057.
Families that are below poverty line in Fort Smith earn $11,057 less on average than the poverty threshold level.
What is Inequality or Gini Index in Fort Smith?
Inequality or Gini Index in Fort Smith is 0.53.
What is the Total Population of Fort Smith?
Total Population of Fort Smith is 89,315.
What is the Total Male Population of Fort Smith?
Total Male Population of Fort Smith is 44,101.
What is the Total Female Population of Fort Smith?
Total Female Population of Fort Smith is 45,214.
What is the Ratio of Males per 100 Females in Fort Smith?
There are 97.54 Males per 100 Females in Fort Smith.
What is the Ratio of Females per 100 Males in Fort Smith?
There are 102.52 Females per 100 Males in Fort Smith.
What is the Median Population Age in Fort Smith?
Median Population Age in Fort Smith is 36.4 Years.
What is the Average Family Size in Fort Smith
Average Family Size in Fort Smith is 3.0 People.
What is the Average Household Size in Fort Smith
Average Household Size in Fort Smith is 2.4 People.
How Large is the Labor Force in Fort Smith?
There are 43,302 People in the Labor Forcein in Fort Smith.
What is the Percentage of People in the Labor Force in Fort Smith?
61.4% of People are in the Labor Force in Fort Smith.
What is the Unemployment Rate in Fort Smith?
Unemployment Rate in Fort Smith is 6.1%.