Johnson County, AR Map & Demographics
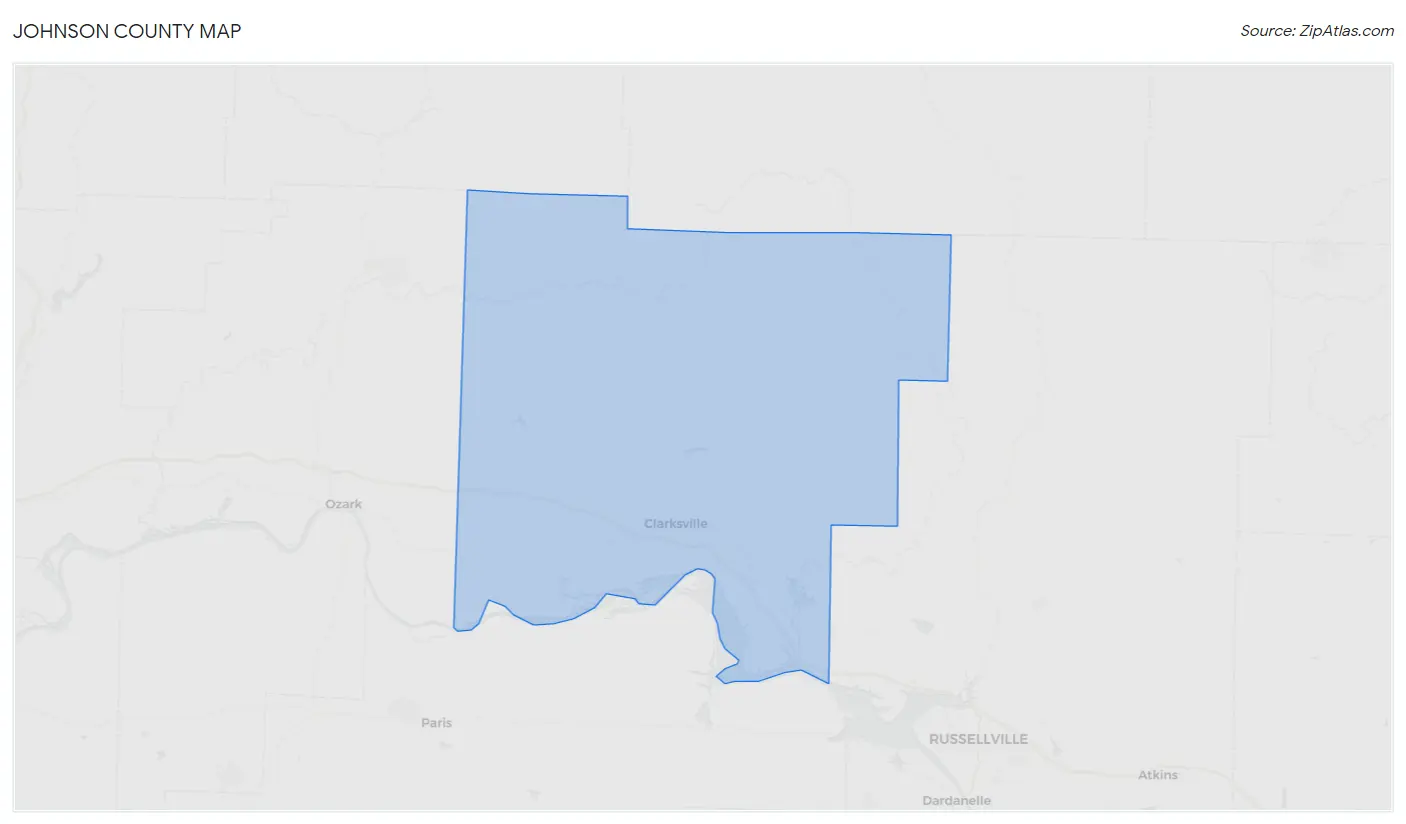
Johnson County Map
Johnson County Overview
$22,457
PER CAPITA INCOME
$52,822
AVG FAMILY INCOME
$42,470
AVG HOUSEHOLD INCOME
27.5%
WAGE / INCOME GAP [ % ]
72.5¢/ $1
WAGE / INCOME GAP [ $ ]
$11,151
FAMILY INCOME DEFICIT
0.45
INEQUALITY / GINI INDEX
25,925
TOTAL POPULATION
12,974
MALE POPULATION
12,951
FEMALE POPULATION
100.18
MALES / 100 FEMALES
99.82
FEMALES / 100 MALES
39.0
MEDIAN AGE
3.1
AVG FAMILY SIZE
2.5
AVG HOUSEHOLD SIZE
10,484
LABOR FORCE [ PEOPLE ]
51.8%
PERCENT IN LABOR FORCE
4.8%
UNEMPLOYMENT RATE
Johnson County Area Codes
Income in Johnson County
Income Overview in Johnson County
Per Capita Income in Johnson County is $22,457, while median incomes of families and households are $52,822 and $42,470 respectively.
| Characteristic | Number | Measure |
| Per Capita Income | 25,925 | $22,457 |
| Median Family Income | 6,625 | $52,822 |
| Mean Family Income | 6,625 | $67,010 |
| Median Household Income | 9,899 | $42,470 |
| Mean Household Income | 9,899 | $56,684 |
| Income Deficit | 6,625 | $11,151 |
| Wage / Income Gap (%) | 25,925 | 27.51% |
| Wage / Income Gap ($) | 25,925 | 72.49¢ per $1 |
| Gini / Inequality Index | 25,925 | 0.45 |
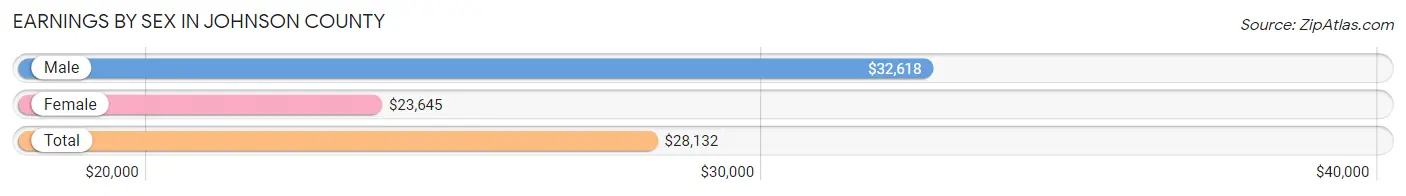
Earnings by Sex in Johnson County
Average Earnings in Johnson County are $28,132, $32,618 for men and $23,645 for women, a difference of 27.5%.
| Sex | Number | Average Earnings |
| Male | 5,962 (54.3%) | $32,618 |
| Female | 5,010 (45.7%) | $23,645 |
| Total | 10,972 (100.0%) | $28,132 |
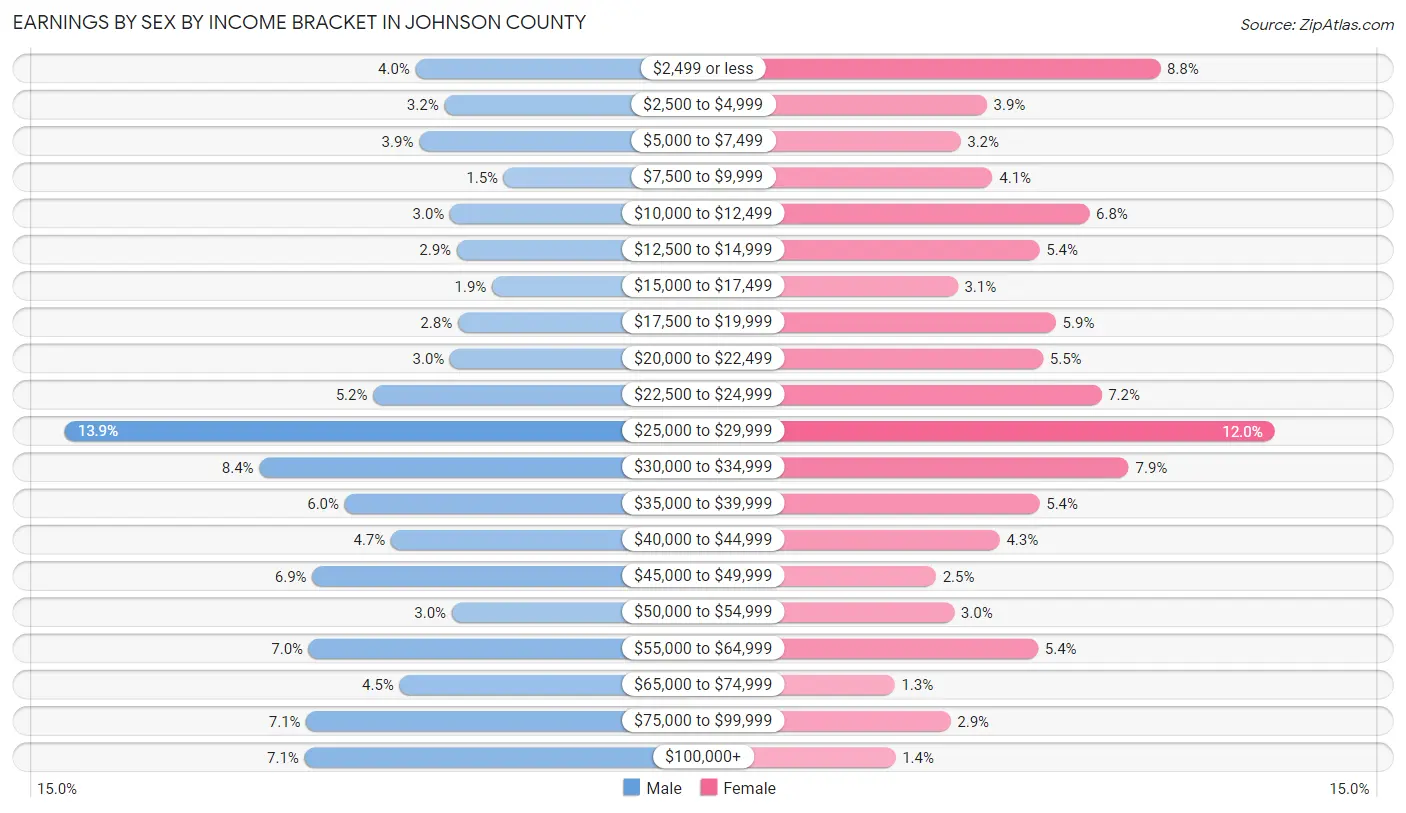
Earnings by Sex by Income Bracket in Johnson County
The most common earnings brackets in Johnson County are $25,000 to $29,999 for men (827 | 13.9%) and $25,000 to $29,999 for women (602 | 12.0%).
| Income | Male | Female |
| $2,499 or less | 239 (4.0%) | 441 (8.8%) |
| $2,500 to $4,999 | 191 (3.2%) | 197 (3.9%) |
| $5,000 to $7,499 | 233 (3.9%) | 160 (3.2%) |
| $7,500 to $9,999 | 91 (1.5%) | 205 (4.1%) |
| $10,000 to $12,499 | 181 (3.0%) | 341 (6.8%) |
| $12,500 to $14,999 | 170 (2.9%) | 271 (5.4%) |
| $15,000 to $17,499 | 111 (1.9%) | 156 (3.1%) |
| $17,500 to $19,999 | 168 (2.8%) | 294 (5.9%) |
| $20,000 to $22,499 | 181 (3.0%) | 276 (5.5%) |
| $22,500 to $24,999 | 310 (5.2%) | 358 (7.1%) |
| $25,000 to $29,999 | 827 (13.9%) | 602 (12.0%) |
| $30,000 to $34,999 | 501 (8.4%) | 397 (7.9%) |
| $35,000 to $39,999 | 358 (6.0%) | 271 (5.4%) |
| $40,000 to $44,999 | 280 (4.7%) | 215 (4.3%) |
| $45,000 to $49,999 | 412 (6.9%) | 125 (2.5%) |
| $50,000 to $54,999 | 178 (3.0%) | 151 (3.0%) |
| $55,000 to $64,999 | 418 (7.0%) | 269 (5.4%) |
| $65,000 to $74,999 | 266 (4.5%) | 67 (1.3%) |
| $75,000 to $99,999 | 422 (7.1%) | 146 (2.9%) |
| $100,000+ | 425 (7.1%) | 68 (1.4%) |
| Total | 5,962 (100.0%) | 5,010 (100.0%) |
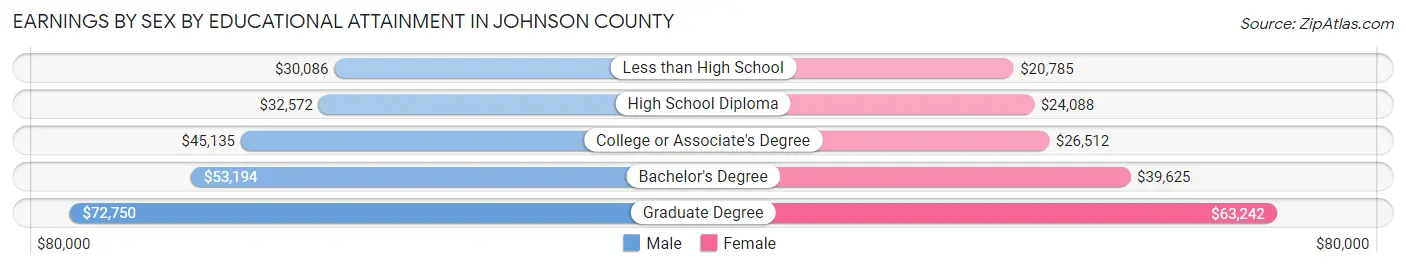
Earnings by Sex by Educational Attainment in Johnson County
Average earnings in Johnson County are $35,620 for men and $26,424 for women, a difference of 25.8%. Men with an educational attainment of graduate degree enjoy the highest average annual earnings of $72,750, while those with less than high school education earn the least with $30,086. Women with an educational attainment of graduate degree earn the most with the average annual earnings of $63,242, while those with less than high school education have the smallest earnings of $20,785.
| Educational Attainment | Male Income | Female Income |
| Less than High School | $30,086 | $20,785 |
| High School Diploma | $32,572 | $24,088 |
| College or Associate's Degree | $45,135 | $26,512 |
| Bachelor's Degree | $53,194 | $39,625 |
| Graduate Degree | $72,750 | $63,242 |
| Total | $35,620 | $26,424 |
Family Income in Johnson County
Family Income Brackets in Johnson County
According to the Johnson County family income data, there are 1,398 families falling into the $50,000 to $74,999 income range, which is the most common income bracket and makes up 21.1% of all families. Conversely, the $200,000+ income bracket is the least frequent group with only 186 families (2.8%) belonging to this category.
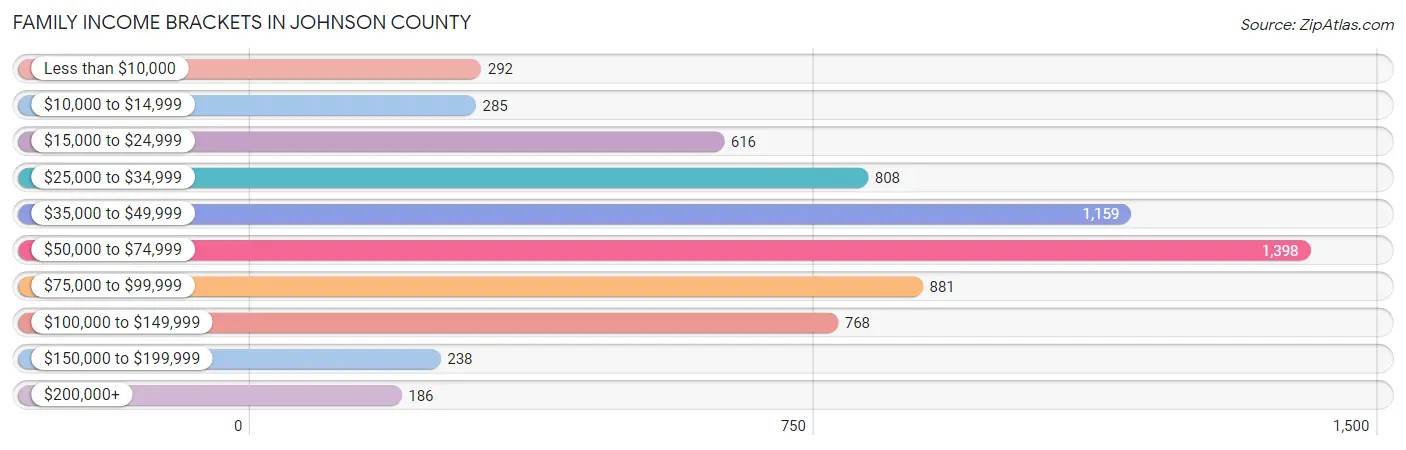
| Income Bracket | # Families | % Families |
| Less than $10,000 | 292 | 4.4% |
| $10,000 to $14,999 | 285 | 4.3% |
| $15,000 to $24,999 | 616 | 9.3% |
| $25,000 to $34,999 | 808 | 12.2% |
| $35,000 to $49,999 | 1,159 | 17.5% |
| $50,000 to $74,999 | 1,398 | 21.1% |
| $75,000 to $99,999 | 881 | 13.3% |
| $100,000 to $149,999 | 768 | 11.6% |
| $150,000 to $199,999 | 238 | 3.6% |
| $200,000+ | 186 | 2.8% |
Family Income by Famaliy Size in Johnson County
6-person families (260 | 3.9%) account for the highest median family income in Johnson County with $77,698 per family, while 2-person families (3,302 | 49.8%) have the highest median income of $24,418 per family member.
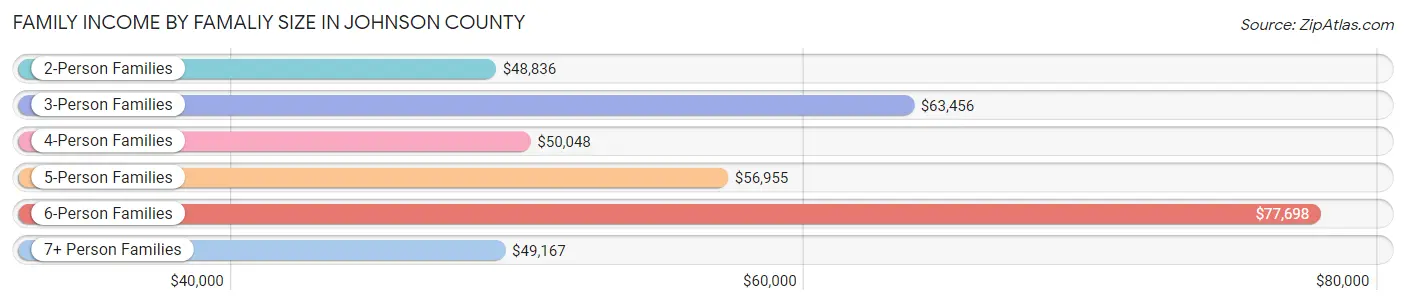
| Income Bracket | # Families | Median Income |
| 2-Person Families | 3,302 (49.8%) | $48,836 |
| 3-Person Families | 1,274 (19.2%) | $63,456 |
| 4-Person Families | 1,057 (16.0%) | $50,048 |
| 5-Person Families | 586 (8.8%) | $56,955 |
| 6-Person Families | 260 (3.9%) | $77,698 |
| 7+ Person Families | 146 (2.2%) | $49,167 |
| Total | 6,625 (100.0%) | $52,822 |
Family Income by Number of Earners in Johnson County
The median family income in Johnson County is $52,822, with families comprising 3+ earners (347) having the highest median family income of $135,824, while families with no earners (1,723) have the lowest median family income of $32,658, accounting for 5.2% and 26.0% of families, respectively.
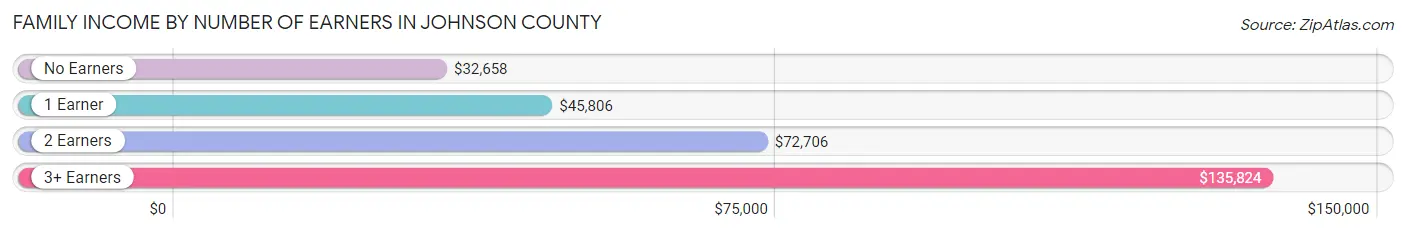
| Number of Earners | # Families | Median Income |
| No Earners | 1,723 (26.0%) | $32,658 |
| 1 Earner | 2,256 (34.1%) | $45,806 |
| 2 Earners | 2,299 (34.7%) | $72,706 |
| 3+ Earners | 347 (5.2%) | $135,824 |
| Total | 6,625 (100.0%) | $52,822 |
Household Income in Johnson County
Household Income Brackets in Johnson County
With 1,703 households falling in the category, the $35,000 to $49,999 income range is the most frequent in Johnson County, accounting for 17.2% of all households. In contrast, only 198 households (2.0%) fall into the $200,000+ income bracket, making it the least populous group.
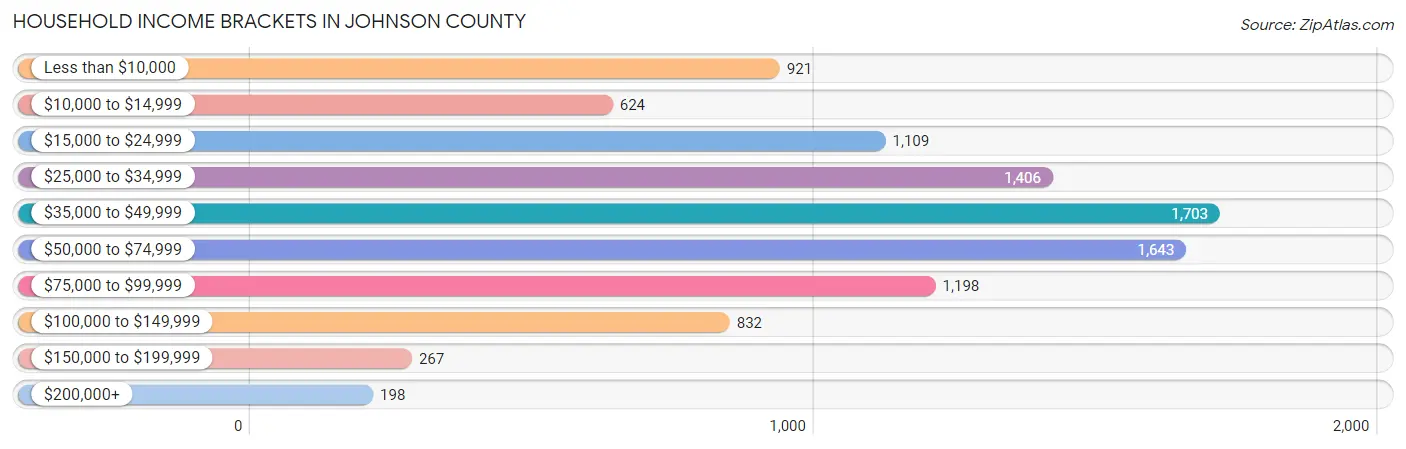
| Income Bracket | # Households | % Households |
| Less than $10,000 | 921 | 9.3% |
| $10,000 to $14,999 | 624 | 6.3% |
| $15,000 to $24,999 | 1,109 | 11.2% |
| $25,000 to $34,999 | 1,406 | 14.2% |
| $35,000 to $49,999 | 1,703 | 17.2% |
| $50,000 to $74,999 | 1,643 | 16.6% |
| $75,000 to $99,999 | 1,198 | 12.1% |
| $100,000 to $149,999 | 832 | 8.4% |
| $150,000 to $199,999 | 267 | 2.7% |
| $200,000+ | 198 | 2.0% |
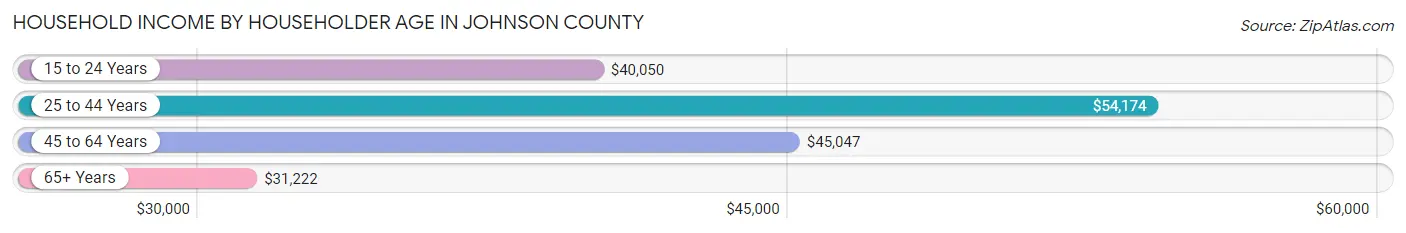
Household Income by Householder Age in Johnson County
The median household income in Johnson County is $42,470, with the highest median household income of $54,174 found in the 25 to 44 years age bracket for the primary householder. A total of 3,061 households (30.9%) fall into this category. Meanwhile, the 65+ years age bracket for the primary householder has the lowest median household income of $31,222, with 2,777 households (28.1%) in this group.
| Income Bracket | # Households | Median Income |
| 15 to 24 Years | 375 (3.8%) | $40,050 |
| 25 to 44 Years | 3,061 (30.9%) | $54,174 |
| 45 to 64 Years | 3,686 (37.2%) | $45,047 |
| 65+ Years | 2,777 (28.1%) | $31,222 |
| Total | 9,899 (100.0%) | $42,470 |
Poverty in Johnson County
Income Below Poverty by Sex and Age in Johnson County
With 17.9% poverty level for males and 24.5% for females among the residents of Johnson County, under 5 year old males and 5 year old females are the most vulnerable to poverty, with 320 males (36.9%) and 78 females (66.7%) in their respective age groups living below the poverty level.
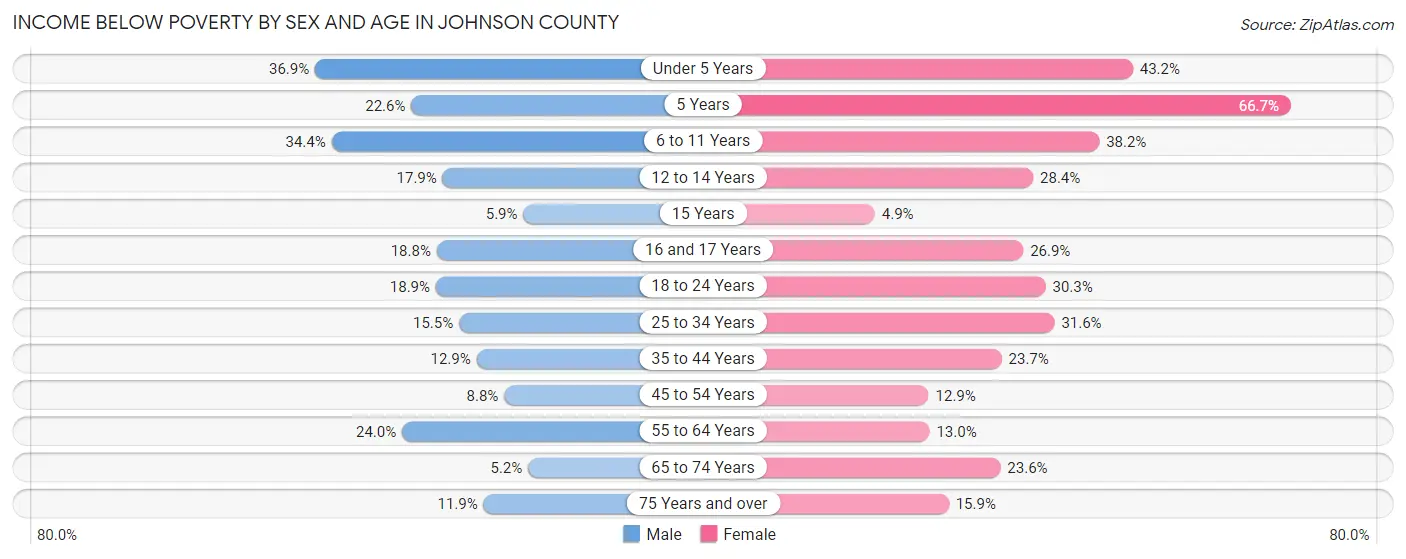
| Age Bracket | Male | Female |
| Under 5 Years | 320 (36.9%) | 353 (43.2%) |
| 5 Years | 35 (22.6%) | 78 (66.7%) |
| 6 to 11 Years | 381 (34.4%) | 386 (38.2%) |
| 12 to 14 Years | 97 (17.9%) | 154 (28.4%) |
| 15 Years | 12 (5.9%) | 11 (4.9%) |
| 16 and 17 Years | 66 (18.8%) | 97 (26.9%) |
| 18 to 24 Years | 198 (18.9%) | 240 (30.3%) |
| 25 to 34 Years | 226 (15.5%) | 521 (31.6%) |
| 35 to 44 Years | 197 (12.9%) | 326 (23.7%) |
| 45 to 54 Years | 139 (8.8%) | 216 (12.9%) |
| 55 to 64 Years | 439 (23.9%) | 224 (13.0%) |
| 65 to 74 Years | 65 (5.2%) | 316 (23.5%) |
| 75 Years and over | 89 (11.8%) | 141 (15.9%) |
| Total | 2,264 (17.9%) | 3,063 (24.5%) |
Income Above Poverty by Sex and Age in Johnson County
According to the poverty statistics in Johnson County, males aged 65 to 74 years and females aged 15 years are the age groups that are most secure financially, with 94.8% of males and 95.1% of females in these age groups living above the poverty line.
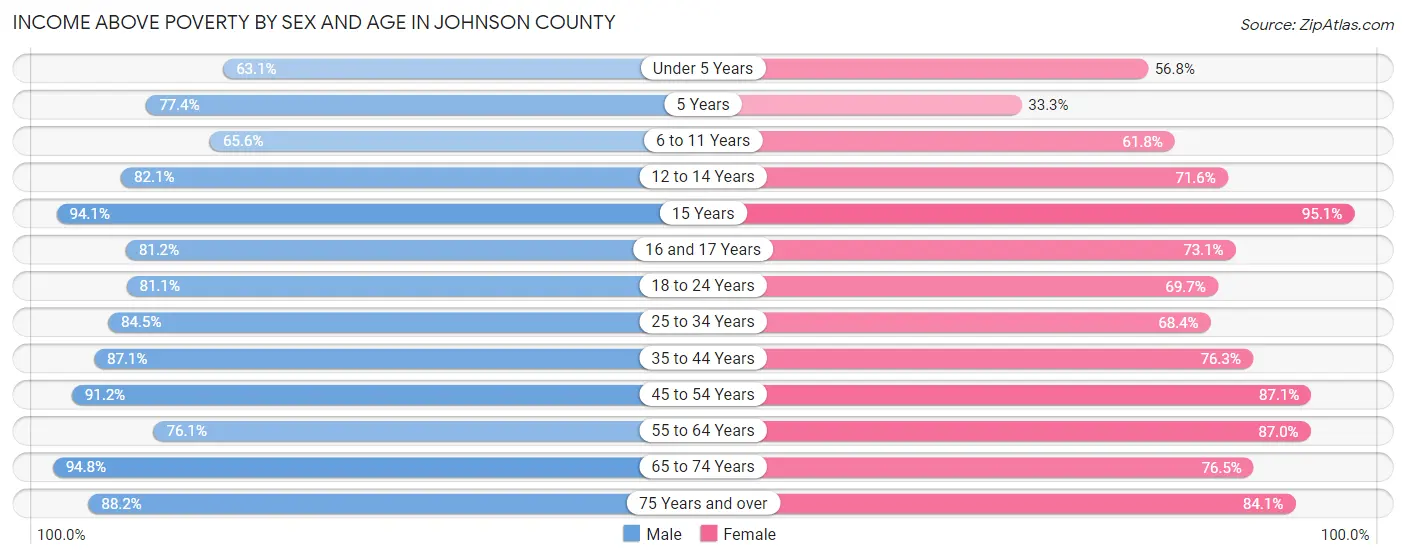
| Age Bracket | Male | Female |
| Under 5 Years | 548 (63.1%) | 464 (56.8%) |
| 5 Years | 120 (77.4%) | 39 (33.3%) |
| 6 to 11 Years | 726 (65.6%) | 624 (61.8%) |
| 12 to 14 Years | 444 (82.1%) | 388 (71.6%) |
| 15 Years | 190 (94.1%) | 213 (95.1%) |
| 16 and 17 Years | 285 (81.2%) | 263 (73.1%) |
| 18 to 24 Years | 848 (81.1%) | 553 (69.7%) |
| 25 to 34 Years | 1,233 (84.5%) | 1,129 (68.4%) |
| 35 to 44 Years | 1,331 (87.1%) | 1,048 (76.3%) |
| 45 to 54 Years | 1,442 (91.2%) | 1,460 (87.1%) |
| 55 to 64 Years | 1,394 (76.0%) | 1,497 (87.0%) |
| 65 to 74 Years | 1,178 (94.8%) | 1,026 (76.4%) |
| 75 Years and over | 662 (88.1%) | 747 (84.1%) |
| Total | 10,401 (82.1%) | 9,451 (75.5%) |
Income Below Poverty Among Married-Couple Families in Johnson County
The poverty statistics for married-couple families in Johnson County show that 8.0% or 403 of the total 5,066 families live below the poverty line. Families with 5 or more children have the highest poverty rate of 53.9%, comprising of 55 families. On the other hand, families with no children have the lowest poverty rate of 4.9%, which includes 153 families.
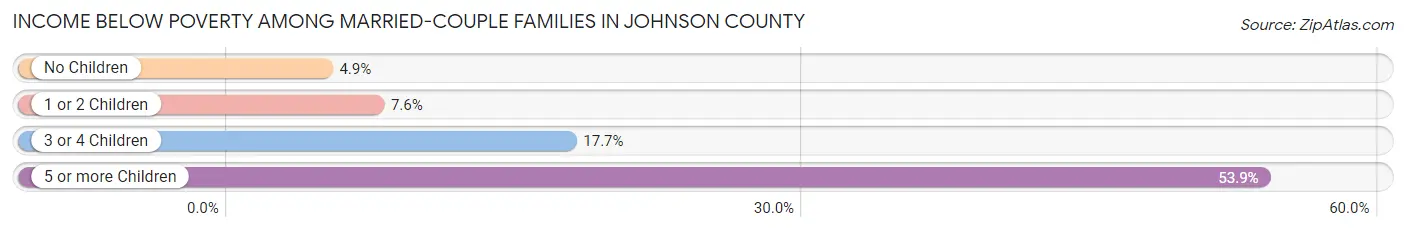
| Children | Above Poverty | Below Poverty |
| No Children | 2,953 (95.1%) | 153 (4.9%) |
| 1 or 2 Children | 1,225 (92.4%) | 101 (7.6%) |
| 3 or 4 Children | 438 (82.3%) | 94 (17.7%) |
| 5 or more Children | 47 (46.1%) | 55 (53.9%) |
| Total | 4,663 (92.0%) | 403 (8.0%) |
Income Below Poverty Among Single-Parent Households in Johnson County
According to the poverty data in Johnson County, 17.2% or 82 single-father households and 51.7% or 559 single-mother households are living below the poverty line. Among single-father households, those with 3 or 4 children have the highest poverty rate, with 20 households (27.8%) experiencing poverty. Likewise, among single-mother households, those with 3 or 4 children have the highest poverty rate, with 159 households (100.0%) falling below the poverty line.
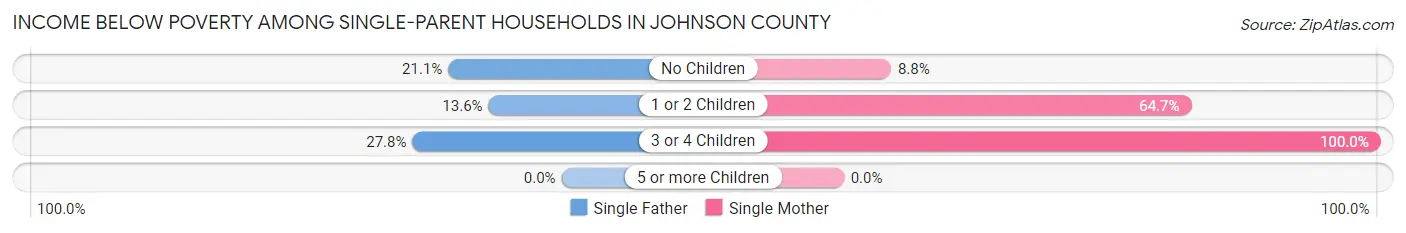
| Children | Single Father | Single Mother |
| No Children | 19 (21.1%) | 31 (8.8%) |
| 1 or 2 Children | 43 (13.6%) | 369 (64.7%) |
| 3 or 4 Children | 20 (27.8%) | 159 (100.0%) |
| 5 or more Children | 0 (0.0%) | 0 (0.0%) |
| Total | 82 (17.2%) | 559 (51.7%) |
Income Below Poverty Among Married-Couple vs Single-Parent Households in Johnson County
The poverty data for Johnson County shows that 403 of the married-couple family households (8.0%) and 641 of the single-parent households (41.1%) are living below the poverty level. Within the married-couple family households, those with 5 or more children have the highest poverty rate, with 55 households (53.9%) falling below the poverty line. Among the single-parent households, those with 3 or 4 children have the highest poverty rate, with 179 household (77.5%) living below poverty.
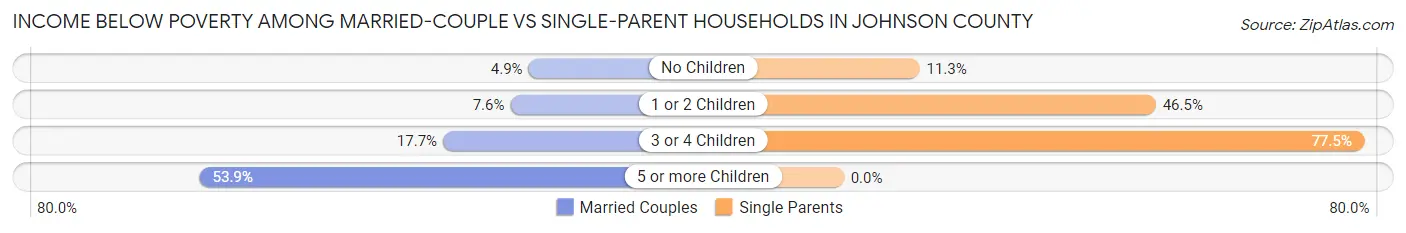
| Children | Married-Couple Families | Single-Parent Households |
| No Children | 153 (4.9%) | 50 (11.3%) |
| 1 or 2 Children | 101 (7.6%) | 412 (46.5%) |
| 3 or 4 Children | 94 (17.7%) | 179 (77.5%) |
| 5 or more Children | 55 (53.9%) | 0 (0.0%) |
| Total | 403 (8.0%) | 641 (41.1%) |
Race in Johnson County
The most populous races in Johnson County are White / Caucasian (22,047 | 85.0%), Hispanic or Latino (3,736 | 14.4%), and Two or more Races (2,024 | 7.8%).
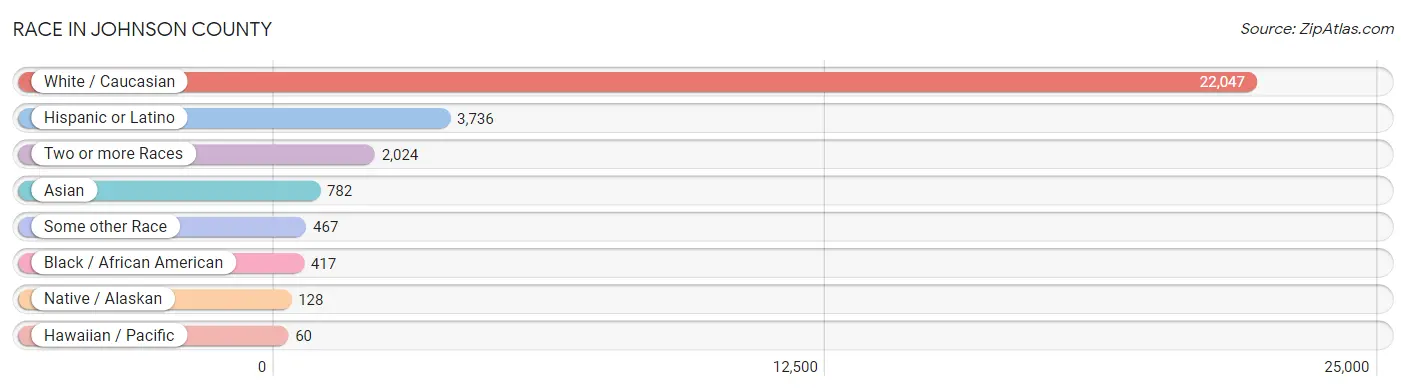
| Race | # Population | % Population |
| Asian | 782 | 3.0% |
| Black / African American | 417 | 1.6% |
| Hawaiian / Pacific | 60 | 0.2% |
| Hispanic or Latino | 3,736 | 14.4% |
| Native / Alaskan | 128 | 0.5% |
| White / Caucasian | 22,047 | 85.0% |
| Two or more Races | 2,024 | 7.8% |
| Some other Race | 467 | 1.8% |
| Total | 25,925 | 100.0% |
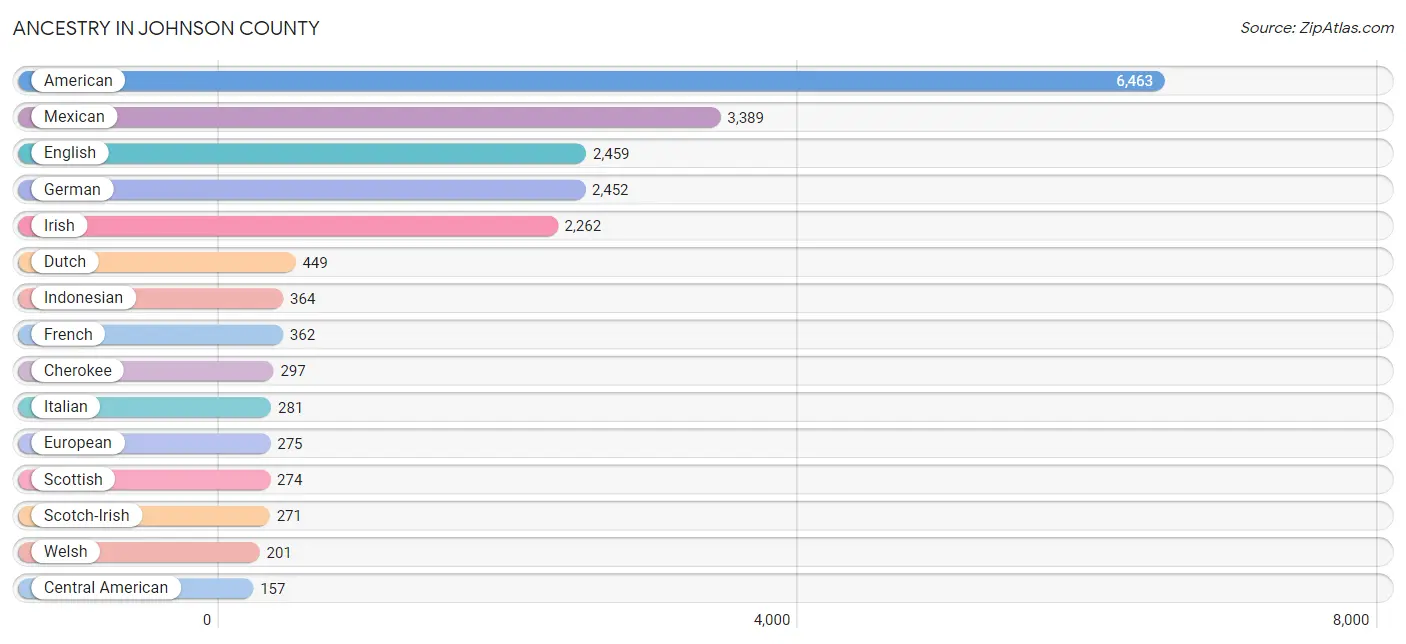
Ancestry in Johnson County
The most populous ancestries reported in Johnson County are American (6,463 | 24.9%), Mexican (3,389 | 13.1%), English (2,459 | 9.5%), German (2,452 | 9.5%), and Irish (2,262 | 8.7%), together accounting for 65.7% of all Johnson County residents.
| Ancestry | # Population | % Population |
| African | 6 | 0.0% |
| American | 6,463 | 24.9% |
| Arab | 6 | 0.0% |
| Australian | 6 | 0.0% |
| Austrian | 22 | 0.1% |
| Bahamian | 15 | 0.1% |
| Bangladeshi | 14 | 0.1% |
| Bhutanese | 45 | 0.2% |
| Blackfeet | 6 | 0.0% |
| British | 52 | 0.2% |
| Burmese | 54 | 0.2% |
| Cajun | 29 | 0.1% |
| Canadian | 17 | 0.1% |
| Central American | 157 | 0.6% |
| Central American Indian | 98 | 0.4% |
| Cherokee | 297 | 1.1% |
| Choctaw | 20 | 0.1% |
| Comanche | 44 | 0.2% |
| Creek | 4 | 0.0% |
| Cuban | 13 | 0.1% |
| Czech | 6 | 0.0% |
| Czechoslovakian | 3 | 0.0% |
| Danish | 33 | 0.1% |
| Dutch | 449 | 1.7% |
| Dutch West Indian | 12 | 0.1% |
| Eastern European | 14 | 0.1% |
| English | 2,459 | 9.5% |
| European | 275 | 1.1% |
| Finnish | 84 | 0.3% |
| French | 362 | 1.4% |
| French Canadian | 26 | 0.1% |
| German | 2,452 | 9.5% |
| Greek | 32 | 0.1% |
| Guamanian / Chamorro | 14 | 0.1% |
| Guatemalan | 8 | 0.0% |
| Haitian | 51 | 0.2% |
| Indian (Asian) | 58 | 0.2% |
| Indonesian | 364 | 1.4% |
| Iranian | 32 | 0.1% |
| Irish | 2,262 | 8.7% |
| Italian | 281 | 1.1% |
| Jamaican | 13 | 0.1% |
| Japanese | 64 | 0.3% |
| Korean | 96 | 0.4% |
| Latvian | 11 | 0.0% |
| Lebanese | 6 | 0.0% |
| Lithuanian | 33 | 0.1% |
| Lumbee | 29 | 0.1% |
| Mexican | 3,389 | 13.1% |
| Native Hawaiian | 6 | 0.0% |
| Nicaraguan | 6 | 0.0% |
| Norwegian | 60 | 0.2% |
| Pennsylvania German | 11 | 0.0% |
| Peruvian | 32 | 0.1% |
| Polish | 95 | 0.4% |
| Portuguese | 63 | 0.2% |
| Puerto Rican | 134 | 0.5% |
| Romanian | 7 | 0.0% |
| Russian | 20 | 0.1% |
| Salvadoran | 143 | 0.5% |
| Samoan | 16 | 0.1% |
| Scandinavian | 50 | 0.2% |
| Scotch-Irish | 271 | 1.1% |
| Scottish | 274 | 1.1% |
| Sioux | 2 | 0.0% |
| Slavic | 1 | 0.0% |
| Slovak | 3 | 0.0% |
| South American | 32 | 0.1% |
| Spanish | 11 | 0.0% |
| Sri Lankan | 92 | 0.4% |
| Subsaharan African | 6 | 0.0% |
| Swedish | 85 | 0.3% |
| Swiss | 92 | 0.4% |
| Ukrainian | 4 | 0.0% |
| Welsh | 201 | 0.8% | View All 75 Rows |
Immigrants in Johnson County
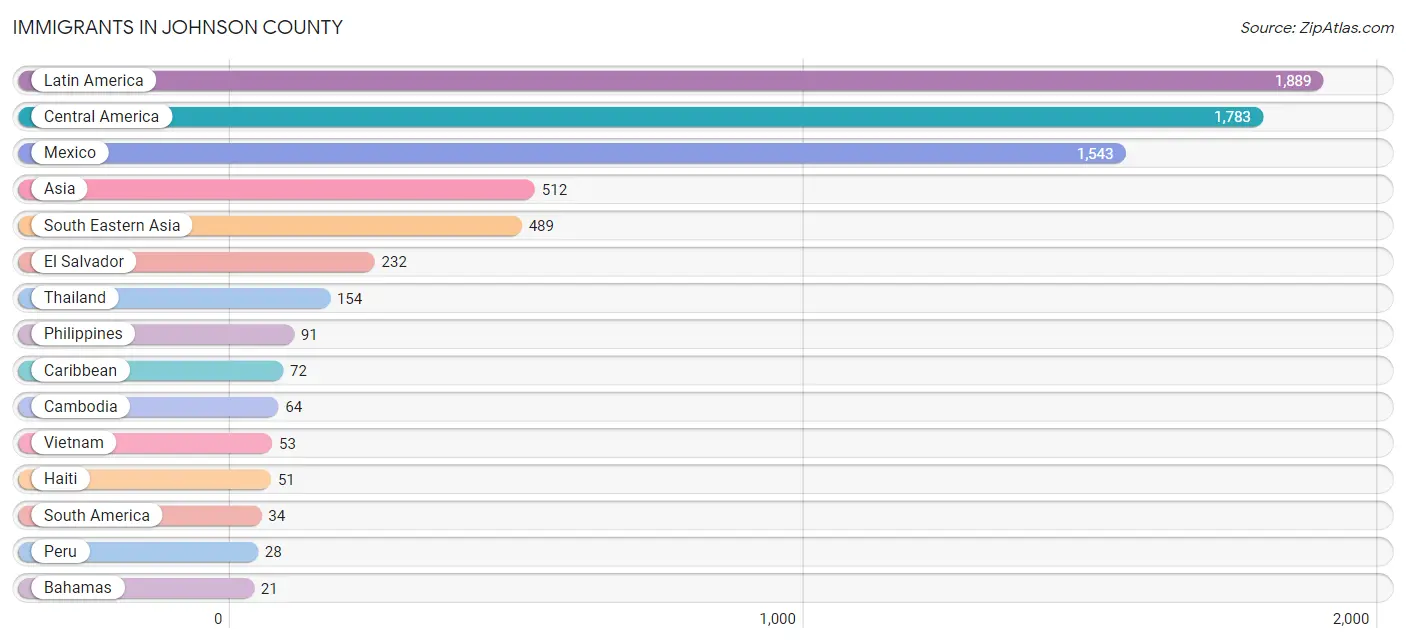
The most numerous immigrant groups reported in Johnson County came from Latin America (1,889 | 7.3%), Central America (1,783 | 6.9%), Mexico (1,543 | 5.9%), Asia (512 | 2.0%), and South Eastern Asia (489 | 1.9%), together accounting for 24.0% of all Johnson County residents.
| Immigration Origin | # Population | % Population |
| Asia | 512 | 2.0% |
| Bahamas | 21 | 0.1% |
| Cambodia | 64 | 0.3% |
| Caribbean | 72 | 0.3% |
| Central America | 1,783 | 6.9% |
| China | 16 | 0.1% |
| Colombia | 6 | 0.0% |
| Eastern Asia | 16 | 0.1% |
| El Salvador | 232 | 0.9% |
| Guatemala | 8 | 0.0% |
| Haiti | 51 | 0.2% |
| India | 7 | 0.0% |
| Latin America | 1,889 | 7.3% |
| Mexico | 1,543 | 5.9% |
| Peru | 28 | 0.1% |
| Philippines | 91 | 0.4% |
| South America | 34 | 0.1% |
| South Central Asia | 7 | 0.0% |
| South Eastern Asia | 489 | 1.9% |
| Thailand | 154 | 0.6% |
| Vietnam | 53 | 0.2% | View All 21 Rows |
Sex and Age in Johnson County
Sex and Age in Johnson County
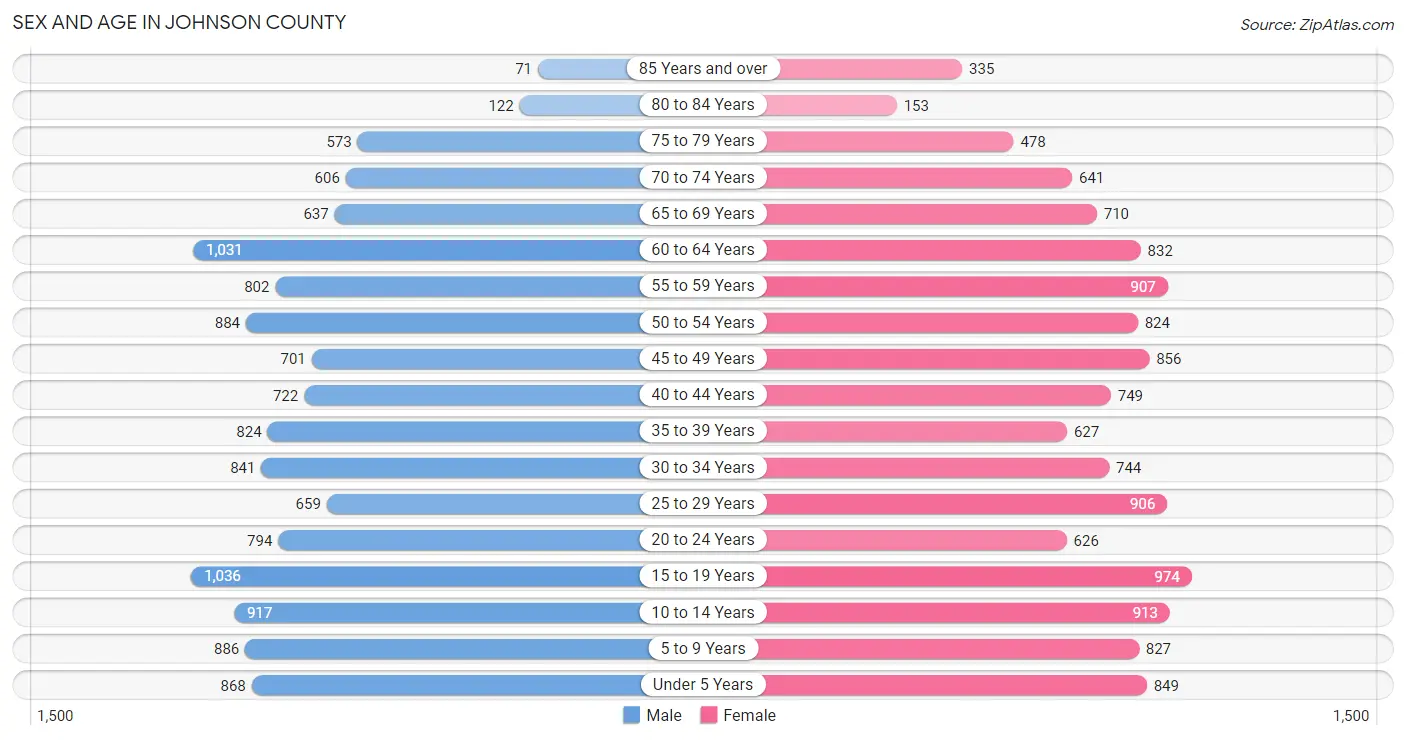
The most populous age groups in Johnson County are 15 to 19 Years (1,036 | 8.0%) for men and 15 to 19 Years (974 | 7.5%) for women.
| Age Bracket | Male | Female |
| Under 5 Years | 868 (6.7%) | 849 (6.6%) |
| 5 to 9 Years | 886 (6.8%) | 827 (6.4%) |
| 10 to 14 Years | 917 (7.1%) | 913 (7.0%) |
| 15 to 19 Years | 1,036 (8.0%) | 974 (7.5%) |
| 20 to 24 Years | 794 (6.1%) | 626 (4.8%) |
| 25 to 29 Years | 659 (5.1%) | 906 (7.0%) |
| 30 to 34 Years | 841 (6.5%) | 744 (5.7%) |
| 35 to 39 Years | 824 (6.4%) | 627 (4.8%) |
| 40 to 44 Years | 722 (5.6%) | 749 (5.8%) |
| 45 to 49 Years | 701 (5.4%) | 856 (6.6%) |
| 50 to 54 Years | 884 (6.8%) | 824 (6.4%) |
| 55 to 59 Years | 802 (6.2%) | 907 (7.0%) |
| 60 to 64 Years | 1,031 (8.0%) | 832 (6.4%) |
| 65 to 69 Years | 637 (4.9%) | 710 (5.5%) |
| 70 to 74 Years | 606 (4.7%) | 641 (5.0%) |
| 75 to 79 Years | 573 (4.4%) | 478 (3.7%) |
| 80 to 84 Years | 122 (0.9%) | 153 (1.2%) |
| 85 Years and over | 71 (0.5%) | 335 (2.6%) |
| Total | 12,974 (100.0%) | 12,951 (100.0%) |
Families and Households in Johnson County
Median Family Size in Johnson County
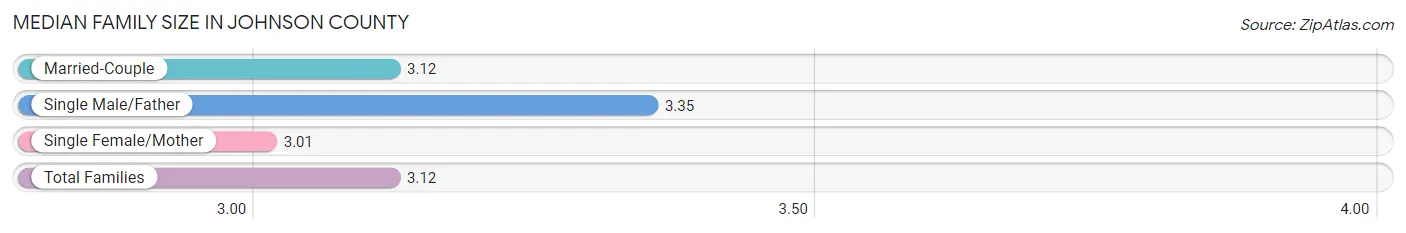
The median family size in Johnson County is 3.12 persons per family, with single male/father families (478 | 7.2%) accounting for the largest median family size of 3.35 persons per family. On the other hand, single female/mother families (1,081 | 16.3%) represent the smallest median family size with 3.01 persons per family.
| Family Type | # Families | Family Size |
| Married-Couple | 5,066 (76.5%) | 3.12 |
| Single Male/Father | 478 (7.2%) | 3.35 |
| Single Female/Mother | 1,081 (16.3%) | 3.01 |
| Total Families | 6,625 (100.0%) | 3.12 |
Median Household Size in Johnson County
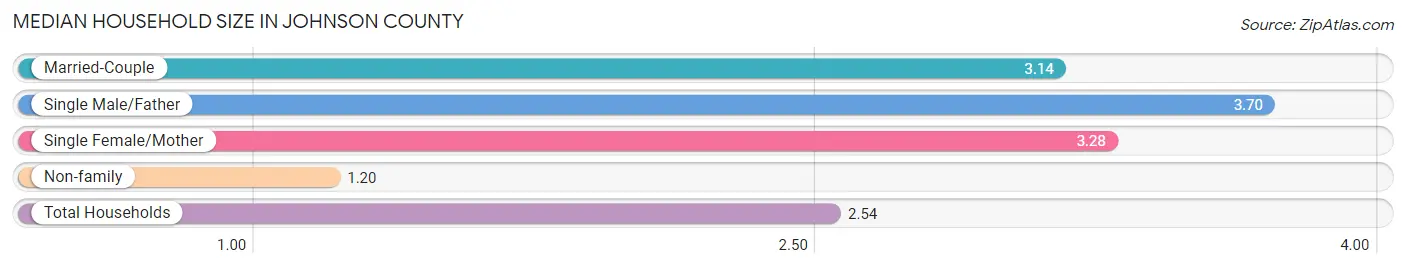
The median household size in Johnson County is 2.54 persons per household, with single male/father households (478 | 4.8%) accounting for the largest median household size of 3.7 persons per household. non-family households (3,274 | 33.1%) represent the smallest median household size with 1.20 persons per household.
| Household Type | # Households | Household Size |
| Married-Couple | 5,066 (51.2%) | 3.14 |
| Single Male/Father | 478 (4.8%) | 3.70 |
| Single Female/Mother | 1,081 (10.9%) | 3.28 |
| Non-family | 3,274 (33.1%) | 1.20 |
| Total Households | 9,899 (100.0%) | 2.54 |
Household Size by Marriage Status in Johnson County
Out of a total of 9,899 households in Johnson County, 6,625 (66.9%) are family households, while 3,274 (33.1%) are nonfamily households. The most numerous type of family households are 2-person households, comprising 3,120, and the most common type of nonfamily households are 1-person households, comprising 2,870.
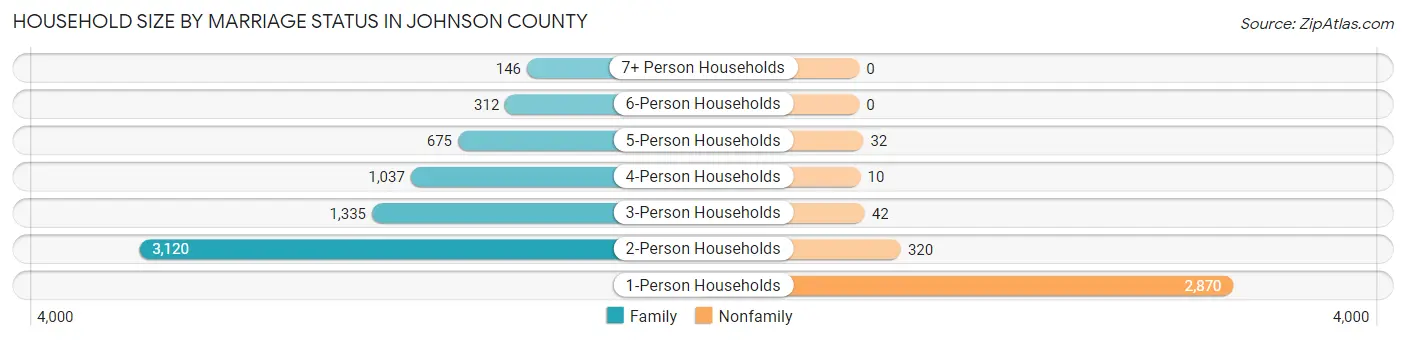
| Household Size | Family Households | Nonfamily Households |
| 1-Person Households | - | 2,870 (29.0%) |
| 2-Person Households | 3,120 (31.5%) | 320 (3.2%) |
| 3-Person Households | 1,335 (13.5%) | 42 (0.4%) |
| 4-Person Households | 1,037 (10.5%) | 10 (0.1%) |
| 5-Person Households | 675 (6.8%) | 32 (0.3%) |
| 6-Person Households | 312 (3.2%) | 0 (0.0%) |
| 7+ Person Households | 146 (1.5%) | 0 (0.0%) |
| Total | 6,625 (66.9%) | 3,274 (33.1%) |
Female Fertility in Johnson County
Fertility by Age in Johnson County
Average fertility rate in Johnson County is 62.0 births per 1,000 women. Women in the age bracket of 20 to 34 years have the highest fertility rate with 145.0 births per 1,000 women. Women in the age bracket of 20 to 34 years acount for 94.5% of all women with births.
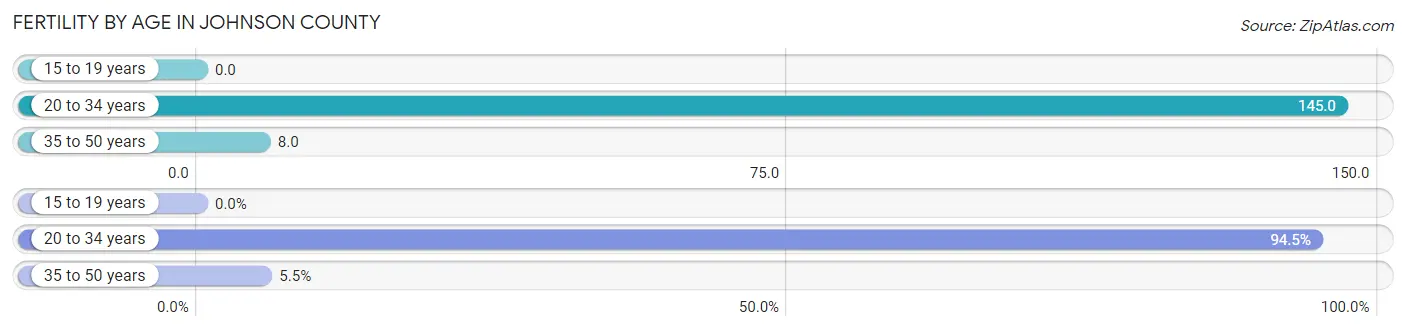
| Age Bracket | Women with Births | Births / 1,000 Women |
| 15 to 19 years | 0 (0.0%) | 0.0 |
| 20 to 34 years | 329 (94.5%) | 145.0 |
| 35 to 50 years | 19 (5.5%) | 8.0 |
| Total | 348 (100.0%) | 62.0 |
Fertility by Age by Marriage Status in Johnson County
71.6% of women with births (348) in Johnson County are married. The highest percentage of unmarried women with births falls into 20 to 34 years age bracket with 30.1% of them unmarried at the time of birth, while the lowest percentage of unmarried women with births belong to 35 to 50 years age bracket with 0.0% of them unmarried.
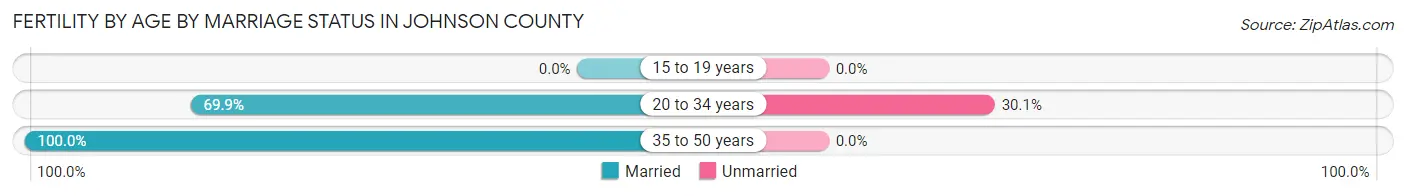
| Age Bracket | Married | Unmarried |
| 15 to 19 years | 0 (0.0%) | 0 (0.0%) |
| 20 to 34 years | 230 (69.9%) | 99 (30.1%) |
| 35 to 50 years | 19 (100.0%) | 0 (0.0%) |
| Total | 249 (71.6%) | 99 (28.4%) |
Fertility by Education in Johnson County
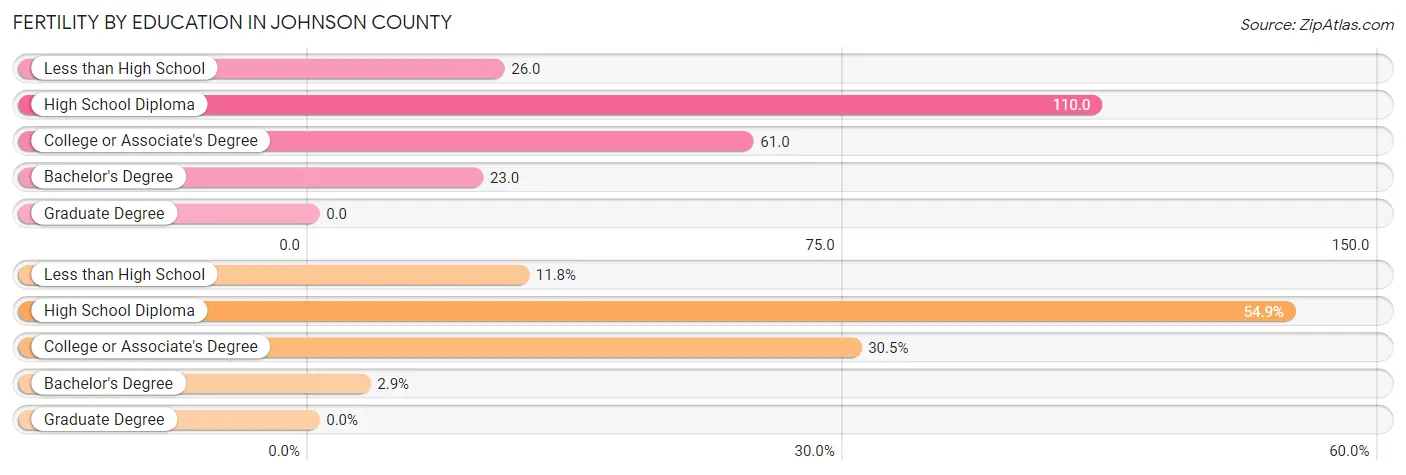
| Educational Attainment | Women with Births | Births / 1,000 Women |
| Less than High School | 41 (11.8%) | 26.0 |
| High School Diploma | 191 (54.9%) | 110.0 |
| College or Associate's Degree | 106 (30.5%) | 61.0 |
| Bachelor's Degree | 10 (2.9%) | 23.0 |
| Graduate Degree | 0 (0.0%) | 0.0 |
| Total | 348 (100.0%) | 62.0 |
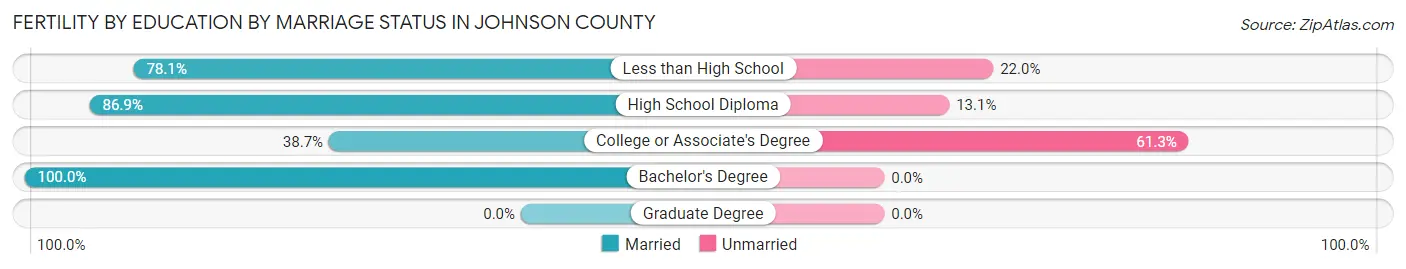
Fertility by Education by Marriage Status in Johnson County
28.4% of women with births in Johnson County are unmarried. Women with the educational attainment of bachelor's degree are most likely to be married with 100.0% of them married at childbirth, while women with the educational attainment of college or associate's degree are least likely to be married with 61.3% of them unmarried at childbirth.
| Educational Attainment | Married | Unmarried |
| Less than High School | 32 (78.0%) | 9 (22.0%) |
| High School Diploma | 166 (86.9%) | 25 (13.1%) |
| College or Associate's Degree | 41 (38.7%) | 65 (61.3%) |
| Bachelor's Degree | 10 (100.0%) | 0 (0.0%) |
| Graduate Degree | 0 (0.0%) | 0 (0.0%) |
| Total | 249 (71.6%) | 99 (28.4%) |
Employment Characteristics in Johnson County
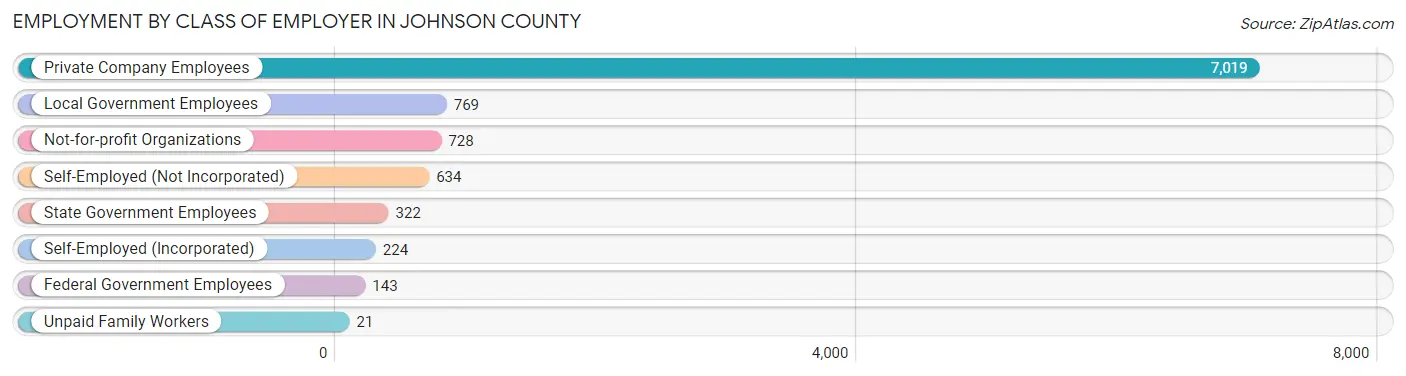
Employment by Class of Employer in Johnson County
Among the 9,860 employed individuals in Johnson County, private company employees (7,019 | 71.2%), local government employees (769 | 7.8%), and not-for-profit organizations (728 | 7.4%) make up the most common classes of employment.
| Employer Class | # Employees | % Employees |
| Private Company Employees | 7,019 | 71.2% |
| Self-Employed (Incorporated) | 224 | 2.3% |
| Self-Employed (Not Incorporated) | 634 | 6.4% |
| Not-for-profit Organizations | 728 | 7.4% |
| Local Government Employees | 769 | 7.8% |
| State Government Employees | 322 | 3.3% |
| Federal Government Employees | 143 | 1.5% |
| Unpaid Family Workers | 21 | 0.2% |
| Total | 9,860 | 100.0% |
Employment Status by Age in Johnson County
According to the labor force statistics for Johnson County, out of the total population over 16 years of age (20,239), 51.8% or 10,484 individuals are in the labor force, with 4.8% or 503 of them unemployed. The age group with the highest labor force participation rate is 30 to 34 years, with 85.2% or 1,350 individuals in the labor force. Within the labor force, the 16 to 19 years age range has the highest percentage of unemployed individuals, with 18.7% or 80 of them being unemployed.
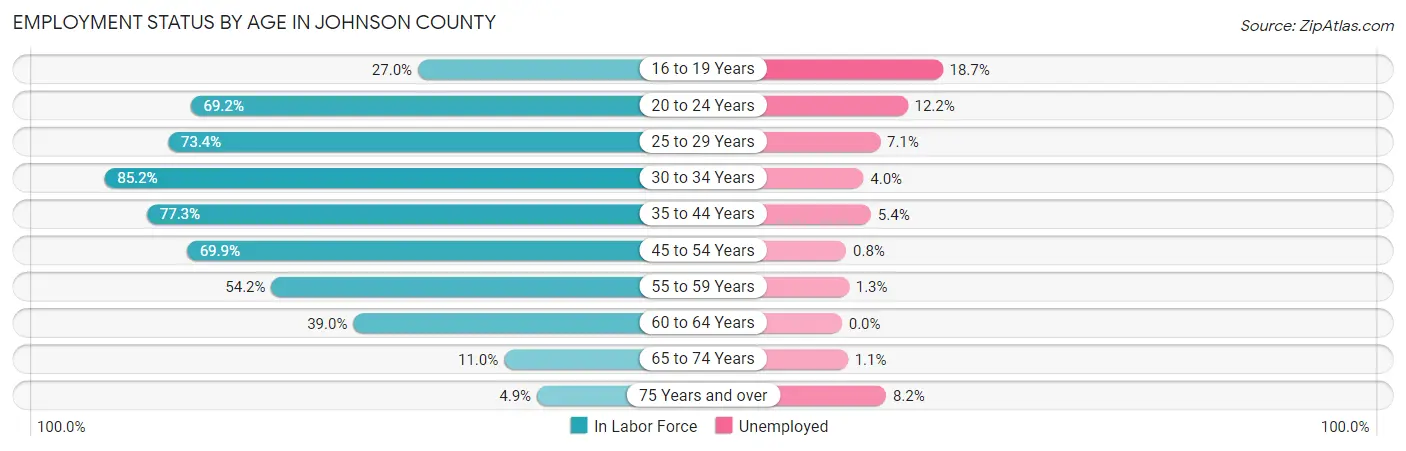
| Age Bracket | In Labor Force | Unemployed |
| 16 to 19 Years | 428 (27.0%) | 80 (18.7%) |
| 20 to 24 Years | 983 (69.2%) | 120 (12.2%) |
| 25 to 29 Years | 1,149 (73.4%) | 82 (7.1%) |
| 30 to 34 Years | 1,350 (85.2%) | 54 (4.0%) |
| 35 to 44 Years | 2,259 (77.3%) | 122 (5.4%) |
| 45 to 54 Years | 2,282 (69.9%) | 18 (0.8%) |
| 55 to 59 Years | 926 (54.2%) | 12 (1.3%) |
| 60 to 64 Years | 727 (39.0%) | 0 (0.0%) |
| 65 to 74 Years | 285 (11.0%) | 3 (1.1%) |
| 75 Years and over | 85 (4.9%) | 7 (8.2%) |
| Total | 10,484 (51.8%) | 503 (4.8%) |
Employment Status by Educational Attainment in Johnson County
According to labor force statistics for Johnson County, 67.3% of individuals (8,688) out of the total population between 25 and 64 years of age (12,909) are in the labor force, with 3.3% or 287 of them being unemployed. The group with the highest labor force participation rate are those with the educational attainment of bachelor's degree or higher, with 76.9% or 1,486 individuals in the labor force. Within the labor force, individuals with college / associate degree education have the highest percentage of unemployment, with 3.9% or 90 of them being unemployed.
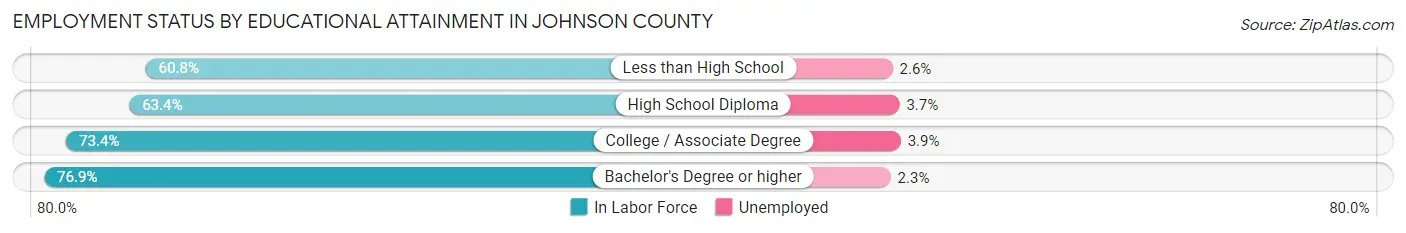
| Educational Attainment | In Labor Force | Unemployed |
| Less than High School | 1,587 (60.8%) | 68 (2.6%) |
| High School Diploma | 3,312 (63.4%) | 193 (3.7%) |
| College / Associate Degree | 2,307 (73.4%) | 123 (3.9%) |
| Bachelor's Degree or higher | 1,486 (76.9%) | 44 (2.3%) |
| Total | 8,688 (67.3%) | 426 (3.3%) |
Employment Occupations by Sex in Johnson County
Management, Business, Science and Arts Occupations
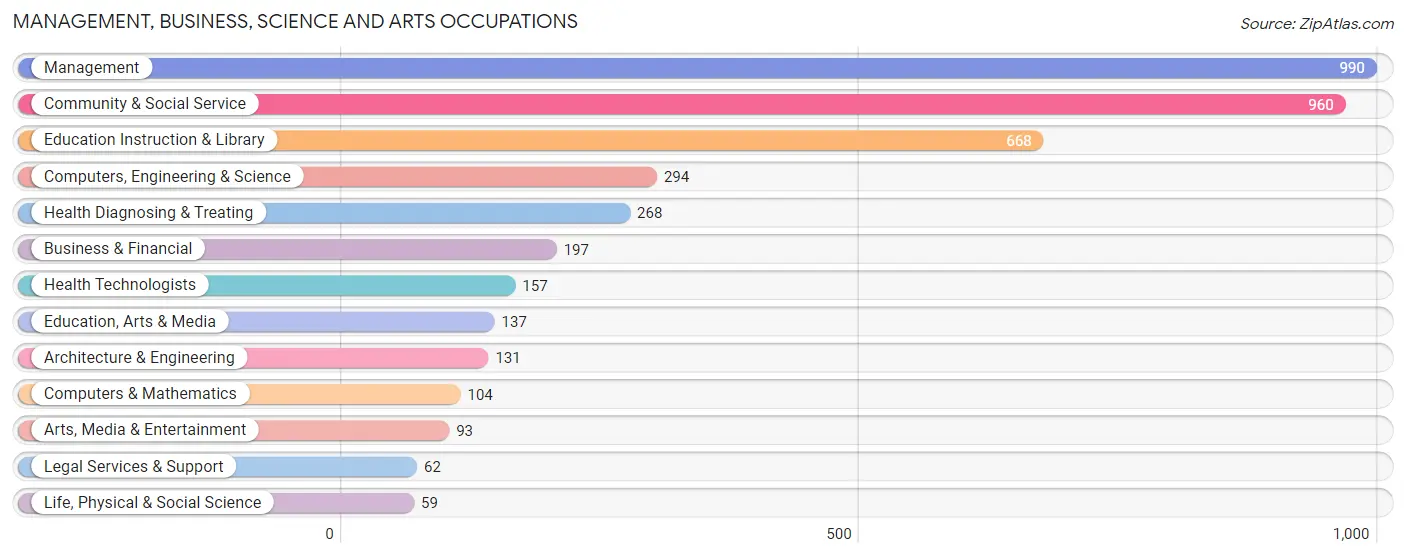
The most common Management, Business, Science and Arts occupations in Johnson County are Management (990 | 10.0%), Community & Social Service (960 | 9.7%), Education Instruction & Library (668 | 6.7%), Computers, Engineering & Science (294 | 2.9%), and Health Diagnosing & Treating (268 | 2.7%).
Management, Business, Science and Arts Occupations by Sex
Within the Management, Business, Science and Arts occupations in Johnson County, the most male-oriented occupations are Architecture & Engineering (100.0%), Computers & Mathematics (91.3%), and Computers, Engineering & Science (89.1%), while the most female-oriented occupations are Health Diagnosing & Treating (85.1%), Health Technologists (84.1%), and Legal Services & Support (77.4%).
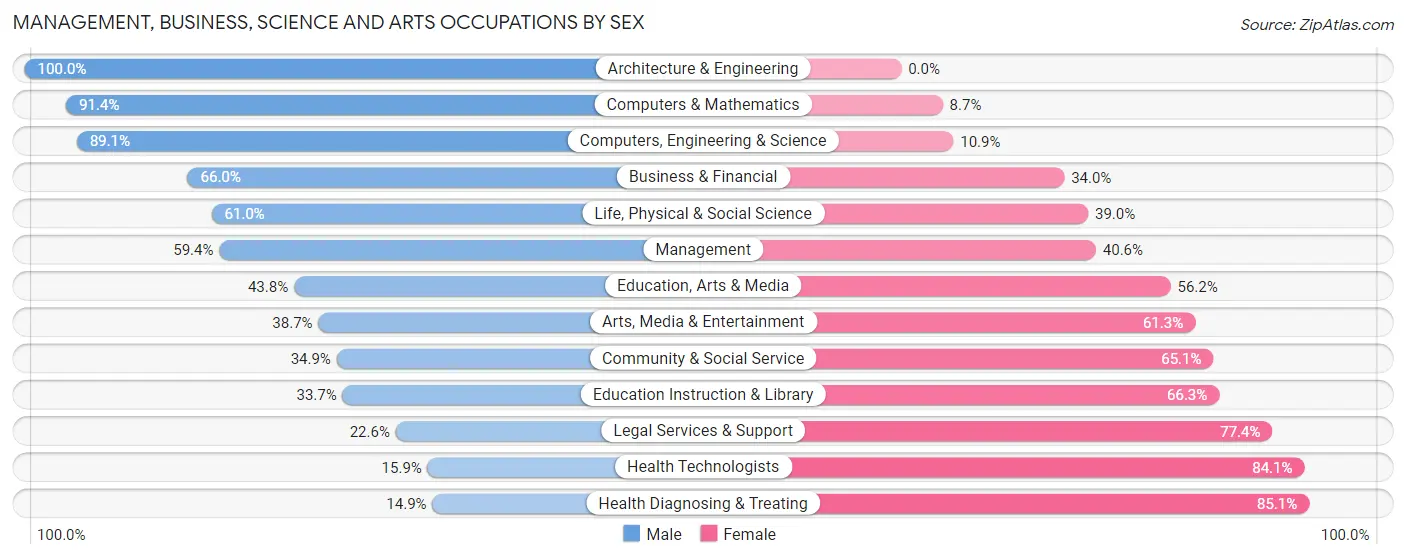
| Occupation | Male | Female |
| Management | 588 (59.4%) | 402 (40.6%) |
| Business & Financial | 130 (66.0%) | 67 (34.0%) |
| Computers, Engineering & Science | 262 (89.1%) | 32 (10.9%) |
| Computers & Mathematics | 95 (91.3%) | 9 (8.6%) |
| Architecture & Engineering | 131 (100.0%) | 0 (0.0%) |
| Life, Physical & Social Science | 36 (61.0%) | 23 (39.0%) |
| Community & Social Service | 335 (34.9%) | 625 (65.1%) |
| Education, Arts & Media | 60 (43.8%) | 77 (56.2%) |
| Legal Services & Support | 14 (22.6%) | 48 (77.4%) |
| Education Instruction & Library | 225 (33.7%) | 443 (66.3%) |
| Arts, Media & Entertainment | 36 (38.7%) | 57 (61.3%) |
| Health Diagnosing & Treating | 40 (14.9%) | 228 (85.1%) |
| Health Technologists | 25 (15.9%) | 132 (84.1%) |
| Total (Category) | 1,355 (50.0%) | 1,354 (50.0%) |
| Total (Overall) | 5,483 (55.1%) | 4,470 (44.9%) |
Services Occupations
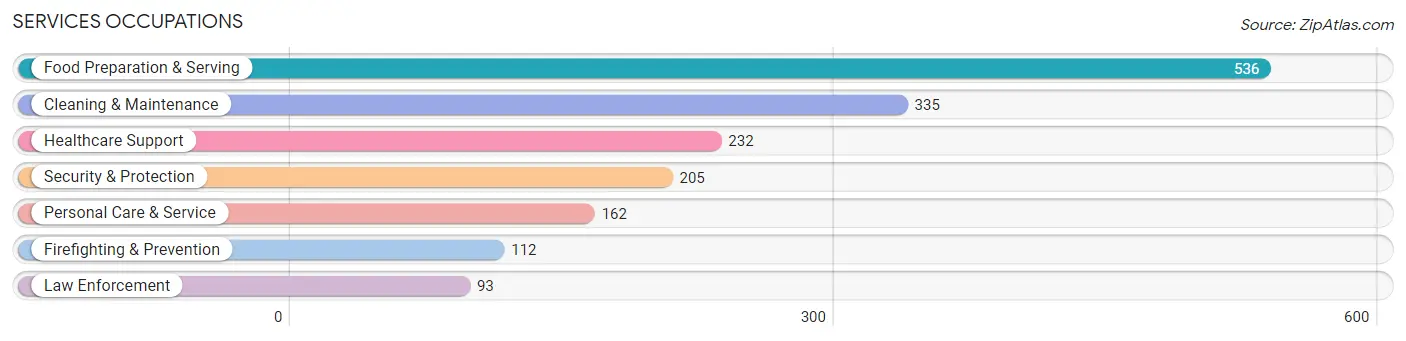
The most common Services occupations in Johnson County are Food Preparation & Serving (536 | 5.4%), Cleaning & Maintenance (335 | 3.4%), Healthcare Support (232 | 2.3%), Security & Protection (205 | 2.1%), and Personal Care & Service (162 | 1.6%).
Services Occupations by Sex
Within the Services occupations in Johnson County, the most male-oriented occupations are Law Enforcement (98.9%), Security & Protection (96.6%), and Firefighting & Prevention (94.6%), while the most female-oriented occupations are Healthcare Support (90.1%), Food Preparation & Serving (81.2%), and Personal Care & Service (63.6%).
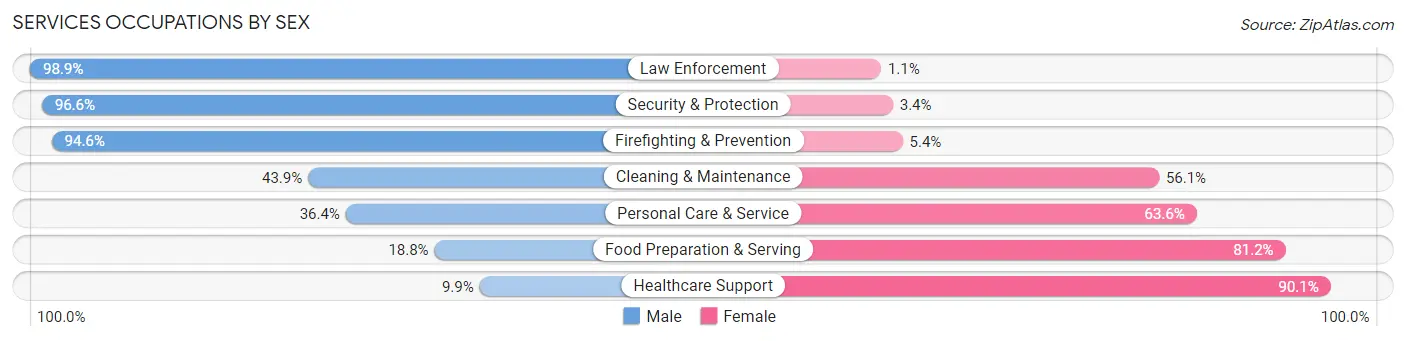
| Occupation | Male | Female |
| Healthcare Support | 23 (9.9%) | 209 (90.1%) |
| Security & Protection | 198 (96.6%) | 7 (3.4%) |
| Firefighting & Prevention | 106 (94.6%) | 6 (5.4%) |
| Law Enforcement | 92 (98.9%) | 1 (1.1%) |
| Food Preparation & Serving | 101 (18.8%) | 435 (81.2%) |
| Cleaning & Maintenance | 147 (43.9%) | 188 (56.1%) |
| Personal Care & Service | 59 (36.4%) | 103 (63.6%) |
| Total (Category) | 528 (35.9%) | 942 (64.1%) |
| Total (Overall) | 5,483 (55.1%) | 4,470 (44.9%) |
Sales and Office Occupations
The most common Sales and Office occupations in Johnson County are Sales & Related (856 | 8.6%), and Office & Administration (740 | 7.4%).
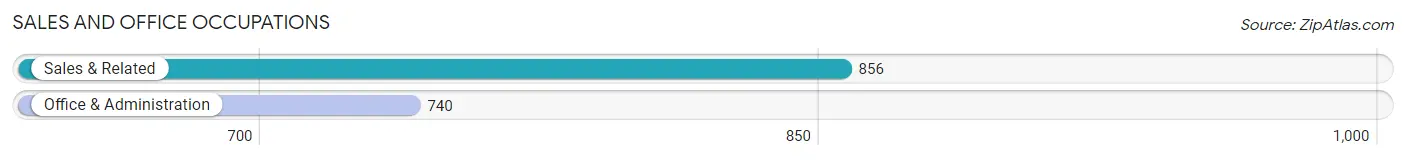
Sales and Office Occupations by Sex
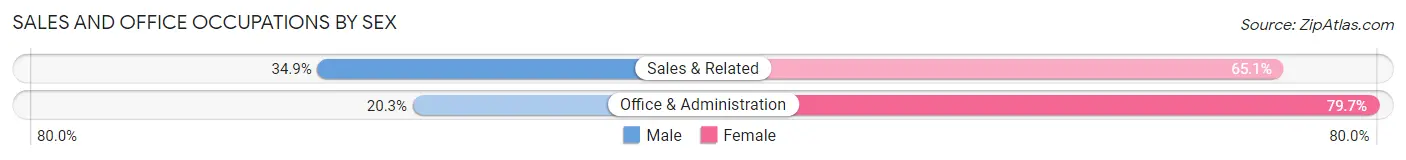
| Occupation | Male | Female |
| Sales & Related | 299 (34.9%) | 557 (65.1%) |
| Office & Administration | 150 (20.3%) | 590 (79.7%) |
| Total (Category) | 449 (28.1%) | 1,147 (71.9%) |
| Total (Overall) | 5,483 (55.1%) | 4,470 (44.9%) |
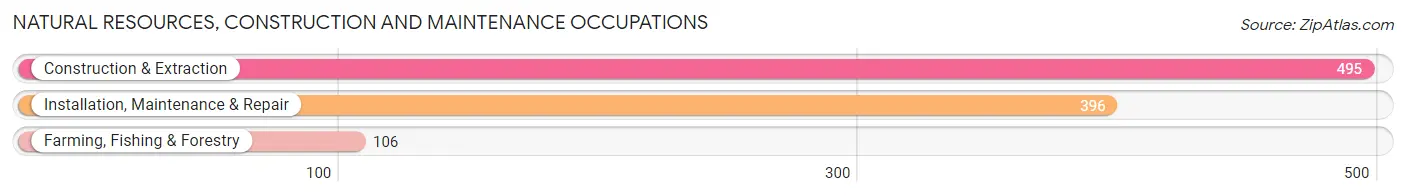
Natural Resources, Construction and Maintenance Occupations
The most common Natural Resources, Construction and Maintenance occupations in Johnson County are Construction & Extraction (495 | 5.0%), Installation, Maintenance & Repair (396 | 4.0%), and Farming, Fishing & Forestry (106 | 1.1%).
Natural Resources, Construction and Maintenance Occupations by Sex
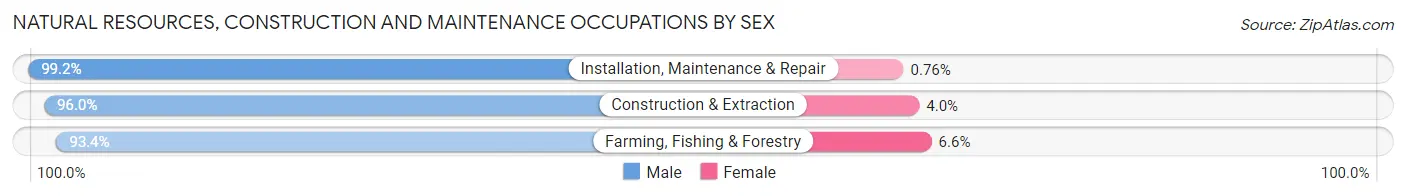
| Occupation | Male | Female |
| Farming, Fishing & Forestry | 99 (93.4%) | 7 (6.6%) |
| Construction & Extraction | 475 (96.0%) | 20 (4.0%) |
| Installation, Maintenance & Repair | 393 (99.2%) | 3 (0.8%) |
| Total (Category) | 967 (97.0%) | 30 (3.0%) |
| Total (Overall) | 5,483 (55.1%) | 4,470 (44.9%) |
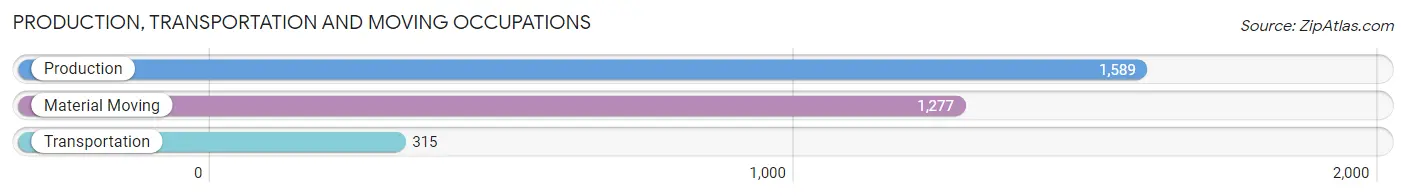
Production, Transportation and Moving Occupations
The most common Production, Transportation and Moving occupations in Johnson County are Production (1,589 | 16.0%), Material Moving (1,277 | 12.8%), and Transportation (315 | 3.2%).
Production, Transportation and Moving Occupations by Sex
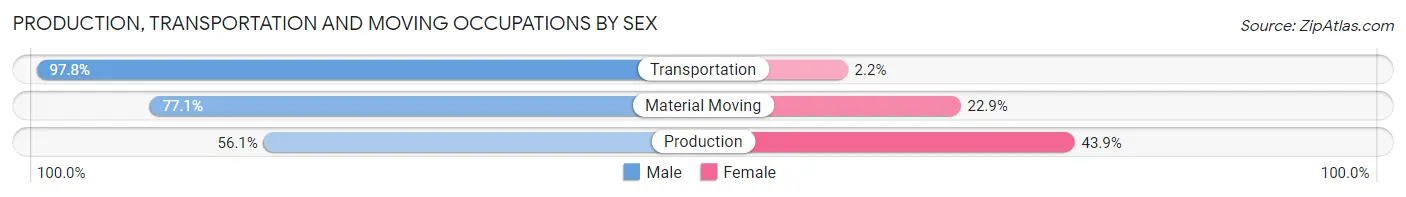
| Occupation | Male | Female |
| Production | 892 (56.1%) | 697 (43.9%) |
| Transportation | 308 (97.8%) | 7 (2.2%) |
| Material Moving | 984 (77.1%) | 293 (22.9%) |
| Total (Category) | 2,184 (68.7%) | 997 (31.3%) |
| Total (Overall) | 5,483 (55.1%) | 4,470 (44.9%) |
Employment Industries by Sex in Johnson County
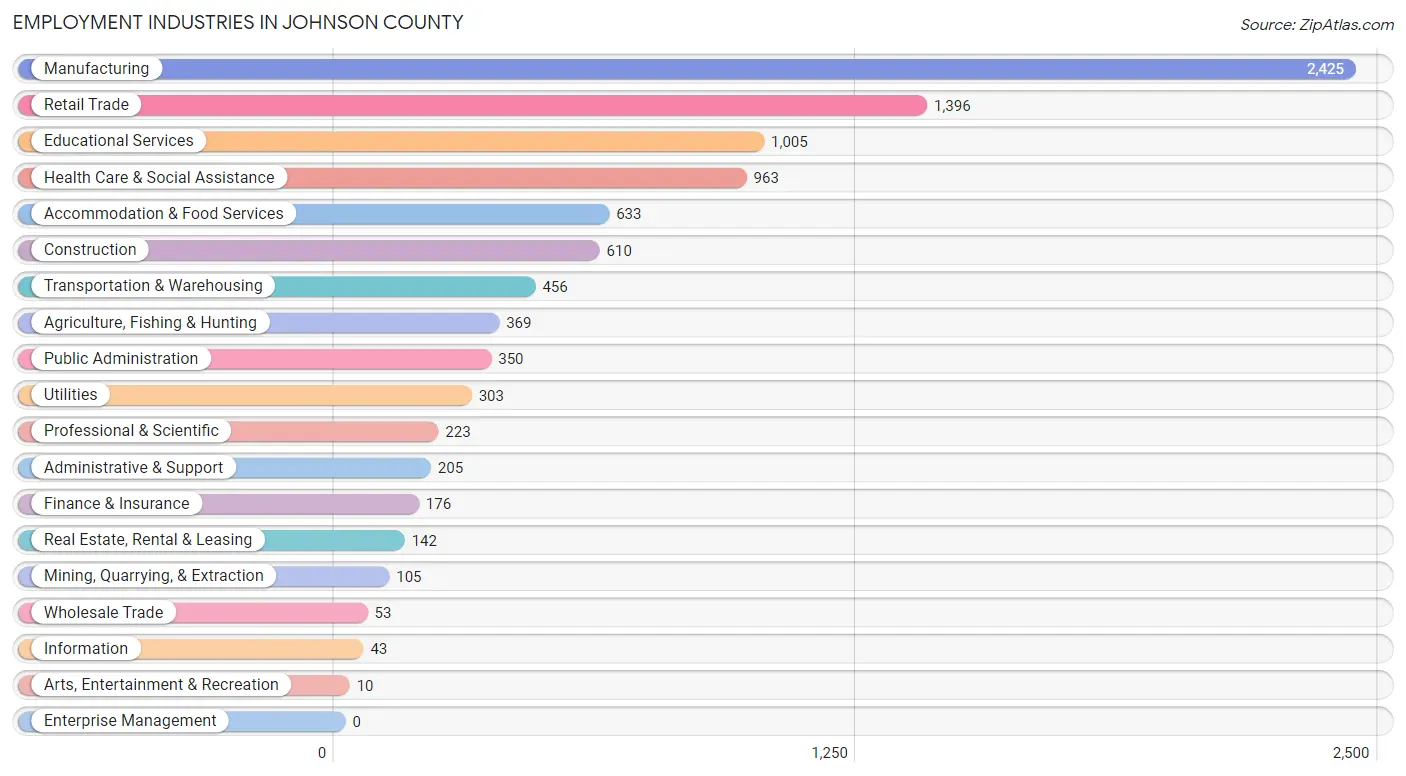
Employment Industries in Johnson County
The major employment industries in Johnson County include Manufacturing (2,425 | 24.4%), Retail Trade (1,396 | 14.0%), Educational Services (1,005 | 10.1%), Health Care & Social Assistance (963 | 9.7%), and Accommodation & Food Services (633 | 6.4%).
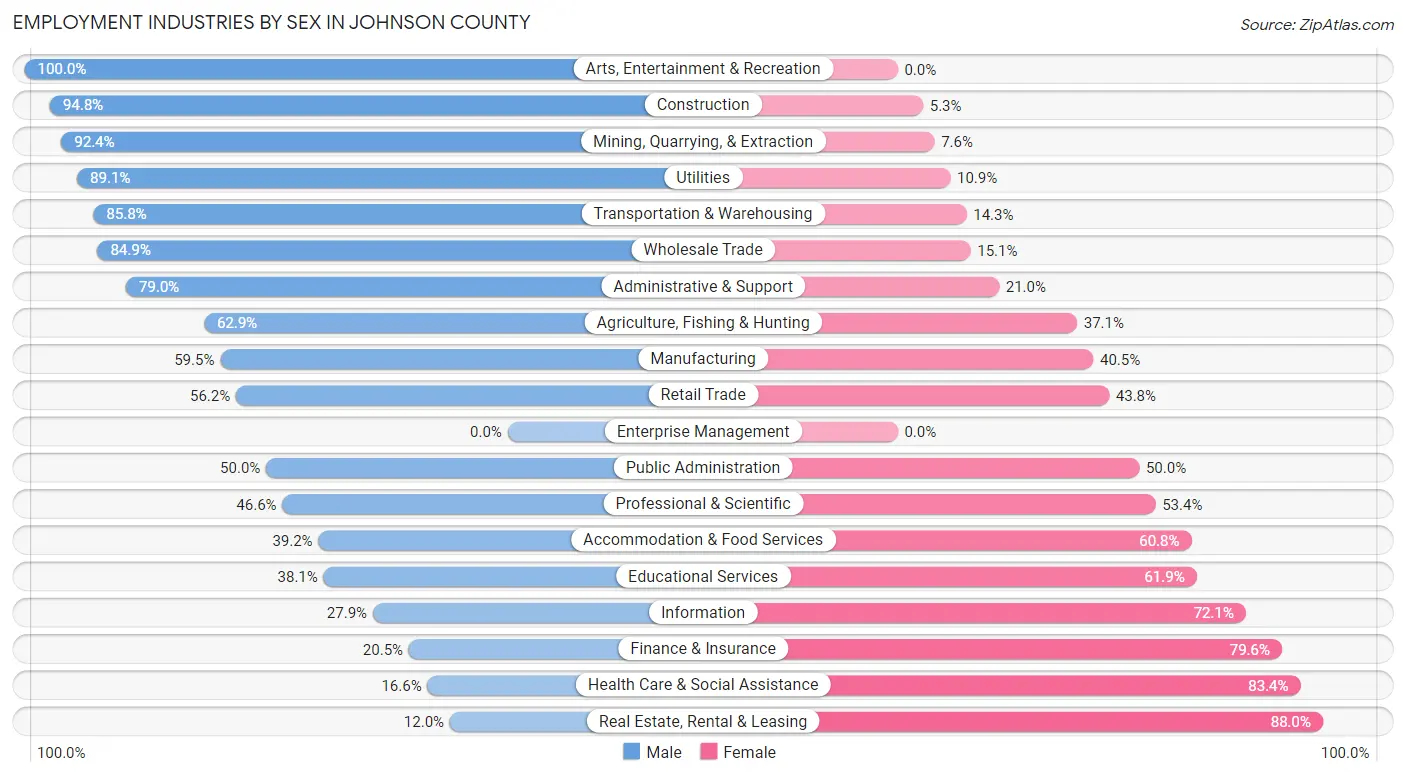
Employment Industries by Sex in Johnson County
The Johnson County industries that see more men than women are Arts, Entertainment & Recreation (100.0%), Construction (94.8%), and Mining, Quarrying, & Extraction (92.4%), whereas the industries that tend to have a higher number of women are Real Estate, Rental & Leasing (88.0%), Health Care & Social Assistance (83.4%), and Finance & Insurance (79.5%).
| Industry | Male | Female |
| Agriculture, Fishing & Hunting | 232 (62.9%) | 137 (37.1%) |
| Mining, Quarrying, & Extraction | 97 (92.4%) | 8 (7.6%) |
| Construction | 578 (94.8%) | 32 (5.2%) |
| Manufacturing | 1,443 (59.5%) | 982 (40.5%) |
| Wholesale Trade | 45 (84.9%) | 8 (15.1%) |
| Retail Trade | 785 (56.2%) | 611 (43.8%) |
| Transportation & Warehousing | 391 (85.8%) | 65 (14.2%) |
| Utilities | 270 (89.1%) | 33 (10.9%) |
| Information | 12 (27.9%) | 31 (72.1%) |
| Finance & Insurance | 36 (20.4%) | 140 (79.5%) |
| Real Estate, Rental & Leasing | 17 (12.0%) | 125 (88.0%) |
| Professional & Scientific | 104 (46.6%) | 119 (53.4%) |
| Enterprise Management | 0 (0.0%) | 0 (0.0%) |
| Administrative & Support | 162 (79.0%) | 43 (21.0%) |
| Educational Services | 383 (38.1%) | 622 (61.9%) |
| Health Care & Social Assistance | 160 (16.6%) | 803 (83.4%) |
| Arts, Entertainment & Recreation | 10 (100.0%) | 0 (0.0%) |
| Accommodation & Food Services | 248 (39.2%) | 385 (60.8%) |
| Public Administration | 175 (50.0%) | 175 (50.0%) |
| Total | 5,483 (55.1%) | 4,470 (44.9%) |
Education in Johnson County
School Enrollment in Johnson County
The most common levels of schooling among the 5,884 students in Johnson County are middle school (1,414 | 24.0%), high school (1,385 | 23.5%), and elementary school (1,324 | 22.5%).
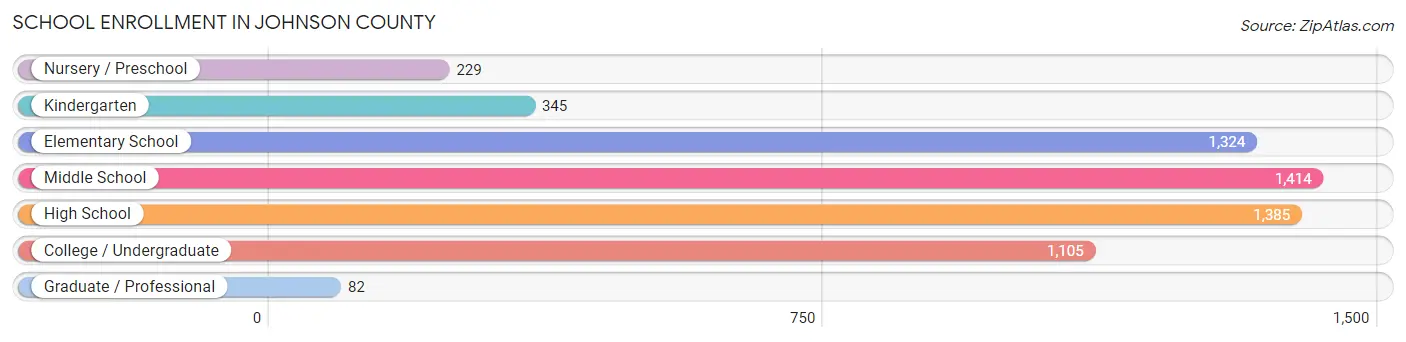
| School Level | # Students | % Students |
| Nursery / Preschool | 229 | 3.9% |
| Kindergarten | 345 | 5.9% |
| Elementary School | 1,324 | 22.5% |
| Middle School | 1,414 | 24.0% |
| High School | 1,385 | 23.5% |
| College / Undergraduate | 1,105 | 18.8% |
| Graduate / Professional | 82 | 1.4% |
| Total | 5,884 | 100.0% |
School Enrollment by Age by Funding Source in Johnson County
Out of a total of 5,884 students who are enrolled in schools in Johnson County, 947 (16.1%) attend a private institution, while the remaining 4,937 (83.9%) are enrolled in public schools. The age group of 20 to 24 year olds has the highest likelihood of being enrolled in private schools, with 240 (62.7% in the age bracket) enrolled. Conversely, the age group of 10 to 14 year olds has the lowest likelihood of being enrolled in a private school, with 1,733 (96.8% in the age bracket) attending a public institution.
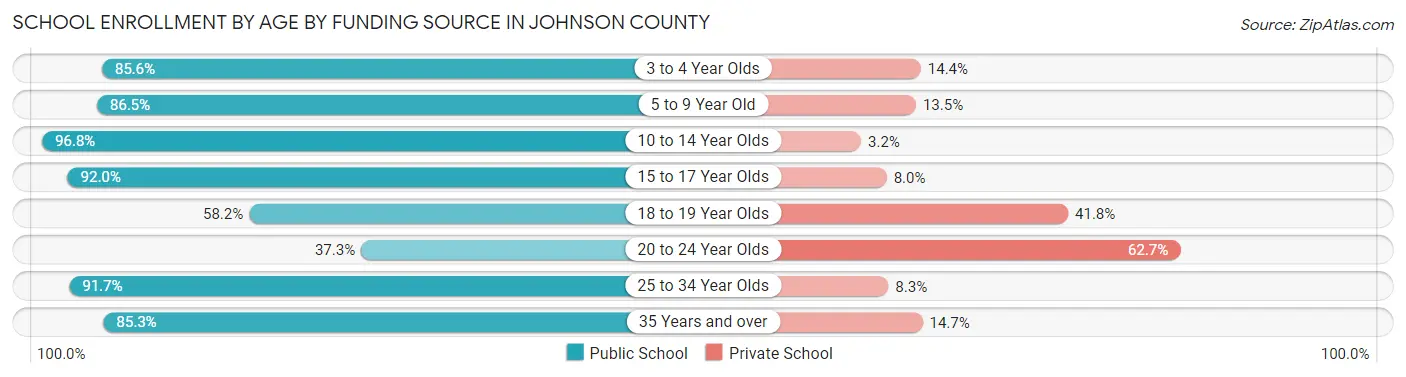
| Age Bracket | Public School | Private School |
| 3 to 4 Year Olds | 125 (85.6%) | 21 (14.4%) |
| 5 to 9 Year Old | 1,311 (86.5%) | 204 (13.5%) |
| 10 to 14 Year Olds | 1,733 (96.8%) | 58 (3.2%) |
| 15 to 17 Year Olds | 952 (92.0%) | 83 (8.0%) |
| 18 to 19 Year Olds | 430 (58.2%) | 309 (41.8%) |
| 20 to 24 Year Olds | 143 (37.3%) | 240 (62.7%) |
| 25 to 34 Year Olds | 121 (91.7%) | 11 (8.3%) |
| 35 Years and over | 122 (85.3%) | 21 (14.7%) |
| Total | 4,937 (83.9%) | 947 (16.1%) |
Educational Attainment by Field of Study in Johnson County
Education (608 | 21.0%), business (561 | 19.4%), liberal arts & history (268 | 9.2%), social sciences (226 | 7.8%), and bio, nature & agricultural (219 | 7.5%) are the most common fields of study among 2,899 individuals in Johnson County who have obtained a bachelor's degree or higher.
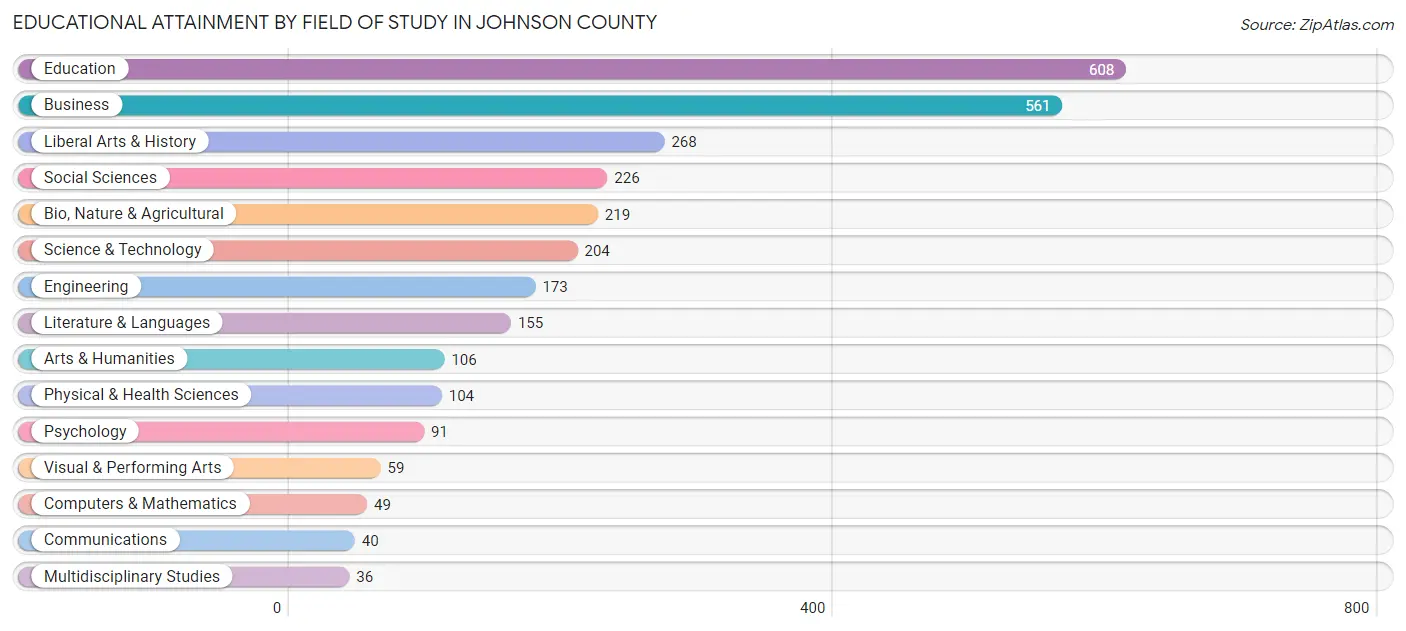
| Field of Study | # Graduates | % Graduates |
| Computers & Mathematics | 49 | 1.7% |
| Bio, Nature & Agricultural | 219 | 7.5% |
| Physical & Health Sciences | 104 | 3.6% |
| Psychology | 91 | 3.1% |
| Social Sciences | 226 | 7.8% |
| Engineering | 173 | 6.0% |
| Multidisciplinary Studies | 36 | 1.2% |
| Science & Technology | 204 | 7.0% |
| Business | 561 | 19.4% |
| Education | 608 | 21.0% |
| Literature & Languages | 155 | 5.3% |
| Liberal Arts & History | 268 | 9.2% |
| Visual & Performing Arts | 59 | 2.0% |
| Communications | 40 | 1.4% |
| Arts & Humanities | 106 | 3.7% |
| Total | 2,899 | 100.0% |
Transportation & Commute in Johnson County
Vehicle Availability by Sex in Johnson County
The most prevalent vehicle ownership categories in Johnson County are males with 2 vehicles (1,852, accounting for 34.6%) and females with 2 vehicles (1,783, making up 42.4%).
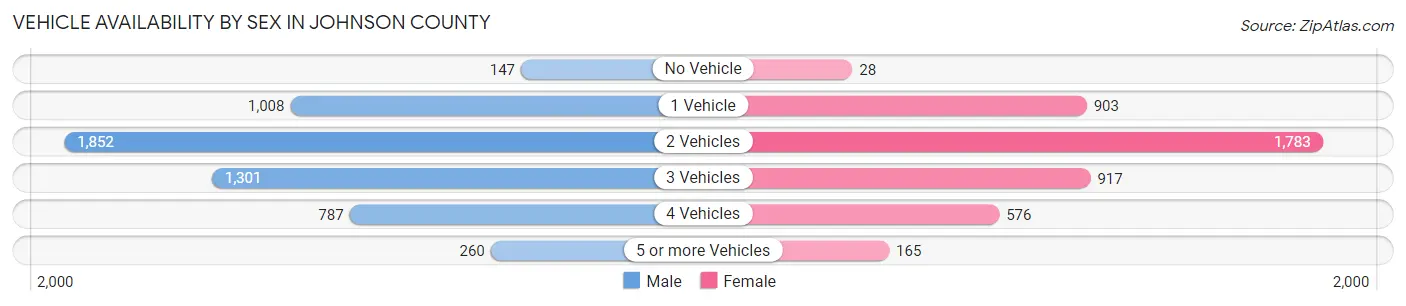
| Vehicles Available | Male | Female |
| No Vehicle | 147 (2.8%) | 28 (0.6%) |
| 1 Vehicle | 1,008 (18.8%) | 903 (20.6%) |
| 2 Vehicles | 1,852 (34.6%) | 1,783 (40.8%) |
| 3 Vehicles | 1,301 (24.3%) | 917 (21.0%) |
| 4 Vehicles | 787 (14.7%) | 576 (13.2%) |
| 5 or more Vehicles | 260 (4.9%) | 165 (3.8%) |
| Total | 5,355 (100.0%) | 4,372 (100.0%) |
Commute Time in Johnson County
The most frequently occuring commute durations in Johnson County are 15 to 19 minutes (2,183 commuters, 23.0%), 10 to 14 minutes (1,919 commuters, 20.3%), and 5 to 9 minutes (1,547 commuters, 16.3%).
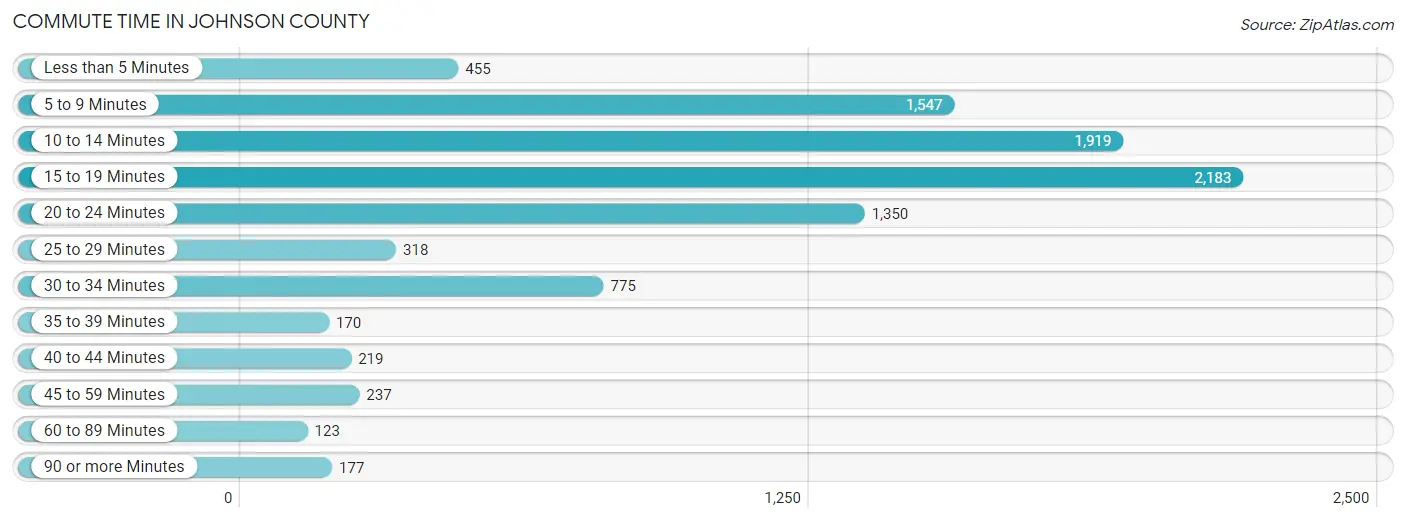
| Commute Time | # Commuters | % Commuters |
| Less than 5 Minutes | 455 | 4.8% |
| 5 to 9 Minutes | 1,547 | 16.3% |
| 10 to 14 Minutes | 1,919 | 20.3% |
| 15 to 19 Minutes | 2,183 | 23.0% |
| 20 to 24 Minutes | 1,350 | 14.2% |
| 25 to 29 Minutes | 318 | 3.4% |
| 30 to 34 Minutes | 775 | 8.2% |
| 35 to 39 Minutes | 170 | 1.8% |
| 40 to 44 Minutes | 219 | 2.3% |
| 45 to 59 Minutes | 237 | 2.5% |
| 60 to 89 Minutes | 123 | 1.3% |
| 90 or more Minutes | 177 | 1.9% |
Commute Time by Sex in Johnson County
The most common commute times in Johnson County are 15 to 19 minutes (1,123 commuters, 21.1%) for males and 15 to 19 minutes (1,060 commuters, 25.5%) for females.
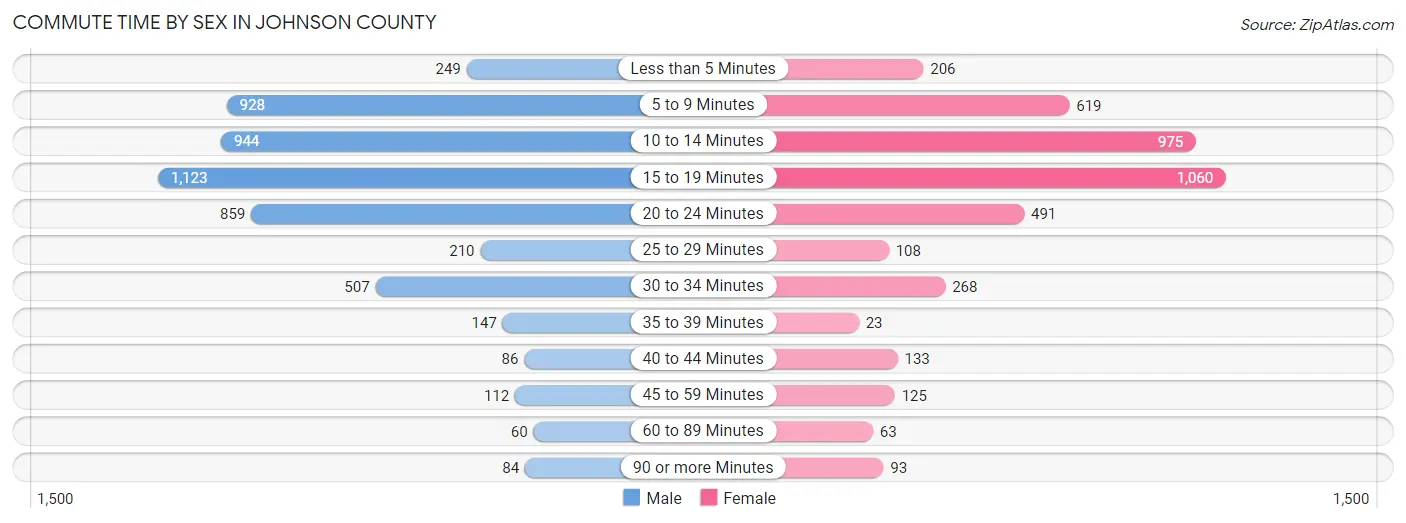
| Commute Time | Male | Female |
| Less than 5 Minutes | 249 (4.7%) | 206 (5.0%) |
| 5 to 9 Minutes | 928 (17.5%) | 619 (14.9%) |
| 10 to 14 Minutes | 944 (17.8%) | 975 (23.4%) |
| 15 to 19 Minutes | 1,123 (21.1%) | 1,060 (25.5%) |
| 20 to 24 Minutes | 859 (16.2%) | 491 (11.8%) |
| 25 to 29 Minutes | 210 (4.0%) | 108 (2.6%) |
| 30 to 34 Minutes | 507 (9.6%) | 268 (6.4%) |
| 35 to 39 Minutes | 147 (2.8%) | 23 (0.5%) |
| 40 to 44 Minutes | 86 (1.6%) | 133 (3.2%) |
| 45 to 59 Minutes | 112 (2.1%) | 125 (3.0%) |
| 60 to 89 Minutes | 60 (1.1%) | 63 (1.5%) |
| 90 or more Minutes | 84 (1.6%) | 93 (2.2%) |
Time of Departure to Work by Sex in Johnson County
The most frequent times of departure to work in Johnson County are 12:00 AM to 4:59 AM (756, 14.2%) for males and 7:00 AM to 7:29 AM (808, 19.4%) for females.
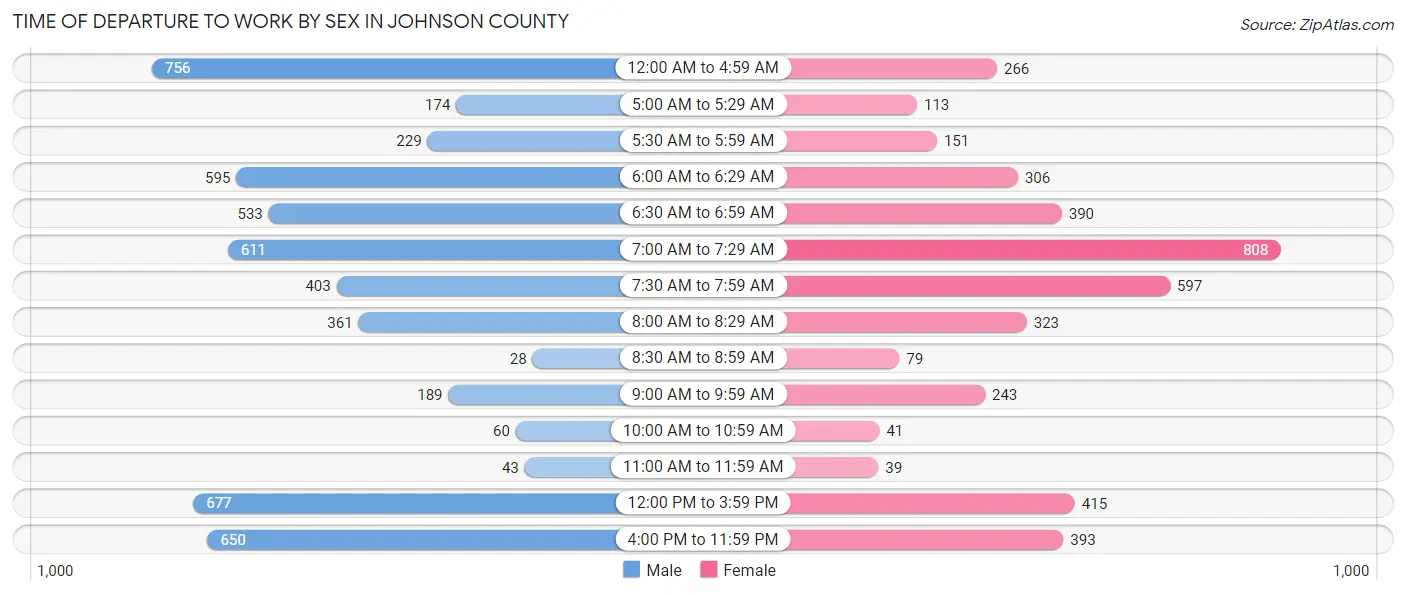
| Time of Departure | Male | Female |
| 12:00 AM to 4:59 AM | 756 (14.2%) | 266 (6.4%) |
| 5:00 AM to 5:29 AM | 174 (3.3%) | 113 (2.7%) |
| 5:30 AM to 5:59 AM | 229 (4.3%) | 151 (3.6%) |
| 6:00 AM to 6:29 AM | 595 (11.2%) | 306 (7.3%) |
| 6:30 AM to 6:59 AM | 533 (10.0%) | 390 (9.4%) |
| 7:00 AM to 7:29 AM | 611 (11.5%) | 808 (19.4%) |
| 7:30 AM to 7:59 AM | 403 (7.6%) | 597 (14.3%) |
| 8:00 AM to 8:29 AM | 361 (6.8%) | 323 (7.8%) |
| 8:30 AM to 8:59 AM | 28 (0.5%) | 79 (1.9%) |
| 9:00 AM to 9:59 AM | 189 (3.6%) | 243 (5.8%) |
| 10:00 AM to 10:59 AM | 60 (1.1%) | 41 (1.0%) |
| 11:00 AM to 11:59 AM | 43 (0.8%) | 39 (0.9%) |
| 12:00 PM to 3:59 PM | 677 (12.8%) | 415 (10.0%) |
| 4:00 PM to 11:59 PM | 650 (12.2%) | 393 (9.4%) |
| Total | 5,309 (100.0%) | 4,164 (100.0%) |
Housing Occupancy in Johnson County
Occupancy by Ownership in Johnson County
Of the total 9,899 dwellings in Johnson County, owner-occupied units account for 6,967 (70.4%), while renter-occupied units make up 2,932 (29.6%).
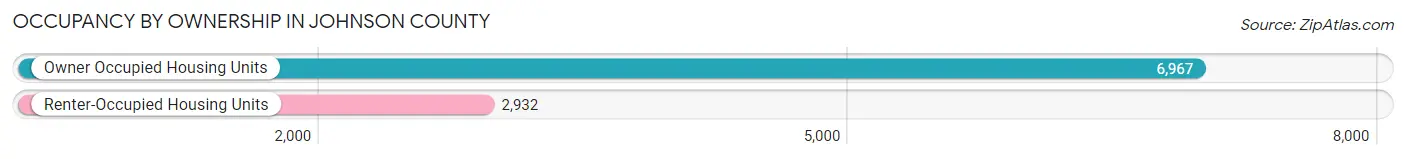
| Occupancy | # Housing Units | % Housing Units |
| Owner Occupied Housing Units | 6,967 | 70.4% |
| Renter-Occupied Housing Units | 2,932 | 29.6% |
| Total Occupied Housing Units | 9,899 | 100.0% |
Occupancy by Household Size in Johnson County
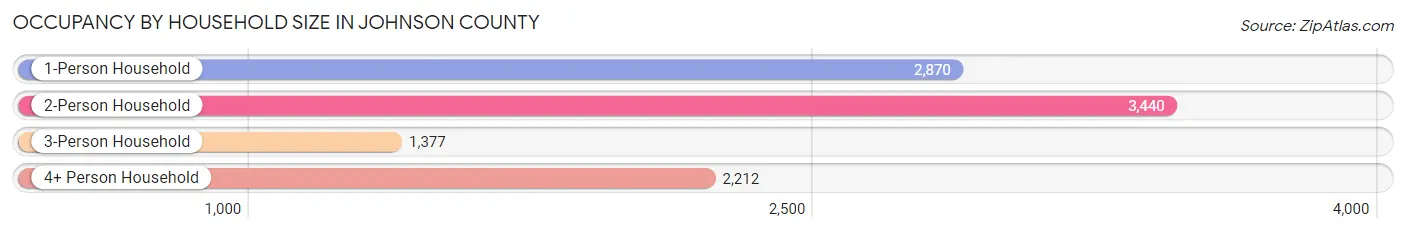
| Household Size | # Housing Units | % Housing Units |
| 1-Person Household | 2,870 | 29.0% |
| 2-Person Household | 3,440 | 34.7% |
| 3-Person Household | 1,377 | 13.9% |
| 4+ Person Household | 2,212 | 22.4% |
| Total Housing Units | 9,899 | 100.0% |
Occupancy by Ownership by Household Size in Johnson County
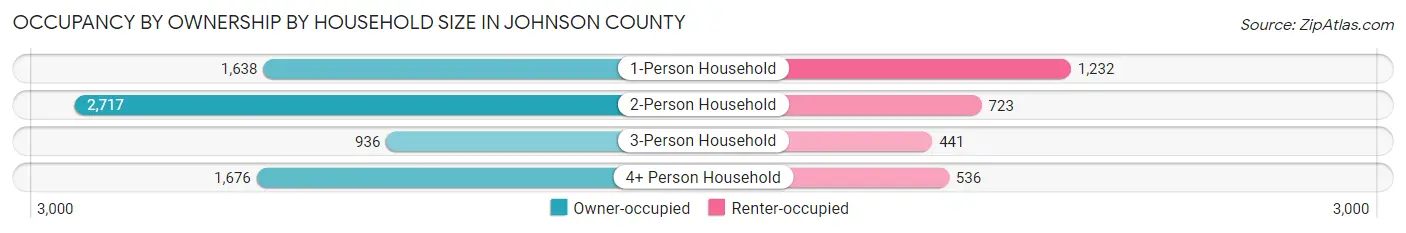
| Household Size | Owner-occupied | Renter-occupied |
| 1-Person Household | 1,638 (57.1%) | 1,232 (42.9%) |
| 2-Person Household | 2,717 (79.0%) | 723 (21.0%) |
| 3-Person Household | 936 (68.0%) | 441 (32.0%) |
| 4+ Person Household | 1,676 (75.8%) | 536 (24.2%) |
| Total Housing Units | 6,967 (70.4%) | 2,932 (29.6%) |
Occupancy by Educational Attainment in Johnson County
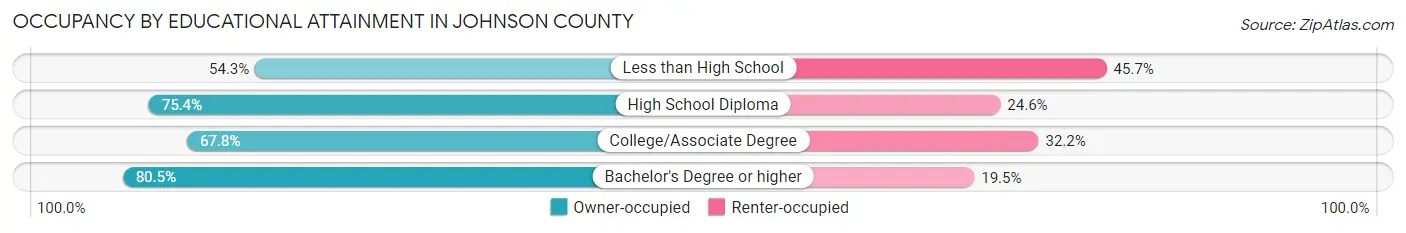
| Household Size | Owner-occupied | Renter-occupied |
| Less than High School | 991 (54.3%) | 834 (45.7%) |
| High School Diploma | 2,917 (75.4%) | 953 (24.6%) |
| College/Associate Degree | 1,739 (67.8%) | 826 (32.2%) |
| Bachelor's Degree or higher | 1,320 (80.5%) | 319 (19.5%) |
Occupancy by Age of Householder in Johnson County
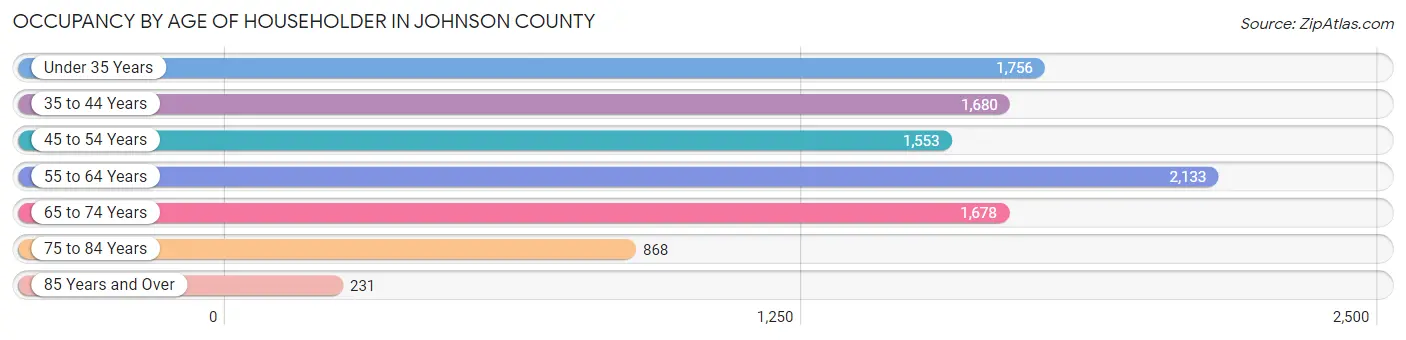
| Age Bracket | # Households | % Households |
| Under 35 Years | 1,756 | 17.7% |
| 35 to 44 Years | 1,680 | 17.0% |
| 45 to 54 Years | 1,553 | 15.7% |
| 55 to 64 Years | 2,133 | 21.5% |
| 65 to 74 Years | 1,678 | 17.0% |
| 75 to 84 Years | 868 | 8.8% |
| 85 Years and Over | 231 | 2.3% |
| Total | 9,899 | 100.0% |
Housing Finances in Johnson County
Median Income by Occupancy in Johnson County
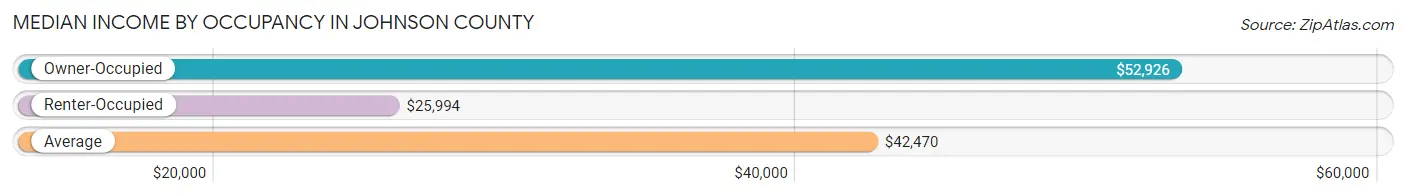
| Occupancy Type | # Households | Median Income |
| Owner-Occupied | 6,967 (70.4%) | $52,926 |
| Renter-Occupied | 2,932 (29.6%) | $25,994 |
| Average | 9,899 (100.0%) | $42,470 |
Occupancy by Householder Income Bracket in Johnson County
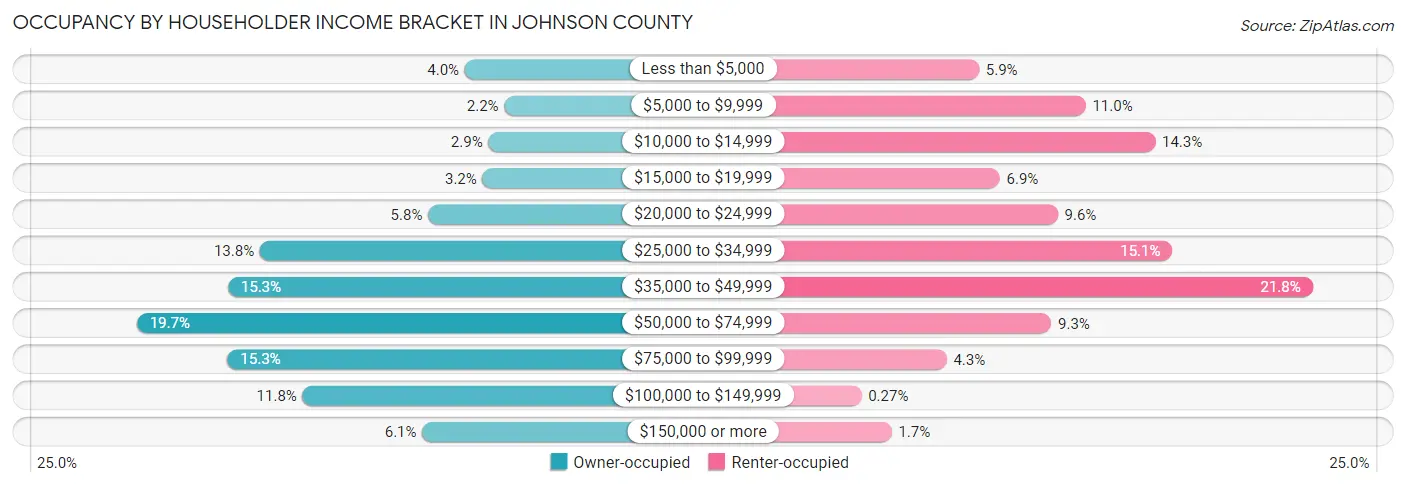
| Income Bracket | Owner-occupied | Renter-occupied |
| Less than $5,000 | 281 (4.0%) | 172 (5.9%) |
| $5,000 to $9,999 | 150 (2.1%) | 321 (11.0%) |
| $10,000 to $14,999 | 203 (2.9%) | 418 (14.3%) |
| $15,000 to $19,999 | 222 (3.2%) | 201 (6.9%) |
| $20,000 to $24,999 | 403 (5.8%) | 282 (9.6%) |
| $25,000 to $34,999 | 961 (13.8%) | 442 (15.1%) |
| $35,000 to $49,999 | 1,067 (15.3%) | 638 (21.8%) |
| $50,000 to $74,999 | 1,370 (19.7%) | 273 (9.3%) |
| $75,000 to $99,999 | 1,069 (15.3%) | 127 (4.3%) |
| $100,000 to $149,999 | 819 (11.8%) | 8 (0.3%) |
| $150,000 or more | 422 (6.1%) | 50 (1.7%) |
| Total | 6,967 (100.0%) | 2,932 (100.0%) |
Monthly Housing Cost Tiers in Johnson County
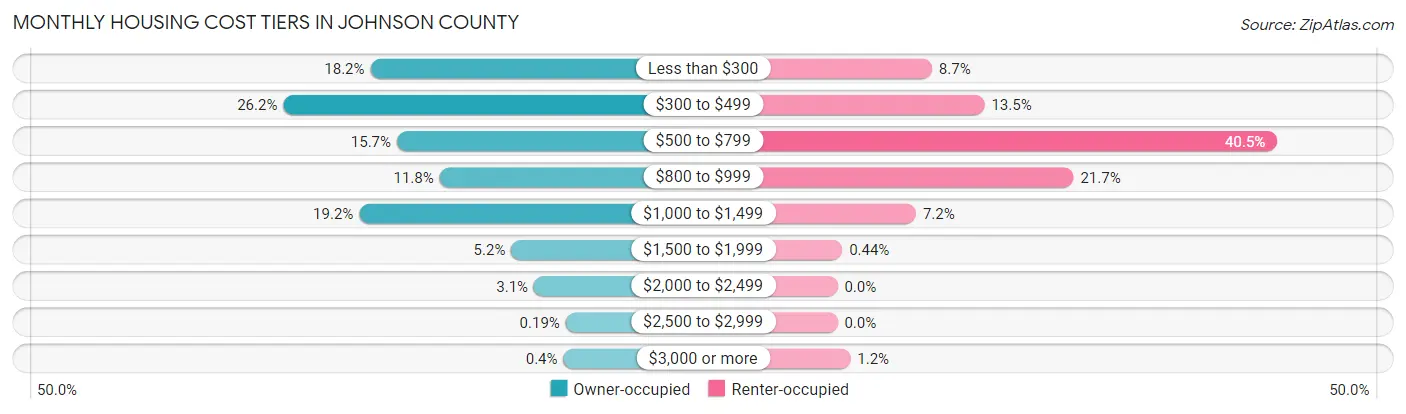
| Monthly Cost | Owner-occupied | Renter-occupied |
| Less than $300 | 1,266 (18.2%) | 255 (8.7%) |
| $300 to $499 | 1,825 (26.2%) | 397 (13.5%) |
| $500 to $799 | 1,096 (15.7%) | 1,187 (40.5%) |
| $800 to $999 | 822 (11.8%) | 637 (21.7%) |
| $1,000 to $1,499 | 1,338 (19.2%) | 212 (7.2%) |
| $1,500 to $1,999 | 362 (5.2%) | 13 (0.4%) |
| $2,000 to $2,499 | 217 (3.1%) | 0 (0.0%) |
| $2,500 to $2,999 | 13 (0.2%) | 0 (0.0%) |
| $3,000 or more | 28 (0.4%) | 35 (1.2%) |
| Total | 6,967 (100.0%) | 2,932 (100.0%) |
Physical Housing Characteristics in Johnson County
Housing Structures in Johnson County
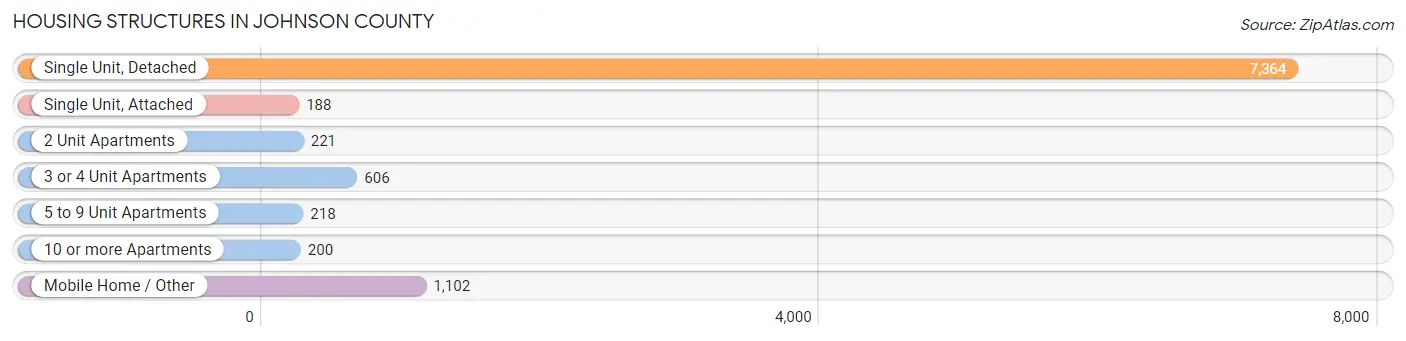
| Structure Type | # Housing Units | % Housing Units |
| Single Unit, Detached | 7,364 | 74.4% |
| Single Unit, Attached | 188 | 1.9% |
| 2 Unit Apartments | 221 | 2.2% |
| 3 or 4 Unit Apartments | 606 | 6.1% |
| 5 to 9 Unit Apartments | 218 | 2.2% |
| 10 or more Apartments | 200 | 2.0% |
| Mobile Home / Other | 1,102 | 11.1% |
| Total | 9,899 | 100.0% |
Housing Structures by Occupancy in Johnson County
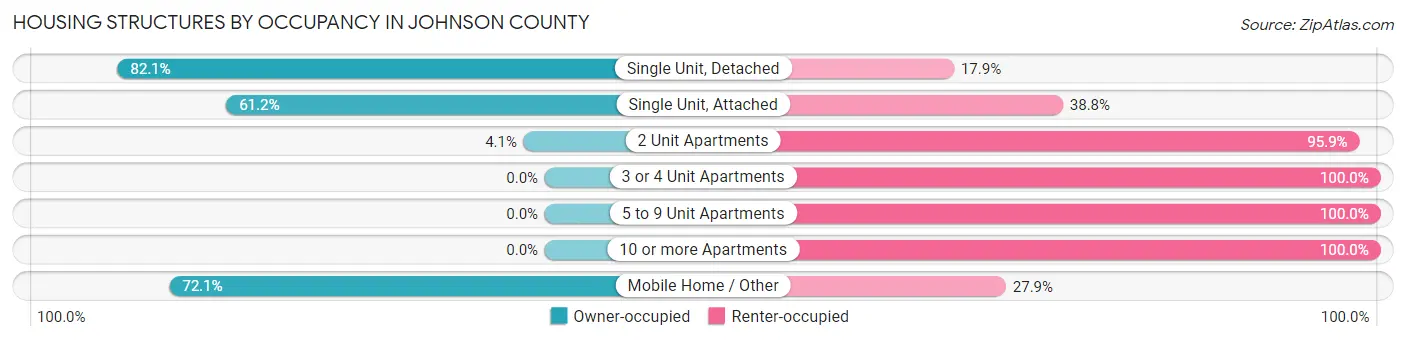
| Structure Type | Owner-occupied | Renter-occupied |
| Single Unit, Detached | 6,048 (82.1%) | 1,316 (17.9%) |
| Single Unit, Attached | 115 (61.2%) | 73 (38.8%) |
| 2 Unit Apartments | 9 (4.1%) | 212 (95.9%) |
| 3 or 4 Unit Apartments | 0 (0.0%) | 606 (100.0%) |
| 5 to 9 Unit Apartments | 0 (0.0%) | 218 (100.0%) |
| 10 or more Apartments | 0 (0.0%) | 200 (100.0%) |
| Mobile Home / Other | 795 (72.1%) | 307 (27.9%) |
| Total | 6,967 (70.4%) | 2,932 (29.6%) |
Housing Structures by Number of Rooms in Johnson County
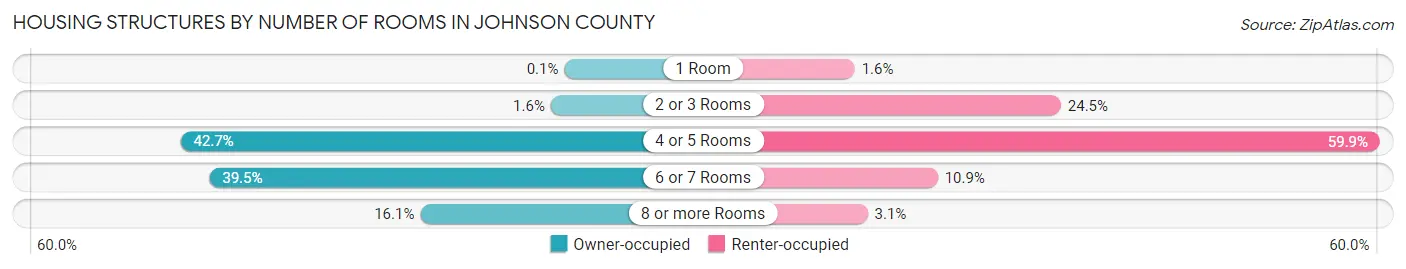
| Number of Rooms | Owner-occupied | Renter-occupied |
| 1 Room | 7 (0.1%) | 48 (1.6%) |
| 2 or 3 Rooms | 112 (1.6%) | 719 (24.5%) |
| 4 or 5 Rooms | 2,975 (42.7%) | 1,757 (59.9%) |
| 6 or 7 Rooms | 2,752 (39.5%) | 318 (10.8%) |
| 8 or more Rooms | 1,121 (16.1%) | 90 (3.1%) |
| Total | 6,967 (100.0%) | 2,932 (100.0%) |
Housing Structure by Heating Type in Johnson County
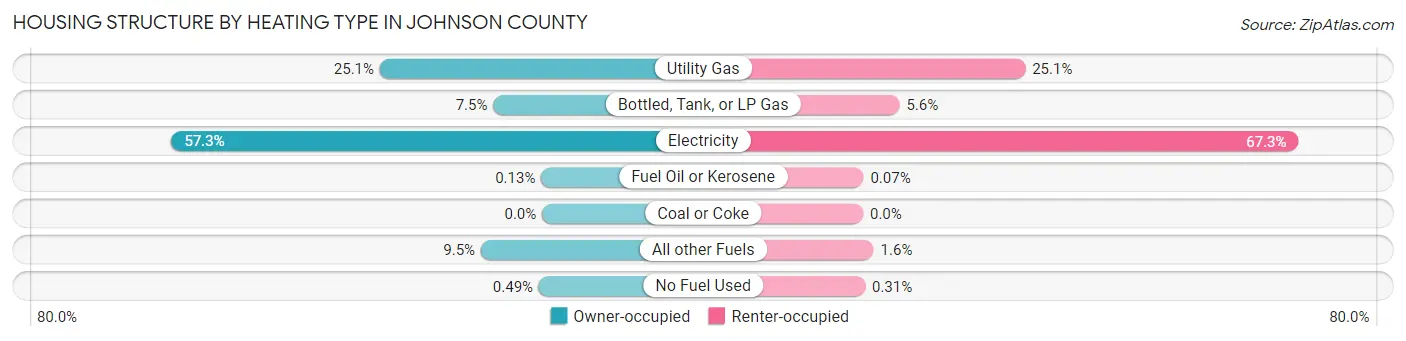
| Heating Type | Owner-occupied | Renter-occupied |
| Utility Gas | 1,747 (25.1%) | 735 (25.1%) |
| Bottled, Tank, or LP Gas | 525 (7.5%) | 165 (5.6%) |
| Electricity | 3,993 (57.3%) | 1,973 (67.3%) |
| Fuel Oil or Kerosene | 9 (0.1%) | 2 (0.1%) |
| Coal or Coke | 0 (0.0%) | 0 (0.0%) |
| All other Fuels | 659 (9.5%) | 48 (1.6%) |
| No Fuel Used | 34 (0.5%) | 9 (0.3%) |
| Total | 6,967 (100.0%) | 2,932 (100.0%) |
Household Vehicle Usage in Johnson County
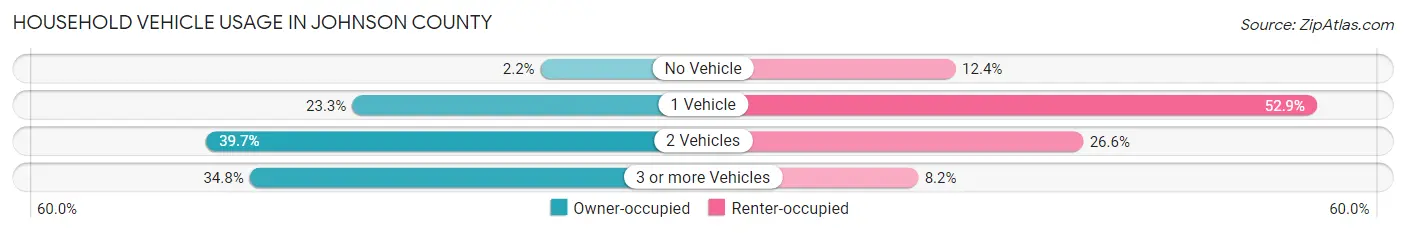
| Vehicles per Household | Owner-occupied | Renter-occupied |
| No Vehicle | 155 (2.2%) | 362 (12.3%) |
| 1 Vehicle | 1,624 (23.3%) | 1,550 (52.9%) |
| 2 Vehicles | 2,763 (39.7%) | 781 (26.6%) |
| 3 or more Vehicles | 2,425 (34.8%) | 239 (8.2%) |
| Total | 6,967 (100.0%) | 2,932 (100.0%) |
Real Estate & Mortgages in Johnson County
Real Estate and Mortgage Overview in Johnson County
| Characteristic | Without Mortgage | With Mortgage |
| Housing Units | 3,700 | 3,267 |
| Median Property Value | $105,200 | $143,400 |
| Median Household Income | $45,526 | $299 |
| Monthly Housing Costs | $344 | $28 |
| Real Estate Taxes | $605 | $208 |
Property Value by Mortgage Status in Johnson County
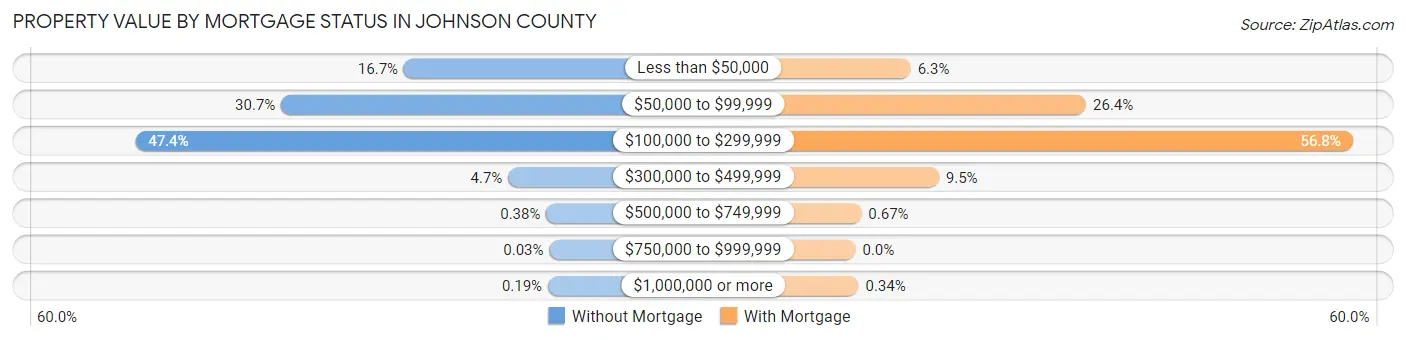
| Property Value | Without Mortgage | With Mortgage |
| Less than $50,000 | 616 (16.7%) | 206 (6.3%) |
| $50,000 to $99,999 | 1,135 (30.7%) | 861 (26.4%) |
| $100,000 to $299,999 | 1,752 (47.3%) | 1,856 (56.8%) |
| $300,000 to $499,999 | 175 (4.7%) | 311 (9.5%) |
| $500,000 to $749,999 | 14 (0.4%) | 22 (0.7%) |
| $750,000 to $999,999 | 1 (0.0%) | 0 (0.0%) |
| $1,000,000 or more | 7 (0.2%) | 11 (0.3%) |
| Total | 3,700 (100.0%) | 3,267 (100.0%) |
Household Income by Mortgage Status in Johnson County
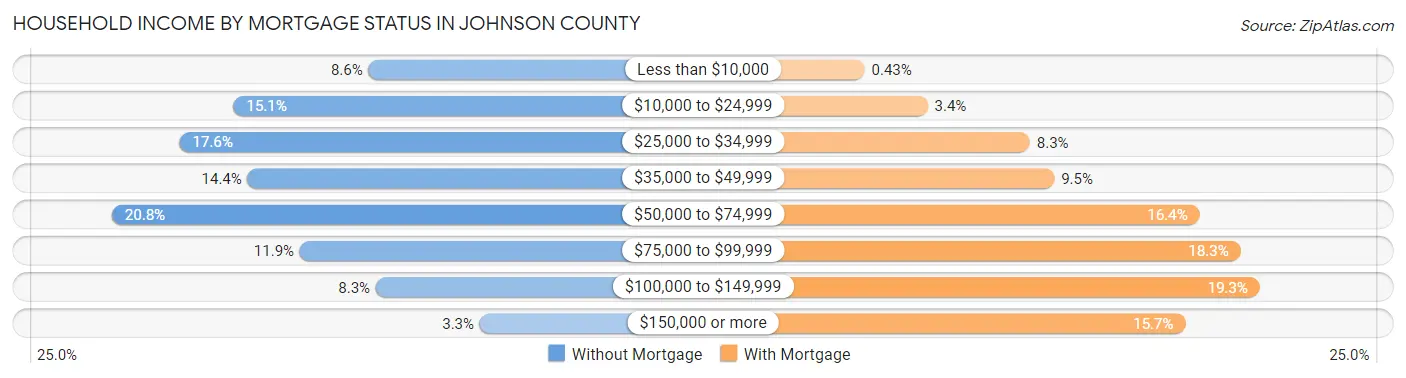
| Household Income | Without Mortgage | With Mortgage |
| Less than $10,000 | 319 (8.6%) | 14 (0.4%) |
| $10,000 to $24,999 | 557 (15.0%) | 112 (3.4%) |
| $25,000 to $34,999 | 652 (17.6%) | 271 (8.3%) |
| $35,000 to $49,999 | 532 (14.4%) | 309 (9.5%) |
| $50,000 to $74,999 | 771 (20.8%) | 535 (16.4%) |
| $75,000 to $99,999 | 440 (11.9%) | 599 (18.3%) |
| $100,000 to $149,999 | 306 (8.3%) | 629 (19.3%) |
| $150,000 or more | 123 (3.3%) | 513 (15.7%) |
| Total | 3,700 (100.0%) | 3,267 (100.0%) |
Property Value to Household Income Ratio in Johnson County
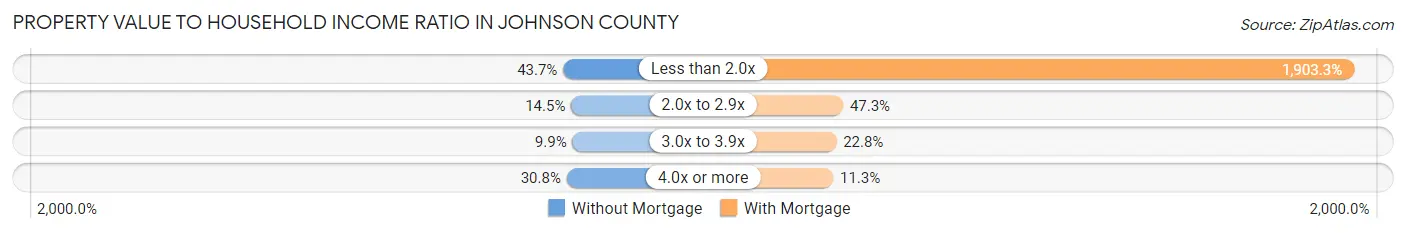
| Value-to-Income Ratio | Without Mortgage | With Mortgage |
| Less than 2.0x | 1,618 (43.7%) | 62,181 (1,903.3%) |
| 2.0x to 2.9x | 538 (14.5%) | 1,546 (47.3%) |
| 3.0x to 3.9x | 366 (9.9%) | 744 (22.8%) |
| 4.0x or more | 1,140 (30.8%) | 370 (11.3%) |
| Total | 3,700 (100.0%) | 3,267 (100.0%) |
Real Estate Taxes by Mortgage Status in Johnson County
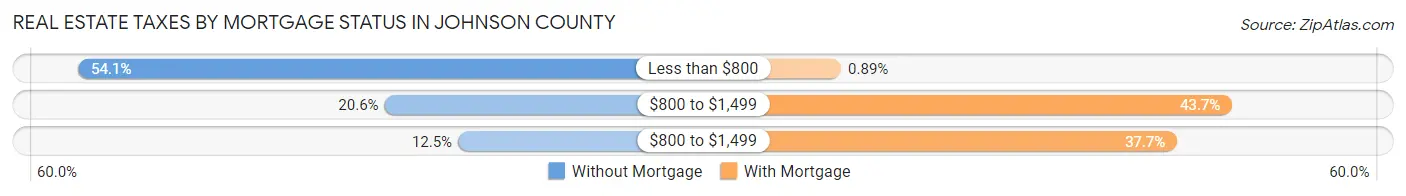
| Property Taxes | Without Mortgage | With Mortgage |
| Less than $800 | 2,003 (54.1%) | 29 (0.9%) |
| $800 to $1,499 | 761 (20.6%) | 1,429 (43.7%) |
| $800 to $1,499 | 463 (12.5%) | 1,232 (37.7%) |
| Total | 3,700 (100.0%) | 3,267 (100.0%) |
Health & Disability in Johnson County
Health Insurance Coverage by Age in Johnson County
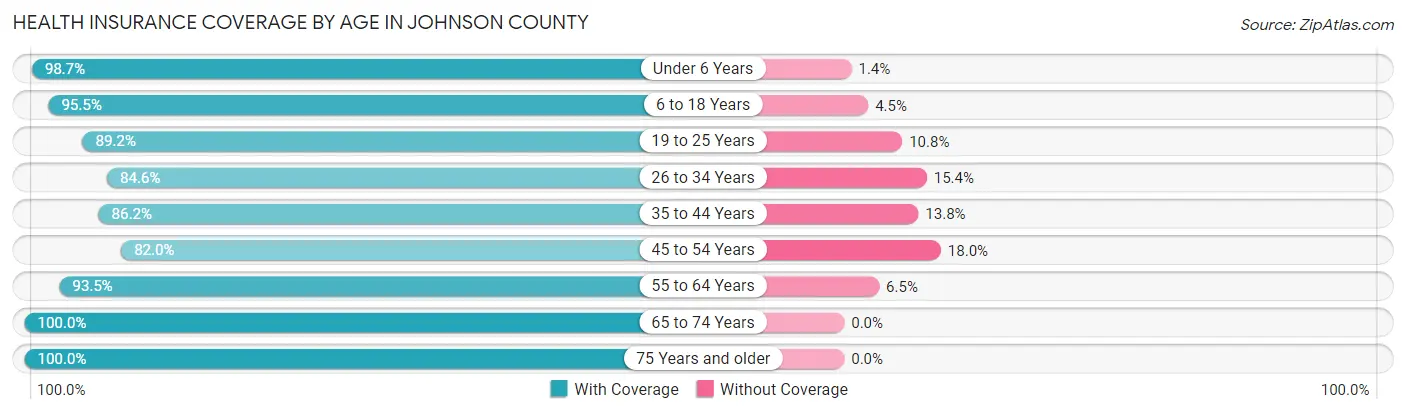
| Age Bracket | With Coverage | Without Coverage |
| Under 6 Years | 1,969 (98.7%) | 27 (1.3%) |
| 6 to 18 Years | 4,712 (95.5%) | 220 (4.5%) |
| 19 to 25 Years | 1,840 (89.2%) | 223 (10.8%) |
| 26 to 34 Years | 2,372 (84.6%) | 431 (15.4%) |
| 35 to 44 Years | 2,501 (86.2%) | 401 (13.8%) |
| 45 to 54 Years | 2,661 (82.0%) | 585 (18.0%) |
| 55 to 64 Years | 3,323 (93.5%) | 231 (6.5%) |
| 65 to 74 Years | 2,585 (100.0%) | 0 (0.0%) |
| 75 Years and older | 1,639 (100.0%) | 0 (0.0%) |
| Total | 23,602 (91.8%) | 2,118 (8.2%) |
Health Insurance Coverage by Citizenship Status in Johnson County
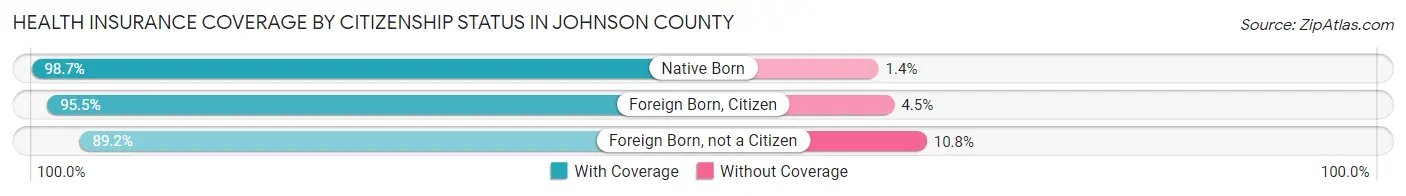
| Citizenship Status | With Coverage | Without Coverage |
| Native Born | 1,969 (98.7%) | 27 (1.3%) |
| Foreign Born, Citizen | 4,712 (95.5%) | 220 (4.5%) |
| Foreign Born, not a Citizen | 1,840 (89.2%) | 223 (10.8%) |
Health Insurance Coverage by Household Income in Johnson County
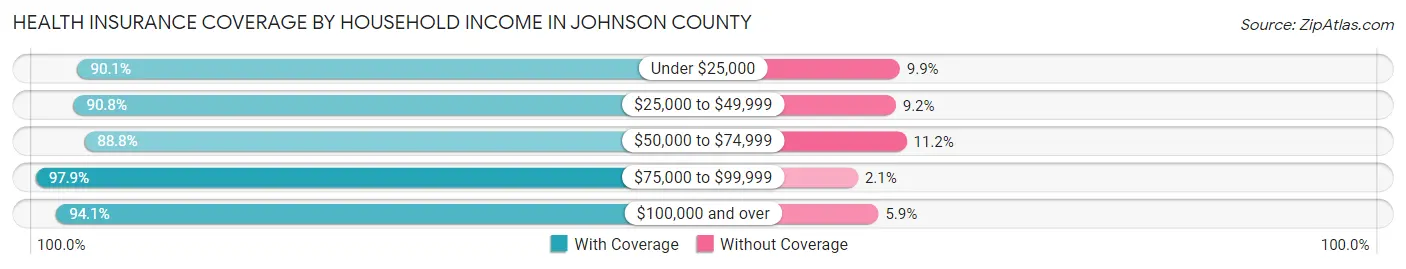
| Household Income | With Coverage | Without Coverage |
| Under $25,000 | 4,447 (90.1%) | 491 (9.9%) |
| $25,000 to $49,999 | 6,795 (90.8%) | 687 (9.2%) |
| $50,000 to $74,999 | 4,422 (88.8%) | 557 (11.2%) |
| $75,000 to $99,999 | 3,541 (97.9%) | 76 (2.1%) |
| $100,000 and over | 3,895 (94.1%) | 246 (5.9%) |
Public vs Private Health Insurance Coverage by Age in Johnson County
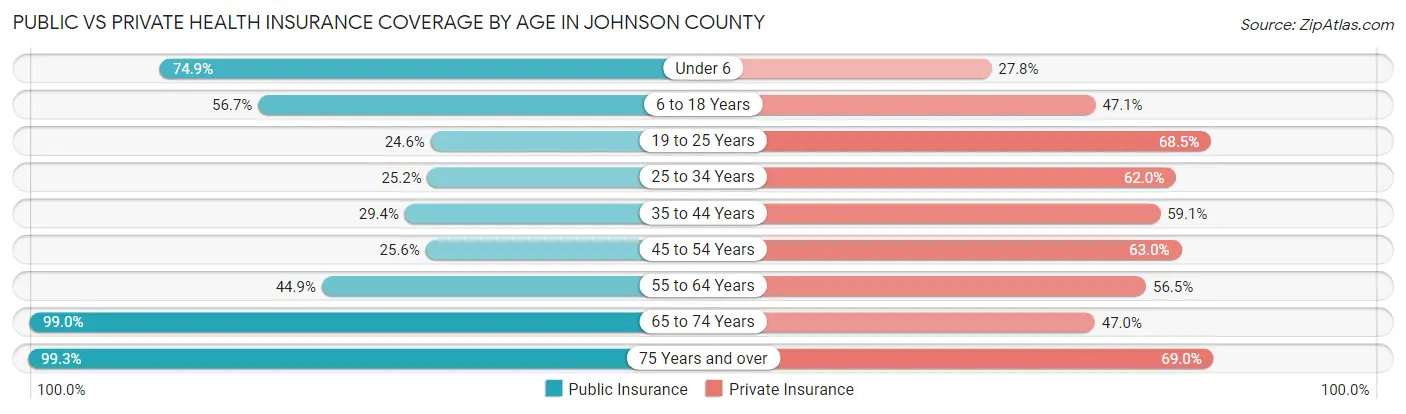
| Age Bracket | Public Insurance | Private Insurance |
| Under 6 | 1,495 (74.9%) | 554 (27.8%) |
| 6 to 18 Years | 2,794 (56.7%) | 2,322 (47.1%) |
| 19 to 25 Years | 508 (24.6%) | 1,414 (68.5%) |
| 25 to 34 Years | 707 (25.2%) | 1,739 (62.0%) |
| 35 to 44 Years | 854 (29.4%) | 1,715 (59.1%) |
| 45 to 54 Years | 830 (25.6%) | 2,046 (63.0%) |
| 55 to 64 Years | 1,594 (44.9%) | 2,007 (56.5%) |
| 65 to 74 Years | 2,558 (99.0%) | 1,214 (47.0%) |
| 75 Years and over | 1,628 (99.3%) | 1,131 (69.0%) |
| Total | 12,968 (50.4%) | 14,142 (55.0%) |
Disability Status by Sex by Age in Johnson County
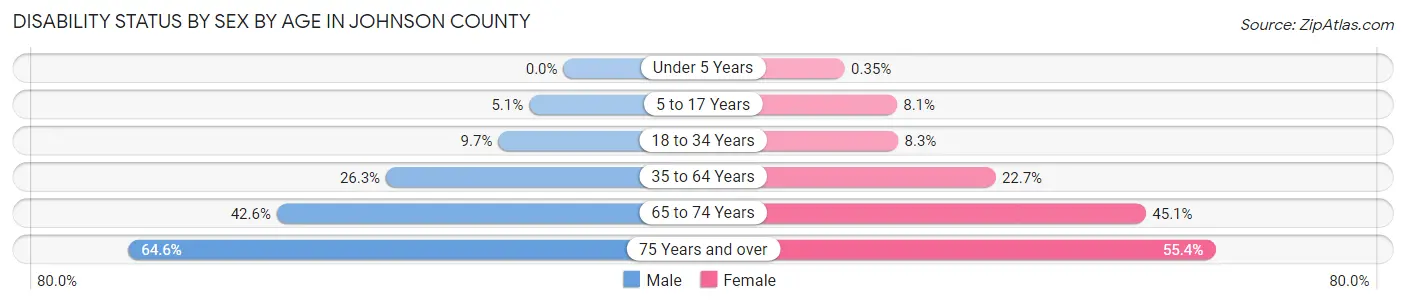
| Age Bracket | Male | Female |
| Under 5 Years | 0 (0.0%) | 3 (0.4%) |
| 5 to 17 Years | 120 (5.1%) | 188 (8.1%) |
| 18 to 34 Years | 264 (9.7%) | 221 (8.3%) |
| 35 to 64 Years | 1,299 (26.3%) | 1,085 (22.7%) |
| 65 to 74 Years | 529 (42.6%) | 605 (45.1%) |
| 75 Years and over | 485 (64.6%) | 492 (55.4%) |
Disability Class by Sex by Age in Johnson County
Disability Class: Hearing Difficulty
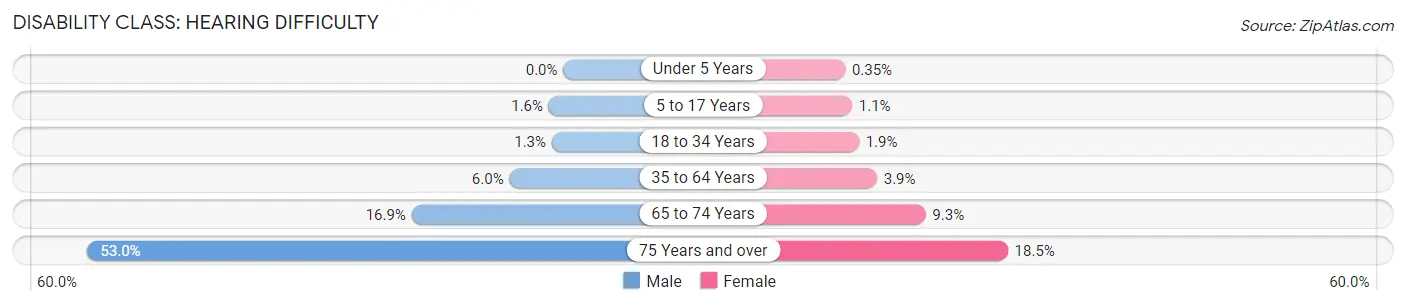
| Age Bracket | Male | Female |
| Under 5 Years | 0 (0.0%) | 3 (0.4%) |
| 5 to 17 Years | 38 (1.6%) | 26 (1.1%) |
| 18 to 34 Years | 35 (1.3%) | 50 (1.9%) |
| 35 to 64 Years | 296 (6.0%) | 186 (3.9%) |
| 65 to 74 Years | 210 (16.9%) | 125 (9.3%) |
| 75 Years and over | 398 (53.0%) | 164 (18.5%) |
Disability Class: Vision Difficulty
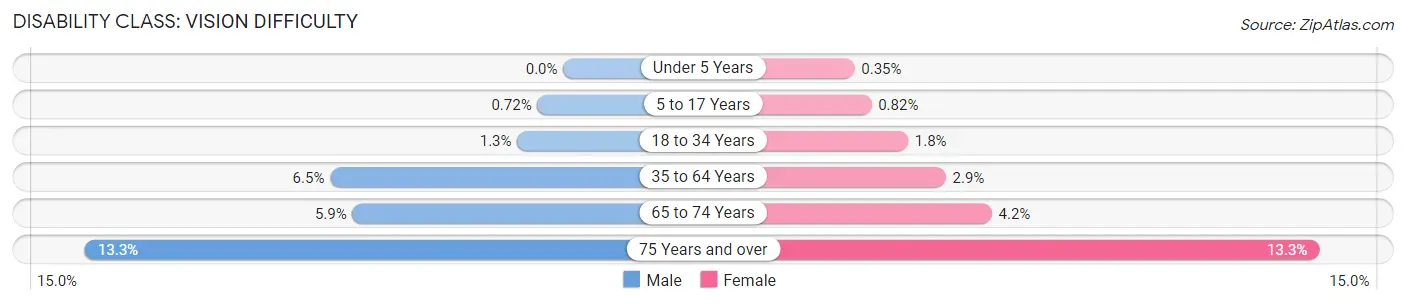
| Age Bracket | Male | Female |
| Under 5 Years | 0 (0.0%) | 3 (0.4%) |
| 5 to 17 Years | 17 (0.7%) | 19 (0.8%) |
| 18 to 34 Years | 35 (1.3%) | 49 (1.8%) |
| 35 to 64 Years | 320 (6.5%) | 138 (2.9%) |
| 65 to 74 Years | 73 (5.9%) | 56 (4.2%) |
| 75 Years and over | 100 (13.3%) | 118 (13.3%) |
Disability Class: Cognitive Difficulty
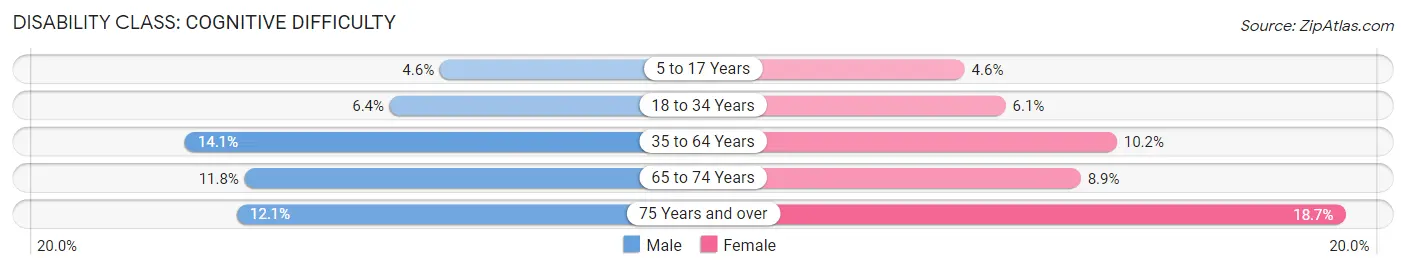
| Age Bracket | Male | Female |
| 5 to 17 Years | 108 (4.6%) | 106 (4.6%) |
| 18 to 34 Years | 176 (6.4%) | 162 (6.1%) |
| 35 to 64 Years | 693 (14.1%) | 487 (10.2%) |
| 65 to 74 Years | 147 (11.8%) | 119 (8.9%) |
| 75 Years and over | 91 (12.1%) | 166 (18.7%) |
Disability Class: Ambulatory Difficulty
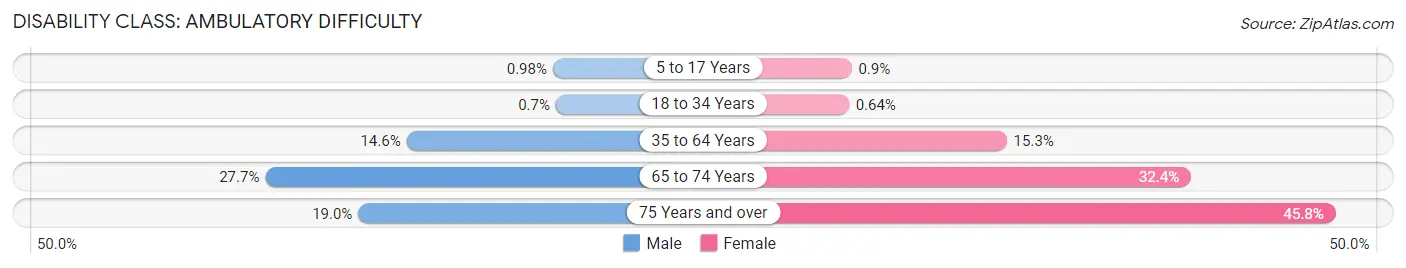
| Age Bracket | Male | Female |
| 5 to 17 Years | 23 (1.0%) | 21 (0.9%) |
| 18 to 34 Years | 19 (0.7%) | 17 (0.6%) |
| 35 to 64 Years | 718 (14.6%) | 730 (15.3%) |
| 65 to 74 Years | 344 (27.7%) | 435 (32.4%) |
| 75 Years and over | 143 (19.0%) | 407 (45.8%) |
Disability Class: Self-Care Difficulty
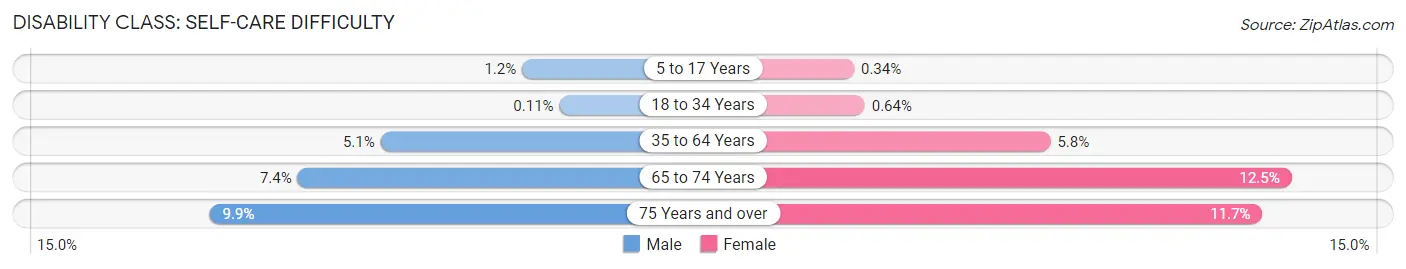
| Age Bracket | Male | Female |
| 5 to 17 Years | 27 (1.1%) | 8 (0.3%) |
| 18 to 34 Years | 3 (0.1%) | 17 (0.6%) |
| 35 to 64 Years | 251 (5.1%) | 277 (5.8%) |
| 65 to 74 Years | 92 (7.4%) | 168 (12.5%) |
| 75 Years and over | 74 (9.9%) | 104 (11.7%) |
Technology Access in Johnson County
Computing Device Access in Johnson County
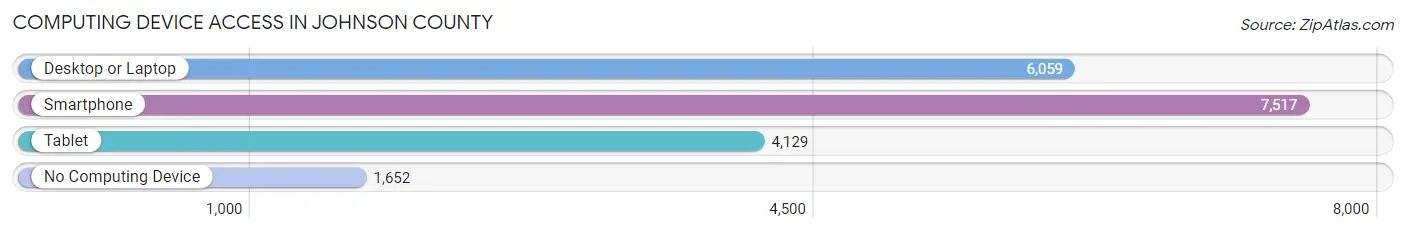
| Device Type | # Households | % Households |
| Desktop or Laptop | 6,059 | 61.2% |
| Smartphone | 7,517 | 75.9% |
| Tablet | 4,129 | 41.7% |
| No Computing Device | 1,652 | 16.7% |
| Total | 9,899 | 100.0% |
Internet Access in Johnson County
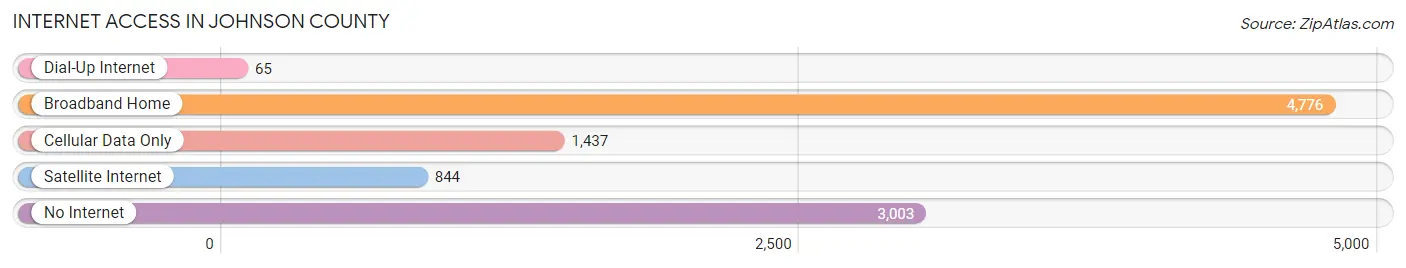
| Internet Type | # Households | % Households |
| Dial-Up Internet | 65 | 0.7% |
| Broadband Home | 4,776 | 48.2% |
| Cellular Data Only | 1,437 | 14.5% |
| Satellite Internet | 844 | 8.5% |
| No Internet | 3,003 | 30.3% |
| Total | 9,899 | 100.0% |
Johnson County Summary
Johnson County, Arkansas is located in the northwest corner of the state and is bordered by Franklin County to the north, Pope County to the east, Yell County to the south, and Logan County to the west. The county seat is Clarksville, and the county has a total area of 602 square miles.
History
Johnson County was formed in 1833 from parts of Pope and Franklin counties. It was named for Benjamin Johnson, a prominent early settler and state legislator. The first settlers in the area were mostly farmers from Tennessee and Kentucky, who arrived in the early 1800s. The county was largely rural until the late 19th century, when the railroad arrived and the timber industry began to boom. The county seat of Clarksville was established in 1836 and the first courthouse was built in 1837.
The county experienced significant growth in the early 20th century, as the timber industry continued to expand and the population increased. The county was also home to several military bases during World War II, including Camp Chaffee and Camp Robinson. After the war, the county continued to grow, with the establishment of the University of the Ozarks in Clarksville in 1949.
Geography
Johnson County is located in the Ozark Mountains region of Arkansas. The terrain is mostly hilly and forested, with the highest point being Mount Magazine at 2,753 feet. The county is drained by the Arkansas River and its tributaries, including the Petit Jean River, the Illinois Bayou, and the Mulberry River. The county is home to several state parks, including Mount Magazine State Park, Ozark National Forest, and Petit Jean State Park.
Economy
The economy of Johnson County is largely based on agriculture and forestry. The county is home to several large farms, as well as several timber companies. The county is also home to several manufacturing companies, including a paper mill and a furniture factory. Tourism is also an important part of the economy, with several state parks and recreational areas located in the county.
Demographics
As of the 2010 census, Johnson County had a population of 25,540. The population was spread out, with 24.3% under the age of 18, 8.2% from 18 to 24, 28.2% from 25 to 44, 24.3% from 45 to 64, and 14.0% who were 65 years of age or older. The median age was 37.4 years. The median income for a household in the county was $35,945, and the median income for a family was $45,945. The per capita income for the county was $19,845.
Johnson County is largely rural and has a population that is predominantly white (94.3%). The largest minority group is African American (3.3%), followed by Hispanic (1.3%) and Asian (0.7%). The county is also home to a small Native American population (0.2%). The county is served by several school districts, including the Clarksville School District, the Ozark School District, and the Johnson County School District.
Common Questions
What is Per Capita Income in Johnson County?
Per Capita income in Johnson County is $22,457.
What is the Median Family Income in Johnson County?
Median Family Income in Johnson County is $52,822.
What is the Median Household income in Johnson County?
Median Household Income in Johnson County is $42,470.
What is Income or Wage Gap in Johnson County?
Income or Wage Gap in Johnson County is 27.5%.
Women in Johnson County earn 72.5 cents for every dollar earned by a man.
What is Family Income Deficit in Johnson County?
Family Income Deficit in Johnson County is $11,151.
Families that are below poverty line in Johnson County earn $11,151 less on average than the poverty threshold level.
What is Inequality or Gini Index in Johnson County?
Inequality or Gini Index in Johnson County is 0.45.
What is the Total Population of Johnson County?
Total Population of Johnson County is 25,925.
What is the Total Male Population of Johnson County?
Total Male Population of Johnson County is 12,974.
What is the Total Female Population of Johnson County?
Total Female Population of Johnson County is 12,951.
What is the Ratio of Males per 100 Females in Johnson County?
There are 100.18 Males per 100 Females in Johnson County.
What is the Ratio of Females per 100 Males in Johnson County?
There are 99.82 Females per 100 Males in Johnson County.
What is the Median Population Age in Johnson County?
Median Population Age in Johnson County is 39.0 Years.
What is the Average Family Size in Johnson County
Average Family Size in Johnson County is 3.1 People.
What is the Average Household Size in Johnson County
Average Household Size in Johnson County is 2.5 People.
How Large is the Labor Force in Johnson County?
There are 10,484 People in the Labor Forcein in Johnson County.
What is the Percentage of People in the Labor Force in Johnson County?
51.8% of People are in the Labor Force in Johnson County.
What is the Unemployment Rate in Johnson County?
Unemployment Rate in Johnson County is 4.8%.