Marion, AR Map & Demographics
Marion Map
Marion Overview
$37,483
PER CAPITA INCOME
$90,814
AVG FAMILY INCOME
$77,350
AVG HOUSEHOLD INCOME
31.7%
WAGE / INCOME GAP [ % ]
68.3¢/ $1
WAGE / INCOME GAP [ $ ]
0.44
INEQUALITY / GINI INDEX
13,635
TOTAL POPULATION
6,836
MALE POPULATION
6,799
FEMALE POPULATION
100.54
MALES / 100 FEMALES
99.46
FEMALES / 100 MALES
35.5
MEDIAN AGE
3.3
AVG FAMILY SIZE
2.6
AVG HOUSEHOLD SIZE
7,095
LABOR FORCE [ PEOPLE ]
70.1%
PERCENT IN LABOR FORCE
5.6%
UNEMPLOYMENT RATE
Marion Zip Codes
Marion Area Codes
Income in Marion
Income Overview in Marion
Per Capita Income in Marion is $37,483, while median incomes of families and households are $90,814 and $77,350 respectively.
| Characteristic | Number | Measure |
| Per Capita Income | 13,635 | $37,483 |
| Median Family Income | 3,463 | $90,814 |
| Mean Family Income | 3,463 | $119,018 |
| Median Household Income | 5,105 | $77,350 |
| Mean Household Income | 5,105 | $99,590 |
| Income Deficit | 3,463 | $0 |
| Wage / Income Gap (%) | 13,635 | 31.75% |
| Wage / Income Gap ($) | 13,635 | 68.25¢ per $1 |
| Gini / Inequality Index | 13,635 | 0.44 |
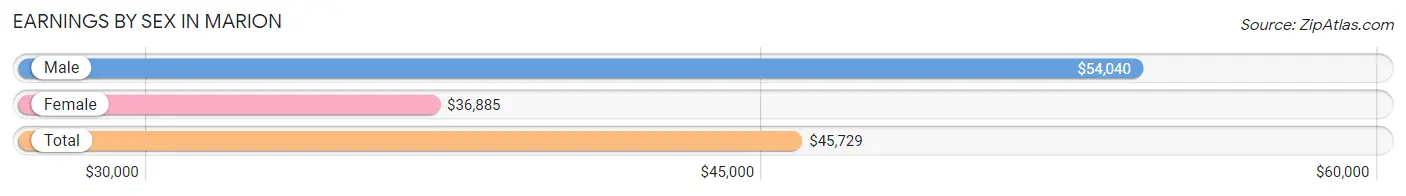
Earnings by Sex in Marion
Average Earnings in Marion are $45,729, $54,040 for men and $36,885 for women, a difference of 31.8%.
| Sex | Number | Average Earnings |
| Male | 3,649 (50.3%) | $54,040 |
| Female | 3,606 (49.7%) | $36,885 |
| Total | 7,255 (100.0%) | $45,729 |
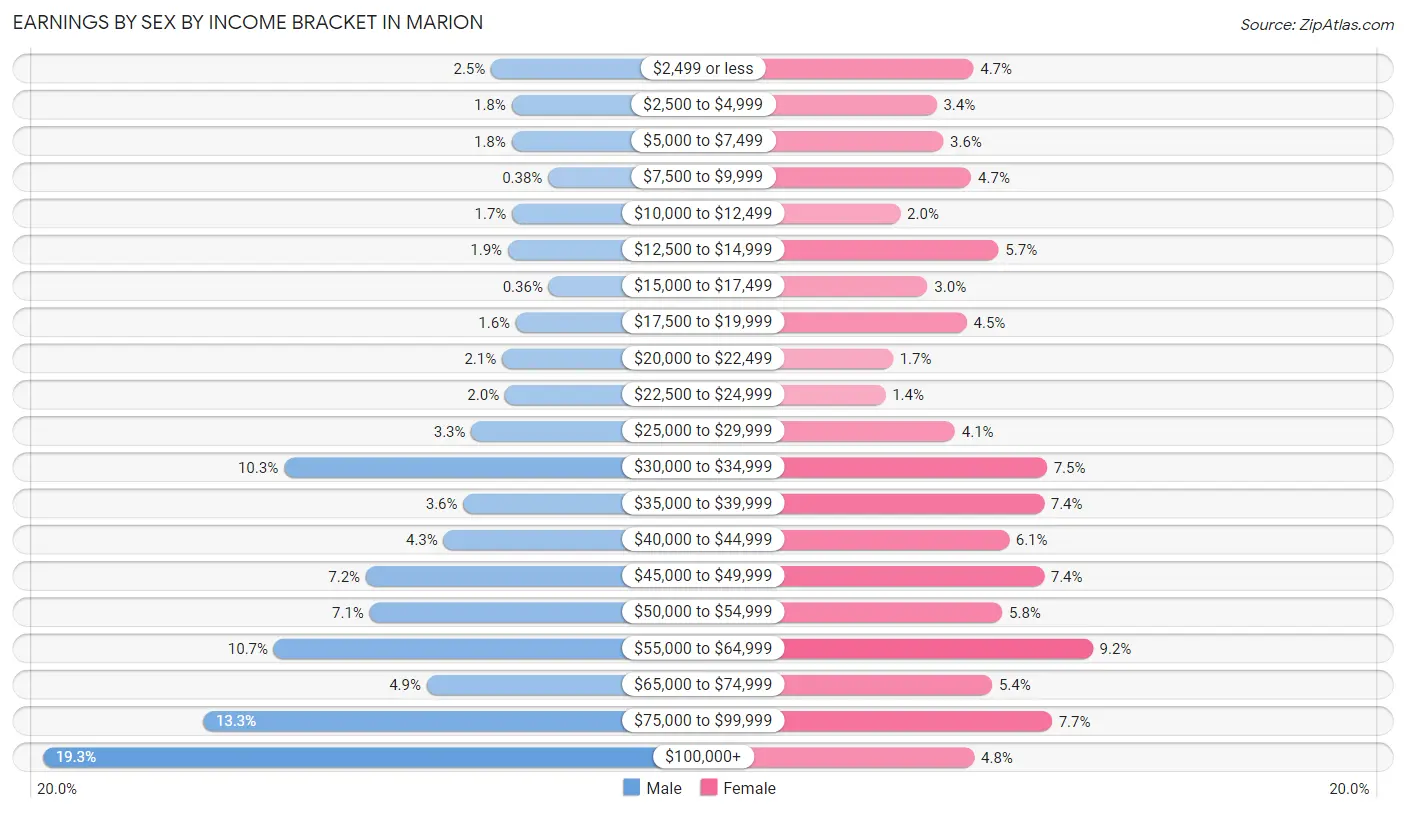
Earnings by Sex by Income Bracket in Marion
The most common earnings brackets in Marion are $100,000+ for men (705 | 19.3%) and $55,000 to $64,999 for women (332 | 9.2%).
| Income | Male | Female |
| $2,499 or less | 92 (2.5%) | 171 (4.7%) |
| $2,500 to $4,999 | 64 (1.8%) | 121 (3.4%) |
| $5,000 to $7,499 | 64 (1.8%) | 130 (3.6%) |
| $7,500 to $9,999 | 14 (0.4%) | 168 (4.7%) |
| $10,000 to $12,499 | 63 (1.7%) | 72 (2.0%) |
| $12,500 to $14,999 | 69 (1.9%) | 205 (5.7%) |
| $15,000 to $17,499 | 13 (0.4%) | 109 (3.0%) |
| $17,500 to $19,999 | 58 (1.6%) | 162 (4.5%) |
| $20,000 to $22,499 | 77 (2.1%) | 62 (1.7%) |
| $22,500 to $24,999 | 73 (2.0%) | 52 (1.4%) |
| $25,000 to $29,999 | 119 (3.3%) | 146 (4.1%) |
| $30,000 to $34,999 | 375 (10.3%) | 270 (7.5%) |
| $35,000 to $39,999 | 130 (3.6%) | 266 (7.4%) |
| $40,000 to $44,999 | 157 (4.3%) | 219 (6.1%) |
| $45,000 to $49,999 | 263 (7.2%) | 266 (7.4%) |
| $50,000 to $54,999 | 258 (7.1%) | 210 (5.8%) |
| $55,000 to $64,999 | 389 (10.7%) | 332 (9.2%) |
| $65,000 to $74,999 | 180 (4.9%) | 196 (5.4%) |
| $75,000 to $99,999 | 486 (13.3%) | 277 (7.7%) |
| $100,000+ | 705 (19.3%) | 172 (4.8%) |
| Total | 3,649 (100.0%) | 3,606 (100.0%) |
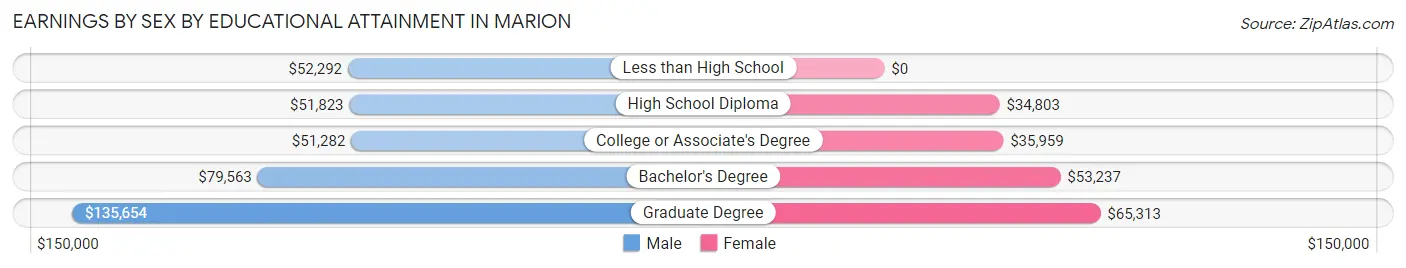
Earnings by Sex by Educational Attainment in Marion
Average earnings in Marion are $56,896 for men and $40,825 for women, a difference of 28.2%. Men with an educational attainment of graduate degree enjoy the highest average annual earnings of $135,654, while those with college or associate's degree education earn the least with $51,282. Women with an educational attainment of graduate degree earn the most with the average annual earnings of $65,313, while those with high school diploma education have the smallest earnings of $34,803.
| Educational Attainment | Male Income | Female Income |
| Less than High School | $52,292 | $0 |
| High School Diploma | $51,823 | $34,803 |
| College or Associate's Degree | $51,282 | $35,959 |
| Bachelor's Degree | $79,563 | $53,237 |
| Graduate Degree | $135,654 | $65,313 |
| Total | $56,896 | $40,825 |
Family Income in Marion
Family Income Brackets in Marion
According to the Marion family income data, there are 862 families falling into the $100,000 to $149,999 income range, which is the most common income bracket and makes up 24.9% of all families. Conversely, the $15,000 to $24,999 income bracket is the least frequent group with only 42 families (1.2%) belonging to this category.
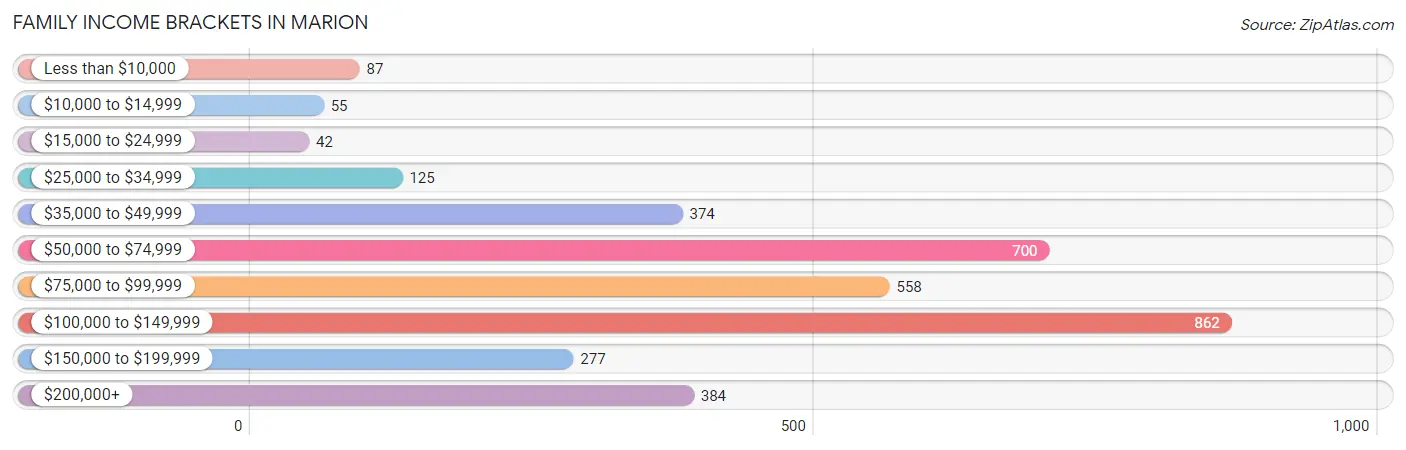
| Income Bracket | # Families | % Families |
| Less than $10,000 | 87 | 2.5% |
| $10,000 to $14,999 | 55 | 1.6% |
| $15,000 to $24,999 | 42 | 1.2% |
| $25,000 to $34,999 | 125 | 3.6% |
| $35,000 to $49,999 | 374 | 10.8% |
| $50,000 to $74,999 | 700 | 20.2% |
| $75,000 to $99,999 | 558 | 16.1% |
| $100,000 to $149,999 | 862 | 24.9% |
| $150,000 to $199,999 | 277 | 8.0% |
| $200,000+ | 384 | 11.1% |
Family Income by Famaliy Size in Marion
4-person families (586 | 16.9%) account for the highest median family income in Marion with $106,722 per family, while 2-person families (1,406 | 40.6%) have the highest median income of $35,956 per family member.
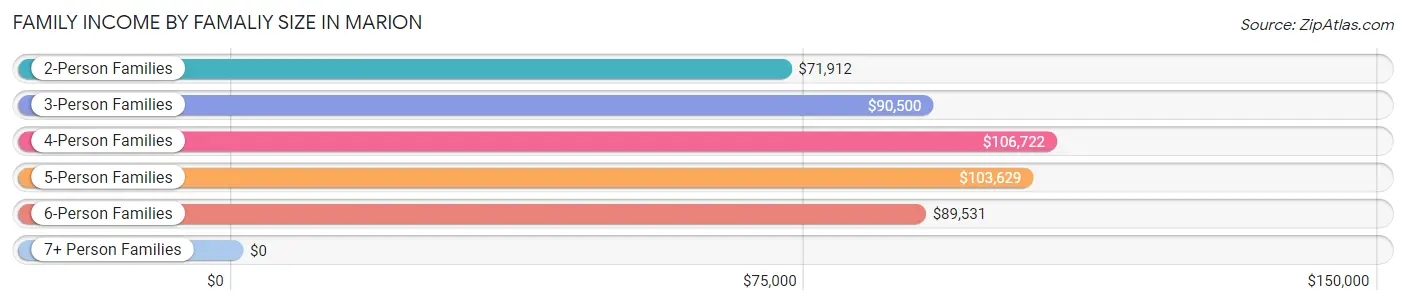
| Income Bracket | # Families | Median Income |
| 2-Person Families | 1,406 (40.6%) | $71,912 |
| 3-Person Families | 1,004 (29.0%) | $90,500 |
| 4-Person Families | 586 (16.9%) | $106,722 |
| 5-Person Families | 334 (9.6%) | $103,629 |
| 6-Person Families | 89 (2.6%) | $89,531 |
| 7+ Person Families | 44 (1.3%) | $0 |
| Total | 3,463 (100.0%) | $90,814 |
Family Income by Number of Earners in Marion
The median family income in Marion is $90,814, with families comprising 3+ earners (272) having the highest median family income of $134,423, while families with no earners (289) have the lowest median family income of $38,750, accounting for 7.9% and 8.4% of families, respectively.
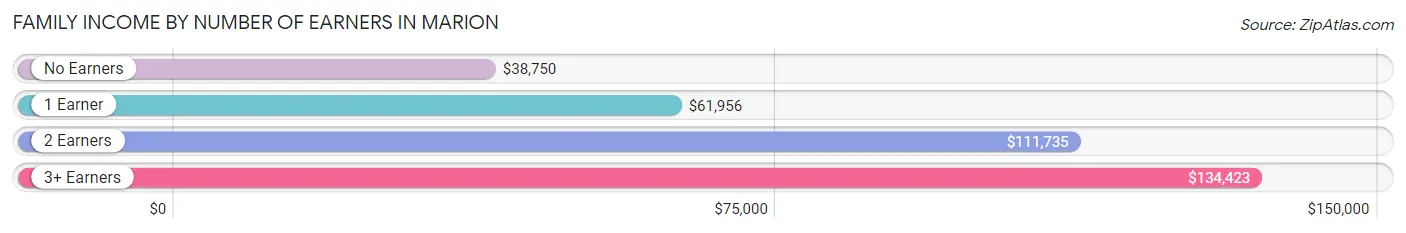
| Number of Earners | # Families | Median Income |
| No Earners | 289 (8.4%) | $38,750 |
| 1 Earner | 1,153 (33.3%) | $61,956 |
| 2 Earners | 1,749 (50.5%) | $111,735 |
| 3+ Earners | 272 (7.9%) | $134,423 |
| Total | 3,463 (100.0%) | $90,814 |
Household Income in Marion
Household Income Brackets in Marion
With 1,123 households falling in the category, the $100,000 to $149,999 income range is the most frequent in Marion, accounting for 22.0% of all households. In contrast, only 174 households (3.4%) fall into the less than $10,000 income bracket, making it the least populous group.
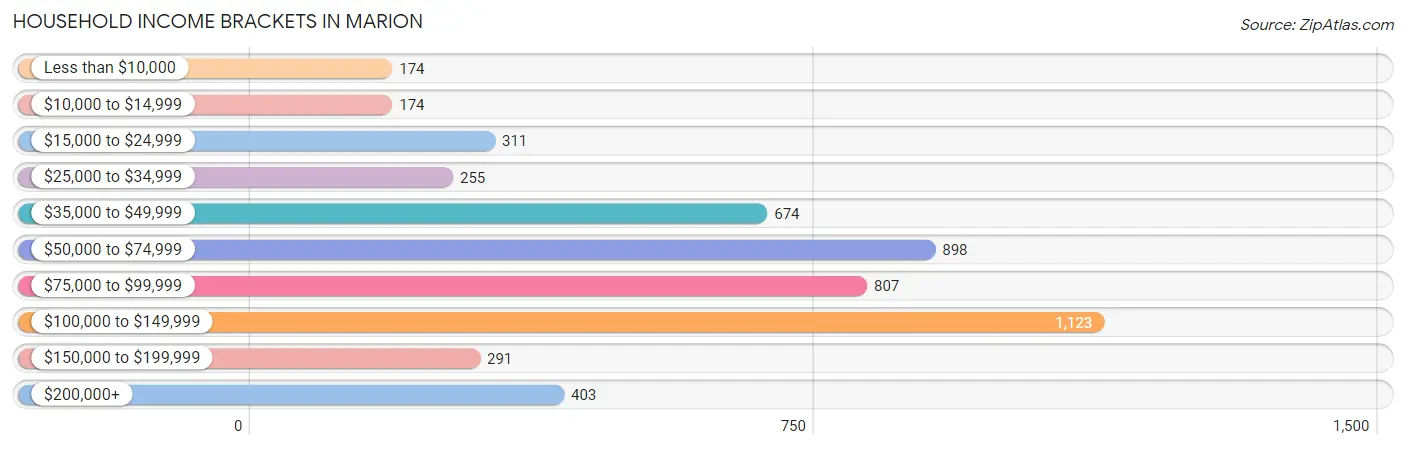
| Income Bracket | # Households | % Households |
| Less than $10,000 | 174 | 3.4% |
| $10,000 to $14,999 | 174 | 3.4% |
| $15,000 to $24,999 | 311 | 6.1% |
| $25,000 to $34,999 | 255 | 5.0% |
| $35,000 to $49,999 | 674 | 13.2% |
| $50,000 to $74,999 | 898 | 17.6% |
| $75,000 to $99,999 | 807 | 15.8% |
| $100,000 to $149,999 | 1,123 | 22.0% |
| $150,000 to $199,999 | 291 | 5.7% |
| $200,000+ | 403 | 7.9% |
Household Income by Householder Age in Marion
The median household income in Marion is $77,350, with the highest median household income of $91,946 found in the 45 to 64 years age bracket for the primary householder. A total of 1,991 households (39.0%) fall into this category. Meanwhile, the 65+ years age bracket for the primary householder has the lowest median household income of $44,219, with 833 households (16.3%) in this group.
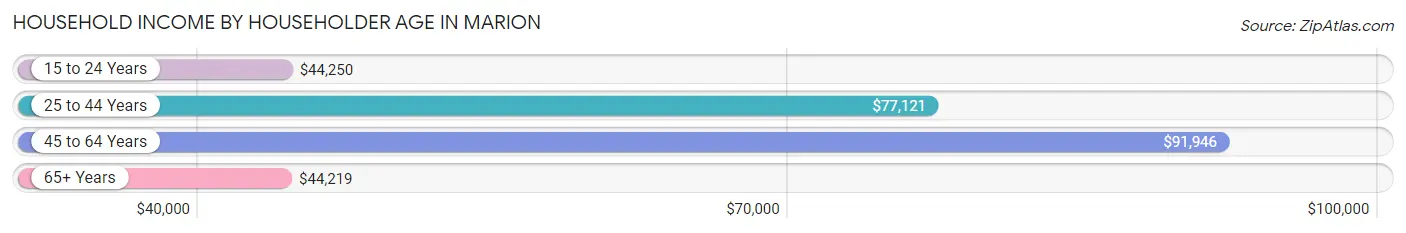
| Income Bracket | # Households | Median Income |
| 15 to 24 Years | 175 (3.4%) | $44,250 |
| 25 to 44 Years | 2,106 (41.2%) | $77,121 |
| 45 to 64 Years | 1,991 (39.0%) | $91,946 |
| 65+ Years | 833 (16.3%) | $44,219 |
| Total | 5,105 (100.0%) | $77,350 |
Poverty in Marion
Income Below Poverty by Sex and Age in Marion
With 6.5% poverty level for males and 9.1% for females among the residents of Marion, 5 year old males and 5 year old females are the most vulnerable to poverty, with 37 males (40.7%) and 10 females (22.7%) in their respective age groups living below the poverty level.
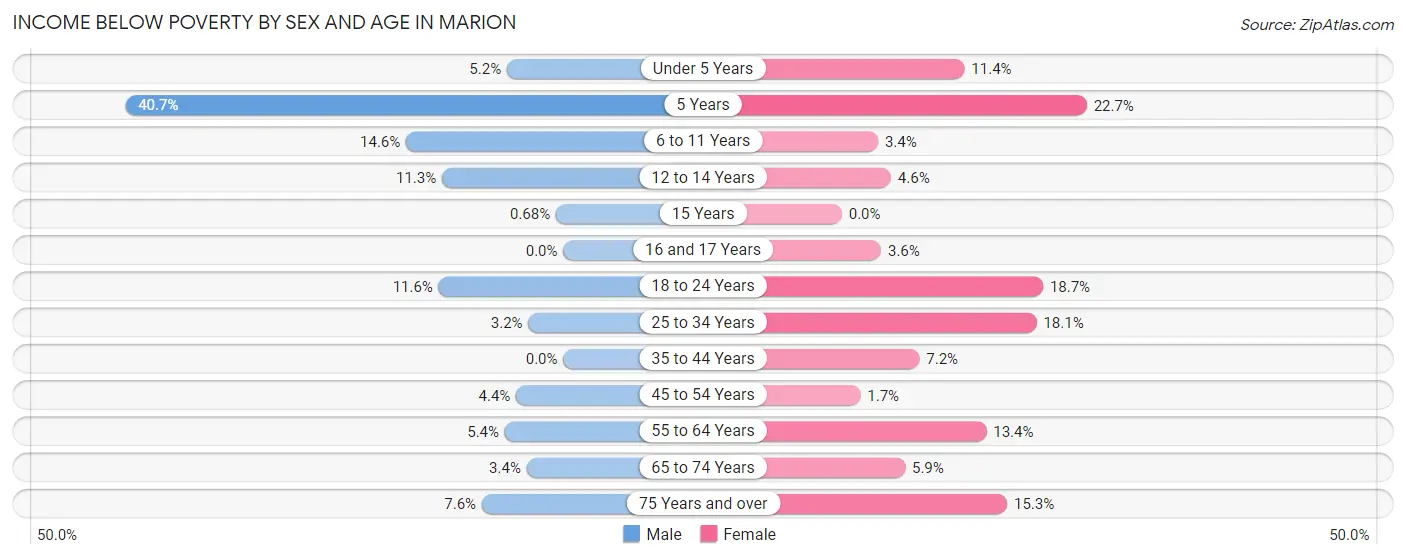
| Age Bracket | Male | Female |
| Under 5 Years | 26 (5.2%) | 28 (11.4%) |
| 5 Years | 37 (40.7%) | 10 (22.7%) |
| 6 to 11 Years | 131 (14.6%) | 19 (3.4%) |
| 12 to 14 Years | 42 (11.3%) | 16 (4.6%) |
| 15 Years | 1 (0.7%) | 0 (0.0%) |
| 16 and 17 Years | 0 (0.0%) | 11 (3.6%) |
| 18 to 24 Years | 65 (11.6%) | 87 (18.7%) |
| 25 to 34 Years | 30 (3.2%) | 152 (18.1%) |
| 35 to 44 Years | 0 (0.0%) | 68 (7.2%) |
| 45 to 54 Years | 46 (4.4%) | 18 (1.7%) |
| 55 to 64 Years | 27 (5.4%) | 124 (13.4%) |
| 65 to 74 Years | 16 (3.4%) | 24 (5.9%) |
| 75 Years and over | 17 (7.6%) | 50 (15.3%) |
| Total | 438 (6.5%) | 607 (9.1%) |
Income Above Poverty by Sex and Age in Marion
According to the poverty statistics in Marion, males aged 16 and 17 years and females aged 15 years are the age groups that are most secure financially, with 100.0% of males and 100.0% of females in these age groups living above the poverty line.
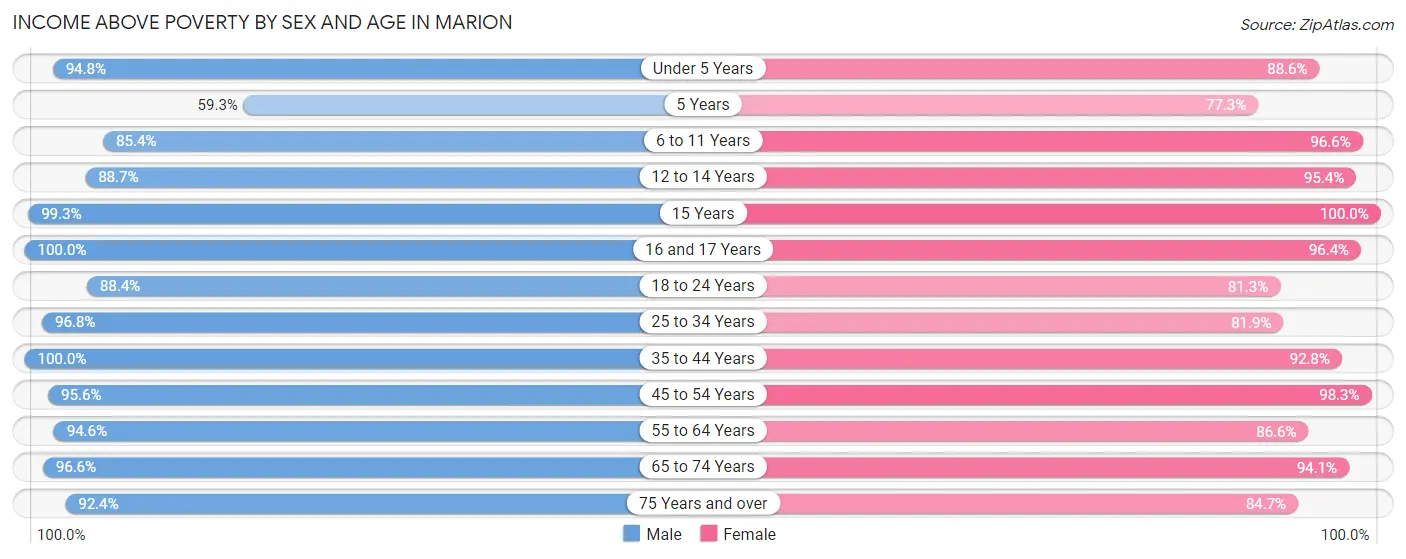
| Age Bracket | Male | Female |
| Under 5 Years | 471 (94.8%) | 218 (88.6%) |
| 5 Years | 54 (59.3%) | 34 (77.3%) |
| 6 to 11 Years | 767 (85.4%) | 546 (96.6%) |
| 12 to 14 Years | 331 (88.7%) | 335 (95.4%) |
| 15 Years | 145 (99.3%) | 189 (100.0%) |
| 16 and 17 Years | 160 (100.0%) | 291 (96.4%) |
| 18 to 24 Years | 497 (88.4%) | 379 (81.3%) |
| 25 to 34 Years | 895 (96.8%) | 689 (81.9%) |
| 35 to 44 Years | 862 (100.0%) | 876 (92.8%) |
| 45 to 54 Years | 1,005 (95.6%) | 1,028 (98.3%) |
| 55 to 64 Years | 470 (94.6%) | 801 (86.6%) |
| 65 to 74 Years | 454 (96.6%) | 385 (94.1%) |
| 75 Years and over | 208 (92.4%) | 276 (84.7%) |
| Total | 6,319 (93.5%) | 6,047 (90.9%) |
Income Below Poverty Among Married-Couple Families in Marion
The poverty statistics for married-couple families in Marion show that 1.5% or 36 of the total 2,470 families live below the poverty line. Families with 3 or 4 children have the highest poverty rate of 1.8%, comprising of 6 families. On the other hand, families with 5 or more children have the lowest poverty rate of 0.0%, which includes 0 families.
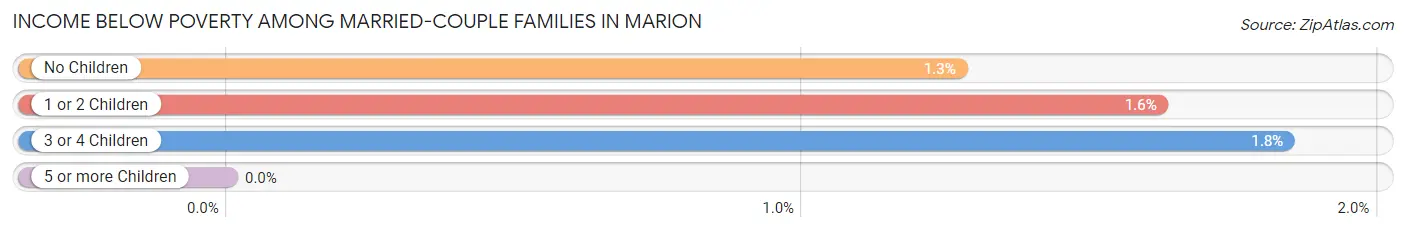
| Children | Above Poverty | Below Poverty |
| No Children | 1,165 (98.7%) | 15 (1.3%) |
| 1 or 2 Children | 911 (98.4%) | 15 (1.6%) |
| 3 or 4 Children | 320 (98.2%) | 6 (1.8%) |
| 5 or more Children | 38 (100.0%) | 0 (0.0%) |
| Total | 2,434 (98.5%) | 36 (1.5%) |
Income Below Poverty Among Single-Parent Households in Marion
According to the poverty data in Marion, 11.0% or 33 single-father households and 17.3% or 120 single-mother households are living below the poverty line. Among single-father households, those with 1 or 2 children have the highest poverty rate, with 33 households (21.8%) experiencing poverty. Likewise, among single-mother households, those with 3 or 4 children have the highest poverty rate, with 25 households (29.1%) falling below the poverty line.

| Children | Single Father | Single Mother |
| No Children | 0 (0.0%) | 15 (8.0%) |
| 1 or 2 Children | 33 (21.8%) | 80 (19.1%) |
| 3 or 4 Children | 0 (0.0%) | 25 (29.1%) |
| 5 or more Children | 0 (0.0%) | 0 (0.0%) |
| Total | 33 (11.0%) | 120 (17.3%) |
Income Below Poverty Among Married-Couple vs Single-Parent Households in Marion
The poverty data for Marion shows that 36 of the married-couple family households (1.5%) and 153 of the single-parent households (15.4%) are living below the poverty level. Within the married-couple family households, those with 3 or 4 children have the highest poverty rate, with 6 households (1.8%) falling below the poverty line. Among the single-parent households, those with 3 or 4 children have the highest poverty rate, with 25 household (22.3%) living below poverty.
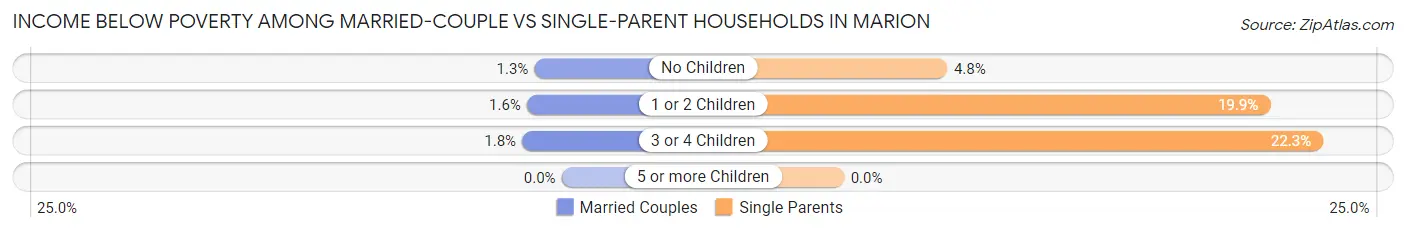
| Children | Married-Couple Families | Single-Parent Households |
| No Children | 15 (1.3%) | 15 (4.8%) |
| 1 or 2 Children | 15 (1.6%) | 113 (19.9%) |
| 3 or 4 Children | 6 (1.8%) | 25 (22.3%) |
| 5 or more Children | 0 (0.0%) | 0 (0.0%) |
| Total | 36 (1.5%) | 153 (15.4%) |
Race in Marion
The most populous races in Marion are White / Caucasian (7,147 | 52.4%), Black / African American (4,995 | 36.6%), and Two or more Races (1,266 | 9.3%).
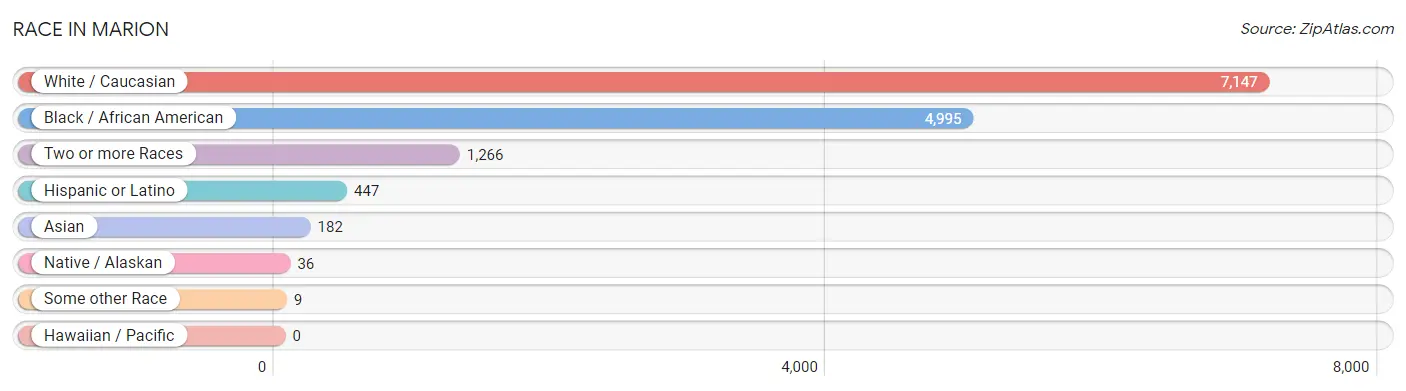
| Race | # Population | % Population |
| Asian | 182 | 1.3% |
| Black / African American | 4,995 | 36.6% |
| Hawaiian / Pacific | 0 | 0.0% |
| Hispanic or Latino | 447 | 3.3% |
| Native / Alaskan | 36 | 0.3% |
| White / Caucasian | 7,147 | 52.4% |
| Two or more Races | 1,266 | 9.3% |
| Some other Race | 9 | 0.1% |
| Total | 13,635 | 100.0% |
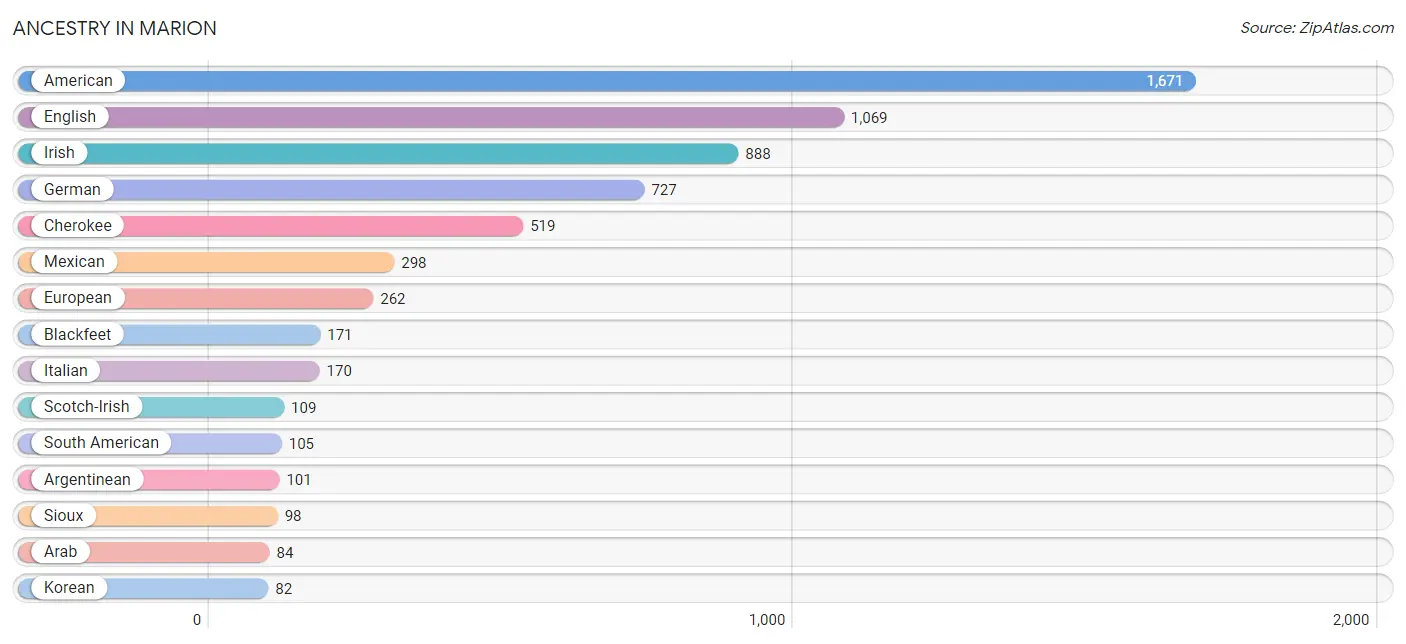
Ancestry in Marion
The most populous ancestries reported in Marion are American (1,671 | 12.3%), English (1,069 | 7.8%), Irish (888 | 6.5%), German (727 | 5.3%), and Cherokee (519 | 3.8%), together accounting for 35.8% of all Marion residents.
| Ancestry | # Population | % Population |
| African | 37 | 0.3% |
| American | 1,671 | 12.3% |
| Arab | 84 | 0.6% |
| Argentinean | 101 | 0.7% |
| Bhutanese | 6 | 0.0% |
| Blackfeet | 171 | 1.3% |
| Burmese | 57 | 0.4% |
| Canadian | 19 | 0.1% |
| Cherokee | 519 | 3.8% |
| Chickasaw | 33 | 0.2% |
| Chippewa | 35 | 0.3% |
| Choctaw | 10 | 0.1% |
| Czech | 5 | 0.0% |
| Czechoslovakian | 11 | 0.1% |
| Danish | 30 | 0.2% |
| Dutch | 23 | 0.2% |
| English | 1,069 | 7.8% |
| European | 262 | 1.9% |
| French | 51 | 0.4% |
| German | 727 | 5.3% |
| German Russian | 13 | 0.1% |
| Haitian | 14 | 0.1% |
| Indian (Asian) | 1 | 0.0% |
| Irish | 888 | 6.5% |
| Italian | 170 | 1.3% |
| Korean | 82 | 0.6% |
| Mexican | 298 | 2.2% |
| Navajo | 10 | 0.1% |
| Norwegian | 50 | 0.4% |
| Polish | 40 | 0.3% |
| Potawatomi | 7 | 0.1% |
| Puerto Rican | 28 | 0.2% |
| Russian | 57 | 0.4% |
| Scandinavian | 10 | 0.1% |
| Scotch-Irish | 109 | 0.8% |
| Scottish | 56 | 0.4% |
| Sioux | 98 | 0.7% |
| South American | 105 | 0.8% |
| Spanish | 16 | 0.1% |
| Subsaharan African | 37 | 0.3% |
| Swedish | 21 | 0.2% |
| Thai | 58 | 0.4% |
| Ukrainian | 44 | 0.3% |
| Venezuelan | 4 | 0.0% |
| Welsh | 36 | 0.3% | View All 45 Rows |
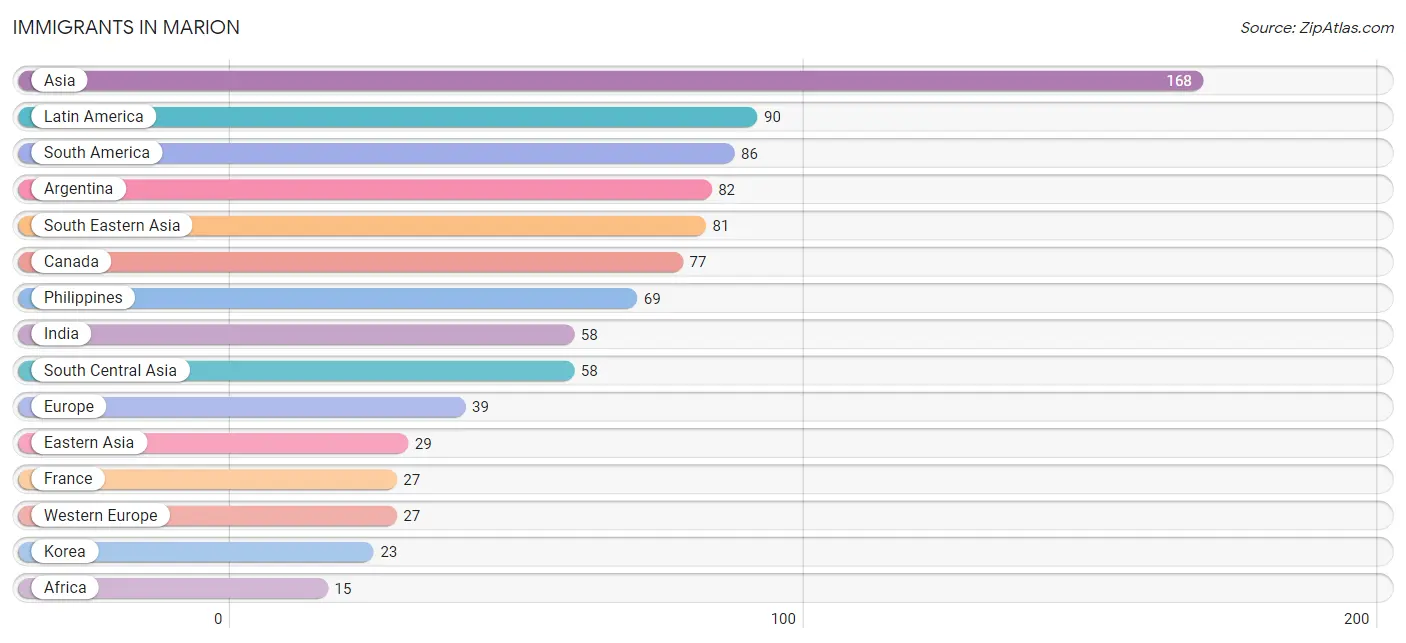
Immigrants in Marion
The most numerous immigrant groups reported in Marion came from Asia (168 | 1.2%), Latin America (90 | 0.7%), South America (86 | 0.6%), Argentina (82 | 0.6%), and South Eastern Asia (81 | 0.6%), together accounting for 3.7% of all Marion residents.
| Immigration Origin | # Population | % Population |
| Africa | 15 | 0.1% |
| Argentina | 82 | 0.6% |
| Asia | 168 | 1.2% |
| Canada | 77 | 0.6% |
| Central America | 4 | 0.0% |
| Eastern Asia | 29 | 0.2% |
| Eastern Europe | 12 | 0.1% |
| Europe | 39 | 0.3% |
| France | 27 | 0.2% |
| India | 58 | 0.4% |
| Japan | 6 | 0.0% |
| Korea | 23 | 0.2% |
| Latin America | 90 | 0.7% |
| Mexico | 4 | 0.0% |
| Northern Africa | 15 | 0.1% |
| Philippines | 69 | 0.5% |
| Russia | 12 | 0.1% |
| South America | 86 | 0.6% |
| South Central Asia | 58 | 0.4% |
| South Eastern Asia | 81 | 0.6% |
| Venezuela | 4 | 0.0% |
| Vietnam | 12 | 0.1% |
| Western Europe | 27 | 0.2% | View All 23 Rows |
Sex and Age in Marion
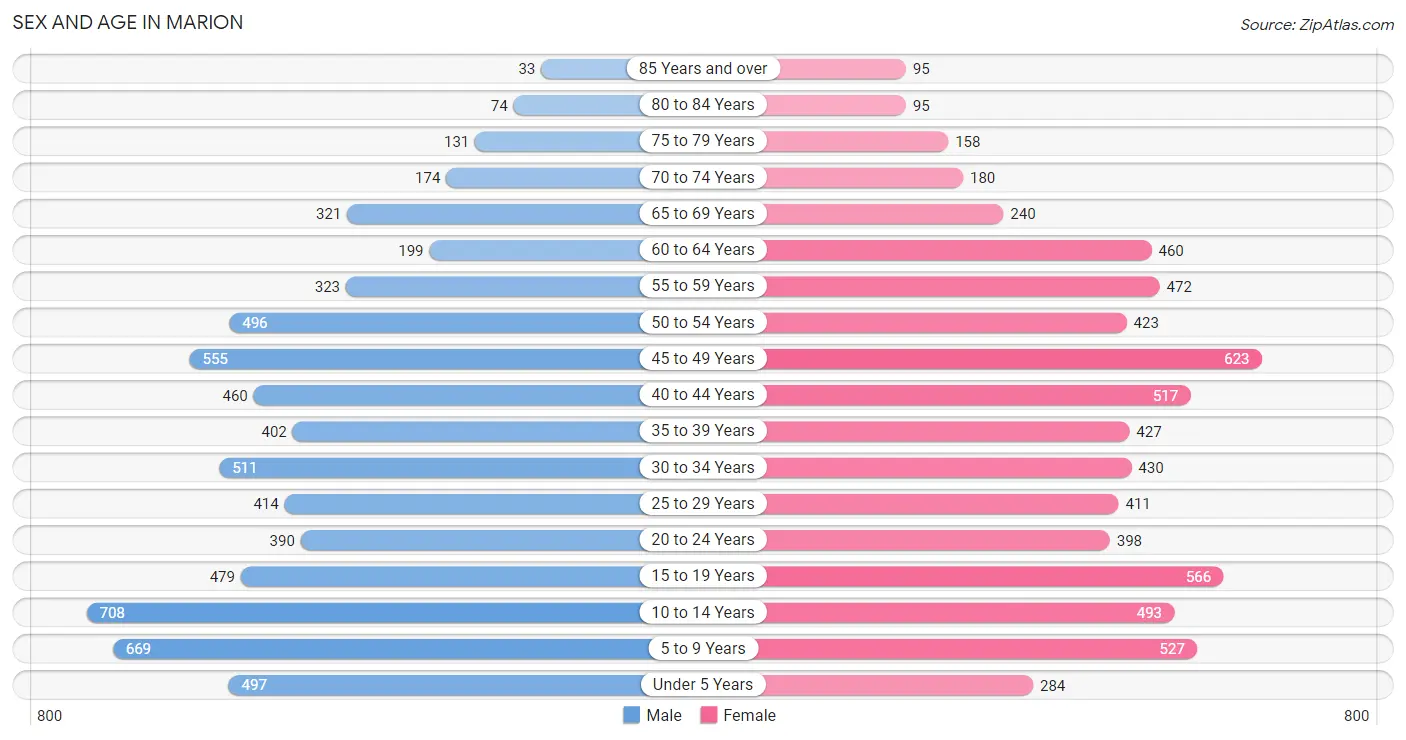
Sex and Age in Marion
The most populous age groups in Marion are 10 to 14 Years (708 | 10.4%) for men and 45 to 49 Years (623 | 9.2%) for women.
| Age Bracket | Male | Female |
| Under 5 Years | 497 (7.3%) | 284 (4.2%) |
| 5 to 9 Years | 669 (9.8%) | 527 (7.7%) |
| 10 to 14 Years | 708 (10.4%) | 493 (7.2%) |
| 15 to 19 Years | 479 (7.0%) | 566 (8.3%) |
| 20 to 24 Years | 390 (5.7%) | 398 (5.9%) |
| 25 to 29 Years | 414 (6.1%) | 411 (6.0%) |
| 30 to 34 Years | 511 (7.5%) | 430 (6.3%) |
| 35 to 39 Years | 402 (5.9%) | 427 (6.3%) |
| 40 to 44 Years | 460 (6.7%) | 517 (7.6%) |
| 45 to 49 Years | 555 (8.1%) | 623 (9.2%) |
| 50 to 54 Years | 496 (7.3%) | 423 (6.2%) |
| 55 to 59 Years | 323 (4.7%) | 472 (6.9%) |
| 60 to 64 Years | 199 (2.9%) | 460 (6.8%) |
| 65 to 69 Years | 321 (4.7%) | 240 (3.5%) |
| 70 to 74 Years | 174 (2.5%) | 180 (2.6%) |
| 75 to 79 Years | 131 (1.9%) | 158 (2.3%) |
| 80 to 84 Years | 74 (1.1%) | 95 (1.4%) |
| 85 Years and over | 33 (0.5%) | 95 (1.4%) |
| Total | 6,836 (100.0%) | 6,799 (100.0%) |
Families and Households in Marion
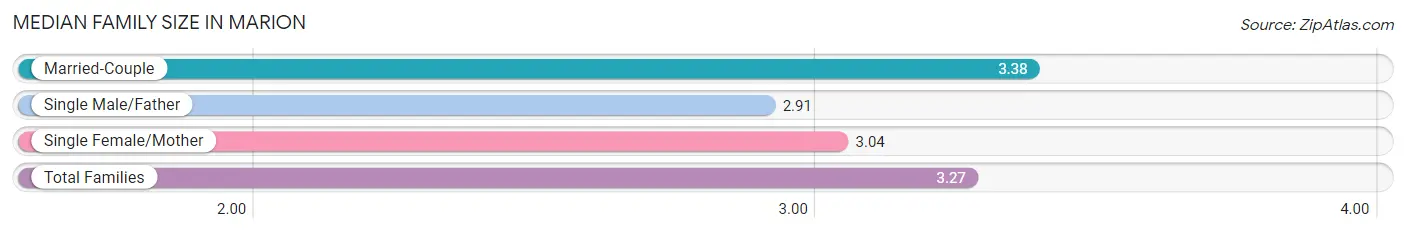
Median Family Size in Marion
The median family size in Marion is 3.27 persons per family, with married-couple families (2,470 | 71.3%) accounting for the largest median family size of 3.38 persons per family. On the other hand, single male/father families (301 | 8.7%) represent the smallest median family size with 2.91 persons per family.
| Family Type | # Families | Family Size |
| Married-Couple | 2,470 (71.3%) | 3.38 |
| Single Male/Father | 301 (8.7%) | 2.91 |
| Single Female/Mother | 692 (20.0%) | 3.04 |
| Total Families | 3,463 (100.0%) | 3.27 |
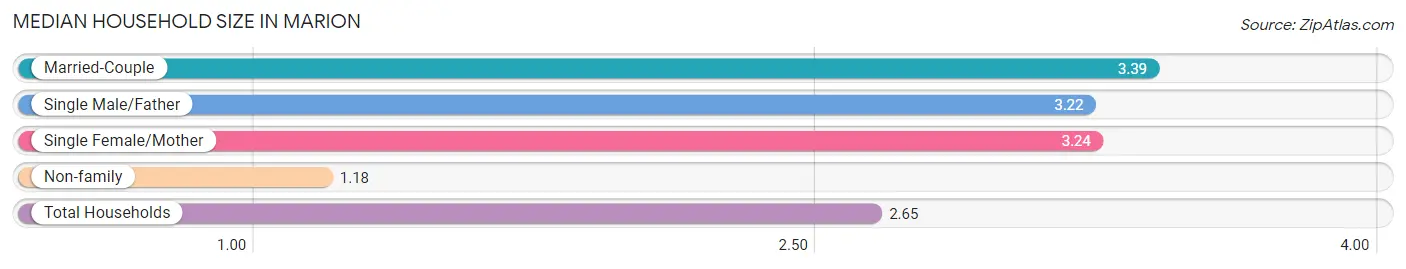
Median Household Size in Marion
The median household size in Marion is 2.65 persons per household, with married-couple households (2,470 | 48.4%) accounting for the largest median household size of 3.39 persons per household. non-family households (1,642 | 32.2%) represent the smallest median household size with 1.18 persons per household.
| Household Type | # Households | Household Size |
| Married-Couple | 2,470 (48.4%) | 3.39 |
| Single Male/Father | 301 (5.9%) | 3.22 |
| Single Female/Mother | 692 (13.6%) | 3.24 |
| Non-family | 1,642 (32.2%) | 1.18 |
| Total Households | 5,105 (100.0%) | 2.65 |
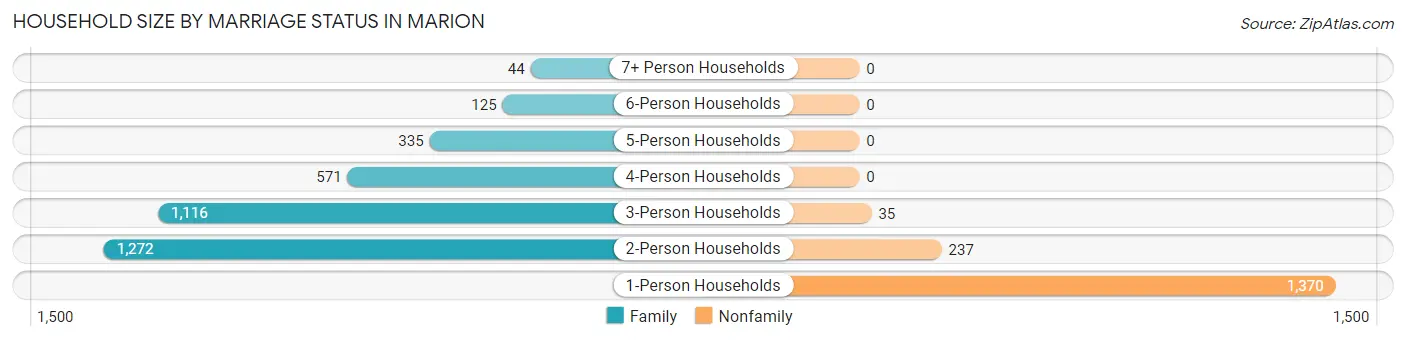
Household Size by Marriage Status in Marion
Out of a total of 5,105 households in Marion, 3,463 (67.8%) are family households, while 1,642 (32.2%) are nonfamily households. The most numerous type of family households are 2-person households, comprising 1,272, and the most common type of nonfamily households are 1-person households, comprising 1,370.
| Household Size | Family Households | Nonfamily Households |
| 1-Person Households | - | 1,370 (26.8%) |
| 2-Person Households | 1,272 (24.9%) | 237 (4.6%) |
| 3-Person Households | 1,116 (21.9%) | 35 (0.7%) |
| 4-Person Households | 571 (11.2%) | 0 (0.0%) |
| 5-Person Households | 335 (6.6%) | 0 (0.0%) |
| 6-Person Households | 125 (2.5%) | 0 (0.0%) |
| 7+ Person Households | 44 (0.9%) | 0 (0.0%) |
| Total | 3,463 (67.8%) | 1,642 (32.2%) |
Female Fertility in Marion
Fertility by Age in Marion
Average fertility rate in Marion is 42.0 births per 1,000 women. Women in the age bracket of 20 to 34 years have the highest fertility rate with 77.0 births per 1,000 women. Women in the age bracket of 20 to 34 years acount for 66.4% of all women with births.
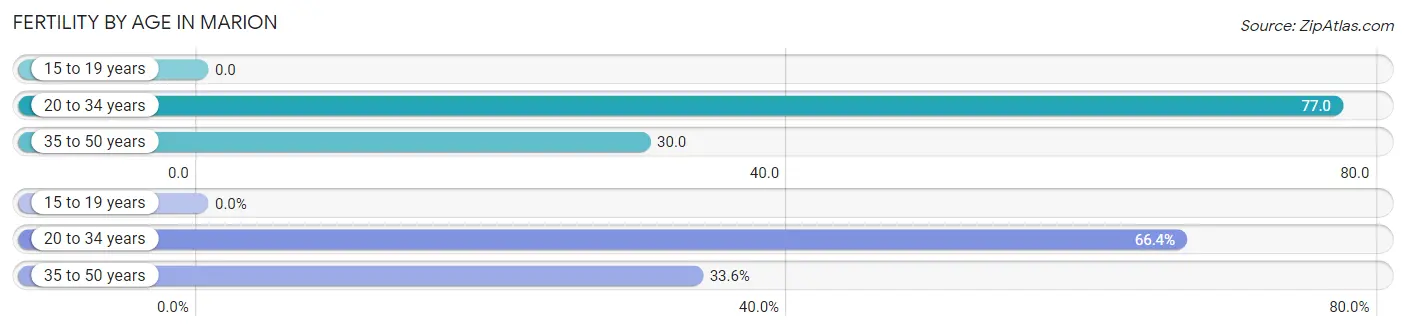
| Age Bracket | Women with Births | Births / 1,000 Women |
| 15 to 19 years | 0 (0.0%) | 0.0 |
| 20 to 34 years | 95 (66.4%) | 77.0 |
| 35 to 50 years | 48 (33.6%) | 30.0 |
| Total | 143 (100.0%) | 42.0 |
Fertility by Age by Marriage Status in Marion
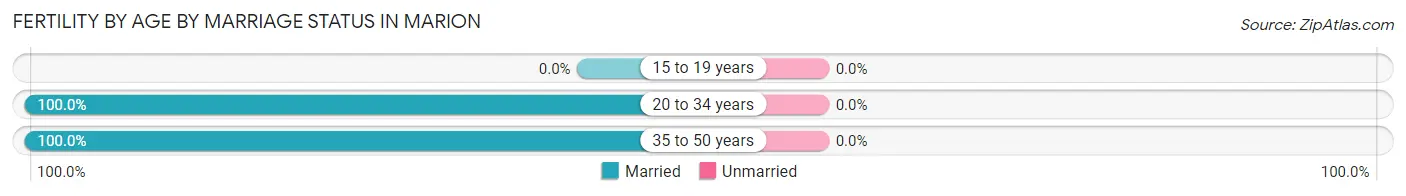
| Age Bracket | Married | Unmarried |
| 15 to 19 years | 0 (0.0%) | 0 (0.0%) |
| 20 to 34 years | 95 (100.0%) | 0 (0.0%) |
| 35 to 50 years | 48 (100.0%) | 0 (0.0%) |
| Total | 143 (100.0%) | 0 (0.0%) |
Fertility by Education in Marion
Average fertility rate in Marion is 42.0 births per 1,000 women. Women with the education attainment of high school diploma have the highest fertility rate of 97.0 births per 1,000 women, while women with the education attainment of less than high school have the lowest fertility at 7.0 births per 1,000 women. Women with the education attainment of high school diploma represent 49.6% of all women with births.
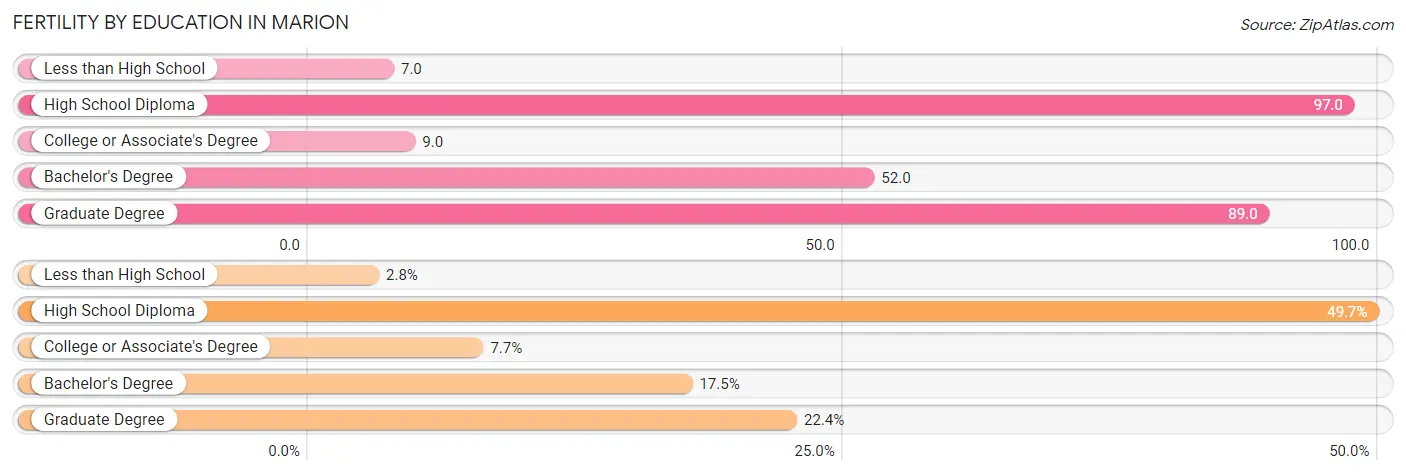
| Educational Attainment | Women with Births | Births / 1,000 Women |
| Less than High School | 4 (2.8%) | 7.0 |
| High School Diploma | 71 (49.6%) | 97.0 |
| College or Associate's Degree | 11 (7.7%) | 9.0 |
| Bachelor's Degree | 25 (17.5%) | 52.0 |
| Graduate Degree | 32 (22.4%) | 89.0 |
| Total | 143 (100.0%) | 42.0 |
Fertility by Education by Marriage Status in Marion
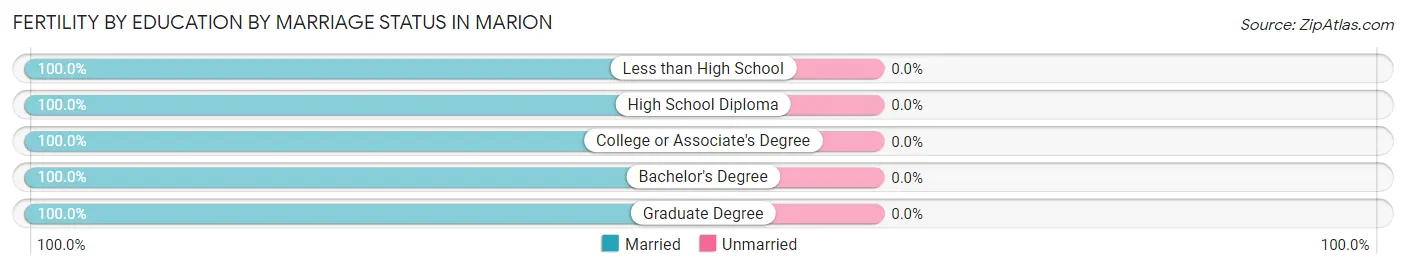
| Educational Attainment | Married | Unmarried |
| Less than High School | 4 (100.0%) | 0 (0.0%) |
| High School Diploma | 71 (100.0%) | 0 (0.0%) |
| College or Associate's Degree | 11 (100.0%) | 0 (0.0%) |
| Bachelor's Degree | 25 (100.0%) | 0 (0.0%) |
| Graduate Degree | 32 (100.0%) | 0 (0.0%) |
| Total | 143 (100.0%) | 0 (0.0%) |
Employment Characteristics in Marion
Employment by Class of Employer in Marion
Among the 6,609 employed individuals in Marion, private company employees (4,545 | 68.8%), not-for-profit organizations (552 | 8.4%), and local government employees (538 | 8.1%) make up the most common classes of employment.
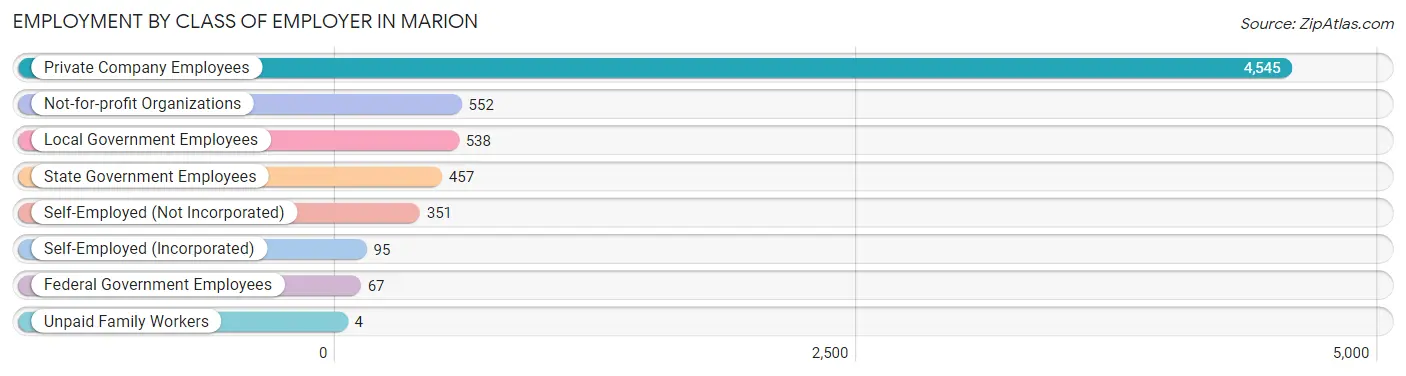
| Employer Class | # Employees | % Employees |
| Private Company Employees | 4,545 | 68.8% |
| Self-Employed (Incorporated) | 95 | 1.4% |
| Self-Employed (Not Incorporated) | 351 | 5.3% |
| Not-for-profit Organizations | 552 | 8.4% |
| Local Government Employees | 538 | 8.1% |
| State Government Employees | 457 | 6.9% |
| Federal Government Employees | 67 | 1.0% |
| Unpaid Family Workers | 4 | 0.1% |
| Total | 6,609 | 100.0% |
Employment Status by Age in Marion
According to the labor force statistics for Marion, out of the total population over 16 years of age (10,121), 70.1% or 7,095 individuals are in the labor force, with 5.6% or 397 of them unemployed. The age group with the highest labor force participation rate is 45 to 54 years, with 91.0% or 1,908 individuals in the labor force. Within the labor force, the 16 to 19 years age range has the highest percentage of unemployed individuals, with 26.8% or 60 of them being unemployed.
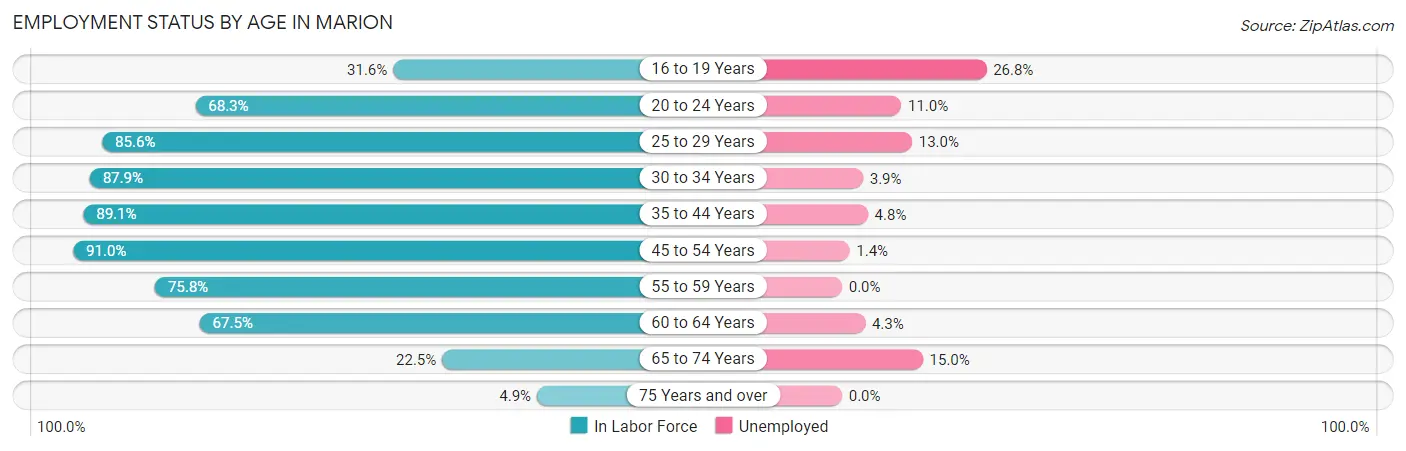
| Age Bracket | In Labor Force | Unemployed |
| 16 to 19 Years | 224 (31.6%) | 60 (26.8%) |
| 20 to 24 Years | 538 (68.3%) | 59 (11.0%) |
| 25 to 29 Years | 706 (85.6%) | 92 (13.0%) |
| 30 to 34 Years | 827 (87.9%) | 32 (3.9%) |
| 35 to 44 Years | 1,609 (89.1%) | 77 (4.8%) |
| 45 to 54 Years | 1,908 (91.0%) | 27 (1.4%) |
| 55 to 59 Years | 603 (75.8%) | 0 (0.0%) |
| 60 to 64 Years | 445 (67.5%) | 19 (4.3%) |
| 65 to 74 Years | 206 (22.5%) | 31 (15.0%) |
| 75 Years and over | 29 (4.9%) | 0 (0.0%) |
| Total | 7,095 (70.1%) | 397 (5.6%) |
Employment Status by Educational Attainment in Marion
According to labor force statistics for Marion, 85.6% of individuals (6,097) out of the total population between 25 and 64 years of age (7,123) are in the labor force, with 4.0% or 244 of them being unemployed. The group with the highest labor force participation rate are those with the educational attainment of bachelor's degree or higher, with 90.5% or 1,673 individuals in the labor force. Within the labor force, individuals with high school diploma education have the highest percentage of unemployment, with 13.6% or 208 of them being unemployed.
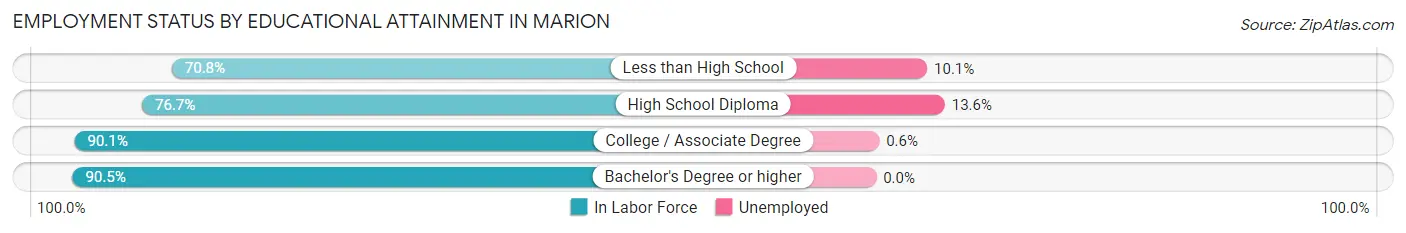
| Educational Attainment | In Labor Force | Unemployed |
| Less than High School | 218 (70.8%) | 31 (10.1%) |
| High School Diploma | 1,529 (76.7%) | 271 (13.6%) |
| College / Associate Degree | 2,678 (90.1%) | 18 (0.6%) |
| Bachelor's Degree or higher | 1,673 (90.5%) | 0 (0.0%) |
| Total | 6,097 (85.6%) | 285 (4.0%) |
Employment Occupations by Sex in Marion
Management, Business, Science and Arts Occupations
The most common Management, Business, Science and Arts occupations in Marion are Management (864 | 12.9%), Community & Social Service (811 | 12.1%), Education Instruction & Library (537 | 8.0%), Health Diagnosing & Treating (496 | 7.4%), and Business & Financial (371 | 5.5%).
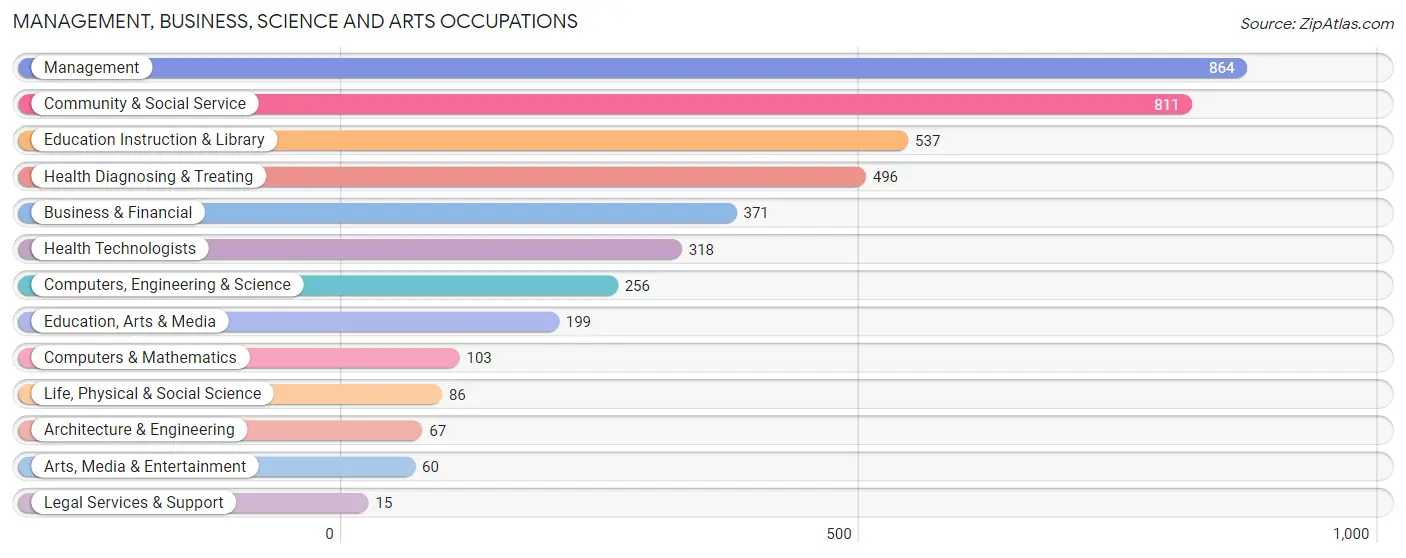
Management, Business, Science and Arts Occupations by Sex
Within the Management, Business, Science and Arts occupations in Marion, the most male-oriented occupations are Architecture & Engineering (92.5%), Arts, Media & Entertainment (81.7%), and Computers & Mathematics (80.6%), while the most female-oriented occupations are Education, Arts & Media (95.5%), Legal Services & Support (93.3%), and Health Diagnosing & Treating (84.7%).
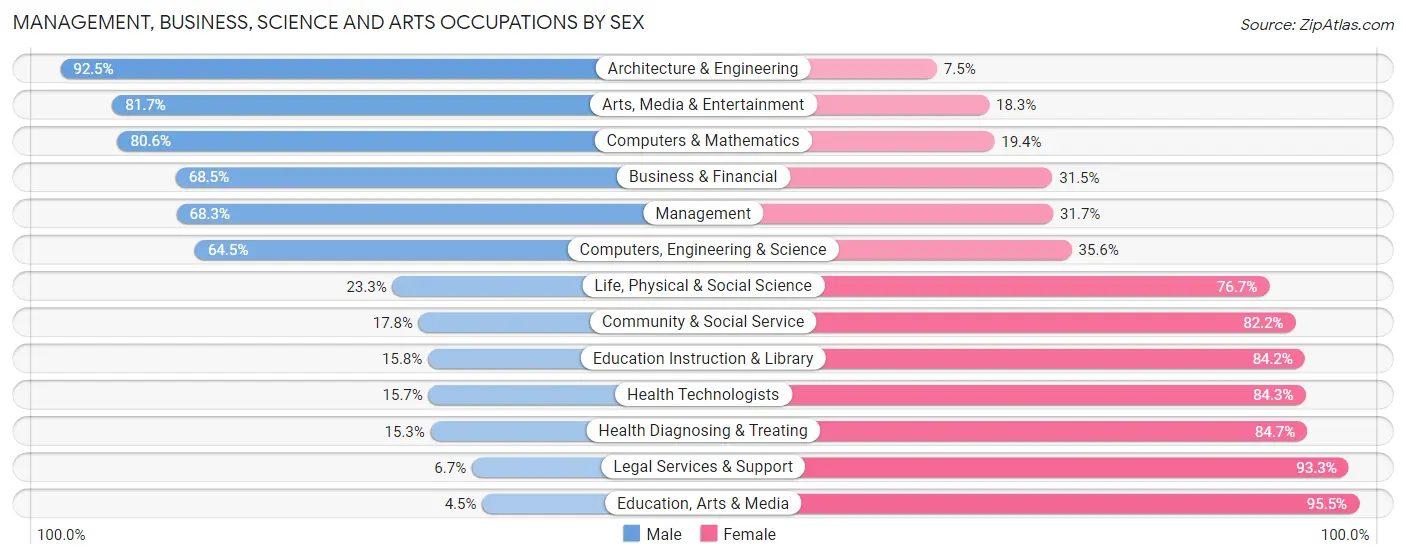
| Occupation | Male | Female |
| Management | 590 (68.3%) | 274 (31.7%) |
| Business & Financial | 254 (68.5%) | 117 (31.5%) |
| Computers, Engineering & Science | 165 (64.4%) | 91 (35.5%) |
| Computers & Mathematics | 83 (80.6%) | 20 (19.4%) |
| Architecture & Engineering | 62 (92.5%) | 5 (7.5%) |
| Life, Physical & Social Science | 20 (23.3%) | 66 (76.7%) |
| Community & Social Service | 144 (17.8%) | 667 (82.2%) |
| Education, Arts & Media | 9 (4.5%) | 190 (95.5%) |
| Legal Services & Support | 1 (6.7%) | 14 (93.3%) |
| Education Instruction & Library | 85 (15.8%) | 452 (84.2%) |
| Arts, Media & Entertainment | 49 (81.7%) | 11 (18.3%) |
| Health Diagnosing & Treating | 76 (15.3%) | 420 (84.7%) |
| Health Technologists | 50 (15.7%) | 268 (84.3%) |
| Total (Category) | 1,229 (43.9%) | 1,569 (56.1%) |
| Total (Overall) | 3,390 (50.6%) | 3,310 (49.4%) |
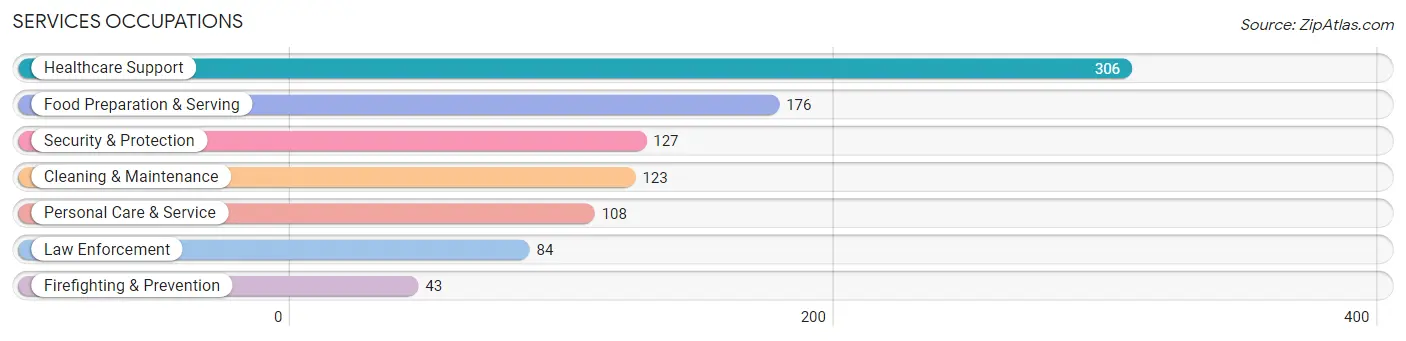
Services Occupations
The most common Services occupations in Marion are Healthcare Support (306 | 4.6%), Food Preparation & Serving (176 | 2.6%), Security & Protection (127 | 1.9%), Cleaning & Maintenance (123 | 1.8%), and Personal Care & Service (108 | 1.6%).
Services Occupations by Sex
Within the Services occupations in Marion, the most male-oriented occupations are Cleaning & Maintenance (100.0%), Food Preparation & Serving (68.2%), and Law Enforcement (58.3%), while the most female-oriented occupations are Healthcare Support (98.7%), Personal Care & Service (63.0%), and Firefighting & Prevention (46.5%).
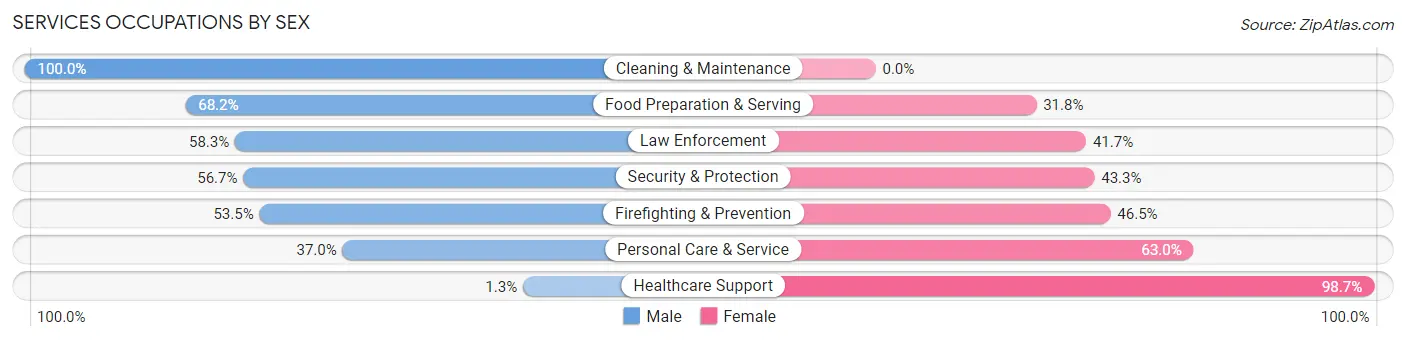
| Occupation | Male | Female |
| Healthcare Support | 4 (1.3%) | 302 (98.7%) |
| Security & Protection | 72 (56.7%) | 55 (43.3%) |
| Firefighting & Prevention | 23 (53.5%) | 20 (46.5%) |
| Law Enforcement | 49 (58.3%) | 35 (41.7%) |
| Food Preparation & Serving | 120 (68.2%) | 56 (31.8%) |
| Cleaning & Maintenance | 123 (100.0%) | 0 (0.0%) |
| Personal Care & Service | 40 (37.0%) | 68 (63.0%) |
| Total (Category) | 359 (42.7%) | 481 (57.3%) |
| Total (Overall) | 3,390 (50.6%) | 3,310 (49.4%) |
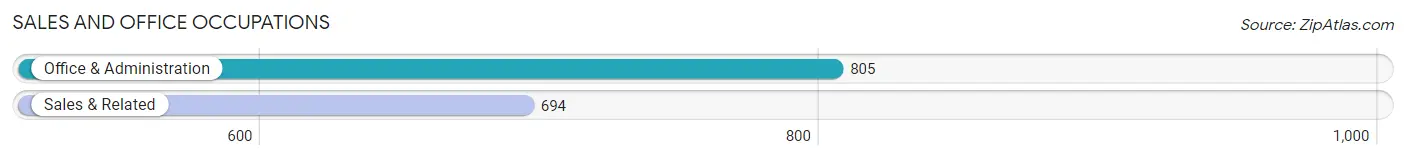
Sales and Office Occupations
The most common Sales and Office occupations in Marion are Office & Administration (805 | 12.0%), and Sales & Related (694 | 10.4%).
Sales and Office Occupations by Sex
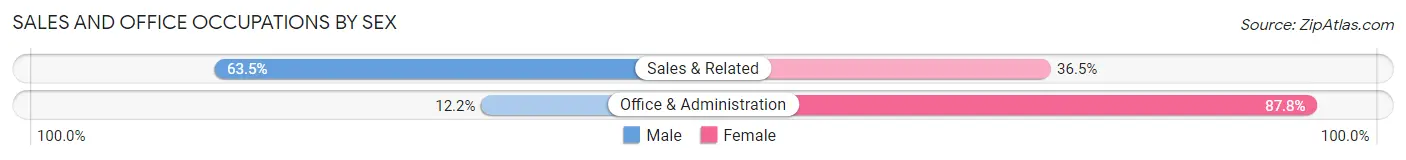
| Occupation | Male | Female |
| Sales & Related | 441 (63.5%) | 253 (36.5%) |
| Office & Administration | 98 (12.2%) | 707 (87.8%) |
| Total (Category) | 539 (36.0%) | 960 (64.0%) |
| Total (Overall) | 3,390 (50.6%) | 3,310 (49.4%) |
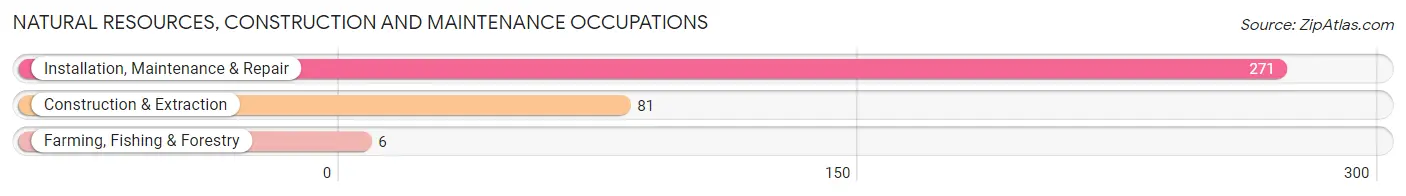
Natural Resources, Construction and Maintenance Occupations
The most common Natural Resources, Construction and Maintenance occupations in Marion are Installation, Maintenance & Repair (271 | 4.0%), Construction & Extraction (81 | 1.2%), and Farming, Fishing & Forestry (6 | 0.1%).
Natural Resources, Construction and Maintenance Occupations by Sex
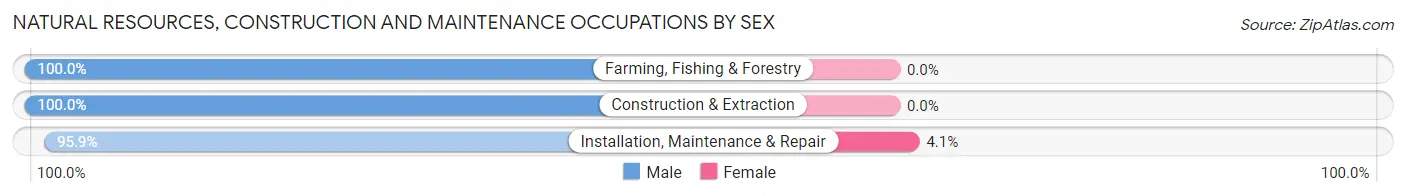
| Occupation | Male | Female |
| Farming, Fishing & Forestry | 6 (100.0%) | 0 (0.0%) |
| Construction & Extraction | 81 (100.0%) | 0 (0.0%) |
| Installation, Maintenance & Repair | 260 (95.9%) | 11 (4.1%) |
| Total (Category) | 347 (96.9%) | 11 (3.1%) |
| Total (Overall) | 3,390 (50.6%) | 3,310 (49.4%) |
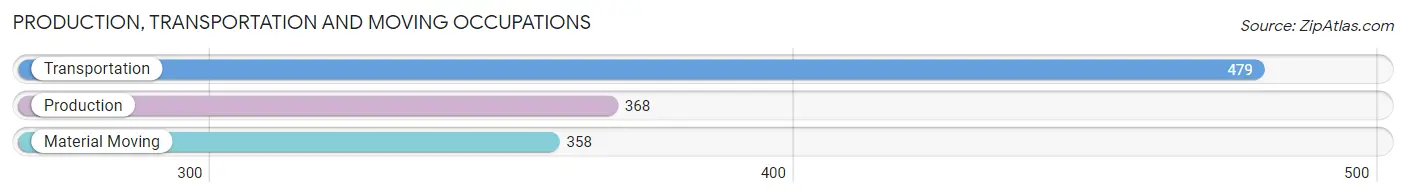
Production, Transportation and Moving Occupations
The most common Production, Transportation and Moving occupations in Marion are Transportation (479 | 7.1%), Production (368 | 5.5%), and Material Moving (358 | 5.3%).
Production, Transportation and Moving Occupations by Sex
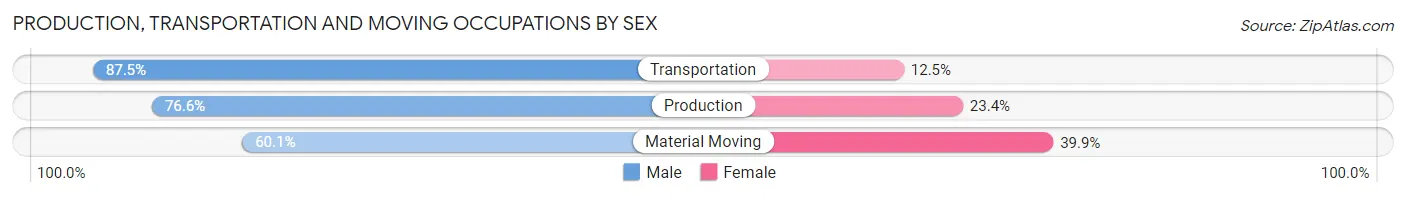
| Occupation | Male | Female |
| Production | 282 (76.6%) | 86 (23.4%) |
| Transportation | 419 (87.5%) | 60 (12.5%) |
| Material Moving | 215 (60.1%) | 143 (39.9%) |
| Total (Category) | 916 (76.0%) | 289 (24.0%) |
| Total (Overall) | 3,390 (50.6%) | 3,310 (49.4%) |
Employment Industries by Sex in Marion
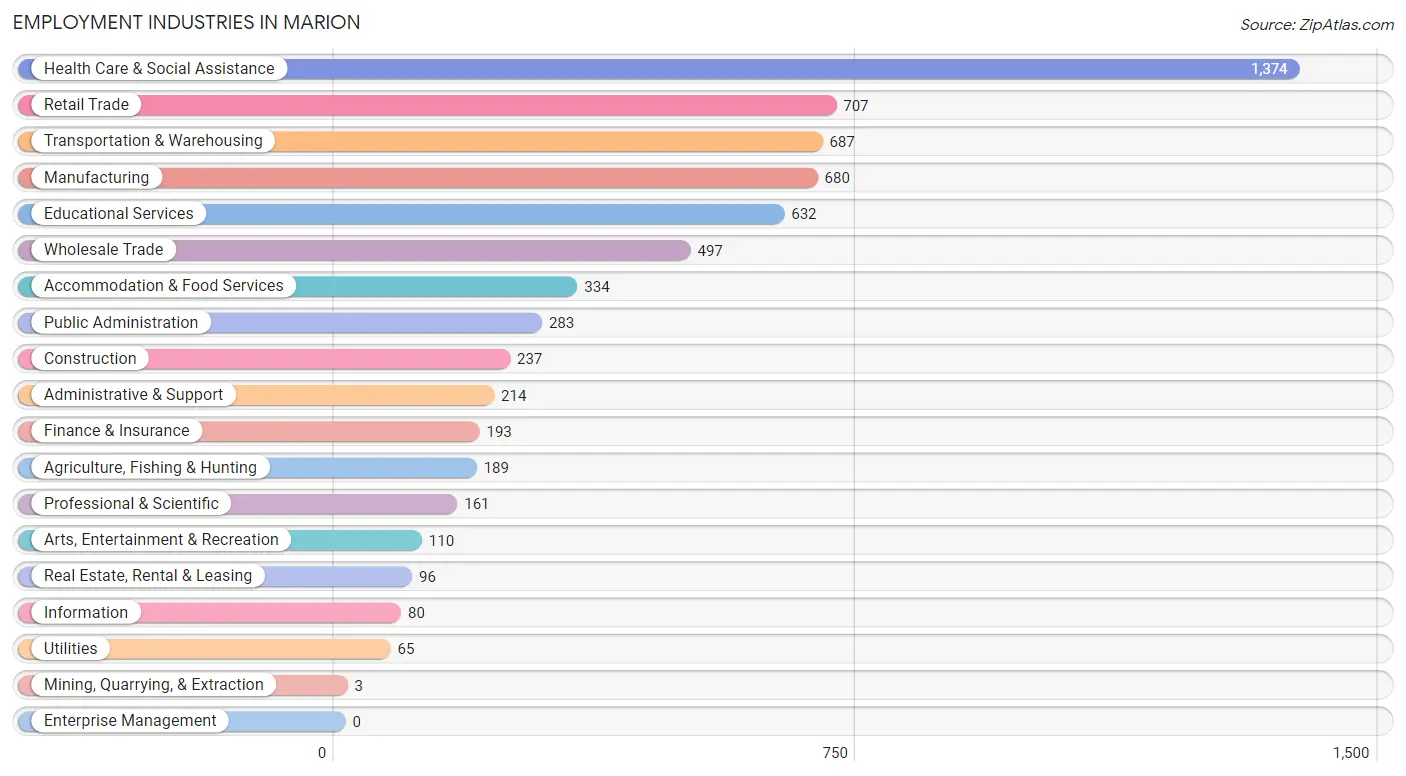
Employment Industries in Marion
The major employment industries in Marion include Health Care & Social Assistance (1,374 | 20.5%), Retail Trade (707 | 10.5%), Transportation & Warehousing (687 | 10.2%), Manufacturing (680 | 10.2%), and Educational Services (632 | 9.4%).
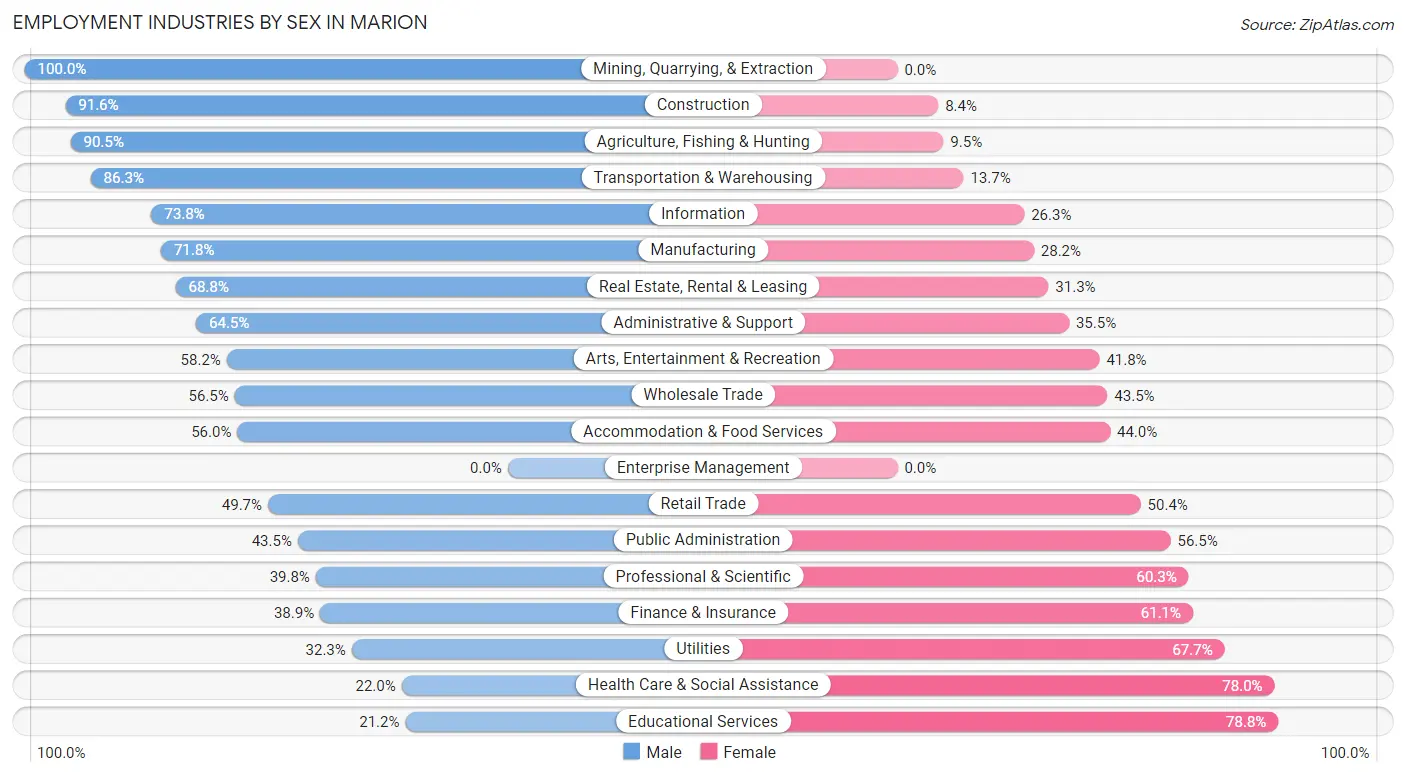
Employment Industries by Sex in Marion
The Marion industries that see more men than women are Mining, Quarrying, & Extraction (100.0%), Construction (91.6%), and Agriculture, Fishing & Hunting (90.5%), whereas the industries that tend to have a higher number of women are Educational Services (78.8%), Health Care & Social Assistance (78.0%), and Utilities (67.7%).
| Industry | Male | Female |
| Agriculture, Fishing & Hunting | 171 (90.5%) | 18 (9.5%) |
| Mining, Quarrying, & Extraction | 3 (100.0%) | 0 (0.0%) |
| Construction | 217 (91.6%) | 20 (8.4%) |
| Manufacturing | 488 (71.8%) | 192 (28.2%) |
| Wholesale Trade | 281 (56.5%) | 216 (43.5%) |
| Retail Trade | 351 (49.6%) | 356 (50.3%) |
| Transportation & Warehousing | 593 (86.3%) | 94 (13.7%) |
| Utilities | 21 (32.3%) | 44 (67.7%) |
| Information | 59 (73.8%) | 21 (26.3%) |
| Finance & Insurance | 75 (38.9%) | 118 (61.1%) |
| Real Estate, Rental & Leasing | 66 (68.8%) | 30 (31.2%) |
| Professional & Scientific | 64 (39.8%) | 97 (60.3%) |
| Enterprise Management | 0 (0.0%) | 0 (0.0%) |
| Administrative & Support | 138 (64.5%) | 76 (35.5%) |
| Educational Services | 134 (21.2%) | 498 (78.8%) |
| Health Care & Social Assistance | 302 (22.0%) | 1,072 (78.0%) |
| Arts, Entertainment & Recreation | 64 (58.2%) | 46 (41.8%) |
| Accommodation & Food Services | 187 (56.0%) | 147 (44.0%) |
| Public Administration | 123 (43.5%) | 160 (56.5%) |
| Total | 3,390 (50.6%) | 3,310 (49.4%) |
Education in Marion
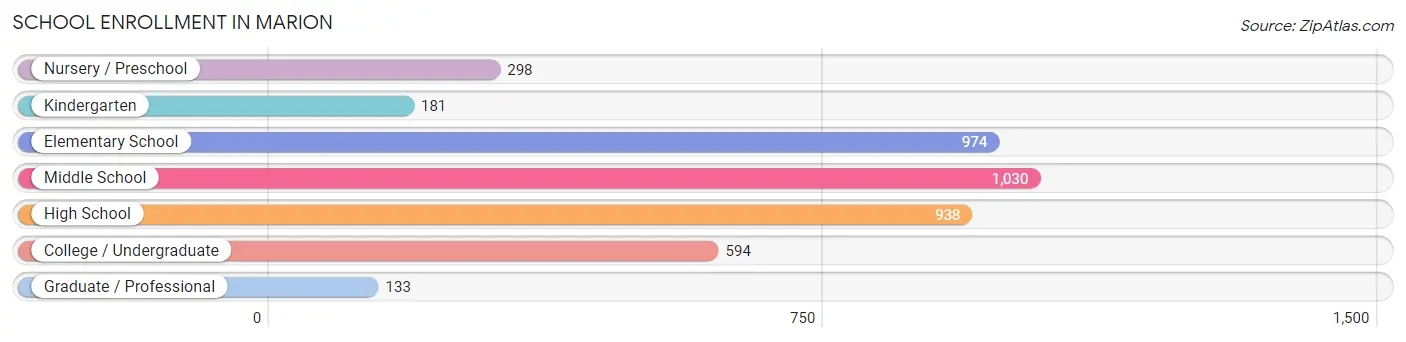
School Enrollment in Marion
The most common levels of schooling among the 4,148 students in Marion are middle school (1,030 | 24.8%), elementary school (974 | 23.5%), and high school (938 | 22.6%).
| School Level | # Students | % Students |
| Nursery / Preschool | 298 | 7.2% |
| Kindergarten | 181 | 4.4% |
| Elementary School | 974 | 23.5% |
| Middle School | 1,030 | 24.8% |
| High School | 938 | 22.6% |
| College / Undergraduate | 594 | 14.3% |
| Graduate / Professional | 133 | 3.2% |
| Total | 4,148 | 100.0% |
School Enrollment by Age by Funding Source in Marion
Out of a total of 4,148 students who are enrolled in schools in Marion, 556 (13.4%) attend a private institution, while the remaining 3,592 (86.6%) are enrolled in public schools. The age group of 3 to 4 year olds has the highest likelihood of being enrolled in private schools, with 58 (31.9% in the age bracket) enrolled. Conversely, the age group of 20 to 24 year olds has the lowest likelihood of being enrolled in a private school, with 272 (91.3% in the age bracket) attending a public institution.
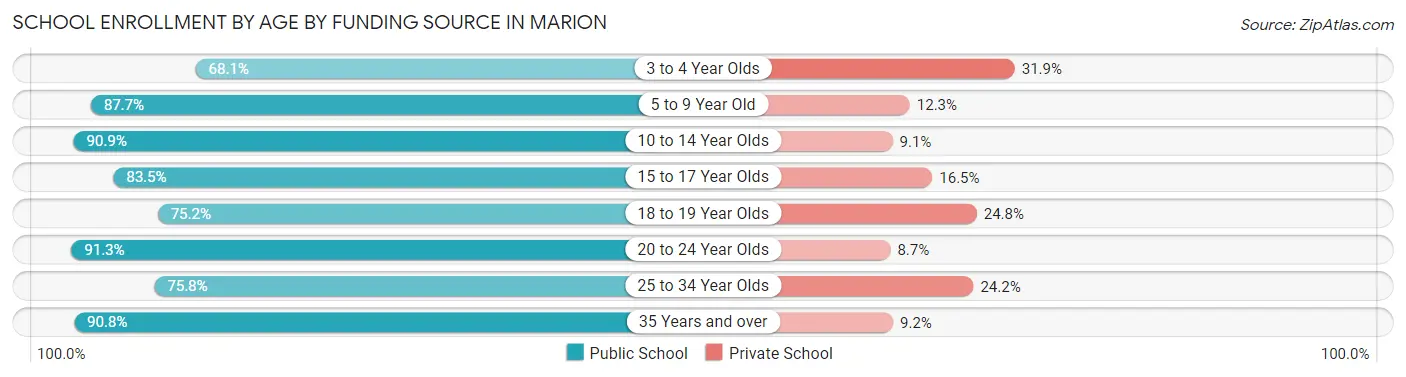
| Age Bracket | Public School | Private School |
| 3 to 4 Year Olds | 124 (68.1%) | 58 (31.9%) |
| 5 to 9 Year Old | 1,024 (87.7%) | 144 (12.3%) |
| 10 to 14 Year Olds | 1,087 (90.9%) | 109 (9.1%) |
| 15 to 17 Year Olds | 657 (83.5%) | 130 (16.5%) |
| 18 to 19 Year Olds | 94 (75.2%) | 31 (24.8%) |
| 20 to 24 Year Olds | 272 (91.3%) | 26 (8.7%) |
| 25 to 34 Year Olds | 116 (75.8%) | 37 (24.2%) |
| 35 Years and over | 217 (90.8%) | 22 (9.2%) |
| Total | 3,592 (86.6%) | 556 (13.4%) |
Educational Attainment by Field of Study in Marion
Business (489 | 22.5%), education (472 | 21.7%), science & technology (285 | 13.1%), engineering (175 | 8.1%), and arts & humanities (160 | 7.4%) are the most common fields of study among 2,173 individuals in Marion who have obtained a bachelor's degree or higher.
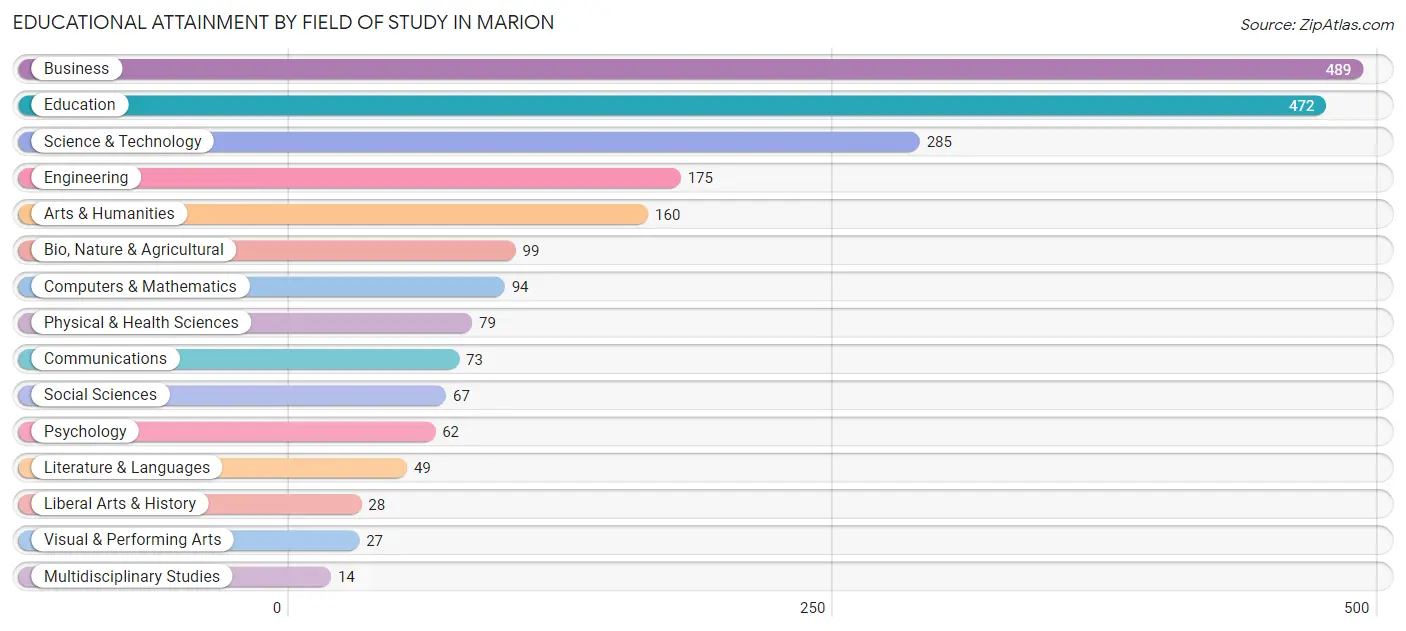
| Field of Study | # Graduates | % Graduates |
| Computers & Mathematics | 94 | 4.3% |
| Bio, Nature & Agricultural | 99 | 4.6% |
| Physical & Health Sciences | 79 | 3.6% |
| Psychology | 62 | 2.9% |
| Social Sciences | 67 | 3.1% |
| Engineering | 175 | 8.1% |
| Multidisciplinary Studies | 14 | 0.6% |
| Science & Technology | 285 | 13.1% |
| Business | 489 | 22.5% |
| Education | 472 | 21.7% |
| Literature & Languages | 49 | 2.2% |
| Liberal Arts & History | 28 | 1.3% |
| Visual & Performing Arts | 27 | 1.2% |
| Communications | 73 | 3.4% |
| Arts & Humanities | 160 | 7.4% |
| Total | 2,173 | 100.0% |
Transportation & Commute in Marion
Vehicle Availability by Sex in Marion
The most prevalent vehicle ownership categories in Marion are males with 2 vehicles (1,375, accounting for 41.4%) and females with 2 vehicles (1,471, making up 41.9%).
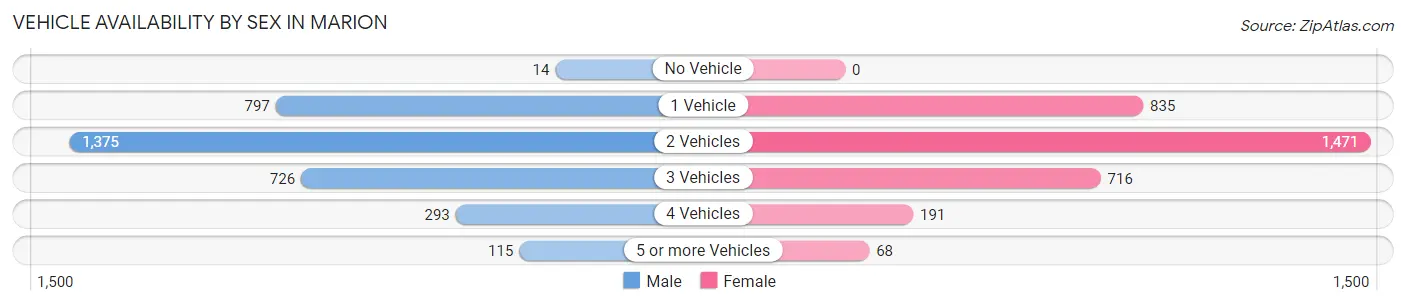
| Vehicles Available | Male | Female |
| No Vehicle | 14 (0.4%) | 0 (0.0%) |
| 1 Vehicle | 797 (24.0%) | 835 (25.5%) |
| 2 Vehicles | 1,375 (41.4%) | 1,471 (44.8%) |
| 3 Vehicles | 726 (21.9%) | 716 (21.8%) |
| 4 Vehicles | 293 (8.8%) | 191 (5.8%) |
| 5 or more Vehicles | 115 (3.5%) | 68 (2.1%) |
| Total | 3,320 (100.0%) | 3,281 (100.0%) |
Commute Time in Marion
The most frequently occuring commute durations in Marion are 10 to 14 minutes (1,043 commuters, 16.7%), 5 to 9 minutes (969 commuters, 15.6%), and 15 to 19 minutes (935 commuters, 15.0%).
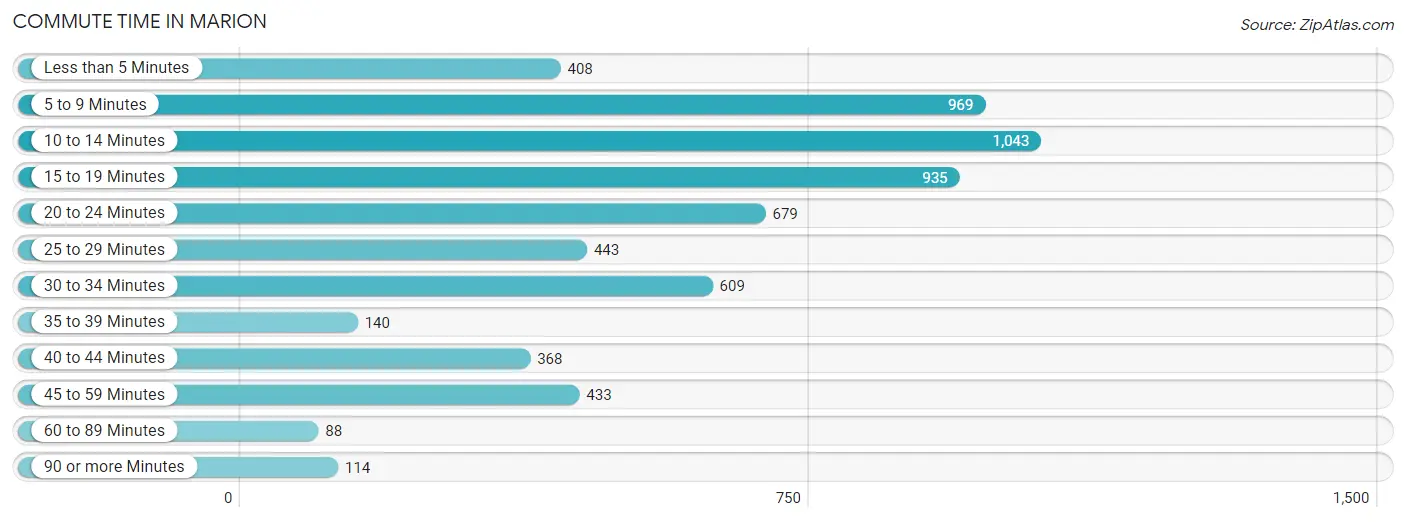
| Commute Time | # Commuters | % Commuters |
| Less than 5 Minutes | 408 | 6.6% |
| 5 to 9 Minutes | 969 | 15.6% |
| 10 to 14 Minutes | 1,043 | 16.7% |
| 15 to 19 Minutes | 935 | 15.0% |
| 20 to 24 Minutes | 679 | 10.9% |
| 25 to 29 Minutes | 443 | 7.1% |
| 30 to 34 Minutes | 609 | 9.8% |
| 35 to 39 Minutes | 140 | 2.2% |
| 40 to 44 Minutes | 368 | 5.9% |
| 45 to 59 Minutes | 433 | 7.0% |
| 60 to 89 Minutes | 88 | 1.4% |
| 90 or more Minutes | 114 | 1.8% |
Commute Time by Sex in Marion
The most common commute times in Marion are 10 to 14 minutes (577 commuters, 18.5%) for males and 5 to 9 minutes (530 commuters, 17.0%) for females.
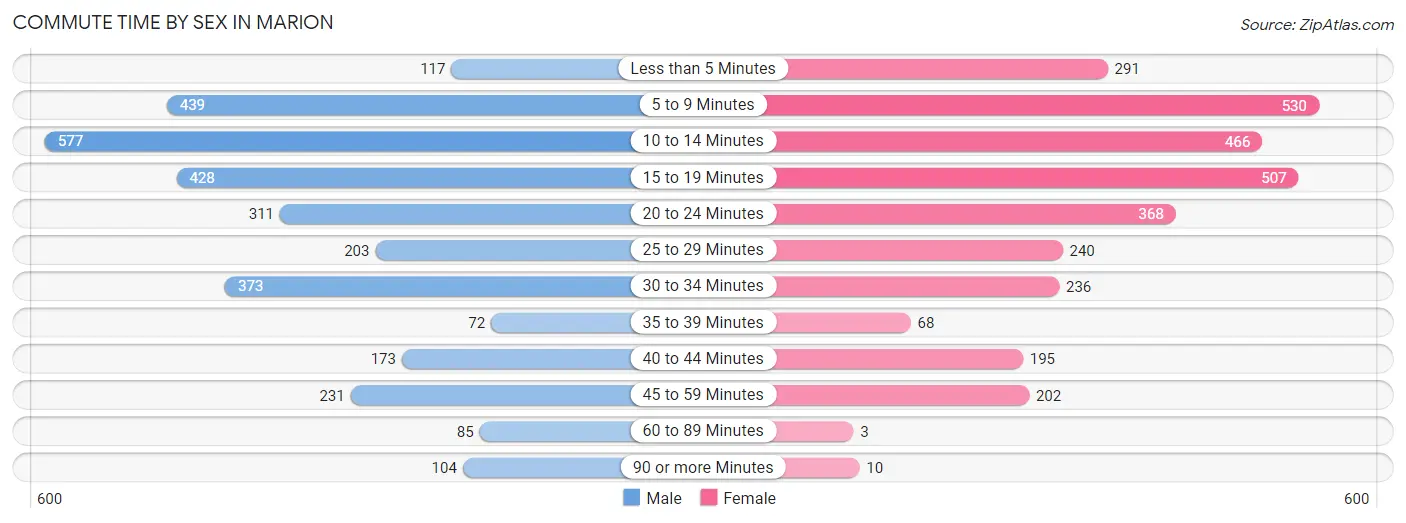
| Commute Time | Male | Female |
| Less than 5 Minutes | 117 (3.8%) | 291 (9.3%) |
| 5 to 9 Minutes | 439 (14.1%) | 530 (17.0%) |
| 10 to 14 Minutes | 577 (18.5%) | 466 (15.0%) |
| 15 to 19 Minutes | 428 (13.8%) | 507 (16.3%) |
| 20 to 24 Minutes | 311 (10.0%) | 368 (11.8%) |
| 25 to 29 Minutes | 203 (6.5%) | 240 (7.7%) |
| 30 to 34 Minutes | 373 (12.0%) | 236 (7.6%) |
| 35 to 39 Minutes | 72 (2.3%) | 68 (2.2%) |
| 40 to 44 Minutes | 173 (5.6%) | 195 (6.3%) |
| 45 to 59 Minutes | 231 (7.4%) | 202 (6.5%) |
| 60 to 89 Minutes | 85 (2.7%) | 3 (0.1%) |
| 90 or more Minutes | 104 (3.3%) | 10 (0.3%) |
Time of Departure to Work by Sex in Marion
The most frequent times of departure to work in Marion are 7:00 AM to 7:29 AM (588, 18.9%) for males and 7:30 AM to 7:59 AM (686, 22.0%) for females.
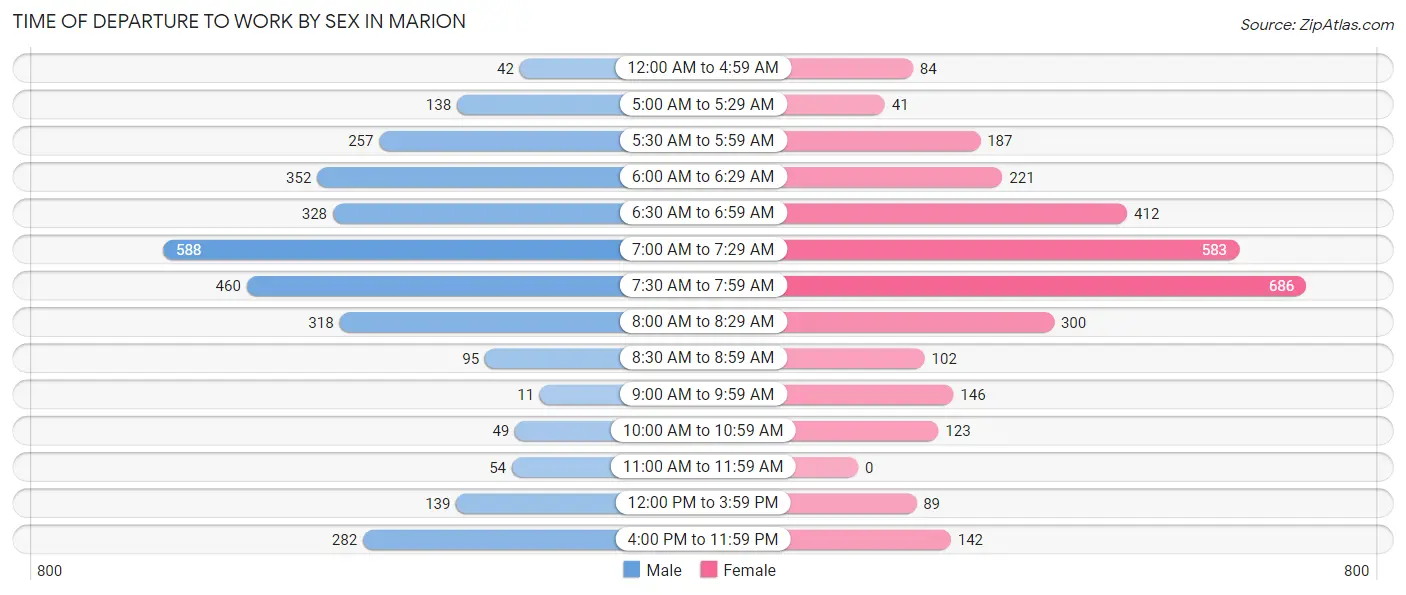
| Time of Departure | Male | Female |
| 12:00 AM to 4:59 AM | 42 (1.3%) | 84 (2.7%) |
| 5:00 AM to 5:29 AM | 138 (4.4%) | 41 (1.3%) |
| 5:30 AM to 5:59 AM | 257 (8.3%) | 187 (6.0%) |
| 6:00 AM to 6:29 AM | 352 (11.3%) | 221 (7.1%) |
| 6:30 AM to 6:59 AM | 328 (10.5%) | 412 (13.2%) |
| 7:00 AM to 7:29 AM | 588 (18.9%) | 583 (18.7%) |
| 7:30 AM to 7:59 AM | 460 (14.8%) | 686 (22.0%) |
| 8:00 AM to 8:29 AM | 318 (10.2%) | 300 (9.6%) |
| 8:30 AM to 8:59 AM | 95 (3.0%) | 102 (3.3%) |
| 9:00 AM to 9:59 AM | 11 (0.4%) | 146 (4.7%) |
| 10:00 AM to 10:59 AM | 49 (1.6%) | 123 (4.0%) |
| 11:00 AM to 11:59 AM | 54 (1.7%) | 0 (0.0%) |
| 12:00 PM to 3:59 PM | 139 (4.5%) | 89 (2.9%) |
| 4:00 PM to 11:59 PM | 282 (9.1%) | 142 (4.6%) |
| Total | 3,113 (100.0%) | 3,116 (100.0%) |
Housing Occupancy in Marion
Occupancy by Ownership in Marion
Of the total 5,105 dwellings in Marion, owner-occupied units account for 3,631 (71.1%), while renter-occupied units make up 1,474 (28.9%).
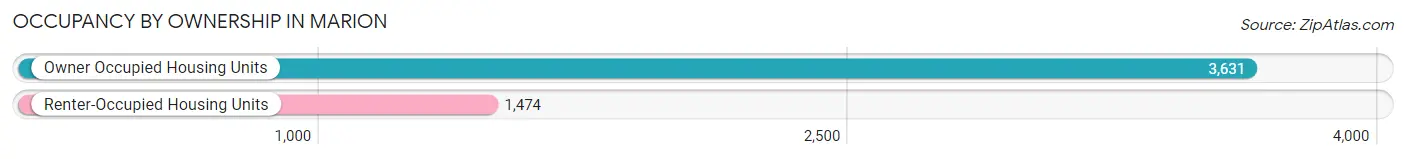
| Occupancy | # Housing Units | % Housing Units |
| Owner Occupied Housing Units | 3,631 | 71.1% |
| Renter-Occupied Housing Units | 1,474 | 28.9% |
| Total Occupied Housing Units | 5,105 | 100.0% |
Occupancy by Household Size in Marion
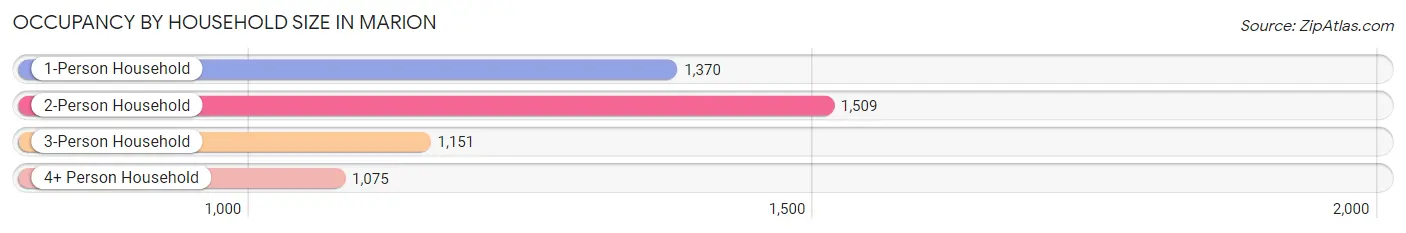
| Household Size | # Housing Units | % Housing Units |
| 1-Person Household | 1,370 | 26.8% |
| 2-Person Household | 1,509 | 29.6% |
| 3-Person Household | 1,151 | 22.6% |
| 4+ Person Household | 1,075 | 21.1% |
| Total Housing Units | 5,105 | 100.0% |
Occupancy by Ownership by Household Size in Marion
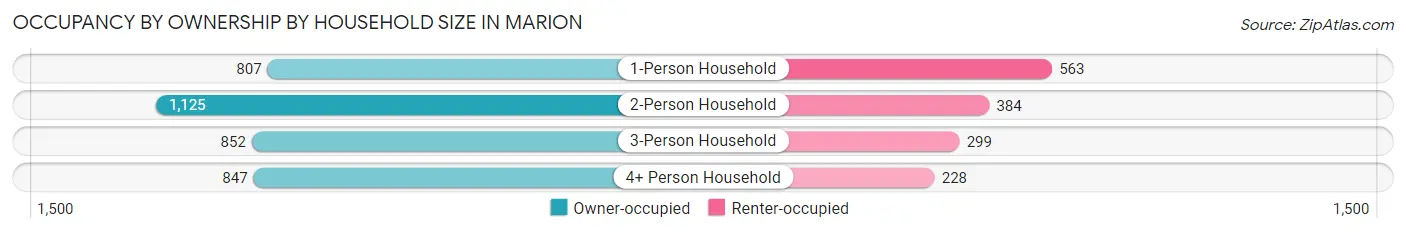
| Household Size | Owner-occupied | Renter-occupied |
| 1-Person Household | 807 (58.9%) | 563 (41.1%) |
| 2-Person Household | 1,125 (74.6%) | 384 (25.5%) |
| 3-Person Household | 852 (74.0%) | 299 (26.0%) |
| 4+ Person Household | 847 (78.8%) | 228 (21.2%) |
| Total Housing Units | 3,631 (71.1%) | 1,474 (28.9%) |
Occupancy by Educational Attainment in Marion
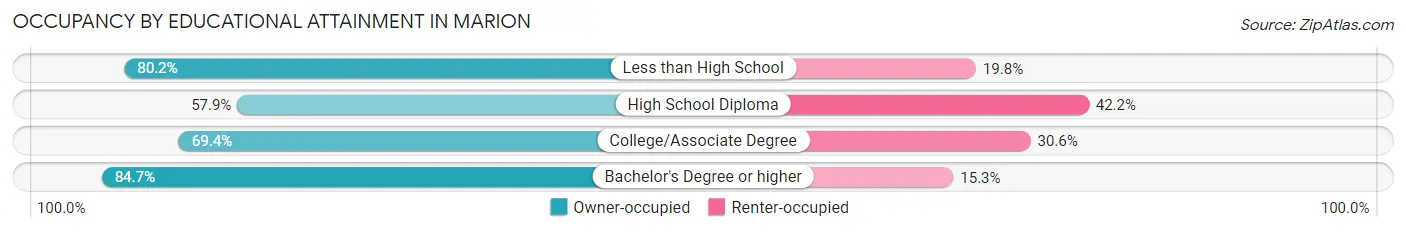
| Household Size | Owner-occupied | Renter-occupied |
| Less than High School | 154 (80.2%) | 38 (19.8%) |
| High School Diploma | 840 (57.9%) | 612 (42.1%) |
| College/Associate Degree | 1,336 (69.4%) | 589 (30.6%) |
| Bachelor's Degree or higher | 1,301 (84.7%) | 235 (15.3%) |
Occupancy by Age of Householder in Marion
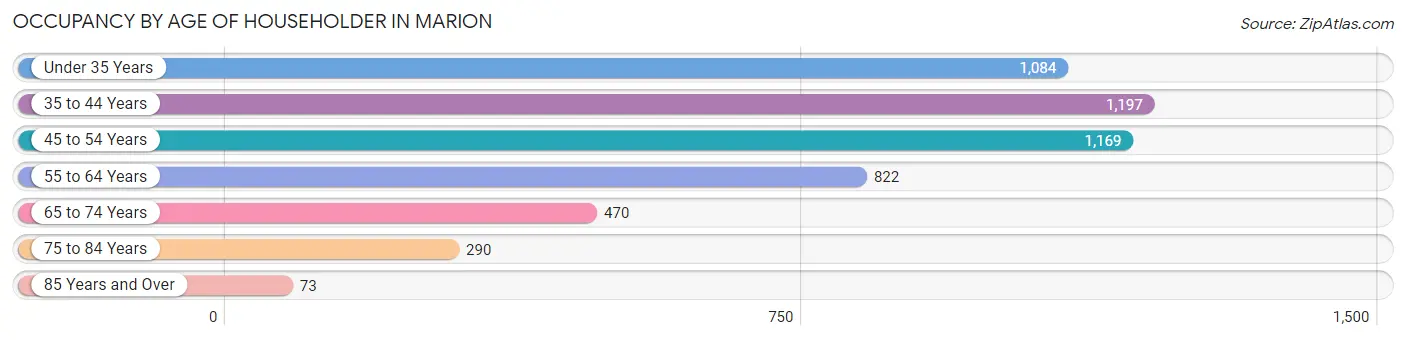
| Age Bracket | # Households | % Households |
| Under 35 Years | 1,084 | 21.2% |
| 35 to 44 Years | 1,197 | 23.4% |
| 45 to 54 Years | 1,169 | 22.9% |
| 55 to 64 Years | 822 | 16.1% |
| 65 to 74 Years | 470 | 9.2% |
| 75 to 84 Years | 290 | 5.7% |
| 85 Years and Over | 73 | 1.4% |
| Total | 5,105 | 100.0% |
Housing Finances in Marion
Median Income by Occupancy in Marion
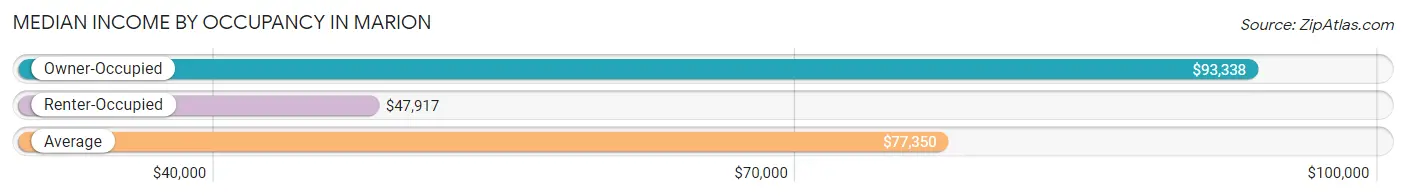
| Occupancy Type | # Households | Median Income |
| Owner-Occupied | 3,631 (71.1%) | $93,338 |
| Renter-Occupied | 1,474 (28.9%) | $47,917 |
| Average | 5,105 (100.0%) | $77,350 |
Occupancy by Householder Income Bracket in Marion
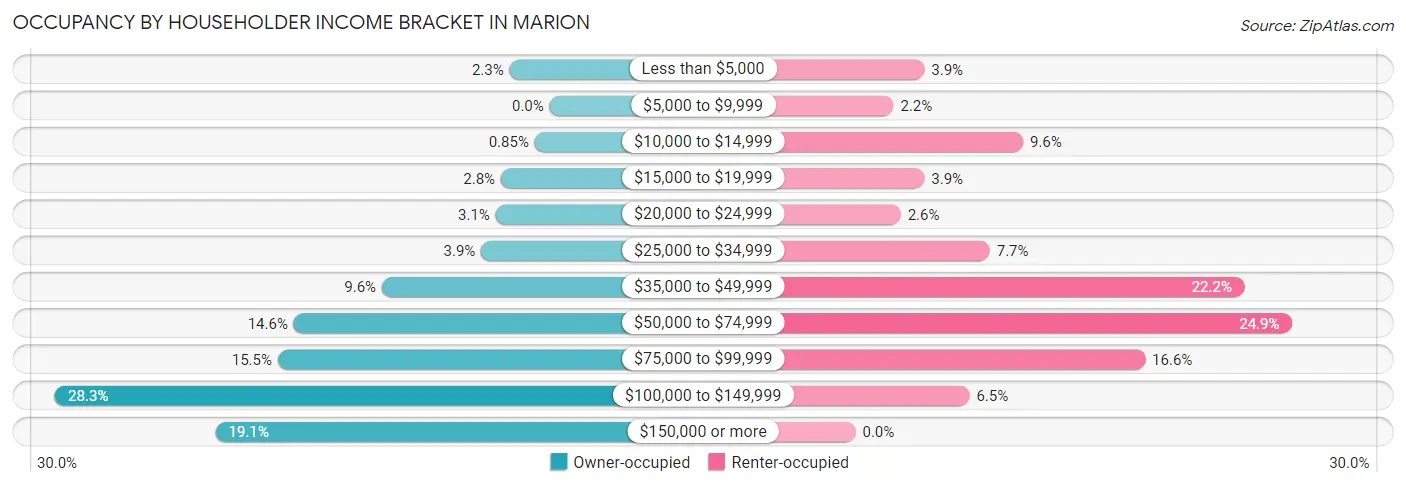
| Income Bracket | Owner-occupied | Renter-occupied |
| Less than $5,000 | 83 (2.3%) | 58 (3.9%) |
| $5,000 to $9,999 | 0 (0.0%) | 32 (2.2%) |
| $10,000 to $14,999 | 31 (0.9%) | 141 (9.6%) |
| $15,000 to $19,999 | 101 (2.8%) | 58 (3.9%) |
| $20,000 to $24,999 | 112 (3.1%) | 38 (2.6%) |
| $25,000 to $34,999 | 142 (3.9%) | 113 (7.7%) |
| $35,000 to $49,999 | 348 (9.6%) | 327 (22.2%) |
| $50,000 to $74,999 | 531 (14.6%) | 367 (24.9%) |
| $75,000 to $99,999 | 564 (15.5%) | 244 (16.6%) |
| $100,000 to $149,999 | 1,026 (28.3%) | 96 (6.5%) |
| $150,000 or more | 693 (19.1%) | 0 (0.0%) |
| Total | 3,631 (100.0%) | 1,474 (100.0%) |
Monthly Housing Cost Tiers in Marion
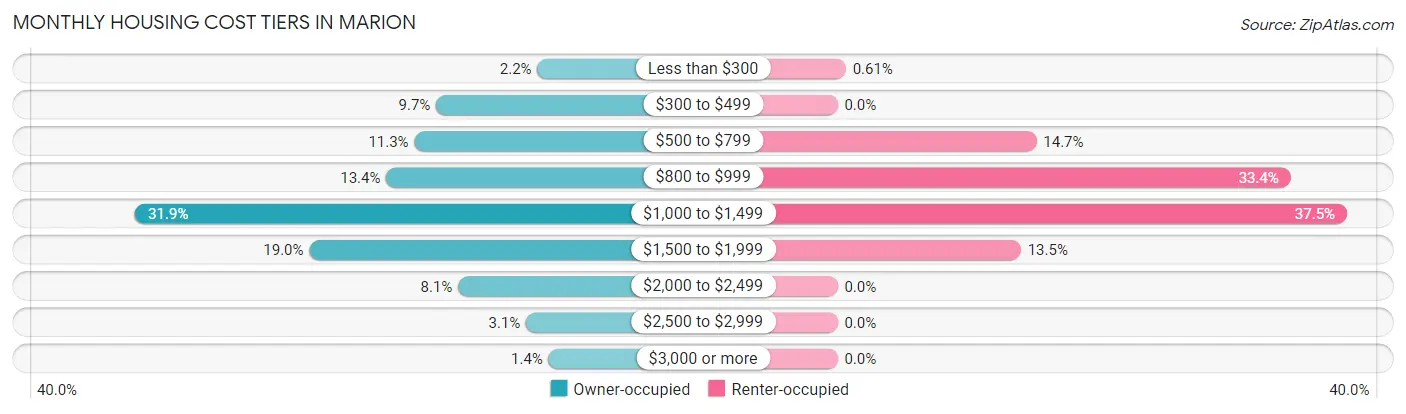
| Monthly Cost | Owner-occupied | Renter-occupied |
| Less than $300 | 81 (2.2%) | 9 (0.6%) |
| $300 to $499 | 352 (9.7%) | 0 (0.0%) |
| $500 to $799 | 410 (11.3%) | 216 (14.6%) |
| $800 to $999 | 485 (13.4%) | 492 (33.4%) |
| $1,000 to $1,499 | 1,157 (31.9%) | 553 (37.5%) |
| $1,500 to $1,999 | 691 (19.0%) | 199 (13.5%) |
| $2,000 to $2,499 | 293 (8.1%) | 0 (0.0%) |
| $2,500 to $2,999 | 111 (3.1%) | 0 (0.0%) |
| $3,000 or more | 51 (1.4%) | 0 (0.0%) |
| Total | 3,631 (100.0%) | 1,474 (100.0%) |
Physical Housing Characteristics in Marion
Housing Structures in Marion
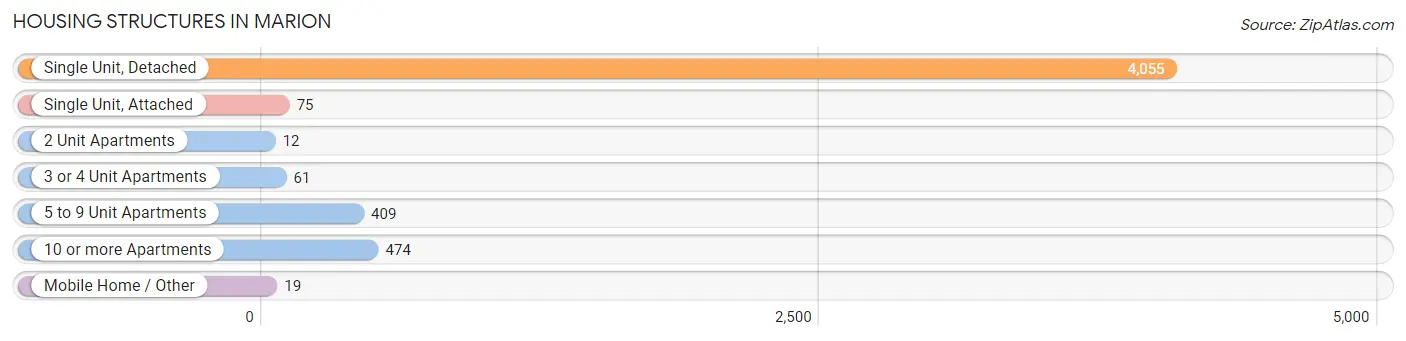
| Structure Type | # Housing Units | % Housing Units |
| Single Unit, Detached | 4,055 | 79.4% |
| Single Unit, Attached | 75 | 1.5% |
| 2 Unit Apartments | 12 | 0.2% |
| 3 or 4 Unit Apartments | 61 | 1.2% |
| 5 to 9 Unit Apartments | 409 | 8.0% |
| 10 or more Apartments | 474 | 9.3% |
| Mobile Home / Other | 19 | 0.4% |
| Total | 5,105 | 100.0% |
Housing Structures by Occupancy in Marion
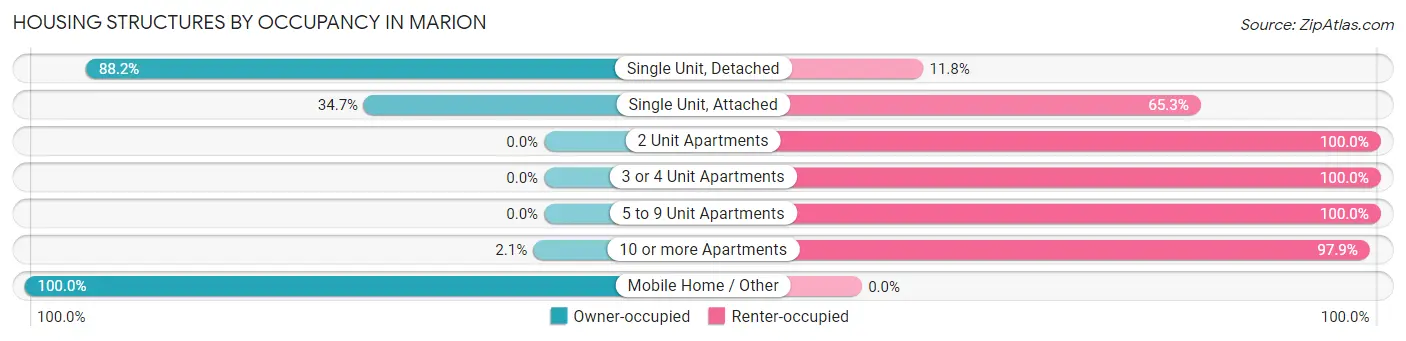
| Structure Type | Owner-occupied | Renter-occupied |
| Single Unit, Detached | 3,576 (88.2%) | 479 (11.8%) |
| Single Unit, Attached | 26 (34.7%) | 49 (65.3%) |
| 2 Unit Apartments | 0 (0.0%) | 12 (100.0%) |
| 3 or 4 Unit Apartments | 0 (0.0%) | 61 (100.0%) |
| 5 to 9 Unit Apartments | 0 (0.0%) | 409 (100.0%) |
| 10 or more Apartments | 10 (2.1%) | 464 (97.9%) |
| Mobile Home / Other | 19 (100.0%) | 0 (0.0%) |
| Total | 3,631 (71.1%) | 1,474 (28.9%) |
Housing Structures by Number of Rooms in Marion
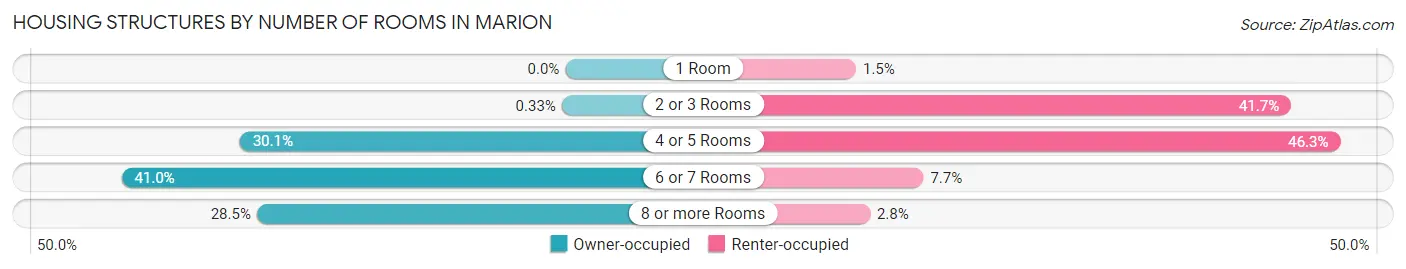
| Number of Rooms | Owner-occupied | Renter-occupied |
| 1 Room | 0 (0.0%) | 22 (1.5%) |
| 2 or 3 Rooms | 12 (0.3%) | 615 (41.7%) |
| 4 or 5 Rooms | 1,093 (30.1%) | 682 (46.3%) |
| 6 or 7 Rooms | 1,490 (41.0%) | 114 (7.7%) |
| 8 or more Rooms | 1,036 (28.5%) | 41 (2.8%) |
| Total | 3,631 (100.0%) | 1,474 (100.0%) |
Housing Structure by Heating Type in Marion
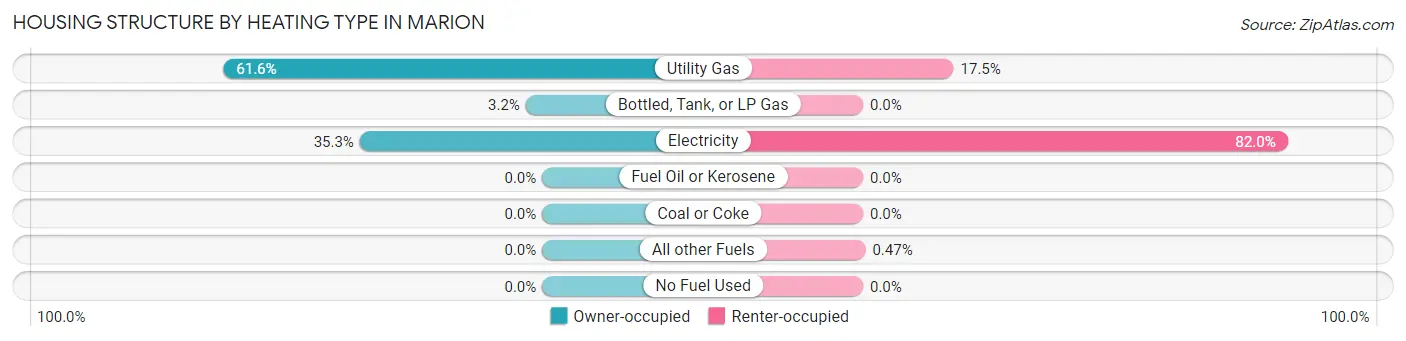
| Heating Type | Owner-occupied | Renter-occupied |
| Utility Gas | 2,236 (61.6%) | 258 (17.5%) |
| Bottled, Tank, or LP Gas | 115 (3.2%) | 0 (0.0%) |
| Electricity | 1,280 (35.2%) | 1,209 (82.0%) |
| Fuel Oil or Kerosene | 0 (0.0%) | 0 (0.0%) |
| Coal or Coke | 0 (0.0%) | 0 (0.0%) |
| All other Fuels | 0 (0.0%) | 7 (0.5%) |
| No Fuel Used | 0 (0.0%) | 0 (0.0%) |
| Total | 3,631 (100.0%) | 1,474 (100.0%) |
Household Vehicle Usage in Marion
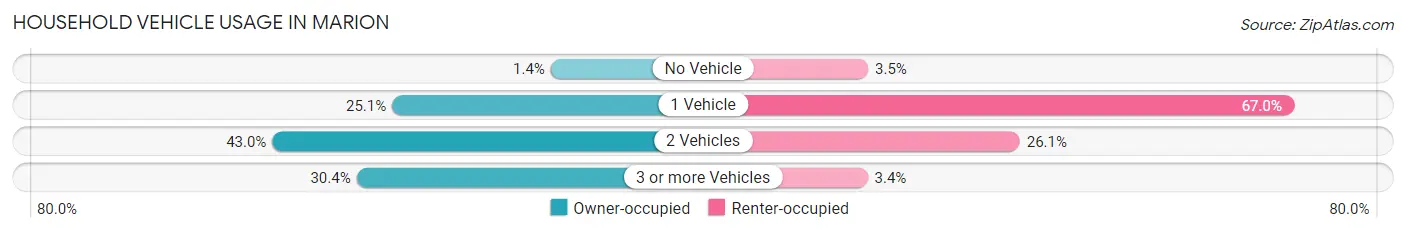
| Vehicles per Household | Owner-occupied | Renter-occupied |
| No Vehicle | 52 (1.4%) | 51 (3.5%) |
| 1 Vehicle | 912 (25.1%) | 988 (67.0%) |
| 2 Vehicles | 1,562 (43.0%) | 385 (26.1%) |
| 3 or more Vehicles | 1,105 (30.4%) | 50 (3.4%) |
| Total | 3,631 (100.0%) | 1,474 (100.0%) |
Real Estate & Mortgages in Marion
Real Estate and Mortgage Overview in Marion
| Characteristic | Without Mortgage | With Mortgage |
| Housing Units | 934 | 2,697 |
| Median Property Value | $187,900 | $187,100 |
| Median Household Income | $72,813 | $500 |
| Monthly Housing Costs | $526 | $51 |
| Real Estate Taxes | $1,647 | $104 |
Property Value by Mortgage Status in Marion
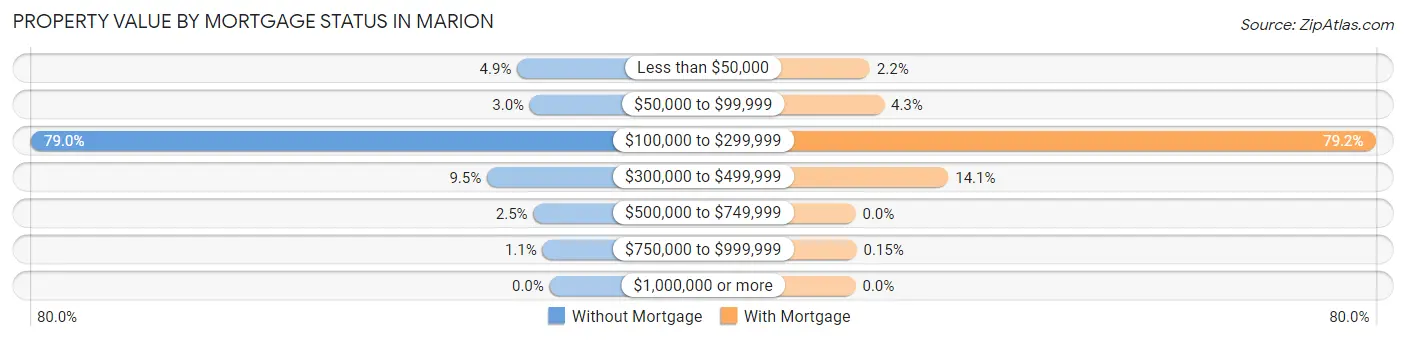
| Property Value | Without Mortgage | With Mortgage |
| Less than $50,000 | 46 (4.9%) | 59 (2.2%) |
| $50,000 to $99,999 | 28 (3.0%) | 117 (4.3%) |
| $100,000 to $299,999 | 738 (79.0%) | 2,136 (79.2%) |
| $300,000 to $499,999 | 89 (9.5%) | 381 (14.1%) |
| $500,000 to $749,999 | 23 (2.5%) | 0 (0.0%) |
| $750,000 to $999,999 | 10 (1.1%) | 4 (0.2%) |
| $1,000,000 or more | 0 (0.0%) | 0 (0.0%) |
| Total | 934 (100.0%) | 2,697 (100.0%) |
Household Income by Mortgage Status in Marion
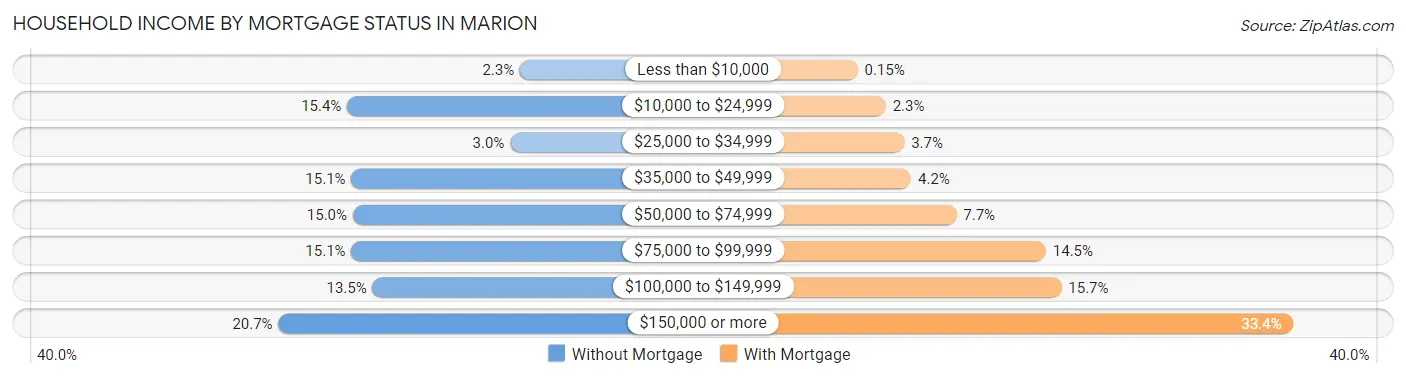
| Household Income | Without Mortgage | With Mortgage |
| Less than $10,000 | 21 (2.2%) | 4 (0.2%) |
| $10,000 to $24,999 | 144 (15.4%) | 62 (2.3%) |
| $25,000 to $34,999 | 28 (3.0%) | 100 (3.7%) |
| $35,000 to $49,999 | 141 (15.1%) | 114 (4.2%) |
| $50,000 to $74,999 | 140 (15.0%) | 207 (7.7%) |
| $75,000 to $99,999 | 141 (15.1%) | 391 (14.5%) |
| $100,000 to $149,999 | 126 (13.5%) | 423 (15.7%) |
| $150,000 or more | 193 (20.7%) | 900 (33.4%) |
| Total | 934 (100.0%) | 2,697 (100.0%) |
Property Value to Household Income Ratio in Marion
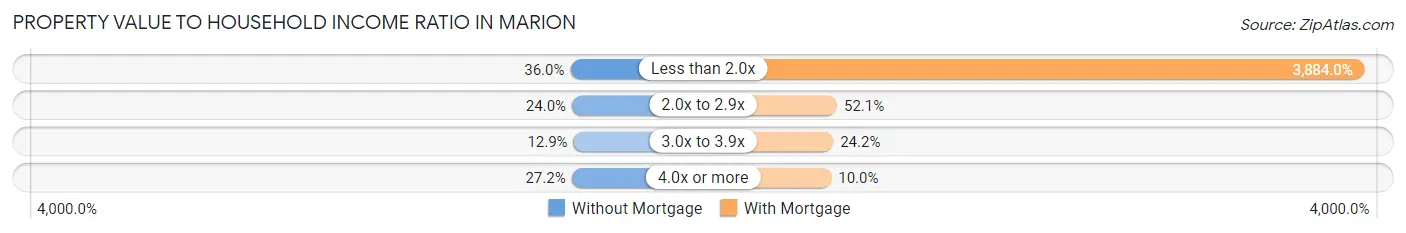
| Value-to-Income Ratio | Without Mortgage | With Mortgage |
| Less than 2.0x | 336 (36.0%) | 104,750 (3,884.0%) |
| 2.0x to 2.9x | 224 (24.0%) | 1,404 (52.1%) |
| 3.0x to 3.9x | 120 (12.9%) | 652 (24.2%) |
| 4.0x or more | 254 (27.2%) | 269 (10.0%) |
| Total | 934 (100.0%) | 2,697 (100.0%) |
Real Estate Taxes by Mortgage Status in Marion
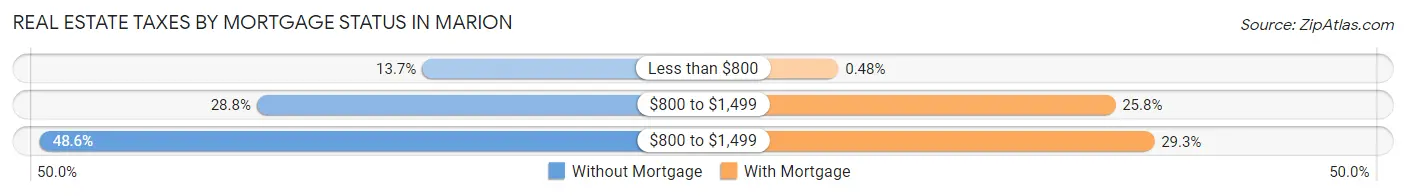
| Property Taxes | Without Mortgage | With Mortgage |
| Less than $800 | 128 (13.7%) | 13 (0.5%) |
| $800 to $1,499 | 269 (28.8%) | 695 (25.8%) |
| $800 to $1,499 | 454 (48.6%) | 791 (29.3%) |
| Total | 934 (100.0%) | 2,697 (100.0%) |
Health & Disability in Marion
Health Insurance Coverage by Age in Marion
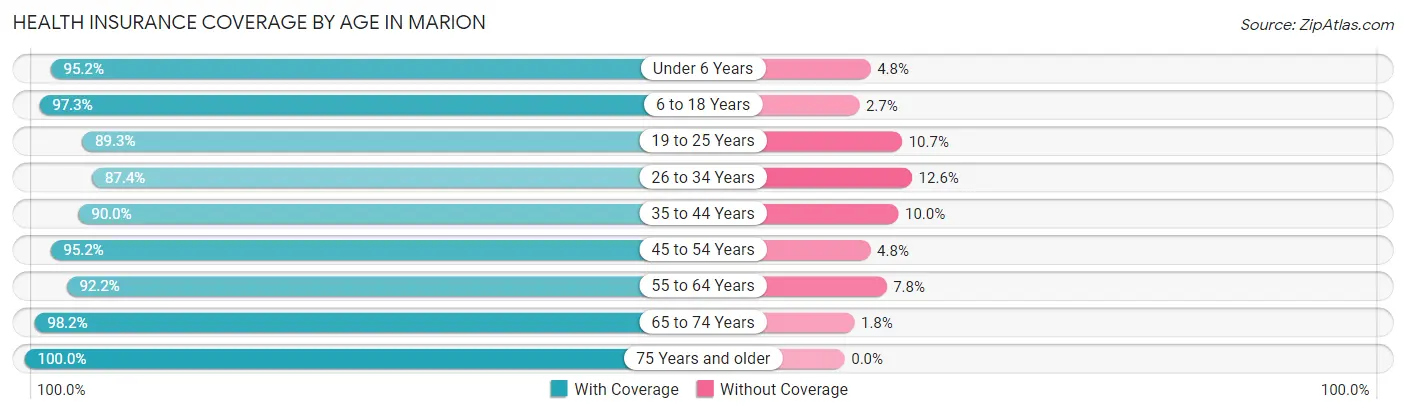
| Age Bracket | With Coverage | Without Coverage |
| Under 6 Years | 885 (95.2%) | 45 (4.8%) |
| 6 to 18 Years | 3,086 (97.3%) | 87 (2.7%) |
| 19 to 25 Years | 959 (89.3%) | 115 (10.7%) |
| 26 to 34 Years | 1,392 (87.4%) | 200 (12.6%) |
| 35 to 44 Years | 1,625 (90.0%) | 181 (10.0%) |
| 45 to 54 Years | 1,996 (95.2%) | 101 (4.8%) |
| 55 to 64 Years | 1,311 (92.2%) | 111 (7.8%) |
| 65 to 74 Years | 863 (98.2%) | 16 (1.8%) |
| 75 Years and older | 551 (100.0%) | 0 (0.0%) |
| Total | 12,668 (93.7%) | 856 (6.3%) |
Health Insurance Coverage by Citizenship Status in Marion
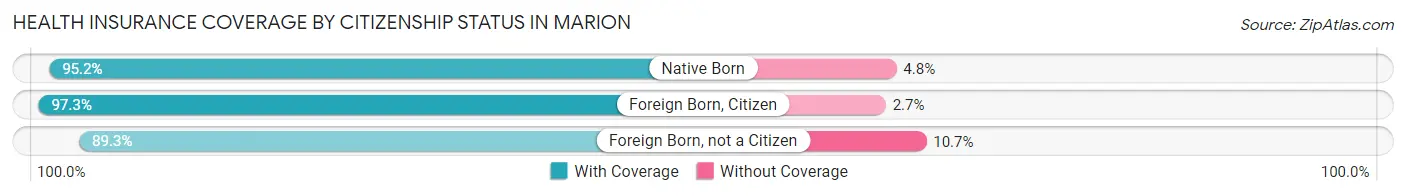
| Citizenship Status | With Coverage | Without Coverage |
| Native Born | 885 (95.2%) | 45 (4.8%) |
| Foreign Born, Citizen | 3,086 (97.3%) | 87 (2.7%) |
| Foreign Born, not a Citizen | 959 (89.3%) | 115 (10.7%) |
Health Insurance Coverage by Household Income in Marion
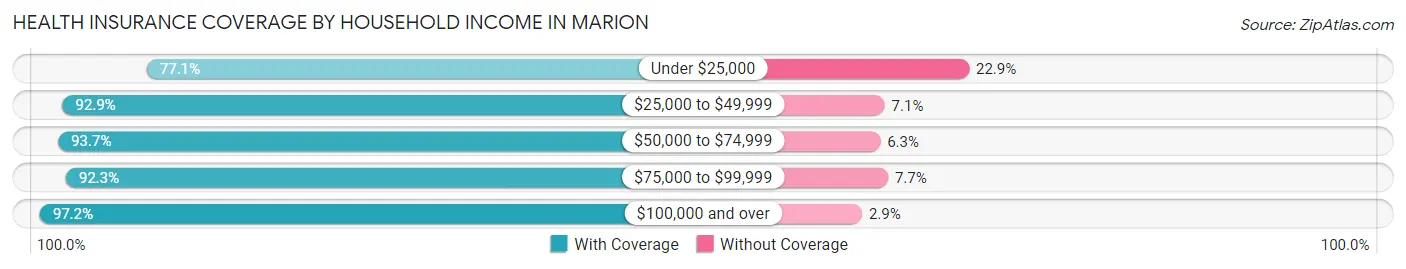
| Household Income | With Coverage | Without Coverage |
| Under $25,000 | 730 (77.1%) | 217 (22.9%) |
| $25,000 to $49,999 | 1,834 (92.9%) | 140 (7.1%) |
| $50,000 to $74,999 | 2,379 (93.7%) | 159 (6.3%) |
| $75,000 to $99,999 | 2,033 (92.3%) | 170 (7.7%) |
| $100,000 and over | 5,683 (97.2%) | 167 (2.9%) |
Public vs Private Health Insurance Coverage by Age in Marion
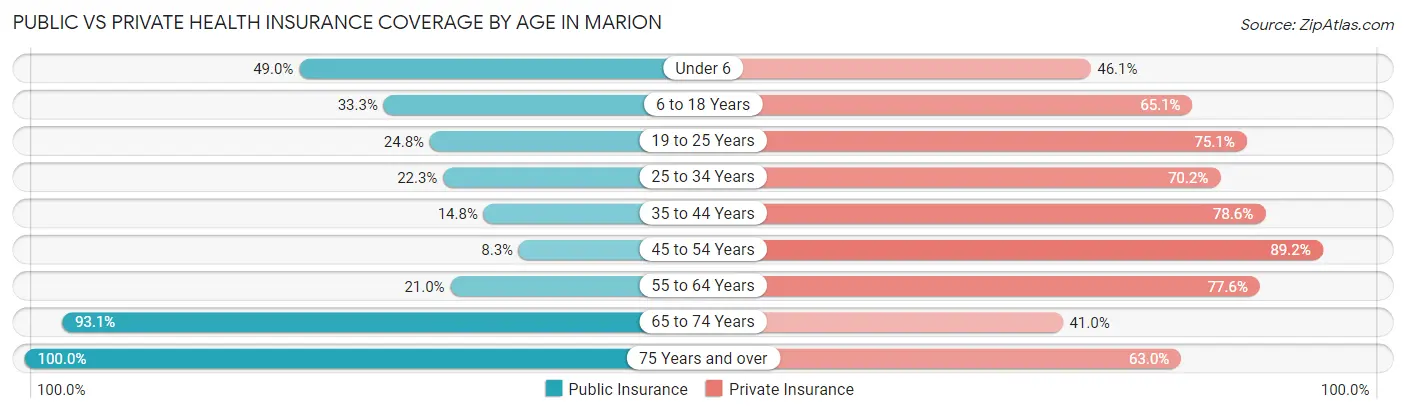
| Age Bracket | Public Insurance | Private Insurance |
| Under 6 | 456 (49.0%) | 429 (46.1%) |
| 6 to 18 Years | 1,058 (33.3%) | 2,065 (65.1%) |
| 19 to 25 Years | 266 (24.8%) | 807 (75.1%) |
| 25 to 34 Years | 355 (22.3%) | 1,118 (70.2%) |
| 35 to 44 Years | 267 (14.8%) | 1,419 (78.6%) |
| 45 to 54 Years | 173 (8.3%) | 1,871 (89.2%) |
| 55 to 64 Years | 298 (21.0%) | 1,103 (77.6%) |
| 65 to 74 Years | 818 (93.1%) | 360 (41.0%) |
| 75 Years and over | 551 (100.0%) | 347 (63.0%) |
| Total | 4,242 (31.4%) | 9,519 (70.4%) |
Disability Status by Sex by Age in Marion
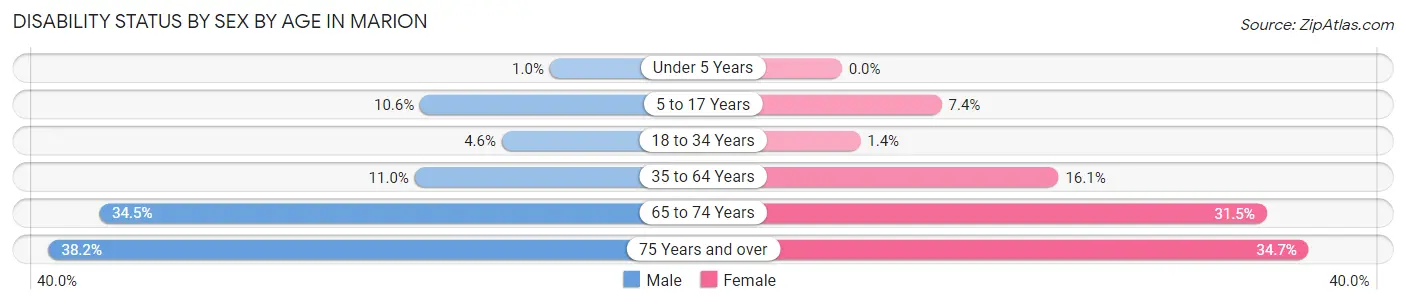
| Age Bracket | Male | Female |
| Under 5 Years | 5 (1.0%) | 0 (0.0%) |
| 5 to 17 Years | 179 (10.6%) | 112 (7.4%) |
| 18 to 34 Years | 68 (4.6%) | 18 (1.4%) |
| 35 to 64 Years | 266 (11.0%) | 469 (16.1%) |
| 65 to 74 Years | 162 (34.5%) | 129 (31.5%) |
| 75 Years and over | 86 (38.2%) | 113 (34.7%) |
Disability Class by Sex by Age in Marion
Disability Class: Hearing Difficulty
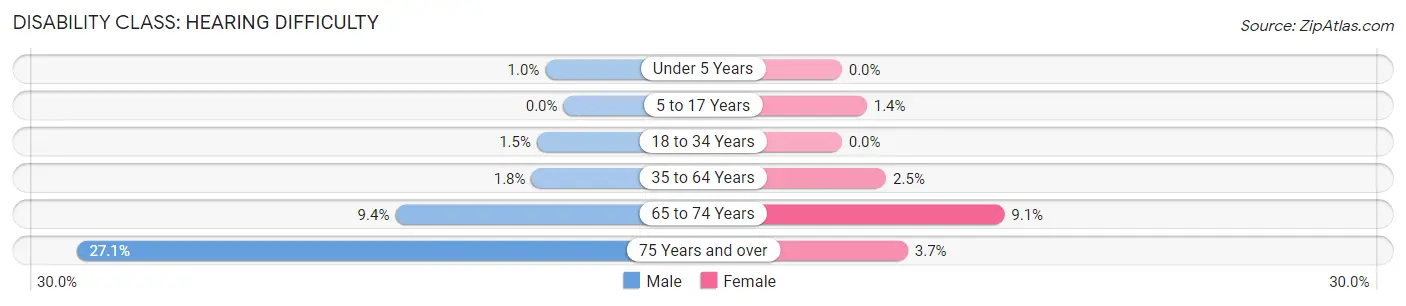
| Age Bracket | Male | Female |
| Under 5 Years | 5 (1.0%) | 0 (0.0%) |
| 5 to 17 Years | 0 (0.0%) | 21 (1.4%) |
| 18 to 34 Years | 22 (1.5%) | 0 (0.0%) |
| 35 to 64 Years | 43 (1.8%) | 72 (2.5%) |
| 65 to 74 Years | 44 (9.4%) | 37 (9.0%) |
| 75 Years and over | 61 (27.1%) | 12 (3.7%) |
Disability Class: Vision Difficulty
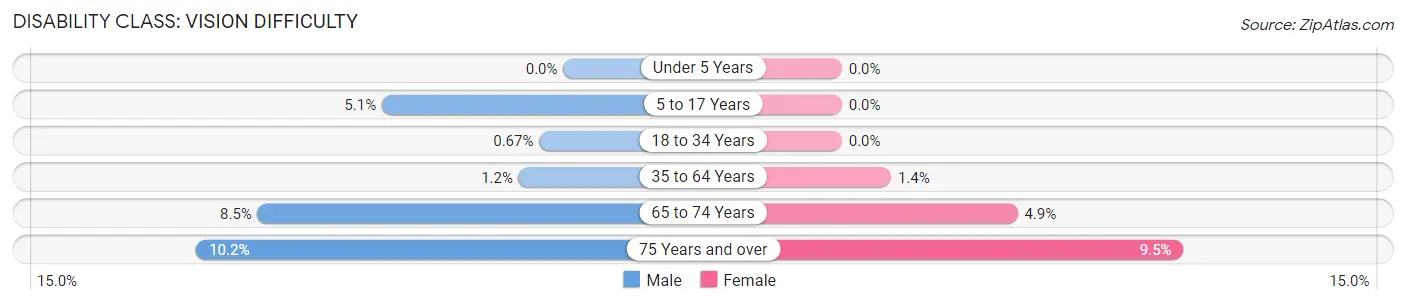
| Age Bracket | Male | Female |
| Under 5 Years | 0 (0.0%) | 0 (0.0%) |
| 5 to 17 Years | 85 (5.1%) | 0 (0.0%) |
| 18 to 34 Years | 10 (0.7%) | 0 (0.0%) |
| 35 to 64 Years | 30 (1.2%) | 40 (1.4%) |
| 65 to 74 Years | 40 (8.5%) | 20 (4.9%) |
| 75 Years and over | 23 (10.2%) | 31 (9.5%) |
Disability Class: Cognitive Difficulty
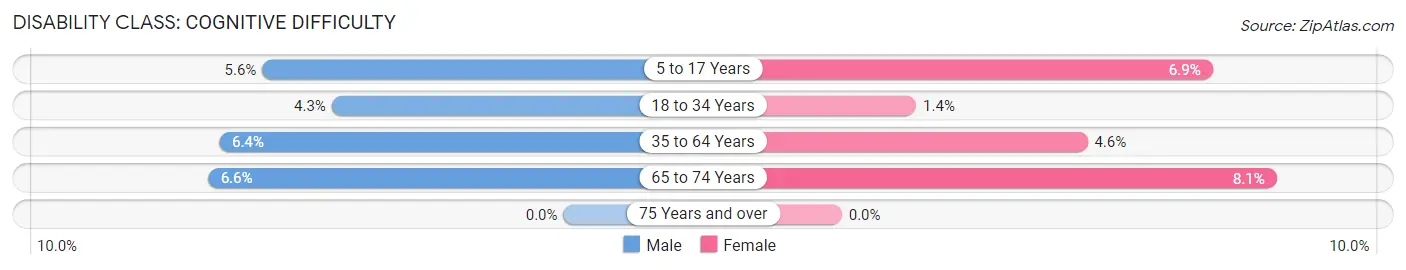
| Age Bracket | Male | Female |
| 5 to 17 Years | 94 (5.6%) | 104 (6.9%) |
| 18 to 34 Years | 64 (4.3%) | 18 (1.4%) |
| 35 to 64 Years | 154 (6.4%) | 133 (4.6%) |
| 65 to 74 Years | 31 (6.6%) | 33 (8.1%) |
| 75 Years and over | 0 (0.0%) | 0 (0.0%) |
Disability Class: Ambulatory Difficulty
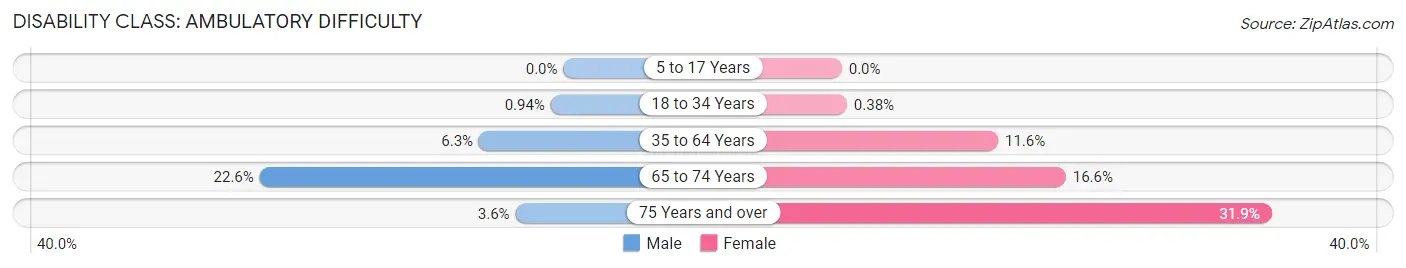
| Age Bracket | Male | Female |
| 5 to 17 Years | 0 (0.0%) | 0 (0.0%) |
| 18 to 34 Years | 14 (0.9%) | 5 (0.4%) |
| 35 to 64 Years | 151 (6.3%) | 338 (11.6%) |
| 65 to 74 Years | 106 (22.6%) | 68 (16.6%) |
| 75 Years and over | 8 (3.6%) | 104 (31.9%) |
Disability Class: Self-Care Difficulty
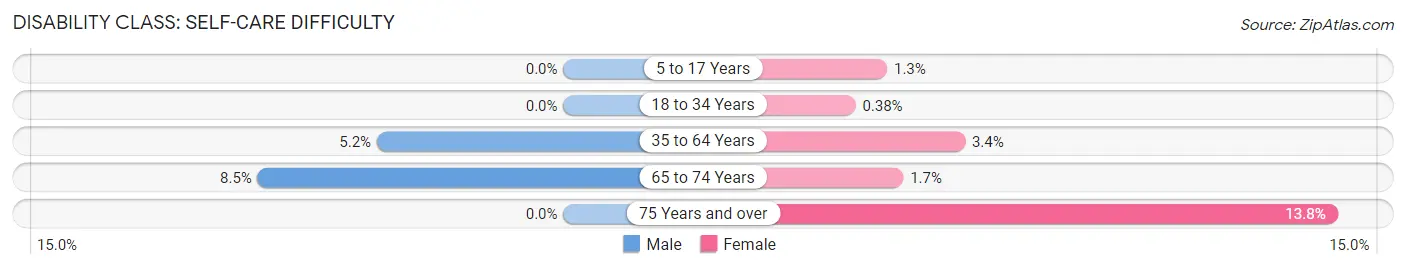
| Age Bracket | Male | Female |
| 5 to 17 Years | 0 (0.0%) | 19 (1.3%) |
| 18 to 34 Years | 0 (0.0%) | 5 (0.4%) |
| 35 to 64 Years | 125 (5.2%) | 100 (3.4%) |
| 65 to 74 Years | 40 (8.5%) | 7 (1.7%) |
| 75 Years and over | 0 (0.0%) | 45 (13.8%) |
Technology Access in Marion
Computing Device Access in Marion
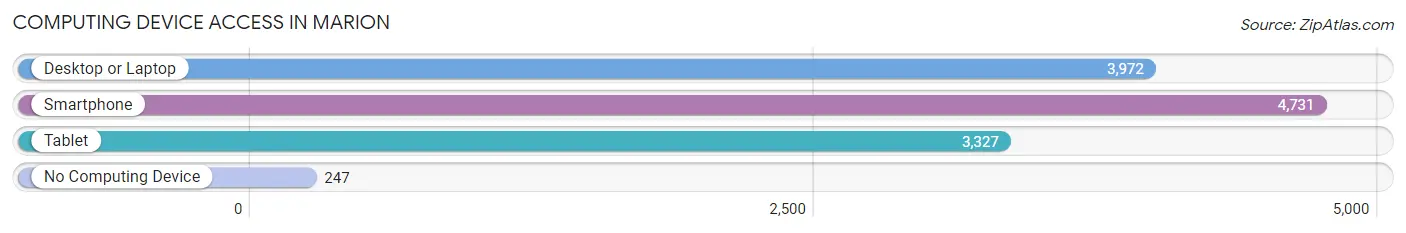
| Device Type | # Households | % Households |
| Desktop or Laptop | 3,972 | 77.8% |
| Smartphone | 4,731 | 92.7% |
| Tablet | 3,327 | 65.2% |
| No Computing Device | 247 | 4.8% |
| Total | 5,105 | 100.0% |
Internet Access in Marion
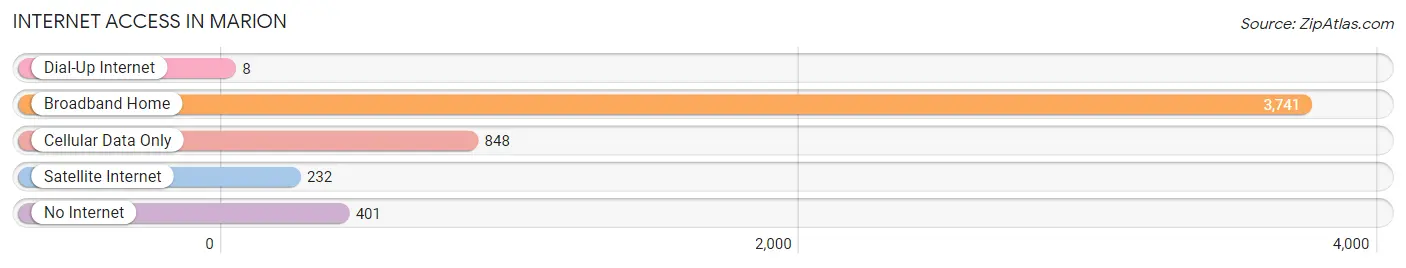
| Internet Type | # Households | % Households |
| Dial-Up Internet | 8 | 0.2% |
| Broadband Home | 3,741 | 73.3% |
| Cellular Data Only | 848 | 16.6% |
| Satellite Internet | 232 | 4.5% |
| No Internet | 401 | 7.9% |
| Total | 5,105 | 100.0% |
Marion Summary
Marion, Arkansas is a city located in Crittenden County, Arkansas. It is situated on the banks of the Mississippi River, just south of Memphis, Tennessee. The city has a population of approximately 12,345 people, according to the 2010 census.
History
Marion was founded in 1839 by William B. Crittenden, a prominent lawyer and politician from Kentucky. The city was named after Francis Marion, a Revolutionary War hero. The city was incorporated in 1848 and was the county seat of Crittenden County.
During the Civil War, Marion was a major supply center for the Confederate Army. The city was the site of several battles, including the Battle of Chalk Bluff in 1863. After the war, the city was occupied by Union troops and was the site of a Freedmen's Bureau office.
In the late 19th century, Marion became a major railroad hub, with the St. Louis, Iron Mountain and Southern Railway running through the city. The city was also home to several cotton mills and other industries.
Geography
Marion is located in the northwest corner of Crittenden County, Arkansas. It is situated on the banks of the Mississippi River, just south of Memphis, Tennessee. The city has a total area of 8.3 square miles, all of which is land.
The city is located in the Mississippi Alluvial Plain, a flat, low-lying area that is prone to flooding. The city is located in the humid subtropical climate zone, with hot, humid summers and mild winters.
Economy
Marion's economy is largely based on agriculture and manufacturing. The city is home to several large agricultural operations, including cotton, soybeans, corn, and rice. The city is also home to several manufacturing companies, including a paper mill, a furniture factory, and a plastics plant.
The city is also home to several retail stores, restaurants, and other businesses. The city is served by the Marion Municipal Airport, which offers flights to several major cities in the region.
Demographics
According to the 2010 census, Marion had a population of 12,345 people. The racial makeup of the city was 68.3% White, 28.2% African American, 0.3% Native American, 0.7% Asian, 0.1% Pacific Islander, and 2.4% from other races. Hispanic or Latino of any race were 2.7% of the population.
The median income for a household in the city was $30,945, and the median income for a family was $37,945. The per capita income for the city was $17,845. About 17.2% of families and 20.7% of the population were below the poverty line, including 28.2% of those under age 18 and 16.2% of those age 65 or over.
Common Questions
What is Per Capita Income in Marion?
Per Capita income in Marion is $37,483.
What is the Median Family Income in Marion?
Median Family Income in Marion is $90,814.
What is the Median Household income in Marion?
Median Household Income in Marion is $77,350.
What is Income or Wage Gap in Marion?
Income or Wage Gap in Marion is 31.7%.
Women in Marion earn 68.3 cents for every dollar earned by a man.
What is Inequality or Gini Index in Marion?
Inequality or Gini Index in Marion is 0.44.
What is the Total Population of Marion?
Total Population of Marion is 13,635.
What is the Total Male Population of Marion?
Total Male Population of Marion is 6,836.
What is the Total Female Population of Marion?
Total Female Population of Marion is 6,799.
What is the Ratio of Males per 100 Females in Marion?
There are 100.54 Males per 100 Females in Marion.
What is the Ratio of Females per 100 Males in Marion?
There are 99.46 Females per 100 Males in Marion.
What is the Median Population Age in Marion?
Median Population Age in Marion is 35.5 Years.
What is the Average Family Size in Marion
Average Family Size in Marion is 3.3 People.
What is the Average Household Size in Marion
Average Household Size in Marion is 2.6 People.
How Large is the Labor Force in Marion?
There are 7,095 People in the Labor Forcein in Marion.
What is the Percentage of People in the Labor Force in Marion?
70.1% of People are in the Labor Force in Marion.
What is the Unemployment Rate in Marion?
Unemployment Rate in Marion is 5.6%.