Hot Springs Village, AR Map & Demographics
Hot Springs Village Map
Hot Springs Village Overview
$41,819
PER CAPITA INCOME
$84,310
AVG FAMILY INCOME
$68,580
AVG HOUSEHOLD INCOME
6.5%
WAGE / INCOME GAP [ % ]
93.5¢/ $1
WAGE / INCOME GAP [ $ ]
0.41
INEQUALITY / GINI INDEX
16,843
TOTAL POPULATION
8,029
MALE POPULATION
8,814
FEMALE POPULATION
91.09
MALES / 100 FEMALES
109.78
FEMALES / 100 MALES
69.7
MEDIAN AGE
2.3
AVG FAMILY SIZE
2.0
AVG HOUSEHOLD SIZE
4,385
LABOR FORCE [ PEOPLE ]
27.2%
PERCENT IN LABOR FORCE
4.7%
UNEMPLOYMENT RATE
Hot Springs Village Zip Codes
Hot Springs Village Area Codes
Income in Hot Springs Village
Income Overview in Hot Springs Village
Per Capita Income in Hot Springs Village is $41,819, while median incomes of families and households are $84,310 and $68,580 respectively.
| Characteristic | Number | Measure |
| Per Capita Income | 16,843 | $41,819 |
| Median Family Income | 5,507 | $84,310 |
| Mean Family Income | 5,507 | $96,077 |
| Median Household Income | 8,555 | $68,580 |
| Mean Household Income | 8,555 | $81,017 |
| Income Deficit | 5,507 | $0 |
| Wage / Income Gap (%) | 16,843 | 6.52% |
| Wage / Income Gap ($) | 16,843 | 93.48¢ per $1 |
| Gini / Inequality Index | 16,843 | 0.41 |
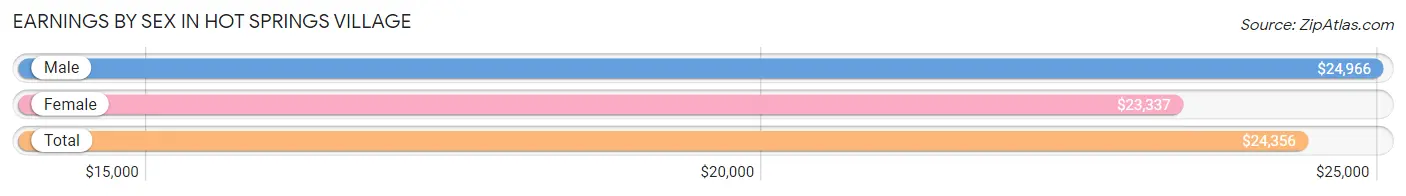
Earnings by Sex in Hot Springs Village
Average Earnings in Hot Springs Village are $24,356, $24,966 for men and $23,337 for women, a difference of 6.5%.
| Sex | Number | Average Earnings |
| Male | 2,677 (55.4%) | $24,966 |
| Female | 2,153 (44.6%) | $23,337 |
| Total | 4,830 (100.0%) | $24,356 |
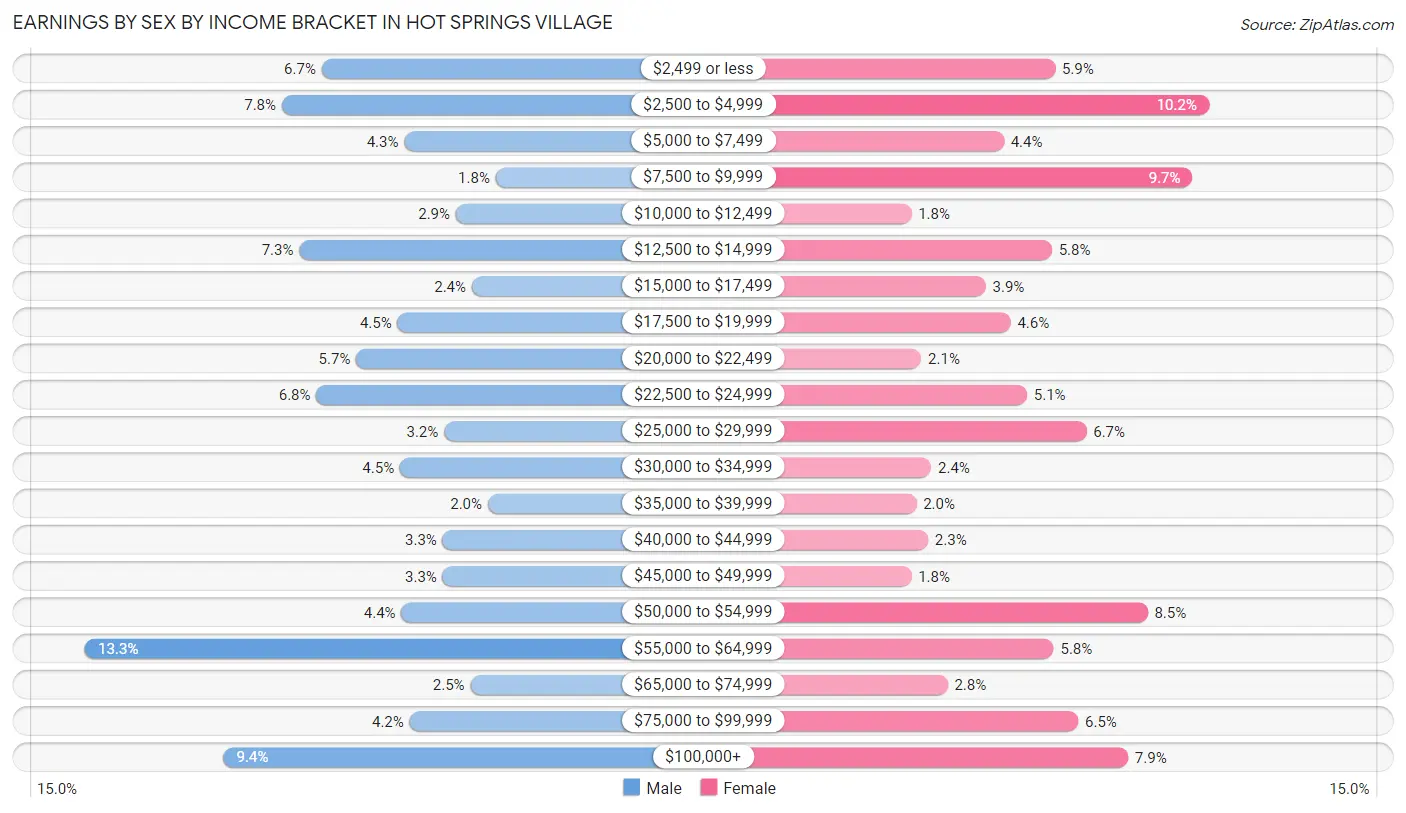
Earnings by Sex by Income Bracket in Hot Springs Village
The most common earnings brackets in Hot Springs Village are $55,000 to $64,999 for men (356 | 13.3%) and $2,500 to $4,999 for women (219 | 10.2%).
| Income | Male | Female |
| $2,499 or less | 178 (6.7%) | 126 (5.9%) |
| $2,500 to $4,999 | 208 (7.8%) | 219 (10.2%) |
| $5,000 to $7,499 | 116 (4.3%) | 95 (4.4%) |
| $7,500 to $9,999 | 47 (1.8%) | 209 (9.7%) |
| $10,000 to $12,499 | 77 (2.9%) | 39 (1.8%) |
| $12,500 to $14,999 | 195 (7.3%) | 124 (5.8%) |
| $15,000 to $17,499 | 65 (2.4%) | 84 (3.9%) |
| $17,500 to $19,999 | 121 (4.5%) | 99 (4.6%) |
| $20,000 to $22,499 | 152 (5.7%) | 45 (2.1%) |
| $22,500 to $24,999 | 182 (6.8%) | 109 (5.1%) |
| $25,000 to $29,999 | 86 (3.2%) | 145 (6.7%) |
| $30,000 to $34,999 | 119 (4.4%) | 51 (2.4%) |
| $35,000 to $39,999 | 53 (2.0%) | 42 (1.9%) |
| $40,000 to $44,999 | 87 (3.3%) | 49 (2.3%) |
| $45,000 to $49,999 | 87 (3.3%) | 39 (1.8%) |
| $50,000 to $54,999 | 118 (4.4%) | 182 (8.5%) |
| $55,000 to $64,999 | 356 (13.3%) | 125 (5.8%) |
| $65,000 to $74,999 | 66 (2.5%) | 61 (2.8%) |
| $75,000 to $99,999 | 112 (4.2%) | 140 (6.5%) |
| $100,000+ | 252 (9.4%) | 170 (7.9%) |
| Total | 2,677 (100.0%) | 2,153 (100.0%) |
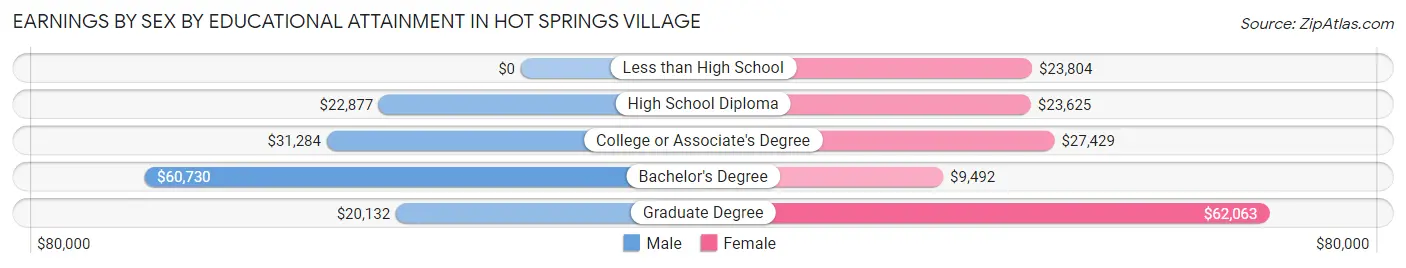
Earnings by Sex by Educational Attainment in Hot Springs Village
Average earnings in Hot Springs Village are $29,863 for men and $25,256 for women, a difference of 15.4%. Men with an educational attainment of bachelor's degree enjoy the highest average annual earnings of $60,730, while those with graduate degree education earn the least with $20,132. Women with an educational attainment of graduate degree earn the most with the average annual earnings of $62,063, while those with bachelor's degree education have the smallest earnings of $9,492.
| Educational Attainment | Male Income | Female Income |
| Less than High School | - | - |
| High School Diploma | $22,877 | $23,625 |
| College or Associate's Degree | $31,284 | $27,429 |
| Bachelor's Degree | $60,730 | $9,492 |
| Graduate Degree | $20,132 | $62,063 |
| Total | $29,863 | $25,256 |
Family Income in Hot Springs Village
Family Income Brackets in Hot Springs Village
According to the Hot Springs Village family income data, there are 1,239 families falling into the $100,000 to $149,999 income range, which is the most common income bracket and makes up 22.5% of all families. Conversely, the $10,000 to $14,999 income bracket is the least frequent group with only 55 families (1.0%) belonging to this category.
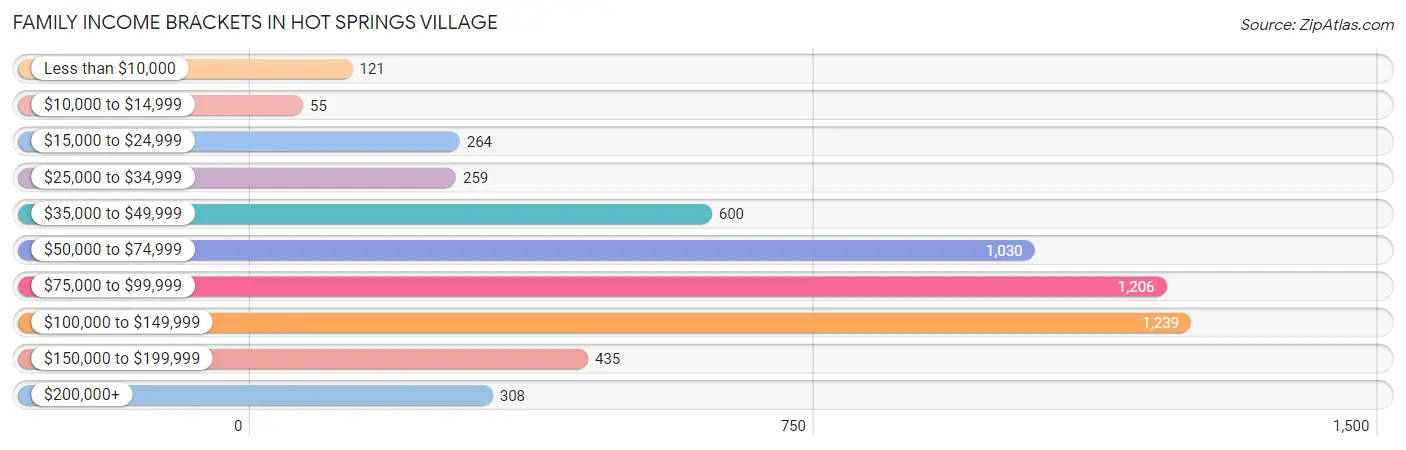
| Income Bracket | # Families | % Families |
| Less than $10,000 | 121 | 2.2% |
| $10,000 to $14,999 | 55 | 1.0% |
| $15,000 to $24,999 | 264 | 4.8% |
| $25,000 to $34,999 | 259 | 4.7% |
| $35,000 to $49,999 | 600 | 10.9% |
| $50,000 to $74,999 | 1,030 | 18.7% |
| $75,000 to $99,999 | 1,206 | 21.9% |
| $100,000 to $149,999 | 1,239 | 22.5% |
| $150,000 to $199,999 | 435 | 7.9% |
| $200,000+ | 308 | 5.6% |
Family Income by Famaliy Size in Hot Springs Village
3-person families (461 | 8.4%) account for the highest median family income in Hot Springs Village with $92,841 per family, while 2-person families (4,621 | 83.9%) have the highest median income of $41,764 per family member.
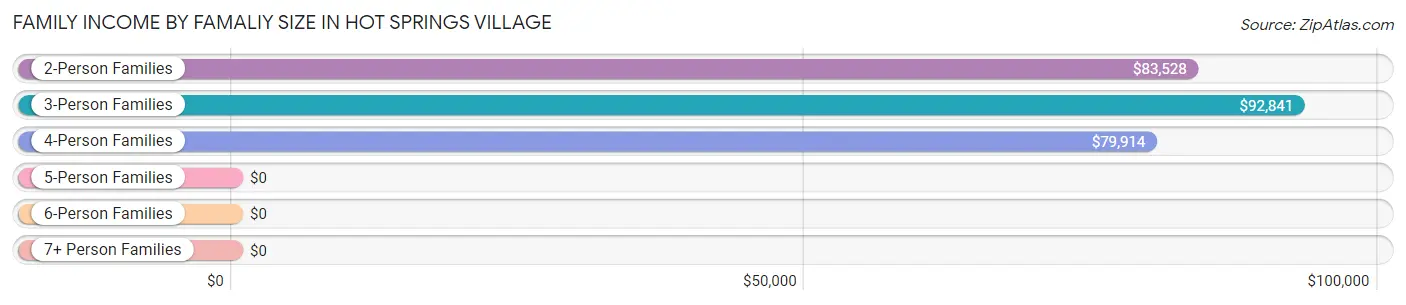
| Income Bracket | # Families | Median Income |
| 2-Person Families | 4,621 (83.9%) | $83,528 |
| 3-Person Families | 461 (8.4%) | $92,841 |
| 4-Person Families | 178 (3.2%) | $79,914 |
| 5-Person Families | 186 (3.4%) | $0 |
| 6-Person Families | 0 (0.0%) | $0 |
| 7+ Person Families | 61 (1.1%) | $0 |
| Total | 5,507 (100.0%) | $84,310 |
Family Income by Number of Earners in Hot Springs Village
The median family income in Hot Springs Village is $84,310, with families comprising 3+ earners (121) having the highest median family income of $97,454, while families with no earners (3,172) have the lowest median family income of $75,643, accounting for 2.2% and 57.6% of families, respectively.
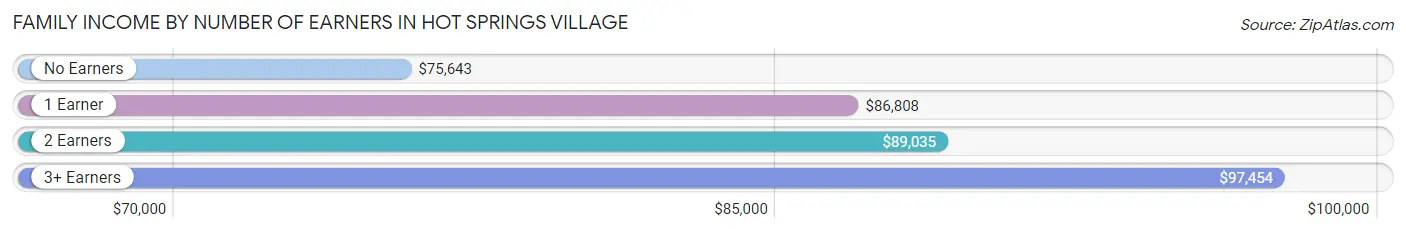
| Number of Earners | # Families | Median Income |
| No Earners | 3,172 (57.6%) | $75,643 |
| 1 Earner | 1,219 (22.1%) | $86,808 |
| 2 Earners | 995 (18.1%) | $89,035 |
| 3+ Earners | 121 (2.2%) | $97,454 |
| Total | 5,507 (100.0%) | $84,310 |
Household Income in Hot Springs Village
Household Income Brackets in Hot Springs Village
With 1,574 households falling in the category, the $50,000 to $74,999 income range is the most frequent in Hot Springs Village, accounting for 18.4% of all households. In contrast, only 231 households (2.7%) fall into the $10,000 to $14,999 income bracket, making it the least populous group.
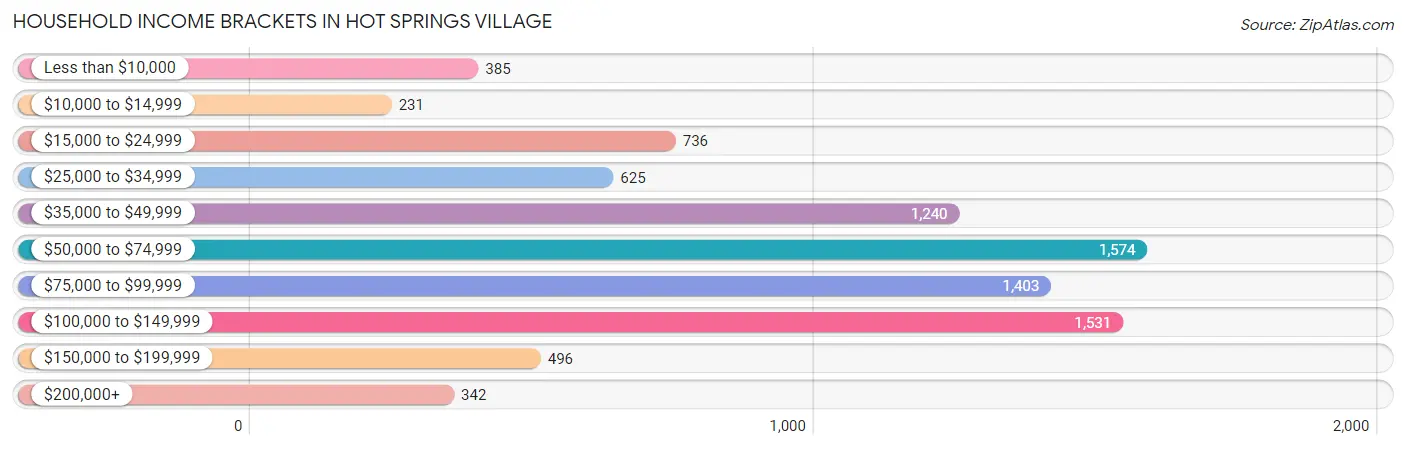
| Income Bracket | # Households | % Households |
| Less than $10,000 | 385 | 4.5% |
| $10,000 to $14,999 | 231 | 2.7% |
| $15,000 to $24,999 | 736 | 8.6% |
| $25,000 to $34,999 | 625 | 7.3% |
| $35,000 to $49,999 | 1,240 | 14.5% |
| $50,000 to $74,999 | 1,574 | 18.4% |
| $75,000 to $99,999 | 1,403 | 16.4% |
| $100,000 to $149,999 | 1,531 | 17.9% |
| $150,000 to $199,999 | 496 | 5.8% |
| $200,000+ | 342 | 4.0% |
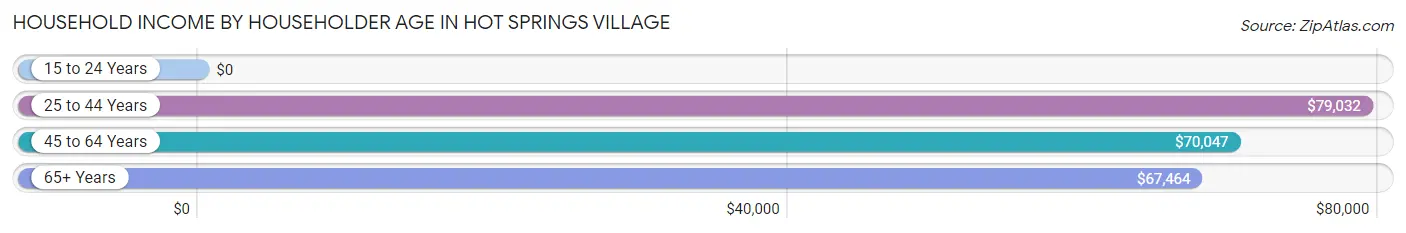
Household Income by Householder Age in Hot Springs Village
The median household income in Hot Springs Village is $68,580, with the highest median household income of $79,032 found in the 25 to 44 years age bracket for the primary householder. A total of 484 households (5.7%) fall into this category. Meanwhile, the 15 to 24 years age bracket for the primary householder has the lowest median household income of $0, with 40 households (0.5%) in this group.
| Income Bracket | # Households | Median Income |
| 15 to 24 Years | 40 (0.5%) | $0 |
| 25 to 44 Years | 484 (5.7%) | $79,032 |
| 45 to 64 Years | 1,837 (21.5%) | $70,047 |
| 65+ Years | 6,194 (72.4%) | $67,464 |
| Total | 8,555 (100.0%) | $68,580 |
Poverty in Hot Springs Village
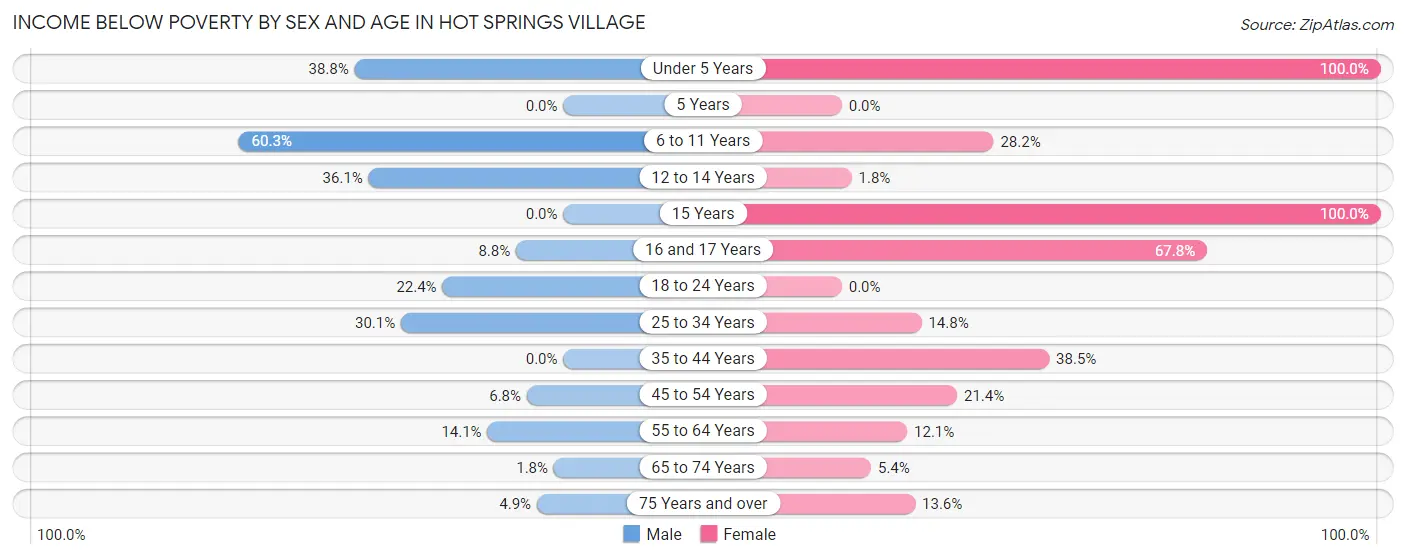
Income Below Poverty by Sex and Age in Hot Springs Village
With 8.8% poverty level for males and 14.8% for females among the residents of Hot Springs Village, 6 to 11 year old males and under 5 year old females are the most vulnerable to poverty, with 47 males (60.3%) and 66 females (100.0%) in their respective age groups living below the poverty level.
| Age Bracket | Male | Female |
| Under 5 Years | 50 (38.8%) | 66 (100.0%) |
| 5 Years | 0 (0.0%) | 0 (0.0%) |
| 6 to 11 Years | 47 (60.3%) | 49 (28.2%) |
| 12 to 14 Years | 30 (36.1%) | 2 (1.8%) |
| 15 Years | 0 (0.0%) | 9 (100.0%) |
| 16 and 17 Years | 13 (8.8%) | 183 (67.8%) |
| 18 to 24 Years | 114 (22.4%) | 0 (0.0%) |
| 25 to 34 Years | 97 (30.1%) | 46 (14.8%) |
| 35 to 44 Years | 0 (0.0%) | 107 (38.5%) |
| 45 to 54 Years | 32 (6.8%) | 193 (21.4%) |
| 55 to 64 Years | 156 (14.1%) | 136 (12.1%) |
| 65 to 74 Years | 39 (1.8%) | 154 (5.4%) |
| 75 Years and over | 129 (4.9%) | 348 (13.6%) |
| Total | 707 (8.8%) | 1,293 (14.8%) |
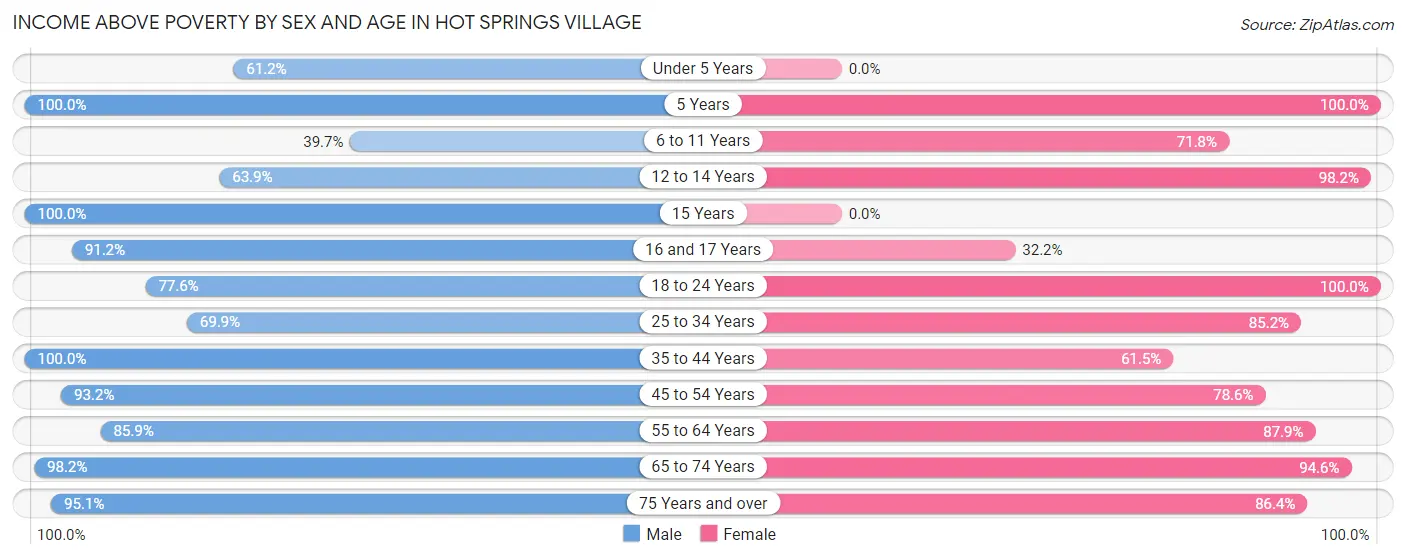
Income Above Poverty by Sex and Age in Hot Springs Village
According to the poverty statistics in Hot Springs Village, males aged 5 years and females aged 5 years are the age groups that are most secure financially, with 100.0% of males and 100.0% of females in these age groups living above the poverty line.
| Age Bracket | Male | Female |
| Under 5 Years | 79 (61.2%) | 0 (0.0%) |
| 5 Years | 9 (100.0%) | 11 (100.0%) |
| 6 to 11 Years | 31 (39.7%) | 125 (71.8%) |
| 12 to 14 Years | 53 (63.9%) | 108 (98.2%) |
| 15 Years | 7 (100.0%) | 0 (0.0%) |
| 16 and 17 Years | 135 (91.2%) | 87 (32.2%) |
| 18 to 24 Years | 394 (77.6%) | 75 (100.0%) |
| 25 to 34 Years | 225 (69.9%) | 265 (85.2%) |
| 35 to 44 Years | 320 (100.0%) | 171 (61.5%) |
| 45 to 54 Years | 441 (93.2%) | 709 (78.6%) |
| 55 to 64 Years | 951 (85.9%) | 986 (87.9%) |
| 65 to 74 Years | 2,174 (98.2%) | 2,681 (94.6%) |
| 75 Years and over | 2,496 (95.1%) | 2,209 (86.4%) |
| Total | 7,315 (91.2%) | 7,427 (85.2%) |
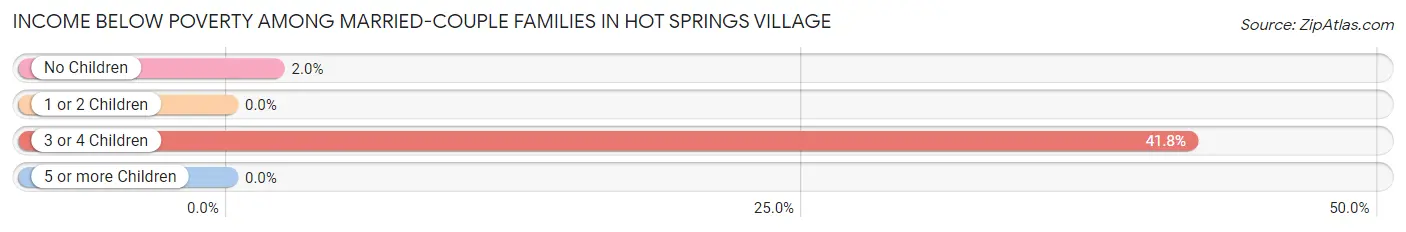
Income Below Poverty Among Married-Couple Families in Hot Springs Village
The poverty statistics for married-couple families in Hot Springs Village show that 3.2% or 160 of the total 5,023 families live below the poverty line. Families with 3 or 4 children have the highest poverty rate of 41.8%, comprising of 66 families. On the other hand, families with 1 or 2 children have the lowest poverty rate of 0.0%, which includes 0 families.
| Children | Above Poverty | Below Poverty |
| No Children | 4,528 (98.0%) | 94 (2.0%) |
| 1 or 2 Children | 243 (100.0%) | 0 (0.0%) |
| 3 or 4 Children | 92 (58.2%) | 66 (41.8%) |
| 5 or more Children | 0 (0.0%) | 0 (0.0%) |
| Total | 4,863 (96.8%) | 160 (3.2%) |
Income Below Poverty Among Single-Parent Households in Hot Springs Village
According to the poverty data in Hot Springs Village, 44.3% or 47 single-father households and 24.9% or 94 single-mother households are living below the poverty line. Among single-father households, those with 1 or 2 children have the highest poverty rate, with 47 households (85.5%) experiencing poverty. Likewise, among single-mother households, those with 1 or 2 children have the highest poverty rate, with 46 households (30.1%) falling below the poverty line.
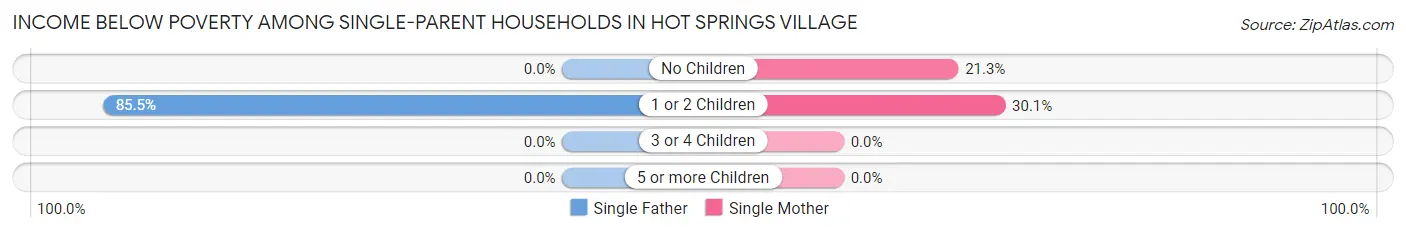
| Children | Single Father | Single Mother |
| No Children | 0 (0.0%) | 48 (21.3%) |
| 1 or 2 Children | 47 (85.5%) | 46 (30.1%) |
| 3 or 4 Children | 0 (0.0%) | 0 (0.0%) |
| 5 or more Children | 0 (0.0%) | 0 (0.0%) |
| Total | 47 (44.3%) | 94 (24.9%) |
Income Below Poverty Among Married-Couple vs Single-Parent Households in Hot Springs Village
The poverty data for Hot Springs Village shows that 160 of the married-couple family households (3.2%) and 141 of the single-parent households (29.1%) are living below the poverty level. Within the married-couple family households, those with 3 or 4 children have the highest poverty rate, with 66 households (41.8%) falling below the poverty line. Among the single-parent households, those with 1 or 2 children have the highest poverty rate, with 93 household (44.7%) living below poverty.
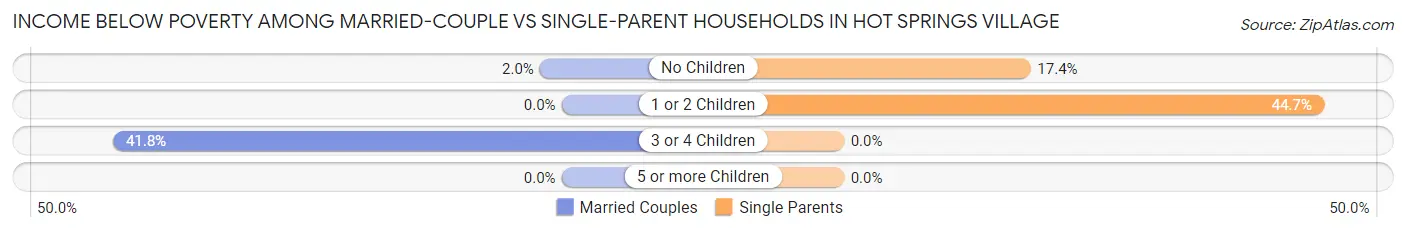
| Children | Married-Couple Families | Single-Parent Households |
| No Children | 94 (2.0%) | 48 (17.4%) |
| 1 or 2 Children | 0 (0.0%) | 93 (44.7%) |
| 3 or 4 Children | 66 (41.8%) | 0 (0.0%) |
| 5 or more Children | 0 (0.0%) | 0 (0.0%) |
| Total | 160 (3.2%) | 141 (29.1%) |
Race in Hot Springs Village
The most populous races in Hot Springs Village are White / Caucasian (15,997 | 95.0%), Two or more Races (569 | 3.4%), and Hispanic or Latino (197 | 1.2%).
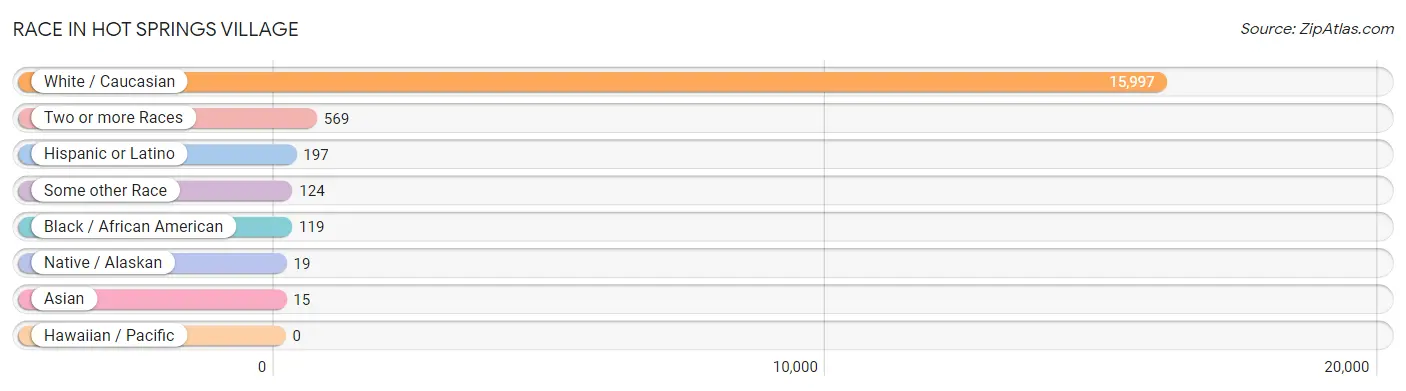
| Race | # Population | % Population |
| Asian | 15 | 0.1% |
| Black / African American | 119 | 0.7% |
| Hawaiian / Pacific | 0 | 0.0% |
| Hispanic or Latino | 197 | 1.2% |
| Native / Alaskan | 19 | 0.1% |
| White / Caucasian | 15,997 | 95.0% |
| Two or more Races | 569 | 3.4% |
| Some other Race | 124 | 0.7% |
| Total | 16,843 | 100.0% |
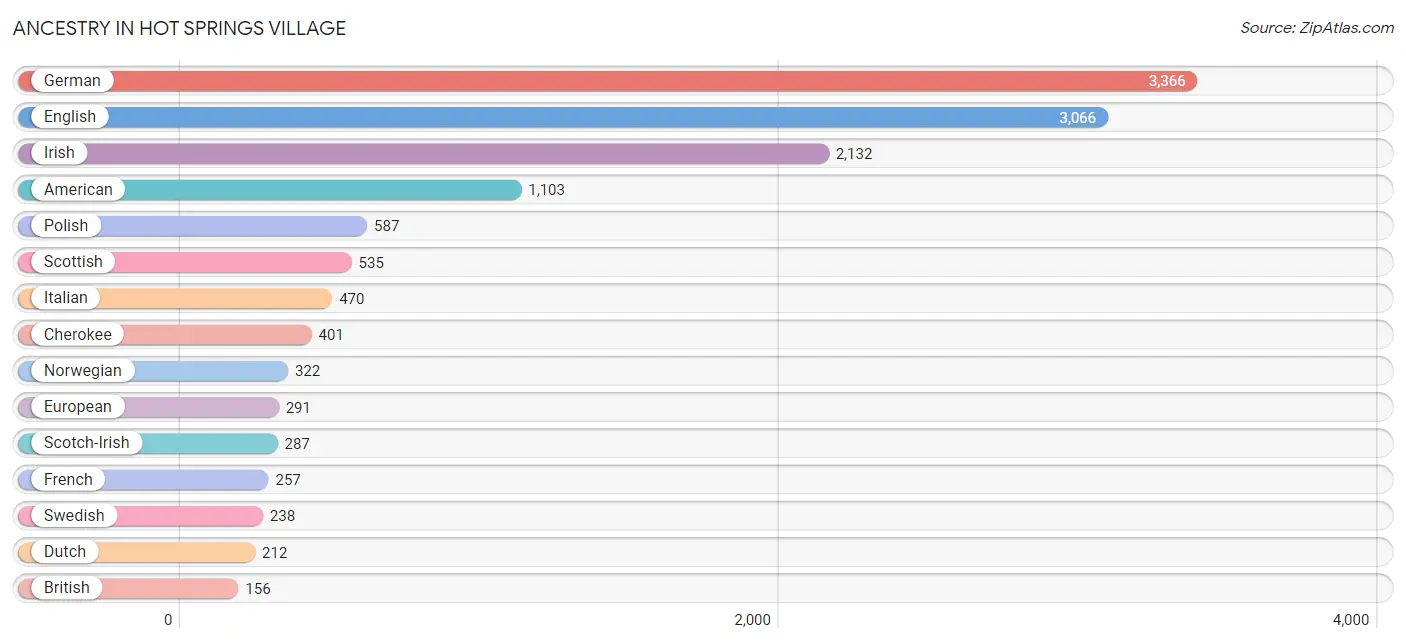
Ancestry in Hot Springs Village
The most populous ancestries reported in Hot Springs Village are German (3,366 | 20.0%), English (3,066 | 18.2%), Irish (2,132 | 12.7%), American (1,103 | 6.6%), and Polish (587 | 3.5%), together accounting for 60.9% of all Hot Springs Village residents.
| Ancestry | # Population | % Population |
| African | 1 | 0.0% |
| American | 1,103 | 6.6% |
| Arab | 16 | 0.1% |
| Australian | 17 | 0.1% |
| Belgian | 30 | 0.2% |
| Bhutanese | 24 | 0.1% |
| Bolivian | 9 | 0.1% |
| British | 156 | 0.9% |
| Cajun | 19 | 0.1% |
| Canadian | 26 | 0.2% |
| Celtic | 30 | 0.2% |
| Central American | 7 | 0.0% |
| Cherokee | 401 | 2.4% |
| Creek | 4 | 0.0% |
| Croatian | 42 | 0.3% |
| Cuban | 16 | 0.1% |
| Czech | 114 | 0.7% |
| Czechoslovakian | 33 | 0.2% |
| Danish | 140 | 0.8% |
| Dutch | 212 | 1.3% |
| Dutch West Indian | 29 | 0.2% |
| Eastern European | 10 | 0.1% |
| English | 3,066 | 18.2% |
| European | 291 | 1.7% |
| Finnish | 28 | 0.2% |
| French | 257 | 1.5% |
| French Canadian | 36 | 0.2% |
| German | 3,366 | 20.0% |
| Greek | 106 | 0.6% |
| Guatemalan | 7 | 0.0% |
| Hungarian | 46 | 0.3% |
| Indian (Asian) | 10 | 0.1% |
| Irish | 2,132 | 12.7% |
| Italian | 470 | 2.8% |
| Jamaican | 8 | 0.1% |
| Lebanese | 16 | 0.1% |
| Lithuanian | 66 | 0.4% |
| Mexican | 93 | 0.5% |
| Nigerian | 12 | 0.1% |
| Norwegian | 322 | 1.9% |
| Pennsylvania German | 25 | 0.2% |
| Polish | 587 | 3.5% |
| Portuguese | 77 | 0.5% |
| Puerto Rican | 23 | 0.1% |
| Romanian | 16 | 0.1% |
| Russian | 16 | 0.1% |
| Scandinavian | 94 | 0.6% |
| Scotch-Irish | 287 | 1.7% |
| Scottish | 535 | 3.2% |
| Slovak | 71 | 0.4% |
| Slovene | 8 | 0.1% |
| South African | 12 | 0.1% |
| South American | 9 | 0.1% |
| Spaniard | 39 | 0.2% |
| Sri Lankan | 5 | 0.0% |
| Subsaharan African | 25 | 0.2% |
| Swedish | 238 | 1.4% |
| Swiss | 53 | 0.3% |
| Welsh | 155 | 0.9% | View All 59 Rows |
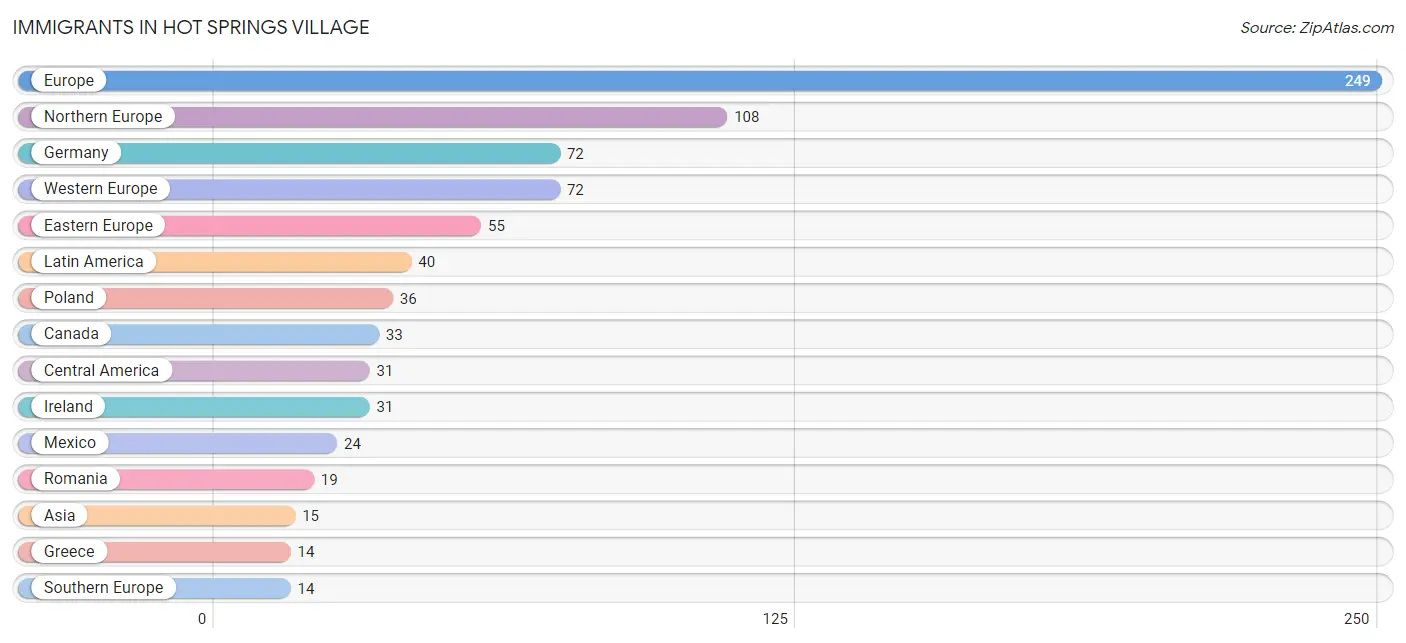
Immigrants in Hot Springs Village
The most numerous immigrant groups reported in Hot Springs Village came from Europe (249 | 1.5%), Northern Europe (108 | 0.6%), Germany (72 | 0.4%), Western Europe (72 | 0.4%), and Eastern Europe (55 | 0.3%), together accounting for 3.3% of all Hot Springs Village residents.
| Immigration Origin | # Population | % Population |
| Africa | 12 | 0.1% |
| Asia | 15 | 0.1% |
| Bolivia | 9 | 0.1% |
| Canada | 33 | 0.2% |
| Central America | 31 | 0.2% |
| China | 10 | 0.1% |
| Eastern Asia | 10 | 0.1% |
| Eastern Europe | 55 | 0.3% |
| England | 11 | 0.1% |
| Europe | 249 | 1.5% |
| Germany | 72 | 0.4% |
| Greece | 14 | 0.1% |
| Guatemala | 7 | 0.0% |
| Ireland | 31 | 0.2% |
| Latin America | 40 | 0.2% |
| Mexico | 24 | 0.1% |
| Northern Europe | 108 | 0.6% |
| Poland | 36 | 0.2% |
| Romania | 19 | 0.1% |
| Scotland | 10 | 0.1% |
| South Africa | 12 | 0.1% |
| South America | 9 | 0.1% |
| South Eastern Asia | 5 | 0.0% |
| Southern Europe | 14 | 0.1% |
| Sweden | 10 | 0.1% |
| Vietnam | 5 | 0.0% |
| Western Europe | 72 | 0.4% | View All 27 Rows |
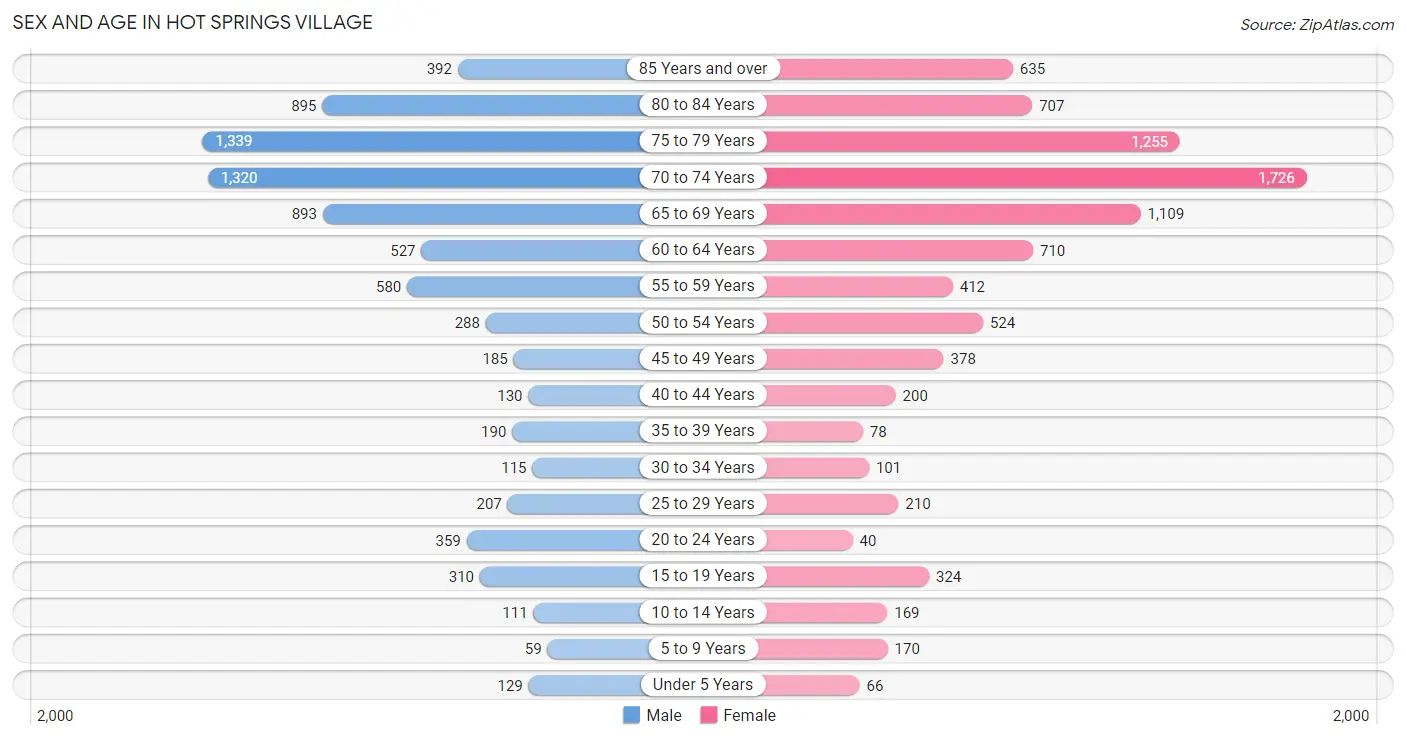
Sex and Age in Hot Springs Village
Sex and Age in Hot Springs Village
The most populous age groups in Hot Springs Village are 75 to 79 Years (1,339 | 16.7%) for men and 70 to 74 Years (1,726 | 19.6%) for women.
| Age Bracket | Male | Female |
| Under 5 Years | 129 (1.6%) | 66 (0.7%) |
| 5 to 9 Years | 59 (0.7%) | 170 (1.9%) |
| 10 to 14 Years | 111 (1.4%) | 169 (1.9%) |
| 15 to 19 Years | 310 (3.9%) | 324 (3.7%) |
| 20 to 24 Years | 359 (4.5%) | 40 (0.4%) |
| 25 to 29 Years | 207 (2.6%) | 210 (2.4%) |
| 30 to 34 Years | 115 (1.4%) | 101 (1.1%) |
| 35 to 39 Years | 190 (2.4%) | 78 (0.9%) |
| 40 to 44 Years | 130 (1.6%) | 200 (2.3%) |
| 45 to 49 Years | 185 (2.3%) | 378 (4.3%) |
| 50 to 54 Years | 288 (3.6%) | 524 (5.9%) |
| 55 to 59 Years | 580 (7.2%) | 412 (4.7%) |
| 60 to 64 Years | 527 (6.6%) | 710 (8.1%) |
| 65 to 69 Years | 893 (11.1%) | 1,109 (12.6%) |
| 70 to 74 Years | 1,320 (16.4%) | 1,726 (19.6%) |
| 75 to 79 Years | 1,339 (16.7%) | 1,255 (14.2%) |
| 80 to 84 Years | 895 (11.2%) | 707 (8.0%) |
| 85 Years and over | 392 (4.9%) | 635 (7.2%) |
| Total | 8,029 (100.0%) | 8,814 (100.0%) |
Families and Households in Hot Springs Village
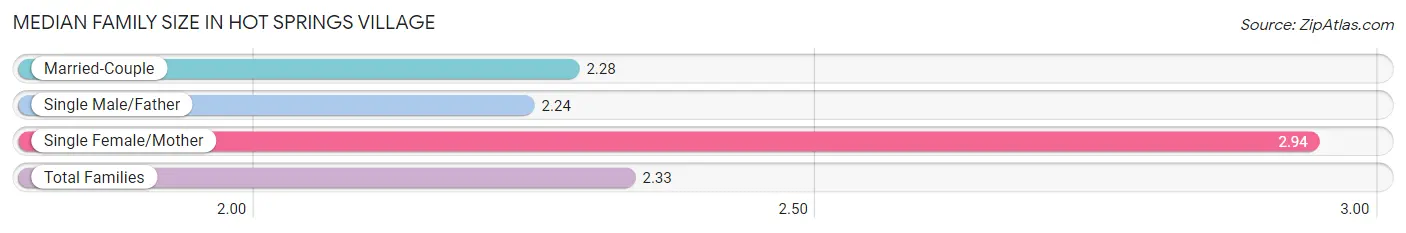
Median Family Size in Hot Springs Village
The median family size in Hot Springs Village is 2.33 persons per family, with single female/mother families (378 | 6.9%) accounting for the largest median family size of 2.94 persons per family. On the other hand, single male/father families (106 | 1.9%) represent the smallest median family size with 2.24 persons per family.
| Family Type | # Families | Family Size |
| Married-Couple | 5,023 (91.2%) | 2.28 |
| Single Male/Father | 106 (1.9%) | 2.24 |
| Single Female/Mother | 378 (6.9%) | 2.94 |
| Total Families | 5,507 (100.0%) | 2.33 |
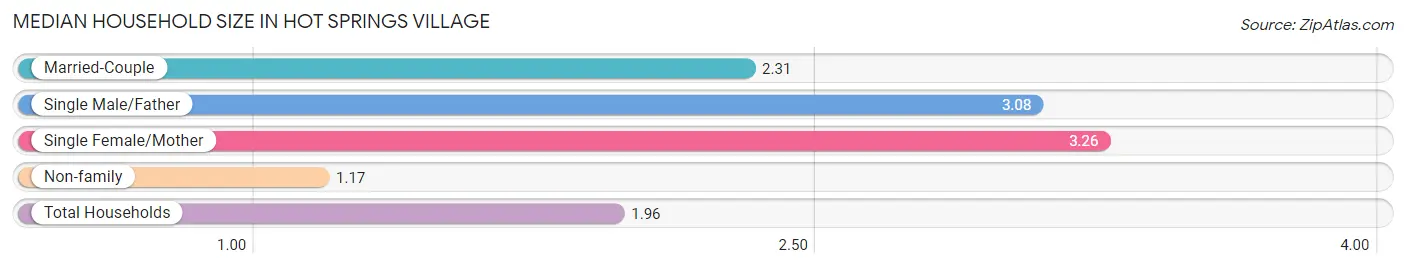
Median Household Size in Hot Springs Village
The median household size in Hot Springs Village is 1.96 persons per household, with single female/mother households (378 | 4.4%) accounting for the largest median household size of 3.26 persons per household. non-family households (3,048 | 35.6%) represent the smallest median household size with 1.17 persons per household.
| Household Type | # Households | Household Size |
| Married-Couple | 5,023 (58.7%) | 2.31 |
| Single Male/Father | 106 (1.2%) | 3.08 |
| Single Female/Mother | 378 (4.4%) | 3.26 |
| Non-family | 3,048 (35.6%) | 1.17 |
| Total Households | 8,555 (100.0%) | 1.96 |
Household Size by Marriage Status in Hot Springs Village
Out of a total of 8,555 households in Hot Springs Village, 5,507 (64.4%) are family households, while 3,048 (35.6%) are nonfamily households. The most numerous type of family households are 2-person households, comprising 4,523, and the most common type of nonfamily households are 1-person households, comprising 2,607.
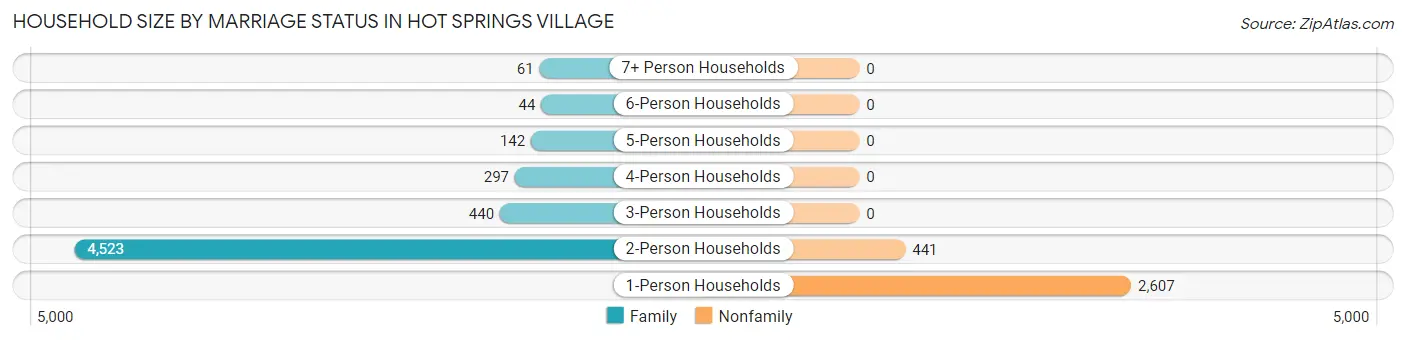
| Household Size | Family Households | Nonfamily Households |
| 1-Person Households | - | 2,607 (30.5%) |
| 2-Person Households | 4,523 (52.9%) | 441 (5.1%) |
| 3-Person Households | 440 (5.1%) | 0 (0.0%) |
| 4-Person Households | 297 (3.5%) | 0 (0.0%) |
| 5-Person Households | 142 (1.7%) | 0 (0.0%) |
| 6-Person Households | 44 (0.5%) | 0 (0.0%) |
| 7+ Person Households | 61 (0.7%) | 0 (0.0%) |
| Total | 5,507 (64.4%) | 3,048 (35.6%) |
Female Fertility in Hot Springs Village
Fertility by Age in Hot Springs Village
Average fertility rate in Hot Springs Village is 12.0 births per 1,000 women. Women in the age bracket of 20 to 34 years have the highest fertility rate with 26.0 births per 1,000 women. Women in the age bracket of 20 to 34 years acount for 50.0% of all women with births.
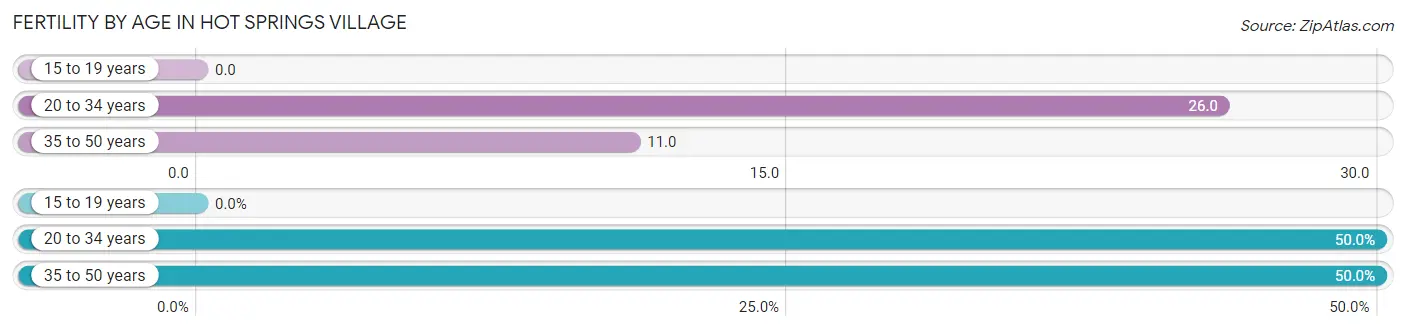
| Age Bracket | Women with Births | Births / 1,000 Women |
| 15 to 19 years | 0 (0.0%) | 0.0 |
| 20 to 34 years | 9 (50.0%) | 26.0 |
| 35 to 50 years | 9 (50.0%) | 11.0 |
| Total | 18 (100.0%) | 12.0 |
Fertility by Age by Marriage Status in Hot Springs Village
50.0% of women with births (18) in Hot Springs Village are married. The highest percentage of unmarried women with births falls into 35 to 50 years age bracket with 100.0% of them unmarried at the time of birth, while the lowest percentage of unmarried women with births belong to 20 to 34 years age bracket with 0.0% of them unmarried.
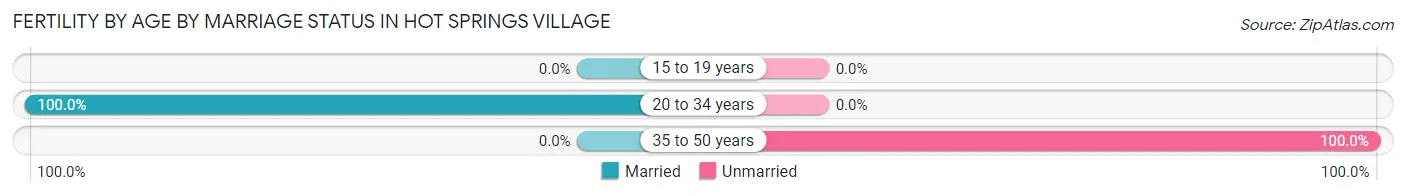
| Age Bracket | Married | Unmarried |
| 15 to 19 years | 0 (0.0%) | 0 (0.0%) |
| 20 to 34 years | 9 (100.0%) | 0 (0.0%) |
| 35 to 50 years | 0 (0.0%) | 9 (100.0%) |
| Total | 9 (50.0%) | 9 (50.0%) |
Fertility by Education in Hot Springs Village
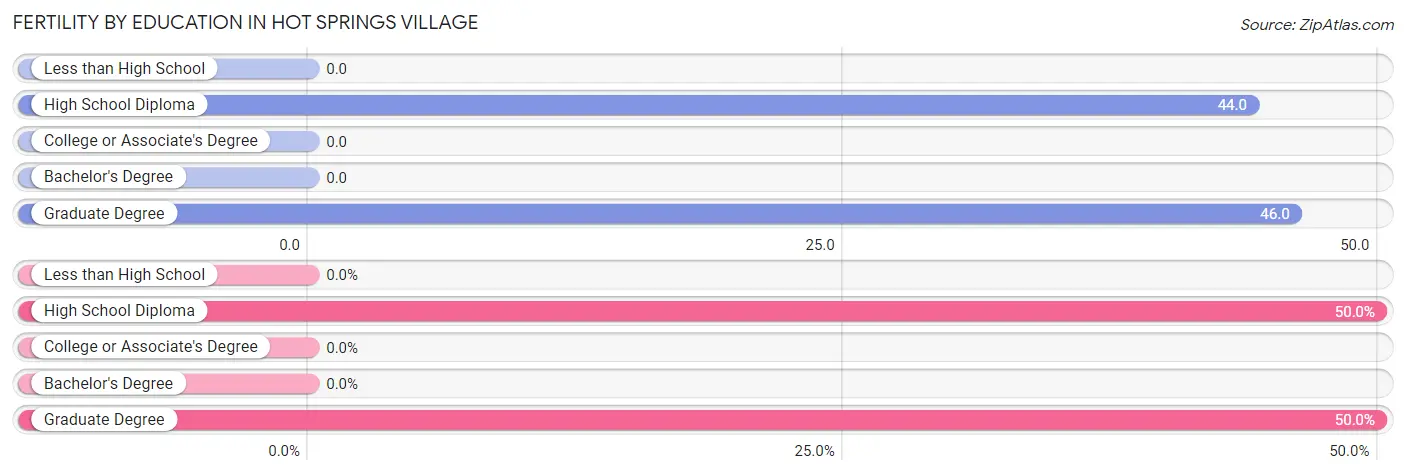
| Educational Attainment | Women with Births | Births / 1,000 Women |
| Less than High School | 0 (0.0%) | 0.0 |
| High School Diploma | 9 (50.0%) | 44.0 |
| College or Associate's Degree | 0 (0.0%) | 0.0 |
| Bachelor's Degree | 0 (0.0%) | 0.0 |
| Graduate Degree | 9 (50.0%) | 46.0 |
| Total | 18 (100.0%) | 12.0 |
Fertility by Education by Marriage Status in Hot Springs Village
50.0% of women with births in Hot Springs Village are unmarried. Women with the educational attainment of graduate degree are most likely to be married with 100.0% of them married at childbirth, while women with the educational attainment of high school diploma are least likely to be married with 100.0% of them unmarried at childbirth.
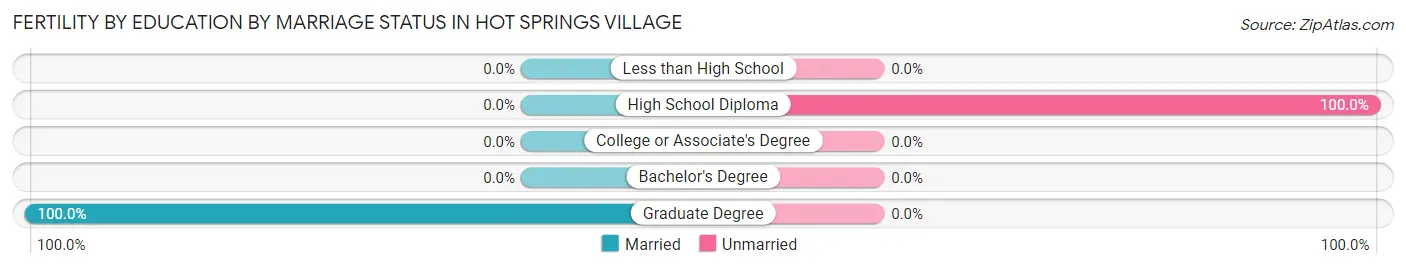
| Educational Attainment | Married | Unmarried |
| Less than High School | 0 (0.0%) | 0 (0.0%) |
| High School Diploma | 0 (0.0%) | 9 (100.0%) |
| College or Associate's Degree | 0 (0.0%) | 0 (0.0%) |
| Bachelor's Degree | 0 (0.0%) | 0 (0.0%) |
| Graduate Degree | 9 (100.0%) | 0 (0.0%) |
| Total | 9 (50.0%) | 9 (50.0%) |
Employment Characteristics in Hot Springs Village
Employment by Class of Employer in Hot Springs Village
Among the 4,036 employed individuals in Hot Springs Village, private company employees (2,650 | 65.7%), not-for-profit organizations (459 | 11.4%), and self-employed (not incorporated) (273 | 6.8%) make up the most common classes of employment.
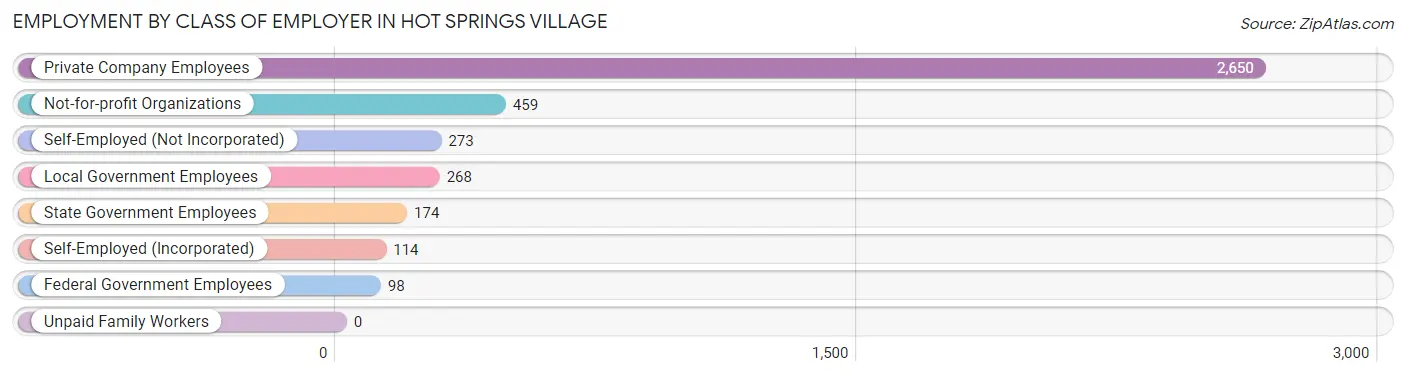
| Employer Class | # Employees | % Employees |
| Private Company Employees | 2,650 | 65.7% |
| Self-Employed (Incorporated) | 114 | 2.8% |
| Self-Employed (Not Incorporated) | 273 | 6.8% |
| Not-for-profit Organizations | 459 | 11.4% |
| Local Government Employees | 268 | 6.6% |
| State Government Employees | 174 | 4.3% |
| Federal Government Employees | 98 | 2.4% |
| Unpaid Family Workers | 0 | 0.0% |
| Total | 4,036 | 100.0% |
Employment Status by Age in Hot Springs Village
According to the labor force statistics for Hot Springs Village, out of the total population over 16 years of age (16,123), 27.2% or 4,385 individuals are in the labor force, with 4.7% or 206 of them unemployed. The age group with the highest labor force participation rate is 20 to 24 years, with 98.7% or 394 individuals in the labor force. Within the labor force, the 30 to 34 years age range has the highest percentage of unemployed individuals, with 36.8% or 67 of them being unemployed.
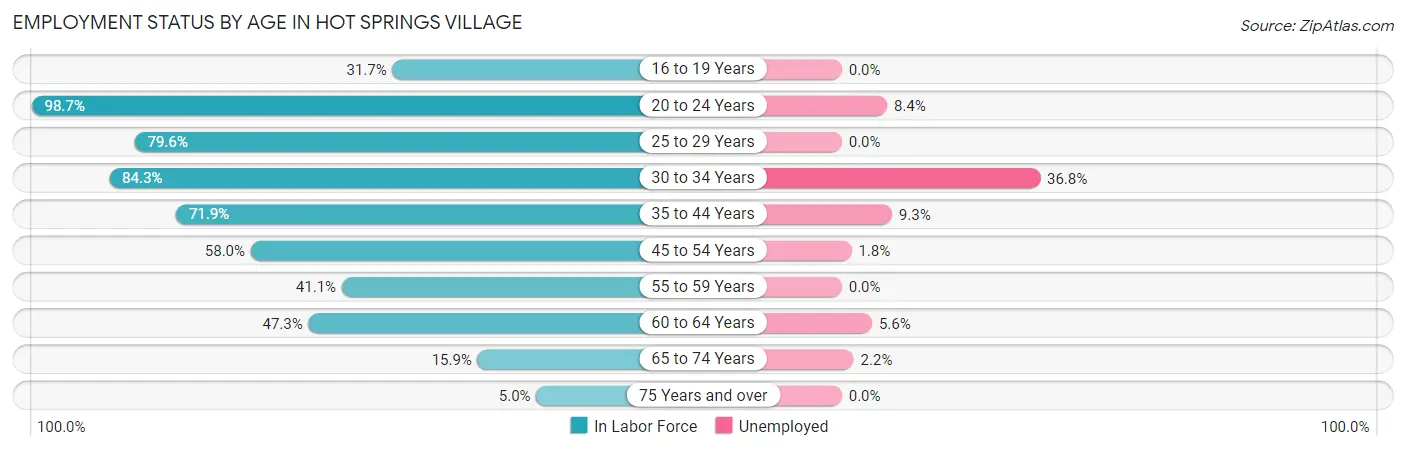
| Age Bracket | In Labor Force | Unemployed |
| 16 to 19 Years | 196 (31.7%) | 0 (0.0%) |
| 20 to 24 Years | 394 (98.7%) | 33 (8.4%) |
| 25 to 29 Years | 332 (79.6%) | 0 (0.0%) |
| 30 to 34 Years | 182 (84.3%) | 67 (36.8%) |
| 35 to 44 Years | 430 (71.9%) | 40 (9.3%) |
| 45 to 54 Years | 798 (58.0%) | 14 (1.8%) |
| 55 to 59 Years | 408 (41.1%) | 0 (0.0%) |
| 60 to 64 Years | 585 (47.3%) | 33 (5.6%) |
| 65 to 74 Years | 803 (15.9%) | 18 (2.2%) |
| 75 Years and over | 261 (5.0%) | 0 (0.0%) |
| Total | 4,385 (27.2%) | 206 (4.7%) |
Employment Status by Educational Attainment in Hot Springs Village
According to labor force statistics for Hot Springs Village, 56.5% of individuals (2,732) out of the total population between 25 and 64 years of age (4,835) are in the labor force, with 5.6% or 153 of them being unemployed. The group with the highest labor force participation rate are those with the educational attainment of less than high school, with 82.4% or 122 individuals in the labor force. Within the labor force, individuals with college / associate degree education have the highest percentage of unemployment, with 8.2% or 92 of them being unemployed.
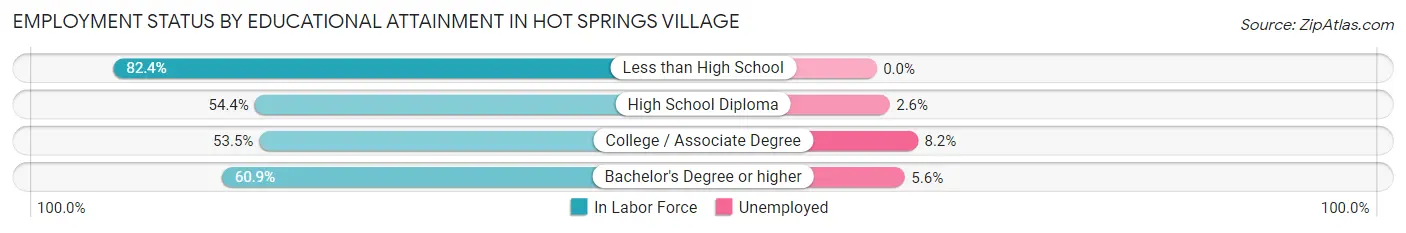
| Educational Attainment | In Labor Force | Unemployed |
| Less than High School | 122 (82.4%) | 0 (0.0%) |
| High School Diploma | 724 (54.4%) | 35 (2.6%) |
| College / Associate Degree | 1,118 (53.5%) | 171 (8.2%) |
| Bachelor's Degree or higher | 772 (60.9%) | 71 (5.6%) |
| Total | 2,732 (56.5%) | 271 (5.6%) |
Employment Occupations by Sex in Hot Springs Village
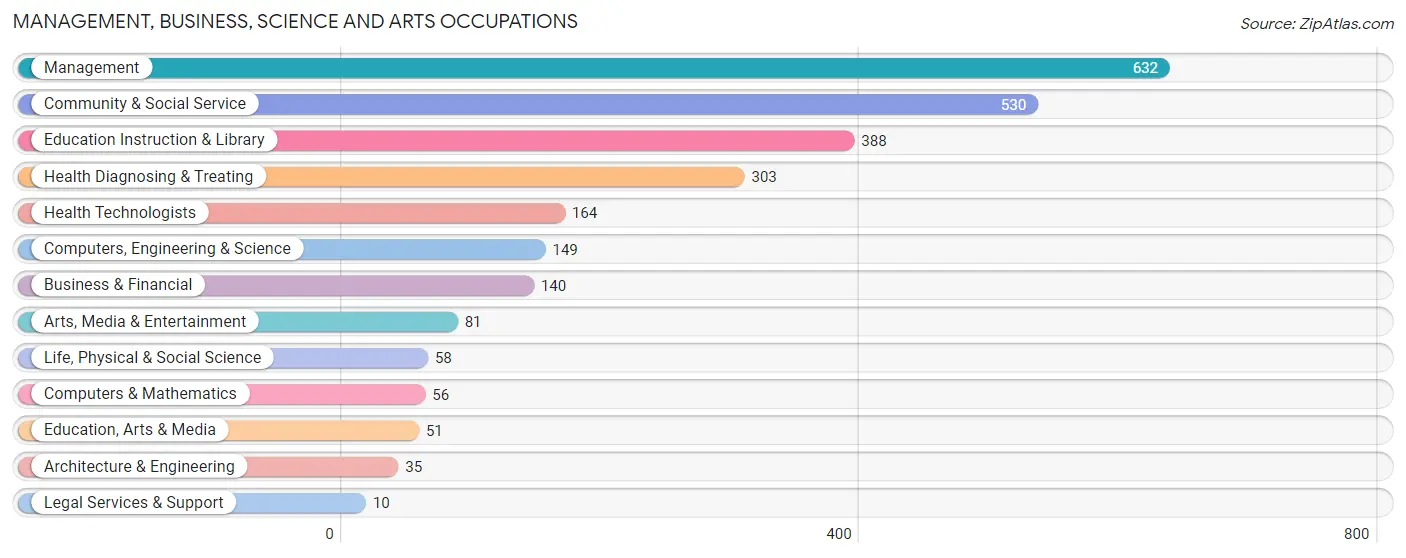
Management, Business, Science and Arts Occupations
The most common Management, Business, Science and Arts occupations in Hot Springs Village are Management (632 | 15.1%), Community & Social Service (530 | 12.7%), Education Instruction & Library (388 | 9.3%), Health Diagnosing & Treating (303 | 7.2%), and Health Technologists (164 | 3.9%).
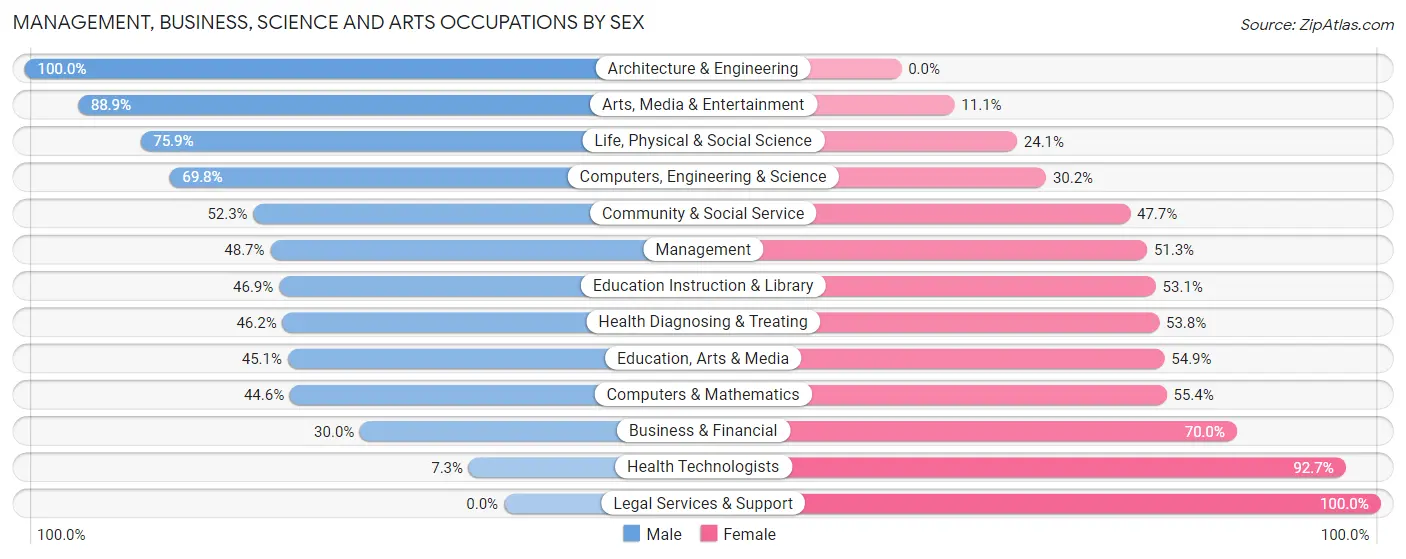
Management, Business, Science and Arts Occupations by Sex
Within the Management, Business, Science and Arts occupations in Hot Springs Village, the most male-oriented occupations are Architecture & Engineering (100.0%), Arts, Media & Entertainment (88.9%), and Life, Physical & Social Science (75.9%), while the most female-oriented occupations are Legal Services & Support (100.0%), Health Technologists (92.7%), and Business & Financial (70.0%).
| Occupation | Male | Female |
| Management | 308 (48.7%) | 324 (51.3%) |
| Business & Financial | 42 (30.0%) | 98 (70.0%) |
| Computers, Engineering & Science | 104 (69.8%) | 45 (30.2%) |
| Computers & Mathematics | 25 (44.6%) | 31 (55.4%) |
| Architecture & Engineering | 35 (100.0%) | 0 (0.0%) |
| Life, Physical & Social Science | 44 (75.9%) | 14 (24.1%) |
| Community & Social Service | 277 (52.3%) | 253 (47.7%) |
| Education, Arts & Media | 23 (45.1%) | 28 (54.9%) |
| Legal Services & Support | 0 (0.0%) | 10 (100.0%) |
| Education Instruction & Library | 182 (46.9%) | 206 (53.1%) |
| Arts, Media & Entertainment | 72 (88.9%) | 9 (11.1%) |
| Health Diagnosing & Treating | 140 (46.2%) | 163 (53.8%) |
| Health Technologists | 12 (7.3%) | 152 (92.7%) |
| Total (Category) | 871 (49.7%) | 883 (50.3%) |
| Total (Overall) | 2,404 (57.5%) | 1,780 (42.5%) |
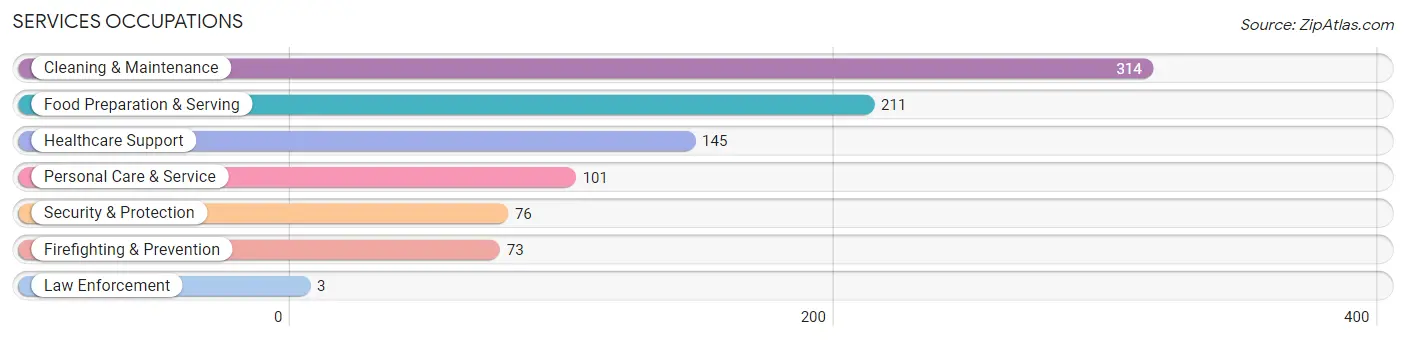
Services Occupations
The most common Services occupations in Hot Springs Village are Cleaning & Maintenance (314 | 7.5%), Food Preparation & Serving (211 | 5.0%), Healthcare Support (145 | 3.5%), Personal Care & Service (101 | 2.4%), and Security & Protection (76 | 1.8%).
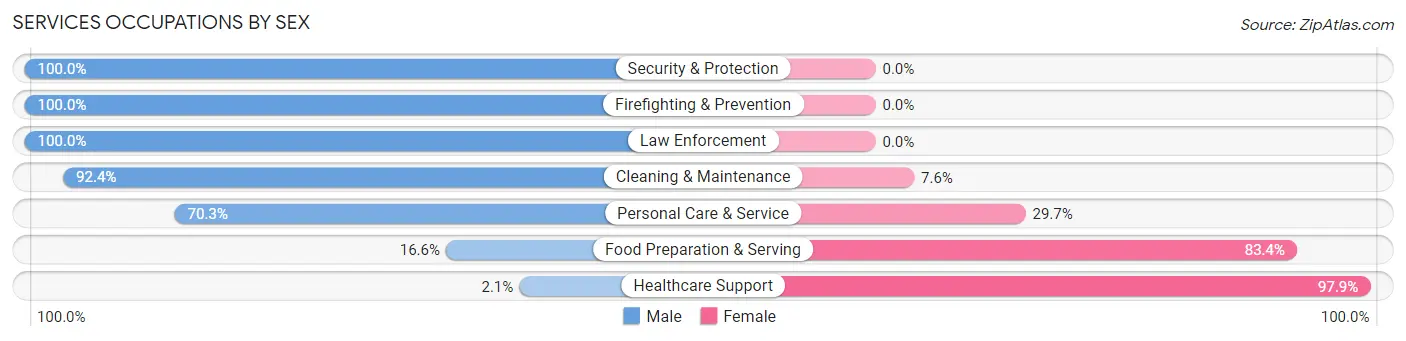
Services Occupations by Sex
Within the Services occupations in Hot Springs Village, the most male-oriented occupations are Security & Protection (100.0%), Firefighting & Prevention (100.0%), and Law Enforcement (100.0%), while the most female-oriented occupations are Healthcare Support (97.9%), Food Preparation & Serving (83.4%), and Personal Care & Service (29.7%).
| Occupation | Male | Female |
| Healthcare Support | 3 (2.1%) | 142 (97.9%) |
| Security & Protection | 76 (100.0%) | 0 (0.0%) |
| Firefighting & Prevention | 73 (100.0%) | 0 (0.0%) |
| Law Enforcement | 3 (100.0%) | 0 (0.0%) |
| Food Preparation & Serving | 35 (16.6%) | 176 (83.4%) |
| Cleaning & Maintenance | 290 (92.4%) | 24 (7.6%) |
| Personal Care & Service | 71 (70.3%) | 30 (29.7%) |
| Total (Category) | 475 (56.1%) | 372 (43.9%) |
| Total (Overall) | 2,404 (57.5%) | 1,780 (42.5%) |
Sales and Office Occupations
The most common Sales and Office occupations in Hot Springs Village are Sales & Related (595 | 14.2%), and Office & Administration (398 | 9.5%).
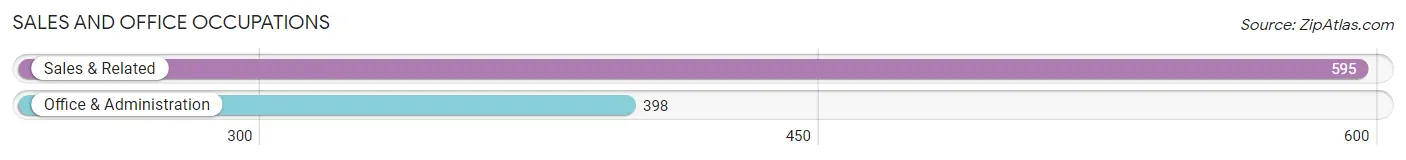
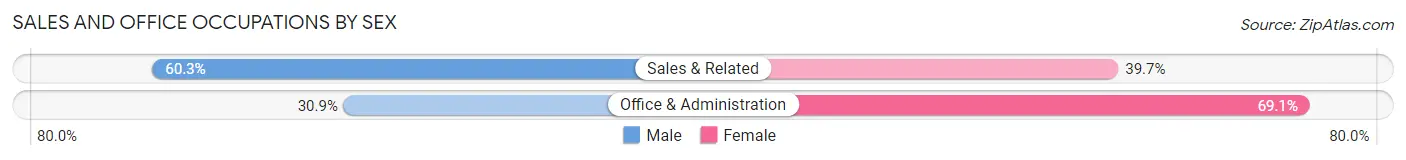
Sales and Office Occupations by Sex
| Occupation | Male | Female |
| Sales & Related | 359 (60.3%) | 236 (39.7%) |
| Office & Administration | 123 (30.9%) | 275 (69.1%) |
| Total (Category) | 482 (48.5%) | 511 (51.5%) |
| Total (Overall) | 2,404 (57.5%) | 1,780 (42.5%) |
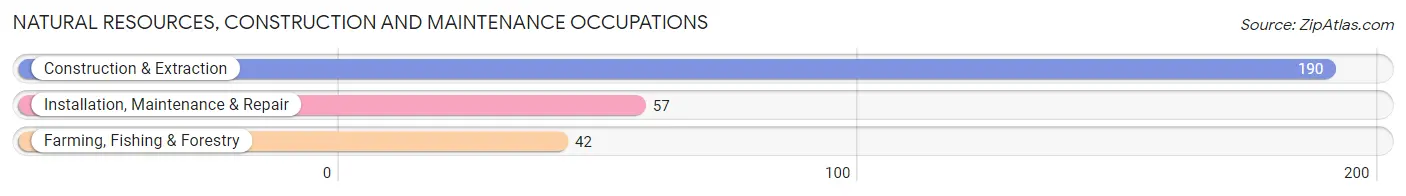
Natural Resources, Construction and Maintenance Occupations
The most common Natural Resources, Construction and Maintenance occupations in Hot Springs Village are Construction & Extraction (190 | 4.5%), Installation, Maintenance & Repair (57 | 1.4%), and Farming, Fishing & Forestry (42 | 1.0%).
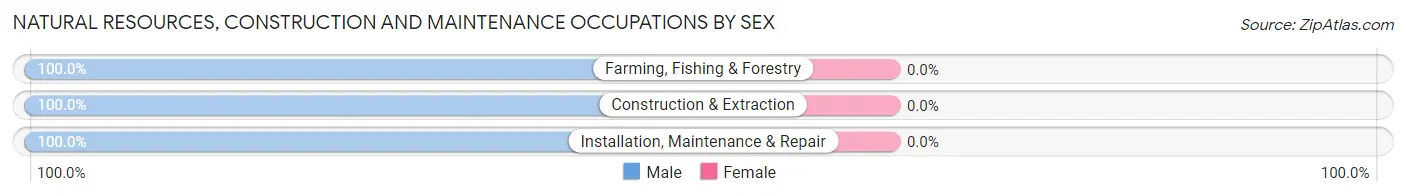
Natural Resources, Construction and Maintenance Occupations by Sex
| Occupation | Male | Female |
| Farming, Fishing & Forestry | 42 (100.0%) | 0 (0.0%) |
| Construction & Extraction | 190 (100.0%) | 0 (0.0%) |
| Installation, Maintenance & Repair | 57 (100.0%) | 0 (0.0%) |
| Total (Category) | 289 (100.0%) | 0 (0.0%) |
| Total (Overall) | 2,404 (57.5%) | 1,780 (42.5%) |
Production, Transportation and Moving Occupations
The most common Production, Transportation and Moving occupations in Hot Springs Village are Transportation (129 | 3.1%), Production (102 | 2.4%), and Material Moving (70 | 1.7%).
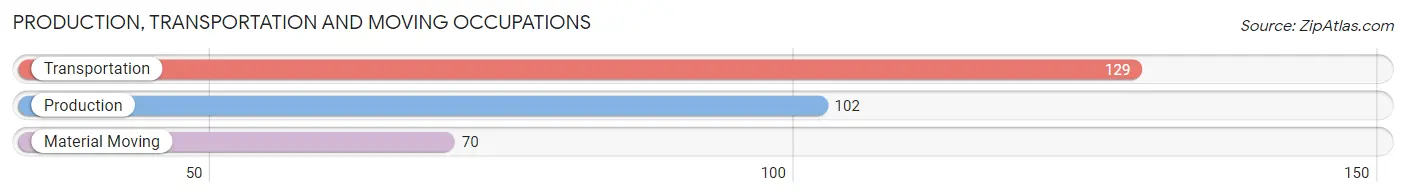
Production, Transportation and Moving Occupations by Sex
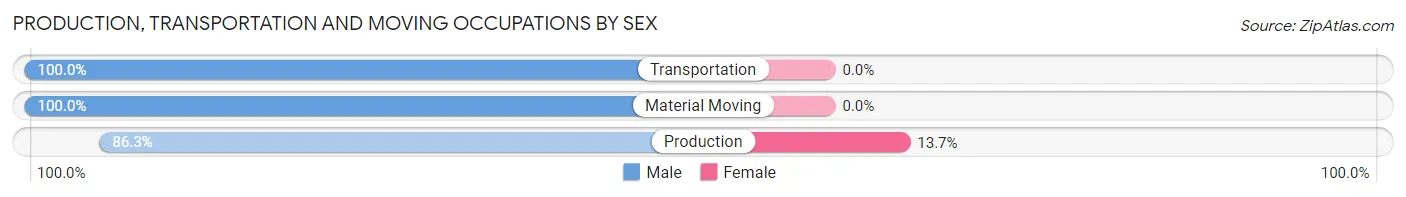
| Occupation | Male | Female |
| Production | 88 (86.3%) | 14 (13.7%) |
| Transportation | 129 (100.0%) | 0 (0.0%) |
| Material Moving | 70 (100.0%) | 0 (0.0%) |
| Total (Category) | 287 (95.4%) | 14 (4.6%) |
| Total (Overall) | 2,404 (57.5%) | 1,780 (42.5%) |
Employment Industries by Sex in Hot Springs Village
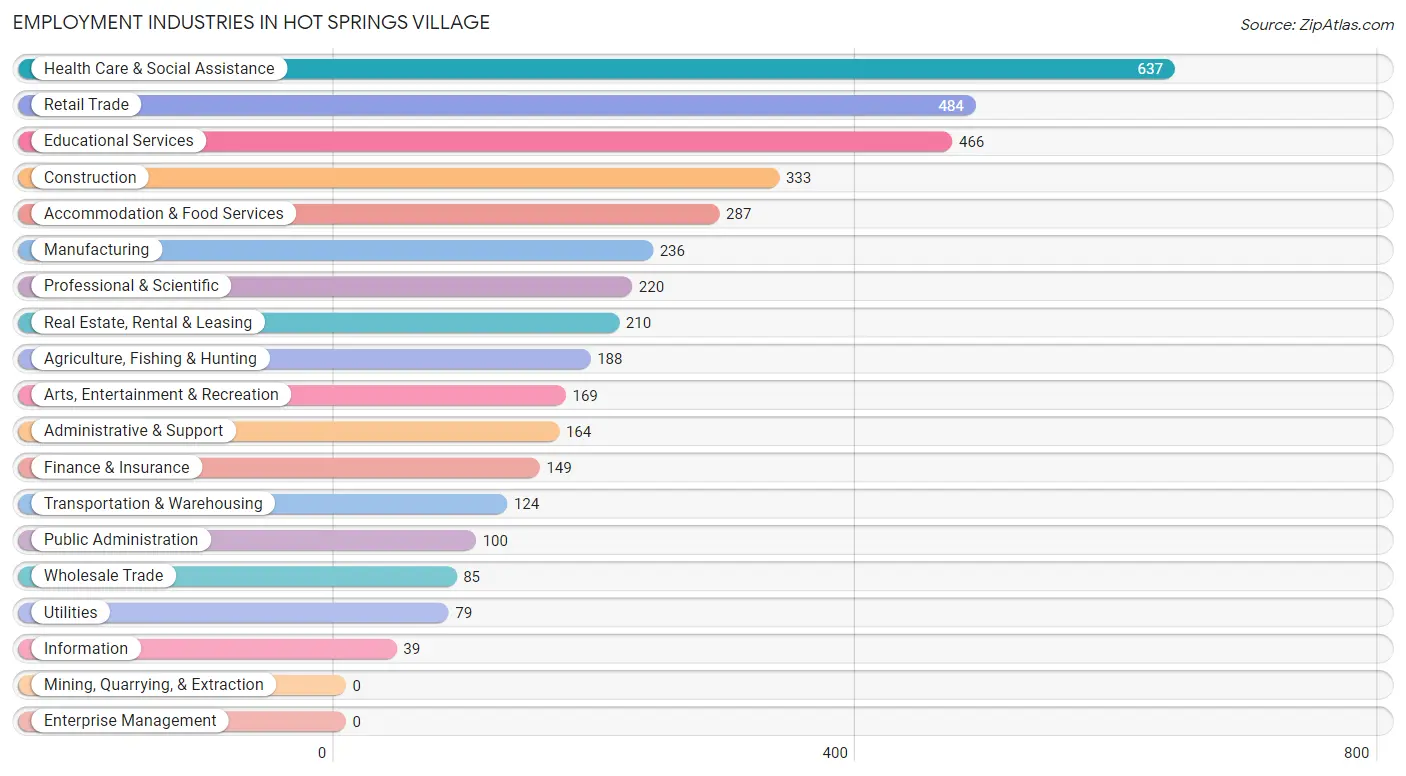
Employment Industries in Hot Springs Village
The major employment industries in Hot Springs Village include Health Care & Social Assistance (637 | 15.2%), Retail Trade (484 | 11.6%), Educational Services (466 | 11.1%), Construction (333 | 8.0%), and Accommodation & Food Services (287 | 6.9%).
Employment Industries by Sex in Hot Springs Village
The Hot Springs Village industries that see more men than women are Utilities (100.0%), Agriculture, Fishing & Hunting (96.3%), and Public Administration (91.0%), whereas the industries that tend to have a higher number of women are Information (100.0%), Health Care & Social Assistance (74.6%), and Accommodation & Food Services (69.7%).
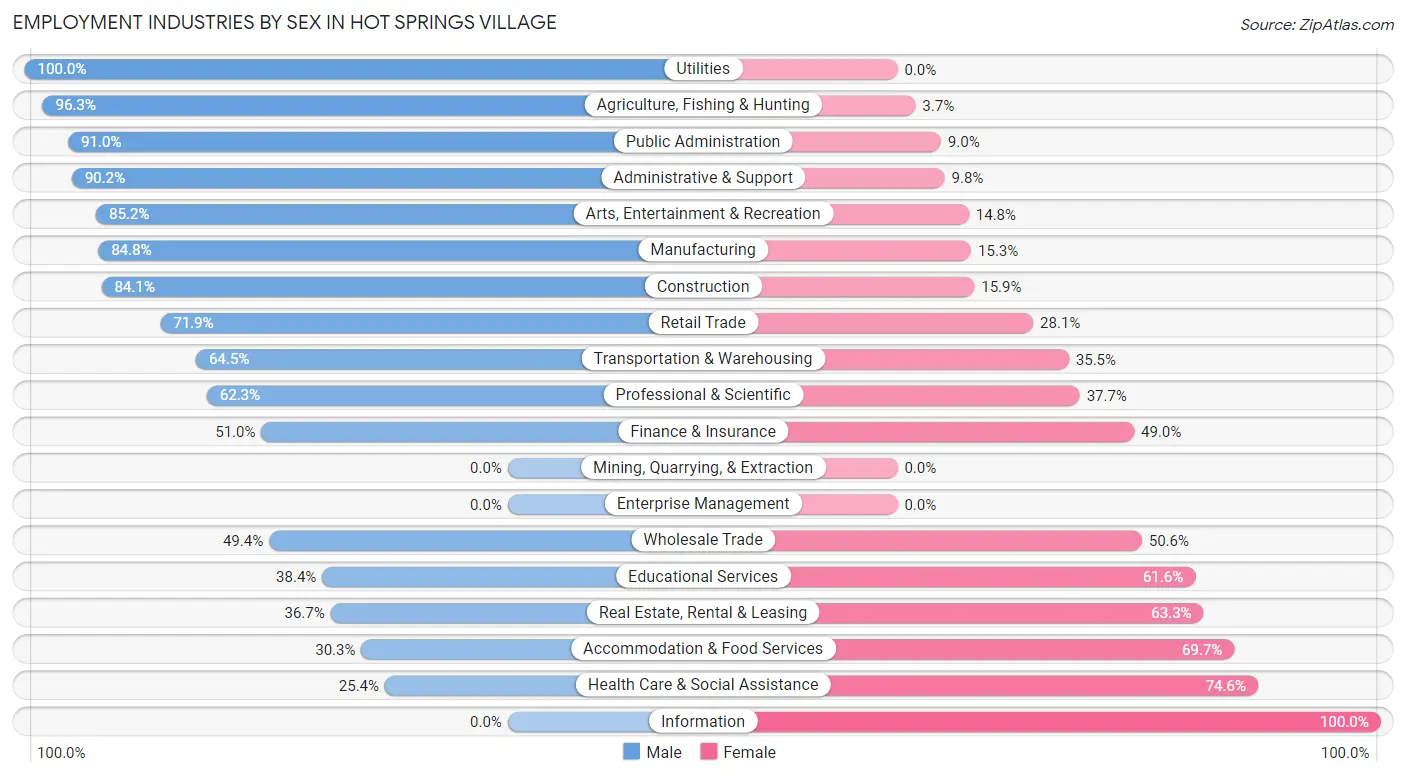
| Industry | Male | Female |
| Agriculture, Fishing & Hunting | 181 (96.3%) | 7 (3.7%) |
| Mining, Quarrying, & Extraction | 0 (0.0%) | 0 (0.0%) |
| Construction | 280 (84.1%) | 53 (15.9%) |
| Manufacturing | 200 (84.8%) | 36 (15.2%) |
| Wholesale Trade | 42 (49.4%) | 43 (50.6%) |
| Retail Trade | 348 (71.9%) | 136 (28.1%) |
| Transportation & Warehousing | 80 (64.5%) | 44 (35.5%) |
| Utilities | 79 (100.0%) | 0 (0.0%) |
| Information | 0 (0.0%) | 39 (100.0%) |
| Finance & Insurance | 76 (51.0%) | 73 (49.0%) |
| Real Estate, Rental & Leasing | 77 (36.7%) | 133 (63.3%) |
| Professional & Scientific | 137 (62.3%) | 83 (37.7%) |
| Enterprise Management | 0 (0.0%) | 0 (0.0%) |
| Administrative & Support | 148 (90.2%) | 16 (9.8%) |
| Educational Services | 179 (38.4%) | 287 (61.6%) |
| Health Care & Social Assistance | 162 (25.4%) | 475 (74.6%) |
| Arts, Entertainment & Recreation | 144 (85.2%) | 25 (14.8%) |
| Accommodation & Food Services | 87 (30.3%) | 200 (69.7%) |
| Public Administration | 91 (91.0%) | 9 (9.0%) |
| Total | 2,404 (57.5%) | 1,780 (42.5%) |
Education in Hot Springs Village
School Enrollment in Hot Springs Village
The most common levels of schooling among the 1,404 students in Hot Springs Village are high school (559 | 39.8%), college / undergraduate (353 | 25.1%), and middle school (176 | 12.5%).
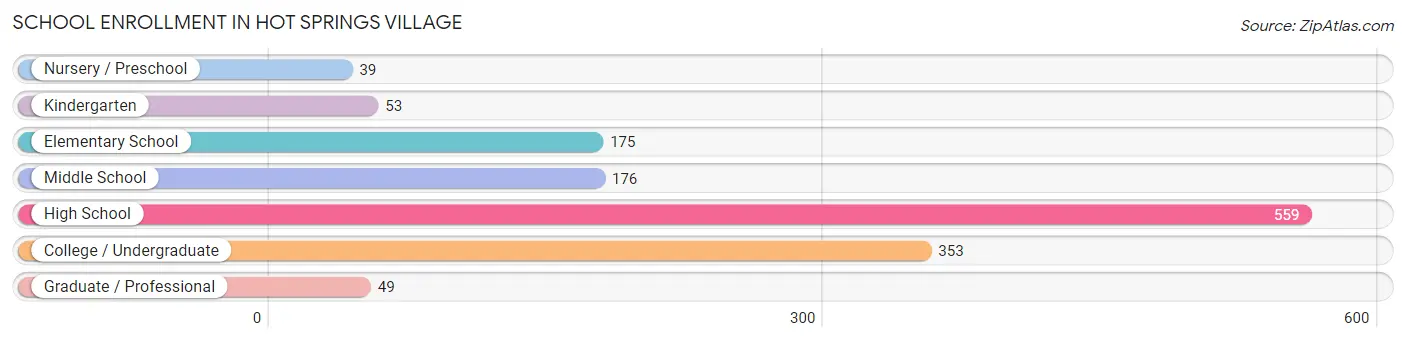
| School Level | # Students | % Students |
| Nursery / Preschool | 39 | 2.8% |
| Kindergarten | 53 | 3.8% |
| Elementary School | 175 | 12.5% |
| Middle School | 176 | 12.5% |
| High School | 559 | 39.8% |
| College / Undergraduate | 353 | 25.1% |
| Graduate / Professional | 49 | 3.5% |
| Total | 1,404 | 100.0% |
School Enrollment by Age by Funding Source in Hot Springs Village
Out of a total of 1,404 students who are enrolled in schools in Hot Springs Village, 270 (19.2%) attend a private institution, while the remaining 1,134 (80.8%) are enrolled in public schools. The age group of 3 to 4 year olds has the highest likelihood of being enrolled in private schools, with 15 (53.6% in the age bracket) enrolled. Conversely, the age group of 25 to 34 year olds has the lowest likelihood of being enrolled in a private school, with 117 (100.0% in the age bracket) attending a public institution.
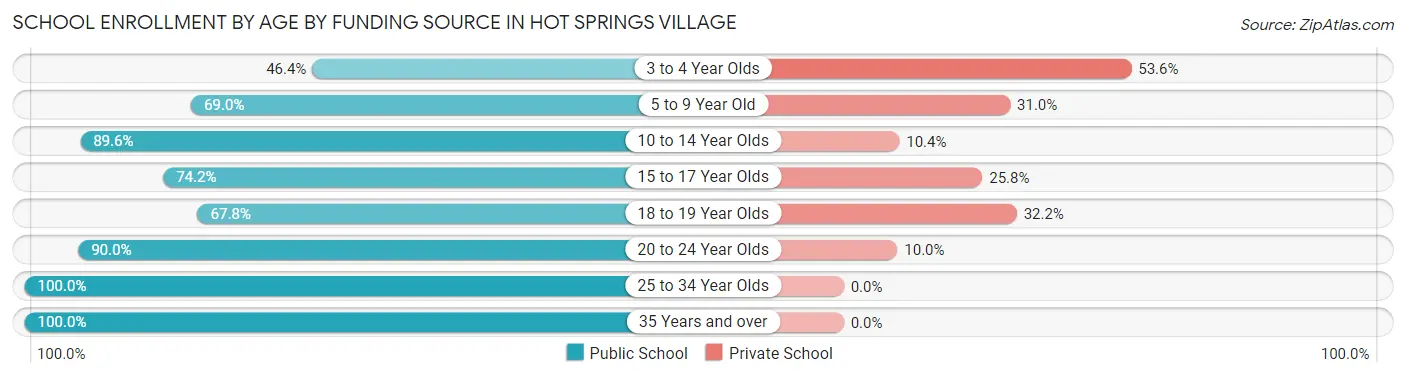
| Age Bracket | Public School | Private School |
| 3 to 4 Year Olds | 13 (46.4%) | 15 (53.6%) |
| 5 to 9 Year Old | 158 (69.0%) | 71 (31.0%) |
| 10 to 14 Year Olds | 251 (89.6%) | 29 (10.4%) |
| 15 to 17 Year Olds | 316 (74.2%) | 110 (25.8%) |
| 18 to 19 Year Olds | 82 (67.8%) | 39 (32.2%) |
| 20 to 24 Year Olds | 45 (90.0%) | 5 (10.0%) |
| 25 to 34 Year Olds | 117 (100.0%) | 0 (0.0%) |
| 35 Years and over | 153 (100.0%) | 0 (0.0%) |
| Total | 1,134 (80.8%) | 270 (19.2%) |
Educational Attainment by Field of Study in Hot Springs Village
Business (1,396 | 23.7%), education (1,314 | 22.3%), science & technology (393 | 6.7%), liberal arts & history (361 | 6.1%), and computers & mathematics (343 | 5.8%) are the most common fields of study among 5,887 individuals in Hot Springs Village who have obtained a bachelor's degree or higher.
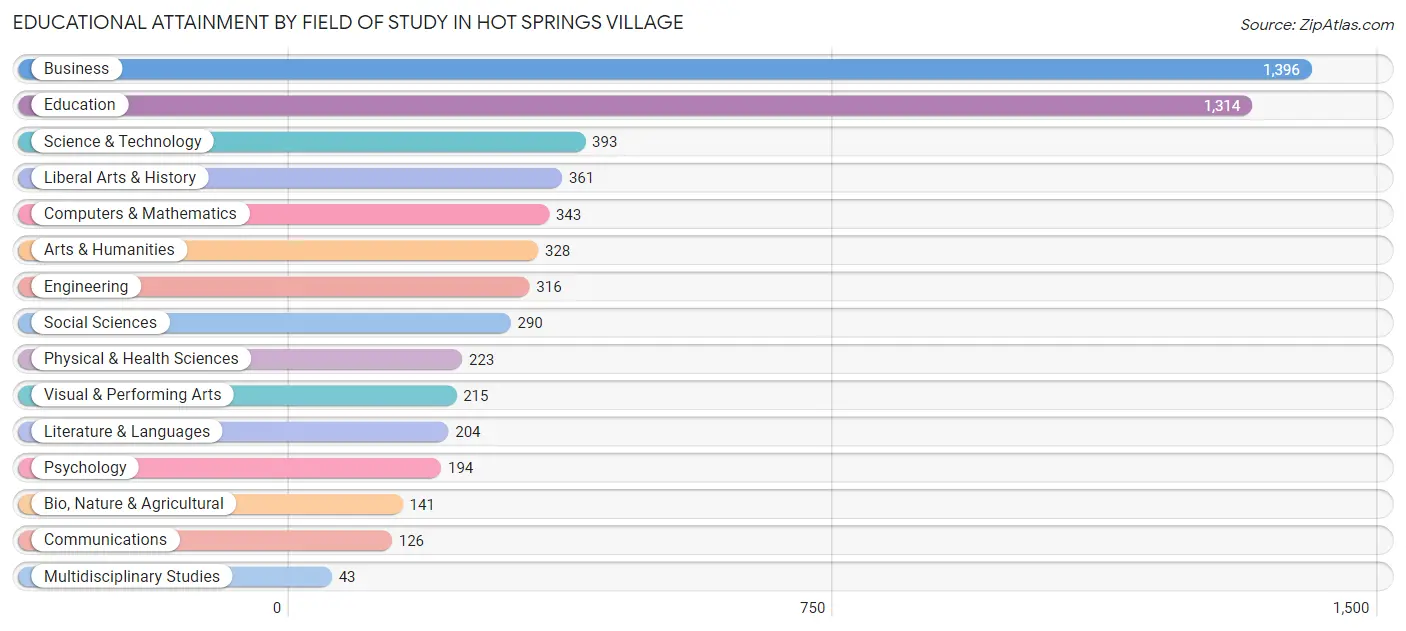
| Field of Study | # Graduates | % Graduates |
| Computers & Mathematics | 343 | 5.8% |
| Bio, Nature & Agricultural | 141 | 2.4% |
| Physical & Health Sciences | 223 | 3.8% |
| Psychology | 194 | 3.3% |
| Social Sciences | 290 | 4.9% |
| Engineering | 316 | 5.4% |
| Multidisciplinary Studies | 43 | 0.7% |
| Science & Technology | 393 | 6.7% |
| Business | 1,396 | 23.7% |
| Education | 1,314 | 22.3% |
| Literature & Languages | 204 | 3.5% |
| Liberal Arts & History | 361 | 6.1% |
| Visual & Performing Arts | 215 | 3.6% |
| Communications | 126 | 2.1% |
| Arts & Humanities | 328 | 5.6% |
| Total | 5,887 | 100.0% |
Transportation & Commute in Hot Springs Village
Vehicle Availability by Sex in Hot Springs Village
The most prevalent vehicle ownership categories in Hot Springs Village are males with 2 vehicles (1,156, accounting for 49.2%) and females with 2 vehicles (880, making up 69.0%).
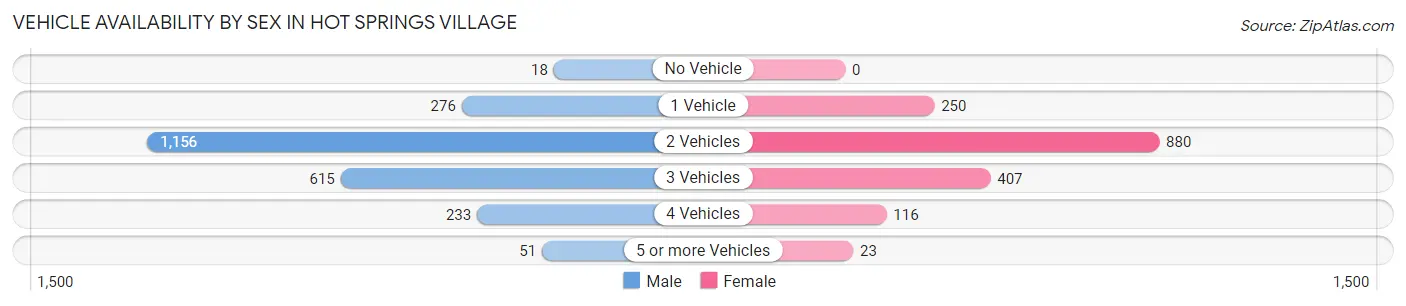
| Vehicles Available | Male | Female |
| No Vehicle | 18 (0.8%) | 0 (0.0%) |
| 1 Vehicle | 276 (11.7%) | 250 (14.9%) |
| 2 Vehicles | 1,156 (49.2%) | 880 (52.5%) |
| 3 Vehicles | 615 (26.2%) | 407 (24.3%) |
| 4 Vehicles | 233 (9.9%) | 116 (6.9%) |
| 5 or more Vehicles | 51 (2.2%) | 23 (1.4%) |
| Total | 2,349 (100.0%) | 1,676 (100.0%) |
Commute Time in Hot Springs Village
The most frequently occuring commute durations in Hot Springs Village are 30 to 34 minutes (682 commuters, 19.2%), 15 to 19 minutes (596 commuters, 16.8%), and 10 to 14 minutes (491 commuters, 13.8%).
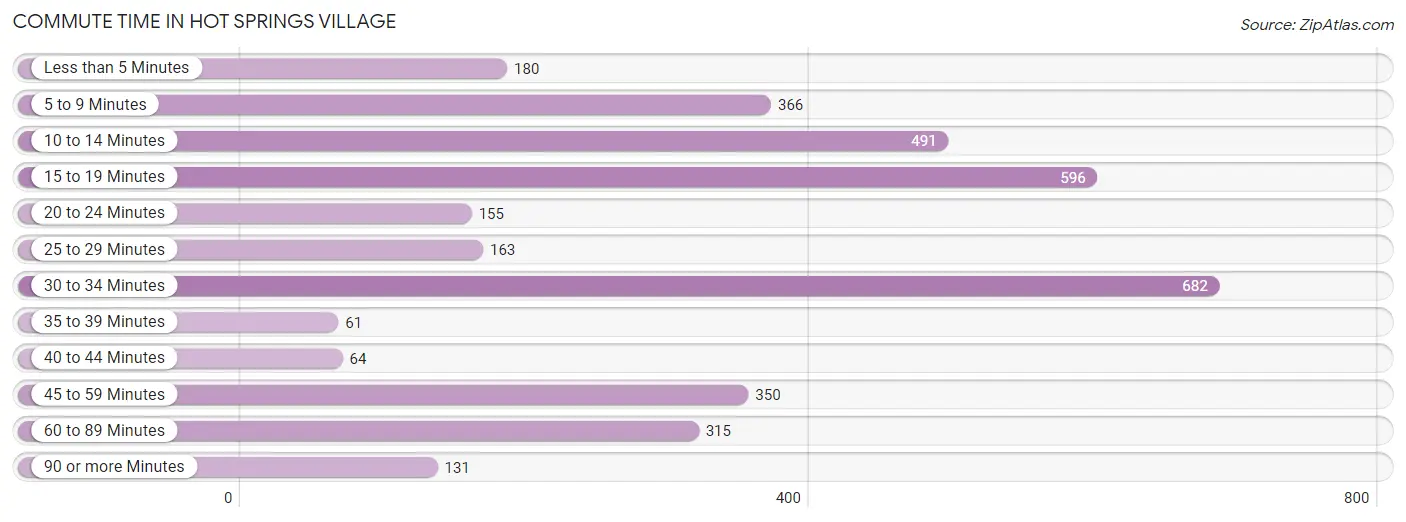
| Commute Time | # Commuters | % Commuters |
| Less than 5 Minutes | 180 | 5.1% |
| 5 to 9 Minutes | 366 | 10.3% |
| 10 to 14 Minutes | 491 | 13.8% |
| 15 to 19 Minutes | 596 | 16.8% |
| 20 to 24 Minutes | 155 | 4.4% |
| 25 to 29 Minutes | 163 | 4.6% |
| 30 to 34 Minutes | 682 | 19.2% |
| 35 to 39 Minutes | 61 | 1.7% |
| 40 to 44 Minutes | 64 | 1.8% |
| 45 to 59 Minutes | 350 | 9.9% |
| 60 to 89 Minutes | 315 | 8.9% |
| 90 or more Minutes | 131 | 3.7% |
Commute Time by Sex in Hot Springs Village
The most common commute times in Hot Springs Village are 15 to 19 minutes (412 commuters, 19.2%) for males and 30 to 34 minutes (392 commuters, 27.8%) for females.
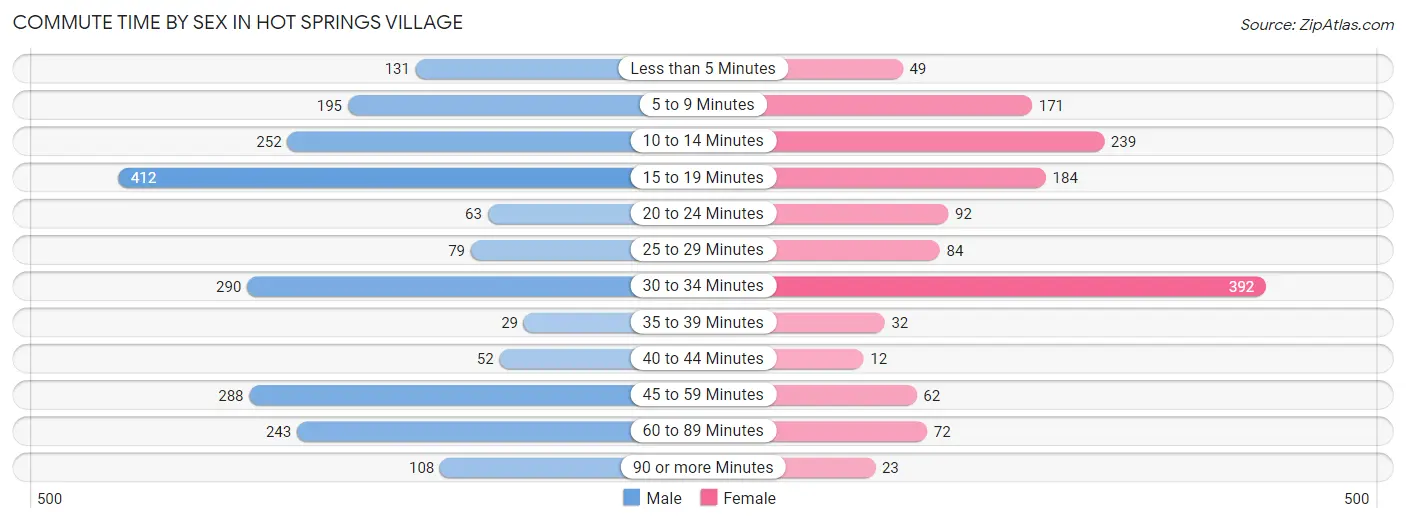
| Commute Time | Male | Female |
| Less than 5 Minutes | 131 (6.1%) | 49 (3.5%) |
| 5 to 9 Minutes | 195 (9.1%) | 171 (12.1%) |
| 10 to 14 Minutes | 252 (11.8%) | 239 (16.9%) |
| 15 to 19 Minutes | 412 (19.2%) | 184 (13.0%) |
| 20 to 24 Minutes | 63 (2.9%) | 92 (6.5%) |
| 25 to 29 Minutes | 79 (3.7%) | 84 (5.9%) |
| 30 to 34 Minutes | 290 (13.5%) | 392 (27.8%) |
| 35 to 39 Minutes | 29 (1.3%) | 32 (2.3%) |
| 40 to 44 Minutes | 52 (2.4%) | 12 (0.9%) |
| 45 to 59 Minutes | 288 (13.5%) | 62 (4.4%) |
| 60 to 89 Minutes | 243 (11.3%) | 72 (5.1%) |
| 90 or more Minutes | 108 (5.0%) | 23 (1.6%) |
Time of Departure to Work by Sex in Hot Springs Village
The most frequent times of departure to work in Hot Springs Village are 7:30 AM to 7:59 AM (358, 16.7%) for males and 7:00 AM to 7:29 AM (336, 23.8%) for females.
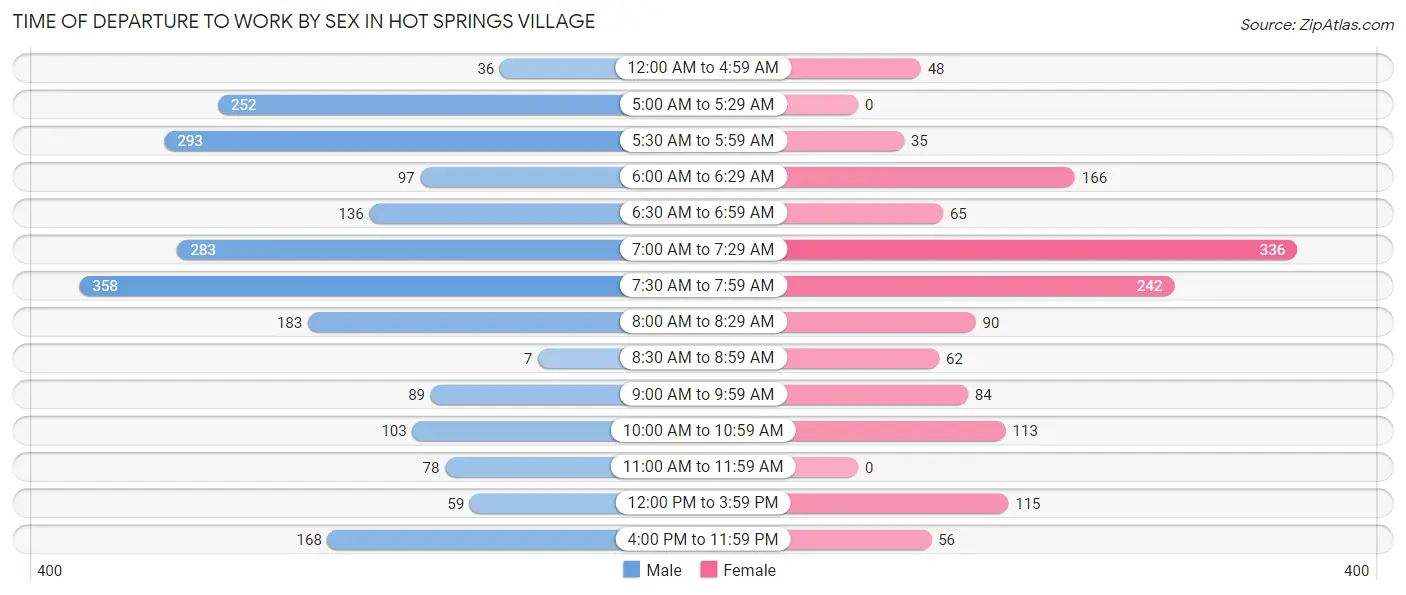
| Time of Departure | Male | Female |
| 12:00 AM to 4:59 AM | 36 (1.7%) | 48 (3.4%) |
| 5:00 AM to 5:29 AM | 252 (11.8%) | 0 (0.0%) |
| 5:30 AM to 5:59 AM | 293 (13.7%) | 35 (2.5%) |
| 6:00 AM to 6:29 AM | 97 (4.5%) | 166 (11.8%) |
| 6:30 AM to 6:59 AM | 136 (6.4%) | 65 (4.6%) |
| 7:00 AM to 7:29 AM | 283 (13.2%) | 336 (23.8%) |
| 7:30 AM to 7:59 AM | 358 (16.7%) | 242 (17.1%) |
| 8:00 AM to 8:29 AM | 183 (8.5%) | 90 (6.4%) |
| 8:30 AM to 8:59 AM | 7 (0.3%) | 62 (4.4%) |
| 9:00 AM to 9:59 AM | 89 (4.2%) | 84 (5.9%) |
| 10:00 AM to 10:59 AM | 103 (4.8%) | 113 (8.0%) |
| 11:00 AM to 11:59 AM | 78 (3.6%) | 0 (0.0%) |
| 12:00 PM to 3:59 PM | 59 (2.8%) | 115 (8.1%) |
| 4:00 PM to 11:59 PM | 168 (7.8%) | 56 (4.0%) |
| Total | 2,142 (100.0%) | 1,412 (100.0%) |
Housing Occupancy in Hot Springs Village
Occupancy by Ownership in Hot Springs Village
Of the total 8,555 dwellings in Hot Springs Village, owner-occupied units account for 7,356 (86.0%), while renter-occupied units make up 1,199 (14.0%).
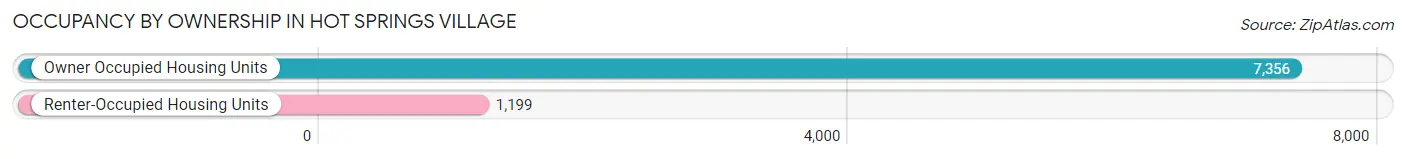
| Occupancy | # Housing Units | % Housing Units |
| Owner Occupied Housing Units | 7,356 | 86.0% |
| Renter-Occupied Housing Units | 1,199 | 14.0% |
| Total Occupied Housing Units | 8,555 | 100.0% |
Occupancy by Household Size in Hot Springs Village
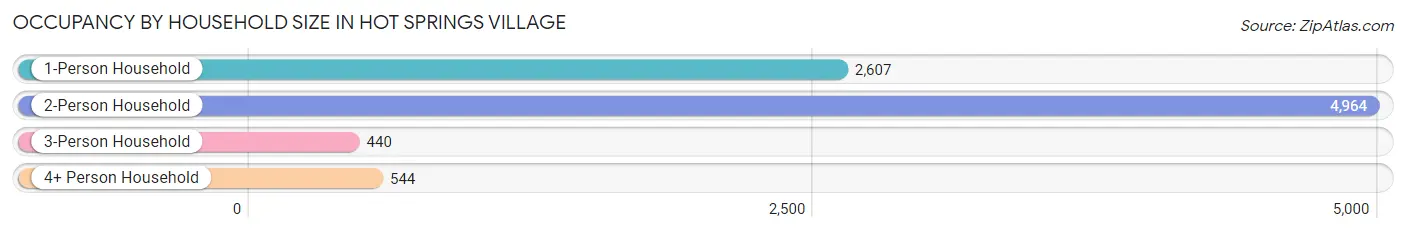
| Household Size | # Housing Units | % Housing Units |
| 1-Person Household | 2,607 | 30.5% |
| 2-Person Household | 4,964 | 58.0% |
| 3-Person Household | 440 | 5.1% |
| 4+ Person Household | 544 | 6.4% |
| Total Housing Units | 8,555 | 100.0% |
Occupancy by Ownership by Household Size in Hot Springs Village
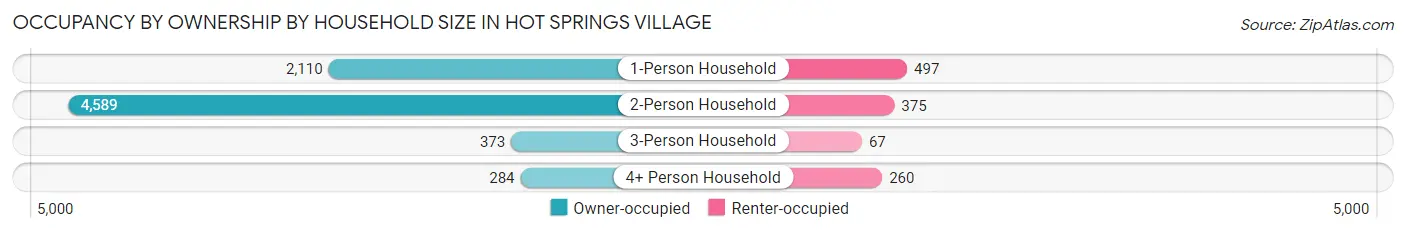
| Household Size | Owner-occupied | Renter-occupied |
| 1-Person Household | 2,110 (80.9%) | 497 (19.1%) |
| 2-Person Household | 4,589 (92.4%) | 375 (7.5%) |
| 3-Person Household | 373 (84.8%) | 67 (15.2%) |
| 4+ Person Household | 284 (52.2%) | 260 (47.8%) |
| Total Housing Units | 7,356 (86.0%) | 1,199 (14.0%) |
Occupancy by Educational Attainment in Hot Springs Village
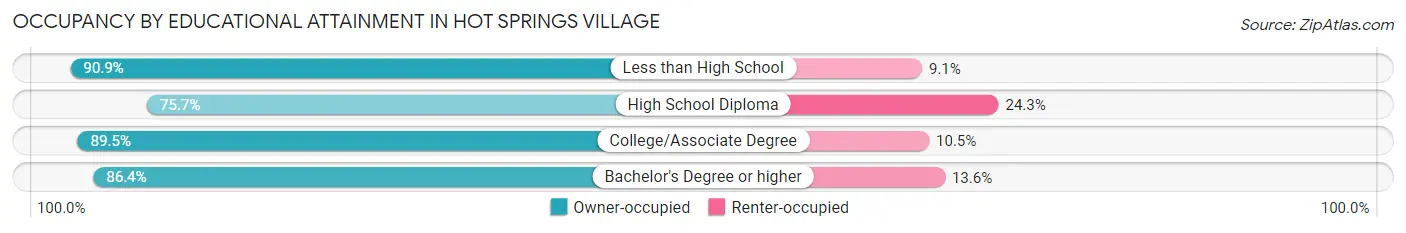
| Household Size | Owner-occupied | Renter-occupied |
| Less than High School | 230 (90.9%) | 23 (9.1%) |
| High School Diploma | 1,111 (75.7%) | 356 (24.3%) |
| College/Associate Degree | 3,197 (89.5%) | 375 (10.5%) |
| Bachelor's Degree or higher | 2,818 (86.4%) | 445 (13.6%) |
Occupancy by Age of Householder in Hot Springs Village
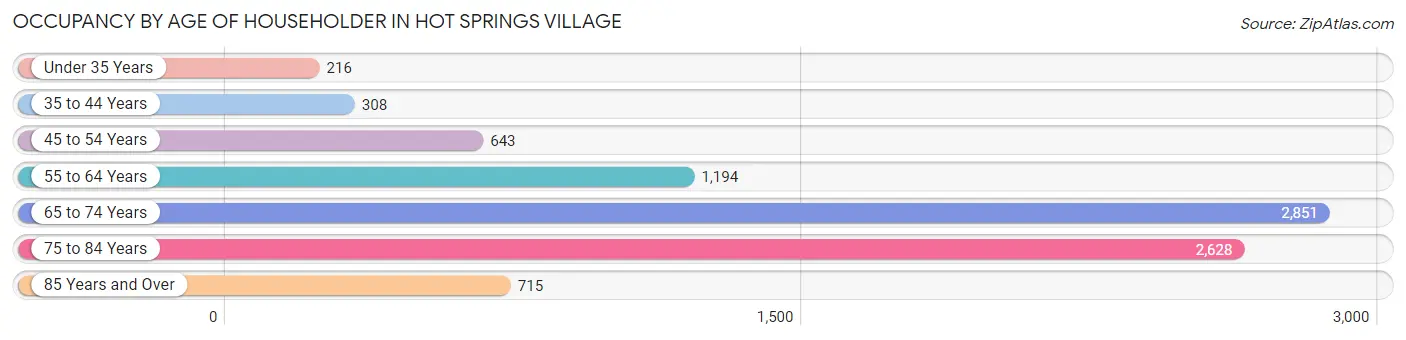
| Age Bracket | # Households | % Households |
| Under 35 Years | 216 | 2.5% |
| 35 to 44 Years | 308 | 3.6% |
| 45 to 54 Years | 643 | 7.5% |
| 55 to 64 Years | 1,194 | 14.0% |
| 65 to 74 Years | 2,851 | 33.3% |
| 75 to 84 Years | 2,628 | 30.7% |
| 85 Years and Over | 715 | 8.4% |
| Total | 8,555 | 100.0% |
Housing Finances in Hot Springs Village
Median Income by Occupancy in Hot Springs Village
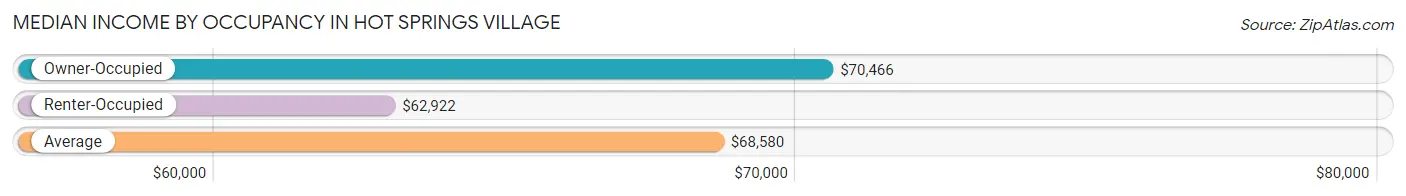
| Occupancy Type | # Households | Median Income |
| Owner-Occupied | 7,356 (86.0%) | $70,466 |
| Renter-Occupied | 1,199 (14.0%) | $62,922 |
| Average | 8,555 (100.0%) | $68,580 |
Occupancy by Householder Income Bracket in Hot Springs Village
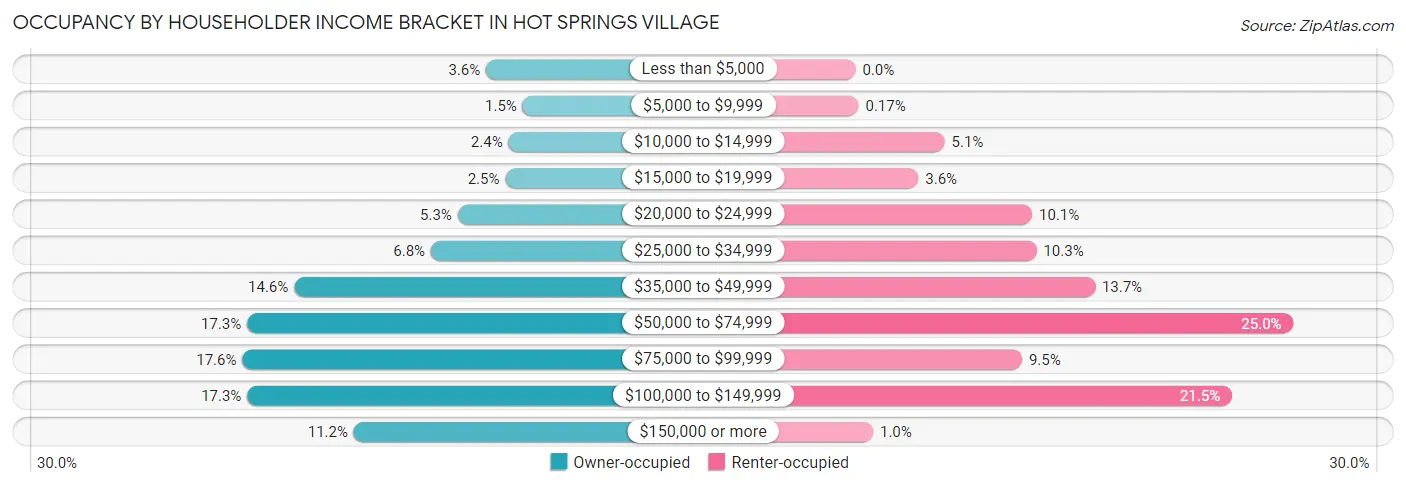
| Income Bracket | Owner-occupied | Renter-occupied |
| Less than $5,000 | 267 (3.6%) | 0 (0.0%) |
| $5,000 to $9,999 | 113 (1.5%) | 2 (0.2%) |
| $10,000 to $14,999 | 173 (2.4%) | 61 (5.1%) |
| $15,000 to $19,999 | 186 (2.5%) | 43 (3.6%) |
| $20,000 to $24,999 | 386 (5.2%) | 121 (10.1%) |
| $25,000 to $34,999 | 499 (6.8%) | 124 (10.3%) |
| $35,000 to $49,999 | 1,074 (14.6%) | 164 (13.7%) |
| $50,000 to $74,999 | 1,272 (17.3%) | 300 (25.0%) |
| $75,000 to $99,999 | 1,292 (17.6%) | 114 (9.5%) |
| $100,000 to $149,999 | 1,271 (17.3%) | 258 (21.5%) |
| $150,000 or more | 823 (11.2%) | 12 (1.0%) |
| Total | 7,356 (100.0%) | 1,199 (100.0%) |
Monthly Housing Cost Tiers in Hot Springs Village
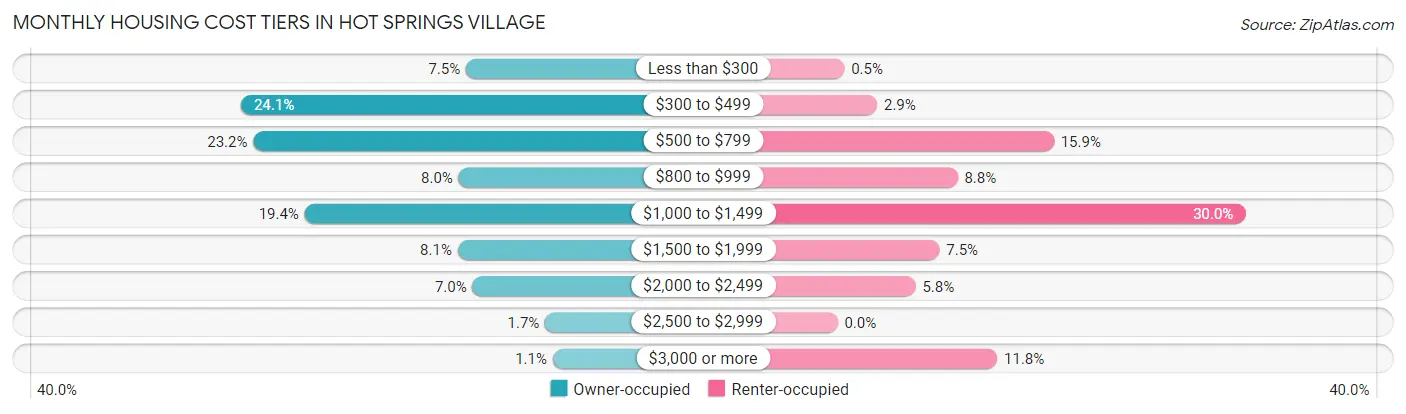
| Monthly Cost | Owner-occupied | Renter-occupied |
| Less than $300 | 551 (7.5%) | 6 (0.5%) |
| $300 to $499 | 1,770 (24.1%) | 35 (2.9%) |
| $500 to $799 | 1,704 (23.2%) | 191 (15.9%) |
| $800 to $999 | 591 (8.0%) | 106 (8.8%) |
| $1,000 to $1,499 | 1,425 (19.4%) | 360 (30.0%) |
| $1,500 to $1,999 | 596 (8.1%) | 90 (7.5%) |
| $2,000 to $2,499 | 516 (7.0%) | 69 (5.8%) |
| $2,500 to $2,999 | 122 (1.7%) | 0 (0.0%) |
| $3,000 or more | 81 (1.1%) | 141 (11.8%) |
| Total | 7,356 (100.0%) | 1,199 (100.0%) |
Physical Housing Characteristics in Hot Springs Village
Housing Structures in Hot Springs Village
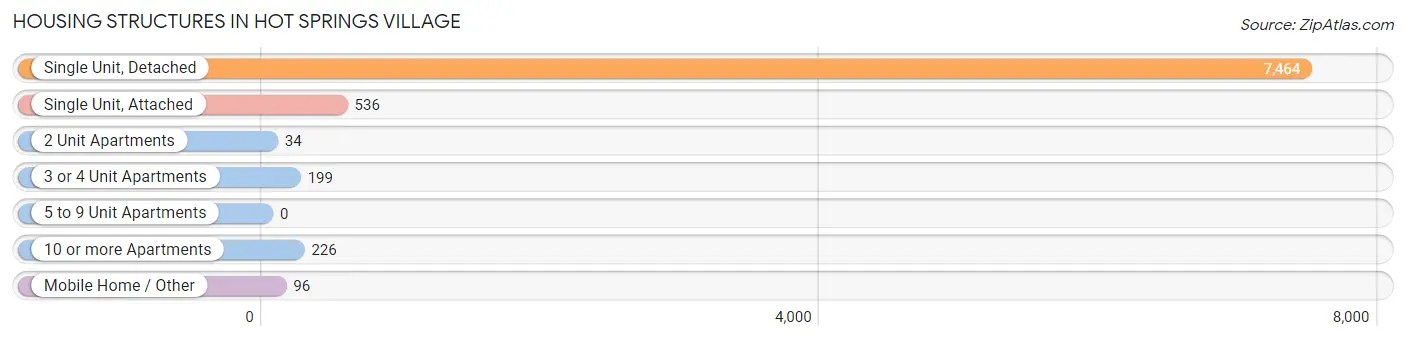
| Structure Type | # Housing Units | % Housing Units |
| Single Unit, Detached | 7,464 | 87.3% |
| Single Unit, Attached | 536 | 6.3% |
| 2 Unit Apartments | 34 | 0.4% |
| 3 or 4 Unit Apartments | 199 | 2.3% |
| 5 to 9 Unit Apartments | 0 | 0.0% |
| 10 or more Apartments | 226 | 2.6% |
| Mobile Home / Other | 96 | 1.1% |
| Total | 8,555 | 100.0% |
Housing Structures by Occupancy in Hot Springs Village
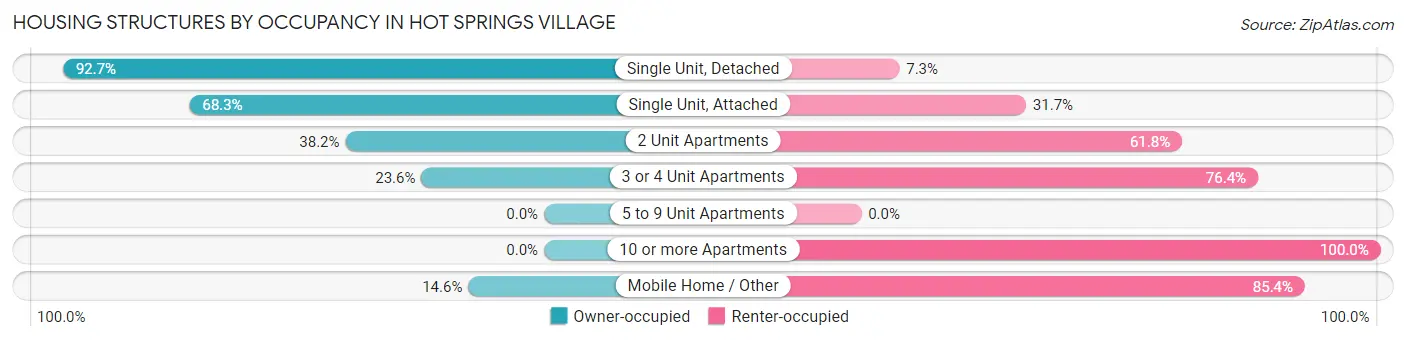
| Structure Type | Owner-occupied | Renter-occupied |
| Single Unit, Detached | 6,916 (92.7%) | 548 (7.3%) |
| Single Unit, Attached | 366 (68.3%) | 170 (31.7%) |
| 2 Unit Apartments | 13 (38.2%) | 21 (61.8%) |
| 3 or 4 Unit Apartments | 47 (23.6%) | 152 (76.4%) |
| 5 to 9 Unit Apartments | 0 (0.0%) | 0 (0.0%) |
| 10 or more Apartments | 0 (0.0%) | 226 (100.0%) |
| Mobile Home / Other | 14 (14.6%) | 82 (85.4%) |
| Total | 7,356 (86.0%) | 1,199 (14.0%) |
Housing Structures by Number of Rooms in Hot Springs Village
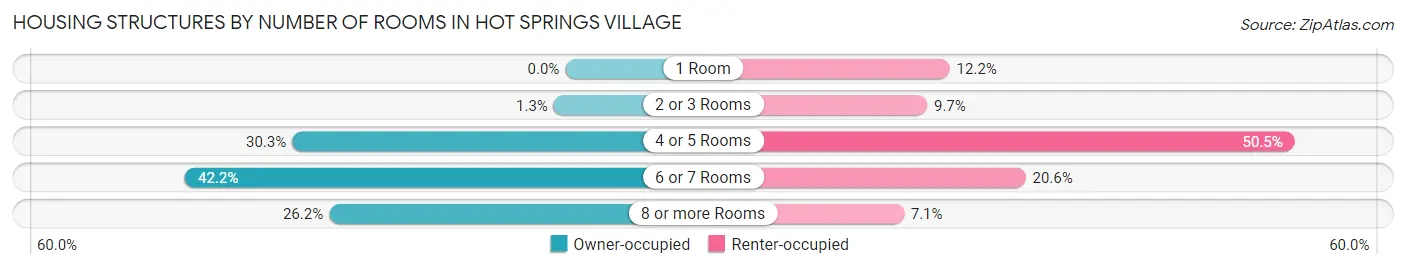
| Number of Rooms | Owner-occupied | Renter-occupied |
| 1 Room | 0 (0.0%) | 146 (12.2%) |
| 2 or 3 Rooms | 94 (1.3%) | 116 (9.7%) |
| 4 or 5 Rooms | 2,230 (30.3%) | 605 (50.5%) |
| 6 or 7 Rooms | 3,103 (42.2%) | 247 (20.6%) |
| 8 or more Rooms | 1,929 (26.2%) | 85 (7.1%) |
| Total | 7,356 (100.0%) | 1,199 (100.0%) |
Housing Structure by Heating Type in Hot Springs Village
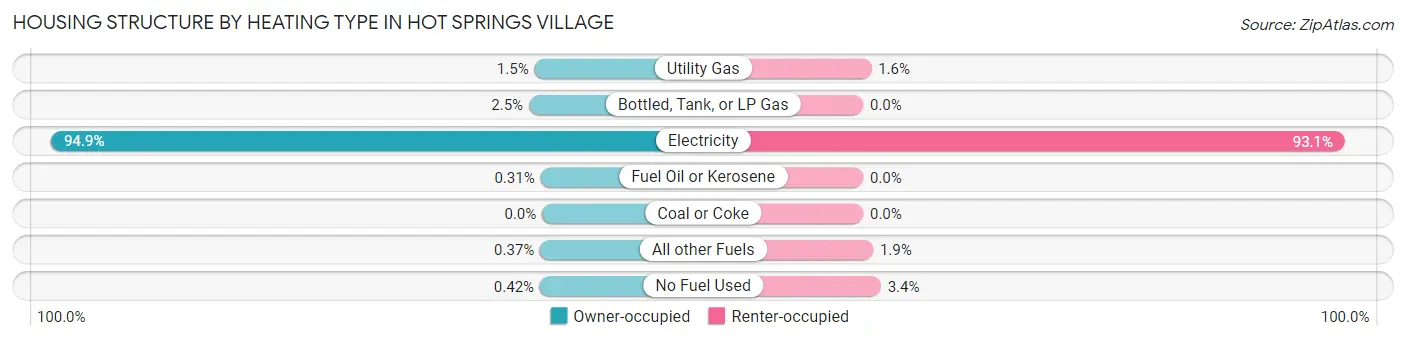
| Heating Type | Owner-occupied | Renter-occupied |
| Utility Gas | 108 (1.5%) | 19 (1.6%) |
| Bottled, Tank, or LP Gas | 187 (2.5%) | 0 (0.0%) |
| Electricity | 6,980 (94.9%) | 1,116 (93.1%) |
| Fuel Oil or Kerosene | 23 (0.3%) | 0 (0.0%) |
| Coal or Coke | 0 (0.0%) | 0 (0.0%) |
| All other Fuels | 27 (0.4%) | 23 (1.9%) |
| No Fuel Used | 31 (0.4%) | 41 (3.4%) |
| Total | 7,356 (100.0%) | 1,199 (100.0%) |
Household Vehicle Usage in Hot Springs Village
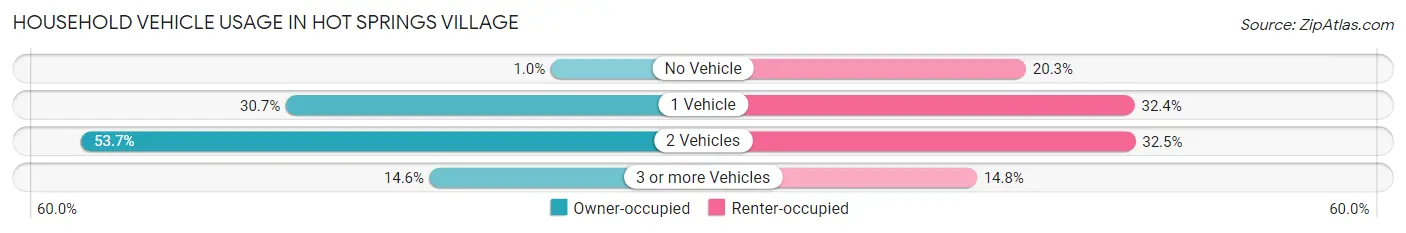
| Vehicles per Household | Owner-occupied | Renter-occupied |
| No Vehicle | 76 (1.0%) | 243 (20.3%) |
| 1 Vehicle | 2,259 (30.7%) | 389 (32.4%) |
| 2 Vehicles | 3,947 (53.7%) | 390 (32.5%) |
| 3 or more Vehicles | 1,074 (14.6%) | 177 (14.8%) |
| Total | 7,356 (100.0%) | 1,199 (100.0%) |
Real Estate & Mortgages in Hot Springs Village
Real Estate and Mortgage Overview in Hot Springs Village
| Characteristic | Without Mortgage | With Mortgage |
| Housing Units | 4,213 | 3,143 |
| Median Property Value | $258,000 | $241,400 |
| Median Household Income | $63,042 | $359 |
| Monthly Housing Costs | $484 | $81 |
| Real Estate Taxes | $1,349 | $169 |
Property Value by Mortgage Status in Hot Springs Village
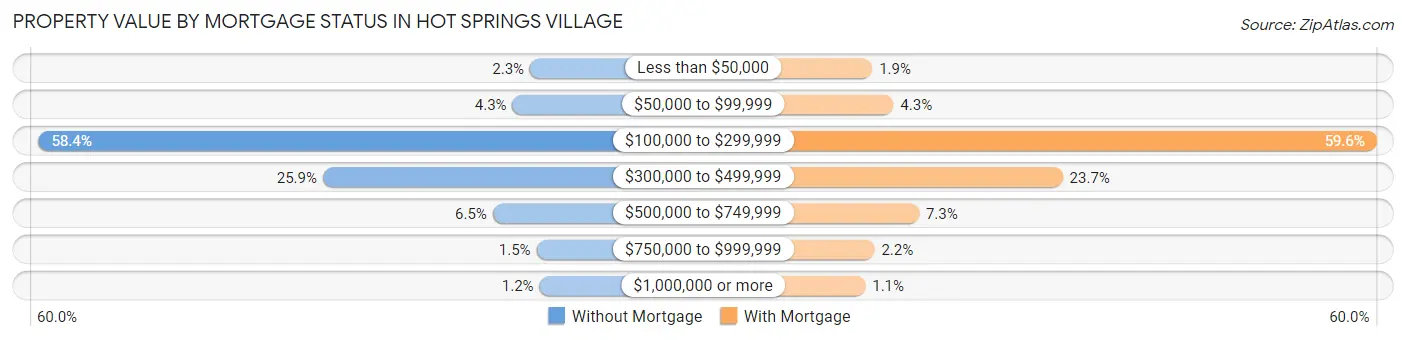
| Property Value | Without Mortgage | With Mortgage |
| Less than $50,000 | 95 (2.2%) | 60 (1.9%) |
| $50,000 to $99,999 | 179 (4.3%) | 136 (4.3%) |
| $100,000 to $299,999 | 2,461 (58.4%) | 1,872 (59.6%) |
| $300,000 to $499,999 | 1,092 (25.9%) | 744 (23.7%) |
| $500,000 to $749,999 | 274 (6.5%) | 228 (7.2%) |
| $750,000 to $999,999 | 63 (1.5%) | 68 (2.2%) |
| $1,000,000 or more | 49 (1.2%) | 35 (1.1%) |
| Total | 4,213 (100.0%) | 3,143 (100.0%) |
Household Income by Mortgage Status in Hot Springs Village
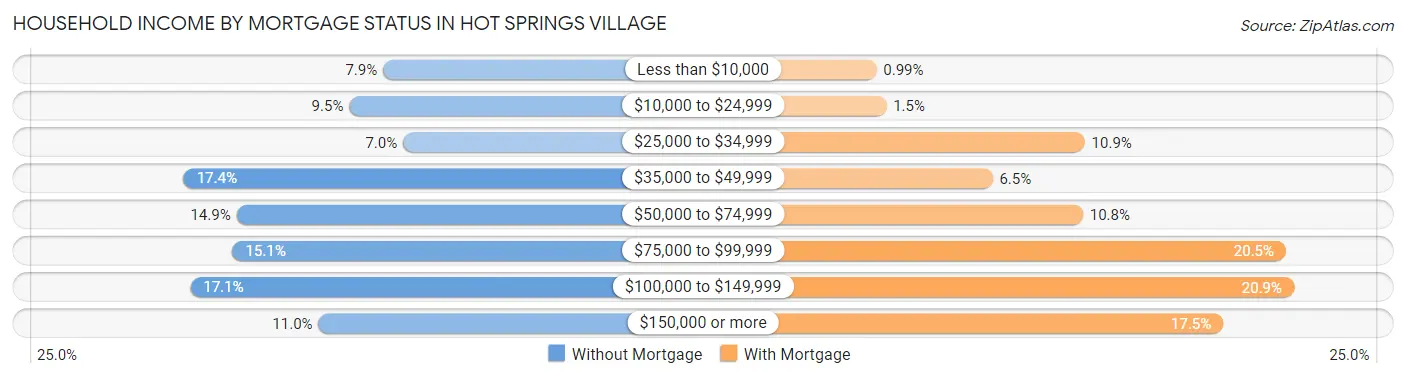
| Household Income | Without Mortgage | With Mortgage |
| Less than $10,000 | 334 (7.9%) | 31 (1.0%) |
| $10,000 to $24,999 | 402 (9.5%) | 46 (1.5%) |
| $25,000 to $34,999 | 294 (7.0%) | 343 (10.9%) |
| $35,000 to $49,999 | 734 (17.4%) | 205 (6.5%) |
| $50,000 to $74,999 | 628 (14.9%) | 340 (10.8%) |
| $75,000 to $99,999 | 636 (15.1%) | 644 (20.5%) |
| $100,000 to $149,999 | 721 (17.1%) | 656 (20.9%) |
| $150,000 or more | 464 (11.0%) | 550 (17.5%) |
| Total | 4,213 (100.0%) | 3,143 (100.0%) |
Property Value to Household Income Ratio in Hot Springs Village
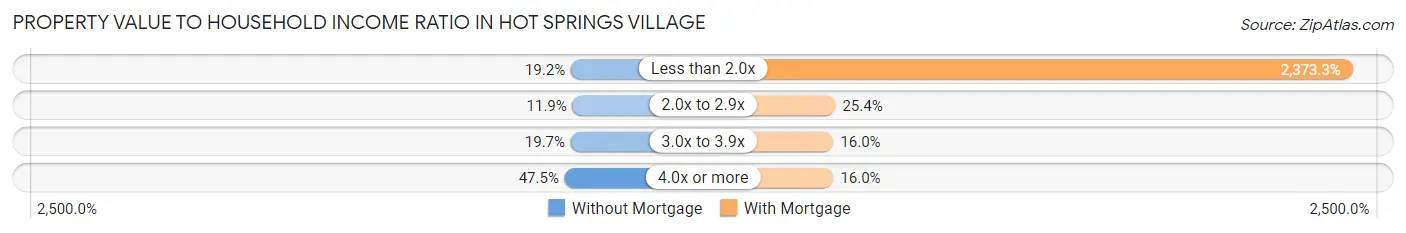
| Value-to-Income Ratio | Without Mortgage | With Mortgage |
| Less than 2.0x | 809 (19.2%) | 74,594 (2,373.3%) |
| 2.0x to 2.9x | 502 (11.9%) | 797 (25.4%) |
| 3.0x to 3.9x | 831 (19.7%) | 502 (16.0%) |
| 4.0x or more | 2,003 (47.5%) | 502 (16.0%) |
| Total | 4,213 (100.0%) | 3,143 (100.0%) |
Real Estate Taxes by Mortgage Status in Hot Springs Village
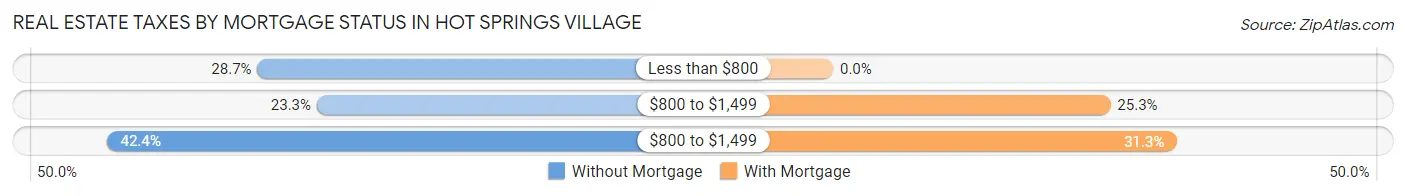
| Property Taxes | Without Mortgage | With Mortgage |
| Less than $800 | 1,211 (28.7%) | 0 (0.0%) |
| $800 to $1,499 | 982 (23.3%) | 796 (25.3%) |
| $800 to $1,499 | 1,787 (42.4%) | 985 (31.3%) |
| Total | 4,213 (100.0%) | 3,143 (100.0%) |
Health & Disability in Hot Springs Village
Health Insurance Coverage by Age in Hot Springs Village
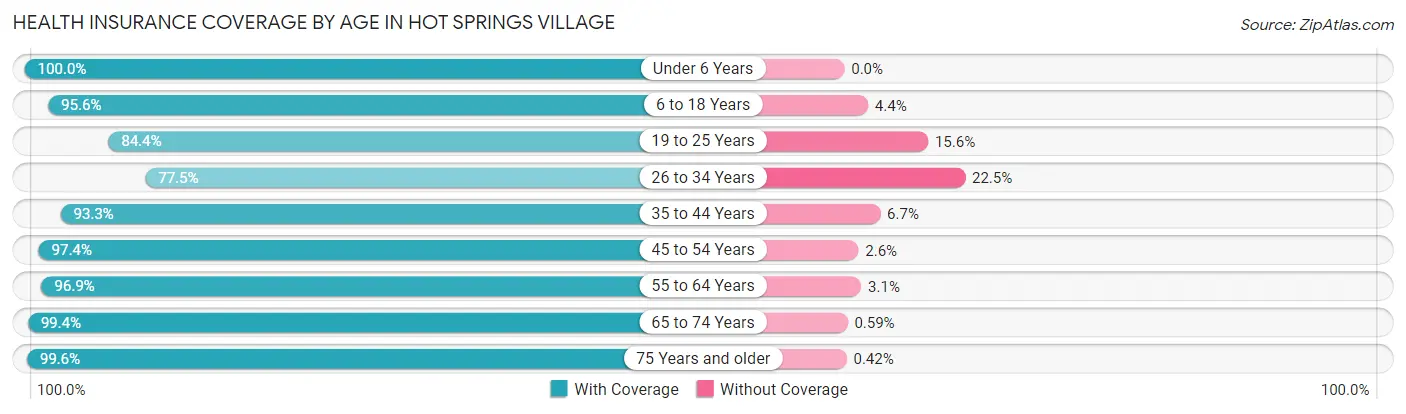
| Age Bracket | With Coverage | Without Coverage |
| Under 6 Years | 259 (100.0%) | 0 (0.0%) |
| 6 to 18 Years | 956 (95.6%) | 44 (4.4%) |
| 19 to 25 Years | 454 (84.4%) | 84 (15.6%) |
| 26 to 34 Years | 444 (77.5%) | 129 (22.5%) |
| 35 to 44 Years | 558 (93.3%) | 40 (6.7%) |
| 45 to 54 Years | 1,339 (97.4%) | 36 (2.6%) |
| 55 to 64 Years | 2,159 (96.9%) | 70 (3.1%) |
| 65 to 74 Years | 5,018 (99.4%) | 30 (0.6%) |
| 75 Years and older | 5,160 (99.6%) | 22 (0.4%) |
| Total | 16,347 (97.3%) | 455 (2.7%) |
Health Insurance Coverage by Citizenship Status in Hot Springs Village
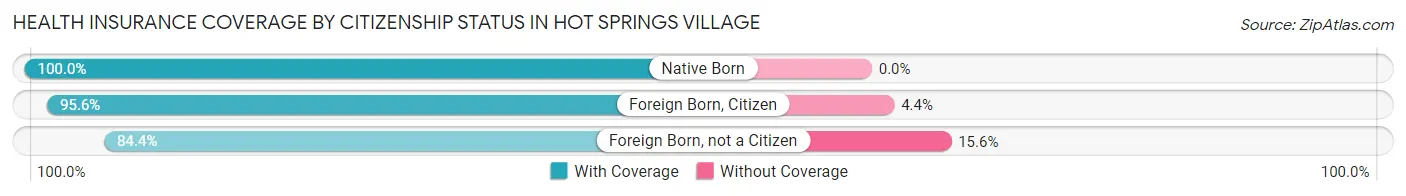
| Citizenship Status | With Coverage | Without Coverage |
| Native Born | 259 (100.0%) | 0 (0.0%) |
| Foreign Born, Citizen | 956 (95.6%) | 44 (4.4%) |
| Foreign Born, not a Citizen | 454 (84.4%) | 84 (15.6%) |
Health Insurance Coverage by Household Income in Hot Springs Village
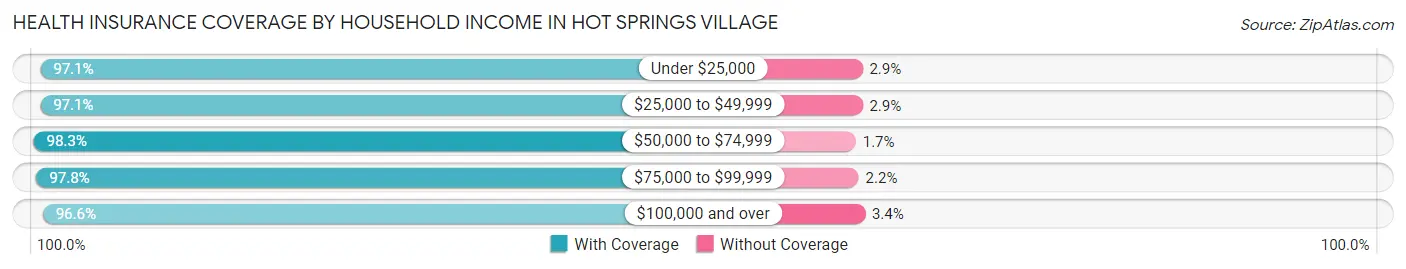
| Household Income | With Coverage | Without Coverage |
| Under $25,000 | 1,748 (97.1%) | 53 (2.9%) |
| $25,000 to $49,999 | 3,450 (97.1%) | 104 (2.9%) |
| $50,000 to $74,999 | 2,854 (98.3%) | 49 (1.7%) |
| $75,000 to $99,999 | 3,298 (97.8%) | 75 (2.2%) |
| $100,000 and over | 4,943 (96.6%) | 174 (3.4%) |
Public vs Private Health Insurance Coverage by Age in Hot Springs Village
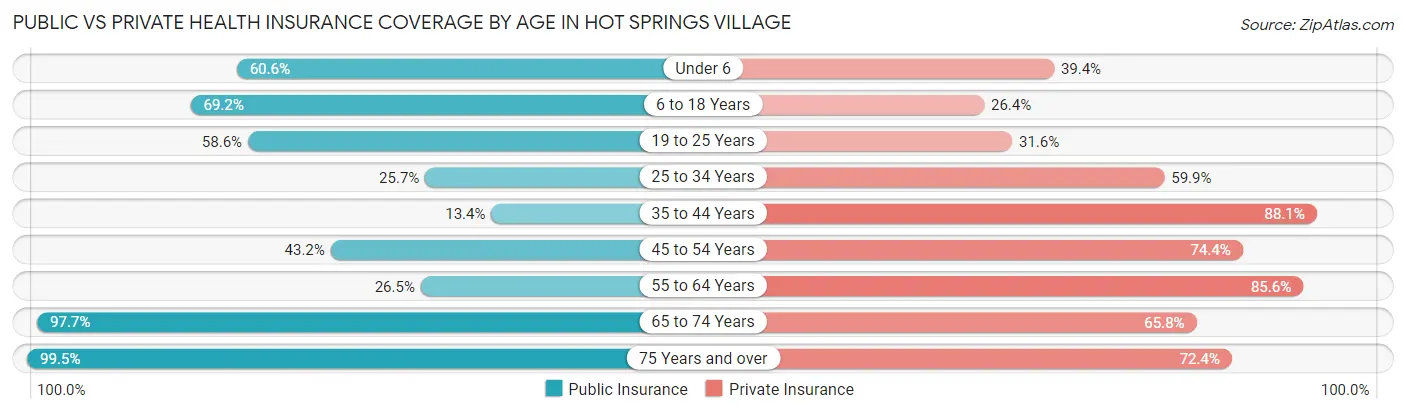
| Age Bracket | Public Insurance | Private Insurance |
| Under 6 | 157 (60.6%) | 102 (39.4%) |
| 6 to 18 Years | 692 (69.2%) | 264 (26.4%) |
| 19 to 25 Years | 315 (58.6%) | 170 (31.6%) |
| 25 to 34 Years | 147 (25.7%) | 343 (59.9%) |
| 35 to 44 Years | 80 (13.4%) | 527 (88.1%) |
| 45 to 54 Years | 594 (43.2%) | 1,023 (74.4%) |
| 55 to 64 Years | 590 (26.5%) | 1,908 (85.6%) |
| 65 to 74 Years | 4,931 (97.7%) | 3,322 (65.8%) |
| 75 Years and over | 5,158 (99.5%) | 3,750 (72.4%) |
| Total | 12,664 (75.4%) | 11,409 (67.9%) |
Disability Status by Sex by Age in Hot Springs Village
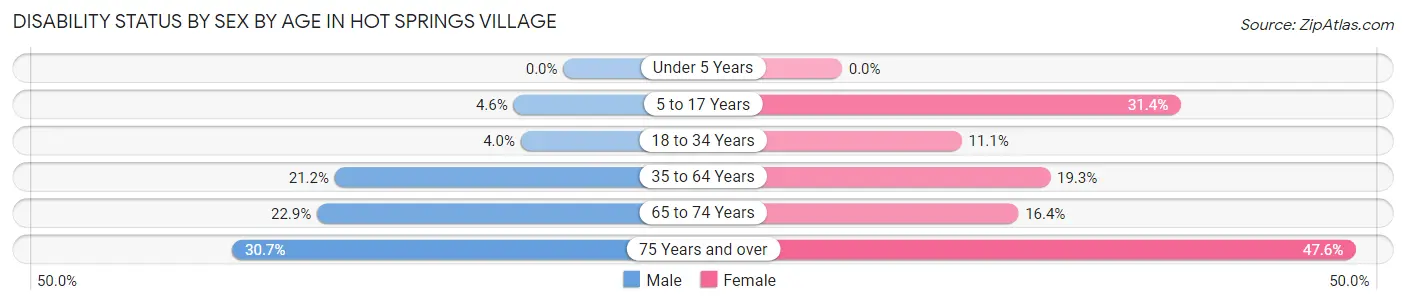
| Age Bracket | Male | Female |
| Under 5 Years | 0 (0.0%) | 0 (0.0%) |
| 5 to 17 Years | 15 (4.6%) | 194 (31.4%) |
| 18 to 34 Years | 33 (4.0%) | 44 (11.1%) |
| 35 to 64 Years | 403 (21.2%) | 445 (19.3%) |
| 65 to 74 Years | 506 (22.9%) | 464 (16.4%) |
| 75 Years and over | 807 (30.7%) | 1,218 (47.6%) |
Disability Class by Sex by Age in Hot Springs Village
Disability Class: Hearing Difficulty
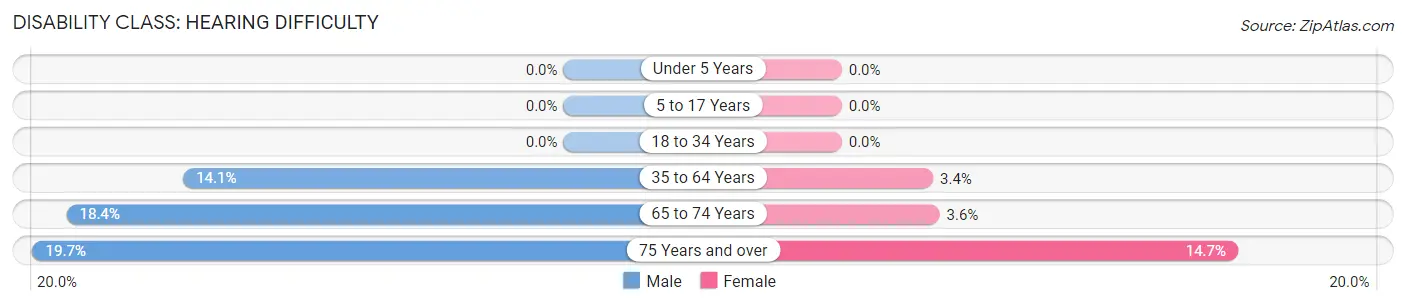
| Age Bracket | Male | Female |
| Under 5 Years | 0 (0.0%) | 0 (0.0%) |
| 5 to 17 Years | 0 (0.0%) | 0 (0.0%) |
| 18 to 34 Years | 0 (0.0%) | 0 (0.0%) |
| 35 to 64 Years | 268 (14.1%) | 78 (3.4%) |
| 65 to 74 Years | 408 (18.4%) | 103 (3.6%) |
| 75 Years and over | 517 (19.7%) | 376 (14.7%) |
Disability Class: Vision Difficulty
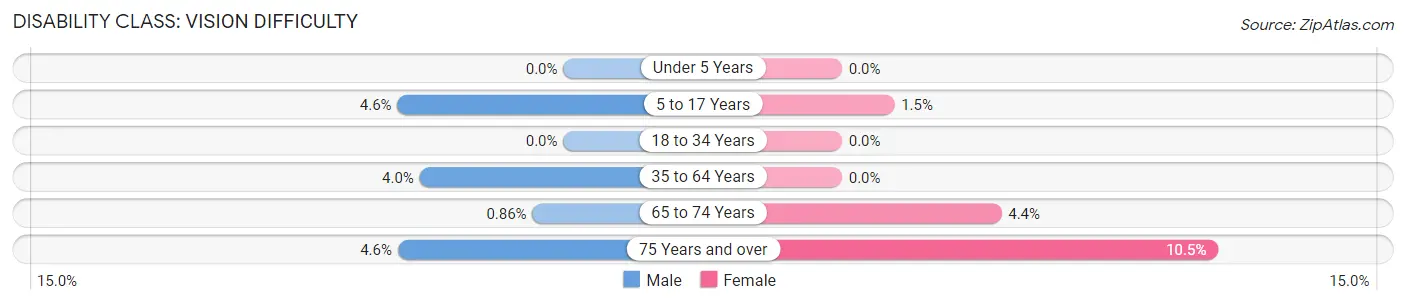
| Age Bracket | Male | Female |
| Under 5 Years | 0 (0.0%) | 0 (0.0%) |
| 5 to 17 Years | 15 (4.6%) | 9 (1.5%) |
| 18 to 34 Years | 0 (0.0%) | 0 (0.0%) |
| 35 to 64 Years | 76 (4.0%) | 0 (0.0%) |
| 65 to 74 Years | 19 (0.9%) | 126 (4.4%) |
| 75 Years and over | 121 (4.6%) | 268 (10.5%) |
Disability Class: Cognitive Difficulty
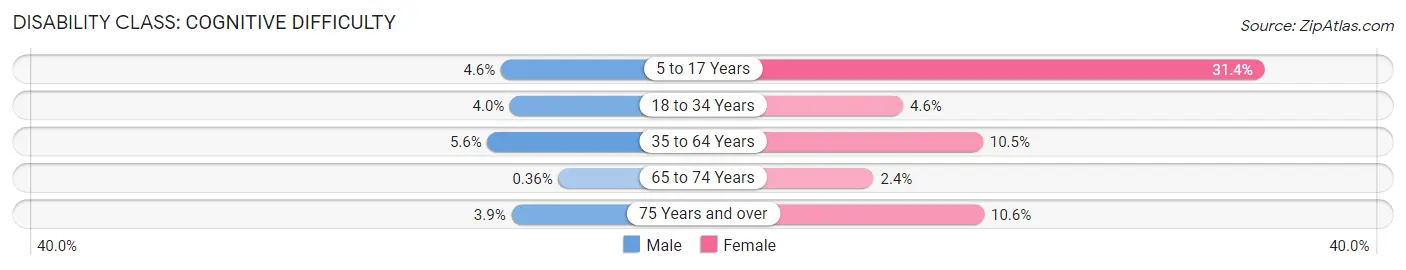
| Age Bracket | Male | Female |
| 5 to 17 Years | 15 (4.6%) | 194 (31.4%) |
| 18 to 34 Years | 33 (4.0%) | 18 (4.5%) |
| 35 to 64 Years | 107 (5.6%) | 241 (10.5%) |
| 65 to 74 Years | 8 (0.4%) | 67 (2.4%) |
| 75 Years and over | 101 (3.8%) | 270 (10.6%) |
Disability Class: Ambulatory Difficulty
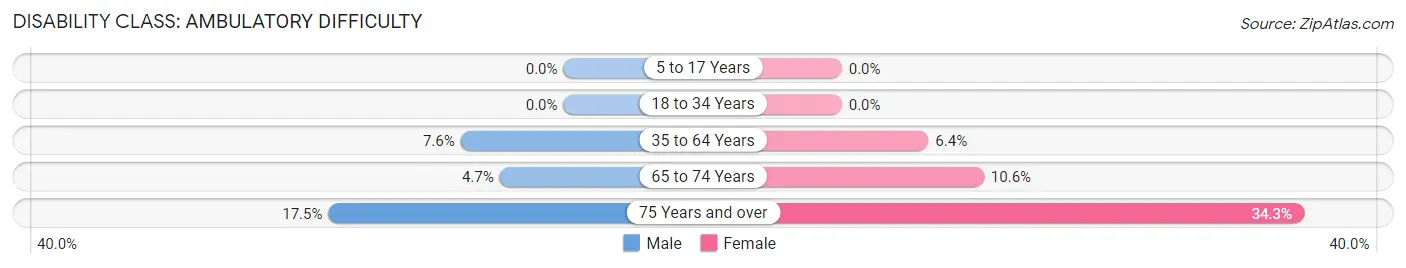
| Age Bracket | Male | Female |
| 5 to 17 Years | 0 (0.0%) | 0 (0.0%) |
| 18 to 34 Years | 0 (0.0%) | 0 (0.0%) |
| 35 to 64 Years | 145 (7.6%) | 148 (6.4%) |
| 65 to 74 Years | 105 (4.7%) | 299 (10.5%) |
| 75 Years and over | 458 (17.4%) | 877 (34.3%) |
Disability Class: Self-Care Difficulty
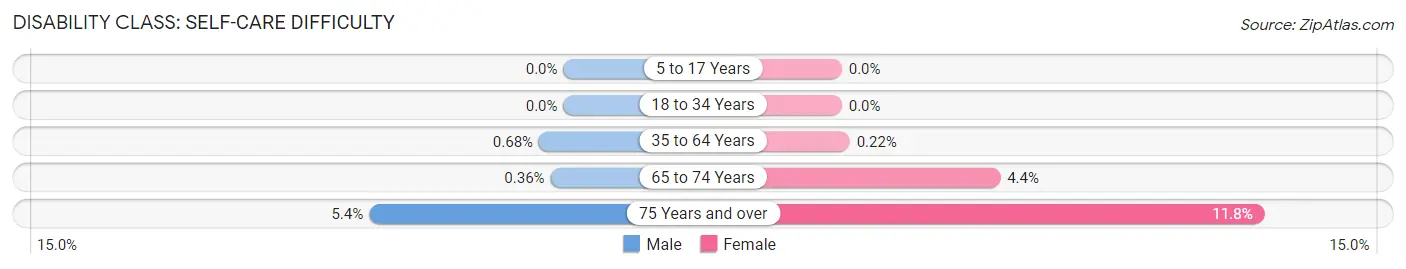
| Age Bracket | Male | Female |
| 5 to 17 Years | 0 (0.0%) | 0 (0.0%) |
| 18 to 34 Years | 0 (0.0%) | 0 (0.0%) |
| 35 to 64 Years | 13 (0.7%) | 5 (0.2%) |
| 65 to 74 Years | 8 (0.4%) | 125 (4.4%) |
| 75 Years and over | 142 (5.4%) | 301 (11.8%) |
Technology Access in Hot Springs Village
Computing Device Access in Hot Springs Village
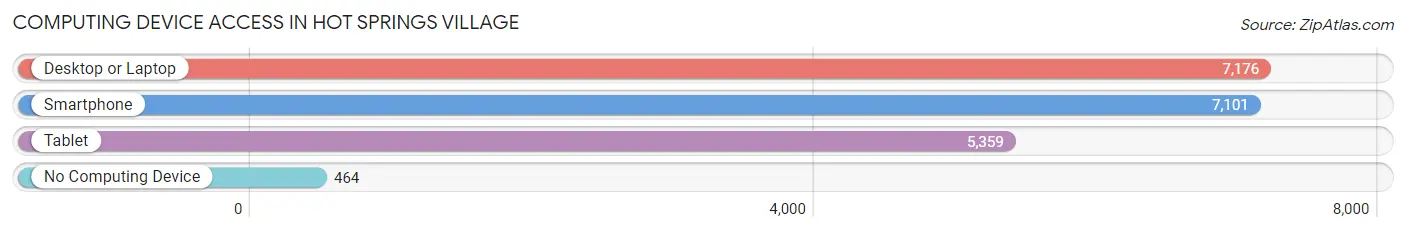
| Device Type | # Households | % Households |
| Desktop or Laptop | 7,176 | 83.9% |
| Smartphone | 7,101 | 83.0% |
| Tablet | 5,359 | 62.6% |
| No Computing Device | 464 | 5.4% |
| Total | 8,555 | 100.0% |
Internet Access in Hot Springs Village
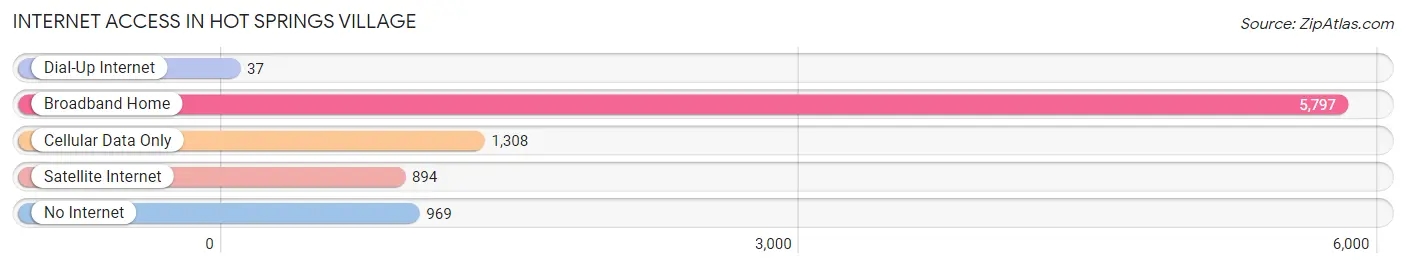
| Internet Type | # Households | % Households |
| Dial-Up Internet | 37 | 0.4% |
| Broadband Home | 5,797 | 67.8% |
| Cellular Data Only | 1,308 | 15.3% |
| Satellite Internet | 894 | 10.4% |
| No Internet | 969 | 11.3% |
| Total | 8,555 | 100.0% |
Hot Springs Village Summary
History
Hot Springs Village is a census-designated place (CDP) located in Garland and Saline counties in the U.S. state of Arkansas. It is the largest gated community in the United States. The community was founded in 1970 by the Arkansas Industrial Development Commission and the Hot Springs Village Property Owners’ Association. The community was designed to be a self-contained, self-sustaining community with its own schools, churches, shopping centers, and recreational facilities.
The area that is now Hot Springs Village was originally inhabited by the Quapaw and Caddo Native American tribes. The first European settlers arrived in the area in the early 1800s. The area was known as the Hot Springs Reservation and was used by the federal government to protect the hot springs from development. In the late 1800s, the area was opened up to homesteaders and settlers.
Geography
Hot Springs Village is located in the Ouachita Mountains of central Arkansas. It is situated in the foothills of the Ouachita Mountains, approximately 20 miles northwest of Hot Springs, Arkansas. The community is located in both Garland and Saline counties and is bordered by Lake Hamilton to the south and Lake Catherine to the north. The total area of Hot Springs Village is approximately 26,000 acres.
The terrain of Hot Springs Village is mostly hilly and wooded. The highest point in the community is Mount Carmel, which has an elevation of 1,400 feet. The community is home to several lakes, including Lake Balboa, Lake Coronado, Lake Cortez, Lake DeSoto, Lake Estrella, Lake Granada, Lake Isabella, Lake Lago, Lake Maria, Lake Pineda, and Lake Tamarack.
Economy
Hot Springs Village is a self-contained, self-sustaining community. The economy of Hot Springs Village is largely based on tourism and retirement. The community is home to several resorts, golf courses, and other recreational facilities. The community also has a variety of retail stores, restaurants, and other businesses.
The median household income in Hot Springs Village is $50,000, which is higher than the national average. The unemployment rate in Hot Springs Village is 4.2%, which is lower than the national average.
Demographics
As of the 2010 census, there were 12,807 people, 5,845 households, and 4,092 families residing in Hot Springs Village. The population density was 486.3 people per square mile. The racial makeup of Hot Springs Village was 94.3% White, 1.2% African American, 0.3% Native American, 1.2% Asian, 0.1% Pacific Islander, 1.2% from other races, and 1.7% from two or more races. Hispanic or Latino of any race were 3.2% of the population.
The median age in Hot Springs Village was 68.2 years. About 20.2% of residents were under the age of 18, and 8.2% were 65 years of age or older. The gender makeup of Hot Springs Village was 48.2% male and 51.8% female.
Common Questions
What is Per Capita Income in Hot Springs Village?
Per Capita income in Hot Springs Village is $41,819.
What is the Median Family Income in Hot Springs Village?
Median Family Income in Hot Springs Village is $84,310.
What is the Median Household income in Hot Springs Village?
Median Household Income in Hot Springs Village is $68,580.
What is Income or Wage Gap in Hot Springs Village?
Income or Wage Gap in Hot Springs Village is 6.5%.
Women in Hot Springs Village earn 93.5 cents for every dollar earned by a man.
What is Inequality or Gini Index in Hot Springs Village?
Inequality or Gini Index in Hot Springs Village is 0.41.
What is the Total Population of Hot Springs Village?
Total Population of Hot Springs Village is 16,843.
What is the Total Male Population of Hot Springs Village?
Total Male Population of Hot Springs Village is 8,029.
What is the Total Female Population of Hot Springs Village?
Total Female Population of Hot Springs Village is 8,814.
What is the Ratio of Males per 100 Females in Hot Springs Village?
There are 91.09 Males per 100 Females in Hot Springs Village.
What is the Ratio of Females per 100 Males in Hot Springs Village?
There are 109.78 Females per 100 Males in Hot Springs Village.
What is the Median Population Age in Hot Springs Village?
Median Population Age in Hot Springs Village is 69.7 Years.
What is the Average Family Size in Hot Springs Village
Average Family Size in Hot Springs Village is 2.3 People.
What is the Average Household Size in Hot Springs Village
Average Household Size in Hot Springs Village is 2.0 People.
How Large is the Labor Force in Hot Springs Village?
There are 4,385 People in the Labor Forcein in Hot Springs Village.
What is the Percentage of People in the Labor Force in Hot Springs Village?
27.2% of People are in the Labor Force in Hot Springs Village.
What is the Unemployment Rate in Hot Springs Village?
Unemployment Rate in Hot Springs Village is 4.7%.