El Dorado, AR Map & Demographics
El Dorado Map
El Dorado Overview
$25,284
PER CAPITA INCOME
$56,851
AVG FAMILY INCOME
$46,869
AVG HOUSEHOLD INCOME
33.9%
WAGE / INCOME GAP [ % ]
66.1¢/ $1
WAGE / INCOME GAP [ $ ]
0.46
INEQUALITY / GINI INDEX
17,606
TOTAL POPULATION
8,695
MALE POPULATION
8,911
FEMALE POPULATION
97.58
MALES / 100 FEMALES
102.48
FEMALES / 100 MALES
36.4
MEDIAN AGE
3.6
AVG FAMILY SIZE
2.6
AVG HOUSEHOLD SIZE
7,654
LABOR FORCE [ PEOPLE ]
55.9%
PERCENT IN LABOR FORCE
4.3%
UNEMPLOYMENT RATE
El Dorado Zip Codes
El Dorado Area Codes
Income in El Dorado
Income Overview in El Dorado
Per Capita Income in El Dorado is $25,284, while median incomes of families and households are $56,851 and $46,869 respectively.
| Characteristic | Number | Measure |
| Per Capita Income | 17,606 | $25,284 |
| Median Family Income | 3,841 | $56,851 |
| Mean Family Income | 3,841 | $70,866 |
| Median Household Income | 6,574 | $46,869 |
| Mean Household Income | 6,574 | $61,547 |
| Income Deficit | 3,841 | $0 |
| Wage / Income Gap (%) | 17,606 | 33.92% |
| Wage / Income Gap ($) | 17,606 | 66.08¢ per $1 |
| Gini / Inequality Index | 17,606 | 0.46 |
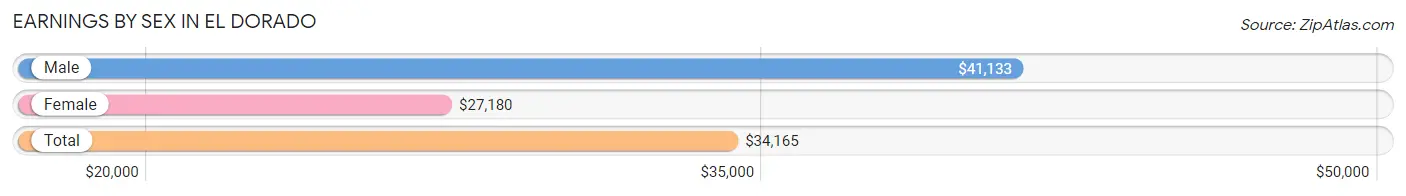
Earnings by Sex in El Dorado
Average Earnings in El Dorado are $34,165, $41,133 for men and $27,180 for women, a difference of 33.9%.
| Sex | Number | Average Earnings |
| Male | 3,887 (49.9%) | $41,133 |
| Female | 3,902 (50.1%) | $27,180 |
| Total | 7,789 (100.0%) | $34,165 |
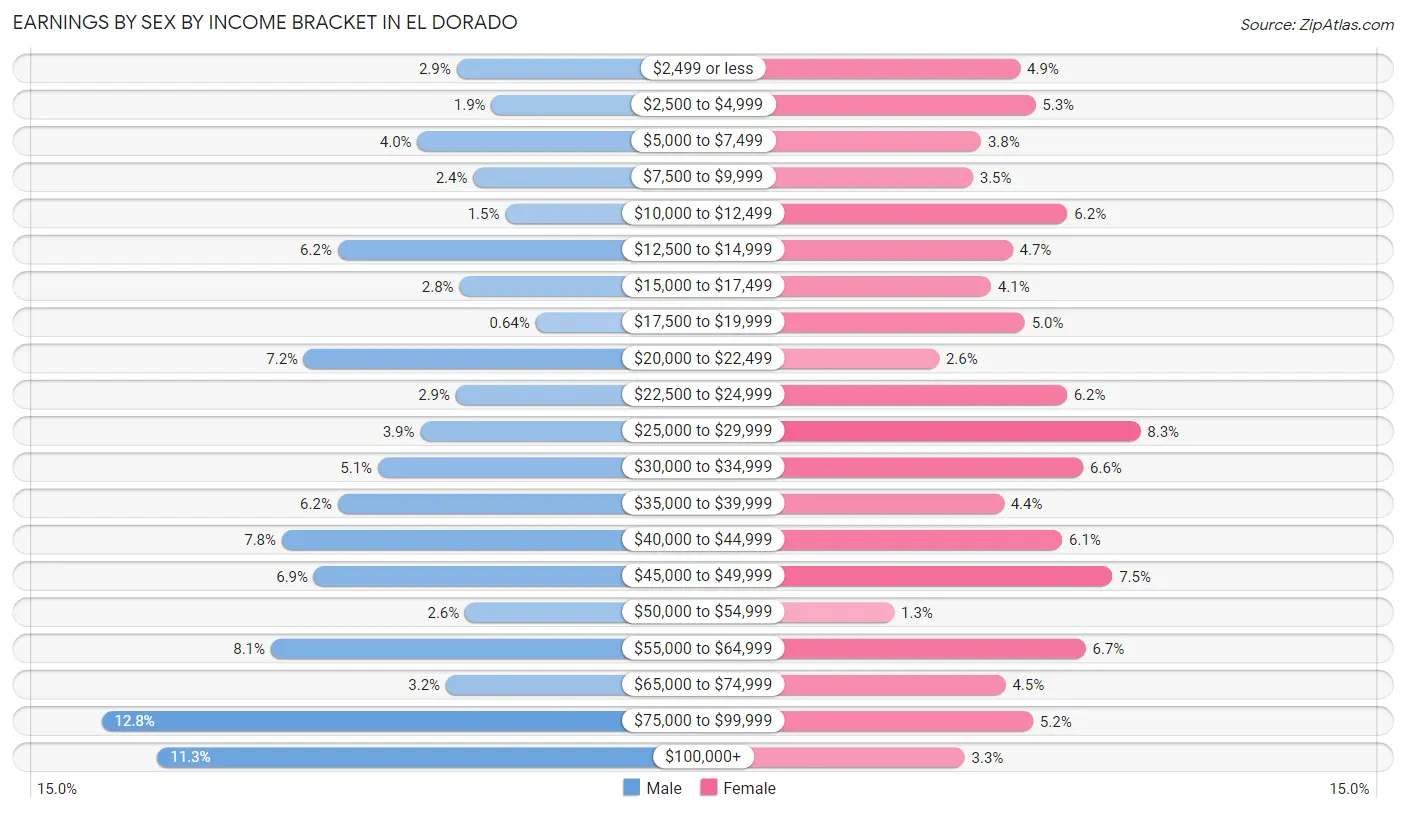
Earnings by Sex by Income Bracket in El Dorado
The most common earnings brackets in El Dorado are $75,000 to $99,999 for men (499 | 12.8%) and $25,000 to $29,999 for women (322 | 8.3%).
| Income | Male | Female |
| $2,499 or less | 111 (2.9%) | 190 (4.9%) |
| $2,500 to $4,999 | 73 (1.9%) | 207 (5.3%) |
| $5,000 to $7,499 | 154 (4.0%) | 147 (3.8%) |
| $7,500 to $9,999 | 93 (2.4%) | 138 (3.5%) |
| $10,000 to $12,499 | 58 (1.5%) | 242 (6.2%) |
| $12,500 to $14,999 | 241 (6.2%) | 182 (4.7%) |
| $15,000 to $17,499 | 108 (2.8%) | 158 (4.1%) |
| $17,500 to $19,999 | 25 (0.6%) | 195 (5.0%) |
| $20,000 to $22,499 | 278 (7.1%) | 101 (2.6%) |
| $22,500 to $24,999 | 112 (2.9%) | 241 (6.2%) |
| $25,000 to $29,999 | 151 (3.9%) | 322 (8.3%) |
| $30,000 to $34,999 | 197 (5.1%) | 259 (6.6%) |
| $35,000 to $39,999 | 241 (6.2%) | 172 (4.4%) |
| $40,000 to $44,999 | 302 (7.8%) | 236 (6.0%) |
| $45,000 to $49,999 | 267 (6.9%) | 291 (7.5%) |
| $50,000 to $54,999 | 102 (2.6%) | 52 (1.3%) |
| $55,000 to $64,999 | 314 (8.1%) | 262 (6.7%) |
| $65,000 to $74,999 | 123 (3.2%) | 174 (4.5%) |
| $75,000 to $99,999 | 499 (12.8%) | 204 (5.2%) |
| $100,000+ | 438 (11.3%) | 129 (3.3%) |
| Total | 3,887 (100.0%) | 3,902 (100.0%) |
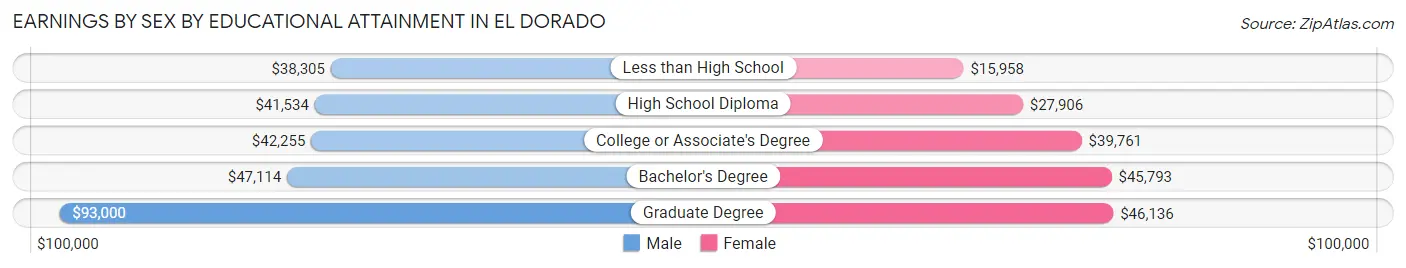
Earnings by Sex by Educational Attainment in El Dorado
Average earnings in El Dorado are $45,007 for men and $31,862 for women, a difference of 29.2%. Men with an educational attainment of graduate degree enjoy the highest average annual earnings of $93,000, while those with less than high school education earn the least with $38,305. Women with an educational attainment of graduate degree earn the most with the average annual earnings of $46,136, while those with less than high school education have the smallest earnings of $15,958.
| Educational Attainment | Male Income | Female Income |
| Less than High School | $38,305 | $15,958 |
| High School Diploma | $41,534 | $27,906 |
| College or Associate's Degree | $42,255 | $39,761 |
| Bachelor's Degree | $47,114 | $45,793 |
| Graduate Degree | $93,000 | $46,136 |
| Total | $45,007 | $31,862 |
Family Income in El Dorado
Family Income Brackets in El Dorado
According to the El Dorado family income data, there are 768 families falling into the $50,000 to $74,999 income range, which is the most common income bracket and makes up 20.0% of all families. Conversely, the $200,000+ income bracket is the least frequent group with only 131 families (3.4%) belonging to this category.
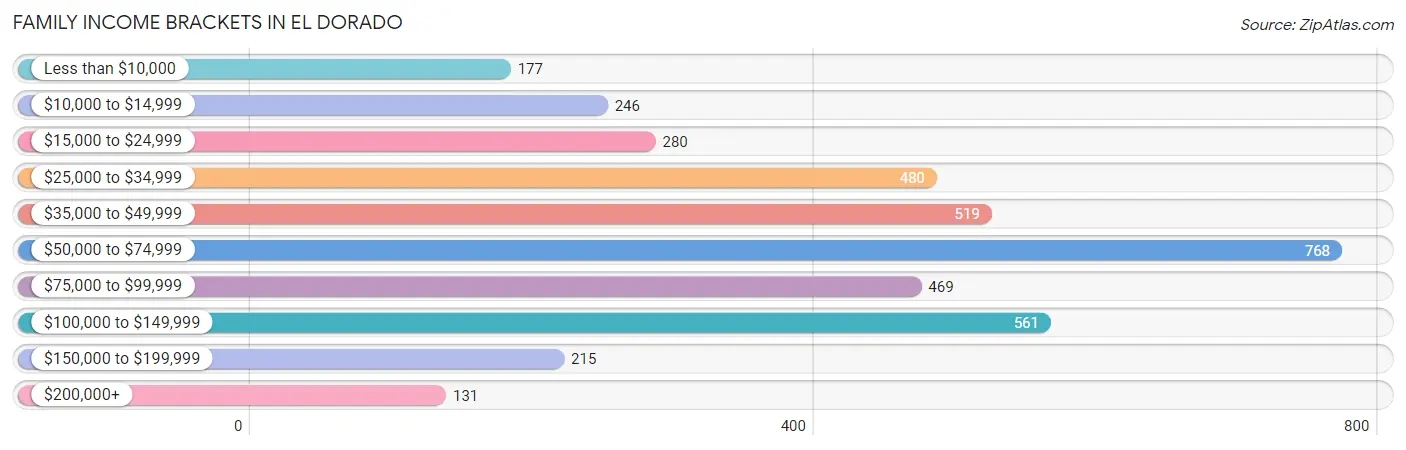
| Income Bracket | # Families | % Families |
| Less than $10,000 | 177 | 4.6% |
| $10,000 to $14,999 | 246 | 6.4% |
| $15,000 to $24,999 | 280 | 7.3% |
| $25,000 to $34,999 | 480 | 12.5% |
| $35,000 to $49,999 | 519 | 13.5% |
| $50,000 to $74,999 | 768 | 20.0% |
| $75,000 to $99,999 | 469 | 12.2% |
| $100,000 to $149,999 | 561 | 14.6% |
| $150,000 to $199,999 | 215 | 5.6% |
| $200,000+ | 131 | 3.4% |
Family Income by Famaliy Size in El Dorado
4-person families (652 | 17.0%) account for the highest median family income in El Dorado with $71,944 per family, while 2-person families (1,950 | 50.8%) have the highest median income of $22,928 per family member.
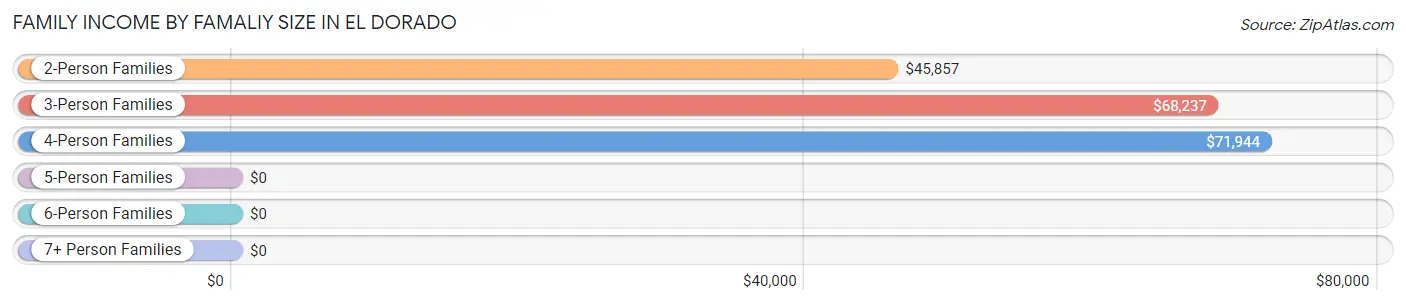
| Income Bracket | # Families | Median Income |
| 2-Person Families | 1,950 (50.8%) | $45,857 |
| 3-Person Families | 873 (22.7%) | $68,237 |
| 4-Person Families | 652 (17.0%) | $71,944 |
| 5-Person Families | 239 (6.2%) | $0 |
| 6-Person Families | 100 (2.6%) | $0 |
| 7+ Person Families | 27 (0.7%) | $0 |
| Total | 3,841 (100.0%) | $56,851 |
Family Income by Number of Earners in El Dorado
The median family income in El Dorado is $56,851, with families comprising 2 earners (1,181) having the highest median family income of $91,384, while families with no earners (556) have the lowest median family income of $30,192, accounting for 30.7% and 14.5% of families, respectively.
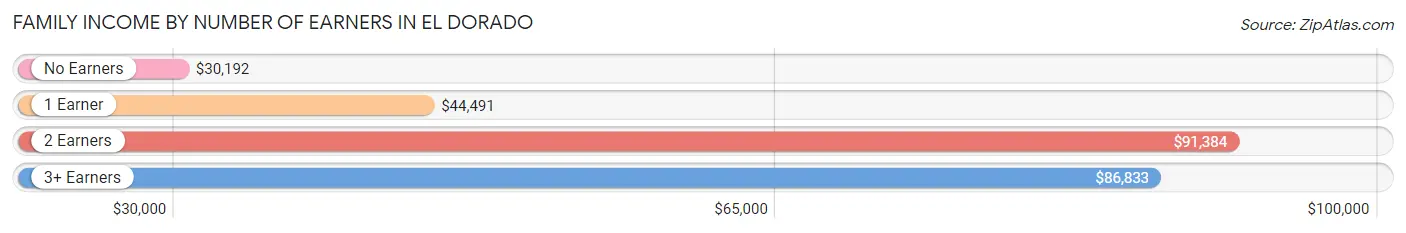
| Number of Earners | # Families | Median Income |
| No Earners | 556 (14.5%) | $30,192 |
| 1 Earner | 1,916 (49.9%) | $44,491 |
| 2 Earners | 1,181 (30.7%) | $91,384 |
| 3+ Earners | 188 (4.9%) | $86,833 |
| Total | 3,841 (100.0%) | $56,851 |
Household Income in El Dorado
Household Income Brackets in El Dorado
With 1,269 households falling in the category, the $50,000 to $74,999 income range is the most frequent in El Dorado, accounting for 19.3% of all households. In contrast, only 158 households (2.4%) fall into the $200,000+ income bracket, making it the least populous group.
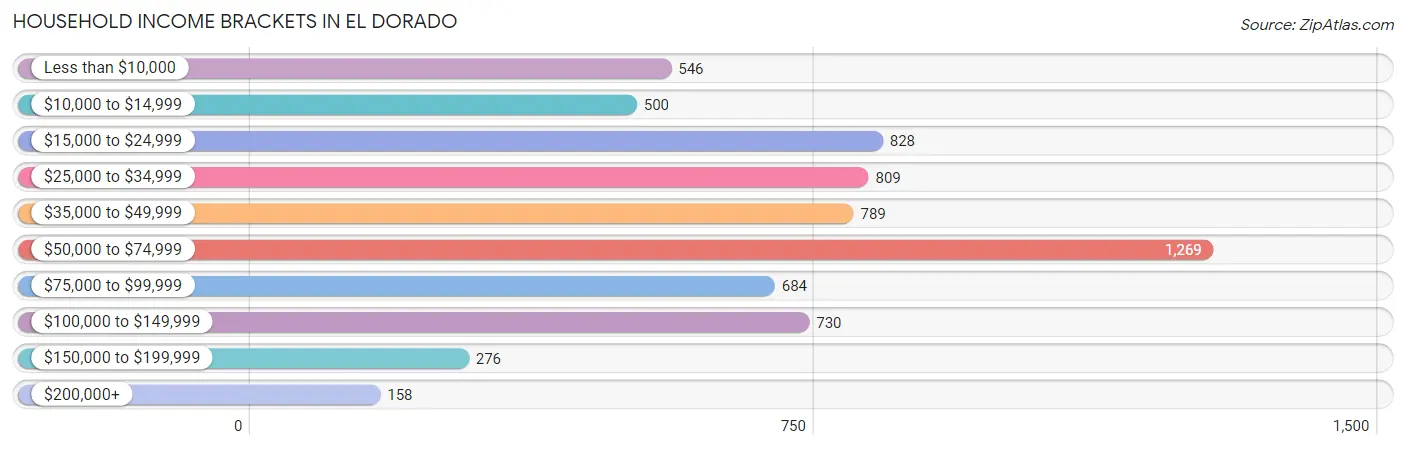
| Income Bracket | # Households | % Households |
| Less than $10,000 | 546 | 8.3% |
| $10,000 to $14,999 | 500 | 7.6% |
| $15,000 to $24,999 | 828 | 12.6% |
| $25,000 to $34,999 | 809 | 12.3% |
| $35,000 to $49,999 | 789 | 12.0% |
| $50,000 to $74,999 | 1,269 | 19.3% |
| $75,000 to $99,999 | 684 | 10.4% |
| $100,000 to $149,999 | 730 | 11.1% |
| $150,000 to $199,999 | 276 | 4.2% |
| $200,000+ | 158 | 2.4% |
Household Income by Householder Age in El Dorado
The median household income in El Dorado is $46,869, with the highest median household income of $56,057 found in the 25 to 44 years age bracket for the primary householder. A total of 2,347 households (35.7%) fall into this category. Meanwhile, the 15 to 24 years age bracket for the primary householder has the lowest median household income of $20,262, with 225 households (3.4%) in this group.
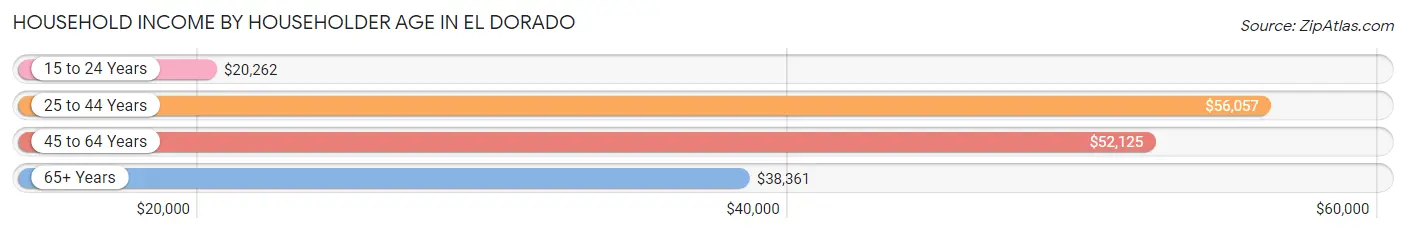
| Income Bracket | # Households | Median Income |
| 15 to 24 Years | 225 (3.4%) | $20,262 |
| 25 to 44 Years | 2,347 (35.7%) | $56,057 |
| 45 to 64 Years | 2,086 (31.7%) | $52,125 |
| 65+ Years | 1,916 (29.1%) | $38,361 |
| Total | 6,574 (100.0%) | $46,869 |
Poverty in El Dorado
Income Below Poverty by Sex and Age in El Dorado
With 19.5% poverty level for males and 24.8% for females among the residents of El Dorado, 6 to 11 year old males and under 5 year old females are the most vulnerable to poverty, with 366 males (38.1%) and 324 females (59.6%) in their respective age groups living below the poverty level.
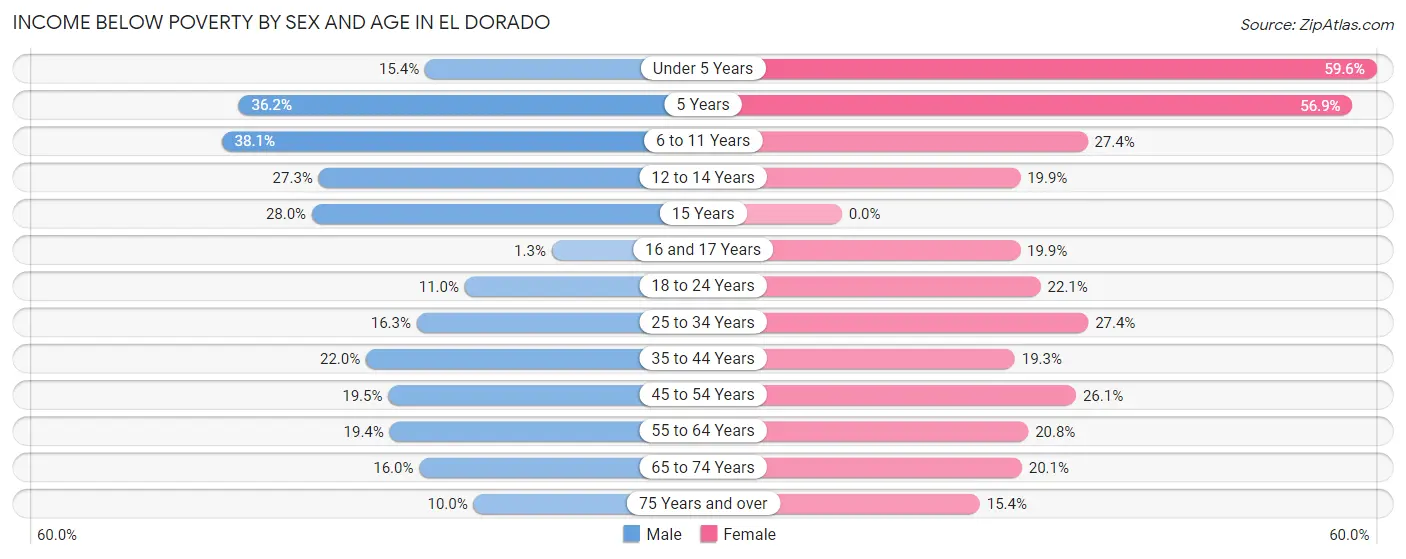
| Age Bracket | Male | Female |
| Under 5 Years | 77 (15.4%) | 324 (59.6%) |
| 5 Years | 51 (36.2%) | 58 (56.9%) |
| 6 to 11 Years | 366 (38.1%) | 200 (27.4%) |
| 12 to 14 Years | 130 (27.3%) | 60 (19.9%) |
| 15 Years | 7 (28.0%) | 0 (0.0%) |
| 16 and 17 Years | 4 (1.3%) | 27 (19.9%) |
| 18 to 24 Years | 77 (11.0%) | 176 (22.1%) |
| 25 to 34 Years | 236 (16.3%) | 363 (27.4%) |
| 35 to 44 Years | 201 (22.0%) | 238 (19.3%) |
| 45 to 54 Years | 212 (19.5%) | 242 (26.1%) |
| 55 to 64 Years | 166 (19.4%) | 181 (20.8%) |
| 65 to 74 Years | 107 (16.0%) | 160 (20.1%) |
| 75 Years and over | 58 (10.0%) | 119 (15.4%) |
| Total | 1,692 (19.5%) | 2,148 (24.8%) |
Income Above Poverty by Sex and Age in El Dorado
According to the poverty statistics in El Dorado, males aged 16 and 17 years and females aged 15 years are the age groups that are most secure financially, with 98.7% of males and 100.0% of females in these age groups living above the poverty line.
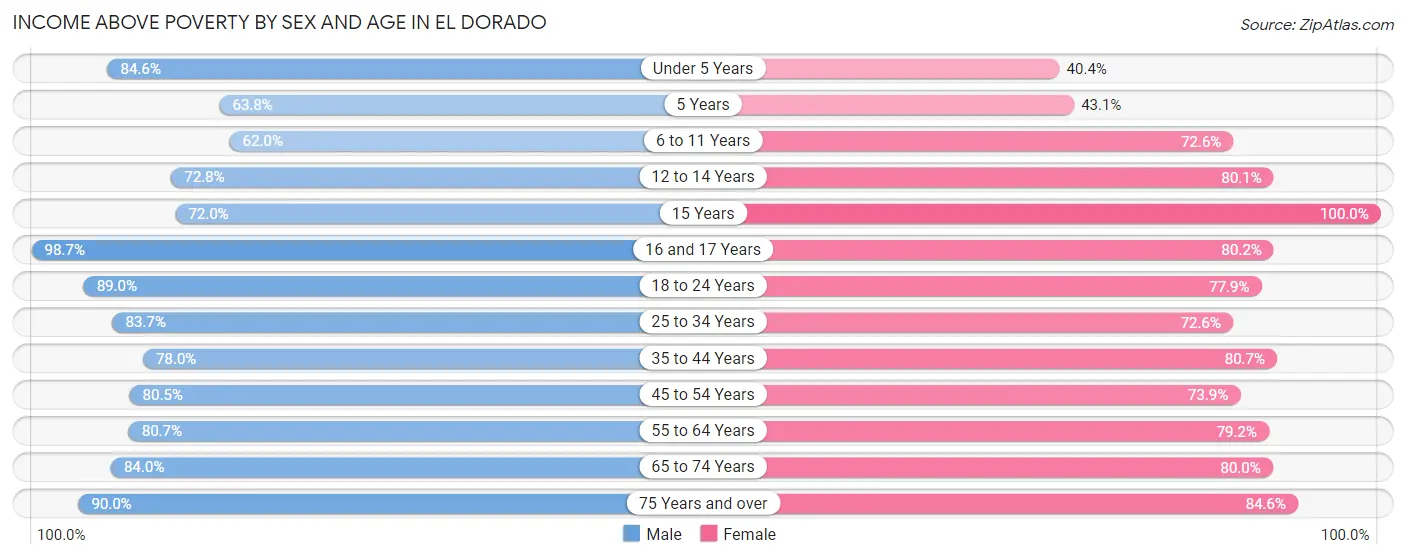
| Age Bracket | Male | Female |
| Under 5 Years | 423 (84.6%) | 220 (40.4%) |
| 5 Years | 90 (63.8%) | 44 (43.1%) |
| 6 to 11 Years | 596 (62.0%) | 531 (72.6%) |
| 12 to 14 Years | 347 (72.8%) | 242 (80.1%) |
| 15 Years | 18 (72.0%) | 122 (100.0%) |
| 16 and 17 Years | 306 (98.7%) | 109 (80.1%) |
| 18 to 24 Years | 624 (89.0%) | 619 (77.9%) |
| 25 to 34 Years | 1,210 (83.7%) | 960 (72.6%) |
| 35 to 44 Years | 714 (78.0%) | 997 (80.7%) |
| 45 to 54 Years | 875 (80.5%) | 686 (73.9%) |
| 55 to 64 Years | 692 (80.6%) | 691 (79.2%) |
| 65 to 74 Years | 560 (84.0%) | 638 (79.9%) |
| 75 Years and over | 522 (90.0%) | 655 (84.6%) |
| Total | 6,977 (80.5%) | 6,514 (75.2%) |
Income Below Poverty Among Married-Couple Families in El Dorado
The poverty statistics for married-couple families in El Dorado show that 12.3% or 298 of the total 2,426 families live below the poverty line. Families with 3 or 4 children have the highest poverty rate of 31.7%, comprising of 53 families. On the other hand, families with 5 or more children have the lowest poverty rate of 0.0%, which includes 0 families.
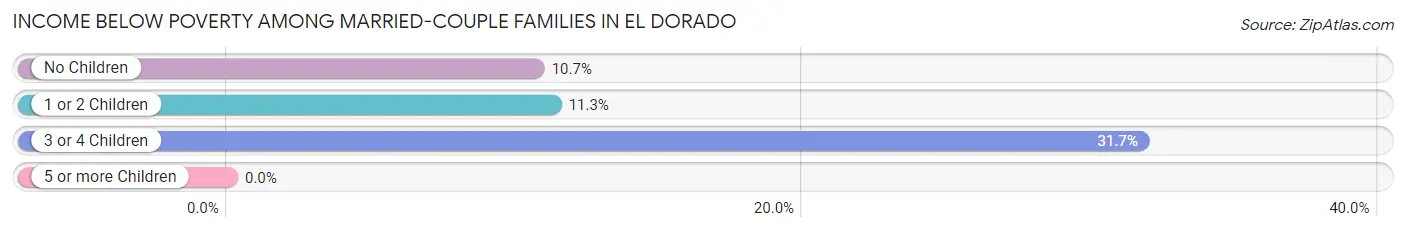
| Children | Above Poverty | Below Poverty |
| No Children | 1,322 (89.3%) | 158 (10.7%) |
| 1 or 2 Children | 685 (88.7%) | 87 (11.3%) |
| 3 or 4 Children | 114 (68.3%) | 53 (31.7%) |
| 5 or more Children | 7 (100.0%) | 0 (0.0%) |
| Total | 2,128 (87.7%) | 298 (12.3%) |
Income Below Poverty Among Single-Parent Households in El Dorado
According to the poverty data in El Dorado, 17.4% or 46 single-father households and 31.5% or 363 single-mother households are living below the poverty line. Among single-father households, those with 1 or 2 children have the highest poverty rate, with 46 households (35.1%) experiencing poverty. Likewise, among single-mother households, those with 3 or 4 children have the highest poverty rate, with 135 households (100.0%) falling below the poverty line.
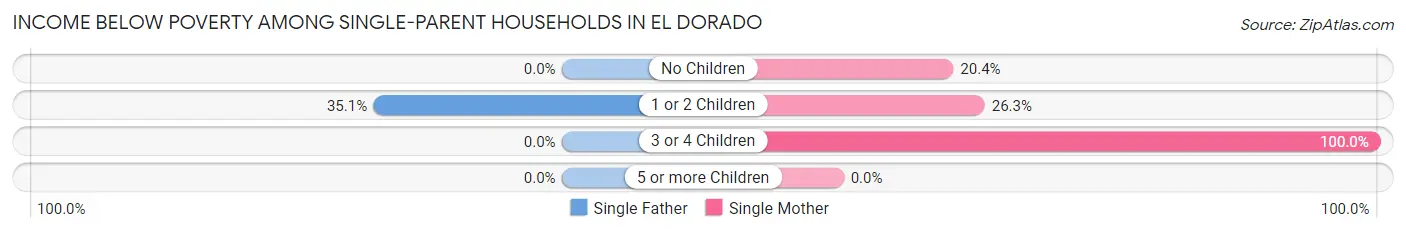
| Children | Single Father | Single Mother |
| No Children | 0 (0.0%) | 111 (20.4%) |
| 1 or 2 Children | 46 (35.1%) | 117 (26.3%) |
| 3 or 4 Children | 0 (0.0%) | 135 (100.0%) |
| 5 or more Children | 0 (0.0%) | 0 (0.0%) |
| Total | 46 (17.4%) | 363 (31.5%) |
Income Below Poverty Among Married-Couple vs Single-Parent Households in El Dorado
The poverty data for El Dorado shows that 298 of the married-couple family households (12.3%) and 409 of the single-parent households (28.9%) are living below the poverty level. Within the married-couple family households, those with 3 or 4 children have the highest poverty rate, with 53 households (31.7%) falling below the poverty line. Among the single-parent households, those with 3 or 4 children have the highest poverty rate, with 135 household (88.8%) living below poverty.
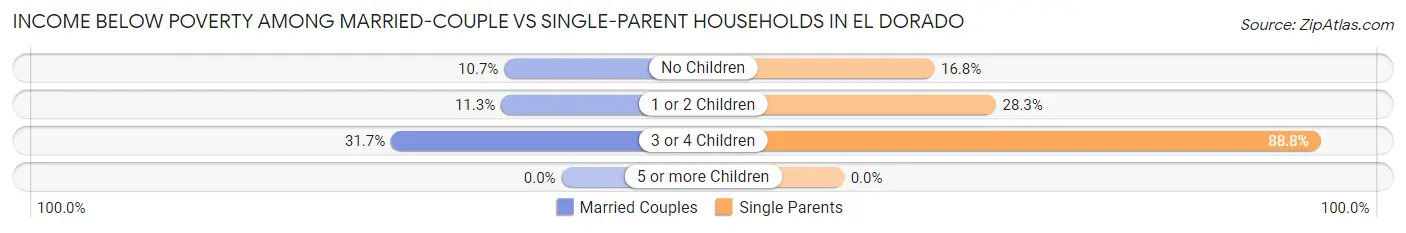
| Children | Married-Couple Families | Single-Parent Households |
| No Children | 158 (10.7%) | 111 (16.8%) |
| 1 or 2 Children | 87 (11.3%) | 163 (28.3%) |
| 3 or 4 Children | 53 (31.7%) | 135 (88.8%) |
| 5 or more Children | 0 (0.0%) | 0 (0.0%) |
| Total | 298 (12.3%) | 409 (28.9%) |
Race in El Dorado
The most populous races in El Dorado are Black / African American (8,519 | 48.4%), White / Caucasian (8,140 | 46.2%), and Hispanic or Latino (845 | 4.8%).
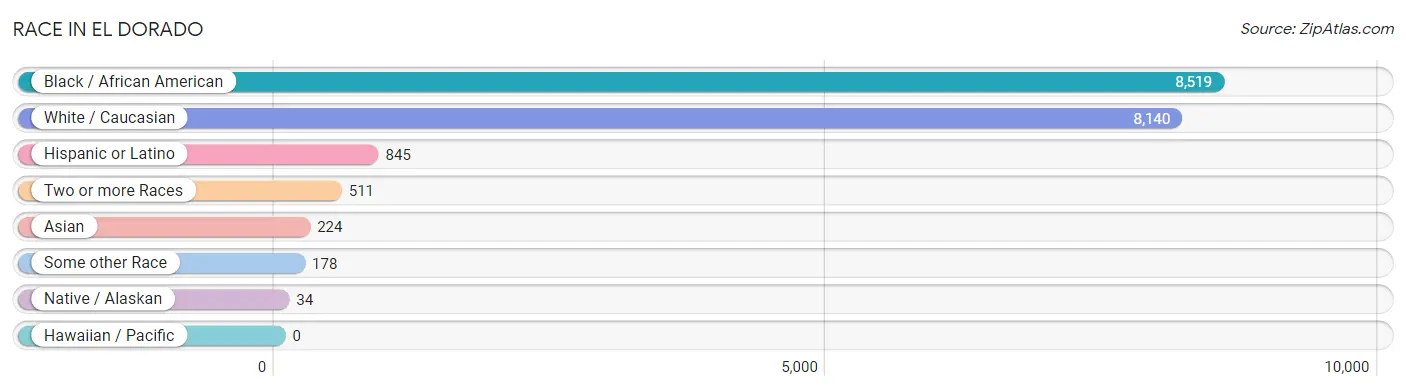
| Race | # Population | % Population |
| Asian | 224 | 1.3% |
| Black / African American | 8,519 | 48.4% |
| Hawaiian / Pacific | 0 | 0.0% |
| Hispanic or Latino | 845 | 4.8% |
| Native / Alaskan | 34 | 0.2% |
| White / Caucasian | 8,140 | 46.2% |
| Two or more Races | 511 | 2.9% |
| Some other Race | 178 | 1.0% |
| Total | 17,606 | 100.0% |
Ancestry in El Dorado
The most populous ancestries reported in El Dorado are American (2,918 | 16.6%), English (1,130 | 6.4%), German (853 | 4.8%), Mexican (816 | 4.6%), and Irish (675 | 3.8%), together accounting for 36.3% of all El Dorado residents.
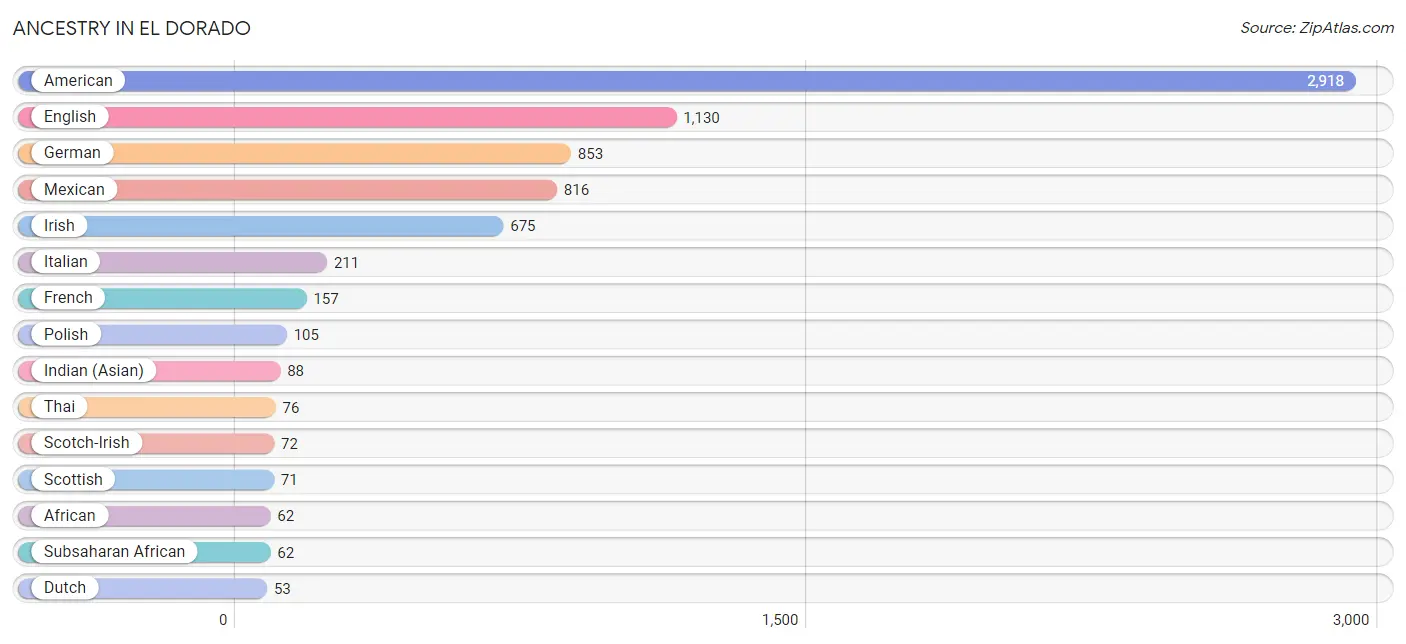
| Ancestry | # Population | % Population |
| African | 62 | 0.4% |
| American | 2,918 | 16.6% |
| Arab | 15 | 0.1% |
| Argentinean | 19 | 0.1% |
| British | 9 | 0.1% |
| Burmese | 51 | 0.3% |
| Canadian | 8 | 0.1% |
| Cherokee | 34 | 0.2% |
| Choctaw | 28 | 0.2% |
| Danish | 38 | 0.2% |
| Dutch | 53 | 0.3% |
| English | 1,130 | 6.4% |
| European | 50 | 0.3% |
| Finnish | 23 | 0.1% |
| French | 157 | 0.9% |
| French Canadian | 24 | 0.1% |
| German | 853 | 4.8% |
| Indian (Asian) | 88 | 0.5% |
| Irish | 675 | 3.8% |
| Italian | 211 | 1.2% |
| Lebanese | 7 | 0.0% |
| Mexican | 816 | 4.6% |
| Native Hawaiian | 4 | 0.0% |
| Northern European | 32 | 0.2% |
| Norwegian | 13 | 0.1% |
| Polish | 105 | 0.6% |
| Puerto Rican | 4 | 0.0% |
| Russian | 15 | 0.1% |
| Scandinavian | 28 | 0.2% |
| Scotch-Irish | 72 | 0.4% |
| Scottish | 71 | 0.4% |
| South American | 21 | 0.1% |
| Sri Lankan | 24 | 0.1% |
| Subsaharan African | 62 | 0.4% |
| Swedish | 19 | 0.1% |
| Swiss | 25 | 0.1% |
| Syrian | 8 | 0.1% |
| Thai | 76 | 0.4% |
| Venezuelan | 2 | 0.0% |
| Welsh | 8 | 0.1% | View All 40 Rows |
Immigrants in El Dorado
The most numerous immigrant groups reported in El Dorado came from Latin America (346 | 2.0%), Central America (327 | 1.9%), Mexico (327 | 1.9%), Asia (155 | 0.9%), and India (76 | 0.4%), together accounting for 7.0% of all El Dorado residents.
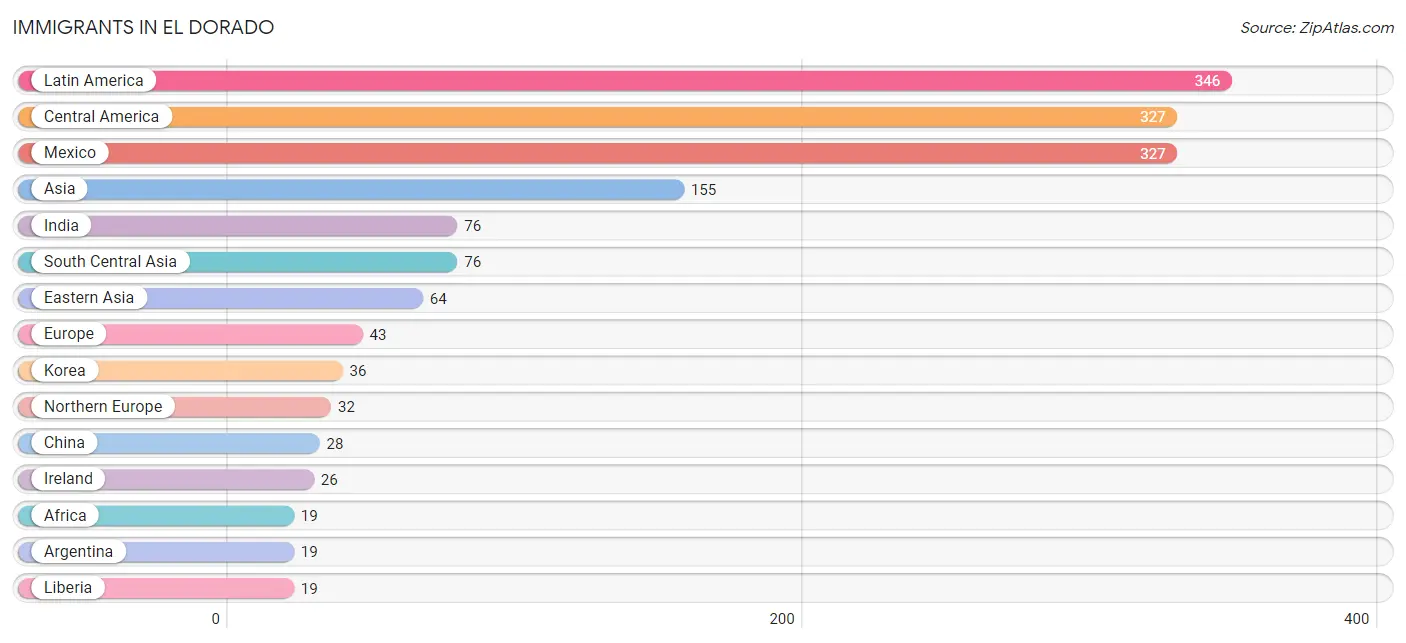
| Immigration Origin | # Population | % Population |
| Africa | 19 | 0.1% |
| Argentina | 19 | 0.1% |
| Asia | 155 | 0.9% |
| Central America | 327 | 1.9% |
| China | 28 | 0.2% |
| Eastern Asia | 64 | 0.4% |
| Europe | 43 | 0.2% |
| Germany | 11 | 0.1% |
| India | 76 | 0.4% |
| Ireland | 26 | 0.2% |
| Korea | 36 | 0.2% |
| Latin America | 346 | 2.0% |
| Liberia | 19 | 0.1% |
| Mexico | 327 | 1.9% |
| Northern Europe | 32 | 0.2% |
| Scotland | 6 | 0.0% |
| South America | 19 | 0.1% |
| South Central Asia | 76 | 0.4% |
| South Eastern Asia | 15 | 0.1% |
| Vietnam | 15 | 0.1% |
| Western Africa | 19 | 0.1% |
| Western Europe | 11 | 0.1% | View All 22 Rows |
Sex and Age in El Dorado
Sex and Age in El Dorado
The most populous age groups in El Dorado are 10 to 14 Years (873 | 10.0%) for men and 40 to 44 Years (765 | 8.6%) for women.
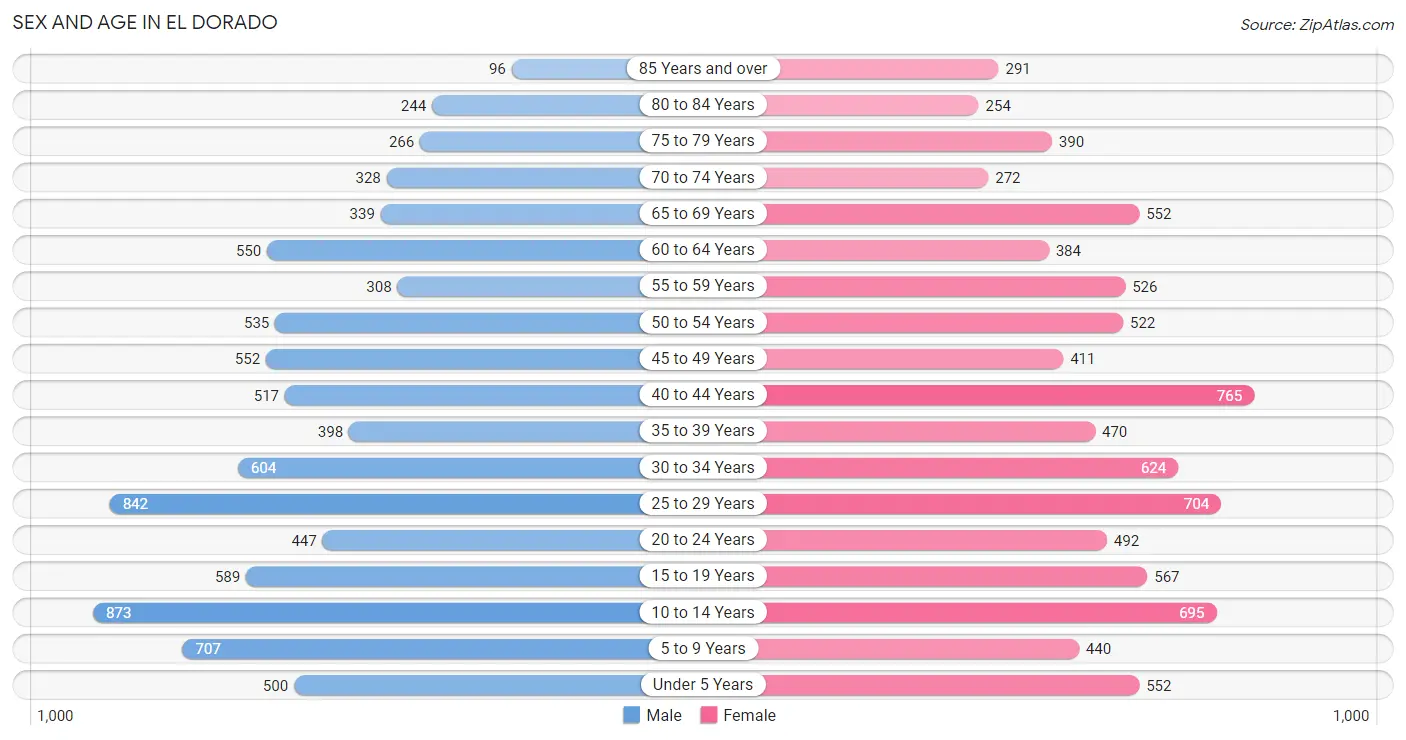
| Age Bracket | Male | Female |
| Under 5 Years | 500 (5.8%) | 552 (6.2%) |
| 5 to 9 Years | 707 (8.1%) | 440 (4.9%) |
| 10 to 14 Years | 873 (10.0%) | 695 (7.8%) |
| 15 to 19 Years | 589 (6.8%) | 567 (6.4%) |
| 20 to 24 Years | 447 (5.1%) | 492 (5.5%) |
| 25 to 29 Years | 842 (9.7%) | 704 (7.9%) |
| 30 to 34 Years | 604 (7.0%) | 624 (7.0%) |
| 35 to 39 Years | 398 (4.6%) | 470 (5.3%) |
| 40 to 44 Years | 517 (5.9%) | 765 (8.6%) |
| 45 to 49 Years | 552 (6.4%) | 411 (4.6%) |
| 50 to 54 Years | 535 (6.1%) | 522 (5.9%) |
| 55 to 59 Years | 308 (3.5%) | 526 (5.9%) |
| 60 to 64 Years | 550 (6.3%) | 384 (4.3%) |
| 65 to 69 Years | 339 (3.9%) | 552 (6.2%) |
| 70 to 74 Years | 328 (3.8%) | 272 (3.0%) |
| 75 to 79 Years | 266 (3.1%) | 390 (4.4%) |
| 80 to 84 Years | 244 (2.8%) | 254 (2.9%) |
| 85 Years and over | 96 (1.1%) | 291 (3.3%) |
| Total | 8,695 (100.0%) | 8,911 (100.0%) |
Families and Households in El Dorado
Median Family Size in El Dorado
The median family size in El Dorado is 3.56 persons per family, with single female/mother families (1,151 | 30.0%) accounting for the largest median family size of 3.85 persons per family. On the other hand, married-couple families (2,426 | 63.2%) represent the smallest median family size with 3.44 persons per family.
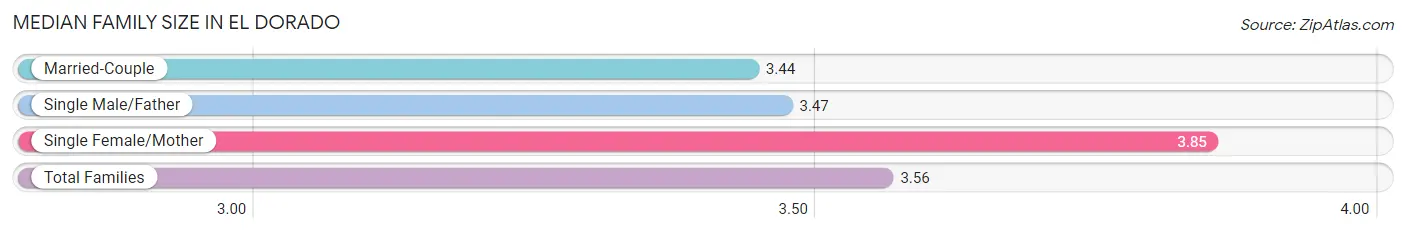
| Family Type | # Families | Family Size |
| Married-Couple | 2,426 (63.2%) | 3.44 |
| Single Male/Father | 264 (6.9%) | 3.47 |
| Single Female/Mother | 1,151 (30.0%) | 3.85 |
| Total Families | 3,841 (100.0%) | 3.56 |
Median Household Size in El Dorado
The median household size in El Dorado is 2.62 persons per household, with single male/father households (264 | 4.0%) accounting for the largest median household size of 4.11 persons per household. non-family households (2,733 | 41.6%) represent the smallest median household size with 1.17 persons per household.
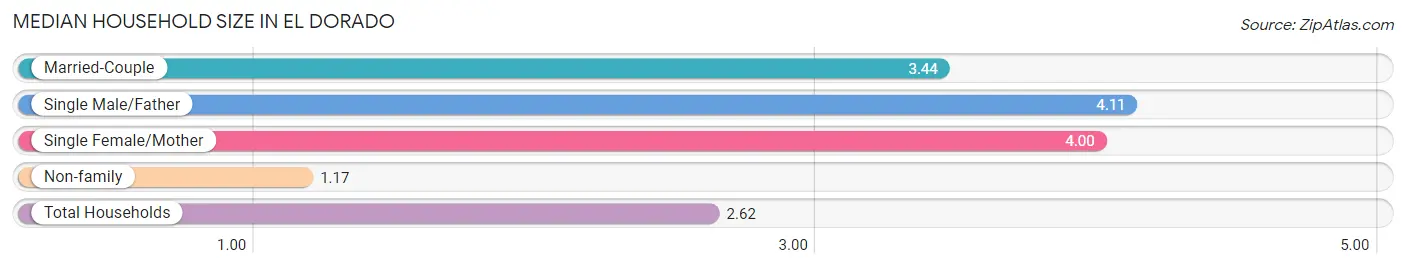
| Household Type | # Households | Household Size |
| Married-Couple | 2,426 (36.9%) | 3.44 |
| Single Male/Father | 264 (4.0%) | 4.11 |
| Single Female/Mother | 1,151 (17.5%) | 4.00 |
| Non-family | 2,733 (41.6%) | 1.17 |
| Total Households | 6,574 (100.0%) | 2.62 |
Household Size by Marriage Status in El Dorado
Out of a total of 6,574 households in El Dorado, 3,841 (58.4%) are family households, while 2,733 (41.6%) are nonfamily households. The most numerous type of family households are 2-person households, comprising 1,791, and the most common type of nonfamily households are 1-person households, comprising 2,427.
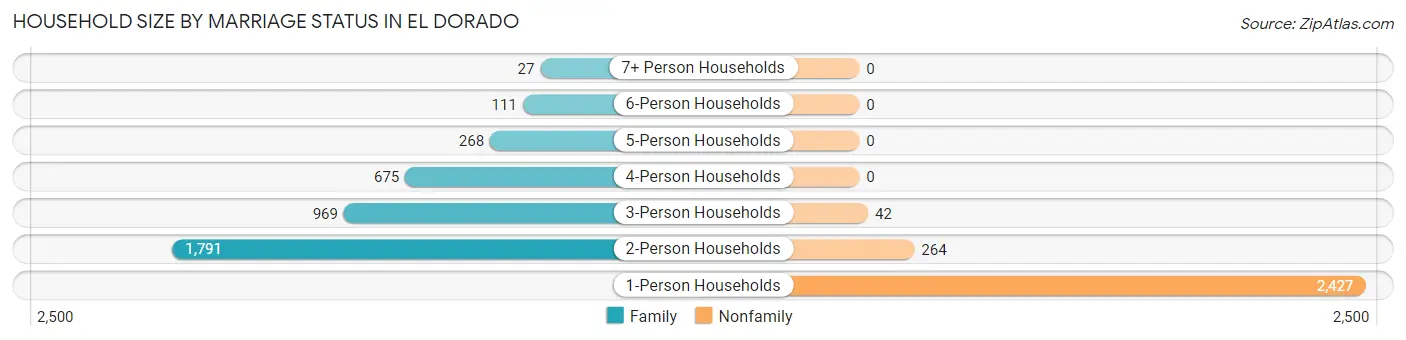
| Household Size | Family Households | Nonfamily Households |
| 1-Person Households | - | 2,427 (36.9%) |
| 2-Person Households | 1,791 (27.2%) | 264 (4.0%) |
| 3-Person Households | 969 (14.7%) | 42 (0.6%) |
| 4-Person Households | 675 (10.3%) | 0 (0.0%) |
| 5-Person Households | 268 (4.1%) | 0 (0.0%) |
| 6-Person Households | 111 (1.7%) | 0 (0.0%) |
| 7+ Person Households | 27 (0.4%) | 0 (0.0%) |
| Total | 3,841 (58.4%) | 2,733 (41.6%) |
Female Fertility in El Dorado
Fertility by Age in El Dorado
Average fertility rate in El Dorado is 45.0 births per 1,000 women. Women in the age bracket of 20 to 34 years have the highest fertility rate with 97.0 births per 1,000 women. Women in the age bracket of 20 to 34 years acount for 95.7% of all women with births.
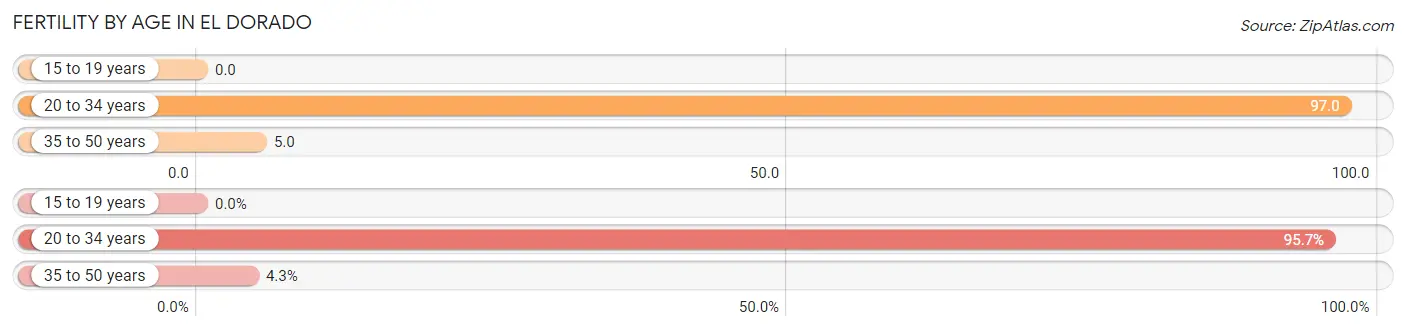
| Age Bracket | Women with Births | Births / 1,000 Women |
| 15 to 19 years | 0 (0.0%) | 0.0 |
| 20 to 34 years | 177 (95.7%) | 97.0 |
| 35 to 50 years | 8 (4.3%) | 5.0 |
| Total | 185 (100.0%) | 45.0 |
Fertility by Age by Marriage Status in El Dorado
37.8% of women with births (185) in El Dorado are married. The highest percentage of unmarried women with births falls into 20 to 34 years age bracket with 65.0% of them unmarried at the time of birth, while the lowest percentage of unmarried women with births belong to 35 to 50 years age bracket with 0.0% of them unmarried.
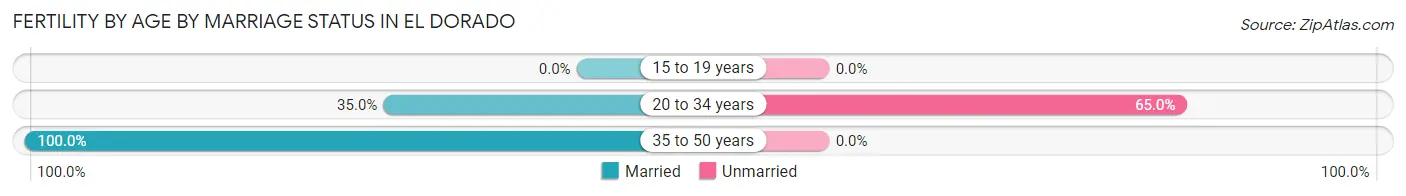
| Age Bracket | Married | Unmarried |
| 15 to 19 years | 0 (0.0%) | 0 (0.0%) |
| 20 to 34 years | 62 (35.0%) | 115 (65.0%) |
| 35 to 50 years | 8 (100.0%) | 0 (0.0%) |
| Total | 70 (37.8%) | 115 (62.2%) |
Fertility by Education in El Dorado
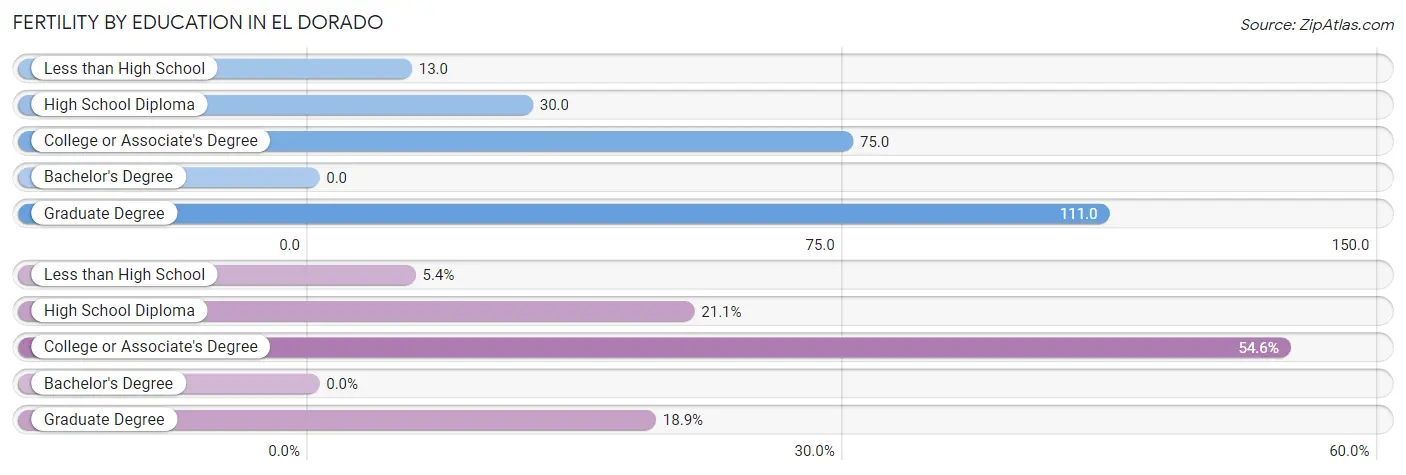
| Educational Attainment | Women with Births | Births / 1,000 Women |
| Less than High School | 10 (5.4%) | 13.0 |
| High School Diploma | 39 (21.1%) | 30.0 |
| College or Associate's Degree | 101 (54.6%) | 75.0 |
| Bachelor's Degree | 0 (0.0%) | 0.0 |
| Graduate Degree | 35 (18.9%) | 111.0 |
| Total | 185 (100.0%) | 45.0 |
Fertility by Education by Marriage Status in El Dorado
62.2% of women with births in El Dorado are unmarried. Women with the educational attainment of less than high school are most likely to be married with 100.0% of them married at childbirth, while women with the educational attainment of high school diploma are least likely to be married with 100.0% of them unmarried at childbirth.
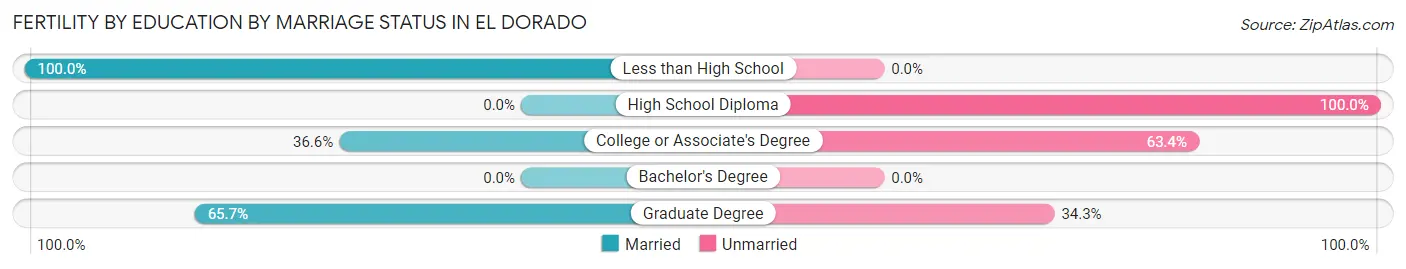
| Educational Attainment | Married | Unmarried |
| Less than High School | 10 (100.0%) | 0 (0.0%) |
| High School Diploma | 0 (0.0%) | 39 (100.0%) |
| College or Associate's Degree | 37 (36.6%) | 64 (63.4%) |
| Bachelor's Degree | 0 (0.0%) | 0 (0.0%) |
| Graduate Degree | 23 (65.7%) | 12 (34.3%) |
| Total | 70 (37.8%) | 115 (62.2%) |
Employment Characteristics in El Dorado
Employment by Class of Employer in El Dorado
Among the 7,216 employed individuals in El Dorado, private company employees (5,075 | 70.3%), state government employees (655 | 9.1%), and self-employed (not incorporated) (554 | 7.7%) make up the most common classes of employment.
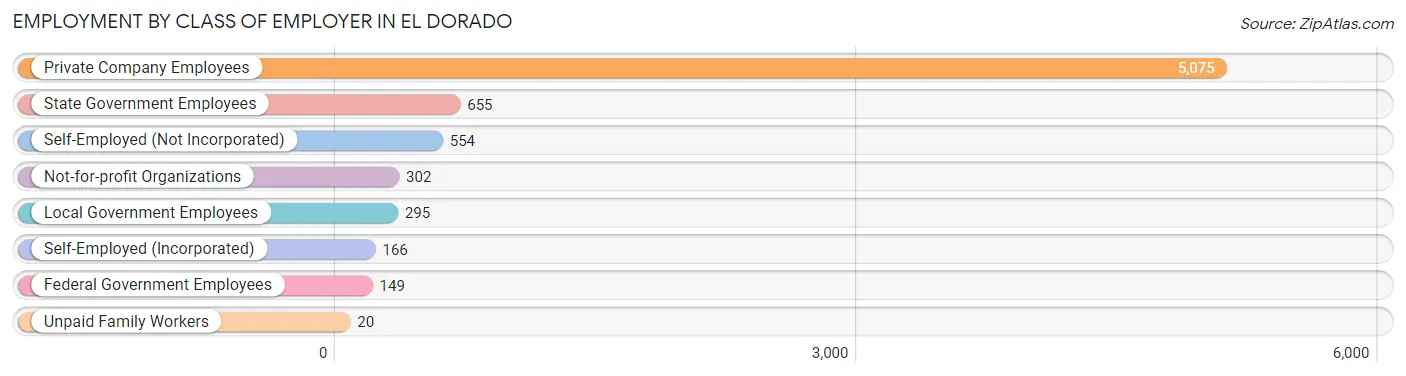
| Employer Class | # Employees | % Employees |
| Private Company Employees | 5,075 | 70.3% |
| Self-Employed (Incorporated) | 166 | 2.3% |
| Self-Employed (Not Incorporated) | 554 | 7.7% |
| Not-for-profit Organizations | 302 | 4.2% |
| Local Government Employees | 295 | 4.1% |
| State Government Employees | 655 | 9.1% |
| Federal Government Employees | 149 | 2.1% |
| Unpaid Family Workers | 20 | 0.3% |
| Total | 7,216 | 100.0% |
Employment Status by Age in El Dorado
According to the labor force statistics for El Dorado, out of the total population over 16 years of age (13,692), 55.9% or 7,654 individuals are in the labor force, with 4.3% or 329 of them unemployed. The age group with the highest labor force participation rate is 20 to 24 years, with 87.0% or 817 individuals in the labor force. Within the labor force, the 16 to 19 years age range has the highest percentage of unemployed individuals, with 25.6% or 79 of them being unemployed.
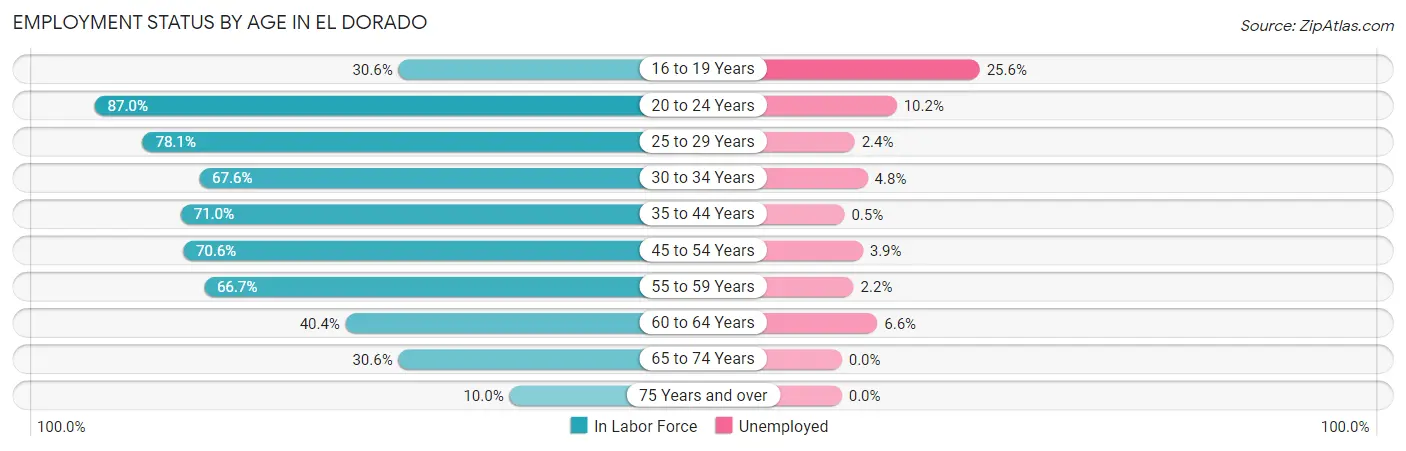
| Age Bracket | In Labor Force | Unemployed |
| 16 to 19 Years | 309 (30.6%) | 79 (25.6%) |
| 20 to 24 Years | 817 (87.0%) | 83 (10.2%) |
| 25 to 29 Years | 1,207 (78.1%) | 29 (2.4%) |
| 30 to 34 Years | 830 (67.6%) | 40 (4.8%) |
| 35 to 44 Years | 1,526 (71.0%) | 8 (0.5%) |
| 45 to 54 Years | 1,426 (70.6%) | 56 (3.9%) |
| 55 to 59 Years | 556 (66.7%) | 12 (2.2%) |
| 60 to 64 Years | 377 (40.4%) | 25 (6.6%) |
| 65 to 74 Years | 456 (30.6%) | 0 (0.0%) |
| 75 Years and over | 154 (10.0%) | 0 (0.0%) |
| Total | 7,654 (55.9%) | 329 (4.3%) |
Employment Status by Educational Attainment in El Dorado
According to labor force statistics for El Dorado, 68.0% of individuals (5,924) out of the total population between 25 and 64 years of age (8,712) are in the labor force, with 2.8% or 166 of them being unemployed. The group with the highest labor force participation rate are those with the educational attainment of bachelor's degree or higher, with 83.5% or 1,360 individuals in the labor force. Within the labor force, individuals with less than high school education have the highest percentage of unemployment, with 15.4% or 71 of them being unemployed.
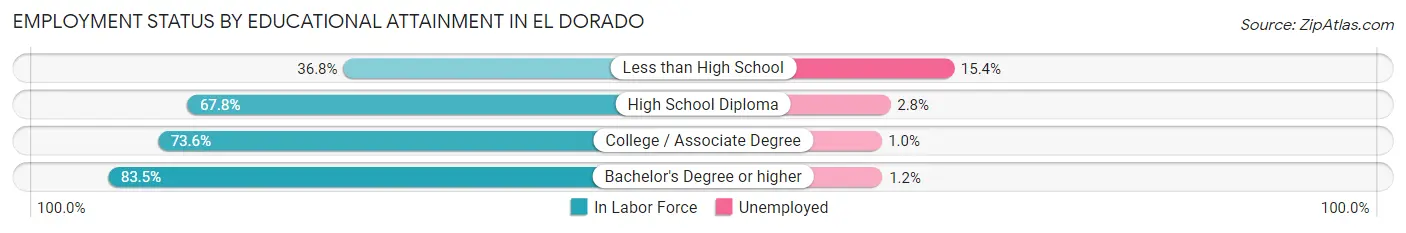
| Educational Attainment | In Labor Force | Unemployed |
| Less than High School | 461 (36.8%) | 193 (15.4%) |
| High School Diploma | 2,240 (67.8%) | 93 (2.8%) |
| College / Associate Degree | 1,858 (73.6%) | 25 (1.0%) |
| Bachelor's Degree or higher | 1,360 (83.5%) | 20 (1.2%) |
| Total | 5,924 (68.0%) | 244 (2.8%) |
Employment Occupations by Sex in El Dorado
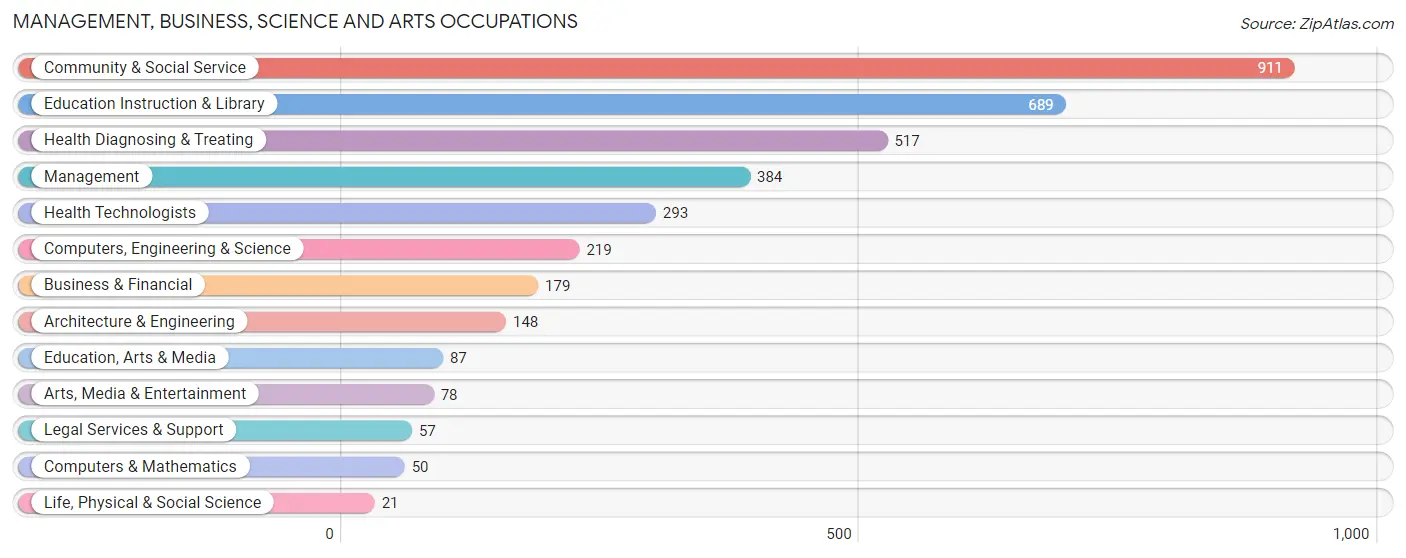
Management, Business, Science and Arts Occupations
The most common Management, Business, Science and Arts occupations in El Dorado are Community & Social Service (911 | 12.4%), Education Instruction & Library (689 | 9.4%), Health Diagnosing & Treating (517 | 7.0%), Management (384 | 5.2%), and Health Technologists (293 | 4.0%).
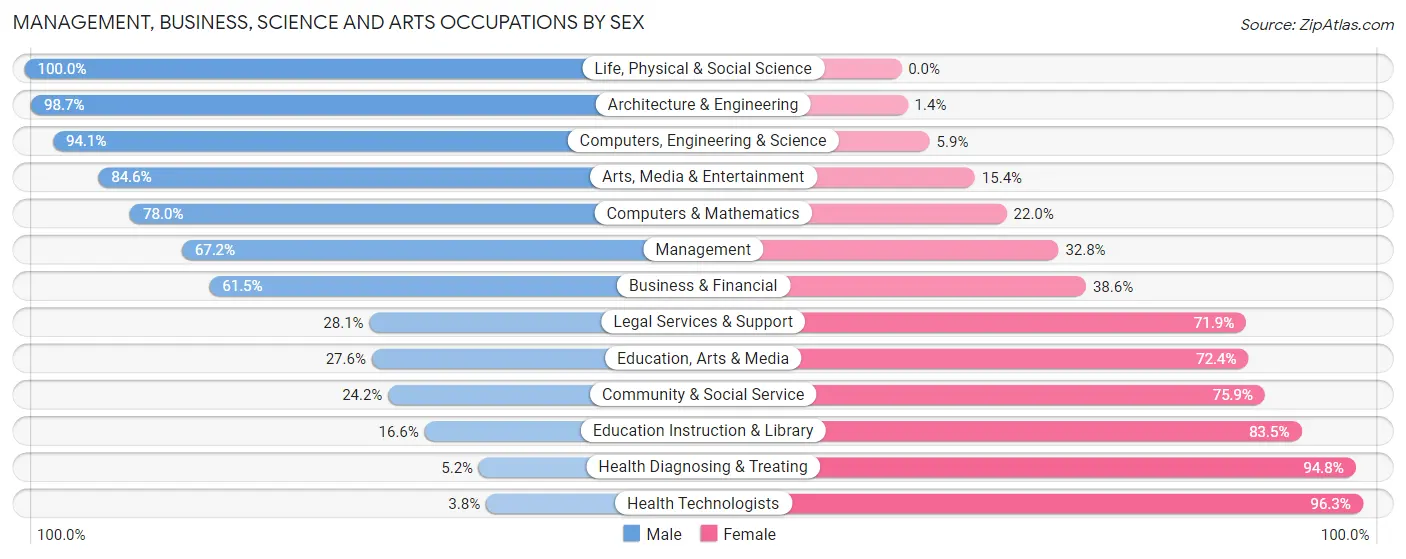
Management, Business, Science and Arts Occupations by Sex
Within the Management, Business, Science and Arts occupations in El Dorado, the most male-oriented occupations are Life, Physical & Social Science (100.0%), Architecture & Engineering (98.7%), and Computers, Engineering & Science (94.1%), while the most female-oriented occupations are Health Technologists (96.3%), Health Diagnosing & Treating (94.8%), and Education Instruction & Library (83.5%).
| Occupation | Male | Female |
| Management | 258 (67.2%) | 126 (32.8%) |
| Business & Financial | 110 (61.5%) | 69 (38.6%) |
| Computers, Engineering & Science | 206 (94.1%) | 13 (5.9%) |
| Computers & Mathematics | 39 (78.0%) | 11 (22.0%) |
| Architecture & Engineering | 146 (98.7%) | 2 (1.3%) |
| Life, Physical & Social Science | 21 (100.0%) | 0 (0.0%) |
| Community & Social Service | 220 (24.1%) | 691 (75.8%) |
| Education, Arts & Media | 24 (27.6%) | 63 (72.4%) |
| Legal Services & Support | 16 (28.1%) | 41 (71.9%) |
| Education Instruction & Library | 114 (16.6%) | 575 (83.5%) |
| Arts, Media & Entertainment | 66 (84.6%) | 12 (15.4%) |
| Health Diagnosing & Treating | 27 (5.2%) | 490 (94.8%) |
| Health Technologists | 11 (3.7%) | 282 (96.3%) |
| Total (Category) | 821 (37.1%) | 1,389 (62.8%) |
| Total (Overall) | 3,660 (49.9%) | 3,669 (50.1%) |
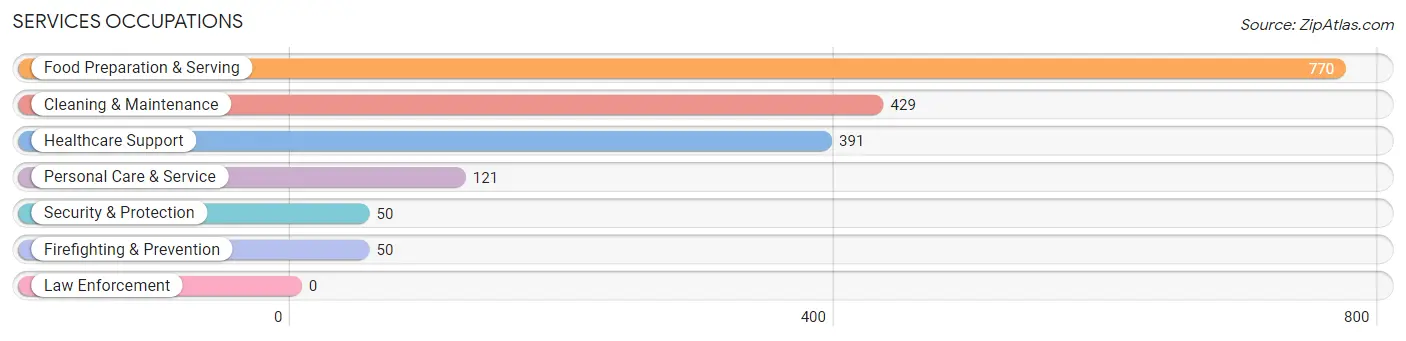
Services Occupations
The most common Services occupations in El Dorado are Food Preparation & Serving (770 | 10.5%), Cleaning & Maintenance (429 | 5.9%), Healthcare Support (391 | 5.3%), Personal Care & Service (121 | 1.7%), and Security & Protection (50 | 0.7%).
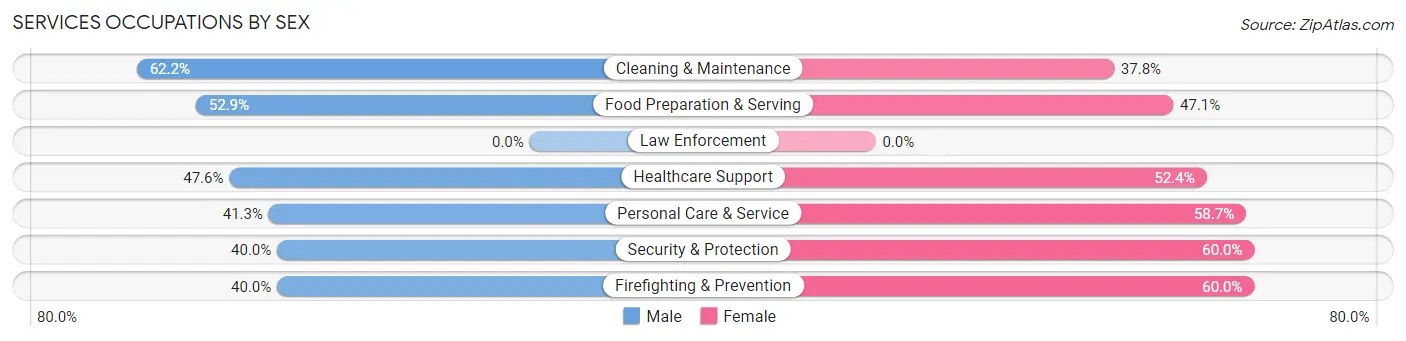
Services Occupations by Sex
Within the Services occupations in El Dorado, the most male-oriented occupations are Cleaning & Maintenance (62.2%), Food Preparation & Serving (52.9%), and Healthcare Support (47.6%), while the most female-oriented occupations are Security & Protection (60.0%), Firefighting & Prevention (60.0%), and Personal Care & Service (58.7%).
| Occupation | Male | Female |
| Healthcare Support | 186 (47.6%) | 205 (52.4%) |
| Security & Protection | 20 (40.0%) | 30 (60.0%) |
| Firefighting & Prevention | 20 (40.0%) | 30 (60.0%) |
| Law Enforcement | 0 (0.0%) | 0 (0.0%) |
| Food Preparation & Serving | 407 (52.9%) | 363 (47.1%) |
| Cleaning & Maintenance | 267 (62.2%) | 162 (37.8%) |
| Personal Care & Service | 50 (41.3%) | 71 (58.7%) |
| Total (Category) | 930 (52.8%) | 831 (47.2%) |
| Total (Overall) | 3,660 (49.9%) | 3,669 (50.1%) |
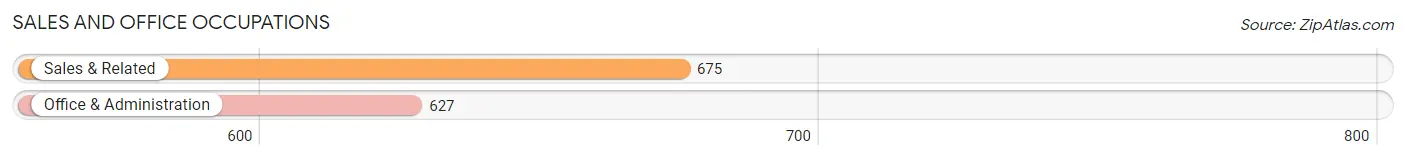
Sales and Office Occupations
The most common Sales and Office occupations in El Dorado are Sales & Related (675 | 9.2%), and Office & Administration (627 | 8.6%).
Sales and Office Occupations by Sex
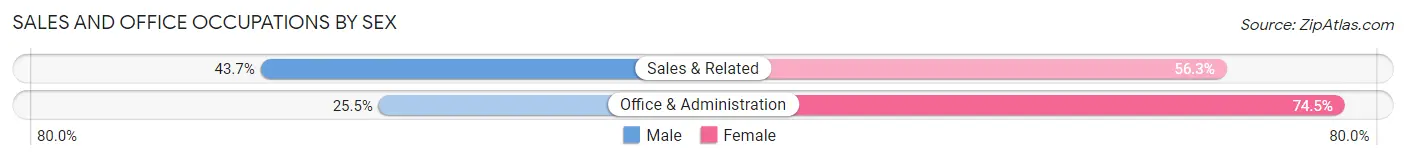
| Occupation | Male | Female |
| Sales & Related | 295 (43.7%) | 380 (56.3%) |
| Office & Administration | 160 (25.5%) | 467 (74.5%) |
| Total (Category) | 455 (34.9%) | 847 (65.0%) |
| Total (Overall) | 3,660 (49.9%) | 3,669 (50.1%) |
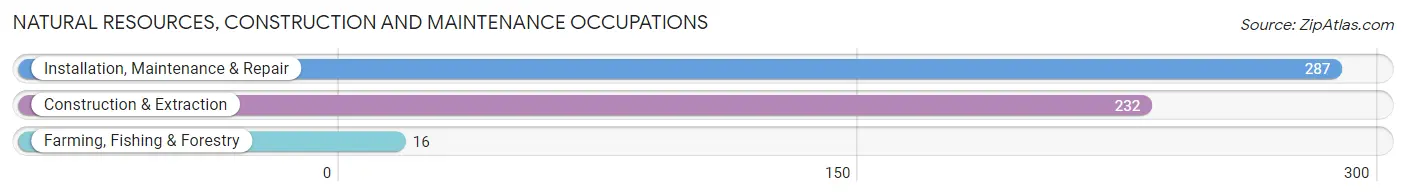
Natural Resources, Construction and Maintenance Occupations
The most common Natural Resources, Construction and Maintenance occupations in El Dorado are Installation, Maintenance & Repair (287 | 3.9%), Construction & Extraction (232 | 3.2%), and Farming, Fishing & Forestry (16 | 0.2%).
Natural Resources, Construction and Maintenance Occupations by Sex
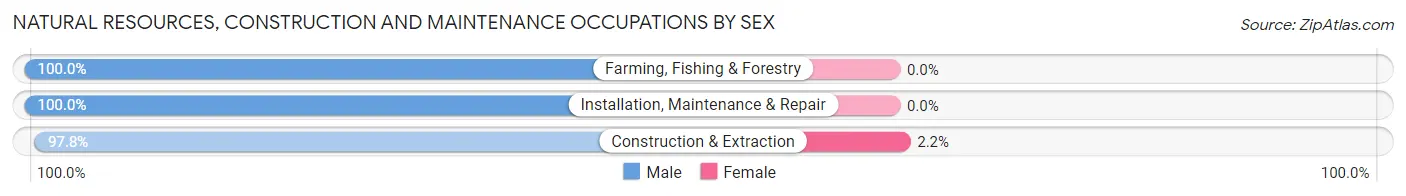
| Occupation | Male | Female |
| Farming, Fishing & Forestry | 16 (100.0%) | 0 (0.0%) |
| Construction & Extraction | 227 (97.8%) | 5 (2.2%) |
| Installation, Maintenance & Repair | 287 (100.0%) | 0 (0.0%) |
| Total (Category) | 530 (99.1%) | 5 (0.9%) |
| Total (Overall) | 3,660 (49.9%) | 3,669 (50.1%) |
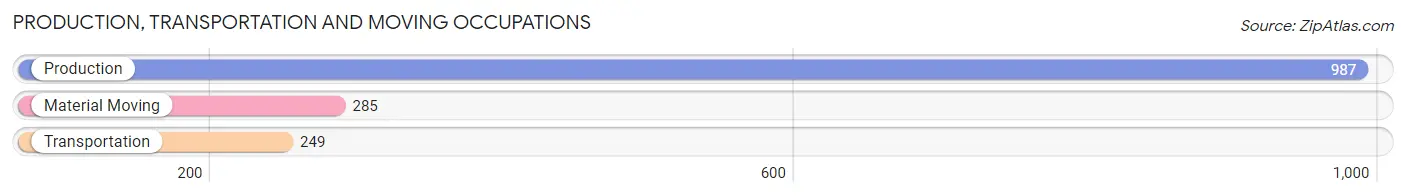
Production, Transportation and Moving Occupations
The most common Production, Transportation and Moving occupations in El Dorado are Production (987 | 13.5%), Material Moving (285 | 3.9%), and Transportation (249 | 3.4%).
Production, Transportation and Moving Occupations by Sex
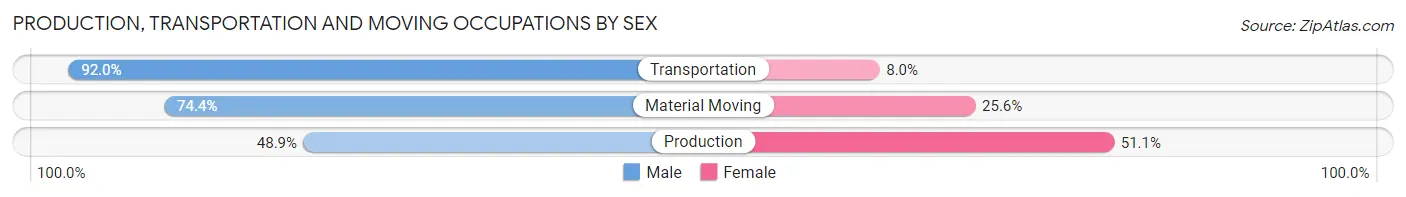
| Occupation | Male | Female |
| Production | 483 (48.9%) | 504 (51.1%) |
| Transportation | 229 (92.0%) | 20 (8.0%) |
| Material Moving | 212 (74.4%) | 73 (25.6%) |
| Total (Category) | 924 (60.8%) | 597 (39.3%) |
| Total (Overall) | 3,660 (49.9%) | 3,669 (50.1%) |
Employment Industries by Sex in El Dorado
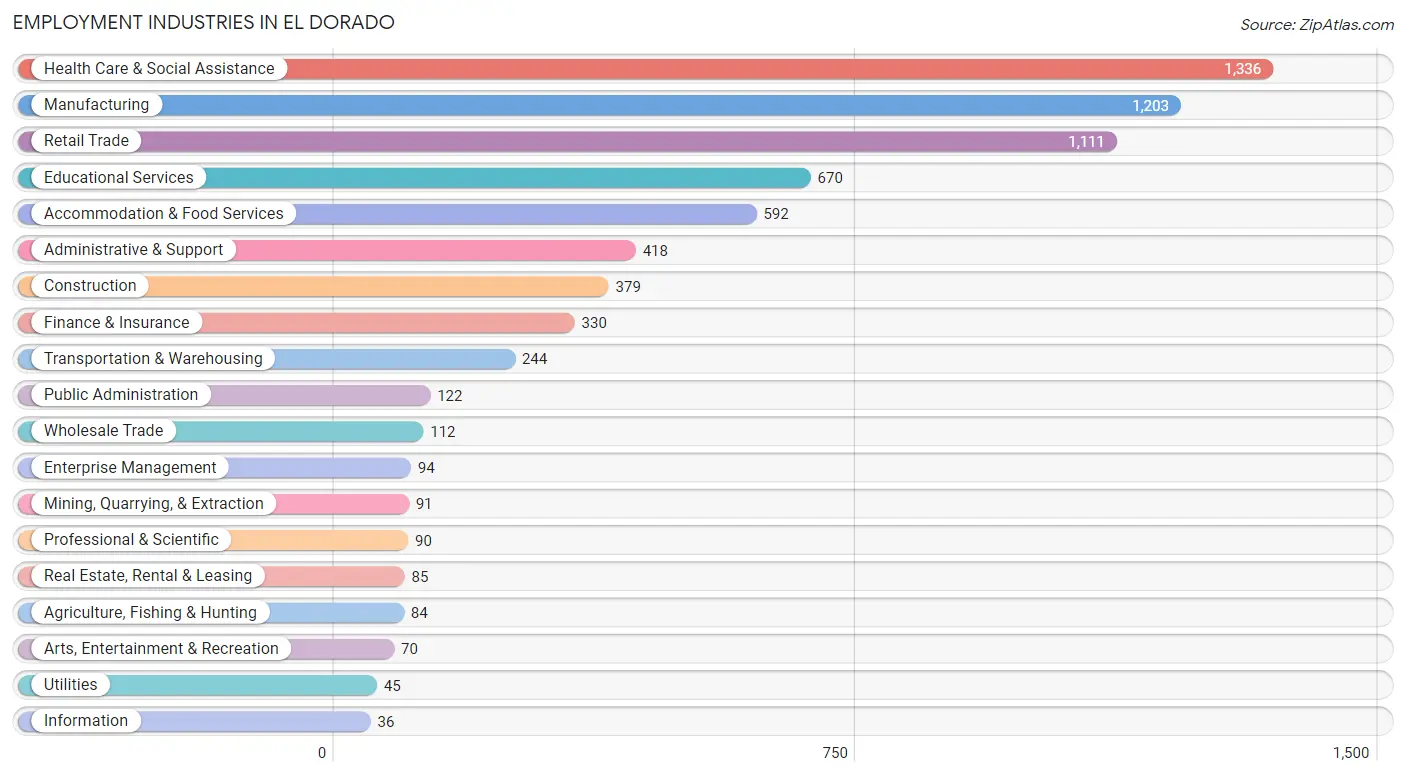
Employment Industries in El Dorado
The major employment industries in El Dorado include Health Care & Social Assistance (1,336 | 18.2%), Manufacturing (1,203 | 16.4%), Retail Trade (1,111 | 15.2%), Educational Services (670 | 9.1%), and Accommodation & Food Services (592 | 8.1%).
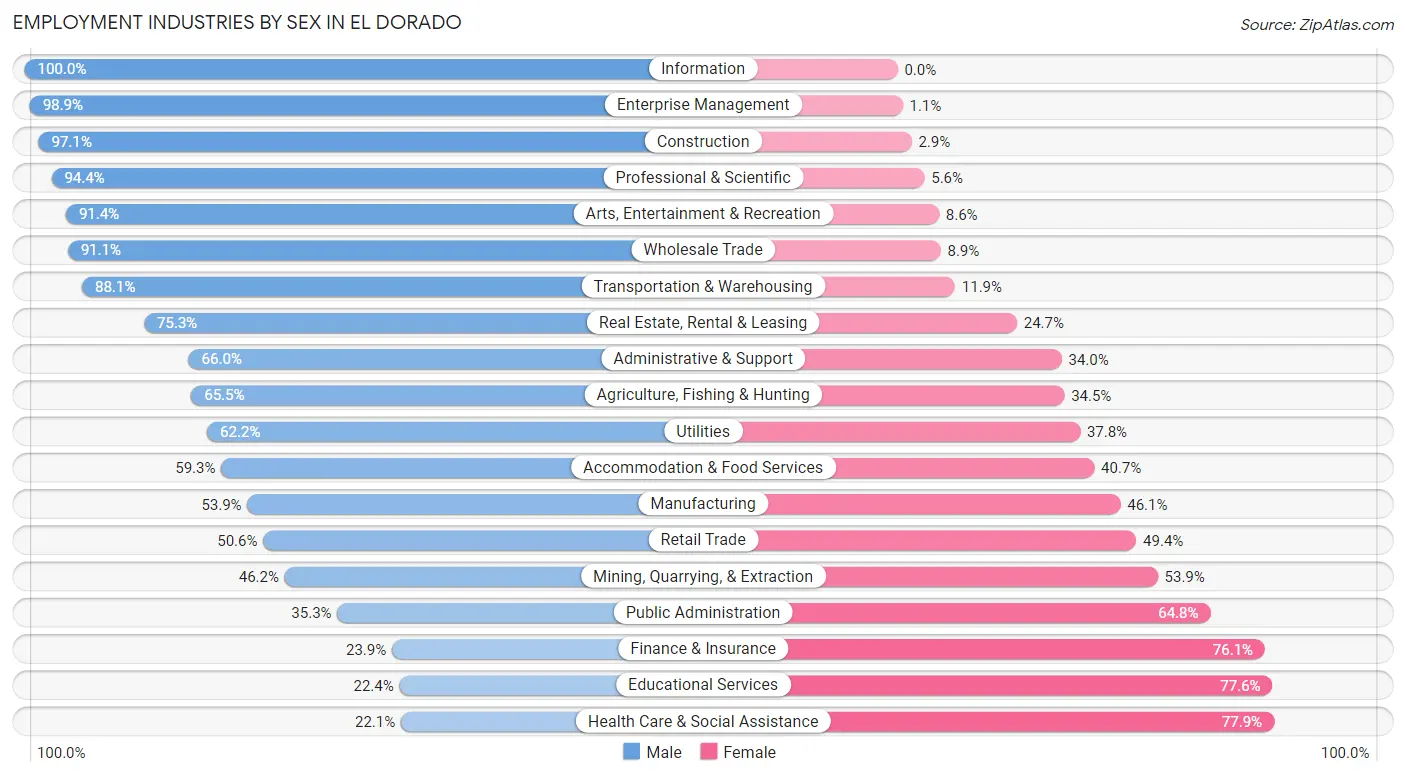
Employment Industries by Sex in El Dorado
The El Dorado industries that see more men than women are Information (100.0%), Enterprise Management (98.9%), and Construction (97.1%), whereas the industries that tend to have a higher number of women are Health Care & Social Assistance (77.9%), Educational Services (77.6%), and Finance & Insurance (76.1%).
| Industry | Male | Female |
| Agriculture, Fishing & Hunting | 55 (65.5%) | 29 (34.5%) |
| Mining, Quarrying, & Extraction | 42 (46.2%) | 49 (53.8%) |
| Construction | 368 (97.1%) | 11 (2.9%) |
| Manufacturing | 648 (53.9%) | 555 (46.1%) |
| Wholesale Trade | 102 (91.1%) | 10 (8.9%) |
| Retail Trade | 562 (50.6%) | 549 (49.4%) |
| Transportation & Warehousing | 215 (88.1%) | 29 (11.9%) |
| Utilities | 28 (62.2%) | 17 (37.8%) |
| Information | 36 (100.0%) | 0 (0.0%) |
| Finance & Insurance | 79 (23.9%) | 251 (76.1%) |
| Real Estate, Rental & Leasing | 64 (75.3%) | 21 (24.7%) |
| Professional & Scientific | 85 (94.4%) | 5 (5.6%) |
| Enterprise Management | 93 (98.9%) | 1 (1.1%) |
| Administrative & Support | 276 (66.0%) | 142 (34.0%) |
| Educational Services | 150 (22.4%) | 520 (77.6%) |
| Health Care & Social Assistance | 295 (22.1%) | 1,041 (77.9%) |
| Arts, Entertainment & Recreation | 64 (91.4%) | 6 (8.6%) |
| Accommodation & Food Services | 351 (59.3%) | 241 (40.7%) |
| Public Administration | 43 (35.2%) | 79 (64.7%) |
| Total | 3,660 (49.9%) | 3,669 (50.1%) |
Education in El Dorado
School Enrollment in El Dorado
The most common levels of schooling among the 4,418 students in El Dorado are middle school (1,311 | 29.7%), high school (998 | 22.6%), and elementary school (750 | 17.0%).
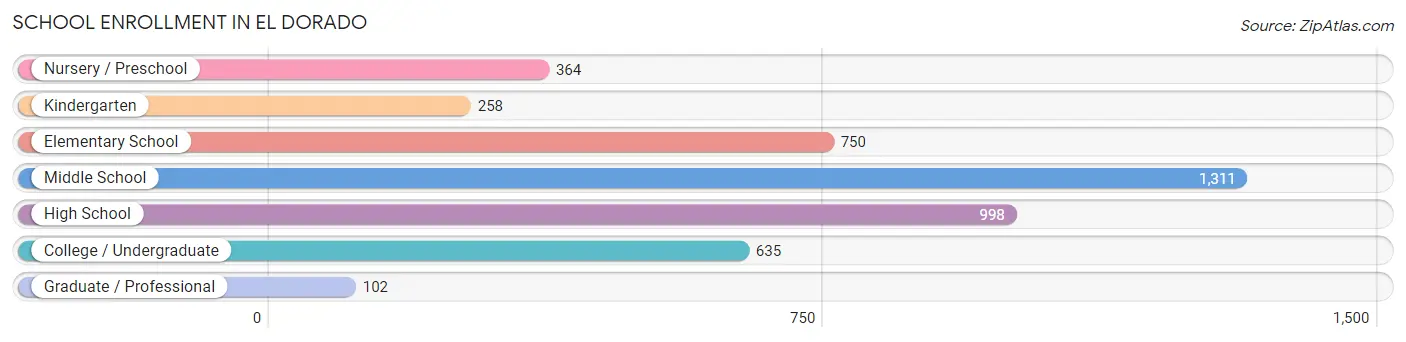
| School Level | # Students | % Students |
| Nursery / Preschool | 364 | 8.2% |
| Kindergarten | 258 | 5.8% |
| Elementary School | 750 | 17.0% |
| Middle School | 1,311 | 29.7% |
| High School | 998 | 22.6% |
| College / Undergraduate | 635 | 14.4% |
| Graduate / Professional | 102 | 2.3% |
| Total | 4,418 | 100.0% |
School Enrollment by Age by Funding Source in El Dorado
Out of a total of 4,418 students who are enrolled in schools in El Dorado, 402 (9.1%) attend a private institution, while the remaining 4,016 (90.9%) are enrolled in public schools. The age group of 35 years and over has the highest likelihood of being enrolled in private schools, with 87 (41.2% in the age bracket) enrolled. Conversely, the age group of 18 to 19 year olds has the lowest likelihood of being enrolled in a private school, with 561 (100.0% in the age bracket) attending a public institution.
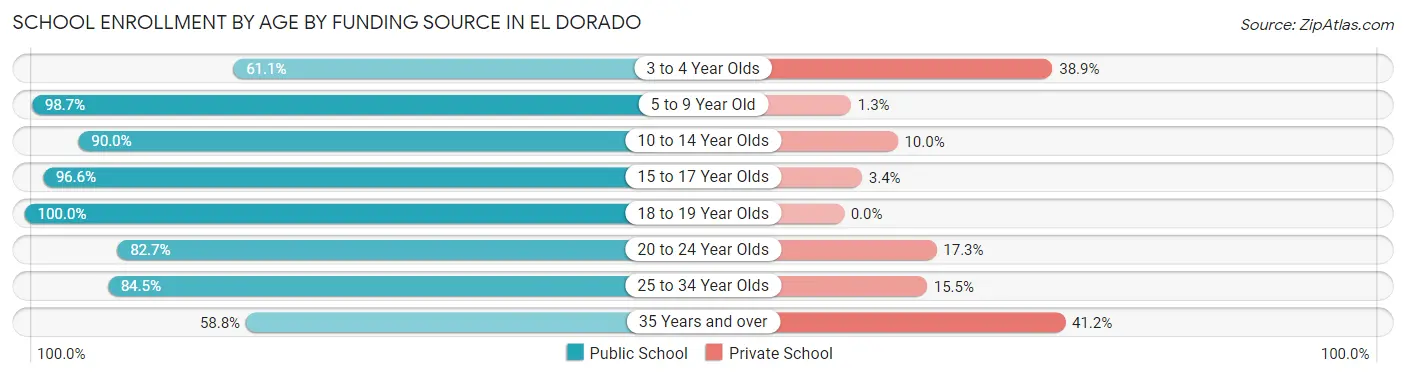
| Age Bracket | Public School | Private School |
| 3 to 4 Year Olds | 129 (61.1%) | 82 (38.9%) |
| 5 to 9 Year Old | 1,033 (98.7%) | 14 (1.3%) |
| 10 to 14 Year Olds | 1,338 (90.0%) | 149 (10.0%) |
| 15 to 17 Year Olds | 571 (96.6%) | 20 (3.4%) |
| 18 to 19 Year Olds | 561 (100.0%) | 0 (0.0%) |
| 20 to 24 Year Olds | 139 (82.7%) | 29 (17.3%) |
| 25 to 34 Year Olds | 120 (84.5%) | 22 (15.5%) |
| 35 Years and over | 124 (58.8%) | 87 (41.2%) |
| Total | 4,016 (90.9%) | 402 (9.1%) |
Educational Attainment by Field of Study in El Dorado
Business (490 | 21.3%), education (469 | 20.4%), arts & humanities (265 | 11.5%), science & technology (232 | 10.1%), and engineering (190 | 8.3%) are the most common fields of study among 2,297 individuals in El Dorado who have obtained a bachelor's degree or higher.
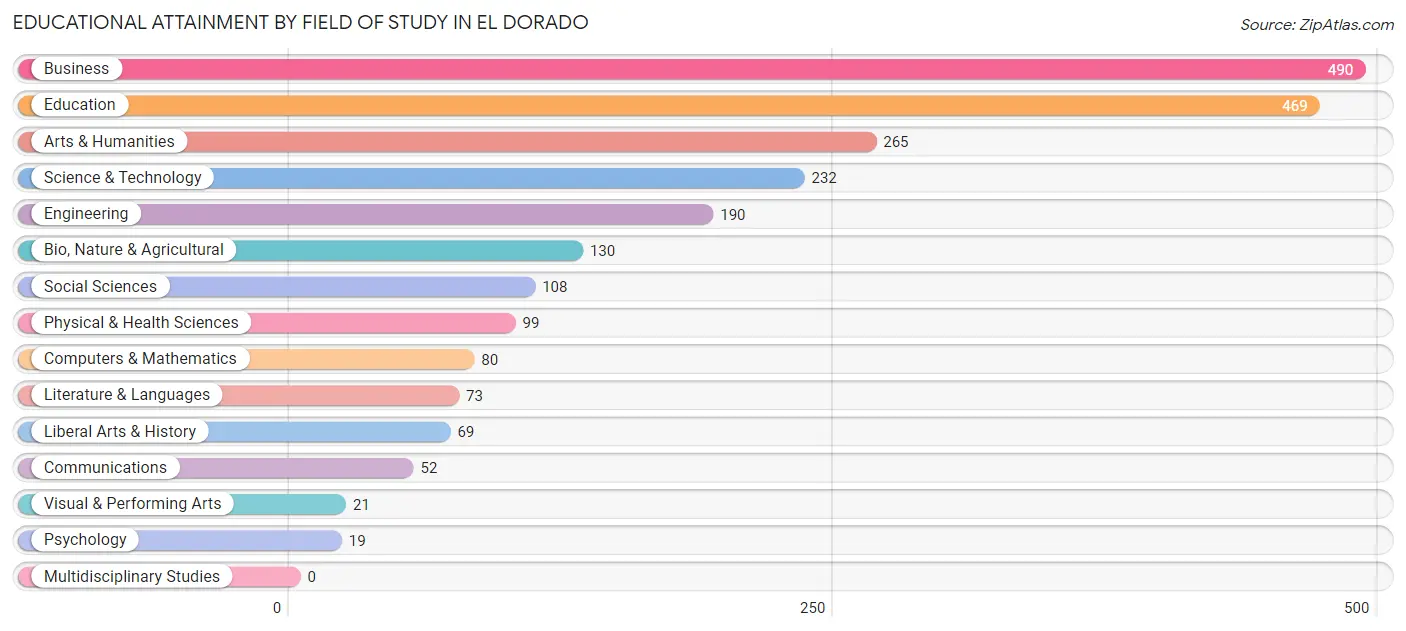
| Field of Study | # Graduates | % Graduates |
| Computers & Mathematics | 80 | 3.5% |
| Bio, Nature & Agricultural | 130 | 5.7% |
| Physical & Health Sciences | 99 | 4.3% |
| Psychology | 19 | 0.8% |
| Social Sciences | 108 | 4.7% |
| Engineering | 190 | 8.3% |
| Multidisciplinary Studies | 0 | 0.0% |
| Science & Technology | 232 | 10.1% |
| Business | 490 | 21.3% |
| Education | 469 | 20.4% |
| Literature & Languages | 73 | 3.2% |
| Liberal Arts & History | 69 | 3.0% |
| Visual & Performing Arts | 21 | 0.9% |
| Communications | 52 | 2.3% |
| Arts & Humanities | 265 | 11.5% |
| Total | 2,297 | 100.0% |
Transportation & Commute in El Dorado
Vehicle Availability by Sex in El Dorado
The most prevalent vehicle ownership categories in El Dorado are males with 2 vehicles (1,409, accounting for 39.2%) and females with 2 vehicles (1,410, making up 39.0%).
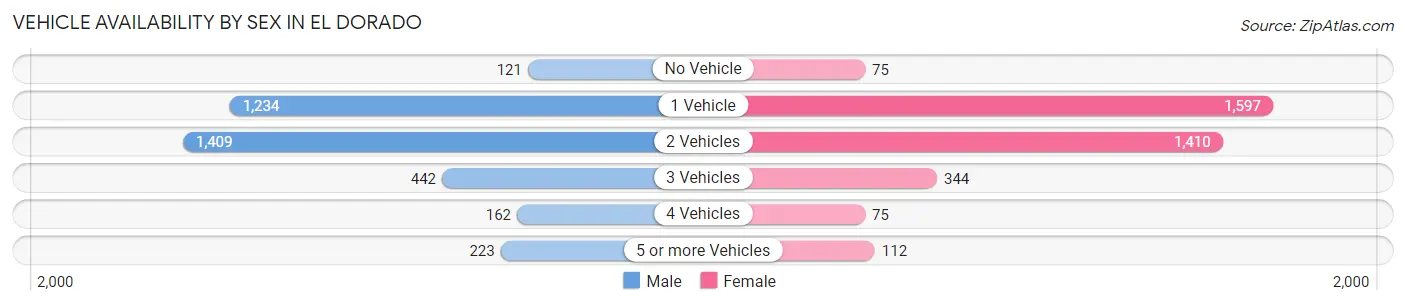
| Vehicles Available | Male | Female |
| No Vehicle | 121 (3.4%) | 75 (2.1%) |
| 1 Vehicle | 1,234 (34.4%) | 1,597 (44.2%) |
| 2 Vehicles | 1,409 (39.2%) | 1,410 (39.0%) |
| 3 Vehicles | 442 (12.3%) | 344 (9.5%) |
| 4 Vehicles | 162 (4.5%) | 75 (2.1%) |
| 5 or more Vehicles | 223 (6.2%) | 112 (3.1%) |
| Total | 3,591 (100.0%) | 3,613 (100.0%) |
Commute Time in El Dorado
The most frequently occuring commute durations in El Dorado are 10 to 14 minutes (2,173 commuters, 32.9%), 15 to 19 minutes (1,472 commuters, 22.3%), and 5 to 9 minutes (1,270 commuters, 19.2%).
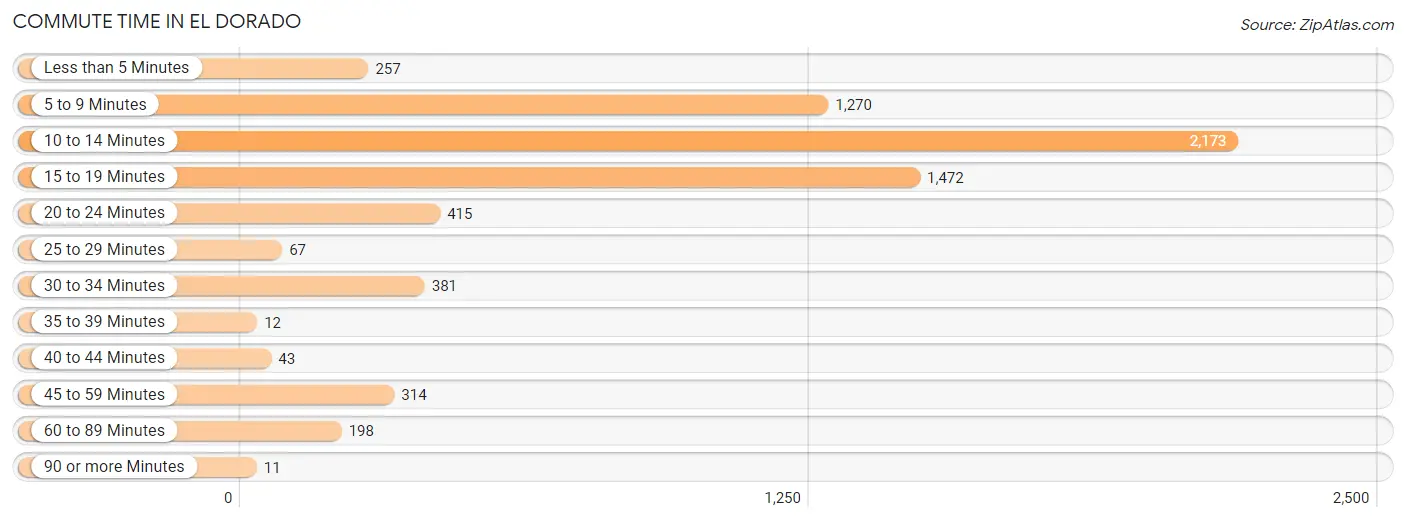
| Commute Time | # Commuters | % Commuters |
| Less than 5 Minutes | 257 | 3.9% |
| 5 to 9 Minutes | 1,270 | 19.2% |
| 10 to 14 Minutes | 2,173 | 32.9% |
| 15 to 19 Minutes | 1,472 | 22.3% |
| 20 to 24 Minutes | 415 | 6.3% |
| 25 to 29 Minutes | 67 | 1.0% |
| 30 to 34 Minutes | 381 | 5.8% |
| 35 to 39 Minutes | 12 | 0.2% |
| 40 to 44 Minutes | 43 | 0.6% |
| 45 to 59 Minutes | 314 | 4.8% |
| 60 to 89 Minutes | 198 | 3.0% |
| 90 or more Minutes | 11 | 0.2% |
Commute Time by Sex in El Dorado
The most common commute times in El Dorado are 10 to 14 minutes (947 commuters, 29.0%) for males and 10 to 14 minutes (1,226 commuters, 36.6%) for females.
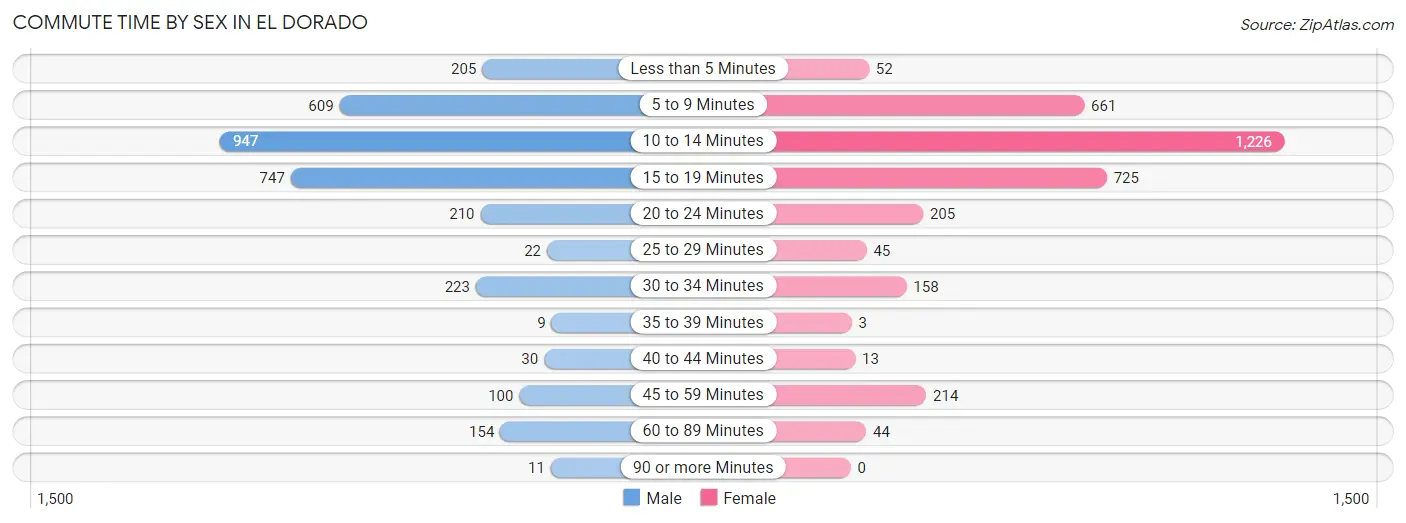
| Commute Time | Male | Female |
| Less than 5 Minutes | 205 (6.3%) | 52 (1.5%) |
| 5 to 9 Minutes | 609 (18.6%) | 661 (19.8%) |
| 10 to 14 Minutes | 947 (29.0%) | 1,226 (36.6%) |
| 15 to 19 Minutes | 747 (22.9%) | 725 (21.7%) |
| 20 to 24 Minutes | 210 (6.4%) | 205 (6.1%) |
| 25 to 29 Minutes | 22 (0.7%) | 45 (1.3%) |
| 30 to 34 Minutes | 223 (6.8%) | 158 (4.7%) |
| 35 to 39 Minutes | 9 (0.3%) | 3 (0.1%) |
| 40 to 44 Minutes | 30 (0.9%) | 13 (0.4%) |
| 45 to 59 Minutes | 100 (3.1%) | 214 (6.4%) |
| 60 to 89 Minutes | 154 (4.7%) | 44 (1.3%) |
| 90 or more Minutes | 11 (0.3%) | 0 (0.0%) |
Time of Departure to Work by Sex in El Dorado
The most frequent times of departure to work in El Dorado are 7:00 AM to 7:29 AM (630, 19.3%) for males and 7:00 AM to 7:29 AM (737, 22.0%) for females.
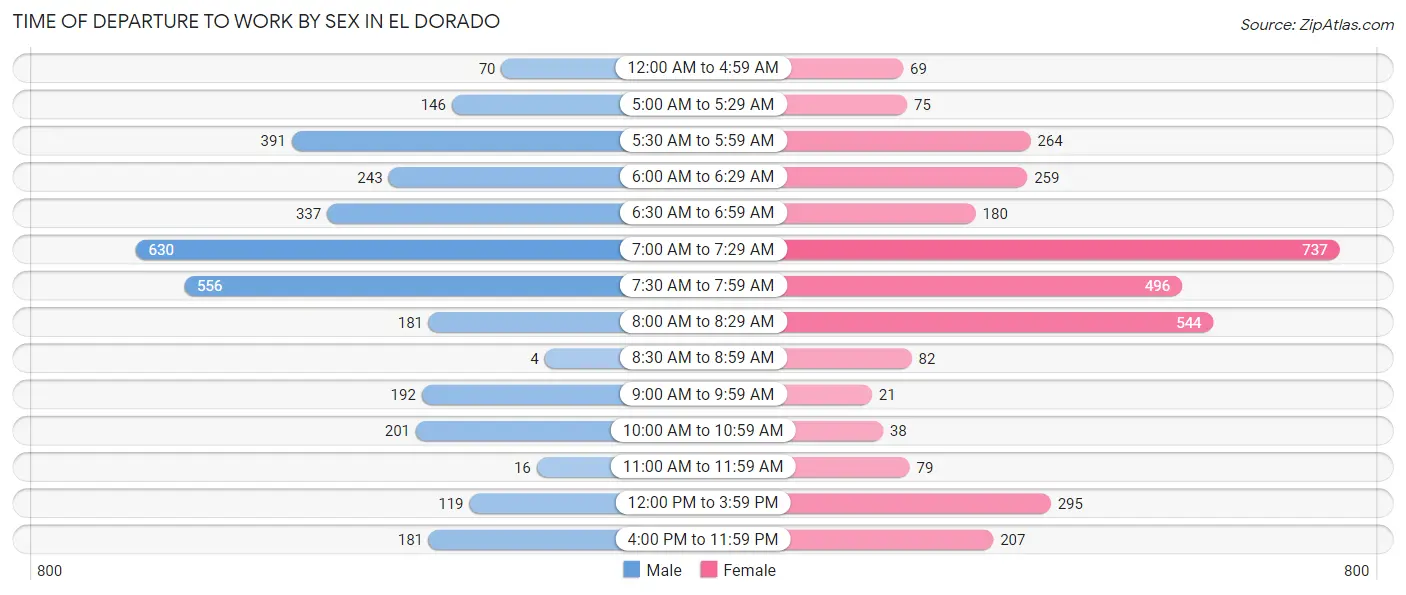
| Time of Departure | Male | Female |
| 12:00 AM to 4:59 AM | 70 (2.1%) | 69 (2.1%) |
| 5:00 AM to 5:29 AM | 146 (4.5%) | 75 (2.2%) |
| 5:30 AM to 5:59 AM | 391 (12.0%) | 264 (7.9%) |
| 6:00 AM to 6:29 AM | 243 (7.4%) | 259 (7.7%) |
| 6:30 AM to 6:59 AM | 337 (10.3%) | 180 (5.4%) |
| 7:00 AM to 7:29 AM | 630 (19.3%) | 737 (22.0%) |
| 7:30 AM to 7:59 AM | 556 (17.0%) | 496 (14.8%) |
| 8:00 AM to 8:29 AM | 181 (5.5%) | 544 (16.3%) |
| 8:30 AM to 8:59 AM | 4 (0.1%) | 82 (2.5%) |
| 9:00 AM to 9:59 AM | 192 (5.9%) | 21 (0.6%) |
| 10:00 AM to 10:59 AM | 201 (6.1%) | 38 (1.1%) |
| 11:00 AM to 11:59 AM | 16 (0.5%) | 79 (2.4%) |
| 12:00 PM to 3:59 PM | 119 (3.6%) | 295 (8.8%) |
| 4:00 PM to 11:59 PM | 181 (5.5%) | 207 (6.2%) |
| Total | 3,267 (100.0%) | 3,346 (100.0%) |
Housing Occupancy in El Dorado
Occupancy by Ownership in El Dorado
Of the total 6,574 dwellings in El Dorado, owner-occupied units account for 3,755 (57.1%), while renter-occupied units make up 2,819 (42.9%).
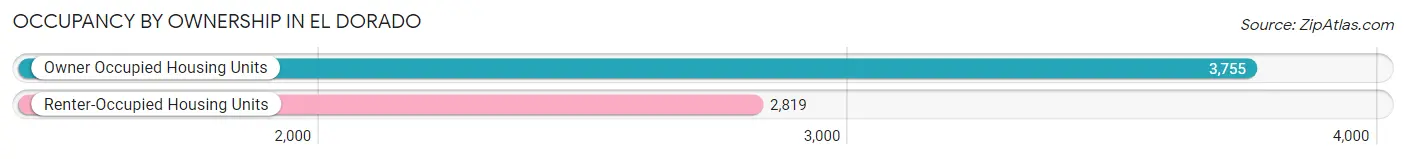
| Occupancy | # Housing Units | % Housing Units |
| Owner Occupied Housing Units | 3,755 | 57.1% |
| Renter-Occupied Housing Units | 2,819 | 42.9% |
| Total Occupied Housing Units | 6,574 | 100.0% |
Occupancy by Household Size in El Dorado
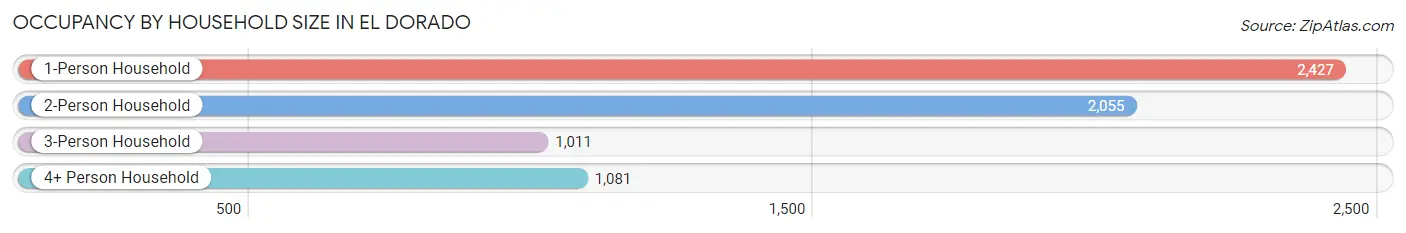
| Household Size | # Housing Units | % Housing Units |
| 1-Person Household | 2,427 | 36.9% |
| 2-Person Household | 2,055 | 31.3% |
| 3-Person Household | 1,011 | 15.4% |
| 4+ Person Household | 1,081 | 16.4% |
| Total Housing Units | 6,574 | 100.0% |
Occupancy by Ownership by Household Size in El Dorado
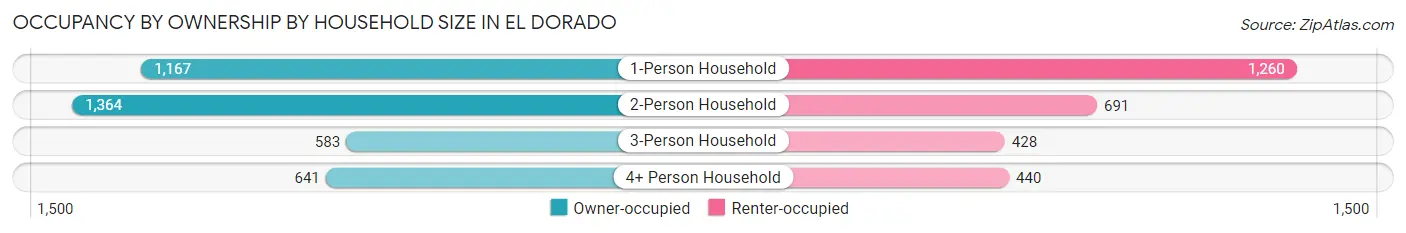
| Household Size | Owner-occupied | Renter-occupied |
| 1-Person Household | 1,167 (48.1%) | 1,260 (51.9%) |
| 2-Person Household | 1,364 (66.4%) | 691 (33.6%) |
| 3-Person Household | 583 (57.7%) | 428 (42.3%) |
| 4+ Person Household | 641 (59.3%) | 440 (40.7%) |
| Total Housing Units | 3,755 (57.1%) | 2,819 (42.9%) |
Occupancy by Educational Attainment in El Dorado
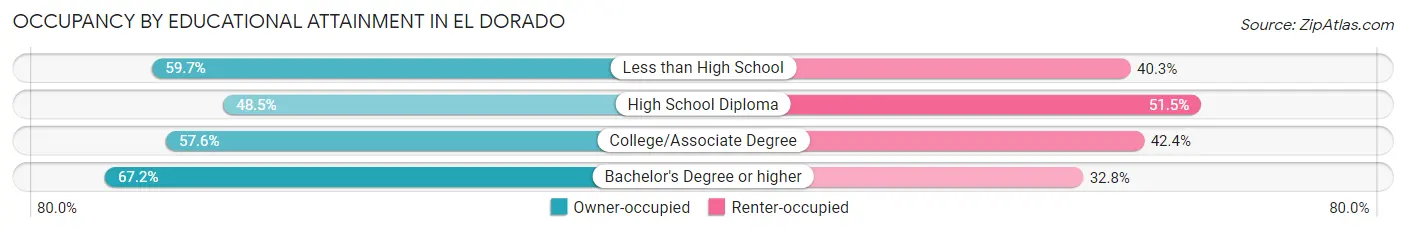
| Household Size | Owner-occupied | Renter-occupied |
| Less than High School | 507 (59.7%) | 342 (40.3%) |
| High School Diploma | 1,034 (48.5%) | 1,099 (51.5%) |
| College/Associate Degree | 1,196 (57.6%) | 882 (42.4%) |
| Bachelor's Degree or higher | 1,018 (67.2%) | 496 (32.8%) |
Occupancy by Age of Householder in El Dorado
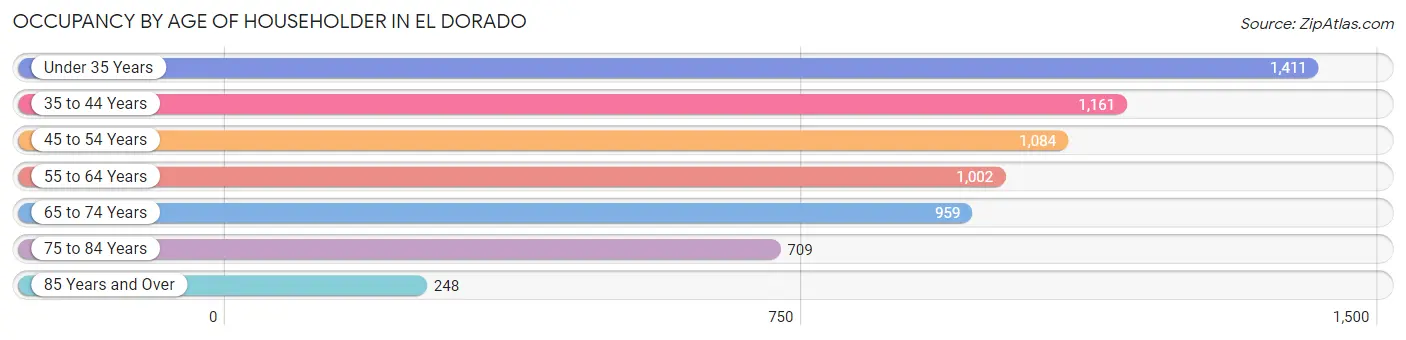
| Age Bracket | # Households | % Households |
| Under 35 Years | 1,411 | 21.5% |
| 35 to 44 Years | 1,161 | 17.7% |
| 45 to 54 Years | 1,084 | 16.5% |
| 55 to 64 Years | 1,002 | 15.2% |
| 65 to 74 Years | 959 | 14.6% |
| 75 to 84 Years | 709 | 10.8% |
| 85 Years and Over | 248 | 3.8% |
| Total | 6,574 | 100.0% |
Housing Finances in El Dorado
Median Income by Occupancy in El Dorado
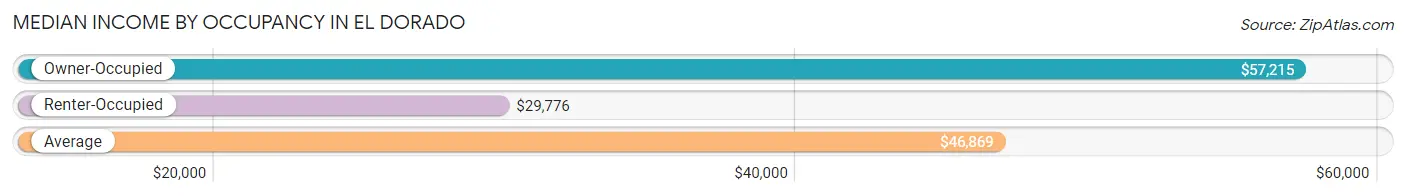
| Occupancy Type | # Households | Median Income |
| Owner-Occupied | 3,755 (57.1%) | $57,215 |
| Renter-Occupied | 2,819 (42.9%) | $29,776 |
| Average | 6,574 (100.0%) | $46,869 |
Occupancy by Householder Income Bracket in El Dorado
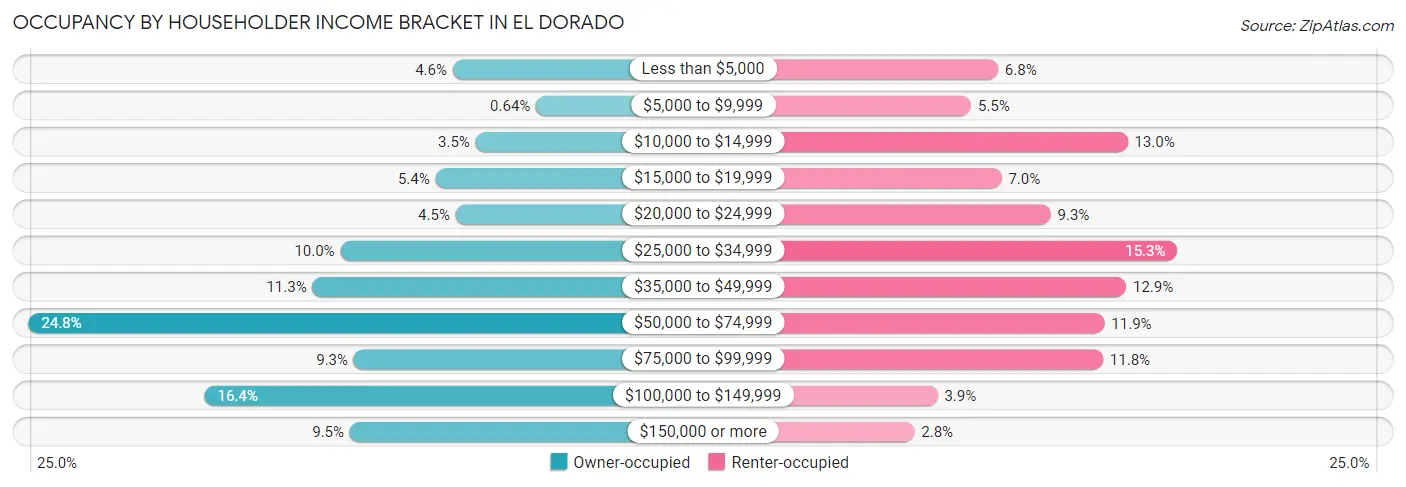
| Income Bracket | Owner-occupied | Renter-occupied |
| Less than $5,000 | 173 (4.6%) | 191 (6.8%) |
| $5,000 to $9,999 | 24 (0.6%) | 155 (5.5%) |
| $10,000 to $14,999 | 132 (3.5%) | 365 (13.0%) |
| $15,000 to $19,999 | 204 (5.4%) | 196 (7.0%) |
| $20,000 to $24,999 | 168 (4.5%) | 262 (9.3%) |
| $25,000 to $34,999 | 374 (10.0%) | 432 (15.3%) |
| $35,000 to $49,999 | 424 (11.3%) | 363 (12.9%) |
| $50,000 to $74,999 | 932 (24.8%) | 334 (11.8%) |
| $75,000 to $99,999 | 350 (9.3%) | 332 (11.8%) |
| $100,000 to $149,999 | 617 (16.4%) | 110 (3.9%) |
| $150,000 or more | 357 (9.5%) | 79 (2.8%) |
| Total | 3,755 (100.0%) | 2,819 (100.0%) |
Monthly Housing Cost Tiers in El Dorado
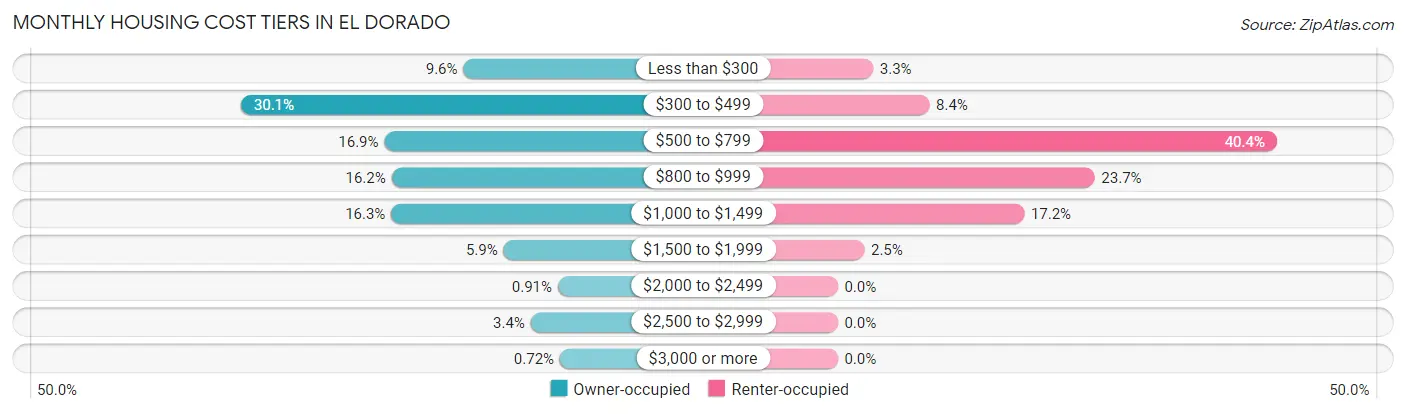
| Monthly Cost | Owner-occupied | Renter-occupied |
| Less than $300 | 361 (9.6%) | 92 (3.3%) |
| $300 to $499 | 1,130 (30.1%) | 238 (8.4%) |
| $500 to $799 | 634 (16.9%) | 1,140 (40.4%) |
| $800 to $999 | 609 (16.2%) | 667 (23.7%) |
| $1,000 to $1,499 | 610 (16.3%) | 484 (17.2%) |
| $1,500 to $1,999 | 222 (5.9%) | 69 (2.5%) |
| $2,000 to $2,499 | 34 (0.9%) | 0 (0.0%) |
| $2,500 to $2,999 | 128 (3.4%) | 0 (0.0%) |
| $3,000 or more | 27 (0.7%) | 0 (0.0%) |
| Total | 3,755 (100.0%) | 2,819 (100.0%) |
Physical Housing Characteristics in El Dorado
Housing Structures in El Dorado
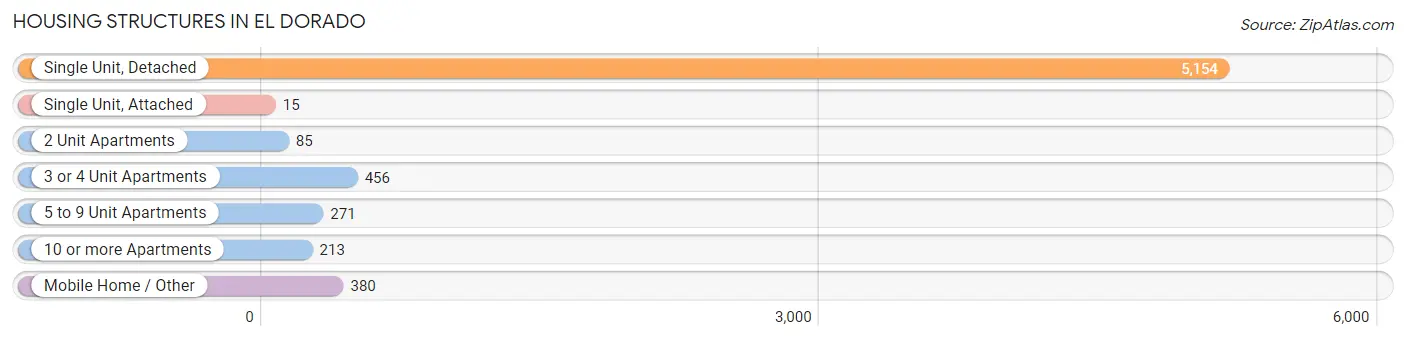
| Structure Type | # Housing Units | % Housing Units |
| Single Unit, Detached | 5,154 | 78.4% |
| Single Unit, Attached | 15 | 0.2% |
| 2 Unit Apartments | 85 | 1.3% |
| 3 or 4 Unit Apartments | 456 | 6.9% |
| 5 to 9 Unit Apartments | 271 | 4.1% |
| 10 or more Apartments | 213 | 3.2% |
| Mobile Home / Other | 380 | 5.8% |
| Total | 6,574 | 100.0% |
Housing Structures by Occupancy in El Dorado
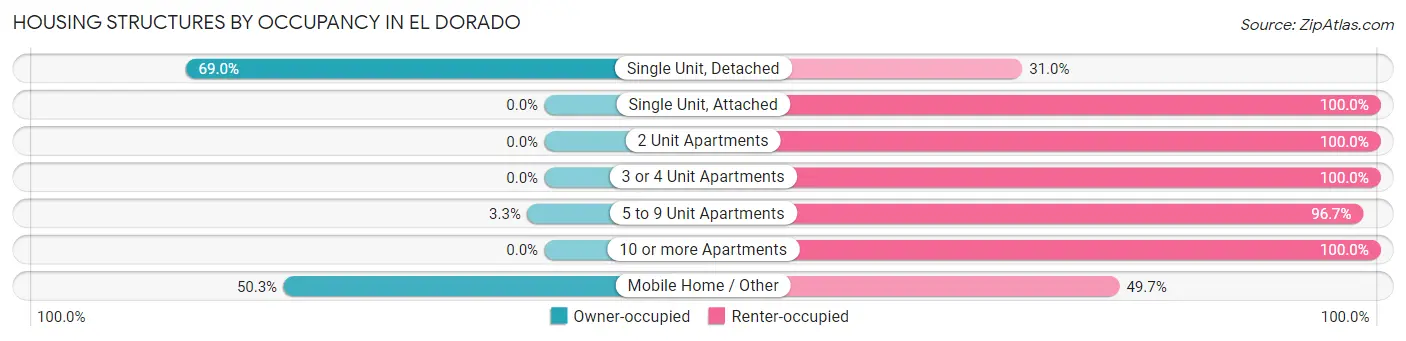
| Structure Type | Owner-occupied | Renter-occupied |
| Single Unit, Detached | 3,555 (69.0%) | 1,599 (31.0%) |
| Single Unit, Attached | 0 (0.0%) | 15 (100.0%) |
| 2 Unit Apartments | 0 (0.0%) | 85 (100.0%) |
| 3 or 4 Unit Apartments | 0 (0.0%) | 456 (100.0%) |
| 5 to 9 Unit Apartments | 9 (3.3%) | 262 (96.7%) |
| 10 or more Apartments | 0 (0.0%) | 213 (100.0%) |
| Mobile Home / Other | 191 (50.3%) | 189 (49.7%) |
| Total | 3,755 (57.1%) | 2,819 (42.9%) |
Housing Structures by Number of Rooms in El Dorado
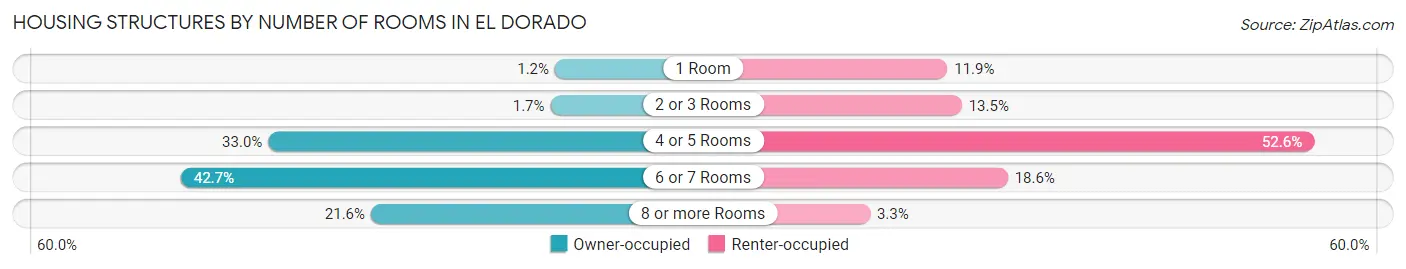
| Number of Rooms | Owner-occupied | Renter-occupied |
| 1 Room | 43 (1.1%) | 336 (11.9%) |
| 2 or 3 Rooms | 62 (1.7%) | 381 (13.5%) |
| 4 or 5 Rooms | 1,238 (33.0%) | 1,483 (52.6%) |
| 6 or 7 Rooms | 1,602 (42.7%) | 525 (18.6%) |
| 8 or more Rooms | 810 (21.6%) | 94 (3.3%) |
| Total | 3,755 (100.0%) | 2,819 (100.0%) |
Housing Structure by Heating Type in El Dorado
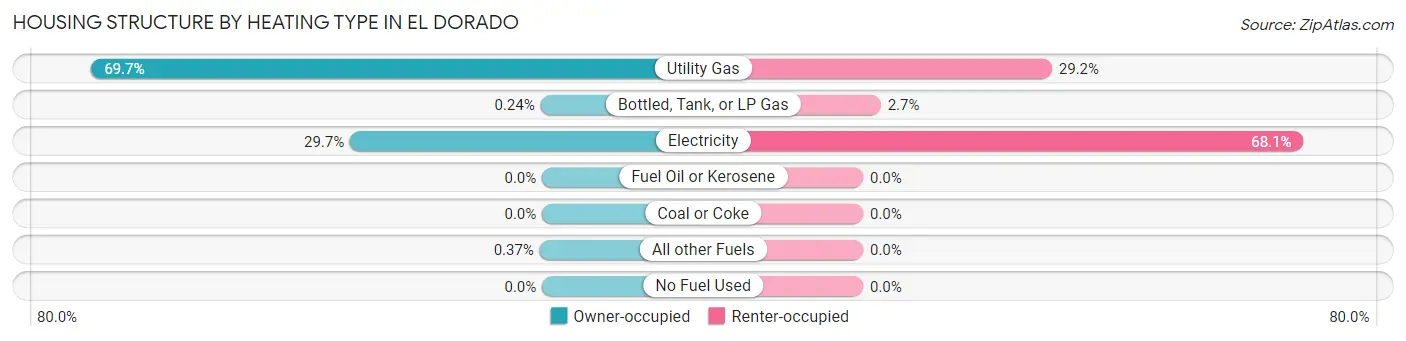
| Heating Type | Owner-occupied | Renter-occupied |
| Utility Gas | 2,617 (69.7%) | 823 (29.2%) |
| Bottled, Tank, or LP Gas | 9 (0.2%) | 77 (2.7%) |
| Electricity | 1,115 (29.7%) | 1,919 (68.1%) |
| Fuel Oil or Kerosene | 0 (0.0%) | 0 (0.0%) |
| Coal or Coke | 0 (0.0%) | 0 (0.0%) |
| All other Fuels | 14 (0.4%) | 0 (0.0%) |
| No Fuel Used | 0 (0.0%) | 0 (0.0%) |
| Total | 3,755 (100.0%) | 2,819 (100.0%) |
Household Vehicle Usage in El Dorado
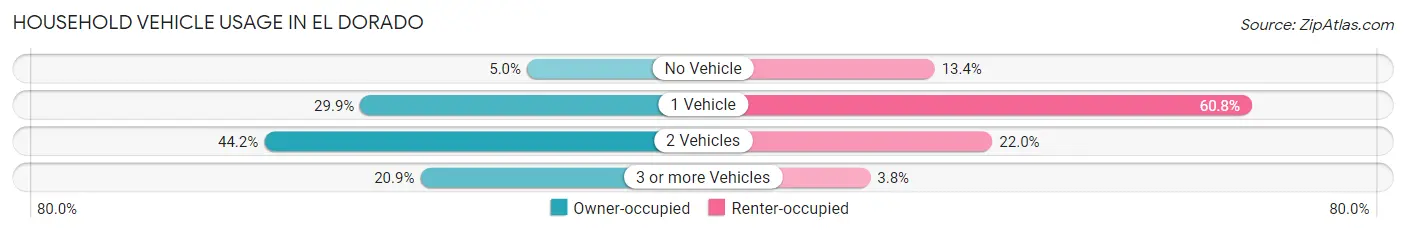
| Vehicles per Household | Owner-occupied | Renter-occupied |
| No Vehicle | 187 (5.0%) | 378 (13.4%) |
| 1 Vehicle | 1,122 (29.9%) | 1,713 (60.8%) |
| 2 Vehicles | 1,661 (44.2%) | 621 (22.0%) |
| 3 or more Vehicles | 785 (20.9%) | 107 (3.8%) |
| Total | 3,755 (100.0%) | 2,819 (100.0%) |
Real Estate & Mortgages in El Dorado
Real Estate and Mortgage Overview in El Dorado
| Characteristic | Without Mortgage | With Mortgage |
| Housing Units | 1,889 | 1,866 |
| Median Property Value | $107,500 | $115,300 |
| Median Household Income | $51,414 | $263 |
| Monthly Housing Costs | $402 | $27 |
| Real Estate Taxes | $558 | $244 |
Property Value by Mortgage Status in El Dorado
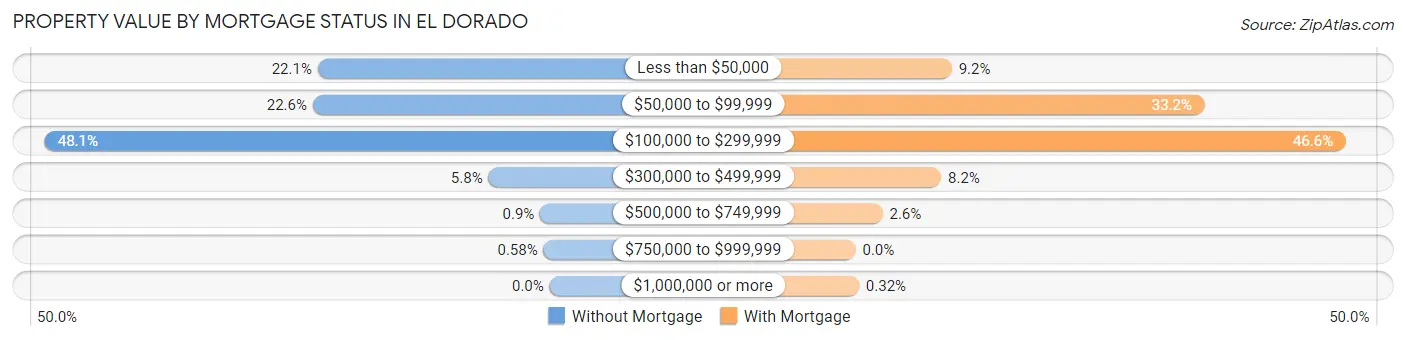
| Property Value | Without Mortgage | With Mortgage |
| Less than $50,000 | 417 (22.1%) | 171 (9.2%) |
| $50,000 to $99,999 | 426 (22.6%) | 619 (33.2%) |
| $100,000 to $299,999 | 908 (48.1%) | 870 (46.6%) |
| $300,000 to $499,999 | 110 (5.8%) | 152 (8.2%) |
| $500,000 to $749,999 | 17 (0.9%) | 48 (2.6%) |
| $750,000 to $999,999 | 11 (0.6%) | 0 (0.0%) |
| $1,000,000 or more | 0 (0.0%) | 6 (0.3%) |
| Total | 1,889 (100.0%) | 1,866 (100.0%) |
Household Income by Mortgage Status in El Dorado
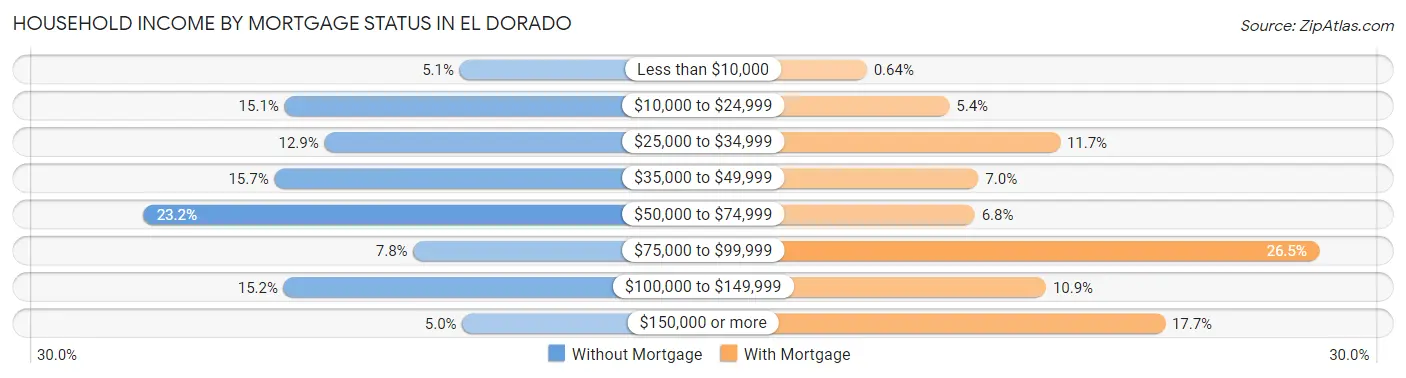
| Household Income | Without Mortgage | With Mortgage |
| Less than $10,000 | 97 (5.1%) | 12 (0.6%) |
| $10,000 to $24,999 | 286 (15.1%) | 100 (5.4%) |
| $25,000 to $34,999 | 243 (12.9%) | 218 (11.7%) |
| $35,000 to $49,999 | 297 (15.7%) | 131 (7.0%) |
| $50,000 to $74,999 | 438 (23.2%) | 127 (6.8%) |
| $75,000 to $99,999 | 147 (7.8%) | 494 (26.5%) |
| $100,000 to $149,999 | 287 (15.2%) | 203 (10.9%) |
| $150,000 or more | 94 (5.0%) | 330 (17.7%) |
| Total | 1,889 (100.0%) | 1,866 (100.0%) |
Property Value to Household Income Ratio in El Dorado
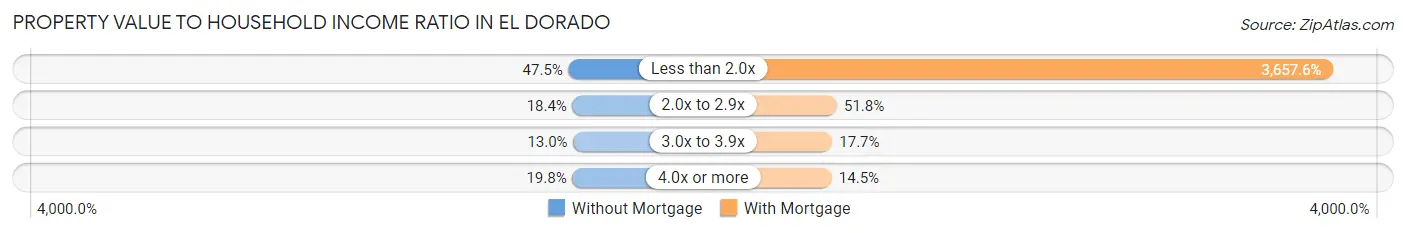
| Value-to-Income Ratio | Without Mortgage | With Mortgage |
| Less than 2.0x | 898 (47.5%) | 68,250 (3,657.6%) |
| 2.0x to 2.9x | 347 (18.4%) | 967 (51.8%) |
| 3.0x to 3.9x | 245 (13.0%) | 331 (17.7%) |
| 4.0x or more | 373 (19.8%) | 271 (14.5%) |
| Total | 1,889 (100.0%) | 1,866 (100.0%) |
Real Estate Taxes by Mortgage Status in El Dorado
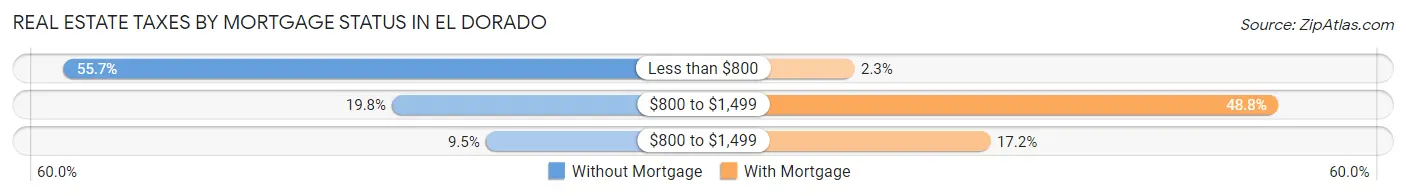
| Property Taxes | Without Mortgage | With Mortgage |
| Less than $800 | 1,052 (55.7%) | 43 (2.3%) |
| $800 to $1,499 | 373 (19.8%) | 911 (48.8%) |
| $800 to $1,499 | 179 (9.5%) | 321 (17.2%) |
| Total | 1,889 (100.0%) | 1,866 (100.0%) |
Health & Disability in El Dorado
Health Insurance Coverage by Age in El Dorado
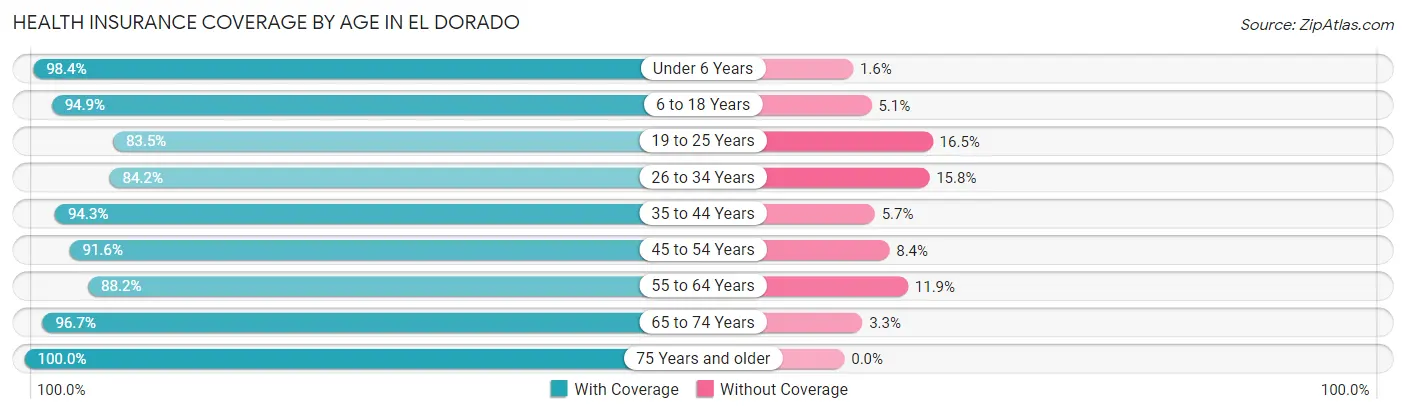
| Age Bracket | With Coverage | Without Coverage |
| Under 6 Years | 1,274 (98.4%) | 21 (1.6%) |
| 6 to 18 Years | 3,299 (94.9%) | 176 (5.1%) |
| 19 to 25 Years | 1,110 (83.5%) | 219 (16.5%) |
| 26 to 34 Years | 2,126 (84.2%) | 400 (15.8%) |
| 35 to 44 Years | 2,028 (94.3%) | 122 (5.7%) |
| 45 to 54 Years | 1,846 (91.6%) | 169 (8.4%) |
| 55 to 64 Years | 1,525 (88.1%) | 205 (11.8%) |
| 65 to 74 Years | 1,416 (96.7%) | 49 (3.3%) |
| 75 Years and older | 1,354 (100.0%) | 0 (0.0%) |
| Total | 15,978 (92.1%) | 1,361 (7.9%) |
Health Insurance Coverage by Citizenship Status in El Dorado
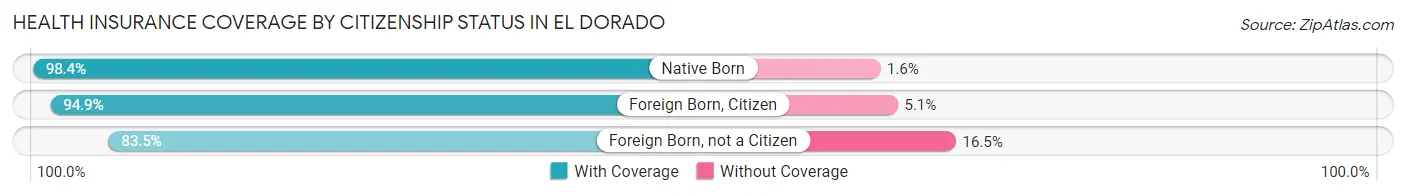
| Citizenship Status | With Coverage | Without Coverage |
| Native Born | 1,274 (98.4%) | 21 (1.6%) |
| Foreign Born, Citizen | 3,299 (94.9%) | 176 (5.1%) |
| Foreign Born, not a Citizen | 1,110 (83.5%) | 219 (16.5%) |
Health Insurance Coverage by Household Income in El Dorado
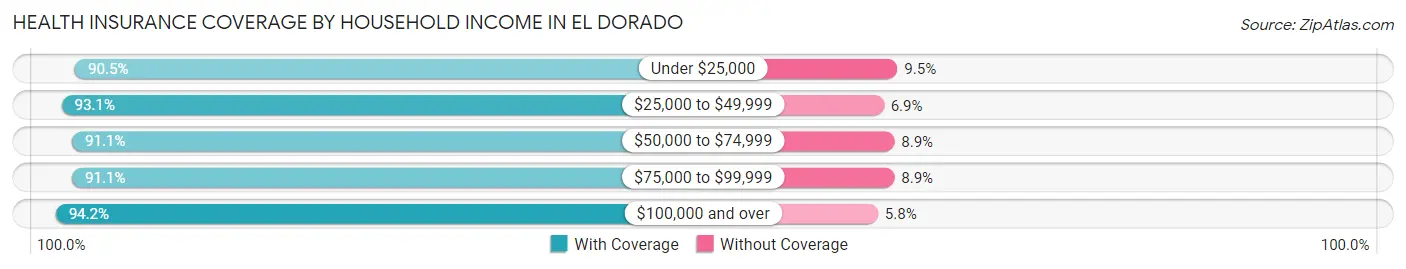
| Household Income | With Coverage | Without Coverage |
| Under $25,000 | 3,266 (90.5%) | 342 (9.5%) |
| $25,000 to $49,999 | 3,473 (93.1%) | 258 (6.9%) |
| $50,000 to $74,999 | 3,312 (91.1%) | 324 (8.9%) |
| $75,000 to $99,999 | 1,921 (91.1%) | 188 (8.9%) |
| $100,000 and over | 3,894 (94.2%) | 241 (5.8%) |
Public vs Private Health Insurance Coverage by Age in El Dorado
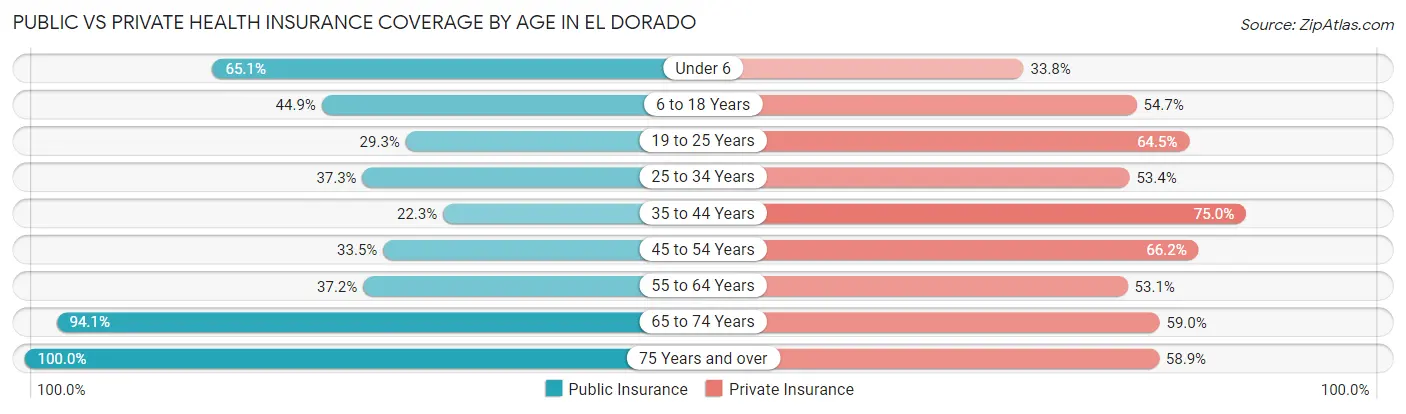
| Age Bracket | Public Insurance | Private Insurance |
| Under 6 | 843 (65.1%) | 437 (33.8%) |
| 6 to 18 Years | 1,559 (44.9%) | 1,901 (54.7%) |
| 19 to 25 Years | 389 (29.3%) | 857 (64.5%) |
| 25 to 34 Years | 942 (37.3%) | 1,349 (53.4%) |
| 35 to 44 Years | 480 (22.3%) | 1,613 (75.0%) |
| 45 to 54 Years | 674 (33.5%) | 1,334 (66.2%) |
| 55 to 64 Years | 643 (37.2%) | 918 (53.1%) |
| 65 to 74 Years | 1,378 (94.1%) | 864 (59.0%) |
| 75 Years and over | 1,354 (100.0%) | 797 (58.9%) |
| Total | 8,262 (47.6%) | 10,070 (58.1%) |
Disability Status by Sex by Age in El Dorado
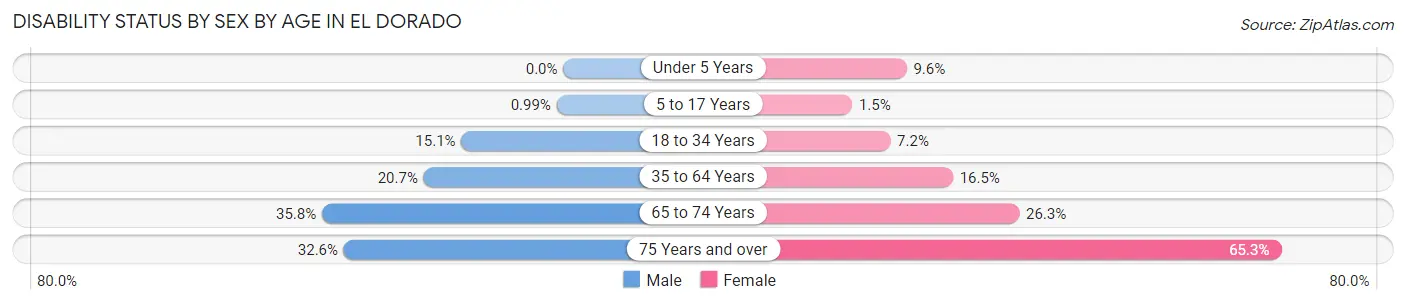
| Age Bracket | Male | Female |
| Under 5 Years | 0 (0.0%) | 53 (9.6%) |
| 5 to 17 Years | 19 (1.0%) | 21 (1.5%) |
| 18 to 34 Years | 325 (15.1%) | 152 (7.2%) |
| 35 to 64 Years | 593 (20.7%) | 500 (16.5%) |
| 65 to 74 Years | 239 (35.8%) | 210 (26.3%) |
| 75 Years and over | 189 (32.6%) | 505 (65.2%) |
Disability Class by Sex by Age in El Dorado
Disability Class: Hearing Difficulty
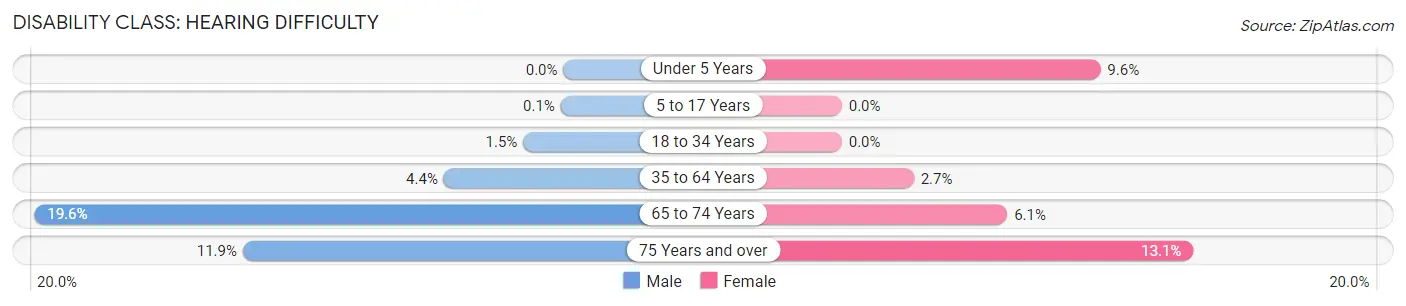
| Age Bracket | Male | Female |
| Under 5 Years | 0 (0.0%) | 53 (9.6%) |
| 5 to 17 Years | 2 (0.1%) | 0 (0.0%) |
| 18 to 34 Years | 32 (1.5%) | 0 (0.0%) |
| 35 to 64 Years | 127 (4.4%) | 81 (2.7%) |
| 65 to 74 Years | 131 (19.6%) | 49 (6.1%) |
| 75 Years and over | 69 (11.9%) | 101 (13.1%) |
Disability Class: Vision Difficulty
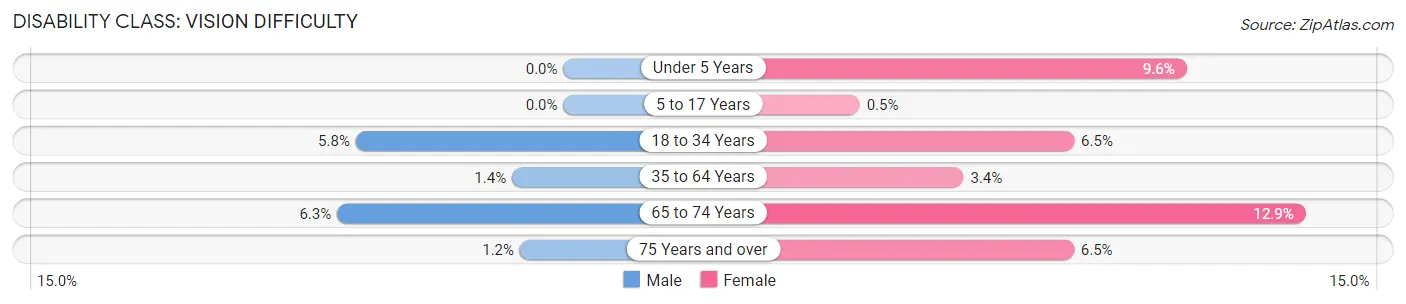
| Age Bracket | Male | Female |
| Under 5 Years | 0 (0.0%) | 53 (9.6%) |
| 5 to 17 Years | 0 (0.0%) | 7 (0.5%) |
| 18 to 34 Years | 124 (5.8%) | 137 (6.5%) |
| 35 to 64 Years | 41 (1.4%) | 103 (3.4%) |
| 65 to 74 Years | 42 (6.3%) | 103 (12.9%) |
| 75 Years and over | 7 (1.2%) | 50 (6.5%) |
Disability Class: Cognitive Difficulty
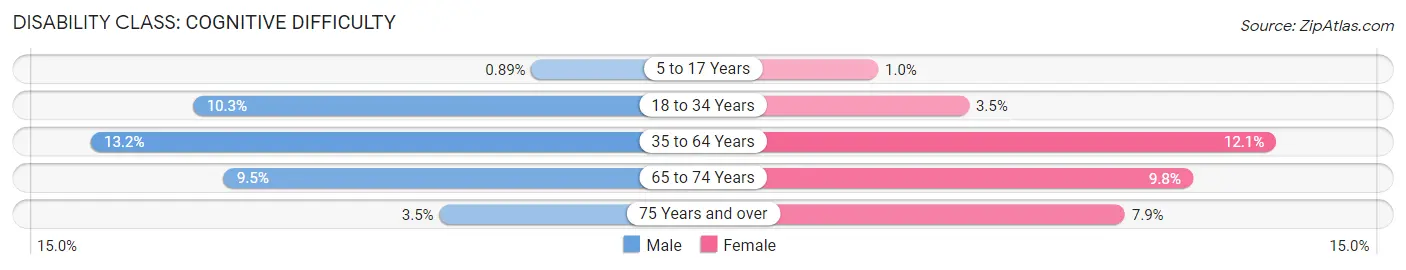
| Age Bracket | Male | Female |
| 5 to 17 Years | 17 (0.9%) | 14 (1.0%) |
| 18 to 34 Years | 221 (10.3%) | 75 (3.5%) |
| 35 to 64 Years | 376 (13.2%) | 367 (12.1%) |
| 65 to 74 Years | 63 (9.5%) | 78 (9.8%) |
| 75 Years and over | 20 (3.5%) | 61 (7.9%) |
Disability Class: Ambulatory Difficulty
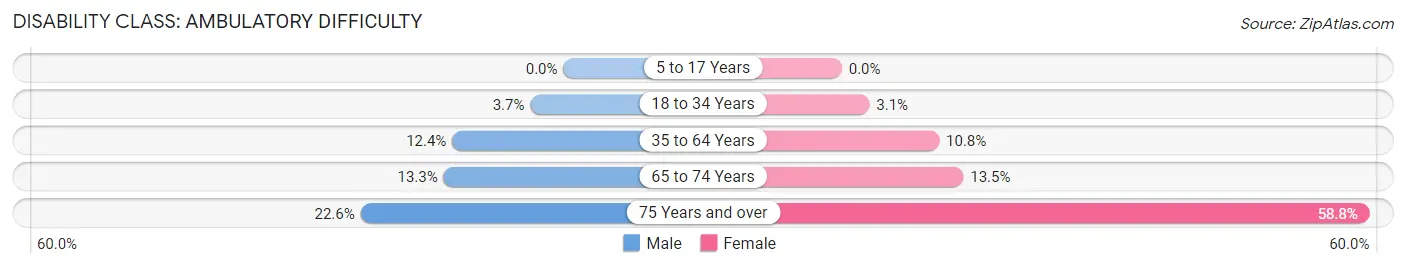
| Age Bracket | Male | Female |
| 5 to 17 Years | 0 (0.0%) | 0 (0.0%) |
| 18 to 34 Years | 79 (3.7%) | 65 (3.1%) |
| 35 to 64 Years | 354 (12.4%) | 329 (10.8%) |
| 65 to 74 Years | 89 (13.3%) | 108 (13.5%) |
| 75 Years and over | 131 (22.6%) | 455 (58.8%) |
Disability Class: Self-Care Difficulty
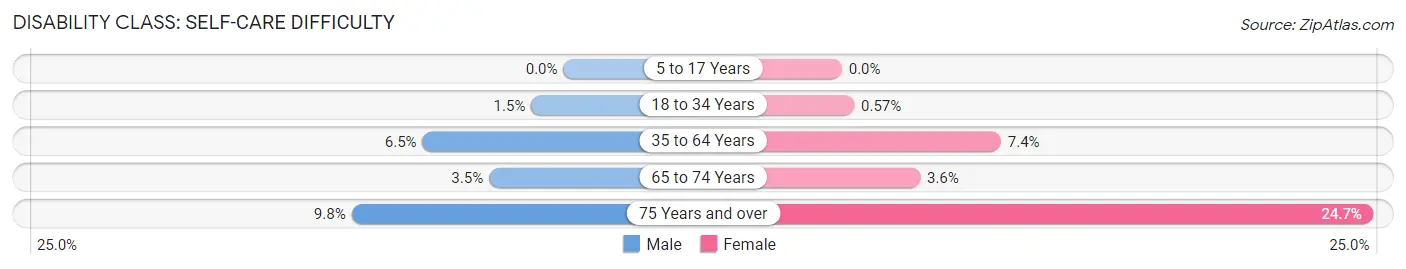
| Age Bracket | Male | Female |
| 5 to 17 Years | 0 (0.0%) | 0 (0.0%) |
| 18 to 34 Years | 32 (1.5%) | 12 (0.6%) |
| 35 to 64 Years | 187 (6.5%) | 224 (7.4%) |
| 65 to 74 Years | 23 (3.5%) | 29 (3.6%) |
| 75 Years and over | 57 (9.8%) | 191 (24.7%) |
Technology Access in El Dorado
Computing Device Access in El Dorado
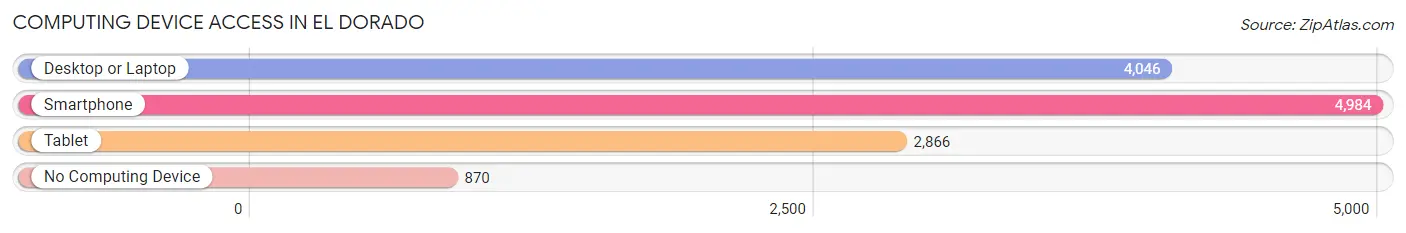
| Device Type | # Households | % Households |
| Desktop or Laptop | 4,046 | 61.6% |
| Smartphone | 4,984 | 75.8% |
| Tablet | 2,866 | 43.6% |
| No Computing Device | 870 | 13.2% |
| Total | 6,574 | 100.0% |
Internet Access in El Dorado
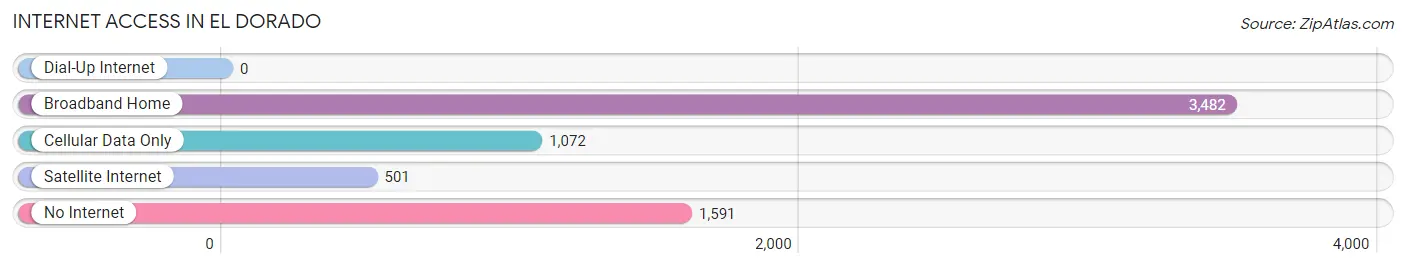
| Internet Type | # Households | % Households |
| Dial-Up Internet | 0 | 0.0% |
| Broadband Home | 3,482 | 53.0% |
| Cellular Data Only | 1,072 | 16.3% |
| Satellite Internet | 501 | 7.6% |
| No Internet | 1,591 | 24.2% |
| Total | 6,574 | 100.0% |
El Dorado Summary
El Dorado, Arkansas is a city located in Union County, Arkansas. It is the county seat of Union County and is located in the southern part of the state. The city is situated on the Ouachita River and is the largest city in the county. As of the 2010 census, the population of El Dorado was 18,491.
History
El Dorado was founded in 1843 by a group of settlers from Georgia and Alabama. The city was named after the mythical city of El Dorado, which was said to be a city of gold. The city was incorporated in 1845 and was the first city in Arkansas to be incorporated.
The city was an important center for the oil industry in the early 20th century. The city was home to the first oil refinery in Arkansas, which was built in 1903. The city was also home to the first oil well in the state, which was drilled in 1905.
The city was also an important center for the timber industry in the early 20th century. The city was home to several sawmills and lumber companies.
Geography
El Dorado is located in the southern part of Arkansas, in Union County. The city is situated on the Ouachita River and is the largest city in the county. The city is located at the intersection of U.S. Route 82 and U.S. Route 167.
The city has a total area of 16.2 square miles, of which 16.1 square miles is land and 0.1 square miles is water. The city has a humid subtropical climate, with hot, humid summers and mild winters.
Economy
El Dorado is an important center for the oil and gas industry in Arkansas. The city is home to several oil and gas companies, including Murphy Oil Corporation, which is headquartered in the city. The city is also home to several other oil and gas related businesses, such as oilfield services companies, drilling companies, and pipeline companies.
The city is also an important center for the timber industry in Arkansas. The city is home to several sawmills and lumber companies.
The city is also home to several manufacturing companies, including a paper mill, a steel mill, and a chemical plant. The city is also home to several retail stores, restaurants, and other businesses.
Demographics
As of the 2010 census, the population of El Dorado was 18,491. The racial makeup of the city was 57.3% White, 37.2% African American, 0.5% Native American, 0.7% Asian, 0.1% Pacific Islander, 1.7% from other races, and 2.5% from two or more races. Hispanic or Latino of any race were 4.2% of the population.
The median income for a household in the city was $30,945, and the median income for a family was $37,945. The per capita income for the city was $17,845. About 19.2% of the population was below the poverty line.
Common Questions
What is Per Capita Income in El Dorado?
Per Capita income in El Dorado is $25,284.
What is the Median Family Income in El Dorado?
Median Family Income in El Dorado is $56,851.
What is the Median Household income in El Dorado?
Median Household Income in El Dorado is $46,869.
What is Income or Wage Gap in El Dorado?
Income or Wage Gap in El Dorado is 33.9%.
Women in El Dorado earn 66.1 cents for every dollar earned by a man.
What is Inequality or Gini Index in El Dorado?
Inequality or Gini Index in El Dorado is 0.46.
What is the Total Population of El Dorado?
Total Population of El Dorado is 17,606.
What is the Total Male Population of El Dorado?
Total Male Population of El Dorado is 8,695.
What is the Total Female Population of El Dorado?
Total Female Population of El Dorado is 8,911.
What is the Ratio of Males per 100 Females in El Dorado?
There are 97.58 Males per 100 Females in El Dorado.
What is the Ratio of Females per 100 Males in El Dorado?
There are 102.48 Females per 100 Males in El Dorado.
What is the Median Population Age in El Dorado?
Median Population Age in El Dorado is 36.4 Years.
What is the Average Family Size in El Dorado
Average Family Size in El Dorado is 3.6 People.
What is the Average Household Size in El Dorado
Average Household Size in El Dorado is 2.6 People.
How Large is the Labor Force in El Dorado?
There are 7,654 People in the Labor Forcein in El Dorado.
What is the Percentage of People in the Labor Force in El Dorado?
55.9% of People are in the Labor Force in El Dorado.
What is the Unemployment Rate in El Dorado?
Unemployment Rate in El Dorado is 4.3%.