Hot Spring County, AR Map & Demographics
Hot Spring County Map
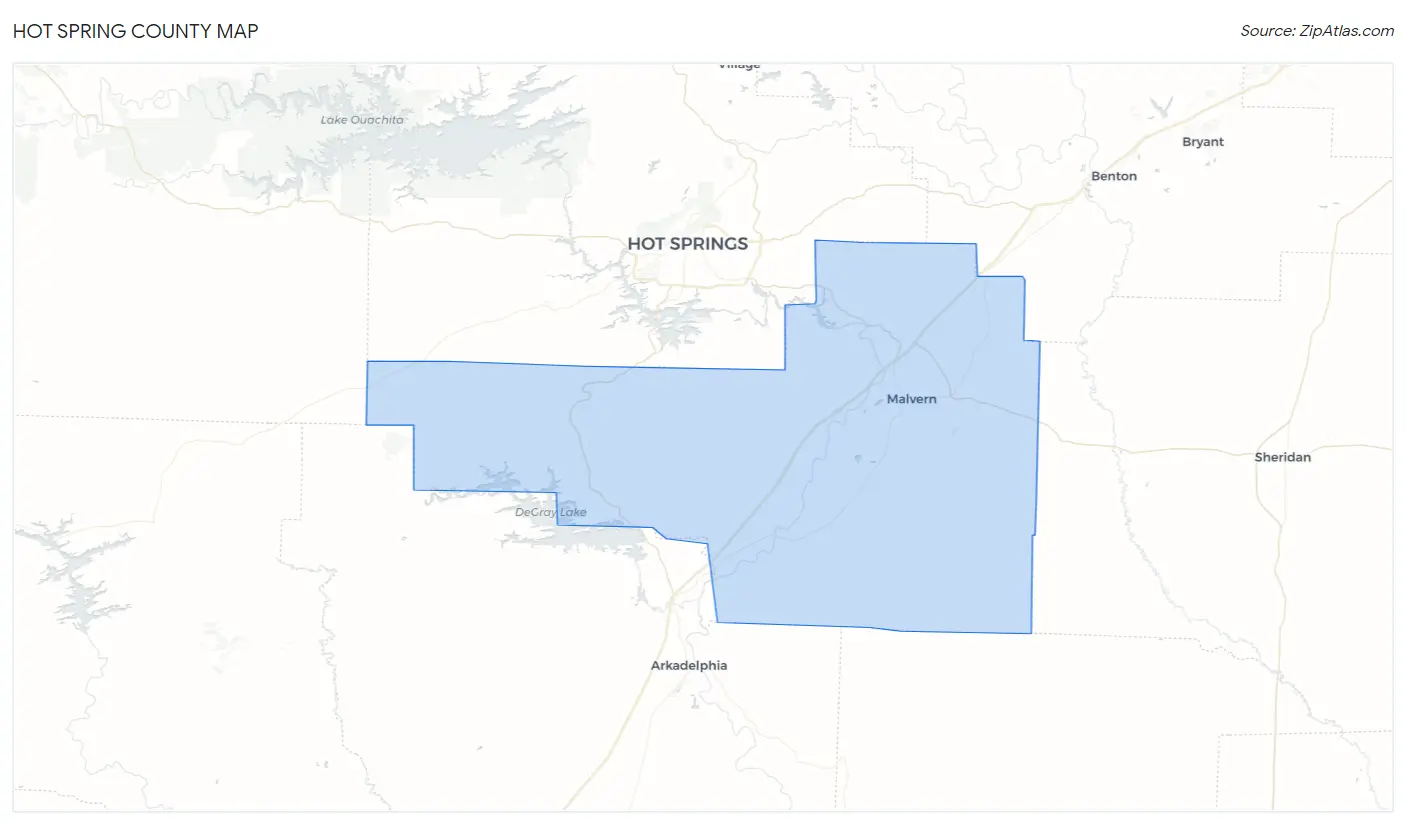
Hot Spring County Overview
$25,486
PER CAPITA INCOME
$63,503
AVG FAMILY INCOME
$50,260
AVG HOUSEHOLD INCOME
22.3%
WAGE / INCOME GAP [ % ]
77.7¢/ $1
WAGE / INCOME GAP [ $ ]
$9,822
FAMILY INCOME DEFICIT
0.44
INEQUALITY / GINI INDEX
33,129
TOTAL POPULATION
17,621
MALE POPULATION
15,508
FEMALE POPULATION
113.63
MALES / 100 FEMALES
88.01
FEMALES / 100 MALES
42.6
MEDIAN AGE
3.1
AVG FAMILY SIZE
2.6
AVG HOUSEHOLD SIZE
13,482
LABOR FORCE [ PEOPLE ]
49.2%
PERCENT IN LABOR FORCE
4.6%
UNEMPLOYMENT RATE
Income in Hot Spring County
Income Overview in Hot Spring County
Per Capita Income in Hot Spring County is $25,486, while median incomes of families and households are $63,503 and $50,260 respectively.
| Characteristic | Number | Measure |
| Per Capita Income | 33,129 | $25,486 |
| Median Family Income | 8,267 | $63,503 |
| Mean Family Income | 8,267 | $77,122 |
| Median Household Income | 11,900 | $50,260 |
| Mean Household Income | 11,900 | $65,891 |
| Income Deficit | 8,267 | $9,822 |
| Wage / Income Gap (%) | 33,129 | 22.33% |
| Wage / Income Gap ($) | 33,129 | 77.67¢ per $1 |
| Gini / Inequality Index | 33,129 | 0.44 |
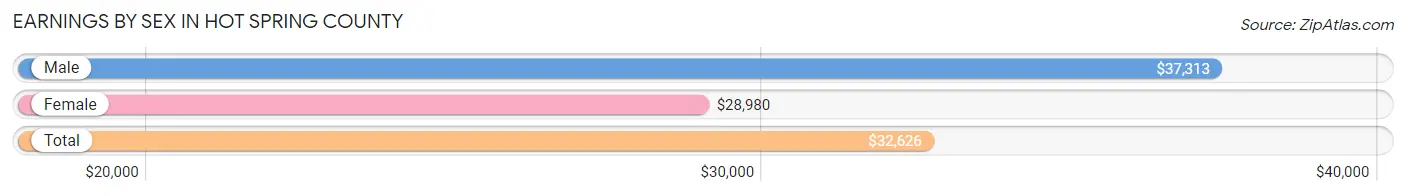
Earnings by Sex in Hot Spring County
Average Earnings in Hot Spring County are $32,626, $37,313 for men and $28,980 for women, a difference of 22.3%.
| Sex | Number | Average Earnings |
| Male | 7,678 (53.1%) | $37,313 |
| Female | 6,783 (46.9%) | $28,980 |
| Total | 14,461 (100.0%) | $32,626 |
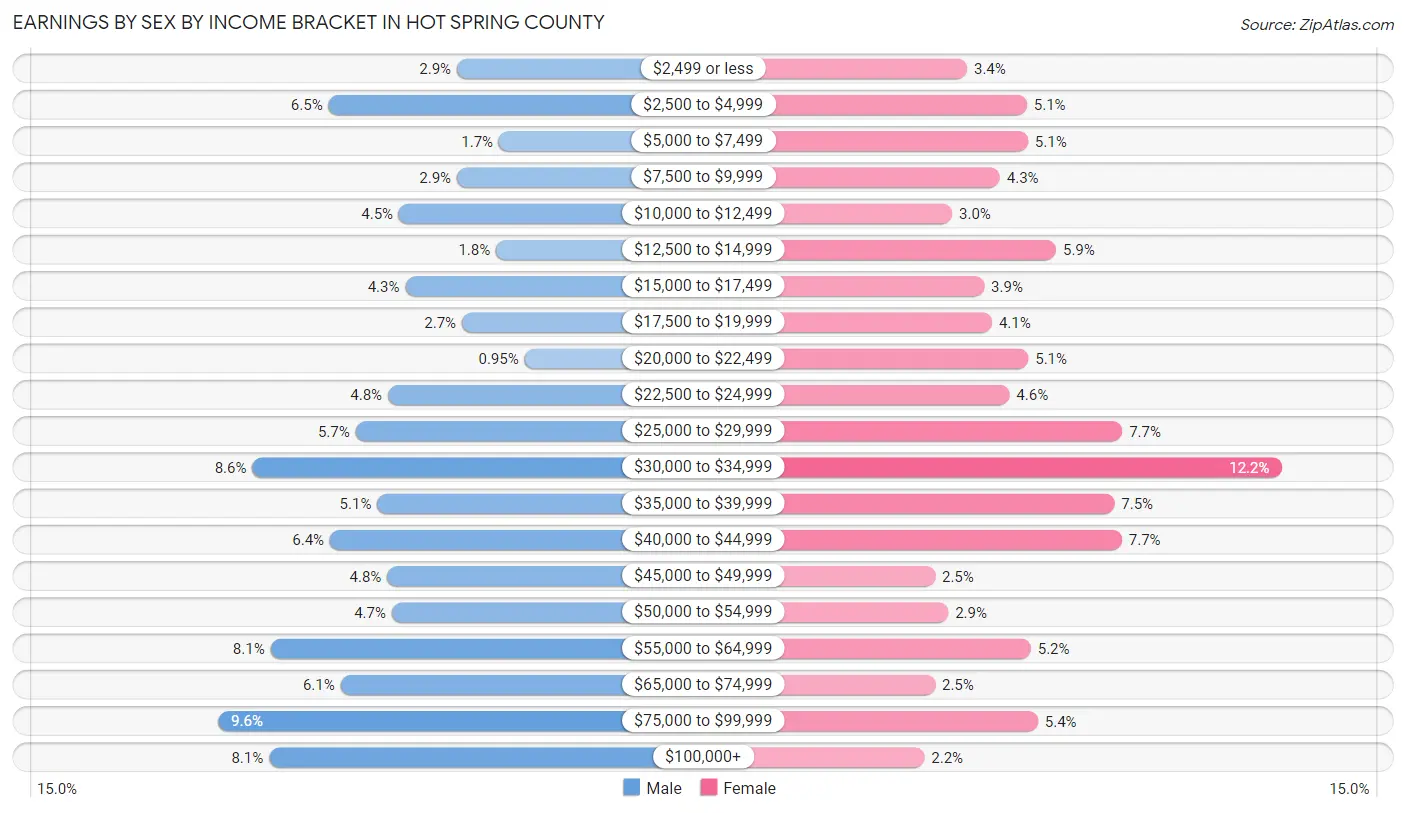
Earnings by Sex by Income Bracket in Hot Spring County
The most common earnings brackets in Hot Spring County are $75,000 to $99,999 for men (734 | 9.6%) and $30,000 to $34,999 for women (828 | 12.2%).
| Income | Male | Female |
| $2,499 or less | 219 (2.9%) | 229 (3.4%) |
| $2,500 to $4,999 | 496 (6.5%) | 343 (5.1%) |
| $5,000 to $7,499 | 128 (1.7%) | 345 (5.1%) |
| $7,500 to $9,999 | 219 (2.9%) | 292 (4.3%) |
| $10,000 to $12,499 | 344 (4.5%) | 201 (3.0%) |
| $12,500 to $14,999 | 134 (1.8%) | 399 (5.9%) |
| $15,000 to $17,499 | 330 (4.3%) | 262 (3.9%) |
| $17,500 to $19,999 | 208 (2.7%) | 277 (4.1%) |
| $20,000 to $22,499 | 73 (0.9%) | 346 (5.1%) |
| $22,500 to $24,999 | 368 (4.8%) | 310 (4.6%) |
| $25,000 to $29,999 | 438 (5.7%) | 525 (7.7%) |
| $30,000 to $34,999 | 660 (8.6%) | 828 (12.2%) |
| $35,000 to $39,999 | 391 (5.1%) | 510 (7.5%) |
| $40,000 to $44,999 | 493 (6.4%) | 524 (7.7%) |
| $45,000 to $49,999 | 369 (4.8%) | 168 (2.5%) |
| $50,000 to $54,999 | 359 (4.7%) | 193 (2.9%) |
| $55,000 to $64,999 | 621 (8.1%) | 351 (5.2%) |
| $65,000 to $74,999 | 470 (6.1%) | 168 (2.5%) |
| $75,000 to $99,999 | 734 (9.6%) | 364 (5.4%) |
| $100,000+ | 624 (8.1%) | 148 (2.2%) |
| Total | 7,678 (100.0%) | 6,783 (100.0%) |
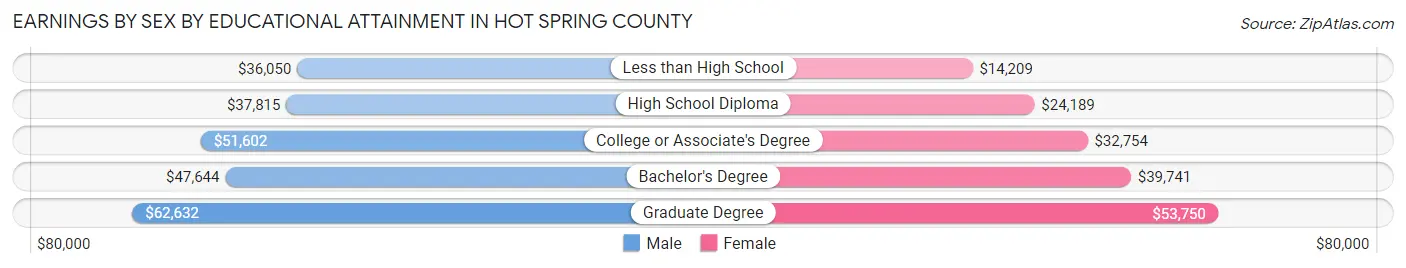
Earnings by Sex by Educational Attainment in Hot Spring County
Average earnings in Hot Spring County are $43,364 for men and $31,930 for women, a difference of 26.4%. Men with an educational attainment of graduate degree enjoy the highest average annual earnings of $62,632, while those with less than high school education earn the least with $36,050. Women with an educational attainment of graduate degree earn the most with the average annual earnings of $53,750, while those with less than high school education have the smallest earnings of $14,209.
| Educational Attainment | Male Income | Female Income |
| Less than High School | $36,050 | $14,209 |
| High School Diploma | $37,815 | $24,189 |
| College or Associate's Degree | $51,602 | $32,754 |
| Bachelor's Degree | $47,644 | $39,741 |
| Graduate Degree | $62,632 | $53,750 |
| Total | $43,364 | $31,930 |
Family Income in Hot Spring County
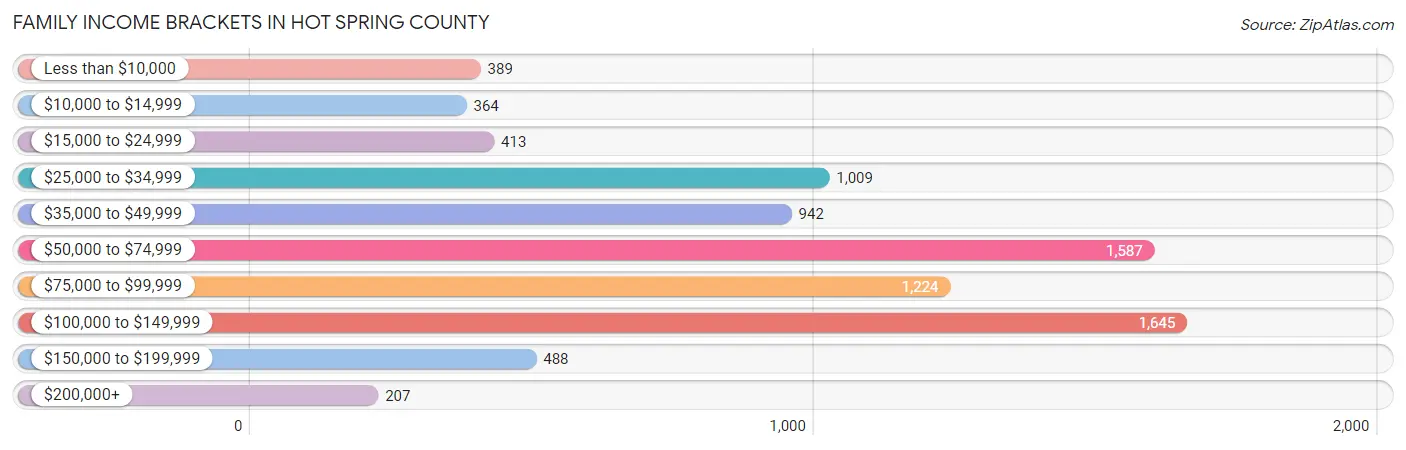
Family Income Brackets in Hot Spring County
According to the Hot Spring County family income data, there are 1,645 families falling into the $100,000 to $149,999 income range, which is the most common income bracket and makes up 19.9% of all families. Conversely, the $200,000+ income bracket is the least frequent group with only 207 families (2.5%) belonging to this category.
| Income Bracket | # Families | % Families |
| Less than $10,000 | 389 | 4.7% |
| $10,000 to $14,999 | 364 | 4.4% |
| $15,000 to $24,999 | 413 | 5.0% |
| $25,000 to $34,999 | 1,009 | 12.2% |
| $35,000 to $49,999 | 942 | 11.4% |
| $50,000 to $74,999 | 1,587 | 19.2% |
| $75,000 to $99,999 | 1,224 | 14.8% |
| $100,000 to $149,999 | 1,645 | 19.9% |
| $150,000 to $199,999 | 488 | 5.9% |
| $200,000+ | 207 | 2.5% |
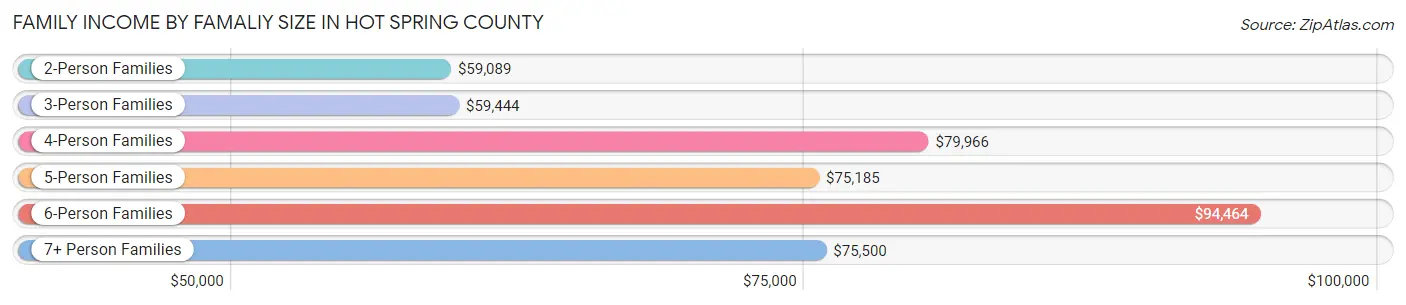
Family Income by Famaliy Size in Hot Spring County
6-person families (211 | 2.5%) account for the highest median family income in Hot Spring County with $94,464 per family, while 2-person families (4,154 | 50.2%) have the highest median income of $29,544 per family member.
| Income Bracket | # Families | Median Income |
| 2-Person Families | 4,154 (50.2%) | $59,089 |
| 3-Person Families | 1,780 (21.5%) | $59,444 |
| 4-Person Families | 1,464 (17.7%) | $79,966 |
| 5-Person Families | 558 (6.8%) | $75,185 |
| 6-Person Families | 211 (2.5%) | $94,464 |
| 7+ Person Families | 100 (1.2%) | $75,500 |
| Total | 8,267 (100.0%) | $63,503 |
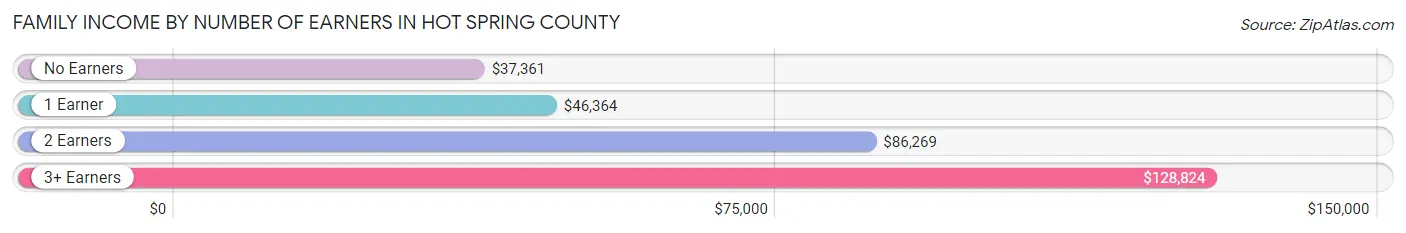
Family Income by Number of Earners in Hot Spring County
The median family income in Hot Spring County is $63,503, with families comprising 3+ earners (824) having the highest median family income of $128,824, while families with no earners (1,844) have the lowest median family income of $37,361, accounting for 10.0% and 22.3% of families, respectively.
| Number of Earners | # Families | Median Income |
| No Earners | 1,844 (22.3%) | $37,361 |
| 1 Earner | 2,892 (35.0%) | $46,364 |
| 2 Earners | 2,707 (32.7%) | $86,269 |
| 3+ Earners | 824 (10.0%) | $128,824 |
| Total | 8,267 (100.0%) | $63,503 |
Household Income in Hot Spring County
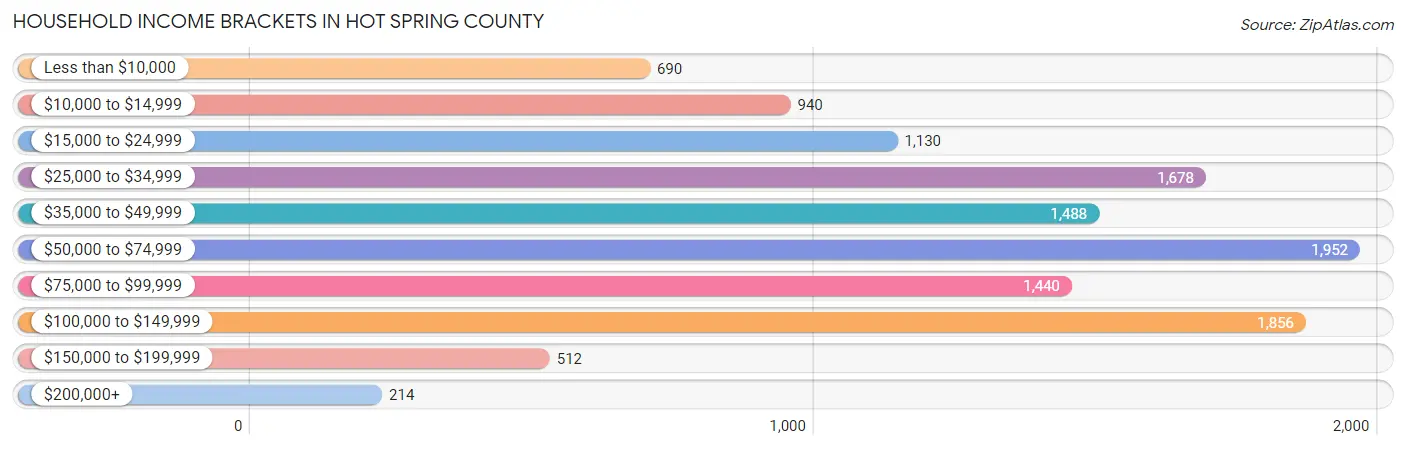
Household Income Brackets in Hot Spring County
With 1,952 households falling in the category, the $50,000 to $74,999 income range is the most frequent in Hot Spring County, accounting for 16.4% of all households. In contrast, only 214 households (1.8%) fall into the $200,000+ income bracket, making it the least populous group.
| Income Bracket | # Households | % Households |
| Less than $10,000 | 690 | 5.8% |
| $10,000 to $14,999 | 940 | 7.9% |
| $15,000 to $24,999 | 1,130 | 9.5% |
| $25,000 to $34,999 | 1,678 | 14.1% |
| $35,000 to $49,999 | 1,488 | 12.5% |
| $50,000 to $74,999 | 1,952 | 16.4% |
| $75,000 to $99,999 | 1,440 | 12.1% |
| $100,000 to $149,999 | 1,856 | 15.6% |
| $150,000 to $199,999 | 512 | 4.3% |
| $200,000+ | 214 | 1.8% |
Household Income by Householder Age in Hot Spring County
The median household income in Hot Spring County is $50,260, with the highest median household income of $57,988 found in the 45 to 64 years age bracket for the primary householder. A total of 4,749 households (39.9%) fall into this category. Meanwhile, the 15 to 24 years age bracket for the primary householder has the lowest median household income of $36,979, with 249 households (2.1%) in this group.
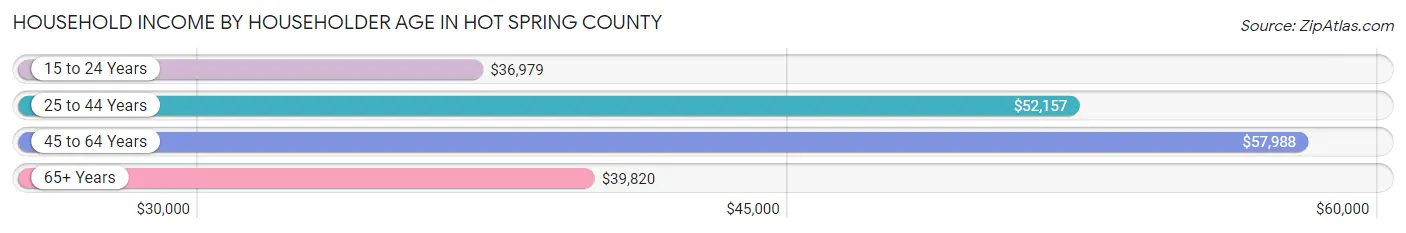
| Income Bracket | # Households | Median Income |
| 15 to 24 Years | 249 (2.1%) | $36,979 |
| 25 to 44 Years | 3,188 (26.8%) | $52,157 |
| 45 to 64 Years | 4,749 (39.9%) | $57,988 |
| 65+ Years | 3,714 (31.2%) | $39,820 |
| Total | 11,900 (100.0%) | $50,260 |
Poverty in Hot Spring County
Income Below Poverty by Sex and Age in Hot Spring County
With 18.4% poverty level for males and 21.0% for females among the residents of Hot Spring County, under 5 year old males and 6 to 11 year old females are the most vulnerable to poverty, with 321 males (37.9%) and 533 females (49.2%) in their respective age groups living below the poverty level.
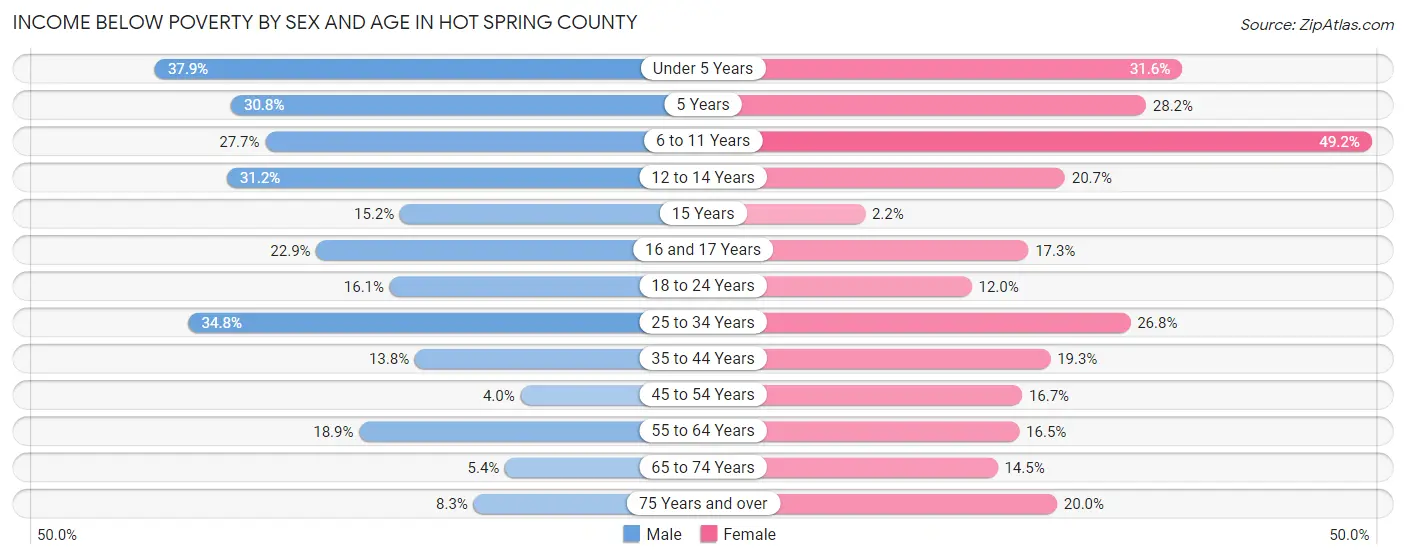
| Age Bracket | Male | Female |
| Under 5 Years | 321 (37.9%) | 215 (31.6%) |
| 5 Years | 33 (30.8%) | 68 (28.2%) |
| 6 to 11 Years | 325 (27.7%) | 533 (49.2%) |
| 12 to 14 Years | 236 (31.2%) | 107 (20.7%) |
| 15 Years | 20 (15.1%) | 4 (2.1%) |
| 16 and 17 Years | 110 (22.9%) | 50 (17.3%) |
| 18 to 24 Years | 234 (16.1%) | 120 (12.0%) |
| 25 to 34 Years | 679 (34.8%) | 504 (26.8%) |
| 35 to 44 Years | 230 (13.8%) | 392 (19.3%) |
| 45 to 54 Years | 80 (4.0%) | 312 (16.7%) |
| 55 to 64 Years | 413 (18.9%) | 370 (16.5%) |
| 65 to 74 Years | 93 (5.4%) | 288 (14.4%) |
| 75 Years and over | 83 (8.3%) | 273 (20.0%) |
| Total | 2,857 (18.4%) | 3,236 (21.0%) |
Income Above Poverty by Sex and Age in Hot Spring County
According to the poverty statistics in Hot Spring County, males aged 45 to 54 years and females aged 15 years are the age groups that are most secure financially, with 96.0% of males and 97.9% of females in these age groups living above the poverty line.
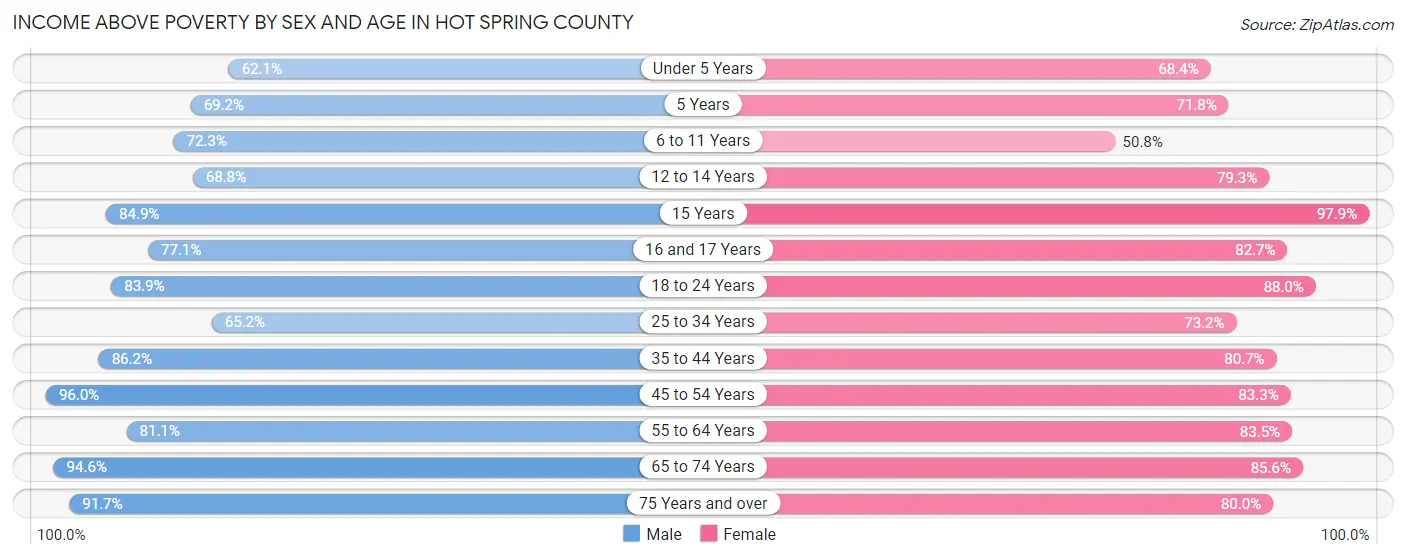
| Age Bracket | Male | Female |
| Under 5 Years | 526 (62.1%) | 466 (68.4%) |
| 5 Years | 74 (69.2%) | 173 (71.8%) |
| 6 to 11 Years | 850 (72.3%) | 551 (50.8%) |
| 12 to 14 Years | 520 (68.8%) | 410 (79.3%) |
| 15 Years | 112 (84.9%) | 182 (97.9%) |
| 16 and 17 Years | 370 (77.1%) | 239 (82.7%) |
| 18 to 24 Years | 1,219 (83.9%) | 877 (88.0%) |
| 25 to 34 Years | 1,274 (65.2%) | 1,379 (73.2%) |
| 35 to 44 Years | 1,440 (86.2%) | 1,635 (80.7%) |
| 45 to 54 Years | 1,933 (96.0%) | 1,554 (83.3%) |
| 55 to 64 Years | 1,767 (81.1%) | 1,878 (83.5%) |
| 65 to 74 Years | 1,628 (94.6%) | 1,705 (85.6%) |
| 75 Years and over | 914 (91.7%) | 1,095 (80.0%) |
| Total | 12,627 (81.6%) | 12,144 (79.0%) |
Income Below Poverty Among Married-Couple Families in Hot Spring County
The poverty statistics for married-couple families in Hot Spring County show that 9.3% or 588 of the total 6,296 families live below the poverty line. Families with 3 or 4 children have the highest poverty rate of 45.7%, comprising of 196 families. On the other hand, families with 5 or more children have the lowest poverty rate of 0.0%, which includes 0 families.
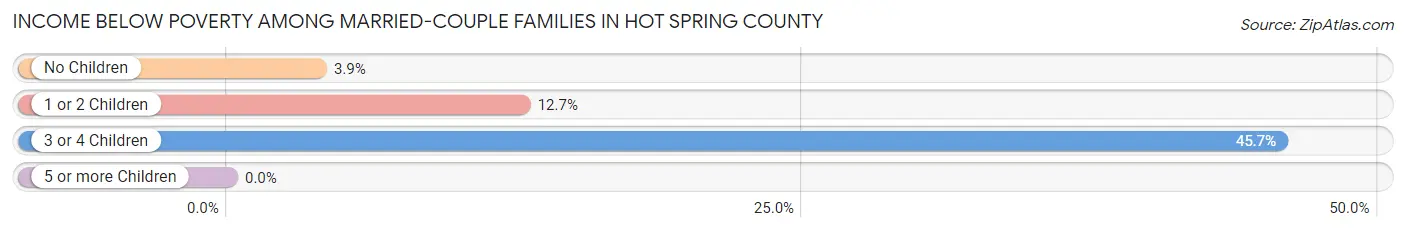
| Children | Above Poverty | Below Poverty |
| No Children | 3,824 (96.1%) | 154 (3.9%) |
| 1 or 2 Children | 1,630 (87.3%) | 238 (12.7%) |
| 3 or 4 Children | 233 (54.3%) | 196 (45.7%) |
| 5 or more Children | 21 (100.0%) | 0 (0.0%) |
| Total | 5,708 (90.7%) | 588 (9.3%) |
Income Below Poverty Among Single-Parent Households in Hot Spring County
According to the poverty data in Hot Spring County, 21.5% or 111 single-father households and 42.9% or 624 single-mother households are living below the poverty line. Among single-father households, those with 3 or 4 children have the highest poverty rate, with 22 households (40.0%) experiencing poverty. Likewise, among single-mother households, those with 5 or more children have the highest poverty rate, with 20 households (100.0%) falling below the poverty line.
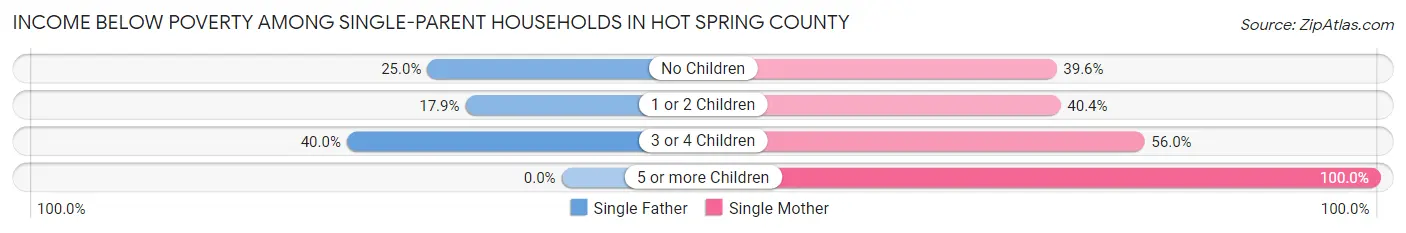
| Children | Single Father | Single Mother |
| No Children | 22 (25.0%) | 248 (39.6%) |
| 1 or 2 Children | 67 (17.9%) | 249 (40.4%) |
| 3 or 4 Children | 22 (40.0%) | 107 (56.0%) |
| 5 or more Children | 0 (0.0%) | 20 (100.0%) |
| Total | 111 (21.5%) | 624 (42.9%) |
Income Below Poverty Among Married-Couple vs Single-Parent Households in Hot Spring County
The poverty data for Hot Spring County shows that 588 of the married-couple family households (9.3%) and 735 of the single-parent households (37.3%) are living below the poverty level. Within the married-couple family households, those with 3 or 4 children have the highest poverty rate, with 196 households (45.7%) falling below the poverty line. Among the single-parent households, those with 5 or more children have the highest poverty rate, with 20 household (100.0%) living below poverty.
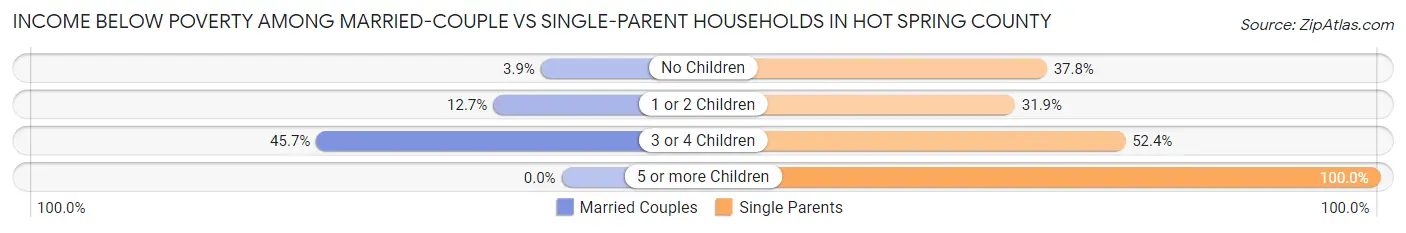
| Children | Married-Couple Families | Single-Parent Households |
| No Children | 154 (3.9%) | 270 (37.8%) |
| 1 or 2 Children | 238 (12.7%) | 316 (31.9%) |
| 3 or 4 Children | 196 (45.7%) | 129 (52.4%) |
| 5 or more Children | 0 (0.0%) | 20 (100.0%) |
| Total | 588 (9.3%) | 735 (37.3%) |
Race in Hot Spring County
The most populous races in Hot Spring County are White / Caucasian (27,782 | 83.9%), Black / African American (3,803 | 11.5%), and Hispanic or Latino (1,249 | 3.8%).
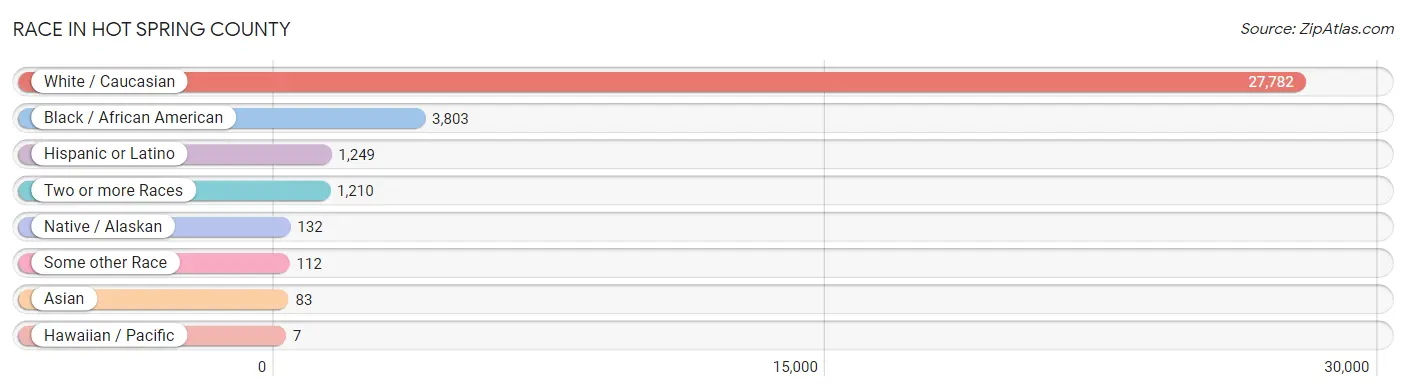
| Race | # Population | % Population |
| Asian | 83 | 0.3% |
| Black / African American | 3,803 | 11.5% |
| Hawaiian / Pacific | 7 | 0.0% |
| Hispanic or Latino | 1,249 | 3.8% |
| Native / Alaskan | 132 | 0.4% |
| White / Caucasian | 27,782 | 83.9% |
| Two or more Races | 1,210 | 3.6% |
| Some other Race | 112 | 0.3% |
| Total | 33,129 | 100.0% |
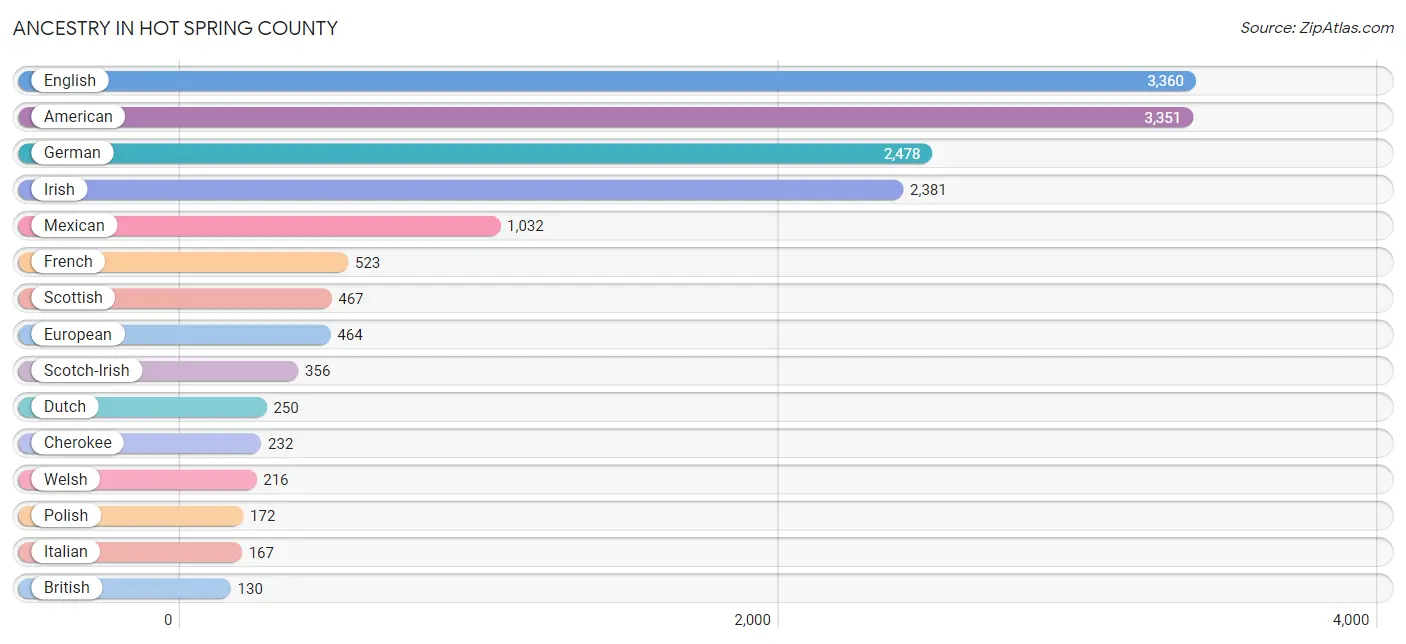
Ancestry in Hot Spring County
The most populous ancestries reported in Hot Spring County are English (3,360 | 10.1%), American (3,351 | 10.1%), German (2,478 | 7.5%), Irish (2,381 | 7.2%), and Mexican (1,032 | 3.1%), together accounting for 38.1% of all Hot Spring County residents.
| Ancestry | # Population | % Population |
| African | 7 | 0.0% |
| American | 3,351 | 10.1% |
| Apache | 31 | 0.1% |
| Austrian | 20 | 0.1% |
| Bahamian | 26 | 0.1% |
| Blackfeet | 31 | 0.1% |
| Brazilian | 11 | 0.0% |
| British | 130 | 0.4% |
| Burmese | 76 | 0.2% |
| Canadian | 10 | 0.0% |
| Central American Indian | 73 | 0.2% |
| Cherokee | 232 | 0.7% |
| Choctaw | 56 | 0.2% |
| Cuban | 33 | 0.1% |
| Czech | 67 | 0.2% |
| Czechoslovakian | 27 | 0.1% |
| Danish | 12 | 0.0% |
| Dutch | 250 | 0.7% |
| Dutch West Indian | 12 | 0.0% |
| Eastern European | 2 | 0.0% |
| English | 3,360 | 10.1% |
| European | 464 | 1.4% |
| Filipino | 1 | 0.0% |
| Finnish | 4 | 0.0% |
| French | 523 | 1.6% |
| French American Indian | 22 | 0.1% |
| French Canadian | 40 | 0.1% |
| German | 2,478 | 7.5% |
| Greek | 126 | 0.4% |
| Haitian | 6 | 0.0% |
| Hungarian | 27 | 0.1% |
| Icelander | 2 | 0.0% |
| Indian (Asian) | 3 | 0.0% |
| Irish | 2,381 | 7.2% |
| Italian | 167 | 0.5% |
| Korean | 38 | 0.1% |
| Malaysian | 96 | 0.3% |
| Mexican | 1,032 | 3.1% |
| Mexican American Indian | 73 | 0.2% |
| Native Hawaiian | 7 | 0.0% |
| Northern European | 78 | 0.2% |
| Norwegian | 66 | 0.2% |
| Ottawa | 38 | 0.1% |
| Pakistani | 28 | 0.1% |
| Pennsylvania German | 42 | 0.1% |
| Polish | 172 | 0.5% |
| Portuguese | 8 | 0.0% |
| Puerto Rican | 7 | 0.0% |
| Russian | 8 | 0.0% |
| Scandinavian | 69 | 0.2% |
| Scotch-Irish | 356 | 1.1% |
| Scottish | 467 | 1.4% |
| Slavic | 6 | 0.0% |
| Spaniard | 22 | 0.1% |
| Spanish | 73 | 0.2% |
| Subsaharan African | 7 | 0.0% |
| Swedish | 124 | 0.4% |
| Swiss | 8 | 0.0% |
| Ukrainian | 8 | 0.0% |
| Welsh | 216 | 0.6% | View All 60 Rows |
Immigrants in Hot Spring County
The most numerous immigrant groups reported in Hot Spring County came from Latin America (308 | 0.9%), Central America (271 | 0.8%), Mexico (271 | 0.8%), Europe (28 | 0.1%), and Asia (26 | 0.1%), together accounting for 2.7% of all Hot Spring County residents.
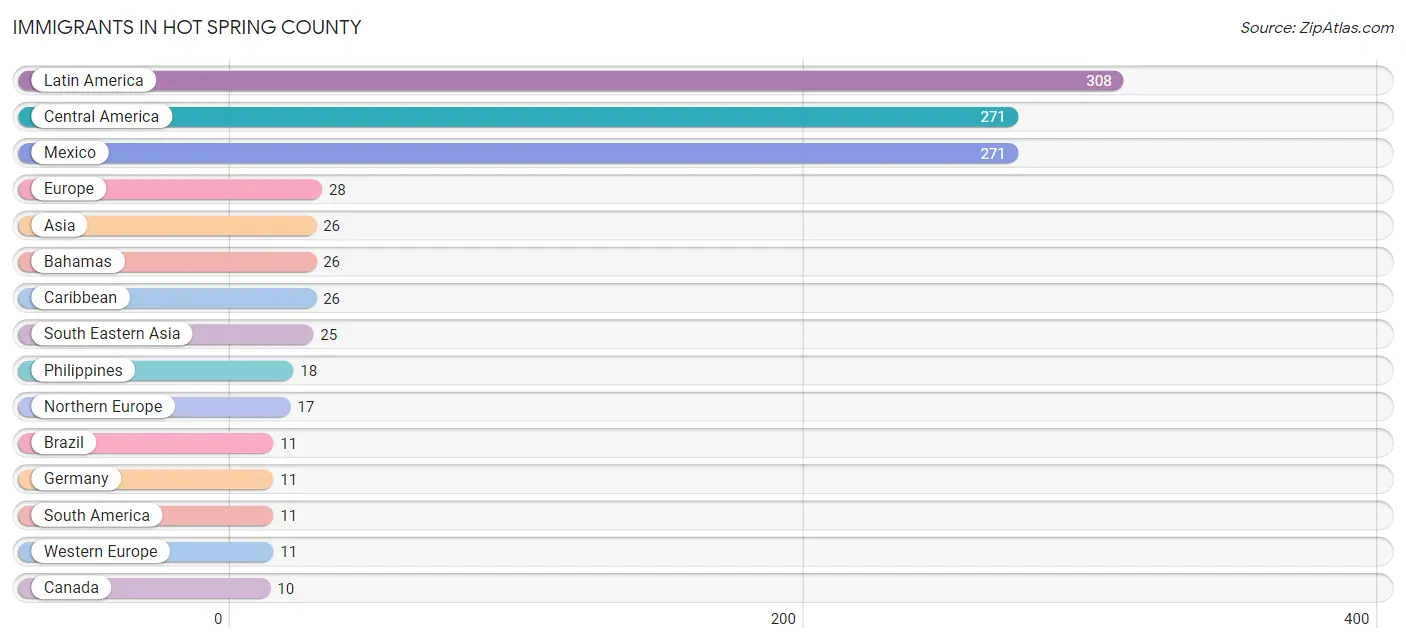
| Immigration Origin | # Population | % Population |
| Asia | 26 | 0.1% |
| Bahamas | 26 | 0.1% |
| Brazil | 11 | 0.0% |
| Canada | 10 | 0.0% |
| Caribbean | 26 | 0.1% |
| Central America | 271 | 0.8% |
| China | 1 | 0.0% |
| Eastern Asia | 1 | 0.0% |
| Europe | 28 | 0.1% |
| Germany | 11 | 0.0% |
| Laos | 6 | 0.0% |
| Latin America | 308 | 0.9% |
| Mexico | 271 | 0.8% |
| Northern Europe | 17 | 0.1% |
| Philippines | 18 | 0.1% |
| South America | 11 | 0.0% |
| South Eastern Asia | 25 | 0.1% |
| Thailand | 1 | 0.0% |
| Western Europe | 11 | 0.0% | View All 19 Rows |
Sex and Age in Hot Spring County
Sex and Age in Hot Spring County
The most populous age groups in Hot Spring County are 45 to 49 Years (1,369 | 7.8%) for men and 60 to 64 Years (1,267 | 8.2%) for women.
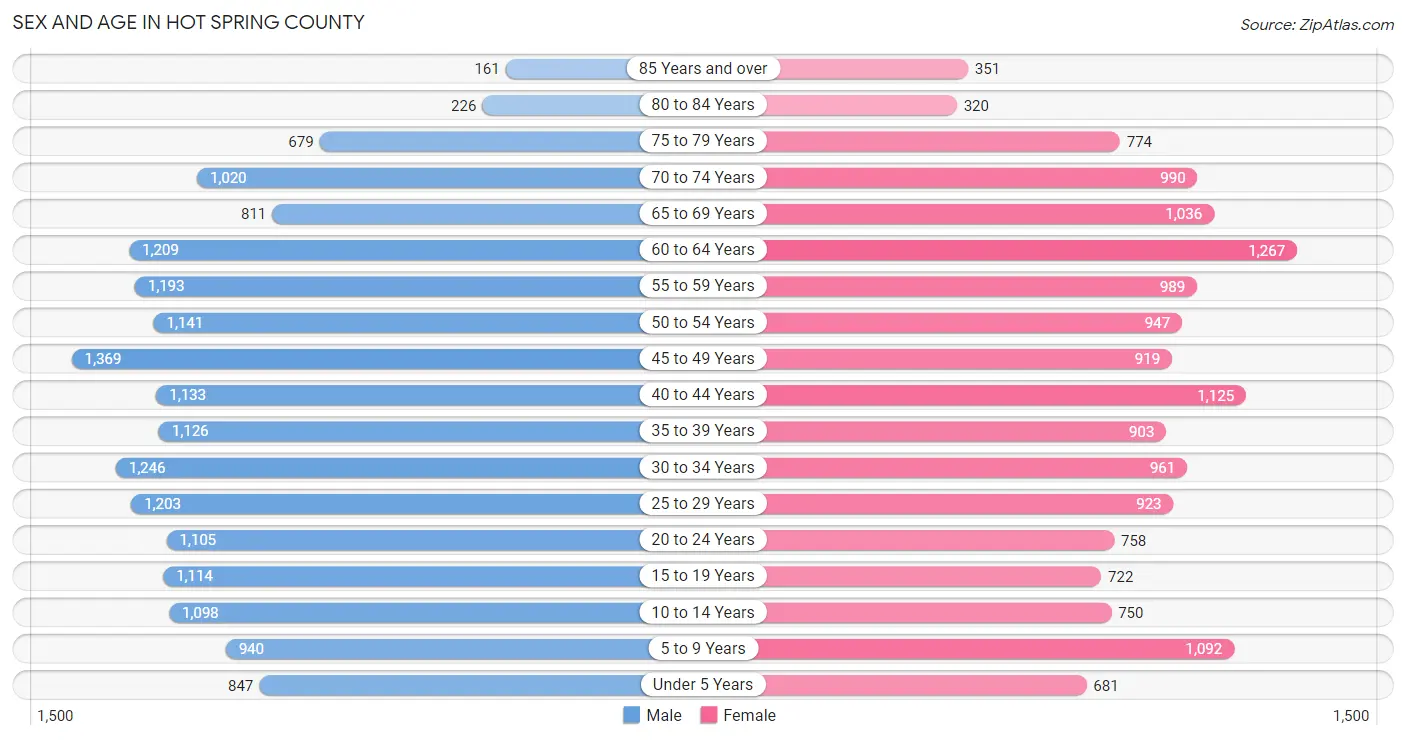
| Age Bracket | Male | Female |
| Under 5 Years | 847 (4.8%) | 681 (4.4%) |
| 5 to 9 Years | 940 (5.3%) | 1,092 (7.0%) |
| 10 to 14 Years | 1,098 (6.2%) | 750 (4.8%) |
| 15 to 19 Years | 1,114 (6.3%) | 722 (4.7%) |
| 20 to 24 Years | 1,105 (6.3%) | 758 (4.9%) |
| 25 to 29 Years | 1,203 (6.8%) | 923 (5.9%) |
| 30 to 34 Years | 1,246 (7.1%) | 961 (6.2%) |
| 35 to 39 Years | 1,126 (6.4%) | 903 (5.8%) |
| 40 to 44 Years | 1,133 (6.4%) | 1,125 (7.2%) |
| 45 to 49 Years | 1,369 (7.8%) | 919 (5.9%) |
| 50 to 54 Years | 1,141 (6.5%) | 947 (6.1%) |
| 55 to 59 Years | 1,193 (6.8%) | 989 (6.4%) |
| 60 to 64 Years | 1,209 (6.9%) | 1,267 (8.2%) |
| 65 to 69 Years | 811 (4.6%) | 1,036 (6.7%) |
| 70 to 74 Years | 1,020 (5.8%) | 990 (6.4%) |
| 75 to 79 Years | 679 (3.8%) | 774 (5.0%) |
| 80 to 84 Years | 226 (1.3%) | 320 (2.1%) |
| 85 Years and over | 161 (0.9%) | 351 (2.3%) |
| Total | 17,621 (100.0%) | 15,508 (100.0%) |
Families and Households in Hot Spring County
Median Family Size in Hot Spring County
The median family size in Hot Spring County is 3.15 persons per family, with single female/mother families (1,454 | 17.6%) accounting for the largest median family size of 3.47 persons per family. On the other hand, married-couple families (6,296 | 76.2%) represent the smallest median family size with 3.08 persons per family.
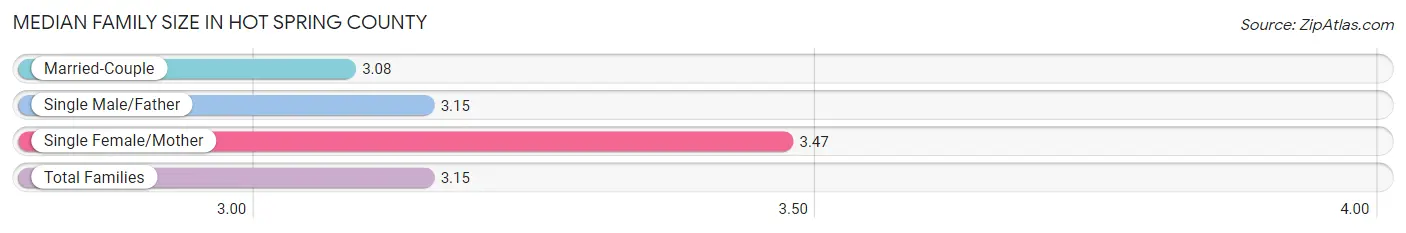
| Family Type | # Families | Family Size |
| Married-Couple | 6,296 (76.2%) | 3.08 |
| Single Male/Father | 517 (6.2%) | 3.15 |
| Single Female/Mother | 1,454 (17.6%) | 3.47 |
| Total Families | 8,267 (100.0%) | 3.15 |
Median Household Size in Hot Spring County
The median household size in Hot Spring County is 2.59 persons per household, with single female/mother households (1,454 | 12.2%) accounting for the largest median household size of 3.66 persons per household. non-family households (3,633 | 30.5%) represent the smallest median household size with 1.15 persons per household.
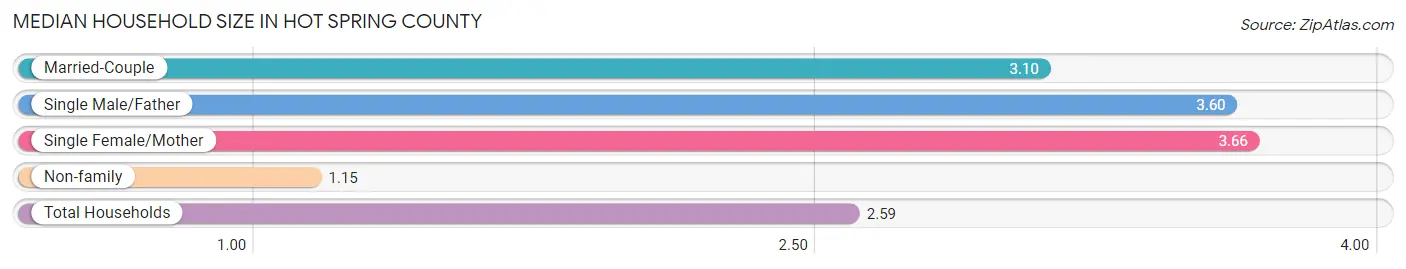
| Household Type | # Households | Household Size |
| Married-Couple | 6,296 (52.9%) | 3.10 |
| Single Male/Father | 517 (4.3%) | 3.60 |
| Single Female/Mother | 1,454 (12.2%) | 3.66 |
| Non-family | 3,633 (30.5%) | 1.15 |
| Total Households | 11,900 (100.0%) | 2.59 |
Household Size by Marriage Status in Hot Spring County
Out of a total of 11,900 households in Hot Spring County, 8,267 (69.5%) are family households, while 3,633 (30.5%) are nonfamily households. The most numerous type of family households are 2-person households, comprising 3,968, and the most common type of nonfamily households are 1-person households, comprising 3,225.
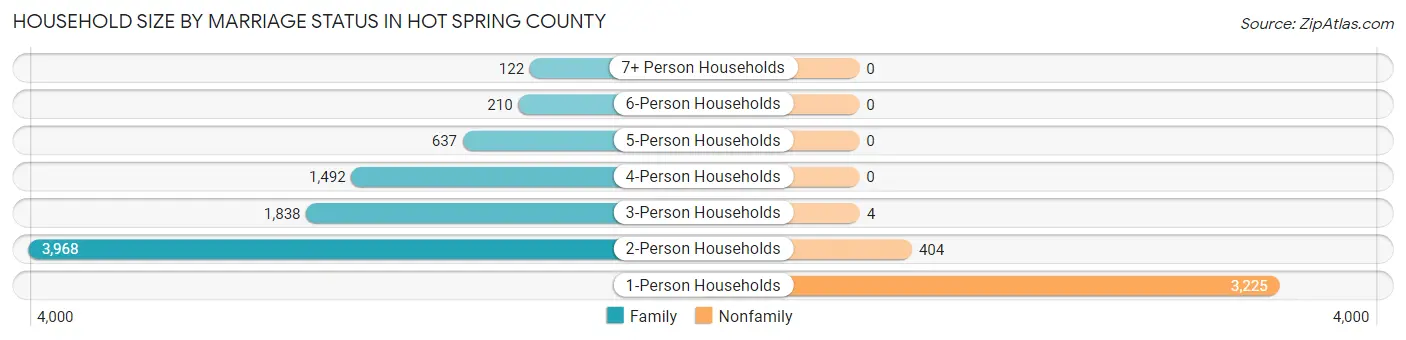
| Household Size | Family Households | Nonfamily Households |
| 1-Person Households | - | 3,225 (27.1%) |
| 2-Person Households | 3,968 (33.3%) | 404 (3.4%) |
| 3-Person Households | 1,838 (15.4%) | 4 (0.0%) |
| 4-Person Households | 1,492 (12.5%) | 0 (0.0%) |
| 5-Person Households | 637 (5.3%) | 0 (0.0%) |
| 6-Person Households | 210 (1.8%) | 0 (0.0%) |
| 7+ Person Households | 122 (1.0%) | 0 (0.0%) |
| Total | 8,267 (69.5%) | 3,633 (30.5%) |
Female Fertility in Hot Spring County
Fertility by Age in Hot Spring County
Average fertility rate in Hot Spring County is 42.0 births per 1,000 women. Women in the age bracket of 20 to 34 years have the highest fertility rate with 97.0 births per 1,000 women. Women in the age bracket of 20 to 34 years acount for 93.8% of all women with births.
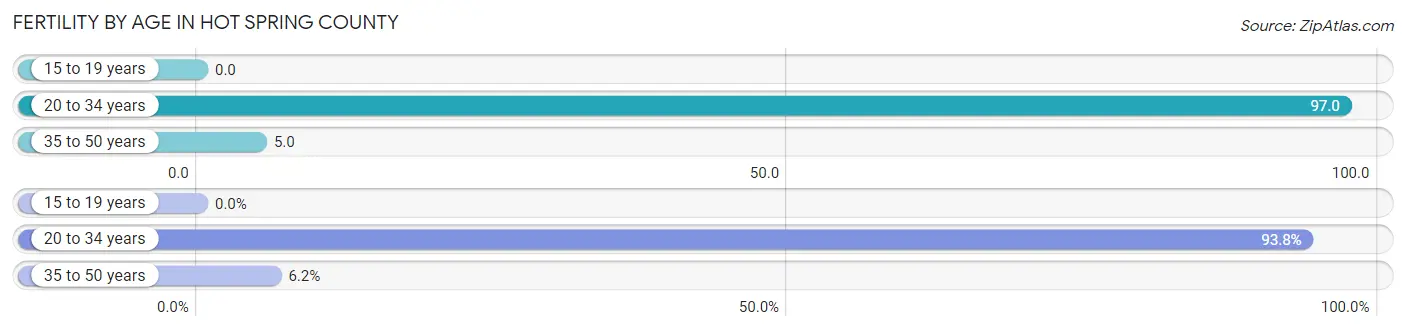
| Age Bracket | Women with Births | Births / 1,000 Women |
| 15 to 19 years | 0 (0.0%) | 0.0 |
| 20 to 34 years | 256 (93.8%) | 97.0 |
| 35 to 50 years | 17 (6.2%) | 5.0 |
| Total | 273 (100.0%) | 42.0 |
Fertility by Age by Marriage Status in Hot Spring County
64.8% of women with births (273) in Hot Spring County are married. The highest percentage of unmarried women with births falls into 20 to 34 years age bracket with 37.5% of them unmarried at the time of birth, while the lowest percentage of unmarried women with births belong to 35 to 50 years age bracket with 0.0% of them unmarried.
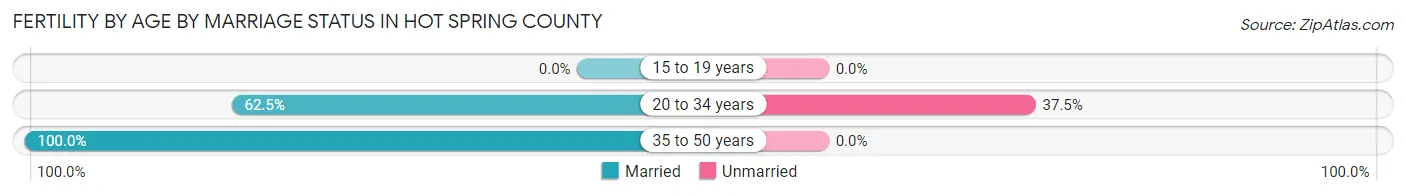
| Age Bracket | Married | Unmarried |
| 15 to 19 years | 0 (0.0%) | 0 (0.0%) |
| 20 to 34 years | 160 (62.5%) | 96 (37.5%) |
| 35 to 50 years | 17 (100.0%) | 0 (0.0%) |
| Total | 177 (64.8%) | 96 (35.2%) |
Fertility by Education in Hot Spring County
Average fertility rate in Hot Spring County is 42.0 births per 1,000 women. Women with the education attainment of college or associate's degree have the highest fertility rate of 52.0 births per 1,000 women, while women with the education attainment of bachelor's degree have the lowest fertility at 22.0 births per 1,000 women. Women with the education attainment of college or associate's degree represent 56.0% of all women with births.
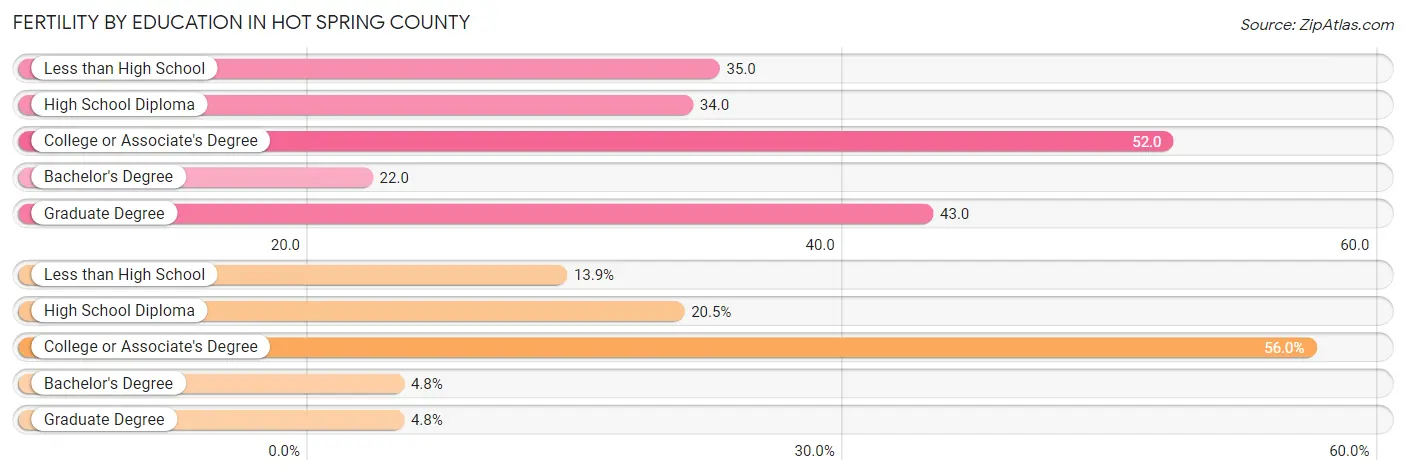
| Educational Attainment | Women with Births | Births / 1,000 Women |
| Less than High School | 38 (13.9%) | 35.0 |
| High School Diploma | 56 (20.5%) | 34.0 |
| College or Associate's Degree | 153 (56.0%) | 52.0 |
| Bachelor's Degree | 13 (4.8%) | 22.0 |
| Graduate Degree | 13 (4.8%) | 43.0 |
| Total | 273 (100.0%) | 42.0 |
Fertility by Education by Marriage Status in Hot Spring County
35.2% of women with births in Hot Spring County are unmarried. Women with the educational attainment of bachelor's degree are most likely to be married with 100.0% of them married at childbirth, while women with the educational attainment of less than high school are least likely to be married with 76.3% of them unmarried at childbirth.
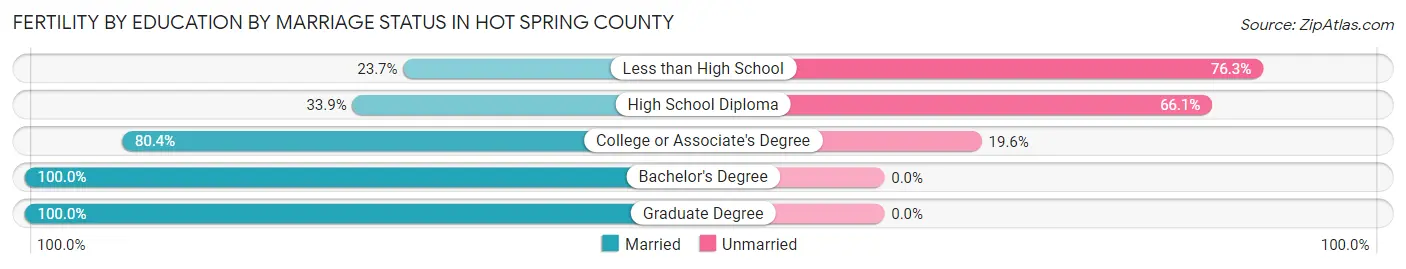
| Educational Attainment | Married | Unmarried |
| Less than High School | 9 (23.7%) | 29 (76.3%) |
| High School Diploma | 19 (33.9%) | 37 (66.1%) |
| College or Associate's Degree | 123 (80.4%) | 30 (19.6%) |
| Bachelor's Degree | 13 (100.0%) | 0 (0.0%) |
| Graduate Degree | 13 (100.0%) | 0 (0.0%) |
| Total | 177 (64.8%) | 96 (35.2%) |
Employment Characteristics in Hot Spring County
Employment by Class of Employer in Hot Spring County
Among the 12,758 employed individuals in Hot Spring County, private company employees (9,024 | 70.7%), state government employees (918 | 7.2%), and not-for-profit organizations (805 | 6.3%) make up the most common classes of employment.
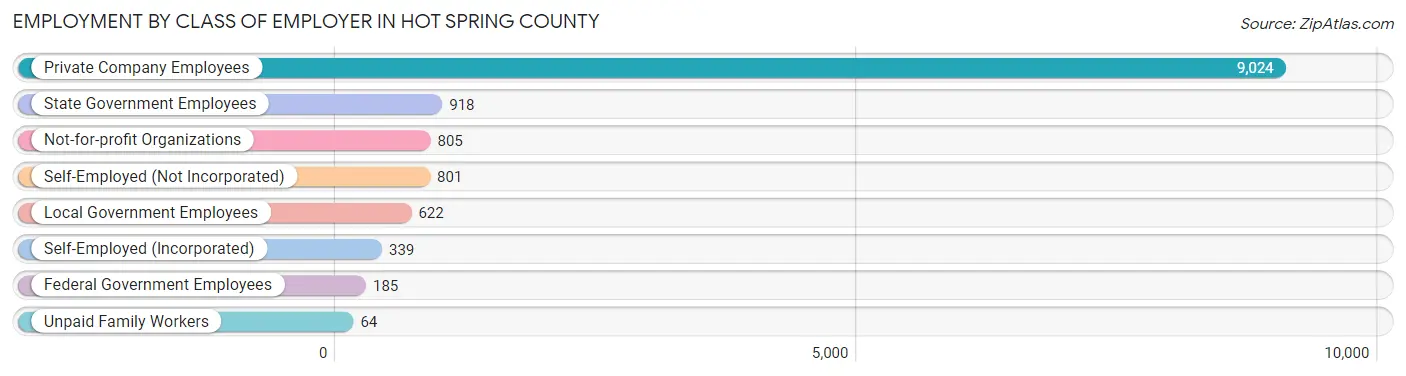
| Employer Class | # Employees | % Employees |
| Private Company Employees | 9,024 | 70.7% |
| Self-Employed (Incorporated) | 339 | 2.7% |
| Self-Employed (Not Incorporated) | 801 | 6.3% |
| Not-for-profit Organizations | 805 | 6.3% |
| Local Government Employees | 622 | 4.9% |
| State Government Employees | 918 | 7.2% |
| Federal Government Employees | 185 | 1.5% |
| Unpaid Family Workers | 64 | 0.5% |
| Total | 12,758 | 100.0% |
Employment Status by Age in Hot Spring County
According to the labor force statistics for Hot Spring County, out of the total population over 16 years of age (27,403), 49.2% or 13,482 individuals are in the labor force, with 4.6% or 620 of them unemployed. The age group with the highest labor force participation rate is 30 to 34 years, with 69.4% or 1,532 individuals in the labor force. Within the labor force, the 20 to 24 years age range has the highest percentage of unemployed individuals, with 11.2% or 141 of them being unemployed.
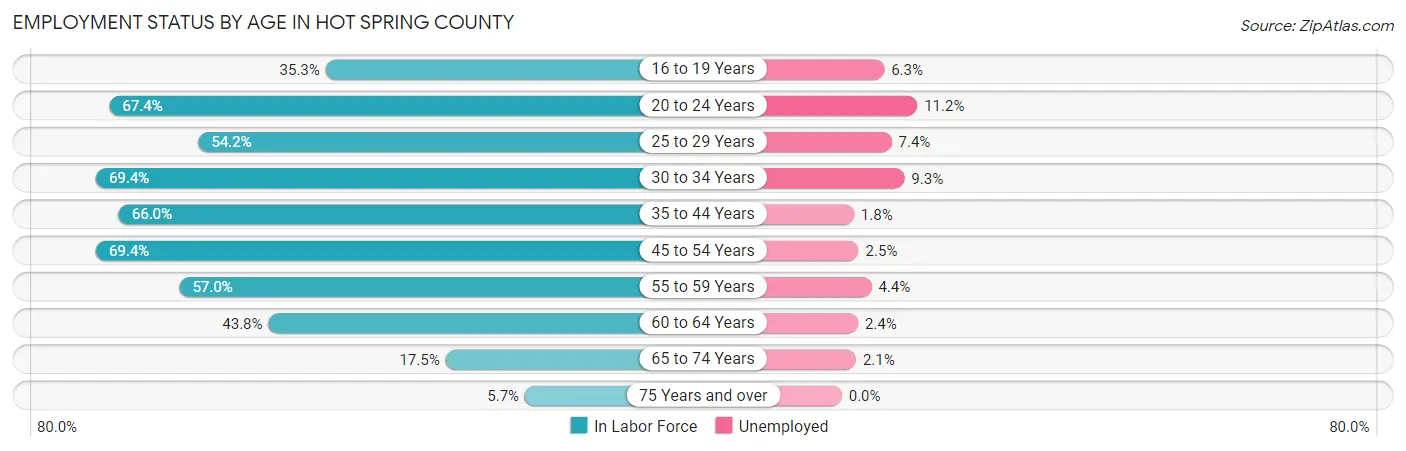
| Age Bracket | In Labor Force | Unemployed |
| 16 to 19 Years | 536 (35.3%) | 34 (6.3%) |
| 20 to 24 Years | 1,256 (67.4%) | 141 (11.2%) |
| 25 to 29 Years | 1,152 (54.2%) | 85 (7.4%) |
| 30 to 34 Years | 1,532 (69.4%) | 142 (9.3%) |
| 35 to 44 Years | 2,829 (66.0%) | 51 (1.8%) |
| 45 to 54 Years | 3,037 (69.4%) | 76 (2.5%) |
| 55 to 59 Years | 1,244 (57.0%) | 55 (4.4%) |
| 60 to 64 Years | 1,084 (43.8%) | 26 (2.4%) |
| 65 to 74 Years | 675 (17.5%) | 14 (2.1%) |
| 75 Years and over | 143 (5.7%) | 0 (0.0%) |
| Total | 13,482 (49.2%) | 620 (4.6%) |
Employment Status by Educational Attainment in Hot Spring County
According to labor force statistics for Hot Spring County, 61.6% of individuals (10,875) out of the total population between 25 and 64 years of age (17,654) are in the labor force, with 4.0% or 435 of them being unemployed. The group with the highest labor force participation rate are those with the educational attainment of bachelor's degree or higher, with 75.8% or 1,925 individuals in the labor force. Within the labor force, individuals with less than high school education have the highest percentage of unemployment, with 8.8% or 62 of them being unemployed.
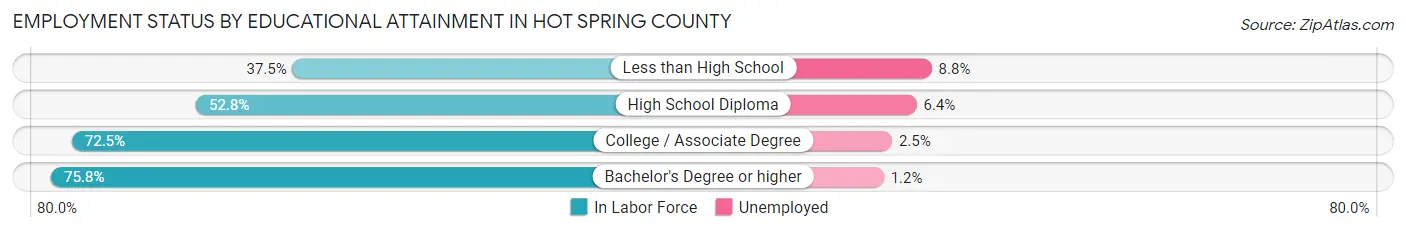
| Educational Attainment | In Labor Force | Unemployed |
| Less than High School | 702 (37.5%) | 165 (8.8%) |
| High School Diploma | 3,620 (52.8%) | 439 (6.4%) |
| College / Associate Degree | 4,630 (72.5%) | 160 (2.5%) |
| Bachelor's Degree or higher | 1,925 (75.8%) | 30 (1.2%) |
| Total | 10,875 (61.6%) | 706 (4.0%) |
Employment Occupations by Sex in Hot Spring County
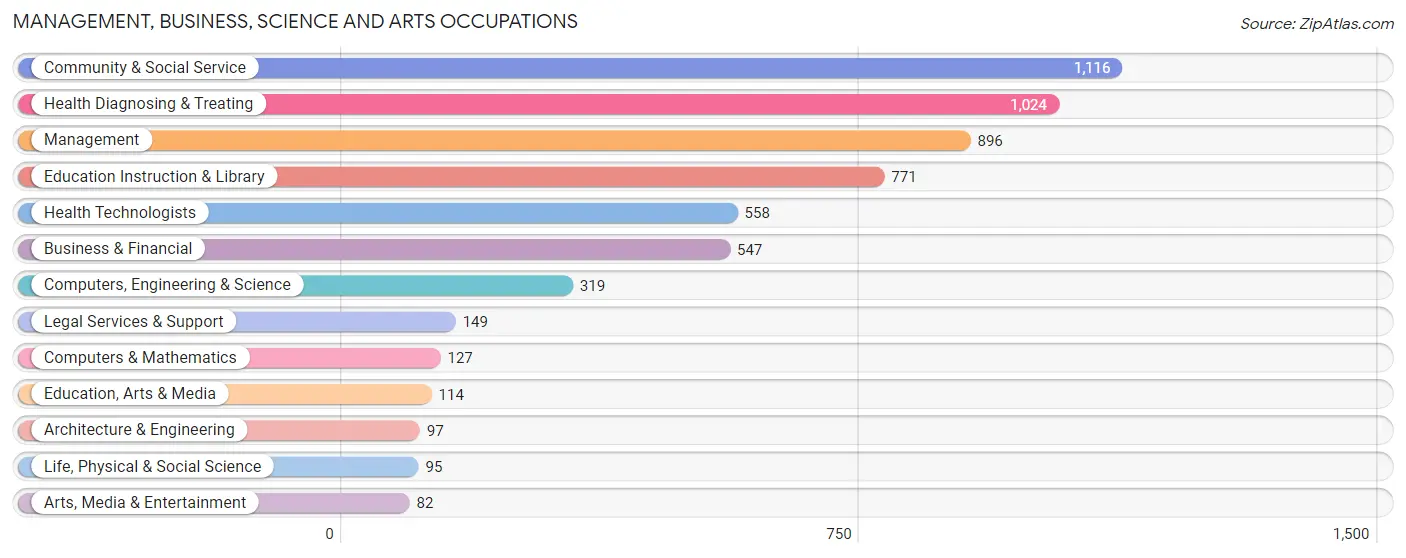
Management, Business, Science and Arts Occupations
The most common Management, Business, Science and Arts occupations in Hot Spring County are Community & Social Service (1,116 | 8.7%), Health Diagnosing & Treating (1,024 | 8.0%), Management (896 | 7.0%), Education Instruction & Library (771 | 6.0%), and Health Technologists (558 | 4.3%).
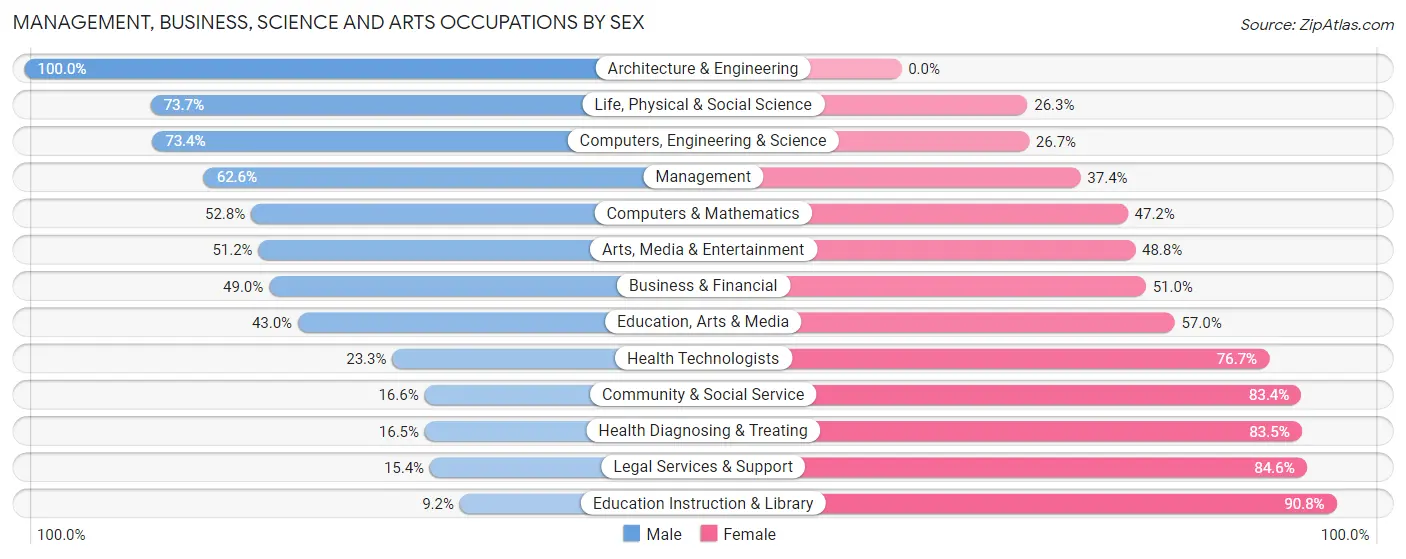
Management, Business, Science and Arts Occupations by Sex
Within the Management, Business, Science and Arts occupations in Hot Spring County, the most male-oriented occupations are Architecture & Engineering (100.0%), Life, Physical & Social Science (73.7%), and Computers, Engineering & Science (73.4%), while the most female-oriented occupations are Education Instruction & Library (90.8%), Legal Services & Support (84.6%), and Health Diagnosing & Treating (83.5%).
| Occupation | Male | Female |
| Management | 561 (62.6%) | 335 (37.4%) |
| Business & Financial | 268 (49.0%) | 279 (51.0%) |
| Computers, Engineering & Science | 234 (73.4%) | 85 (26.7%) |
| Computers & Mathematics | 67 (52.8%) | 60 (47.2%) |
| Architecture & Engineering | 97 (100.0%) | 0 (0.0%) |
| Life, Physical & Social Science | 70 (73.7%) | 25 (26.3%) |
| Community & Social Service | 185 (16.6%) | 931 (83.4%) |
| Education, Arts & Media | 49 (43.0%) | 65 (57.0%) |
| Legal Services & Support | 23 (15.4%) | 126 (84.6%) |
| Education Instruction & Library | 71 (9.2%) | 700 (90.8%) |
| Arts, Media & Entertainment | 42 (51.2%) | 40 (48.8%) |
| Health Diagnosing & Treating | 169 (16.5%) | 855 (83.5%) |
| Health Technologists | 130 (23.3%) | 428 (76.7%) |
| Total (Category) | 1,417 (36.3%) | 2,485 (63.7%) |
| Total (Overall) | 6,644 (51.8%) | 6,175 (48.2%) |
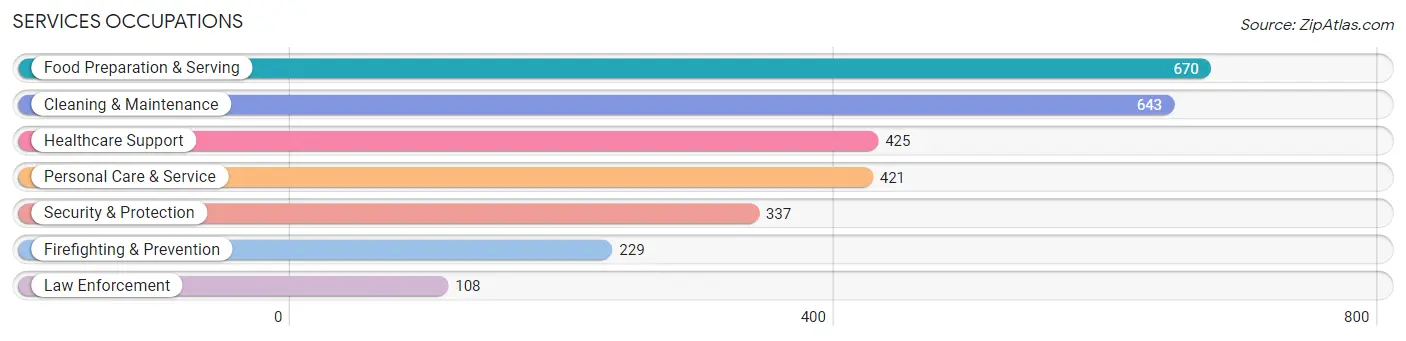
Services Occupations
The most common Services occupations in Hot Spring County are Food Preparation & Serving (670 | 5.2%), Cleaning & Maintenance (643 | 5.0%), Healthcare Support (425 | 3.3%), Personal Care & Service (421 | 3.3%), and Security & Protection (337 | 2.6%).
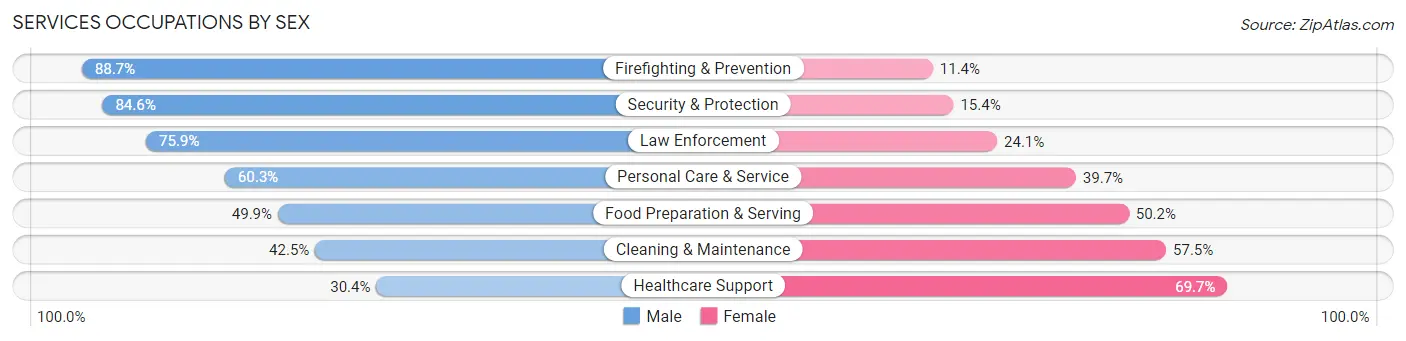
Services Occupations by Sex
Within the Services occupations in Hot Spring County, the most male-oriented occupations are Firefighting & Prevention (88.6%), Security & Protection (84.6%), and Law Enforcement (75.9%), while the most female-oriented occupations are Healthcare Support (69.7%), Cleaning & Maintenance (57.5%), and Food Preparation & Serving (50.1%).
| Occupation | Male | Female |
| Healthcare Support | 129 (30.3%) | 296 (69.7%) |
| Security & Protection | 285 (84.6%) | 52 (15.4%) |
| Firefighting & Prevention | 203 (88.6%) | 26 (11.4%) |
| Law Enforcement | 82 (75.9%) | 26 (24.1%) |
| Food Preparation & Serving | 334 (49.8%) | 336 (50.1%) |
| Cleaning & Maintenance | 273 (42.5%) | 370 (57.5%) |
| Personal Care & Service | 254 (60.3%) | 167 (39.7%) |
| Total (Category) | 1,275 (51.1%) | 1,221 (48.9%) |
| Total (Overall) | 6,644 (51.8%) | 6,175 (48.2%) |
Sales and Office Occupations
The most common Sales and Office occupations in Hot Spring County are Office & Administration (1,353 | 10.5%), and Sales & Related (1,201 | 9.4%).
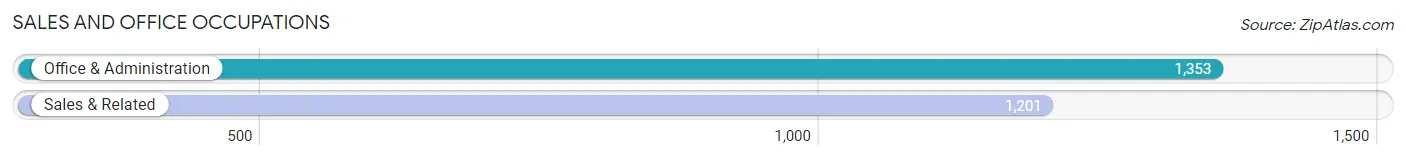
Sales and Office Occupations by Sex
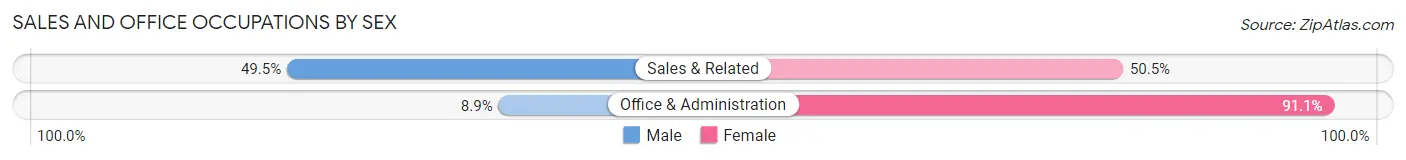
| Occupation | Male | Female |
| Sales & Related | 595 (49.5%) | 606 (50.5%) |
| Office & Administration | 120 (8.9%) | 1,233 (91.1%) |
| Total (Category) | 715 (28.0%) | 1,839 (72.0%) |
| Total (Overall) | 6,644 (51.8%) | 6,175 (48.2%) |
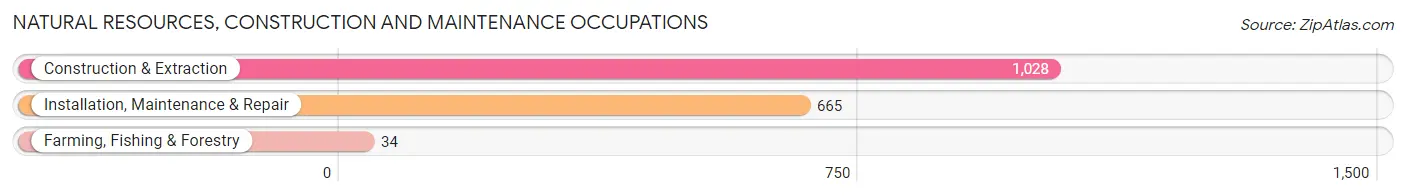
Natural Resources, Construction and Maintenance Occupations
The most common Natural Resources, Construction and Maintenance occupations in Hot Spring County are Construction & Extraction (1,028 | 8.0%), Installation, Maintenance & Repair (665 | 5.2%), and Farming, Fishing & Forestry (34 | 0.3%).
Natural Resources, Construction and Maintenance Occupations by Sex
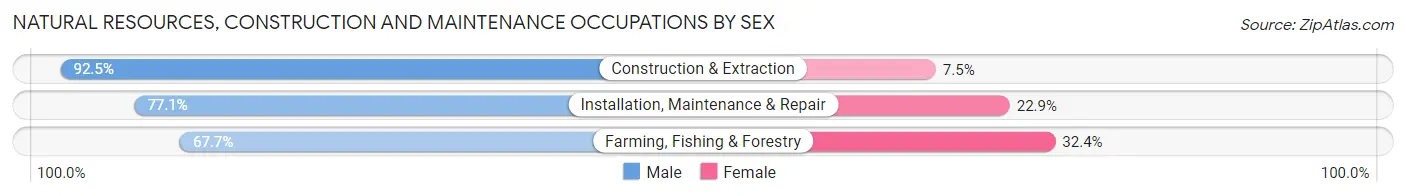
| Occupation | Male | Female |
| Farming, Fishing & Forestry | 23 (67.6%) | 11 (32.4%) |
| Construction & Extraction | 951 (92.5%) | 77 (7.5%) |
| Installation, Maintenance & Repair | 513 (77.1%) | 152 (22.9%) |
| Total (Category) | 1,487 (86.1%) | 240 (13.9%) |
| Total (Overall) | 6,644 (51.8%) | 6,175 (48.2%) |
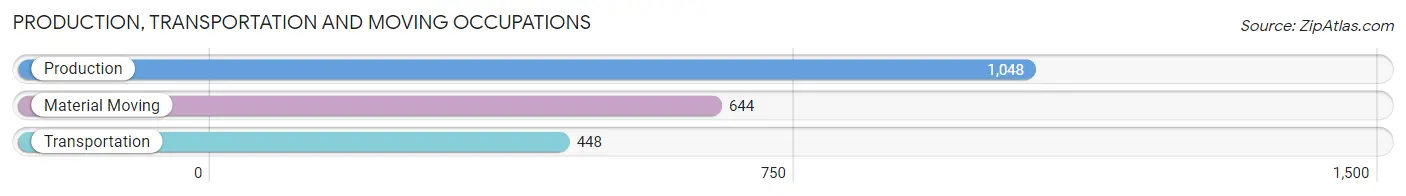
Production, Transportation and Moving Occupations
The most common Production, Transportation and Moving occupations in Hot Spring County are Production (1,048 | 8.2%), Material Moving (644 | 5.0%), and Transportation (448 | 3.5%).
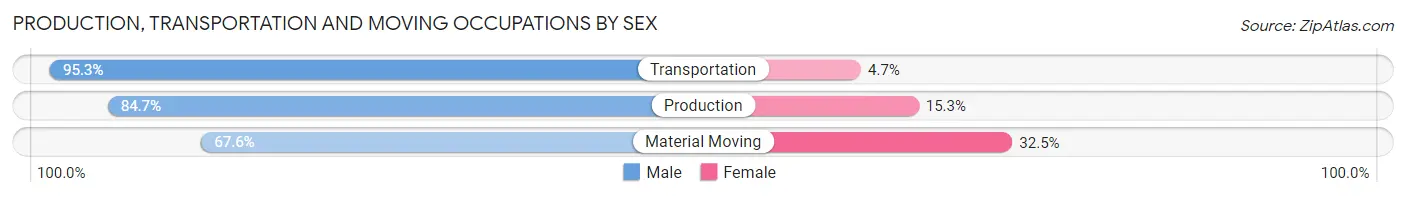
Production, Transportation and Moving Occupations by Sex
| Occupation | Male | Female |
| Production | 888 (84.7%) | 160 (15.3%) |
| Transportation | 427 (95.3%) | 21 (4.7%) |
| Material Moving | 435 (67.5%) | 209 (32.5%) |
| Total (Category) | 1,750 (81.8%) | 390 (18.2%) |
| Total (Overall) | 6,644 (51.8%) | 6,175 (48.2%) |
Employment Industries by Sex in Hot Spring County
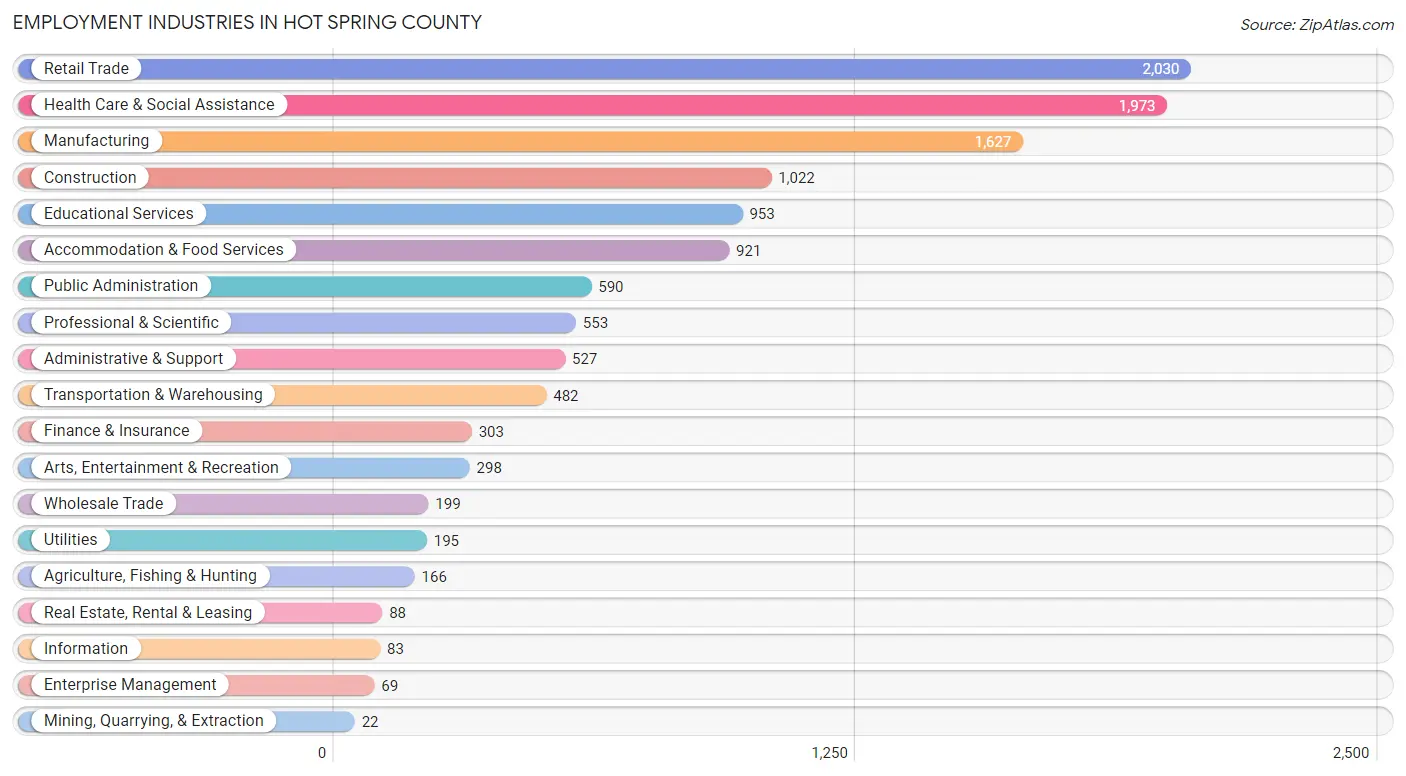
Employment Industries in Hot Spring County
The major employment industries in Hot Spring County include Retail Trade (2,030 | 15.8%), Health Care & Social Assistance (1,973 | 15.4%), Manufacturing (1,627 | 12.7%), Construction (1,022 | 8.0%), and Educational Services (953 | 7.4%).
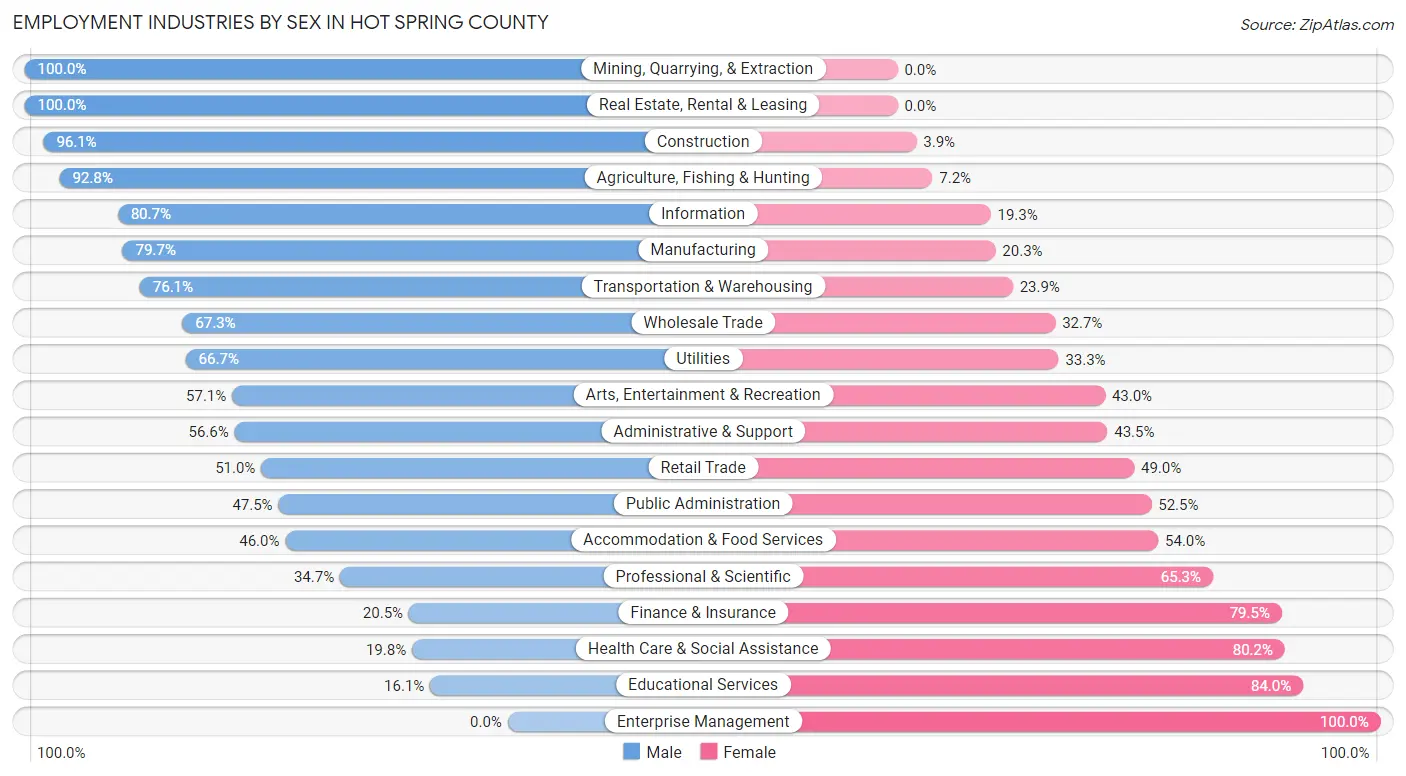
Employment Industries by Sex in Hot Spring County
The Hot Spring County industries that see more men than women are Mining, Quarrying, & Extraction (100.0%), Real Estate, Rental & Leasing (100.0%), and Construction (96.1%), whereas the industries that tend to have a higher number of women are Enterprise Management (100.0%), Educational Services (84.0%), and Health Care & Social Assistance (80.2%).
| Industry | Male | Female |
| Agriculture, Fishing & Hunting | 154 (92.8%) | 12 (7.2%) |
| Mining, Quarrying, & Extraction | 22 (100.0%) | 0 (0.0%) |
| Construction | 982 (96.1%) | 40 (3.9%) |
| Manufacturing | 1,297 (79.7%) | 330 (20.3%) |
| Wholesale Trade | 134 (67.3%) | 65 (32.7%) |
| Retail Trade | 1,036 (51.0%) | 994 (49.0%) |
| Transportation & Warehousing | 367 (76.1%) | 115 (23.9%) |
| Utilities | 130 (66.7%) | 65 (33.3%) |
| Information | 67 (80.7%) | 16 (19.3%) |
| Finance & Insurance | 62 (20.5%) | 241 (79.5%) |
| Real Estate, Rental & Leasing | 88 (100.0%) | 0 (0.0%) |
| Professional & Scientific | 192 (34.7%) | 361 (65.3%) |
| Enterprise Management | 0 (0.0%) | 69 (100.0%) |
| Administrative & Support | 298 (56.6%) | 229 (43.4%) |
| Educational Services | 153 (16.1%) | 800 (84.0%) |
| Health Care & Social Assistance | 391 (19.8%) | 1,582 (80.2%) |
| Arts, Entertainment & Recreation | 170 (57.1%) | 128 (42.9%) |
| Accommodation & Food Services | 424 (46.0%) | 497 (54.0%) |
| Public Administration | 280 (47.5%) | 310 (52.5%) |
| Total | 6,644 (51.8%) | 6,175 (48.2%) |
Education in Hot Spring County
School Enrollment in Hot Spring County
The most common levels of schooling among the 6,463 students in Hot Spring County are high school (1,587 | 24.6%), middle school (1,557 | 24.1%), and elementary school (1,461 | 22.6%).
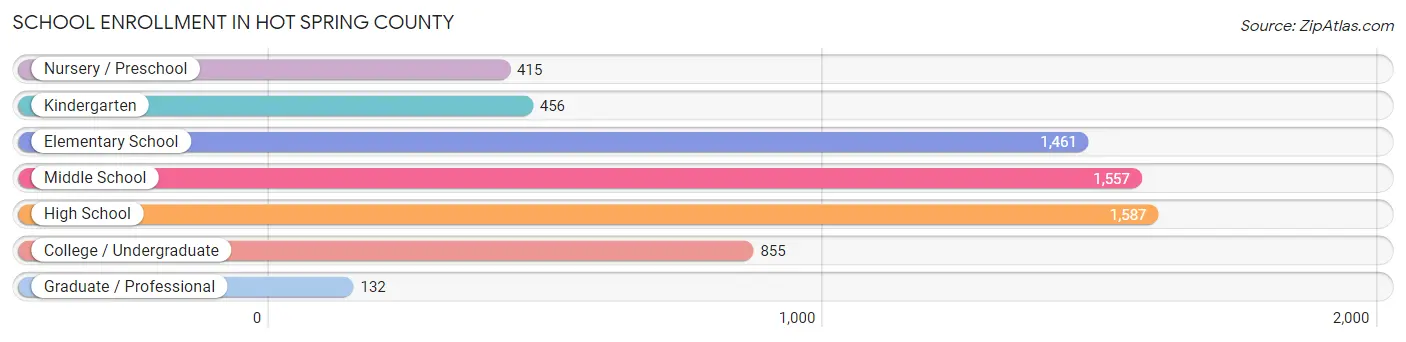
| School Level | # Students | % Students |
| Nursery / Preschool | 415 | 6.4% |
| Kindergarten | 456 | 7.1% |
| Elementary School | 1,461 | 22.6% |
| Middle School | 1,557 | 24.1% |
| High School | 1,587 | 24.6% |
| College / Undergraduate | 855 | 13.2% |
| Graduate / Professional | 132 | 2.0% |
| Total | 6,463 | 100.0% |
School Enrollment by Age by Funding Source in Hot Spring County
Out of a total of 6,463 students who are enrolled in schools in Hot Spring County, 401 (6.2%) attend a private institution, while the remaining 6,062 (93.8%) are enrolled in public schools. The age group of 25 to 34 year olds has the highest likelihood of being enrolled in private schools, with 43 (18.6% in the age bracket) enrolled. Conversely, the age group of 5 to 9 year old has the lowest likelihood of being enrolled in a private school, with 1,770 (96.5% in the age bracket) attending a public institution.
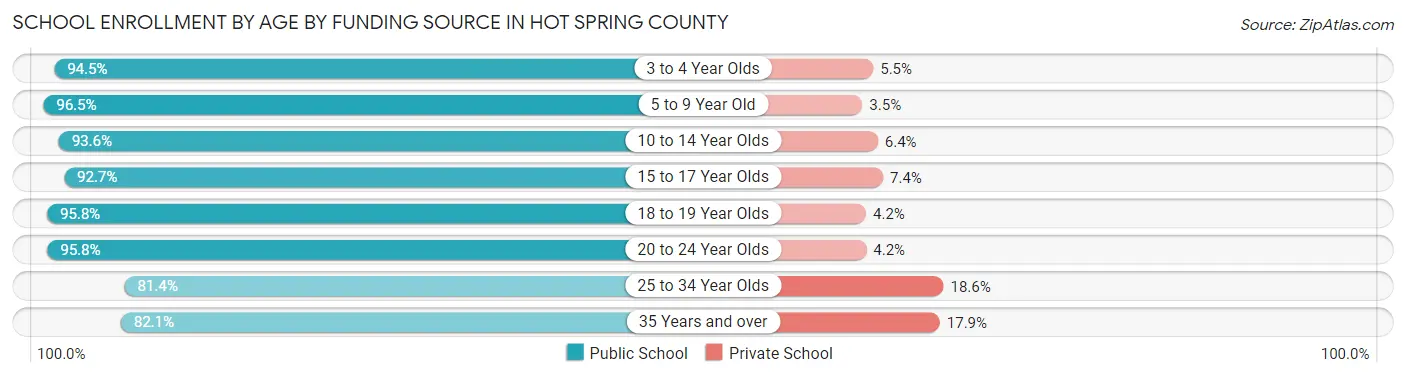
| Age Bracket | Public School | Private School |
| 3 to 4 Year Olds | 325 (94.5%) | 19 (5.5%) |
| 5 to 9 Year Old | 1,770 (96.5%) | 64 (3.5%) |
| 10 to 14 Year Olds | 1,689 (93.6%) | 115 (6.4%) |
| 15 to 17 Year Olds | 983 (92.6%) | 78 (7.3%) |
| 18 to 19 Year Olds | 506 (95.8%) | 22 (4.2%) |
| 20 to 24 Year Olds | 430 (95.8%) | 19 (4.2%) |
| 25 to 34 Year Olds | 188 (81.4%) | 43 (18.6%) |
| 35 Years and over | 174 (82.1%) | 38 (17.9%) |
| Total | 6,062 (93.8%) | 401 (6.2%) |
Educational Attainment by Field of Study in Hot Spring County
Education (1,080 | 27.2%), business (635 | 16.0%), science & technology (491 | 12.3%), bio, nature & agricultural (338 | 8.5%), and visual & performing arts (275 | 6.9%) are the most common fields of study among 3,978 individuals in Hot Spring County who have obtained a bachelor's degree or higher.
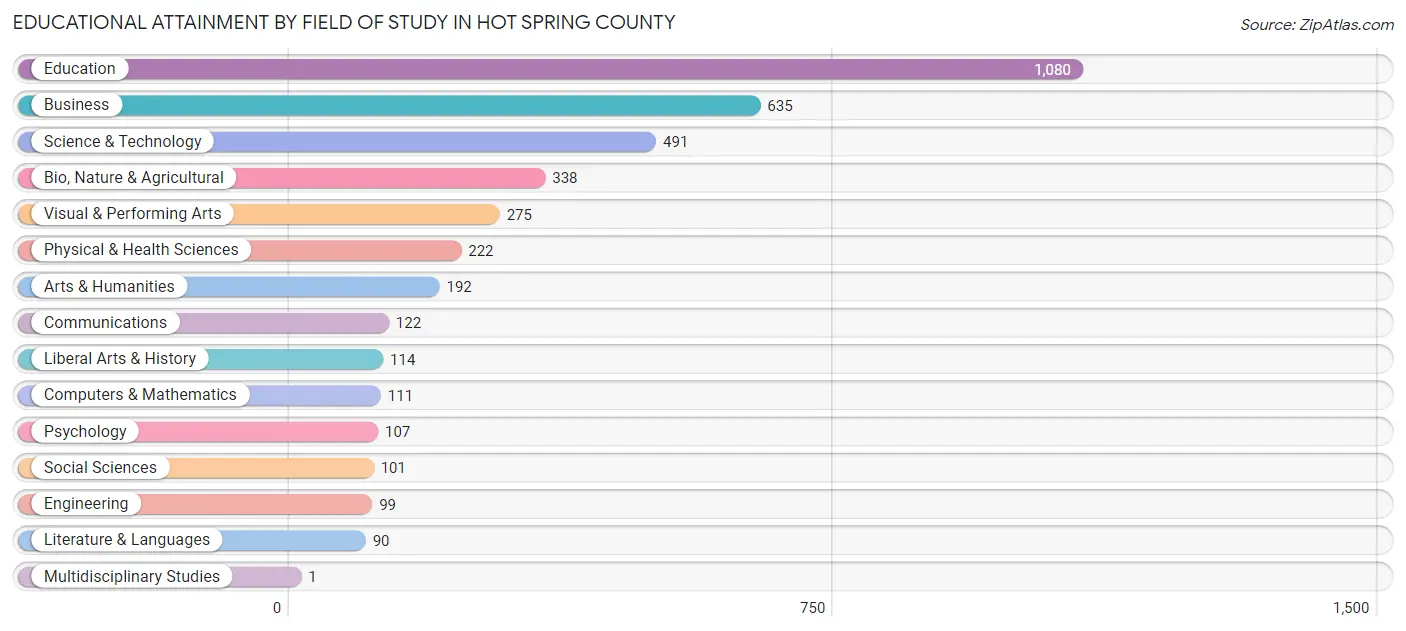
| Field of Study | # Graduates | % Graduates |
| Computers & Mathematics | 111 | 2.8% |
| Bio, Nature & Agricultural | 338 | 8.5% |
| Physical & Health Sciences | 222 | 5.6% |
| Psychology | 107 | 2.7% |
| Social Sciences | 101 | 2.5% |
| Engineering | 99 | 2.5% |
| Multidisciplinary Studies | 1 | 0.0% |
| Science & Technology | 491 | 12.3% |
| Business | 635 | 16.0% |
| Education | 1,080 | 27.2% |
| Literature & Languages | 90 | 2.3% |
| Liberal Arts & History | 114 | 2.9% |
| Visual & Performing Arts | 275 | 6.9% |
| Communications | 122 | 3.1% |
| Arts & Humanities | 192 | 4.8% |
| Total | 3,978 | 100.0% |
Transportation & Commute in Hot Spring County
Vehicle Availability by Sex in Hot Spring County
The most prevalent vehicle ownership categories in Hot Spring County are males with 2 vehicles (2,618, accounting for 39.4%) and females with 2 vehicles (2,042, making up 42.9%).
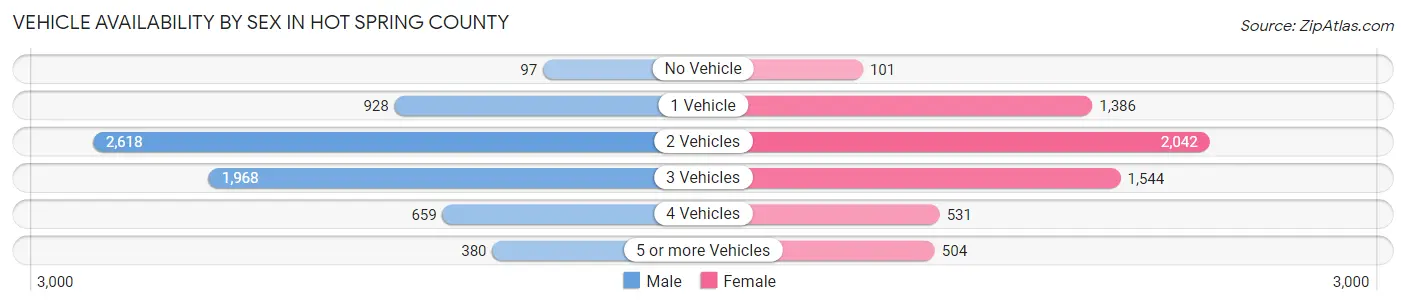
| Vehicles Available | Male | Female |
| No Vehicle | 97 (1.5%) | 101 (1.7%) |
| 1 Vehicle | 928 (14.0%) | 1,386 (22.7%) |
| 2 Vehicles | 2,618 (39.4%) | 2,042 (33.4%) |
| 3 Vehicles | 1,968 (29.6%) | 1,544 (25.3%) |
| 4 Vehicles | 659 (9.9%) | 531 (8.7%) |
| 5 or more Vehicles | 380 (5.7%) | 504 (8.3%) |
| Total | 6,650 (100.0%) | 6,108 (100.0%) |
Commute Time in Hot Spring County
The most frequently occuring commute durations in Hot Spring County are 30 to 34 minutes (2,060 commuters, 16.6%), 5 to 9 minutes (1,360 commuters, 10.9%), and 15 to 19 minutes (1,332 commuters, 10.7%).
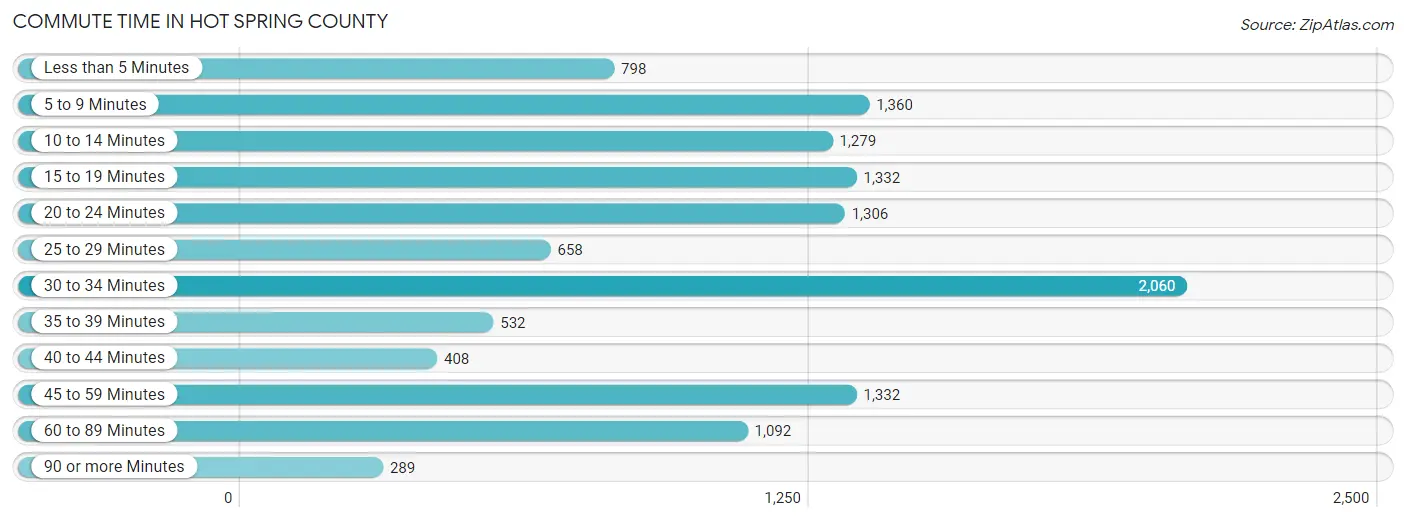
| Commute Time | # Commuters | % Commuters |
| Less than 5 Minutes | 798 | 6.4% |
| 5 to 9 Minutes | 1,360 | 10.9% |
| 10 to 14 Minutes | 1,279 | 10.3% |
| 15 to 19 Minutes | 1,332 | 10.7% |
| 20 to 24 Minutes | 1,306 | 10.5% |
| 25 to 29 Minutes | 658 | 5.3% |
| 30 to 34 Minutes | 2,060 | 16.6% |
| 35 to 39 Minutes | 532 | 4.3% |
| 40 to 44 Minutes | 408 | 3.3% |
| 45 to 59 Minutes | 1,332 | 10.7% |
| 60 to 89 Minutes | 1,092 | 8.8% |
| 90 or more Minutes | 289 | 2.3% |
Commute Time by Sex in Hot Spring County
The most common commute times in Hot Spring County are 30 to 34 minutes (1,171 commuters, 17.9%) for males and 15 to 19 minutes (894 commuters, 15.1%) for females.
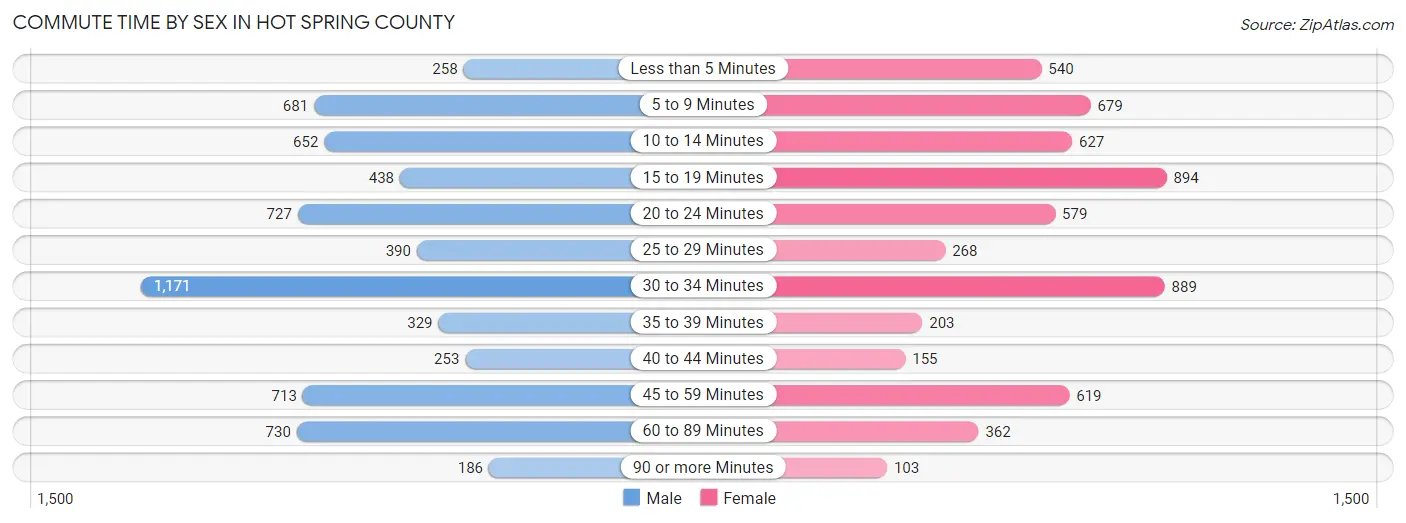
| Commute Time | Male | Female |
| Less than 5 Minutes | 258 (4.0%) | 540 (9.1%) |
| 5 to 9 Minutes | 681 (10.4%) | 679 (11.5%) |
| 10 to 14 Minutes | 652 (10.0%) | 627 (10.6%) |
| 15 to 19 Minutes | 438 (6.7%) | 894 (15.1%) |
| 20 to 24 Minutes | 727 (11.1%) | 579 (9.8%) |
| 25 to 29 Minutes | 390 (6.0%) | 268 (4.5%) |
| 30 to 34 Minutes | 1,171 (17.9%) | 889 (15.0%) |
| 35 to 39 Minutes | 329 (5.0%) | 203 (3.4%) |
| 40 to 44 Minutes | 253 (3.9%) | 155 (2.6%) |
| 45 to 59 Minutes | 713 (10.9%) | 619 (10.5%) |
| 60 to 89 Minutes | 730 (11.2%) | 362 (6.1%) |
| 90 or more Minutes | 186 (2.9%) | 103 (1.7%) |
Time of Departure to Work by Sex in Hot Spring County
The most frequent times of departure to work in Hot Spring County are 6:00 AM to 6:29 AM (934, 14.3%) for males and 7:00 AM to 7:29 AM (1,016, 17.2%) for females.
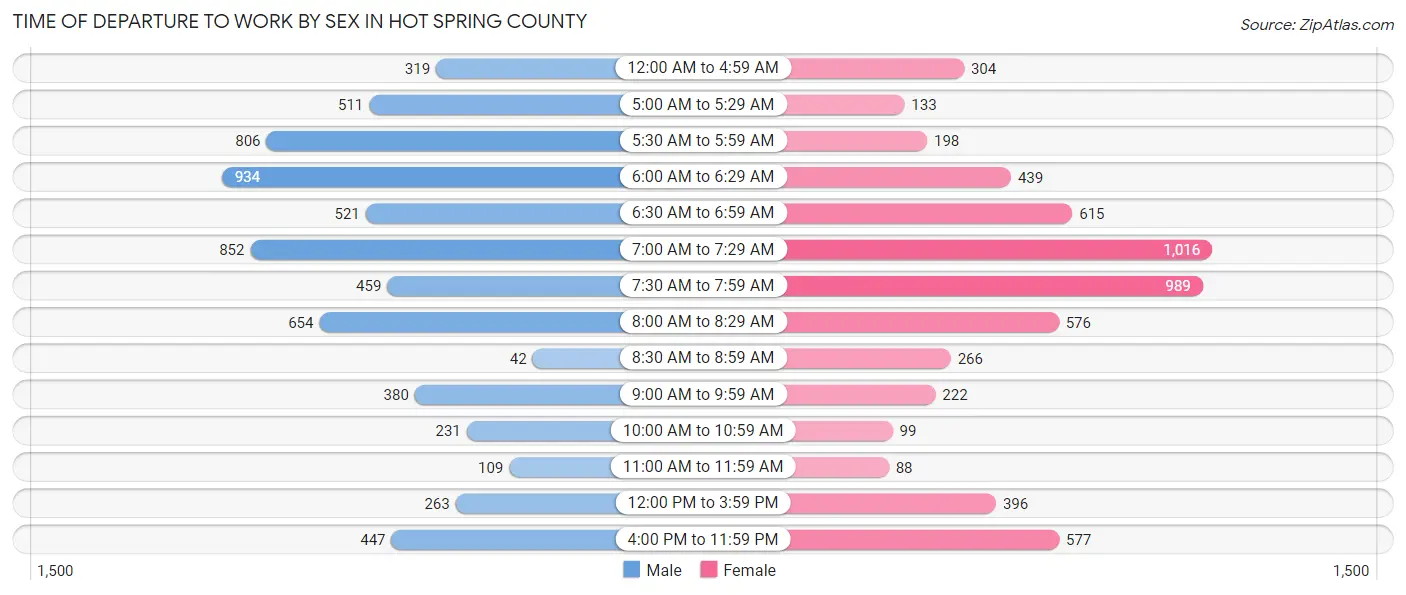
| Time of Departure | Male | Female |
| 12:00 AM to 4:59 AM | 319 (4.9%) | 304 (5.1%) |
| 5:00 AM to 5:29 AM | 511 (7.8%) | 133 (2.2%) |
| 5:30 AM to 5:59 AM | 806 (12.3%) | 198 (3.4%) |
| 6:00 AM to 6:29 AM | 934 (14.3%) | 439 (7.4%) |
| 6:30 AM to 6:59 AM | 521 (8.0%) | 615 (10.4%) |
| 7:00 AM to 7:29 AM | 852 (13.1%) | 1,016 (17.2%) |
| 7:30 AM to 7:59 AM | 459 (7.0%) | 989 (16.7%) |
| 8:00 AM to 8:29 AM | 654 (10.0%) | 576 (9.7%) |
| 8:30 AM to 8:59 AM | 42 (0.6%) | 266 (4.5%) |
| 9:00 AM to 9:59 AM | 380 (5.8%) | 222 (3.7%) |
| 10:00 AM to 10:59 AM | 231 (3.5%) | 99 (1.7%) |
| 11:00 AM to 11:59 AM | 109 (1.7%) | 88 (1.5%) |
| 12:00 PM to 3:59 PM | 263 (4.0%) | 396 (6.7%) |
| 4:00 PM to 11:59 PM | 447 (6.9%) | 577 (9.8%) |
| Total | 6,528 (100.0%) | 5,918 (100.0%) |
Housing Occupancy in Hot Spring County
Occupancy by Ownership in Hot Spring County
Of the total 11,900 dwellings in Hot Spring County, owner-occupied units account for 9,360 (78.7%), while renter-occupied units make up 2,540 (21.3%).
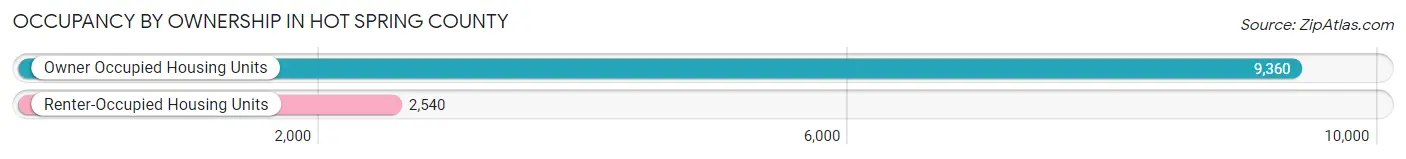
| Occupancy | # Housing Units | % Housing Units |
| Owner Occupied Housing Units | 9,360 | 78.7% |
| Renter-Occupied Housing Units | 2,540 | 21.3% |
| Total Occupied Housing Units | 11,900 | 100.0% |
Occupancy by Household Size in Hot Spring County
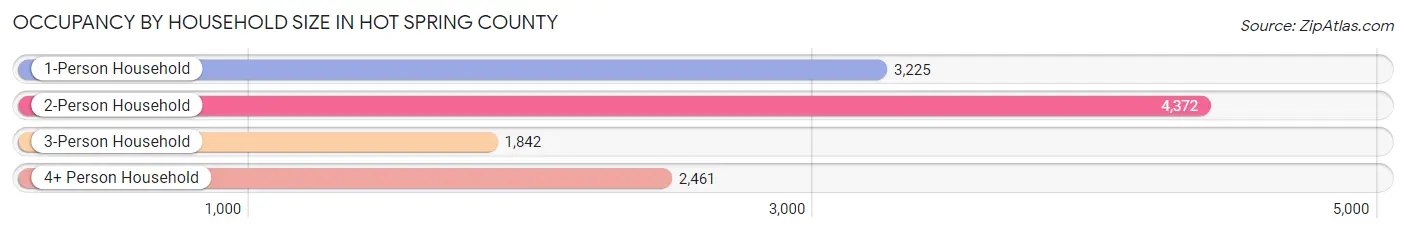
| Household Size | # Housing Units | % Housing Units |
| 1-Person Household | 3,225 | 27.1% |
| 2-Person Household | 4,372 | 36.7% |
| 3-Person Household | 1,842 | 15.5% |
| 4+ Person Household | 2,461 | 20.7% |
| Total Housing Units | 11,900 | 100.0% |
Occupancy by Ownership by Household Size in Hot Spring County
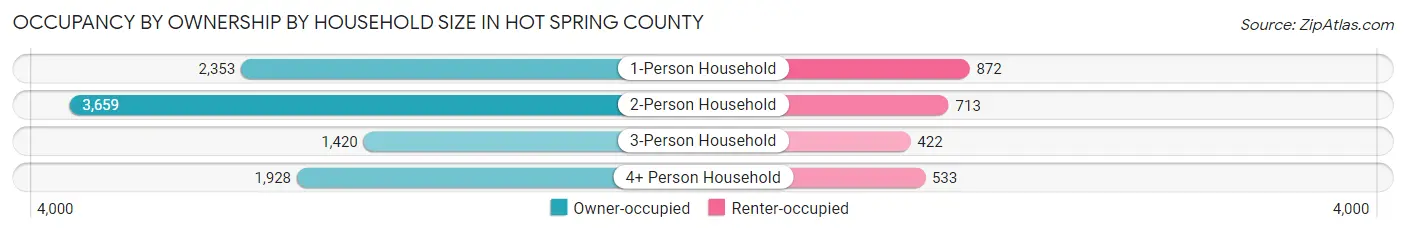
| Household Size | Owner-occupied | Renter-occupied |
| 1-Person Household | 2,353 (73.0%) | 872 (27.0%) |
| 2-Person Household | 3,659 (83.7%) | 713 (16.3%) |
| 3-Person Household | 1,420 (77.1%) | 422 (22.9%) |
| 4+ Person Household | 1,928 (78.3%) | 533 (21.7%) |
| Total Housing Units | 9,360 (78.7%) | 2,540 (21.3%) |
Occupancy by Educational Attainment in Hot Spring County
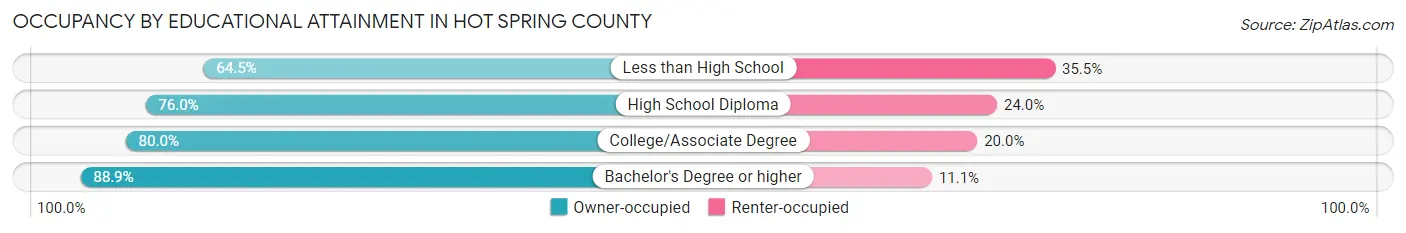
| Household Size | Owner-occupied | Renter-occupied |
| Less than High School | 757 (64.5%) | 416 (35.5%) |
| High School Diploma | 3,187 (76.0%) | 1,004 (24.0%) |
| College/Associate Degree | 3,535 (80.0%) | 886 (20.0%) |
| Bachelor's Degree or higher | 1,881 (88.9%) | 234 (11.1%) |
Occupancy by Age of Householder in Hot Spring County
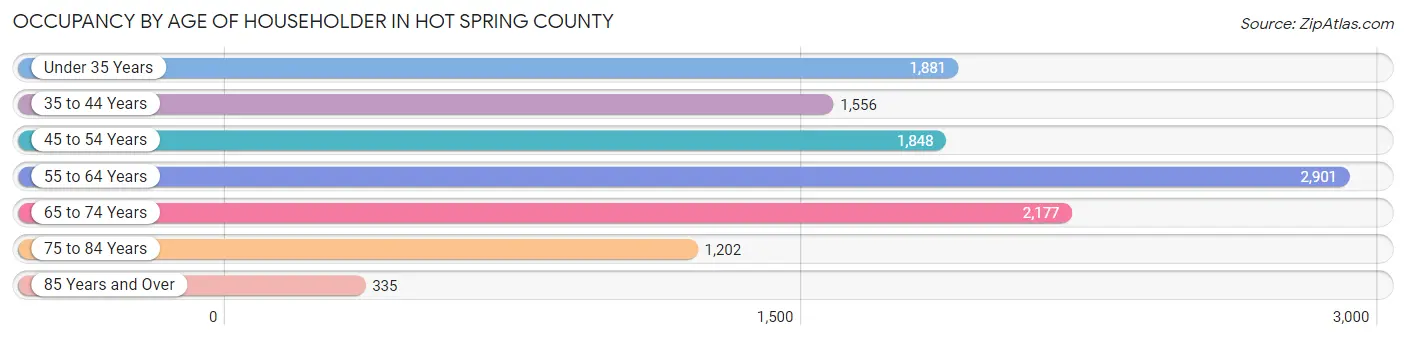
| Age Bracket | # Households | % Households |
| Under 35 Years | 1,881 | 15.8% |
| 35 to 44 Years | 1,556 | 13.1% |
| 45 to 54 Years | 1,848 | 15.5% |
| 55 to 64 Years | 2,901 | 24.4% |
| 65 to 74 Years | 2,177 | 18.3% |
| 75 to 84 Years | 1,202 | 10.1% |
| 85 Years and Over | 335 | 2.8% |
| Total | 11,900 | 100.0% |
Housing Finances in Hot Spring County
Median Income by Occupancy in Hot Spring County
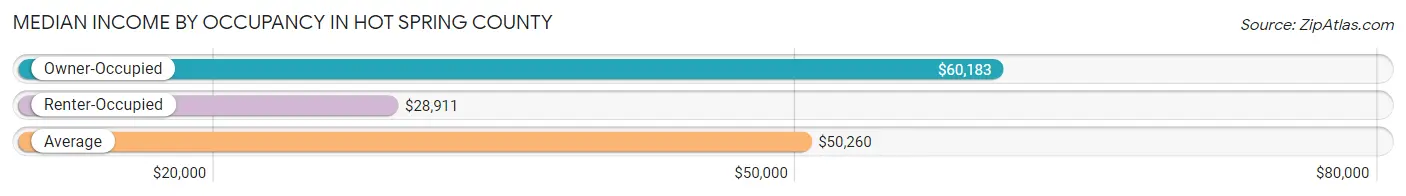
| Occupancy Type | # Households | Median Income |
| Owner-Occupied | 9,360 (78.7%) | $60,183 |
| Renter-Occupied | 2,540 (21.3%) | $28,911 |
| Average | 11,900 (100.0%) | $50,260 |
Occupancy by Householder Income Bracket in Hot Spring County
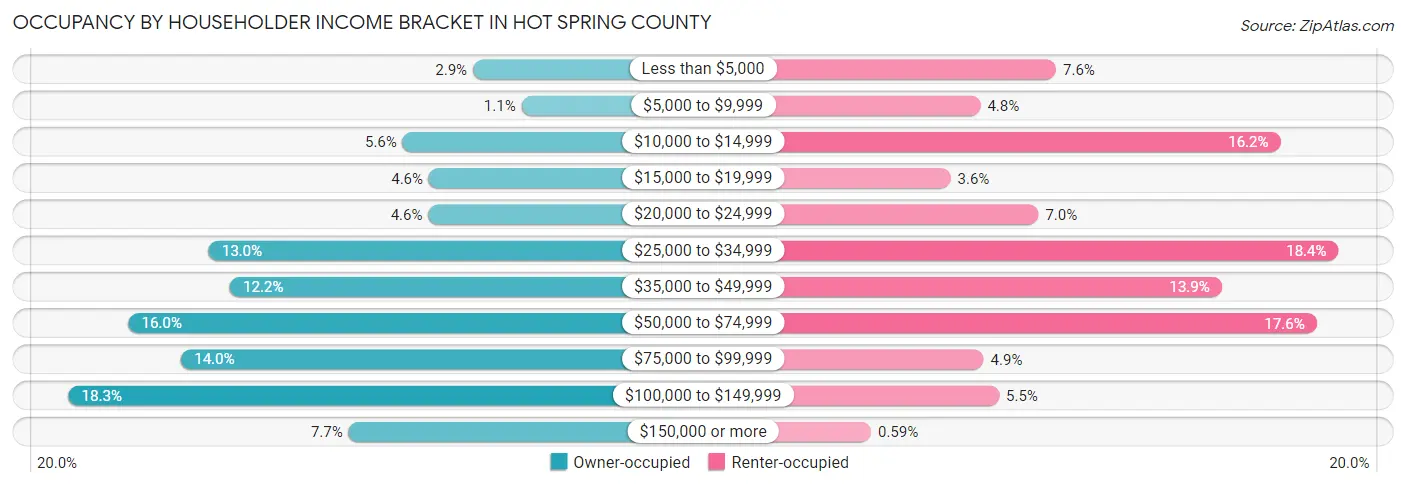
| Income Bracket | Owner-occupied | Renter-occupied |
| Less than $5,000 | 273 (2.9%) | 194 (7.6%) |
| $5,000 to $9,999 | 100 (1.1%) | 121 (4.8%) |
| $10,000 to $14,999 | 524 (5.6%) | 411 (16.2%) |
| $15,000 to $19,999 | 431 (4.6%) | 92 (3.6%) |
| $20,000 to $24,999 | 432 (4.6%) | 177 (7.0%) |
| $25,000 to $34,999 | 1,215 (13.0%) | 467 (18.4%) |
| $35,000 to $49,999 | 1,139 (12.2%) | 354 (13.9%) |
| $50,000 to $74,999 | 1,501 (16.0%) | 446 (17.6%) |
| $75,000 to $99,999 | 1,313 (14.0%) | 124 (4.9%) |
| $100,000 to $149,999 | 1,715 (18.3%) | 139 (5.5%) |
| $150,000 or more | 717 (7.7%) | 15 (0.6%) |
| Total | 9,360 (100.0%) | 2,540 (100.0%) |
Monthly Housing Cost Tiers in Hot Spring County
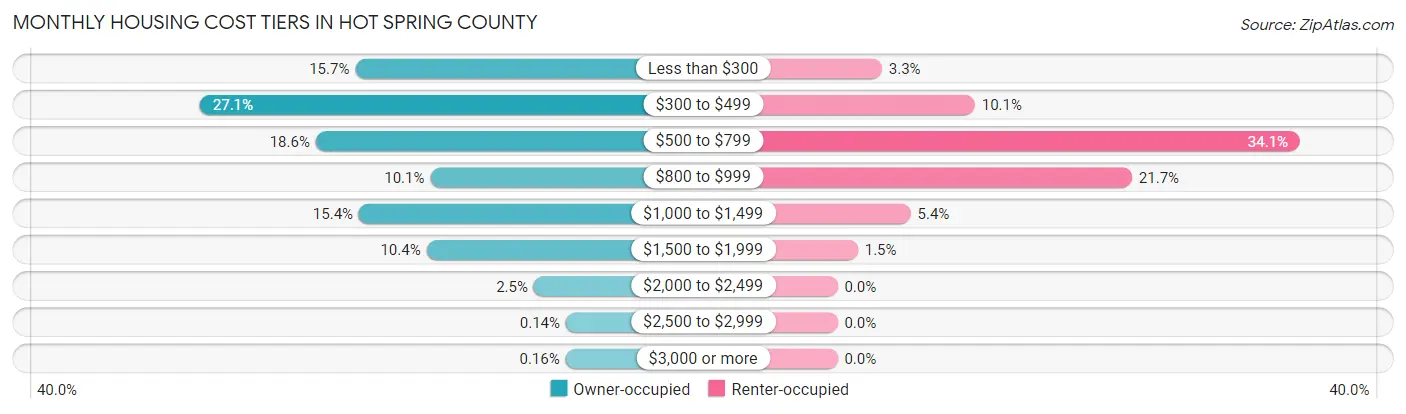
| Monthly Cost | Owner-occupied | Renter-occupied |
| Less than $300 | 1,465 (15.7%) | 83 (3.3%) |
| $300 to $499 | 2,536 (27.1%) | 257 (10.1%) |
| $500 to $799 | 1,737 (18.6%) | 865 (34.1%) |
| $800 to $999 | 947 (10.1%) | 551 (21.7%) |
| $1,000 to $1,499 | 1,440 (15.4%) | 137 (5.4%) |
| $1,500 to $1,999 | 973 (10.4%) | 38 (1.5%) |
| $2,000 to $2,499 | 234 (2.5%) | 0 (0.0%) |
| $2,500 to $2,999 | 13 (0.1%) | 0 (0.0%) |
| $3,000 or more | 15 (0.2%) | 0 (0.0%) |
| Total | 9,360 (100.0%) | 2,540 (100.0%) |
Physical Housing Characteristics in Hot Spring County
Housing Structures in Hot Spring County
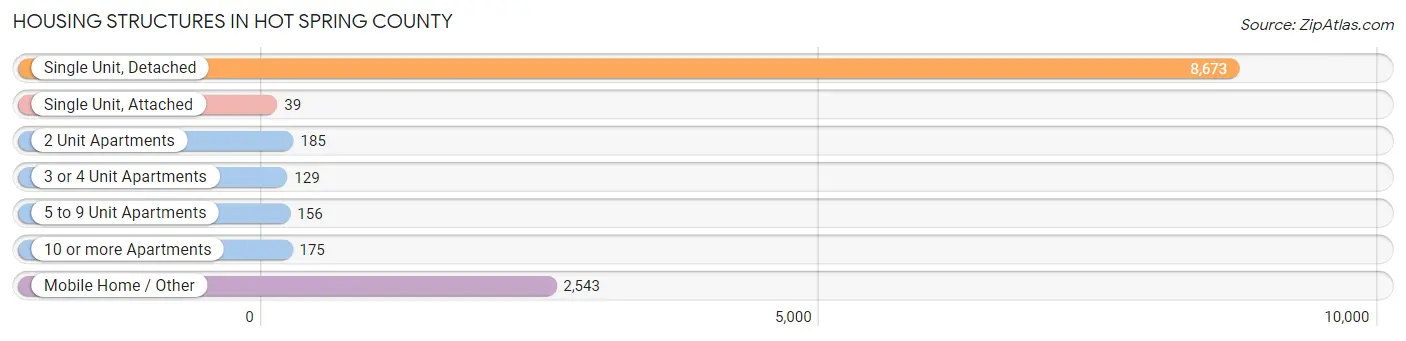
| Structure Type | # Housing Units | % Housing Units |
| Single Unit, Detached | 8,673 | 72.9% |
| Single Unit, Attached | 39 | 0.3% |
| 2 Unit Apartments | 185 | 1.5% |
| 3 or 4 Unit Apartments | 129 | 1.1% |
| 5 to 9 Unit Apartments | 156 | 1.3% |
| 10 or more Apartments | 175 | 1.5% |
| Mobile Home / Other | 2,543 | 21.4% |
| Total | 11,900 | 100.0% |
Housing Structures by Occupancy in Hot Spring County

| Structure Type | Owner-occupied | Renter-occupied |
| Single Unit, Detached | 7,348 (84.7%) | 1,325 (15.3%) |
| Single Unit, Attached | 26 (66.7%) | 13 (33.3%) |
| 2 Unit Apartments | 0 (0.0%) | 185 (100.0%) |
| 3 or 4 Unit Apartments | 0 (0.0%) | 129 (100.0%) |
| 5 to 9 Unit Apartments | 13 (8.3%) | 143 (91.7%) |
| 10 or more Apartments | 0 (0.0%) | 175 (100.0%) |
| Mobile Home / Other | 1,973 (77.6%) | 570 (22.4%) |
| Total | 9,360 (78.7%) | 2,540 (21.3%) |
Housing Structures by Number of Rooms in Hot Spring County
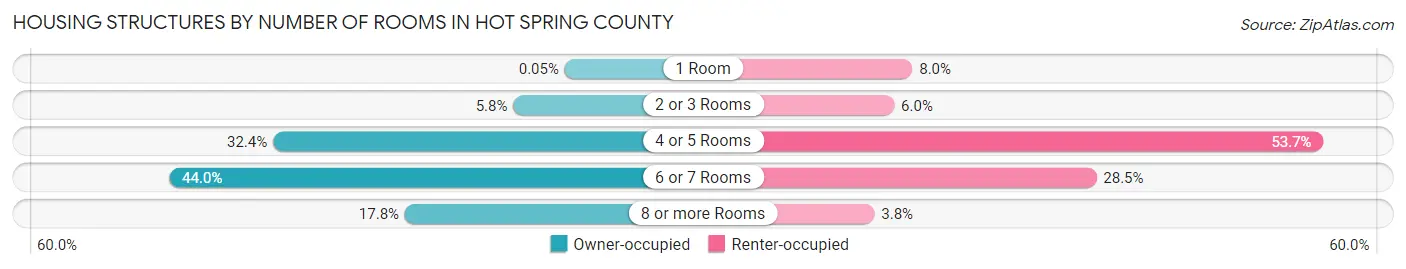
| Number of Rooms | Owner-occupied | Renter-occupied |
| 1 Room | 5 (0.1%) | 204 (8.0%) |
| 2 or 3 Rooms | 539 (5.8%) | 153 (6.0%) |
| 4 or 5 Rooms | 3,035 (32.4%) | 1,363 (53.7%) |
| 6 or 7 Rooms | 4,116 (44.0%) | 723 (28.5%) |
| 8 or more Rooms | 1,665 (17.8%) | 97 (3.8%) |
| Total | 9,360 (100.0%) | 2,540 (100.0%) |
Housing Structure by Heating Type in Hot Spring County
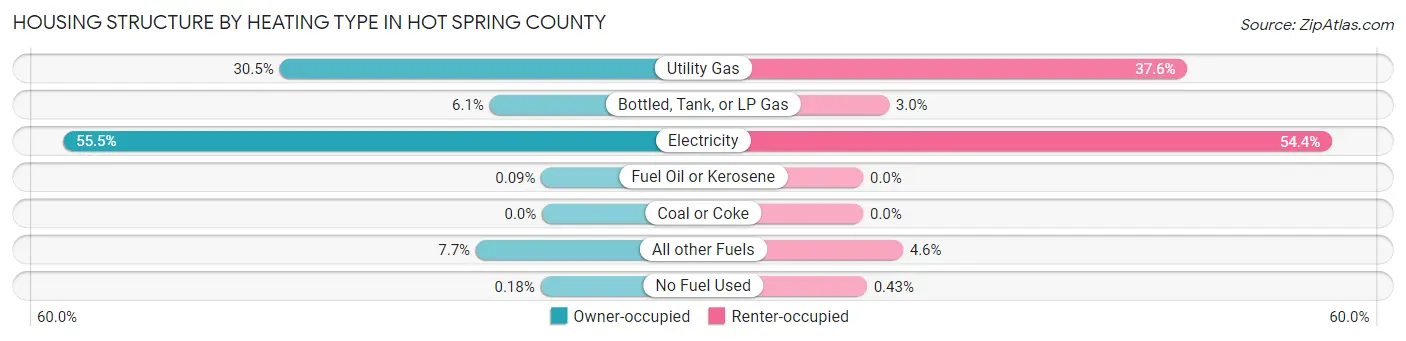
| Heating Type | Owner-occupied | Renter-occupied |
| Utility Gas | 2,850 (30.4%) | 955 (37.6%) |
| Bottled, Tank, or LP Gas | 569 (6.1%) | 76 (3.0%) |
| Electricity | 5,198 (55.5%) | 1,381 (54.4%) |
| Fuel Oil or Kerosene | 8 (0.1%) | 0 (0.0%) |
| Coal or Coke | 0 (0.0%) | 0 (0.0%) |
| All other Fuels | 718 (7.7%) | 117 (4.6%) |
| No Fuel Used | 17 (0.2%) | 11 (0.4%) |
| Total | 9,360 (100.0%) | 2,540 (100.0%) |
Household Vehicle Usage in Hot Spring County
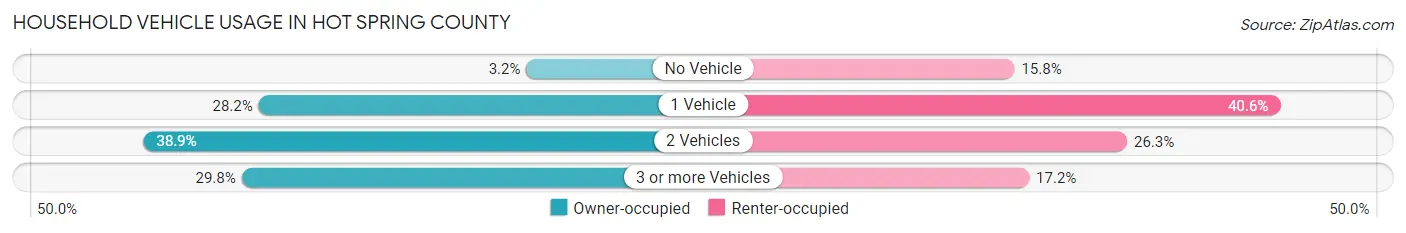
| Vehicles per Household | Owner-occupied | Renter-occupied |
| No Vehicle | 297 (3.2%) | 402 (15.8%) |
| 1 Vehicle | 2,636 (28.2%) | 1,032 (40.6%) |
| 2 Vehicles | 3,642 (38.9%) | 669 (26.3%) |
| 3 or more Vehicles | 2,785 (29.7%) | 437 (17.2%) |
| Total | 9,360 (100.0%) | 2,540 (100.0%) |
Real Estate & Mortgages in Hot Spring County
Real Estate and Mortgage Overview in Hot Spring County
| Characteristic | Without Mortgage | With Mortgage |
| Housing Units | 4,795 | 4,565 |
| Median Property Value | $103,200 | $151,200 |
| Median Household Income | $44,547 | $509 |
| Monthly Housing Costs | $358 | $15 |
| Real Estate Taxes | $549 | $241 |
Property Value by Mortgage Status in Hot Spring County
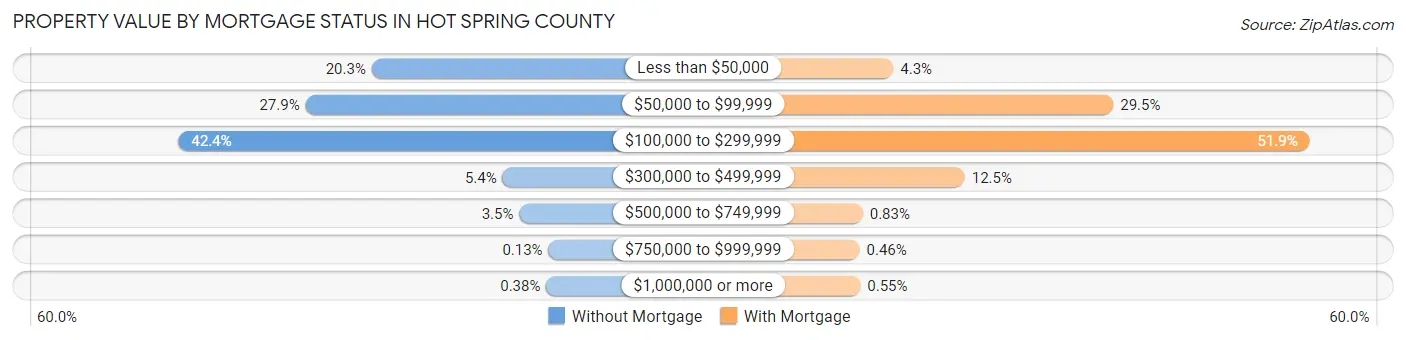
| Property Value | Without Mortgage | With Mortgage |
| Less than $50,000 | 975 (20.3%) | 197 (4.3%) |
| $50,000 to $99,999 | 1,338 (27.9%) | 1,345 (29.5%) |
| $100,000 to $299,999 | 2,034 (42.4%) | 2,369 (51.9%) |
| $300,000 to $499,999 | 258 (5.4%) | 570 (12.5%) |
| $500,000 to $749,999 | 166 (3.5%) | 38 (0.8%) |
| $750,000 to $999,999 | 6 (0.1%) | 21 (0.5%) |
| $1,000,000 or more | 18 (0.4%) | 25 (0.5%) |
| Total | 4,795 (100.0%) | 4,565 (100.0%) |
Household Income by Mortgage Status in Hot Spring County
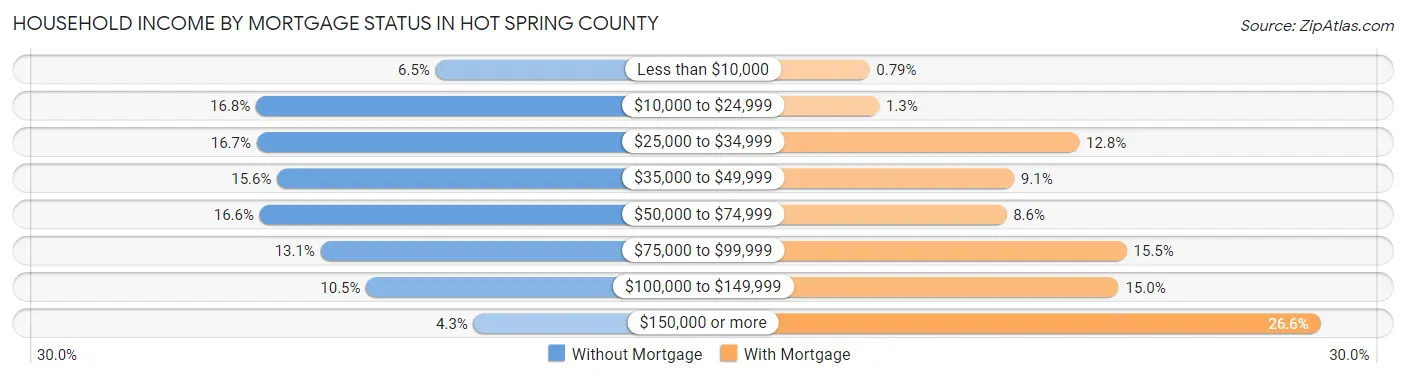
| Household Income | Without Mortgage | With Mortgage |
| Less than $10,000 | 312 (6.5%) | 36 (0.8%) |
| $10,000 to $24,999 | 804 (16.8%) | 61 (1.3%) |
| $25,000 to $34,999 | 802 (16.7%) | 583 (12.8%) |
| $35,000 to $49,999 | 746 (15.6%) | 413 (9.0%) |
| $50,000 to $74,999 | 794 (16.6%) | 393 (8.6%) |
| $75,000 to $99,999 | 627 (13.1%) | 707 (15.5%) |
| $100,000 to $149,999 | 502 (10.5%) | 686 (15.0%) |
| $150,000 or more | 208 (4.3%) | 1,213 (26.6%) |
| Total | 4,795 (100.0%) | 4,565 (100.0%) |
Property Value to Household Income Ratio in Hot Spring County
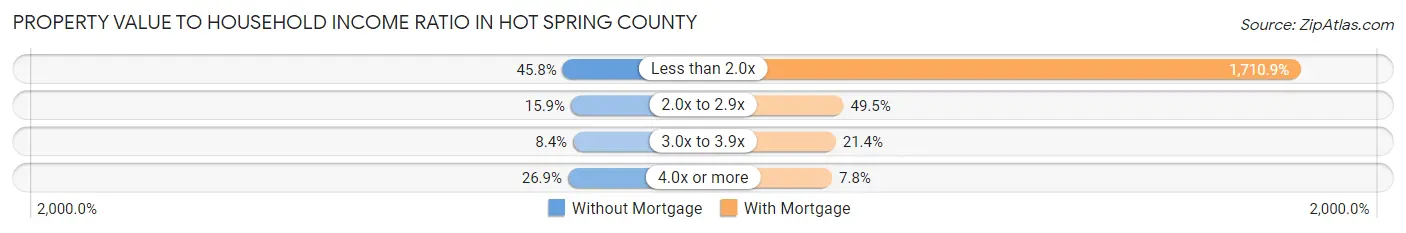
| Value-to-Income Ratio | Without Mortgage | With Mortgage |
| Less than 2.0x | 2,197 (45.8%) | 78,101 (1,710.9%) |
| 2.0x to 2.9x | 762 (15.9%) | 2,260 (49.5%) |
| 3.0x to 3.9x | 404 (8.4%) | 975 (21.4%) |
| 4.0x or more | 1,289 (26.9%) | 357 (7.8%) |
| Total | 4,795 (100.0%) | 4,565 (100.0%) |
Real Estate Taxes by Mortgage Status in Hot Spring County
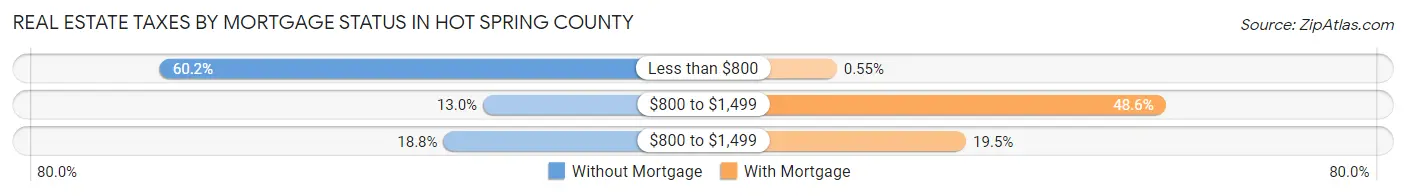
| Property Taxes | Without Mortgage | With Mortgage |
| Less than $800 | 2,888 (60.2%) | 25 (0.5%) |
| $800 to $1,499 | 625 (13.0%) | 2,217 (48.6%) |
| $800 to $1,499 | 902 (18.8%) | 888 (19.5%) |
| Total | 4,795 (100.0%) | 4,565 (100.0%) |
Health & Disability in Hot Spring County
Health Insurance Coverage by Age in Hot Spring County
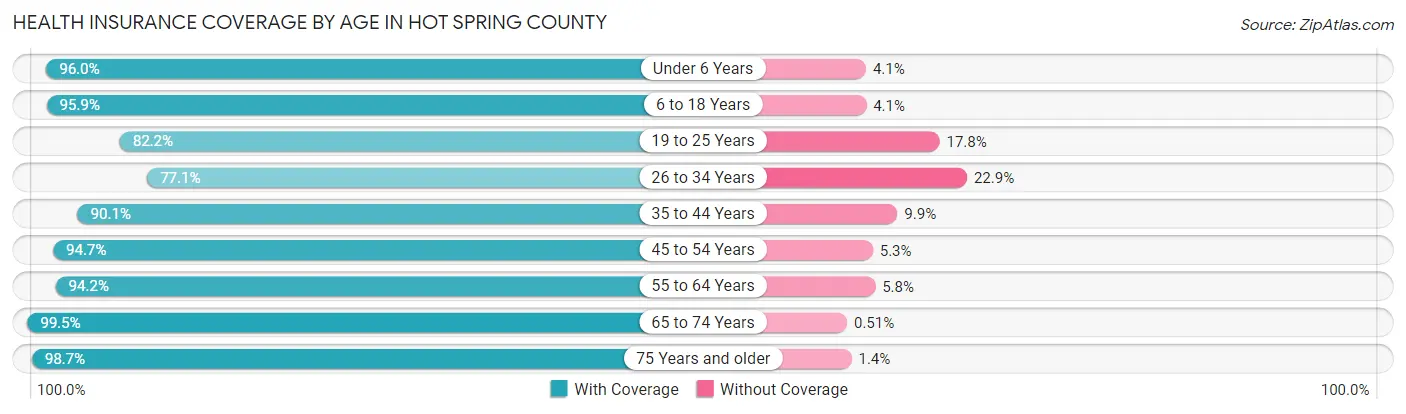
| Age Bracket | With Coverage | Without Coverage |
| Under 6 Years | 1,800 (96.0%) | 76 (4.1%) |
| 6 to 18 Years | 4,759 (95.9%) | 203 (4.1%) |
| 19 to 25 Years | 2,148 (82.2%) | 464 (17.8%) |
| 26 to 34 Years | 2,535 (77.1%) | 752 (22.9%) |
| 35 to 44 Years | 3,331 (90.1%) | 366 (9.9%) |
| 45 to 54 Years | 3,673 (94.7%) | 206 (5.3%) |
| 55 to 64 Years | 4,168 (94.2%) | 255 (5.8%) |
| 65 to 74 Years | 3,695 (99.5%) | 19 (0.5%) |
| 75 Years and older | 2,333 (98.7%) | 32 (1.3%) |
| Total | 28,442 (92.3%) | 2,373 (7.7%) |
Health Insurance Coverage by Citizenship Status in Hot Spring County
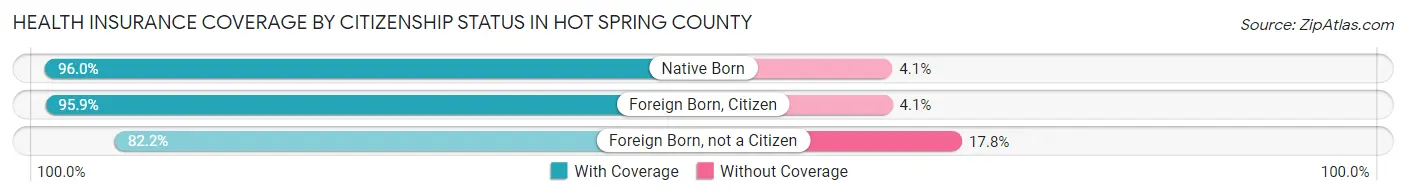
| Citizenship Status | With Coverage | Without Coverage |
| Native Born | 1,800 (96.0%) | 76 (4.1%) |
| Foreign Born, Citizen | 4,759 (95.9%) | 203 (4.1%) |
| Foreign Born, not a Citizen | 2,148 (82.2%) | 464 (17.8%) |
Health Insurance Coverage by Household Income in Hot Spring County
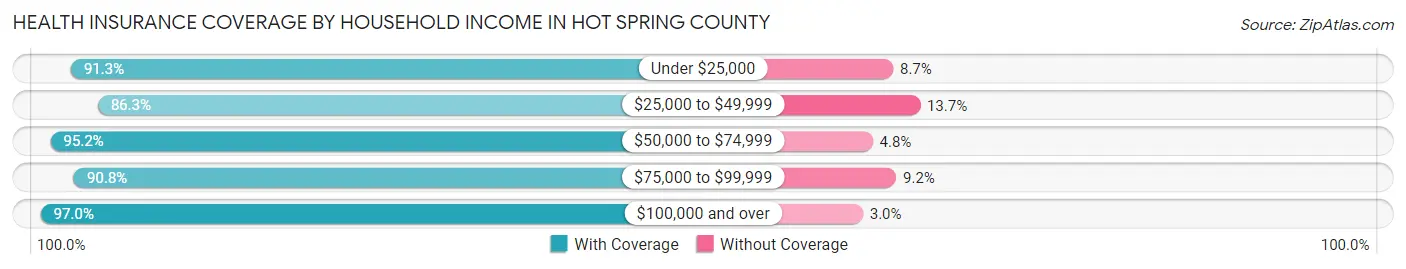
| Household Income | With Coverage | Without Coverage |
| Under $25,000 | 4,863 (91.3%) | 461 (8.7%) |
| $25,000 to $49,999 | 6,137 (86.3%) | 975 (13.7%) |
| $50,000 to $74,999 | 4,880 (95.2%) | 248 (4.8%) |
| $75,000 to $99,999 | 4,244 (90.8%) | 432 (9.2%) |
| $100,000 and over | 8,318 (97.0%) | 257 (3.0%) |
Public vs Private Health Insurance Coverage by Age in Hot Spring County
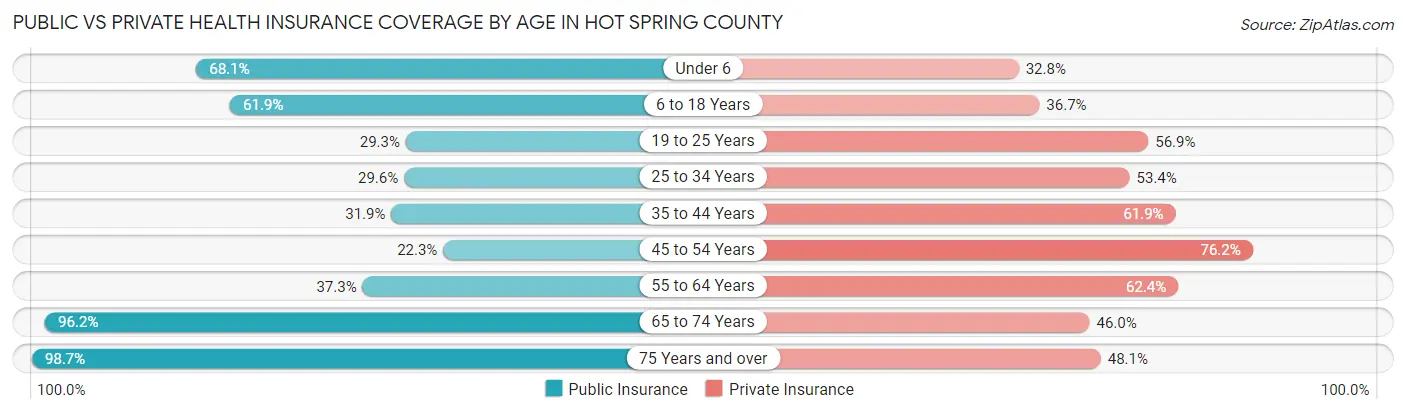
| Age Bracket | Public Insurance | Private Insurance |
| Under 6 | 1,278 (68.1%) | 616 (32.8%) |
| 6 to 18 Years | 3,069 (61.9%) | 1,820 (36.7%) |
| 19 to 25 Years | 764 (29.2%) | 1,486 (56.9%) |
| 25 to 34 Years | 972 (29.6%) | 1,756 (53.4%) |
| 35 to 44 Years | 1,181 (31.9%) | 2,289 (61.9%) |
| 45 to 54 Years | 865 (22.3%) | 2,957 (76.2%) |
| 55 to 64 Years | 1,649 (37.3%) | 2,761 (62.4%) |
| 65 to 74 Years | 3,573 (96.2%) | 1,708 (46.0%) |
| 75 Years and over | 2,333 (98.7%) | 1,137 (48.1%) |
| Total | 15,684 (50.9%) | 16,530 (53.6%) |
Disability Status by Sex by Age in Hot Spring County
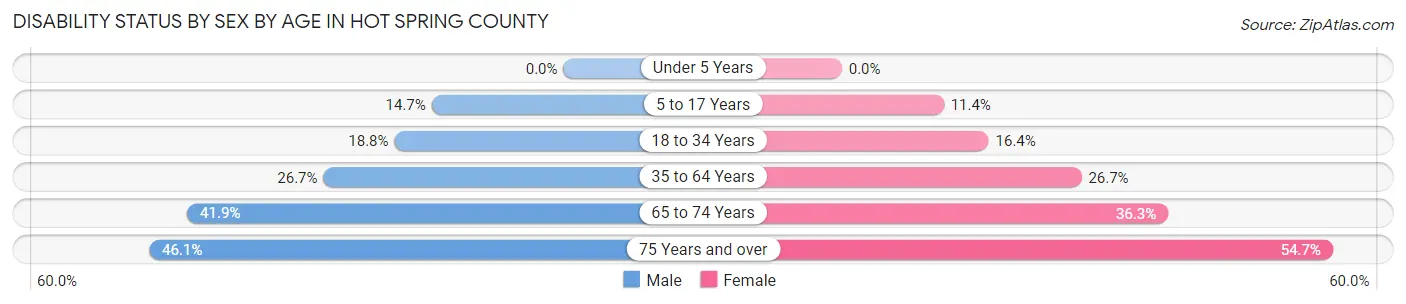
| Age Bracket | Male | Female |
| Under 5 Years | 0 (0.0%) | 0 (0.0%) |
| 5 to 17 Years | 389 (14.7%) | 263 (11.4%) |
| 18 to 34 Years | 637 (18.8%) | 467 (16.4%) |
| 35 to 64 Years | 1,566 (26.7%) | 1,639 (26.7%) |
| 65 to 74 Years | 721 (41.9%) | 724 (36.3%) |
| 75 Years and over | 460 (46.1%) | 748 (54.7%) |
Disability Class by Sex by Age in Hot Spring County
Disability Class: Hearing Difficulty
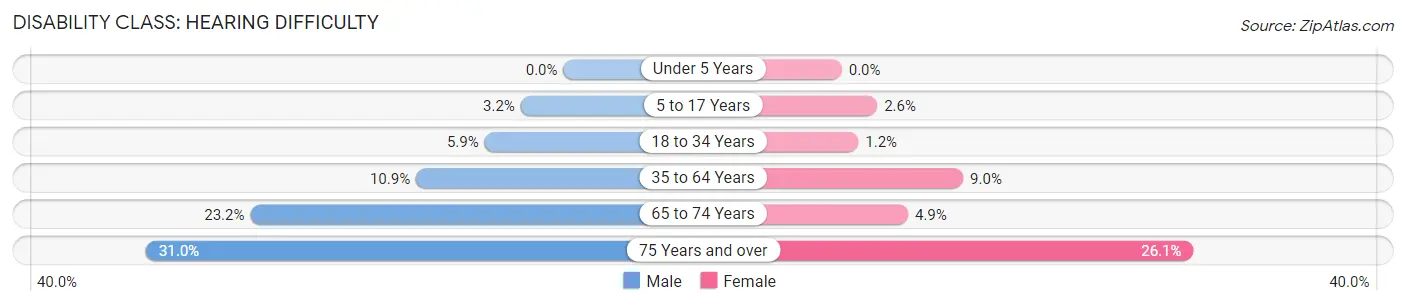
| Age Bracket | Male | Female |
| Under 5 Years | 0 (0.0%) | 0 (0.0%) |
| 5 to 17 Years | 84 (3.2%) | 61 (2.6%) |
| 18 to 34 Years | 198 (5.9%) | 35 (1.2%) |
| 35 to 64 Years | 641 (10.9%) | 553 (9.0%) |
| 65 to 74 Years | 400 (23.2%) | 98 (4.9%) |
| 75 Years and over | 309 (31.0%) | 357 (26.1%) |
Disability Class: Vision Difficulty
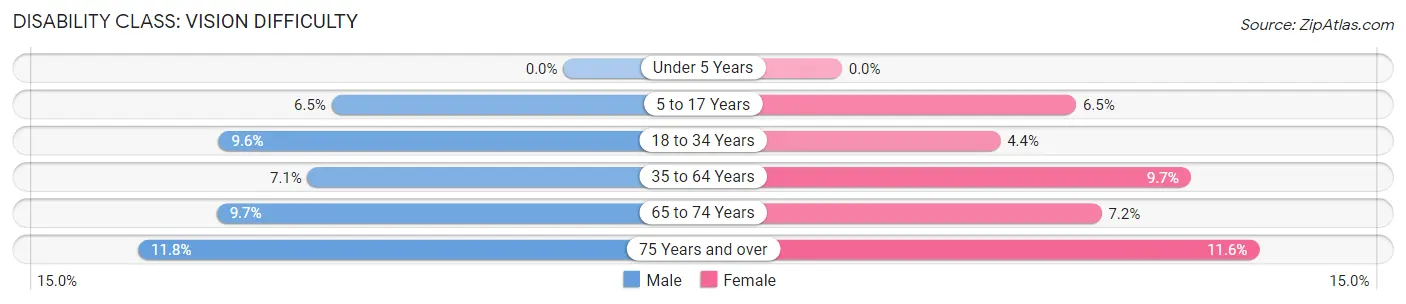
| Age Bracket | Male | Female |
| Under 5 Years | 0 (0.0%) | 0 (0.0%) |
| 5 to 17 Years | 171 (6.5%) | 151 (6.5%) |
| 18 to 34 Years | 325 (9.6%) | 126 (4.4%) |
| 35 to 64 Years | 417 (7.1%) | 596 (9.7%) |
| 65 to 74 Years | 166 (9.7%) | 144 (7.2%) |
| 75 Years and over | 118 (11.8%) | 159 (11.6%) |
Disability Class: Cognitive Difficulty
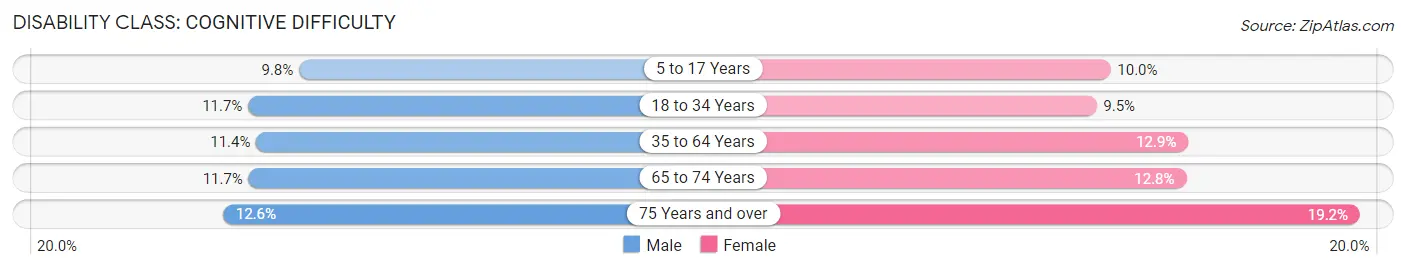
| Age Bracket | Male | Female |
| 5 to 17 Years | 260 (9.8%) | 231 (10.0%) |
| 18 to 34 Years | 396 (11.7%) | 270 (9.5%) |
| 35 to 64 Years | 668 (11.4%) | 790 (12.9%) |
| 65 to 74 Years | 201 (11.7%) | 255 (12.8%) |
| 75 Years and over | 126 (12.6%) | 263 (19.2%) |
Disability Class: Ambulatory Difficulty
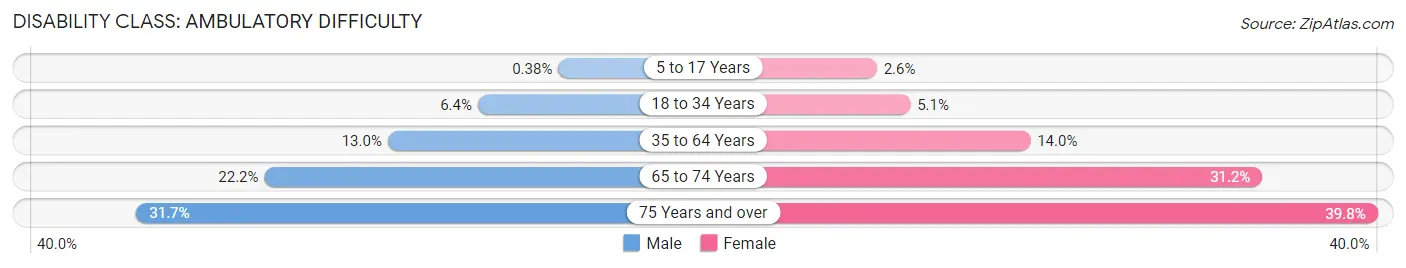
| Age Bracket | Male | Female |
| 5 to 17 Years | 10 (0.4%) | 60 (2.6%) |
| 18 to 34 Years | 215 (6.4%) | 145 (5.1%) |
| 35 to 64 Years | 764 (13.0%) | 859 (14.0%) |
| 65 to 74 Years | 382 (22.2%) | 622 (31.2%) |
| 75 Years and over | 316 (31.7%) | 544 (39.8%) |
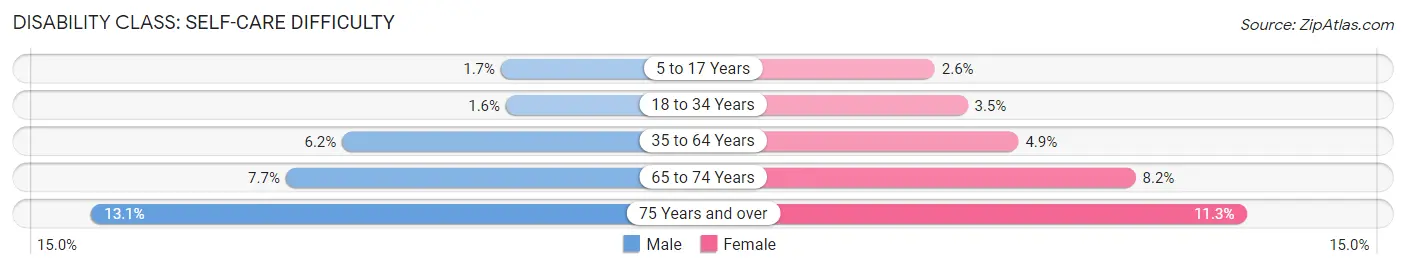
Disability Class: Self-Care Difficulty
| Age Bracket | Male | Female |
| 5 to 17 Years | 46 (1.7%) | 60 (2.6%) |
| 18 to 34 Years | 54 (1.6%) | 100 (3.5%) |
| 35 to 64 Years | 361 (6.2%) | 302 (4.9%) |
| 65 to 74 Years | 133 (7.7%) | 163 (8.2%) |
| 75 Years and over | 131 (13.1%) | 154 (11.3%) |
Technology Access in Hot Spring County
Computing Device Access in Hot Spring County
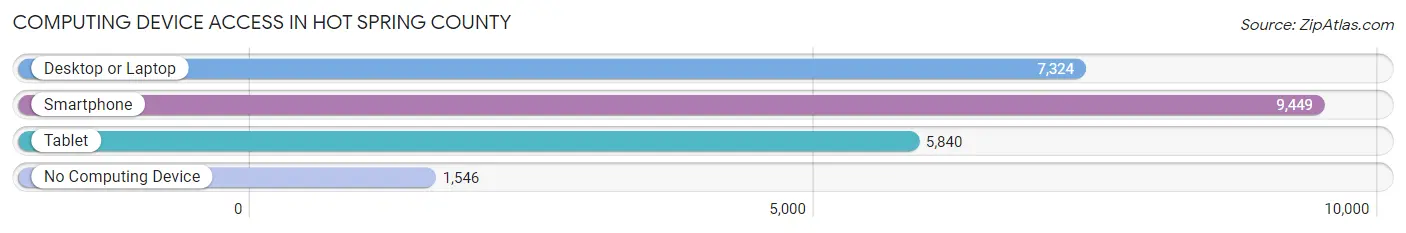
| Device Type | # Households | % Households |
| Desktop or Laptop | 7,324 | 61.6% |
| Smartphone | 9,449 | 79.4% |
| Tablet | 5,840 | 49.1% |
| No Computing Device | 1,546 | 13.0% |
| Total | 11,900 | 100.0% |
Internet Access in Hot Spring County
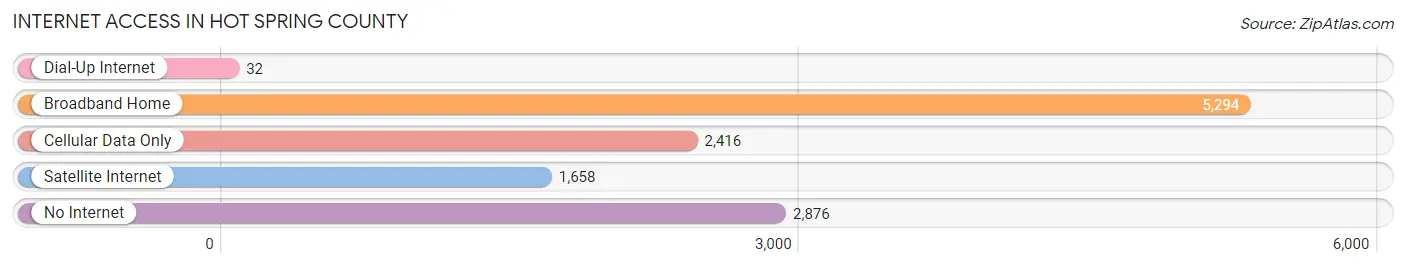
| Internet Type | # Households | % Households |
| Dial-Up Internet | 32 | 0.3% |
| Broadband Home | 5,294 | 44.5% |
| Cellular Data Only | 2,416 | 20.3% |
| Satellite Internet | 1,658 | 13.9% |
| No Internet | 2,876 | 24.2% |
| Total | 11,900 | 100.0% |
Hot Spring County Summary
Spring County, Arkansas is located in the northwest corner of the state and is part of the Ozark Mountains region. It is bordered by Washington County to the north, Madison County to the east, Carroll County to the south, and Benton County to the west. The county seat is located in the city of Hot Springs, which is the largest city in the county.
Geography
Hot Spring County covers an area of 602 square miles and is located in the Ouachita Mountains region of Arkansas. The county is mostly mountainous, with the highest point being Hot Springs Mountain at 1,843 feet. The county is drained by the Ouachita River, which forms the western boundary of the county. Other major waterways include the Little Missouri River, which flows through the northern part of the county, and the Saline River, which flows through the southern part of the county.
The county is home to several state parks, including Hot Springs National Park, Lake Catherine State Park, and Ouachita National Forest. The county also contains several lakes, including Lake Hamilton, Lake Catherine, and Lake Ouachita.
Demographics
As of the 2010 census, Hot Spring County had a population of 32,923. The racial makeup of the county was 87.3% White, 9.2% Black or African American, 0.5% Native American, 0.4% Asian, 0.1% Pacific Islander, 1.2% from other races, and 1.3% from two or more races. Hispanic or Latino of any race were 2.7% of the population.
The median income for a household in the county was $35,945, and the median income for a family was $43,945. The per capita income for the county was $19,945. About 13.2% of families and 16.7% of the population were below the poverty line, including 22.2% of those under age 18 and 11.7% of those age 65 or over.
Economy
Hot Spring County is home to a variety of industries, including tourism, manufacturing, and agriculture. The county is home to several tourist attractions, including Hot Springs National Park, Lake Catherine State Park, and Ouachita National Forest. The county is also home to several manufacturing companies, including Arkansas Steel and Wire, Arkansas Steel Products, and Hot Springs Manufacturing.
Agriculture is an important part of the county’s economy, with the main crops being soybeans, corn, cotton, and wheat. Livestock production is also important, with the main animals being cattle, hogs, and poultry.
History
Hot Spring County was formed in 1829 from parts of Clark and Hempstead counties. The county was named for the hot springs located in the area. Hot Springs was established as the county seat in 1832.
The county was home to several Native American tribes, including the Caddo, Osage, and Quapaw. The first European settlers arrived in the area in the early 1800s.
During the Civil War, Hot Spring County was the site of several battles, including the Battle of Hot Springs in 1863. After the war, the county experienced a period of economic growth, with the development of the hot springs as a tourist destination.
In the late 19th century, the county was home to several resorts, including the Arlington Hotel and the Majestic Hotel. The county also experienced a period of industrial growth, with the development of several manufacturing companies.
Today, Hot Spring County is a popular tourist destination, with the hot springs and state parks drawing visitors from all over the country. The county is also home to several manufacturing companies, as well as a thriving agricultural industry.
Common Questions
What is Per Capita Income in Hot Spring County?
Per Capita income in Hot Spring County is $25,486.
What is the Median Family Income in Hot Spring County?
Median Family Income in Hot Spring County is $63,503.
What is the Median Household income in Hot Spring County?
Median Household Income in Hot Spring County is $50,260.
What is Income or Wage Gap in Hot Spring County?
Income or Wage Gap in Hot Spring County is 22.3%.
Women in Hot Spring County earn 77.7 cents for every dollar earned by a man.
What is Family Income Deficit in Hot Spring County?
Family Income Deficit in Hot Spring County is $9,822.
Families that are below poverty line in Hot Spring County earn $9,822 less on average than the poverty threshold level.
What is Inequality or Gini Index in Hot Spring County?
Inequality or Gini Index in Hot Spring County is 0.44.
What is the Total Population of Hot Spring County?
Total Population of Hot Spring County is 33,129.
What is the Total Male Population of Hot Spring County?
Total Male Population of Hot Spring County is 17,621.
What is the Total Female Population of Hot Spring County?
Total Female Population of Hot Spring County is 15,508.
What is the Ratio of Males per 100 Females in Hot Spring County?
There are 113.63 Males per 100 Females in Hot Spring County.
What is the Ratio of Females per 100 Males in Hot Spring County?
There are 88.01 Females per 100 Males in Hot Spring County.
What is the Median Population Age in Hot Spring County?
Median Population Age in Hot Spring County is 42.6 Years.
What is the Average Family Size in Hot Spring County
Average Family Size in Hot Spring County is 3.1 People.
What is the Average Household Size in Hot Spring County
Average Household Size in Hot Spring County is 2.6 People.
How Large is the Labor Force in Hot Spring County?
There are 13,482 People in the Labor Forcein in Hot Spring County.
What is the Percentage of People in the Labor Force in Hot Spring County?
49.2% of People are in the Labor Force in Hot Spring County.
What is the Unemployment Rate in Hot Spring County?
Unemployment Rate in Hot Spring County is 4.6%.