Garland County, AR Map & Demographics
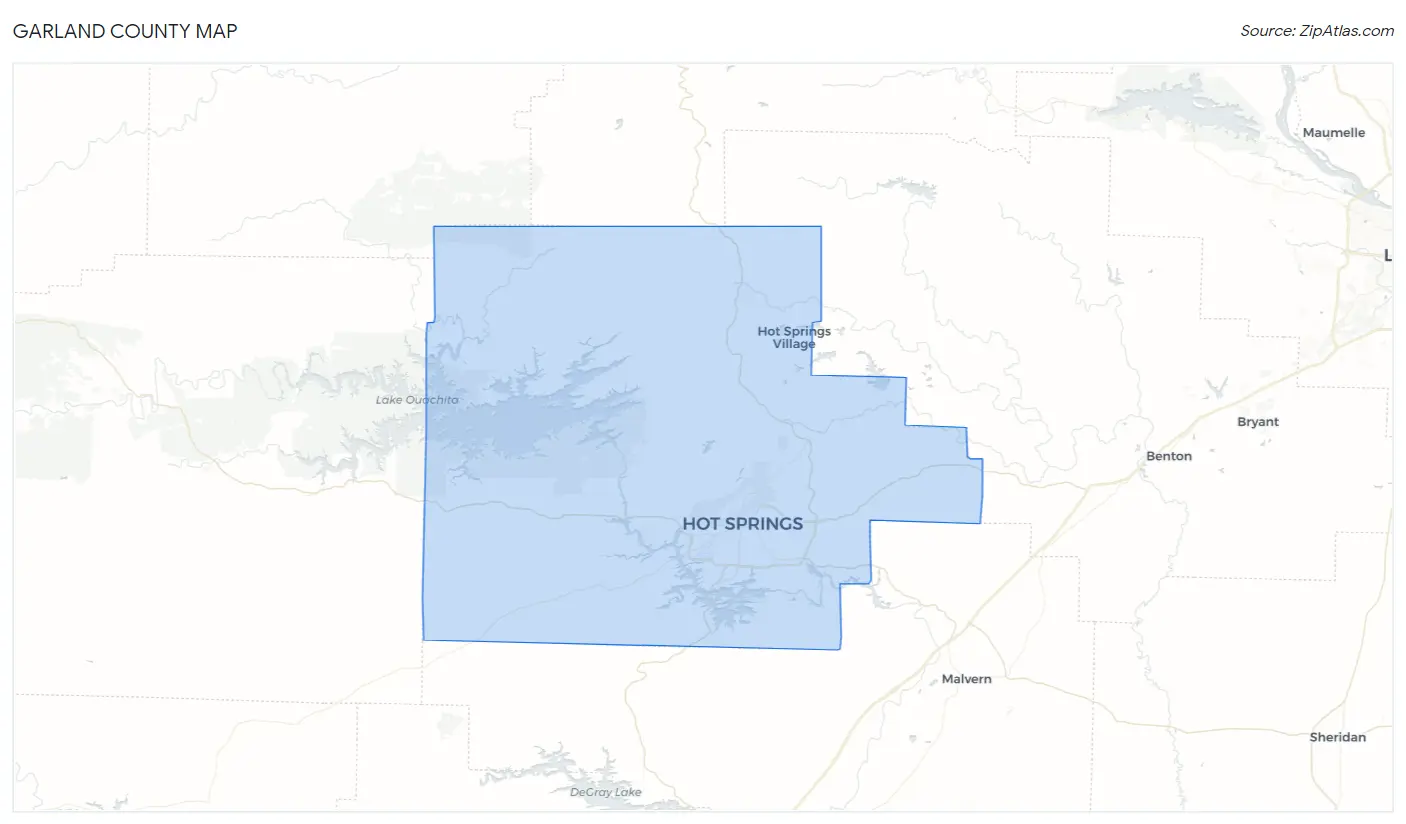
Garland County Map
Garland County Overview
$31,854
PER CAPITA INCOME
$68,326
AVG FAMILY INCOME
$54,229
AVG HOUSEHOLD INCOME
23.8%
WAGE / INCOME GAP [ % ]
76.2¢/ $1
WAGE / INCOME GAP [ $ ]
$9,698
FAMILY INCOME DEFICIT
0.46
INEQUALITY / GINI INDEX
100,021
TOTAL POPULATION
48,360
MALE POPULATION
51,661
FEMALE POPULATION
93.61
MALES / 100 FEMALES
106.83
FEMALES / 100 MALES
45.4
MEDIAN AGE
2.8
AVG FAMILY SIZE
2.3
AVG HOUSEHOLD SIZE
44,877
LABOR FORCE [ PEOPLE ]
54.2%
PERCENT IN LABOR FORCE
5.7%
UNEMPLOYMENT RATE
Garland County Area Codes
Income in Garland County
Income Overview in Garland County
Per Capita Income in Garland County is $31,854, while median incomes of families and households are $68,326 and $54,229 respectively.
| Characteristic | Number | Measure |
| Per Capita Income | 100,021 | $31,854 |
| Median Family Income | 27,766 | $68,326 |
| Mean Family Income | 27,766 | $86,932 |
| Median Household Income | 43,220 | $54,229 |
| Mean Household Income | 43,220 | $73,126 |
| Income Deficit | 27,766 | $9,698 |
| Wage / Income Gap (%) | 100,021 | 23.83% |
| Wage / Income Gap ($) | 100,021 | 76.17¢ per $1 |
| Gini / Inequality Index | 100,021 | 0.46 |
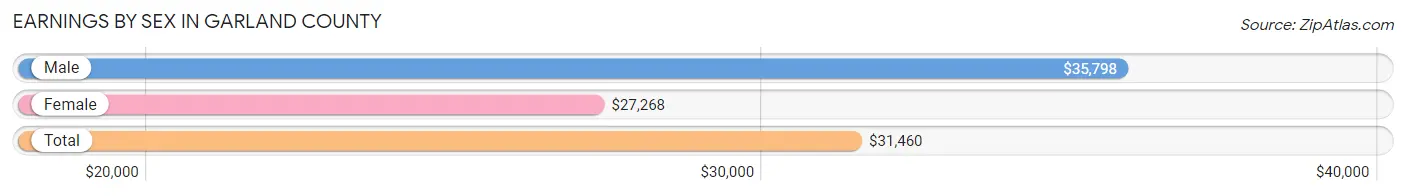
Earnings by Sex in Garland County
Average Earnings in Garland County are $31,460, $35,798 for men and $27,268 for women, a difference of 23.8%.
| Sex | Number | Average Earnings |
| Male | 23,922 (50.7%) | $35,798 |
| Female | 23,226 (49.3%) | $27,268 |
| Total | 47,148 (100.0%) | $31,460 |
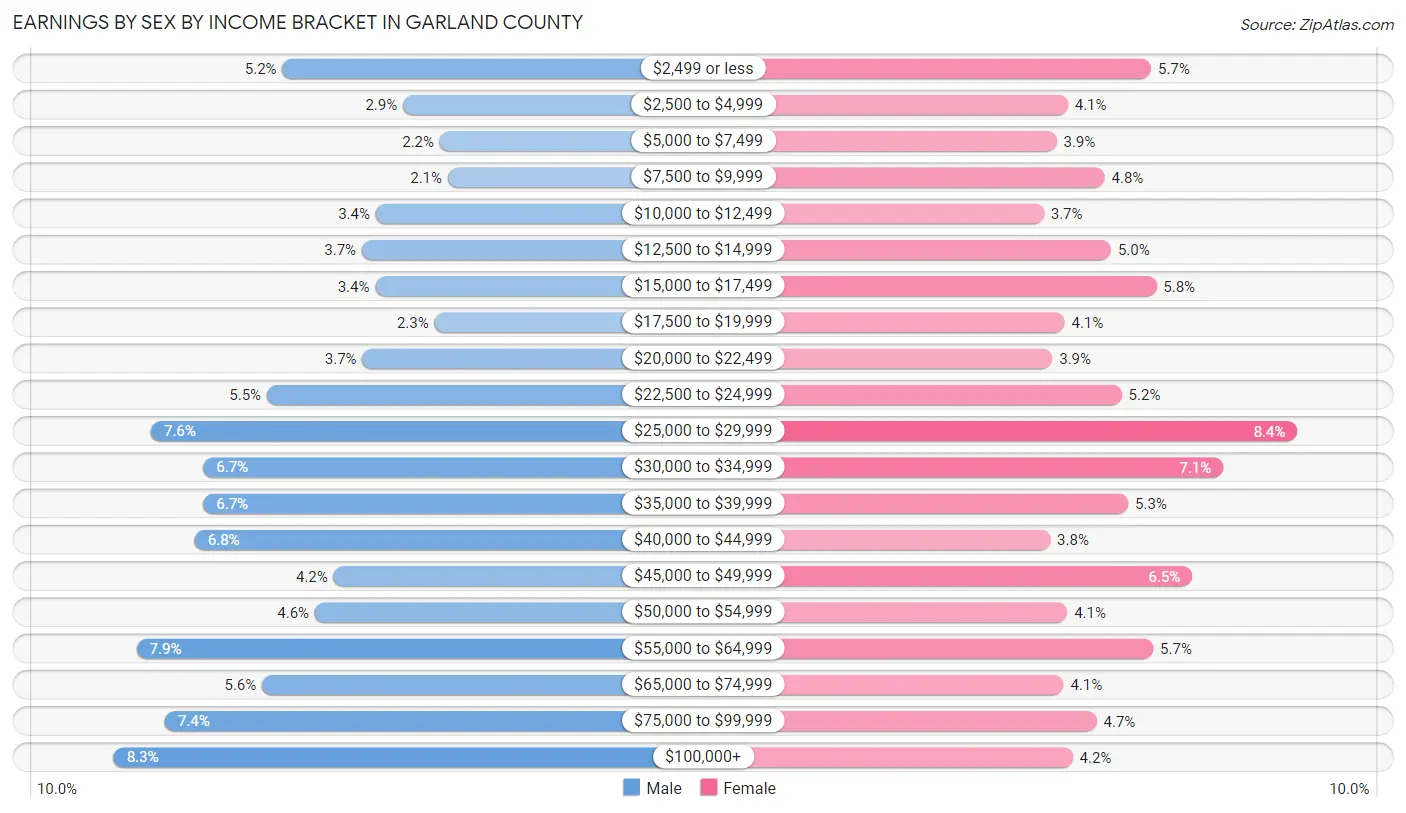
Earnings by Sex by Income Bracket in Garland County
The most common earnings brackets in Garland County are $100,000+ for men (1,993 | 8.3%) and $25,000 to $29,999 for women (1,960 | 8.4%).
| Income | Male | Female |
| $2,499 or less | 1,237 (5.2%) | 1,325 (5.7%) |
| $2,500 to $4,999 | 695 (2.9%) | 961 (4.1%) |
| $5,000 to $7,499 | 531 (2.2%) | 913 (3.9%) |
| $7,500 to $9,999 | 494 (2.1%) | 1,122 (4.8%) |
| $10,000 to $12,499 | 818 (3.4%) | 858 (3.7%) |
| $12,500 to $14,999 | 881 (3.7%) | 1,149 (5.0%) |
| $15,000 to $17,499 | 820 (3.4%) | 1,348 (5.8%) |
| $17,500 to $19,999 | 554 (2.3%) | 947 (4.1%) |
| $20,000 to $22,499 | 879 (3.7%) | 895 (3.8%) |
| $22,500 to $24,999 | 1,307 (5.5%) | 1,195 (5.1%) |
| $25,000 to $29,999 | 1,826 (7.6%) | 1,960 (8.4%) |
| $30,000 to $34,999 | 1,591 (6.7%) | 1,637 (7.0%) |
| $35,000 to $39,999 | 1,592 (6.7%) | 1,225 (5.3%) |
| $40,000 to $44,999 | 1,628 (6.8%) | 884 (3.8%) |
| $45,000 to $49,999 | 1,007 (4.2%) | 1,503 (6.5%) |
| $50,000 to $54,999 | 1,090 (4.6%) | 959 (4.1%) |
| $55,000 to $64,999 | 1,889 (7.9%) | 1,333 (5.7%) |
| $65,000 to $74,999 | 1,328 (5.6%) | 943 (4.1%) |
| $75,000 to $99,999 | 1,762 (7.4%) | 1,087 (4.7%) |
| $100,000+ | 1,993 (8.3%) | 982 (4.2%) |
| Total | 23,922 (100.0%) | 23,226 (100.0%) |
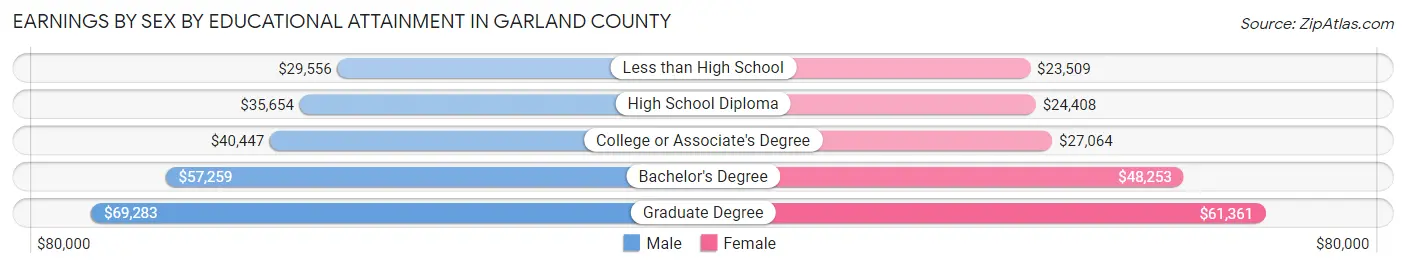
Earnings by Sex by Educational Attainment in Garland County
Average earnings in Garland County are $40,206 for men and $31,013 for women, a difference of 22.9%. Men with an educational attainment of graduate degree enjoy the highest average annual earnings of $69,283, while those with less than high school education earn the least with $29,556. Women with an educational attainment of graduate degree earn the most with the average annual earnings of $61,361, while those with less than high school education have the smallest earnings of $23,509.
| Educational Attainment | Male Income | Female Income |
| Less than High School | $29,556 | $23,509 |
| High School Diploma | $35,654 | $24,408 |
| College or Associate's Degree | $40,447 | $27,064 |
| Bachelor's Degree | $57,259 | $48,253 |
| Graduate Degree | $69,283 | $61,361 |
| Total | $40,206 | $31,013 |
Family Income in Garland County
Family Income Brackets in Garland County
According to the Garland County family income data, there are 5,470 families falling into the $50,000 to $74,999 income range, which is the most common income bracket and makes up 19.7% of all families. Conversely, the $10,000 to $14,999 income bracket is the least frequent group with only 805 families (2.9%) belonging to this category.
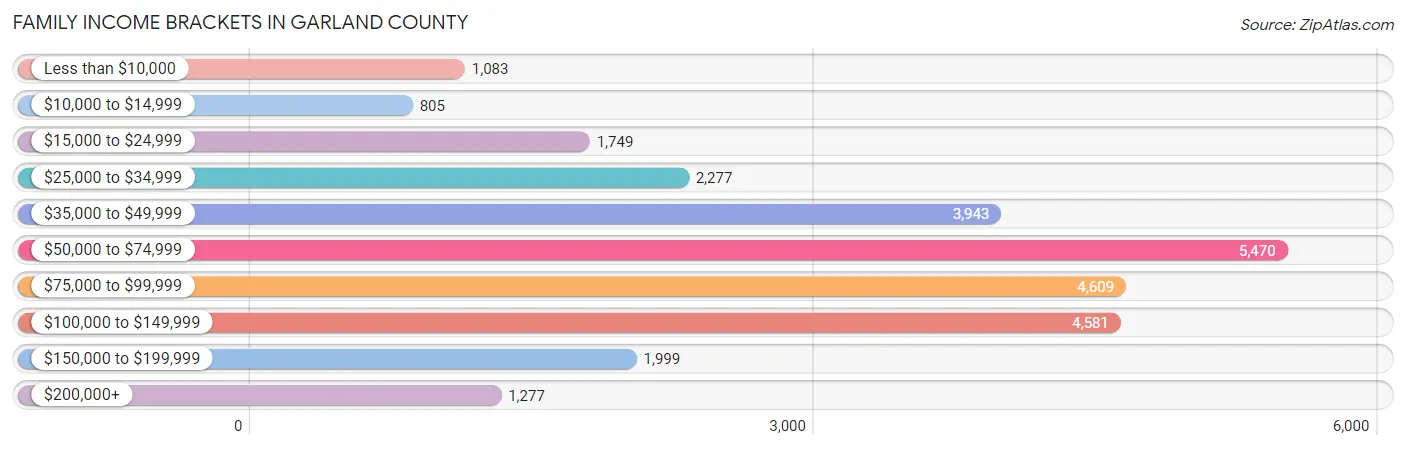
| Income Bracket | # Families | % Families |
| Less than $10,000 | 1,083 | 3.9% |
| $10,000 to $14,999 | 805 | 2.9% |
| $15,000 to $24,999 | 1,749 | 6.3% |
| $25,000 to $34,999 | 2,277 | 8.2% |
| $35,000 to $49,999 | 3,943 | 14.2% |
| $50,000 to $74,999 | 5,470 | 19.7% |
| $75,000 to $99,999 | 4,609 | 16.6% |
| $100,000 to $149,999 | 4,581 | 16.5% |
| $150,000 to $199,999 | 1,999 | 7.2% |
| $200,000+ | 1,277 | 4.6% |
Family Income by Famaliy Size in Garland County
7+ person families (596 | 2.1%) account for the highest median family income in Garland County with $85,283 per family, while 2-person families (15,310 | 55.1%) have the highest median income of $31,754 per family member.
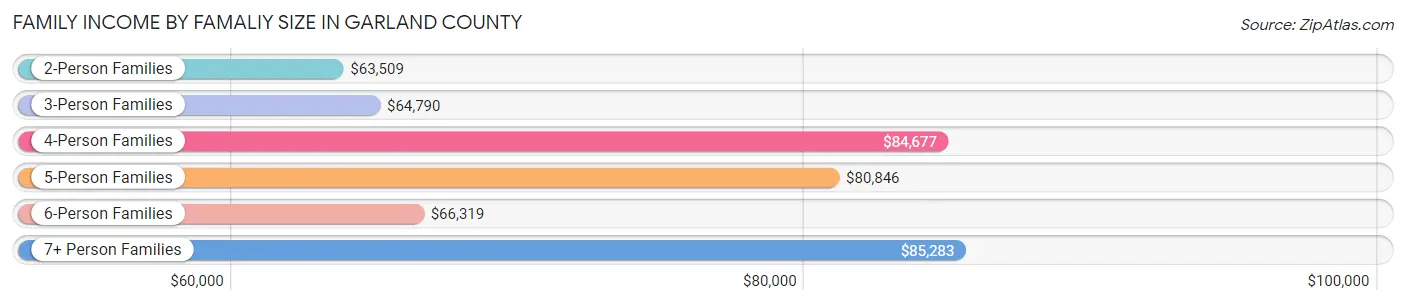
| Income Bracket | # Families | Median Income |
| 2-Person Families | 15,310 (55.1%) | $63,509 |
| 3-Person Families | 6,225 (22.4%) | $64,790 |
| 4-Person Families | 3,530 (12.7%) | $84,677 |
| 5-Person Families | 1,693 (6.1%) | $80,846 |
| 6-Person Families | 412 (1.5%) | $66,319 |
| 7+ Person Families | 596 (2.1%) | $85,283 |
| Total | 27,766 (100.0%) | $68,326 |
Family Income by Number of Earners in Garland County
The median family income in Garland County is $68,326, with families comprising 3+ earners (1,983) having the highest median family income of $104,981, while families with 1 earner (10,559) have the lowest median family income of $49,623, accounting for 7.1% and 38.0% of families, respectively.
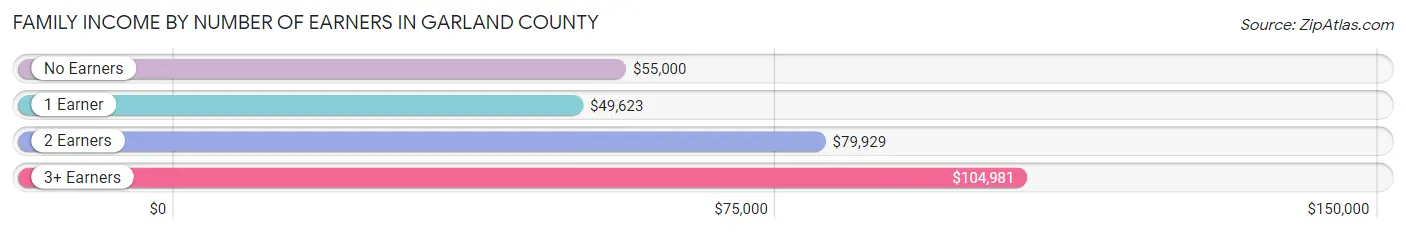
| Number of Earners | # Families | Median Income |
| No Earners | 5,980 (21.5%) | $55,000 |
| 1 Earner | 10,559 (38.0%) | $49,623 |
| 2 Earners | 9,244 (33.3%) | $79,929 |
| 3+ Earners | 1,983 (7.1%) | $104,981 |
| Total | 27,766 (100.0%) | $68,326 |
Household Income in Garland County
Household Income Brackets in Garland County
With 8,169 households falling in the category, the $50,000 to $74,999 income range is the most frequent in Garland County, accounting for 18.9% of all households. In contrast, only 1,469 households (3.4%) fall into the $200,000+ income bracket, making it the least populous group.
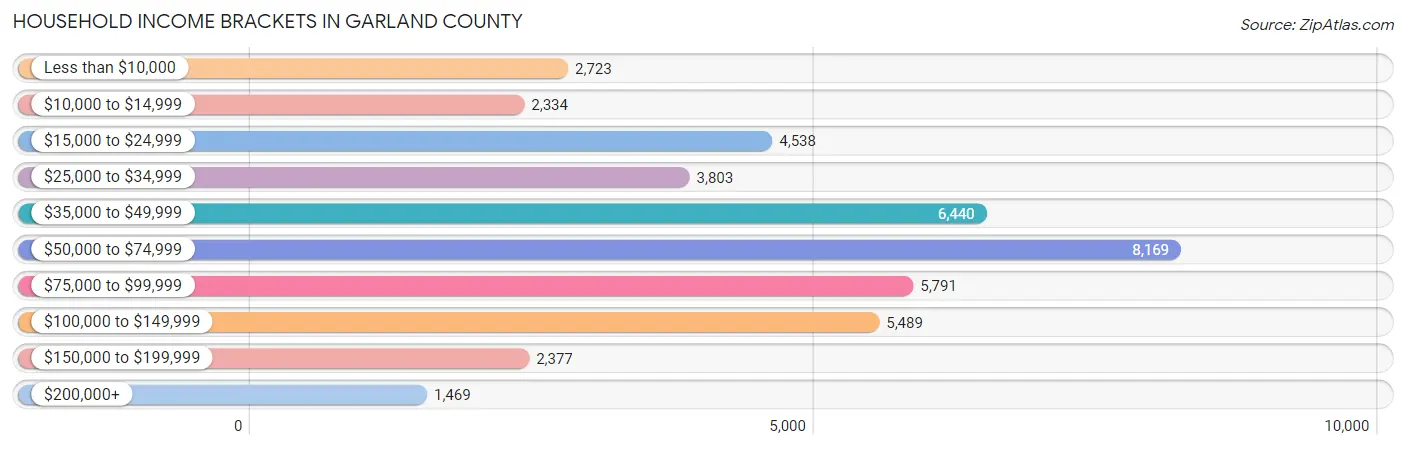
| Income Bracket | # Households | % Households |
| Less than $10,000 | 2,723 | 6.3% |
| $10,000 to $14,999 | 2,334 | 5.4% |
| $15,000 to $24,999 | 4,538 | 10.5% |
| $25,000 to $34,999 | 3,803 | 8.8% |
| $35,000 to $49,999 | 6,440 | 14.9% |
| $50,000 to $74,999 | 8,169 | 18.9% |
| $75,000 to $99,999 | 5,791 | 13.4% |
| $100,000 to $149,999 | 5,489 | 12.7% |
| $150,000 to $199,999 | 2,377 | 5.5% |
| $200,000+ | 1,469 | 3.4% |
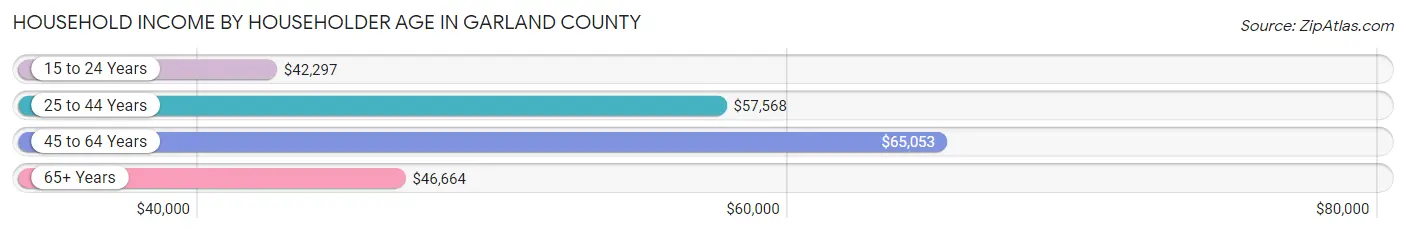
Household Income by Householder Age in Garland County
The median household income in Garland County is $54,229, with the highest median household income of $65,053 found in the 45 to 64 years age bracket for the primary householder. A total of 14,577 households (33.7%) fall into this category. Meanwhile, the 15 to 24 years age bracket for the primary householder has the lowest median household income of $42,297, with 1,204 households (2.8%) in this group.
| Income Bracket | # Households | Median Income |
| 15 to 24 Years | 1,204 (2.8%) | $42,297 |
| 25 to 44 Years | 11,792 (27.3%) | $57,568 |
| 45 to 64 Years | 14,577 (33.7%) | $65,053 |
| 65+ Years | 15,647 (36.2%) | $46,664 |
| Total | 43,220 (100.0%) | $54,229 |
Poverty in Garland County
Income Below Poverty by Sex and Age in Garland County
With 14.5% poverty level for males and 19.1% for females among the residents of Garland County, under 5 year old males and 18 to 24 year old females are the most vulnerable to poverty, with 844 males (32.8%) and 1,140 females (33.3%) in their respective age groups living below the poverty level.
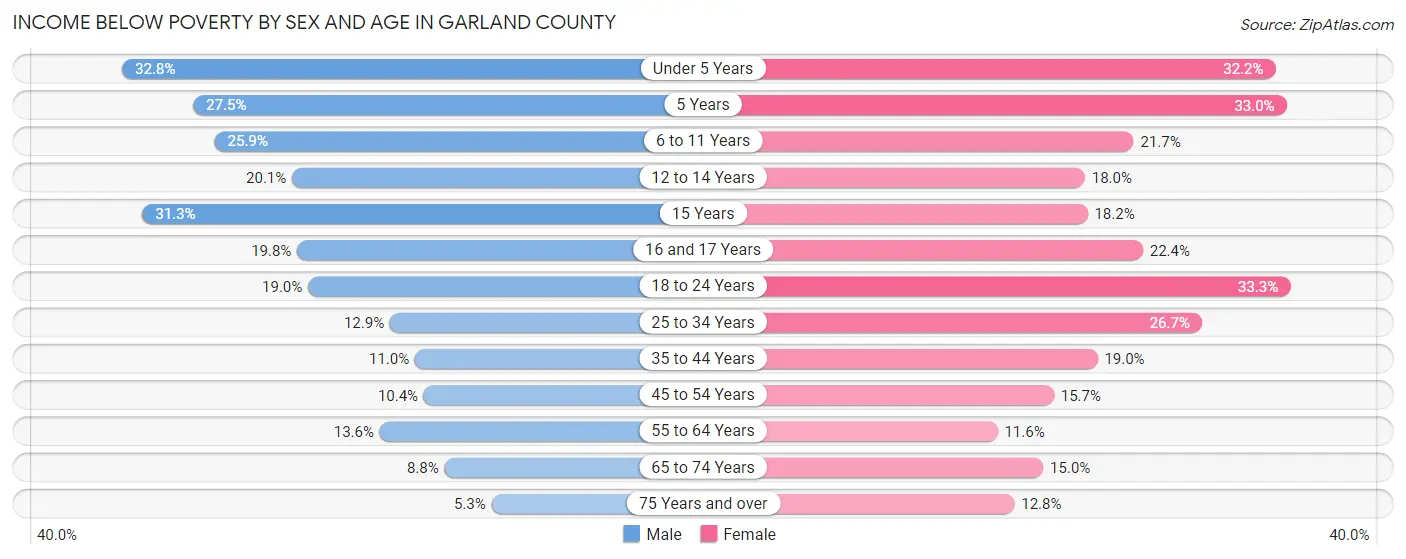
| Age Bracket | Male | Female |
| Under 5 Years | 844 (32.8%) | 831 (32.2%) |
| 5 Years | 204 (27.5%) | 136 (33.0%) |
| 6 to 11 Years | 818 (25.9%) | 752 (21.7%) |
| 12 to 14 Years | 324 (20.1%) | 256 (18.0%) |
| 15 Years | 156 (31.3%) | 81 (18.2%) |
| 16 and 17 Years | 247 (19.8%) | 280 (22.4%) |
| 18 to 24 Years | 698 (19.0%) | 1,140 (33.3%) |
| 25 to 34 Years | 681 (12.9%) | 1,520 (26.7%) |
| 35 to 44 Years | 595 (11.0%) | 1,095 (19.0%) |
| 45 to 54 Years | 586 (10.3%) | 961 (15.7%) |
| 55 to 64 Years | 920 (13.6%) | 887 (11.6%) |
| 65 to 74 Years | 556 (8.8%) | 1,089 (14.9%) |
| 75 Years and over | 238 (5.3%) | 709 (12.8%) |
| Total | 6,867 (14.5%) | 9,737 (19.1%) |
Income Above Poverty by Sex and Age in Garland County
According to the poverty statistics in Garland County, males aged 75 years and over and females aged 55 to 64 years are the age groups that are most secure financially, with 94.7% of males and 88.4% of females in these age groups living above the poverty line.
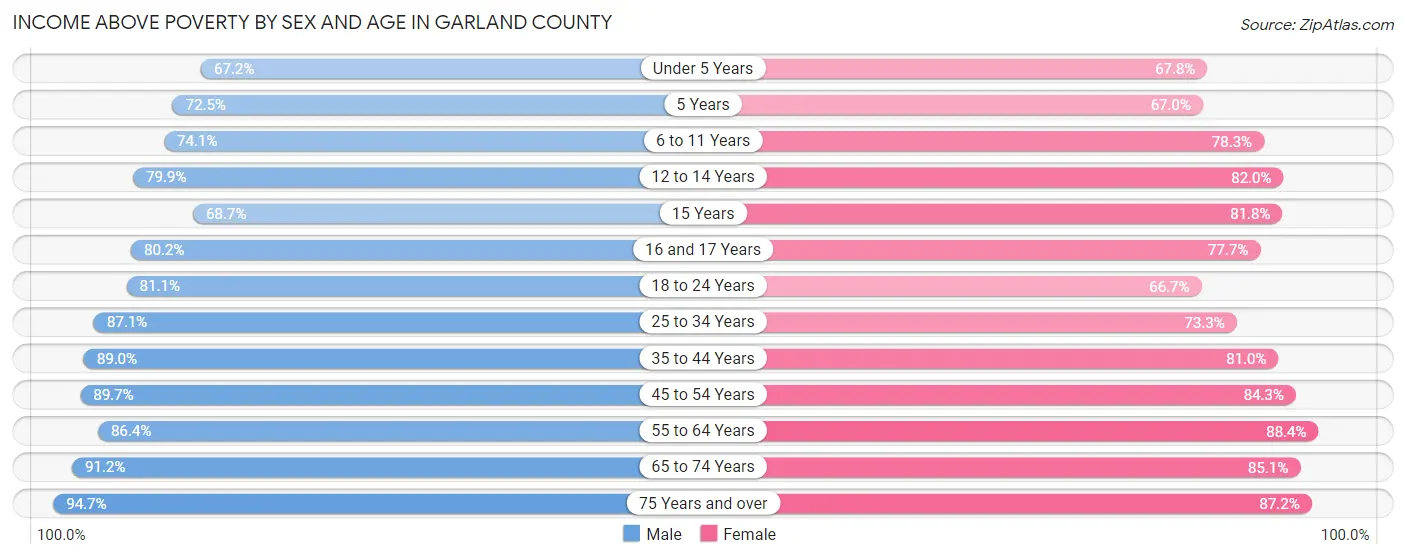
| Age Bracket | Male | Female |
| Under 5 Years | 1,732 (67.2%) | 1,751 (67.8%) |
| 5 Years | 538 (72.5%) | 276 (67.0%) |
| 6 to 11 Years | 2,341 (74.1%) | 2,720 (78.3%) |
| 12 to 14 Years | 1,285 (79.9%) | 1,163 (82.0%) |
| 15 Years | 343 (68.7%) | 363 (81.8%) |
| 16 and 17 Years | 1,003 (80.2%) | 973 (77.6%) |
| 18 to 24 Years | 2,985 (81.0%) | 2,285 (66.7%) |
| 25 to 34 Years | 4,609 (87.1%) | 4,168 (73.3%) |
| 35 to 44 Years | 4,811 (89.0%) | 4,674 (81.0%) |
| 45 to 54 Years | 5,076 (89.6%) | 5,144 (84.3%) |
| 55 to 64 Years | 5,830 (86.4%) | 6,788 (88.4%) |
| 65 to 74 Years | 5,748 (91.2%) | 6,197 (85.1%) |
| 75 Years and over | 4,231 (94.7%) | 4,827 (87.2%) |
| Total | 40,532 (85.5%) | 41,329 (80.9%) |
Income Below Poverty Among Married-Couple Families in Garland County
The poverty statistics for married-couple families in Garland County show that 5.2% or 996 of the total 19,209 families live below the poverty line. Families with 3 or 4 children have the highest poverty rate of 26.0%, comprising of 335 families. On the other hand, families with no children have the lowest poverty rate of 3.1%, which includes 400 families.
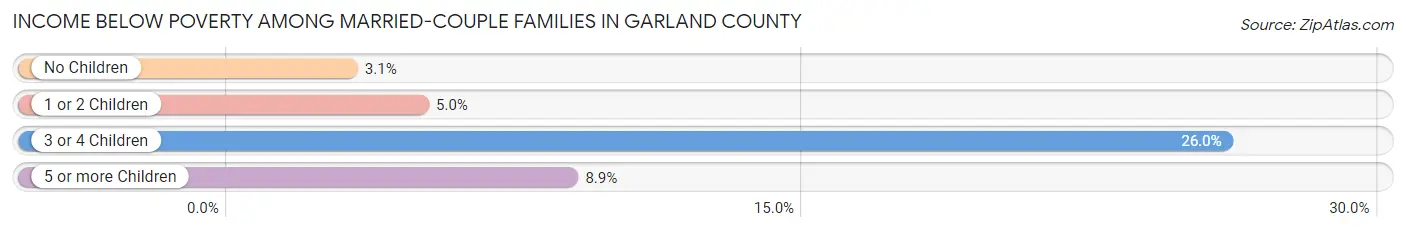
| Children | Above Poverty | Below Poverty |
| No Children | 12,364 (96.9%) | 400 (3.1%) |
| 1 or 2 Children | 4,813 (95.0%) | 253 (5.0%) |
| 3 or 4 Children | 954 (74.0%) | 335 (26.0%) |
| 5 or more Children | 82 (91.1%) | 8 (8.9%) |
| Total | 18,213 (94.8%) | 996 (5.2%) |
Income Below Poverty Among Single-Parent Households in Garland County
According to the poverty data in Garland County, 15.1% or 385 single-father households and 33.1% or 1,991 single-mother households are living below the poverty line. Among single-father households, those with 3 or 4 children have the highest poverty rate, with 18 households (36.0%) experiencing poverty. Likewise, among single-mother households, those with 5 or more children have the highest poverty rate, with 72 households (52.9%) falling below the poverty line.
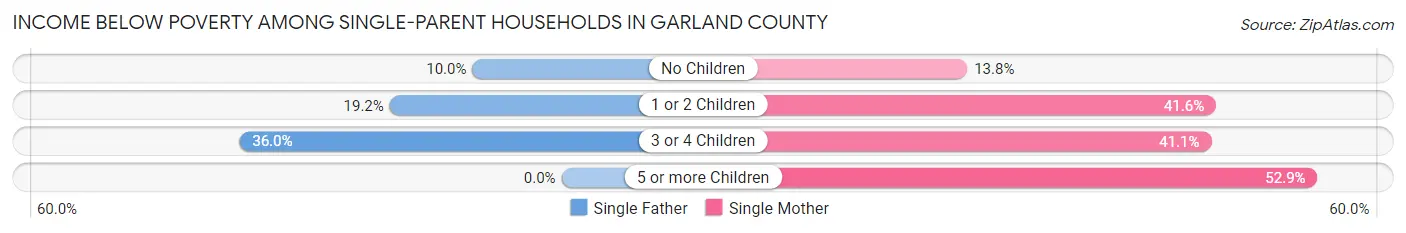
| Children | Single Father | Single Mother |
| No Children | 100 (10.0%) | 259 (13.8%) |
| 1 or 2 Children | 267 (19.2%) | 1,411 (41.6%) |
| 3 or 4 Children | 18 (36.0%) | 249 (41.1%) |
| 5 or more Children | 0 (0.0%) | 72 (52.9%) |
| Total | 385 (15.1%) | 1,991 (33.1%) |
Income Below Poverty Among Married-Couple vs Single-Parent Households in Garland County
The poverty data for Garland County shows that 996 of the married-couple family households (5.2%) and 2,376 of the single-parent households (27.8%) are living below the poverty level. Within the married-couple family households, those with 3 or 4 children have the highest poverty rate, with 335 households (26.0%) falling below the poverty line. Among the single-parent households, those with 3 or 4 children have the highest poverty rate, with 267 household (40.7%) living below poverty.
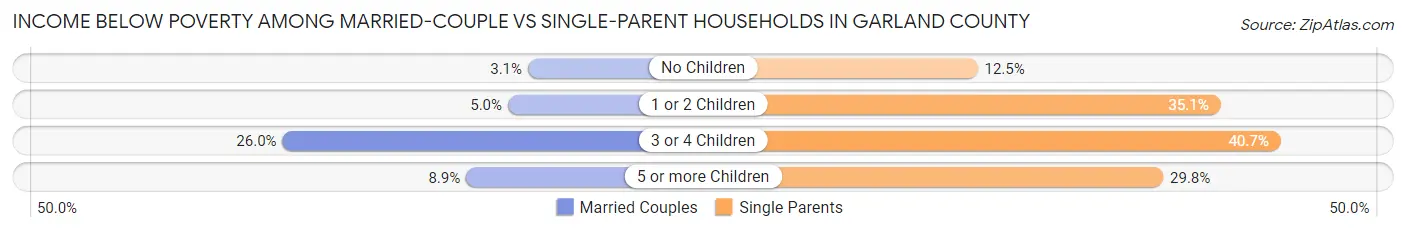
| Children | Married-Couple Families | Single-Parent Households |
| No Children | 400 (3.1%) | 359 (12.5%) |
| 1 or 2 Children | 253 (5.0%) | 1,678 (35.1%) |
| 3 or 4 Children | 335 (26.0%) | 267 (40.7%) |
| 5 or more Children | 8 (8.9%) | 72 (29.7%) |
| Total | 996 (5.2%) | 2,376 (27.8%) |
Race in Garland County
The most populous races in Garland County are White / Caucasian (84,455 | 84.4%), Black / African American (7,924 | 7.9%), and Hispanic or Latino (6,204 | 6.2%).
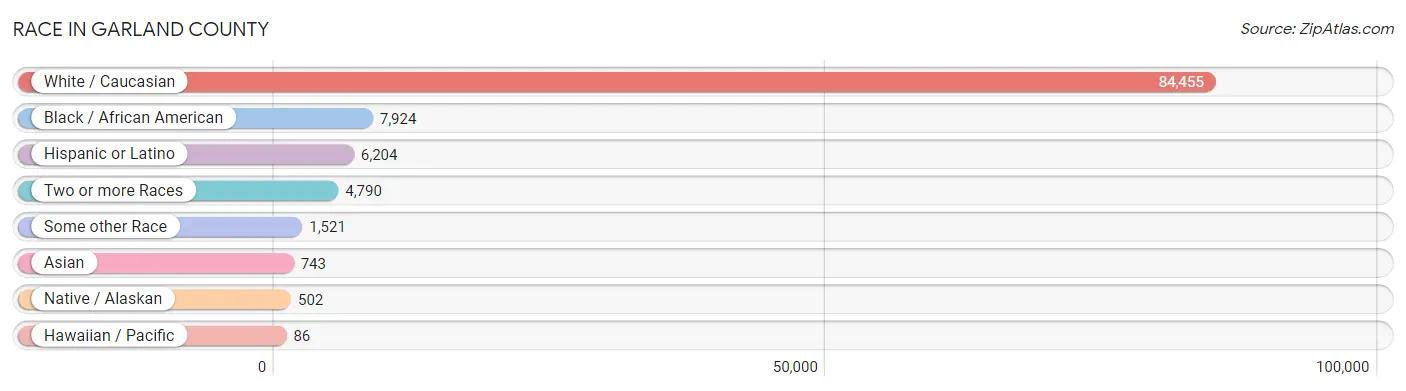
| Race | # Population | % Population |
| Asian | 743 | 0.7% |
| Black / African American | 7,924 | 7.9% |
| Hawaiian / Pacific | 86 | 0.1% |
| Hispanic or Latino | 6,204 | 6.2% |
| Native / Alaskan | 502 | 0.5% |
| White / Caucasian | 84,455 | 84.4% |
| Two or more Races | 4,790 | 4.8% |
| Some other Race | 1,521 | 1.5% |
| Total | 100,021 | 100.0% |
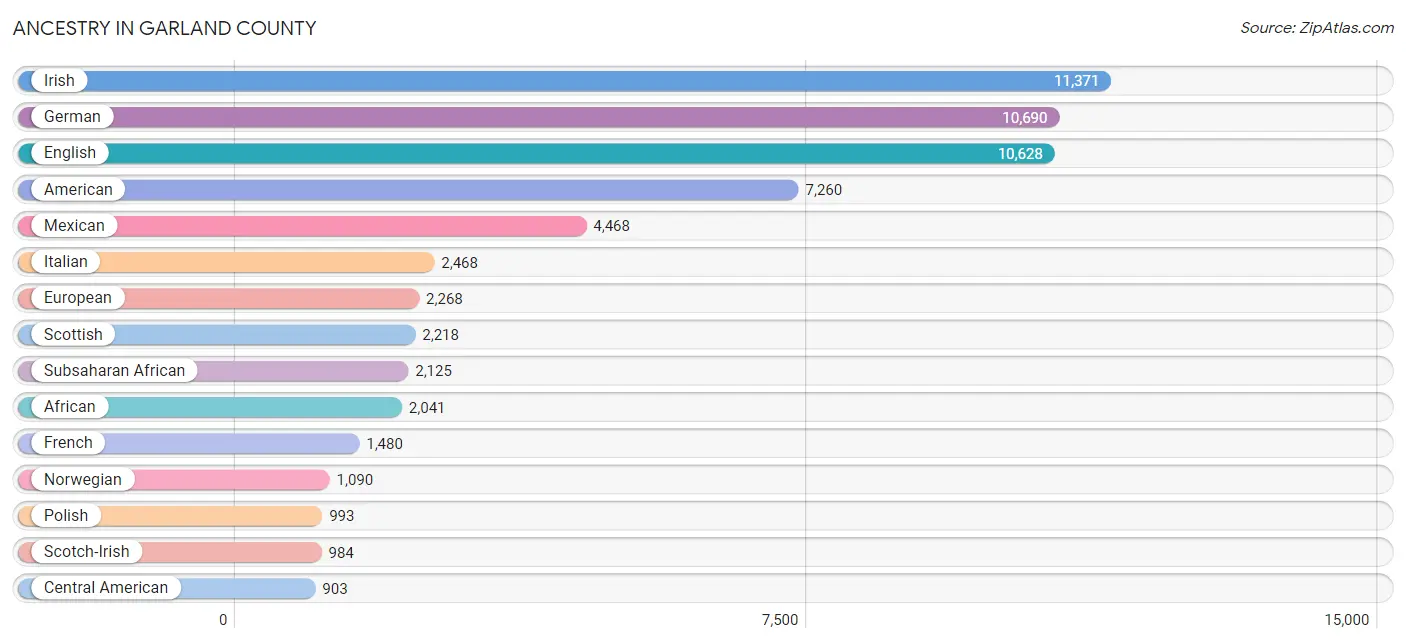
Ancestry in Garland County
The most populous ancestries reported in Garland County are Irish (11,371 | 11.4%), German (10,690 | 10.7%), English (10,628 | 10.6%), American (7,260 | 7.3%), and Mexican (4,468 | 4.5%), together accounting for 44.4% of all Garland County residents.
| Ancestry | # Population | % Population |
| African | 2,041 | 2.0% |
| American | 7,260 | 7.3% |
| Apache | 4 | 0.0% |
| Arab | 84 | 0.1% |
| Australian | 24 | 0.0% |
| Austrian | 40 | 0.0% |
| Bangladeshi | 102 | 0.1% |
| Belgian | 24 | 0.0% |
| Bhutanese | 158 | 0.2% |
| Blackfeet | 93 | 0.1% |
| Bolivian | 9 | 0.0% |
| British | 399 | 0.4% |
| Burmese | 56 | 0.1% |
| Cajun | 46 | 0.1% |
| Canadian | 64 | 0.1% |
| Carpatho Rusyn | 12 | 0.0% |
| Central American | 903 | 0.9% |
| Central American Indian | 15 | 0.0% |
| Cherokee | 794 | 0.8% |
| Cheyenne | 2 | 0.0% |
| Chickasaw | 12 | 0.0% |
| Chilean | 32 | 0.0% |
| Choctaw | 269 | 0.3% |
| Colombian | 20 | 0.0% |
| Cree | 3 | 0.0% |
| Creek | 12 | 0.0% |
| Croatian | 24 | 0.0% |
| Cuban | 28 | 0.0% |
| Czech | 321 | 0.3% |
| Czechoslovakian | 54 | 0.1% |
| Danish | 185 | 0.2% |
| Dominican | 3 | 0.0% |
| Dutch | 720 | 0.7% |
| Dutch West Indian | 65 | 0.1% |
| Eastern European | 30 | 0.0% |
| Egyptian | 8 | 0.0% |
| English | 10,628 | 10.6% |
| European | 2,268 | 2.3% |
| Fijian | 18 | 0.0% |
| Filipino | 3 | 0.0% |
| Finnish | 85 | 0.1% |
| French | 1,480 | 1.5% |
| French Canadian | 183 | 0.2% |
| German | 10,690 | 10.7% |
| Greek | 249 | 0.3% |
| Guatemalan | 32 | 0.0% |
| Honduran | 139 | 0.1% |
| Hungarian | 141 | 0.1% |
| Indian (Asian) | 90 | 0.1% |
| Iranian | 71 | 0.1% |
| Irish | 11,371 | 11.4% |
| Iroquois | 29 | 0.0% |
| Israeli | 7 | 0.0% |
| Italian | 2,468 | 2.5% |
| Korean | 282 | 0.3% |
| Lithuanian | 180 | 0.2% |
| Malaysian | 10 | 0.0% |
| Mexican | 4,468 | 4.5% |
| Mexican American Indian | 20 | 0.0% |
| Moroccan | 5 | 0.0% |
| Native Hawaiian | 40 | 0.0% |
| Navajo | 111 | 0.1% |
| Nigerian | 84 | 0.1% |
| Northern European | 202 | 0.2% |
| Norwegian | 1,090 | 1.1% |
| Osage | 6 | 0.0% |
| Pakistani | 144 | 0.1% |
| Panamanian | 9 | 0.0% |
| Pennsylvania German | 72 | 0.1% |
| Polish | 993 | 1.0% |
| Portuguese | 229 | 0.2% |
| Potawatomi | 11 | 0.0% |
| Puerto Rican | 161 | 0.2% |
| Romanian | 658 | 0.7% |
| Russian | 144 | 0.1% |
| Salvadoran | 723 | 0.7% |
| Scandinavian | 298 | 0.3% |
| Scotch-Irish | 984 | 1.0% |
| Scottish | 2,218 | 2.2% |
| Seminole | 12 | 0.0% |
| Serbian | 65 | 0.1% |
| Slovak | 90 | 0.1% |
| Slovene | 8 | 0.0% |
| South American | 139 | 0.1% |
| Spaniard | 118 | 0.1% |
| Spanish | 155 | 0.2% |
| Sri Lankan | 187 | 0.2% |
| Subsaharan African | 2,125 | 2.1% |
| Swedish | 520 | 0.5% |
| Swiss | 90 | 0.1% |
| Syrian | 61 | 0.1% |
| Thai | 330 | 0.3% |
| Ukrainian | 49 | 0.1% |
| Ute | 13 | 0.0% |
| Venezuelan | 78 | 0.1% |
| Welsh | 506 | 0.5% |
| Yugoslavian | 31 | 0.0% | View All 97 Rows |
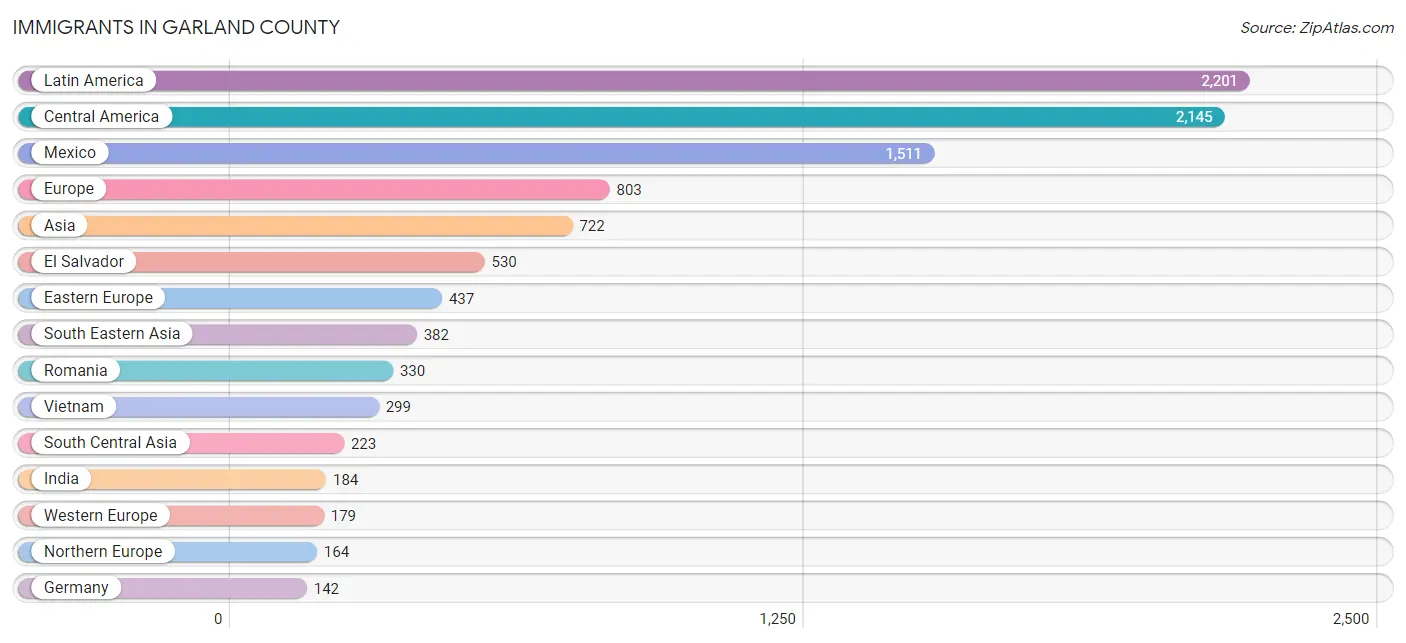
Immigrants in Garland County
The most numerous immigrant groups reported in Garland County came from Latin America (2,201 | 2.2%), Central America (2,145 | 2.1%), Mexico (1,511 | 1.5%), Europe (803 | 0.8%), and Asia (722 | 0.7%), together accounting for 7.4% of all Garland County residents.
| Immigration Origin | # Population | % Population |
| Africa | 28 | 0.0% |
| Asia | 722 | 0.7% |
| Belarus | 9 | 0.0% |
| Bolivia | 9 | 0.0% |
| Canada | 74 | 0.1% |
| Caribbean | 7 | 0.0% |
| Central America | 2,145 | 2.1% |
| Chile | 20 | 0.0% |
| China | 28 | 0.0% |
| Colombia | 1 | 0.0% |
| Croatia | 9 | 0.0% |
| Cuba | 7 | 0.0% |
| Czechoslovakia | 5 | 0.0% |
| Eastern Africa | 20 | 0.0% |
| Eastern Asia | 109 | 0.1% |
| Eastern Europe | 437 | 0.4% |
| Egypt | 8 | 0.0% |
| El Salvador | 530 | 0.5% |
| Europe | 803 | 0.8% |
| France | 25 | 0.0% |
| Germany | 142 | 0.1% |
| Greece | 14 | 0.0% |
| Guatemala | 32 | 0.0% |
| Honduras | 72 | 0.1% |
| India | 184 | 0.2% |
| Iran | 21 | 0.0% |
| Japan | 25 | 0.0% |
| Kenya | 20 | 0.0% |
| Korea | 56 | 0.1% |
| Latin America | 2,201 | 2.2% |
| Mexico | 1,511 | 1.5% |
| Micronesia | 15 | 0.0% |
| Netherlands | 12 | 0.0% |
| Northern Africa | 8 | 0.0% |
| Northern Europe | 164 | 0.2% |
| Oceania | 30 | 0.0% |
| Philippines | 46 | 0.1% |
| Poland | 7 | 0.0% |
| Romania | 330 | 0.3% |
| Saudi Arabia | 8 | 0.0% |
| Scotland | 105 | 0.1% |
| Serbia | 36 | 0.0% |
| South America | 49 | 0.1% |
| South Central Asia | 223 | 0.2% |
| South Eastern Asia | 382 | 0.4% |
| Southern Europe | 14 | 0.0% |
| Sri Lanka | 18 | 0.0% |
| Sweden | 21 | 0.0% |
| Taiwan | 3 | 0.0% |
| Thailand | 37 | 0.0% |
| Venezuela | 19 | 0.0% |
| Vietnam | 299 | 0.3% |
| Western Asia | 8 | 0.0% |
| Western Europe | 179 | 0.2% | View All 54 Rows |
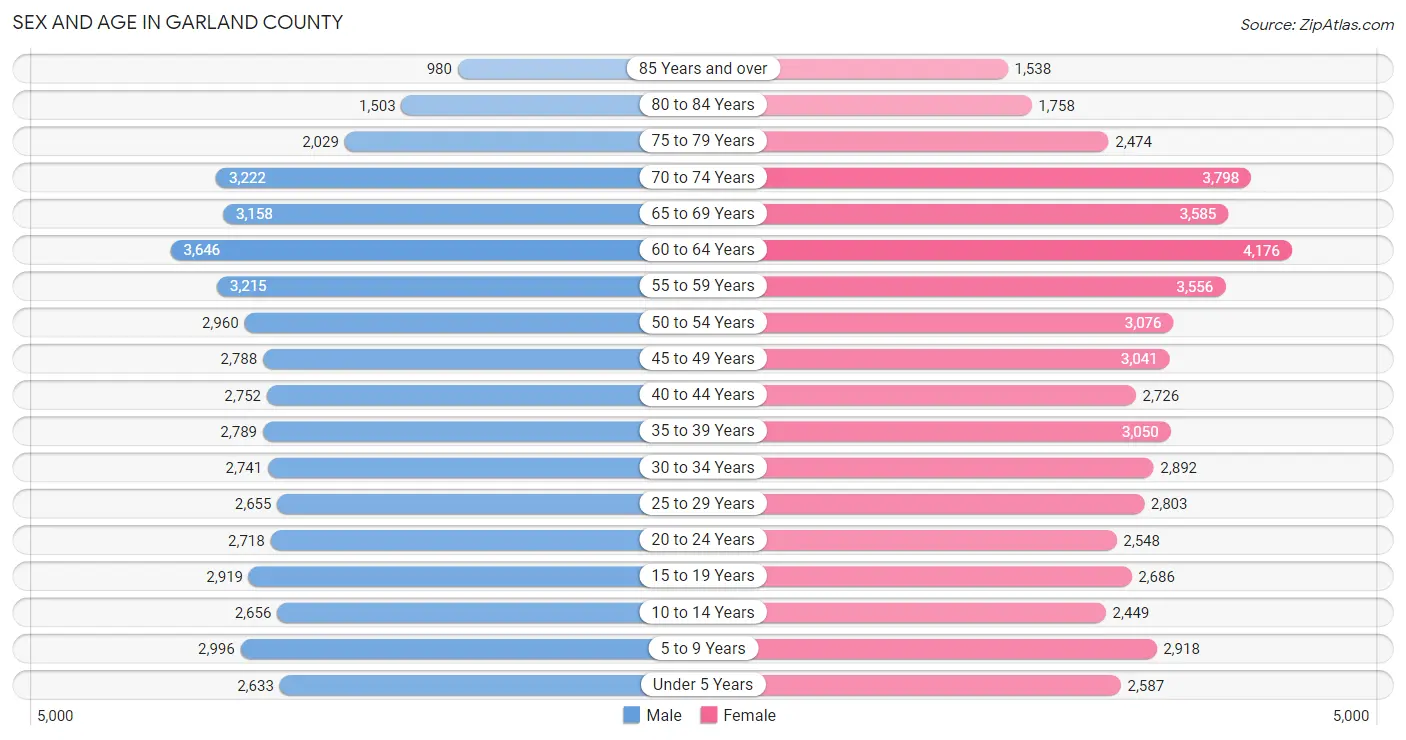
Sex and Age in Garland County
Sex and Age in Garland County
The most populous age groups in Garland County are 60 to 64 Years (3,646 | 7.5%) for men and 60 to 64 Years (4,176 | 8.1%) for women.
| Age Bracket | Male | Female |
| Under 5 Years | 2,633 (5.4%) | 2,587 (5.0%) |
| 5 to 9 Years | 2,996 (6.2%) | 2,918 (5.7%) |
| 10 to 14 Years | 2,656 (5.5%) | 2,449 (4.7%) |
| 15 to 19 Years | 2,919 (6.0%) | 2,686 (5.2%) |
| 20 to 24 Years | 2,718 (5.6%) | 2,548 (4.9%) |
| 25 to 29 Years | 2,655 (5.5%) | 2,803 (5.4%) |
| 30 to 34 Years | 2,741 (5.7%) | 2,892 (5.6%) |
| 35 to 39 Years | 2,789 (5.8%) | 3,050 (5.9%) |
| 40 to 44 Years | 2,752 (5.7%) | 2,726 (5.3%) |
| 45 to 49 Years | 2,788 (5.8%) | 3,041 (5.9%) |
| 50 to 54 Years | 2,960 (6.1%) | 3,076 (5.9%) |
| 55 to 59 Years | 3,215 (6.7%) | 3,556 (6.9%) |
| 60 to 64 Years | 3,646 (7.5%) | 4,176 (8.1%) |
| 65 to 69 Years | 3,158 (6.5%) | 3,585 (6.9%) |
| 70 to 74 Years | 3,222 (6.7%) | 3,798 (7.3%) |
| 75 to 79 Years | 2,029 (4.2%) | 2,474 (4.8%) |
| 80 to 84 Years | 1,503 (3.1%) | 1,758 (3.4%) |
| 85 Years and over | 980 (2.0%) | 1,538 (3.0%) |
| Total | 48,360 (100.0%) | 51,661 (100.0%) |
Families and Households in Garland County
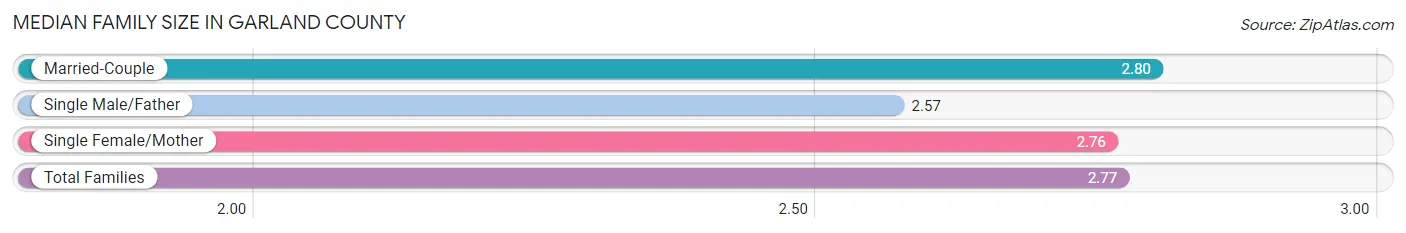
Median Family Size in Garland County
The median family size in Garland County is 2.77 persons per family, with married-couple families (19,209 | 69.2%) accounting for the largest median family size of 2.8 persons per family. On the other hand, single male/father families (2,549 | 9.2%) represent the smallest median family size with 2.57 persons per family.
| Family Type | # Families | Family Size |
| Married-Couple | 19,209 (69.2%) | 2.80 |
| Single Male/Father | 2,549 (9.2%) | 2.57 |
| Single Female/Mother | 6,008 (21.6%) | 2.76 |
| Total Families | 27,766 (100.0%) | 2.77 |
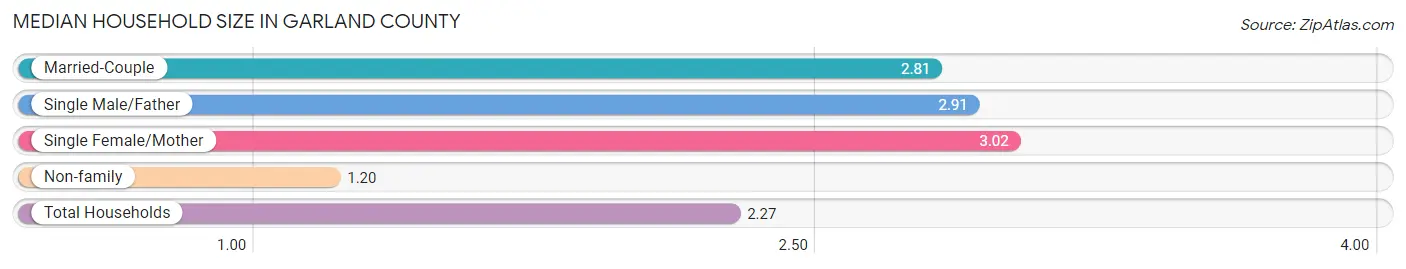
Median Household Size in Garland County
The median household size in Garland County is 2.27 persons per household, with single female/mother households (6,008 | 13.9%) accounting for the largest median household size of 3.02 persons per household. non-family households (15,454 | 35.8%) represent the smallest median household size with 1.20 persons per household.
| Household Type | # Households | Household Size |
| Married-Couple | 19,209 (44.4%) | 2.81 |
| Single Male/Father | 2,549 (5.9%) | 2.91 |
| Single Female/Mother | 6,008 (13.9%) | 3.02 |
| Non-family | 15,454 (35.8%) | 1.20 |
| Total Households | 43,220 (100.0%) | 2.27 |
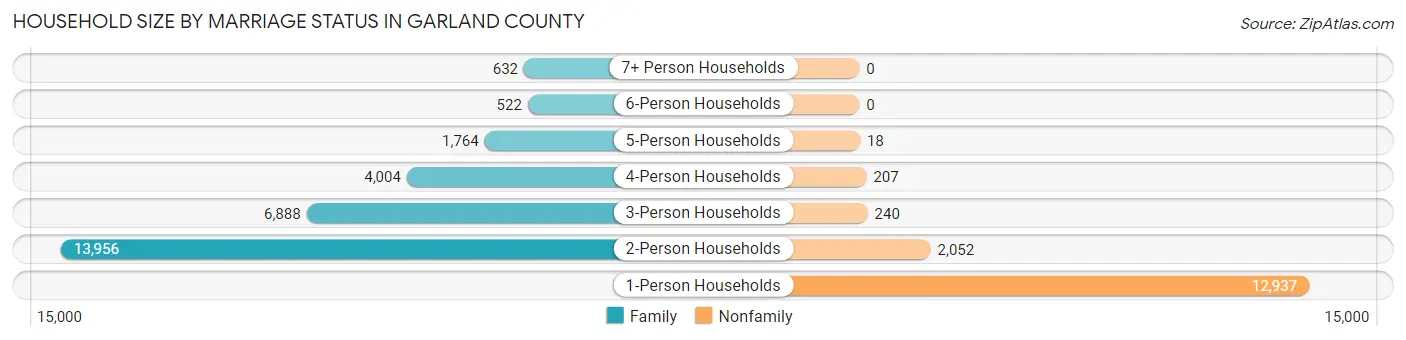
Household Size by Marriage Status in Garland County
Out of a total of 43,220 households in Garland County, 27,766 (64.2%) are family households, while 15,454 (35.8%) are nonfamily households. The most numerous type of family households are 2-person households, comprising 13,956, and the most common type of nonfamily households are 1-person households, comprising 12,937.
| Household Size | Family Households | Nonfamily Households |
| 1-Person Households | - | 12,937 (29.9%) |
| 2-Person Households | 13,956 (32.3%) | 2,052 (4.8%) |
| 3-Person Households | 6,888 (15.9%) | 240 (0.6%) |
| 4-Person Households | 4,004 (9.3%) | 207 (0.5%) |
| 5-Person Households | 1,764 (4.1%) | 18 (0.0%) |
| 6-Person Households | 522 (1.2%) | 0 (0.0%) |
| 7+ Person Households | 632 (1.5%) | 0 (0.0%) |
| Total | 27,766 (64.2%) | 15,454 (35.8%) |
Female Fertility in Garland County
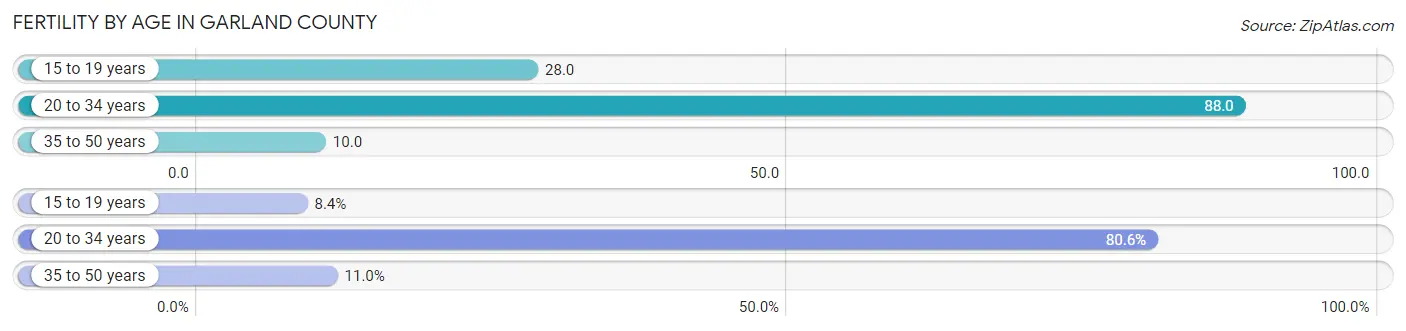
Fertility by Age in Garland County
Average fertility rate in Garland County is 44.0 births per 1,000 women. Women in the age bracket of 20 to 34 years have the highest fertility rate with 88.0 births per 1,000 women. Women in the age bracket of 20 to 34 years acount for 80.6% of all women with births.
| Age Bracket | Women with Births | Births / 1,000 Women |
| 15 to 19 years | 76 (8.4%) | 28.0 |
| 20 to 34 years | 726 (80.6%) | 88.0 |
| 35 to 50 years | 99 (11.0%) | 10.0 |
| Total | 901 (100.0%) | 44.0 |
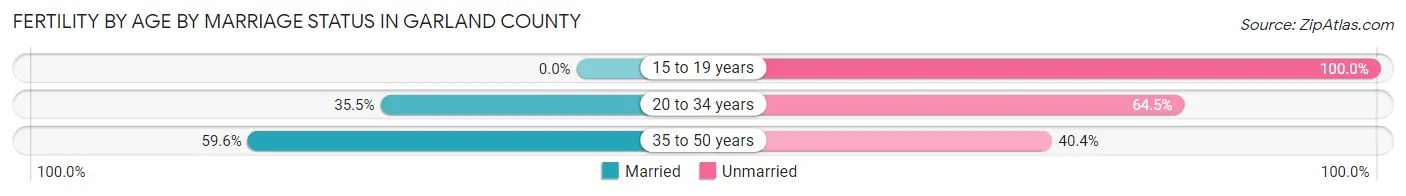
Fertility by Age by Marriage Status in Garland County
35.2% of women with births (901) in Garland County are married. The highest percentage of unmarried women with births falls into 15 to 19 years age bracket with 100.0% of them unmarried at the time of birth, while the lowest percentage of unmarried women with births belong to 35 to 50 years age bracket with 40.4% of them unmarried.
| Age Bracket | Married | Unmarried |
| 15 to 19 years | 0 (0.0%) | 76 (100.0%) |
| 20 to 34 years | 258 (35.5%) | 468 (64.5%) |
| 35 to 50 years | 59 (59.6%) | 40 (40.4%) |
| Total | 317 (35.2%) | 584 (64.8%) |
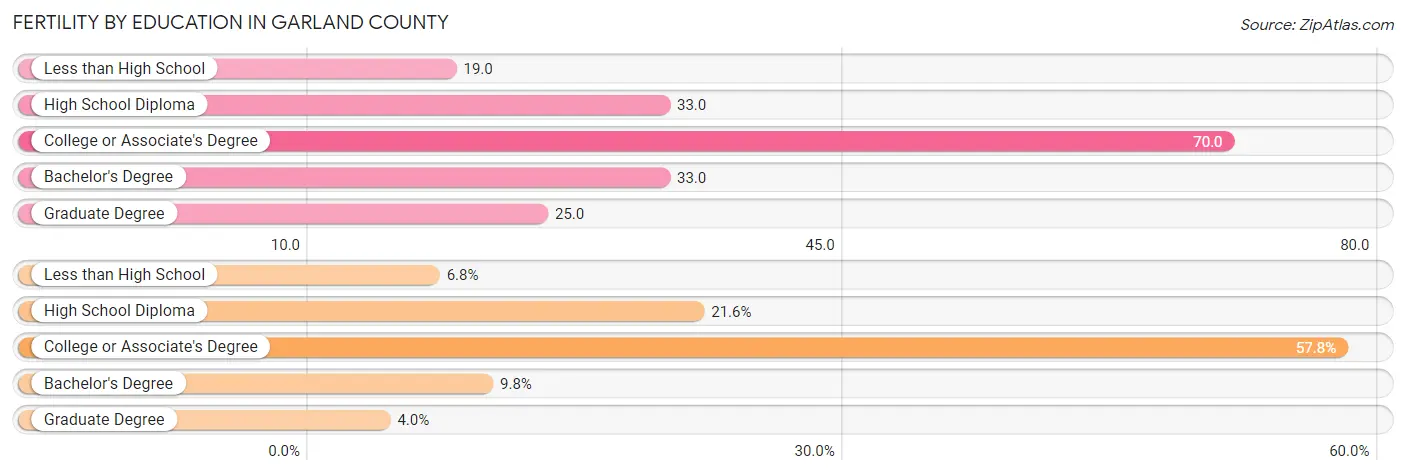
Fertility by Education in Garland County
Average fertility rate in Garland County is 44.0 births per 1,000 women. Women with the education attainment of college or associate's degree have the highest fertility rate of 70.0 births per 1,000 women, while women with the education attainment of less than high school have the lowest fertility at 19.0 births per 1,000 women. Women with the education attainment of college or associate's degree represent 57.8% of all women with births.
| Educational Attainment | Women with Births | Births / 1,000 Women |
| Less than High School | 61 (6.8%) | 19.0 |
| High School Diploma | 195 (21.6%) | 33.0 |
| College or Associate's Degree | 521 (57.8%) | 70.0 |
| Bachelor's Degree | 88 (9.8%) | 33.0 |
| Graduate Degree | 36 (4.0%) | 25.0 |
| Total | 901 (100.0%) | 44.0 |
Fertility by Education by Marriage Status in Garland County
64.8% of women with births in Garland County are unmarried. Women with the educational attainment of graduate degree are most likely to be married with 100.0% of them married at childbirth, while women with the educational attainment of college or associate's degree are least likely to be married with 77.3% of them unmarried at childbirth.
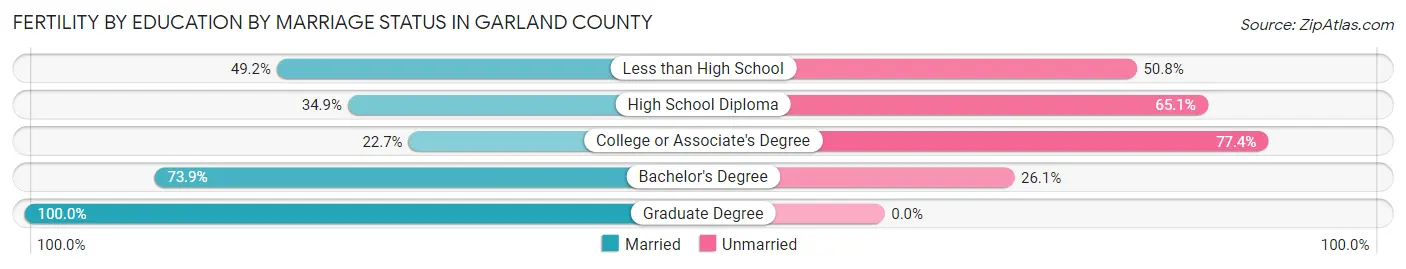
| Educational Attainment | Married | Unmarried |
| Less than High School | 30 (49.2%) | 31 (50.8%) |
| High School Diploma | 68 (34.9%) | 127 (65.1%) |
| College or Associate's Degree | 118 (22.7%) | 403 (77.3%) |
| Bachelor's Degree | 65 (73.9%) | 23 (26.1%) |
| Graduate Degree | 36 (100.0%) | 0 (0.0%) |
| Total | 317 (35.2%) | 584 (64.8%) |
Employment Characteristics in Garland County
Employment by Class of Employer in Garland County
Among the 41,090 employed individuals in Garland County, private company employees (27,946 | 68.0%), not-for-profit organizations (3,181 | 7.7%), and self-employed (not incorporated) (2,574 | 6.3%) make up the most common classes of employment.
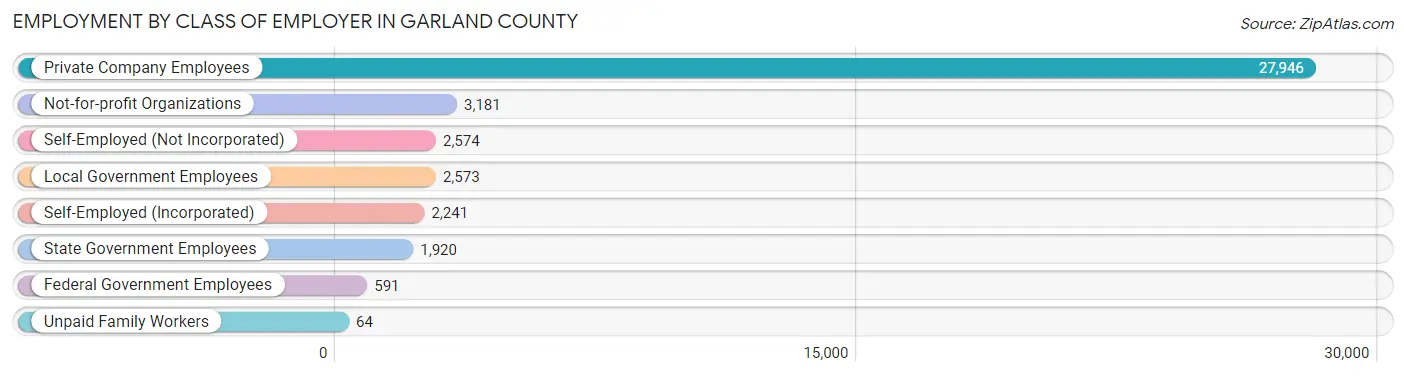
| Employer Class | # Employees | % Employees |
| Private Company Employees | 27,946 | 68.0% |
| Self-Employed (Incorporated) | 2,241 | 5.4% |
| Self-Employed (Not Incorporated) | 2,574 | 6.3% |
| Not-for-profit Organizations | 3,181 | 7.7% |
| Local Government Employees | 2,573 | 6.3% |
| State Government Employees | 1,920 | 4.7% |
| Federal Government Employees | 591 | 1.4% |
| Unpaid Family Workers | 64 | 0.2% |
| Total | 41,090 | 100.0% |
Employment Status by Age in Garland County
According to the labor force statistics for Garland County, out of the total population over 16 years of age (82,799), 54.2% or 44,877 individuals are in the labor force, with 5.7% or 2,558 of them unemployed. The age group with the highest labor force participation rate is 25 to 29 years, with 82.1% or 4,481 individuals in the labor force. Within the labor force, the 16 to 19 years age range has the highest percentage of unemployed individuals, with 14.7% or 299 of them being unemployed.
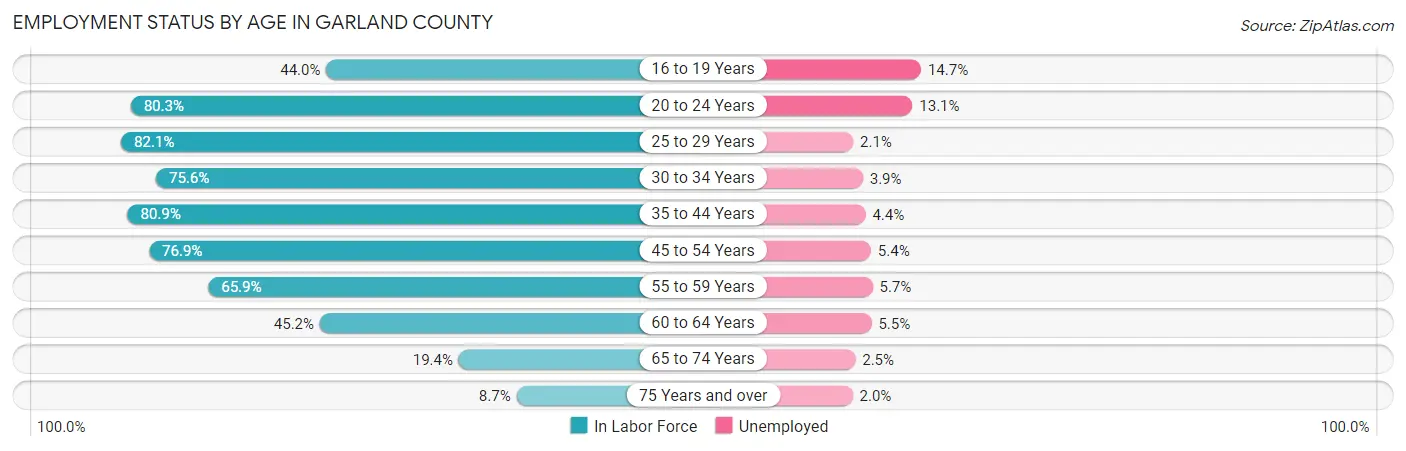
| Age Bracket | In Labor Force | Unemployed |
| 16 to 19 Years | 2,034 (44.0%) | 299 (14.7%) |
| 20 to 24 Years | 4,229 (80.3%) | 554 (13.1%) |
| 25 to 29 Years | 4,481 (82.1%) | 94 (2.1%) |
| 30 to 34 Years | 4,259 (75.6%) | 166 (3.9%) |
| 35 to 44 Years | 9,155 (80.9%) | 403 (4.4%) |
| 45 to 54 Years | 9,124 (76.9%) | 493 (5.4%) |
| 55 to 59 Years | 4,462 (65.9%) | 254 (5.7%) |
| 60 to 64 Years | 3,536 (45.2%) | 194 (5.5%) |
| 65 to 74 Years | 2,670 (19.4%) | 67 (2.5%) |
| 75 Years and over | 895 (8.7%) | 18 (2.0%) |
| Total | 44,877 (54.2%) | 2,558 (5.7%) |
Employment Status by Educational Attainment in Garland County
According to labor force statistics for Garland County, 71.6% of individuals (34,988) out of the total population between 25 and 64 years of age (48,866) are in the labor force, with 4.6% or 1,609 of them being unemployed. The group with the highest labor force participation rate are those with the educational attainment of bachelor's degree or higher, with 76.5% or 9,013 individuals in the labor force. Within the labor force, individuals with high school diploma education have the highest percentage of unemployment, with 5.9% or 603 of them being unemployed.
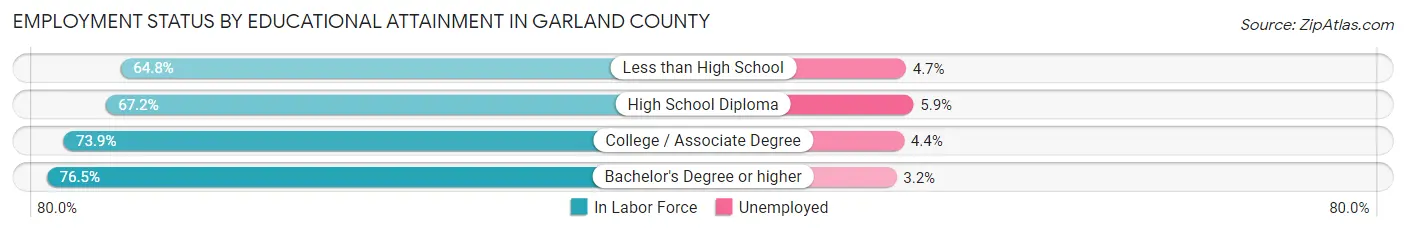
| Educational Attainment | In Labor Force | Unemployed |
| Less than High School | 2,808 (64.8%) | 204 (4.7%) |
| High School Diploma | 10,224 (67.2%) | 898 (5.9%) |
| College / Associate Degree | 12,959 (73.9%) | 772 (4.4%) |
| Bachelor's Degree or higher | 9,013 (76.5%) | 377 (3.2%) |
| Total | 34,988 (71.6%) | 2,248 (4.6%) |
Employment Occupations by Sex in Garland County
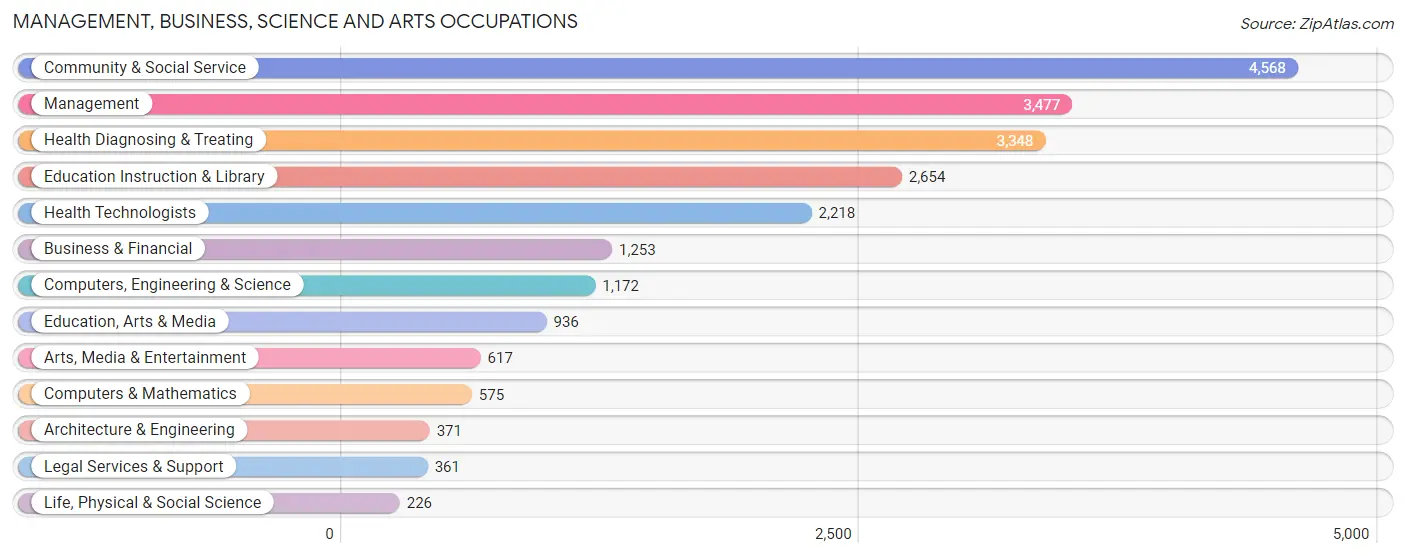
Management, Business, Science and Arts Occupations
The most common Management, Business, Science and Arts occupations in Garland County are Community & Social Service (4,568 | 10.8%), Management (3,477 | 8.2%), Health Diagnosing & Treating (3,348 | 7.9%), Education Instruction & Library (2,654 | 6.3%), and Health Technologists (2,218 | 5.2%).
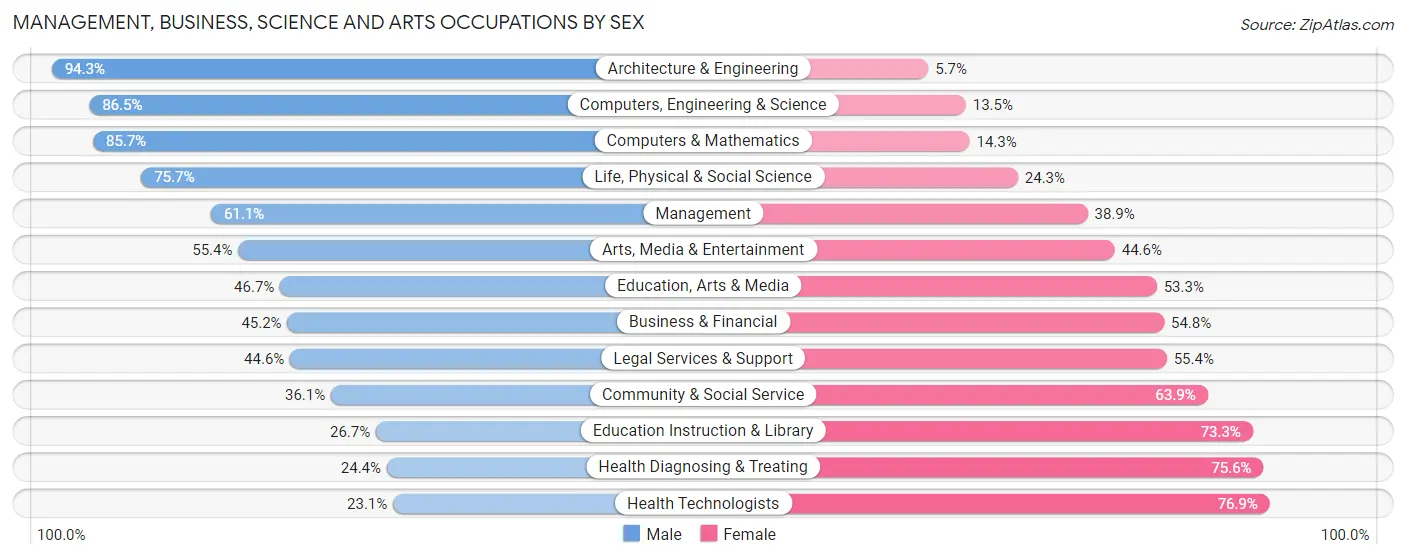
Management, Business, Science and Arts Occupations by Sex
Within the Management, Business, Science and Arts occupations in Garland County, the most male-oriented occupations are Architecture & Engineering (94.3%), Computers, Engineering & Science (86.5%), and Computers & Mathematics (85.7%), while the most female-oriented occupations are Health Technologists (76.9%), Health Diagnosing & Treating (75.6%), and Education Instruction & Library (73.3%).
| Occupation | Male | Female |
| Management | 2,125 (61.1%) | 1,352 (38.9%) |
| Business & Financial | 566 (45.2%) | 687 (54.8%) |
| Computers, Engineering & Science | 1,014 (86.5%) | 158 (13.5%) |
| Computers & Mathematics | 493 (85.7%) | 82 (14.3%) |
| Architecture & Engineering | 350 (94.3%) | 21 (5.7%) |
| Life, Physical & Social Science | 171 (75.7%) | 55 (24.3%) |
| Community & Social Service | 1,648 (36.1%) | 2,920 (63.9%) |
| Education, Arts & Media | 437 (46.7%) | 499 (53.3%) |
| Legal Services & Support | 161 (44.6%) | 200 (55.4%) |
| Education Instruction & Library | 708 (26.7%) | 1,946 (73.3%) |
| Arts, Media & Entertainment | 342 (55.4%) | 275 (44.6%) |
| Health Diagnosing & Treating | 818 (24.4%) | 2,530 (75.6%) |
| Health Technologists | 513 (23.1%) | 1,705 (76.9%) |
| Total (Category) | 6,171 (44.7%) | 7,647 (55.3%) |
| Total (Overall) | 21,427 (50.7%) | 20,869 (49.3%) |
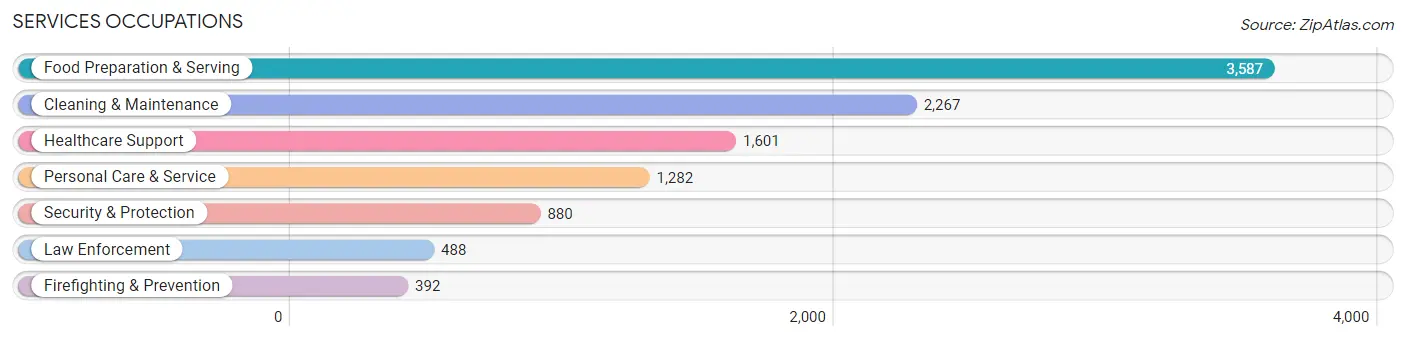
Services Occupations
The most common Services occupations in Garland County are Food Preparation & Serving (3,587 | 8.5%), Cleaning & Maintenance (2,267 | 5.4%), Healthcare Support (1,601 | 3.8%), Personal Care & Service (1,282 | 3.0%), and Security & Protection (880 | 2.1%).
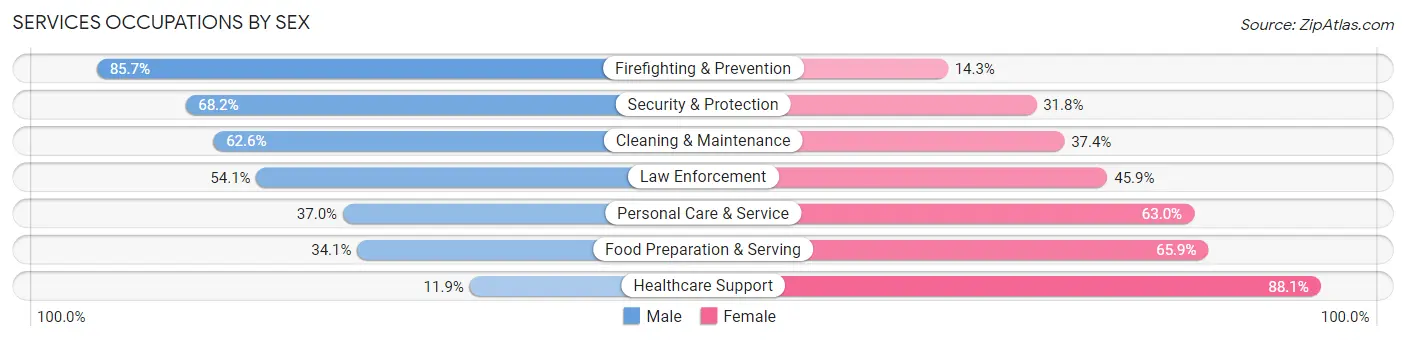
Services Occupations by Sex
Within the Services occupations in Garland County, the most male-oriented occupations are Firefighting & Prevention (85.7%), Security & Protection (68.2%), and Cleaning & Maintenance (62.6%), while the most female-oriented occupations are Healthcare Support (88.1%), Food Preparation & Serving (65.9%), and Personal Care & Service (63.0%).
| Occupation | Male | Female |
| Healthcare Support | 190 (11.9%) | 1,411 (88.1%) |
| Security & Protection | 600 (68.2%) | 280 (31.8%) |
| Firefighting & Prevention | 336 (85.7%) | 56 (14.3%) |
| Law Enforcement | 264 (54.1%) | 224 (45.9%) |
| Food Preparation & Serving | 1,224 (34.1%) | 2,363 (65.9%) |
| Cleaning & Maintenance | 1,420 (62.6%) | 847 (37.4%) |
| Personal Care & Service | 474 (37.0%) | 808 (63.0%) |
| Total (Category) | 3,908 (40.6%) | 5,709 (59.4%) |
| Total (Overall) | 21,427 (50.7%) | 20,869 (49.3%) |
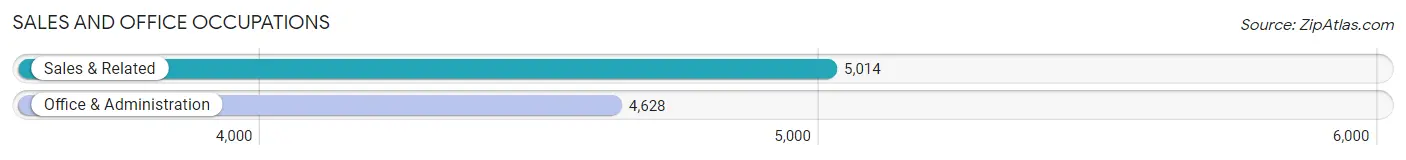
Sales and Office Occupations
The most common Sales and Office occupations in Garland County are Sales & Related (5,014 | 11.8%), and Office & Administration (4,628 | 10.9%).
Sales and Office Occupations by Sex
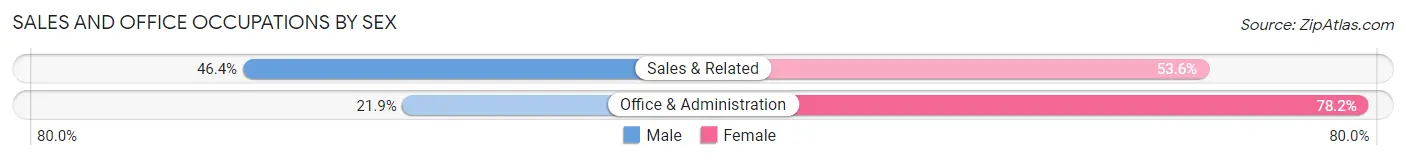
| Occupation | Male | Female |
| Sales & Related | 2,327 (46.4%) | 2,687 (53.6%) |
| Office & Administration | 1,011 (21.8%) | 3,617 (78.1%) |
| Total (Category) | 3,338 (34.6%) | 6,304 (65.4%) |
| Total (Overall) | 21,427 (50.7%) | 20,869 (49.3%) |
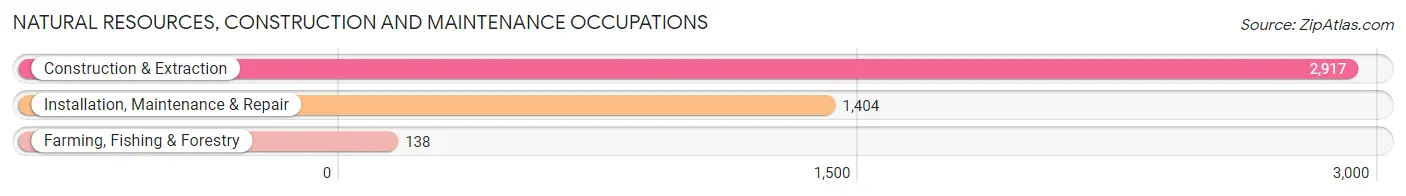
Natural Resources, Construction and Maintenance Occupations
The most common Natural Resources, Construction and Maintenance occupations in Garland County are Construction & Extraction (2,917 | 6.9%), Installation, Maintenance & Repair (1,404 | 3.3%), and Farming, Fishing & Forestry (138 | 0.3%).
Natural Resources, Construction and Maintenance Occupations by Sex
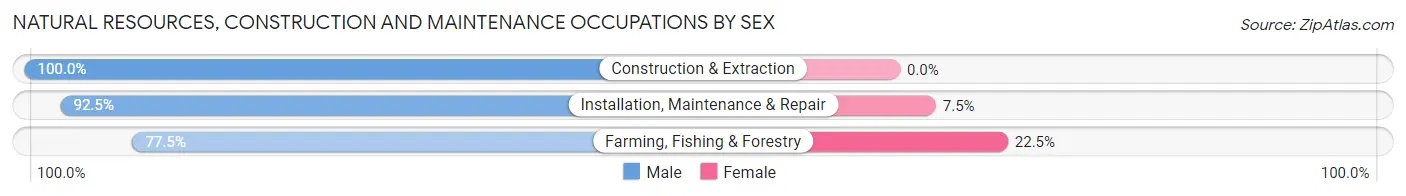
| Occupation | Male | Female |
| Farming, Fishing & Forestry | 107 (77.5%) | 31 (22.5%) |
| Construction & Extraction | 2,917 (100.0%) | 0 (0.0%) |
| Installation, Maintenance & Repair | 1,299 (92.5%) | 105 (7.5%) |
| Total (Category) | 4,323 (97.0%) | 136 (3.0%) |
| Total (Overall) | 21,427 (50.7%) | 20,869 (49.3%) |
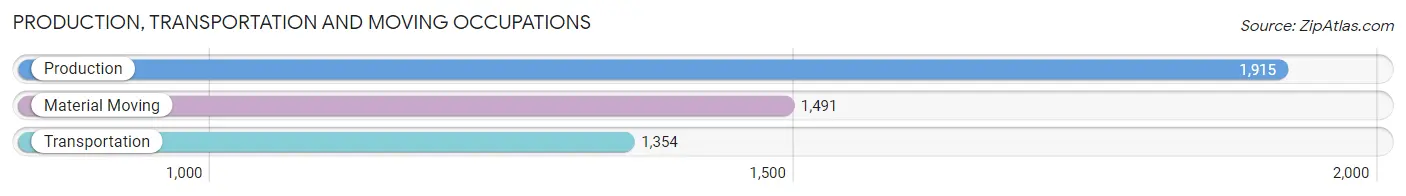
Production, Transportation and Moving Occupations
The most common Production, Transportation and Moving occupations in Garland County are Production (1,915 | 4.5%), Material Moving (1,491 | 3.5%), and Transportation (1,354 | 3.2%).
Production, Transportation and Moving Occupations by Sex
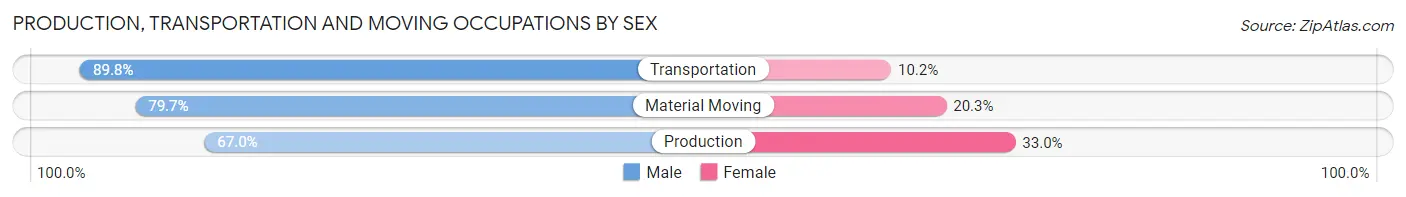
| Occupation | Male | Female |
| Production | 1,283 (67.0%) | 632 (33.0%) |
| Transportation | 1,216 (89.8%) | 138 (10.2%) |
| Material Moving | 1,188 (79.7%) | 303 (20.3%) |
| Total (Category) | 3,687 (77.5%) | 1,073 (22.5%) |
| Total (Overall) | 21,427 (50.7%) | 20,869 (49.3%) |
Employment Industries by Sex in Garland County
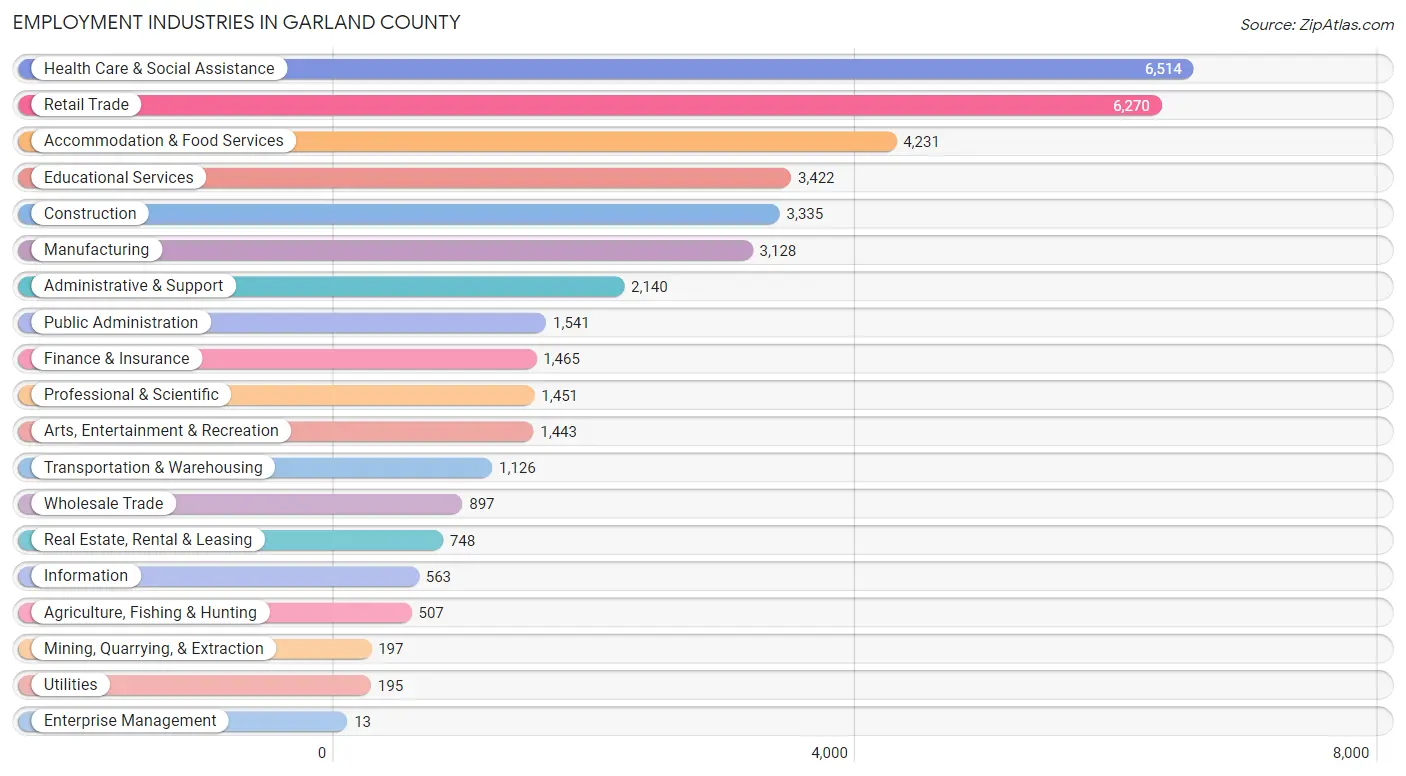
Employment Industries in Garland County
The major employment industries in Garland County include Health Care & Social Assistance (6,514 | 15.4%), Retail Trade (6,270 | 14.8%), Accommodation & Food Services (4,231 | 10.0%), Educational Services (3,422 | 8.1%), and Construction (3,335 | 7.9%).
Employment Industries by Sex in Garland County
The Garland County industries that see more men than women are Mining, Quarrying, & Extraction (100.0%), Construction (93.5%), and Agriculture, Fishing & Hunting (89.9%), whereas the industries that tend to have a higher number of women are Enterprise Management (100.0%), Health Care & Social Assistance (80.4%), and Educational Services (67.2%).

| Industry | Male | Female |
| Agriculture, Fishing & Hunting | 456 (89.9%) | 51 (10.1%) |
| Mining, Quarrying, & Extraction | 197 (100.0%) | 0 (0.0%) |
| Construction | 3,117 (93.5%) | 218 (6.5%) |
| Manufacturing | 2,068 (66.1%) | 1,060 (33.9%) |
| Wholesale Trade | 690 (76.9%) | 207 (23.1%) |
| Retail Trade | 2,809 (44.8%) | 3,461 (55.2%) |
| Transportation & Warehousing | 914 (81.2%) | 212 (18.8%) |
| Utilities | 151 (77.4%) | 44 (22.6%) |
| Information | 376 (66.8%) | 187 (33.2%) |
| Finance & Insurance | 503 (34.3%) | 962 (65.7%) |
| Real Estate, Rental & Leasing | 322 (43.0%) | 426 (57.0%) |
| Professional & Scientific | 849 (58.5%) | 602 (41.5%) |
| Enterprise Management | 0 (0.0%) | 13 (100.0%) |
| Administrative & Support | 1,501 (70.1%) | 639 (29.9%) |
| Educational Services | 1,122 (32.8%) | 2,300 (67.2%) |
| Health Care & Social Assistance | 1,278 (19.6%) | 5,236 (80.4%) |
| Arts, Entertainment & Recreation | 963 (66.7%) | 480 (33.3%) |
| Accommodation & Food Services | 1,587 (37.5%) | 2,644 (62.5%) |
| Public Administration | 732 (47.5%) | 809 (52.5%) |
| Total | 21,427 (50.7%) | 20,869 (49.3%) |
Education in Garland County
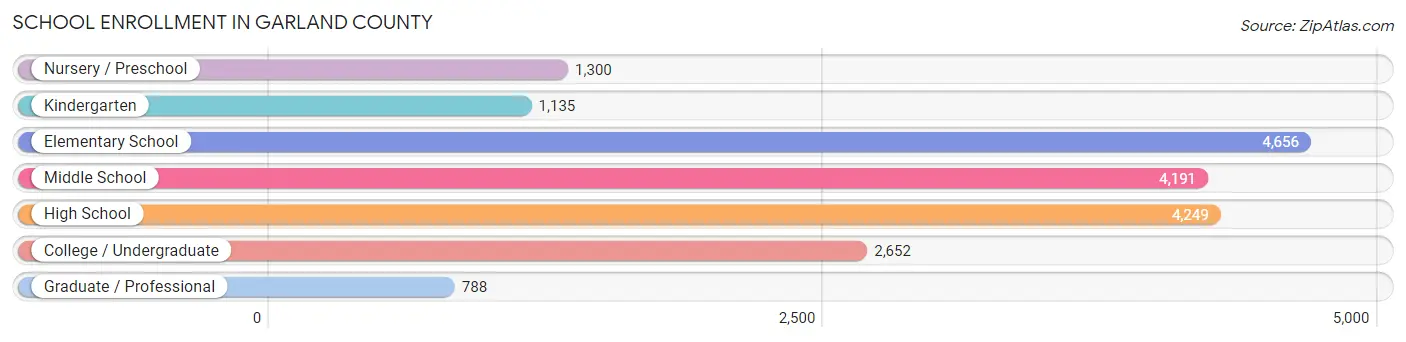
School Enrollment in Garland County
The most common levels of schooling among the 18,971 students in Garland County are elementary school (4,656 | 24.5%), high school (4,249 | 22.4%), and middle school (4,191 | 22.1%).
| School Level | # Students | % Students |
| Nursery / Preschool | 1,300 | 6.9% |
| Kindergarten | 1,135 | 6.0% |
| Elementary School | 4,656 | 24.5% |
| Middle School | 4,191 | 22.1% |
| High School | 4,249 | 22.4% |
| College / Undergraduate | 2,652 | 14.0% |
| Graduate / Professional | 788 | 4.2% |
| Total | 18,971 | 100.0% |
School Enrollment by Age by Funding Source in Garland County
Out of a total of 18,971 students who are enrolled in schools in Garland County, 2,125 (11.2%) attend a private institution, while the remaining 16,846 (88.8%) are enrolled in public schools. The age group of 25 to 34 year olds has the highest likelihood of being enrolled in private schools, with 163 (22.7% in the age bracket) enrolled. Conversely, the age group of 10 to 14 year olds has the lowest likelihood of being enrolled in a private school, with 4,779 (96.1% in the age bracket) attending a public institution.
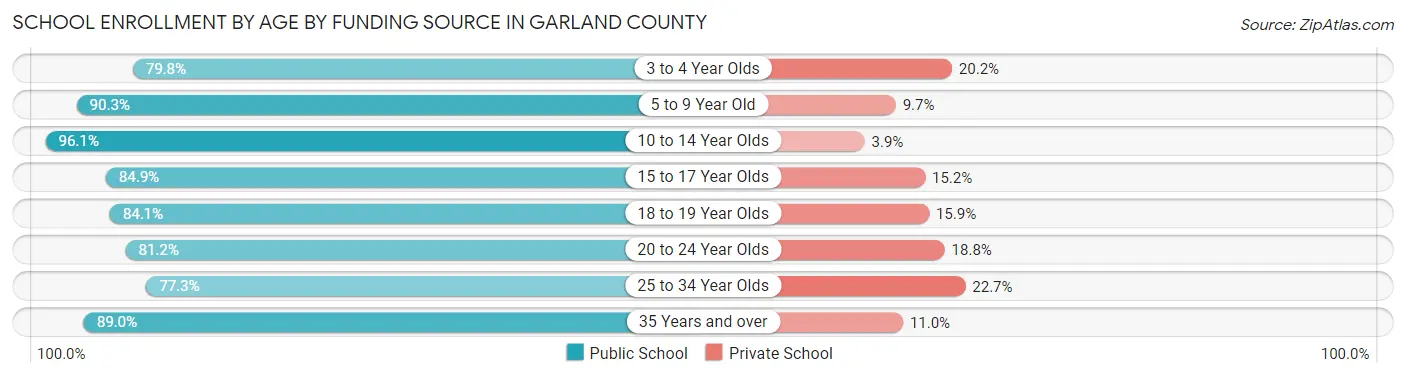
| Age Bracket | Public School | Private School |
| 3 to 4 Year Olds | 717 (79.8%) | 181 (20.2%) |
| 5 to 9 Year Old | 5,017 (90.3%) | 539 (9.7%) |
| 10 to 14 Year Olds | 4,779 (96.1%) | 194 (3.9%) |
| 15 to 17 Year Olds | 2,861 (84.9%) | 511 (15.1%) |
| 18 to 19 Year Olds | 863 (84.1%) | 163 (15.9%) |
| 20 to 24 Year Olds | 1,066 (81.2%) | 247 (18.8%) |
| 25 to 34 Year Olds | 556 (77.3%) | 163 (22.7%) |
| 35 Years and over | 991 (89.0%) | 123 (11.0%) |
| Total | 16,846 (88.8%) | 2,125 (11.2%) |
Educational Attainment by Field of Study in Garland County
Education (4,625 | 23.5%), business (3,700 | 18.8%), science & technology (2,374 | 12.1%), social sciences (1,356 | 6.9%), and liberal arts & history (1,048 | 5.3%) are the most common fields of study among 19,662 individuals in Garland County who have obtained a bachelor's degree or higher.
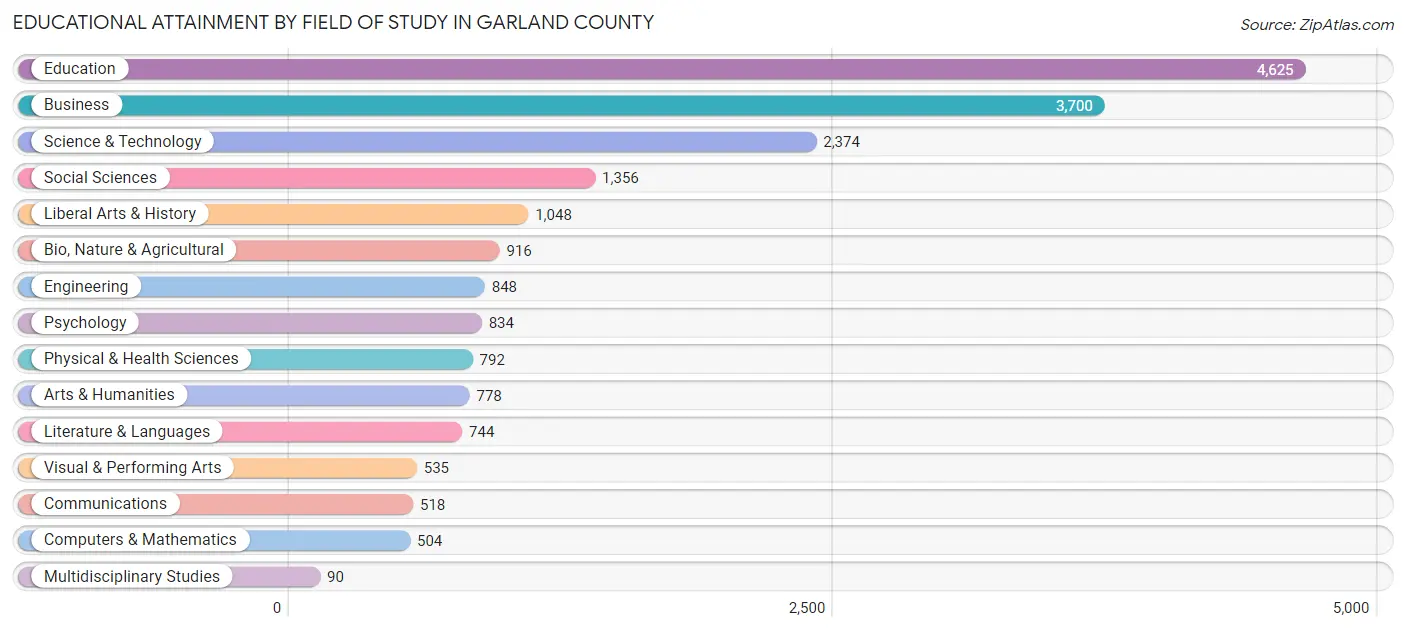
| Field of Study | # Graduates | % Graduates |
| Computers & Mathematics | 504 | 2.6% |
| Bio, Nature & Agricultural | 916 | 4.7% |
| Physical & Health Sciences | 792 | 4.0% |
| Psychology | 834 | 4.2% |
| Social Sciences | 1,356 | 6.9% |
| Engineering | 848 | 4.3% |
| Multidisciplinary Studies | 90 | 0.5% |
| Science & Technology | 2,374 | 12.1% |
| Business | 3,700 | 18.8% |
| Education | 4,625 | 23.5% |
| Literature & Languages | 744 | 3.8% |
| Liberal Arts & History | 1,048 | 5.3% |
| Visual & Performing Arts | 535 | 2.7% |
| Communications | 518 | 2.6% |
| Arts & Humanities | 778 | 4.0% |
| Total | 19,662 | 100.0% |
Transportation & Commute in Garland County
Vehicle Availability by Sex in Garland County
The most prevalent vehicle ownership categories in Garland County are males with 2 vehicles (8,692, accounting for 41.8%) and females with 2 vehicles (8,375, making up 43.3%).
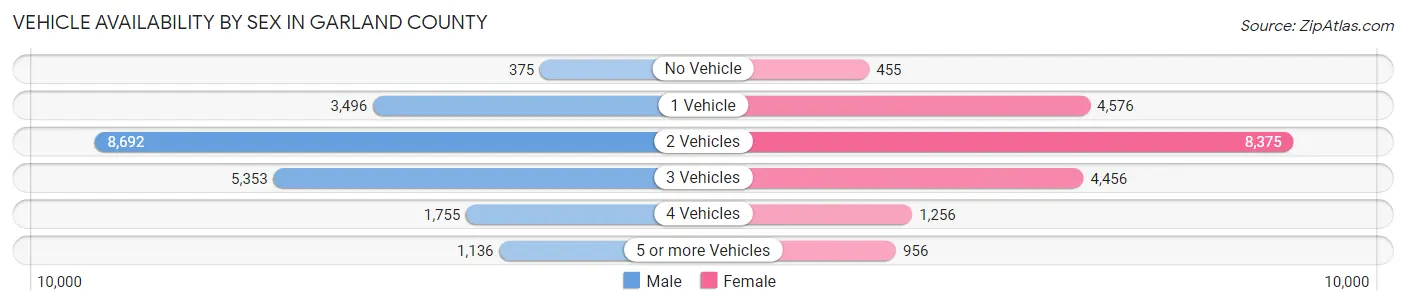
| Vehicles Available | Male | Female |
| No Vehicle | 375 (1.8%) | 455 (2.3%) |
| 1 Vehicle | 3,496 (16.8%) | 4,576 (22.8%) |
| 2 Vehicles | 8,692 (41.8%) | 8,375 (41.7%) |
| 3 Vehicles | 5,353 (25.7%) | 4,456 (22.2%) |
| 4 Vehicles | 1,755 (8.4%) | 1,256 (6.3%) |
| 5 or more Vehicles | 1,136 (5.5%) | 956 (4.8%) |
| Total | 20,807 (100.0%) | 20,074 (100.0%) |
Commute Time in Garland County
The most frequently occuring commute durations in Garland County are 15 to 19 minutes (8,344 commuters, 21.5%), 10 to 14 minutes (6,936 commuters, 17.8%), and 5 to 9 minutes (5,591 commuters, 14.4%).
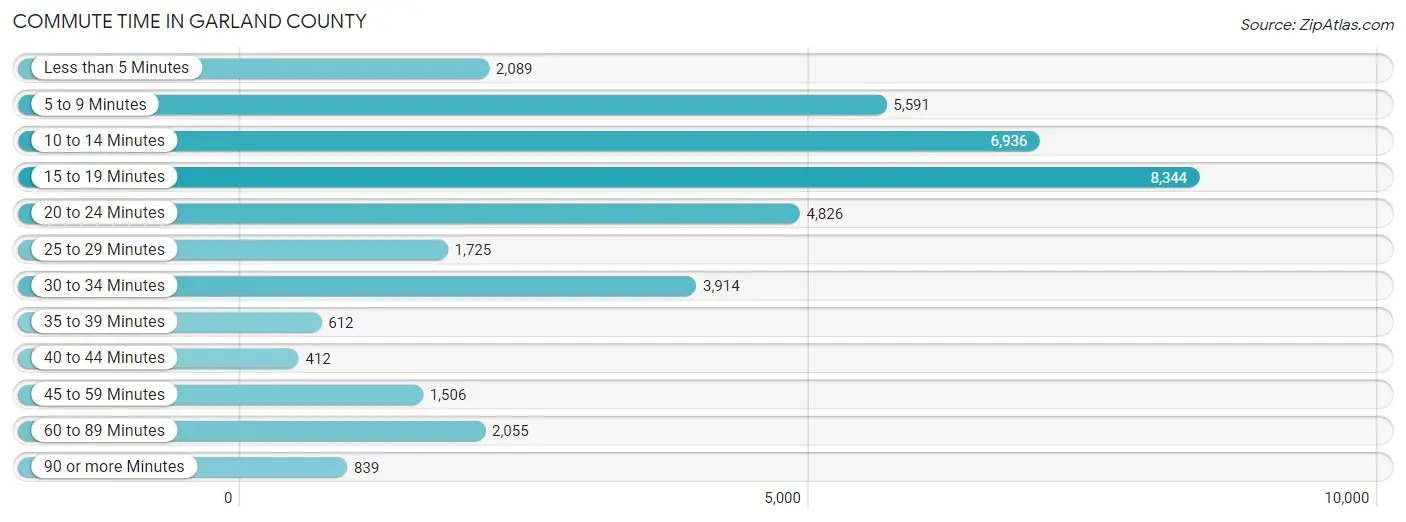
| Commute Time | # Commuters | % Commuters |
| Less than 5 Minutes | 2,089 | 5.4% |
| 5 to 9 Minutes | 5,591 | 14.4% |
| 10 to 14 Minutes | 6,936 | 17.8% |
| 15 to 19 Minutes | 8,344 | 21.5% |
| 20 to 24 Minutes | 4,826 | 12.4% |
| 25 to 29 Minutes | 1,725 | 4.4% |
| 30 to 34 Minutes | 3,914 | 10.1% |
| 35 to 39 Minutes | 612 | 1.6% |
| 40 to 44 Minutes | 412 | 1.1% |
| 45 to 59 Minutes | 1,506 | 3.9% |
| 60 to 89 Minutes | 2,055 | 5.3% |
| 90 or more Minutes | 839 | 2.2% |
Commute Time by Sex in Garland County
The most common commute times in Garland County are 15 to 19 minutes (4,177 commuters, 21.0%) for males and 15 to 19 minutes (4,167 commuters, 22.0%) for females.
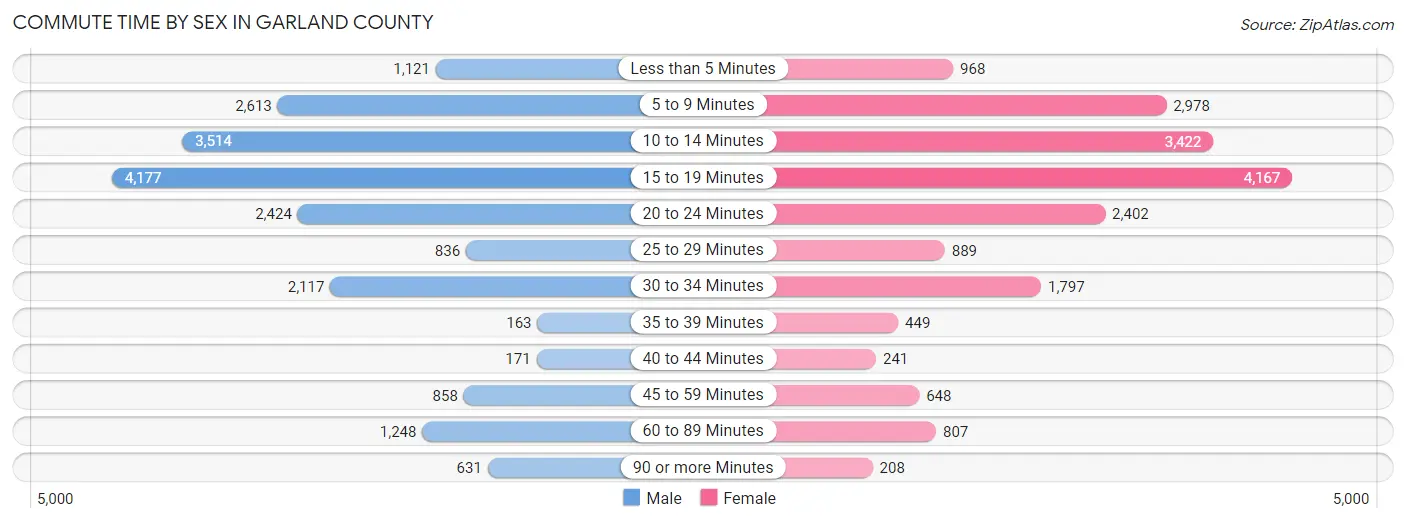
| Commute Time | Male | Female |
| Less than 5 Minutes | 1,121 (5.6%) | 968 (5.1%) |
| 5 to 9 Minutes | 2,613 (13.2%) | 2,978 (15.7%) |
| 10 to 14 Minutes | 3,514 (17.7%) | 3,422 (18.0%) |
| 15 to 19 Minutes | 4,177 (21.0%) | 4,167 (22.0%) |
| 20 to 24 Minutes | 2,424 (12.2%) | 2,402 (12.7%) |
| 25 to 29 Minutes | 836 (4.2%) | 889 (4.7%) |
| 30 to 34 Minutes | 2,117 (10.6%) | 1,797 (9.5%) |
| 35 to 39 Minutes | 163 (0.8%) | 449 (2.4%) |
| 40 to 44 Minutes | 171 (0.9%) | 241 (1.3%) |
| 45 to 59 Minutes | 858 (4.3%) | 648 (3.4%) |
| 60 to 89 Minutes | 1,248 (6.3%) | 807 (4.3%) |
| 90 or more Minutes | 631 (3.2%) | 208 (1.1%) |
Time of Departure to Work by Sex in Garland County
The most frequent times of departure to work in Garland County are 7:00 AM to 7:29 AM (3,105, 15.6%) for males and 7:30 AM to 7:59 AM (3,406, 17.9%) for females.
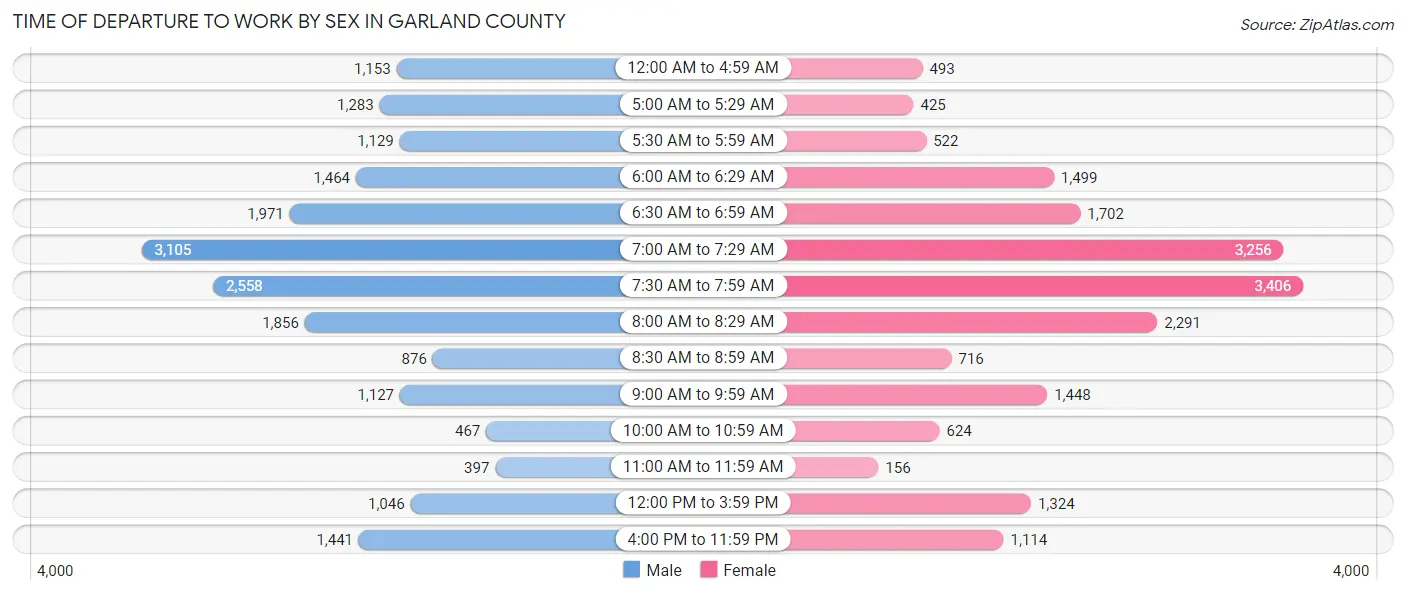
| Time of Departure | Male | Female |
| 12:00 AM to 4:59 AM | 1,153 (5.8%) | 493 (2.6%) |
| 5:00 AM to 5:29 AM | 1,283 (6.5%) | 425 (2.2%) |
| 5:30 AM to 5:59 AM | 1,129 (5.7%) | 522 (2.8%) |
| 6:00 AM to 6:29 AM | 1,464 (7.4%) | 1,499 (7.9%) |
| 6:30 AM to 6:59 AM | 1,971 (9.9%) | 1,702 (9.0%) |
| 7:00 AM to 7:29 AM | 3,105 (15.6%) | 3,256 (17.2%) |
| 7:30 AM to 7:59 AM | 2,558 (12.9%) | 3,406 (17.9%) |
| 8:00 AM to 8:29 AM | 1,856 (9.3%) | 2,291 (12.1%) |
| 8:30 AM to 8:59 AM | 876 (4.4%) | 716 (3.8%) |
| 9:00 AM to 9:59 AM | 1,127 (5.7%) | 1,448 (7.6%) |
| 10:00 AM to 10:59 AM | 467 (2.4%) | 624 (3.3%) |
| 11:00 AM to 11:59 AM | 397 (2.0%) | 156 (0.8%) |
| 12:00 PM to 3:59 PM | 1,046 (5.3%) | 1,324 (7.0%) |
| 4:00 PM to 11:59 PM | 1,441 (7.2%) | 1,114 (5.9%) |
| Total | 19,873 (100.0%) | 18,976 (100.0%) |
Housing Occupancy in Garland County
Occupancy by Ownership in Garland County
Of the total 43,220 dwellings in Garland County, owner-occupied units account for 29,509 (68.3%), while renter-occupied units make up 13,711 (31.7%).
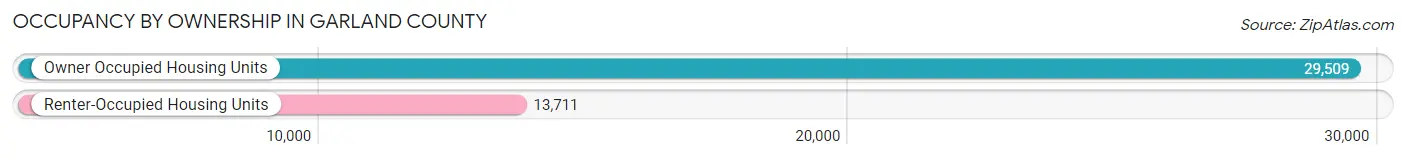
| Occupancy | # Housing Units | % Housing Units |
| Owner Occupied Housing Units | 29,509 | 68.3% |
| Renter-Occupied Housing Units | 13,711 | 31.7% |
| Total Occupied Housing Units | 43,220 | 100.0% |
Occupancy by Household Size in Garland County
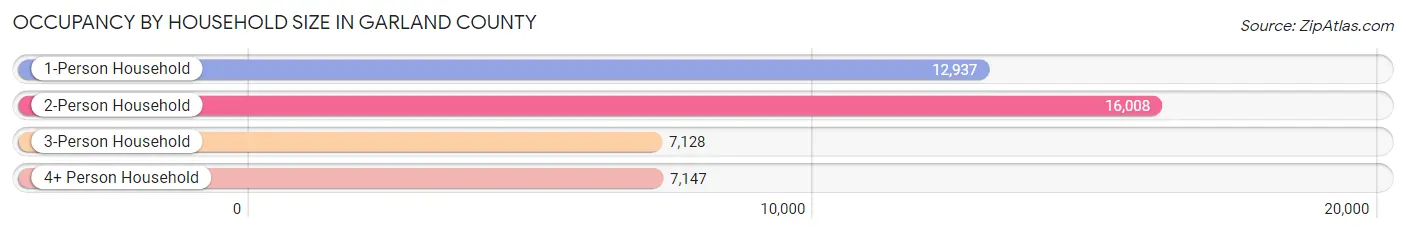
| Household Size | # Housing Units | % Housing Units |
| 1-Person Household | 12,937 | 29.9% |
| 2-Person Household | 16,008 | 37.0% |
| 3-Person Household | 7,128 | 16.5% |
| 4+ Person Household | 7,147 | 16.5% |
| Total Housing Units | 43,220 | 100.0% |
Occupancy by Ownership by Household Size in Garland County
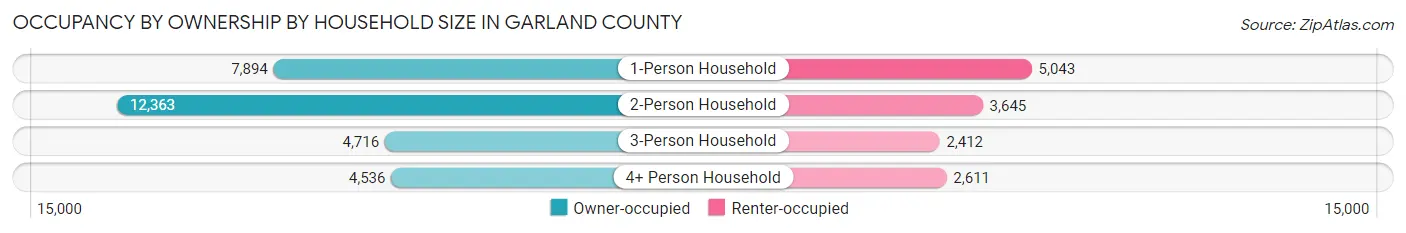
| Household Size | Owner-occupied | Renter-occupied |
| 1-Person Household | 7,894 (61.0%) | 5,043 (39.0%) |
| 2-Person Household | 12,363 (77.2%) | 3,645 (22.8%) |
| 3-Person Household | 4,716 (66.2%) | 2,412 (33.8%) |
| 4+ Person Household | 4,536 (63.5%) | 2,611 (36.5%) |
| Total Housing Units | 29,509 (68.3%) | 13,711 (31.7%) |
Occupancy by Educational Attainment in Garland County
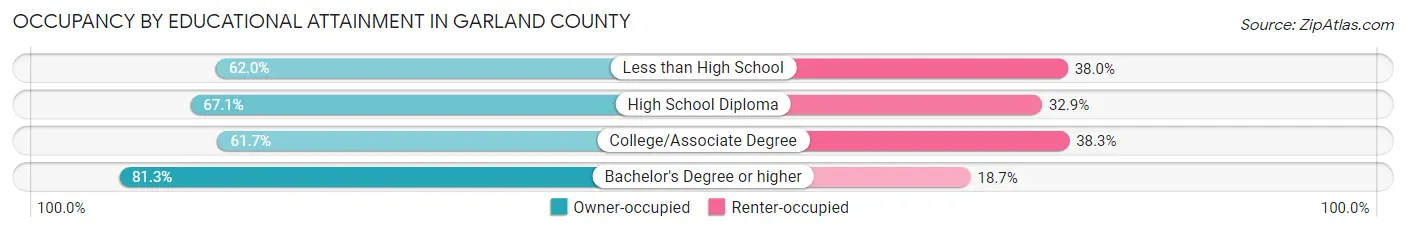
| Household Size | Owner-occupied | Renter-occupied |
| Less than High School | 2,306 (62.0%) | 1,412 (38.0%) |
| High School Diploma | 7,501 (67.1%) | 3,675 (32.9%) |
| College/Associate Degree | 10,485 (61.7%) | 6,502 (38.3%) |
| Bachelor's Degree or higher | 9,217 (81.3%) | 2,122 (18.7%) |
Occupancy by Age of Householder in Garland County
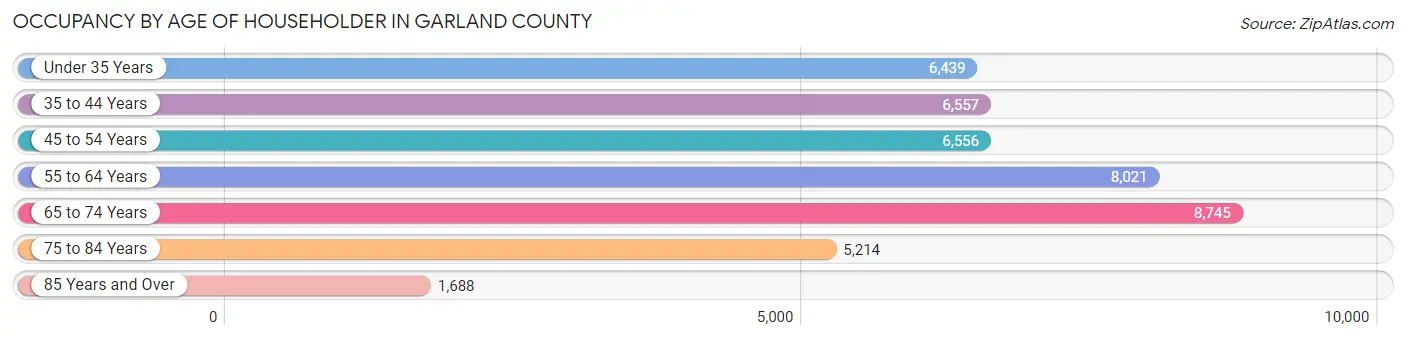
| Age Bracket | # Households | % Households |
| Under 35 Years | 6,439 | 14.9% |
| 35 to 44 Years | 6,557 | 15.2% |
| 45 to 54 Years | 6,556 | 15.2% |
| 55 to 64 Years | 8,021 | 18.6% |
| 65 to 74 Years | 8,745 | 20.2% |
| 75 to 84 Years | 5,214 | 12.1% |
| 85 Years and Over | 1,688 | 3.9% |
| Total | 43,220 | 100.0% |
Housing Finances in Garland County
Median Income by Occupancy in Garland County
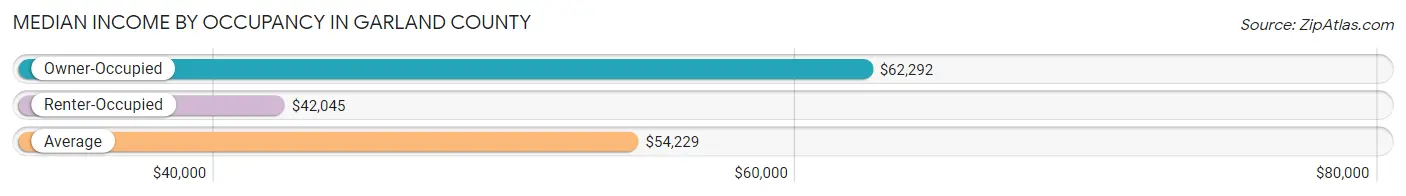
| Occupancy Type | # Households | Median Income |
| Owner-Occupied | 29,509 (68.3%) | $62,292 |
| Renter-Occupied | 13,711 (31.7%) | $42,045 |
| Average | 43,220 (100.0%) | $54,229 |
Occupancy by Householder Income Bracket in Garland County
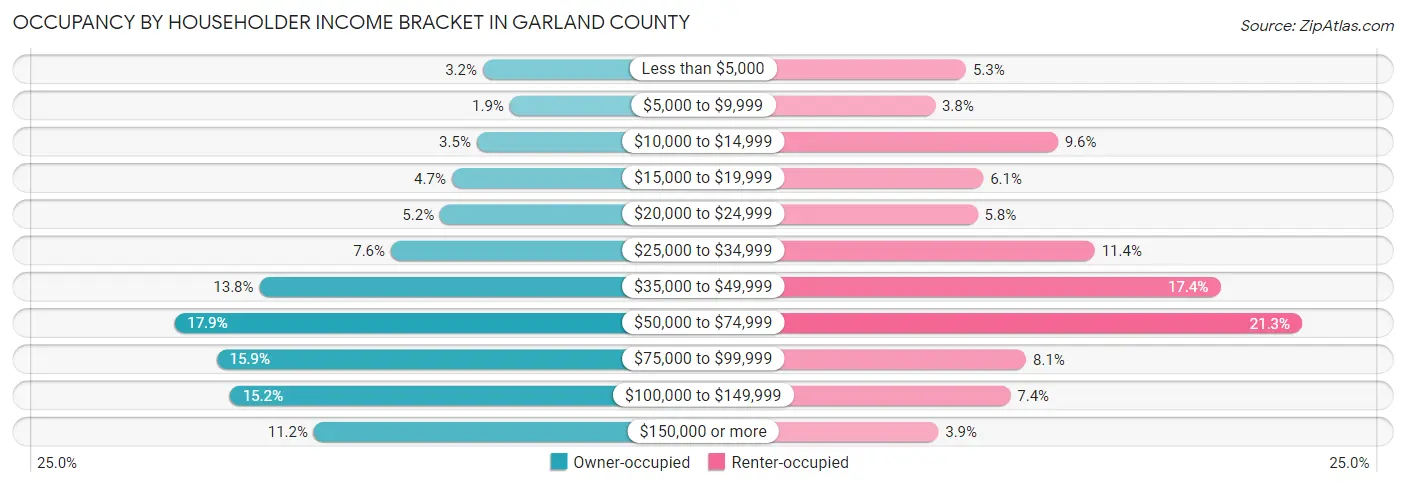
| Income Bracket | Owner-occupied | Renter-occupied |
| Less than $5,000 | 938 (3.2%) | 721 (5.3%) |
| $5,000 to $9,999 | 562 (1.9%) | 518 (3.8%) |
| $10,000 to $14,999 | 1,023 (3.5%) | 1,321 (9.6%) |
| $15,000 to $19,999 | 1,374 (4.7%) | 834 (6.1%) |
| $20,000 to $24,999 | 1,541 (5.2%) | 797 (5.8%) |
| $25,000 to $34,999 | 2,232 (7.6%) | 1,562 (11.4%) |
| $35,000 to $49,999 | 4,078 (13.8%) | 2,380 (17.4%) |
| $50,000 to $74,999 | 5,274 (17.9%) | 2,913 (21.2%) |
| $75,000 to $99,999 | 4,680 (15.9%) | 1,114 (8.1%) |
| $100,000 to $149,999 | 4,493 (15.2%) | 1,011 (7.4%) |
| $150,000 or more | 3,314 (11.2%) | 540 (3.9%) |
| Total | 29,509 (100.0%) | 13,711 (100.0%) |
Monthly Housing Cost Tiers in Garland County
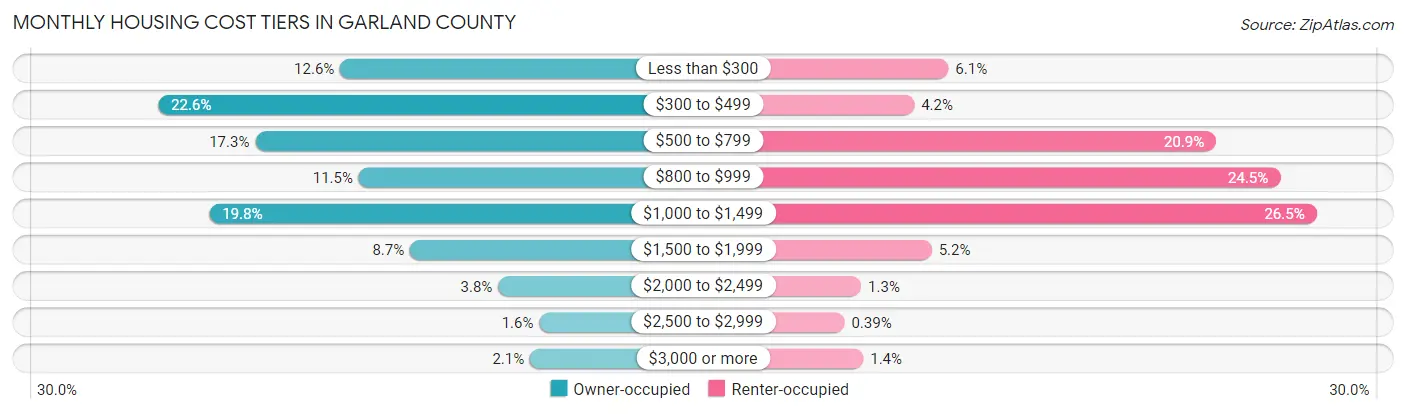
| Monthly Cost | Owner-occupied | Renter-occupied |
| Less than $300 | 3,710 (12.6%) | 840 (6.1%) |
| $300 to $499 | 6,679 (22.6%) | 582 (4.2%) |
| $500 to $799 | 5,092 (17.3%) | 2,867 (20.9%) |
| $800 to $999 | 3,406 (11.5%) | 3,352 (24.4%) |
| $1,000 to $1,499 | 5,844 (19.8%) | 3,628 (26.5%) |
| $1,500 to $1,999 | 2,569 (8.7%) | 715 (5.2%) |
| $2,000 to $2,499 | 1,132 (3.8%) | 179 (1.3%) |
| $2,500 to $2,999 | 462 (1.6%) | 53 (0.4%) |
| $3,000 or more | 615 (2.1%) | 196 (1.4%) |
| Total | 29,509 (100.0%) | 13,711 (100.0%) |
Physical Housing Characteristics in Garland County
Housing Structures in Garland County
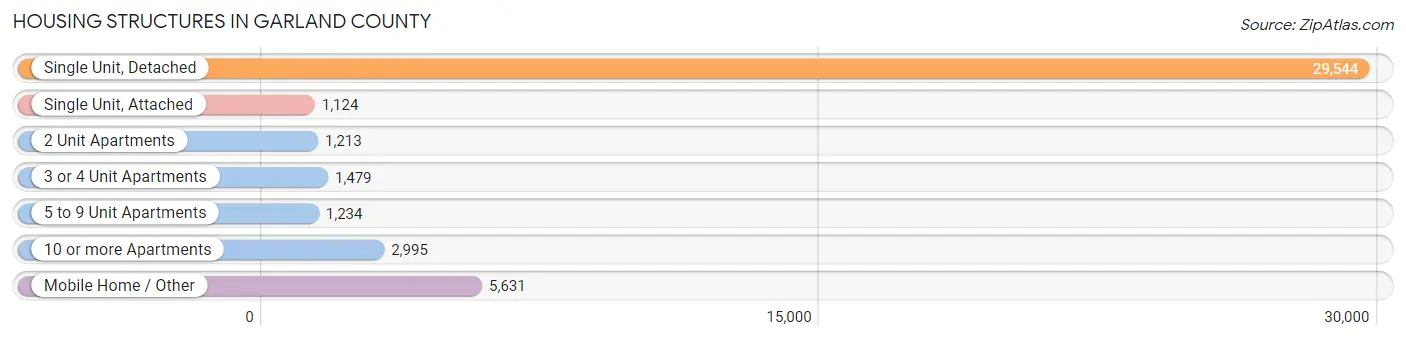
| Structure Type | # Housing Units | % Housing Units |
| Single Unit, Detached | 29,544 | 68.4% |
| Single Unit, Attached | 1,124 | 2.6% |
| 2 Unit Apartments | 1,213 | 2.8% |
| 3 or 4 Unit Apartments | 1,479 | 3.4% |
| 5 to 9 Unit Apartments | 1,234 | 2.9% |
| 10 or more Apartments | 2,995 | 6.9% |
| Mobile Home / Other | 5,631 | 13.0% |
| Total | 43,220 | 100.0% |
Housing Structures by Occupancy in Garland County
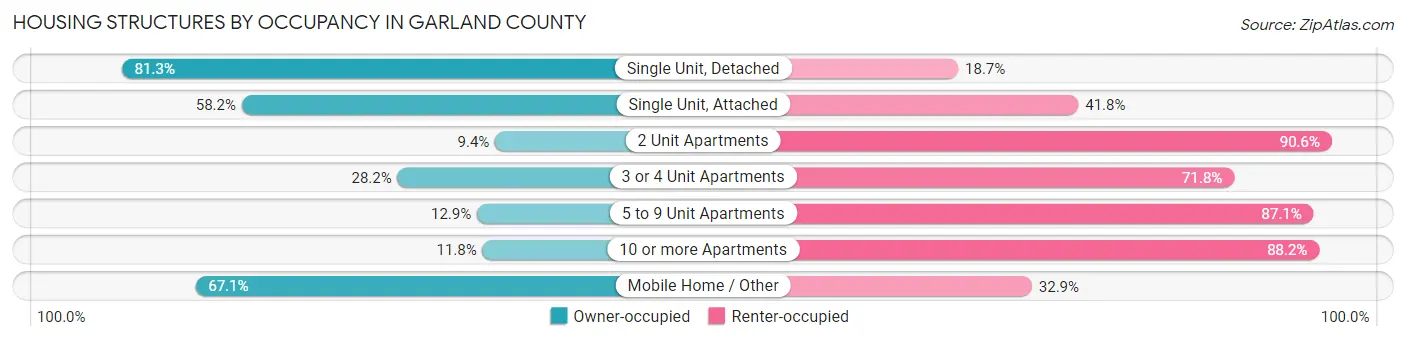
| Structure Type | Owner-occupied | Renter-occupied |
| Single Unit, Detached | 24,031 (81.3%) | 5,513 (18.7%) |
| Single Unit, Attached | 654 (58.2%) | 470 (41.8%) |
| 2 Unit Apartments | 114 (9.4%) | 1,099 (90.6%) |
| 3 or 4 Unit Apartments | 417 (28.2%) | 1,062 (71.8%) |
| 5 to 9 Unit Apartments | 159 (12.9%) | 1,075 (87.1%) |
| 10 or more Apartments | 354 (11.8%) | 2,641 (88.2%) |
| Mobile Home / Other | 3,780 (67.1%) | 1,851 (32.9%) |
| Total | 29,509 (68.3%) | 13,711 (31.7%) |
Housing Structures by Number of Rooms in Garland County
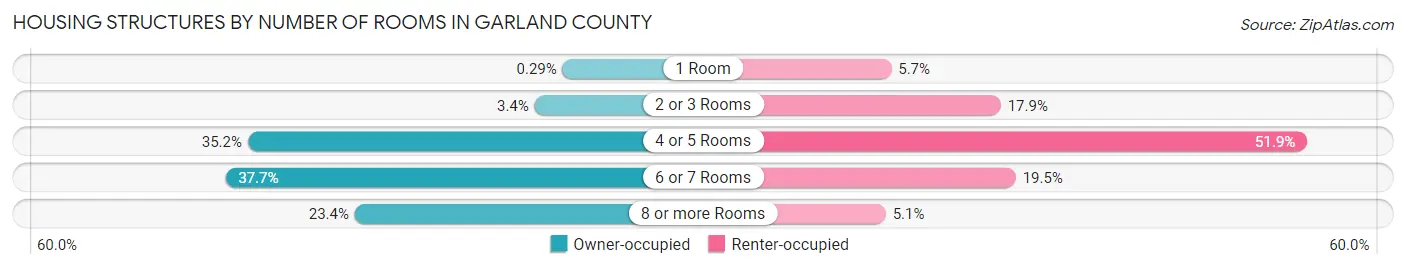
| Number of Rooms | Owner-occupied | Renter-occupied |
| 1 Room | 85 (0.3%) | 782 (5.7%) |
| 2 or 3 Rooms | 1,003 (3.4%) | 2,448 (17.8%) |
| 4 or 5 Rooms | 10,395 (35.2%) | 7,109 (51.8%) |
| 6 or 7 Rooms | 11,135 (37.7%) | 2,675 (19.5%) |
| 8 or more Rooms | 6,891 (23.4%) | 697 (5.1%) |
| Total | 29,509 (100.0%) | 13,711 (100.0%) |
Housing Structure by Heating Type in Garland County
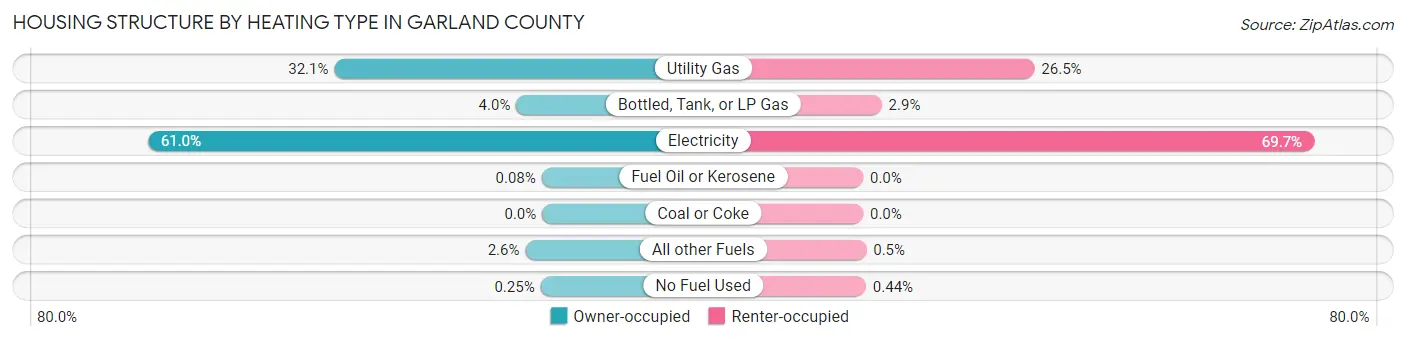
| Heating Type | Owner-occupied | Renter-occupied |
| Utility Gas | 9,479 (32.1%) | 3,632 (26.5%) |
| Bottled, Tank, or LP Gas | 1,180 (4.0%) | 395 (2.9%) |
| Electricity | 17,986 (61.0%) | 9,555 (69.7%) |
| Fuel Oil or Kerosene | 23 (0.1%) | 0 (0.0%) |
| Coal or Coke | 0 (0.0%) | 0 (0.0%) |
| All other Fuels | 767 (2.6%) | 69 (0.5%) |
| No Fuel Used | 74 (0.3%) | 60 (0.4%) |
| Total | 29,509 (100.0%) | 13,711 (100.0%) |
Household Vehicle Usage in Garland County
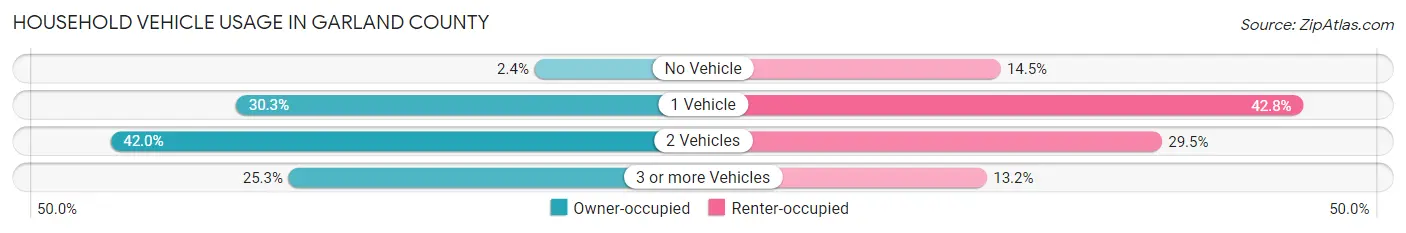
| Vehicles per Household | Owner-occupied | Renter-occupied |
| No Vehicle | 701 (2.4%) | 1,984 (14.5%) |
| 1 Vehicle | 8,936 (30.3%) | 5,868 (42.8%) |
| 2 Vehicles | 12,394 (42.0%) | 4,049 (29.5%) |
| 3 or more Vehicles | 7,478 (25.3%) | 1,810 (13.2%) |
| Total | 29,509 (100.0%) | 13,711 (100.0%) |
Real Estate & Mortgages in Garland County
Real Estate and Mortgage Overview in Garland County
| Characteristic | Without Mortgage | With Mortgage |
| Housing Units | 14,244 | 15,265 |
| Median Property Value | $150,500 | $181,300 |
| Median Household Income | $49,692 | $2,060 |
| Monthly Housing Costs | $403 | $609 |
| Real Estate Taxes | $771 | $1,045 |
Property Value by Mortgage Status in Garland County
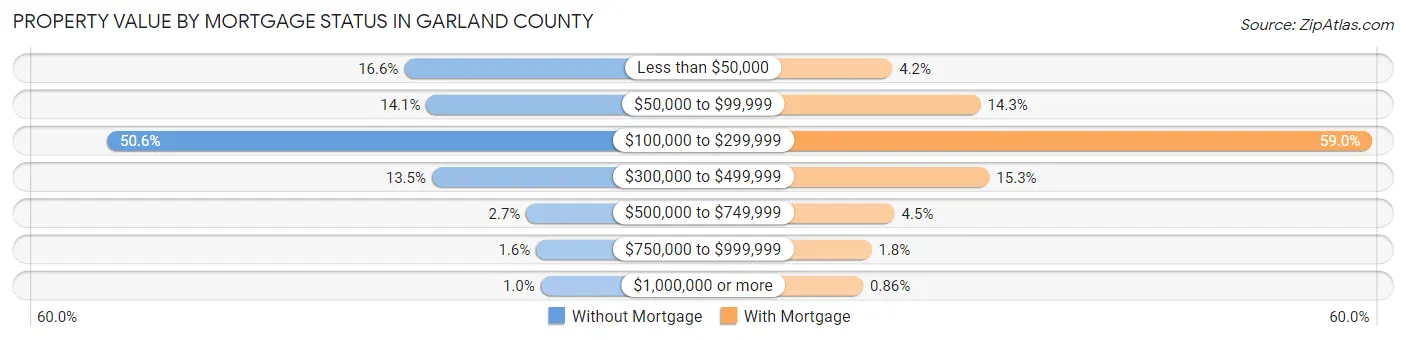
| Property Value | Without Mortgage | With Mortgage |
| Less than $50,000 | 2,367 (16.6%) | 641 (4.2%) |
| $50,000 to $99,999 | 2,007 (14.1%) | 2,183 (14.3%) |
| $100,000 to $299,999 | 7,203 (50.6%) | 9,012 (59.0%) |
| $300,000 to $499,999 | 1,917 (13.5%) | 2,335 (15.3%) |
| $500,000 to $749,999 | 382 (2.7%) | 683 (4.5%) |
| $750,000 to $999,999 | 221 (1.5%) | 279 (1.8%) |
| $1,000,000 or more | 147 (1.0%) | 132 (0.9%) |
| Total | 14,244 (100.0%) | 15,265 (100.0%) |
Household Income by Mortgage Status in Garland County
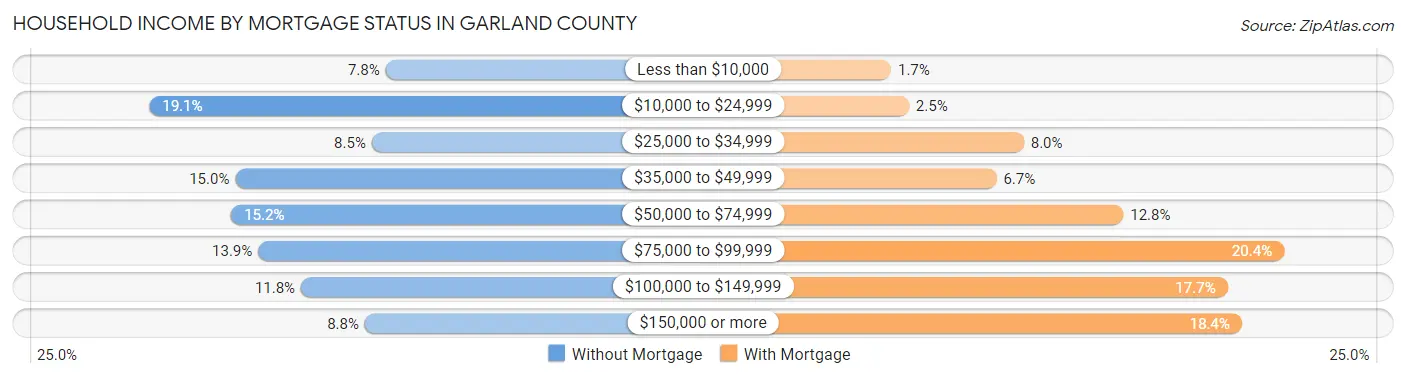
| Household Income | Without Mortgage | With Mortgage |
| Less than $10,000 | 1,113 (7.8%) | 258 (1.7%) |
| $10,000 to $24,999 | 2,715 (19.1%) | 387 (2.5%) |
| $25,000 to $34,999 | 1,207 (8.5%) | 1,223 (8.0%) |
| $35,000 to $49,999 | 2,132 (15.0%) | 1,025 (6.7%) |
| $50,000 to $74,999 | 2,160 (15.2%) | 1,946 (12.8%) |
| $75,000 to $99,999 | 1,977 (13.9%) | 3,114 (20.4%) |
| $100,000 to $149,999 | 1,686 (11.8%) | 2,703 (17.7%) |
| $150,000 or more | 1,254 (8.8%) | 2,807 (18.4%) |
| Total | 14,244 (100.0%) | 15,265 (100.0%) |
Property Value to Household Income Ratio in Garland County
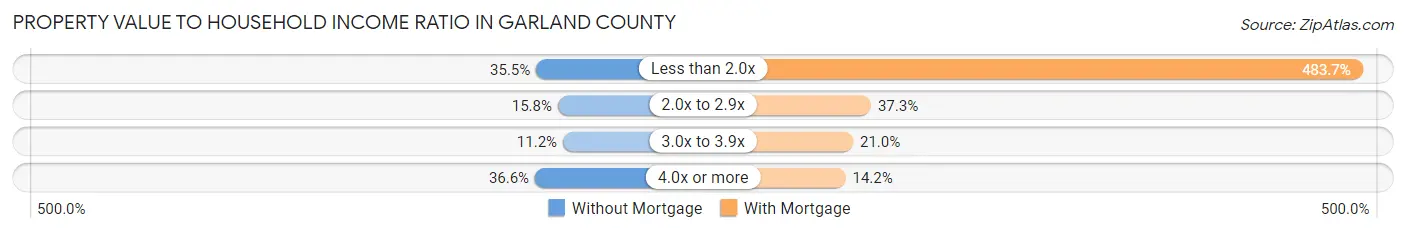
| Value-to-Income Ratio | Without Mortgage | With Mortgage |
| Less than 2.0x | 5,059 (35.5%) | 73,834 (483.7%) |
| 2.0x to 2.9x | 2,254 (15.8%) | 5,691 (37.3%) |
| 3.0x to 3.9x | 1,596 (11.2%) | 3,210 (21.0%) |
| 4.0x or more | 5,210 (36.6%) | 2,168 (14.2%) |
| Total | 14,244 (100.0%) | 15,265 (100.0%) |
Real Estate Taxes by Mortgage Status in Garland County
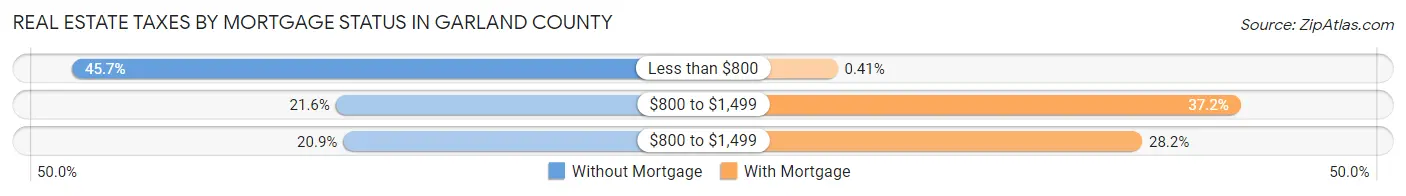
| Property Taxes | Without Mortgage | With Mortgage |
| Less than $800 | 6,504 (45.7%) | 62 (0.4%) |
| $800 to $1,499 | 3,077 (21.6%) | 5,681 (37.2%) |
| $800 to $1,499 | 2,979 (20.9%) | 4,308 (28.2%) |
| Total | 14,244 (100.0%) | 15,265 (100.0%) |
Health & Disability in Garland County
Health Insurance Coverage by Age in Garland County
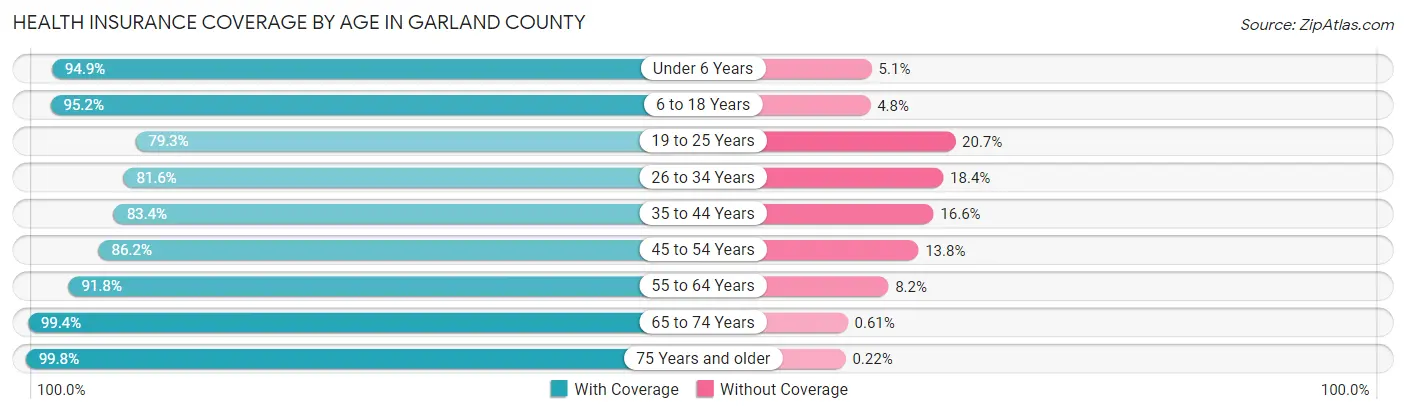
| Age Bracket | With Coverage | Without Coverage |
| Under 6 Years | 6,101 (94.9%) | 328 (5.1%) |
| 6 to 18 Years | 13,924 (95.2%) | 707 (4.8%) |
| 19 to 25 Years | 5,401 (79.3%) | 1,406 (20.7%) |
| 26 to 34 Years | 8,226 (81.6%) | 1,860 (18.4%) |
| 35 to 44 Years | 9,318 (83.4%) | 1,857 (16.6%) |
| 45 to 54 Years | 10,144 (86.2%) | 1,623 (13.8%) |
| 55 to 64 Years | 13,243 (91.8%) | 1,182 (8.2%) |
| 65 to 74 Years | 13,507 (99.4%) | 83 (0.6%) |
| 75 Years and older | 9,983 (99.8%) | 22 (0.2%) |
| Total | 89,847 (90.8%) | 9,068 (9.2%) |
Health Insurance Coverage by Citizenship Status in Garland County
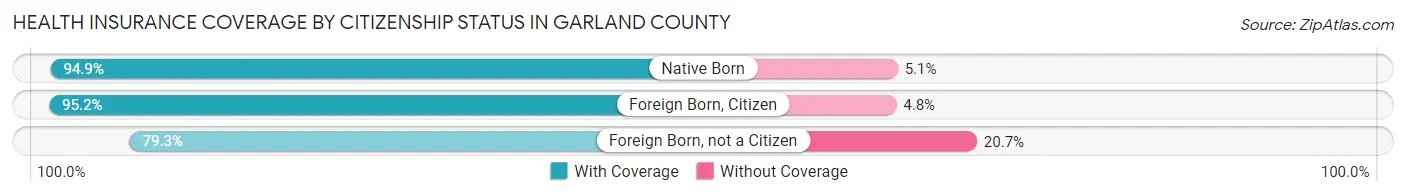
| Citizenship Status | With Coverage | Without Coverage |
| Native Born | 6,101 (94.9%) | 328 (5.1%) |
| Foreign Born, Citizen | 13,924 (95.2%) | 707 (4.8%) |
| Foreign Born, not a Citizen | 5,401 (79.3%) | 1,406 (20.7%) |
Health Insurance Coverage by Household Income in Garland County
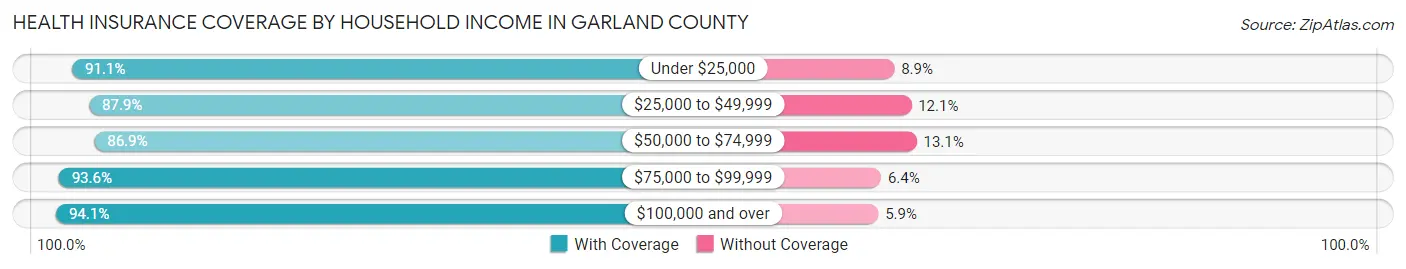
| Household Income | With Coverage | Without Coverage |
| Under $25,000 | 14,010 (91.1%) | 1,367 (8.9%) |
| $25,000 to $49,999 | 18,507 (87.9%) | 2,541 (12.1%) |
| $50,000 to $74,999 | 17,159 (86.9%) | 2,577 (13.1%) |
| $75,000 to $99,999 | 15,058 (93.6%) | 1,030 (6.4%) |
| $100,000 and over | 24,403 (94.1%) | 1,526 (5.9%) |
Public vs Private Health Insurance Coverage by Age in Garland County
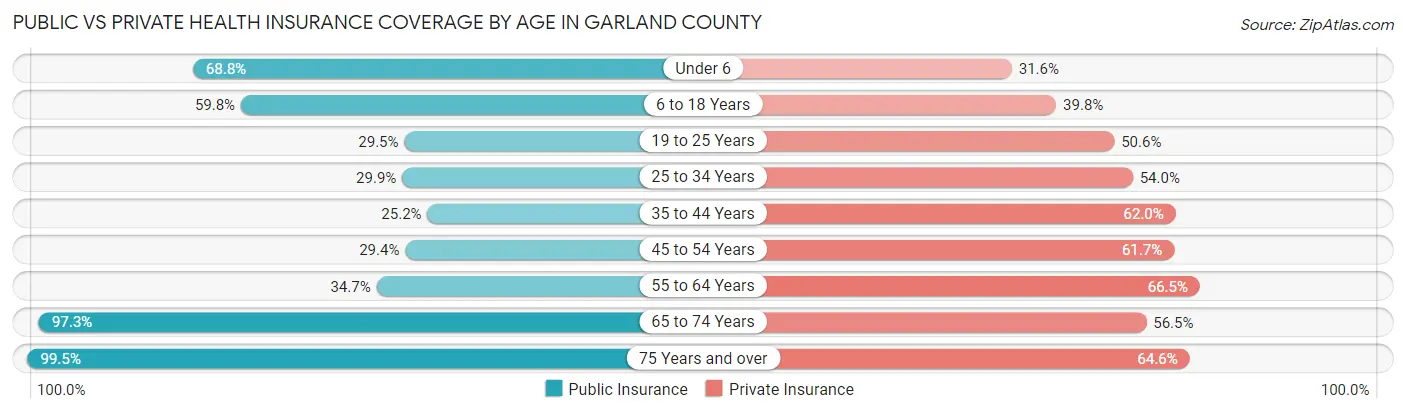
| Age Bracket | Public Insurance | Private Insurance |
| Under 6 | 4,420 (68.8%) | 2,029 (31.6%) |
| 6 to 18 Years | 8,755 (59.8%) | 5,821 (39.8%) |
| 19 to 25 Years | 2,009 (29.5%) | 3,442 (50.6%) |
| 25 to 34 Years | 3,018 (29.9%) | 5,446 (54.0%) |
| 35 to 44 Years | 2,819 (25.2%) | 6,923 (62.0%) |
| 45 to 54 Years | 3,454 (29.3%) | 7,254 (61.7%) |
| 55 to 64 Years | 5,002 (34.7%) | 9,585 (66.4%) |
| 65 to 74 Years | 13,229 (97.3%) | 7,681 (56.5%) |
| 75 Years and over | 9,951 (99.5%) | 6,458 (64.5%) |
| Total | 52,657 (53.2%) | 54,639 (55.2%) |
Disability Status by Sex by Age in Garland County
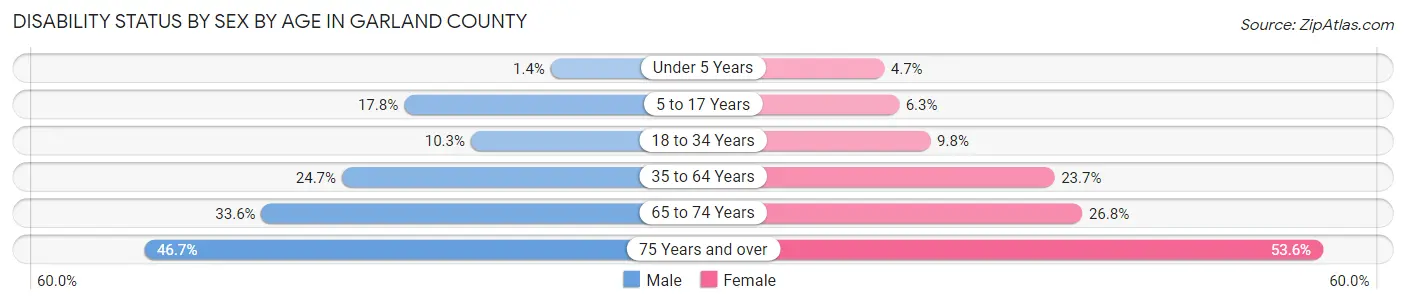
| Age Bracket | Male | Female |
| Under 5 Years | 37 (1.4%) | 121 (4.7%) |
| 5 to 17 Years | 1,313 (17.7%) | 448 (6.3%) |
| 18 to 34 Years | 937 (10.3%) | 903 (9.8%) |
| 35 to 64 Years | 4,396 (24.7%) | 4,626 (23.7%) |
| 65 to 74 Years | 2,120 (33.6%) | 1,949 (26.8%) |
| 75 Years and over | 2,087 (46.7%) | 2,966 (53.6%) |
Disability Class by Sex by Age in Garland County
Disability Class: Hearing Difficulty
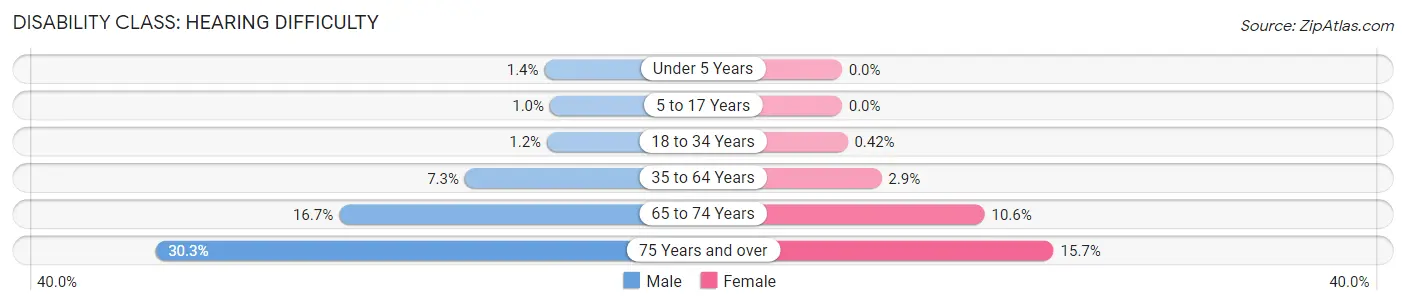
| Age Bracket | Male | Female |
| Under 5 Years | 37 (1.4%) | 0 (0.0%) |
| 5 to 17 Years | 74 (1.0%) | 0 (0.0%) |
| 18 to 34 Years | 111 (1.2%) | 39 (0.4%) |
| 35 to 64 Years | 1,305 (7.3%) | 575 (2.9%) |
| 65 to 74 Years | 1,050 (16.7%) | 772 (10.6%) |
| 75 Years and over | 1,354 (30.3%) | 871 (15.7%) |
Disability Class: Vision Difficulty
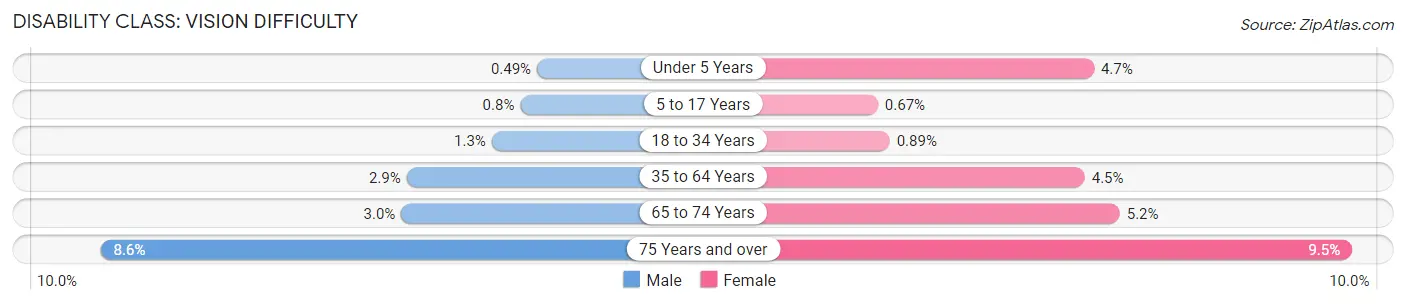
| Age Bracket | Male | Female |
| Under 5 Years | 13 (0.5%) | 121 (4.7%) |
| 5 to 17 Years | 59 (0.8%) | 47 (0.7%) |
| 18 to 34 Years | 121 (1.3%) | 82 (0.9%) |
| 35 to 64 Years | 518 (2.9%) | 881 (4.5%) |
| 65 to 74 Years | 190 (3.0%) | 376 (5.2%) |
| 75 Years and over | 384 (8.6%) | 524 (9.5%) |
Disability Class: Cognitive Difficulty
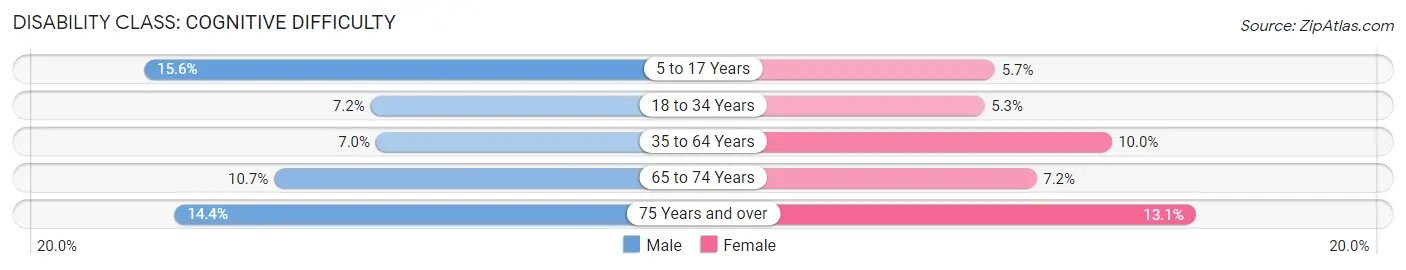
| Age Bracket | Male | Female |
| 5 to 17 Years | 1,151 (15.6%) | 401 (5.7%) |
| 18 to 34 Years | 651 (7.2%) | 486 (5.3%) |
| 35 to 64 Years | 1,241 (7.0%) | 1,954 (10.0%) |
| 65 to 74 Years | 677 (10.7%) | 526 (7.2%) |
| 75 Years and over | 645 (14.4%) | 727 (13.1%) |
Disability Class: Ambulatory Difficulty
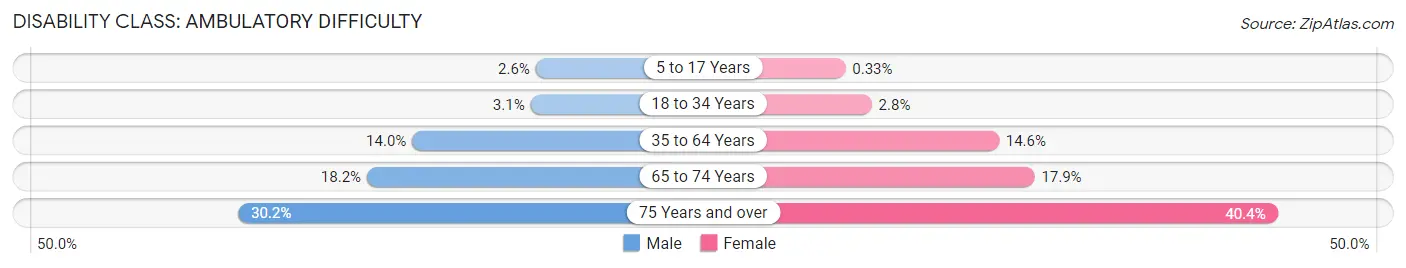
| Age Bracket | Male | Female |
| 5 to 17 Years | 190 (2.6%) | 23 (0.3%) |
| 18 to 34 Years | 277 (3.0%) | 254 (2.8%) |
| 35 to 64 Years | 2,499 (14.0%) | 2,849 (14.6%) |
| 65 to 74 Years | 1,149 (18.2%) | 1,303 (17.9%) |
| 75 Years and over | 1,349 (30.2%) | 2,238 (40.4%) |
Disability Class: Self-Care Difficulty
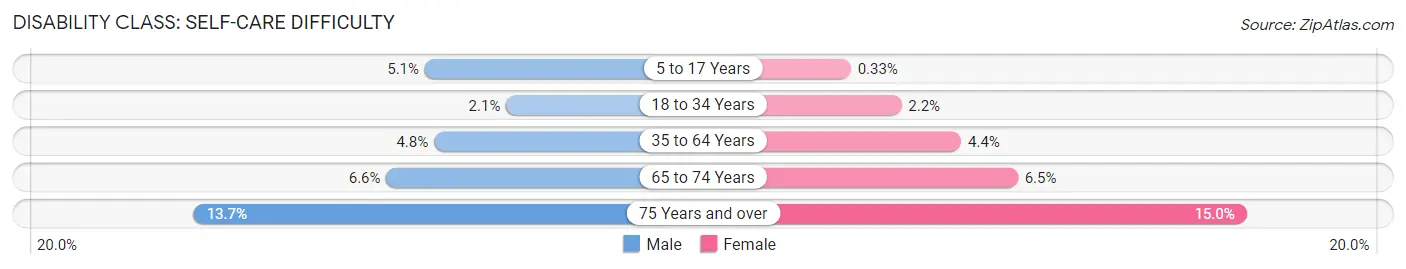
| Age Bracket | Male | Female |
| 5 to 17 Years | 380 (5.1%) | 23 (0.3%) |
| 18 to 34 Years | 193 (2.1%) | 203 (2.2%) |
| 35 to 64 Years | 855 (4.8%) | 866 (4.4%) |
| 65 to 74 Years | 414 (6.6%) | 476 (6.5%) |
| 75 Years and over | 613 (13.7%) | 832 (15.0%) |
Technology Access in Garland County
Computing Device Access in Garland County
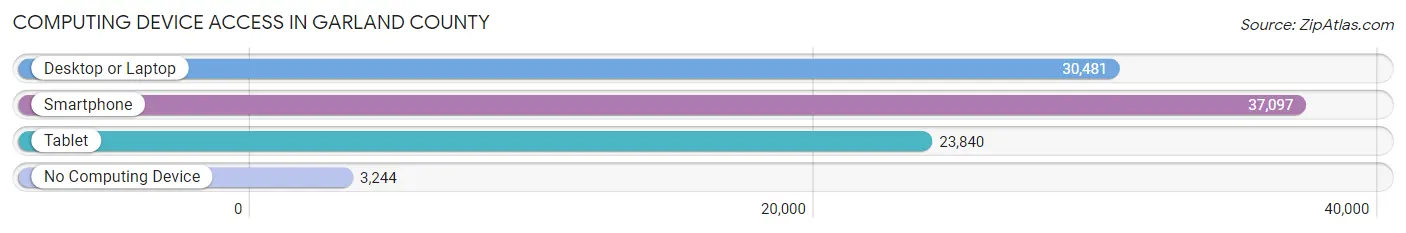
| Device Type | # Households | % Households |
| Desktop or Laptop | 30,481 | 70.5% |
| Smartphone | 37,097 | 85.8% |
| Tablet | 23,840 | 55.2% |
| No Computing Device | 3,244 | 7.5% |
| Total | 43,220 | 100.0% |
Internet Access in Garland County
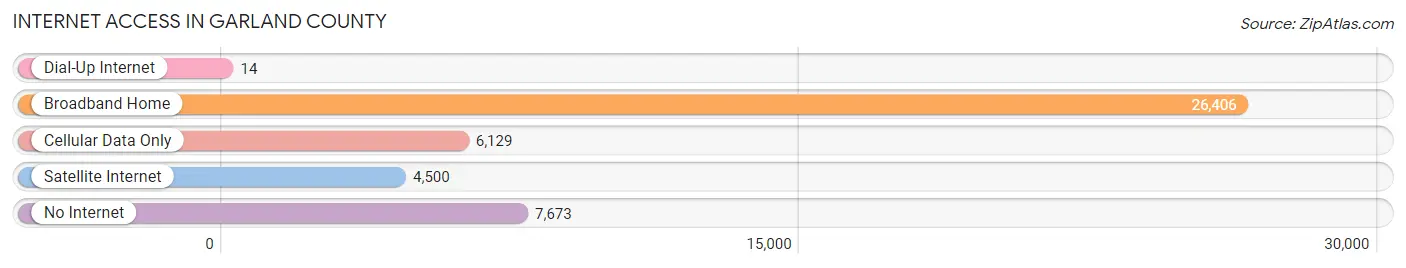
| Internet Type | # Households | % Households |
| Dial-Up Internet | 14 | 0.0% |
| Broadband Home | 26,406 | 61.1% |
| Cellular Data Only | 6,129 | 14.2% |
| Satellite Internet | 4,500 | 10.4% |
| No Internet | 7,673 | 17.7% |
| Total | 43,220 | 100.0% |
Garland County Summary
Garland County is located in the southwestern corner of Arkansas, and is bordered by Hot Spring County to the north, Montgomery County to the east, and Pike County to the south. The county seat is Hot Springs, and the county is part of the Hot Springs Metropolitan Statistical Area. As of the 2010 census, the population of Garland County was 96,024, making it the most populous county in Arkansas.
Geography
Garland County is located in the Ouachita Mountains region of Arkansas, and is characterized by rolling hills and valleys. The county is drained by the Ouachita River, which forms its western boundary. The county is also home to Lake Hamilton, a 7,000-acre reservoir created by the damming of the Ouachita River. The county is home to Hot Springs National Park, which is located in the city of Hot Springs.
History
Garland County was formed in 1873 from parts of Hot Spring and Montgomery counties. The county was named for Augustus H. Garland, who served as Governor of Arkansas from 1874 to 1876. Hot Springs was established as the county seat in 1876.
In the early 20th century, Garland County became a popular destination for tourists, due to its natural hot springs and the development of the Hot Springs Reservation, which later became Hot Springs National Park. The city of Hot Springs became a popular destination for gamblers, and the area was known as the "Las Vegas of the South."
Economy
The economy of Garland County is largely based on tourism, with Hot Springs National Park being the county's largest employer. Other major employers in the county include the Oaklawn Racing and Gaming racetrack, the Hot Springs Convention Center, and the Hot Springs School District.
The county is also home to several manufacturing companies, including the Hot Springs Glass Company, the Hot Springs Veneer Company, and the Hot Springs Wood Products Company.
Demographics
As of the 2010 census, the population of Garland County was 96,024, making it the most populous county in Arkansas. The racial makeup of the county was 79.3% White, 15.3% Black or African American, 0.7% Native American, 1.2% Asian, 0.1% Pacific Islander, 1.3% from other races, and 2.1% from two or more races. Hispanic or Latino of any race were 3.7% of the population.
The median income for a household in the county was $37,945, and the median income for a family was $45,945. The per capita income for the county was $20,945. About 11.3% of families and 14.7% of the population were below the poverty line, including 20.3% of those under age 18 and 10.2% of those age 65 or over.
Common Questions
What is Per Capita Income in Garland County?
Per Capita income in Garland County is $31,854.
What is the Median Family Income in Garland County?
Median Family Income in Garland County is $68,326.
What is the Median Household income in Garland County?
Median Household Income in Garland County is $54,229.
What is Income or Wage Gap in Garland County?
Income or Wage Gap in Garland County is 23.8%.
Women in Garland County earn 76.2 cents for every dollar earned by a man.
What is Family Income Deficit in Garland County?
Family Income Deficit in Garland County is $9,698.
Families that are below poverty line in Garland County earn $9,698 less on average than the poverty threshold level.
What is Inequality or Gini Index in Garland County?
Inequality or Gini Index in Garland County is 0.46.
What is the Total Population of Garland County?
Total Population of Garland County is 100,021.
What is the Total Male Population of Garland County?
Total Male Population of Garland County is 48,360.
What is the Total Female Population of Garland County?
Total Female Population of Garland County is 51,661.
What is the Ratio of Males per 100 Females in Garland County?
There are 93.61 Males per 100 Females in Garland County.
What is the Ratio of Females per 100 Males in Garland County?
There are 106.83 Females per 100 Males in Garland County.
What is the Median Population Age in Garland County?
Median Population Age in Garland County is 45.4 Years.
What is the Average Family Size in Garland County
Average Family Size in Garland County is 2.8 People.
What is the Average Household Size in Garland County
Average Household Size in Garland County is 2.3 People.
How Large is the Labor Force in Garland County?
There are 44,877 People in the Labor Forcein in Garland County.
What is the Percentage of People in the Labor Force in Garland County?
54.2% of People are in the Labor Force in Garland County.
What is the Unemployment Rate in Garland County?
Unemployment Rate in Garland County is 5.7%.