Little Rock, AR Map & Demographics
Little Rock Map
Little Rock Overview
$42,616
PER CAPITA INCOME
$80,633
AVG FAMILY INCOME
$58,697
AVG HOUSEHOLD INCOME
14.4%
WAGE / INCOME GAP [ % ]
85.6¢/ $1
WAGE / INCOME GAP [ $ ]
$11,348
FAMILY INCOME DEFICIT
0.54
INEQUALITY / GINI INDEX
202,218
TOTAL POPULATION
95,444
MALE POPULATION
106,774
FEMALE POPULATION
89.39
MALES / 100 FEMALES
111.87
FEMALES / 100 MALES
36.6
MEDIAN AGE
3.1
AVG FAMILY SIZE
2.3
AVG HOUSEHOLD SIZE
103,396
LABOR FORCE [ PEOPLE ]
64.8%
PERCENT IN LABOR FORCE
4.4%
UNEMPLOYMENT RATE
Little Rock Zip Codes
Little Rock Area Codes
Income in Little Rock
Income Overview in Little Rock
Per Capita Income in Little Rock is $42,616, while median incomes of families and households are $80,633 and $58,697 respectively.
| Characteristic | Number | Measure |
| Per Capita Income | 202,218 | $42,616 |
| Median Family Income | 47,240 | $80,633 |
| Mean Family Income | 47,240 | $126,738 |
| Median Household Income | 86,365 | $58,697 |
| Mean Household Income | 86,365 | $96,841 |
| Income Deficit | 47,240 | $11,348 |
| Wage / Income Gap (%) | 202,218 | 14.44% |
| Wage / Income Gap ($) | 202,218 | 85.56¢ per $1 |
| Gini / Inequality Index | 202,218 | 0.54 |
Earnings by Sex in Little Rock
Average Earnings in Little Rock are $41,351, $45,155 for men and $38,633 for women, a difference of 14.4%.
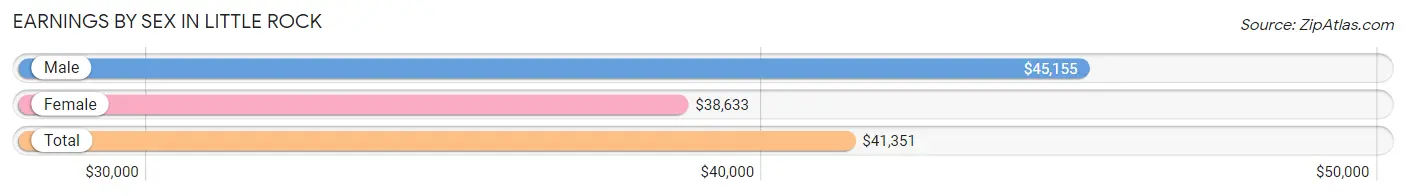
| Sex | Number | Average Earnings |
| Male | 52,248 (49.1%) | $45,155 |
| Female | 54,169 (50.9%) | $38,633 |
| Total | 106,417 (100.0%) | $41,351 |
Earnings by Sex by Income Bracket in Little Rock
The most common earnings brackets in Little Rock are $100,000+ for men (10,036 | 19.2%) and $100,000+ for women (5,474 | 10.1%).
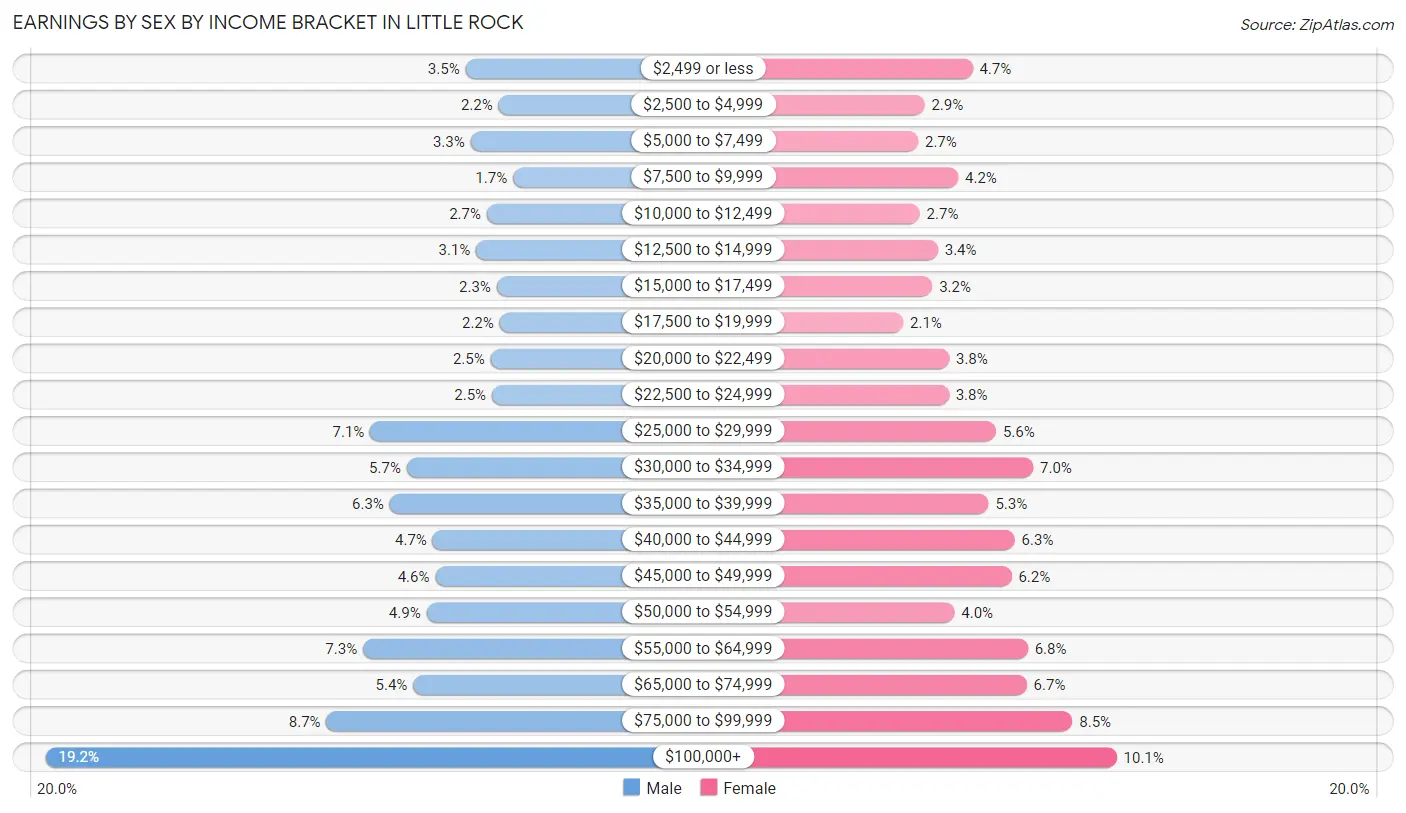
| Income | Male | Female |
| $2,499 or less | 1,820 (3.5%) | 2,550 (4.7%) |
| $2,500 to $4,999 | 1,172 (2.2%) | 1,578 (2.9%) |
| $5,000 to $7,499 | 1,719 (3.3%) | 1,444 (2.7%) |
| $7,500 to $9,999 | 887 (1.7%) | 2,259 (4.2%) |
| $10,000 to $12,499 | 1,400 (2.7%) | 1,478 (2.7%) |
| $12,500 to $14,999 | 1,609 (3.1%) | 1,848 (3.4%) |
| $15,000 to $17,499 | 1,205 (2.3%) | 1,733 (3.2%) |
| $17,500 to $19,999 | 1,152 (2.2%) | 1,144 (2.1%) |
| $20,000 to $22,499 | 1,329 (2.5%) | 2,076 (3.8%) |
| $22,500 to $24,999 | 1,303 (2.5%) | 2,070 (3.8%) |
| $25,000 to $29,999 | 3,685 (7.0%) | 3,027 (5.6%) |
| $30,000 to $34,999 | 2,966 (5.7%) | 3,779 (7.0%) |
| $35,000 to $39,999 | 3,302 (6.3%) | 2,875 (5.3%) |
| $40,000 to $44,999 | 2,463 (4.7%) | 3,408 (6.3%) |
| $45,000 to $49,999 | 2,410 (4.6%) | 3,343 (6.2%) |
| $50,000 to $54,999 | 2,581 (4.9%) | 2,184 (4.0%) |
| $55,000 to $64,999 | 3,827 (7.3%) | 3,672 (6.8%) |
| $65,000 to $74,999 | 2,842 (5.4%) | 3,652 (6.7%) |
| $75,000 to $99,999 | 4,540 (8.7%) | 4,575 (8.5%) |
| $100,000+ | 10,036 (19.2%) | 5,474 (10.1%) |
| Total | 52,248 (100.0%) | 54,169 (100.0%) |
Earnings by Sex by Educational Attainment in Little Rock
Average earnings in Little Rock are $51,599 for men and $42,561 for women, a difference of 17.5%. Men with an educational attainment of graduate degree enjoy the highest average annual earnings of $93,657, while those with high school diploma education earn the least with $35,098. Women with an educational attainment of graduate degree earn the most with the average annual earnings of $69,080, while those with less than high school education have the smallest earnings of $19,719.
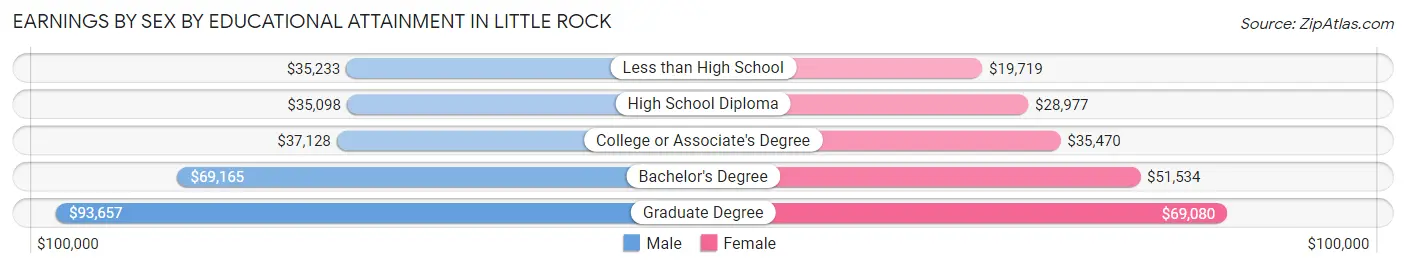
| Educational Attainment | Male Income | Female Income |
| Less than High School | $35,233 | $19,719 |
| High School Diploma | $35,098 | $28,977 |
| College or Associate's Degree | $37,128 | $35,470 |
| Bachelor's Degree | $69,165 | $51,534 |
| Graduate Degree | $93,657 | $69,080 |
| Total | $51,599 | $42,561 |
Family Income in Little Rock
Family Income Brackets in Little Rock
According to the Little Rock family income data, there are 7,511 families falling into the $200,000+ income range, which is the most common income bracket and makes up 15.9% of all families. Conversely, the $10,000 to $14,999 income bracket is the least frequent group with only 1,275 families (2.7%) belonging to this category.
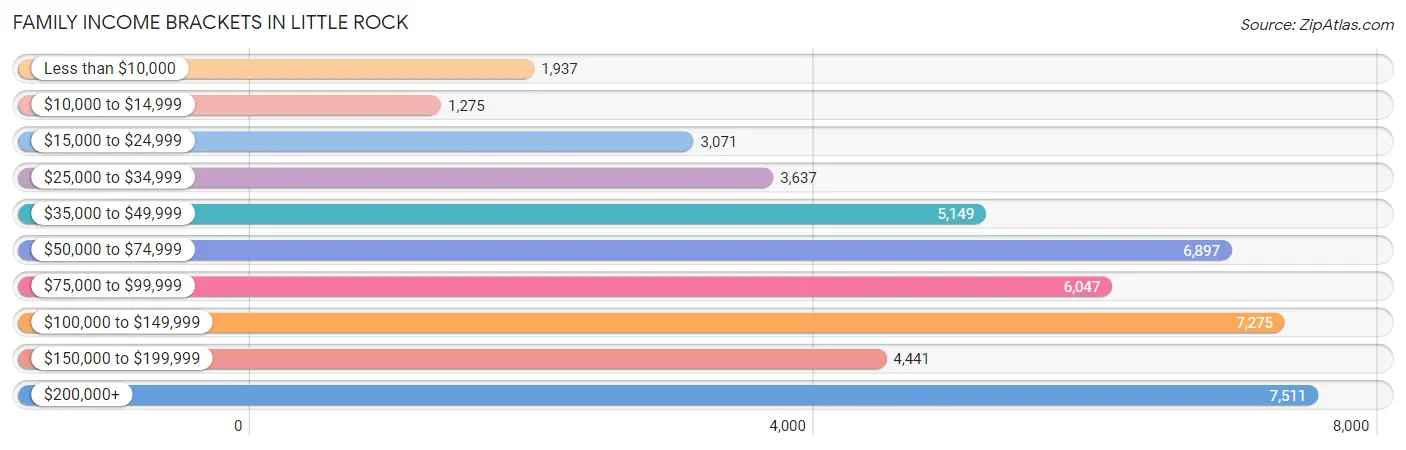
| Income Bracket | # Families | % Families |
| Less than $10,000 | 1,937 | 4.1% |
| $10,000 to $14,999 | 1,275 | 2.7% |
| $15,000 to $24,999 | 3,071 | 6.5% |
| $25,000 to $34,999 | 3,637 | 7.7% |
| $35,000 to $49,999 | 5,149 | 10.9% |
| $50,000 to $74,999 | 6,897 | 14.6% |
| $75,000 to $99,999 | 6,047 | 12.8% |
| $100,000 to $149,999 | 7,275 | 15.4% |
| $150,000 to $199,999 | 4,441 | 9.4% |
| $200,000+ | 7,511 | 15.9% |
Family Income by Famaliy Size in Little Rock
5-person families (3,332 | 7.0%) account for the highest median family income in Little Rock with $101,563 per family, while 2-person families (23,527 | 49.8%) have the highest median income of $38,321 per family member.
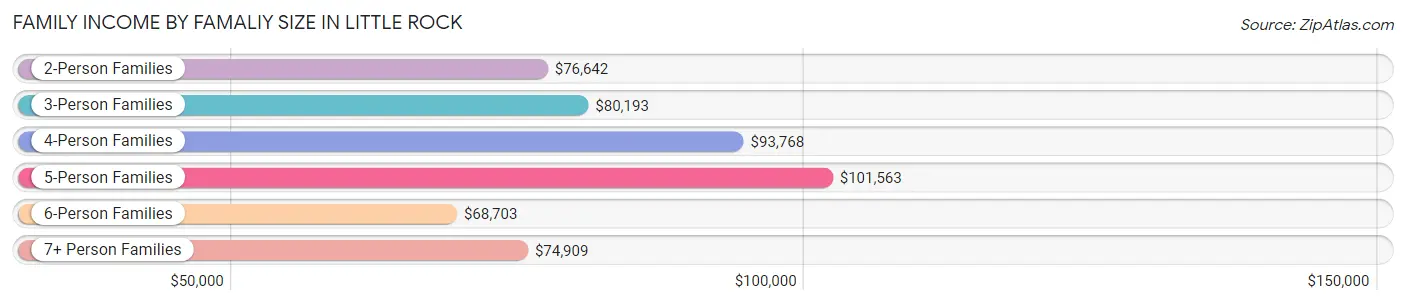
| Income Bracket | # Families | Median Income |
| 2-Person Families | 23,527 (49.8%) | $76,642 |
| 3-Person Families | 11,145 (23.6%) | $80,193 |
| 4-Person Families | 7,495 (15.9%) | $93,768 |
| 5-Person Families | 3,332 (7.0%) | $101,563 |
| 6-Person Families | 1,114 (2.4%) | $68,703 |
| 7+ Person Families | 627 (1.3%) | $74,909 |
| Total | 47,240 (100.0%) | $80,633 |
Family Income by Number of Earners in Little Rock
The median family income in Little Rock is $80,633, with families comprising 3+ earners (3,590) having the highest median family income of $142,339, while families with no earners (6,632) have the lowest median family income of $36,438, accounting for 7.6% and 14.0% of families, respectively.
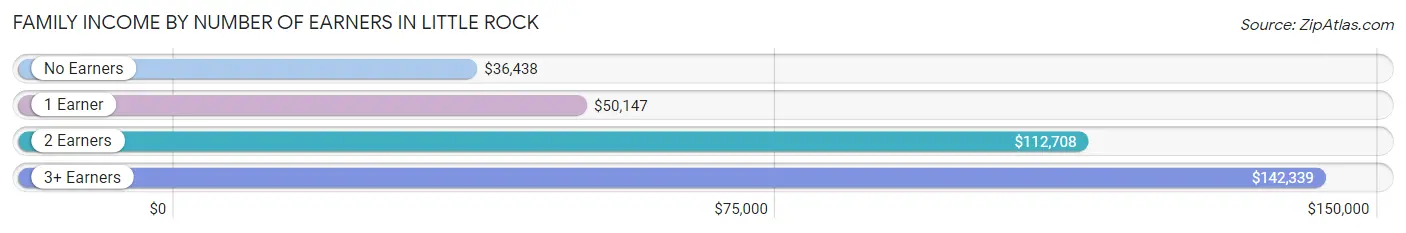
| Number of Earners | # Families | Median Income |
| No Earners | 6,632 (14.0%) | $36,438 |
| 1 Earner | 17,574 (37.2%) | $50,147 |
| 2 Earners | 19,444 (41.2%) | $112,708 |
| 3+ Earners | 3,590 (7.6%) | $142,339 |
| Total | 47,240 (100.0%) | $80,633 |
Household Income in Little Rock
Household Income Brackets in Little Rock
With 13,818 households falling in the category, the $50,000 to $74,999 income range is the most frequent in Little Rock, accounting for 16.0% of all households. In contrast, only 3,714 households (4.3%) fall into the $10,000 to $14,999 income bracket, making it the least populous group.
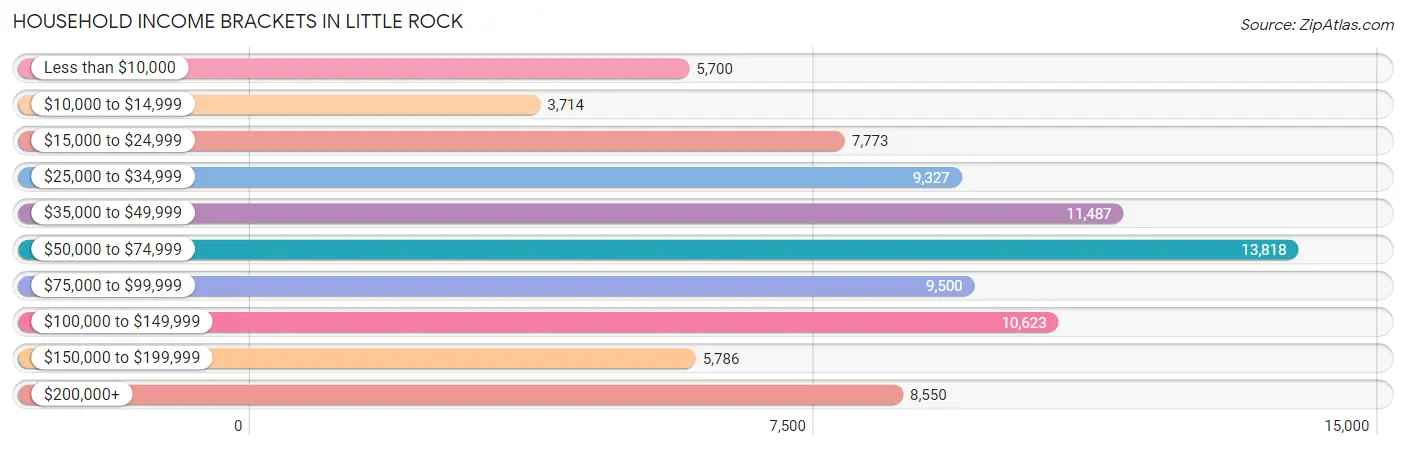
| Income Bracket | # Households | % Households |
| Less than $10,000 | 5,700 | 6.6% |
| $10,000 to $14,999 | 3,714 | 4.3% |
| $15,000 to $24,999 | 7,773 | 9.0% |
| $25,000 to $34,999 | 9,327 | 10.8% |
| $35,000 to $49,999 | 11,487 | 13.3% |
| $50,000 to $74,999 | 13,818 | 16.0% |
| $75,000 to $99,999 | 9,500 | 11.0% |
| $100,000 to $149,999 | 10,623 | 12.3% |
| $150,000 to $199,999 | 5,786 | 6.7% |
| $200,000+ | 8,550 | 9.9% |
Household Income by Householder Age in Little Rock
The median household income in Little Rock is $58,697, with the highest median household income of $71,812 found in the 45 to 64 years age bracket for the primary householder. A total of 29,839 households (34.5%) fall into this category. Meanwhile, the 15 to 24 years age bracket for the primary householder has the lowest median household income of $27,145, with 4,760 households (5.5%) in this group.
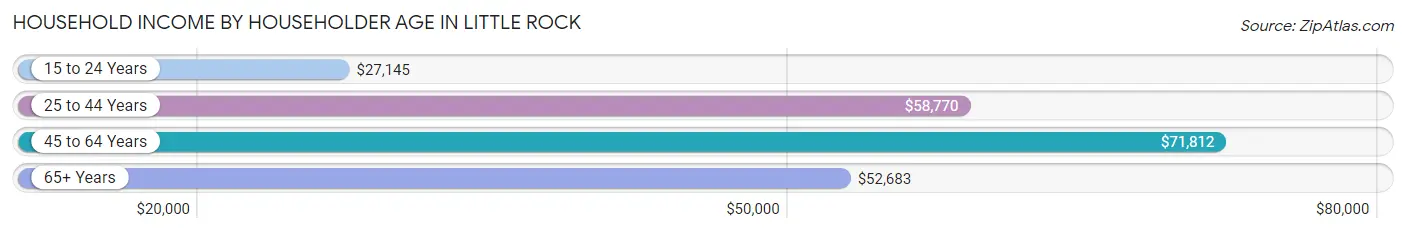
| Income Bracket | # Households | Median Income |
| 15 to 24 Years | 4,760 (5.5%) | $27,145 |
| 25 to 44 Years | 31,703 (36.7%) | $58,770 |
| 45 to 64 Years | 29,839 (34.5%) | $71,812 |
| 65+ Years | 20,063 (23.2%) | $52,683 |
| Total | 86,365 (100.0%) | $58,697 |
Poverty in Little Rock
Income Below Poverty by Sex and Age in Little Rock
With 15.6% poverty level for males and 17.3% for females among the residents of Little Rock, 16 and 17 year old males and 12 to 14 year old females are the most vulnerable to poverty, with 859 males (32.0%) and 1,527 females (34.6%) in their respective age groups living below the poverty level.
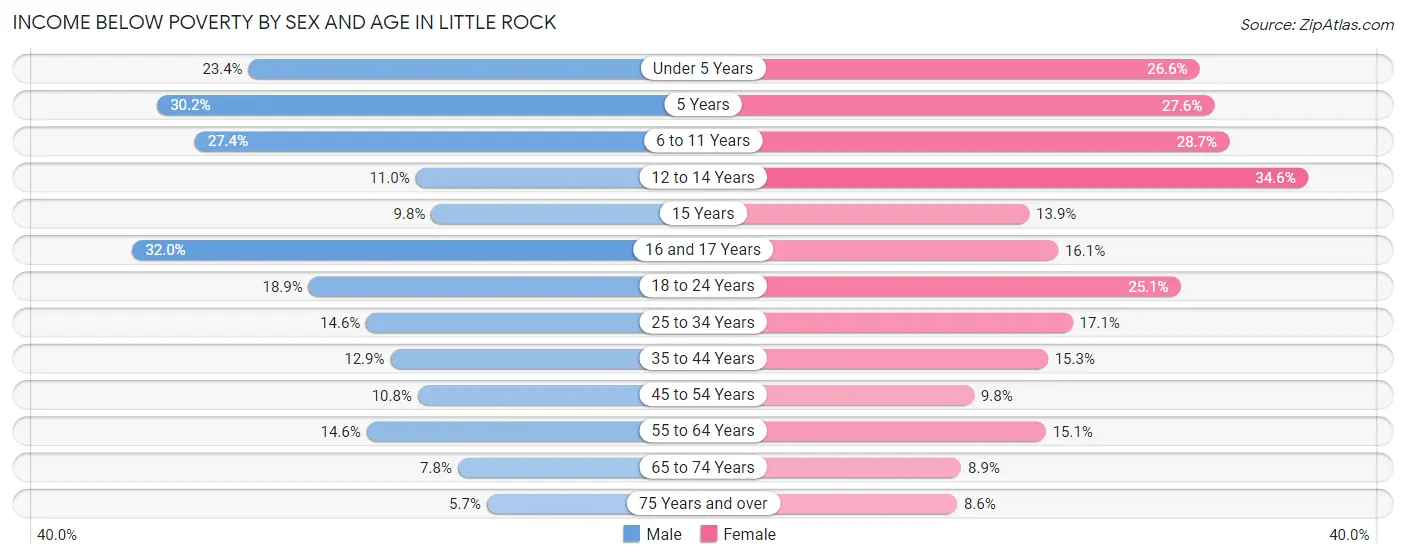
| Age Bracket | Male | Female |
| Under 5 Years | 1,548 (23.4%) | 1,806 (26.6%) |
| 5 Years | 357 (30.1%) | 343 (27.6%) |
| 6 to 11 Years | 2,089 (27.4%) | 2,261 (28.7%) |
| 12 to 14 Years | 390 (11.0%) | 1,527 (34.6%) |
| 15 Years | 144 (9.8%) | 148 (13.9%) |
| 16 and 17 Years | 859 (32.0%) | 342 (16.1%) |
| 18 to 24 Years | 1,832 (18.9%) | 2,169 (25.1%) |
| 25 to 34 Years | 2,121 (14.6%) | 2,676 (17.1%) |
| 35 to 44 Years | 1,654 (12.9%) | 2,118 (15.3%) |
| 45 to 54 Years | 1,198 (10.8%) | 1,264 (9.8%) |
| 55 to 64 Years | 1,560 (14.6%) | 1,904 (15.1%) |
| 65 to 74 Years | 607 (7.8%) | 932 (8.9%) |
| 75 Years and over | 230 (5.7%) | 598 (8.6%) |
| Total | 14,589 (15.6%) | 18,088 (17.3%) |
Income Above Poverty by Sex and Age in Little Rock
According to the poverty statistics in Little Rock, males aged 75 years and over and females aged 75 years and over are the age groups that are most secure financially, with 94.3% of males and 91.4% of females in these age groups living above the poverty line.
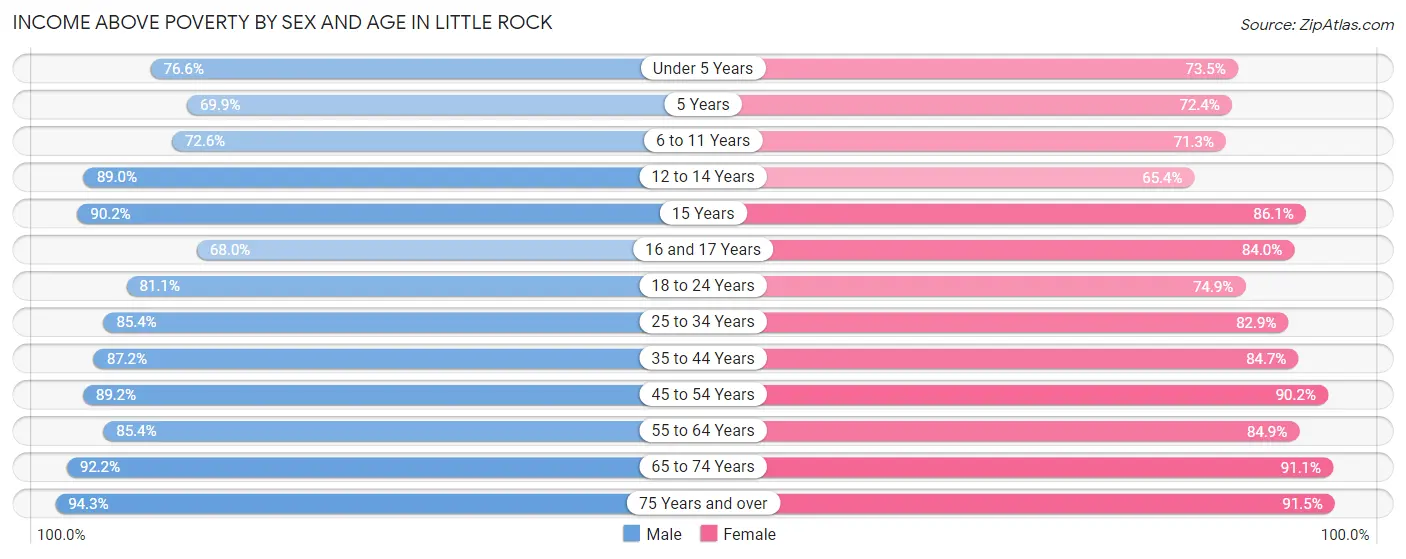
| Age Bracket | Male | Female |
| Under 5 Years | 5,073 (76.6%) | 4,997 (73.5%) |
| 5 Years | 827 (69.9%) | 898 (72.4%) |
| 6 to 11 Years | 5,545 (72.6%) | 5,608 (71.3%) |
| 12 to 14 Years | 3,161 (89.0%) | 2,889 (65.4%) |
| 15 Years | 1,324 (90.2%) | 916 (86.1%) |
| 16 and 17 Years | 1,826 (68.0%) | 1,789 (84.0%) |
| 18 to 24 Years | 7,852 (81.1%) | 6,462 (74.9%) |
| 25 to 34 Years | 12,368 (85.4%) | 12,938 (82.9%) |
| 35 to 44 Years | 11,215 (87.2%) | 11,733 (84.7%) |
| 45 to 54 Years | 9,889 (89.2%) | 11,624 (90.2%) |
| 55 to 64 Years | 9,118 (85.4%) | 10,670 (84.9%) |
| 65 to 74 Years | 7,139 (92.2%) | 9,591 (91.1%) |
| 75 Years and over | 3,810 (94.3%) | 6,395 (91.4%) |
| Total | 79,147 (84.4%) | 86,510 (82.7%) |
Income Below Poverty Among Married-Couple Families in Little Rock
The poverty statistics for married-couple families in Little Rock show that 5.3% or 1,567 of the total 29,779 families live below the poverty line. Families with 5 or more children have the highest poverty rate of 47.7%, comprising of 156 families. On the other hand, families with 1 or 2 children have the lowest poverty rate of 3.2%, which includes 313 families.
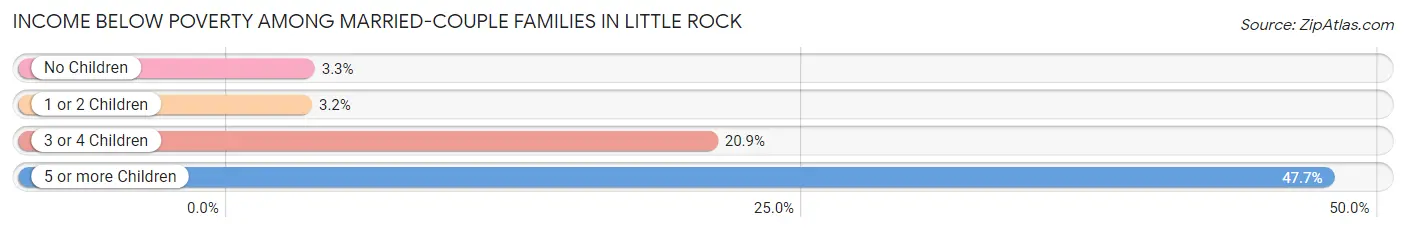
| Children | Above Poverty | Below Poverty |
| No Children | 16,648 (96.7%) | 575 (3.3%) |
| 1 or 2 Children | 9,411 (96.8%) | 313 (3.2%) |
| 3 or 4 Children | 1,982 (79.1%) | 523 (20.9%) |
| 5 or more Children | 171 (52.3%) | 156 (47.7%) |
| Total | 28,212 (94.7%) | 1,567 (5.3%) |
Income Below Poverty Among Single-Parent Households in Little Rock
According to the poverty data in Little Rock, 18.4% or 565 single-father households and 26.6% or 3,823 single-mother households are living below the poverty line. Among single-father households, those with 3 or 4 children have the highest poverty rate, with 66 households (31.0%) experiencing poverty. Likewise, among single-mother households, those with 3 or 4 children have the highest poverty rate, with 1,002 households (62.2%) falling below the poverty line.
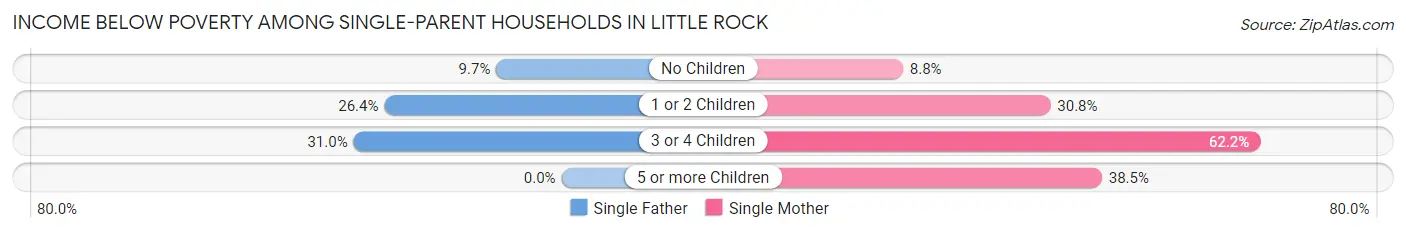
| Children | Single Father | Single Mother |
| No Children | 149 (9.7%) | 455 (8.8%) |
| 1 or 2 Children | 350 (26.4%) | 2,266 (30.8%) |
| 3 or 4 Children | 66 (31.0%) | 1,002 (62.2%) |
| 5 or more Children | 0 (0.0%) | 100 (38.5%) |
| Total | 565 (18.4%) | 3,823 (26.6%) |
Income Below Poverty Among Married-Couple vs Single-Parent Households in Little Rock
The poverty data for Little Rock shows that 1,567 of the married-couple family households (5.3%) and 4,388 of the single-parent households (25.1%) are living below the poverty level. Within the married-couple family households, those with 5 or more children have the highest poverty rate, with 156 households (47.7%) falling below the poverty line. Among the single-parent households, those with 3 or 4 children have the highest poverty rate, with 1,068 household (58.6%) living below poverty.
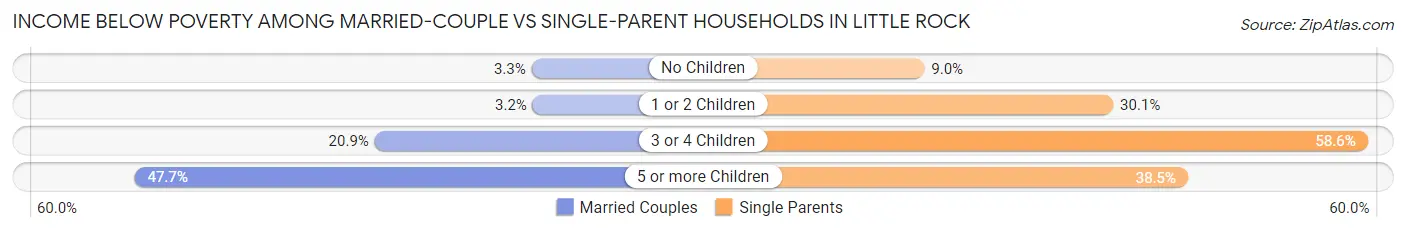
| Children | Married-Couple Families | Single-Parent Households |
| No Children | 575 (3.3%) | 604 (9.0%) |
| 1 or 2 Children | 313 (3.2%) | 2,616 (30.1%) |
| 3 or 4 Children | 523 (20.9%) | 1,068 (58.6%) |
| 5 or more Children | 156 (47.7%) | 100 (38.5%) |
| Total | 1,567 (5.3%) | 4,388 (25.1%) |
Race in Little Rock
The most populous races in Little Rock are White / Caucasian (96,756 | 47.8%), Black / African American (83,874 | 41.5%), and Hispanic or Latino (15,826 | 7.8%).
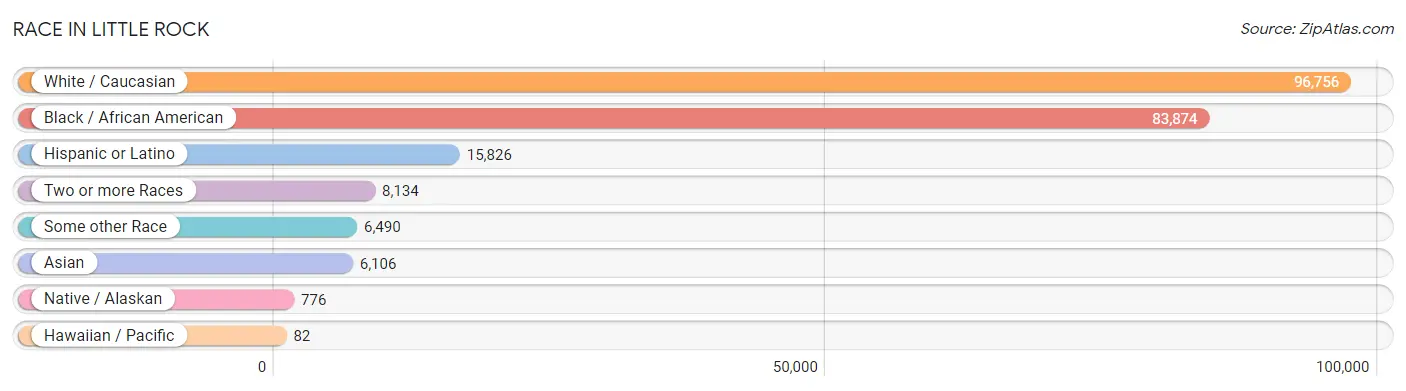
| Race | # Population | % Population |
| Asian | 6,106 | 3.0% |
| Black / African American | 83,874 | 41.5% |
| Hawaiian / Pacific | 82 | 0.0% |
| Hispanic or Latino | 15,826 | 7.8% |
| Native / Alaskan | 776 | 0.4% |
| White / Caucasian | 96,756 | 47.8% |
| Two or more Races | 8,134 | 4.0% |
| Some other Race | 6,490 | 3.2% |
| Total | 202,218 | 100.0% |
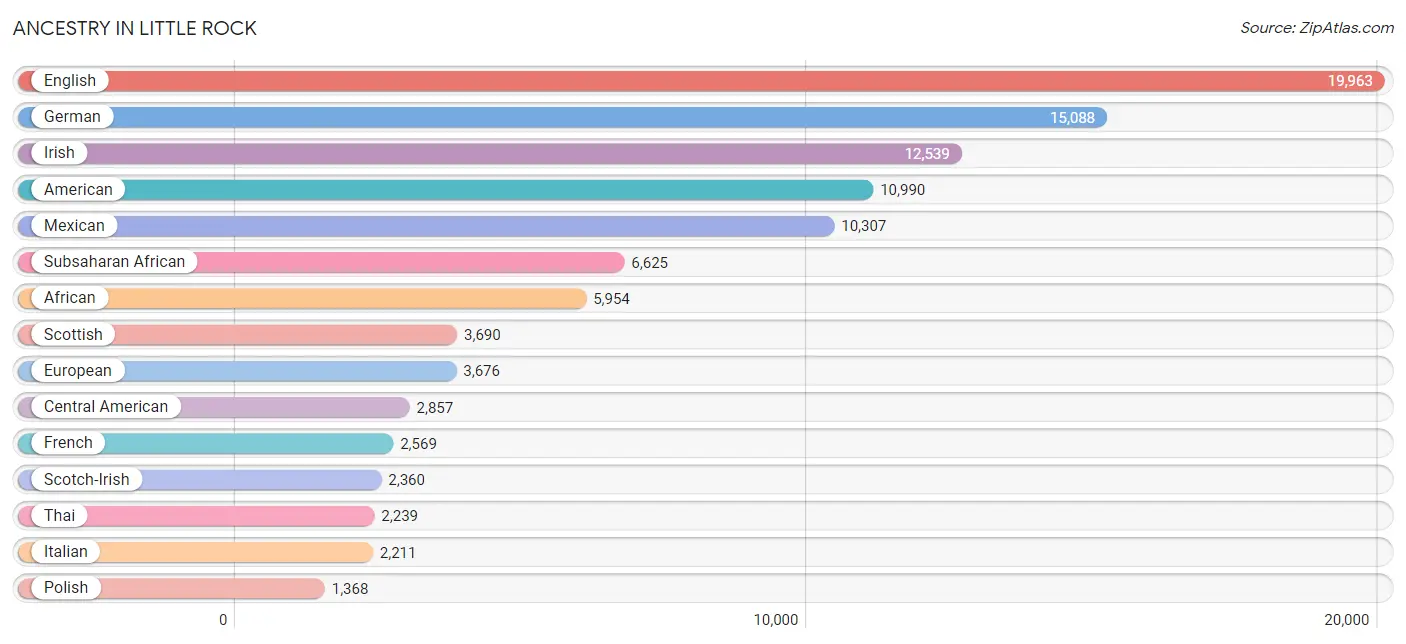
Ancestry in Little Rock
The most populous ancestries reported in Little Rock are English (19,963 | 9.9%), German (15,088 | 7.5%), Irish (12,539 | 6.2%), American (10,990 | 5.4%), and Mexican (10,307 | 5.1%), together accounting for 34.1% of all Little Rock residents.
| Ancestry | # Population | % Population |
| African | 5,954 | 2.9% |
| American | 10,990 | 5.4% |
| Apache | 56 | 0.0% |
| Arab | 741 | 0.4% |
| Argentinean | 44 | 0.0% |
| Armenian | 41 | 0.0% |
| Assyrian / Chaldean / Syriac | 40 | 0.0% |
| Austrian | 103 | 0.1% |
| Bahamian | 22 | 0.0% |
| Bangladeshi | 70 | 0.0% |
| Barbadian | 6 | 0.0% |
| Belgian | 70 | 0.0% |
| Belizean | 43 | 0.0% |
| Bhutanese | 520 | 0.3% |
| Blackfeet | 136 | 0.1% |
| Bolivian | 33 | 0.0% |
| British | 1,268 | 0.6% |
| British West Indian | 9 | 0.0% |
| Burmese | 353 | 0.2% |
| Cajun | 8 | 0.0% |
| Cambodian | 45 | 0.0% |
| Canadian | 62 | 0.0% |
| Celtic | 14 | 0.0% |
| Central American | 2,857 | 1.4% |
| Central American Indian | 6 | 0.0% |
| Cherokee | 669 | 0.3% |
| Cheyenne | 32 | 0.0% |
| Chickasaw | 10 | 0.0% |
| Chilean | 248 | 0.1% |
| Choctaw | 193 | 0.1% |
| Colombian | 77 | 0.0% |
| Costa Rican | 33 | 0.0% |
| Croatian | 81 | 0.0% |
| Cuban | 278 | 0.1% |
| Czech | 619 | 0.3% |
| Czechoslovakian | 100 | 0.1% |
| Danish | 263 | 0.1% |
| Dominican | 12 | 0.0% |
| Dutch | 868 | 0.4% |
| Eastern European | 284 | 0.1% |
| Ecuadorian | 8 | 0.0% |
| Egyptian | 291 | 0.1% |
| English | 19,963 | 9.9% |
| Estonian | 14 | 0.0% |
| European | 3,676 | 1.8% |
| Fijian | 43 | 0.0% |
| Finnish | 33 | 0.0% |
| French | 2,569 | 1.3% |
| French Canadian | 318 | 0.2% |
| German | 15,088 | 7.5% |
| German Russian | 5 | 0.0% |
| Ghanaian | 238 | 0.1% |
| Greek | 159 | 0.1% |
| Guatemalan | 946 | 0.5% |
| Guyanese | 52 | 0.0% |
| Haitian | 91 | 0.1% |
| Honduran | 352 | 0.2% |
| Hungarian | 142 | 0.1% |
| Indian (Asian) | 841 | 0.4% |
| Inupiat | 21 | 0.0% |
| Iranian | 243 | 0.1% |
| Irish | 12,539 | 6.2% |
| Iroquois | 13 | 0.0% |
| Israeli | 62 | 0.0% |
| Italian | 2,211 | 1.1% |
| Jamaican | 121 | 0.1% |
| Jordanian | 27 | 0.0% |
| Kenyan | 32 | 0.0% |
| Korean | 958 | 0.5% |
| Laotian | 232 | 0.1% |
| Latvian | 15 | 0.0% |
| Lebanese | 89 | 0.0% |
| Lithuanian | 131 | 0.1% |
| Luxembourger | 18 | 0.0% |
| Macedonian | 26 | 0.0% |
| Malaysian | 56 | 0.0% |
| Mexican | 10,307 | 5.1% |
| Mexican American Indian | 344 | 0.2% |
| Mongolian | 7 | 0.0% |
| Moroccan | 63 | 0.0% |
| Native Hawaiian | 64 | 0.0% |
| Nicaraguan | 453 | 0.2% |
| Nigerian | 205 | 0.1% |
| Northern European | 275 | 0.1% |
| Norwegian | 1,158 | 0.6% |
| Osage | 63 | 0.0% |
| Pakistani | 144 | 0.1% |
| Panamanian | 43 | 0.0% |
| Pennsylvania German | 10 | 0.0% |
| Polish | 1,368 | 0.7% |
| Portuguese | 59 | 0.0% |
| Potawatomi | 5 | 0.0% |
| Puerto Rican | 266 | 0.1% |
| Romanian | 86 | 0.0% |
| Russian | 266 | 0.1% |
| Salvadoran | 887 | 0.4% |
| Scandinavian | 362 | 0.2% |
| Scotch-Irish | 2,360 | 1.2% |
| Scottish | 3,690 | 1.8% |
| Sioux | 6 | 0.0% |
| Slavic | 36 | 0.0% |
| Slovak | 9 | 0.0% |
| Slovene | 26 | 0.0% |
| South African | 106 | 0.1% |
| South American | 676 | 0.3% |
| South American Indian | 7 | 0.0% |
| Spaniard | 55 | 0.0% |
| Spanish | 286 | 0.1% |
| Spanish American | 7 | 0.0% |
| Sri Lankan | 554 | 0.3% |
| Subsaharan African | 6,625 | 3.3% |
| Swedish | 893 | 0.4% |
| Swiss | 490 | 0.2% |
| Syrian | 180 | 0.1% |
| Thai | 2,239 | 1.1% |
| Trinidadian and Tobagonian | 55 | 0.0% |
| Turkish | 73 | 0.0% |
| U.S. Virgin Islander | 13 | 0.0% |
| Ukrainian | 118 | 0.1% |
| Ute | 18 | 0.0% |
| Venezuelan | 266 | 0.1% |
| Vietnamese | 38 | 0.0% |
| Welsh | 1,067 | 0.5% |
| West Indian | 317 | 0.2% |
| Yugoslavian | 17 | 0.0% | View All 125 Rows |
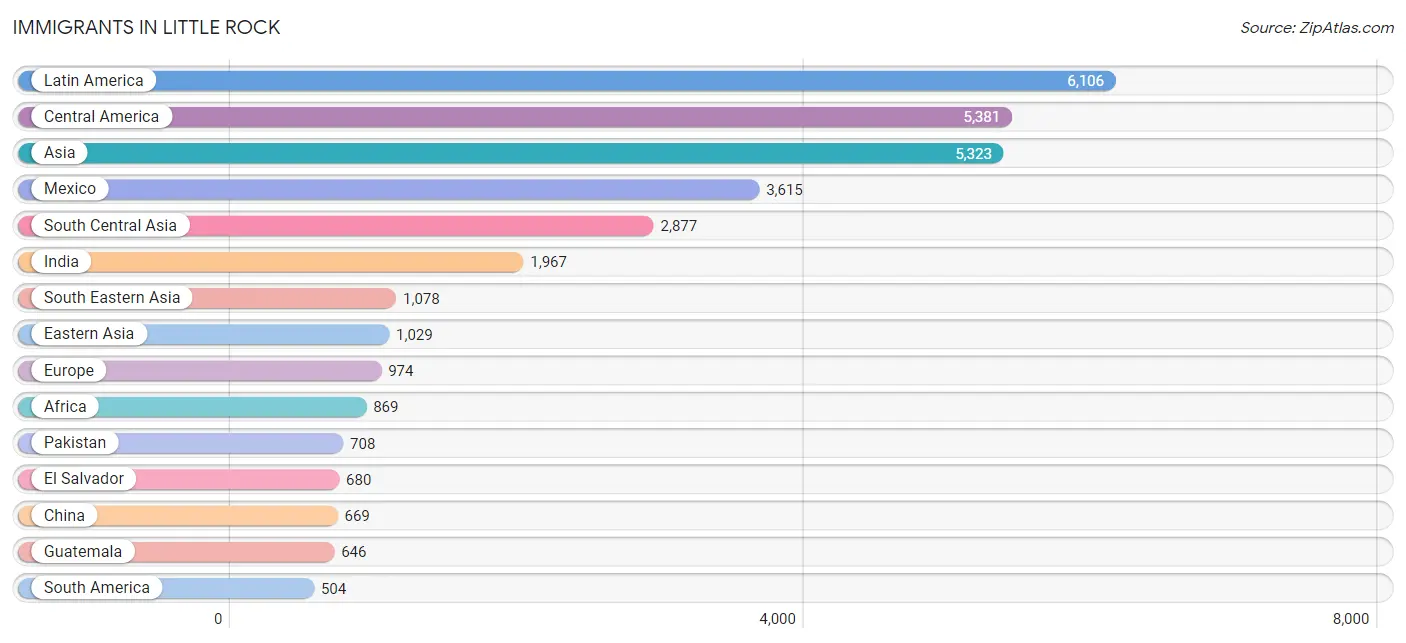
Immigrants in Little Rock
The most numerous immigrant groups reported in Little Rock came from Latin America (6,106 | 3.0%), Central America (5,381 | 2.7%), Asia (5,323 | 2.6%), Mexico (3,615 | 1.8%), and South Central Asia (2,877 | 1.4%), together accounting for 11.5% of all Little Rock residents.
| Immigration Origin | # Population | % Population |
| Africa | 869 | 0.4% |
| Argentina | 44 | 0.0% |
| Asia | 5,323 | 2.6% |
| Austria | 5 | 0.0% |
| Bahamas | 68 | 0.0% |
| Bangladesh | 53 | 0.0% |
| Barbados | 20 | 0.0% |
| Belarus | 56 | 0.0% |
| Belgium | 17 | 0.0% |
| Belize | 16 | 0.0% |
| Bolivia | 14 | 0.0% |
| Brazil | 35 | 0.0% |
| Cameroon | 28 | 0.0% |
| Canada | 100 | 0.1% |
| Caribbean | 221 | 0.1% |
| Central America | 5,381 | 2.7% |
| Chile | 35 | 0.0% |
| China | 669 | 0.3% |
| Colombia | 61 | 0.0% |
| Costa Rica | 33 | 0.0% |
| Cuba | 67 | 0.0% |
| Dominica | 9 | 0.0% |
| Dominican Republic | 12 | 0.0% |
| Eastern Africa | 136 | 0.1% |
| Eastern Asia | 1,029 | 0.5% |
| Eastern Europe | 230 | 0.1% |
| Ecuador | 8 | 0.0% |
| Egypt | 140 | 0.1% |
| El Salvador | 680 | 0.3% |
| England | 96 | 0.1% |
| Europe | 974 | 0.5% |
| France | 150 | 0.1% |
| Germany | 131 | 0.1% |
| Ghana | 170 | 0.1% |
| Greece | 11 | 0.0% |
| Guatemala | 646 | 0.3% |
| Guyana | 29 | 0.0% |
| Honduras | 223 | 0.1% |
| Hungary | 7 | 0.0% |
| India | 1,967 | 1.0% |
| Indonesia | 212 | 0.1% |
| Iran | 111 | 0.1% |
| Iraq | 51 | 0.0% |
| Ireland | 77 | 0.0% |
| Israel | 36 | 0.0% |
| Italy | 53 | 0.0% |
| Japan | 62 | 0.0% |
| Jordan | 74 | 0.0% |
| Kenya | 78 | 0.0% |
| Korea | 253 | 0.1% |
| Kuwait | 25 | 0.0% |
| Laos | 7 | 0.0% |
| Latin America | 6,106 | 3.0% |
| Malaysia | 7 | 0.0% |
| Mexico | 3,615 | 1.8% |
| Middle Africa | 28 | 0.0% |
| Morocco | 38 | 0.0% |
| Nepal | 13 | 0.0% |
| Netherlands | 12 | 0.0% |
| Nicaragua | 164 | 0.1% |
| Nigeria | 205 | 0.1% |
| Northern Africa | 178 | 0.1% |
| Northern Europe | 328 | 0.2% |
| Norway | 59 | 0.0% |
| Oceania | 52 | 0.0% |
| Pakistan | 708 | 0.4% |
| Panama | 4 | 0.0% |
| Philippines | 451 | 0.2% |
| Poland | 56 | 0.0% |
| Romania | 10 | 0.0% |
| Russia | 36 | 0.0% |
| Saudi Arabia | 26 | 0.0% |
| Scotland | 27 | 0.0% |
| South Africa | 106 | 0.1% |
| South America | 504 | 0.3% |
| South Central Asia | 2,877 | 1.4% |
| South Eastern Asia | 1,078 | 0.5% |
| Southern Europe | 80 | 0.0% |
| Spain | 16 | 0.0% |
| Sri Lanka | 25 | 0.0% |
| Sweden | 19 | 0.0% |
| Switzerland | 14 | 0.0% |
| Syria | 50 | 0.0% |
| Taiwan | 45 | 0.0% |
| Thailand | 60 | 0.0% |
| Trinidad and Tobago | 45 | 0.0% |
| Turkey | 40 | 0.0% |
| Ukraine | 20 | 0.0% |
| Venezuela | 238 | 0.1% |
| Vietnam | 325 | 0.2% |
| Western Africa | 421 | 0.2% |
| Western Asia | 339 | 0.2% |
| Western Europe | 329 | 0.2% | View All 93 Rows |
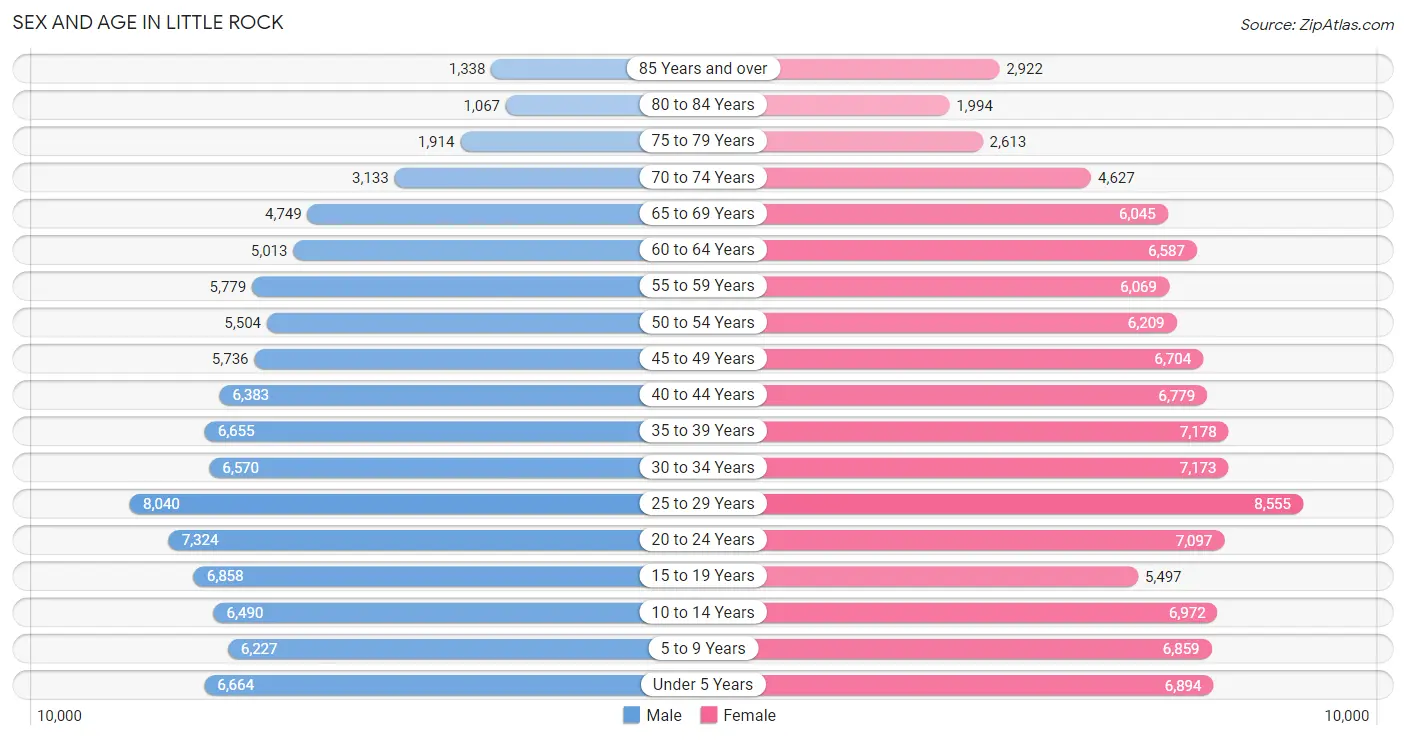
Sex and Age in Little Rock
Sex and Age in Little Rock
The most populous age groups in Little Rock are 25 to 29 Years (8,040 | 8.4%) for men and 25 to 29 Years (8,555 | 8.0%) for women.
| Age Bracket | Male | Female |
| Under 5 Years | 6,664 (7.0%) | 6,894 (6.5%) |
| 5 to 9 Years | 6,227 (6.5%) | 6,859 (6.4%) |
| 10 to 14 Years | 6,490 (6.8%) | 6,972 (6.5%) |
| 15 to 19 Years | 6,858 (7.2%) | 5,497 (5.1%) |
| 20 to 24 Years | 7,324 (7.7%) | 7,097 (6.7%) |
| 25 to 29 Years | 8,040 (8.4%) | 8,555 (8.0%) |
| 30 to 34 Years | 6,570 (6.9%) | 7,173 (6.7%) |
| 35 to 39 Years | 6,655 (7.0%) | 7,178 (6.7%) |
| 40 to 44 Years | 6,383 (6.7%) | 6,779 (6.4%) |
| 45 to 49 Years | 5,736 (6.0%) | 6,704 (6.3%) |
| 50 to 54 Years | 5,504 (5.8%) | 6,209 (5.8%) |
| 55 to 59 Years | 5,779 (6.0%) | 6,069 (5.7%) |
| 60 to 64 Years | 5,013 (5.2%) | 6,587 (6.2%) |
| 65 to 69 Years | 4,749 (5.0%) | 6,045 (5.7%) |
| 70 to 74 Years | 3,133 (3.3%) | 4,627 (4.3%) |
| 75 to 79 Years | 1,914 (2.0%) | 2,613 (2.5%) |
| 80 to 84 Years | 1,067 (1.1%) | 1,994 (1.9%) |
| 85 Years and over | 1,338 (1.4%) | 2,922 (2.7%) |
| Total | 95,444 (100.0%) | 106,774 (100.0%) |
Families and Households in Little Rock
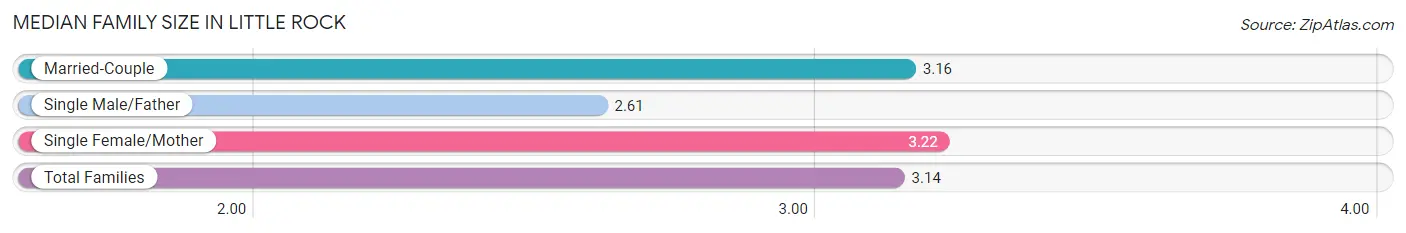
Median Family Size in Little Rock
The median family size in Little Rock is 3.14 persons per family, with single female/mother families (14,389 | 30.5%) accounting for the largest median family size of 3.22 persons per family. On the other hand, single male/father families (3,072 | 6.5%) represent the smallest median family size with 2.61 persons per family.
| Family Type | # Families | Family Size |
| Married-Couple | 29,779 (63.0%) | 3.16 |
| Single Male/Father | 3,072 (6.5%) | 2.61 |
| Single Female/Mother | 14,389 (30.5%) | 3.22 |
| Total Families | 47,240 (100.0%) | 3.14 |
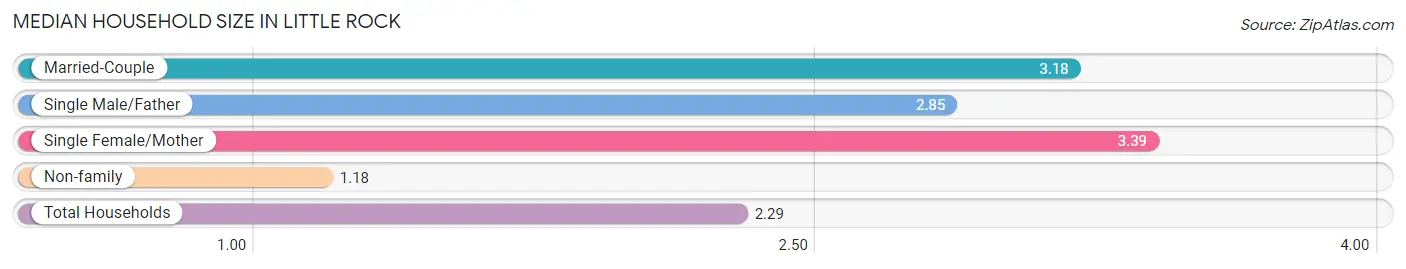
Median Household Size in Little Rock
The median household size in Little Rock is 2.29 persons per household, with single female/mother households (14,389 | 16.7%) accounting for the largest median household size of 3.39 persons per household. non-family households (39,125 | 45.3%) represent the smallest median household size with 1.18 persons per household.
| Household Type | # Households | Household Size |
| Married-Couple | 29,779 (34.5%) | 3.18 |
| Single Male/Father | 3,072 (3.6%) | 2.85 |
| Single Female/Mother | 14,389 (16.7%) | 3.39 |
| Non-family | 39,125 (45.3%) | 1.18 |
| Total Households | 86,365 (100.0%) | 2.29 |
Household Size by Marriage Status in Little Rock
Out of a total of 86,365 households in Little Rock, 47,240 (54.7%) are family households, while 39,125 (45.3%) are nonfamily households. The most numerous type of family households are 2-person households, comprising 22,234, and the most common type of nonfamily households are 1-person households, comprising 33,867.
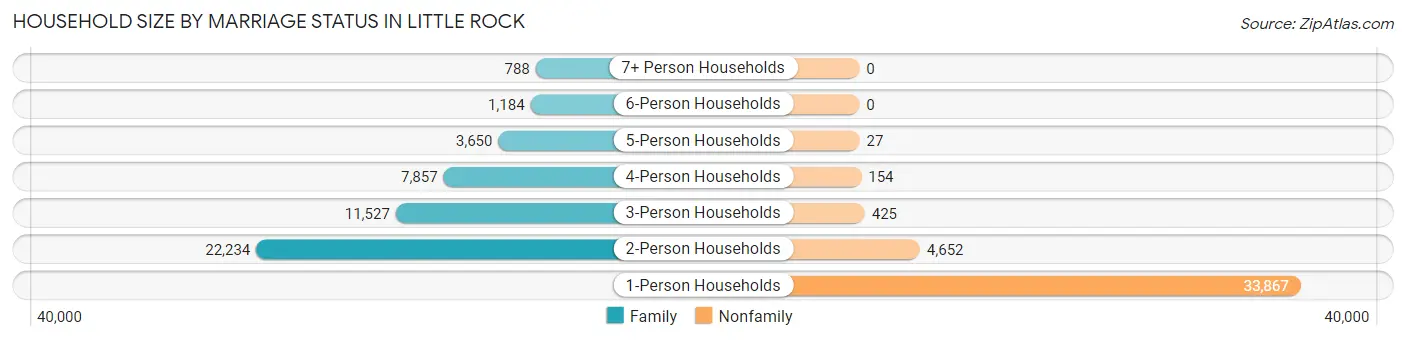
| Household Size | Family Households | Nonfamily Households |
| 1-Person Households | - | 33,867 (39.2%) |
| 2-Person Households | 22,234 (25.7%) | 4,652 (5.4%) |
| 3-Person Households | 11,527 (13.4%) | 425 (0.5%) |
| 4-Person Households | 7,857 (9.1%) | 154 (0.2%) |
| 5-Person Households | 3,650 (4.2%) | 27 (0.0%) |
| 6-Person Households | 1,184 (1.4%) | 0 (0.0%) |
| 7+ Person Households | 788 (0.9%) | 0 (0.0%) |
| Total | 47,240 (54.7%) | 39,125 (45.3%) |
Female Fertility in Little Rock
Fertility by Age in Little Rock
Average fertility rate in Little Rock is 53.0 births per 1,000 women. Women in the age bracket of 20 to 34 years have the highest fertility rate with 84.0 births per 1,000 women. Women in the age bracket of 20 to 34 years acount for 72.3% of all women with births.
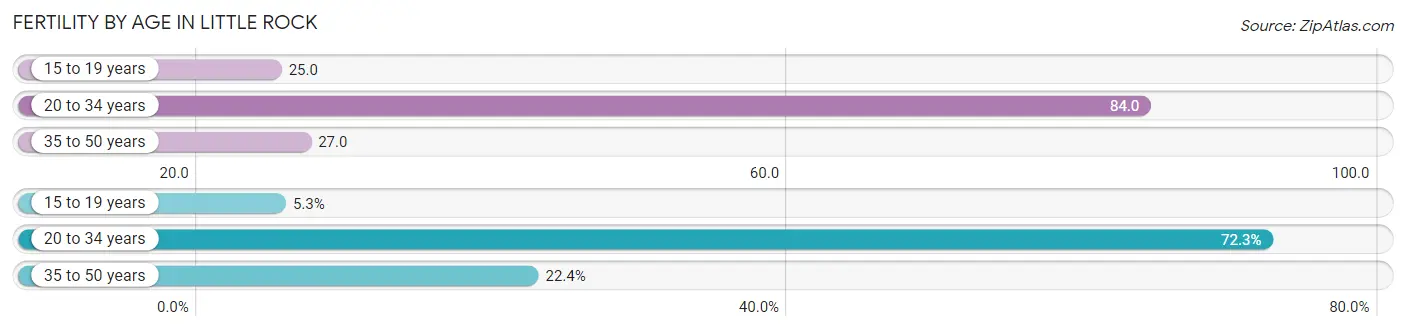
| Age Bracket | Women with Births | Births / 1,000 Women |
| 15 to 19 years | 140 (5.3%) | 25.0 |
| 20 to 34 years | 1,914 (72.3%) | 84.0 |
| 35 to 50 years | 594 (22.4%) | 27.0 |
| Total | 2,648 (100.0%) | 53.0 |
Fertility by Age by Marriage Status in Little Rock
68.5% of women with births (2,648) in Little Rock are married. The highest percentage of unmarried women with births falls into 15 to 19 years age bracket with 100.0% of them unmarried at the time of birth, while the lowest percentage of unmarried women with births belong to 35 to 50 years age bracket with 14.6% of them unmarried.
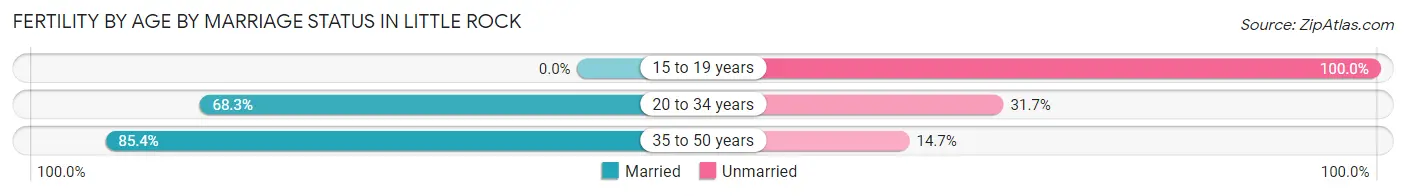
| Age Bracket | Married | Unmarried |
| 15 to 19 years | 0 (0.0%) | 140 (100.0%) |
| 20 to 34 years | 1,307 (68.3%) | 607 (31.7%) |
| 35 to 50 years | 507 (85.4%) | 87 (14.6%) |
| Total | 1,814 (68.5%) | 834 (31.5%) |
Fertility by Education in Little Rock
Average fertility rate in Little Rock is 53.0 births per 1,000 women. Women with the education attainment of graduate degree have the highest fertility rate of 82.0 births per 1,000 women, while women with the education attainment of less than high school have the lowest fertility at 43.0 births per 1,000 women. Women with the education attainment of graduate degree represent 24.9% of all women with births.
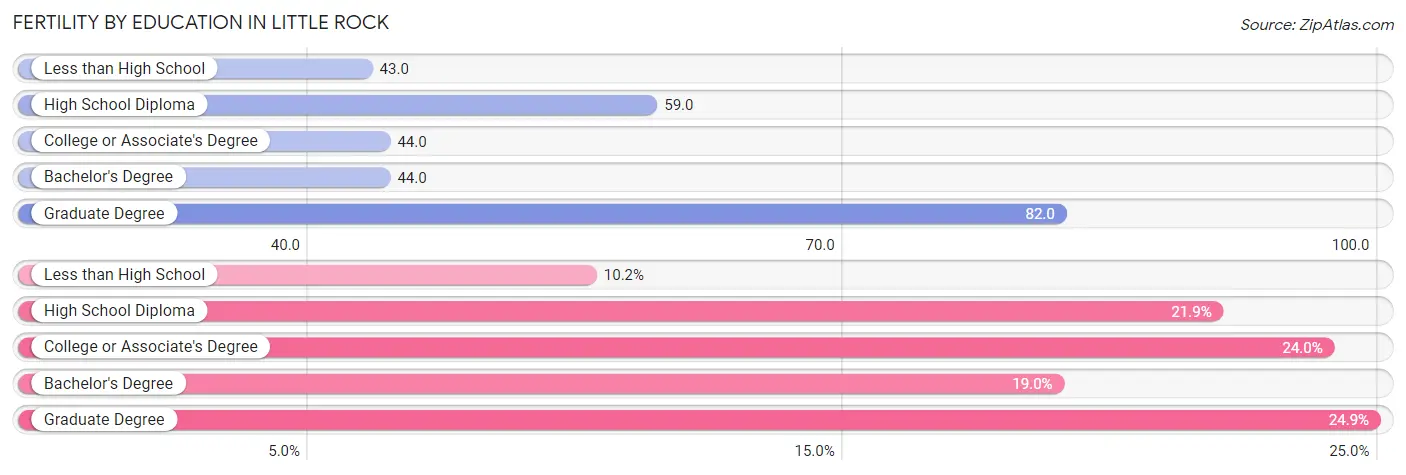
| Educational Attainment | Women with Births | Births / 1,000 Women |
| Less than High School | 270 (10.2%) | 43.0 |
| High School Diploma | 581 (21.9%) | 59.0 |
| College or Associate's Degree | 636 (24.0%) | 44.0 |
| Bachelor's Degree | 502 (19.0%) | 44.0 |
| Graduate Degree | 659 (24.9%) | 82.0 |
| Total | 2,648 (100.0%) | 53.0 |
Fertility by Education by Marriage Status in Little Rock
31.5% of women with births in Little Rock are unmarried. Women with the educational attainment of bachelor's degree are most likely to be married with 100.0% of them married at childbirth, while women with the educational attainment of less than high school are least likely to be married with 88.9% of them unmarried at childbirth.
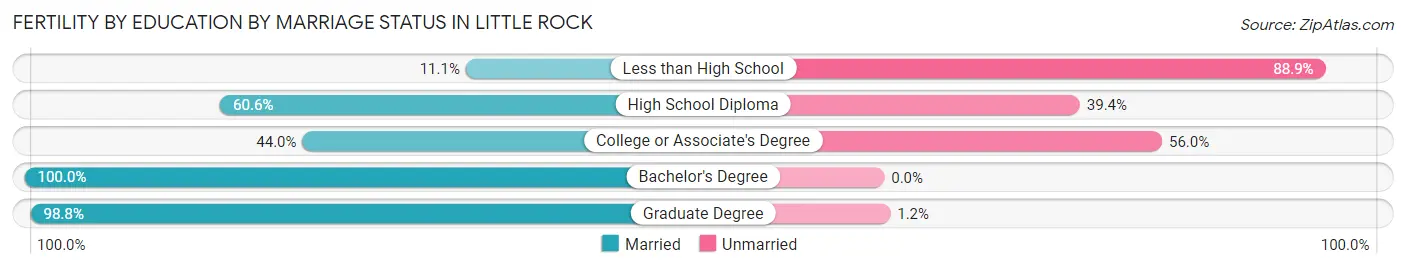
| Educational Attainment | Married | Unmarried |
| Less than High School | 30 (11.1%) | 240 (88.9%) |
| High School Diploma | 352 (60.6%) | 229 (39.4%) |
| College or Associate's Degree | 280 (44.0%) | 356 (56.0%) |
| Bachelor's Degree | 502 (100.0%) | 0 (0.0%) |
| Graduate Degree | 651 (98.8%) | 8 (1.2%) |
| Total | 1,814 (68.5%) | 834 (31.5%) |
Employment Characteristics in Little Rock
Employment by Class of Employer in Little Rock
Among the 97,701 employed individuals in Little Rock, private company employees (58,447 | 59.8%), state government employees (11,411 | 11.7%), and not-for-profit organizations (10,484 | 10.7%) make up the most common classes of employment.
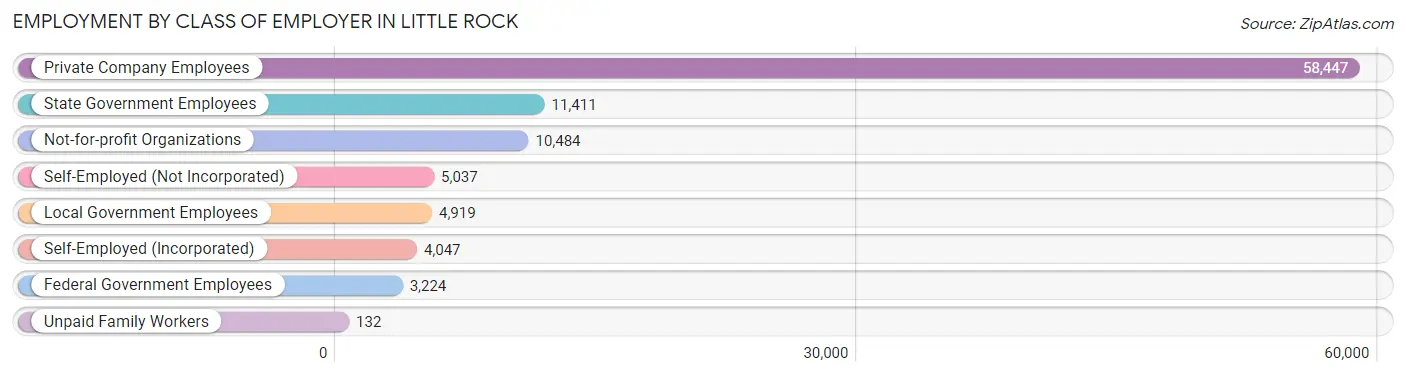
| Employer Class | # Employees | % Employees |
| Private Company Employees | 58,447 | 59.8% |
| Self-Employed (Incorporated) | 4,047 | 4.1% |
| Self-Employed (Not Incorporated) | 5,037 | 5.2% |
| Not-for-profit Organizations | 10,484 | 10.7% |
| Local Government Employees | 4,919 | 5.0% |
| State Government Employees | 11,411 | 11.7% |
| Federal Government Employees | 3,224 | 3.3% |
| Unpaid Family Workers | 132 | 0.1% |
| Total | 97,701 | 100.0% |
Employment Status by Age in Little Rock
According to the labor force statistics for Little Rock, out of the total population over 16 years of age (159,562), 64.8% or 103,396 individuals are in the labor force, with 4.4% or 4,549 of them unemployed. The age group with the highest labor force participation rate is 25 to 29 years, with 83.7% or 13,890 individuals in the labor force. Within the labor force, the 16 to 19 years age range has the highest percentage of unemployed individuals, with 8.9% or 254 of them being unemployed.
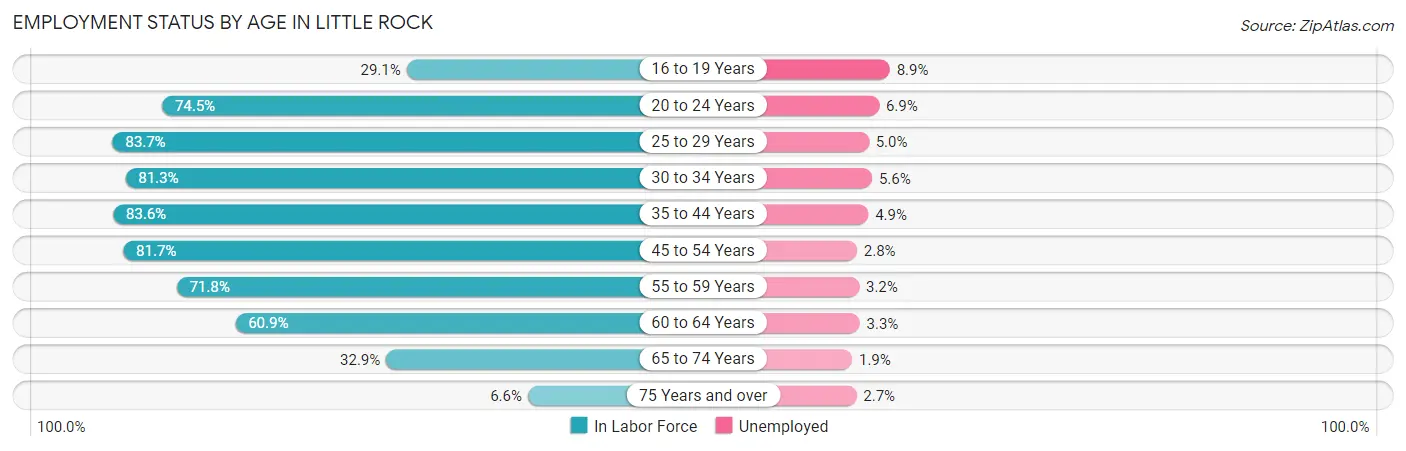
| Age Bracket | In Labor Force | Unemployed |
| 16 to 19 Years | 2,853 (29.1%) | 254 (8.9%) |
| 20 to 24 Years | 10,744 (74.5%) | 741 (6.9%) |
| 25 to 29 Years | 13,890 (83.7%) | 694 (5.0%) |
| 30 to 34 Years | 11,173 (81.3%) | 626 (5.6%) |
| 35 to 44 Years | 22,568 (83.6%) | 1,106 (4.9%) |
| 45 to 54 Years | 19,733 (81.7%) | 553 (2.8%) |
| 55 to 59 Years | 8,507 (71.8%) | 272 (3.2%) |
| 60 to 64 Years | 7,064 (60.9%) | 233 (3.3%) |
| 65 to 74 Years | 6,104 (32.9%) | 116 (1.9%) |
| 75 Years and over | 782 (6.6%) | 21 (2.7%) |
| Total | 103,396 (64.8%) | 4,549 (4.4%) |
Employment Status by Educational Attainment in Little Rock
According to labor force statistics for Little Rock, 79.0% of individuals (82,898) out of the total population between 25 and 64 years of age (104,934) are in the labor force, with 4.2% or 3,482 of them being unemployed. The group with the highest labor force participation rate are those with the educational attainment of bachelor's degree or higher, with 88.7% or 41,018 individuals in the labor force. Within the labor force, individuals with less than high school education have the highest percentage of unemployment, with 16.5% or 661 of them being unemployed.
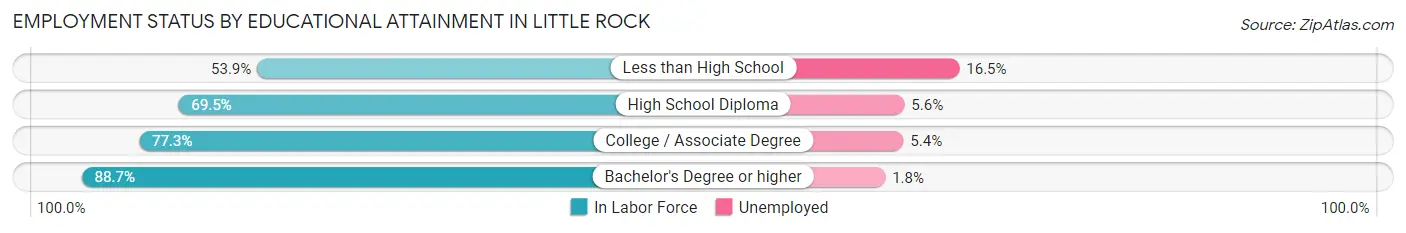
| Educational Attainment | In Labor Force | Unemployed |
| Less than High School | 4,005 (53.9%) | 1,226 (16.5%) |
| High School Diploma | 15,394 (69.5%) | 1,240 (5.6%) |
| College / Associate Degree | 22,504 (77.3%) | 1,572 (5.4%) |
| Bachelor's Degree or higher | 41,018 (88.7%) | 832 (1.8%) |
| Total | 82,898 (79.0%) | 4,407 (4.2%) |
Employment Occupations by Sex in Little Rock
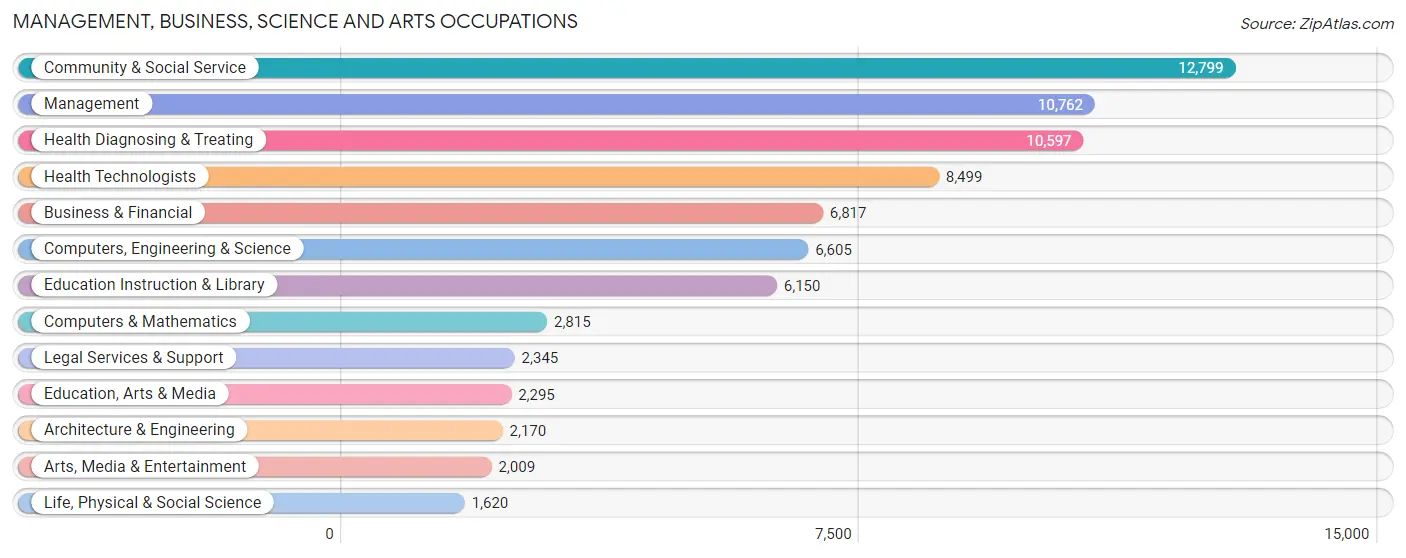
Management, Business, Science and Arts Occupations
The most common Management, Business, Science and Arts occupations in Little Rock are Community & Social Service (12,799 | 13.0%), Management (10,762 | 10.9%), Health Diagnosing & Treating (10,597 | 10.7%), Health Technologists (8,499 | 8.6%), and Business & Financial (6,817 | 6.9%).
Management, Business, Science and Arts Occupations by Sex
Within the Management, Business, Science and Arts occupations in Little Rock, the most male-oriented occupations are Architecture & Engineering (73.4%), Computers & Mathematics (70.1%), and Computers, Engineering & Science (64.1%), while the most female-oriented occupations are Education Instruction & Library (73.4%), Health Diagnosing & Treating (66.2%), and Health Technologists (64.6%).
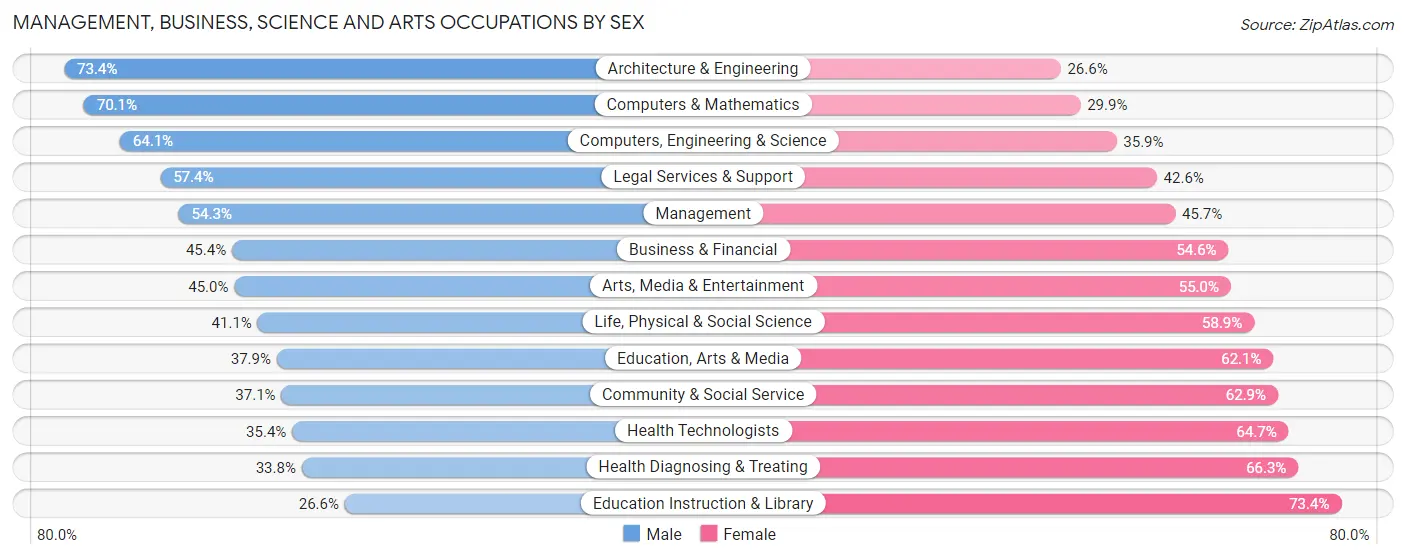
| Occupation | Male | Female |
| Management | 5,842 (54.3%) | 4,920 (45.7%) |
| Business & Financial | 3,094 (45.4%) | 3,723 (54.6%) |
| Computers, Engineering & Science | 4,233 (64.1%) | 2,372 (35.9%) |
| Computers & Mathematics | 1,974 (70.1%) | 841 (29.9%) |
| Architecture & Engineering | 1,593 (73.4%) | 577 (26.6%) |
| Life, Physical & Social Science | 666 (41.1%) | 954 (58.9%) |
| Community & Social Service | 4,753 (37.1%) | 8,046 (62.9%) |
| Education, Arts & Media | 870 (37.9%) | 1,425 (62.1%) |
| Legal Services & Support | 1,345 (57.4%) | 1,000 (42.6%) |
| Education Instruction & Library | 1,634 (26.6%) | 4,516 (73.4%) |
| Arts, Media & Entertainment | 904 (45.0%) | 1,105 (55.0%) |
| Health Diagnosing & Treating | 3,577 (33.8%) | 7,020 (66.2%) |
| Health Technologists | 3,004 (35.3%) | 5,495 (64.6%) |
| Total (Category) | 21,499 (45.2%) | 26,081 (54.8%) |
| Total (Overall) | 48,468 (49.2%) | 50,127 (50.8%) |
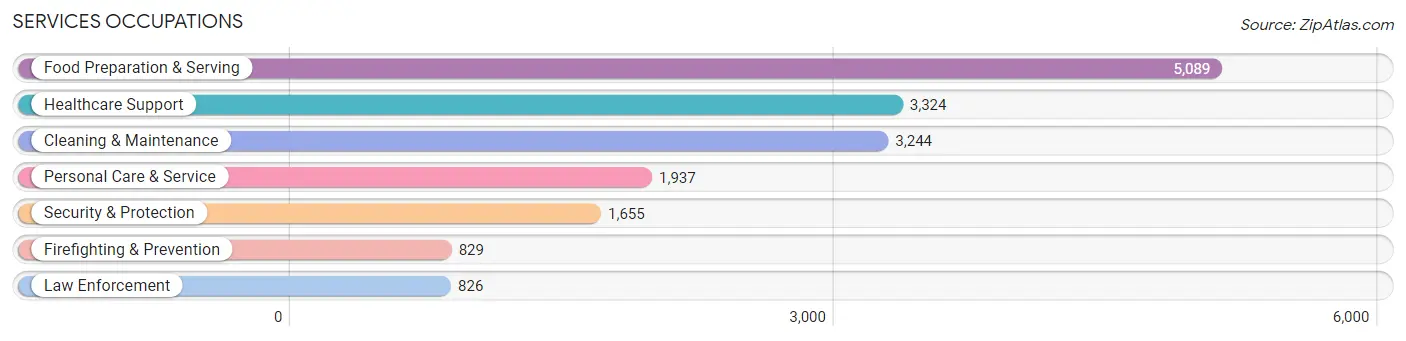
Services Occupations
The most common Services occupations in Little Rock are Food Preparation & Serving (5,089 | 5.2%), Healthcare Support (3,324 | 3.4%), Cleaning & Maintenance (3,244 | 3.3%), Personal Care & Service (1,937 | 2.0%), and Security & Protection (1,655 | 1.7%).
Services Occupations by Sex
Within the Services occupations in Little Rock, the most male-oriented occupations are Firefighting & Prevention (79.7%), Security & Protection (68.1%), and Cleaning & Maintenance (58.5%), while the most female-oriented occupations are Healthcare Support (85.8%), Personal Care & Service (58.4%), and Food Preparation & Serving (49.0%).
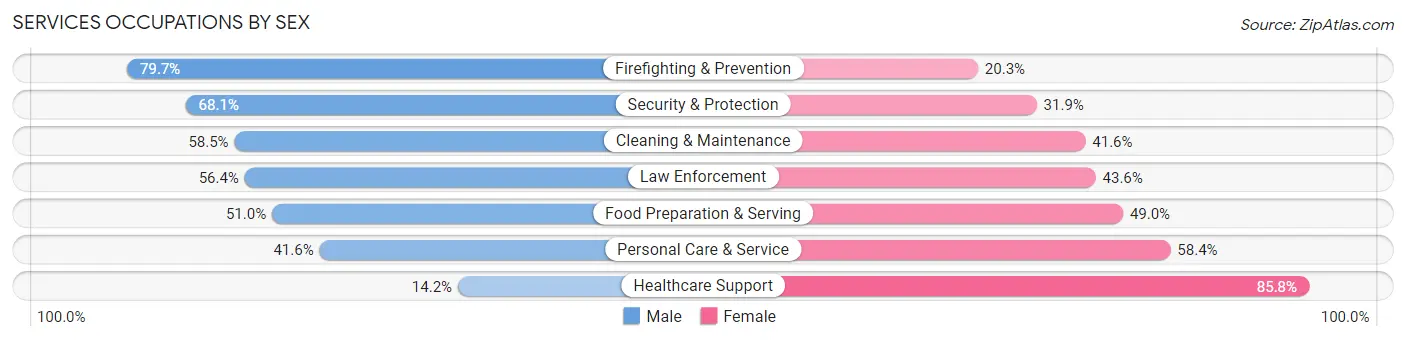
| Occupation | Male | Female |
| Healthcare Support | 472 (14.2%) | 2,852 (85.8%) |
| Security & Protection | 1,127 (68.1%) | 528 (31.9%) |
| Firefighting & Prevention | 661 (79.7%) | 168 (20.3%) |
| Law Enforcement | 466 (56.4%) | 360 (43.6%) |
| Food Preparation & Serving | 2,596 (51.0%) | 2,493 (49.0%) |
| Cleaning & Maintenance | 1,896 (58.5%) | 1,348 (41.5%) |
| Personal Care & Service | 806 (41.6%) | 1,131 (58.4%) |
| Total (Category) | 6,897 (45.2%) | 8,352 (54.8%) |
| Total (Overall) | 48,468 (49.2%) | 50,127 (50.8%) |
Sales and Office Occupations
The most common Sales and Office occupations in Little Rock are Office & Administration (10,838 | 11.0%), and Sales & Related (10,002 | 10.1%).

Sales and Office Occupations by Sex
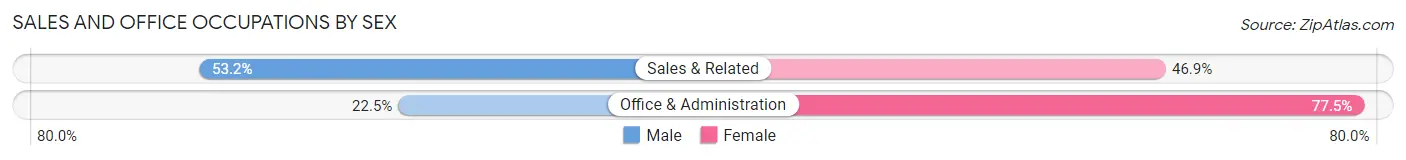
| Occupation | Male | Female |
| Sales & Related | 5,316 (53.1%) | 4,686 (46.9%) |
| Office & Administration | 2,442 (22.5%) | 8,396 (77.5%) |
| Total (Category) | 7,758 (37.2%) | 13,082 (62.8%) |
| Total (Overall) | 48,468 (49.2%) | 50,127 (50.8%) |
Natural Resources, Construction and Maintenance Occupations
The most common Natural Resources, Construction and Maintenance occupations in Little Rock are Construction & Extraction (3,079 | 3.1%), Installation, Maintenance & Repair (1,787 | 1.8%), and Farming, Fishing & Forestry (70 | 0.1%).
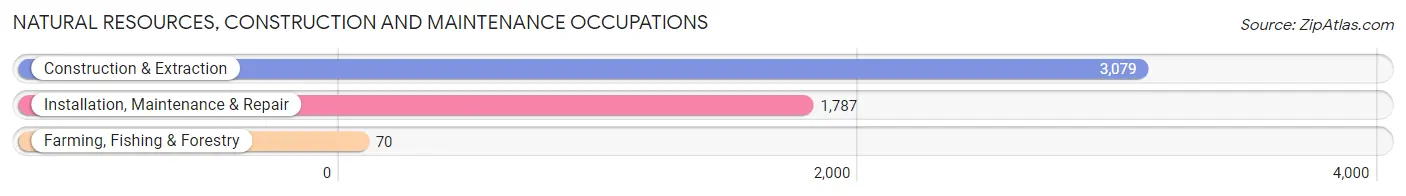
Natural Resources, Construction and Maintenance Occupations by Sex
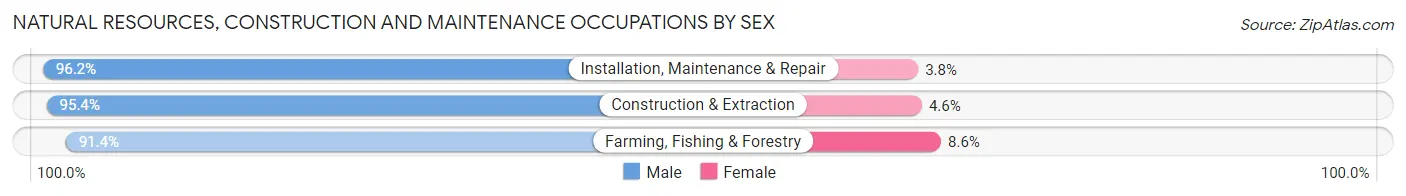
| Occupation | Male | Female |
| Farming, Fishing & Forestry | 64 (91.4%) | 6 (8.6%) |
| Construction & Extraction | 2,938 (95.4%) | 141 (4.6%) |
| Installation, Maintenance & Repair | 1,719 (96.2%) | 68 (3.8%) |
| Total (Category) | 4,721 (95.6%) | 215 (4.4%) |
| Total (Overall) | 48,468 (49.2%) | 50,127 (50.8%) |
Production, Transportation and Moving Occupations
The most common Production, Transportation and Moving occupations in Little Rock are Production (3,527 | 3.6%), Material Moving (3,466 | 3.5%), and Transportation (2,997 | 3.0%).
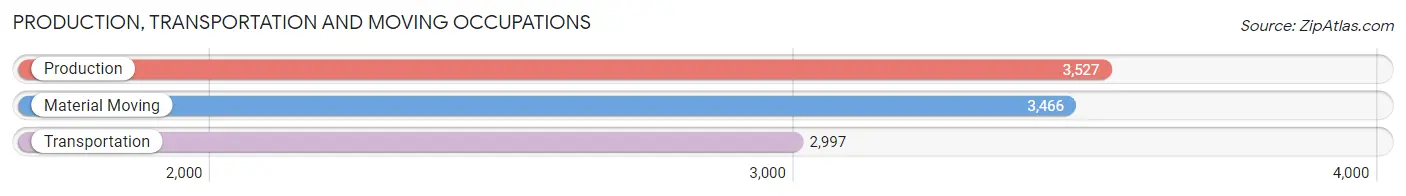
Production, Transportation and Moving Occupations by Sex
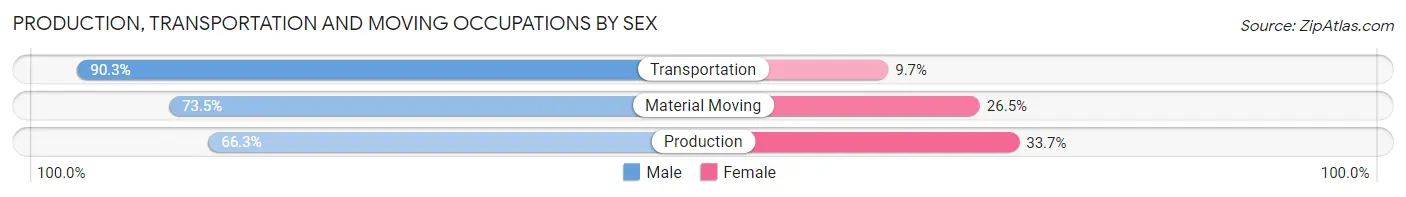
| Occupation | Male | Female |
| Production | 2,338 (66.3%) | 1,189 (33.7%) |
| Transportation | 2,707 (90.3%) | 290 (9.7%) |
| Material Moving | 2,548 (73.5%) | 918 (26.5%) |
| Total (Category) | 7,593 (76.0%) | 2,397 (24.0%) |
| Total (Overall) | 48,468 (49.2%) | 50,127 (50.8%) |
Employment Industries by Sex in Little Rock
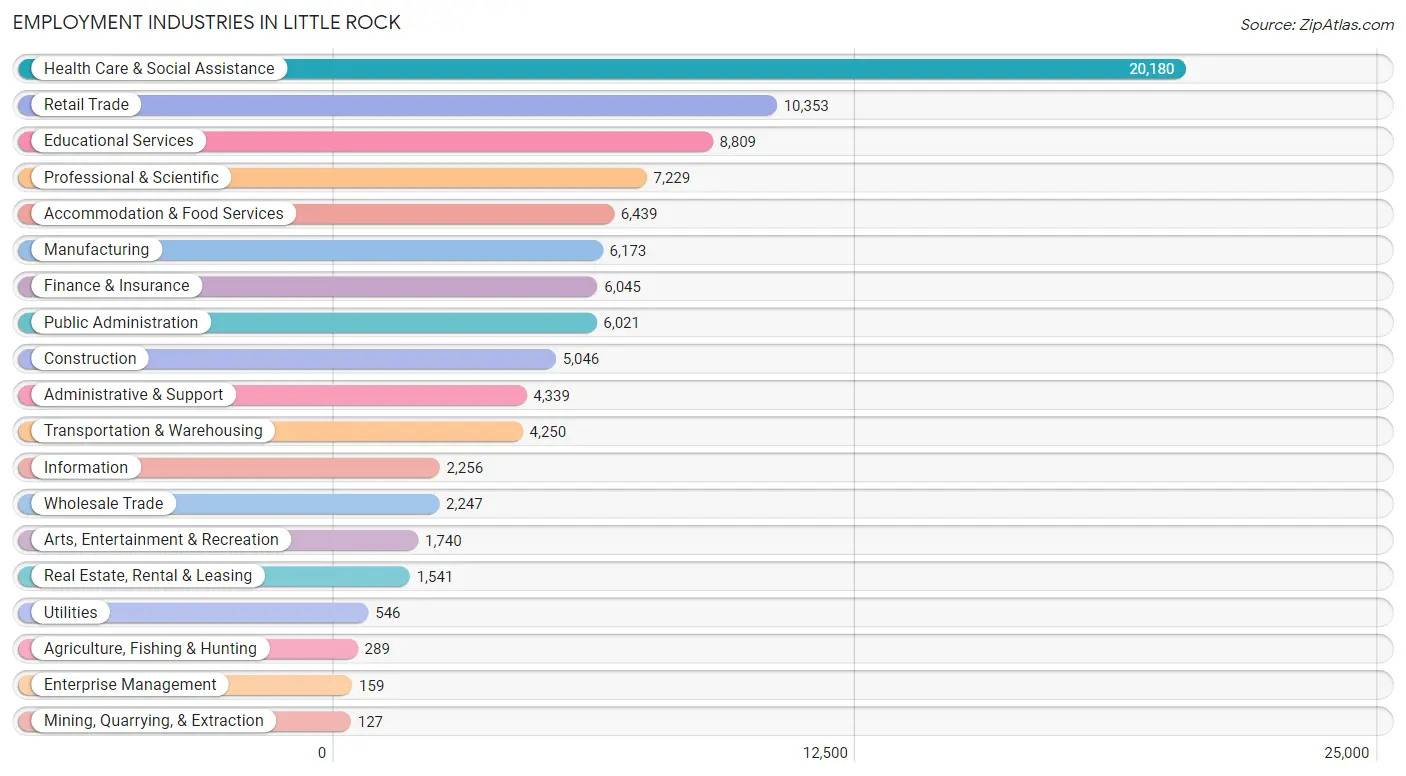
Employment Industries in Little Rock
The major employment industries in Little Rock include Health Care & Social Assistance (20,180 | 20.5%), Retail Trade (10,353 | 10.5%), Educational Services (8,809 | 8.9%), Professional & Scientific (7,229 | 7.3%), and Accommodation & Food Services (6,439 | 6.5%).
Employment Industries by Sex in Little Rock
The Little Rock industries that see more men than women are Mining, Quarrying, & Extraction (88.2%), Agriculture, Fishing & Hunting (87.2%), and Construction (85.5%), whereas the industries that tend to have a higher number of women are Health Care & Social Assistance (71.4%), Educational Services (70.8%), and Public Administration (62.5%).
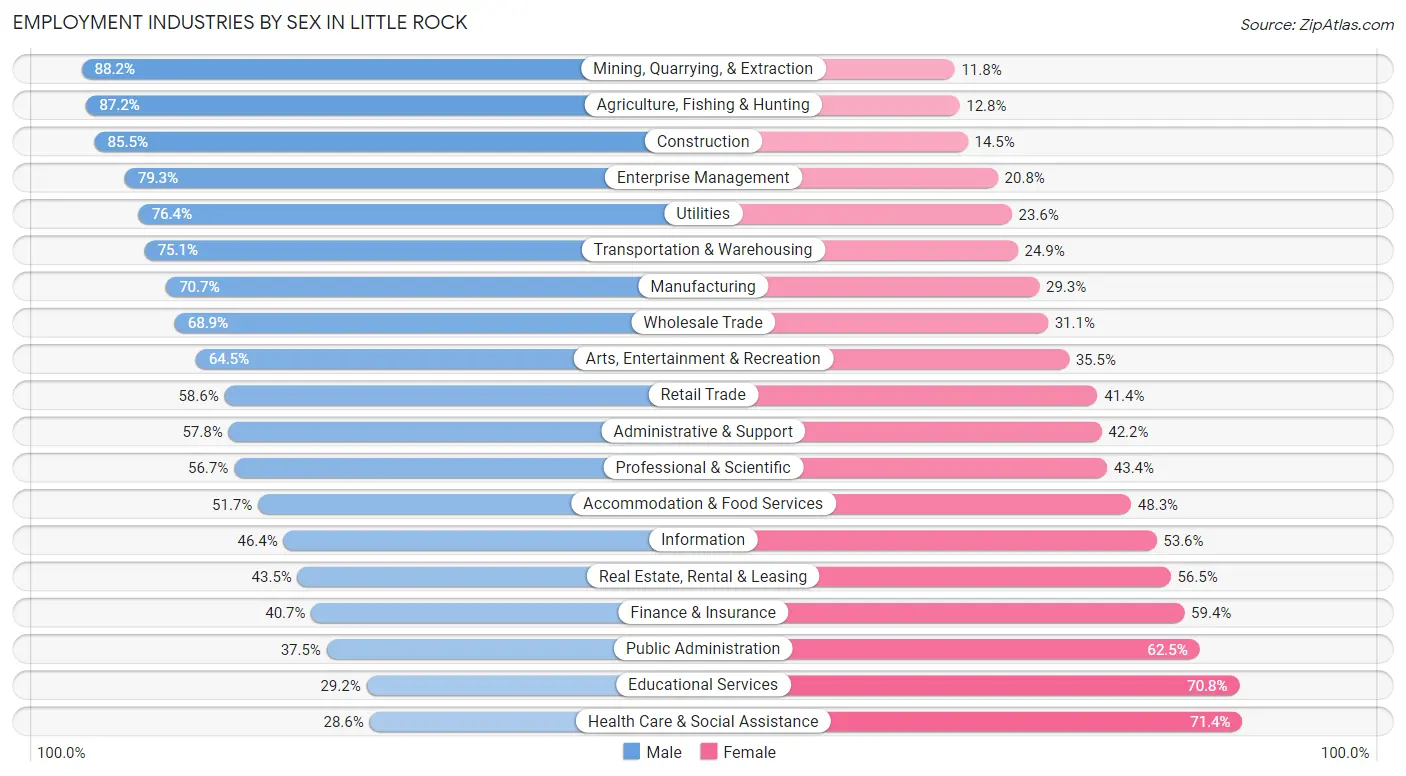
| Industry | Male | Female |
| Agriculture, Fishing & Hunting | 252 (87.2%) | 37 (12.8%) |
| Mining, Quarrying, & Extraction | 112 (88.2%) | 15 (11.8%) |
| Construction | 4,314 (85.5%) | 732 (14.5%) |
| Manufacturing | 4,363 (70.7%) | 1,810 (29.3%) |
| Wholesale Trade | 1,548 (68.9%) | 699 (31.1%) |
| Retail Trade | 6,070 (58.6%) | 4,283 (41.4%) |
| Transportation & Warehousing | 3,193 (75.1%) | 1,057 (24.9%) |
| Utilities | 417 (76.4%) | 129 (23.6%) |
| Information | 1,047 (46.4%) | 1,209 (53.6%) |
| Finance & Insurance | 2,457 (40.6%) | 3,588 (59.4%) |
| Real Estate, Rental & Leasing | 670 (43.5%) | 871 (56.5%) |
| Professional & Scientific | 4,095 (56.7%) | 3,134 (43.3%) |
| Enterprise Management | 126 (79.2%) | 33 (20.7%) |
| Administrative & Support | 2,508 (57.8%) | 1,831 (42.2%) |
| Educational Services | 2,575 (29.2%) | 6,234 (70.8%) |
| Health Care & Social Assistance | 5,771 (28.6%) | 14,409 (71.4%) |
| Arts, Entertainment & Recreation | 1,123 (64.5%) | 617 (35.5%) |
| Accommodation & Food Services | 3,327 (51.7%) | 3,112 (48.3%) |
| Public Administration | 2,256 (37.5%) | 3,765 (62.5%) |
| Total | 48,468 (49.2%) | 50,127 (50.8%) |
Education in Little Rock
School Enrollment in Little Rock
The most common levels of schooling among the 50,188 students in Little Rock are middle school (9,903 | 19.7%), high school (9,693 | 19.3%), and elementary school (9,602 | 19.1%).
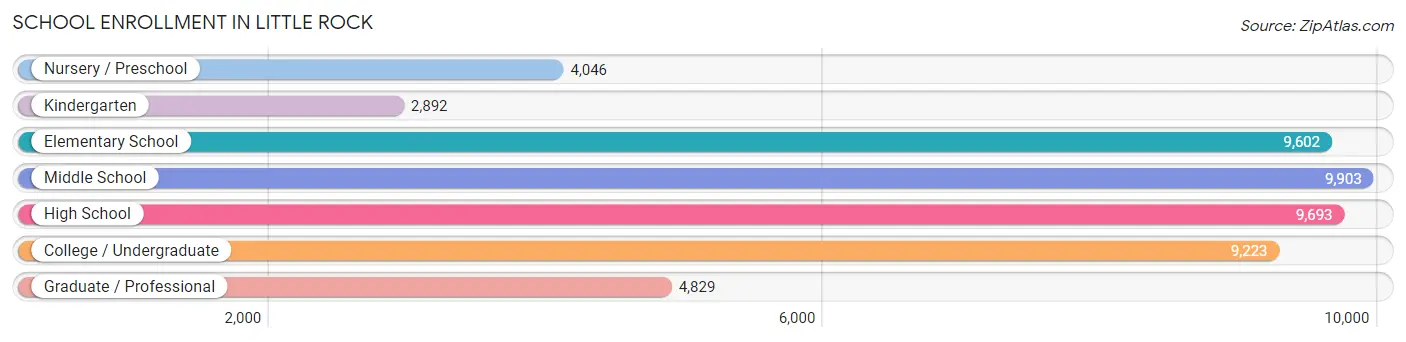
| School Level | # Students | % Students |
| Nursery / Preschool | 4,046 | 8.1% |
| Kindergarten | 2,892 | 5.8% |
| Elementary School | 9,602 | 19.1% |
| Middle School | 9,903 | 19.7% |
| High School | 9,693 | 19.3% |
| College / Undergraduate | 9,223 | 18.4% |
| Graduate / Professional | 4,829 | 9.6% |
| Total | 50,188 | 100.0% |
School Enrollment by Age by Funding Source in Little Rock
Out of a total of 50,188 students who are enrolled in schools in Little Rock, 11,192 (22.3%) attend a private institution, while the remaining 38,996 (77.7%) are enrolled in public schools. The age group of 3 to 4 year olds has the highest likelihood of being enrolled in private schools, with 1,203 (35.6% in the age bracket) enrolled. Conversely, the age group of 25 to 34 year olds has the lowest likelihood of being enrolled in a private school, with 3,510 (83.4% in the age bracket) attending a public institution.
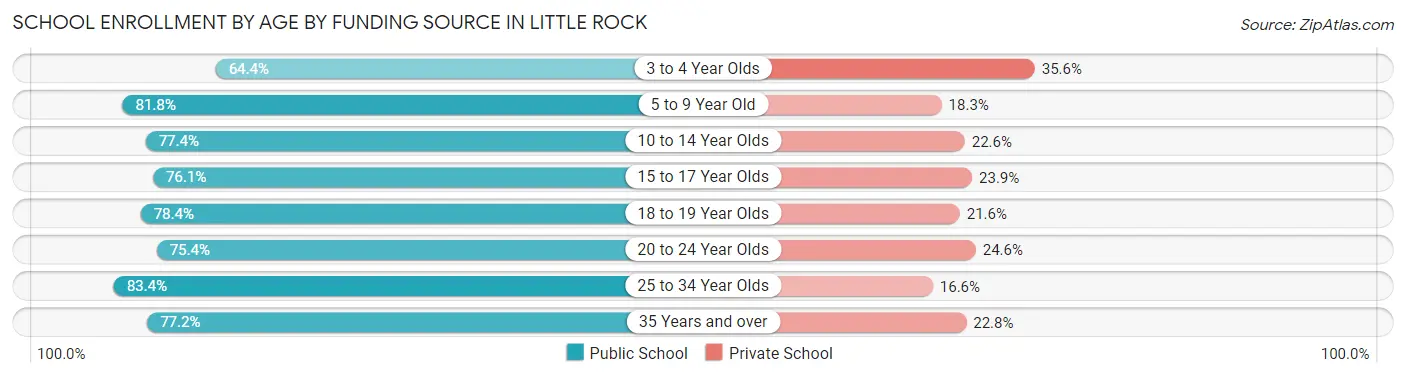
| Age Bracket | Public School | Private School |
| 3 to 4 Year Olds | 2,176 (64.4%) | 1,203 (35.6%) |
| 5 to 9 Year Old | 9,457 (81.8%) | 2,111 (18.2%) |
| 10 to 14 Year Olds | 9,748 (77.4%) | 2,839 (22.6%) |
| 15 to 17 Year Olds | 5,199 (76.1%) | 1,635 (23.9%) |
| 18 to 19 Year Olds | 2,493 (78.4%) | 688 (21.6%) |
| 20 to 24 Year Olds | 4,246 (75.4%) | 1,386 (24.6%) |
| 25 to 34 Year Olds | 3,510 (83.4%) | 699 (16.6%) |
| 35 Years and over | 2,159 (77.2%) | 639 (22.8%) |
| Total | 38,996 (77.7%) | 11,192 (22.3%) |
Educational Attainment by Field of Study in Little Rock
Business (13,081 | 20.2%), science & technology (7,261 | 11.2%), education (6,428 | 9.9%), bio, nature & agricultural (6,283 | 9.7%), and social sciences (4,580 | 7.1%) are the most common fields of study among 64,751 individuals in Little Rock who have obtained a bachelor's degree or higher.
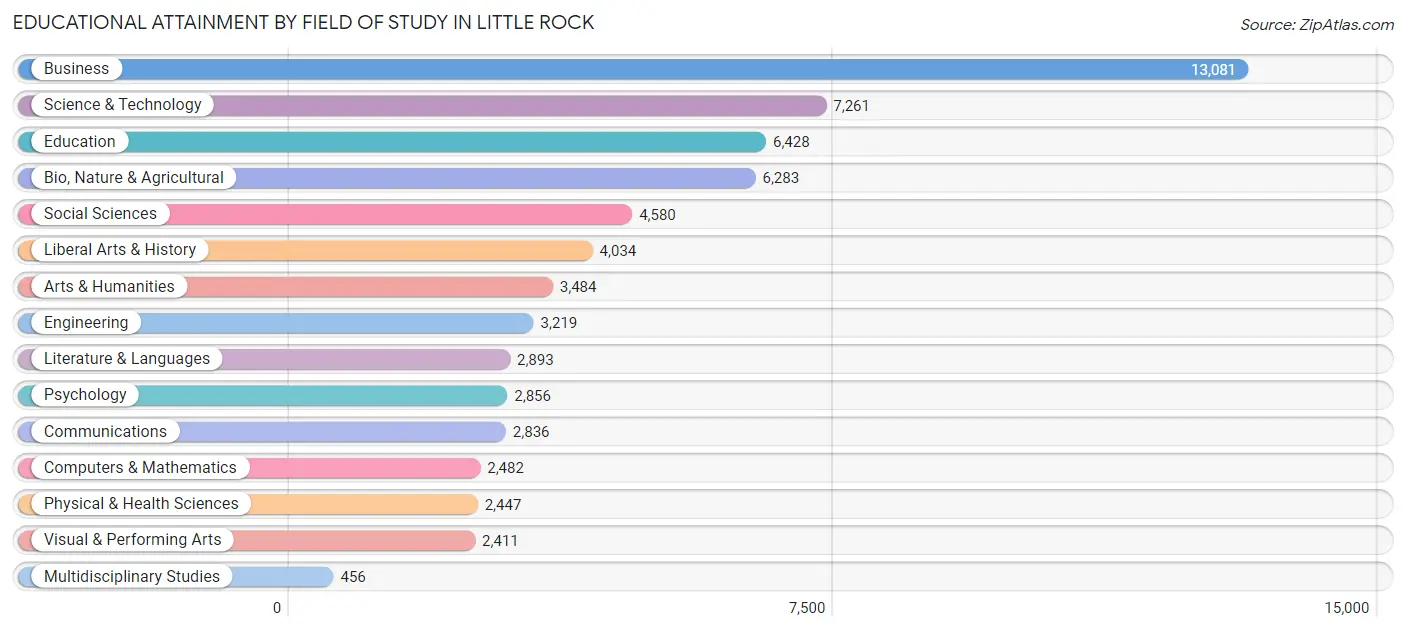
| Field of Study | # Graduates | % Graduates |
| Computers & Mathematics | 2,482 | 3.8% |
| Bio, Nature & Agricultural | 6,283 | 9.7% |
| Physical & Health Sciences | 2,447 | 3.8% |
| Psychology | 2,856 | 4.4% |
| Social Sciences | 4,580 | 7.1% |
| Engineering | 3,219 | 5.0% |
| Multidisciplinary Studies | 456 | 0.7% |
| Science & Technology | 7,261 | 11.2% |
| Business | 13,081 | 20.2% |
| Education | 6,428 | 9.9% |
| Literature & Languages | 2,893 | 4.5% |
| Liberal Arts & History | 4,034 | 6.2% |
| Visual & Performing Arts | 2,411 | 3.7% |
| Communications | 2,836 | 4.4% |
| Arts & Humanities | 3,484 | 5.4% |
| Total | 64,751 | 100.0% |
Transportation & Commute in Little Rock
Vehicle Availability by Sex in Little Rock
The most prevalent vehicle ownership categories in Little Rock are males with 2 vehicles (22,236, accounting for 46.4%) and females with 2 vehicles (20,103, making up 45.3%).
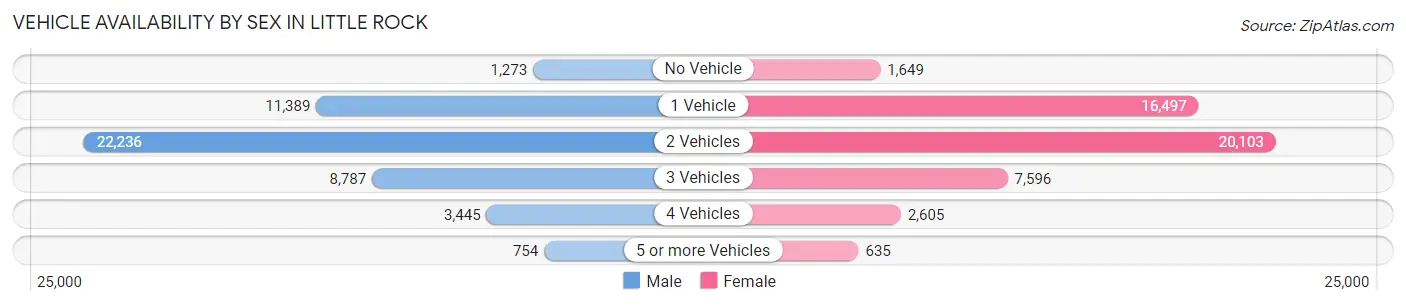
| Vehicles Available | Male | Female |
| No Vehicle | 1,273 (2.7%) | 1,649 (3.4%) |
| 1 Vehicle | 11,389 (23.8%) | 16,497 (33.6%) |
| 2 Vehicles | 22,236 (46.4%) | 20,103 (41.0%) |
| 3 Vehicles | 8,787 (18.3%) | 7,596 (15.5%) |
| 4 Vehicles | 3,445 (7.2%) | 2,605 (5.3%) |
| 5 or more Vehicles | 754 (1.6%) | 635 (1.3%) |
| Total | 47,884 (100.0%) | 49,085 (100.0%) |
Commute Time in Little Rock
The most frequently occuring commute durations in Little Rock are 15 to 19 minutes (22,914 commuters, 25.7%), 10 to 14 minutes (17,845 commuters, 20.0%), and 20 to 24 minutes (15,538 commuters, 17.4%).
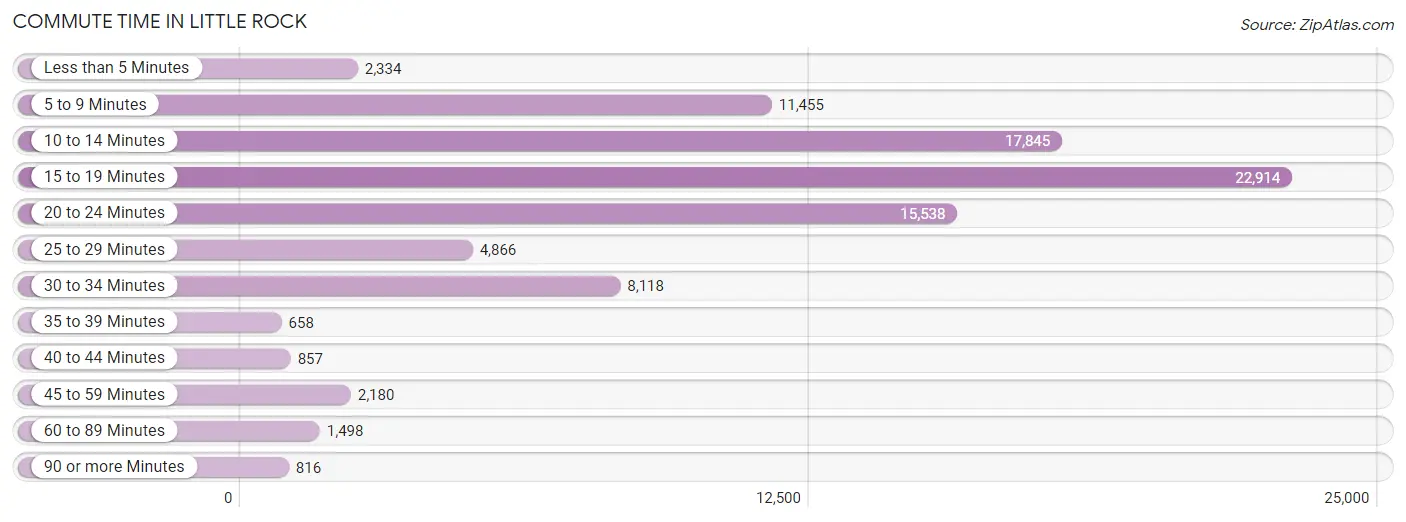
| Commute Time | # Commuters | % Commuters |
| Less than 5 Minutes | 2,334 | 2.6% |
| 5 to 9 Minutes | 11,455 | 12.9% |
| 10 to 14 Minutes | 17,845 | 20.0% |
| 15 to 19 Minutes | 22,914 | 25.7% |
| 20 to 24 Minutes | 15,538 | 17.4% |
| 25 to 29 Minutes | 4,866 | 5.5% |
| 30 to 34 Minutes | 8,118 | 9.1% |
| 35 to 39 Minutes | 658 | 0.7% |
| 40 to 44 Minutes | 857 | 1.0% |
| 45 to 59 Minutes | 2,180 | 2.5% |
| 60 to 89 Minutes | 1,498 | 1.7% |
| 90 or more Minutes | 816 | 0.9% |
Commute Time by Sex in Little Rock
The most common commute times in Little Rock are 15 to 19 minutes (12,241 commuters, 27.6%) for males and 15 to 19 minutes (10,673 commuters, 23.9%) for females.
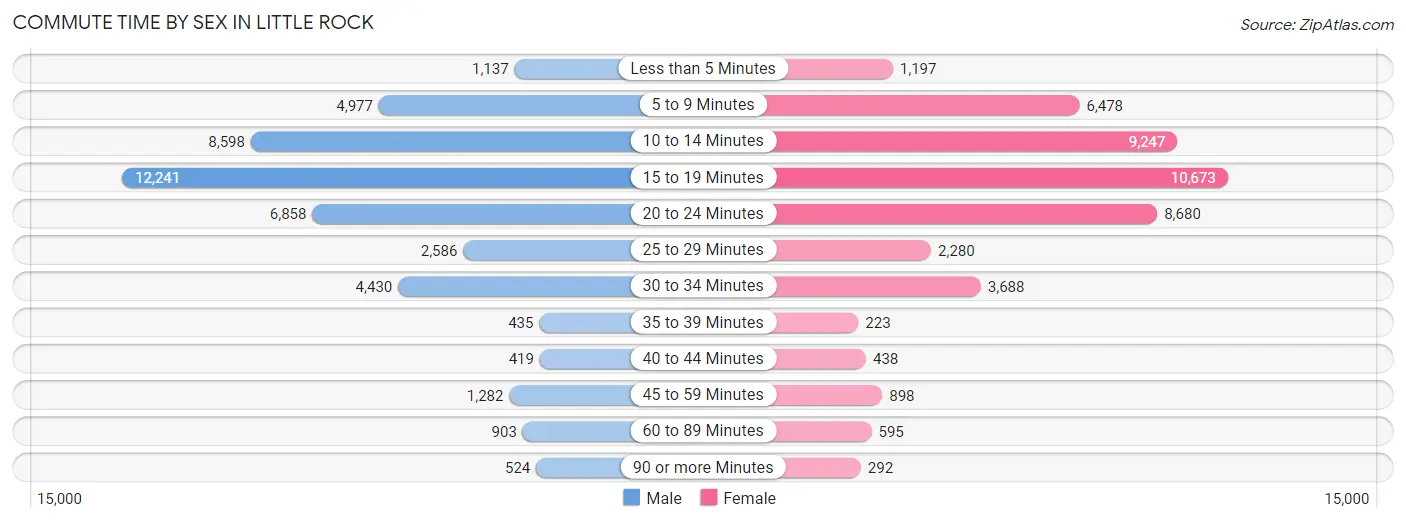
| Commute Time | Male | Female |
| Less than 5 Minutes | 1,137 (2.6%) | 1,197 (2.7%) |
| 5 to 9 Minutes | 4,977 (11.2%) | 6,478 (14.5%) |
| 10 to 14 Minutes | 8,598 (19.4%) | 9,247 (20.7%) |
| 15 to 19 Minutes | 12,241 (27.6%) | 10,673 (23.9%) |
| 20 to 24 Minutes | 6,858 (15.4%) | 8,680 (19.4%) |
| 25 to 29 Minutes | 2,586 (5.8%) | 2,280 (5.1%) |
| 30 to 34 Minutes | 4,430 (10.0%) | 3,688 (8.3%) |
| 35 to 39 Minutes | 435 (1.0%) | 223 (0.5%) |
| 40 to 44 Minutes | 419 (0.9%) | 438 (1.0%) |
| 45 to 59 Minutes | 1,282 (2.9%) | 898 (2.0%) |
| 60 to 89 Minutes | 903 (2.0%) | 595 (1.3%) |
| 90 or more Minutes | 524 (1.2%) | 292 (0.6%) |
Time of Departure to Work by Sex in Little Rock
The most frequent times of departure to work in Little Rock are 7:00 AM to 7:29 AM (7,447, 16.8%) for males and 7:30 AM to 7:59 AM (9,549, 21.4%) for females.
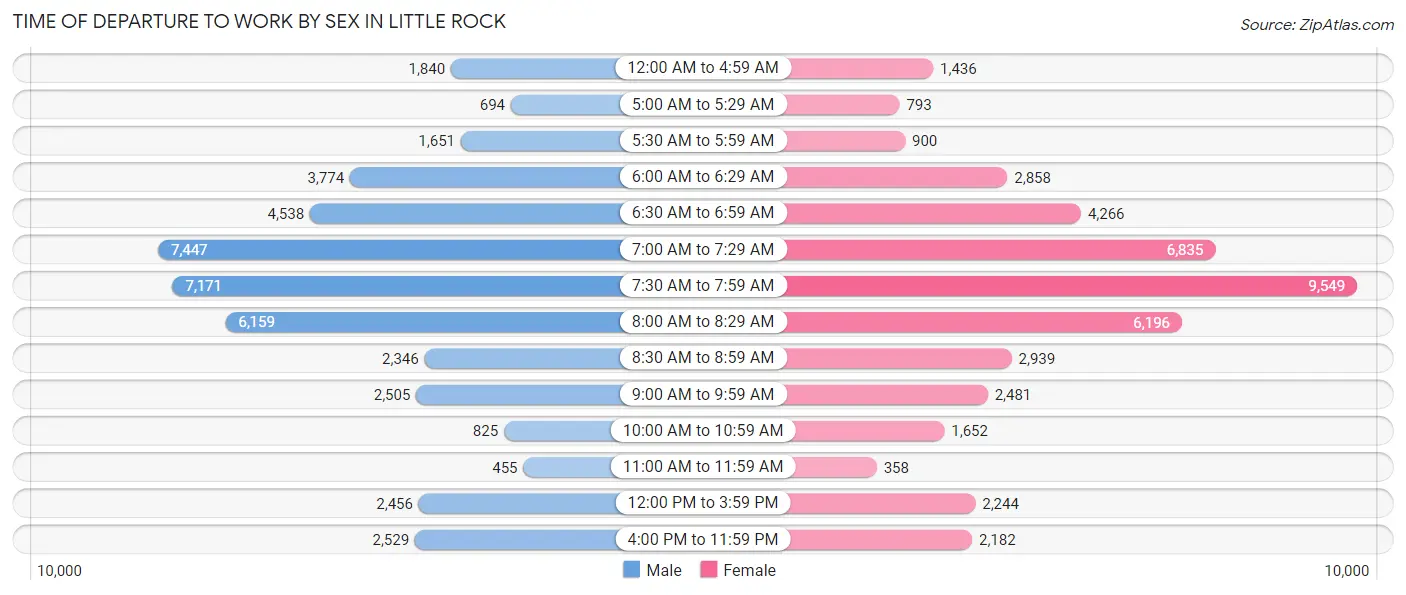
| Time of Departure | Male | Female |
| 12:00 AM to 4:59 AM | 1,840 (4.2%) | 1,436 (3.2%) |
| 5:00 AM to 5:29 AM | 694 (1.6%) | 793 (1.8%) |
| 5:30 AM to 5:59 AM | 1,651 (3.7%) | 900 (2.0%) |
| 6:00 AM to 6:29 AM | 3,774 (8.5%) | 2,858 (6.4%) |
| 6:30 AM to 6:59 AM | 4,538 (10.2%) | 4,266 (9.6%) |
| 7:00 AM to 7:29 AM | 7,447 (16.8%) | 6,835 (15.3%) |
| 7:30 AM to 7:59 AM | 7,171 (16.2%) | 9,549 (21.4%) |
| 8:00 AM to 8:29 AM | 6,159 (13.9%) | 6,196 (13.9%) |
| 8:30 AM to 8:59 AM | 2,346 (5.3%) | 2,939 (6.6%) |
| 9:00 AM to 9:59 AM | 2,505 (5.6%) | 2,481 (5.6%) |
| 10:00 AM to 10:59 AM | 825 (1.9%) | 1,652 (3.7%) |
| 11:00 AM to 11:59 AM | 455 (1.0%) | 358 (0.8%) |
| 12:00 PM to 3:59 PM | 2,456 (5.5%) | 2,244 (5.0%) |
| 4:00 PM to 11:59 PM | 2,529 (5.7%) | 2,182 (4.9%) |
| Total | 44,390 (100.0%) | 44,689 (100.0%) |
Housing Occupancy in Little Rock
Occupancy by Ownership in Little Rock
Of the total 86,365 dwellings in Little Rock, owner-occupied units account for 46,999 (54.4%), while renter-occupied units make up 39,366 (45.6%).
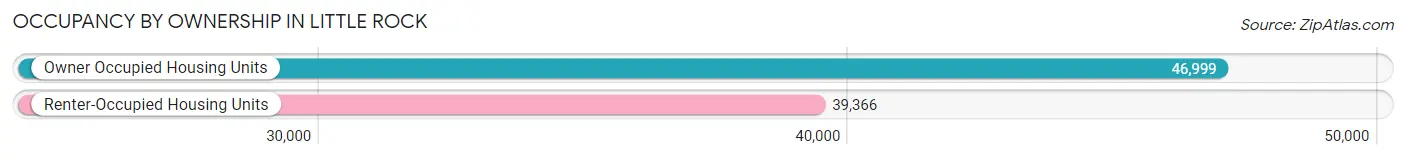
| Occupancy | # Housing Units | % Housing Units |
| Owner Occupied Housing Units | 46,999 | 54.4% |
| Renter-Occupied Housing Units | 39,366 | 45.6% |
| Total Occupied Housing Units | 86,365 | 100.0% |
Occupancy by Household Size in Little Rock
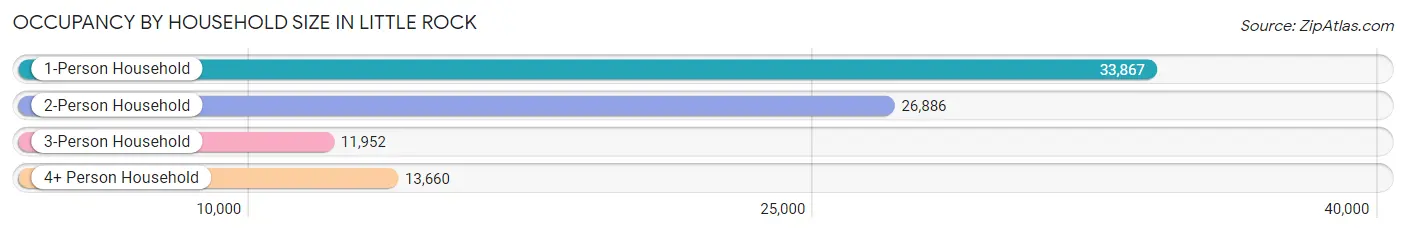
| Household Size | # Housing Units | % Housing Units |
| 1-Person Household | 33,867 | 39.2% |
| 2-Person Household | 26,886 | 31.1% |
| 3-Person Household | 11,952 | 13.8% |
| 4+ Person Household | 13,660 | 15.8% |
| Total Housing Units | 86,365 | 100.0% |
Occupancy by Ownership by Household Size in Little Rock
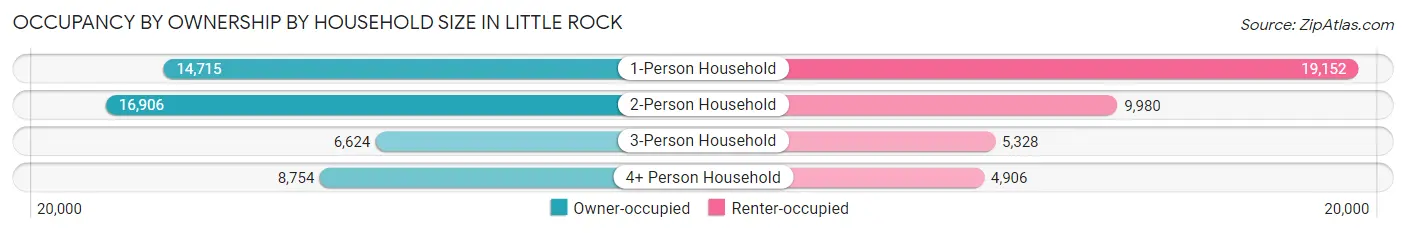
| Household Size | Owner-occupied | Renter-occupied |
| 1-Person Household | 14,715 (43.4%) | 19,152 (56.6%) |
| 2-Person Household | 16,906 (62.9%) | 9,980 (37.1%) |
| 3-Person Household | 6,624 (55.4%) | 5,328 (44.6%) |
| 4+ Person Household | 8,754 (64.1%) | 4,906 (35.9%) |
| Total Housing Units | 46,999 (54.4%) | 39,366 (45.6%) |
Occupancy by Educational Attainment in Little Rock
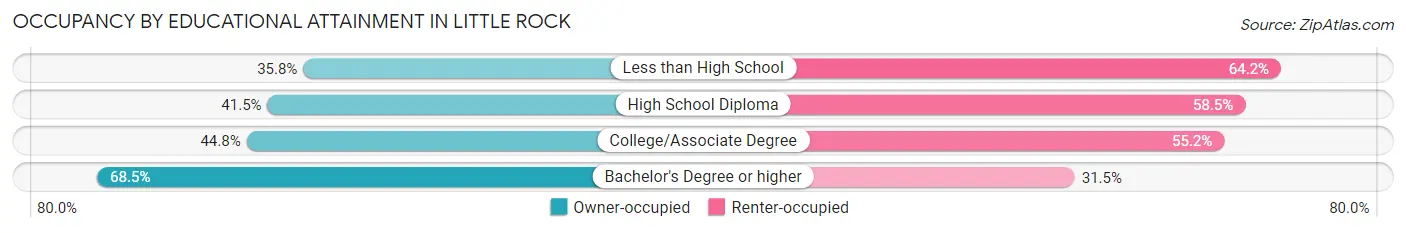
| Household Size | Owner-occupied | Renter-occupied |
| Less than High School | 1,914 (35.8%) | 3,431 (64.2%) |
| High School Diploma | 7,119 (41.5%) | 10,040 (58.5%) |
| College/Associate Degree | 10,927 (44.8%) | 13,458 (55.2%) |
| Bachelor's Degree or higher | 27,039 (68.5%) | 12,437 (31.5%) |
Occupancy by Age of Householder in Little Rock
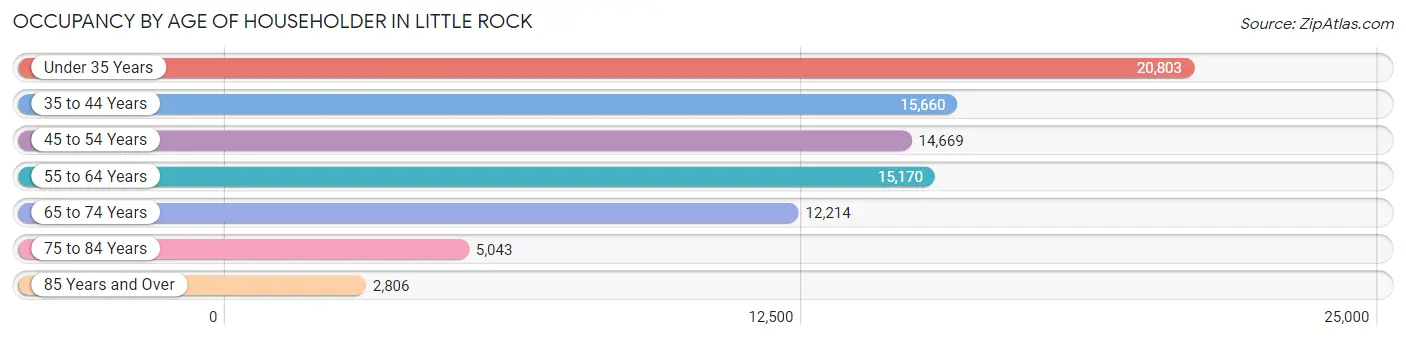
| Age Bracket | # Households | % Households |
| Under 35 Years | 20,803 | 24.1% |
| 35 to 44 Years | 15,660 | 18.1% |
| 45 to 54 Years | 14,669 | 17.0% |
| 55 to 64 Years | 15,170 | 17.6% |
| 65 to 74 Years | 12,214 | 14.1% |
| 75 to 84 Years | 5,043 | 5.8% |
| 85 Years and Over | 2,806 | 3.3% |
| Total | 86,365 | 100.0% |
Housing Finances in Little Rock
Median Income by Occupancy in Little Rock
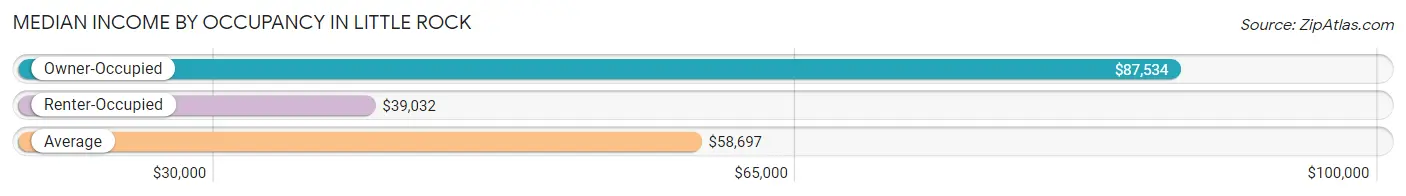
| Occupancy Type | # Households | Median Income |
| Owner-Occupied | 46,999 (54.4%) | $87,534 |
| Renter-Occupied | 39,366 (45.6%) | $39,032 |
| Average | 86,365 (100.0%) | $58,697 |
Occupancy by Householder Income Bracket in Little Rock
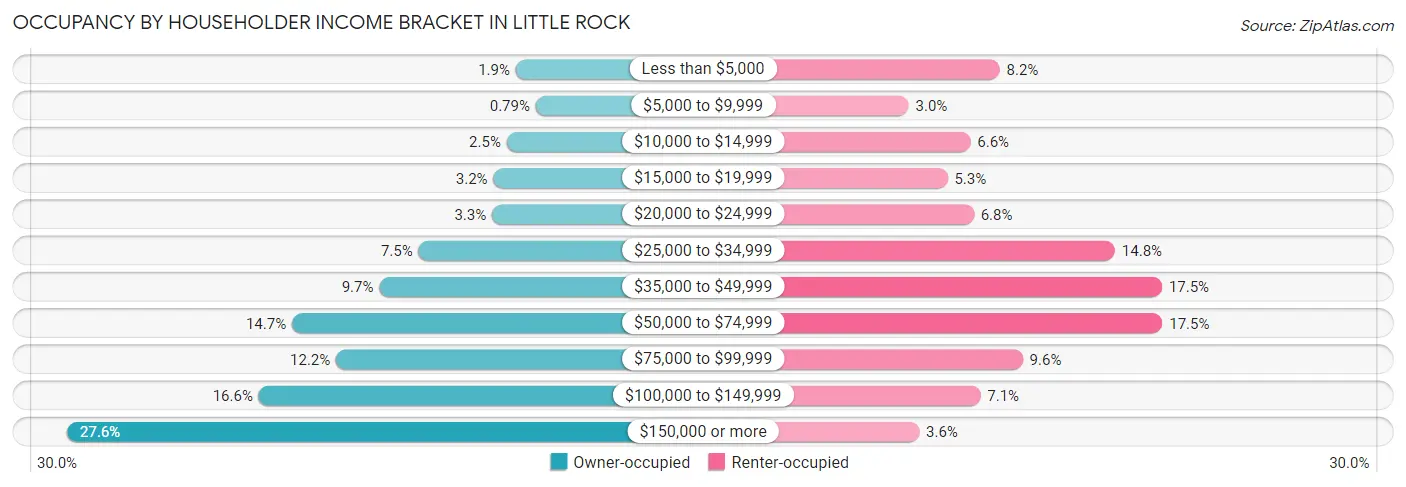
| Income Bracket | Owner-occupied | Renter-occupied |
| Less than $5,000 | 907 (1.9%) | 3,240 (8.2%) |
| $5,000 to $9,999 | 369 (0.8%) | 1,194 (3.0%) |
| $10,000 to $14,999 | 1,152 (2.5%) | 2,582 (6.6%) |
| $15,000 to $19,999 | 1,511 (3.2%) | 2,067 (5.2%) |
| $20,000 to $24,999 | 1,546 (3.3%) | 2,659 (6.8%) |
| $25,000 to $34,999 | 3,520 (7.5%) | 5,836 (14.8%) |
| $35,000 to $49,999 | 4,571 (9.7%) | 6,893 (17.5%) |
| $50,000 to $74,999 | 6,919 (14.7%) | 6,900 (17.5%) |
| $75,000 to $99,999 | 5,732 (12.2%) | 3,760 (9.6%) |
| $100,000 to $149,999 | 7,809 (16.6%) | 2,807 (7.1%) |
| $150,000 or more | 12,963 (27.6%) | 1,428 (3.6%) |
| Total | 46,999 (100.0%) | 39,366 (100.0%) |
Monthly Housing Cost Tiers in Little Rock
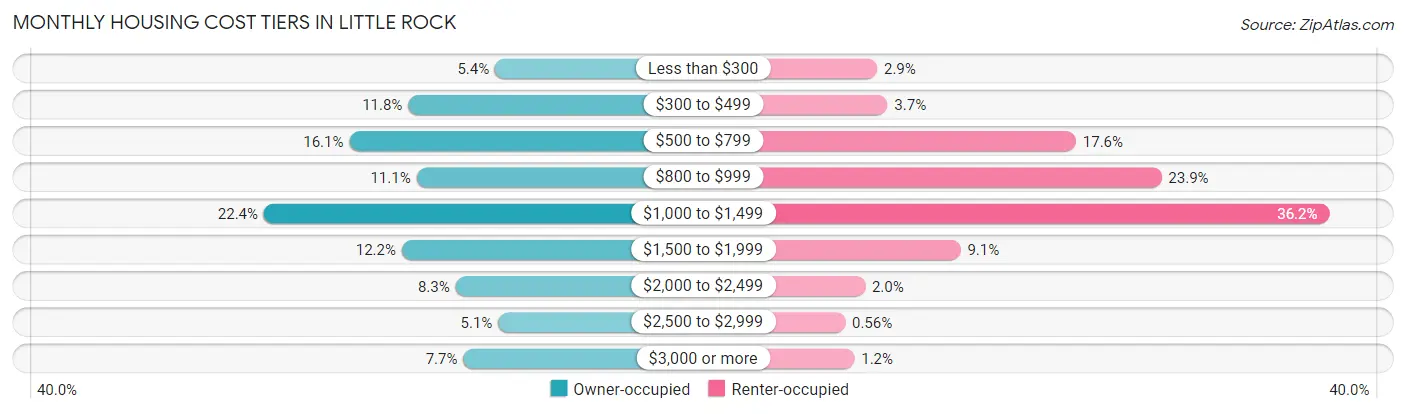
| Monthly Cost | Owner-occupied | Renter-occupied |
| Less than $300 | 2,516 (5.3%) | 1,151 (2.9%) |
| $300 to $499 | 5,521 (11.7%) | 1,450 (3.7%) |
| $500 to $799 | 7,564 (16.1%) | 6,912 (17.6%) |
| $800 to $999 | 5,236 (11.1%) | 9,393 (23.9%) |
| $1,000 to $1,499 | 10,519 (22.4%) | 14,257 (36.2%) |
| $1,500 to $1,999 | 5,743 (12.2%) | 3,566 (9.1%) |
| $2,000 to $2,499 | 3,883 (8.3%) | 798 (2.0%) |
| $2,500 to $2,999 | 2,404 (5.1%) | 222 (0.6%) |
| $3,000 or more | 3,613 (7.7%) | 487 (1.2%) |
| Total | 46,999 (100.0%) | 39,366 (100.0%) |
Physical Housing Characteristics in Little Rock
Housing Structures in Little Rock
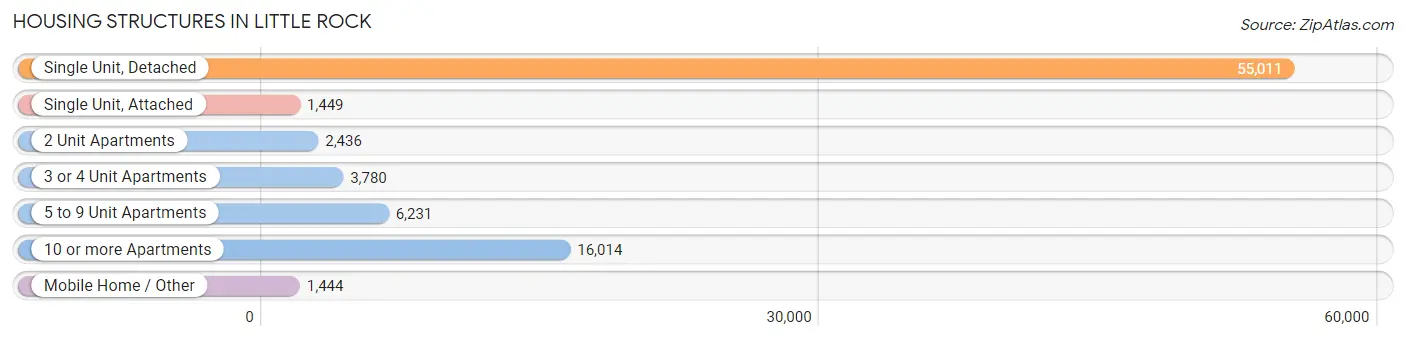
| Structure Type | # Housing Units | % Housing Units |
| Single Unit, Detached | 55,011 | 63.7% |
| Single Unit, Attached | 1,449 | 1.7% |
| 2 Unit Apartments | 2,436 | 2.8% |
| 3 or 4 Unit Apartments | 3,780 | 4.4% |
| 5 to 9 Unit Apartments | 6,231 | 7.2% |
| 10 or more Apartments | 16,014 | 18.5% |
| Mobile Home / Other | 1,444 | 1.7% |
| Total | 86,365 | 100.0% |
Housing Structures by Occupancy in Little Rock
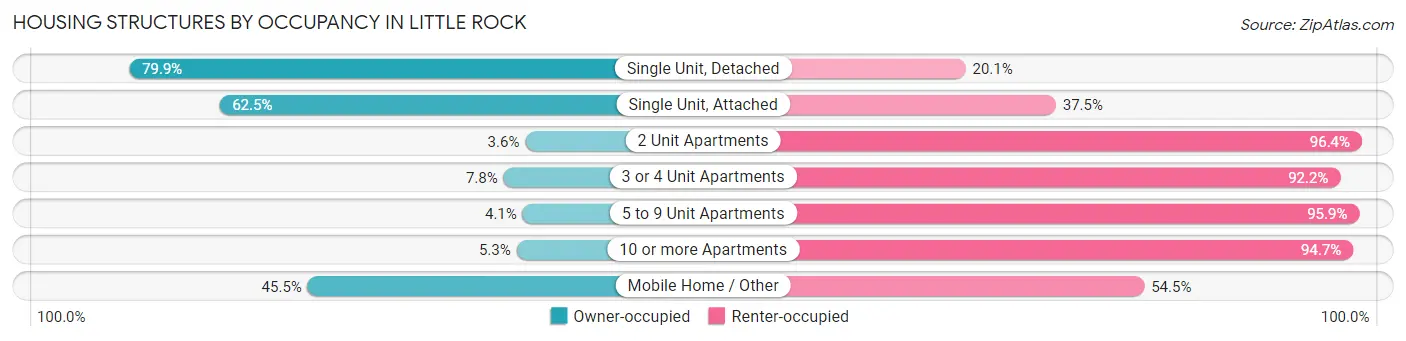
| Structure Type | Owner-occupied | Renter-occupied |
| Single Unit, Detached | 43,952 (79.9%) | 11,059 (20.1%) |
| Single Unit, Attached | 906 (62.5%) | 543 (37.5%) |
| 2 Unit Apartments | 88 (3.6%) | 2,348 (96.4%) |
| 3 or 4 Unit Apartments | 294 (7.8%) | 3,486 (92.2%) |
| 5 to 9 Unit Apartments | 256 (4.1%) | 5,975 (95.9%) |
| 10 or more Apartments | 846 (5.3%) | 15,168 (94.7%) |
| Mobile Home / Other | 657 (45.5%) | 787 (54.5%) |
| Total | 46,999 (54.4%) | 39,366 (45.6%) |
Housing Structures by Number of Rooms in Little Rock
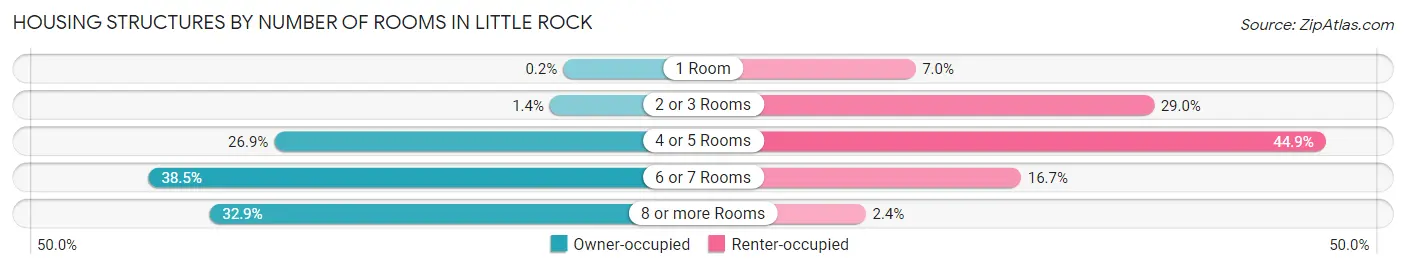
| Number of Rooms | Owner-occupied | Renter-occupied |
| 1 Room | 95 (0.2%) | 2,741 (7.0%) |
| 2 or 3 Rooms | 673 (1.4%) | 11,424 (29.0%) |
| 4 or 5 Rooms | 12,652 (26.9%) | 17,681 (44.9%) |
| 6 or 7 Rooms | 18,112 (38.5%) | 6,586 (16.7%) |
| 8 or more Rooms | 15,467 (32.9%) | 934 (2.4%) |
| Total | 46,999 (100.0%) | 39,366 (100.0%) |
Housing Structure by Heating Type in Little Rock
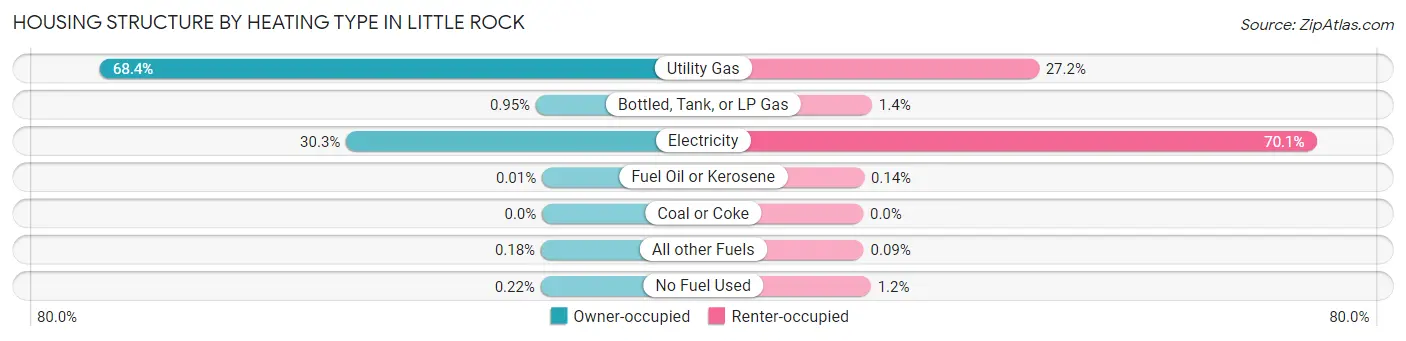
| Heating Type | Owner-occupied | Renter-occupied |
| Utility Gas | 32,122 (68.3%) | 10,691 (27.2%) |
| Bottled, Tank, or LP Gas | 448 (0.9%) | 538 (1.4%) |
| Electricity | 14,234 (30.3%) | 27,581 (70.1%) |
| Fuel Oil or Kerosene | 7 (0.0%) | 54 (0.1%) |
| Coal or Coke | 0 (0.0%) | 0 (0.0%) |
| All other Fuels | 86 (0.2%) | 35 (0.1%) |
| No Fuel Used | 102 (0.2%) | 467 (1.2%) |
| Total | 46,999 (100.0%) | 39,366 (100.0%) |
Household Vehicle Usage in Little Rock
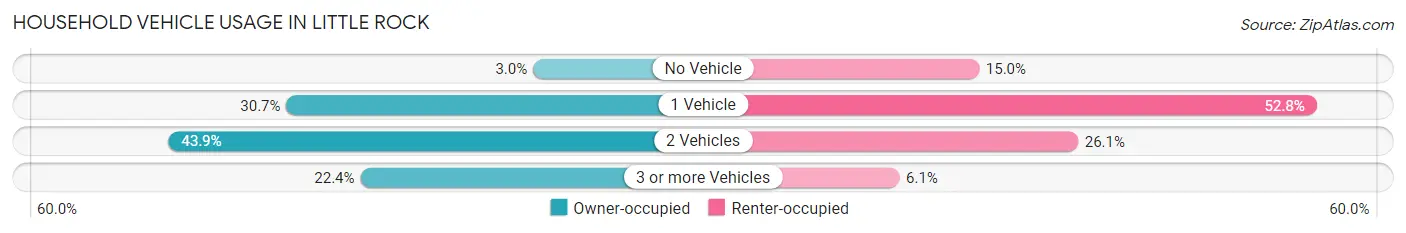
| Vehicles per Household | Owner-occupied | Renter-occupied |
| No Vehicle | 1,430 (3.0%) | 5,904 (15.0%) |
| 1 Vehicle | 14,419 (30.7%) | 20,801 (52.8%) |
| 2 Vehicles | 20,628 (43.9%) | 10,272 (26.1%) |
| 3 or more Vehicles | 10,522 (22.4%) | 2,389 (6.1%) |
| Total | 46,999 (100.0%) | 39,366 (100.0%) |
Real Estate & Mortgages in Little Rock
Real Estate and Mortgage Overview in Little Rock
| Characteristic | Without Mortgage | With Mortgage |
| Housing Units | 16,796 | 30,203 |
| Median Property Value | $177,500 | $220,300 |
| Median Household Income | $69,133 | $9,713 |
| Monthly Housing Costs | $528 | $3,592 |
| Real Estate Taxes | $1,570 | $1,102 |
Property Value by Mortgage Status in Little Rock
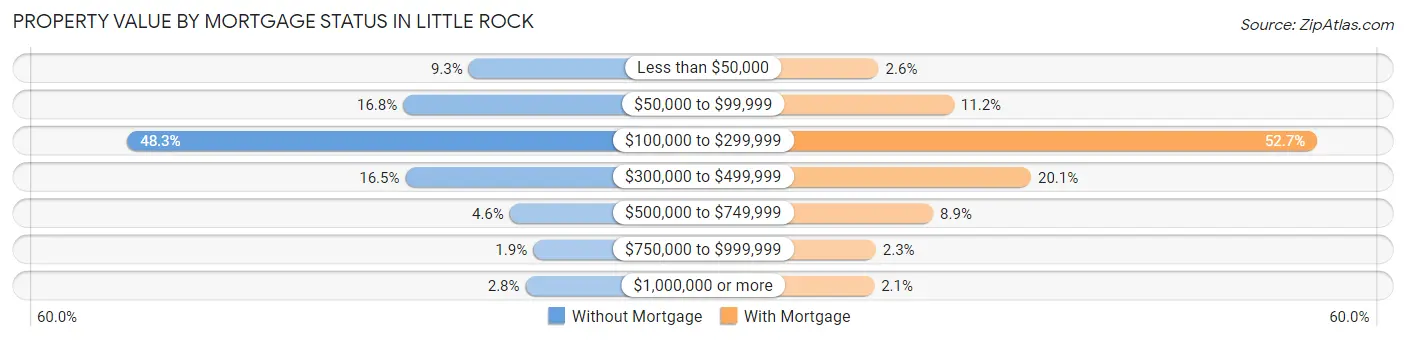
| Property Value | Without Mortgage | With Mortgage |
| Less than $50,000 | 1,556 (9.3%) | 797 (2.6%) |
| $50,000 to $99,999 | 2,814 (16.8%) | 3,396 (11.2%) |
| $100,000 to $299,999 | 8,106 (48.3%) | 15,926 (52.7%) |
| $300,000 to $499,999 | 2,769 (16.5%) | 6,060 (20.1%) |
| $500,000 to $749,999 | 767 (4.6%) | 2,680 (8.9%) |
| $750,000 to $999,999 | 319 (1.9%) | 700 (2.3%) |
| $1,000,000 or more | 465 (2.8%) | 644 (2.1%) |
| Total | 16,796 (100.0%) | 30,203 (100.0%) |
Household Income by Mortgage Status in Little Rock
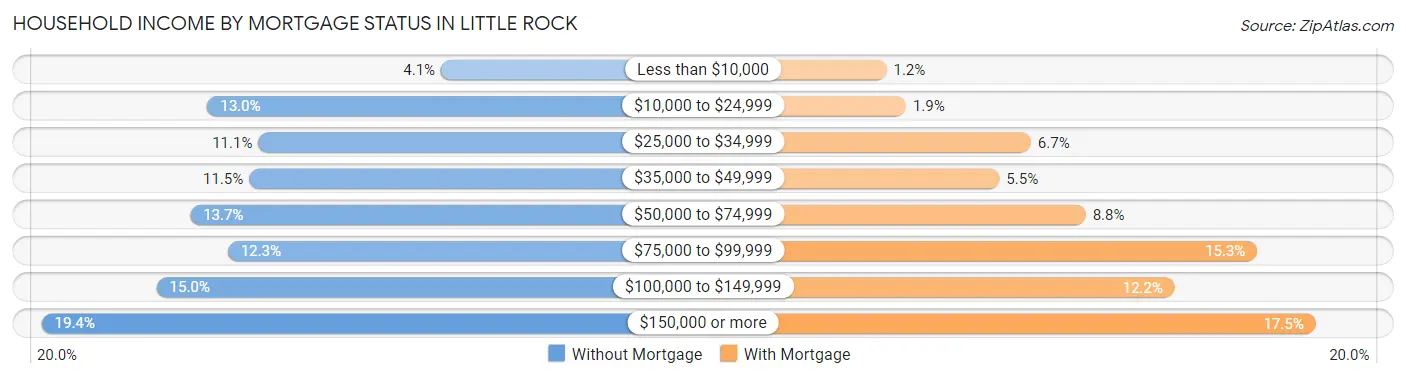
| Household Income | Without Mortgage | With Mortgage |
| Less than $10,000 | 695 (4.1%) | 356 (1.2%) |
| $10,000 to $24,999 | 2,191 (13.0%) | 581 (1.9%) |
| $25,000 to $34,999 | 1,864 (11.1%) | 2,018 (6.7%) |
| $35,000 to $49,999 | 1,923 (11.5%) | 1,656 (5.5%) |
| $50,000 to $74,999 | 2,299 (13.7%) | 2,648 (8.8%) |
| $75,000 to $99,999 | 2,060 (12.3%) | 4,620 (15.3%) |
| $100,000 to $149,999 | 2,514 (15.0%) | 3,672 (12.2%) |
| $150,000 or more | 3,250 (19.4%) | 5,295 (17.5%) |
| Total | 16,796 (100.0%) | 30,203 (100.0%) |
Property Value to Household Income Ratio in Little Rock
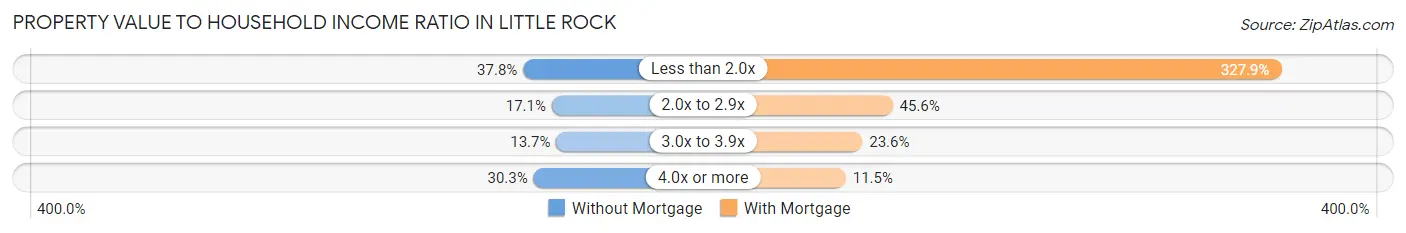
| Value-to-Income Ratio | Without Mortgage | With Mortgage |
| Less than 2.0x | 6,353 (37.8%) | 99,046 (327.9%) |
| 2.0x to 2.9x | 2,863 (17.1%) | 13,758 (45.6%) |
| 3.0x to 3.9x | 2,308 (13.7%) | 7,112 (23.5%) |
| 4.0x or more | 5,088 (30.3%) | 3,479 (11.5%) |
| Total | 16,796 (100.0%) | 30,203 (100.0%) |
Real Estate Taxes by Mortgage Status in Little Rock
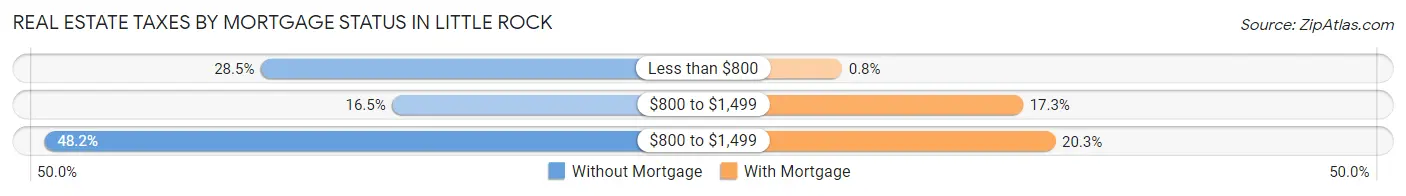
| Property Taxes | Without Mortgage | With Mortgage |
| Less than $800 | 4,783 (28.5%) | 243 (0.8%) |
| $800 to $1,499 | 2,770 (16.5%) | 5,230 (17.3%) |
| $800 to $1,499 | 8,093 (48.2%) | 6,123 (20.3%) |
| Total | 16,796 (100.0%) | 30,203 (100.0%) |
Health & Disability in Little Rock
Health Insurance Coverage by Age in Little Rock
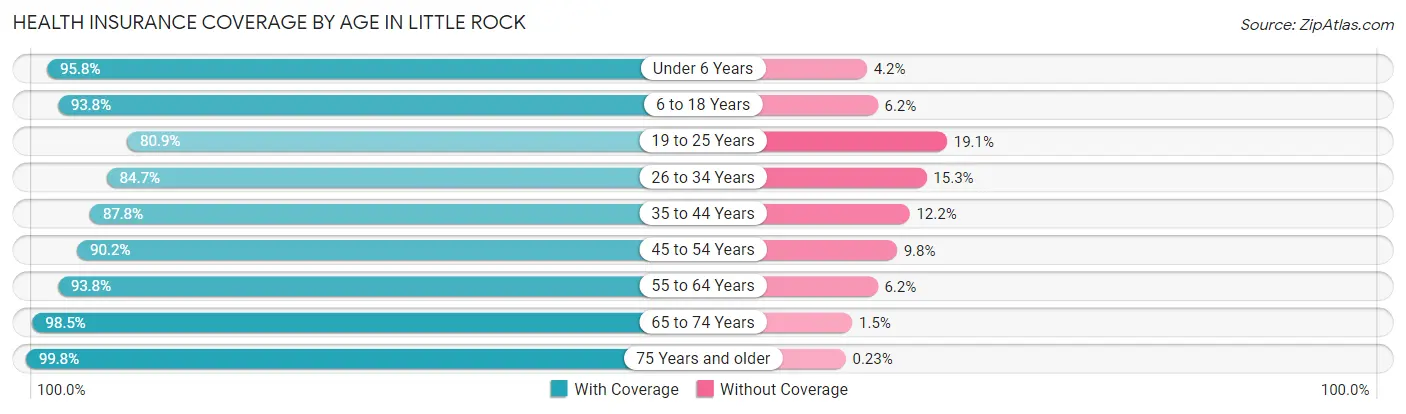
| Age Bracket | With Coverage | Without Coverage |
| Under 6 Years | 15,397 (95.8%) | 671 (4.2%) |
| 6 to 18 Years | 31,735 (93.8%) | 2,096 (6.2%) |
| 19 to 25 Years | 15,331 (80.9%) | 3,622 (19.1%) |
| 26 to 34 Years | 23,607 (84.7%) | 4,267 (15.3%) |
| 35 to 44 Years | 23,387 (87.8%) | 3,237 (12.2%) |
| 45 to 54 Years | 21,621 (90.2%) | 2,345 (9.8%) |
| 55 to 64 Years | 21,812 (93.8%) | 1,440 (6.2%) |
| 65 to 74 Years | 18,003 (98.5%) | 266 (1.5%) |
| 75 Years and older | 11,008 (99.8%) | 25 (0.2%) |
| Total | 181,901 (91.0%) | 17,969 (9.0%) |
Health Insurance Coverage by Citizenship Status in Little Rock
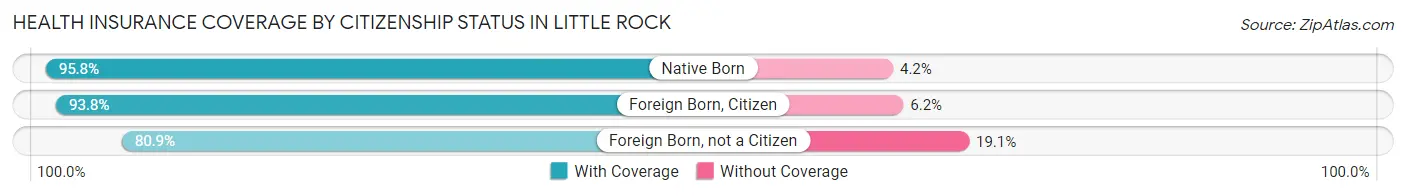
| Citizenship Status | With Coverage | Without Coverage |
| Native Born | 15,397 (95.8%) | 671 (4.2%) |
| Foreign Born, Citizen | 31,735 (93.8%) | 2,096 (6.2%) |
| Foreign Born, not a Citizen | 15,331 (80.9%) | 3,622 (19.1%) |
Health Insurance Coverage by Household Income in Little Rock
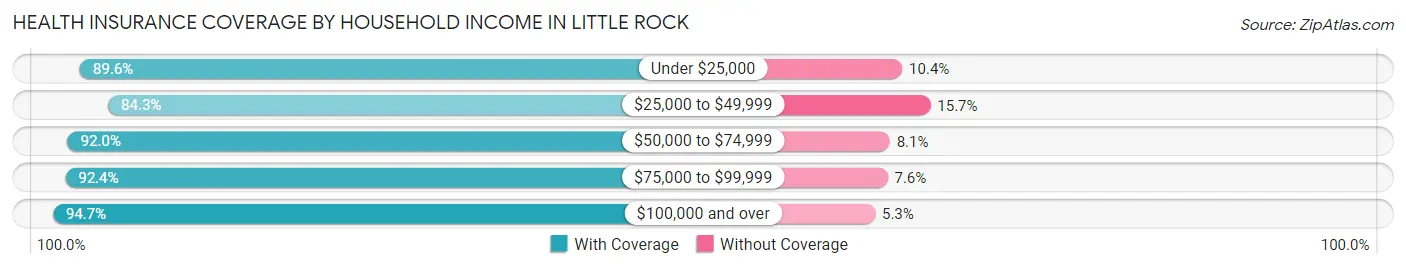
| Household Income | With Coverage | Without Coverage |
| Under $25,000 | 27,962 (89.6%) | 3,236 (10.4%) |
| $25,000 to $49,999 | 34,801 (84.3%) | 6,464 (15.7%) |
| $50,000 to $74,999 | 28,286 (91.9%) | 2,475 (8.1%) |
| $75,000 to $99,999 | 20,926 (92.4%) | 1,729 (7.6%) |
| $100,000 and over | 68,261 (94.7%) | 3,810 (5.3%) |
Public vs Private Health Insurance Coverage by Age in Little Rock
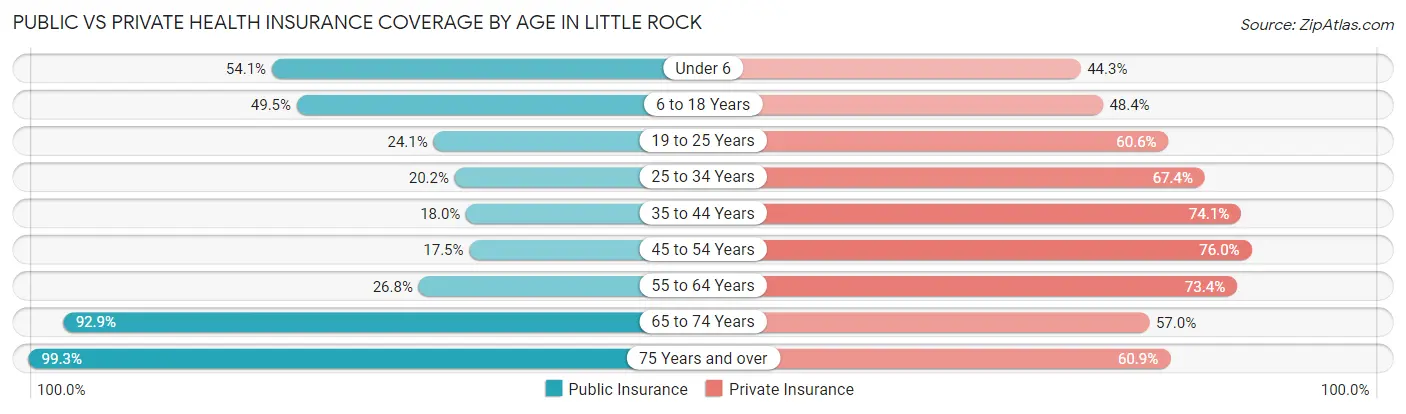
| Age Bracket | Public Insurance | Private Insurance |
| Under 6 | 8,693 (54.1%) | 7,111 (44.3%) |
| 6 to 18 Years | 16,732 (49.5%) | 16,369 (48.4%) |
| 19 to 25 Years | 4,565 (24.1%) | 11,489 (60.6%) |
| 25 to 34 Years | 5,616 (20.2%) | 18,778 (67.4%) |
| 35 to 44 Years | 4,800 (18.0%) | 19,734 (74.1%) |
| 45 to 54 Years | 4,181 (17.4%) | 18,218 (76.0%) |
| 55 to 64 Years | 6,240 (26.8%) | 17,056 (73.4%) |
| 65 to 74 Years | 16,975 (92.9%) | 10,417 (57.0%) |
| 75 Years and over | 10,950 (99.3%) | 6,722 (60.9%) |
| Total | 78,752 (39.4%) | 125,894 (63.0%) |
Disability Status by Sex by Age in Little Rock
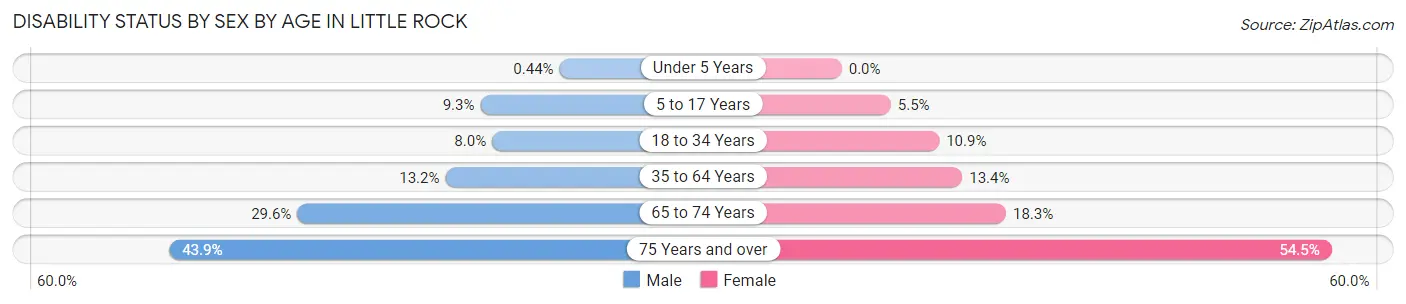
| Age Bracket | Male | Female |
| Under 5 Years | 29 (0.4%) | 0 (0.0%) |
| 5 to 17 Years | 1,560 (9.2%) | 929 (5.5%) |
| 18 to 34 Years | 1,937 (8.0%) | 2,703 (10.8%) |
| 35 to 64 Years | 4,546 (13.2%) | 5,272 (13.4%) |
| 65 to 74 Years | 2,296 (29.6%) | 1,925 (18.3%) |
| 75 Years and over | 1,773 (43.9%) | 3,814 (54.5%) |
Disability Class by Sex by Age in Little Rock
Disability Class: Hearing Difficulty
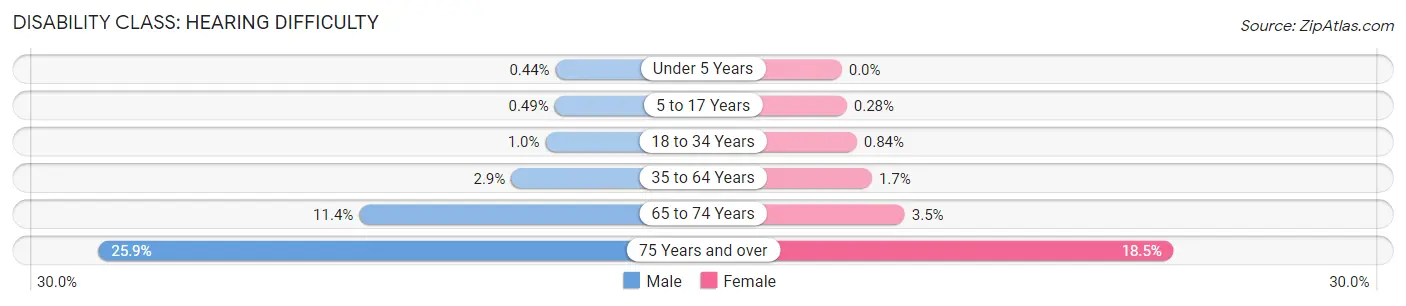
| Age Bracket | Male | Female |
| Under 5 Years | 29 (0.4%) | 0 (0.0%) |
| 5 to 17 Years | 83 (0.5%) | 48 (0.3%) |
| 18 to 34 Years | 243 (1.0%) | 210 (0.8%) |
| 35 to 64 Years | 1,006 (2.9%) | 660 (1.7%) |
| 65 to 74 Years | 881 (11.4%) | 369 (3.5%) |
| 75 Years and over | 1,046 (25.9%) | 1,292 (18.5%) |
Disability Class: Vision Difficulty
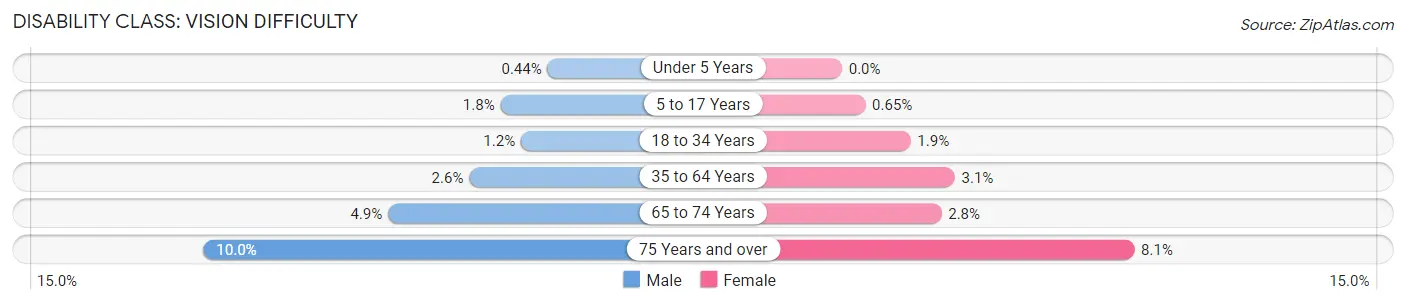
| Age Bracket | Male | Female |
| Under 5 Years | 29 (0.4%) | 0 (0.0%) |
| 5 to 17 Years | 295 (1.8%) | 110 (0.6%) |
| 18 to 34 Years | 287 (1.2%) | 477 (1.9%) |
| 35 to 64 Years | 905 (2.6%) | 1,232 (3.1%) |
| 65 to 74 Years | 378 (4.9%) | 292 (2.8%) |
| 75 Years and over | 405 (10.0%) | 569 (8.1%) |
Disability Class: Cognitive Difficulty
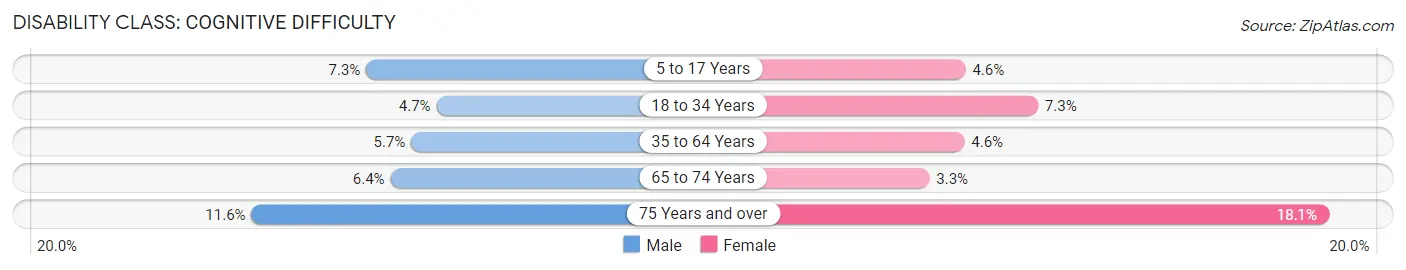
| Age Bracket | Male | Female |
| 5 to 17 Years | 1,234 (7.3%) | 782 (4.6%) |
| 18 to 34 Years | 1,146 (4.7%) | 1,813 (7.3%) |
| 35 to 64 Years | 1,954 (5.7%) | 1,787 (4.5%) |
| 65 to 74 Years | 497 (6.4%) | 342 (3.3%) |
| 75 Years and over | 468 (11.6%) | 1,264 (18.1%) |
Disability Class: Ambulatory Difficulty
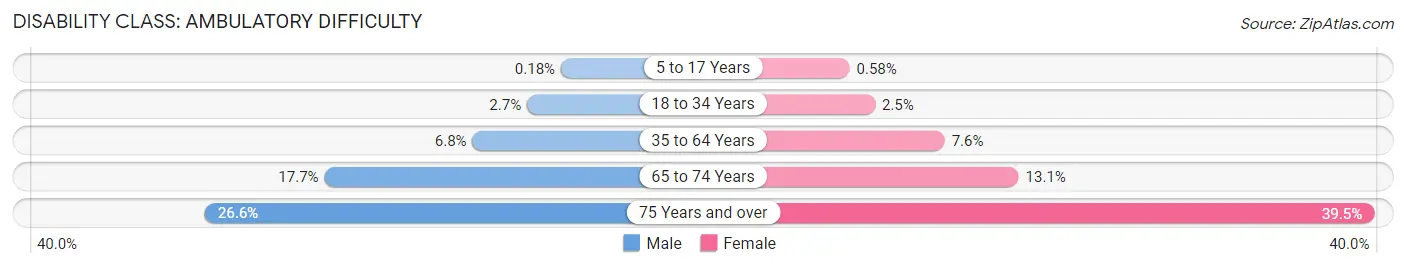
| Age Bracket | Male | Female |
| 5 to 17 Years | 30 (0.2%) | 98 (0.6%) |
| 18 to 34 Years | 657 (2.7%) | 613 (2.5%) |
| 35 to 64 Years | 2,332 (6.8%) | 3,000 (7.6%) |
| 65 to 74 Years | 1,374 (17.7%) | 1,382 (13.1%) |
| 75 Years and over | 1,075 (26.6%) | 2,763 (39.5%) |
Disability Class: Self-Care Difficulty
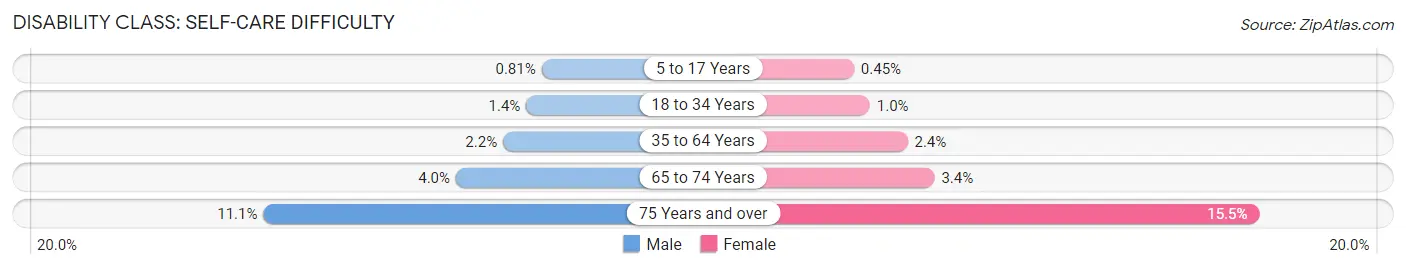
| Age Bracket | Male | Female |
| 5 to 17 Years | 137 (0.8%) | 76 (0.4%) |
| 18 to 34 Years | 336 (1.4%) | 258 (1.0%) |
| 35 to 64 Years | 773 (2.2%) | 957 (2.4%) |
| 65 to 74 Years | 309 (4.0%) | 362 (3.4%) |
| 75 Years and over | 450 (11.1%) | 1,084 (15.5%) |
Technology Access in Little Rock
Computing Device Access in Little Rock
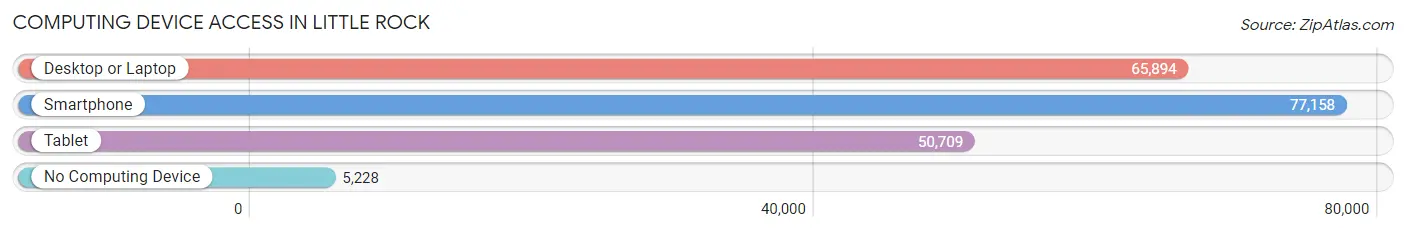
| Device Type | # Households | % Households |
| Desktop or Laptop | 65,894 | 76.3% |
| Smartphone | 77,158 | 89.3% |
| Tablet | 50,709 | 58.7% |
| No Computing Device | 5,228 | 6.0% |
| Total | 86,365 | 100.0% |
Internet Access in Little Rock
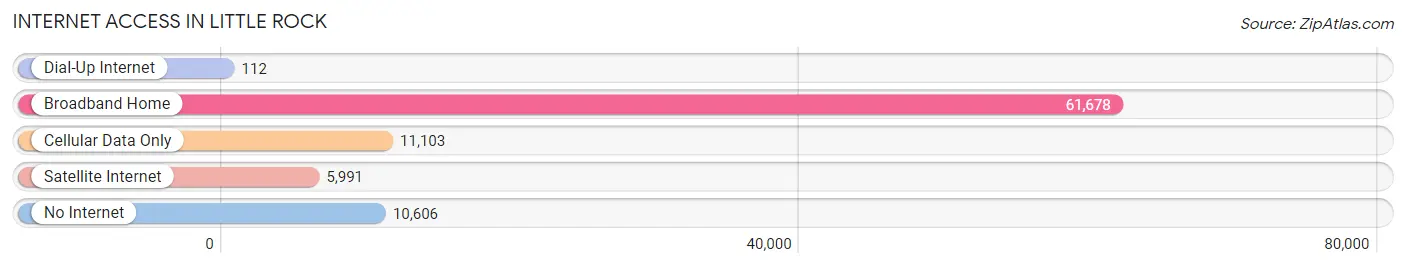
| Internet Type | # Households | % Households |
| Dial-Up Internet | 112 | 0.1% |
| Broadband Home | 61,678 | 71.4% |
| Cellular Data Only | 11,103 | 12.9% |
| Satellite Internet | 5,991 | 6.9% |
| No Internet | 10,606 | 12.3% |
| Total | 86,365 | 100.0% |
Little Rock Summary
Little Rock, Arkansas is the capital and most populous city of the state of Arkansas. It is located in the central part of the state along the Arkansas River. The city has a population of 198,541 as of the 2019 U.S. Census, making it the state’s most populous city. Little Rock is the cultural, economic, and governmental center of Arkansas.
History
Little Rock was founded in 1821 by a group of settlers led by John Woodruff. The city was named after a small rock formation on the south bank of the Arkansas River. The city quickly grew and became an important trading post for the region. In 1836, Little Rock was chosen as the capital of the Arkansas Territory.
In the years leading up to the Civil War, Little Rock was a center of pro-slavery sentiment. In 1861, the city was occupied by Confederate forces and served as the capital of the Confederate state of Arkansas. After the war, Little Rock was occupied by Union forces and served as the capital of the Union-controlled state of Arkansas.
In the late 19th century, Little Rock experienced a period of rapid growth and development. The city was the site of the Little Rock Nine, a group of African-American students who were the first to integrate the city’s public schools in 1957.
Geography
Little Rock is located in the central part of Arkansas, along the Arkansas River. The city is situated in the foothills of the Ouachita Mountains and is surrounded by rolling hills and forests. The city has a total area of 116.8 square miles, of which 115.2 square miles is land and 1.6 square miles is water.
Little Rock has a humid subtropical climate, with hot, humid summers and mild winters. The average annual temperature is 63.2°F, with an average high of 87.2°F in July and an average low of 38.2°F in January. The city receives an average of 48.2 inches of precipitation per year.
Economy
Little Rock’s economy is largely based on government, healthcare, and finance. The city is home to several major corporations, including Dillard’s, Windstream Communications, and Acxiom. Little Rock is also home to the Little Rock Port Authority, which is the largest inland port in the United States.
The city’s largest employers include the University of Arkansas for Medical Sciences, Arkansas Children’s Hospital, and the Little Rock Air Force Base. Little Rock is also home to several major tourist attractions, including the William J. Clinton Presidential Library and Museum, the Arkansas State Capitol, and the Little Rock Zoo.
Demographics
As of the 2019 U.S. Census, Little Rock had a population of 198,541. The city’s population is 63.2% White, 28.3% Black or African American, 4.2% Hispanic or Latino, and 2.2% Asian. The median household income is $45,837, and the median home value is $133,400.
Little Rock is home to a diverse population of people from all walks of life. The city is home to a vibrant arts and culture scene, with several museums, galleries, and performing arts venues. Little Rock is also home to several universities and colleges, including the University of Arkansas at Little Rock, Philander Smith College, and Pulaski Technical College.
Common Questions
What is Per Capita Income in Little Rock?
Per Capita income in Little Rock is $42,616.
What is the Median Family Income in Little Rock?
Median Family Income in Little Rock is $80,633.
What is the Median Household income in Little Rock?
Median Household Income in Little Rock is $58,697.
What is Income or Wage Gap in Little Rock?
Income or Wage Gap in Little Rock is 14.4%.
Women in Little Rock earn 85.6 cents for every dollar earned by a man.
What is Family Income Deficit in Little Rock?
Family Income Deficit in Little Rock is $11,348.
Families that are below poverty line in Little Rock earn $11,348 less on average than the poverty threshold level.
What is Inequality or Gini Index in Little Rock?
Inequality or Gini Index in Little Rock is 0.54.
What is the Total Population of Little Rock?
Total Population of Little Rock is 202,218.
What is the Total Male Population of Little Rock?
Total Male Population of Little Rock is 95,444.
What is the Total Female Population of Little Rock?
Total Female Population of Little Rock is 106,774.
What is the Ratio of Males per 100 Females in Little Rock?
There are 89.39 Males per 100 Females in Little Rock.
What is the Ratio of Females per 100 Males in Little Rock?
There are 111.87 Females per 100 Males in Little Rock.
What is the Median Population Age in Little Rock?
Median Population Age in Little Rock is 36.6 Years.
What is the Average Family Size in Little Rock
Average Family Size in Little Rock is 3.1 People.
What is the Average Household Size in Little Rock
Average Household Size in Little Rock is 2.3 People.
How Large is the Labor Force in Little Rock?
There are 103,396 People in the Labor Forcein in Little Rock.
What is the Percentage of People in the Labor Force in Little Rock?
64.8% of People are in the Labor Force in Little Rock.
What is the Unemployment Rate in Little Rock?
Unemployment Rate in Little Rock is 4.4%.