Ouachita County, AR Map & Demographics
Ouachita County Map
Ouachita County Overview
$25,289
PER CAPITA INCOME
$62,302
AVG FAMILY INCOME
$47,348
AVG HOUSEHOLD INCOME
24.8%
WAGE / INCOME GAP [ % ]
75.2¢/ $1
WAGE / INCOME GAP [ $ ]
$12,342
FAMILY INCOME DEFICIT
0.44
INEQUALITY / GINI INDEX
22,606
TOTAL POPULATION
11,039
MALE POPULATION
11,567
FEMALE POPULATION
95.44
MALES / 100 FEMALES
104.78
FEMALES / 100 MALES
43.9
MEDIAN AGE
3.3
AVG FAMILY SIZE
2.6
AVG HOUSEHOLD SIZE
9,100
LABOR FORCE [ PEOPLE ]
50.2%
PERCENT IN LABOR FORCE
6.5%
UNEMPLOYMENT RATE
Ouachita County Area Codes
Income in Ouachita County
Income Overview in Ouachita County
Per Capita Income in Ouachita County is $25,289, while median incomes of families and households are $62,302 and $47,348 respectively.
| Characteristic | Number | Measure |
| Per Capita Income | 22,606 | $25,289 |
| Median Family Income | 5,620 | $62,302 |
| Mean Family Income | 5,620 | $74,548 |
| Median Household Income | 8,459 | $47,348 |
| Mean Household Income | 8,459 | $62,145 |
| Income Deficit | 5,620 | $12,342 |
| Wage / Income Gap (%) | 22,606 | 24.80% |
| Wage / Income Gap ($) | 22,606 | 75.20¢ per $1 |
| Gini / Inequality Index | 22,606 | 0.44 |
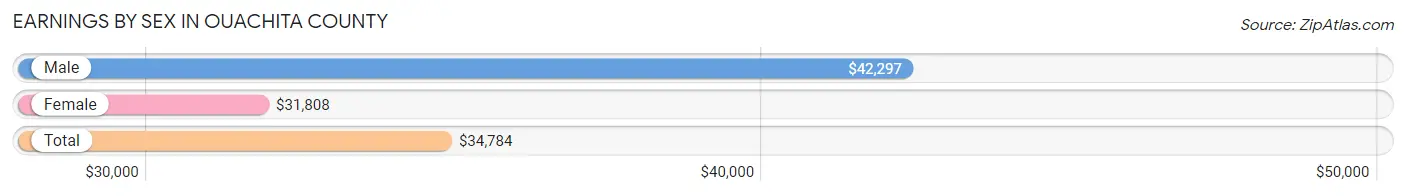
Earnings by Sex in Ouachita County
Average Earnings in Ouachita County are $34,784, $42,297 for men and $31,808 for women, a difference of 24.8%.
| Sex | Number | Average Earnings |
| Male | 4,854 (50.4%) | $42,297 |
| Female | 4,778 (49.6%) | $31,808 |
| Total | 9,632 (100.0%) | $34,784 |
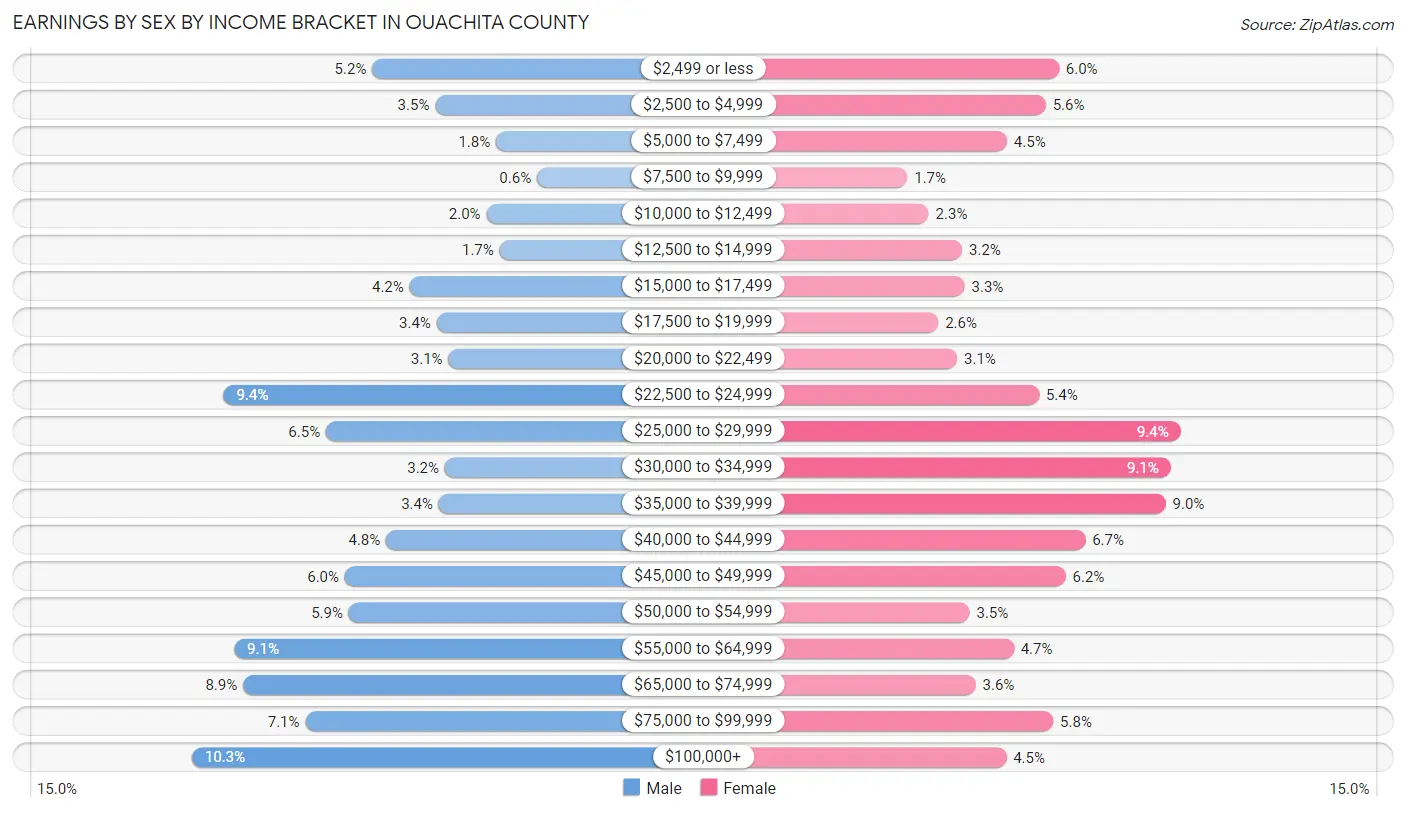
Earnings by Sex by Income Bracket in Ouachita County
The most common earnings brackets in Ouachita County are $100,000+ for men (500 | 10.3%) and $25,000 to $29,999 for women (448 | 9.4%).
| Income | Male | Female |
| $2,499 or less | 254 (5.2%) | 285 (6.0%) |
| $2,500 to $4,999 | 168 (3.5%) | 267 (5.6%) |
| $5,000 to $7,499 | 85 (1.8%) | 215 (4.5%) |
| $7,500 to $9,999 | 29 (0.6%) | 81 (1.7%) |
| $10,000 to $12,499 | 98 (2.0%) | 110 (2.3%) |
| $12,500 to $14,999 | 80 (1.7%) | 155 (3.2%) |
| $15,000 to $17,499 | 203 (4.2%) | 158 (3.3%) |
| $17,500 to $19,999 | 166 (3.4%) | 123 (2.6%) |
| $20,000 to $22,499 | 150 (3.1%) | 148 (3.1%) |
| $22,500 to $24,999 | 457 (9.4%) | 258 (5.4%) |
| $25,000 to $29,999 | 317 (6.5%) | 448 (9.4%) |
| $30,000 to $34,999 | 155 (3.2%) | 435 (9.1%) |
| $35,000 to $39,999 | 163 (3.4%) | 428 (9.0%) |
| $40,000 to $44,999 | 235 (4.8%) | 320 (6.7%) |
| $45,000 to $49,999 | 291 (6.0%) | 294 (6.1%) |
| $50,000 to $54,999 | 286 (5.9%) | 165 (3.5%) |
| $55,000 to $64,999 | 442 (9.1%) | 224 (4.7%) |
| $65,000 to $74,999 | 430 (8.9%) | 173 (3.6%) |
| $75,000 to $99,999 | 345 (7.1%) | 277 (5.8%) |
| $100,000+ | 500 (10.3%) | 214 (4.5%) |
| Total | 4,854 (100.0%) | 4,778 (100.0%) |
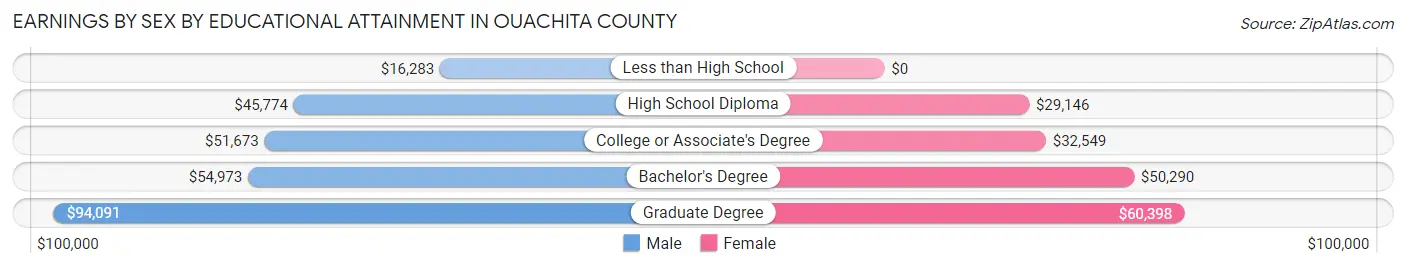
Earnings by Sex by Educational Attainment in Ouachita County
Average earnings in Ouachita County are $48,825 for men and $33,938 for women, a difference of 30.5%. Men with an educational attainment of graduate degree enjoy the highest average annual earnings of $94,091, while those with less than high school education earn the least with $16,283. Women with an educational attainment of graduate degree earn the most with the average annual earnings of $60,398, while those with high school diploma education have the smallest earnings of $29,146.
| Educational Attainment | Male Income | Female Income |
| Less than High School | $16,283 | $0 |
| High School Diploma | $45,774 | $29,146 |
| College or Associate's Degree | $51,673 | $32,549 |
| Bachelor's Degree | $54,973 | $50,290 |
| Graduate Degree | $94,091 | $60,398 |
| Total | $48,825 | $33,938 |
Family Income in Ouachita County
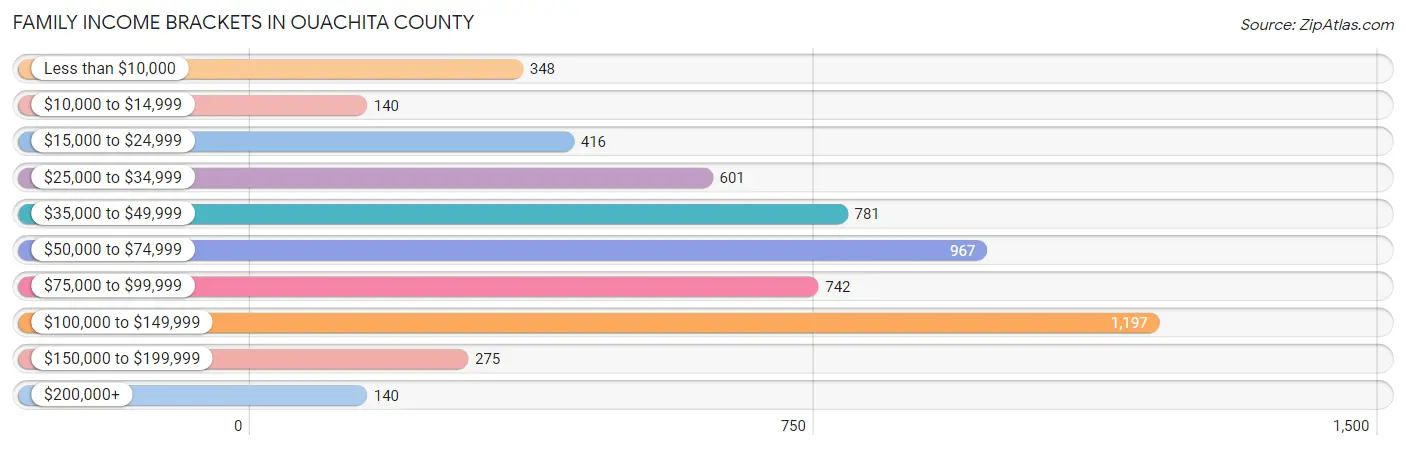
Family Income Brackets in Ouachita County
According to the Ouachita County family income data, there are 1,197 families falling into the $100,000 to $149,999 income range, which is the most common income bracket and makes up 21.3% of all families. Conversely, the $10,000 to $14,999 income bracket is the least frequent group with only 140 families (2.5%) belonging to this category.
| Income Bracket | # Families | % Families |
| Less than $10,000 | 348 | 6.2% |
| $10,000 to $14,999 | 140 | 2.5% |
| $15,000 to $24,999 | 416 | 7.4% |
| $25,000 to $34,999 | 601 | 10.7% |
| $35,000 to $49,999 | 781 | 13.9% |
| $50,000 to $74,999 | 967 | 17.2% |
| $75,000 to $99,999 | 742 | 13.2% |
| $100,000 to $149,999 | 1,197 | 21.3% |
| $150,000 to $199,999 | 275 | 4.9% |
| $200,000+ | 140 | 2.5% |
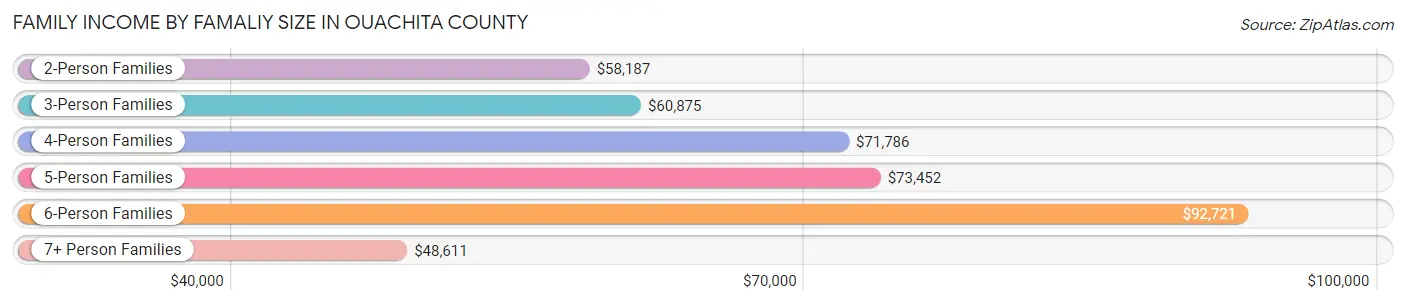
Family Income by Famaliy Size in Ouachita County
6-person families (39 | 0.7%) account for the highest median family income in Ouachita County with $92,721 per family, while 2-person families (3,297 | 58.7%) have the highest median income of $29,094 per family member.
| Income Bracket | # Families | Median Income |
| 2-Person Families | 3,297 (58.7%) | $58,187 |
| 3-Person Families | 1,070 (19.0%) | $60,875 |
| 4-Person Families | 790 (14.1%) | $71,786 |
| 5-Person Families | 362 (6.4%) | $73,452 |
| 6-Person Families | 39 (0.7%) | $92,721 |
| 7+ Person Families | 62 (1.1%) | $48,611 |
| Total | 5,620 (100.0%) | $62,302 |
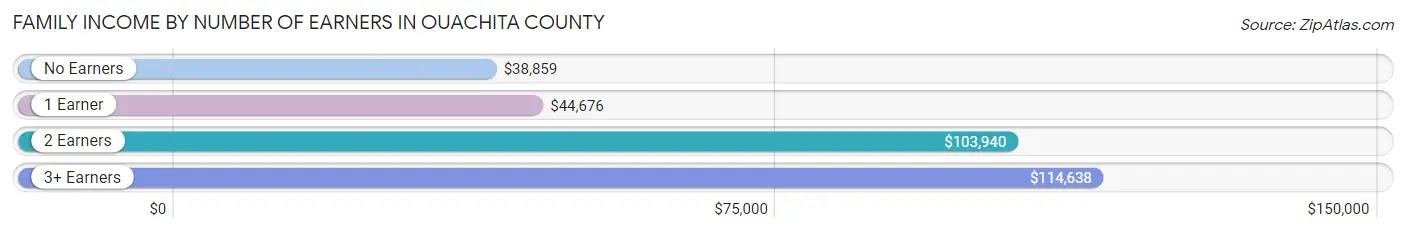
Family Income by Number of Earners in Ouachita County
The median family income in Ouachita County is $62,302, with families comprising 3+ earners (225) having the highest median family income of $114,638, while families with no earners (1,443) have the lowest median family income of $38,859, accounting for 4.0% and 25.7% of families, respectively.
| Number of Earners | # Families | Median Income |
| No Earners | 1,443 (25.7%) | $38,859 |
| 1 Earner | 2,023 (36.0%) | $44,676 |
| 2 Earners | 1,929 (34.3%) | $103,940 |
| 3+ Earners | 225 (4.0%) | $114,638 |
| Total | 5,620 (100.0%) | $62,302 |
Household Income in Ouachita County
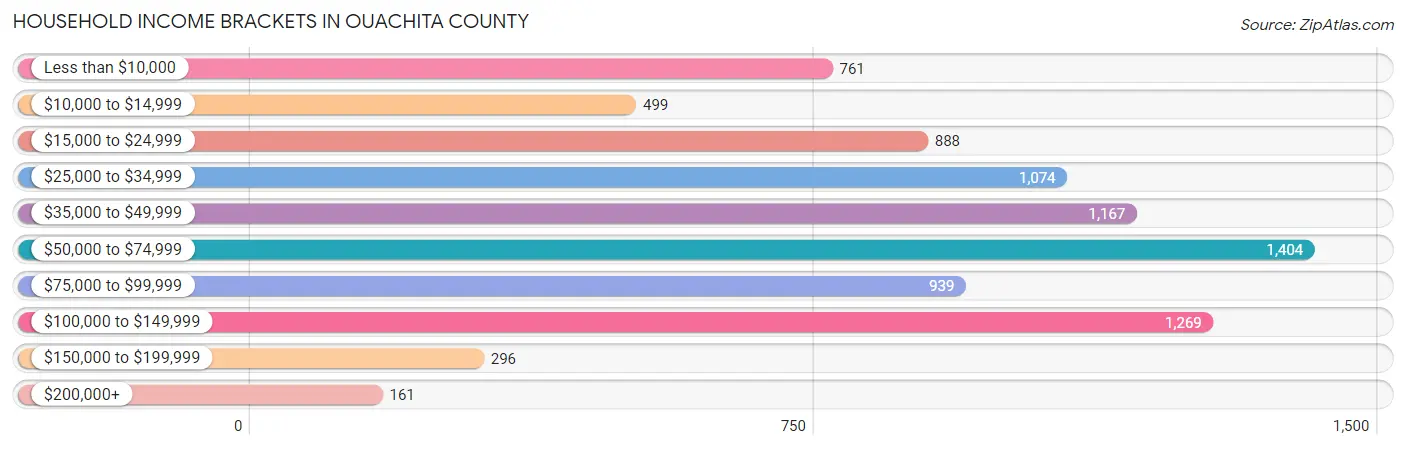
Household Income Brackets in Ouachita County
With 1,404 households falling in the category, the $50,000 to $74,999 income range is the most frequent in Ouachita County, accounting for 16.6% of all households. In contrast, only 161 households (1.9%) fall into the $200,000+ income bracket, making it the least populous group.
| Income Bracket | # Households | % Households |
| Less than $10,000 | 761 | 9.0% |
| $10,000 to $14,999 | 499 | 5.9% |
| $15,000 to $24,999 | 888 | 10.5% |
| $25,000 to $34,999 | 1,074 | 12.7% |
| $35,000 to $49,999 | 1,167 | 13.8% |
| $50,000 to $74,999 | 1,404 | 16.6% |
| $75,000 to $99,999 | 939 | 11.1% |
| $100,000 to $149,999 | 1,269 | 15.0% |
| $150,000 to $199,999 | 296 | 3.5% |
| $200,000+ | 161 | 1.9% |
Household Income by Householder Age in Ouachita County
The median household income in Ouachita County is $47,348, with the highest median household income of $56,307 found in the 25 to 44 years age bracket for the primary householder. A total of 2,313 households (27.3%) fall into this category. Meanwhile, the 15 to 24 years age bracket for the primary householder has the lowest median household income of $0, with 79 households (0.9%) in this group.
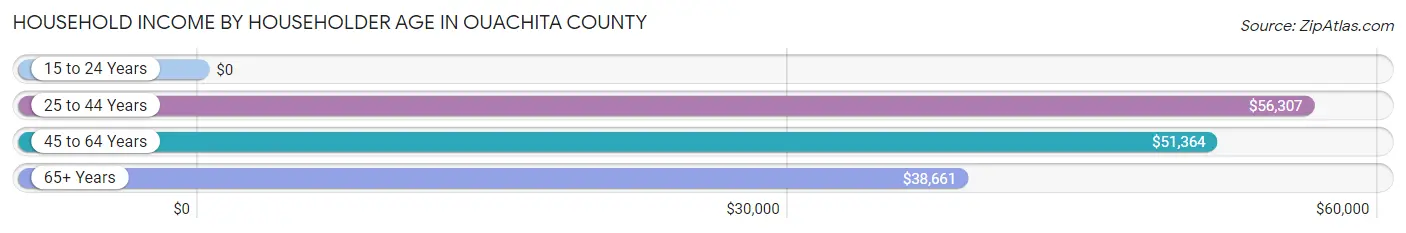
| Income Bracket | # Households | Median Income |
| 15 to 24 Years | 79 (0.9%) | $0 |
| 25 to 44 Years | 2,313 (27.3%) | $56,307 |
| 45 to 64 Years | 3,432 (40.6%) | $51,364 |
| 65+ Years | 2,635 (31.1%) | $38,661 |
| Total | 8,459 (100.0%) | $47,348 |
Poverty in Ouachita County
Income Below Poverty by Sex and Age in Ouachita County
With 18.0% poverty level for males and 20.1% for females among the residents of Ouachita County, 15 year old males and 16 and 17 year old females are the most vulnerable to poverty, with 95 males (82.6%) and 116 females (54.7%) in their respective age groups living below the poverty level.
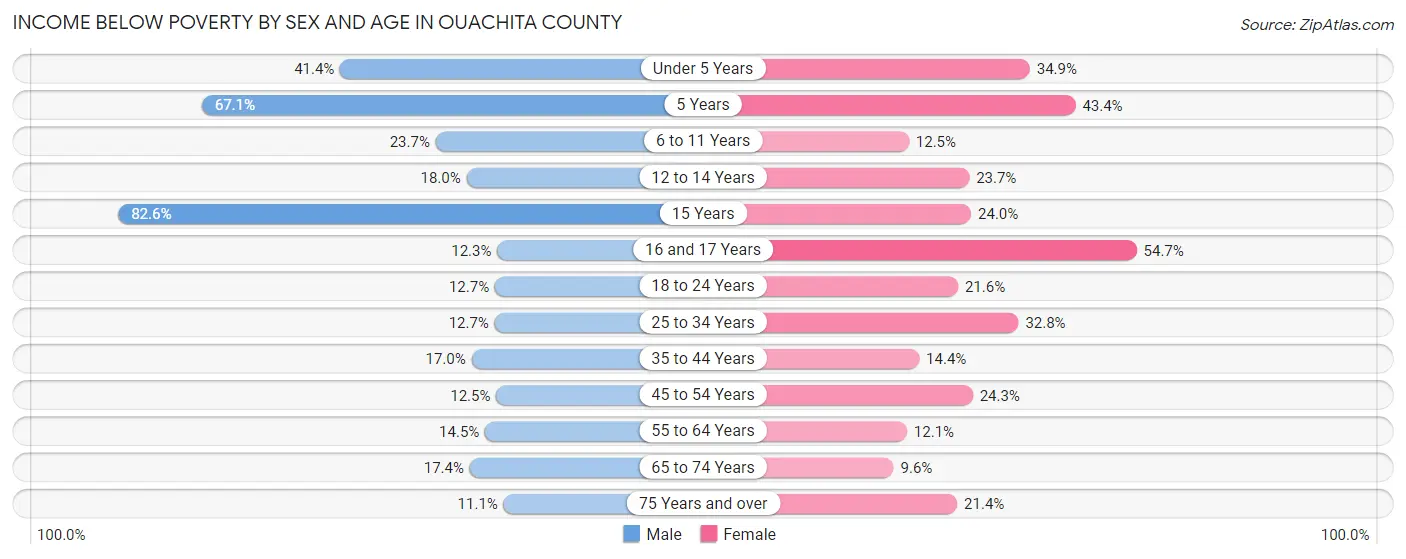
| Age Bracket | Male | Female |
| Under 5 Years | 304 (41.4%) | 157 (34.9%) |
| 5 Years | 51 (67.1%) | 36 (43.4%) |
| 6 to 11 Years | 208 (23.7%) | 101 (12.4%) |
| 12 to 14 Years | 81 (18.0%) | 153 (23.6%) |
| 15 Years | 95 (82.6%) | 42 (24.0%) |
| 16 and 17 Years | 45 (12.3%) | 116 (54.7%) |
| 18 to 24 Years | 126 (12.7%) | 168 (21.6%) |
| 25 to 34 Years | 150 (12.7%) | 381 (32.8%) |
| 35 to 44 Years | 204 (17.0%) | 194 (14.4%) |
| 45 to 54 Years | 158 (12.4%) | 367 (24.3%) |
| 55 to 64 Years | 233 (14.5%) | 209 (12.1%) |
| 65 to 74 Years | 213 (17.4%) | 139 (9.6%) |
| 75 Years and over | 78 (11.1%) | 221 (21.4%) |
| Total | 1,946 (18.0%) | 2,284 (20.1%) |
Income Above Poverty by Sex and Age in Ouachita County
According to the poverty statistics in Ouachita County, males aged 75 years and over and females aged 65 to 74 years are the age groups that are most secure financially, with 88.9% of males and 90.4% of females in these age groups living above the poverty line.
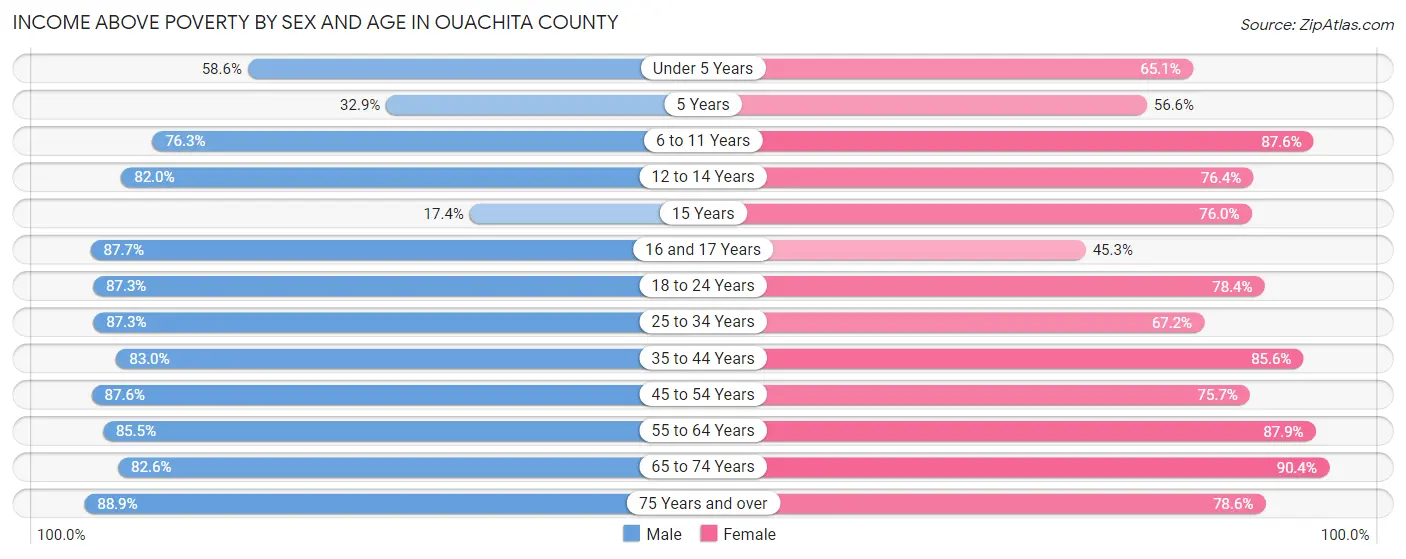
| Age Bracket | Male | Female |
| Under 5 Years | 430 (58.6%) | 293 (65.1%) |
| 5 Years | 25 (32.9%) | 47 (56.6%) |
| 6 to 11 Years | 670 (76.3%) | 710 (87.5%) |
| 12 to 14 Years | 370 (82.0%) | 494 (76.3%) |
| 15 Years | 20 (17.4%) | 133 (76.0%) |
| 16 and 17 Years | 322 (87.7%) | 96 (45.3%) |
| 18 to 24 Years | 867 (87.3%) | 611 (78.4%) |
| 25 to 34 Years | 1,027 (87.3%) | 781 (67.2%) |
| 35 to 44 Years | 993 (83.0%) | 1,157 (85.6%) |
| 45 to 54 Years | 1,111 (87.5%) | 1,143 (75.7%) |
| 55 to 64 Years | 1,373 (85.5%) | 1,519 (87.9%) |
| 65 to 74 Years | 1,013 (82.6%) | 1,308 (90.4%) |
| 75 Years and over | 626 (88.9%) | 811 (78.6%) |
| Total | 8,847 (82.0%) | 9,103 (79.9%) |
Income Below Poverty Among Married-Couple Families in Ouachita County
The poverty statistics for married-couple families in Ouachita County show that 3.8% or 139 of the total 3,623 families live below the poverty line. Families with 5 or more children have the highest poverty rate of 32.6%, comprising of 14 families. On the other hand, families with no children have the lowest poverty rate of 2.1%, which includes 53 families.
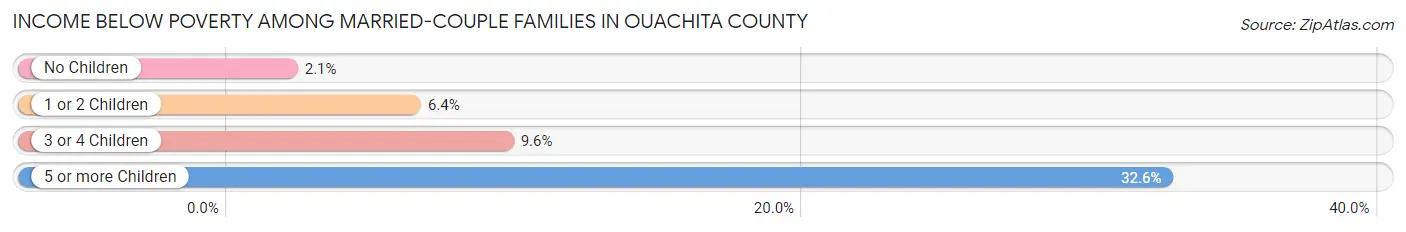
| Children | Above Poverty | Below Poverty |
| No Children | 2,497 (97.9%) | 53 (2.1%) |
| 1 or 2 Children | 779 (93.6%) | 53 (6.4%) |
| 3 or 4 Children | 179 (90.4%) | 19 (9.6%) |
| 5 or more Children | 29 (67.4%) | 14 (32.6%) |
| Total | 3,484 (96.2%) | 139 (3.8%) |
Income Below Poverty Among Single-Parent Households in Ouachita County
According to the poverty data in Ouachita County, 12.2% or 43 single-father households and 34.0% or 559 single-mother households are living below the poverty line. Among single-father households, those with 1 or 2 children have the highest poverty rate, with 25 households (41.7%) experiencing poverty. Likewise, among single-mother households, those with 5 or more children have the highest poverty rate, with 9 households (100.0%) falling below the poverty line.
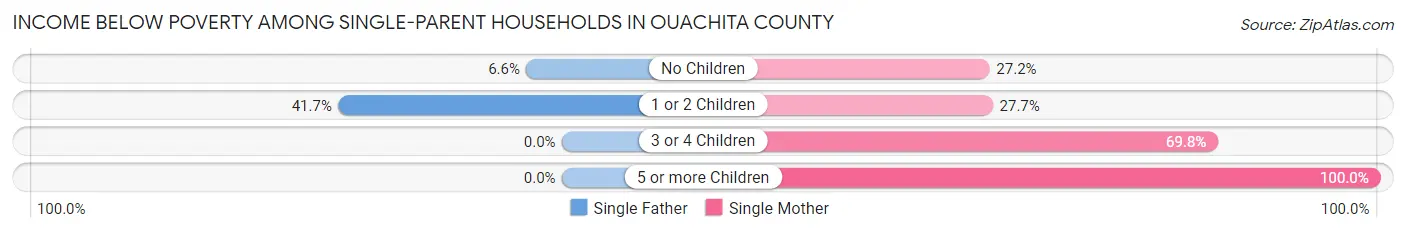
| Children | Single Father | Single Mother |
| No Children | 18 (6.6%) | 164 (27.2%) |
| 1 or 2 Children | 25 (41.7%) | 220 (27.7%) |
| 3 or 4 Children | 0 (0.0%) | 166 (69.8%) |
| 5 or more Children | 0 (0.0%) | 9 (100.0%) |
| Total | 43 (12.2%) | 559 (34.0%) |
Income Below Poverty Among Married-Couple vs Single-Parent Households in Ouachita County
The poverty data for Ouachita County shows that 139 of the married-couple family households (3.8%) and 602 of the single-parent households (30.1%) are living below the poverty level. Within the married-couple family households, those with 5 or more children have the highest poverty rate, with 14 households (32.6%) falling below the poverty line. Among the single-parent households, those with 5 or more children have the highest poverty rate, with 9 household (100.0%) living below poverty.
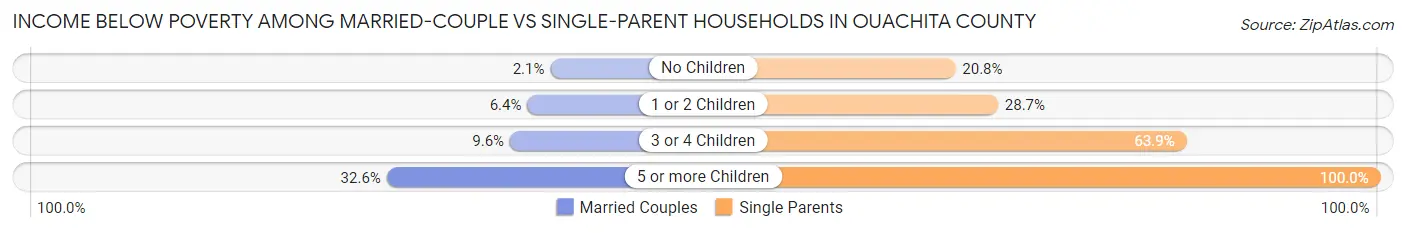
| Children | Married-Couple Families | Single-Parent Households |
| No Children | 53 (2.1%) | 182 (20.8%) |
| 1 or 2 Children | 53 (6.4%) | 245 (28.7%) |
| 3 or 4 Children | 19 (9.6%) | 166 (63.8%) |
| 5 or more Children | 14 (32.6%) | 9 (100.0%) |
| Total | 139 (3.8%) | 602 (30.1%) |
Race in Ouachita County
The most populous races in Ouachita County are White / Caucasian (12,619 | 55.8%), Black / African American (9,275 | 41.0%), and Two or more Races (631 | 2.8%).
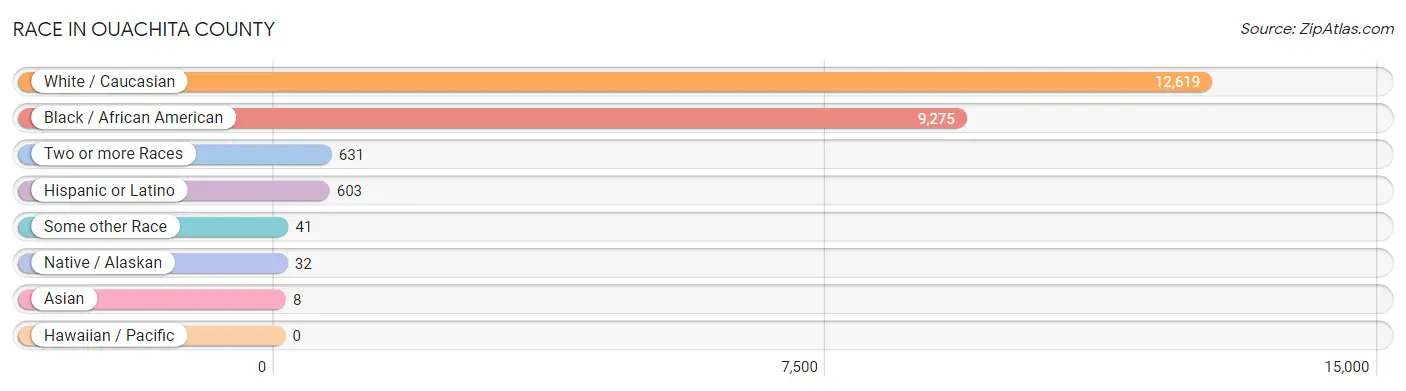
| Race | # Population | % Population |
| Asian | 8 | 0.0% |
| Black / African American | 9,275 | 41.0% |
| Hawaiian / Pacific | 0 | 0.0% |
| Hispanic or Latino | 603 | 2.7% |
| Native / Alaskan | 32 | 0.1% |
| White / Caucasian | 12,619 | 55.8% |
| Two or more Races | 631 | 2.8% |
| Some other Race | 41 | 0.2% |
| Total | 22,606 | 100.0% |
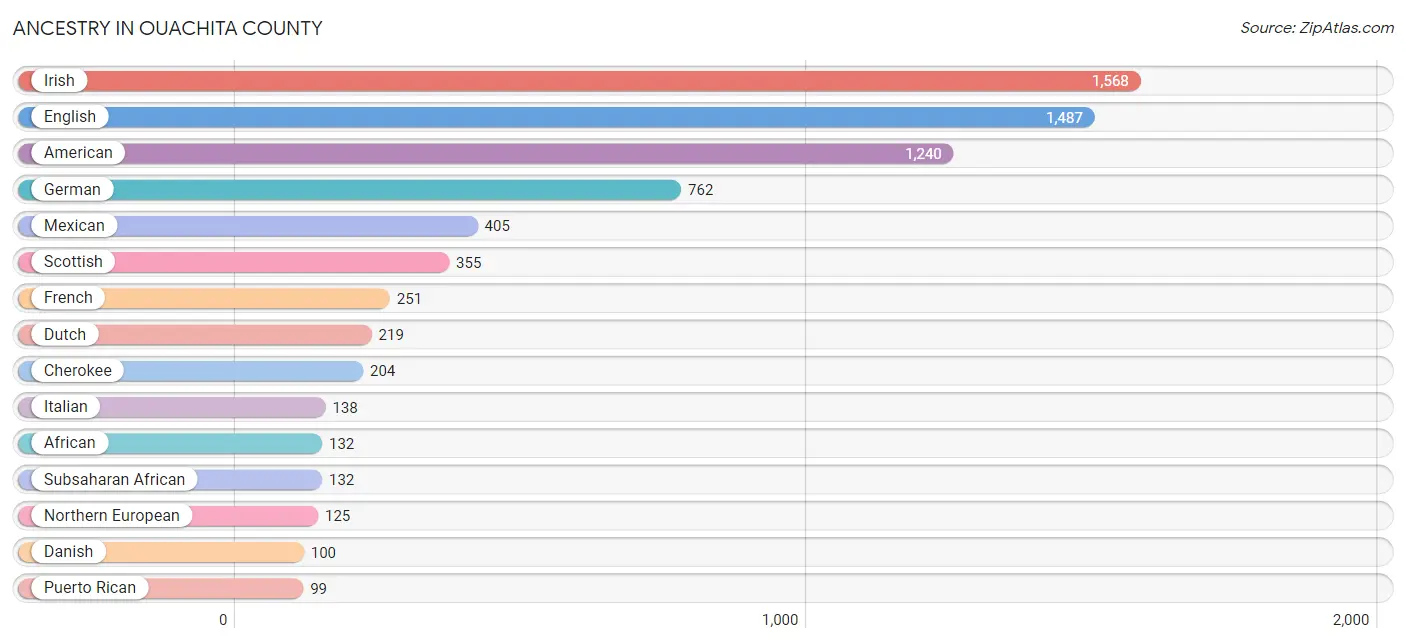
Ancestry in Ouachita County
The most populous ancestries reported in Ouachita County are Irish (1,568 | 6.9%), English (1,487 | 6.6%), American (1,240 | 5.5%), German (762 | 3.4%), and Mexican (405 | 1.8%), together accounting for 24.2% of all Ouachita County residents.
| Ancestry | # Population | % Population |
| African | 132 | 0.6% |
| American | 1,240 | 5.5% |
| Apache | 53 | 0.2% |
| Austrian | 8 | 0.0% |
| Bhutanese | 82 | 0.4% |
| Blackfeet | 82 | 0.4% |
| British | 43 | 0.2% |
| Cajun | 2 | 0.0% |
| Canadian | 21 | 0.1% |
| Central American | 17 | 0.1% |
| Cherokee | 204 | 0.9% |
| Cree | 13 | 0.1% |
| Czech | 4 | 0.0% |
| Danish | 100 | 0.4% |
| Dutch | 219 | 1.0% |
| Eastern European | 92 | 0.4% |
| English | 1,487 | 6.6% |
| European | 93 | 0.4% |
| French | 251 | 1.1% |
| French Canadian | 4 | 0.0% |
| German | 762 | 3.4% |
| Guatemalan | 17 | 0.1% |
| Haitian | 10 | 0.0% |
| Irish | 1,568 | 6.9% |
| Italian | 138 | 0.6% |
| Korean | 5 | 0.0% |
| Mexican | 405 | 1.8% |
| Northern European | 125 | 0.5% |
| Norwegian | 30 | 0.1% |
| Osage | 6 | 0.0% |
| Polish | 45 | 0.2% |
| Portuguese | 7 | 0.0% |
| Puerto Rican | 99 | 0.4% |
| Scandinavian | 28 | 0.1% |
| Scotch-Irish | 91 | 0.4% |
| Scottish | 355 | 1.6% |
| Sioux | 53 | 0.2% |
| South American | 19 | 0.1% |
| Spaniard | 45 | 0.2% |
| Sri Lankan | 3 | 0.0% |
| Subsaharan African | 132 | 0.6% |
| Swedish | 47 | 0.2% |
| Venezuelan | 19 | 0.1% |
| Welsh | 9 | 0.0% | View All 44 Rows |
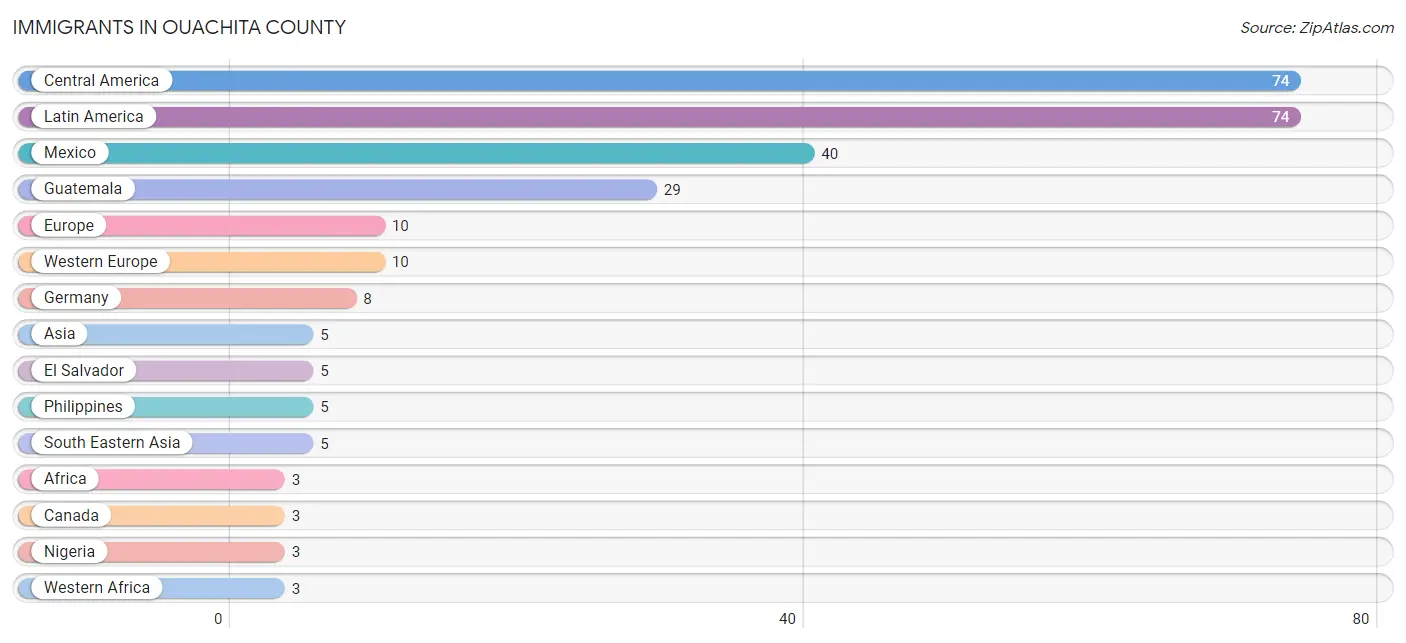
Immigrants in Ouachita County
The most numerous immigrant groups reported in Ouachita County came from Central America (74 | 0.3%), Latin America (74 | 0.3%), Mexico (40 | 0.2%), Guatemala (29 | 0.1%), and Europe (10 | 0.0%), together accounting for 1.0% of all Ouachita County residents.
| Immigration Origin | # Population | % Population |
| Africa | 3 | 0.0% |
| Asia | 5 | 0.0% |
| Canada | 3 | 0.0% |
| Central America | 74 | 0.3% |
| El Salvador | 5 | 0.0% |
| Europe | 10 | 0.0% |
| Germany | 8 | 0.0% |
| Guatemala | 29 | 0.1% |
| Latin America | 74 | 0.3% |
| Mexico | 40 | 0.2% |
| Netherlands | 2 | 0.0% |
| Nigeria | 3 | 0.0% |
| Philippines | 5 | 0.0% |
| South Eastern Asia | 5 | 0.0% |
| Western Africa | 3 | 0.0% |
| Western Europe | 10 | 0.0% | View All 16 Rows |
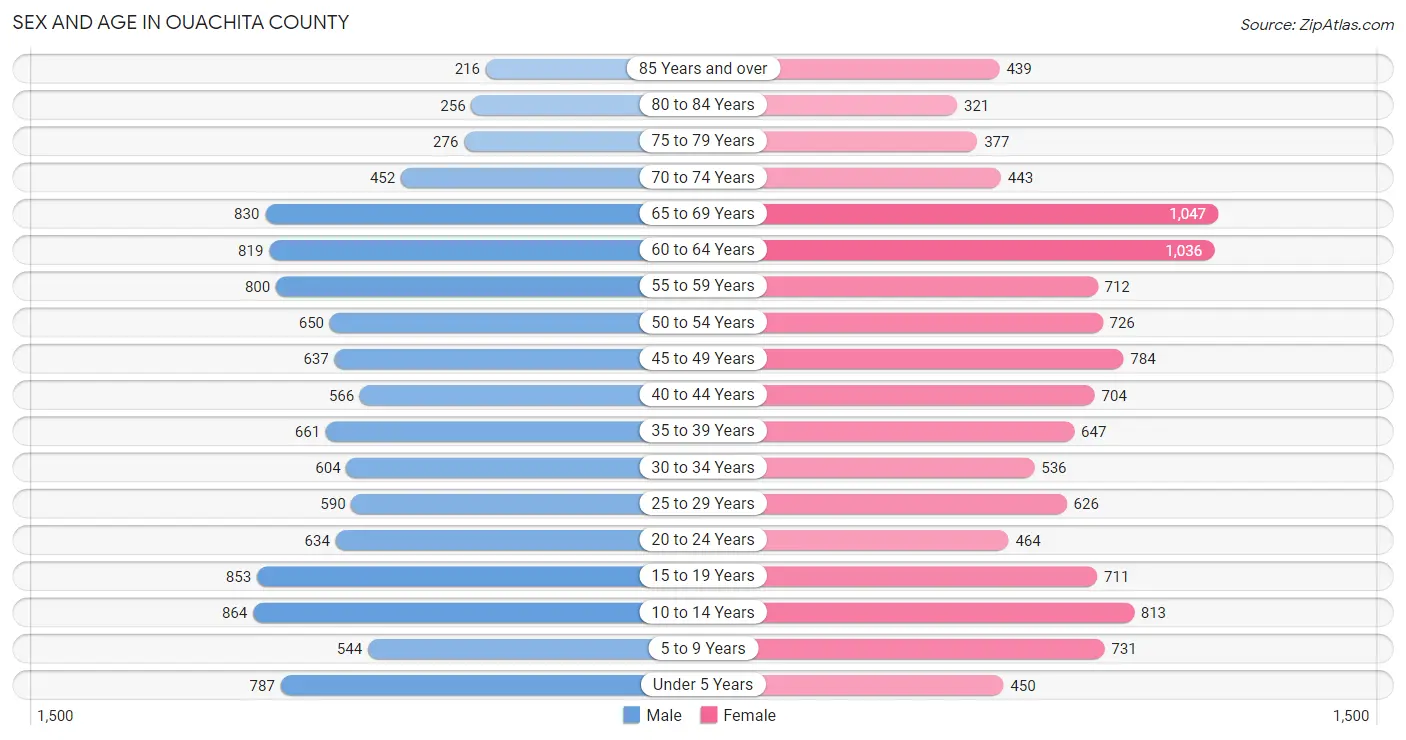
Sex and Age in Ouachita County
Sex and Age in Ouachita County
The most populous age groups in Ouachita County are 10 to 14 Years (864 | 7.8%) for men and 65 to 69 Years (1,047 | 9.0%) for women.
| Age Bracket | Male | Female |
| Under 5 Years | 787 (7.1%) | 450 (3.9%) |
| 5 to 9 Years | 544 (4.9%) | 731 (6.3%) |
| 10 to 14 Years | 864 (7.8%) | 813 (7.0%) |
| 15 to 19 Years | 853 (7.7%) | 711 (6.1%) |
| 20 to 24 Years | 634 (5.7%) | 464 (4.0%) |
| 25 to 29 Years | 590 (5.3%) | 626 (5.4%) |
| 30 to 34 Years | 604 (5.5%) | 536 (4.6%) |
| 35 to 39 Years | 661 (6.0%) | 647 (5.6%) |
| 40 to 44 Years | 566 (5.1%) | 704 (6.1%) |
| 45 to 49 Years | 637 (5.8%) | 784 (6.8%) |
| 50 to 54 Years | 650 (5.9%) | 726 (6.3%) |
| 55 to 59 Years | 800 (7.2%) | 712 (6.2%) |
| 60 to 64 Years | 819 (7.4%) | 1,036 (9.0%) |
| 65 to 69 Years | 830 (7.5%) | 1,047 (9.0%) |
| 70 to 74 Years | 452 (4.1%) | 443 (3.8%) |
| 75 to 79 Years | 276 (2.5%) | 377 (3.3%) |
| 80 to 84 Years | 256 (2.3%) | 321 (2.8%) |
| 85 Years and over | 216 (2.0%) | 439 (3.8%) |
| Total | 11,039 (100.0%) | 11,567 (100.0%) |
Families and Households in Ouachita County
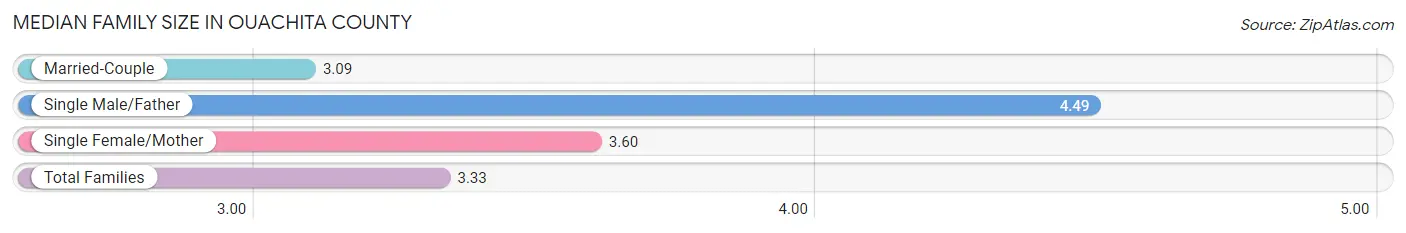
Median Family Size in Ouachita County
The median family size in Ouachita County is 3.33 persons per family, with single male/father families (353 | 6.3%) accounting for the largest median family size of 4.49 persons per family. On the other hand, married-couple families (3,623 | 64.5%) represent the smallest median family size with 3.09 persons per family.
| Family Type | # Families | Family Size |
| Married-Couple | 3,623 (64.5%) | 3.09 |
| Single Male/Father | 353 (6.3%) | 4.49 |
| Single Female/Mother | 1,644 (29.2%) | 3.60 |
| Total Families | 5,620 (100.0%) | 3.33 |
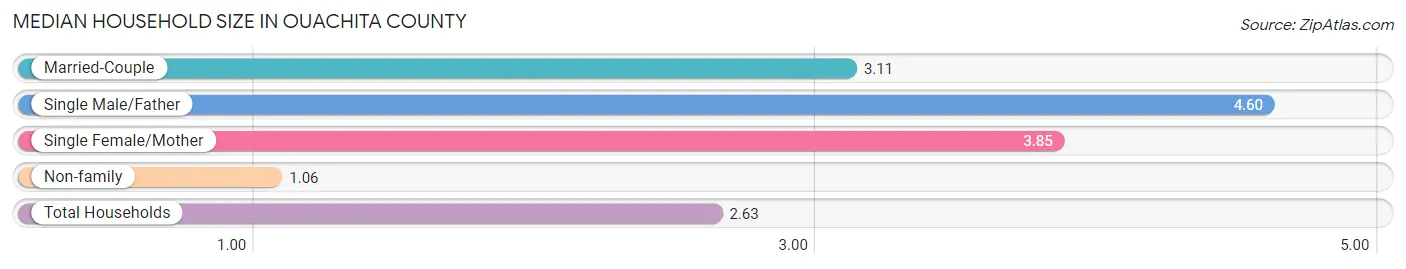
Median Household Size in Ouachita County
The median household size in Ouachita County is 2.63 persons per household, with single male/father households (353 | 4.2%) accounting for the largest median household size of 4.6 persons per household. non-family households (2,839 | 33.6%) represent the smallest median household size with 1.06 persons per household.
| Household Type | # Households | Household Size |
| Married-Couple | 3,623 (42.8%) | 3.11 |
| Single Male/Father | 353 (4.2%) | 4.60 |
| Single Female/Mother | 1,644 (19.4%) | 3.85 |
| Non-family | 2,839 (33.6%) | 1.06 |
| Total Households | 8,459 (100.0%) | 2.63 |
Household Size by Marriage Status in Ouachita County
Out of a total of 8,459 households in Ouachita County, 5,620 (66.4%) are family households, while 2,839 (33.6%) are nonfamily households. The most numerous type of family households are 2-person households, comprising 3,146, and the most common type of nonfamily households are 1-person households, comprising 2,712.
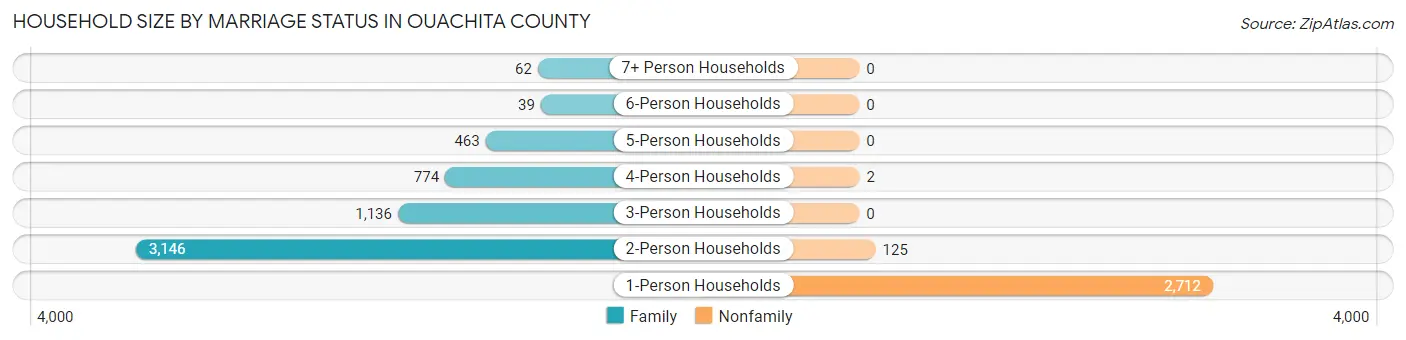
| Household Size | Family Households | Nonfamily Households |
| 1-Person Households | - | 2,712 (32.1%) |
| 2-Person Households | 3,146 (37.2%) | 125 (1.5%) |
| 3-Person Households | 1,136 (13.4%) | 0 (0.0%) |
| 4-Person Households | 774 (9.1%) | 2 (0.0%) |
| 5-Person Households | 463 (5.5%) | 0 (0.0%) |
| 6-Person Households | 39 (0.5%) | 0 (0.0%) |
| 7+ Person Households | 62 (0.7%) | 0 (0.0%) |
| Total | 5,620 (66.4%) | 2,839 (33.6%) |
Female Fertility in Ouachita County
Fertility by Age in Ouachita County
Average fertility rate in Ouachita County is 85.0 births per 1,000 women. Women in the age bracket of 20 to 34 years have the highest fertility rate with 193.0 births per 1,000 women. Women in the age bracket of 20 to 34 years acount for 81.4% of all women with births.
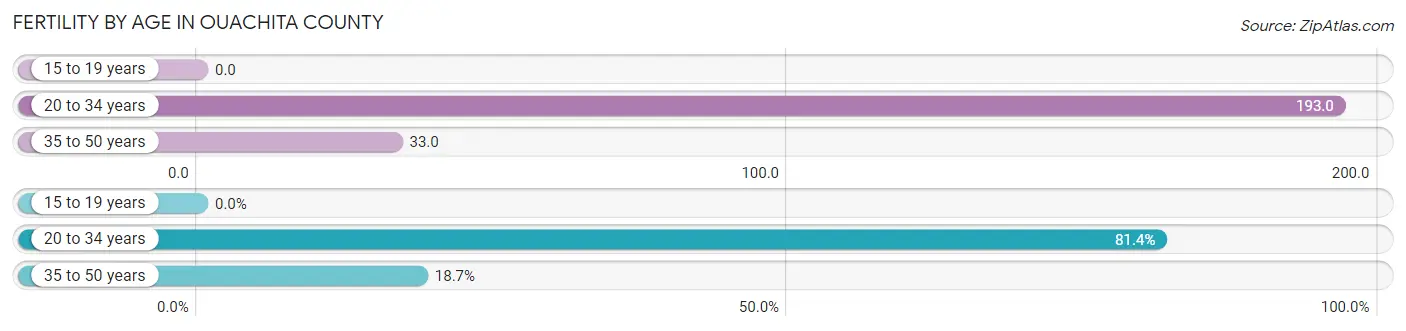
| Age Bracket | Women with Births | Births / 1,000 Women |
| 15 to 19 years | 0 (0.0%) | 0.0 |
| 20 to 34 years | 314 (81.4%) | 193.0 |
| 35 to 50 years | 72 (18.6%) | 33.0 |
| Total | 386 (100.0%) | 85.0 |
Fertility by Age by Marriage Status in Ouachita County
16.3% of women with births (386) in Ouachita County are married. The highest percentage of unmarried women with births falls into 35 to 50 years age bracket with 100.0% of them unmarried at the time of birth, while the lowest percentage of unmarried women with births belong to 20 to 34 years age bracket with 79.9% of them unmarried.
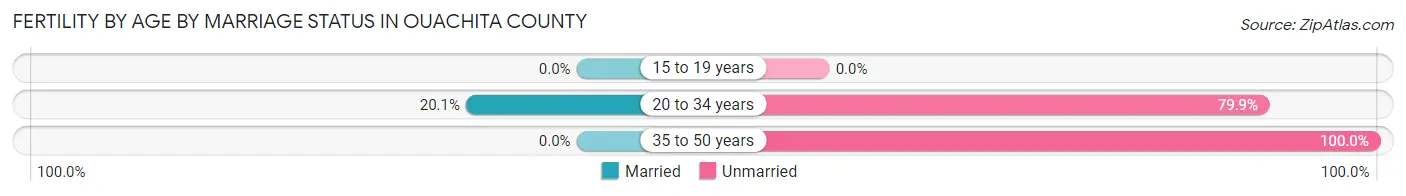
| Age Bracket | Married | Unmarried |
| 15 to 19 years | 0 (0.0%) | 0 (0.0%) |
| 20 to 34 years | 63 (20.1%) | 251 (79.9%) |
| 35 to 50 years | 0 (0.0%) | 72 (100.0%) |
| Total | 63 (16.3%) | 323 (83.7%) |
Fertility by Education in Ouachita County
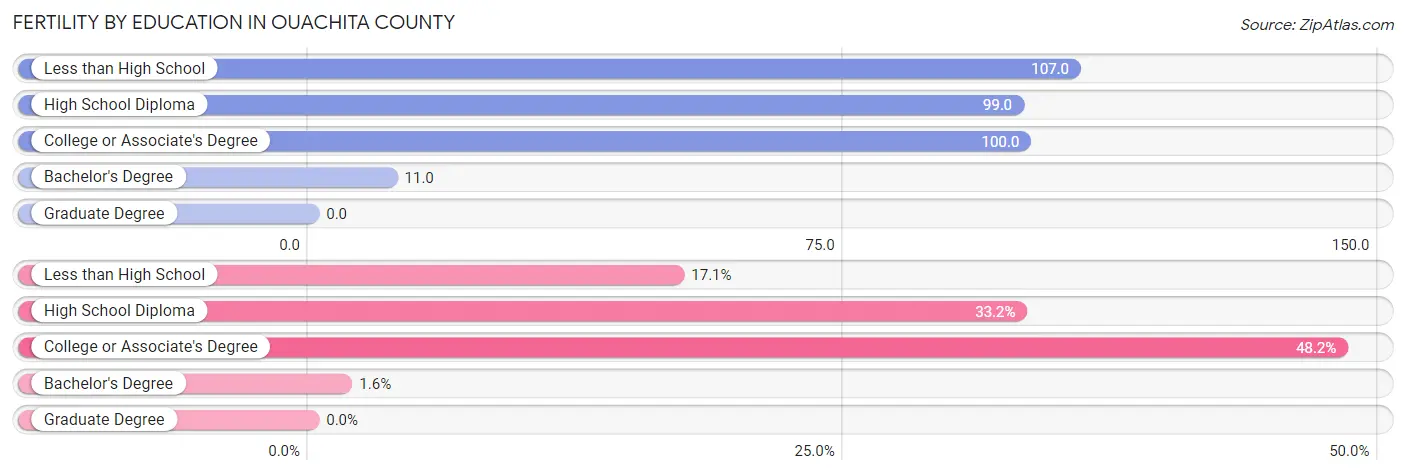
| Educational Attainment | Women with Births | Births / 1,000 Women |
| Less than High School | 66 (17.1%) | 107.0 |
| High School Diploma | 128 (33.2%) | 99.0 |
| College or Associate's Degree | 186 (48.2%) | 100.0 |
| Bachelor's Degree | 6 (1.5%) | 11.0 |
| Graduate Degree | 0 (0.0%) | 0.0 |
| Total | 386 (100.0%) | 85.0 |
Fertility by Education by Marriage Status in Ouachita County
83.7% of women with births in Ouachita County are unmarried. Women with the educational attainment of bachelor's degree are most likely to be married with 100.0% of them married at childbirth, while women with the educational attainment of college or associate's degree are least likely to be married with 97.9% of them unmarried at childbirth.
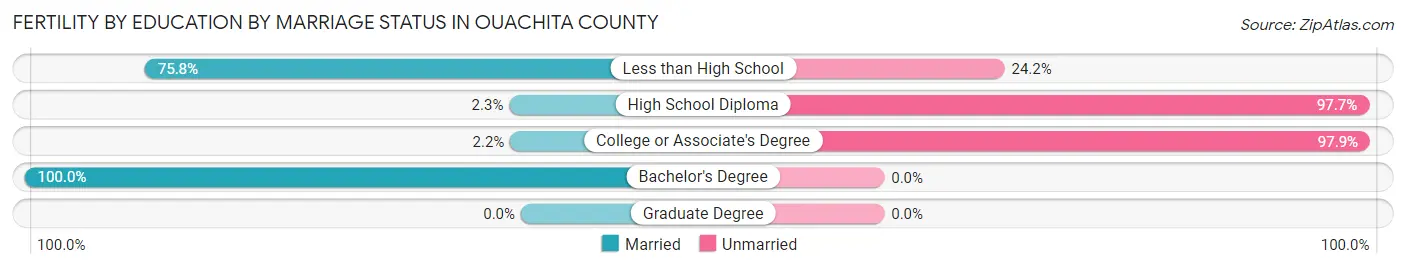
| Educational Attainment | Married | Unmarried |
| Less than High School | 50 (75.8%) | 16 (24.2%) |
| High School Diploma | 3 (2.3%) | 125 (97.7%) |
| College or Associate's Degree | 4 (2.1%) | 182 (97.9%) |
| Bachelor's Degree | 6 (100.0%) | 0 (0.0%) |
| Graduate Degree | 0 (0.0%) | 0 (0.0%) |
| Total | 63 (16.3%) | 323 (83.7%) |
Employment Characteristics in Ouachita County
Employment by Class of Employer in Ouachita County
Among the 8,345 employed individuals in Ouachita County, private company employees (5,619 | 67.3%), local government employees (674 | 8.1%), and state government employees (611 | 7.3%) make up the most common classes of employment.
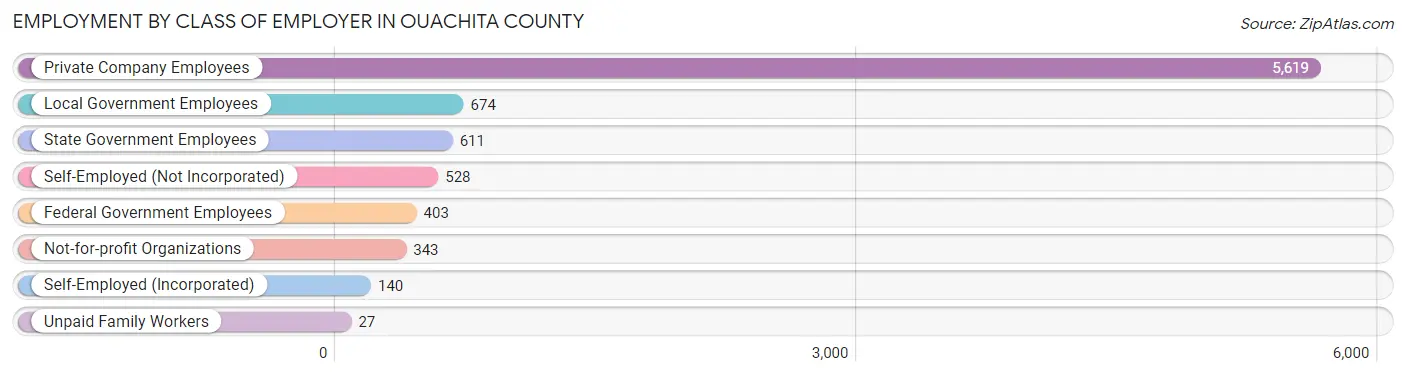
| Employer Class | # Employees | % Employees |
| Private Company Employees | 5,619 | 67.3% |
| Self-Employed (Incorporated) | 140 | 1.7% |
| Self-Employed (Not Incorporated) | 528 | 6.3% |
| Not-for-profit Organizations | 343 | 4.1% |
| Local Government Employees | 674 | 8.1% |
| State Government Employees | 611 | 7.3% |
| Federal Government Employees | 403 | 4.8% |
| Unpaid Family Workers | 27 | 0.3% |
| Total | 8,345 | 100.0% |
Employment Status by Age in Ouachita County
According to the labor force statistics for Ouachita County, out of the total population over 16 years of age (18,127), 50.2% or 9,100 individuals are in the labor force, with 6.5% or 592 of them unemployed. The age group with the highest labor force participation rate is 30 to 34 years, with 89.1% or 1,016 individuals in the labor force. Within the labor force, the 20 to 24 years age range has the highest percentage of unemployed individuals, with 19.1% or 161 of them being unemployed.
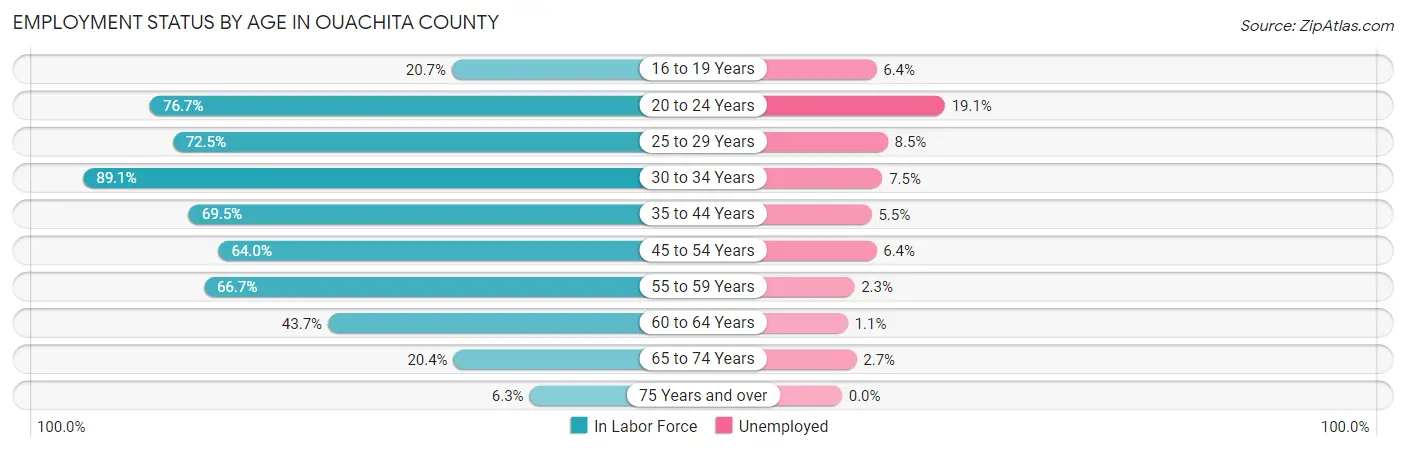
| Age Bracket | In Labor Force | Unemployed |
| 16 to 19 Years | 264 (20.7%) | 17 (6.4%) |
| 20 to 24 Years | 842 (76.7%) | 161 (19.1%) |
| 25 to 29 Years | 882 (72.5%) | 75 (8.5%) |
| 30 to 34 Years | 1,016 (89.1%) | 76 (7.5%) |
| 35 to 44 Years | 1,792 (69.5%) | 99 (5.5%) |
| 45 to 54 Years | 1,790 (64.0%) | 115 (6.4%) |
| 55 to 59 Years | 1,009 (66.7%) | 23 (2.3%) |
| 60 to 64 Years | 811 (43.7%) | 9 (1.1%) |
| 65 to 74 Years | 565 (20.4%) | 15 (2.7%) |
| 75 Years and over | 119 (6.3%) | 0 (0.0%) |
| Total | 9,100 (50.2%) | 592 (6.5%) |
Employment Status by Educational Attainment in Ouachita County
According to labor force statistics for Ouachita County, 65.8% of individuals (7,302) out of the total population between 25 and 64 years of age (11,098) are in the labor force, with 5.4% or 394 of them being unemployed. The group with the highest labor force participation rate are those with the educational attainment of bachelor's degree or higher, with 87.5% or 1,487 individuals in the labor force. Within the labor force, individuals with less than high school education have the highest percentage of unemployment, with 13.6% or 46 of them being unemployed.
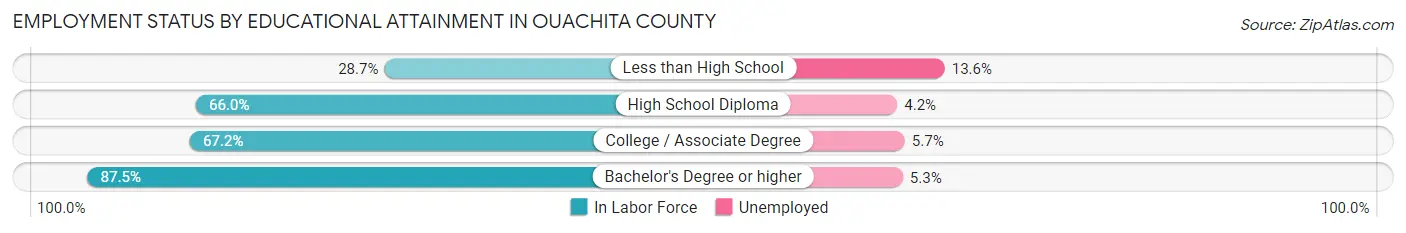
| Educational Attainment | In Labor Force | Unemployed |
| Less than High School | 337 (28.7%) | 160 (13.6%) |
| High School Diploma | 2,782 (66.0%) | 177 (4.2%) |
| College / Associate Degree | 2,694 (67.2%) | 229 (5.7%) |
| Bachelor's Degree or higher | 1,487 (87.5%) | 90 (5.3%) |
| Total | 7,302 (65.8%) | 599 (5.4%) |
Employment Occupations by Sex in Ouachita County
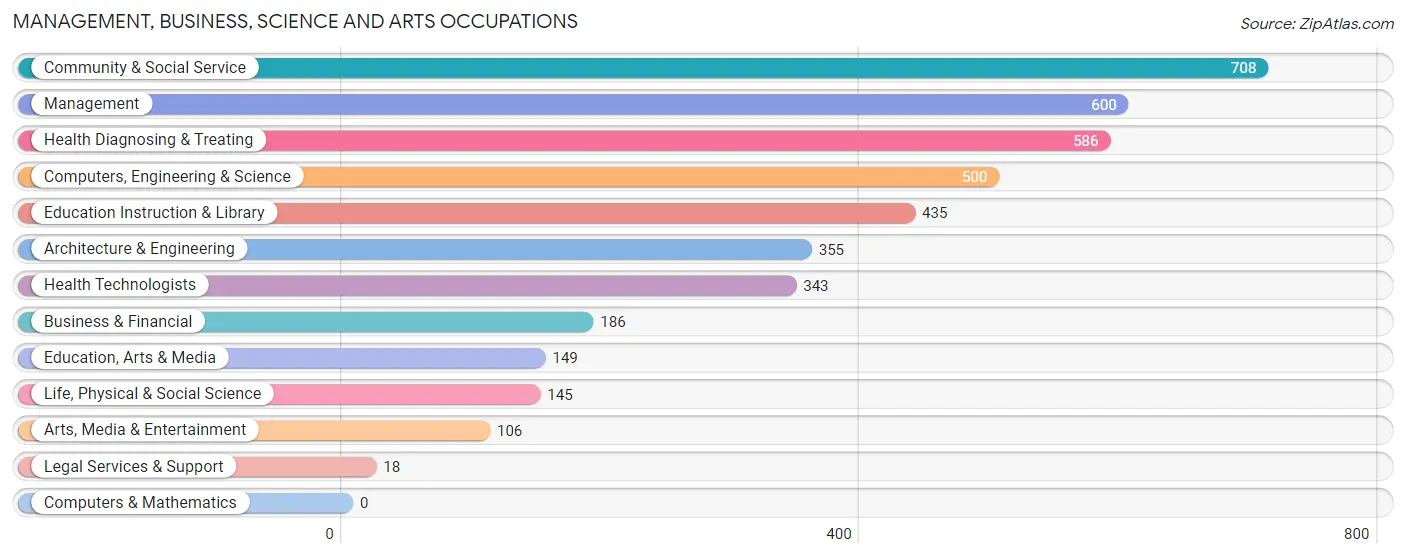
Management, Business, Science and Arts Occupations
The most common Management, Business, Science and Arts occupations in Ouachita County are Community & Social Service (708 | 8.3%), Management (600 | 7.1%), Health Diagnosing & Treating (586 | 6.9%), Computers, Engineering & Science (500 | 5.9%), and Education Instruction & Library (435 | 5.1%).
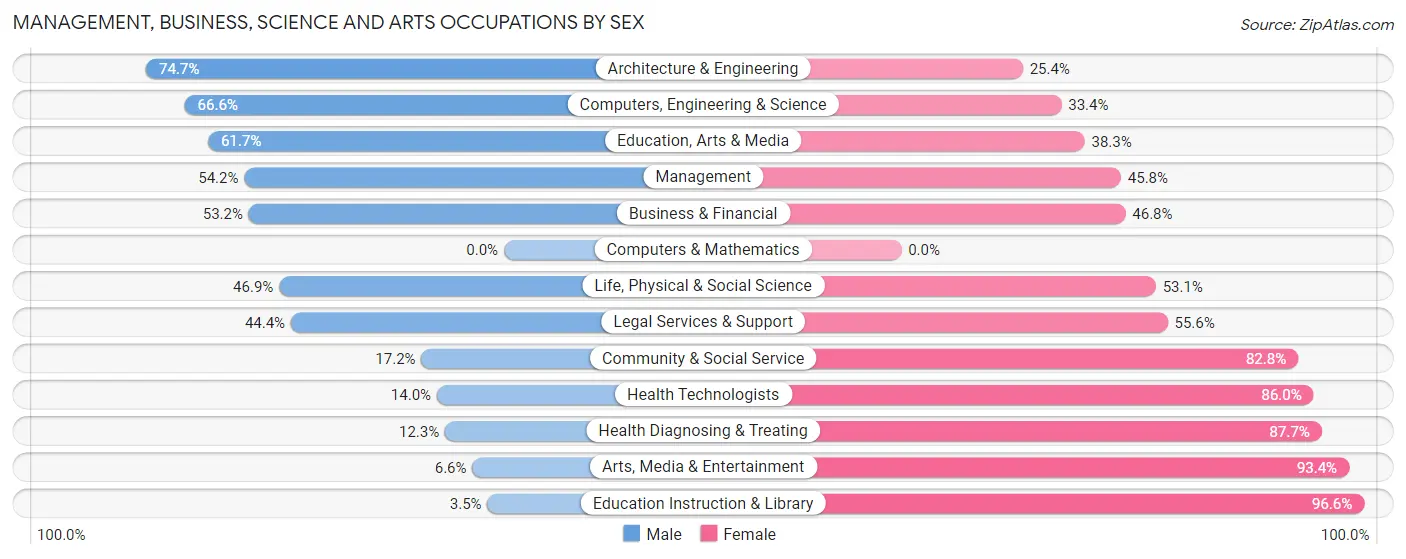
Management, Business, Science and Arts Occupations by Sex
Within the Management, Business, Science and Arts occupations in Ouachita County, the most male-oriented occupations are Architecture & Engineering (74.7%), Computers, Engineering & Science (66.6%), and Education, Arts & Media (61.7%), while the most female-oriented occupations are Education Instruction & Library (96.6%), Arts, Media & Entertainment (93.4%), and Health Diagnosing & Treating (87.7%).
| Occupation | Male | Female |
| Management | 325 (54.2%) | 275 (45.8%) |
| Business & Financial | 99 (53.2%) | 87 (46.8%) |
| Computers, Engineering & Science | 333 (66.6%) | 167 (33.4%) |
| Computers & Mathematics | 0 (0.0%) | 0 (0.0%) |
| Architecture & Engineering | 265 (74.7%) | 90 (25.4%) |
| Life, Physical & Social Science | 68 (46.9%) | 77 (53.1%) |
| Community & Social Service | 122 (17.2%) | 586 (82.8%) |
| Education, Arts & Media | 92 (61.7%) | 57 (38.3%) |
| Legal Services & Support | 8 (44.4%) | 10 (55.6%) |
| Education Instruction & Library | 15 (3.5%) | 420 (96.6%) |
| Arts, Media & Entertainment | 7 (6.6%) | 99 (93.4%) |
| Health Diagnosing & Treating | 72 (12.3%) | 514 (87.7%) |
| Health Technologists | 48 (14.0%) | 295 (86.0%) |
| Total (Category) | 951 (36.9%) | 1,629 (63.1%) |
| Total (Overall) | 4,503 (53.0%) | 3,994 (47.0%) |
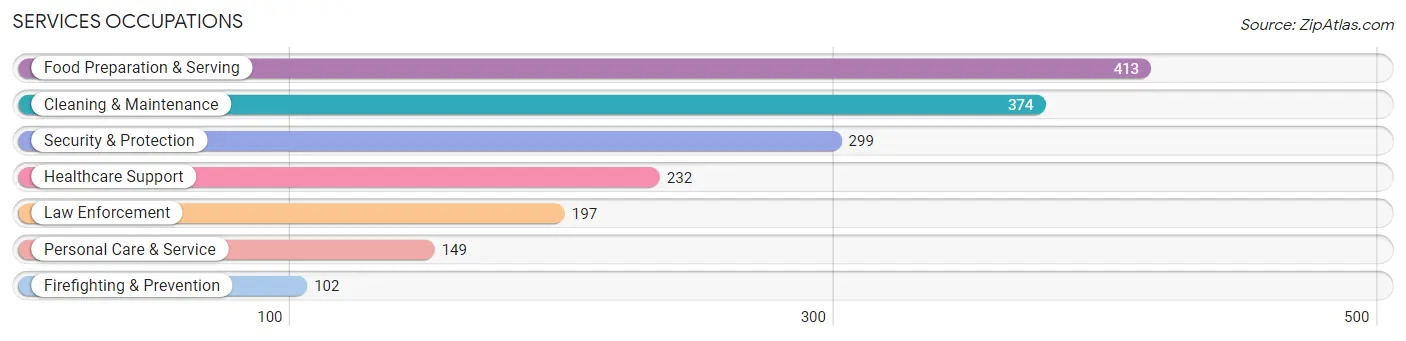
Services Occupations
The most common Services occupations in Ouachita County are Food Preparation & Serving (413 | 4.9%), Cleaning & Maintenance (374 | 4.4%), Security & Protection (299 | 3.5%), Healthcare Support (232 | 2.7%), and Law Enforcement (197 | 2.3%).
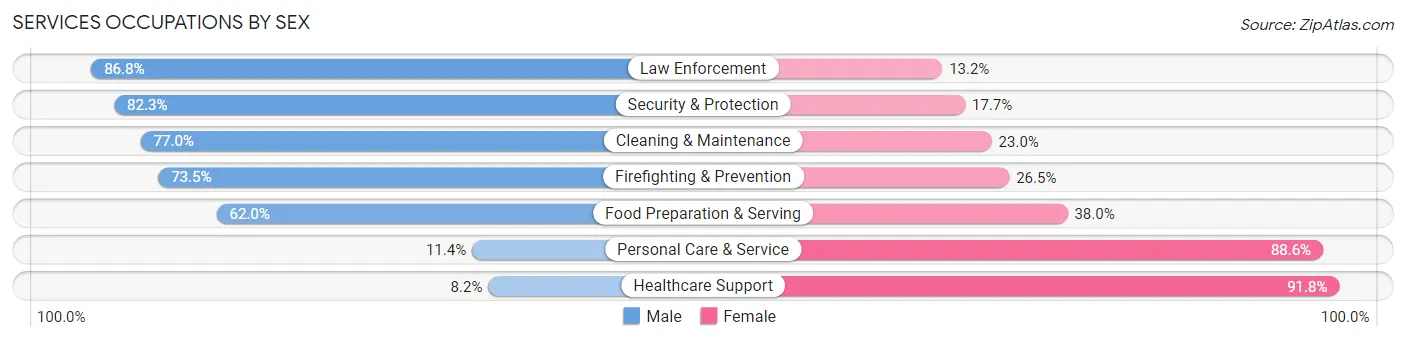
Services Occupations by Sex
Within the Services occupations in Ouachita County, the most male-oriented occupations are Law Enforcement (86.8%), Security & Protection (82.3%), and Cleaning & Maintenance (77.0%), while the most female-oriented occupations are Healthcare Support (91.8%), Personal Care & Service (88.6%), and Food Preparation & Serving (38.0%).
| Occupation | Male | Female |
| Healthcare Support | 19 (8.2%) | 213 (91.8%) |
| Security & Protection | 246 (82.3%) | 53 (17.7%) |
| Firefighting & Prevention | 75 (73.5%) | 27 (26.5%) |
| Law Enforcement | 171 (86.8%) | 26 (13.2%) |
| Food Preparation & Serving | 256 (62.0%) | 157 (38.0%) |
| Cleaning & Maintenance | 288 (77.0%) | 86 (23.0%) |
| Personal Care & Service | 17 (11.4%) | 132 (88.6%) |
| Total (Category) | 826 (56.3%) | 641 (43.7%) |
| Total (Overall) | 4,503 (53.0%) | 3,994 (47.0%) |
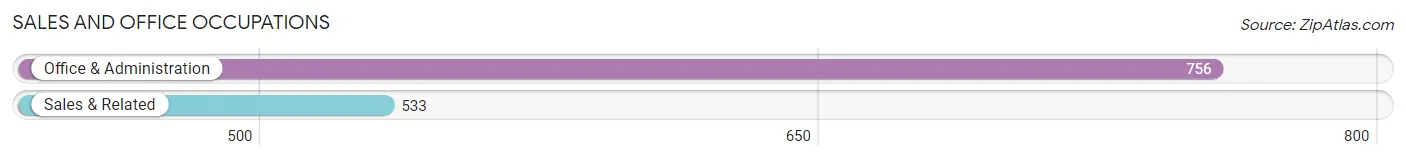
Sales and Office Occupations
The most common Sales and Office occupations in Ouachita County are Office & Administration (756 | 8.9%), and Sales & Related (533 | 6.3%).
Sales and Office Occupations by Sex
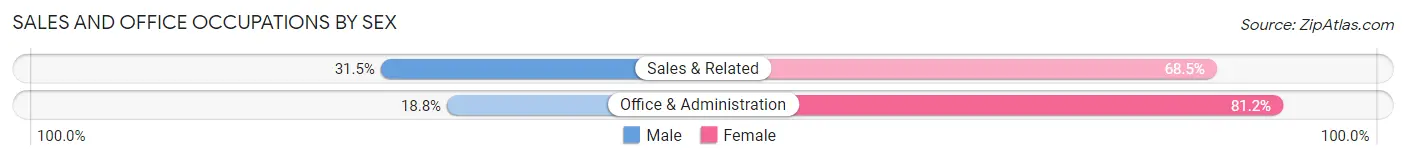
| Occupation | Male | Female |
| Sales & Related | 168 (31.5%) | 365 (68.5%) |
| Office & Administration | 142 (18.8%) | 614 (81.2%) |
| Total (Category) | 310 (24.0%) | 979 (75.9%) |
| Total (Overall) | 4,503 (53.0%) | 3,994 (47.0%) |
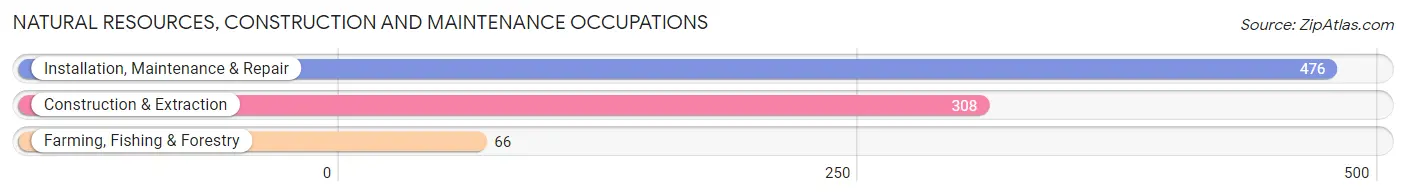
Natural Resources, Construction and Maintenance Occupations
The most common Natural Resources, Construction and Maintenance occupations in Ouachita County are Installation, Maintenance & Repair (476 | 5.6%), Construction & Extraction (308 | 3.6%), and Farming, Fishing & Forestry (66 | 0.8%).
Natural Resources, Construction and Maintenance Occupations by Sex
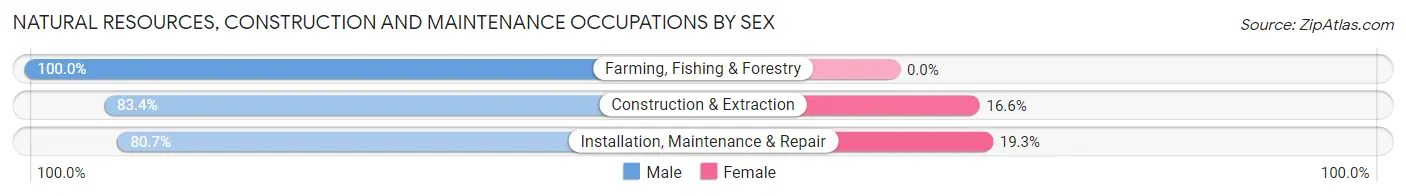
| Occupation | Male | Female |
| Farming, Fishing & Forestry | 66 (100.0%) | 0 (0.0%) |
| Construction & Extraction | 257 (83.4%) | 51 (16.6%) |
| Installation, Maintenance & Repair | 384 (80.7%) | 92 (19.3%) |
| Total (Category) | 707 (83.2%) | 143 (16.8%) |
| Total (Overall) | 4,503 (53.0%) | 3,994 (47.0%) |
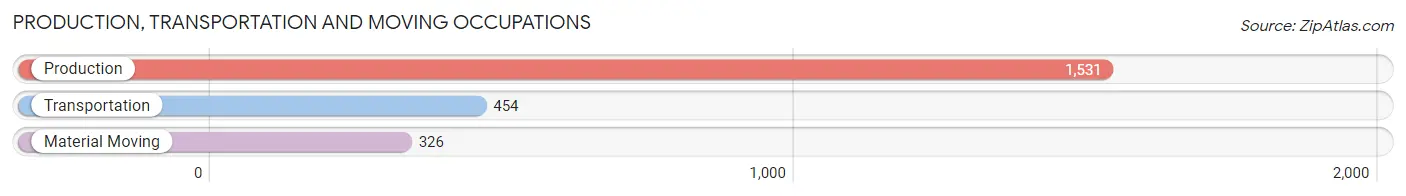
Production, Transportation and Moving Occupations
The most common Production, Transportation and Moving occupations in Ouachita County are Production (1,531 | 18.0%), Transportation (454 | 5.3%), and Material Moving (326 | 3.8%).
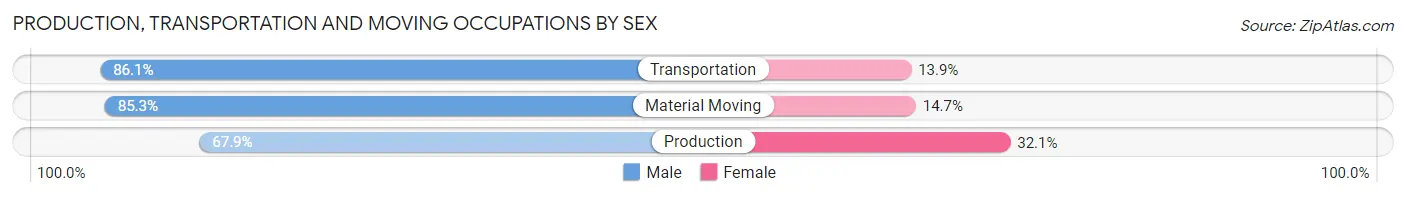
Production, Transportation and Moving Occupations by Sex
| Occupation | Male | Female |
| Production | 1,040 (67.9%) | 491 (32.1%) |
| Transportation | 391 (86.1%) | 63 (13.9%) |
| Material Moving | 278 (85.3%) | 48 (14.7%) |
| Total (Category) | 1,709 (74.0%) | 602 (26.1%) |
| Total (Overall) | 4,503 (53.0%) | 3,994 (47.0%) |
Employment Industries by Sex in Ouachita County
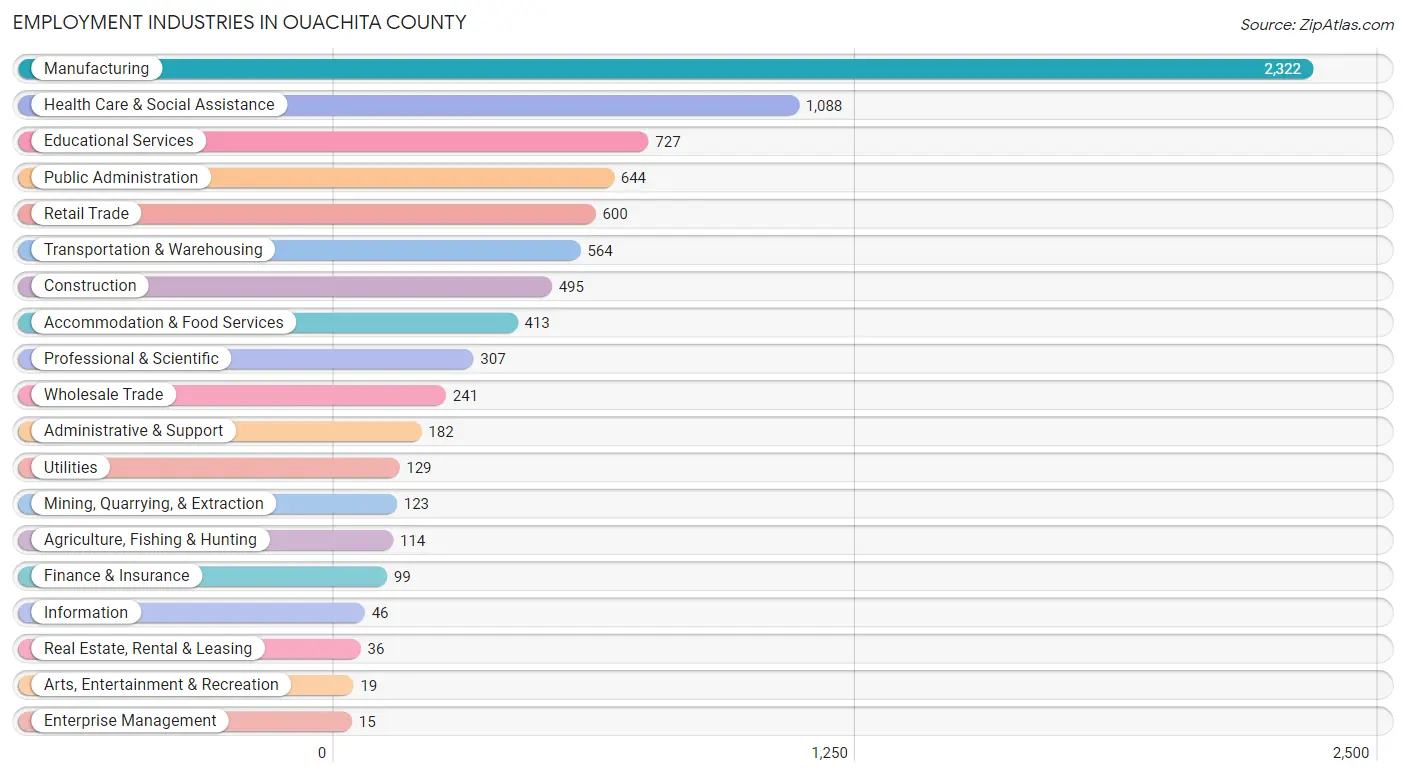
Employment Industries in Ouachita County
The major employment industries in Ouachita County include Manufacturing (2,322 | 27.3%), Health Care & Social Assistance (1,088 | 12.8%), Educational Services (727 | 8.6%), Public Administration (644 | 7.6%), and Retail Trade (600 | 7.1%).
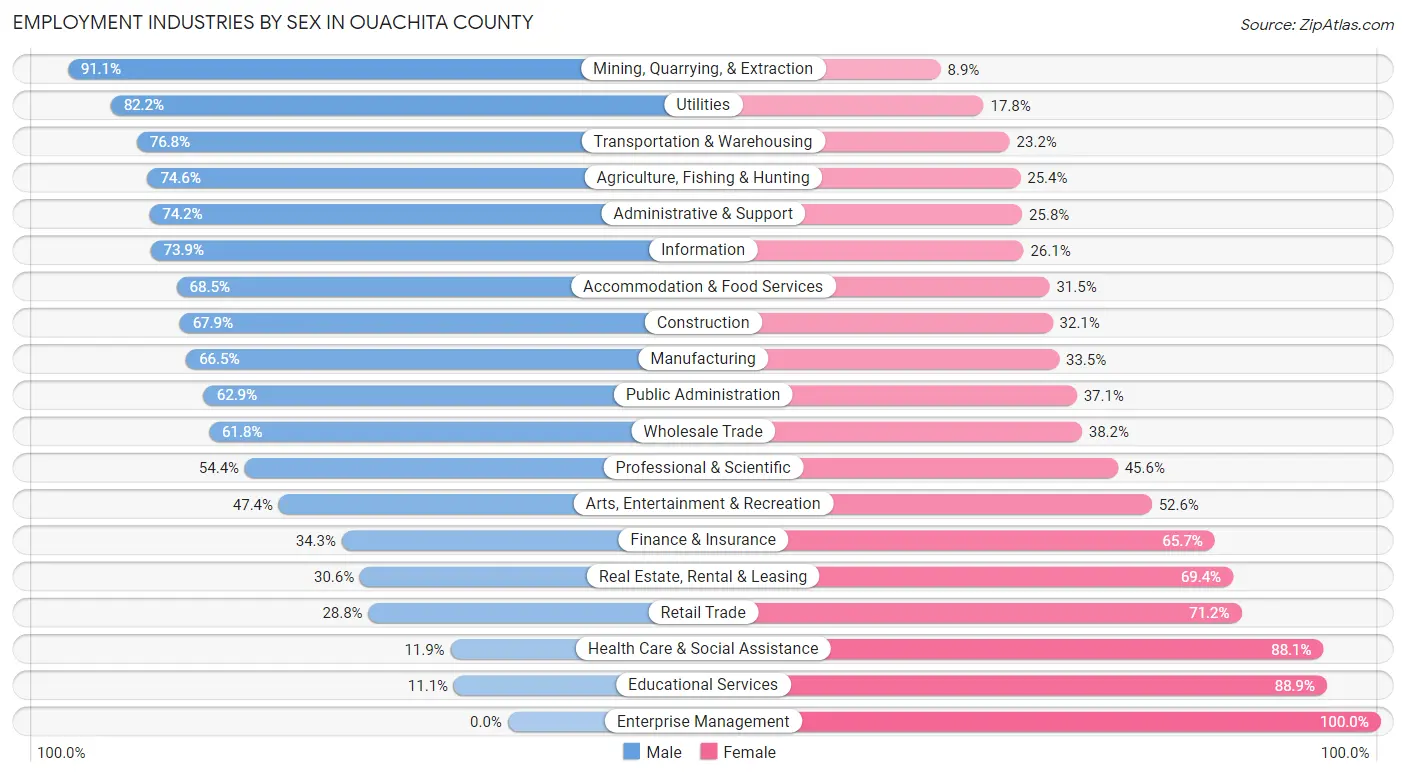
Employment Industries by Sex in Ouachita County
The Ouachita County industries that see more men than women are Mining, Quarrying, & Extraction (91.1%), Utilities (82.2%), and Transportation & Warehousing (76.8%), whereas the industries that tend to have a higher number of women are Enterprise Management (100.0%), Educational Services (88.9%), and Health Care & Social Assistance (88.1%).
| Industry | Male | Female |
| Agriculture, Fishing & Hunting | 85 (74.6%) | 29 (25.4%) |
| Mining, Quarrying, & Extraction | 112 (91.1%) | 11 (8.9%) |
| Construction | 336 (67.9%) | 159 (32.1%) |
| Manufacturing | 1,545 (66.5%) | 777 (33.5%) |
| Wholesale Trade | 149 (61.8%) | 92 (38.2%) |
| Retail Trade | 173 (28.8%) | 427 (71.2%) |
| Transportation & Warehousing | 433 (76.8%) | 131 (23.2%) |
| Utilities | 106 (82.2%) | 23 (17.8%) |
| Information | 34 (73.9%) | 12 (26.1%) |
| Finance & Insurance | 34 (34.3%) | 65 (65.7%) |
| Real Estate, Rental & Leasing | 11 (30.6%) | 25 (69.4%) |
| Professional & Scientific | 167 (54.4%) | 140 (45.6%) |
| Enterprise Management | 0 (0.0%) | 15 (100.0%) |
| Administrative & Support | 135 (74.2%) | 47 (25.8%) |
| Educational Services | 81 (11.1%) | 646 (88.9%) |
| Health Care & Social Assistance | 129 (11.9%) | 959 (88.1%) |
| Arts, Entertainment & Recreation | 9 (47.4%) | 10 (52.6%) |
| Accommodation & Food Services | 283 (68.5%) | 130 (31.5%) |
| Public Administration | 405 (62.9%) | 239 (37.1%) |
| Total | 4,503 (53.0%) | 3,994 (47.0%) |
Education in Ouachita County
School Enrollment in Ouachita County
The most common levels of schooling among the 4,835 students in Ouachita County are middle school (1,368 | 28.3%), high school (1,274 | 26.4%), and elementary school (1,146 | 23.7%).
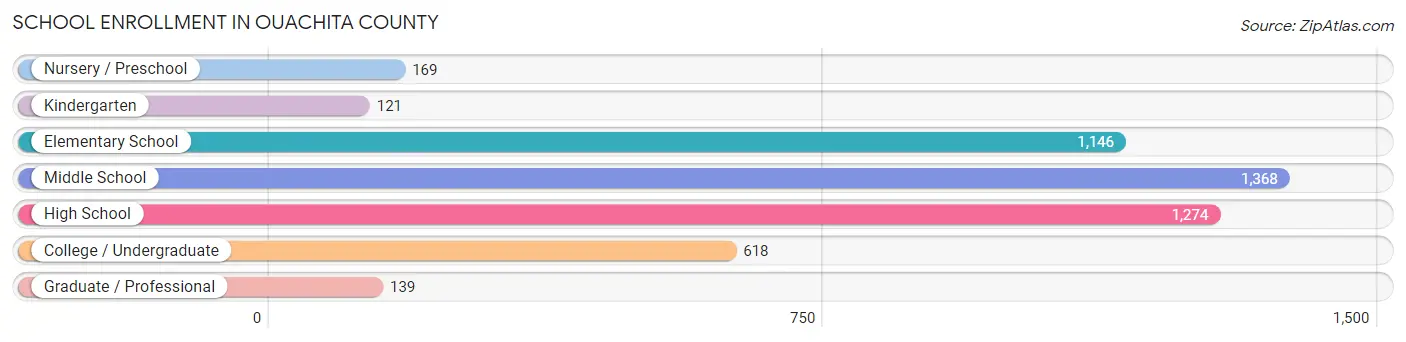
| School Level | # Students | % Students |
| Nursery / Preschool | 169 | 3.5% |
| Kindergarten | 121 | 2.5% |
| Elementary School | 1,146 | 23.7% |
| Middle School | 1,368 | 28.3% |
| High School | 1,274 | 26.4% |
| College / Undergraduate | 618 | 12.8% |
| Graduate / Professional | 139 | 2.9% |
| Total | 4,835 | 100.0% |
School Enrollment by Age by Funding Source in Ouachita County
Out of a total of 4,835 students who are enrolled in schools in Ouachita County, 363 (7.5%) attend a private institution, while the remaining 4,472 (92.5%) are enrolled in public schools. The age group of 35 years and over has the highest likelihood of being enrolled in private schools, with 83 (31.2% in the age bracket) enrolled. Conversely, the age group of 10 to 14 year olds has the lowest likelihood of being enrolled in a private school, with 1,645 (98.1% in the age bracket) attending a public institution.
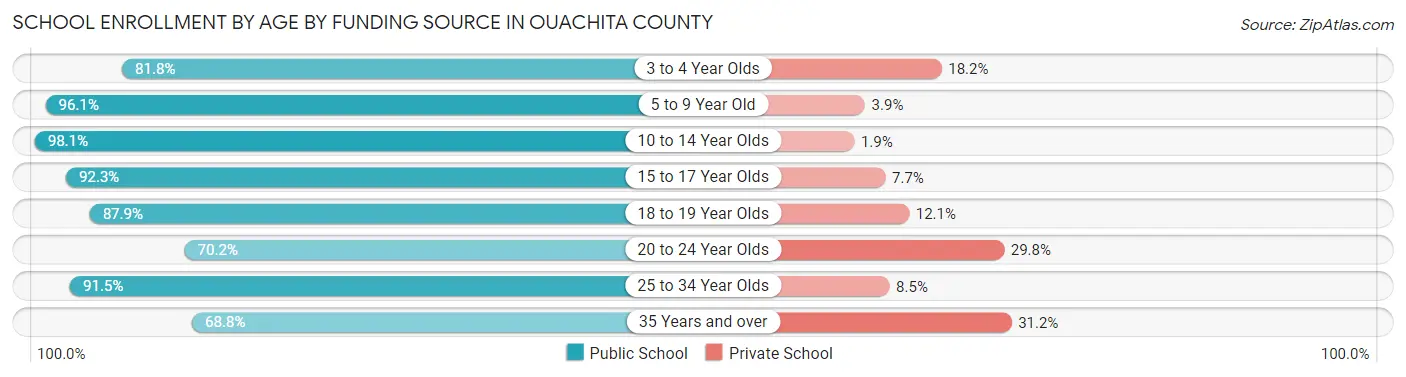
| Age Bracket | Public School | Private School |
| 3 to 4 Year Olds | 99 (81.8%) | 22 (18.2%) |
| 5 to 9 Year Old | 1,155 (96.1%) | 47 (3.9%) |
| 10 to 14 Year Olds | 1,645 (98.1%) | 32 (1.9%) |
| 15 to 17 Year Olds | 802 (92.3%) | 67 (7.7%) |
| 18 to 19 Year Olds | 413 (87.9%) | 57 (12.1%) |
| 20 to 24 Year Olds | 120 (70.2%) | 51 (29.8%) |
| 25 to 34 Year Olds | 54 (91.5%) | 5 (8.5%) |
| 35 Years and over | 183 (68.8%) | 83 (31.2%) |
| Total | 4,472 (92.5%) | 363 (7.5%) |
Educational Attainment by Field of Study in Ouachita County
Business (649 | 26.4%), education (585 | 23.8%), science & technology (304 | 12.4%), engineering (244 | 9.9%), and bio, nature & agricultural (169 | 6.9%) are the most common fields of study among 2,458 individuals in Ouachita County who have obtained a bachelor's degree or higher.
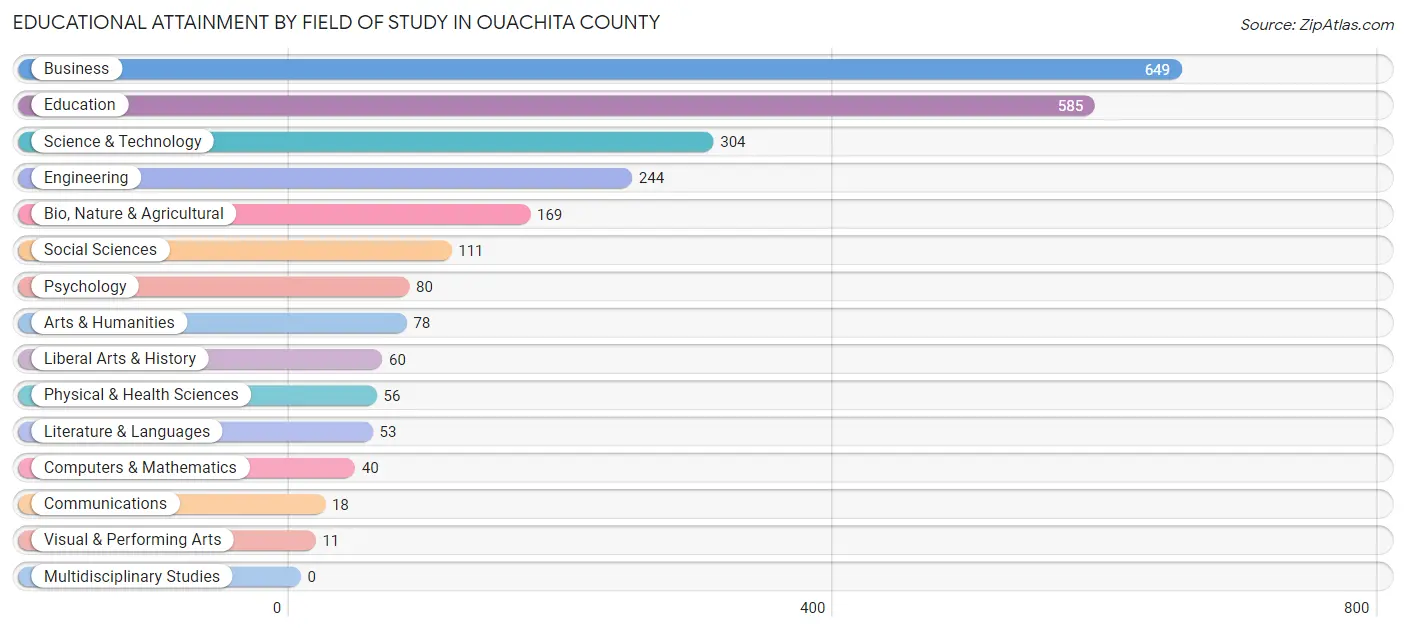
| Field of Study | # Graduates | % Graduates |
| Computers & Mathematics | 40 | 1.6% |
| Bio, Nature & Agricultural | 169 | 6.9% |
| Physical & Health Sciences | 56 | 2.3% |
| Psychology | 80 | 3.3% |
| Social Sciences | 111 | 4.5% |
| Engineering | 244 | 9.9% |
| Multidisciplinary Studies | 0 | 0.0% |
| Science & Technology | 304 | 12.4% |
| Business | 649 | 26.4% |
| Education | 585 | 23.8% |
| Literature & Languages | 53 | 2.2% |
| Liberal Arts & History | 60 | 2.4% |
| Visual & Performing Arts | 11 | 0.4% |
| Communications | 18 | 0.7% |
| Arts & Humanities | 78 | 3.2% |
| Total | 2,458 | 100.0% |
Transportation & Commute in Ouachita County
Vehicle Availability by Sex in Ouachita County
The most prevalent vehicle ownership categories in Ouachita County are males with 2 vehicles (1,744, accounting for 39.1%) and females with 2 vehicles (1,234, making up 45.0%).
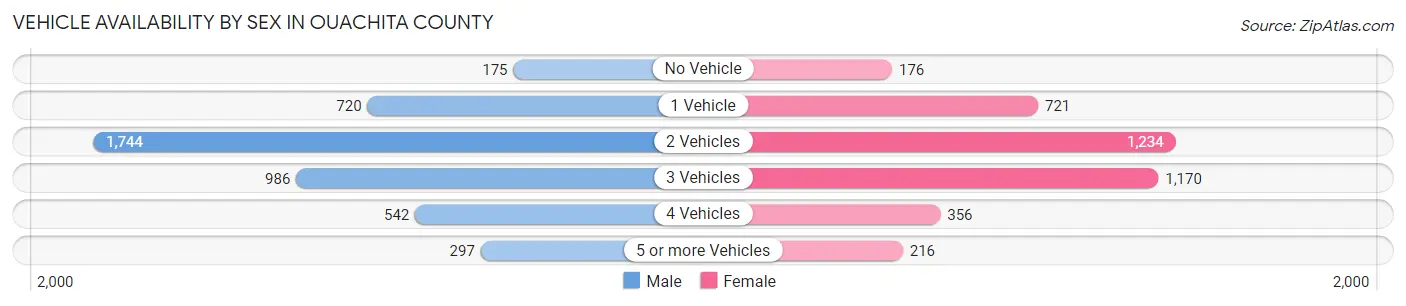
| Vehicles Available | Male | Female |
| No Vehicle | 175 (3.9%) | 176 (4.5%) |
| 1 Vehicle | 720 (16.1%) | 721 (18.6%) |
| 2 Vehicles | 1,744 (39.1%) | 1,234 (31.9%) |
| 3 Vehicles | 986 (22.1%) | 1,170 (30.2%) |
| 4 Vehicles | 542 (12.1%) | 356 (9.2%) |
| 5 or more Vehicles | 297 (6.7%) | 216 (5.6%) |
| Total | 4,464 (100.0%) | 3,873 (100.0%) |
Commute Time in Ouachita County
The most frequently occuring commute durations in Ouachita County are 10 to 14 minutes (1,739 commuters, 21.3%), 15 to 19 minutes (1,253 commuters, 15.3%), and 20 to 24 minutes (1,165 commuters, 14.2%).
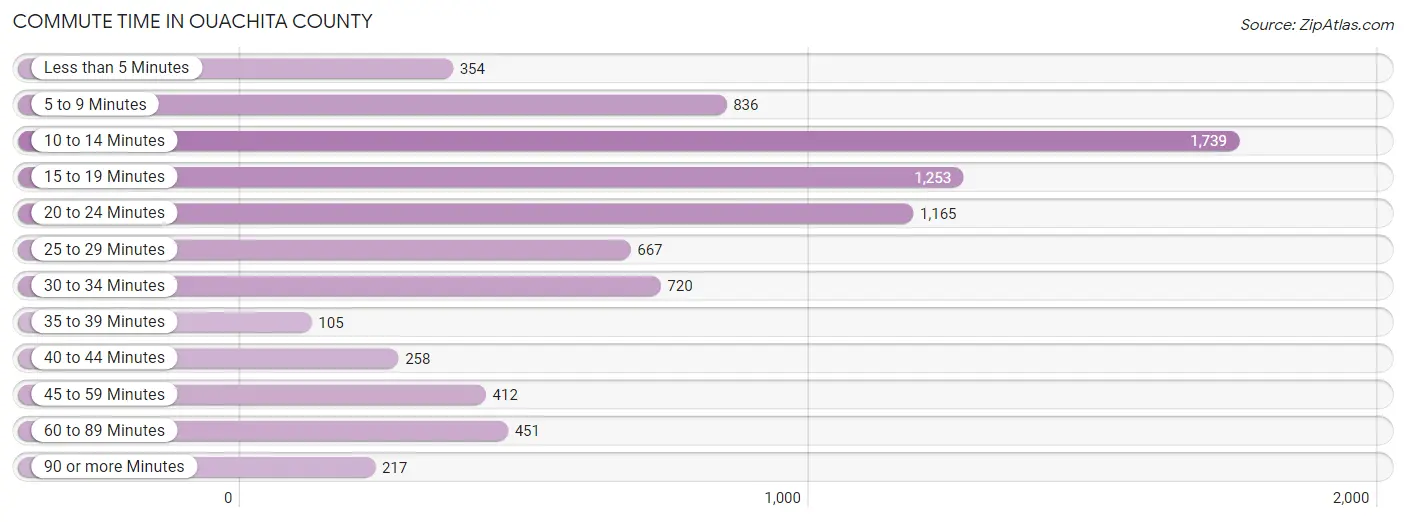
| Commute Time | # Commuters | % Commuters |
| Less than 5 Minutes | 354 | 4.3% |
| 5 to 9 Minutes | 836 | 10.2% |
| 10 to 14 Minutes | 1,739 | 21.3% |
| 15 to 19 Minutes | 1,253 | 15.3% |
| 20 to 24 Minutes | 1,165 | 14.2% |
| 25 to 29 Minutes | 667 | 8.2% |
| 30 to 34 Minutes | 720 | 8.8% |
| 35 to 39 Minutes | 105 | 1.3% |
| 40 to 44 Minutes | 258 | 3.2% |
| 45 to 59 Minutes | 412 | 5.0% |
| 60 to 89 Minutes | 451 | 5.5% |
| 90 or more Minutes | 217 | 2.6% |
Commute Time by Sex in Ouachita County
The most common commute times in Ouachita County are 15 to 19 minutes (934 commuters, 21.2%) for males and 10 to 14 minutes (1,063 commuters, 28.2%) for females.
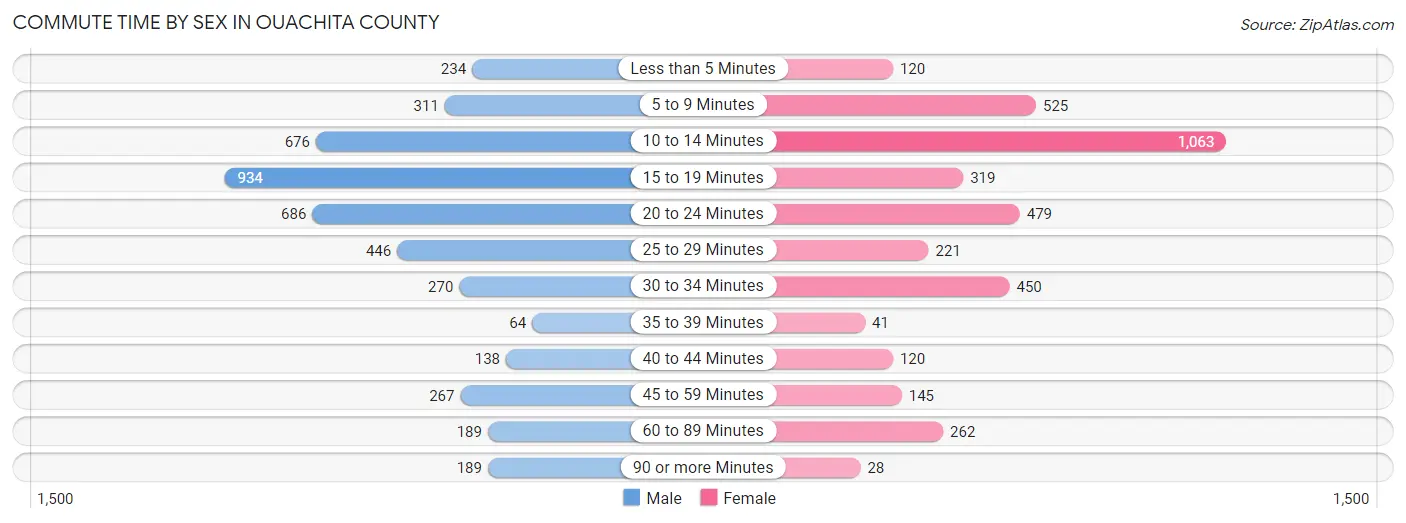
| Commute Time | Male | Female |
| Less than 5 Minutes | 234 (5.3%) | 120 (3.2%) |
| 5 to 9 Minutes | 311 (7.1%) | 525 (13.9%) |
| 10 to 14 Minutes | 676 (15.3%) | 1,063 (28.2%) |
| 15 to 19 Minutes | 934 (21.2%) | 319 (8.5%) |
| 20 to 24 Minutes | 686 (15.6%) | 479 (12.7%) |
| 25 to 29 Minutes | 446 (10.1%) | 221 (5.9%) |
| 30 to 34 Minutes | 270 (6.1%) | 450 (11.9%) |
| 35 to 39 Minutes | 64 (1.5%) | 41 (1.1%) |
| 40 to 44 Minutes | 138 (3.1%) | 120 (3.2%) |
| 45 to 59 Minutes | 267 (6.1%) | 145 (3.8%) |
| 60 to 89 Minutes | 189 (4.3%) | 262 (6.9%) |
| 90 or more Minutes | 189 (4.3%) | 28 (0.7%) |
Time of Departure to Work by Sex in Ouachita County
The most frequent times of departure to work in Ouachita County are 5:00 AM to 5:29 AM (734, 16.7%) for males and 7:30 AM to 7:59 AM (715, 19.0%) for females.
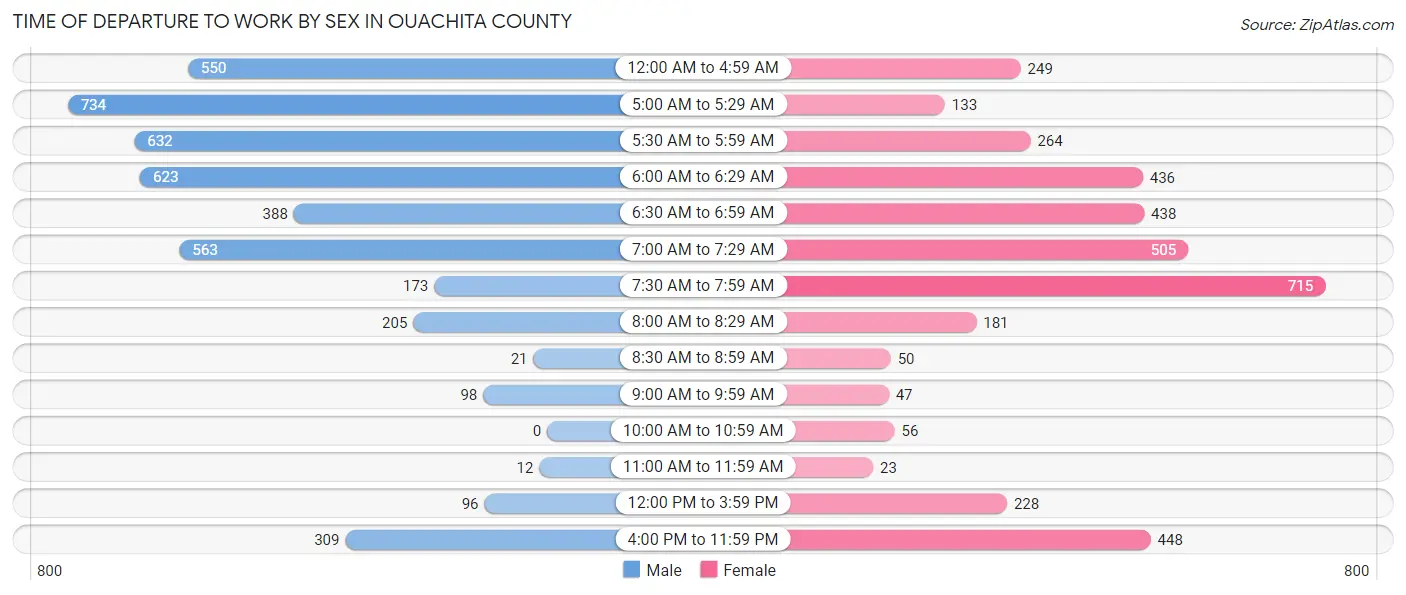
| Time of Departure | Male | Female |
| 12:00 AM to 4:59 AM | 550 (12.5%) | 249 (6.6%) |
| 5:00 AM to 5:29 AM | 734 (16.7%) | 133 (3.5%) |
| 5:30 AM to 5:59 AM | 632 (14.3%) | 264 (7.0%) |
| 6:00 AM to 6:29 AM | 623 (14.1%) | 436 (11.6%) |
| 6:30 AM to 6:59 AM | 388 (8.8%) | 438 (11.6%) |
| 7:00 AM to 7:29 AM | 563 (12.8%) | 505 (13.4%) |
| 7:30 AM to 7:59 AM | 173 (3.9%) | 715 (19.0%) |
| 8:00 AM to 8:29 AM | 205 (4.6%) | 181 (4.8%) |
| 8:30 AM to 8:59 AM | 21 (0.5%) | 50 (1.3%) |
| 9:00 AM to 9:59 AM | 98 (2.2%) | 47 (1.3%) |
| 10:00 AM to 10:59 AM | 0 (0.0%) | 56 (1.5%) |
| 11:00 AM to 11:59 AM | 12 (0.3%) | 23 (0.6%) |
| 12:00 PM to 3:59 PM | 96 (2.2%) | 228 (6.0%) |
| 4:00 PM to 11:59 PM | 309 (7.0%) | 448 (11.9%) |
| Total | 4,404 (100.0%) | 3,773 (100.0%) |
Housing Occupancy in Ouachita County
Occupancy by Ownership in Ouachita County
Of the total 8,459 dwellings in Ouachita County, owner-occupied units account for 6,239 (73.8%), while renter-occupied units make up 2,220 (26.2%).
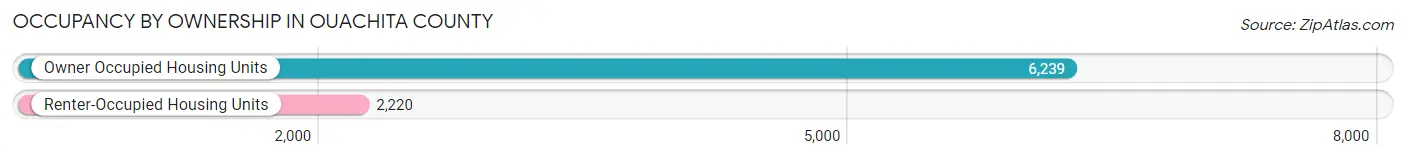
| Occupancy | # Housing Units | % Housing Units |
| Owner Occupied Housing Units | 6,239 | 73.8% |
| Renter-Occupied Housing Units | 2,220 | 26.2% |
| Total Occupied Housing Units | 8,459 | 100.0% |
Occupancy by Household Size in Ouachita County
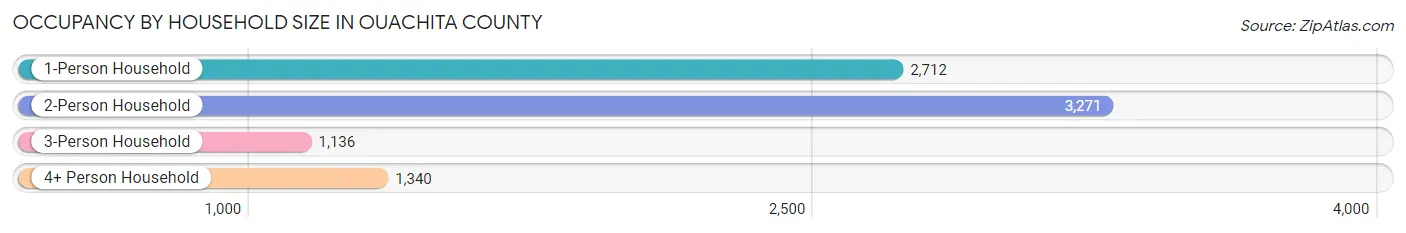
| Household Size | # Housing Units | % Housing Units |
| 1-Person Household | 2,712 | 32.1% |
| 2-Person Household | 3,271 | 38.7% |
| 3-Person Household | 1,136 | 13.4% |
| 4+ Person Household | 1,340 | 15.8% |
| Total Housing Units | 8,459 | 100.0% |
Occupancy by Ownership by Household Size in Ouachita County
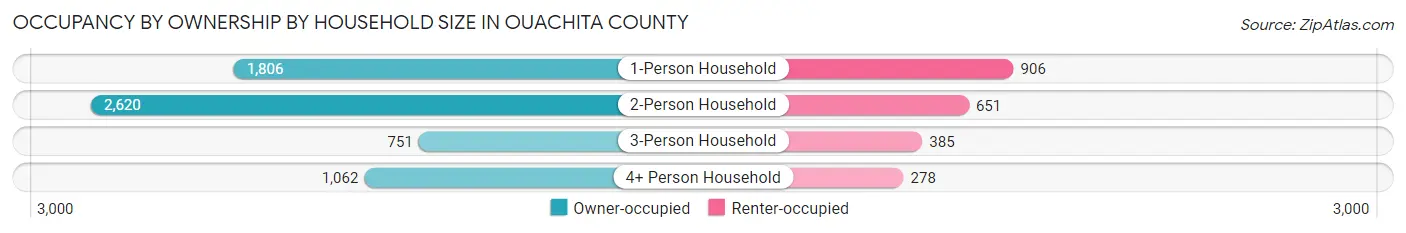
| Household Size | Owner-occupied | Renter-occupied |
| 1-Person Household | 1,806 (66.6%) | 906 (33.4%) |
| 2-Person Household | 2,620 (80.1%) | 651 (19.9%) |
| 3-Person Household | 751 (66.1%) | 385 (33.9%) |
| 4+ Person Household | 1,062 (79.2%) | 278 (20.7%) |
| Total Housing Units | 6,239 (73.8%) | 2,220 (26.2%) |
Occupancy by Educational Attainment in Ouachita County
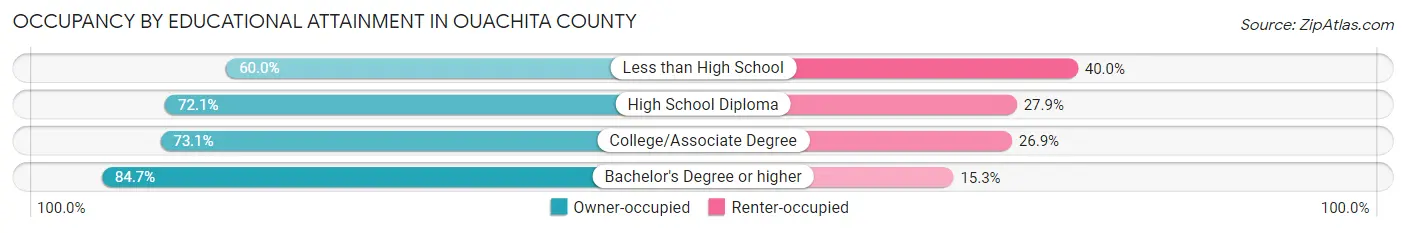
| Household Size | Owner-occupied | Renter-occupied |
| Less than High School | 497 (60.0%) | 331 (40.0%) |
| High School Diploma | 2,184 (72.1%) | 844 (27.9%) |
| College/Associate Degree | 2,143 (73.1%) | 789 (26.9%) |
| Bachelor's Degree or higher | 1,415 (84.7%) | 256 (15.3%) |
Occupancy by Age of Householder in Ouachita County
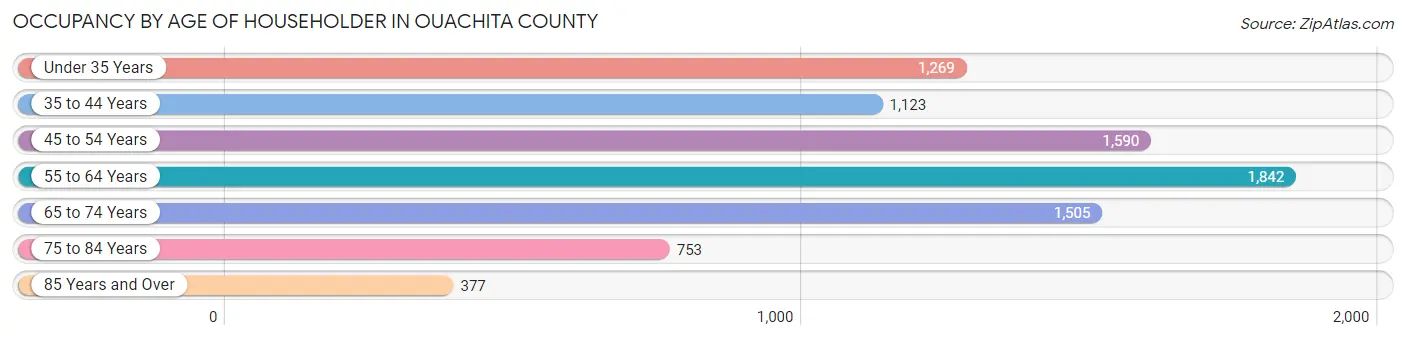
| Age Bracket | # Households | % Households |
| Under 35 Years | 1,269 | 15.0% |
| 35 to 44 Years | 1,123 | 13.3% |
| 45 to 54 Years | 1,590 | 18.8% |
| 55 to 64 Years | 1,842 | 21.8% |
| 65 to 74 Years | 1,505 | 17.8% |
| 75 to 84 Years | 753 | 8.9% |
| 85 Years and Over | 377 | 4.5% |
| Total | 8,459 | 100.0% |
Housing Finances in Ouachita County
Median Income by Occupancy in Ouachita County
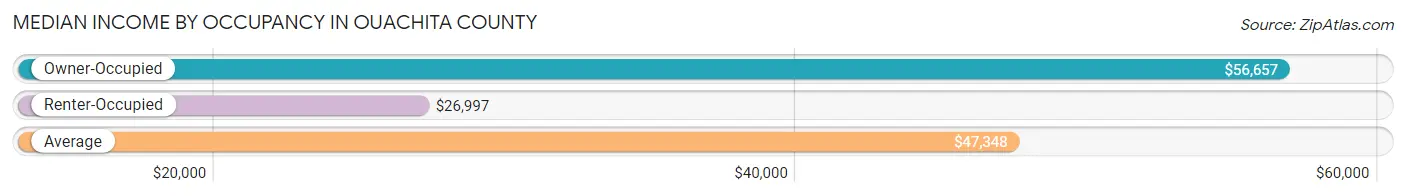
| Occupancy Type | # Households | Median Income |
| Owner-Occupied | 6,239 (73.8%) | $56,657 |
| Renter-Occupied | 2,220 (26.2%) | $26,997 |
| Average | 8,459 (100.0%) | $47,348 |
Occupancy by Householder Income Bracket in Ouachita County
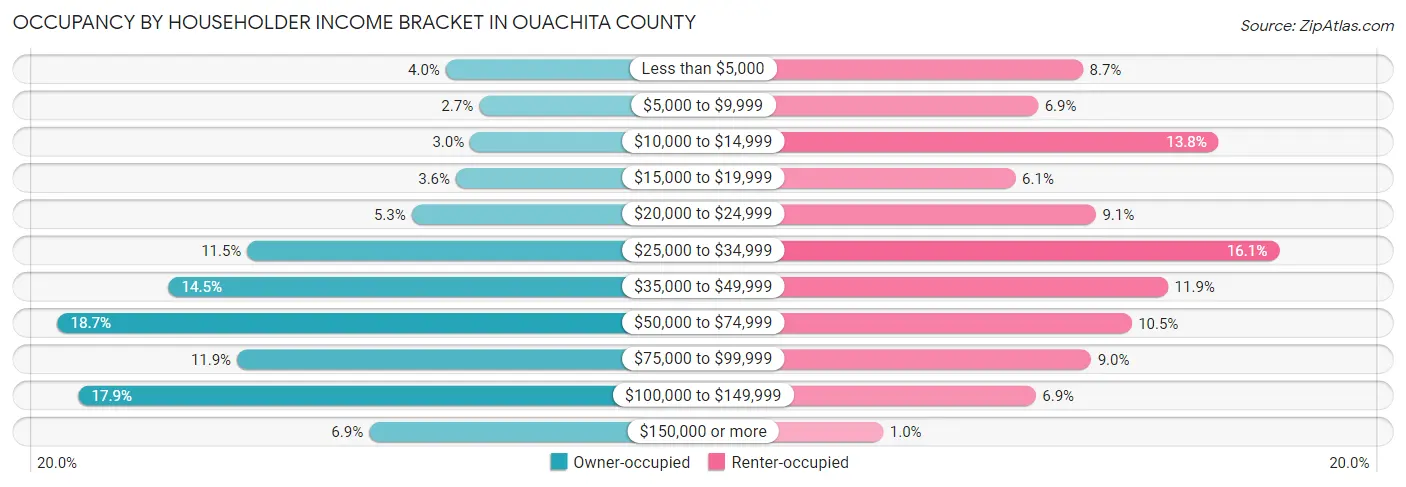
| Income Bracket | Owner-occupied | Renter-occupied |
| Less than $5,000 | 247 (4.0%) | 192 (8.6%) |
| $5,000 to $9,999 | 168 (2.7%) | 154 (6.9%) |
| $10,000 to $14,999 | 189 (3.0%) | 307 (13.8%) |
| $15,000 to $19,999 | 223 (3.6%) | 135 (6.1%) |
| $20,000 to $24,999 | 328 (5.3%) | 203 (9.1%) |
| $25,000 to $34,999 | 719 (11.5%) | 358 (16.1%) |
| $35,000 to $49,999 | 905 (14.5%) | 264 (11.9%) |
| $50,000 to $74,999 | 1,169 (18.7%) | 233 (10.5%) |
| $75,000 to $99,999 | 743 (11.9%) | 199 (9.0%) |
| $100,000 to $149,999 | 1,119 (17.9%) | 152 (6.9%) |
| $150,000 or more | 429 (6.9%) | 23 (1.0%) |
| Total | 6,239 (100.0%) | 2,220 (100.0%) |
Monthly Housing Cost Tiers in Ouachita County
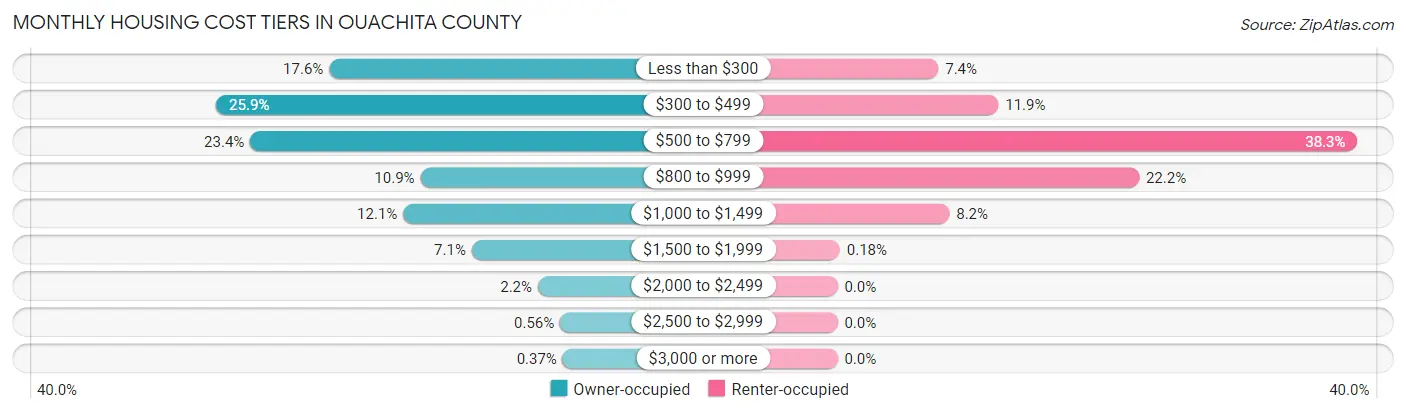
| Monthly Cost | Owner-occupied | Renter-occupied |
| Less than $300 | 1,096 (17.6%) | 165 (7.4%) |
| $300 to $499 | 1,615 (25.9%) | 263 (11.8%) |
| $500 to $799 | 1,459 (23.4%) | 850 (38.3%) |
| $800 to $999 | 677 (10.8%) | 493 (22.2%) |
| $1,000 to $1,499 | 756 (12.1%) | 183 (8.2%) |
| $1,500 to $1,999 | 441 (7.1%) | 4 (0.2%) |
| $2,000 to $2,499 | 137 (2.2%) | 0 (0.0%) |
| $2,500 to $2,999 | 35 (0.6%) | 0 (0.0%) |
| $3,000 or more | 23 (0.4%) | 0 (0.0%) |
| Total | 6,239 (100.0%) | 2,220 (100.0%) |
Physical Housing Characteristics in Ouachita County
Housing Structures in Ouachita County
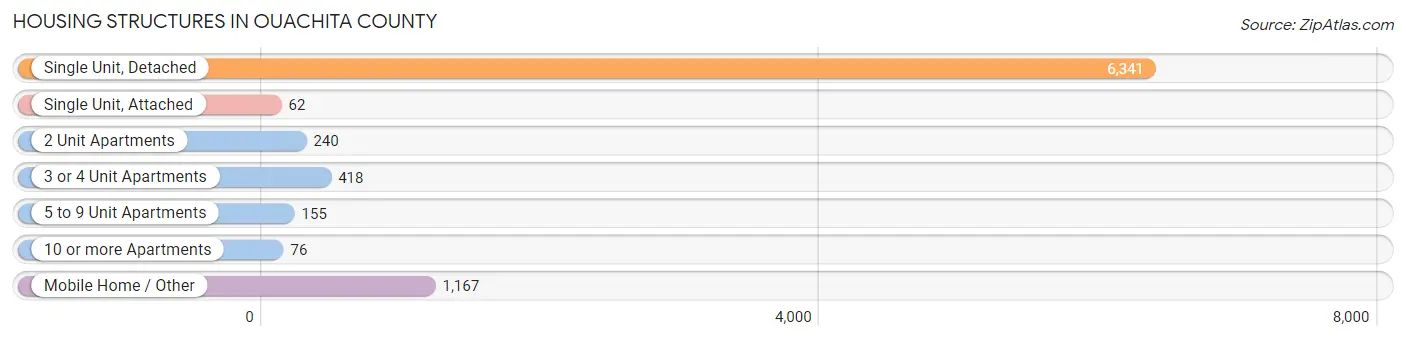
| Structure Type | # Housing Units | % Housing Units |
| Single Unit, Detached | 6,341 | 75.0% |
| Single Unit, Attached | 62 | 0.7% |
| 2 Unit Apartments | 240 | 2.8% |
| 3 or 4 Unit Apartments | 418 | 4.9% |
| 5 to 9 Unit Apartments | 155 | 1.8% |
| 10 or more Apartments | 76 | 0.9% |
| Mobile Home / Other | 1,167 | 13.8% |
| Total | 8,459 | 100.0% |
Housing Structures by Occupancy in Ouachita County
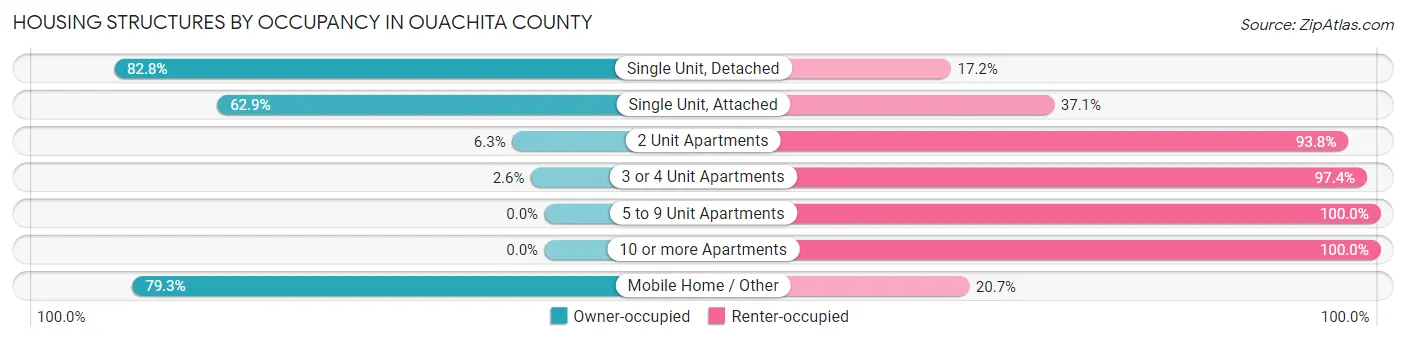
| Structure Type | Owner-occupied | Renter-occupied |
| Single Unit, Detached | 5,249 (82.8%) | 1,092 (17.2%) |
| Single Unit, Attached | 39 (62.9%) | 23 (37.1%) |
| 2 Unit Apartments | 15 (6.2%) | 225 (93.8%) |
| 3 or 4 Unit Apartments | 11 (2.6%) | 407 (97.4%) |
| 5 to 9 Unit Apartments | 0 (0.0%) | 155 (100.0%) |
| 10 or more Apartments | 0 (0.0%) | 76 (100.0%) |
| Mobile Home / Other | 925 (79.3%) | 242 (20.7%) |
| Total | 6,239 (73.8%) | 2,220 (26.2%) |
Housing Structures by Number of Rooms in Ouachita County
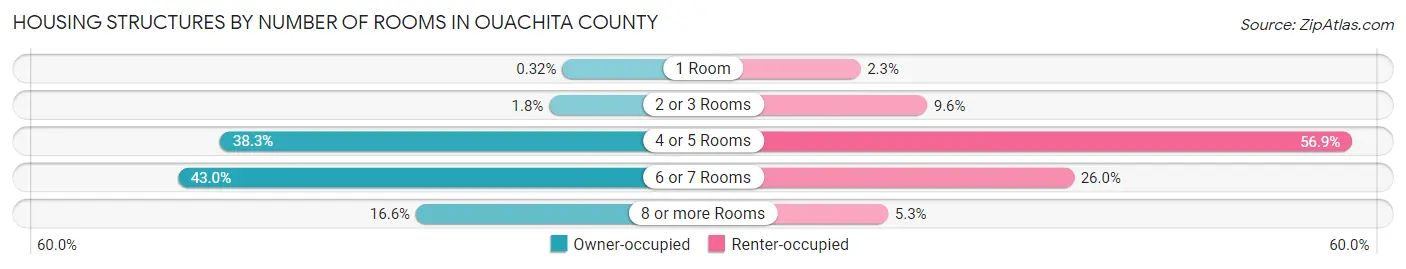
| Number of Rooms | Owner-occupied | Renter-occupied |
| 1 Room | 20 (0.3%) | 50 (2.2%) |
| 2 or 3 Rooms | 111 (1.8%) | 214 (9.6%) |
| 4 or 5 Rooms | 2,391 (38.3%) | 1,262 (56.9%) |
| 6 or 7 Rooms | 2,683 (43.0%) | 576 (26.0%) |
| 8 or more Rooms | 1,034 (16.6%) | 118 (5.3%) |
| Total | 6,239 (100.0%) | 2,220 (100.0%) |
Housing Structure by Heating Type in Ouachita County
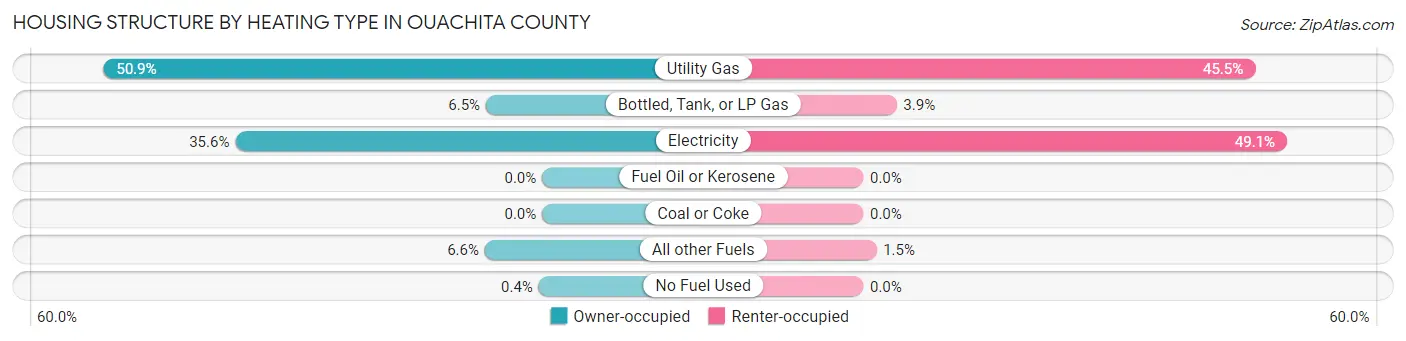
| Heating Type | Owner-occupied | Renter-occupied |
| Utility Gas | 3,174 (50.9%) | 1,009 (45.5%) |
| Bottled, Tank, or LP Gas | 406 (6.5%) | 86 (3.9%) |
| Electricity | 2,220 (35.6%) | 1,091 (49.1%) |
| Fuel Oil or Kerosene | 0 (0.0%) | 0 (0.0%) |
| Coal or Coke | 0 (0.0%) | 0 (0.0%) |
| All other Fuels | 414 (6.6%) | 34 (1.5%) |
| No Fuel Used | 25 (0.4%) | 0 (0.0%) |
| Total | 6,239 (100.0%) | 2,220 (100.0%) |
Household Vehicle Usage in Ouachita County
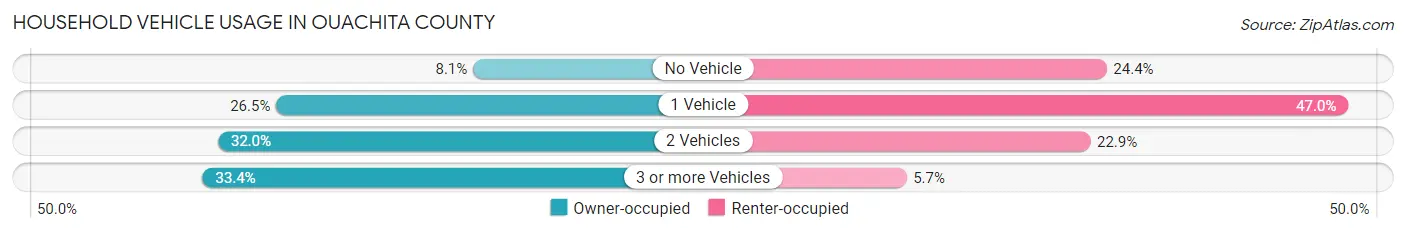
| Vehicles per Household | Owner-occupied | Renter-occupied |
| No Vehicle | 507 (8.1%) | 542 (24.4%) |
| 1 Vehicle | 1,654 (26.5%) | 1,043 (47.0%) |
| 2 Vehicles | 1,994 (32.0%) | 508 (22.9%) |
| 3 or more Vehicles | 2,084 (33.4%) | 127 (5.7%) |
| Total | 6,239 (100.0%) | 2,220 (100.0%) |
Real Estate & Mortgages in Ouachita County
Real Estate and Mortgage Overview in Ouachita County
| Characteristic | Without Mortgage | With Mortgage |
| Housing Units | 3,462 | 2,777 |
| Median Property Value | $88,000 | $105,100 |
| Median Household Income | $43,949 | $258 |
| Monthly Housing Costs | $373 | $23 |
| Real Estate Taxes | $427 | $253 |
Property Value by Mortgage Status in Ouachita County
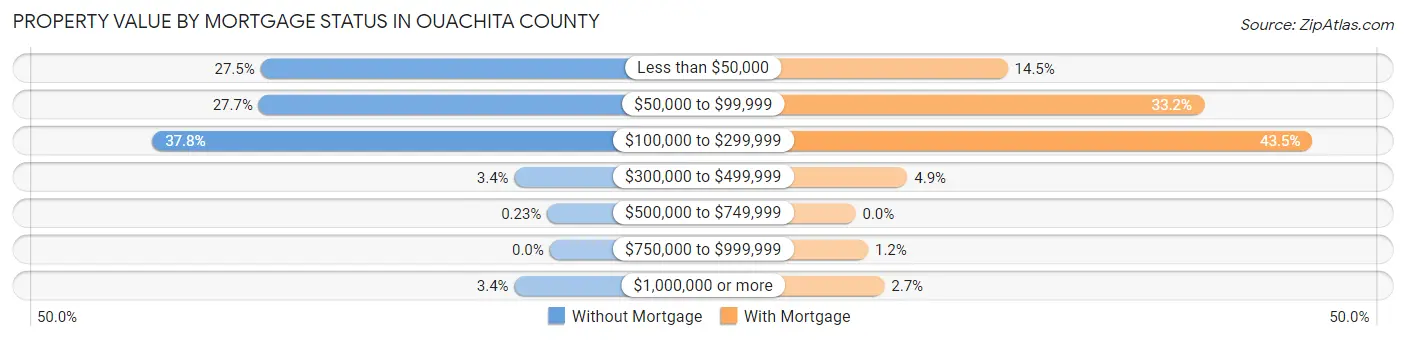
| Property Value | Without Mortgage | With Mortgage |
| Less than $50,000 | 953 (27.5%) | 402 (14.5%) |
| $50,000 to $99,999 | 959 (27.7%) | 921 (33.2%) |
| $100,000 to $299,999 | 1,310 (37.8%) | 1,208 (43.5%) |
| $300,000 to $499,999 | 116 (3.4%) | 137 (4.9%) |
| $500,000 to $749,999 | 8 (0.2%) | 0 (0.0%) |
| $750,000 to $999,999 | 0 (0.0%) | 33 (1.2%) |
| $1,000,000 or more | 116 (3.4%) | 76 (2.7%) |
| Total | 3,462 (100.0%) | 2,777 (100.0%) |
Household Income by Mortgage Status in Ouachita County
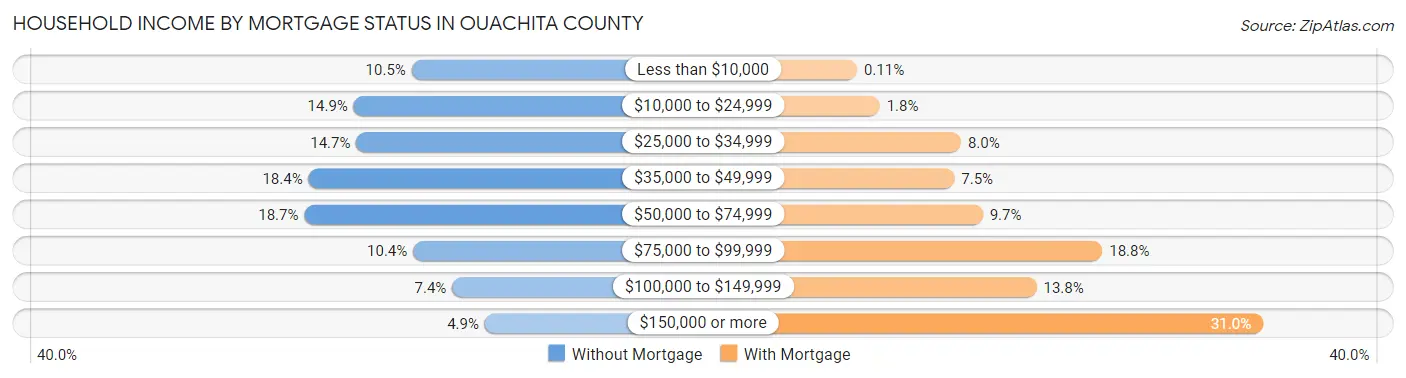
| Household Income | Without Mortgage | With Mortgage |
| Less than $10,000 | 364 (10.5%) | 3 (0.1%) |
| $10,000 to $24,999 | 517 (14.9%) | 51 (1.8%) |
| $25,000 to $34,999 | 510 (14.7%) | 223 (8.0%) |
| $35,000 to $49,999 | 636 (18.4%) | 209 (7.5%) |
| $50,000 to $74,999 | 647 (18.7%) | 269 (9.7%) |
| $75,000 to $99,999 | 360 (10.4%) | 522 (18.8%) |
| $100,000 to $149,999 | 257 (7.4%) | 383 (13.8%) |
| $150,000 or more | 171 (4.9%) | 862 (31.0%) |
| Total | 3,462 (100.0%) | 2,777 (100.0%) |
Property Value to Household Income Ratio in Ouachita County
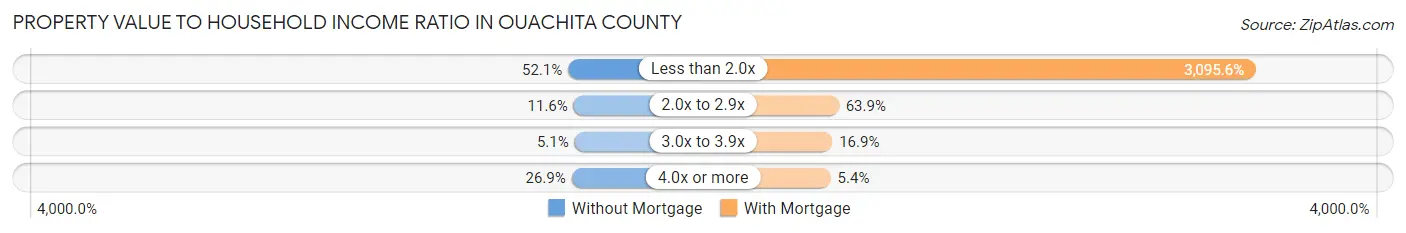
| Value-to-Income Ratio | Without Mortgage | With Mortgage |
| Less than 2.0x | 1,802 (52.0%) | 85,965 (3,095.6%) |
| 2.0x to 2.9x | 400 (11.6%) | 1,773 (63.8%) |
| 3.0x to 3.9x | 178 (5.1%) | 468 (16.9%) |
| 4.0x or more | 932 (26.9%) | 149 (5.4%) |
| Total | 3,462 (100.0%) | 2,777 (100.0%) |
Real Estate Taxes by Mortgage Status in Ouachita County
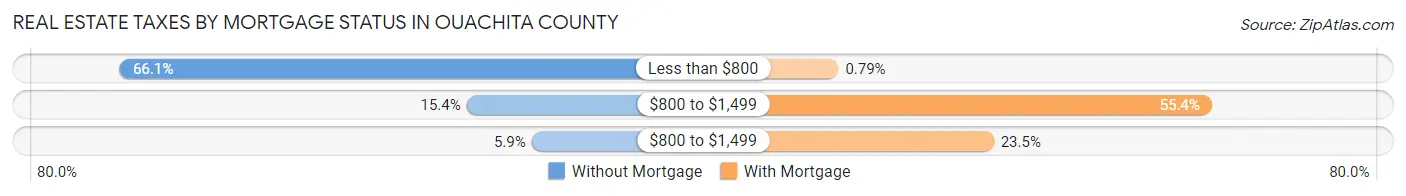
| Property Taxes | Without Mortgage | With Mortgage |
| Less than $800 | 2,287 (66.1%) | 22 (0.8%) |
| $800 to $1,499 | 534 (15.4%) | 1,537 (55.3%) |
| $800 to $1,499 | 205 (5.9%) | 652 (23.5%) |
| Total | 3,462 (100.0%) | 2,777 (100.0%) |
Health & Disability in Ouachita County
Health Insurance Coverage by Age in Ouachita County
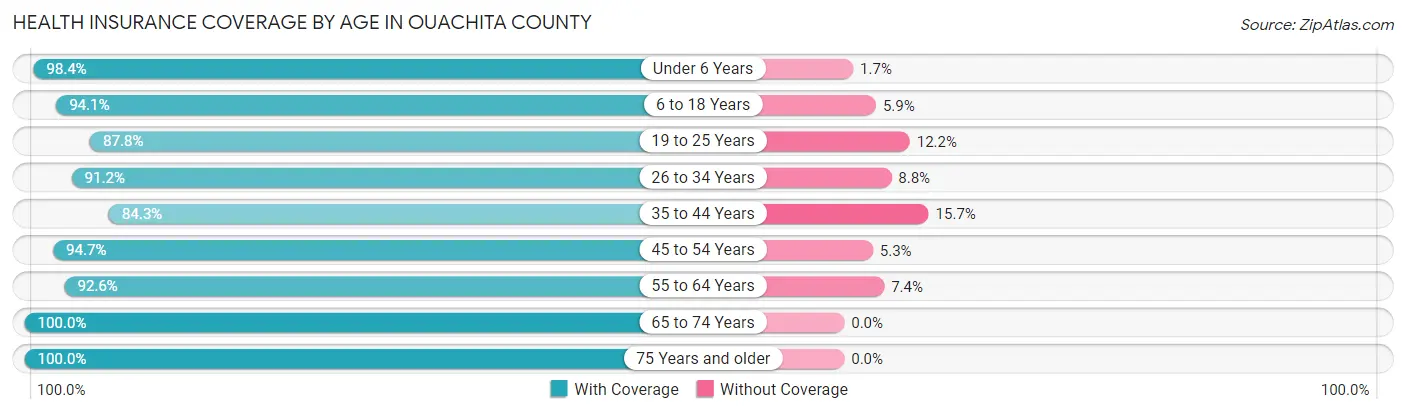
| Age Bracket | With Coverage | Without Coverage |
| Under 6 Years | 1,373 (98.4%) | 23 (1.7%) |
| 6 to 18 Years | 3,802 (94.1%) | 239 (5.9%) |
| 19 to 25 Years | 1,581 (87.8%) | 220 (12.2%) |
| 26 to 34 Years | 1,777 (91.2%) | 171 (8.8%) |
| 35 to 44 Years | 2,143 (84.3%) | 400 (15.7%) |
| 45 to 54 Years | 2,631 (94.7%) | 148 (5.3%) |
| 55 to 64 Years | 3,086 (92.6%) | 248 (7.4%) |
| 65 to 74 Years | 2,673 (100.0%) | 0 (0.0%) |
| 75 Years and older | 1,736 (100.0%) | 0 (0.0%) |
| Total | 20,802 (93.5%) | 1,449 (6.5%) |
Health Insurance Coverage by Citizenship Status in Ouachita County
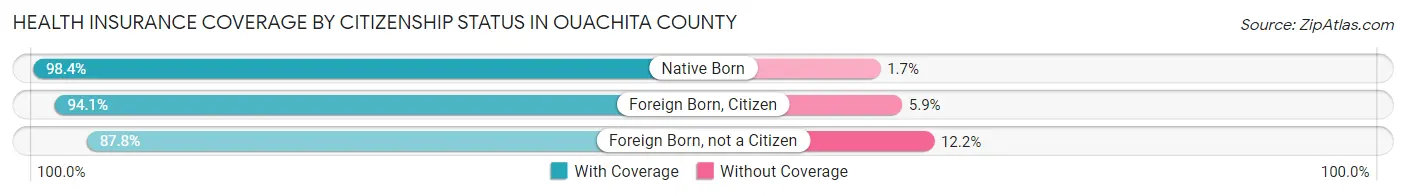
| Citizenship Status | With Coverage | Without Coverage |
| Native Born | 1,373 (98.4%) | 23 (1.7%) |
| Foreign Born, Citizen | 3,802 (94.1%) | 239 (5.9%) |
| Foreign Born, not a Citizen | 1,581 (87.8%) | 220 (12.2%) |
Health Insurance Coverage by Household Income in Ouachita County
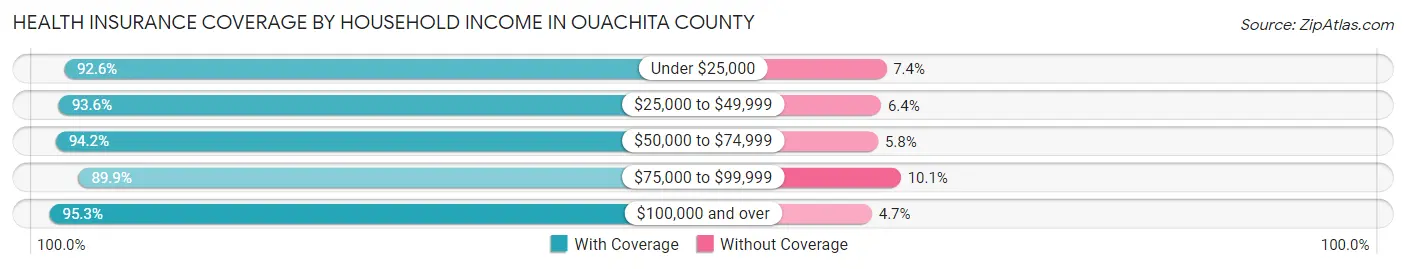
| Household Income | With Coverage | Without Coverage |
| Under $25,000 | 3,691 (92.6%) | 294 (7.4%) |
| $25,000 to $49,999 | 5,366 (93.6%) | 367 (6.4%) |
| $50,000 to $74,999 | 3,771 (94.2%) | 234 (5.8%) |
| $75,000 to $99,999 | 2,527 (89.9%) | 284 (10.1%) |
| $100,000 and over | 5,416 (95.3%) | 266 (4.7%) |
Public vs Private Health Insurance Coverage by Age in Ouachita County
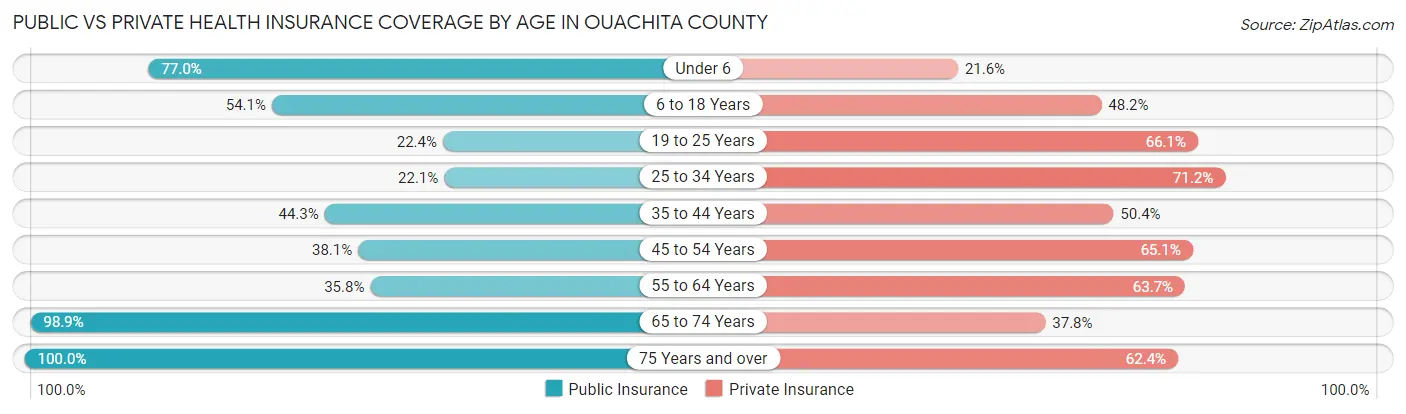
| Age Bracket | Public Insurance | Private Insurance |
| Under 6 | 1,075 (77.0%) | 301 (21.6%) |
| 6 to 18 Years | 2,187 (54.1%) | 1,947 (48.2%) |
| 19 to 25 Years | 403 (22.4%) | 1,190 (66.1%) |
| 25 to 34 Years | 431 (22.1%) | 1,386 (71.2%) |
| 35 to 44 Years | 1,127 (44.3%) | 1,282 (50.4%) |
| 45 to 54 Years | 1,059 (38.1%) | 1,810 (65.1%) |
| 55 to 64 Years | 1,195 (35.8%) | 2,123 (63.7%) |
| 65 to 74 Years | 2,644 (98.9%) | 1,010 (37.8%) |
| 75 Years and over | 1,736 (100.0%) | 1,083 (62.4%) |
| Total | 11,857 (53.3%) | 12,132 (54.5%) |
Disability Status by Sex by Age in Ouachita County
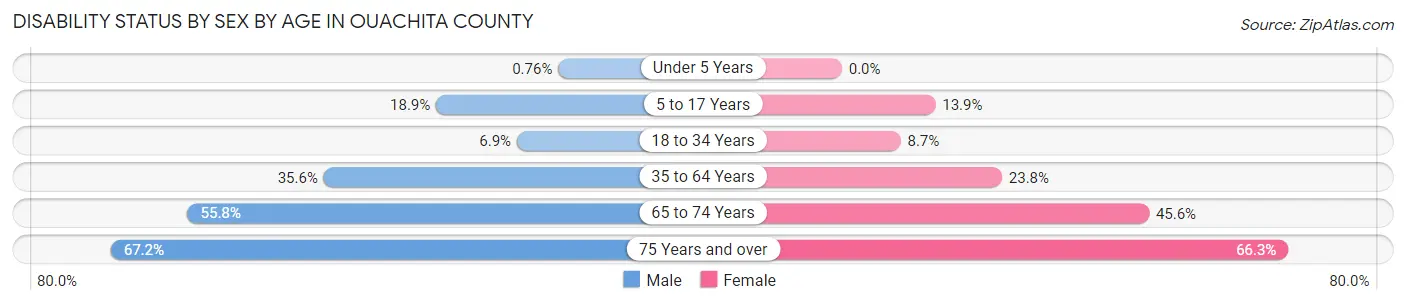
| Age Bracket | Male | Female |
| Under 5 Years | 6 (0.8%) | 0 (0.0%) |
| 5 to 17 Years | 357 (18.9%) | 268 (13.9%) |
| 18 to 34 Years | 150 (6.9%) | 170 (8.7%) |
| 35 to 64 Years | 1,447 (35.6%) | 1,091 (23.8%) |
| 65 to 74 Years | 684 (55.8%) | 660 (45.6%) |
| 75 Years and over | 473 (67.2%) | 684 (66.3%) |
Disability Class by Sex by Age in Ouachita County
Disability Class: Hearing Difficulty
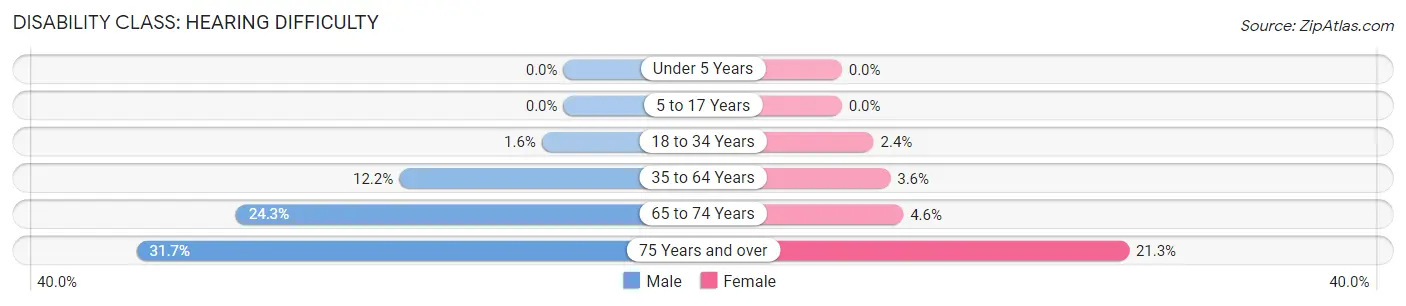
| Age Bracket | Male | Female |
| Under 5 Years | 0 (0.0%) | 0 (0.0%) |
| 5 to 17 Years | 0 (0.0%) | 0 (0.0%) |
| 18 to 34 Years | 35 (1.6%) | 46 (2.4%) |
| 35 to 64 Years | 496 (12.2%) | 165 (3.6%) |
| 65 to 74 Years | 298 (24.3%) | 66 (4.6%) |
| 75 Years and over | 223 (31.7%) | 220 (21.3%) |
Disability Class: Vision Difficulty
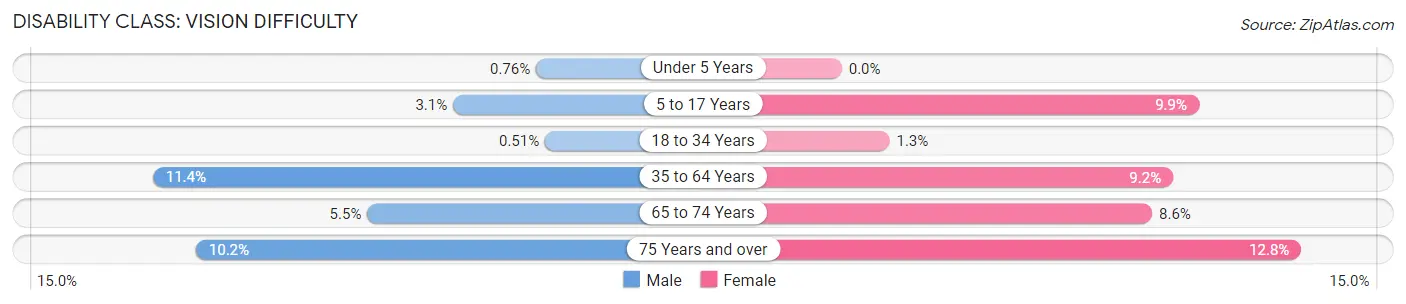
| Age Bracket | Male | Female |
| Under 5 Years | 6 (0.8%) | 0 (0.0%) |
| 5 to 17 Years | 58 (3.1%) | 192 (9.9%) |
| 18 to 34 Years | 11 (0.5%) | 26 (1.3%) |
| 35 to 64 Years | 465 (11.4%) | 423 (9.2%) |
| 65 to 74 Years | 67 (5.5%) | 125 (8.6%) |
| 75 Years and over | 72 (10.2%) | 132 (12.8%) |
Disability Class: Cognitive Difficulty
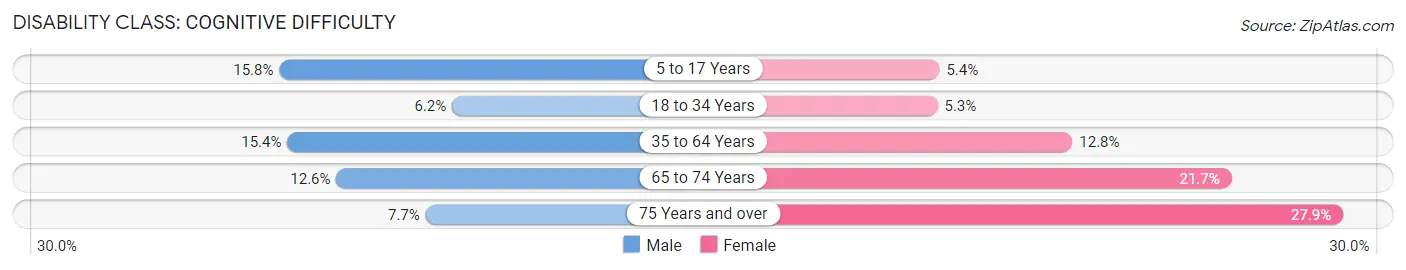
| Age Bracket | Male | Female |
| 5 to 17 Years | 299 (15.8%) | 105 (5.4%) |
| 18 to 34 Years | 135 (6.2%) | 104 (5.3%) |
| 35 to 64 Years | 625 (15.4%) | 589 (12.8%) |
| 65 to 74 Years | 155 (12.6%) | 314 (21.7%) |
| 75 Years and over | 54 (7.7%) | 288 (27.9%) |
Disability Class: Ambulatory Difficulty
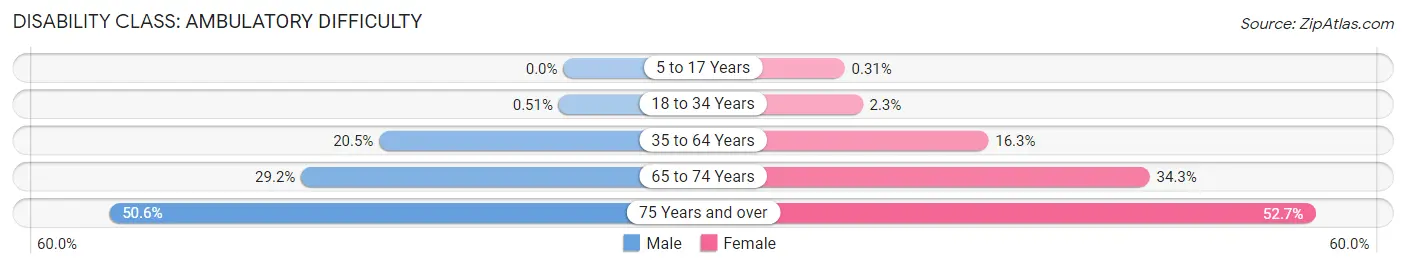
| Age Bracket | Male | Female |
| 5 to 17 Years | 0 (0.0%) | 6 (0.3%) |
| 18 to 34 Years | 11 (0.5%) | 45 (2.3%) |
| 35 to 64 Years | 834 (20.5%) | 749 (16.3%) |
| 65 to 74 Years | 358 (29.2%) | 496 (34.3%) |
| 75 Years and over | 356 (50.6%) | 544 (52.7%) |
Disability Class: Self-Care Difficulty
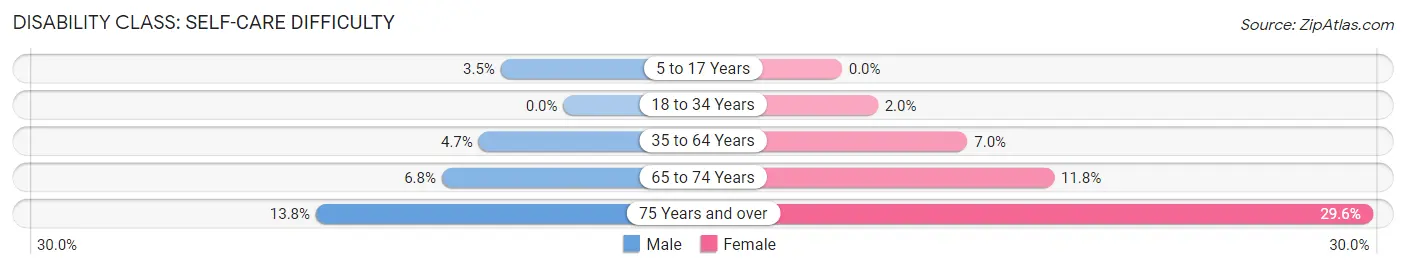
| Age Bracket | Male | Female |
| 5 to 17 Years | 66 (3.5%) | 0 (0.0%) |
| 18 to 34 Years | 0 (0.0%) | 39 (2.0%) |
| 35 to 64 Years | 192 (4.7%) | 321 (7.0%) |
| 65 to 74 Years | 83 (6.8%) | 171 (11.8%) |
| 75 Years and over | 97 (13.8%) | 305 (29.5%) |
Technology Access in Ouachita County
Computing Device Access in Ouachita County
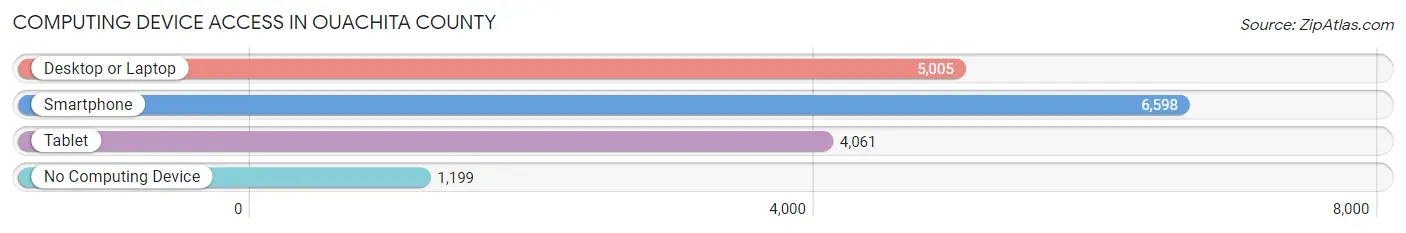
| Device Type | # Households | % Households |
| Desktop or Laptop | 5,005 | 59.2% |
| Smartphone | 6,598 | 78.0% |
| Tablet | 4,061 | 48.0% |
| No Computing Device | 1,199 | 14.2% |
| Total | 8,459 | 100.0% |
Internet Access in Ouachita County
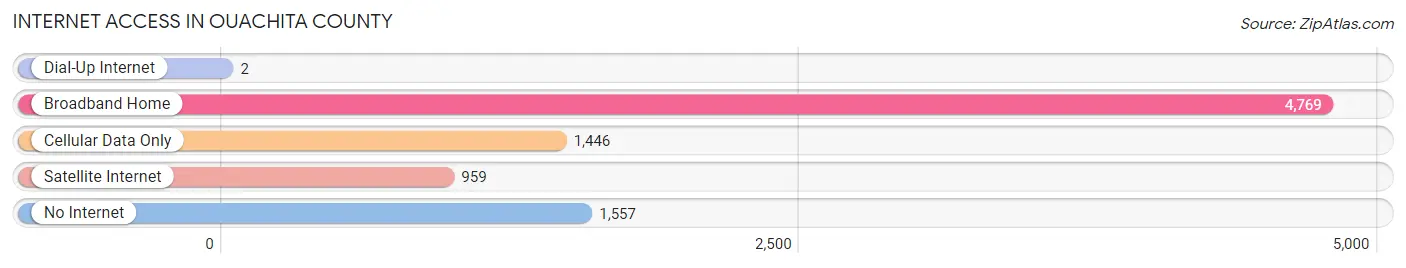
| Internet Type | # Households | % Households |
| Dial-Up Internet | 2 | 0.0% |
| Broadband Home | 4,769 | 56.4% |
| Cellular Data Only | 1,446 | 17.1% |
| Satellite Internet | 959 | 11.3% |
| No Internet | 1,557 | 18.4% |
| Total | 8,459 | 100.0% |
Ouachita County Summary
Ouachita County is located in the south-central region of Arkansas, and is bordered by Hot Spring County to the north, Clark County to the east, Calhoun County to the south, and Dallas County to the west. The county seat is Camden, and the county has a total area of 645 square miles. As of the 2010 census, the population was 26,120.
History
Ouachita County was formed in 1842 from parts of Clark and Hot Spring counties. It was named for the Ouachita River, which flows through the county. The county was originally inhabited by the Quapaw Indians, who were later displaced by settlers from the United States.
The first county seat was at Union, but it was moved to Camden in 1844. The county was a center of Confederate activity during the Civil War, and Camden was the site of several battles. After the war, the county was largely agricultural, with cotton and timber being the main crops.
Geography
Ouachita County is located in the south-central region of Arkansas, and is bordered by Hot Spring County to the north, Clark County to the east, Calhoun County to the south, and Dallas County to the west. The county has a total area of 645 square miles, and is mostly flat, with some rolling hills in the northern part of the county. The Ouachita River flows through the county, and there are several small lakes and streams.
The climate is humid subtropical, with hot, humid summers and mild winters. The average annual temperature is 64°F, and the average annual precipitation is 48 inches.
Economy
The economy of Ouachita County is largely based on agriculture, with cotton, soybeans, and timber being the main crops. The county also has a strong manufacturing sector, with companies such as International Paper, Georgia-Pacific, and Tyson Foods having plants in the area.
The county also has a growing tourism industry, with several state parks and recreational areas located in the area. The county is also home to the Ouachita National Forest, which is a popular destination for camping, fishing, and hiking.
Demographics
As of the 2010 census, the population of Ouachita County was 26,120. The population is mostly white (83.3%), with African Americans (13.2%) and Hispanics (2.7%) making up the remainder of the population. The median household income is $37,845, and the median age is 38.7 years.
The county is served by the Ouachita County School District, which has 11 elementary schools, four middle schools, and two high schools. The county is also home to two colleges, Southern Arkansas University and Ouachita Baptist University.
Common Questions
What is Per Capita Income in Ouachita County?
Per Capita income in Ouachita County is $25,289.
What is the Median Family Income in Ouachita County?
Median Family Income in Ouachita County is $62,302.
What is the Median Household income in Ouachita County?
Median Household Income in Ouachita County is $47,348.
What is Income or Wage Gap in Ouachita County?
Income or Wage Gap in Ouachita County is 24.8%.
Women in Ouachita County earn 75.2 cents for every dollar earned by a man.
What is Family Income Deficit in Ouachita County?
Family Income Deficit in Ouachita County is $12,342.
Families that are below poverty line in Ouachita County earn $12,342 less on average than the poverty threshold level.
What is Inequality or Gini Index in Ouachita County?
Inequality or Gini Index in Ouachita County is 0.44.
What is the Total Population of Ouachita County?
Total Population of Ouachita County is 22,606.
What is the Total Male Population of Ouachita County?
Total Male Population of Ouachita County is 11,039.
What is the Total Female Population of Ouachita County?
Total Female Population of Ouachita County is 11,567.
What is the Ratio of Males per 100 Females in Ouachita County?
There are 95.44 Males per 100 Females in Ouachita County.
What is the Ratio of Females per 100 Males in Ouachita County?
There are 104.78 Females per 100 Males in Ouachita County.
What is the Median Population Age in Ouachita County?
Median Population Age in Ouachita County is 43.9 Years.
What is the Average Family Size in Ouachita County
Average Family Size in Ouachita County is 3.3 People.
What is the Average Household Size in Ouachita County
Average Household Size in Ouachita County is 2.6 People.
How Large is the Labor Force in Ouachita County?
There are 9,100 People in the Labor Forcein in Ouachita County.
What is the Percentage of People in the Labor Force in Ouachita County?
50.2% of People are in the Labor Force in Ouachita County.
What is the Unemployment Rate in Ouachita County?
Unemployment Rate in Ouachita County is 6.5%.