Cabot, AR Map & Demographics
Cabot Map
Cabot Overview
$32,541
PER CAPITA INCOME
$88,163
AVG FAMILY INCOME
$69,094
AVG HOUSEHOLD INCOME
26.4%
WAGE / INCOME GAP [ % ]
73.6¢/ $1
WAGE / INCOME GAP [ $ ]
$10,313
FAMILY INCOME DEFICIT
0.40
INEQUALITY / GINI INDEX
26,543
TOTAL POPULATION
12,984
MALE POPULATION
13,559
FEMALE POPULATION
95.76
MALES / 100 FEMALES
104.43
FEMALES / 100 MALES
35.7
MEDIAN AGE
3.1
AVG FAMILY SIZE
2.6
AVG HOUSEHOLD SIZE
13,199
LABOR FORCE [ PEOPLE ]
64.4%
PERCENT IN LABOR FORCE
3.3%
UNEMPLOYMENT RATE
Cabot Zip Codes
Cabot Area Codes
Income in Cabot
Income Overview in Cabot
Per Capita Income in Cabot is $32,541, while median incomes of families and households are $88,163 and $69,094 respectively.
| Characteristic | Number | Measure |
| Per Capita Income | 26,543 | $32,541 |
| Median Family Income | 7,133 | $88,163 |
| Mean Family Income | 7,133 | $98,185 |
| Median Household Income | 10,064 | $69,094 |
| Mean Household Income | 10,064 | $84,159 |
| Income Deficit | 7,133 | $10,313 |
| Wage / Income Gap (%) | 26,543 | 26.36% |
| Wage / Income Gap ($) | 26,543 | 73.64¢ per $1 |
| Gini / Inequality Index | 26,543 | 0.40 |
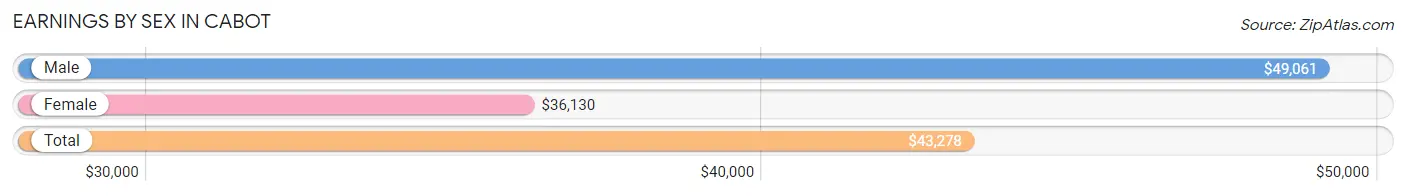
Earnings by Sex in Cabot
Average Earnings in Cabot are $43,278, $49,061 for men and $36,130 for women, a difference of 26.4%.
| Sex | Number | Average Earnings |
| Male | 6,841 (49.2%) | $49,061 |
| Female | 7,062 (50.8%) | $36,130 |
| Total | 13,903 (100.0%) | $43,278 |
Earnings by Sex by Income Bracket in Cabot
The most common earnings brackets in Cabot are $100,000+ for men (1,053 | 15.4%) and $25,000 to $29,999 for women (679 | 9.6%).
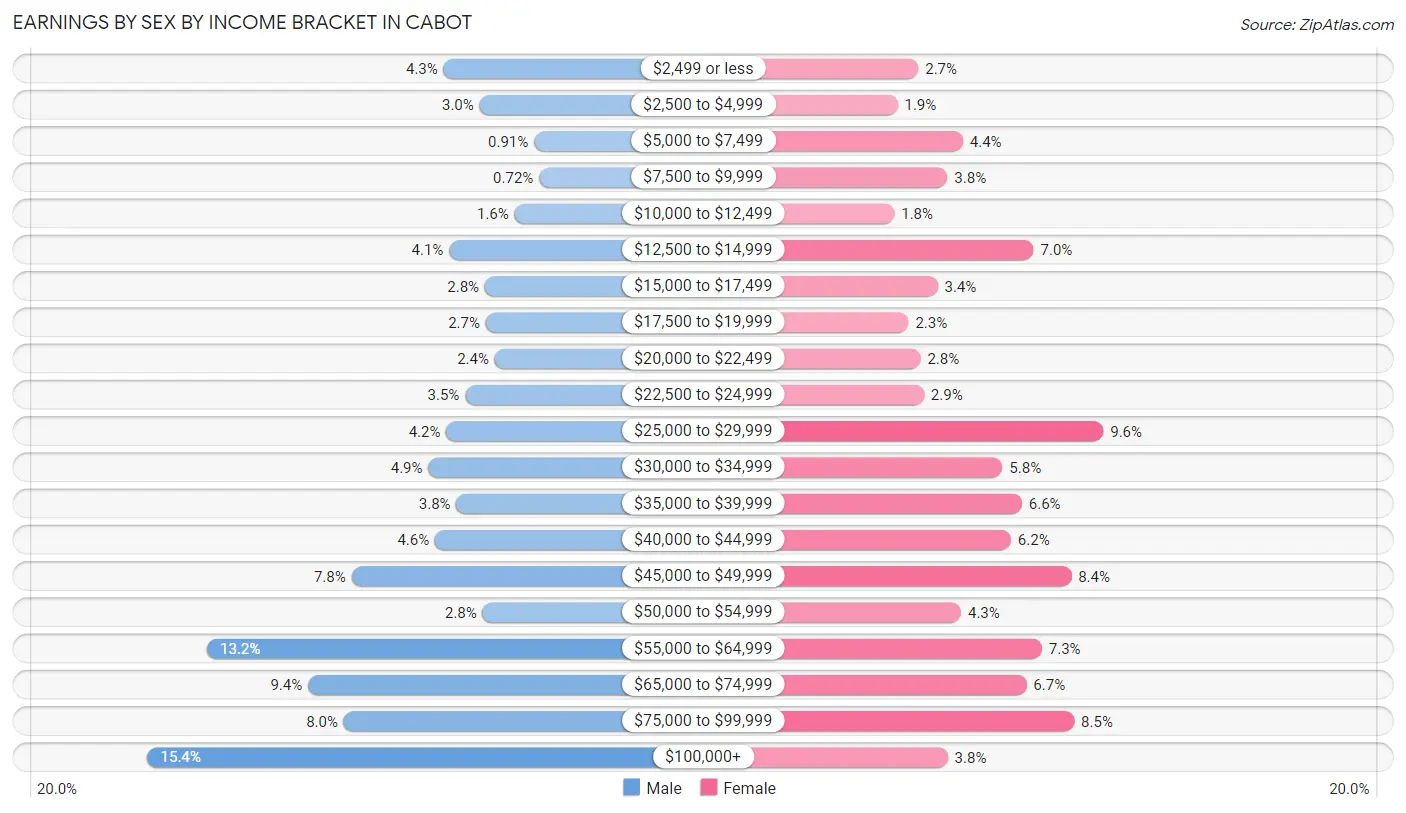
| Income | Male | Female |
| $2,499 or less | 294 (4.3%) | 189 (2.7%) |
| $2,500 to $4,999 | 202 (2.9%) | 134 (1.9%) |
| $5,000 to $7,499 | 62 (0.9%) | 307 (4.3%) |
| $7,500 to $9,999 | 49 (0.7%) | 266 (3.8%) |
| $10,000 to $12,499 | 112 (1.6%) | 126 (1.8%) |
| $12,500 to $14,999 | 280 (4.1%) | 494 (7.0%) |
| $15,000 to $17,499 | 188 (2.8%) | 240 (3.4%) |
| $17,500 to $19,999 | 186 (2.7%) | 163 (2.3%) |
| $20,000 to $22,499 | 163 (2.4%) | 195 (2.8%) |
| $22,500 to $24,999 | 239 (3.5%) | 204 (2.9%) |
| $25,000 to $29,999 | 287 (4.2%) | 679 (9.6%) |
| $30,000 to $34,999 | 333 (4.9%) | 412 (5.8%) |
| $35,000 to $39,999 | 261 (3.8%) | 463 (6.6%) |
| $40,000 to $44,999 | 316 (4.6%) | 434 (6.1%) |
| $45,000 to $49,999 | 530 (7.7%) | 594 (8.4%) |
| $50,000 to $54,999 | 194 (2.8%) | 302 (4.3%) |
| $55,000 to $64,999 | 900 (13.2%) | 516 (7.3%) |
| $65,000 to $74,999 | 642 (9.4%) | 475 (6.7%) |
| $75,000 to $99,999 | 550 (8.0%) | 602 (8.5%) |
| $100,000+ | 1,053 (15.4%) | 267 (3.8%) |
| Total | 6,841 (100.0%) | 7,062 (100.0%) |
Earnings by Sex by Educational Attainment in Cabot
Average earnings in Cabot are $56,281 for men and $41,186 for women, a difference of 26.8%. Men with an educational attainment of graduate degree enjoy the highest average annual earnings of $81,500, while those with less than high school education earn the least with $32,091. Women with an educational attainment of graduate degree earn the most with the average annual earnings of $67,574, while those with less than high school education have the smallest earnings of $29,917.
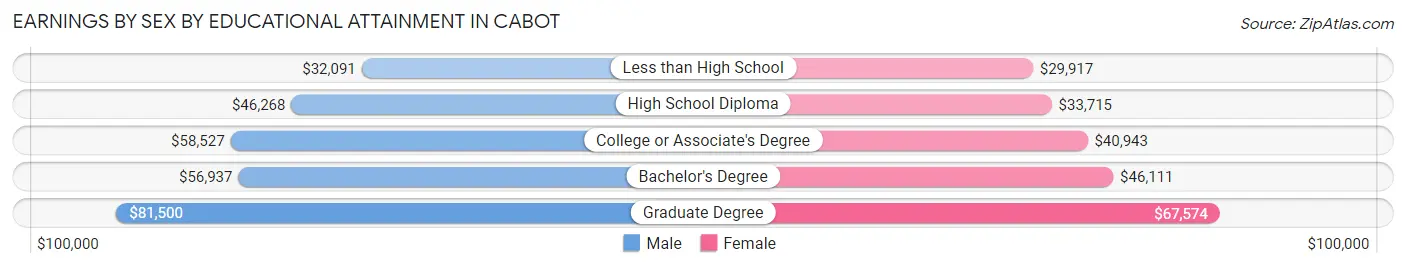
| Educational Attainment | Male Income | Female Income |
| Less than High School | $32,091 | $29,917 |
| High School Diploma | $46,268 | $33,715 |
| College or Associate's Degree | $58,527 | $40,943 |
| Bachelor's Degree | $56,937 | $46,111 |
| Graduate Degree | $81,500 | $67,574 |
| Total | $56,281 | $41,186 |
Family Income in Cabot
Family Income Brackets in Cabot
According to the Cabot family income data, there are 1,869 families falling into the $100,000 to $149,999 income range, which is the most common income bracket and makes up 26.2% of all families. Conversely, the less than $10,000 income bracket is the least frequent group with only 164 families (2.3%) belonging to this category.
| Income Bracket | # Families | % Families |
| Less than $10,000 | 164 | 2.3% |
| $10,000 to $14,999 | 171 | 2.4% |
| $15,000 to $24,999 | 300 | 4.2% |
| $25,000 to $34,999 | 378 | 5.3% |
| $35,000 to $49,999 | 656 | 9.2% |
| $50,000 to $74,999 | 1,412 | 19.8% |
| $75,000 to $99,999 | 949 | 13.3% |
| $100,000 to $149,999 | 1,869 | 26.2% |
| $150,000 to $199,999 | 728 | 10.2% |
| $200,000+ | 506 | 7.1% |
Family Income by Famaliy Size in Cabot
5-person families (494 | 6.9%) account for the highest median family income in Cabot with $127,639 per family, while 2-person families (3,248 | 45.5%) have the highest median income of $40,978 per family member.
| Income Bracket | # Families | Median Income |
| 2-Person Families | 3,248 (45.5%) | $81,957 |
| 3-Person Families | 1,448 (20.3%) | $87,889 |
| 4-Person Families | 1,714 (24.0%) | $88,656 |
| 5-Person Families | 494 (6.9%) | $127,639 |
| 6-Person Families | 155 (2.2%) | $120,509 |
| 7+ Person Families | 74 (1.0%) | $90,078 |
| Total | 7,133 (100.0%) | $88,163 |
Family Income by Number of Earners in Cabot
The median family income in Cabot is $88,163, with families comprising 3+ earners (720) having the highest median family income of $141,136, while families with no earners (728) have the lowest median family income of $59,250, accounting for 10.1% and 10.2% of families, respectively.
| Number of Earners | # Families | Median Income |
| No Earners | 728 (10.2%) | $59,250 |
| 1 Earner | 2,514 (35.2%) | $61,310 |
| 2 Earners | 3,171 (44.5%) | $112,465 |
| 3+ Earners | 720 (10.1%) | $141,136 |
| Total | 7,133 (100.0%) | $88,163 |
Household Income in Cabot
Household Income Brackets in Cabot
With 2,204 households falling in the category, the $100,000 to $149,999 income range is the most frequent in Cabot, accounting for 21.9% of all households. In contrast, only 322 households (3.2%) fall into the less than $10,000 income bracket, making it the least populous group.
| Income Bracket | # Households | % Households |
| Less than $10,000 | 322 | 3.2% |
| $10,000 to $14,999 | 423 | 4.2% |
| $15,000 to $24,999 | 785 | 7.8% |
| $25,000 to $34,999 | 886 | 8.8% |
| $35,000 to $49,999 | 1,167 | 11.6% |
| $50,000 to $74,999 | 1,761 | 17.5% |
| $75,000 to $99,999 | 1,188 | 11.8% |
| $100,000 to $149,999 | 2,204 | 21.9% |
| $150,000 to $199,999 | 825 | 8.2% |
| $200,000+ | 513 | 5.1% |
Household Income by Householder Age in Cabot
The median household income in Cabot is $69,094, with the highest median household income of $101,932 found in the 45 to 64 years age bracket for the primary householder. A total of 3,470 households (34.5%) fall into this category. Meanwhile, the 15 to 24 years age bracket for the primary householder has the lowest median household income of $31,576, with 379 households (3.8%) in this group.
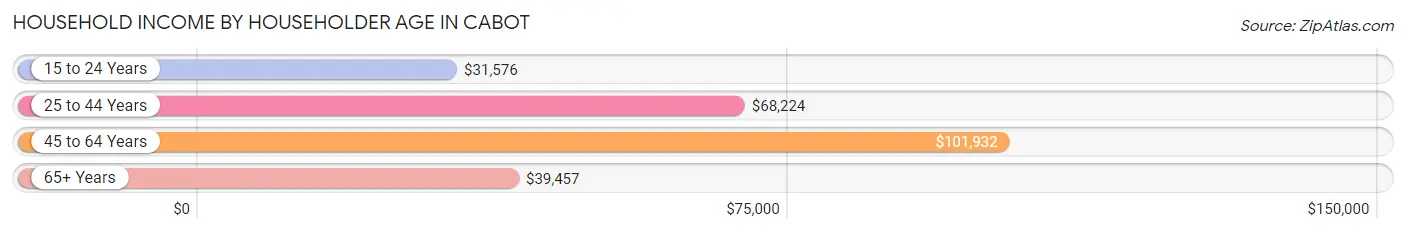
| Income Bracket | # Households | Median Income |
| 15 to 24 Years | 379 (3.8%) | $31,576 |
| 25 to 44 Years | 3,916 (38.9%) | $68,224 |
| 45 to 64 Years | 3,470 (34.5%) | $101,932 |
| 65+ Years | 2,299 (22.8%) | $39,457 |
| Total | 10,064 (100.0%) | $69,094 |
Poverty in Cabot
Income Below Poverty by Sex and Age in Cabot
With 11.0% poverty level for males and 14.6% for females among the residents of Cabot, 5 year old males and under 5 year old females are the most vulnerable to poverty, with 116 males (67.8%) and 303 females (29.7%) in their respective age groups living below the poverty level.
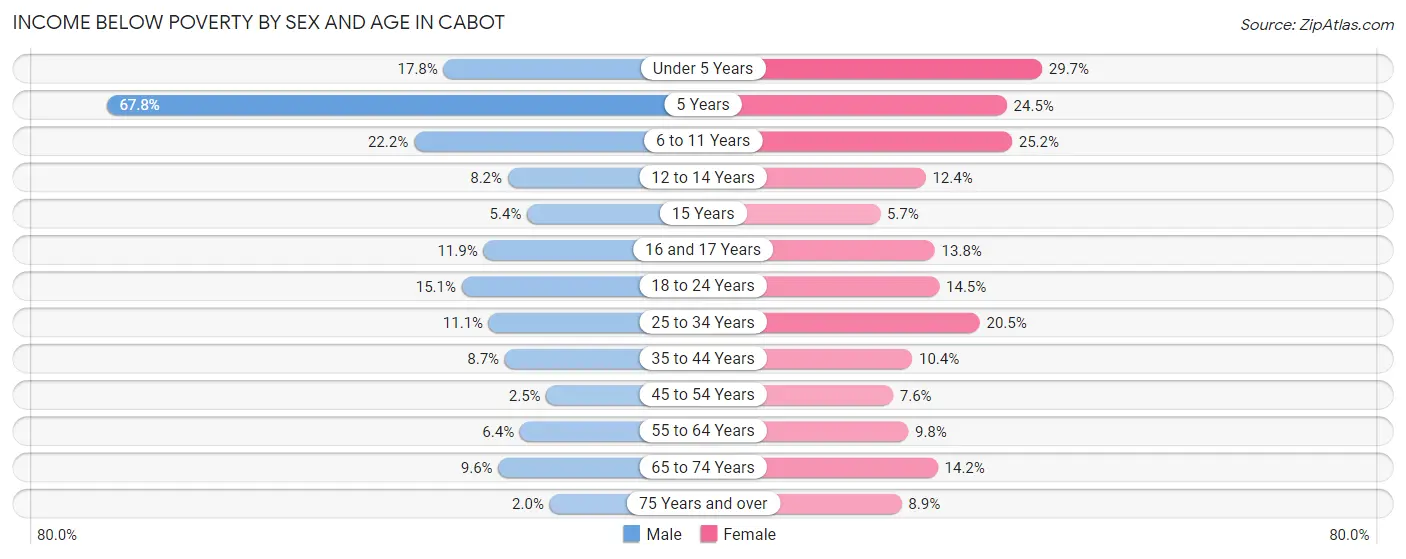
| Age Bracket | Male | Female |
| Under 5 Years | 144 (17.8%) | 303 (29.7%) |
| 5 Years | 116 (67.8%) | 35 (24.5%) |
| 6 to 11 Years | 244 (22.2%) | 232 (25.2%) |
| 12 to 14 Years | 68 (8.2%) | 63 (12.4%) |
| 15 Years | 14 (5.4%) | 14 (5.7%) |
| 16 and 17 Years | 76 (11.9%) | 56 (13.8%) |
| 18 to 24 Years | 168 (15.1%) | 153 (14.4%) |
| 25 to 34 Years | 209 (11.1%) | 382 (20.5%) |
| 35 to 44 Years | 158 (8.7%) | 200 (10.4%) |
| 45 to 54 Years | 37 (2.5%) | 132 (7.6%) |
| 55 to 64 Years | 83 (6.4%) | 164 (9.8%) |
| 65 to 74 Years | 91 (9.6%) | 144 (14.2%) |
| 75 Years and over | 12 (2.0%) | 79 (8.8%) |
| Total | 1,420 (11.0%) | 1,957 (14.6%) |
Income Above Poverty by Sex and Age in Cabot
According to the poverty statistics in Cabot, males aged 75 years and over and females aged 15 years are the age groups that are most secure financially, with 98.0% of males and 94.3% of females in these age groups living above the poverty line.
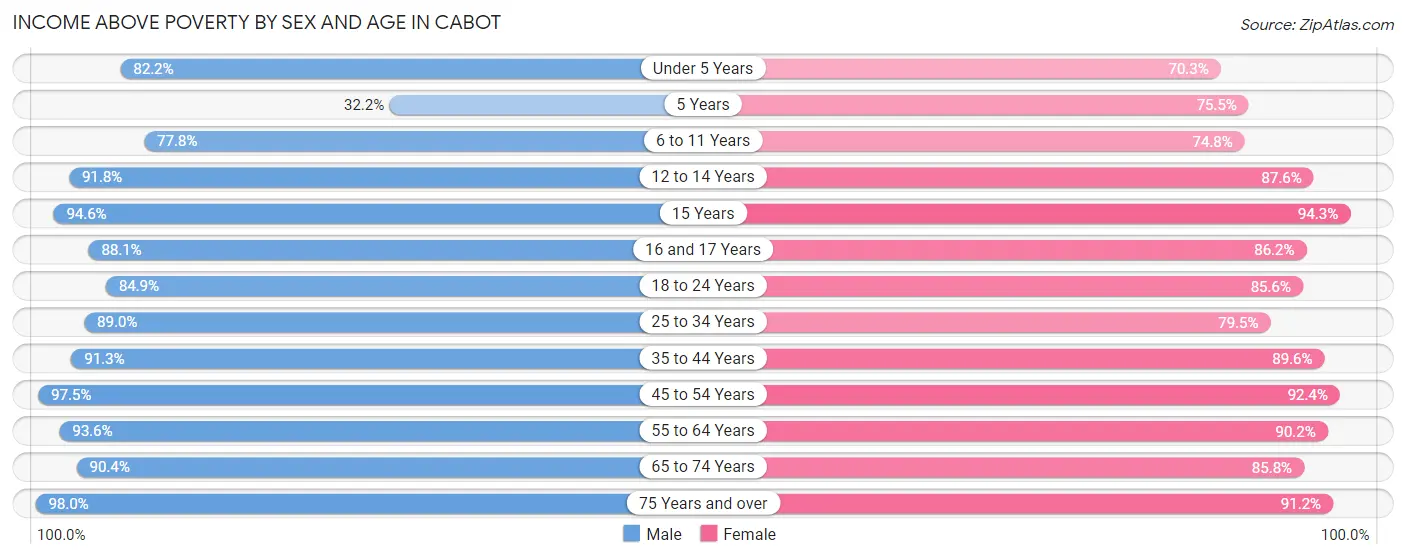
| Age Bracket | Male | Female |
| Under 5 Years | 666 (82.2%) | 717 (70.3%) |
| 5 Years | 55 (32.2%) | 108 (75.5%) |
| 6 to 11 Years | 856 (77.8%) | 687 (74.8%) |
| 12 to 14 Years | 757 (91.8%) | 444 (87.6%) |
| 15 Years | 247 (94.6%) | 233 (94.3%) |
| 16 and 17 Years | 565 (88.1%) | 350 (86.2%) |
| 18 to 24 Years | 946 (84.9%) | 906 (85.6%) |
| 25 to 34 Years | 1,682 (88.9%) | 1,485 (79.5%) |
| 35 to 44 Years | 1,664 (91.3%) | 1,717 (89.6%) |
| 45 to 54 Years | 1,435 (97.5%) | 1,610 (92.4%) |
| 55 to 64 Years | 1,205 (93.6%) | 1,503 (90.2%) |
| 65 to 74 Years | 853 (90.4%) | 868 (85.8%) |
| 75 Years and over | 582 (98.0%) | 814 (91.1%) |
| Total | 11,513 (89.0%) | 11,442 (85.4%) |
Income Below Poverty Among Married-Couple Families in Cabot
The poverty statistics for married-couple families in Cabot show that 4.2% or 218 of the total 5,154 families live below the poverty line. Families with 5 or more children have the highest poverty rate of 28.3%, comprising of 15 families. On the other hand, families with no children have the lowest poverty rate of 2.3%, which includes 66 families.
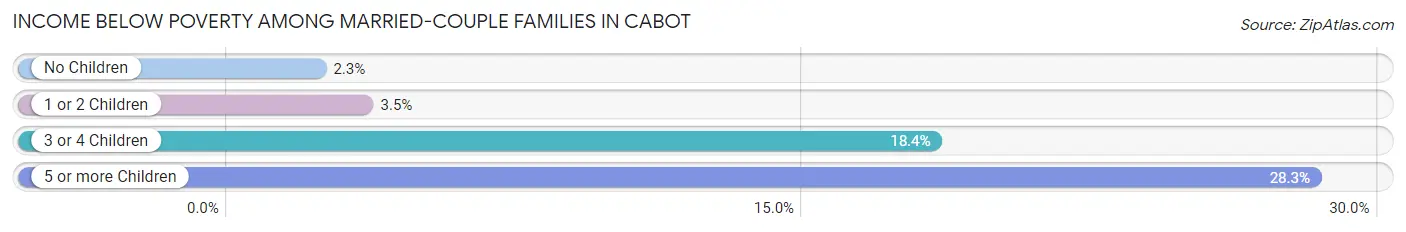
| Children | Above Poverty | Below Poverty |
| No Children | 2,787 (97.7%) | 66 (2.3%) |
| 1 or 2 Children | 1,796 (96.5%) | 66 (3.5%) |
| 3 or 4 Children | 315 (81.6%) | 71 (18.4%) |
| 5 or more Children | 38 (71.7%) | 15 (28.3%) |
| Total | 4,936 (95.8%) | 218 (4.2%) |
Income Below Poverty Among Single-Parent Households in Cabot
According to the poverty data in Cabot, 9.8% or 62 single-father households and 28.1% or 379 single-mother households are living below the poverty line. Among single-father households, those with 1 or 2 children have the highest poverty rate, with 62 households (19.9%) experiencing poverty. Likewise, among single-mother households, those with 3 or 4 children have the highest poverty rate, with 123 households (64.7%) falling below the poverty line.
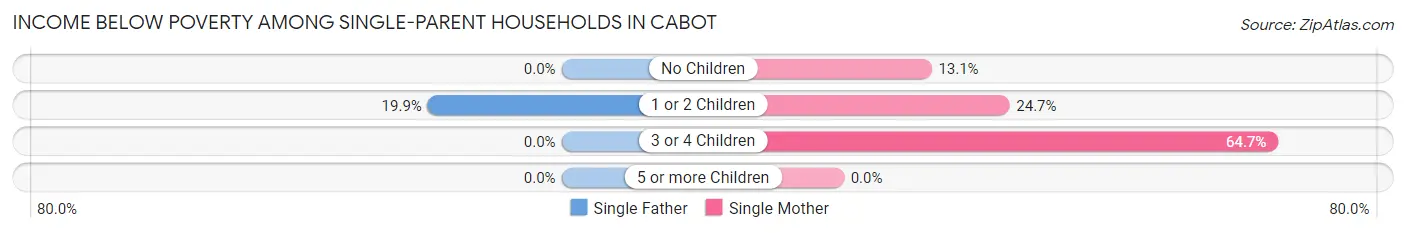
| Children | Single Father | Single Mother |
| No Children | 0 (0.0%) | 34 (13.1%) |
| 1 or 2 Children | 62 (19.9%) | 222 (24.7%) |
| 3 or 4 Children | 0 (0.0%) | 123 (64.7%) |
| 5 or more Children | 0 (0.0%) | 0 (0.0%) |
| Total | 62 (9.8%) | 379 (28.1%) |
Income Below Poverty Among Married-Couple vs Single-Parent Households in Cabot
The poverty data for Cabot shows that 218 of the married-couple family households (4.2%) and 441 of the single-parent households (22.3%) are living below the poverty level. Within the married-couple family households, those with 5 or more children have the highest poverty rate, with 15 households (28.3%) falling below the poverty line. Among the single-parent households, those with 3 or 4 children have the highest poverty rate, with 123 household (47.5%) living below poverty.
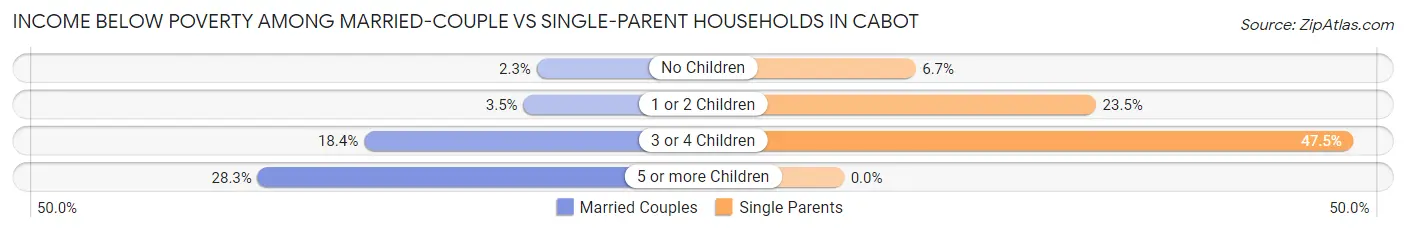
| Children | Married-Couple Families | Single-Parent Households |
| No Children | 66 (2.3%) | 34 (6.7%) |
| 1 or 2 Children | 66 (3.5%) | 284 (23.5%) |
| 3 or 4 Children | 71 (18.4%) | 123 (47.5%) |
| 5 or more Children | 15 (28.3%) | 0 (0.0%) |
| Total | 218 (4.2%) | 441 (22.3%) |
Race in Cabot
The most populous races in Cabot are White / Caucasian (23,171 | 87.3%), Two or more Races (1,511 | 5.7%), and Hispanic or Latino (1,474 | 5.6%).
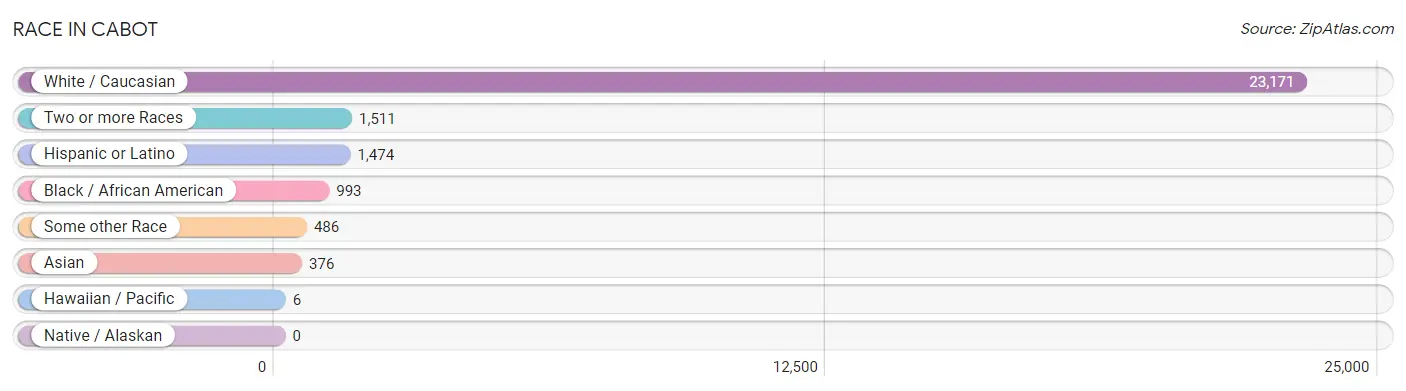
| Race | # Population | % Population |
| Asian | 376 | 1.4% |
| Black / African American | 993 | 3.7% |
| Hawaiian / Pacific | 6 | 0.0% |
| Hispanic or Latino | 1,474 | 5.6% |
| Native / Alaskan | 0 | 0.0% |
| White / Caucasian | 23,171 | 87.3% |
| Two or more Races | 1,511 | 5.7% |
| Some other Race | 486 | 1.8% |
| Total | 26,543 | 100.0% |
Ancestry in Cabot
The most populous ancestries reported in Cabot are English (3,402 | 12.8%), German (3,287 | 12.4%), Irish (2,592 | 9.8%), American (2,126 | 8.0%), and Mexican (1,027 | 3.9%), together accounting for 46.9% of all Cabot residents.
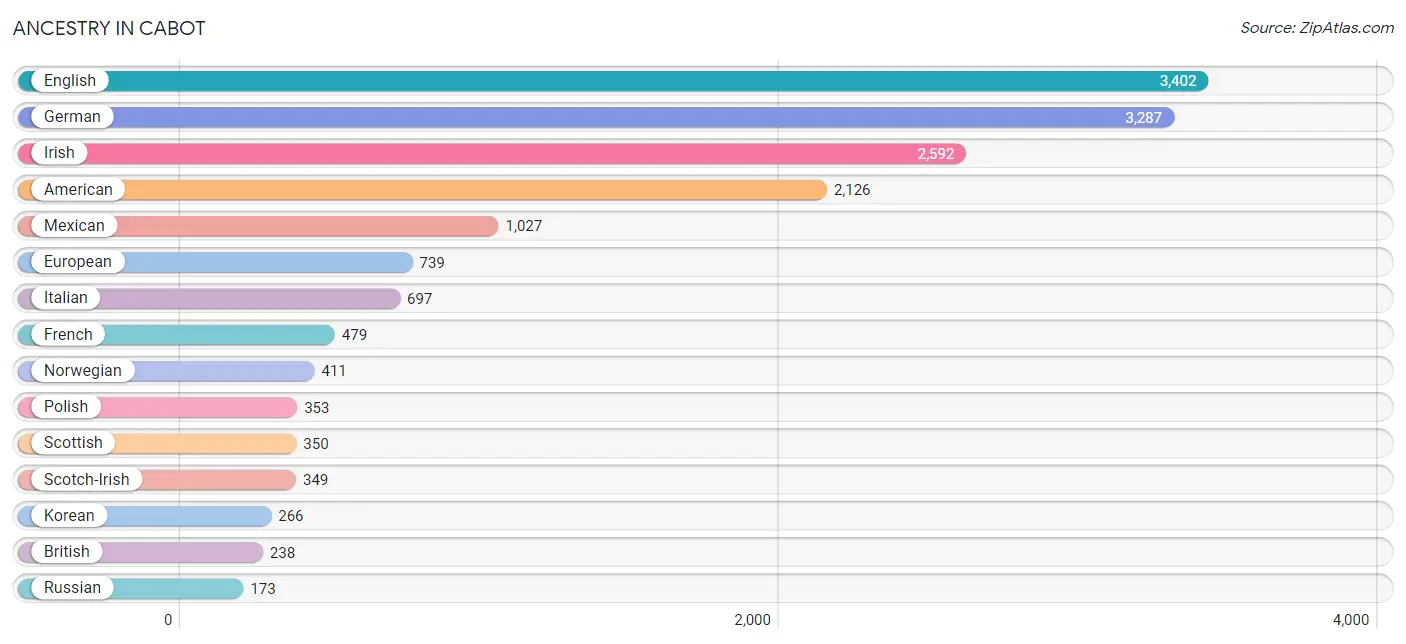
| Ancestry | # Population | % Population |
| African | 113 | 0.4% |
| American | 2,126 | 8.0% |
| Arab | 11 | 0.0% |
| Austrian | 88 | 0.3% |
| Bhutanese | 141 | 0.5% |
| British | 238 | 0.9% |
| Bulgarian | 24 | 0.1% |
| Burmese | 139 | 0.5% |
| Cajun | 13 | 0.1% |
| Canadian | 12 | 0.1% |
| Central American | 110 | 0.4% |
| Cherokee | 99 | 0.4% |
| Choctaw | 17 | 0.1% |
| Cree | 55 | 0.2% |
| Cuban | 17 | 0.1% |
| Czech | 50 | 0.2% |
| Danish | 22 | 0.1% |
| Dutch | 86 | 0.3% |
| Eastern European | 78 | 0.3% |
| English | 3,402 | 12.8% |
| European | 739 | 2.8% |
| Filipino | 14 | 0.1% |
| Finnish | 31 | 0.1% |
| French | 479 | 1.8% |
| French Canadian | 134 | 0.5% |
| German | 3,287 | 12.4% |
| Ghanaian | 108 | 0.4% |
| Greek | 27 | 0.1% |
| Guamanian / Chamorro | 10 | 0.0% |
| Guatemalan | 32 | 0.1% |
| Honduran | 61 | 0.2% |
| Hungarian | 61 | 0.2% |
| Indian (Asian) | 37 | 0.1% |
| Irish | 2,592 | 9.8% |
| Italian | 697 | 2.6% |
| Korean | 266 | 1.0% |
| Lebanese | 11 | 0.0% |
| Mexican | 1,027 | 3.9% |
| Native Hawaiian | 39 | 0.2% |
| Nicaraguan | 11 | 0.0% |
| Norwegian | 411 | 1.5% |
| Polish | 353 | 1.3% |
| Portuguese | 80 | 0.3% |
| Puerto Rican | 29 | 0.1% |
| Romanian | 24 | 0.1% |
| Russian | 173 | 0.6% |
| Salvadoran | 6 | 0.0% |
| Scandinavian | 105 | 0.4% |
| Scotch-Irish | 349 | 1.3% |
| Scottish | 350 | 1.3% |
| Slavic | 11 | 0.0% |
| Slovak | 8 | 0.0% |
| South American | 28 | 0.1% |
| Spaniard | 33 | 0.1% |
| Spanish | 58 | 0.2% |
| Subsaharan African | 113 | 0.4% |
| Swedish | 170 | 0.6% |
| Swiss | 72 | 0.3% |
| Venezuelan | 28 | 0.1% |
| Welsh | 127 | 0.5% | View All 60 Rows |
Immigrants in Cabot
The most numerous immigrant groups reported in Cabot came from Latin America (390 | 1.5%), Central America (310 | 1.2%), Mexico (269 | 1.0%), Africa (136 | 0.5%), and Western Africa (134 | 0.5%), together accounting for 4.7% of all Cabot residents.
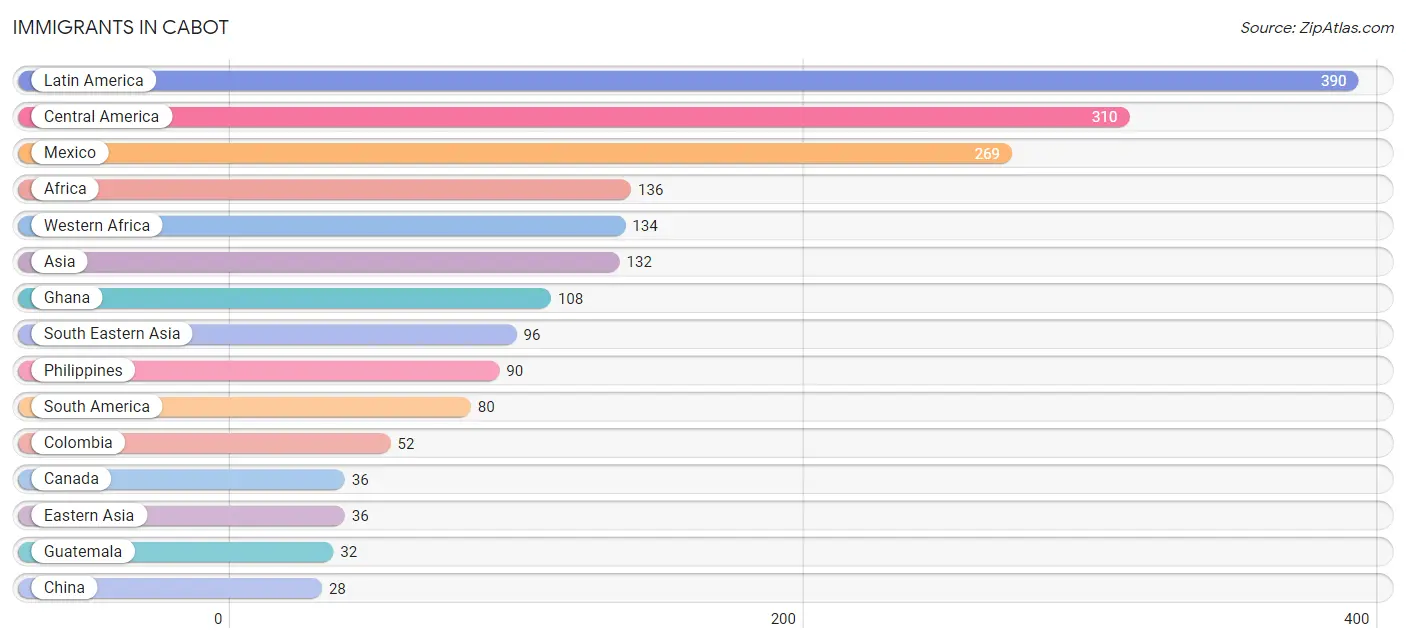
| Immigration Origin | # Population | % Population |
| Africa | 136 | 0.5% |
| Asia | 132 | 0.5% |
| Canada | 36 | 0.1% |
| Central America | 310 | 1.2% |
| China | 28 | 0.1% |
| Colombia | 52 | 0.2% |
| Eastern Africa | 2 | 0.0% |
| Eastern Asia | 36 | 0.1% |
| Europe | 21 | 0.1% |
| Germany | 9 | 0.0% |
| Ghana | 108 | 0.4% |
| Guatemala | 32 | 0.1% |
| Honduras | 9 | 0.0% |
| Korea | 8 | 0.0% |
| Latin America | 390 | 1.5% |
| Mexico | 269 | 1.0% |
| Northern Europe | 12 | 0.1% |
| Philippines | 90 | 0.3% |
| South America | 80 | 0.3% |
| South Eastern Asia | 96 | 0.4% |
| Taiwan | 14 | 0.1% |
| Thailand | 6 | 0.0% |
| Venezuela | 28 | 0.1% |
| Western Africa | 134 | 0.5% |
| Western Europe | 9 | 0.0% |
| Zimbabwe | 2 | 0.0% | View All 26 Rows |
Sex and Age in Cabot
Sex and Age in Cabot
The most populous age groups in Cabot are 15 to 19 Years (1,246 | 9.6%) for men and 50 to 54 Years (1,037 | 7.6%) for women.
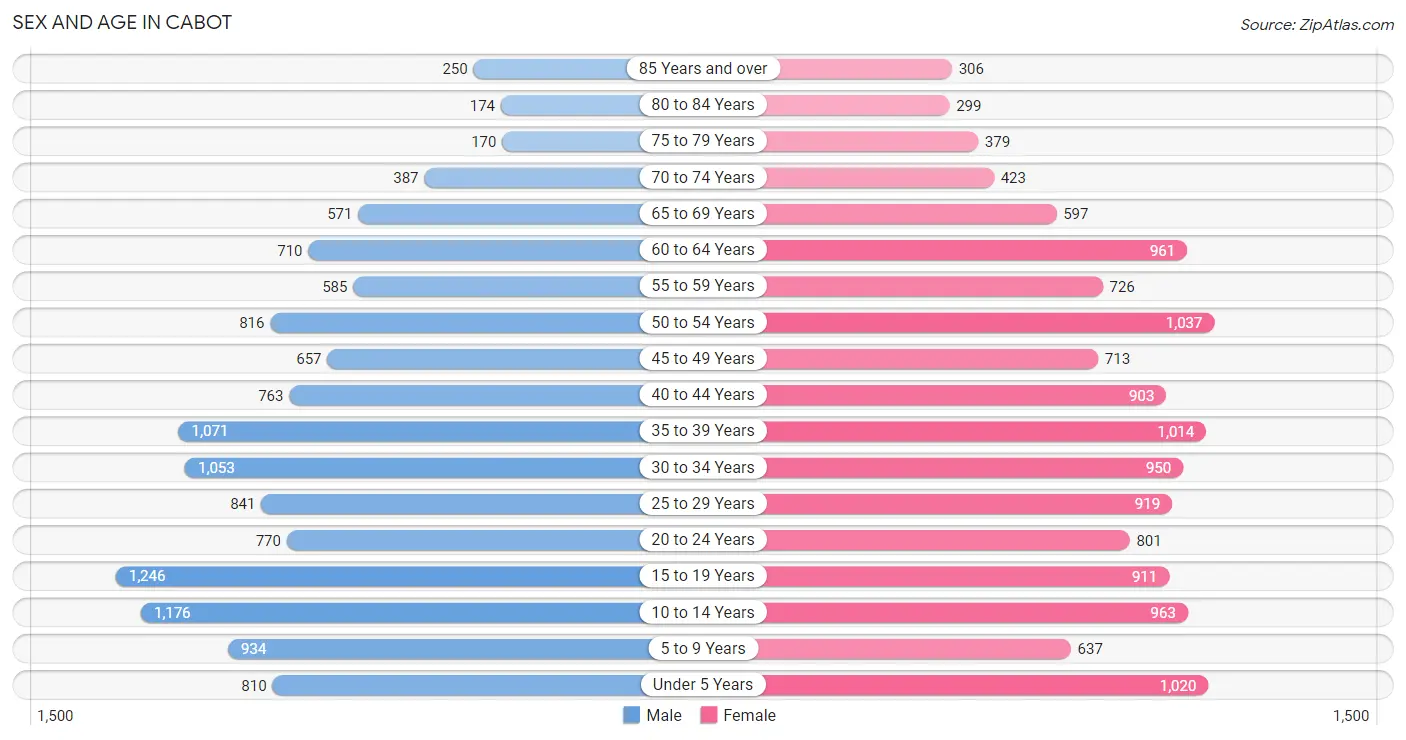
| Age Bracket | Male | Female |
| Under 5 Years | 810 (6.2%) | 1,020 (7.5%) |
| 5 to 9 Years | 934 (7.2%) | 637 (4.7%) |
| 10 to 14 Years | 1,176 (9.1%) | 963 (7.1%) |
| 15 to 19 Years | 1,246 (9.6%) | 911 (6.7%) |
| 20 to 24 Years | 770 (5.9%) | 801 (5.9%) |
| 25 to 29 Years | 841 (6.5%) | 919 (6.8%) |
| 30 to 34 Years | 1,053 (8.1%) | 950 (7.0%) |
| 35 to 39 Years | 1,071 (8.3%) | 1,014 (7.5%) |
| 40 to 44 Years | 763 (5.9%) | 903 (6.7%) |
| 45 to 49 Years | 657 (5.1%) | 713 (5.3%) |
| 50 to 54 Years | 816 (6.3%) | 1,037 (7.6%) |
| 55 to 59 Years | 585 (4.5%) | 726 (5.3%) |
| 60 to 64 Years | 710 (5.5%) | 961 (7.1%) |
| 65 to 69 Years | 571 (4.4%) | 597 (4.4%) |
| 70 to 74 Years | 387 (3.0%) | 423 (3.1%) |
| 75 to 79 Years | 170 (1.3%) | 379 (2.8%) |
| 80 to 84 Years | 174 (1.3%) | 299 (2.2%) |
| 85 Years and over | 250 (1.9%) | 306 (2.3%) |
| Total | 12,984 (100.0%) | 13,559 (100.0%) |
Families and Households in Cabot
Median Family Size in Cabot
The median family size in Cabot is 3.10 persons per family, with single female/mother families (1,349 | 18.9%) accounting for the largest median family size of 3.19 persons per family. On the other hand, single male/father families (630 | 8.8%) represent the smallest median family size with 2.63 persons per family.
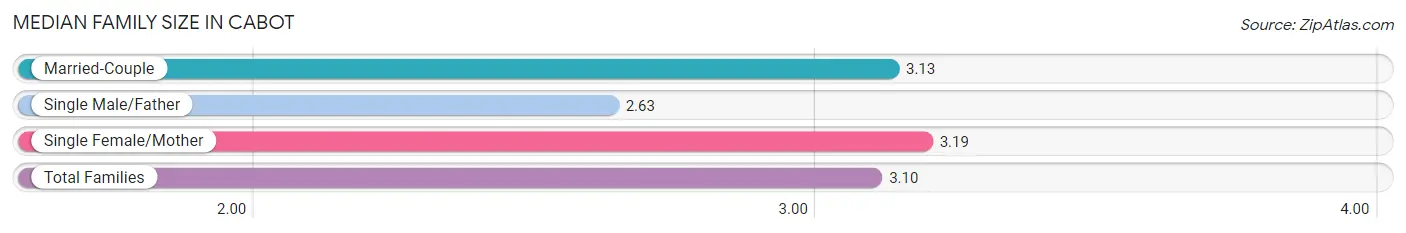
| Family Type | # Families | Family Size |
| Married-Couple | 5,154 (72.3%) | 3.13 |
| Single Male/Father | 630 (8.8%) | 2.63 |
| Single Female/Mother | 1,349 (18.9%) | 3.19 |
| Total Families | 7,133 (100.0%) | 3.10 |
Median Household Size in Cabot
The median household size in Cabot is 2.62 persons per household, with single female/mother households (1,349 | 13.4%) accounting for the largest median household size of 3.27 persons per household. non-family households (2,931 | 29.1%) represent the smallest median household size with 1.26 persons per household.
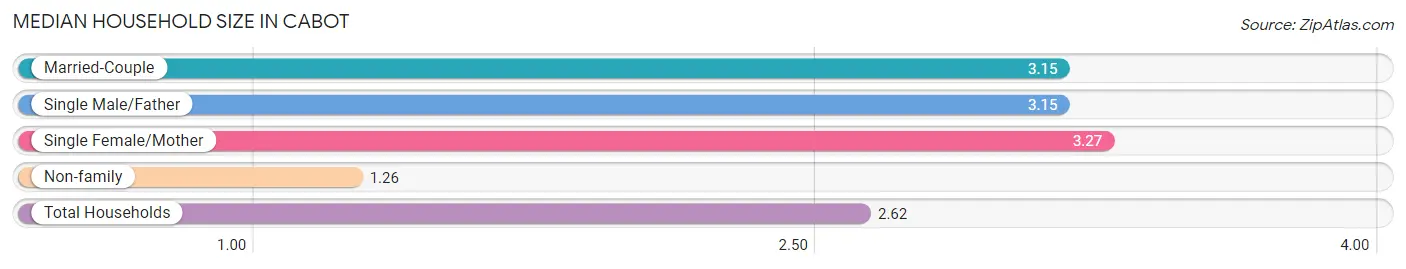
| Household Type | # Households | Household Size |
| Married-Couple | 5,154 (51.2%) | 3.15 |
| Single Male/Father | 630 (6.3%) | 3.15 |
| Single Female/Mother | 1,349 (13.4%) | 3.27 |
| Non-family | 2,931 (29.1%) | 1.26 |
| Total Households | 10,064 (100.0%) | 2.62 |
Household Size by Marriage Status in Cabot
Out of a total of 10,064 households in Cabot, 7,133 (70.9%) are family households, while 2,931 (29.1%) are nonfamily households. The most numerous type of family households are 2-person households, comprising 3,018, and the most common type of nonfamily households are 1-person households, comprising 2,382.
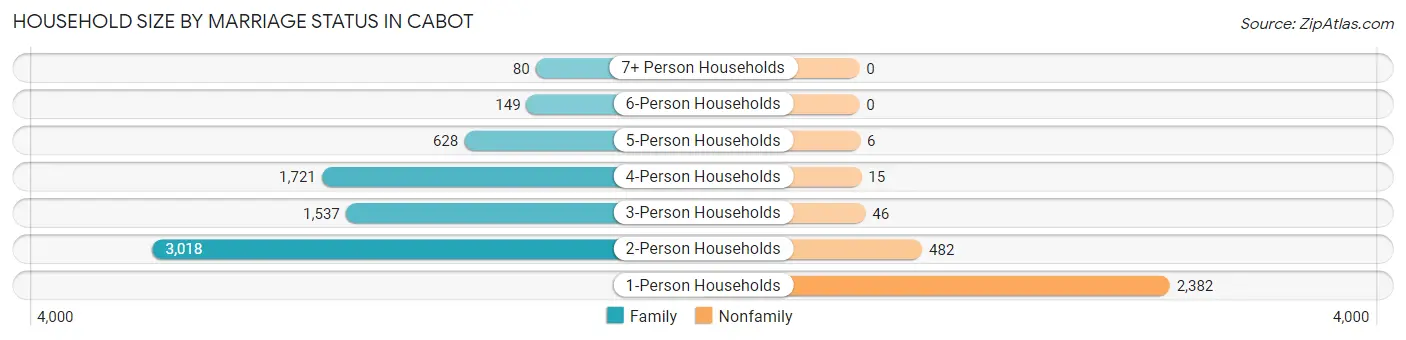
| Household Size | Family Households | Nonfamily Households |
| 1-Person Households | - | 2,382 (23.7%) |
| 2-Person Households | 3,018 (30.0%) | 482 (4.8%) |
| 3-Person Households | 1,537 (15.3%) | 46 (0.5%) |
| 4-Person Households | 1,721 (17.1%) | 15 (0.2%) |
| 5-Person Households | 628 (6.2%) | 6 (0.1%) |
| 6-Person Households | 149 (1.5%) | 0 (0.0%) |
| 7+ Person Households | 80 (0.8%) | 0 (0.0%) |
| Total | 7,133 (70.9%) | 2,931 (29.1%) |
Female Fertility in Cabot
Fertility by Age in Cabot
Average fertility rate in Cabot is 57.0 births per 1,000 women. Women in the age bracket of 20 to 34 years have the highest fertility rate with 90.0 births per 1,000 women. Women in the age bracket of 20 to 34 years acount for 63.7% of all women with births.
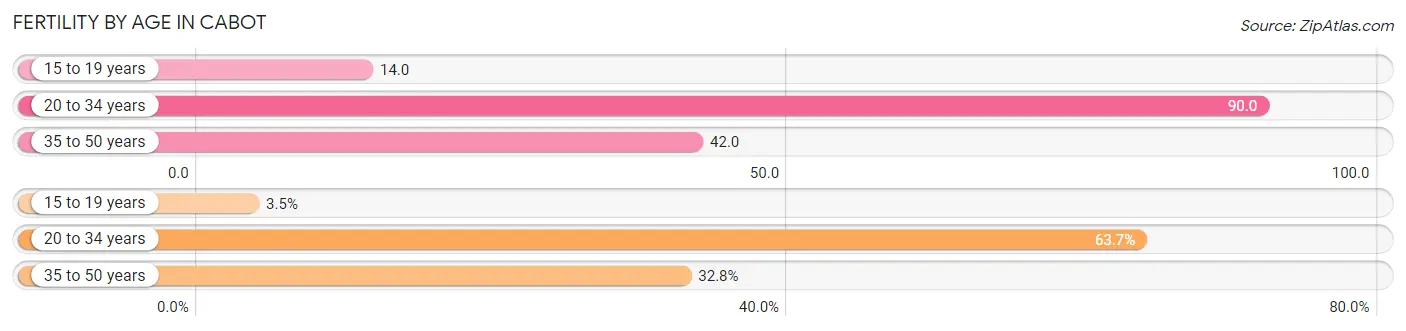
| Age Bracket | Women with Births | Births / 1,000 Women |
| 15 to 19 years | 13 (3.5%) | 14.0 |
| 20 to 34 years | 239 (63.7%) | 90.0 |
| 35 to 50 years | 123 (32.8%) | 42.0 |
| Total | 375 (100.0%) | 57.0 |
Fertility by Age by Marriage Status in Cabot
83.7% of women with births (375) in Cabot are married. The highest percentage of unmarried women with births falls into 15 to 19 years age bracket with 100.0% of them unmarried at the time of birth, while the lowest percentage of unmarried women with births belong to 35 to 50 years age bracket with 0.0% of them unmarried.
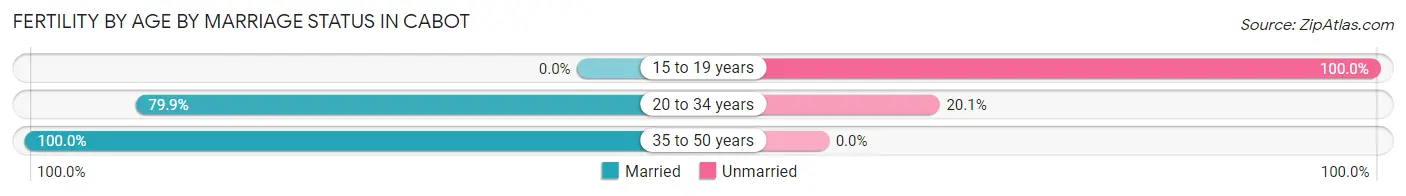
| Age Bracket | Married | Unmarried |
| 15 to 19 years | 0 (0.0%) | 13 (100.0%) |
| 20 to 34 years | 191 (79.9%) | 48 (20.1%) |
| 35 to 50 years | 123 (100.0%) | 0 (0.0%) |
| Total | 314 (83.7%) | 61 (16.3%) |
Fertility by Education in Cabot
Average fertility rate in Cabot is 57.0 births per 1,000 women. Women with the education attainment of college or associate's degree have the highest fertility rate of 82.0 births per 1,000 women, while women with the education attainment of less than high school have the lowest fertility at 14.0 births per 1,000 women. Women with the education attainment of college or associate's degree represent 48.3% of all women with births.
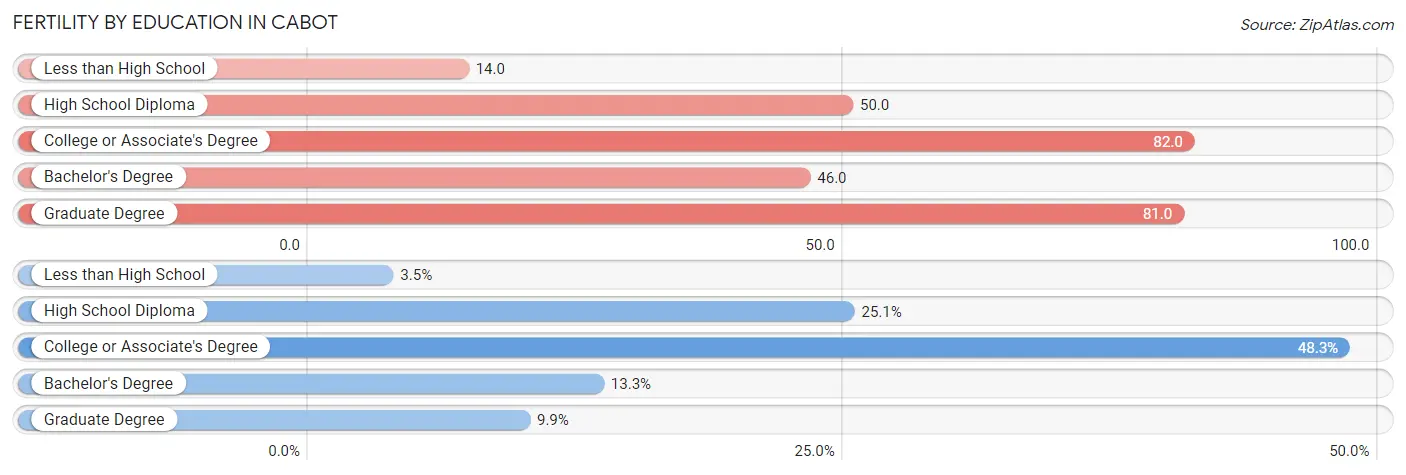
| Educational Attainment | Women with Births | Births / 1,000 Women |
| Less than High School | 13 (3.5%) | 14.0 |
| High School Diploma | 94 (25.1%) | 50.0 |
| College or Associate's Degree | 181 (48.3%) | 82.0 |
| Bachelor's Degree | 50 (13.3%) | 46.0 |
| Graduate Degree | 37 (9.9%) | 81.0 |
| Total | 375 (100.0%) | 57.0 |
Fertility by Education by Marriage Status in Cabot
16.3% of women with births in Cabot are unmarried. Women with the educational attainment of bachelor's degree are most likely to be married with 100.0% of them married at childbirth, while women with the educational attainment of less than high school are least likely to be married with 100.0% of them unmarried at childbirth.
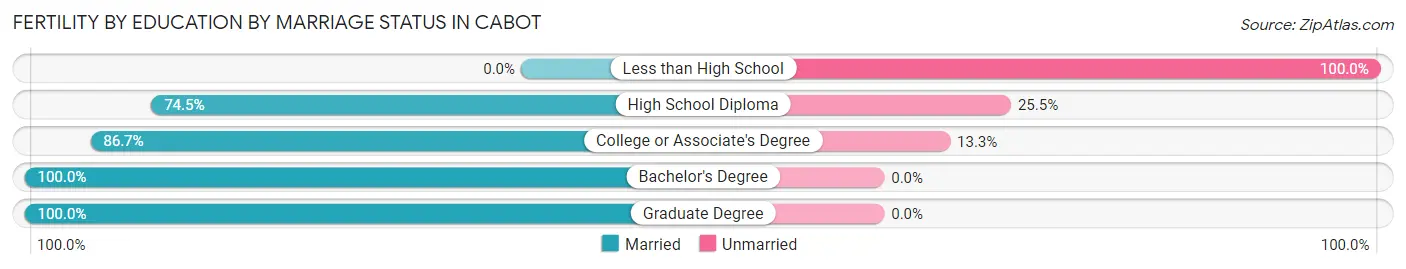
| Educational Attainment | Married | Unmarried |
| Less than High School | 0 (0.0%) | 13 (100.0%) |
| High School Diploma | 70 (74.5%) | 24 (25.5%) |
| College or Associate's Degree | 157 (86.7%) | 24 (13.3%) |
| Bachelor's Degree | 50 (100.0%) | 0 (0.0%) |
| Graduate Degree | 37 (100.0%) | 0 (0.0%) |
| Total | 314 (83.7%) | 61 (16.3%) |
Employment Characteristics in Cabot
Employment by Class of Employer in Cabot
Among the 12,637 employed individuals in Cabot, private company employees (8,397 | 66.4%), federal government employees (1,104 | 8.7%), and local government employees (863 | 6.8%) make up the most common classes of employment.
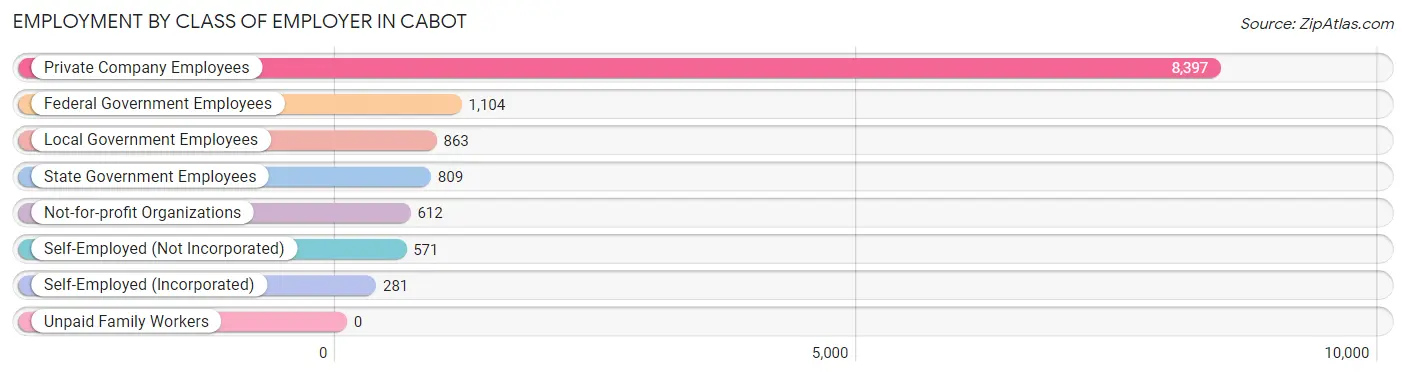
| Employer Class | # Employees | % Employees |
| Private Company Employees | 8,397 | 66.4% |
| Self-Employed (Incorporated) | 281 | 2.2% |
| Self-Employed (Not Incorporated) | 571 | 4.5% |
| Not-for-profit Organizations | 612 | 4.8% |
| Local Government Employees | 863 | 6.8% |
| State Government Employees | 809 | 6.4% |
| Federal Government Employees | 1,104 | 8.7% |
| Unpaid Family Workers | 0 | 0.0% |
| Total | 12,637 | 100.0% |
Employment Status by Age in Cabot
According to the labor force statistics for Cabot, out of the total population over 16 years of age (20,495), 64.4% or 13,199 individuals are in the labor force, with 3.3% or 436 of them unemployed. The age group with the highest labor force participation rate is 35 to 44 years, with 86.1% or 3,230 individuals in the labor force. Within the labor force, the 30 to 34 years age range has the highest percentage of unemployed individuals, with 7.7% or 126 of them being unemployed.
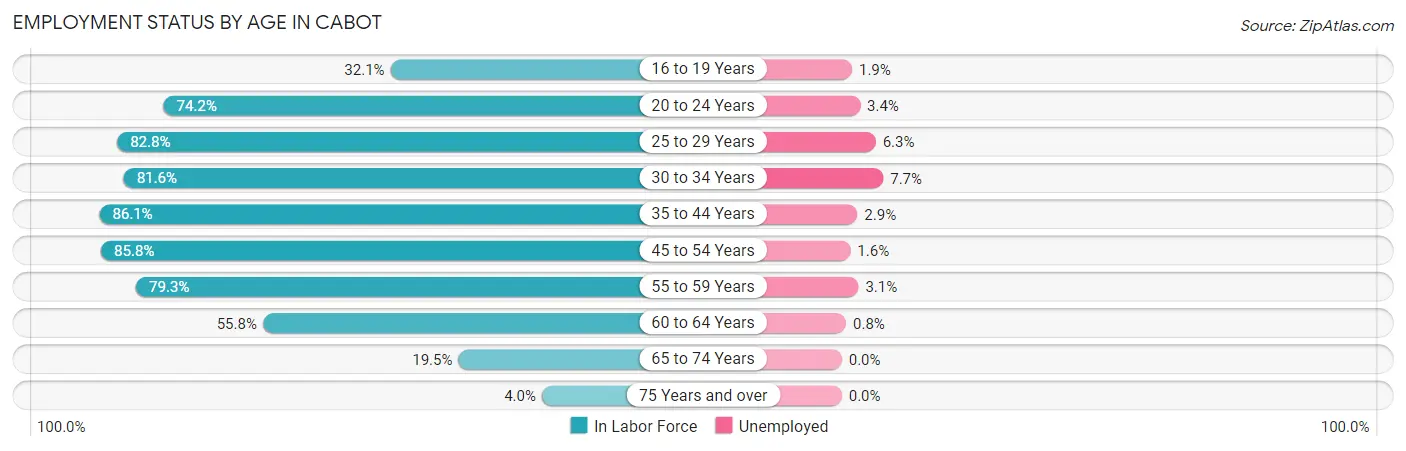
| Age Bracket | In Labor Force | Unemployed |
| 16 to 19 Years | 529 (32.1%) | 10 (1.9%) |
| 20 to 24 Years | 1,166 (74.2%) | 40 (3.4%) |
| 25 to 29 Years | 1,457 (82.8%) | 92 (6.3%) |
| 30 to 34 Years | 1,634 (81.6%) | 126 (7.7%) |
| 35 to 44 Years | 3,230 (86.1%) | 94 (2.9%) |
| 45 to 54 Years | 2,765 (85.8%) | 44 (1.6%) |
| 55 to 59 Years | 1,040 (79.3%) | 32 (3.1%) |
| 60 to 64 Years | 932 (55.8%) | 7 (0.8%) |
| 65 to 74 Years | 386 (19.5%) | 0 (0.0%) |
| 75 Years and over | 63 (4.0%) | 0 (0.0%) |
| Total | 13,199 (64.4%) | 436 (3.3%) |
Employment Status by Educational Attainment in Cabot
According to labor force statistics for Cabot, 80.6% of individuals (11,058) out of the total population between 25 and 64 years of age (13,719) are in the labor force, with 3.5% or 387 of them being unemployed. The group with the highest labor force participation rate are those with the educational attainment of bachelor's degree or higher, with 88.4% or 3,113 individuals in the labor force. Within the labor force, individuals with less than high school education have the highest percentage of unemployment, with 17.9% or 96 of them being unemployed.
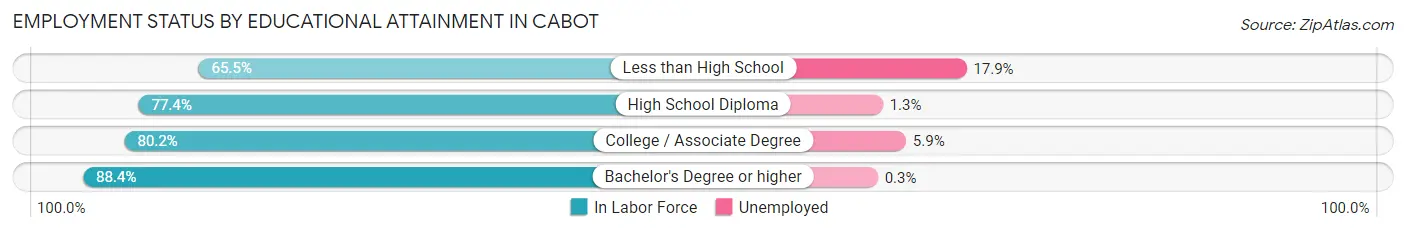
| Educational Attainment | In Labor Force | Unemployed |
| Less than High School | 537 (65.5%) | 147 (17.9%) |
| High School Diploma | 3,214 (77.4%) | 54 (1.3%) |
| College / Associate Degree | 4,190 (80.2%) | 308 (5.9%) |
| Bachelor's Degree or higher | 3,113 (88.4%) | 11 (0.3%) |
| Total | 11,058 (80.6%) | 480 (3.5%) |
Employment Occupations by Sex in Cabot
Management, Business, Science and Arts Occupations
The most common Management, Business, Science and Arts occupations in Cabot are Health Diagnosing & Treating (1,631 | 13.3%), Community & Social Service (1,119 | 9.1%), Health Technologists (1,093 | 8.9%), Management (1,001 | 8.2%), and Education Instruction & Library (886 | 7.2%).
Management, Business, Science and Arts Occupations by Sex
Within the Management, Business, Science and Arts occupations in Cabot, the most male-oriented occupations are Architecture & Engineering (100.0%), Computers, Engineering & Science (75.8%), and Life, Physical & Social Science (69.0%), while the most female-oriented occupations are Health Technologists (92.1%), Health Diagnosing & Treating (91.3%), and Education, Arts & Media (76.7%).
| Occupation | Male | Female |
| Management | 636 (63.5%) | 365 (36.5%) |
| Business & Financial | 199 (39.7%) | 302 (60.3%) |
| Computers, Engineering & Science | 408 (75.8%) | 130 (24.2%) |
| Computers & Mathematics | 267 (68.8%) | 121 (31.2%) |
| Architecture & Engineering | 121 (100.0%) | 0 (0.0%) |
| Life, Physical & Social Science | 20 (69.0%) | 9 (31.0%) |
| Community & Social Service | 352 (31.5%) | 767 (68.5%) |
| Education, Arts & Media | 14 (23.3%) | 46 (76.7%) |
| Legal Services & Support | 37 (36.3%) | 65 (63.7%) |
| Education Instruction & Library | 279 (31.5%) | 607 (68.5%) |
| Arts, Media & Entertainment | 22 (31.0%) | 49 (69.0%) |
| Health Diagnosing & Treating | 141 (8.6%) | 1,490 (91.3%) |
| Health Technologists | 86 (7.9%) | 1,007 (92.1%) |
| Total (Category) | 1,736 (36.2%) | 3,054 (63.8%) |
| Total (Overall) | 5,706 (46.5%) | 6,564 (53.5%) |
Services Occupations
The most common Services occupations in Cabot are Food Preparation & Serving (697 | 5.7%), Security & Protection (377 | 3.1%), Healthcare Support (375 | 3.1%), Personal Care & Service (298 | 2.4%), and Firefighting & Prevention (228 | 1.9%).
Services Occupations by Sex
Within the Services occupations in Cabot, the most male-oriented occupations are Firefighting & Prevention (95.2%), Security & Protection (80.6%), and Law Enforcement (58.4%), while the most female-oriented occupations are Healthcare Support (97.3%), Personal Care & Service (96.0%), and Food Preparation & Serving (78.6%).
| Occupation | Male | Female |
| Healthcare Support | 10 (2.7%) | 365 (97.3%) |
| Security & Protection | 304 (80.6%) | 73 (19.4%) |
| Firefighting & Prevention | 217 (95.2%) | 11 (4.8%) |
| Law Enforcement | 87 (58.4%) | 62 (41.6%) |
| Food Preparation & Serving | 149 (21.4%) | 548 (78.6%) |
| Cleaning & Maintenance | 110 (54.7%) | 91 (45.3%) |
| Personal Care & Service | 12 (4.0%) | 286 (96.0%) |
| Total (Category) | 585 (30.0%) | 1,363 (70.0%) |
| Total (Overall) | 5,706 (46.5%) | 6,564 (53.5%) |
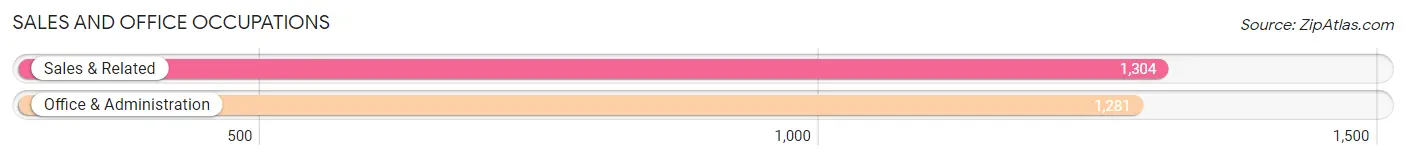
Sales and Office Occupations
The most common Sales and Office occupations in Cabot are Sales & Related (1,304 | 10.6%), and Office & Administration (1,281 | 10.4%).
Sales and Office Occupations by Sex
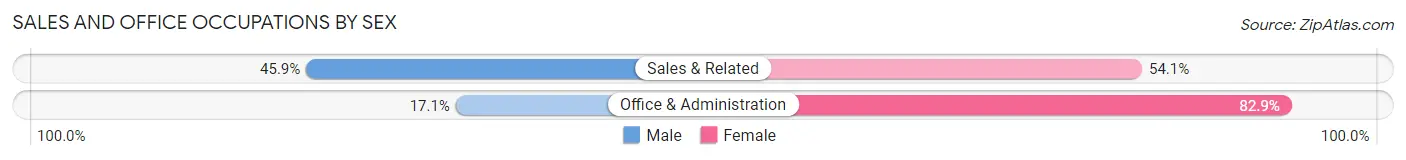
| Occupation | Male | Female |
| Sales & Related | 598 (45.9%) | 706 (54.1%) |
| Office & Administration | 219 (17.1%) | 1,062 (82.9%) |
| Total (Category) | 817 (31.6%) | 1,768 (68.4%) |
| Total (Overall) | 5,706 (46.5%) | 6,564 (53.5%) |
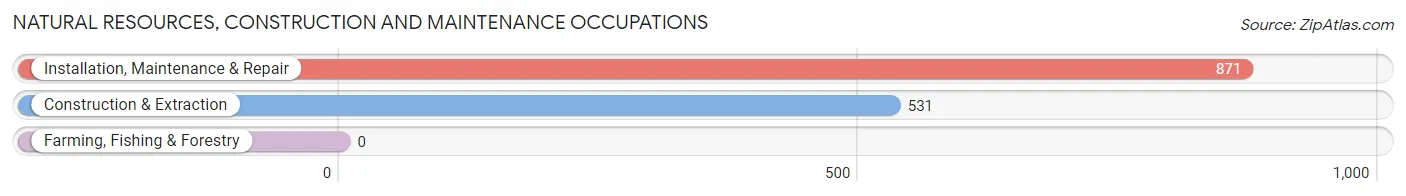
Natural Resources, Construction and Maintenance Occupations
The most common Natural Resources, Construction and Maintenance occupations in Cabot are Installation, Maintenance & Repair (871 | 7.1%), and Construction & Extraction (531 | 4.3%).
Natural Resources, Construction and Maintenance Occupations by Sex
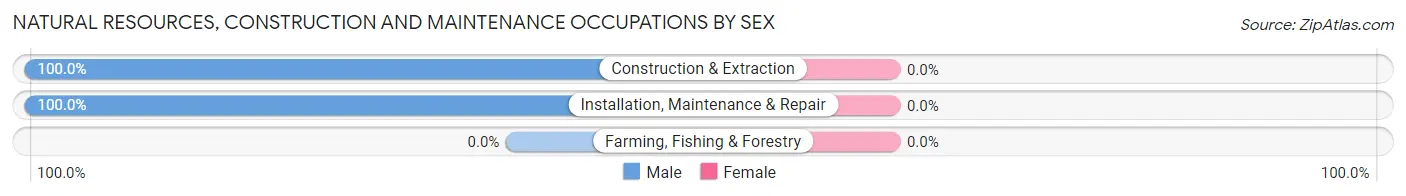
| Occupation | Male | Female |
| Farming, Fishing & Forestry | 0 (0.0%) | 0 (0.0%) |
| Construction & Extraction | 531 (100.0%) | 0 (0.0%) |
| Installation, Maintenance & Repair | 871 (100.0%) | 0 (0.0%) |
| Total (Category) | 1,402 (100.0%) | 0 (0.0%) |
| Total (Overall) | 5,706 (46.5%) | 6,564 (53.5%) |
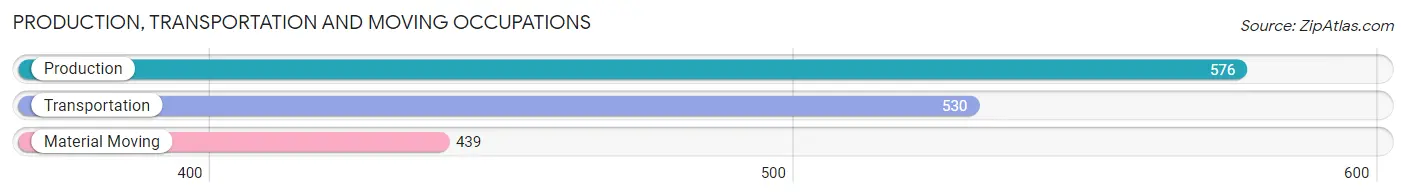
Production, Transportation and Moving Occupations
The most common Production, Transportation and Moving occupations in Cabot are Production (576 | 4.7%), Transportation (530 | 4.3%), and Material Moving (439 | 3.6%).
Production, Transportation and Moving Occupations by Sex
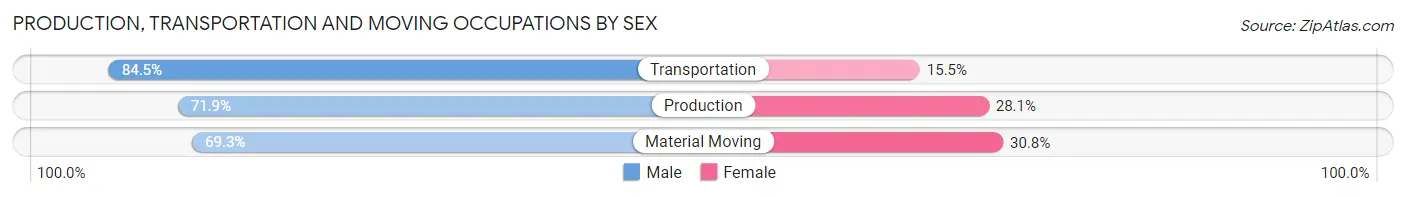
| Occupation | Male | Female |
| Production | 414 (71.9%) | 162 (28.1%) |
| Transportation | 448 (84.5%) | 82 (15.5%) |
| Material Moving | 304 (69.3%) | 135 (30.7%) |
| Total (Category) | 1,166 (75.5%) | 379 (24.5%) |
| Total (Overall) | 5,706 (46.5%) | 6,564 (53.5%) |
Employment Industries by Sex in Cabot
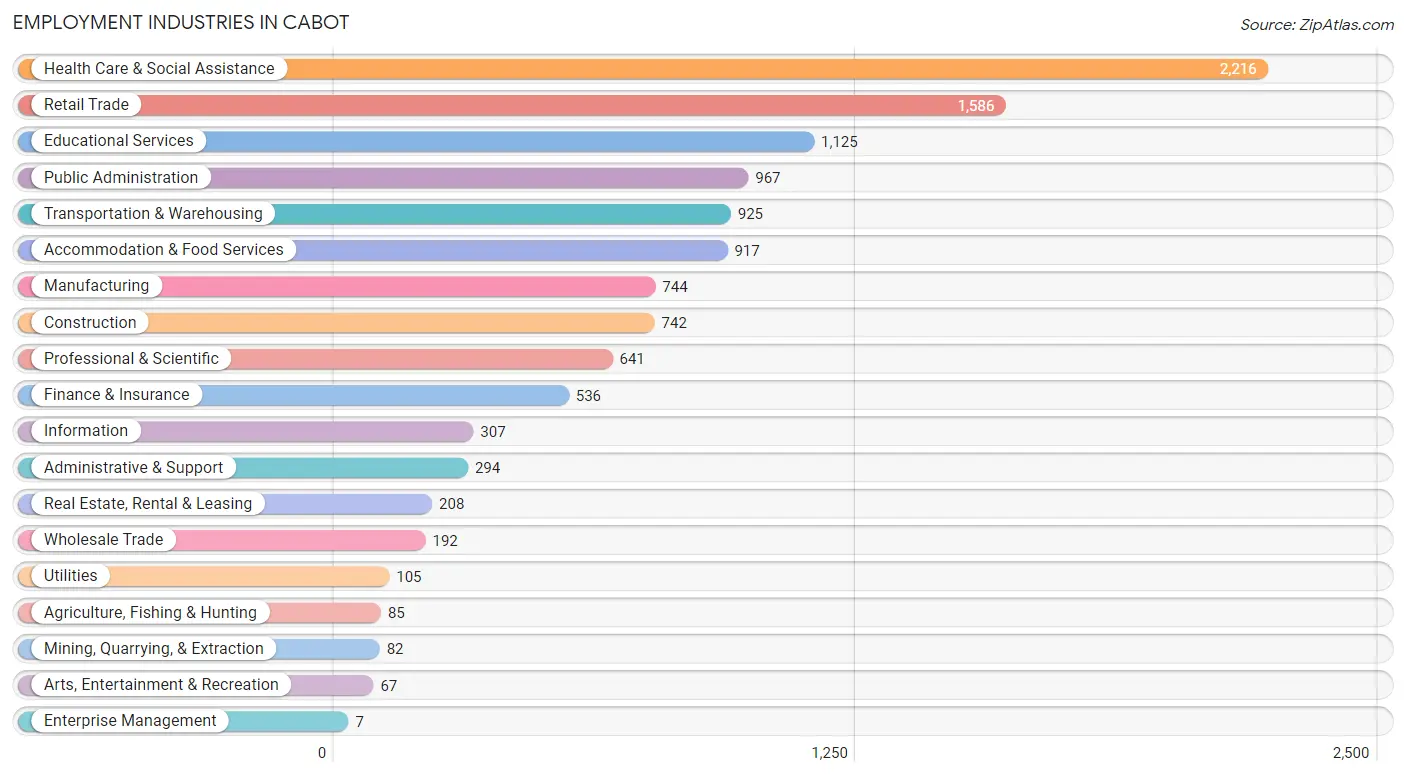
Employment Industries in Cabot
The major employment industries in Cabot include Health Care & Social Assistance (2,216 | 18.1%), Retail Trade (1,586 | 12.9%), Educational Services (1,125 | 9.2%), Public Administration (967 | 7.9%), and Transportation & Warehousing (925 | 7.5%).
Employment Industries by Sex in Cabot
The Cabot industries that see more men than women are Mining, Quarrying, & Extraction (100.0%), Enterprise Management (100.0%), and Information (92.5%), whereas the industries that tend to have a higher number of women are Health Care & Social Assistance (92.8%), Agriculture, Fishing & Hunting (78.8%), and Educational Services (73.2%).
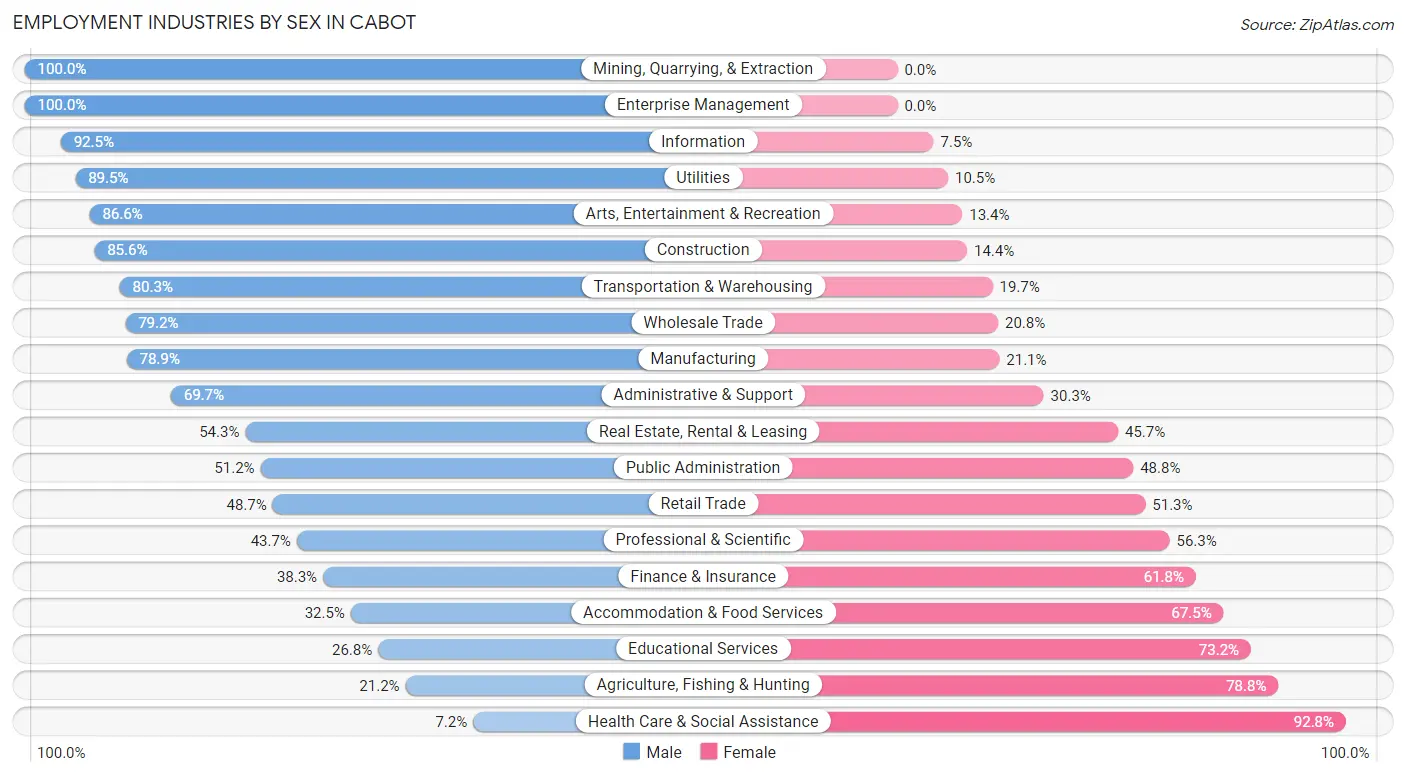
| Industry | Male | Female |
| Agriculture, Fishing & Hunting | 18 (21.2%) | 67 (78.8%) |
| Mining, Quarrying, & Extraction | 82 (100.0%) | 0 (0.0%) |
| Construction | 635 (85.6%) | 107 (14.4%) |
| Manufacturing | 587 (78.9%) | 157 (21.1%) |
| Wholesale Trade | 152 (79.2%) | 40 (20.8%) |
| Retail Trade | 772 (48.7%) | 814 (51.3%) |
| Transportation & Warehousing | 743 (80.3%) | 182 (19.7%) |
| Utilities | 94 (89.5%) | 11 (10.5%) |
| Information | 284 (92.5%) | 23 (7.5%) |
| Finance & Insurance | 205 (38.3%) | 331 (61.8%) |
| Real Estate, Rental & Leasing | 113 (54.3%) | 95 (45.7%) |
| Professional & Scientific | 280 (43.7%) | 361 (56.3%) |
| Enterprise Management | 7 (100.0%) | 0 (0.0%) |
| Administrative & Support | 205 (69.7%) | 89 (30.3%) |
| Educational Services | 302 (26.8%) | 823 (73.2%) |
| Health Care & Social Assistance | 159 (7.2%) | 2,057 (92.8%) |
| Arts, Entertainment & Recreation | 58 (86.6%) | 9 (13.4%) |
| Accommodation & Food Services | 298 (32.5%) | 619 (67.5%) |
| Public Administration | 495 (51.2%) | 472 (48.8%) |
| Total | 5,706 (46.5%) | 6,564 (53.5%) |
Education in Cabot
School Enrollment in Cabot
The most common levels of schooling among the 6,514 students in Cabot are high school (1,911 | 29.3%), middle school (1,632 | 25.1%), and elementary school (1,257 | 19.3%).
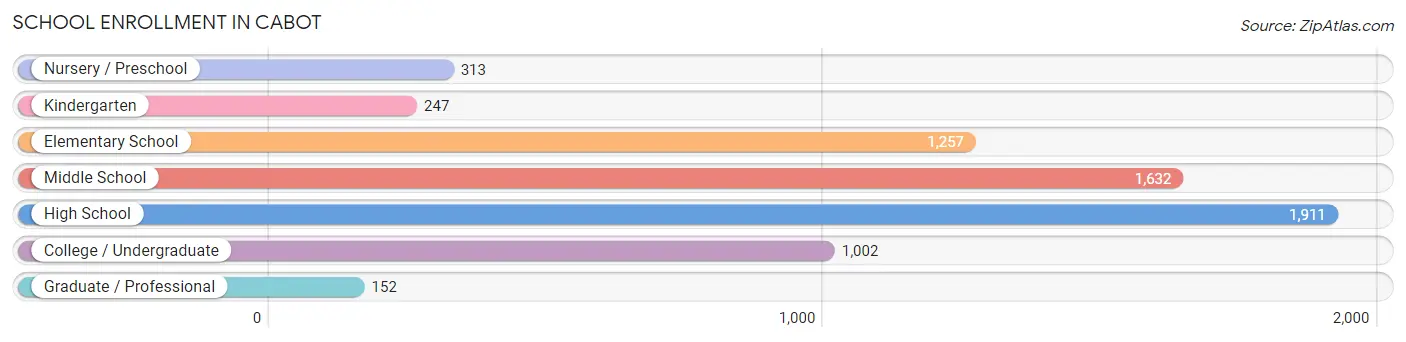
| School Level | # Students | % Students |
| Nursery / Preschool | 313 | 4.8% |
| Kindergarten | 247 | 3.8% |
| Elementary School | 1,257 | 19.3% |
| Middle School | 1,632 | 25.1% |
| High School | 1,911 | 29.3% |
| College / Undergraduate | 1,002 | 15.4% |
| Graduate / Professional | 152 | 2.3% |
| Total | 6,514 | 100.0% |
School Enrollment by Age by Funding Source in Cabot
Out of a total of 6,514 students who are enrolled in schools in Cabot, 482 (7.4%) attend a private institution, while the remaining 6,032 (92.6%) are enrolled in public schools. The age group of 3 to 4 year olds has the highest likelihood of being enrolled in private schools, with 61 (33.0% in the age bracket) enrolled. Conversely, the age group of 15 to 17 year olds has the lowest likelihood of being enrolled in a private school, with 1,505 (100.0% in the age bracket) attending a public institution.
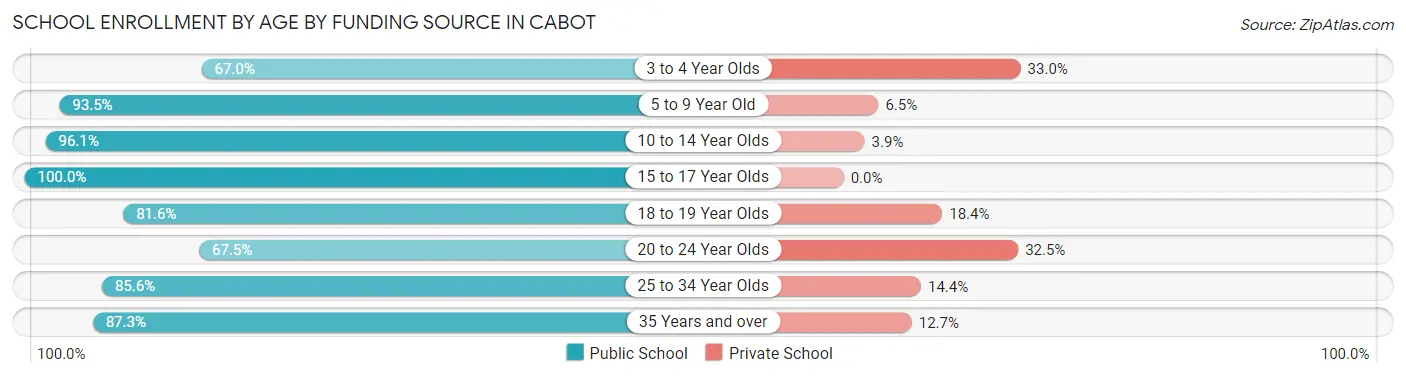
| Age Bracket | Public School | Private School |
| 3 to 4 Year Olds | 124 (67.0%) | 61 (33.0%) |
| 5 to 9 Year Old | 1,325 (93.5%) | 92 (6.5%) |
| 10 to 14 Year Olds | 2,014 (96.1%) | 82 (3.9%) |
| 15 to 17 Year Olds | 1,505 (100.0%) | 0 (0.0%) |
| 18 to 19 Year Olds | 280 (81.6%) | 63 (18.4%) |
| 20 to 24 Year Olds | 191 (67.5%) | 92 (32.5%) |
| 25 to 34 Year Olds | 303 (85.6%) | 51 (14.4%) |
| 35 Years and over | 289 (87.3%) | 42 (12.7%) |
| Total | 6,032 (92.6%) | 482 (7.4%) |
Educational Attainment by Field of Study in Cabot
Business (942 | 20.2%), science & technology (815 | 17.5%), education (787 | 16.9%), bio, nature & agricultural (454 | 9.7%), and arts & humanities (313 | 6.7%) are the most common fields of study among 4,659 individuals in Cabot who have obtained a bachelor's degree or higher.
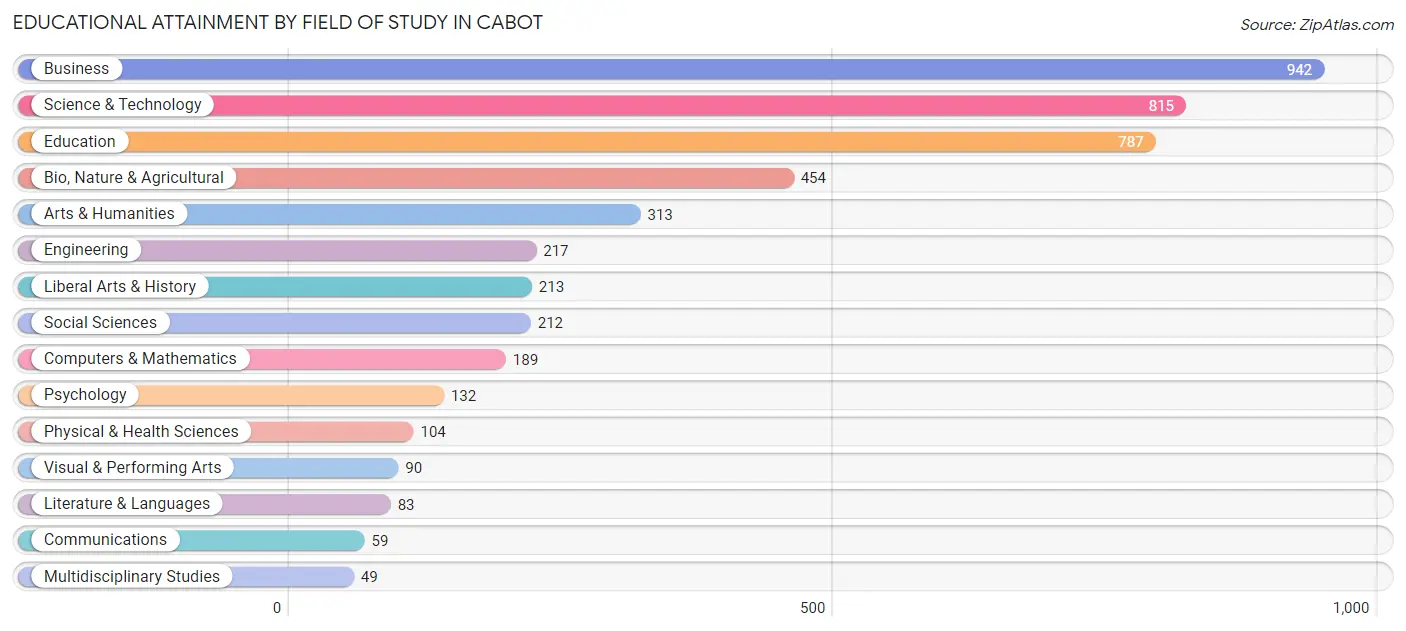
| Field of Study | # Graduates | % Graduates |
| Computers & Mathematics | 189 | 4.1% |
| Bio, Nature & Agricultural | 454 | 9.7% |
| Physical & Health Sciences | 104 | 2.2% |
| Psychology | 132 | 2.8% |
| Social Sciences | 212 | 4.5% |
| Engineering | 217 | 4.7% |
| Multidisciplinary Studies | 49 | 1.1% |
| Science & Technology | 815 | 17.5% |
| Business | 942 | 20.2% |
| Education | 787 | 16.9% |
| Literature & Languages | 83 | 1.8% |
| Liberal Arts & History | 213 | 4.6% |
| Visual & Performing Arts | 90 | 1.9% |
| Communications | 59 | 1.3% |
| Arts & Humanities | 313 | 6.7% |
| Total | 4,659 | 100.0% |
Transportation & Commute in Cabot
Vehicle Availability by Sex in Cabot
The most prevalent vehicle ownership categories in Cabot are males with 2 vehicles (2,634, accounting for 43.6%) and females with 2 vehicles (2,700, making up 40.0%).
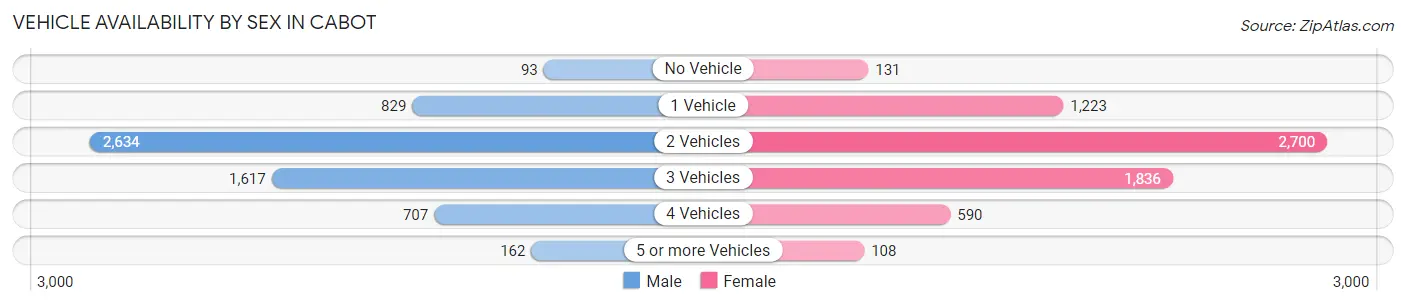
| Vehicles Available | Male | Female |
| No Vehicle | 93 (1.5%) | 131 (2.0%) |
| 1 Vehicle | 829 (13.7%) | 1,223 (18.6%) |
| 2 Vehicles | 2,634 (43.6%) | 2,700 (41.0%) |
| 3 Vehicles | 1,617 (26.8%) | 1,836 (27.9%) |
| 4 Vehicles | 707 (11.7%) | 590 (9.0%) |
| 5 or more Vehicles | 162 (2.7%) | 108 (1.6%) |
| Total | 6,042 (100.0%) | 6,588 (100.0%) |
Commute Time in Cabot
The most frequently occuring commute durations in Cabot are 30 to 34 minutes (2,242 commuters, 18.9%), 45 to 59 minutes (1,543 commuters, 13.0%), and 20 to 24 minutes (1,421 commuters, 12.0%).
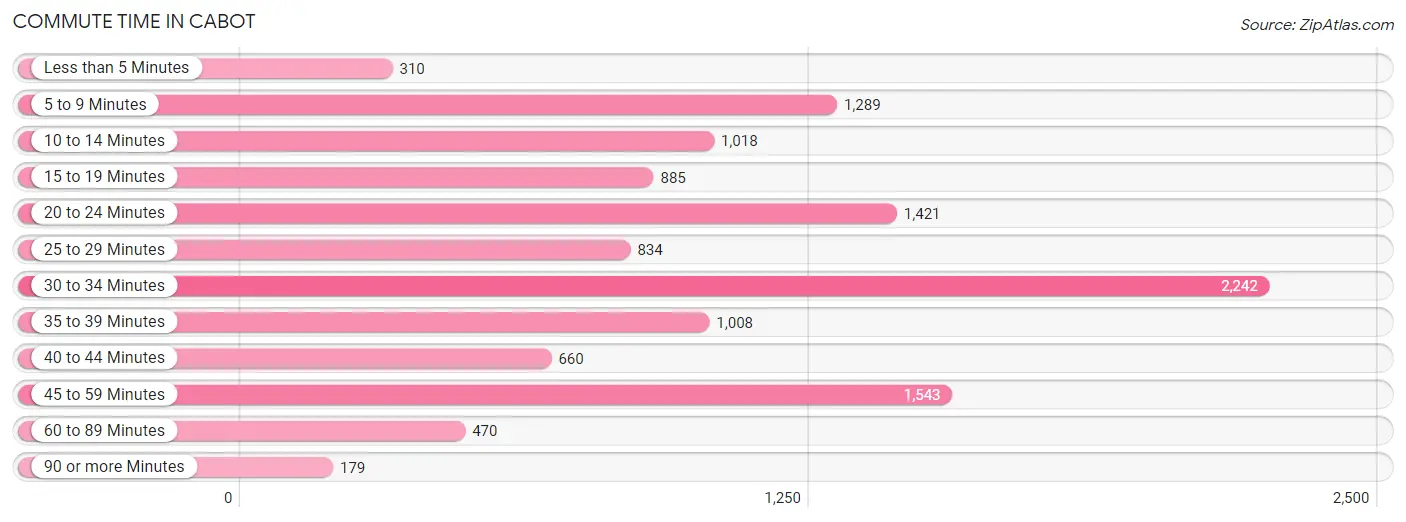
| Commute Time | # Commuters | % Commuters |
| Less than 5 Minutes | 310 | 2.6% |
| 5 to 9 Minutes | 1,289 | 10.9% |
| 10 to 14 Minutes | 1,018 | 8.6% |
| 15 to 19 Minutes | 885 | 7.5% |
| 20 to 24 Minutes | 1,421 | 12.0% |
| 25 to 29 Minutes | 834 | 7.0% |
| 30 to 34 Minutes | 2,242 | 18.9% |
| 35 to 39 Minutes | 1,008 | 8.5% |
| 40 to 44 Minutes | 660 | 5.6% |
| 45 to 59 Minutes | 1,543 | 13.0% |
| 60 to 89 Minutes | 470 | 4.0% |
| 90 or more Minutes | 179 | 1.5% |
Commute Time by Sex in Cabot
The most common commute times in Cabot are 30 to 34 minutes (1,053 commuters, 18.7%) for males and 30 to 34 minutes (1,189 commuters, 19.1%) for females.
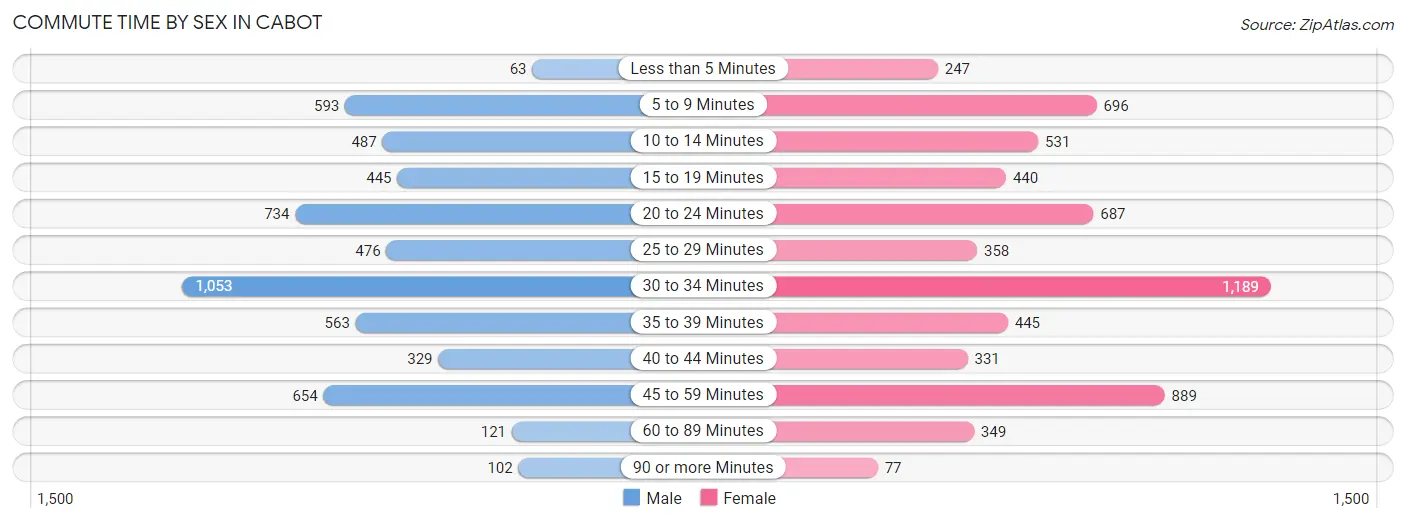
| Commute Time | Male | Female |
| Less than 5 Minutes | 63 (1.1%) | 247 (4.0%) |
| 5 to 9 Minutes | 593 (10.5%) | 696 (11.2%) |
| 10 to 14 Minutes | 487 (8.7%) | 531 (8.5%) |
| 15 to 19 Minutes | 445 (7.9%) | 440 (7.0%) |
| 20 to 24 Minutes | 734 (13.1%) | 687 (11.0%) |
| 25 to 29 Minutes | 476 (8.5%) | 358 (5.7%) |
| 30 to 34 Minutes | 1,053 (18.7%) | 1,189 (19.1%) |
| 35 to 39 Minutes | 563 (10.0%) | 445 (7.1%) |
| 40 to 44 Minutes | 329 (5.9%) | 331 (5.3%) |
| 45 to 59 Minutes | 654 (11.6%) | 889 (14.2%) |
| 60 to 89 Minutes | 121 (2.1%) | 349 (5.6%) |
| 90 or more Minutes | 102 (1.8%) | 77 (1.2%) |
Time of Departure to Work by Sex in Cabot
The most frequent times of departure to work in Cabot are 6:00 AM to 6:29 AM (994, 17.7%) for males and 7:00 AM to 7:29 AM (1,221, 19.6%) for females.
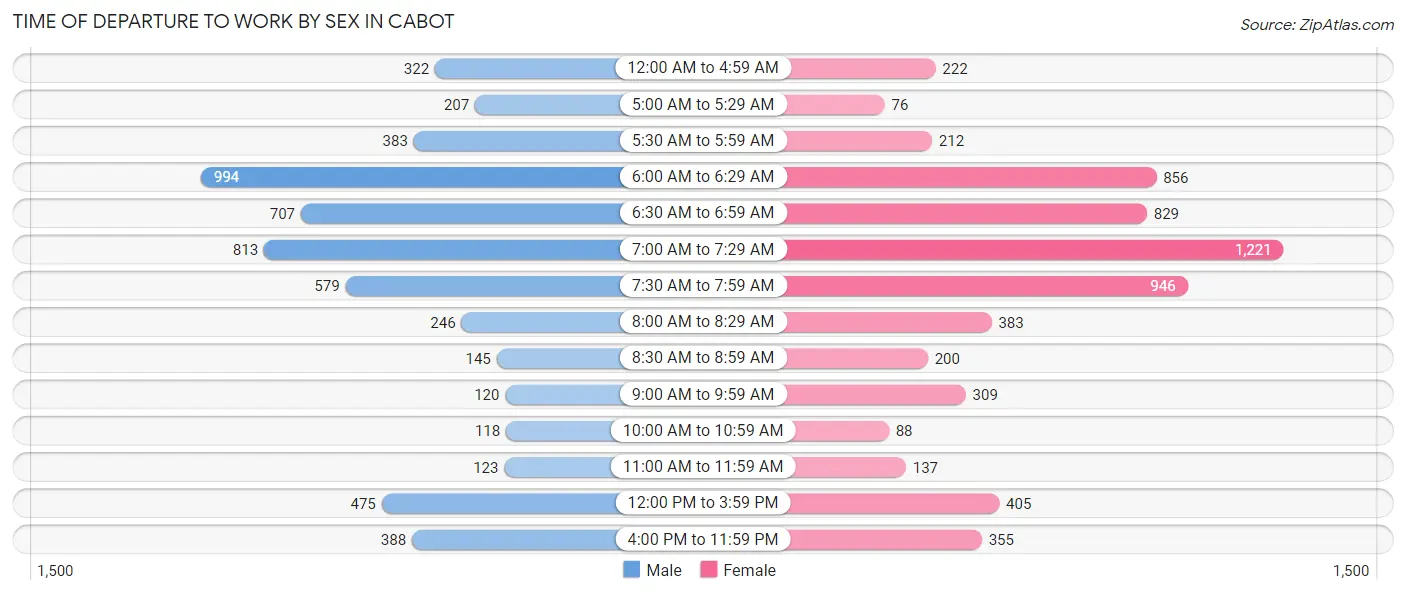
| Time of Departure | Male | Female |
| 12:00 AM to 4:59 AM | 322 (5.7%) | 222 (3.6%) |
| 5:00 AM to 5:29 AM | 207 (3.7%) | 76 (1.2%) |
| 5:30 AM to 5:59 AM | 383 (6.8%) | 212 (3.4%) |
| 6:00 AM to 6:29 AM | 994 (17.7%) | 856 (13.7%) |
| 6:30 AM to 6:59 AM | 707 (12.6%) | 829 (13.3%) |
| 7:00 AM to 7:29 AM | 813 (14.5%) | 1,221 (19.6%) |
| 7:30 AM to 7:59 AM | 579 (10.3%) | 946 (15.2%) |
| 8:00 AM to 8:29 AM | 246 (4.4%) | 383 (6.1%) |
| 8:30 AM to 8:59 AM | 145 (2.6%) | 200 (3.2%) |
| 9:00 AM to 9:59 AM | 120 (2.1%) | 309 (5.0%) |
| 10:00 AM to 10:59 AM | 118 (2.1%) | 88 (1.4%) |
| 11:00 AM to 11:59 AM | 123 (2.2%) | 137 (2.2%) |
| 12:00 PM to 3:59 PM | 475 (8.5%) | 405 (6.5%) |
| 4:00 PM to 11:59 PM | 388 (6.9%) | 355 (5.7%) |
| Total | 5,620 (100.0%) | 6,239 (100.0%) |
Housing Occupancy in Cabot
Occupancy by Ownership in Cabot
Of the total 10,064 dwellings in Cabot, owner-occupied units account for 6,683 (66.4%), while renter-occupied units make up 3,381 (33.6%).
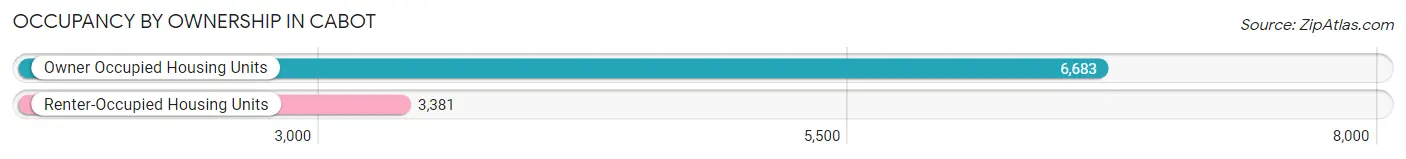
| Occupancy | # Housing Units | % Housing Units |
| Owner Occupied Housing Units | 6,683 | 66.4% |
| Renter-Occupied Housing Units | 3,381 | 33.6% |
| Total Occupied Housing Units | 10,064 | 100.0% |
Occupancy by Household Size in Cabot
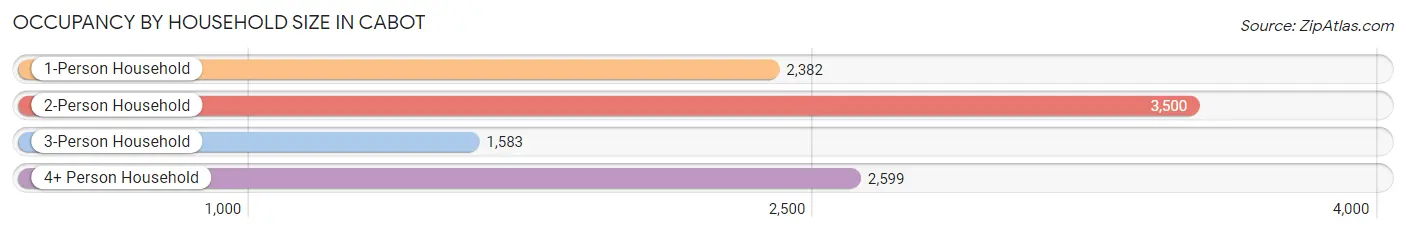
| Household Size | # Housing Units | % Housing Units |
| 1-Person Household | 2,382 | 23.7% |
| 2-Person Household | 3,500 | 34.8% |
| 3-Person Household | 1,583 | 15.7% |
| 4+ Person Household | 2,599 | 25.8% |
| Total Housing Units | 10,064 | 100.0% |
Occupancy by Ownership by Household Size in Cabot
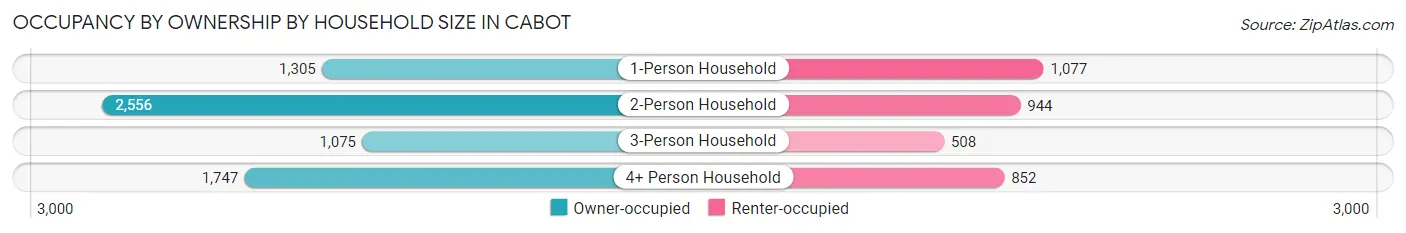
| Household Size | Owner-occupied | Renter-occupied |
| 1-Person Household | 1,305 (54.8%) | 1,077 (45.2%) |
| 2-Person Household | 2,556 (73.0%) | 944 (27.0%) |
| 3-Person Household | 1,075 (67.9%) | 508 (32.1%) |
| 4+ Person Household | 1,747 (67.2%) | 852 (32.8%) |
| Total Housing Units | 6,683 (66.4%) | 3,381 (33.6%) |
Occupancy by Educational Attainment in Cabot
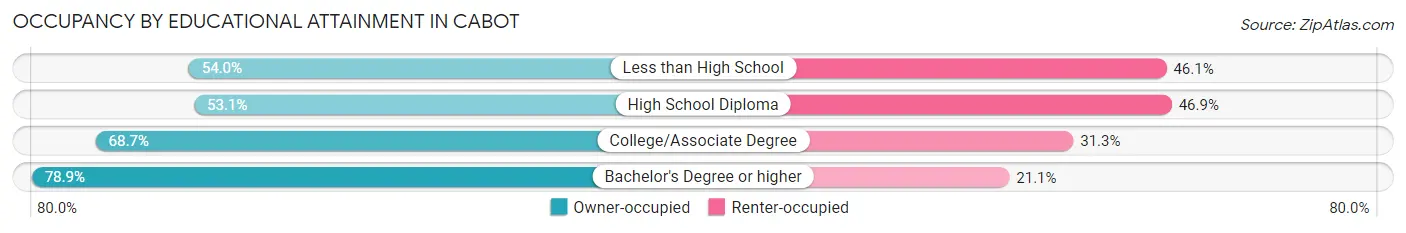
| Household Size | Owner-occupied | Renter-occupied |
| Less than High School | 246 (53.9%) | 210 (46.1%) |
| High School Diploma | 1,542 (53.1%) | 1,361 (46.9%) |
| College/Associate Degree | 2,666 (68.7%) | 1,213 (31.3%) |
| Bachelor's Degree or higher | 2,229 (78.9%) | 597 (21.1%) |
Occupancy by Age of Householder in Cabot
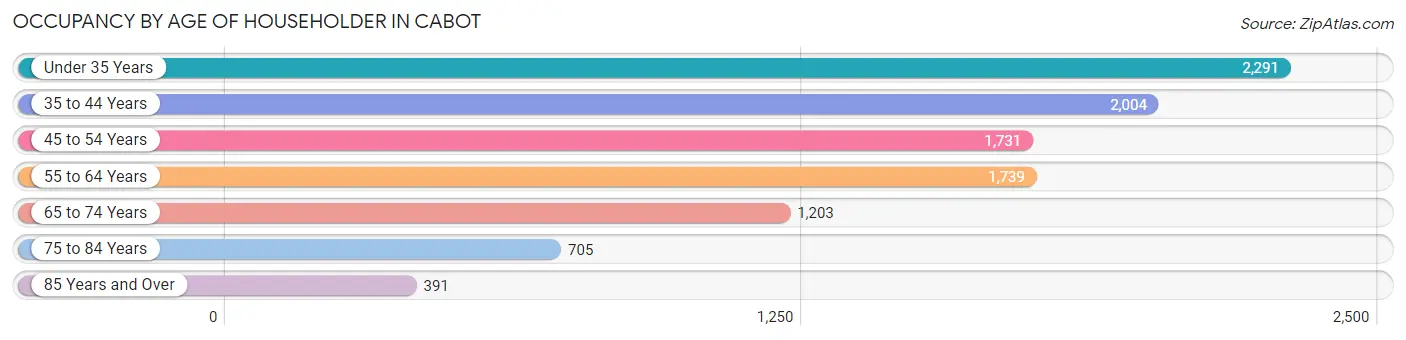
| Age Bracket | # Households | % Households |
| Under 35 Years | 2,291 | 22.8% |
| 35 to 44 Years | 2,004 | 19.9% |
| 45 to 54 Years | 1,731 | 17.2% |
| 55 to 64 Years | 1,739 | 17.3% |
| 65 to 74 Years | 1,203 | 11.9% |
| 75 to 84 Years | 705 | 7.0% |
| 85 Years and Over | 391 | 3.9% |
| Total | 10,064 | 100.0% |
Housing Finances in Cabot
Median Income by Occupancy in Cabot
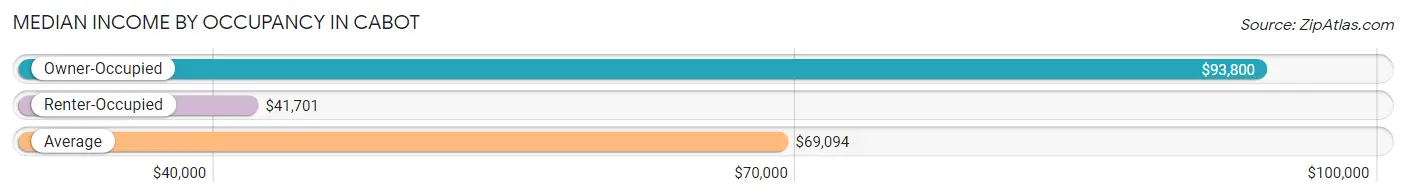
| Occupancy Type | # Households | Median Income |
| Owner-Occupied | 6,683 (66.4%) | $93,800 |
| Renter-Occupied | 3,381 (33.6%) | $41,701 |
| Average | 10,064 (100.0%) | $69,094 |
Occupancy by Householder Income Bracket in Cabot
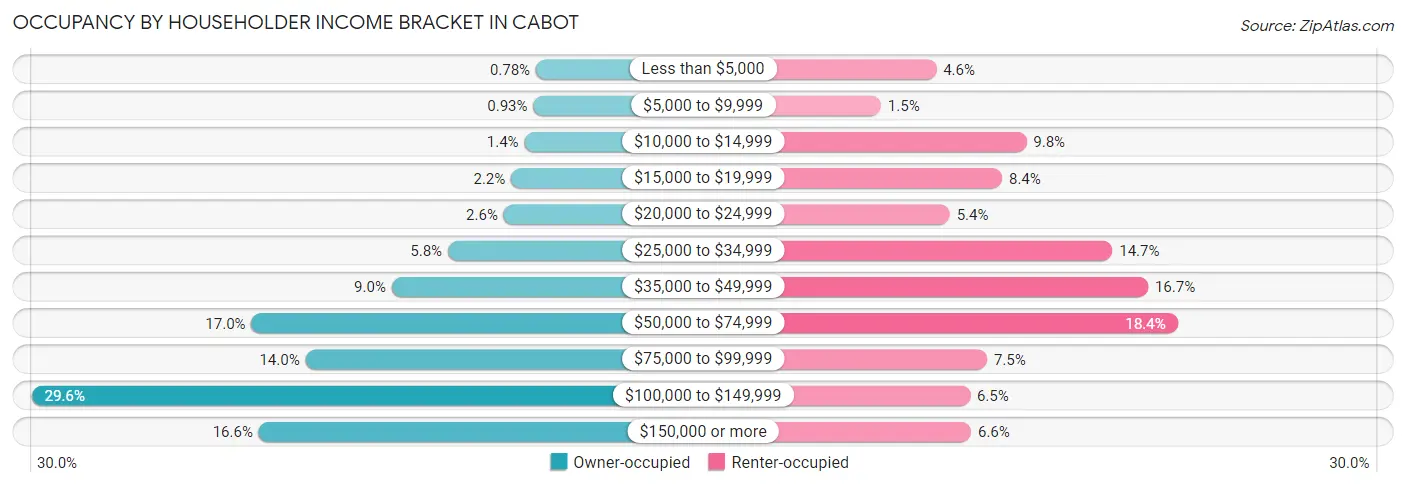
| Income Bracket | Owner-occupied | Renter-occupied |
| Less than $5,000 | 52 (0.8%) | 156 (4.6%) |
| $5,000 to $9,999 | 62 (0.9%) | 49 (1.5%) |
| $10,000 to $14,999 | 96 (1.4%) | 330 (9.8%) |
| $15,000 to $19,999 | 147 (2.2%) | 283 (8.4%) |
| $20,000 to $24,999 | 175 (2.6%) | 182 (5.4%) |
| $25,000 to $34,999 | 388 (5.8%) | 496 (14.7%) |
| $35,000 to $49,999 | 603 (9.0%) | 565 (16.7%) |
| $50,000 to $74,999 | 1,139 (17.0%) | 622 (18.4%) |
| $75,000 to $99,999 | 932 (14.0%) | 254 (7.5%) |
| $100,000 to $149,999 | 1,978 (29.6%) | 221 (6.5%) |
| $150,000 or more | 1,111 (16.6%) | 223 (6.6%) |
| Total | 6,683 (100.0%) | 3,381 (100.0%) |
Monthly Housing Cost Tiers in Cabot
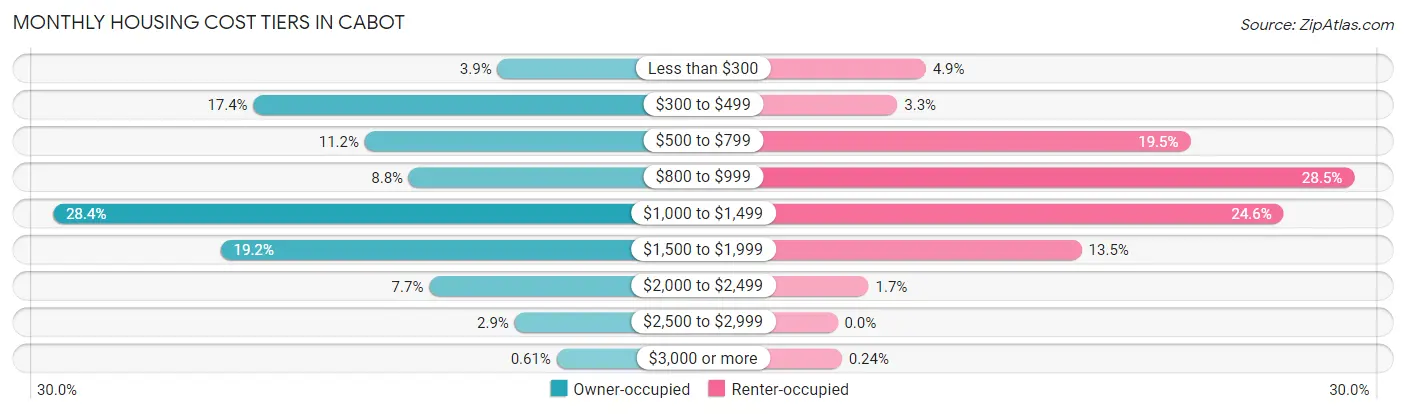
| Monthly Cost | Owner-occupied | Renter-occupied |
| Less than $300 | 259 (3.9%) | 165 (4.9%) |
| $300 to $499 | 1,160 (17.4%) | 112 (3.3%) |
| $500 to $799 | 749 (11.2%) | 659 (19.5%) |
| $800 to $999 | 586 (8.8%) | 965 (28.5%) |
| $1,000 to $1,499 | 1,900 (28.4%) | 833 (24.6%) |
| $1,500 to $1,999 | 1,281 (19.2%) | 456 (13.5%) |
| $2,000 to $2,499 | 511 (7.6%) | 58 (1.7%) |
| $2,500 to $2,999 | 196 (2.9%) | 0 (0.0%) |
| $3,000 or more | 41 (0.6%) | 8 (0.2%) |
| Total | 6,683 (100.0%) | 3,381 (100.0%) |
Physical Housing Characteristics in Cabot
Housing Structures in Cabot
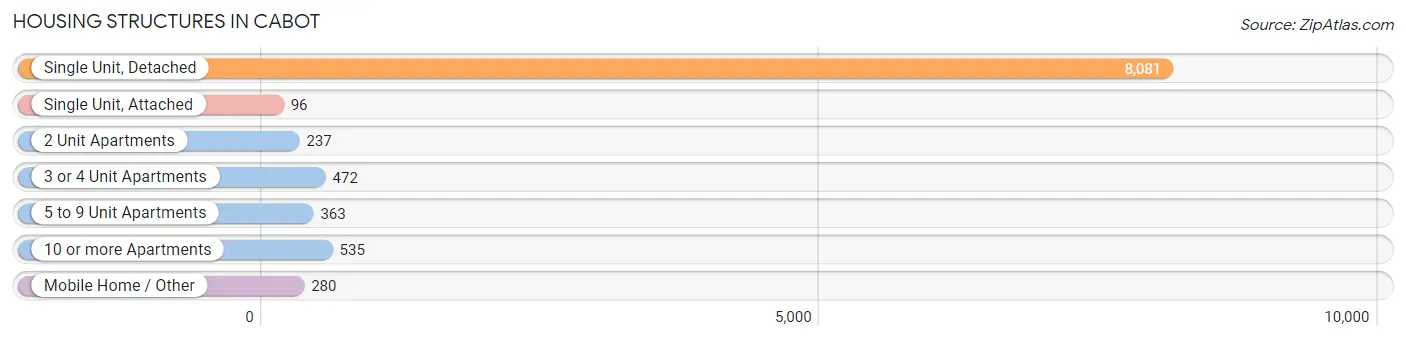
| Structure Type | # Housing Units | % Housing Units |
| Single Unit, Detached | 8,081 | 80.3% |
| Single Unit, Attached | 96 | 0.9% |
| 2 Unit Apartments | 237 | 2.4% |
| 3 or 4 Unit Apartments | 472 | 4.7% |
| 5 to 9 Unit Apartments | 363 | 3.6% |
| 10 or more Apartments | 535 | 5.3% |
| Mobile Home / Other | 280 | 2.8% |
| Total | 10,064 | 100.0% |
Housing Structures by Occupancy in Cabot
| Structure Type | Owner-occupied | Renter-occupied |
| Single Unit, Detached | 6,484 (80.2%) | 1,597 (19.8%) |
| Single Unit, Attached | 18 (18.8%) | 78 (81.2%) |
| 2 Unit Apartments | 0 (0.0%) | 237 (100.0%) |
| 3 or 4 Unit Apartments | 0 (0.0%) | 472 (100.0%) |
| 5 to 9 Unit Apartments | 0 (0.0%) | 363 (100.0%) |
| 10 or more Apartments | 0 (0.0%) | 535 (100.0%) |
| Mobile Home / Other | 181 (64.6%) | 99 (35.4%) |
| Total | 6,683 (66.4%) | 3,381 (33.6%) |
Housing Structures by Number of Rooms in Cabot
| Number of Rooms | Owner-occupied | Renter-occupied |
| 1 Room | 0 (0.0%) | 66 (1.9%) |
| 2 or 3 Rooms | 41 (0.6%) | 394 (11.7%) |
| 4 or 5 Rooms | 2,202 (33.0%) | 1,674 (49.5%) |
| 6 or 7 Rooms | 3,072 (46.0%) | 996 (29.5%) |
| 8 or more Rooms | 1,368 (20.5%) | 251 (7.4%) |
| Total | 6,683 (100.0%) | 3,381 (100.0%) |
Housing Structure by Heating Type in Cabot
| Heating Type | Owner-occupied | Renter-occupied |
| Utility Gas | 3,286 (49.2%) | 716 (21.2%) |
| Bottled, Tank, or LP Gas | 13 (0.2%) | 36 (1.1%) |
| Electricity | 3,336 (49.9%) | 2,629 (77.8%) |
| Fuel Oil or Kerosene | 0 (0.0%) | 0 (0.0%) |
| Coal or Coke | 0 (0.0%) | 0 (0.0%) |
| All other Fuels | 48 (0.7%) | 0 (0.0%) |
| No Fuel Used | 0 (0.0%) | 0 (0.0%) |
| Total | 6,683 (100.0%) | 3,381 (100.0%) |
Household Vehicle Usage in Cabot
| Vehicles per Household | Owner-occupied | Renter-occupied |
| No Vehicle | 44 (0.7%) | 445 (13.2%) |
| 1 Vehicle | 1,580 (23.6%) | 1,433 (42.4%) |
| 2 Vehicles | 2,795 (41.8%) | 1,015 (30.0%) |
| 3 or more Vehicles | 2,264 (33.9%) | 488 (14.4%) |
| Total | 6,683 (100.0%) | 3,381 (100.0%) |
Real Estate & Mortgages in Cabot
Real Estate and Mortgage Overview in Cabot
| Characteristic | Without Mortgage | With Mortgage |
| Housing Units | 1,997 | 4,686 |
| Median Property Value | $163,500 | $201,200 |
| Median Household Income | $56,750 | $864 |
| Monthly Housing Costs | $411 | $41 |
| Real Estate Taxes | $1,081 | $235 |
Property Value by Mortgage Status in Cabot
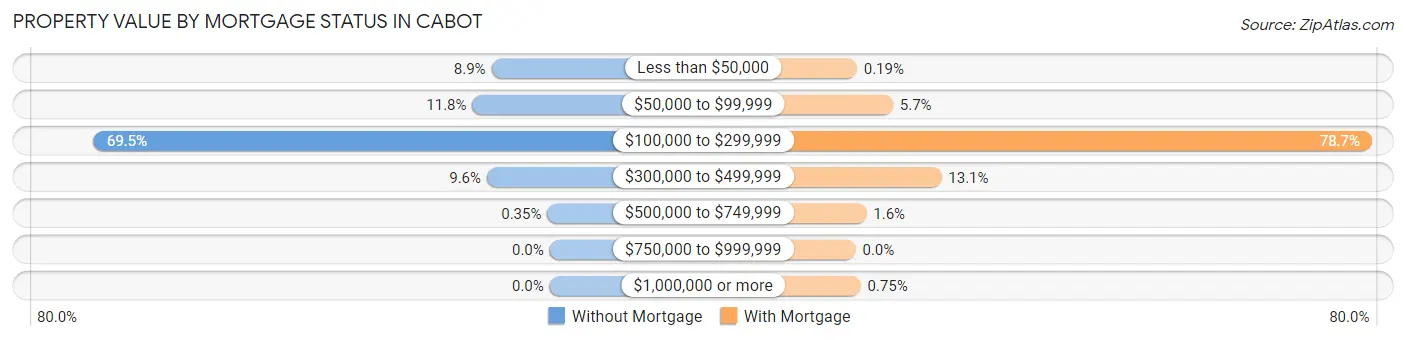
| Property Value | Without Mortgage | With Mortgage |
| Less than $50,000 | 177 (8.9%) | 9 (0.2%) |
| $50,000 to $99,999 | 235 (11.8%) | 266 (5.7%) |
| $100,000 to $299,999 | 1,387 (69.5%) | 3,686 (78.7%) |
| $300,000 to $499,999 | 191 (9.6%) | 613 (13.1%) |
| $500,000 to $749,999 | 7 (0.4%) | 77 (1.6%) |
| $750,000 to $999,999 | 0 (0.0%) | 0 (0.0%) |
| $1,000,000 or more | 0 (0.0%) | 35 (0.7%) |
| Total | 1,997 (100.0%) | 4,686 (100.0%) |
Household Income by Mortgage Status in Cabot
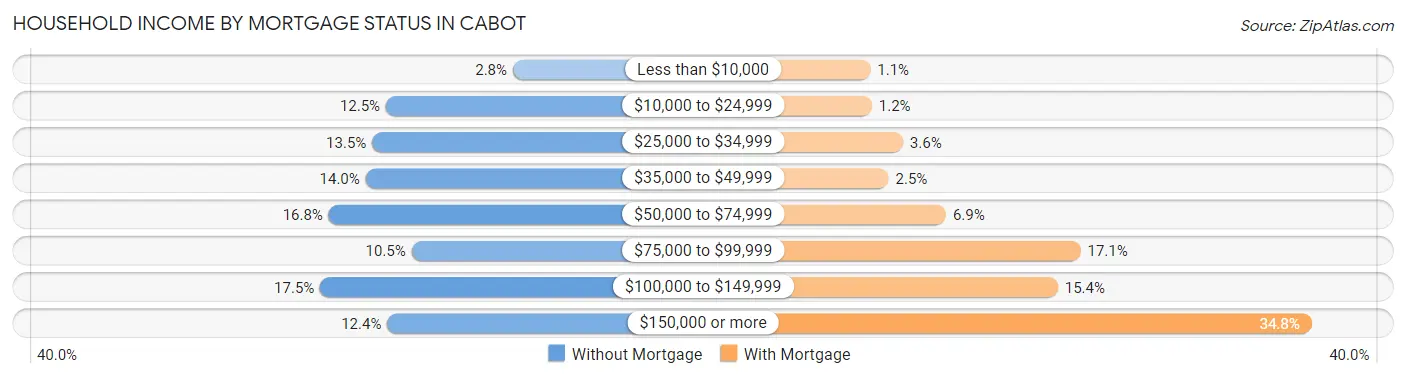
| Household Income | Without Mortgage | With Mortgage |
| Less than $10,000 | 56 (2.8%) | 53 (1.1%) |
| $10,000 to $24,999 | 249 (12.5%) | 58 (1.2%) |
| $25,000 to $34,999 | 270 (13.5%) | 169 (3.6%) |
| $35,000 to $49,999 | 280 (14.0%) | 118 (2.5%) |
| $50,000 to $74,999 | 336 (16.8%) | 323 (6.9%) |
| $75,000 to $99,999 | 210 (10.5%) | 803 (17.1%) |
| $100,000 to $149,999 | 349 (17.5%) | 722 (15.4%) |
| $150,000 or more | 247 (12.4%) | 1,629 (34.8%) |
| Total | 1,997 (100.0%) | 4,686 (100.0%) |
Property Value to Household Income Ratio in Cabot
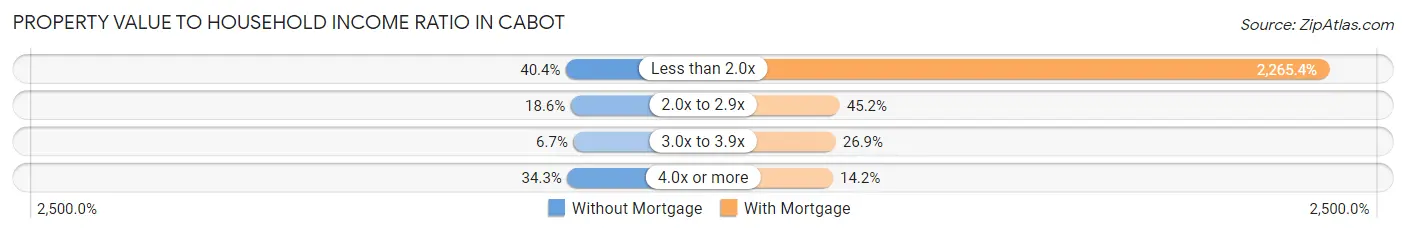
| Value-to-Income Ratio | Without Mortgage | With Mortgage |
| Less than 2.0x | 807 (40.4%) | 106,158 (2,265.4%) |
| 2.0x to 2.9x | 371 (18.6%) | 2,116 (45.2%) |
| 3.0x to 3.9x | 134 (6.7%) | 1,260 (26.9%) |
| 4.0x or more | 685 (34.3%) | 666 (14.2%) |
| Total | 1,997 (100.0%) | 4,686 (100.0%) |
Real Estate Taxes by Mortgage Status in Cabot
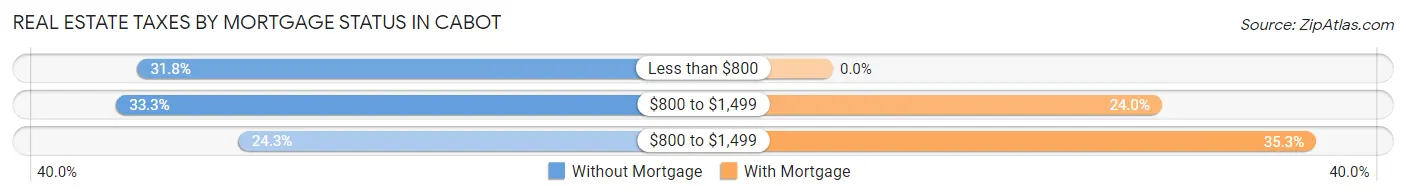
| Property Taxes | Without Mortgage | With Mortgage |
| Less than $800 | 634 (31.8%) | 0 (0.0%) |
| $800 to $1,499 | 665 (33.3%) | 1,125 (24.0%) |
| $800 to $1,499 | 486 (24.3%) | 1,653 (35.3%) |
| Total | 1,997 (100.0%) | 4,686 (100.0%) |
Health & Disability in Cabot
Health Insurance Coverage by Age in Cabot
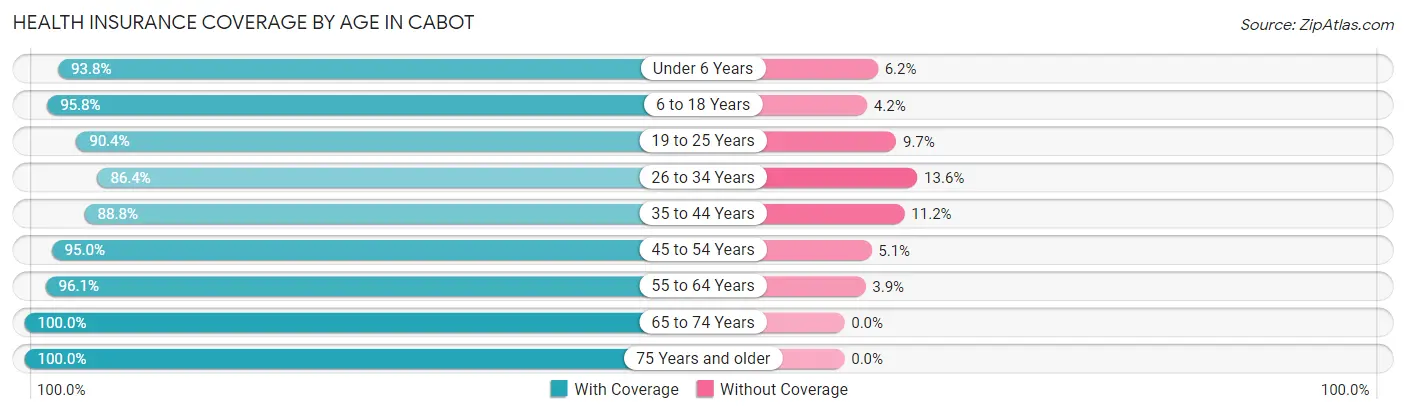
| Age Bracket | With Coverage | Without Coverage |
| Under 6 Years | 2,017 (93.8%) | 134 (6.2%) |
| 6 to 18 Years | 5,013 (95.8%) | 221 (4.2%) |
| 19 to 25 Years | 2,088 (90.3%) | 223 (9.7%) |
| 26 to 34 Years | 2,677 (86.4%) | 421 (13.6%) |
| 35 to 44 Years | 3,128 (88.8%) | 395 (11.2%) |
| 45 to 54 Years | 3,047 (95.0%) | 162 (5.1%) |
| 55 to 64 Years | 2,784 (96.1%) | 114 (3.9%) |
| 65 to 74 Years | 1,956 (100.0%) | 0 (0.0%) |
| 75 Years and older | 1,487 (100.0%) | 0 (0.0%) |
| Total | 24,197 (93.5%) | 1,670 (6.5%) |
Health Insurance Coverage by Citizenship Status in Cabot
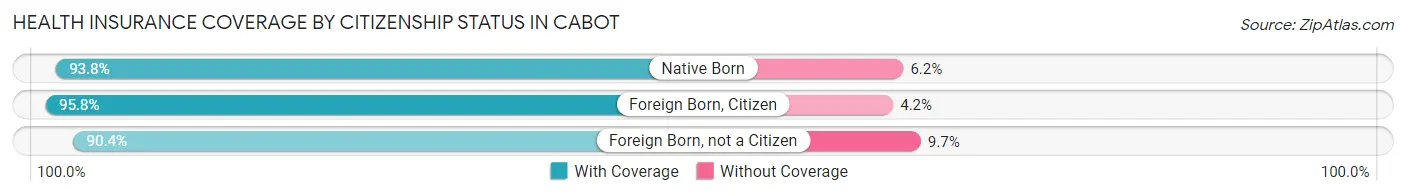
| Citizenship Status | With Coverage | Without Coverage |
| Native Born | 2,017 (93.8%) | 134 (6.2%) |
| Foreign Born, Citizen | 5,013 (95.8%) | 221 (4.2%) |
| Foreign Born, not a Citizen | 2,088 (90.3%) | 223 (9.7%) |
Health Insurance Coverage by Household Income in Cabot
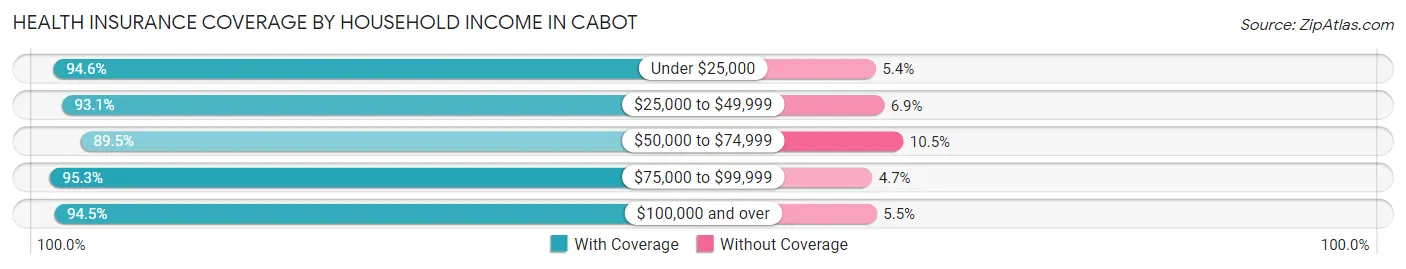
| Household Income | With Coverage | Without Coverage |
| Under $25,000 | 2,768 (94.6%) | 157 (5.4%) |
| $25,000 to $49,999 | 4,163 (93.1%) | 309 (6.9%) |
| $50,000 to $74,999 | 3,825 (89.5%) | 449 (10.5%) |
| $75,000 to $99,999 | 3,151 (95.3%) | 155 (4.7%) |
| $100,000 and over | 10,257 (94.5%) | 600 (5.5%) |
Public vs Private Health Insurance Coverage by Age in Cabot
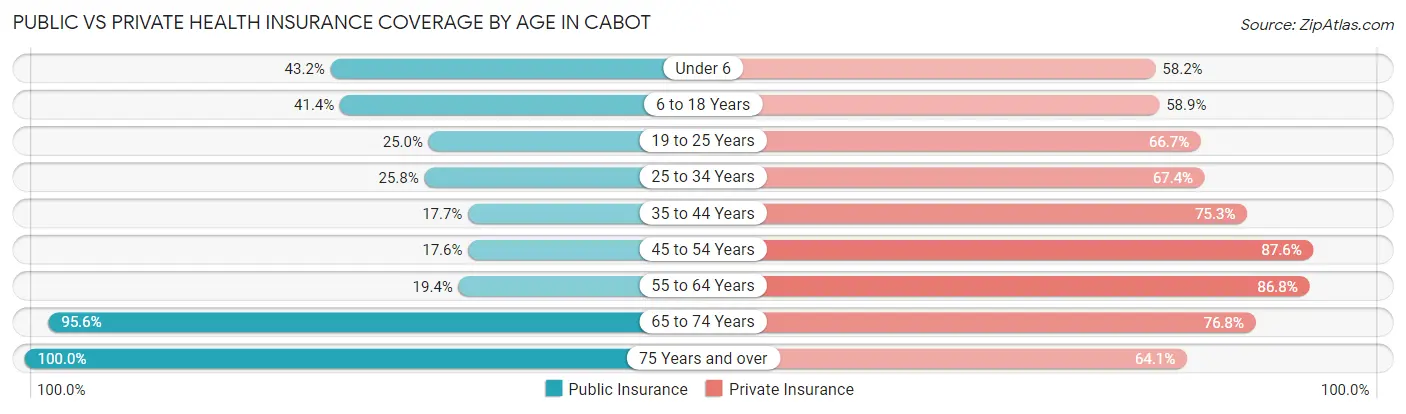
| Age Bracket | Public Insurance | Private Insurance |
| Under 6 | 929 (43.2%) | 1,252 (58.2%) |
| 6 to 18 Years | 2,169 (41.4%) | 3,084 (58.9%) |
| 19 to 25 Years | 577 (25.0%) | 1,541 (66.7%) |
| 25 to 34 Years | 798 (25.8%) | 2,088 (67.4%) |
| 35 to 44 Years | 622 (17.7%) | 2,651 (75.2%) |
| 45 to 54 Years | 566 (17.6%) | 2,810 (87.6%) |
| 55 to 64 Years | 563 (19.4%) | 2,516 (86.8%) |
| 65 to 74 Years | 1,870 (95.6%) | 1,503 (76.8%) |
| 75 Years and over | 1,487 (100.0%) | 953 (64.1%) |
| Total | 9,581 (37.0%) | 18,398 (71.1%) |
Disability Status by Sex by Age in Cabot
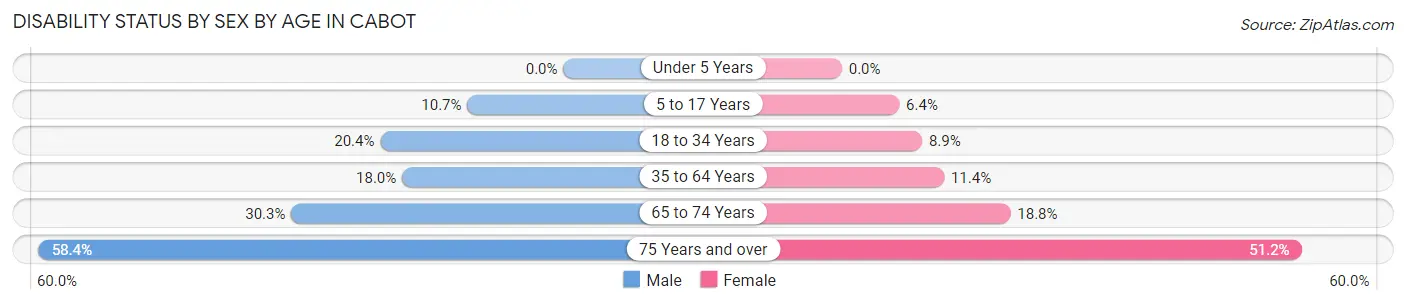
| Age Bracket | Male | Female |
| Under 5 Years | 0 (0.0%) | 0 (0.0%) |
| 5 to 17 Years | 322 (10.7%) | 144 (6.4%) |
| 18 to 34 Years | 582 (20.4%) | 254 (8.9%) |
| 35 to 64 Years | 779 (18.0%) | 602 (11.4%) |
| 65 to 74 Years | 286 (30.3%) | 190 (18.8%) |
| 75 Years and over | 347 (58.4%) | 457 (51.2%) |
Disability Class by Sex by Age in Cabot
Disability Class: Hearing Difficulty
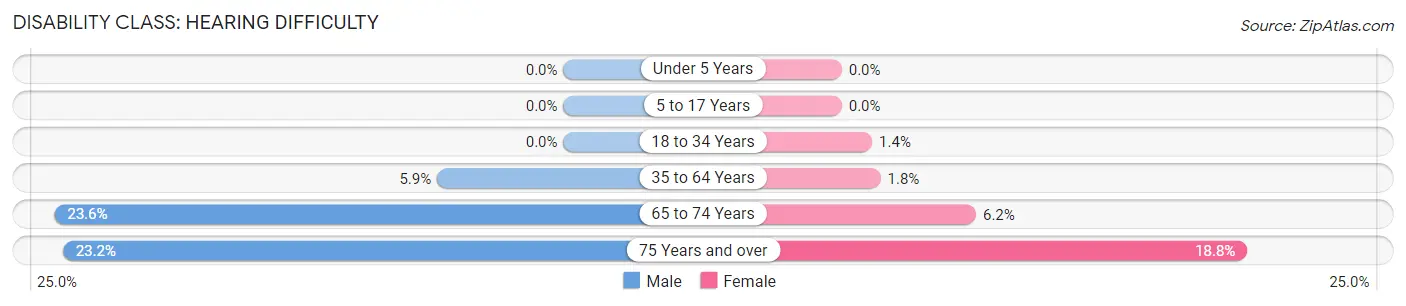
| Age Bracket | Male | Female |
| Under 5 Years | 0 (0.0%) | 0 (0.0%) |
| 5 to 17 Years | 0 (0.0%) | 0 (0.0%) |
| 18 to 34 Years | 0 (0.0%) | 40 (1.4%) |
| 35 to 64 Years | 254 (5.9%) | 95 (1.8%) |
| 65 to 74 Years | 223 (23.6%) | 63 (6.2%) |
| 75 Years and over | 138 (23.2%) | 168 (18.8%) |
Disability Class: Vision Difficulty
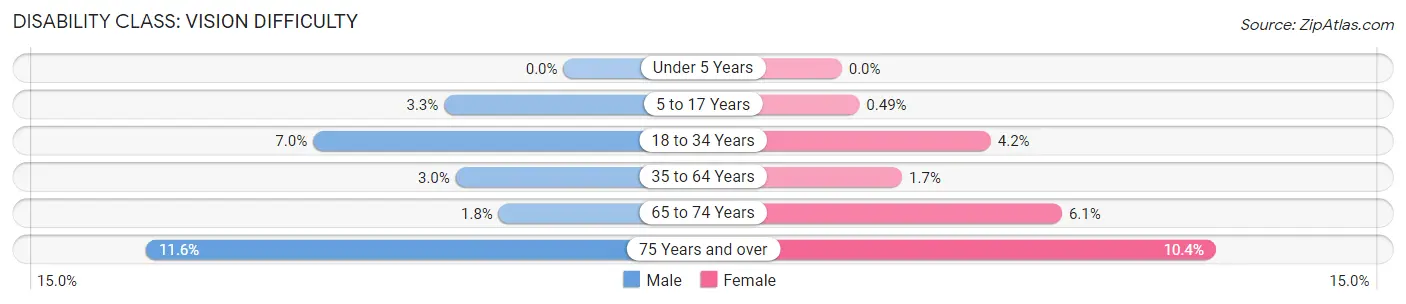
| Age Bracket | Male | Female |
| Under 5 Years | 0 (0.0%) | 0 (0.0%) |
| 5 to 17 Years | 100 (3.3%) | 11 (0.5%) |
| 18 to 34 Years | 199 (7.0%) | 118 (4.2%) |
| 35 to 64 Years | 130 (3.0%) | 89 (1.7%) |
| 65 to 74 Years | 17 (1.8%) | 62 (6.1%) |
| 75 Years and over | 69 (11.6%) | 93 (10.4%) |
Disability Class: Cognitive Difficulty
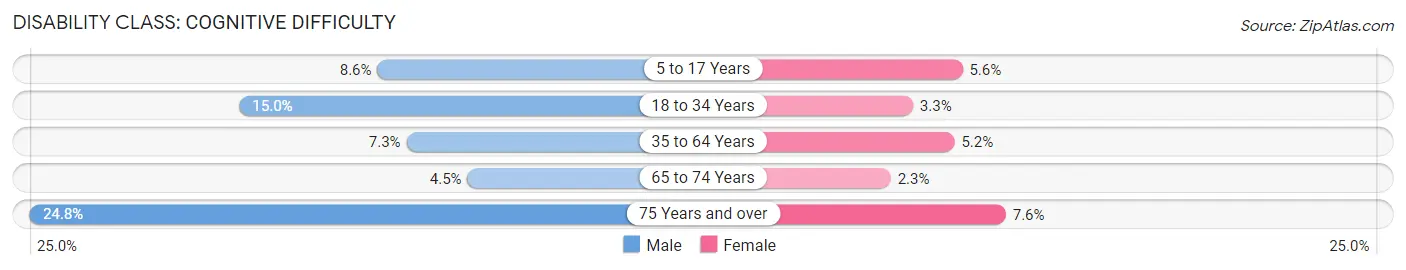
| Age Bracket | Male | Female |
| 5 to 17 Years | 260 (8.6%) | 126 (5.6%) |
| 18 to 34 Years | 429 (15.0%) | 94 (3.3%) |
| 35 to 64 Years | 316 (7.3%) | 277 (5.2%) |
| 65 to 74 Years | 42 (4.4%) | 23 (2.3%) |
| 75 Years and over | 147 (24.7%) | 68 (7.6%) |
Disability Class: Ambulatory Difficulty
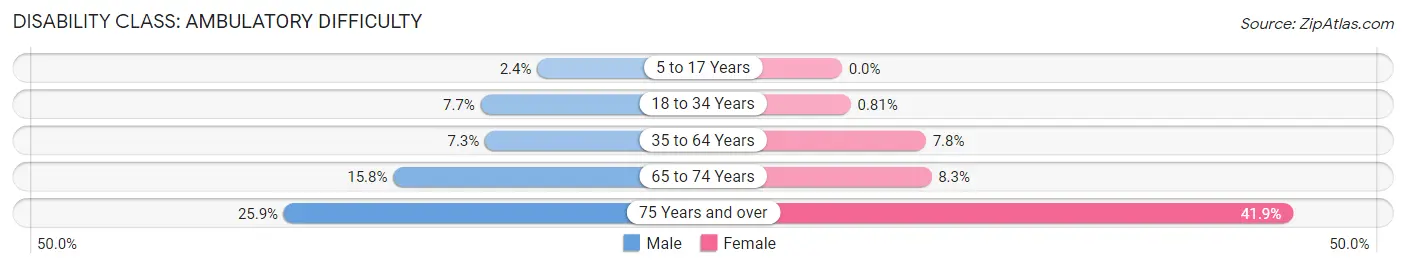
| Age Bracket | Male | Female |
| 5 to 17 Years | 73 (2.4%) | 0 (0.0%) |
| 18 to 34 Years | 219 (7.7%) | 23 (0.8%) |
| 35 to 64 Years | 315 (7.3%) | 412 (7.8%) |
| 65 to 74 Years | 149 (15.8%) | 84 (8.3%) |
| 75 Years and over | 154 (25.9%) | 374 (41.9%) |
Disability Class: Self-Care Difficulty
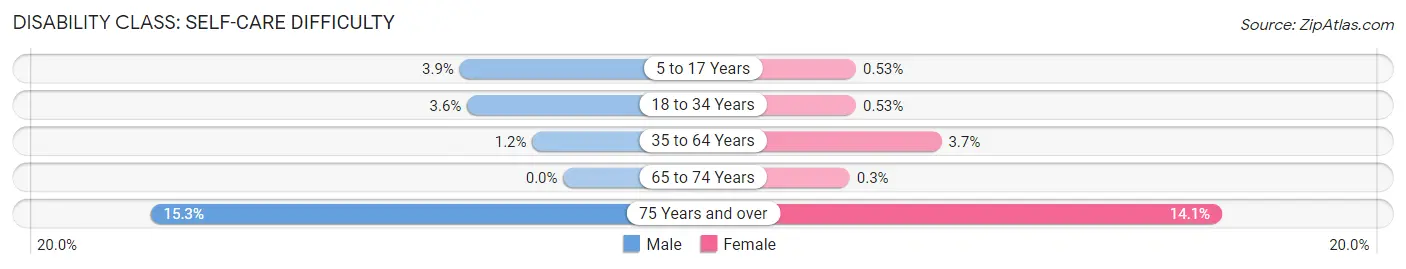
| Age Bracket | Male | Female |
| 5 to 17 Years | 116 (3.8%) | 12 (0.5%) |
| 18 to 34 Years | 102 (3.6%) | 15 (0.5%) |
| 35 to 64 Years | 50 (1.1%) | 196 (3.7%) |
| 65 to 74 Years | 0 (0.0%) | 3 (0.3%) |
| 75 Years and over | 91 (15.3%) | 126 (14.1%) |
Technology Access in Cabot
Computing Device Access in Cabot
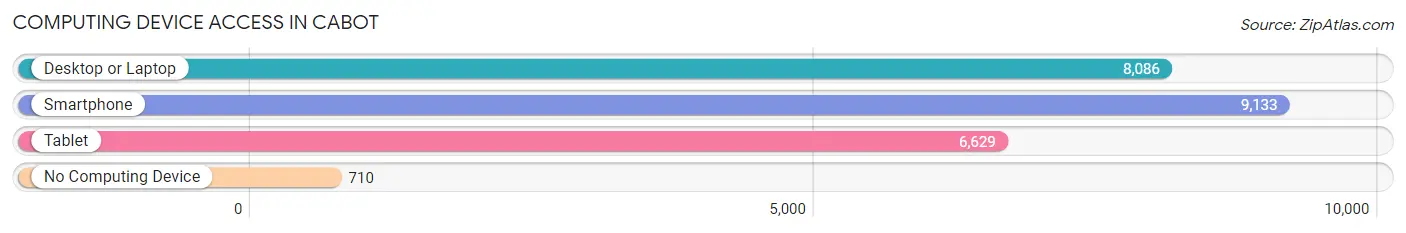
| Device Type | # Households | % Households |
| Desktop or Laptop | 8,086 | 80.3% |
| Smartphone | 9,133 | 90.7% |
| Tablet | 6,629 | 65.9% |
| No Computing Device | 710 | 7.0% |
| Total | 10,064 | 100.0% |
Internet Access in Cabot
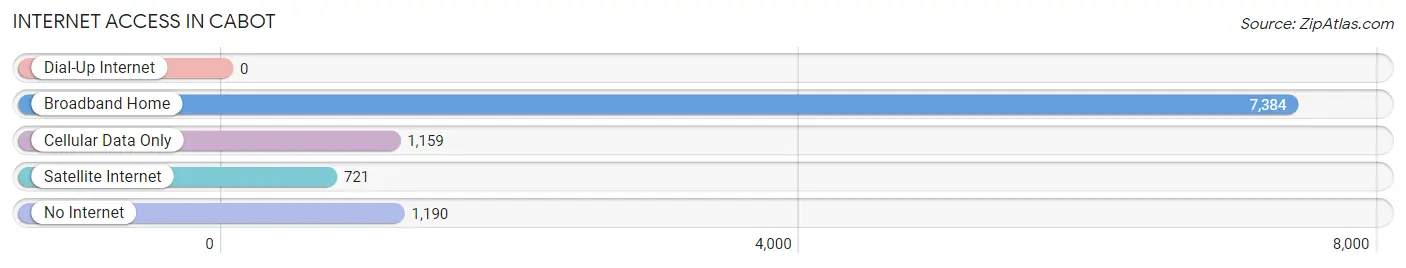
| Internet Type | # Households | % Households |
| Dial-Up Internet | 0 | 0.0% |
| Broadband Home | 7,384 | 73.4% |
| Cellular Data Only | 1,159 | 11.5% |
| Satellite Internet | 721 | 7.2% |
| No Internet | 1,190 | 11.8% |
| Total | 10,064 | 100.0% |
Cabot Summary
Cabot, Arkansas is a city located in Lonoke County, Arkansas. It is situated approximately 25 miles northeast of Little Rock, the state capital. The city is part of the Little Rock-North Little Rock-Conway Metropolitan Statistical Area. As of the 2010 census, the population of Cabot was 23,776, making it the largest city in Lonoke County.
History
The area that is now Cabot was first settled in the early 1800s by a group of settlers from Kentucky. The settlement was originally known as "Greasy Corner" due to the abundance of wild hogs in the area. In 1873, the town was renamed Cabot in honor of Arkansas Governor Elisha Baxter.
The city was officially incorporated in 1891 and was home to a variety of businesses, including a cotton gin, a grist mill, and a sawmill. The city also had a railroad station, which connected it to other towns in the area.
In the early 1900s, Cabot experienced a period of growth and development. The city was home to a variety of businesses, including a bank, a hotel, a newspaper, and a movie theater. The city also had a public school system, which was established in 1910.
Geography
Cabot is located in Lonoke County in central Arkansas. The city is situated at the intersection of Interstate 40 and U.S. Route 67. The city is located approximately 25 miles northeast of Little Rock, the state capital.
The city has a total area of 24.2 square miles, of which 24.1 square miles is land and 0.1 square miles is water. The city is located in the Arkansas Delta region and is characterized by flat terrain and fertile soil.
Economy
Cabot is home to a variety of businesses and industries. The city is home to a number of manufacturing companies, including Cabot Corporation, which produces carbon black, a key ingredient in rubber and plastic products. The city is also home to a number of retail stores, restaurants, and other businesses.
The city is also home to a number of healthcare facilities, including a hospital and several medical clinics. The city is also home to a number of educational institutions, including a community college and a vocational school.
Demographics
As of the 2010 census, the population of Cabot was 23,776. The racial makeup of the city was 87.3% White, 8.2% African American, 0.7% Native American, 0.7% Asian, 0.1% Pacific Islander, 1.2% from other races, and 2.0% from two or more races. Hispanic or Latino of any race were 3.3% of the population.
The median household income in Cabot was $45,945, and the median family income was $54,945. The per capita income in Cabot was $21,945. About 8.2% of families and 10.3% of the population were below the poverty line, including 14.2% of those under age 18 and 8.2% of those age 65 or over.
Common Questions
What is Per Capita Income in Cabot?
Per Capita income in Cabot is $32,541.
What is the Median Family Income in Cabot?
Median Family Income in Cabot is $88,163.
What is the Median Household income in Cabot?
Median Household Income in Cabot is $69,094.
What is Income or Wage Gap in Cabot?
Income or Wage Gap in Cabot is 26.4%.
Women in Cabot earn 73.6 cents for every dollar earned by a man.
What is Family Income Deficit in Cabot?
Family Income Deficit in Cabot is $10,313.
Families that are below poverty line in Cabot earn $10,313 less on average than the poverty threshold level.
What is Inequality or Gini Index in Cabot?
Inequality or Gini Index in Cabot is 0.40.
What is the Total Population of Cabot?
Total Population of Cabot is 26,543.
What is the Total Male Population of Cabot?
Total Male Population of Cabot is 12,984.
What is the Total Female Population of Cabot?
Total Female Population of Cabot is 13,559.
What is the Ratio of Males per 100 Females in Cabot?
There are 95.76 Males per 100 Females in Cabot.
What is the Ratio of Females per 100 Males in Cabot?
There are 104.43 Females per 100 Males in Cabot.
What is the Median Population Age in Cabot?
Median Population Age in Cabot is 35.7 Years.
What is the Average Family Size in Cabot
Average Family Size in Cabot is 3.1 People.
What is the Average Household Size in Cabot
Average Household Size in Cabot is 2.6 People.
How Large is the Labor Force in Cabot?
There are 13,199 People in the Labor Forcein in Cabot.
What is the Percentage of People in the Labor Force in Cabot?
64.4% of People are in the Labor Force in Cabot.
What is the Unemployment Rate in Cabot?
Unemployment Rate in Cabot is 3.3%.