Bentonville, AR Map & Demographics
Bentonville Map
Bentonville Overview
$51,917
PER CAPITA INCOME
$125,942
AVG FAMILY INCOME
$99,074
AVG HOUSEHOLD INCOME
42.0%
WAGE / INCOME GAP [ % ]
58.0¢/ $1
WAGE / INCOME GAP [ $ ]
$10,549
FAMILY INCOME DEFICIT
0.44
INEQUALITY / GINI INDEX
54,513
TOTAL POPULATION
28,358
MALE POPULATION
26,155
FEMALE POPULATION
108.42
MALES / 100 FEMALES
92.23
FEMALES / 100 MALES
32.2
MEDIAN AGE
3.2
AVG FAMILY SIZE
2.6
AVG HOUSEHOLD SIZE
29,858
LABOR FORCE [ PEOPLE ]
72.7%
PERCENT IN LABOR FORCE
3.2%
UNEMPLOYMENT RATE
Bentonville Area Codes
Income in Bentonville
Income Overview in Bentonville
Per Capita Income in Bentonville is $51,917, while median incomes of families and households are $125,942 and $99,074 respectively.
| Characteristic | Number | Measure |
| Per Capita Income | 54,513 | $51,917 |
| Median Family Income | 13,783 | $125,942 |
| Mean Family Income | 13,783 | $158,274 |
| Median Household Income | 20,841 | $99,074 |
| Mean Household Income | 20,841 | $133,835 |
| Income Deficit | 13,783 | $10,549 |
| Wage / Income Gap (%) | 54,513 | 41.98% |
| Wage / Income Gap ($) | 54,513 | 58.02¢ per $1 |
| Gini / Inequality Index | 54,513 | 0.44 |
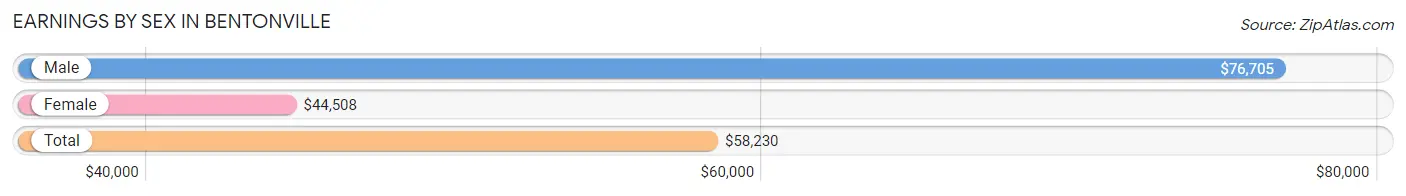
Earnings by Sex in Bentonville
Average Earnings in Bentonville are $58,230, $76,705 for men and $44,508 for women, a difference of 42.0%.
| Sex | Number | Average Earnings |
| Male | 17,286 (56.8%) | $76,705 |
| Female | 13,152 (43.2%) | $44,508 |
| Total | 30,438 (100.0%) | $58,230 |
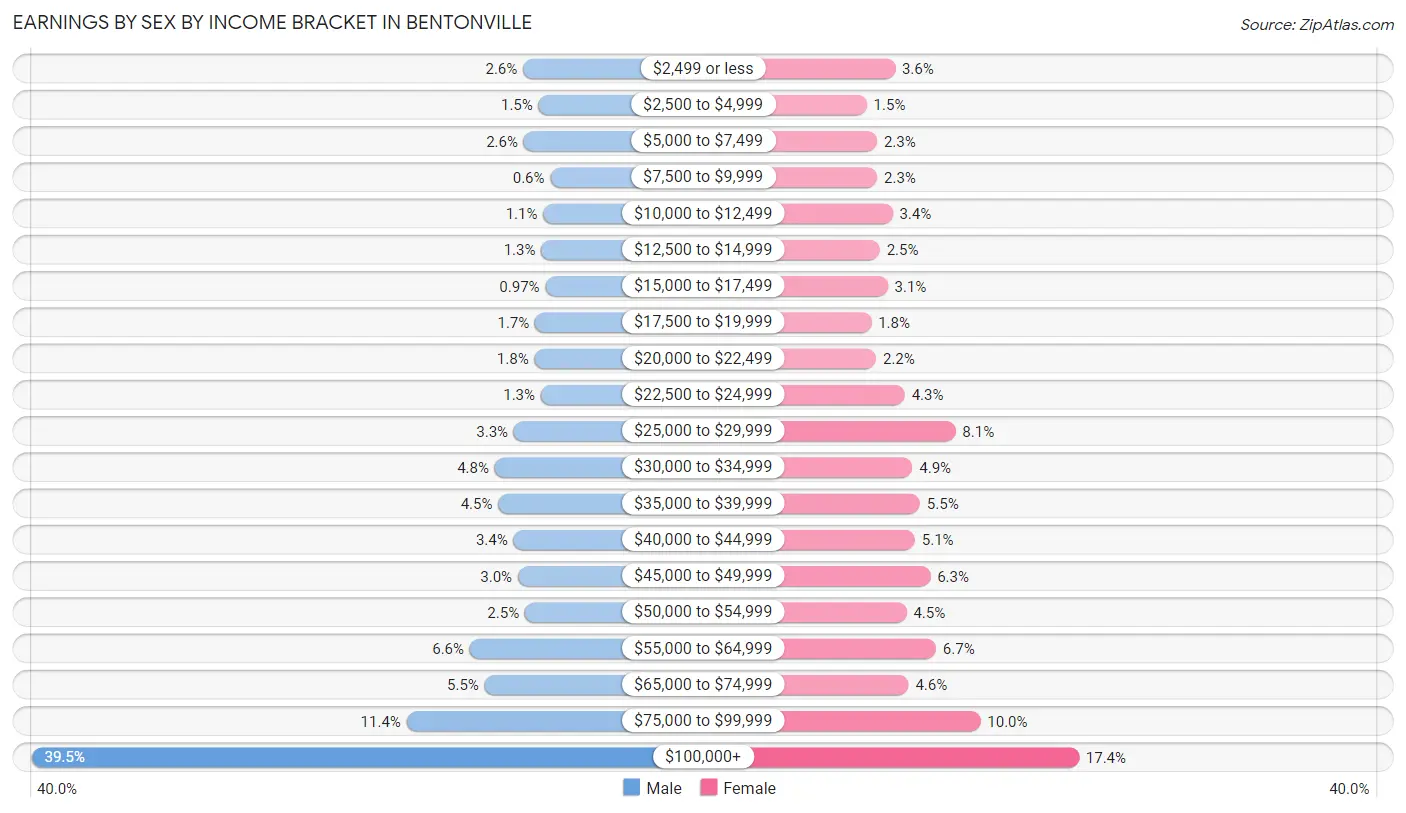
Earnings by Sex by Income Bracket in Bentonville
The most common earnings brackets in Bentonville are $100,000+ for men (6,825 | 39.5%) and $100,000+ for women (2,287 | 17.4%).
| Income | Male | Female |
| $2,499 or less | 457 (2.6%) | 475 (3.6%) |
| $2,500 to $4,999 | 255 (1.5%) | 196 (1.5%) |
| $5,000 to $7,499 | 448 (2.6%) | 297 (2.3%) |
| $7,500 to $9,999 | 104 (0.6%) | 299 (2.3%) |
| $10,000 to $12,499 | 195 (1.1%) | 450 (3.4%) |
| $12,500 to $14,999 | 221 (1.3%) | 325 (2.5%) |
| $15,000 to $17,499 | 167 (1.0%) | 402 (3.1%) |
| $17,500 to $19,999 | 301 (1.7%) | 241 (1.8%) |
| $20,000 to $22,499 | 309 (1.8%) | 288 (2.2%) |
| $22,500 to $24,999 | 227 (1.3%) | 571 (4.3%) |
| $25,000 to $29,999 | 575 (3.3%) | 1,070 (8.1%) |
| $30,000 to $34,999 | 822 (4.8%) | 646 (4.9%) |
| $35,000 to $39,999 | 778 (4.5%) | 721 (5.5%) |
| $40,000 to $44,999 | 580 (3.4%) | 671 (5.1%) |
| $45,000 to $49,999 | 523 (3.0%) | 822 (6.2%) |
| $50,000 to $54,999 | 432 (2.5%) | 588 (4.5%) |
| $55,000 to $64,999 | 1,146 (6.6%) | 879 (6.7%) |
| $65,000 to $74,999 | 955 (5.5%) | 608 (4.6%) |
| $75,000 to $99,999 | 1,966 (11.4%) | 1,316 (10.0%) |
| $100,000+ | 6,825 (39.5%) | 2,287 (17.4%) |
| Total | 17,286 (100.0%) | 13,152 (100.0%) |
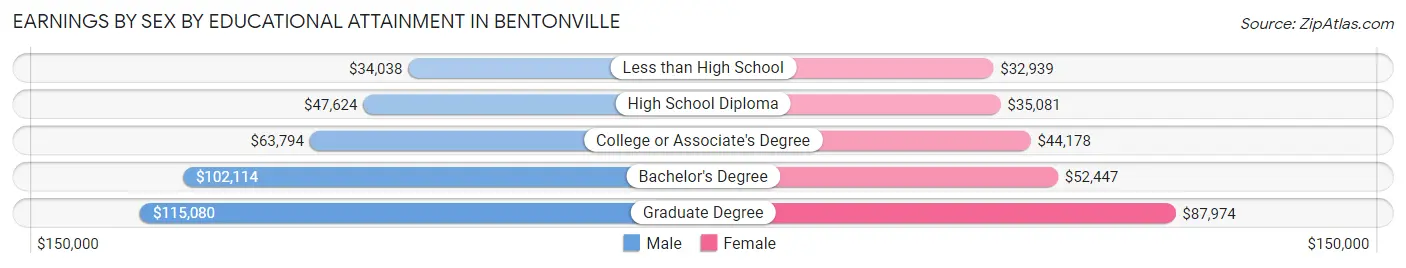
Earnings by Sex by Educational Attainment in Bentonville
Average earnings in Bentonville are $87,344 for men and $48,764 for women, a difference of 44.2%. Men with an educational attainment of graduate degree enjoy the highest average annual earnings of $115,080, while those with less than high school education earn the least with $34,038. Women with an educational attainment of graduate degree earn the most with the average annual earnings of $87,974, while those with less than high school education have the smallest earnings of $32,939.
| Educational Attainment | Male Income | Female Income |
| Less than High School | $34,038 | $32,939 |
| High School Diploma | $47,624 | $35,081 |
| College or Associate's Degree | $63,794 | $44,178 |
| Bachelor's Degree | $102,114 | $52,447 |
| Graduate Degree | $115,080 | $87,974 |
| Total | $87,344 | $48,764 |
Family Income in Bentonville
Family Income Brackets in Bentonville
According to the Bentonville family income data, there are 3,763 families falling into the $200,000+ income range, which is the most common income bracket and makes up 27.3% of all families. Conversely, the $10,000 to $14,999 income bracket is the least frequent group with only 165 families (1.2%) belonging to this category.
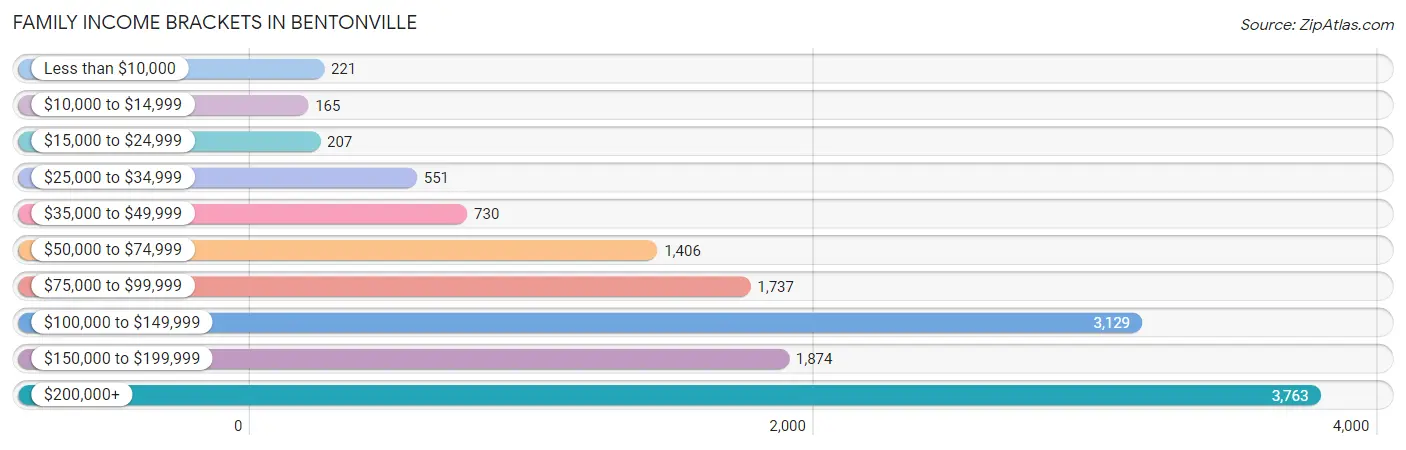
| Income Bracket | # Families | % Families |
| Less than $10,000 | 221 | 1.6% |
| $10,000 to $14,999 | 165 | 1.2% |
| $15,000 to $24,999 | 207 | 1.5% |
| $25,000 to $34,999 | 551 | 4.0% |
| $35,000 to $49,999 | 730 | 5.3% |
| $50,000 to $74,999 | 1,406 | 10.2% |
| $75,000 to $99,999 | 1,737 | 12.6% |
| $100,000 to $149,999 | 3,129 | 22.7% |
| $150,000 to $199,999 | 1,874 | 13.6% |
| $200,000+ | 3,763 | 27.3% |
Family Income by Famaliy Size in Bentonville
4-person families (2,901 | 21.0%) account for the highest median family income in Bentonville with $157,330 per family, while 2-person families (5,183 | 37.6%) have the highest median income of $55,426 per family member.
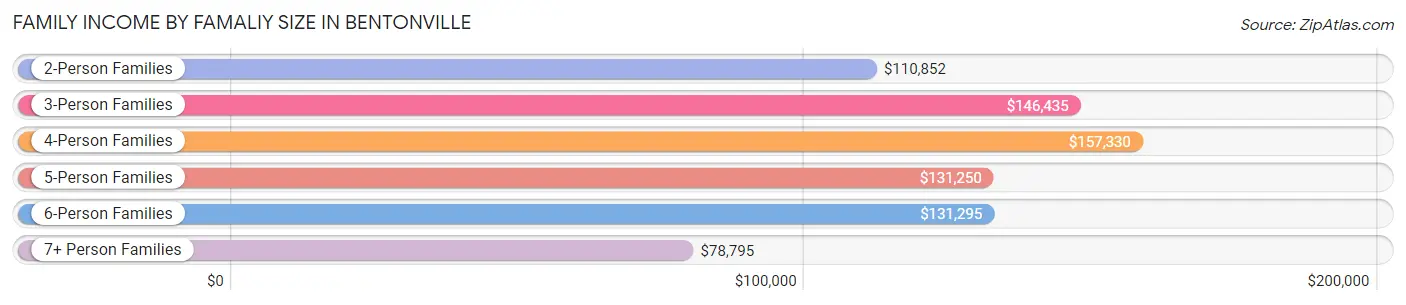
| Income Bracket | # Families | Median Income |
| 2-Person Families | 5,183 (37.6%) | $110,852 |
| 3-Person Families | 3,693 (26.8%) | $146,435 |
| 4-Person Families | 2,901 (21.0%) | $157,330 |
| 5-Person Families | 1,422 (10.3%) | $131,250 |
| 6-Person Families | 443 (3.2%) | $131,295 |
| 7+ Person Families | 141 (1.0%) | $78,795 |
| Total | 13,783 (100.0%) | $125,942 |
Family Income by Number of Earners in Bentonville
The median family income in Bentonville is $125,942, with families comprising 3+ earners (1,061) having the highest median family income of $170,795, while families with no earners (952) have the lowest median family income of $43,077, accounting for 7.7% and 6.9% of families, respectively.
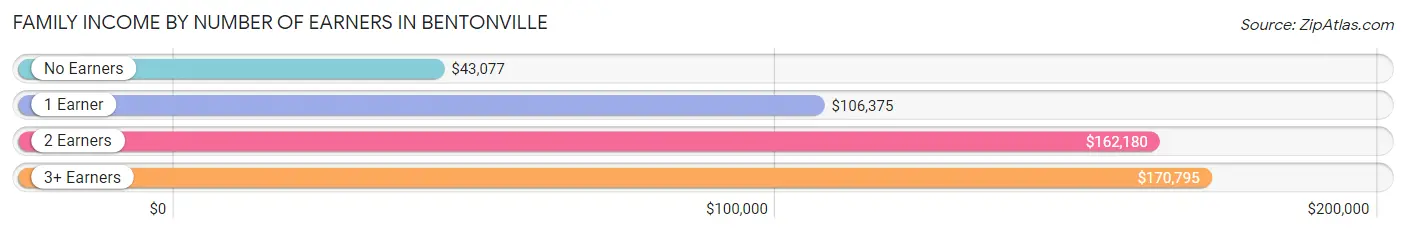
| Number of Earners | # Families | Median Income |
| No Earners | 952 (6.9%) | $43,077 |
| 1 Earner | 5,093 (36.9%) | $106,375 |
| 2 Earners | 6,677 (48.4%) | $162,180 |
| 3+ Earners | 1,061 (7.7%) | $170,795 |
| Total | 13,783 (100.0%) | $125,942 |
Household Income in Bentonville
Household Income Brackets in Bentonville
With 4,231 households falling in the category, the $200,000+ income range is the most frequent in Bentonville, accounting for 20.3% of all households. In contrast, only 292 households (1.4%) fall into the $10,000 to $14,999 income bracket, making it the least populous group.
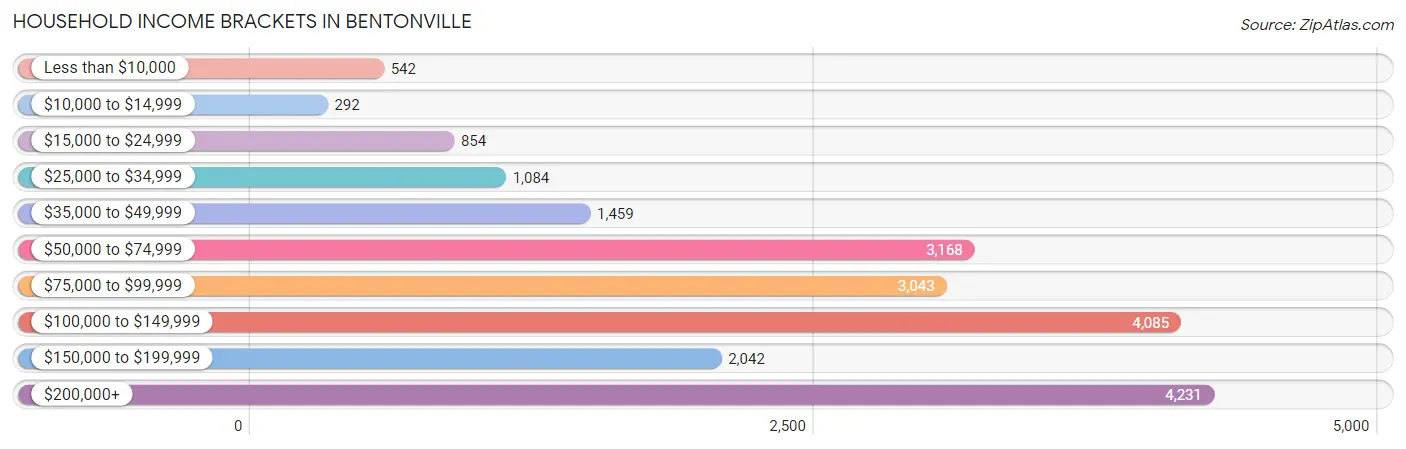
| Income Bracket | # Households | % Households |
| Less than $10,000 | 542 | 2.6% |
| $10,000 to $14,999 | 292 | 1.4% |
| $15,000 to $24,999 | 854 | 4.1% |
| $25,000 to $34,999 | 1,084 | 5.2% |
| $35,000 to $49,999 | 1,459 | 7.0% |
| $50,000 to $74,999 | 3,168 | 15.2% |
| $75,000 to $99,999 | 3,043 | 14.6% |
| $100,000 to $149,999 | 4,085 | 19.6% |
| $150,000 to $199,999 | 2,042 | 9.8% |
| $200,000+ | 4,231 | 20.3% |
Household Income by Householder Age in Bentonville
The median household income in Bentonville is $99,074, with the highest median household income of $122,946 found in the 45 to 64 years age bracket for the primary householder. A total of 6,317 households (30.3%) fall into this category. Meanwhile, the 65+ years age bracket for the primary householder has the lowest median household income of $49,729, with 2,497 households (12.0%) in this group.
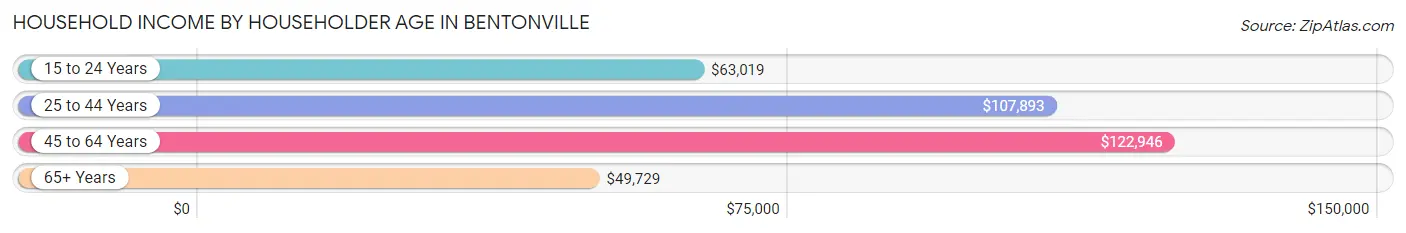
| Income Bracket | # Households | Median Income |
| 15 to 24 Years | 1,092 (5.2%) | $63,019 |
| 25 to 44 Years | 10,935 (52.5%) | $107,893 |
| 45 to 64 Years | 6,317 (30.3%) | $122,946 |
| 65+ Years | 2,497 (12.0%) | $49,729 |
| Total | 20,841 (100.0%) | $99,074 |
Poverty in Bentonville
Income Below Poverty by Sex and Age in Bentonville
With 5.7% poverty level for males and 6.7% for females among the residents of Bentonville, 65 to 74 year old males and 5 year old females are the most vulnerable to poverty, with 141 males (13.2%) and 69 females (19.5%) in their respective age groups living below the poverty level.
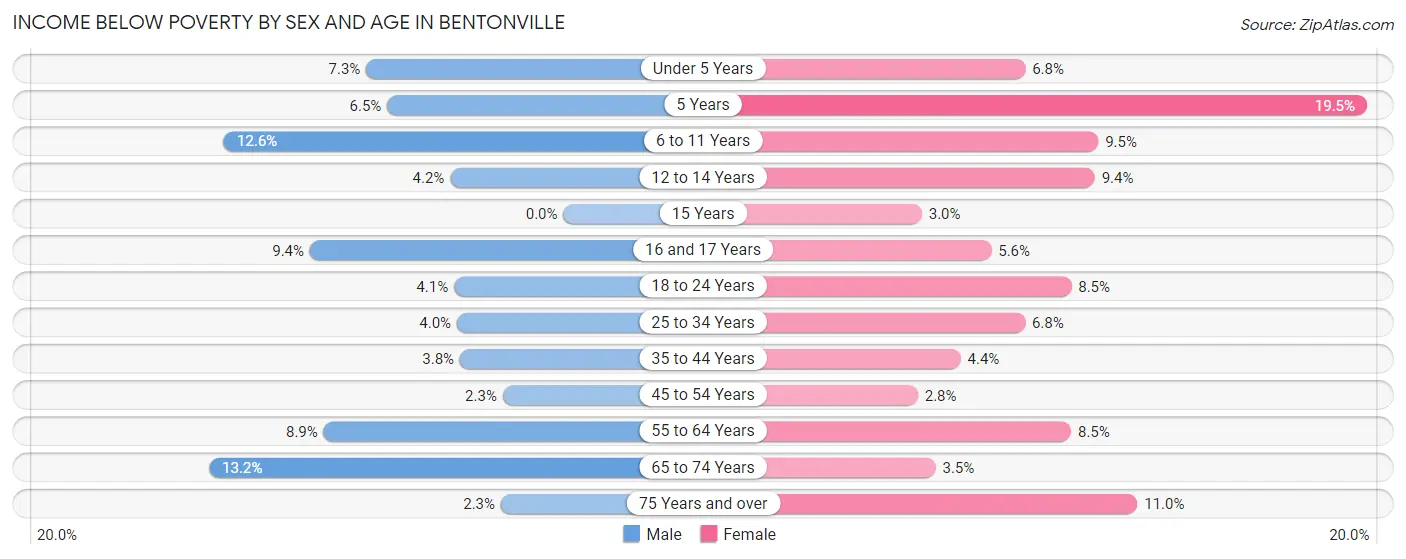
| Age Bracket | Male | Female |
| Under 5 Years | 162 (7.3%) | 107 (6.8%) |
| 5 Years | 43 (6.5%) | 69 (19.5%) |
| 6 to 11 Years | 344 (12.6%) | 265 (9.5%) |
| 12 to 14 Years | 38 (4.2%) | 93 (9.4%) |
| 15 Years | 0 (0.0%) | 12 (3.0%) |
| 16 and 17 Years | 70 (9.4%) | 37 (5.6%) |
| 18 to 24 Years | 104 (4.1%) | 187 (8.5%) |
| 25 to 34 Years | 204 (4.0%) | 318 (6.8%) |
| 35 to 44 Years | 200 (3.8%) | 197 (4.4%) |
| 45 to 54 Years | 74 (2.2%) | 83 (2.8%) |
| 55 to 64 Years | 186 (8.9%) | 190 (8.5%) |
| 65 to 74 Years | 141 (13.2%) | 49 (3.5%) |
| 75 Years and over | 12 (2.3%) | 126 (11.0%) |
| Total | 1,578 (5.7%) | 1,733 (6.7%) |
Income Above Poverty by Sex and Age in Bentonville
According to the poverty statistics in Bentonville, males aged 15 years and females aged 45 to 54 years are the age groups that are most secure financially, with 100.0% of males and 97.2% of females in these age groups living above the poverty line.
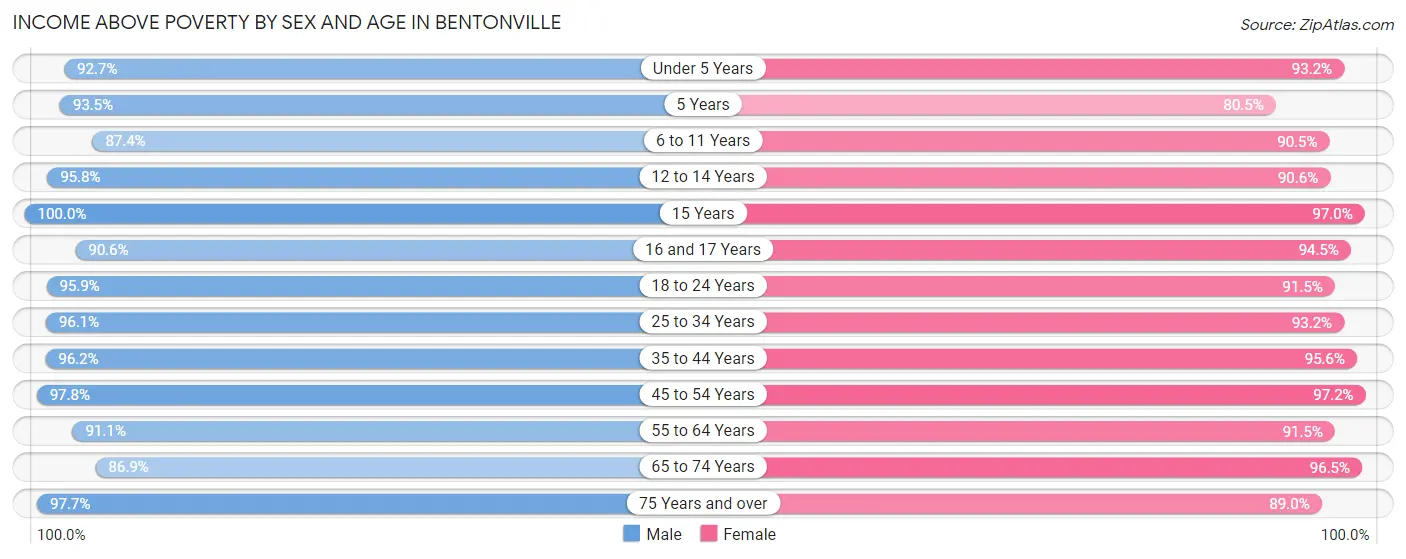
| Age Bracket | Male | Female |
| Under 5 Years | 2,051 (92.7%) | 1,465 (93.2%) |
| 5 Years | 614 (93.5%) | 285 (80.5%) |
| 6 to 11 Years | 2,386 (87.4%) | 2,520 (90.5%) |
| 12 to 14 Years | 867 (95.8%) | 897 (90.6%) |
| 15 Years | 461 (100.0%) | 392 (97.0%) |
| 16 and 17 Years | 674 (90.6%) | 630 (94.5%) |
| 18 to 24 Years | 2,457 (95.9%) | 2,009 (91.5%) |
| 25 to 34 Years | 4,959 (96.1%) | 4,357 (93.2%) |
| 35 to 44 Years | 5,009 (96.2%) | 4,275 (95.6%) |
| 45 to 54 Years | 3,217 (97.8%) | 2,861 (97.2%) |
| 55 to 64 Years | 1,904 (91.1%) | 2,042 (91.5%) |
| 65 to 74 Years | 931 (86.9%) | 1,358 (96.5%) |
| 75 Years and over | 506 (97.7%) | 1,023 (89.0%) |
| Total | 26,036 (94.3%) | 24,114 (93.3%) |
Income Below Poverty Among Married-Couple Families in Bentonville
The poverty statistics for married-couple families in Bentonville show that 2.1% or 231 of the total 10,934 families live below the poverty line. Families with 5 or more children have the highest poverty rate of 42.9%, comprising of 42 families. On the other hand, families with no children have the lowest poverty rate of 1.2%, which includes 58 families.
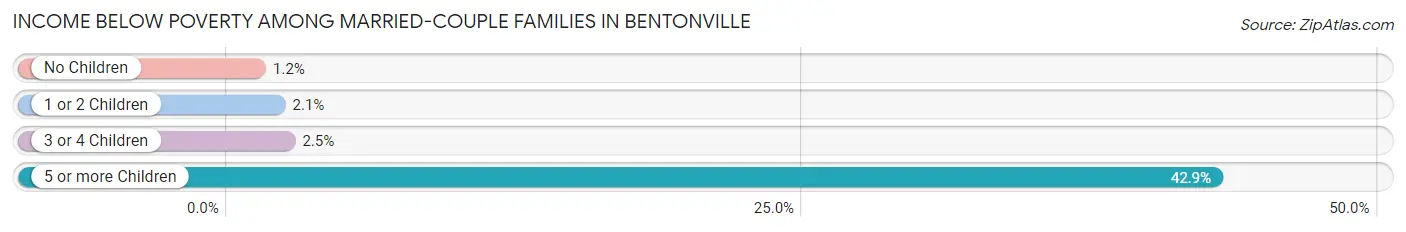
| Children | Above Poverty | Below Poverty |
| No Children | 4,714 (98.8%) | 58 (1.2%) |
| 1 or 2 Children | 4,687 (97.9%) | 99 (2.1%) |
| 3 or 4 Children | 1,246 (97.5%) | 32 (2.5%) |
| 5 or more Children | 56 (57.1%) | 42 (42.9%) |
| Total | 10,703 (97.9%) | 231 (2.1%) |
Income Below Poverty Among Single-Parent Households in Bentonville
According to the poverty data in Bentonville, 14.6% or 114 single-father households and 16.8% or 347 single-mother households are living below the poverty line. Among single-father households, those with 3 or 4 children have the highest poverty rate, with 49 households (51.6%) experiencing poverty. Likewise, among single-mother households, those with 3 or 4 children have the highest poverty rate, with 84 households (37.2%) falling below the poverty line.
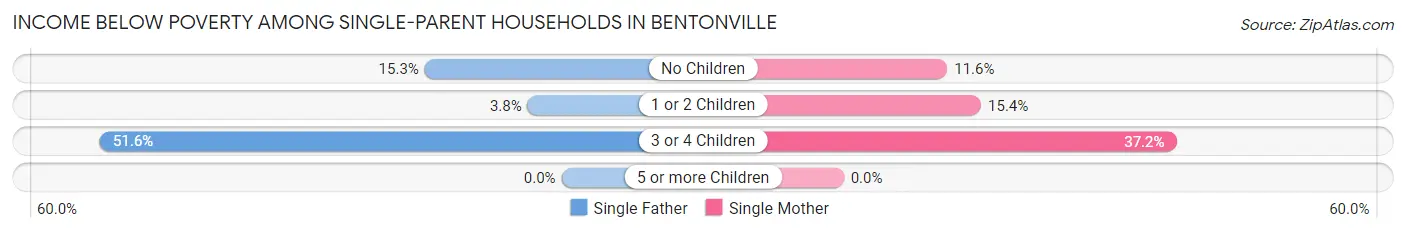
| Children | Single Father | Single Mother |
| No Children | 52 (15.3%) | 60 (11.6%) |
| 1 or 2 Children | 13 (3.8%) | 203 (15.4%) |
| 3 or 4 Children | 49 (51.6%) | 84 (37.2%) |
| 5 or more Children | 0 (0.0%) | 0 (0.0%) |
| Total | 114 (14.6%) | 347 (16.8%) |
Income Below Poverty Among Married-Couple vs Single-Parent Households in Bentonville
The poverty data for Bentonville shows that 231 of the married-couple family households (2.1%) and 461 of the single-parent households (16.2%) are living below the poverty level. Within the married-couple family households, those with 5 or more children have the highest poverty rate, with 42 households (42.9%) falling below the poverty line. Among the single-parent households, those with 3 or 4 children have the highest poverty rate, with 133 household (41.4%) living below poverty.
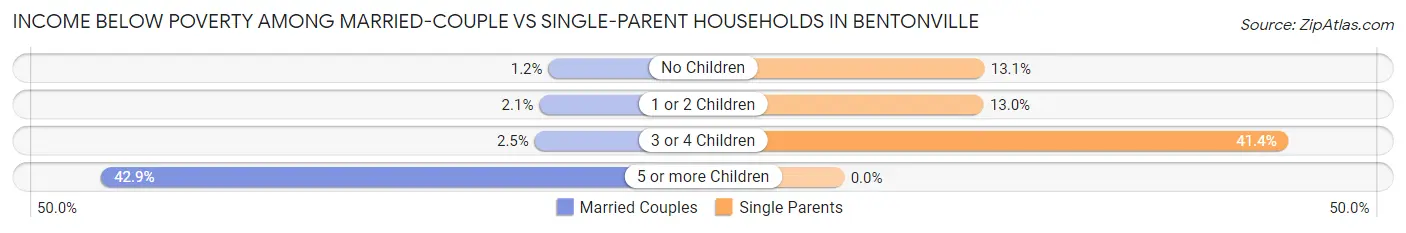
| Children | Married-Couple Families | Single-Parent Households |
| No Children | 58 (1.2%) | 112 (13.1%) |
| 1 or 2 Children | 99 (2.1%) | 216 (13.0%) |
| 3 or 4 Children | 32 (2.5%) | 133 (41.4%) |
| 5 or more Children | 42 (42.9%) | 0 (0.0%) |
| Total | 231 (2.1%) | 461 (16.2%) |
Race in Bentonville
The most populous races in Bentonville are White / Caucasian (36,541 | 67.0%), Asian (7,238 | 13.3%), and Two or more Races (6,999 | 12.8%).
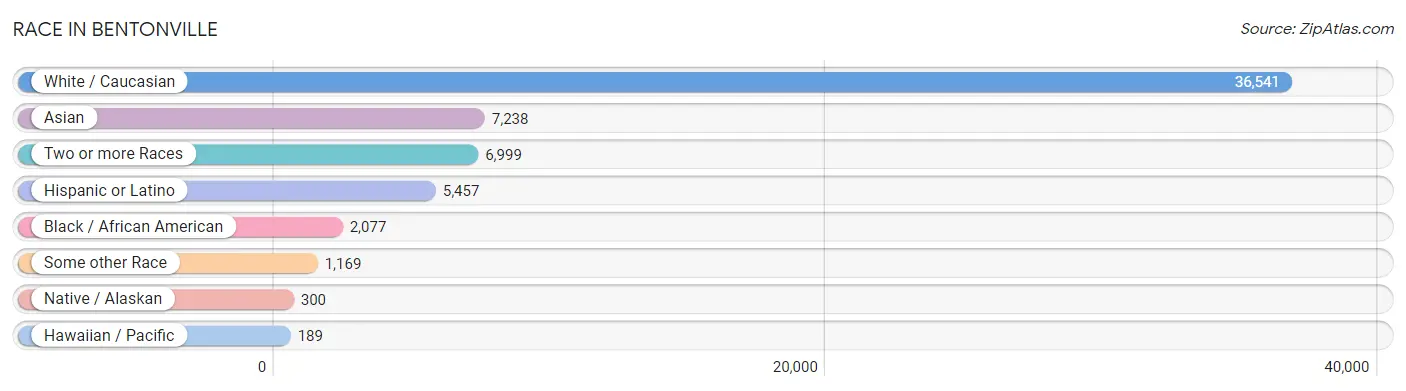
| Race | # Population | % Population |
| Asian | 7,238 | 13.3% |
| Black / African American | 2,077 | 3.8% |
| Hawaiian / Pacific | 189 | 0.4% |
| Hispanic or Latino | 5,457 | 10.0% |
| Native / Alaskan | 300 | 0.5% |
| White / Caucasian | 36,541 | 67.0% |
| Two or more Races | 6,999 | 12.8% |
| Some other Race | 1,169 | 2.1% |
| Total | 54,513 | 100.0% |
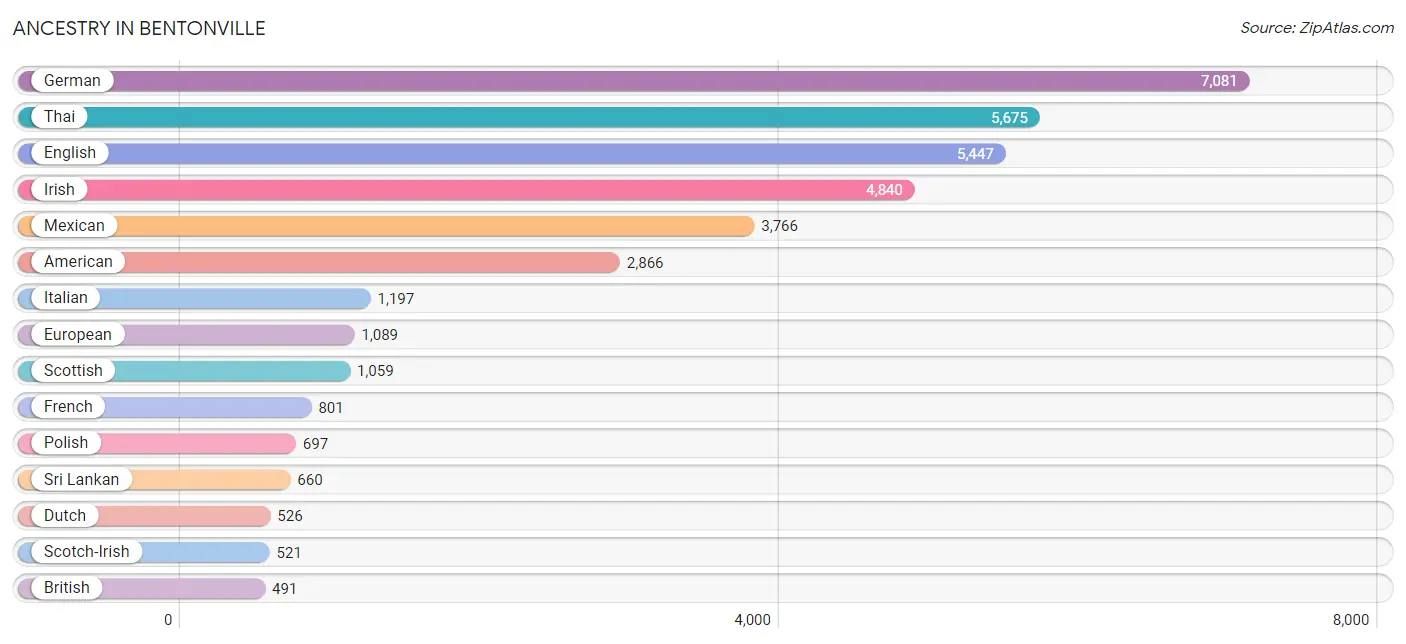
Ancestry in Bentonville
The most populous ancestries reported in Bentonville are German (7,081 | 13.0%), Thai (5,675 | 10.4%), English (5,447 | 10.0%), Irish (4,840 | 8.9%), and Mexican (3,766 | 6.9%), together accounting for 49.2% of all Bentonville residents.
| Ancestry | # Population | % Population |
| African | 117 | 0.2% |
| American | 2,866 | 5.3% |
| Apache | 18 | 0.0% |
| Arab | 169 | 0.3% |
| Australian | 38 | 0.1% |
| Austrian | 39 | 0.1% |
| Bangladeshi | 55 | 0.1% |
| Belgian | 31 | 0.1% |
| Bhutanese | 29 | 0.1% |
| Bolivian | 13 | 0.0% |
| Brazilian | 341 | 0.6% |
| British | 491 | 0.9% |
| Burmese | 332 | 0.6% |
| Cajun | 70 | 0.1% |
| Canadian | 67 | 0.1% |
| Central American | 412 | 0.8% |
| Cherokee | 360 | 0.7% |
| Chickasaw | 60 | 0.1% |
| Choctaw | 83 | 0.2% |
| Colombian | 38 | 0.1% |
| Creek | 7 | 0.0% |
| Croatian | 10 | 0.0% |
| Cuban | 292 | 0.5% |
| Czech | 160 | 0.3% |
| Danish | 107 | 0.2% |
| Dominican | 69 | 0.1% |
| Dutch | 526 | 1.0% |
| Eastern European | 87 | 0.2% |
| English | 5,447 | 10.0% |
| Estonian | 8 | 0.0% |
| Ethiopian | 24 | 0.0% |
| European | 1,089 | 2.0% |
| Fijian | 36 | 0.1% |
| Filipino | 99 | 0.2% |
| Finnish | 58 | 0.1% |
| French | 801 | 1.5% |
| French Canadian | 112 | 0.2% |
| German | 7,081 | 13.0% |
| Greek | 28 | 0.1% |
| Honduran | 43 | 0.1% |
| Hungarian | 194 | 0.4% |
| Icelander | 18 | 0.0% |
| Indian (Asian) | 425 | 0.8% |
| Irish | 4,840 | 8.9% |
| Iroquois | 10 | 0.0% |
| Israeli | 48 | 0.1% |
| Italian | 1,197 | 2.2% |
| Jamaican | 21 | 0.0% |
| Kenyan | 27 | 0.1% |
| Korean | 409 | 0.7% |
| Lebanese | 87 | 0.2% |
| Liberian | 20 | 0.0% |
| Lithuanian | 164 | 0.3% |
| Malaysian | 133 | 0.2% |
| Marshallese | 125 | 0.2% |
| Mexican | 3,766 | 6.9% |
| Mexican American Indian | 64 | 0.1% |
| Native Hawaiian | 119 | 0.2% |
| Nicaraguan | 88 | 0.2% |
| Nigerian | 104 | 0.2% |
| Northern European | 291 | 0.5% |
| Norwegian | 358 | 0.7% |
| Pakistani | 121 | 0.2% |
| Peruvian | 78 | 0.1% |
| Polish | 697 | 1.3% |
| Portuguese | 287 | 0.5% |
| Puerto Rican | 333 | 0.6% |
| Russian | 96 | 0.2% |
| Salvadoran | 281 | 0.5% |
| Samoan | 28 | 0.1% |
| Scandinavian | 88 | 0.2% |
| Scotch-Irish | 521 | 1.0% |
| Scottish | 1,059 | 1.9% |
| Serbian | 10 | 0.0% |
| Shoshone | 26 | 0.1% |
| Sierra Leonean | 130 | 0.2% |
| Slovak | 10 | 0.0% |
| South American | 129 | 0.2% |
| South American Indian | 13 | 0.0% |
| Spaniard | 225 | 0.4% |
| Spanish | 43 | 0.1% |
| Sri Lankan | 660 | 1.2% |
| Subsaharan African | 486 | 0.9% |
| Swedish | 277 | 0.5% |
| Swiss | 182 | 0.3% |
| Thai | 5,675 | 10.4% |
| Ukrainian | 150 | 0.3% |
| Welsh | 277 | 0.5% | View All 88 Rows |
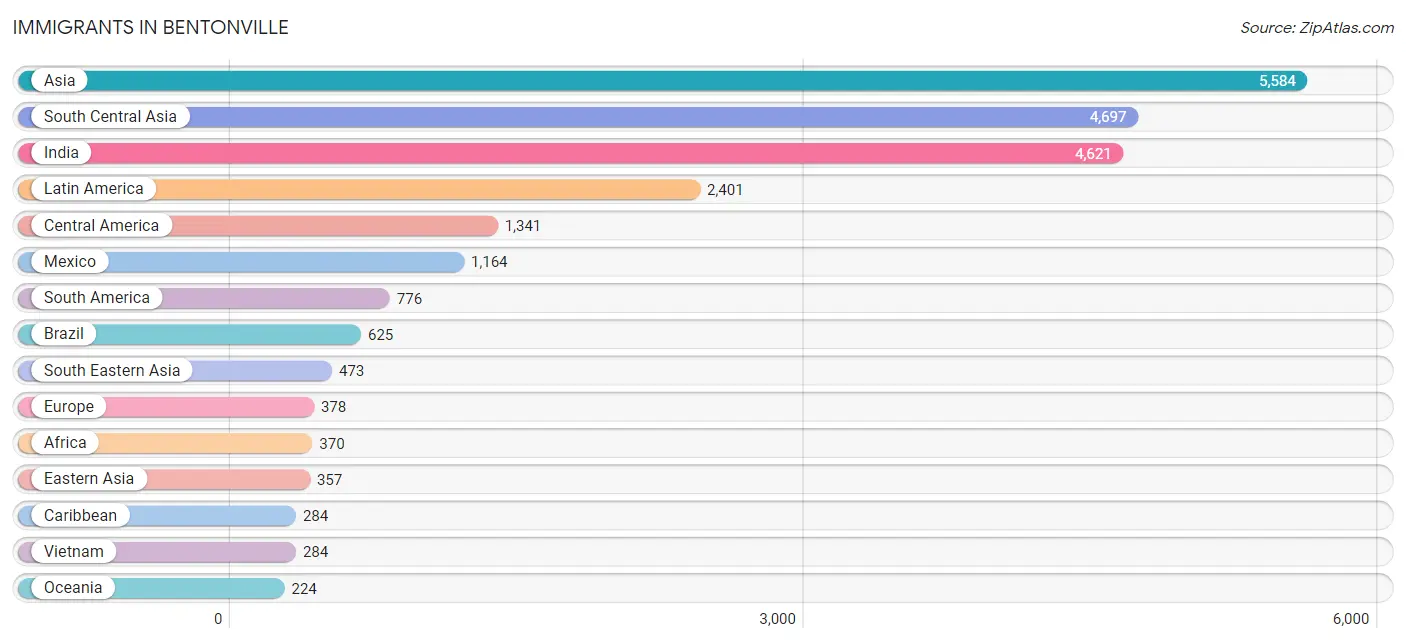
Immigrants in Bentonville
The most numerous immigrant groups reported in Bentonville came from Asia (5,584 | 10.2%), South Central Asia (4,697 | 8.6%), India (4,621 | 8.5%), Latin America (2,401 | 4.4%), and Central America (1,341 | 2.5%), together accounting for 34.2% of all Bentonville residents.
| Immigration Origin | # Population | % Population |
| Africa | 370 | 0.7% |
| Asia | 5,584 | 10.2% |
| Australia | 154 | 0.3% |
| Bolivia | 13 | 0.0% |
| Brazil | 625 | 1.1% |
| Cambodia | 37 | 0.1% |
| Canada | 11 | 0.0% |
| Caribbean | 284 | 0.5% |
| Central America | 1,341 | 2.5% |
| China | 167 | 0.3% |
| Colombia | 9 | 0.0% |
| Congo | 29 | 0.1% |
| Cuba | 143 | 0.3% |
| Dominican Republic | 141 | 0.3% |
| Eastern Africa | 92 | 0.2% |
| Eastern Asia | 357 | 0.6% |
| Eastern Europe | 42 | 0.1% |
| El Salvador | 107 | 0.2% |
| England | 80 | 0.2% |
| Ethiopia | 24 | 0.0% |
| Europe | 378 | 0.7% |
| Germany | 93 | 0.2% |
| Honduras | 20 | 0.0% |
| India | 4,621 | 8.5% |
| Indonesia | 27 | 0.1% |
| Israel | 48 | 0.1% |
| Italy | 14 | 0.0% |
| Kenya | 27 | 0.1% |
| Korea | 190 | 0.4% |
| Kuwait | 9 | 0.0% |
| Laos | 26 | 0.1% |
| Latin America | 2,401 | 4.4% |
| Mexico | 1,164 | 2.1% |
| Micronesia | 22 | 0.0% |
| Middle Africa | 29 | 0.1% |
| Nepal | 76 | 0.1% |
| Netherlands | 32 | 0.1% |
| Nicaragua | 50 | 0.1% |
| Nigeria | 104 | 0.2% |
| Northern Europe | 176 | 0.3% |
| Oceania | 224 | 0.4% |
| Peru | 33 | 0.1% |
| Philippines | 85 | 0.2% |
| Poland | 15 | 0.0% |
| Portugal | 21 | 0.0% |
| Russia | 15 | 0.0% |
| Scotland | 9 | 0.0% |
| Sierra Leone | 53 | 0.1% |
| South America | 776 | 1.4% |
| South Central Asia | 4,697 | 8.6% |
| South Eastern Asia | 473 | 0.9% |
| Southern Europe | 35 | 0.1% |
| Taiwan | 106 | 0.2% |
| Thailand | 14 | 0.0% |
| Ukraine | 12 | 0.0% |
| Venezuela | 96 | 0.2% |
| Vietnam | 284 | 0.5% |
| Western Africa | 184 | 0.3% |
| Western Asia | 57 | 0.1% |
| Western Europe | 125 | 0.2% |
| Zimbabwe | 33 | 0.1% | View All 61 Rows |
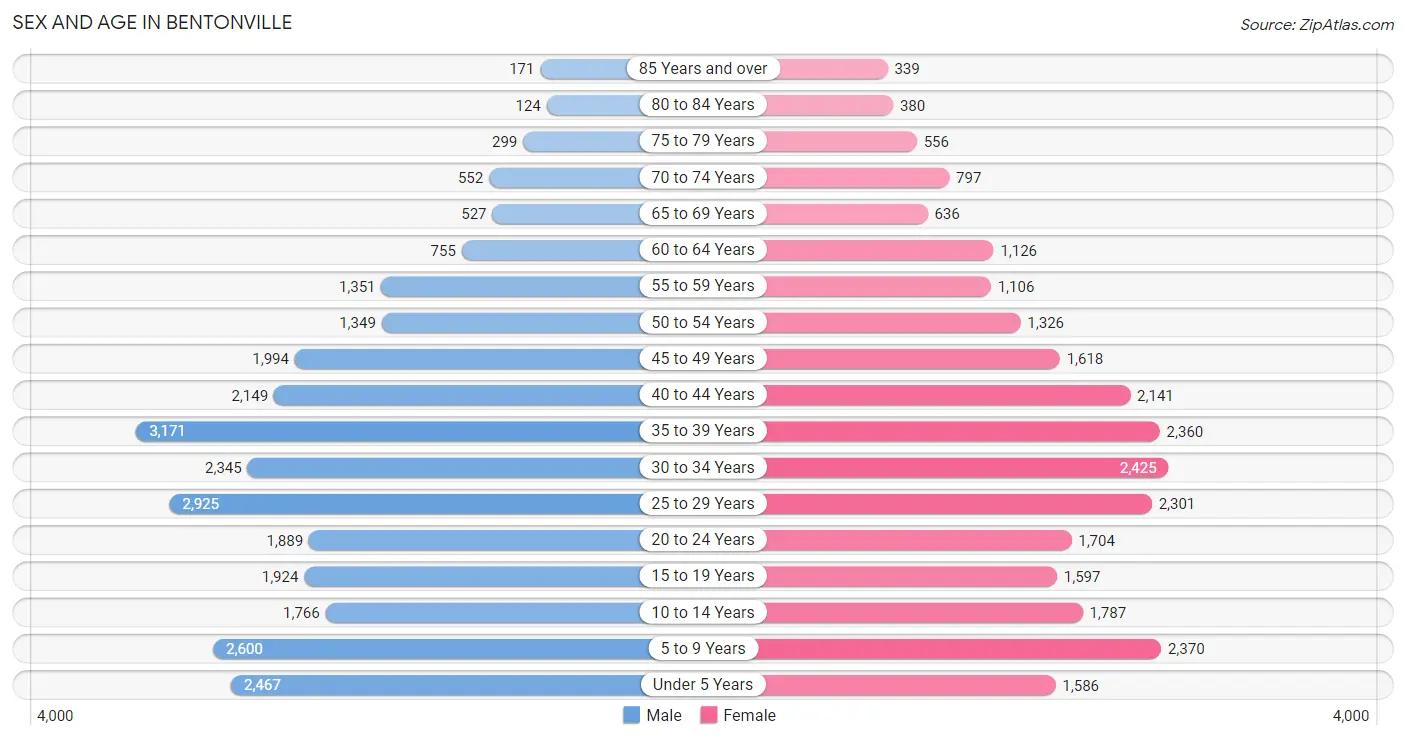
Sex and Age in Bentonville
Sex and Age in Bentonville
The most populous age groups in Bentonville are 35 to 39 Years (3,171 | 11.2%) for men and 30 to 34 Years (2,425 | 9.3%) for women.
| Age Bracket | Male | Female |
| Under 5 Years | 2,467 (8.7%) | 1,586 (6.1%) |
| 5 to 9 Years | 2,600 (9.2%) | 2,370 (9.1%) |
| 10 to 14 Years | 1,766 (6.2%) | 1,787 (6.8%) |
| 15 to 19 Years | 1,924 (6.8%) | 1,597 (6.1%) |
| 20 to 24 Years | 1,889 (6.7%) | 1,704 (6.5%) |
| 25 to 29 Years | 2,925 (10.3%) | 2,301 (8.8%) |
| 30 to 34 Years | 2,345 (8.3%) | 2,425 (9.3%) |
| 35 to 39 Years | 3,171 (11.2%) | 2,360 (9.0%) |
| 40 to 44 Years | 2,149 (7.6%) | 2,141 (8.2%) |
| 45 to 49 Years | 1,994 (7.0%) | 1,618 (6.2%) |
| 50 to 54 Years | 1,349 (4.8%) | 1,326 (5.1%) |
| 55 to 59 Years | 1,351 (4.8%) | 1,106 (4.2%) |
| 60 to 64 Years | 755 (2.7%) | 1,126 (4.3%) |
| 65 to 69 Years | 527 (1.9%) | 636 (2.4%) |
| 70 to 74 Years | 552 (1.9%) | 797 (3.0%) |
| 75 to 79 Years | 299 (1.1%) | 556 (2.1%) |
| 80 to 84 Years | 124 (0.4%) | 380 (1.5%) |
| 85 Years and over | 171 (0.6%) | 339 (1.3%) |
| Total | 28,358 (100.0%) | 26,155 (100.0%) |
Families and Households in Bentonville
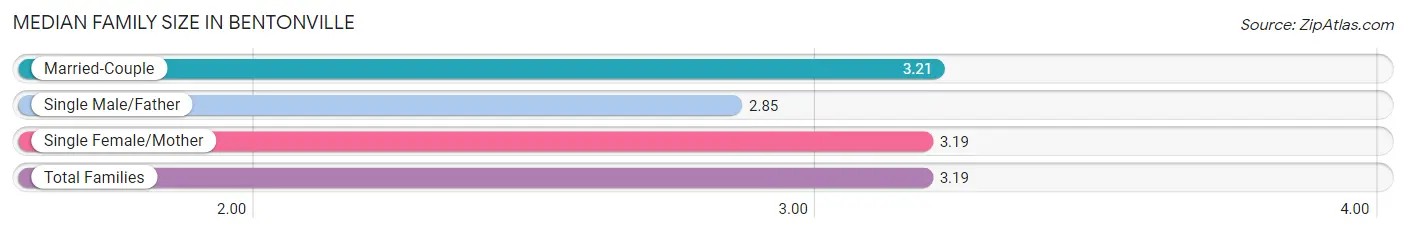
Median Family Size in Bentonville
The median family size in Bentonville is 3.19 persons per family, with married-couple families (10,934 | 79.3%) accounting for the largest median family size of 3.21 persons per family. On the other hand, single male/father families (783 | 5.7%) represent the smallest median family size with 2.85 persons per family.
| Family Type | # Families | Family Size |
| Married-Couple | 10,934 (79.3%) | 3.21 |
| Single Male/Father | 783 (5.7%) | 2.85 |
| Single Female/Mother | 2,066 (15.0%) | 3.19 |
| Total Families | 13,783 (100.0%) | 3.19 |
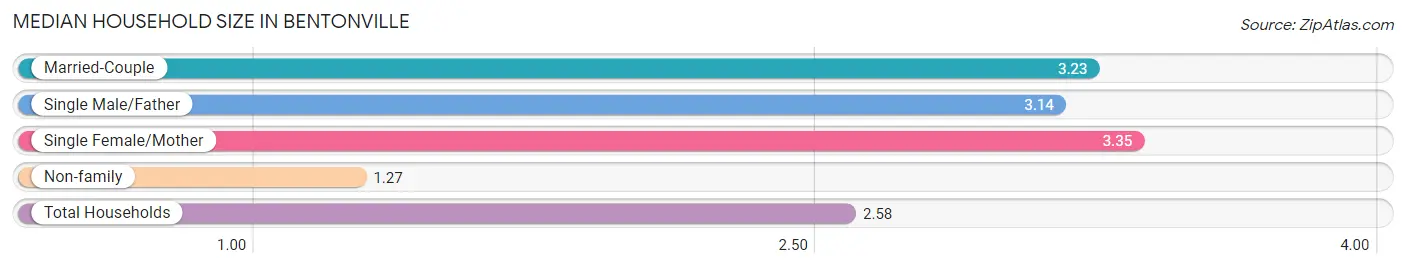
Median Household Size in Bentonville
The median household size in Bentonville is 2.58 persons per household, with single female/mother households (2,066 | 9.9%) accounting for the largest median household size of 3.35 persons per household. non-family households (7,058 | 33.9%) represent the smallest median household size with 1.27 persons per household.
| Household Type | # Households | Household Size |
| Married-Couple | 10,934 (52.5%) | 3.23 |
| Single Male/Father | 783 (3.8%) | 3.14 |
| Single Female/Mother | 2,066 (9.9%) | 3.35 |
| Non-family | 7,058 (33.9%) | 1.27 |
| Total Households | 20,841 (100.0%) | 2.58 |
Household Size by Marriage Status in Bentonville
Out of a total of 20,841 households in Bentonville, 13,783 (66.1%) are family households, while 7,058 (33.9%) are nonfamily households. The most numerous type of family households are 2-person households, comprising 4,870, and the most common type of nonfamily households are 1-person households, comprising 5,758.
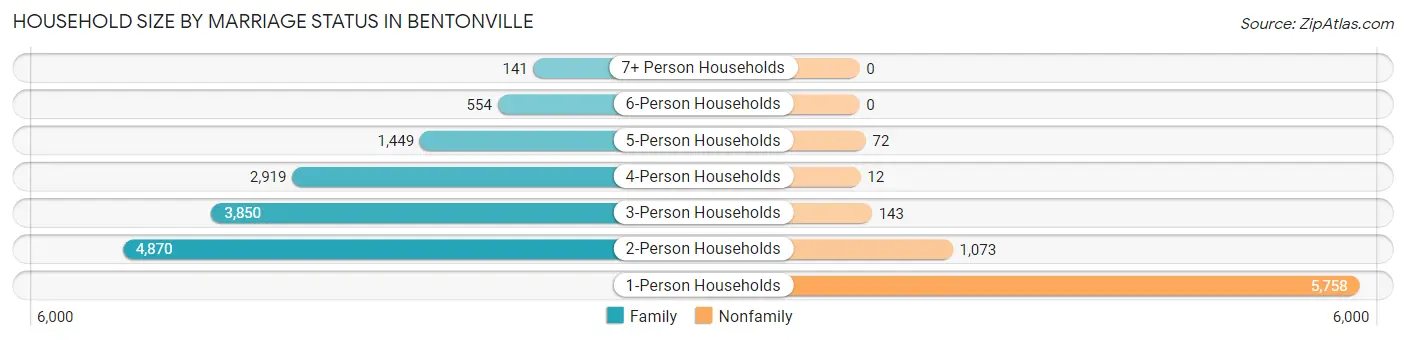
| Household Size | Family Households | Nonfamily Households |
| 1-Person Households | - | 5,758 (27.6%) |
| 2-Person Households | 4,870 (23.4%) | 1,073 (5.1%) |
| 3-Person Households | 3,850 (18.5%) | 143 (0.7%) |
| 4-Person Households | 2,919 (14.0%) | 12 (0.1%) |
| 5-Person Households | 1,449 (7.0%) | 72 (0.4%) |
| 6-Person Households | 554 (2.7%) | 0 (0.0%) |
| 7+ Person Households | 141 (0.7%) | 0 (0.0%) |
| Total | 13,783 (66.1%) | 7,058 (33.9%) |
Female Fertility in Bentonville
Fertility by Age in Bentonville
Average fertility rate in Bentonville is 48.0 births per 1,000 women. Women in the age bracket of 20 to 34 years have the highest fertility rate with 76.0 births per 1,000 women. Women in the age bracket of 20 to 34 years acount for 70.0% of all women with births.
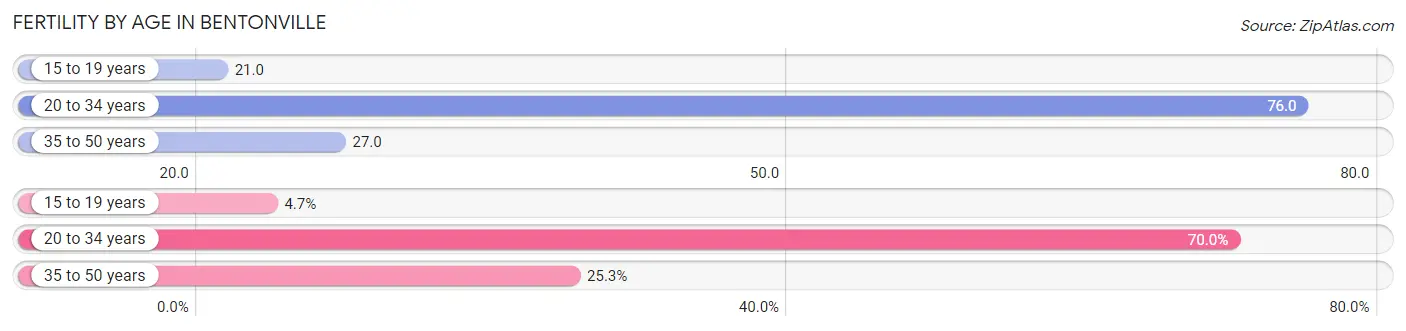
| Age Bracket | Women with Births | Births / 1,000 Women |
| 15 to 19 years | 33 (4.7%) | 21.0 |
| 20 to 34 years | 491 (70.0%) | 76.0 |
| 35 to 50 years | 177 (25.3%) | 27.0 |
| Total | 701 (100.0%) | 48.0 |
Fertility by Age by Marriage Status in Bentonville
74.3% of women with births (701) in Bentonville are married. The highest percentage of unmarried women with births falls into 15 to 19 years age bracket with 100.0% of them unmarried at the time of birth, while the lowest percentage of unmarried women with births belong to 35 to 50 years age bracket with 7.3% of them unmarried.
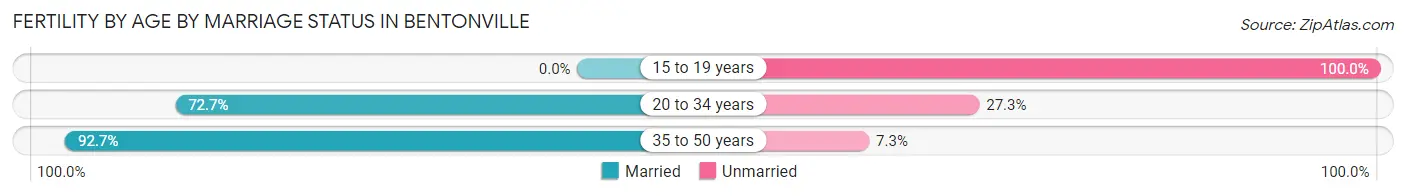
| Age Bracket | Married | Unmarried |
| 15 to 19 years | 0 (0.0%) | 33 (100.0%) |
| 20 to 34 years | 357 (72.7%) | 134 (27.3%) |
| 35 to 50 years | 164 (92.7%) | 13 (7.3%) |
| Total | 521 (74.3%) | 180 (25.7%) |
Fertility by Education in Bentonville
Average fertility rate in Bentonville is 48.0 births per 1,000 women. Women with the education attainment of bachelor's degree have the highest fertility rate of 73.0 births per 1,000 women, while women with the education attainment of less than high school have the lowest fertility at 7.0 births per 1,000 women. Women with the education attainment of bachelor's degree represent 45.9% of all women with births.
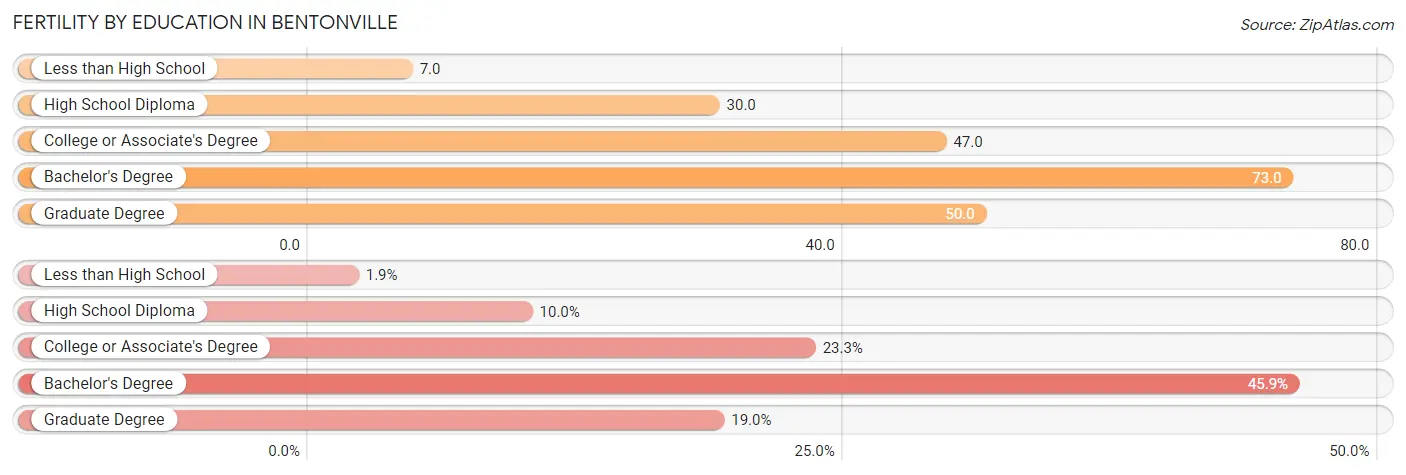
| Educational Attainment | Women with Births | Births / 1,000 Women |
| Less than High School | 13 (1.8%) | 7.0 |
| High School Diploma | 70 (10.0%) | 30.0 |
| College or Associate's Degree | 163 (23.3%) | 47.0 |
| Bachelor's Degree | 322 (45.9%) | 73.0 |
| Graduate Degree | 133 (19.0%) | 50.0 |
| Total | 701 (100.0%) | 48.0 |
Fertility by Education by Marriage Status in Bentonville
25.7% of women with births in Bentonville are unmarried. Women with the educational attainment of bachelor's degree are most likely to be married with 93.5% of them married at childbirth, while women with the educational attainment of less than high school are least likely to be married with 100.0% of them unmarried at childbirth.
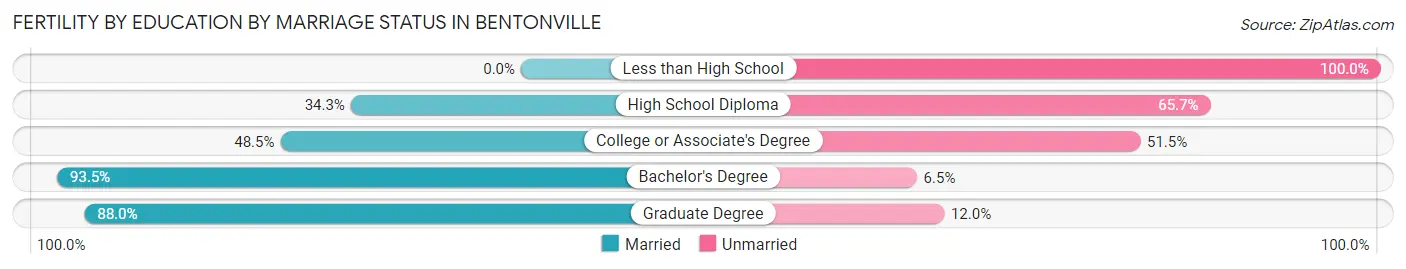
| Educational Attainment | Married | Unmarried |
| Less than High School | 0 (0.0%) | 13 (100.0%) |
| High School Diploma | 24 (34.3%) | 46 (65.7%) |
| College or Associate's Degree | 79 (48.5%) | 84 (51.5%) |
| Bachelor's Degree | 301 (93.5%) | 21 (6.5%) |
| Graduate Degree | 117 (88.0%) | 16 (12.0%) |
| Total | 521 (74.3%) | 180 (25.7%) |
Employment Characteristics in Bentonville
Employment by Class of Employer in Bentonville
Among the 28,569 employed individuals in Bentonville, private company employees (21,984 | 76.9%), self-employed (not incorporated) (2,011 | 7.0%), and not-for-profit organizations (1,890 | 6.6%) make up the most common classes of employment.
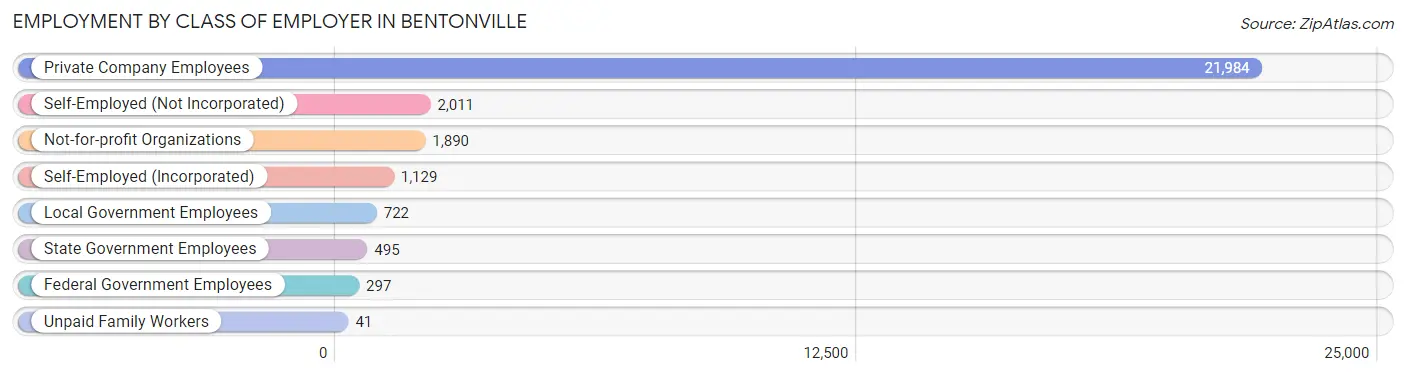
| Employer Class | # Employees | % Employees |
| Private Company Employees | 21,984 | 76.9% |
| Self-Employed (Incorporated) | 1,129 | 4.0% |
| Self-Employed (Not Incorporated) | 2,011 | 7.0% |
| Not-for-profit Organizations | 1,890 | 6.6% |
| Local Government Employees | 722 | 2.5% |
| State Government Employees | 495 | 1.7% |
| Federal Government Employees | 297 | 1.0% |
| Unpaid Family Workers | 41 | 0.1% |
| Total | 28,569 | 100.0% |
Employment Status by Age in Bentonville
According to the labor force statistics for Bentonville, out of the total population over 16 years of age (41,070), 72.7% or 29,858 individuals are in the labor force, with 3.2% or 955 of them unemployed. The age group with the highest labor force participation rate is 35 to 44 years, with 87.4% or 8,584 individuals in the labor force. Within the labor force, the 16 to 19 years age range has the highest percentage of unemployed individuals, with 15.5% or 148 of them being unemployed.
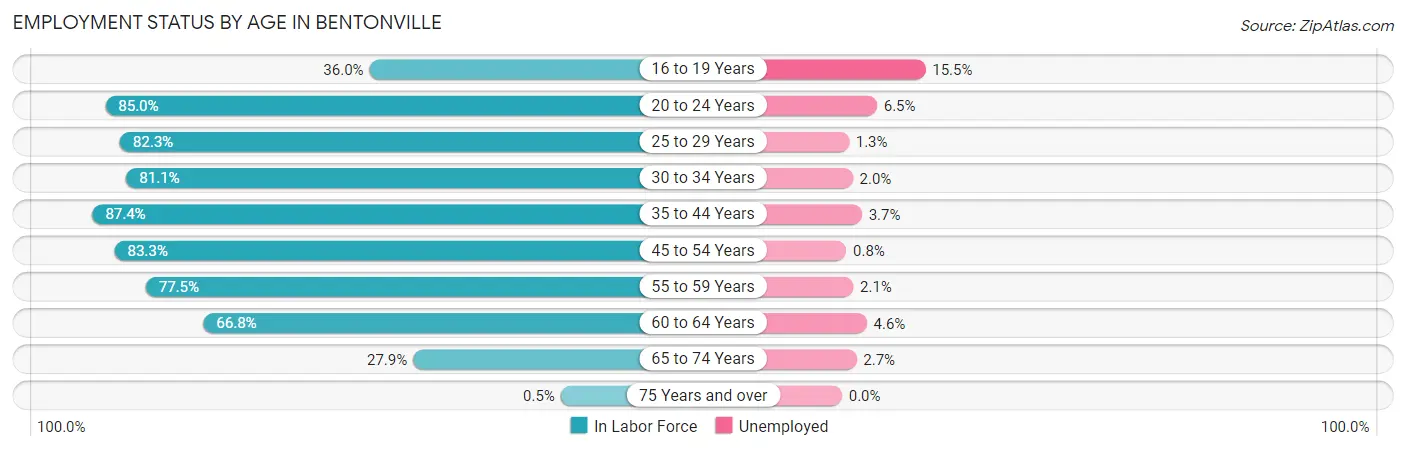
| Age Bracket | In Labor Force | Unemployed |
| 16 to 19 Years | 955 (36.0%) | 148 (15.5%) |
| 20 to 24 Years | 3,054 (85.0%) | 199 (6.5%) |
| 25 to 29 Years | 4,301 (82.3%) | 56 (1.3%) |
| 30 to 34 Years | 3,868 (81.1%) | 77 (2.0%) |
| 35 to 44 Years | 8,584 (87.4%) | 318 (3.7%) |
| 45 to 54 Years | 5,237 (83.3%) | 42 (0.8%) |
| 55 to 59 Years | 1,904 (77.5%) | 40 (2.1%) |
| 60 to 64 Years | 1,257 (66.8%) | 58 (4.6%) |
| 65 to 74 Years | 701 (27.9%) | 19 (2.7%) |
| 75 Years and over | 9 (0.5%) | 0 (0.0%) |
| Total | 29,858 (72.7%) | 955 (3.2%) |
Employment Status by Educational Attainment in Bentonville
According to labor force statistics for Bentonville, 82.6% of individuals (25,145) out of the total population between 25 and 64 years of age (30,442) are in the labor force, with 2.3% or 578 of them being unemployed. The group with the highest labor force participation rate are those with the educational attainment of bachelor's degree or higher, with 87.0% or 14,424 individuals in the labor force. Within the labor force, individuals with less than high school education have the highest percentage of unemployment, with 4.9% or 33 of them being unemployed.
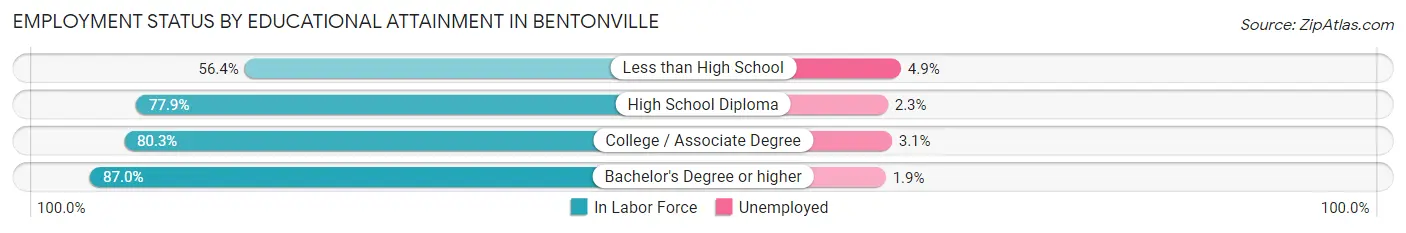
| Educational Attainment | In Labor Force | Unemployed |
| Less than High School | 669 (56.4%) | 58 (4.9%) |
| High School Diploma | 4,189 (77.9%) | 124 (2.3%) |
| College / Associate Degree | 5,861 (80.3%) | 226 (3.1%) |
| Bachelor's Degree or higher | 14,424 (87.0%) | 315 (1.9%) |
| Total | 25,145 (82.6%) | 700 (2.3%) |
Employment Occupations by Sex in Bentonville
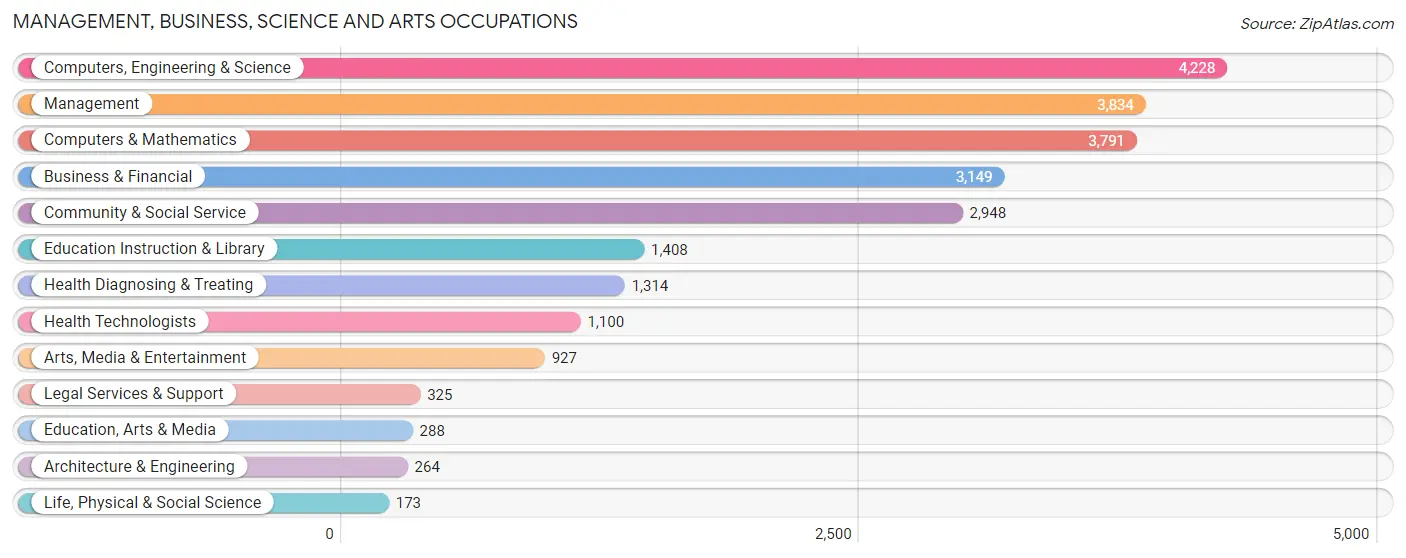
Management, Business, Science and Arts Occupations
The most common Management, Business, Science and Arts occupations in Bentonville are Computers, Engineering & Science (4,228 | 14.6%), Management (3,834 | 13.3%), Computers & Mathematics (3,791 | 13.1%), Business & Financial (3,149 | 10.9%), and Community & Social Service (2,948 | 10.2%).
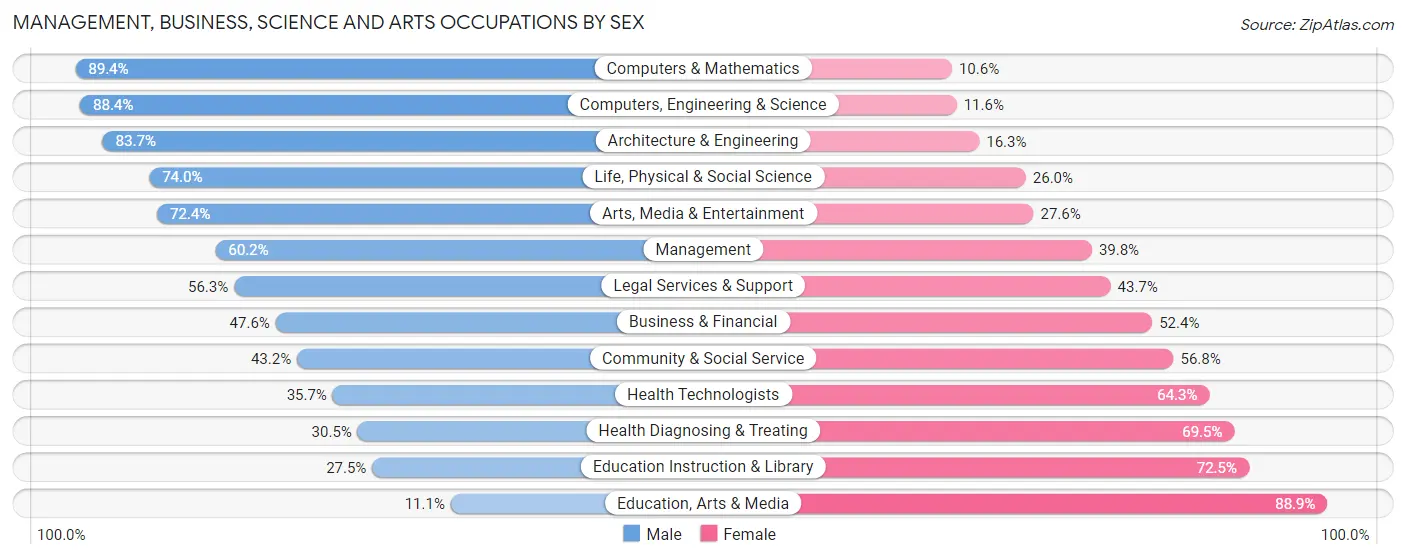
Management, Business, Science and Arts Occupations by Sex
Within the Management, Business, Science and Arts occupations in Bentonville, the most male-oriented occupations are Computers & Mathematics (89.4%), Computers, Engineering & Science (88.4%), and Architecture & Engineering (83.7%), while the most female-oriented occupations are Education, Arts & Media (88.9%), Education Instruction & Library (72.5%), and Health Diagnosing & Treating (69.5%).
| Occupation | Male | Female |
| Management | 2,308 (60.2%) | 1,526 (39.8%) |
| Business & Financial | 1,500 (47.6%) | 1,649 (52.4%) |
| Computers, Engineering & Science | 3,738 (88.4%) | 490 (11.6%) |
| Computers & Mathematics | 3,389 (89.4%) | 402 (10.6%) |
| Architecture & Engineering | 221 (83.7%) | 43 (16.3%) |
| Life, Physical & Social Science | 128 (74.0%) | 45 (26.0%) |
| Community & Social Service | 1,273 (43.2%) | 1,675 (56.8%) |
| Education, Arts & Media | 32 (11.1%) | 256 (88.9%) |
| Legal Services & Support | 183 (56.3%) | 142 (43.7%) |
| Education Instruction & Library | 387 (27.5%) | 1,021 (72.5%) |
| Arts, Media & Entertainment | 671 (72.4%) | 256 (27.6%) |
| Health Diagnosing & Treating | 401 (30.5%) | 913 (69.5%) |
| Health Technologists | 393 (35.7%) | 707 (64.3%) |
| Total (Category) | 9,220 (59.6%) | 6,253 (40.4%) |
| Total (Overall) | 16,515 (57.2%) | 12,366 (42.8%) |
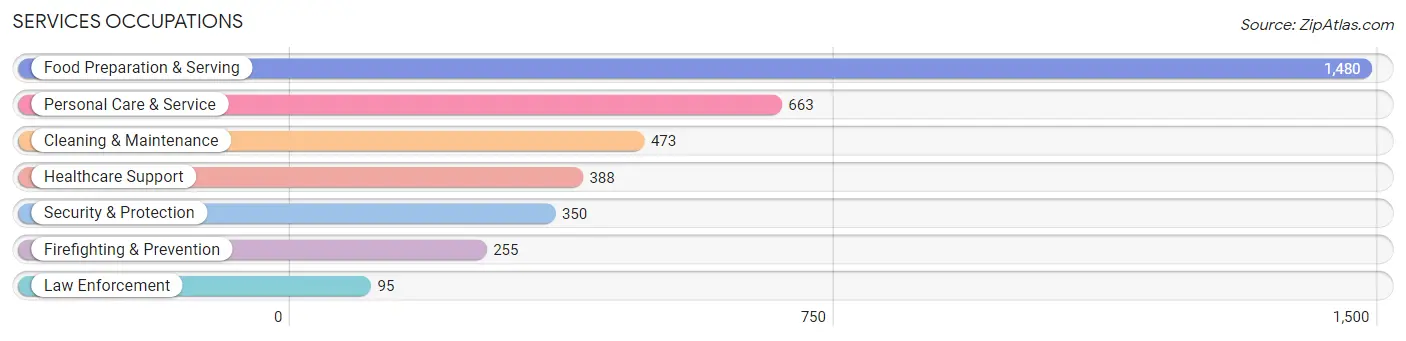
Services Occupations
The most common Services occupations in Bentonville are Food Preparation & Serving (1,480 | 5.1%), Personal Care & Service (663 | 2.3%), Cleaning & Maintenance (473 | 1.6%), Healthcare Support (388 | 1.3%), and Security & Protection (350 | 1.2%).
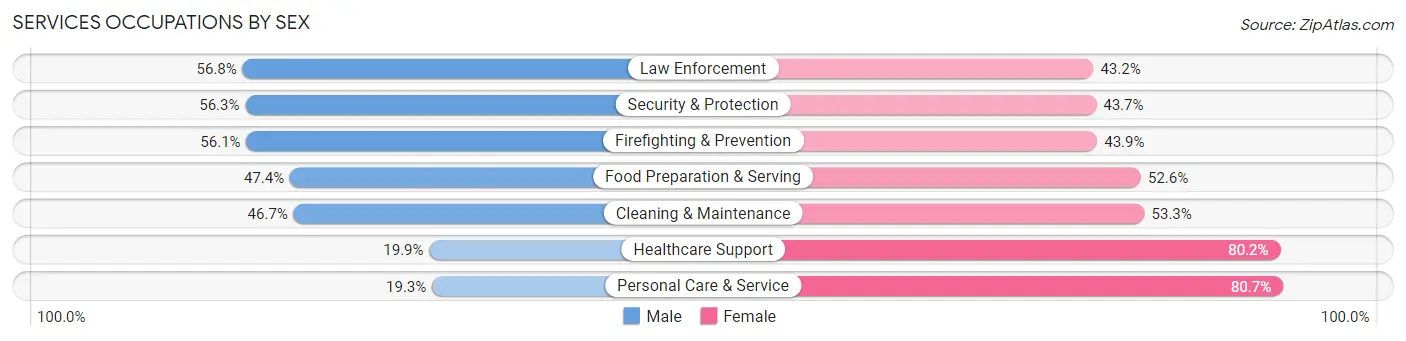
Services Occupations by Sex
Within the Services occupations in Bentonville, the most male-oriented occupations are Law Enforcement (56.8%), Security & Protection (56.3%), and Firefighting & Prevention (56.1%), while the most female-oriented occupations are Personal Care & Service (80.7%), Healthcare Support (80.1%), and Cleaning & Maintenance (53.3%).
| Occupation | Male | Female |
| Healthcare Support | 77 (19.9%) | 311 (80.1%) |
| Security & Protection | 197 (56.3%) | 153 (43.7%) |
| Firefighting & Prevention | 143 (56.1%) | 112 (43.9%) |
| Law Enforcement | 54 (56.8%) | 41 (43.2%) |
| Food Preparation & Serving | 702 (47.4%) | 778 (52.6%) |
| Cleaning & Maintenance | 221 (46.7%) | 252 (53.3%) |
| Personal Care & Service | 128 (19.3%) | 535 (80.7%) |
| Total (Category) | 1,325 (39.5%) | 2,029 (60.5%) |
| Total (Overall) | 16,515 (57.2%) | 12,366 (42.8%) |
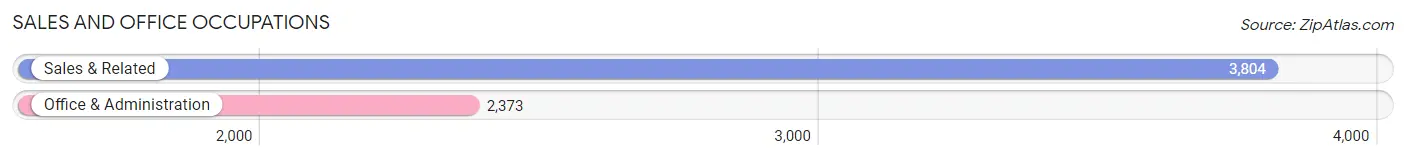
Sales and Office Occupations
The most common Sales and Office occupations in Bentonville are Sales & Related (3,804 | 13.2%), and Office & Administration (2,373 | 8.2%).
Sales and Office Occupations by Sex
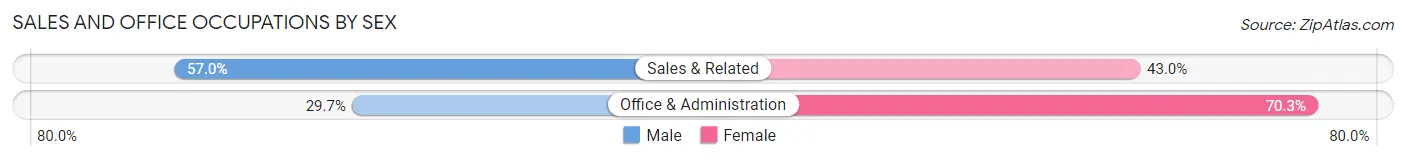
| Occupation | Male | Female |
| Sales & Related | 2,168 (57.0%) | 1,636 (43.0%) |
| Office & Administration | 704 (29.7%) | 1,669 (70.3%) |
| Total (Category) | 2,872 (46.5%) | 3,305 (53.5%) |
| Total (Overall) | 16,515 (57.2%) | 12,366 (42.8%) |
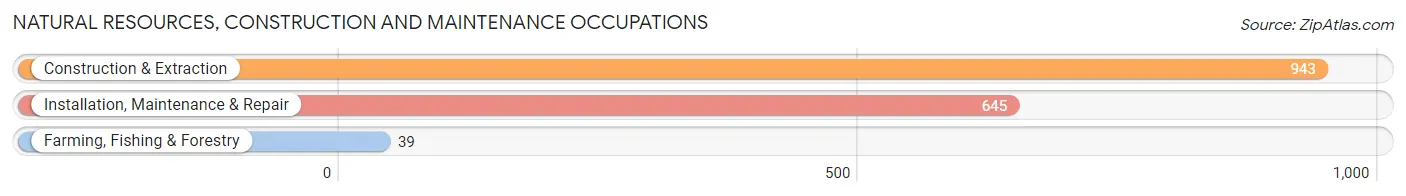
Natural Resources, Construction and Maintenance Occupations
The most common Natural Resources, Construction and Maintenance occupations in Bentonville are Construction & Extraction (943 | 3.3%), Installation, Maintenance & Repair (645 | 2.2%), and Farming, Fishing & Forestry (39 | 0.1%).
Natural Resources, Construction and Maintenance Occupations by Sex
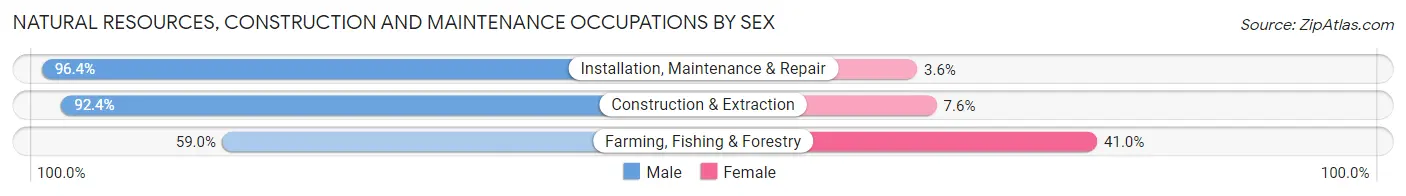
| Occupation | Male | Female |
| Farming, Fishing & Forestry | 23 (59.0%) | 16 (41.0%) |
| Construction & Extraction | 871 (92.4%) | 72 (7.6%) |
| Installation, Maintenance & Repair | 622 (96.4%) | 23 (3.6%) |
| Total (Category) | 1,516 (93.2%) | 111 (6.8%) |
| Total (Overall) | 16,515 (57.2%) | 12,366 (42.8%) |
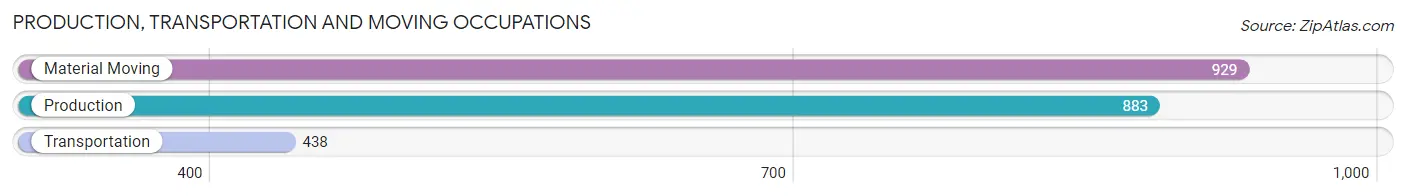
Production, Transportation and Moving Occupations
The most common Production, Transportation and Moving occupations in Bentonville are Material Moving (929 | 3.2%), Production (883 | 3.1%), and Transportation (438 | 1.5%).
Production, Transportation and Moving Occupations by Sex
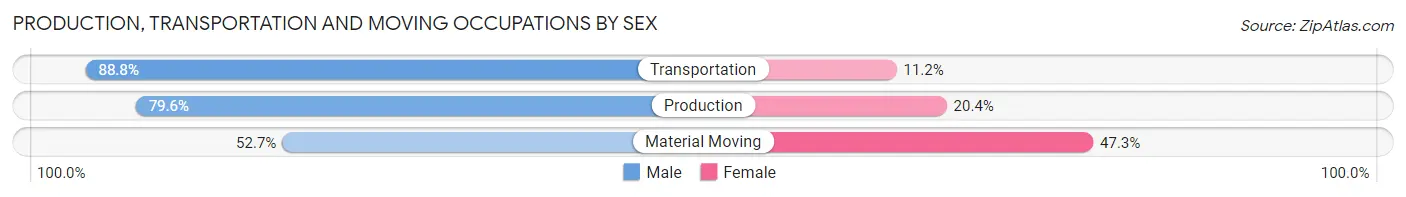
| Occupation | Male | Female |
| Production | 703 (79.6%) | 180 (20.4%) |
| Transportation | 389 (88.8%) | 49 (11.2%) |
| Material Moving | 490 (52.7%) | 439 (47.3%) |
| Total (Category) | 1,582 (70.3%) | 668 (29.7%) |
| Total (Overall) | 16,515 (57.2%) | 12,366 (42.8%) |
Employment Industries by Sex in Bentonville
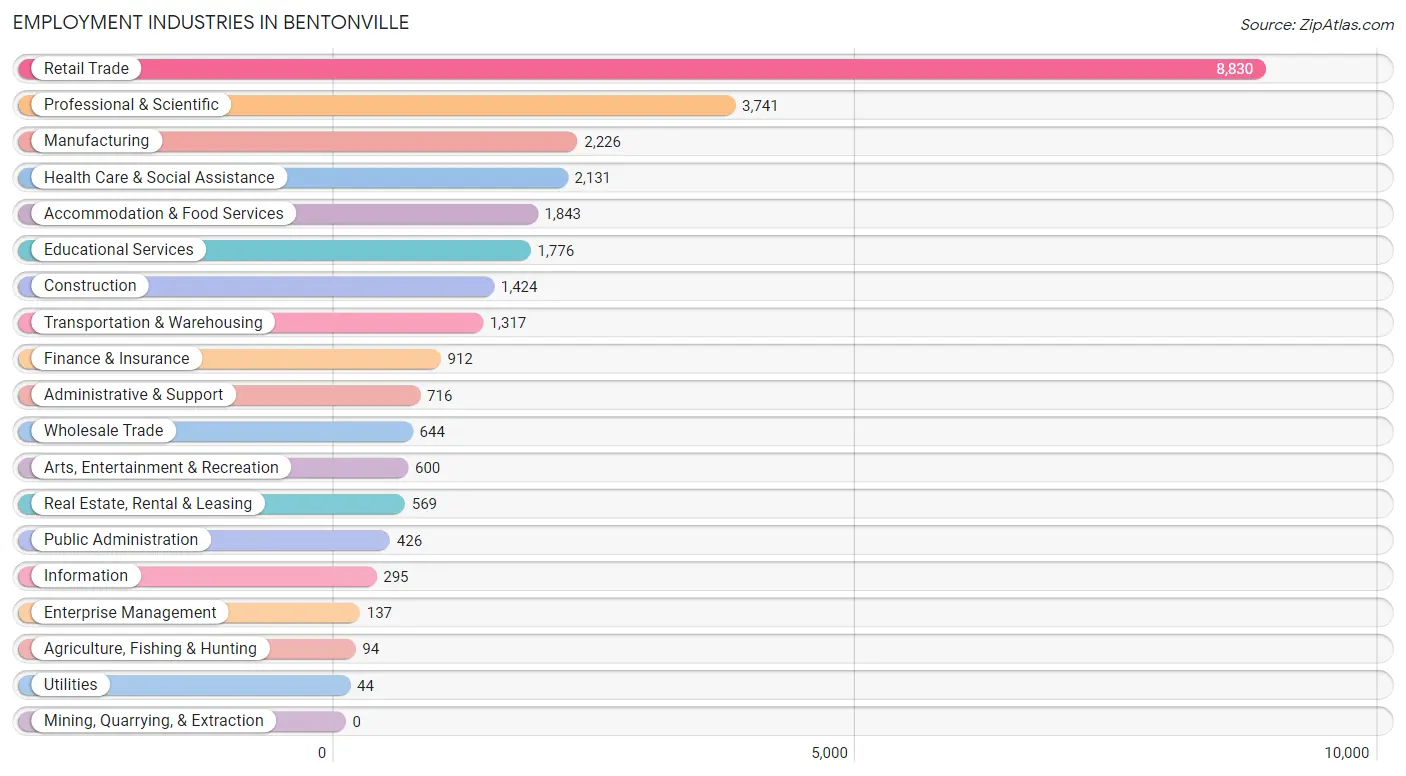
Employment Industries in Bentonville
The major employment industries in Bentonville include Retail Trade (8,830 | 30.6%), Professional & Scientific (3,741 | 13.0%), Manufacturing (2,226 | 7.7%), Health Care & Social Assistance (2,131 | 7.4%), and Accommodation & Food Services (1,843 | 6.4%).
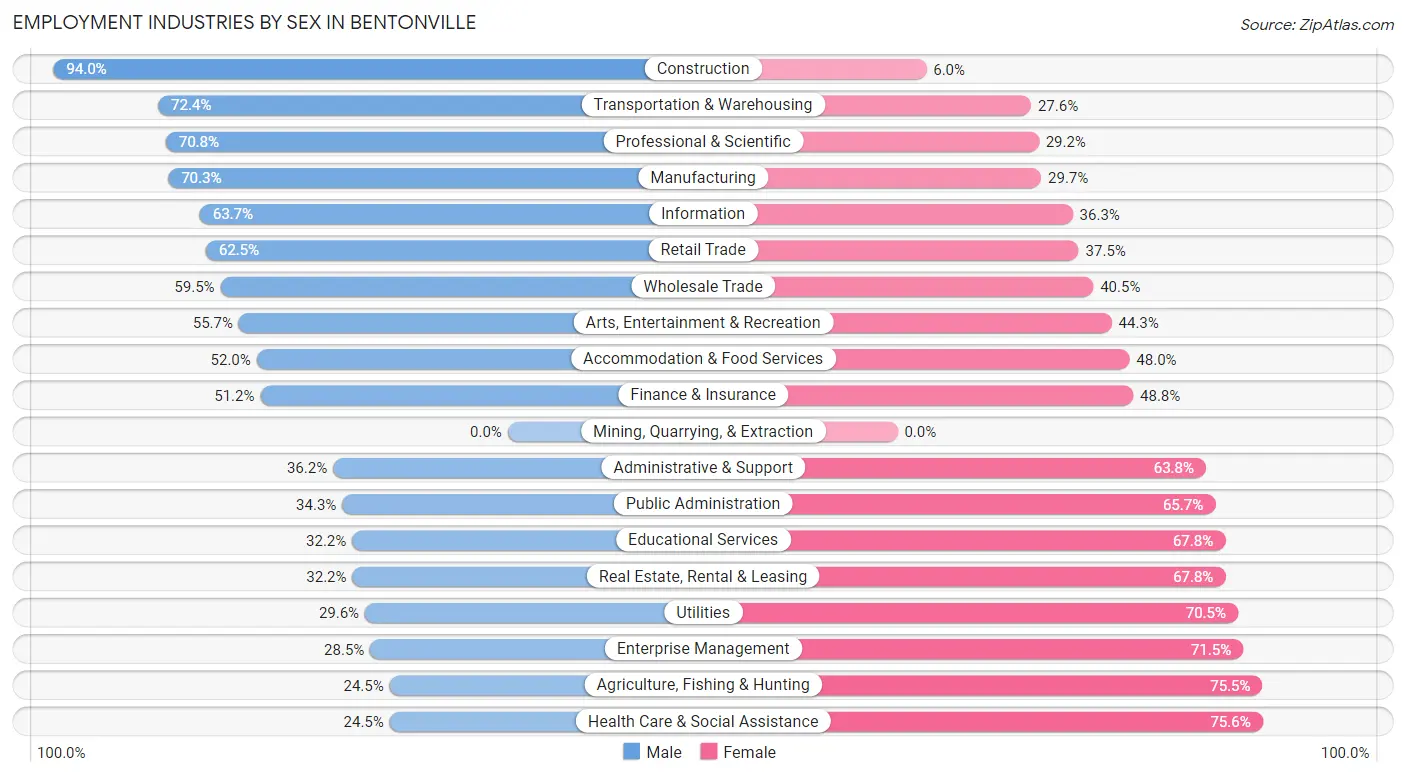
Employment Industries by Sex in Bentonville
The Bentonville industries that see more men than women are Construction (94.0%), Transportation & Warehousing (72.4%), and Professional & Scientific (70.8%), whereas the industries that tend to have a higher number of women are Health Care & Social Assistance (75.5%), Agriculture, Fishing & Hunting (75.5%), and Enterprise Management (71.5%).
| Industry | Male | Female |
| Agriculture, Fishing & Hunting | 23 (24.5%) | 71 (75.5%) |
| Mining, Quarrying, & Extraction | 0 (0.0%) | 0 (0.0%) |
| Construction | 1,339 (94.0%) | 85 (6.0%) |
| Manufacturing | 1,564 (70.3%) | 662 (29.7%) |
| Wholesale Trade | 383 (59.5%) | 261 (40.5%) |
| Retail Trade | 5,518 (62.5%) | 3,312 (37.5%) |
| Transportation & Warehousing | 953 (72.4%) | 364 (27.6%) |
| Utilities | 13 (29.5%) | 31 (70.5%) |
| Information | 188 (63.7%) | 107 (36.3%) |
| Finance & Insurance | 467 (51.2%) | 445 (48.8%) |
| Real Estate, Rental & Leasing | 183 (32.2%) | 386 (67.8%) |
| Professional & Scientific | 2,647 (70.8%) | 1,094 (29.2%) |
| Enterprise Management | 39 (28.5%) | 98 (71.5%) |
| Administrative & Support | 259 (36.2%) | 457 (63.8%) |
| Educational Services | 572 (32.2%) | 1,204 (67.8%) |
| Health Care & Social Assistance | 521 (24.4%) | 1,610 (75.5%) |
| Arts, Entertainment & Recreation | 334 (55.7%) | 266 (44.3%) |
| Accommodation & Food Services | 958 (52.0%) | 885 (48.0%) |
| Public Administration | 146 (34.3%) | 280 (65.7%) |
| Total | 16,515 (57.2%) | 12,366 (42.8%) |
Education in Bentonville
School Enrollment in Bentonville
The most common levels of schooling among the 14,208 students in Bentonville are elementary school (3,883 | 27.3%), high school (2,803 | 19.7%), and middle school (2,748 | 19.3%).
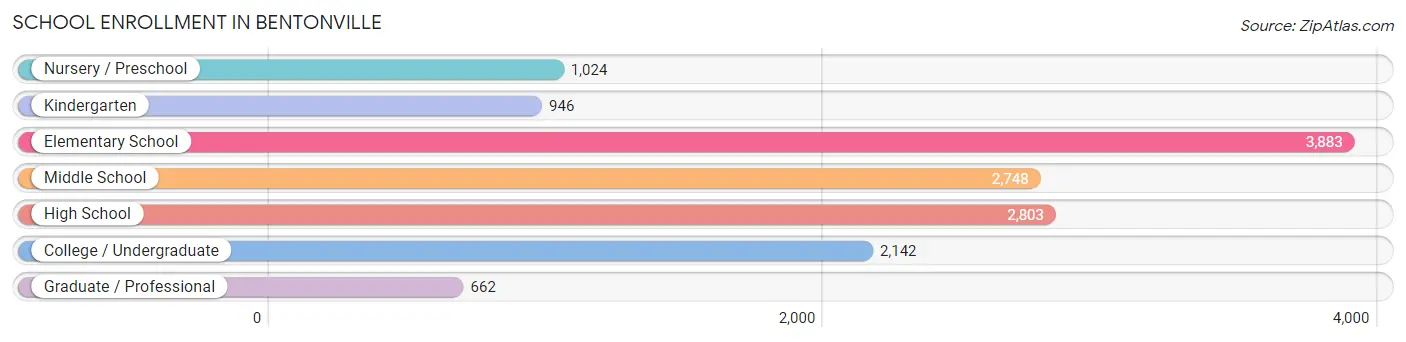
| School Level | # Students | % Students |
| Nursery / Preschool | 1,024 | 7.2% |
| Kindergarten | 946 | 6.7% |
| Elementary School | 3,883 | 27.3% |
| Middle School | 2,748 | 19.3% |
| High School | 2,803 | 19.7% |
| College / Undergraduate | 2,142 | 15.1% |
| Graduate / Professional | 662 | 4.7% |
| Total | 14,208 | 100.0% |
School Enrollment by Age by Funding Source in Bentonville
Out of a total of 14,208 students who are enrolled in schools in Bentonville, 2,089 (14.7%) attend a private institution, while the remaining 12,119 (85.3%) are enrolled in public schools. The age group of 3 to 4 year olds has the highest likelihood of being enrolled in private schools, with 377 (47.5% in the age bracket) enrolled. Conversely, the age group of 18 to 19 year olds has the lowest likelihood of being enrolled in a private school, with 731 (93.5% in the age bracket) attending a public institution.
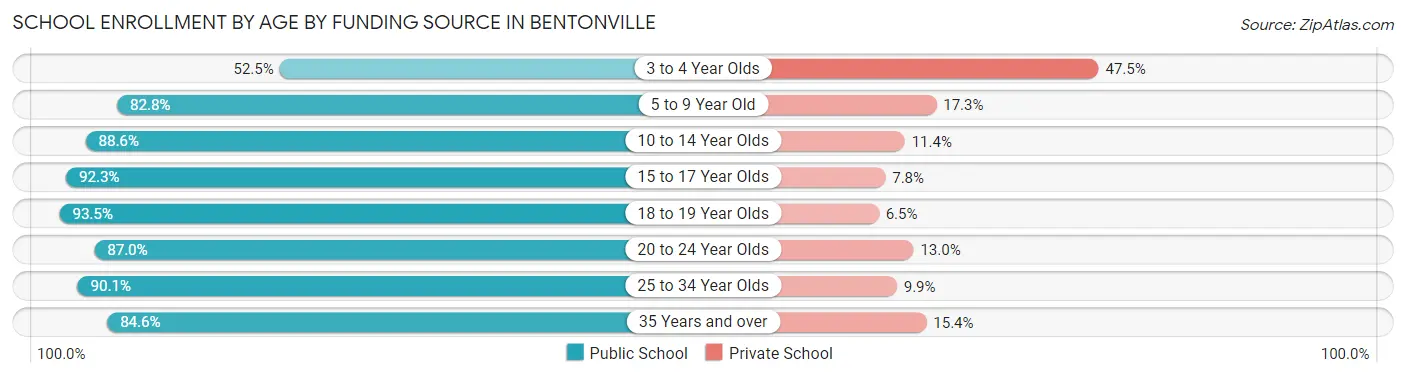
| Age Bracket | Public School | Private School |
| 3 to 4 Year Olds | 417 (52.5%) | 377 (47.5%) |
| 5 to 9 Year Old | 3,776 (82.8%) | 787 (17.2%) |
| 10 to 14 Year Olds | 3,127 (88.6%) | 401 (11.4%) |
| 15 to 17 Year Olds | 2,048 (92.2%) | 172 (7.7%) |
| 18 to 19 Year Olds | 731 (93.5%) | 51 (6.5%) |
| 20 to 24 Year Olds | 776 (87.0%) | 116 (13.0%) |
| 25 to 34 Year Olds | 638 (90.1%) | 70 (9.9%) |
| 35 Years and over | 610 (84.6%) | 111 (15.4%) |
| Total | 12,119 (85.3%) | 2,089 (14.7%) |
Educational Attainment by Field of Study in Bentonville
Business (5,167 | 26.3%), computers & mathematics (2,545 | 13.0%), engineering (2,062 | 10.5%), science & technology (1,631 | 8.3%), and education (1,489 | 7.6%) are the most common fields of study among 19,619 individuals in Bentonville who have obtained a bachelor's degree or higher.
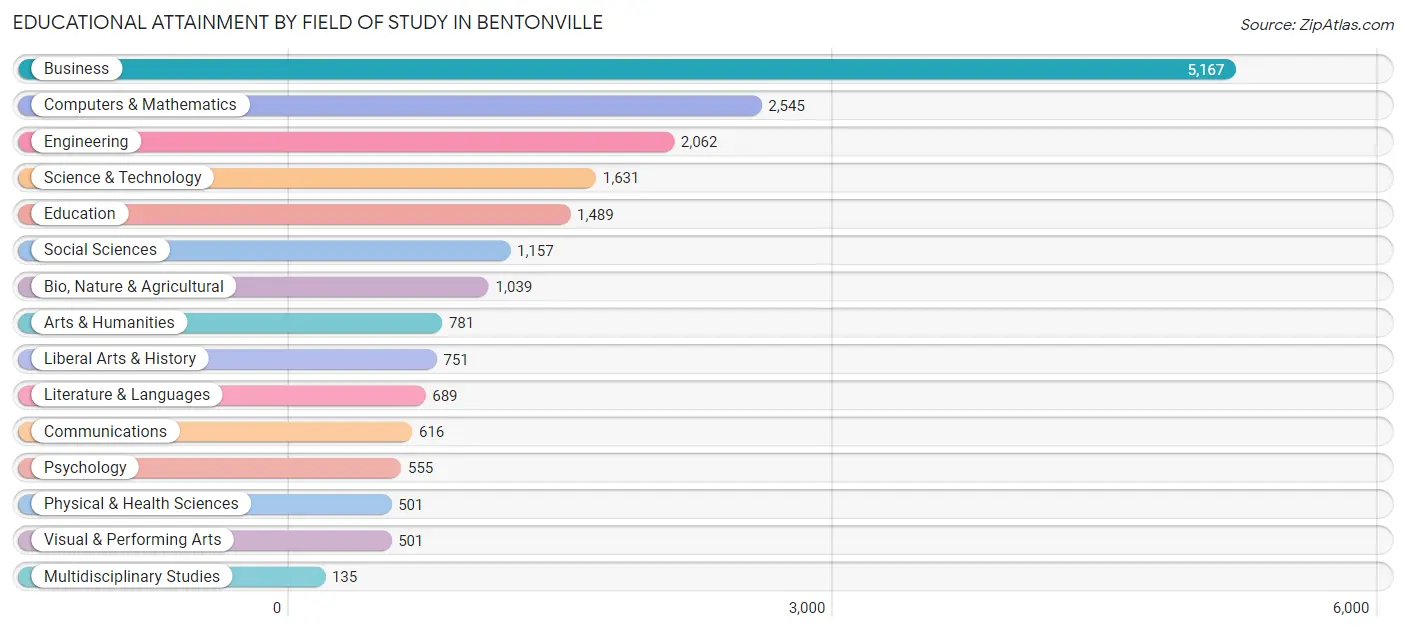
| Field of Study | # Graduates | % Graduates |
| Computers & Mathematics | 2,545 | 13.0% |
| Bio, Nature & Agricultural | 1,039 | 5.3% |
| Physical & Health Sciences | 501 | 2.5% |
| Psychology | 555 | 2.8% |
| Social Sciences | 1,157 | 5.9% |
| Engineering | 2,062 | 10.5% |
| Multidisciplinary Studies | 135 | 0.7% |
| Science & Technology | 1,631 | 8.3% |
| Business | 5,167 | 26.3% |
| Education | 1,489 | 7.6% |
| Literature & Languages | 689 | 3.5% |
| Liberal Arts & History | 751 | 3.8% |
| Visual & Performing Arts | 501 | 2.5% |
| Communications | 616 | 3.1% |
| Arts & Humanities | 781 | 4.0% |
| Total | 19,619 | 100.0% |
Transportation & Commute in Bentonville
Vehicle Availability by Sex in Bentonville
The most prevalent vehicle ownership categories in Bentonville are males with 2 vehicles (7,293, accounting for 44.4%) and females with 2 vehicles (5,719, making up 60.3%).
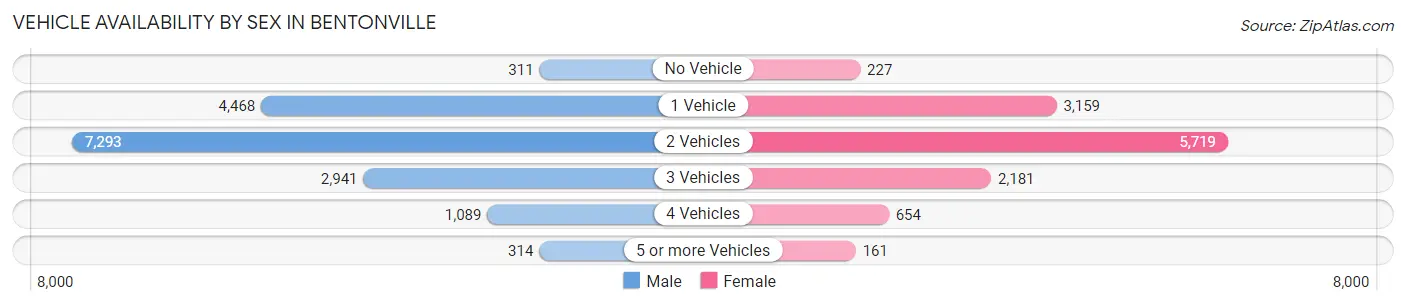
| Vehicles Available | Male | Female |
| No Vehicle | 311 (1.9%) | 227 (1.9%) |
| 1 Vehicle | 4,468 (27.2%) | 3,159 (26.1%) |
| 2 Vehicles | 7,293 (44.4%) | 5,719 (47.3%) |
| 3 Vehicles | 2,941 (17.9%) | 2,181 (18.0%) |
| 4 Vehicles | 1,089 (6.6%) | 654 (5.4%) |
| 5 or more Vehicles | 314 (1.9%) | 161 (1.3%) |
| Total | 16,416 (100.0%) | 12,101 (100.0%) |
Commute Time in Bentonville
The most frequently occuring commute durations in Bentonville are 15 to 19 minutes (5,729 commuters, 24.3%), 10 to 14 minutes (4,673 commuters, 19.8%), and 20 to 24 minutes (3,846 commuters, 16.3%).
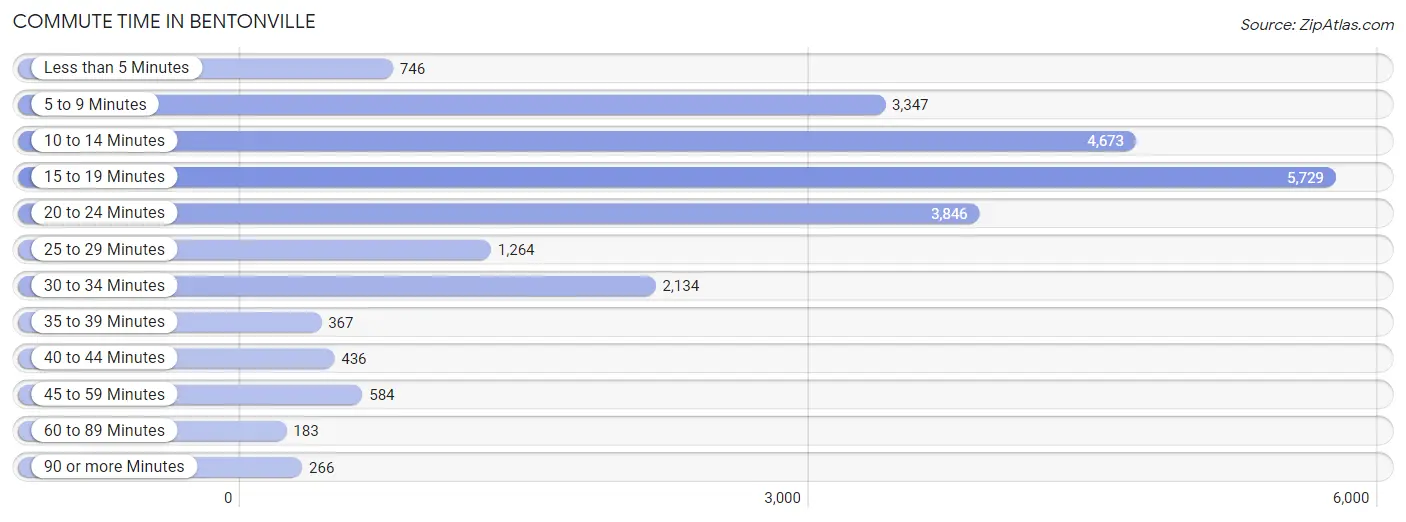
| Commute Time | # Commuters | % Commuters |
| Less than 5 Minutes | 746 | 3.2% |
| 5 to 9 Minutes | 3,347 | 14.2% |
| 10 to 14 Minutes | 4,673 | 19.8% |
| 15 to 19 Minutes | 5,729 | 24.3% |
| 20 to 24 Minutes | 3,846 | 16.3% |
| 25 to 29 Minutes | 1,264 | 5.4% |
| 30 to 34 Minutes | 2,134 | 9.0% |
| 35 to 39 Minutes | 367 | 1.6% |
| 40 to 44 Minutes | 436 | 1.8% |
| 45 to 59 Minutes | 584 | 2.5% |
| 60 to 89 Minutes | 183 | 0.8% |
| 90 or more Minutes | 266 | 1.1% |
Commute Time by Sex in Bentonville
The most common commute times in Bentonville are 15 to 19 minutes (3,578 commuters, 26.3%) for males and 15 to 19 minutes (2,151 commuters, 21.6%) for females.
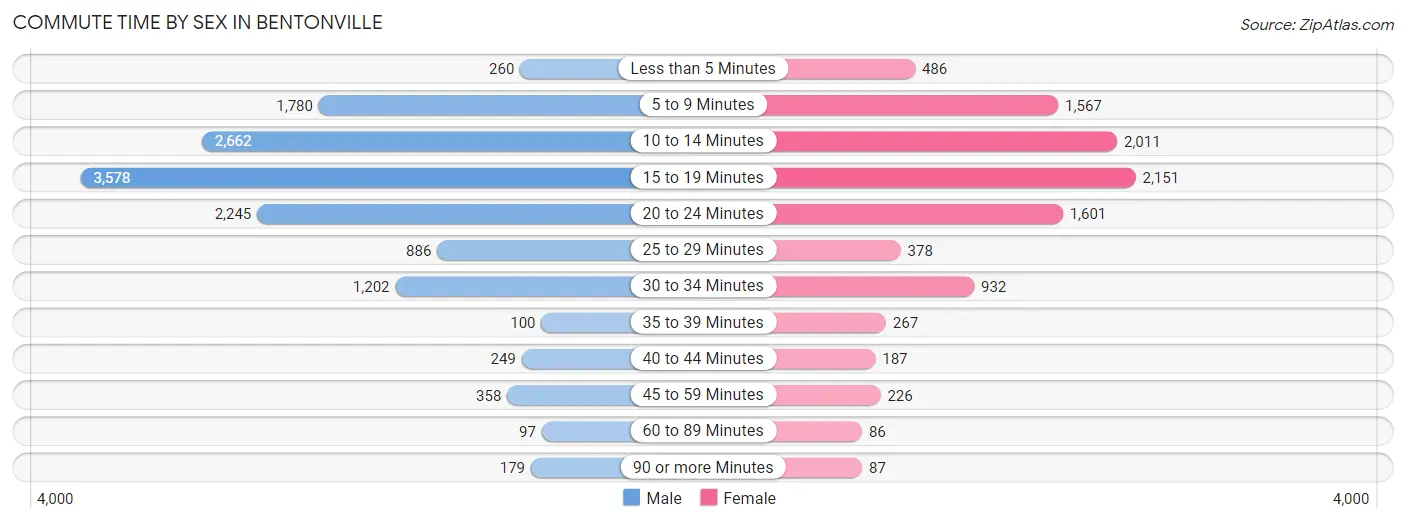
| Commute Time | Male | Female |
| Less than 5 Minutes | 260 (1.9%) | 486 (4.9%) |
| 5 to 9 Minutes | 1,780 (13.1%) | 1,567 (15.7%) |
| 10 to 14 Minutes | 2,662 (19.6%) | 2,011 (20.2%) |
| 15 to 19 Minutes | 3,578 (26.3%) | 2,151 (21.6%) |
| 20 to 24 Minutes | 2,245 (16.5%) | 1,601 (16.0%) |
| 25 to 29 Minutes | 886 (6.5%) | 378 (3.8%) |
| 30 to 34 Minutes | 1,202 (8.8%) | 932 (9.3%) |
| 35 to 39 Minutes | 100 (0.7%) | 267 (2.7%) |
| 40 to 44 Minutes | 249 (1.8%) | 187 (1.9%) |
| 45 to 59 Minutes | 358 (2.6%) | 226 (2.3%) |
| 60 to 89 Minutes | 97 (0.7%) | 86 (0.9%) |
| 90 or more Minutes | 179 (1.3%) | 87 (0.9%) |
Time of Departure to Work by Sex in Bentonville
The most frequent times of departure to work in Bentonville are 7:00 AM to 7:29 AM (2,916, 21.4%) for males and 7:00 AM to 7:29 AM (2,748, 27.5%) for females.
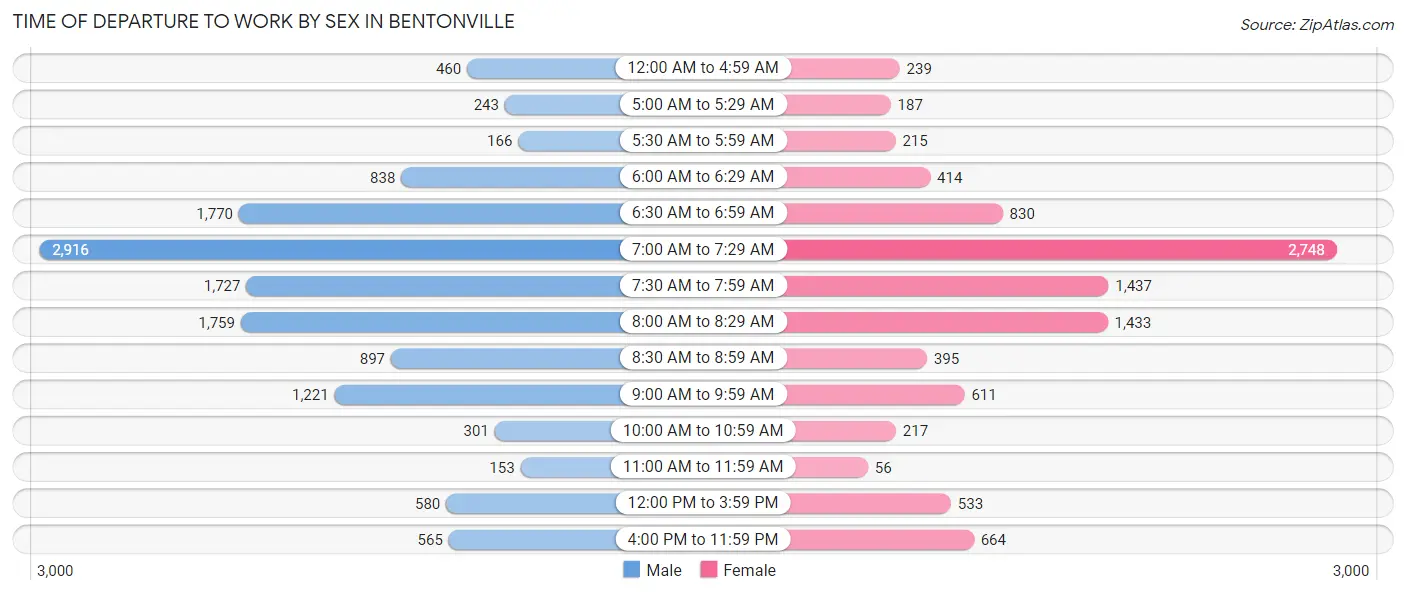
| Time of Departure | Male | Female |
| 12:00 AM to 4:59 AM | 460 (3.4%) | 239 (2.4%) |
| 5:00 AM to 5:29 AM | 243 (1.8%) | 187 (1.9%) |
| 5:30 AM to 5:59 AM | 166 (1.2%) | 215 (2.1%) |
| 6:00 AM to 6:29 AM | 838 (6.2%) | 414 (4.2%) |
| 6:30 AM to 6:59 AM | 1,770 (13.0%) | 830 (8.3%) |
| 7:00 AM to 7:29 AM | 2,916 (21.4%) | 2,748 (27.5%) |
| 7:30 AM to 7:59 AM | 1,727 (12.7%) | 1,437 (14.4%) |
| 8:00 AM to 8:29 AM | 1,759 (12.9%) | 1,433 (14.4%) |
| 8:30 AM to 8:59 AM | 897 (6.6%) | 395 (4.0%) |
| 9:00 AM to 9:59 AM | 1,221 (9.0%) | 611 (6.1%) |
| 10:00 AM to 10:59 AM | 301 (2.2%) | 217 (2.2%) |
| 11:00 AM to 11:59 AM | 153 (1.1%) | 56 (0.6%) |
| 12:00 PM to 3:59 PM | 580 (4.3%) | 533 (5.3%) |
| 4:00 PM to 11:59 PM | 565 (4.2%) | 664 (6.7%) |
| Total | 13,596 (100.0%) | 9,979 (100.0%) |
Housing Occupancy in Bentonville
Occupancy by Ownership in Bentonville
Of the total 20,841 dwellings in Bentonville, owner-occupied units account for 10,871 (52.2%), while renter-occupied units make up 9,970 (47.8%).
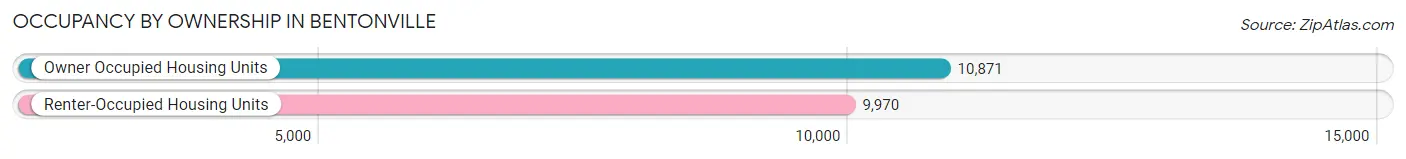
| Occupancy | # Housing Units | % Housing Units |
| Owner Occupied Housing Units | 10,871 | 52.2% |
| Renter-Occupied Housing Units | 9,970 | 47.8% |
| Total Occupied Housing Units | 20,841 | 100.0% |
Occupancy by Household Size in Bentonville
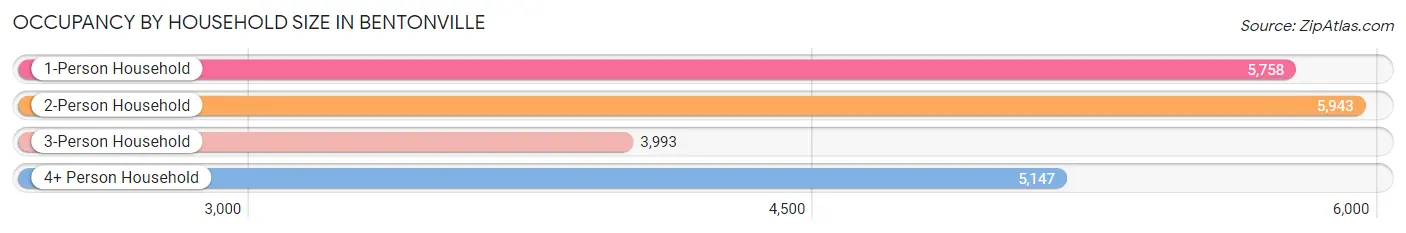
| Household Size | # Housing Units | % Housing Units |
| 1-Person Household | 5,758 | 27.6% |
| 2-Person Household | 5,943 | 28.5% |
| 3-Person Household | 3,993 | 19.2% |
| 4+ Person Household | 5,147 | 24.7% |
| Total Housing Units | 20,841 | 100.0% |
Occupancy by Ownership by Household Size in Bentonville
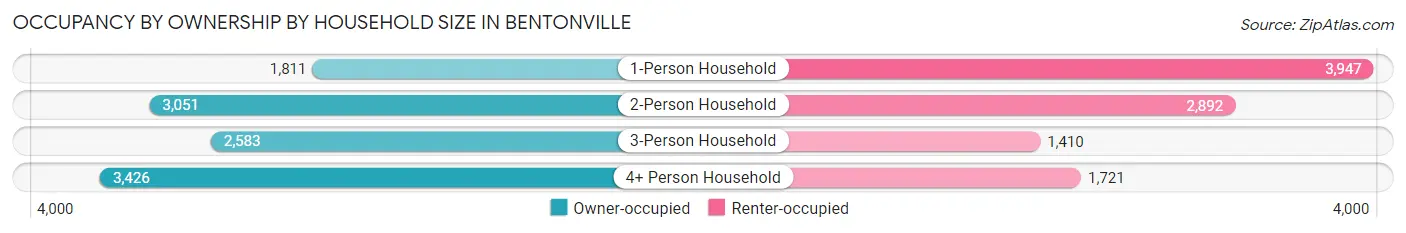
| Household Size | Owner-occupied | Renter-occupied |
| 1-Person Household | 1,811 (31.5%) | 3,947 (68.5%) |
| 2-Person Household | 3,051 (51.3%) | 2,892 (48.7%) |
| 3-Person Household | 2,583 (64.7%) | 1,410 (35.3%) |
| 4+ Person Household | 3,426 (66.6%) | 1,721 (33.4%) |
| Total Housing Units | 10,871 (52.2%) | 9,970 (47.8%) |
Occupancy by Educational Attainment in Bentonville
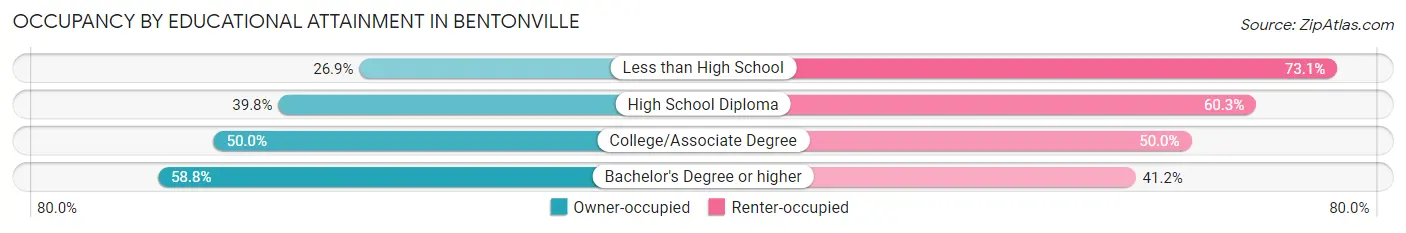
| Household Size | Owner-occupied | Renter-occupied |
| Less than High School | 148 (26.9%) | 402 (73.1%) |
| High School Diploma | 1,520 (39.8%) | 2,304 (60.3%) |
| College/Associate Degree | 2,754 (50.0%) | 2,752 (50.0%) |
| Bachelor's Degree or higher | 6,449 (58.8%) | 4,512 (41.2%) |
Occupancy by Age of Householder in Bentonville
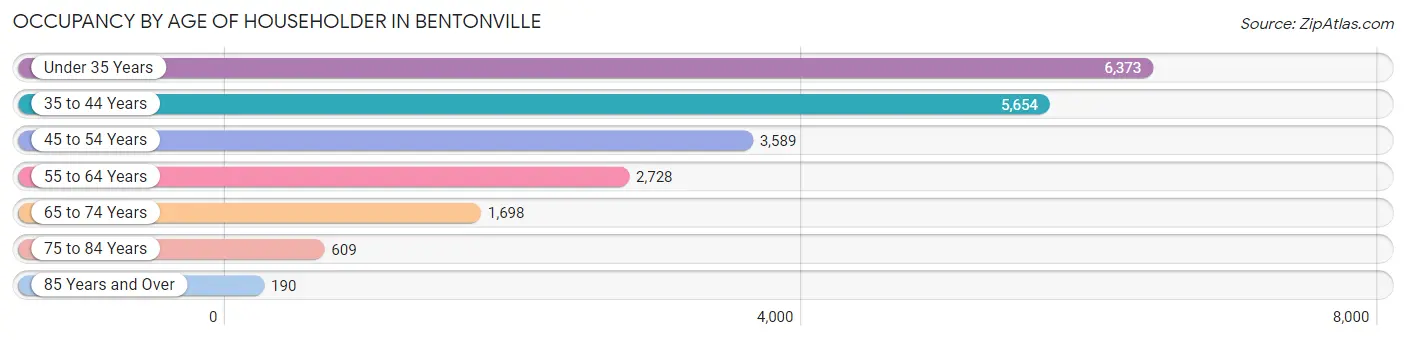
| Age Bracket | # Households | % Households |
| Under 35 Years | 6,373 | 30.6% |
| 35 to 44 Years | 5,654 | 27.1% |
| 45 to 54 Years | 3,589 | 17.2% |
| 55 to 64 Years | 2,728 | 13.1% |
| 65 to 74 Years | 1,698 | 8.2% |
| 75 to 84 Years | 609 | 2.9% |
| 85 Years and Over | 190 | 0.9% |
| Total | 20,841 | 100.0% |
Housing Finances in Bentonville
Median Income by Occupancy in Bentonville
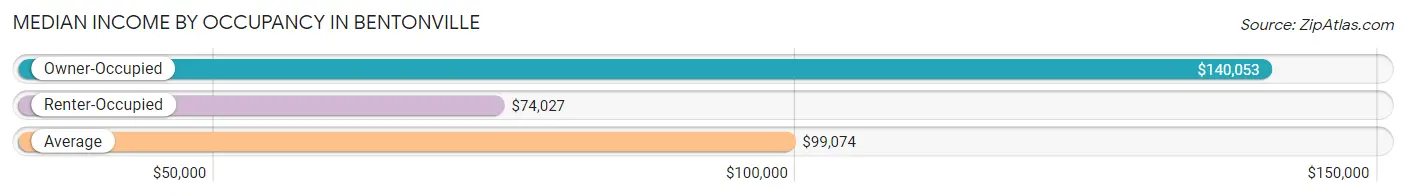
| Occupancy Type | # Households | Median Income |
| Owner-Occupied | 10,871 (52.2%) | $140,053 |
| Renter-Occupied | 9,970 (47.8%) | $74,027 |
| Average | 20,841 (100.0%) | $99,074 |
Occupancy by Householder Income Bracket in Bentonville
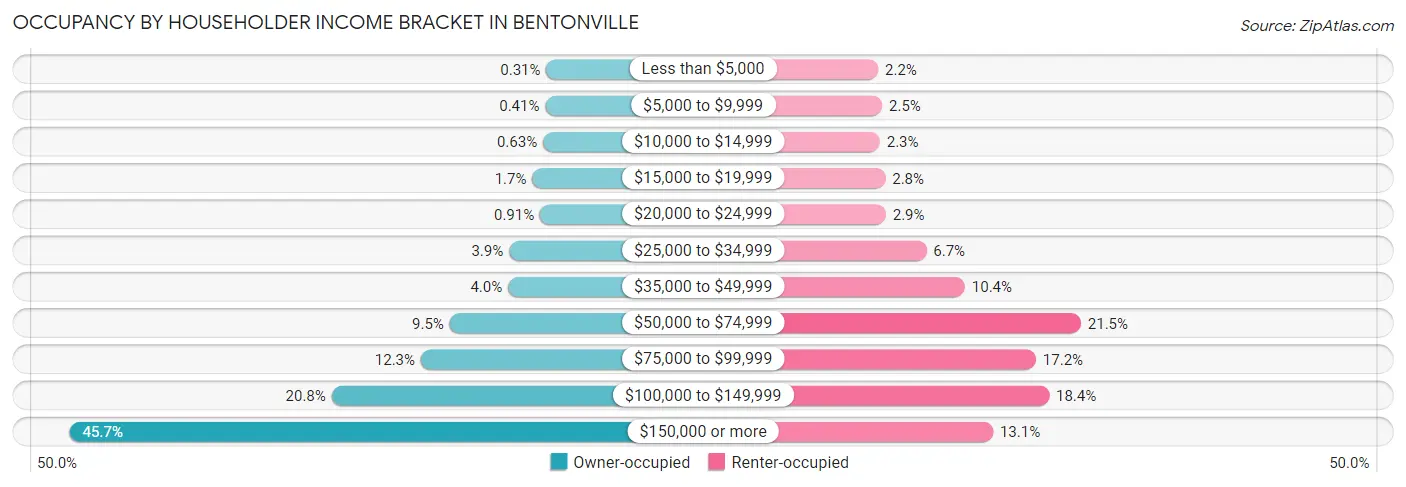
| Income Bracket | Owner-occupied | Renter-occupied |
| Less than $5,000 | 34 (0.3%) | 214 (2.1%) |
| $5,000 to $9,999 | 45 (0.4%) | 252 (2.5%) |
| $10,000 to $14,999 | 68 (0.6%) | 230 (2.3%) |
| $15,000 to $19,999 | 179 (1.7%) | 282 (2.8%) |
| $20,000 to $24,999 | 99 (0.9%) | 287 (2.9%) |
| $25,000 to $34,999 | 420 (3.9%) | 672 (6.7%) |
| $35,000 to $49,999 | 431 (4.0%) | 1,038 (10.4%) |
| $50,000 to $74,999 | 1,035 (9.5%) | 2,140 (21.5%) |
| $75,000 to $99,999 | 1,333 (12.3%) | 1,713 (17.2%) |
| $100,000 to $149,999 | 2,257 (20.8%) | 1,837 (18.4%) |
| $150,000 or more | 4,970 (45.7%) | 1,305 (13.1%) |
| Total | 10,871 (100.0%) | 9,970 (100.0%) |
Monthly Housing Cost Tiers in Bentonville
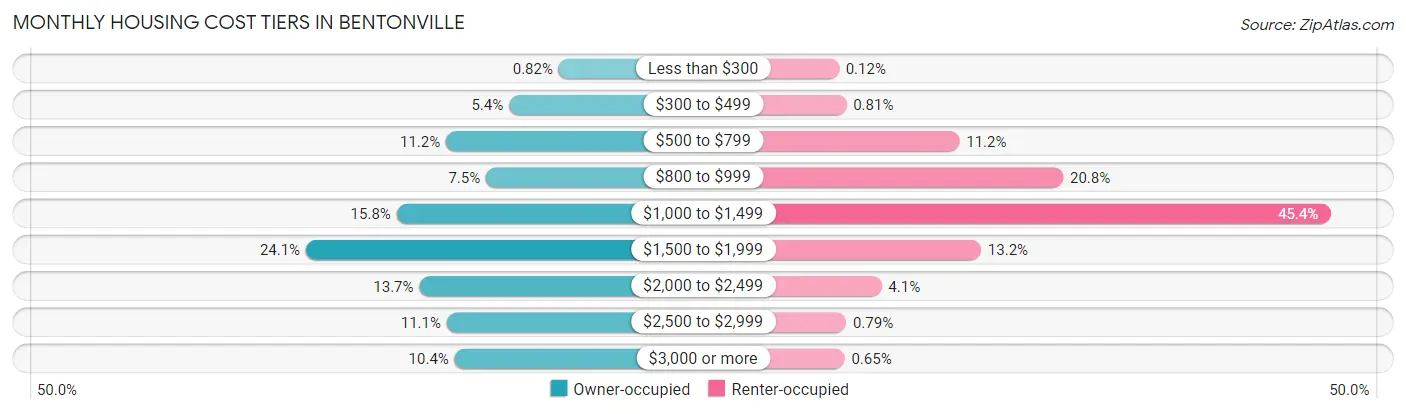
| Monthly Cost | Owner-occupied | Renter-occupied |
| Less than $300 | 89 (0.8%) | 12 (0.1%) |
| $300 to $499 | 587 (5.4%) | 81 (0.8%) |
| $500 to $799 | 1,218 (11.2%) | 1,119 (11.2%) |
| $800 to $999 | 818 (7.5%) | 2,071 (20.8%) |
| $1,000 to $1,499 | 1,712 (15.8%) | 4,522 (45.4%) |
| $1,500 to $1,999 | 2,620 (24.1%) | 1,317 (13.2%) |
| $2,000 to $2,499 | 1,485 (13.7%) | 404 (4.1%) |
| $2,500 to $2,999 | 1,210 (11.1%) | 79 (0.8%) |
| $3,000 or more | 1,132 (10.4%) | 65 (0.6%) |
| Total | 10,871 (100.0%) | 9,970 (100.0%) |
Physical Housing Characteristics in Bentonville
Housing Structures in Bentonville
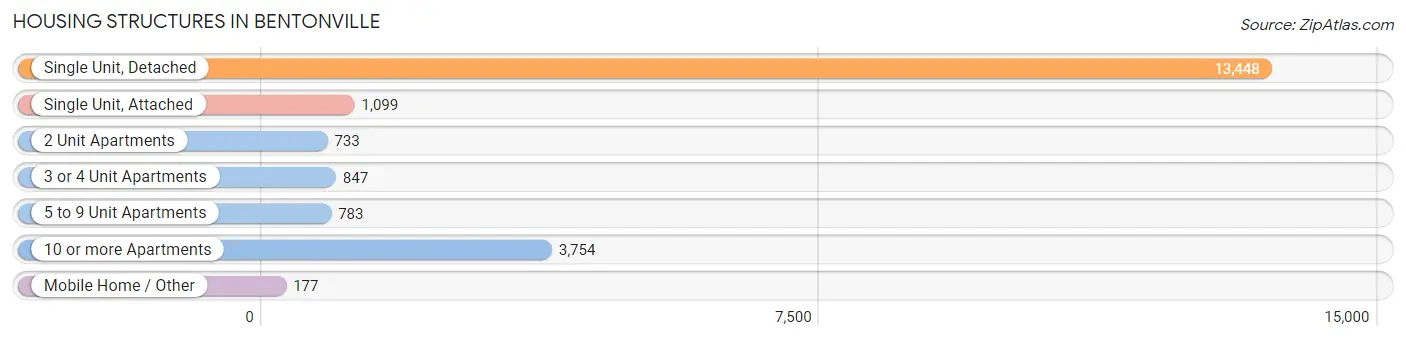
| Structure Type | # Housing Units | % Housing Units |
| Single Unit, Detached | 13,448 | 64.5% |
| Single Unit, Attached | 1,099 | 5.3% |
| 2 Unit Apartments | 733 | 3.5% |
| 3 or 4 Unit Apartments | 847 | 4.1% |
| 5 to 9 Unit Apartments | 783 | 3.8% |
| 10 or more Apartments | 3,754 | 18.0% |
| Mobile Home / Other | 177 | 0.9% |
| Total | 20,841 | 100.0% |
Housing Structures by Occupancy in Bentonville
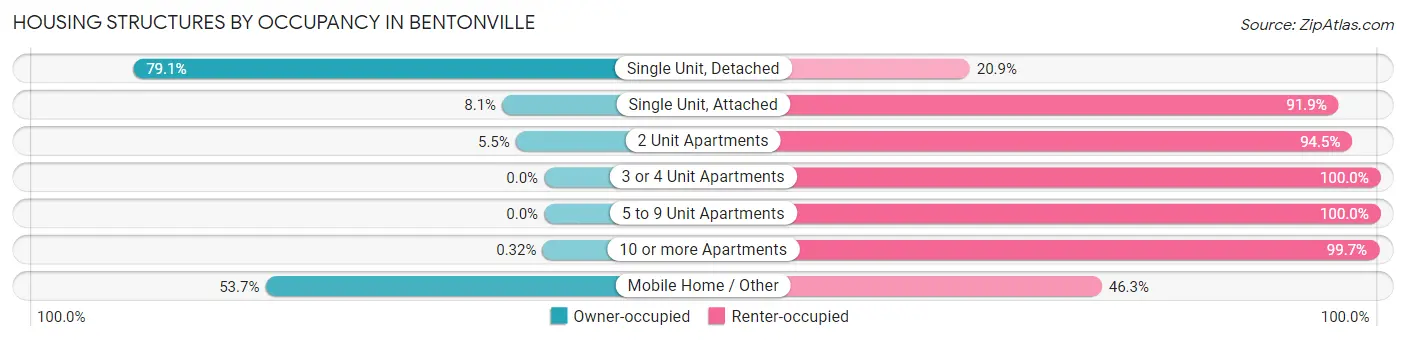
| Structure Type | Owner-occupied | Renter-occupied |
| Single Unit, Detached | 10,635 (79.1%) | 2,813 (20.9%) |
| Single Unit, Attached | 89 (8.1%) | 1,010 (91.9%) |
| 2 Unit Apartments | 40 (5.5%) | 693 (94.5%) |
| 3 or 4 Unit Apartments | 0 (0.0%) | 847 (100.0%) |
| 5 to 9 Unit Apartments | 0 (0.0%) | 783 (100.0%) |
| 10 or more Apartments | 12 (0.3%) | 3,742 (99.7%) |
| Mobile Home / Other | 95 (53.7%) | 82 (46.3%) |
| Total | 10,871 (52.2%) | 9,970 (47.8%) |
Housing Structures by Number of Rooms in Bentonville
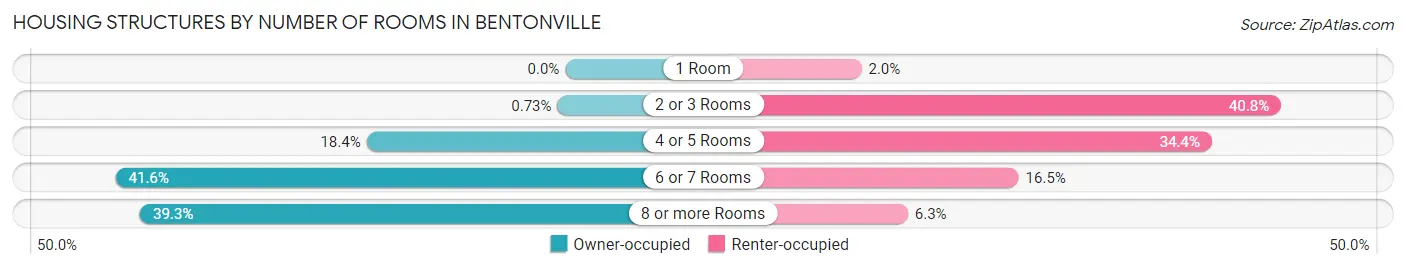
| Number of Rooms | Owner-occupied | Renter-occupied |
| 1 Room | 0 (0.0%) | 199 (2.0%) |
| 2 or 3 Rooms | 79 (0.7%) | 4,068 (40.8%) |
| 4 or 5 Rooms | 1,998 (18.4%) | 3,429 (34.4%) |
| 6 or 7 Rooms | 4,520 (41.6%) | 1,648 (16.5%) |
| 8 or more Rooms | 4,274 (39.3%) | 626 (6.3%) |
| Total | 10,871 (100.0%) | 9,970 (100.0%) |
Housing Structure by Heating Type in Bentonville
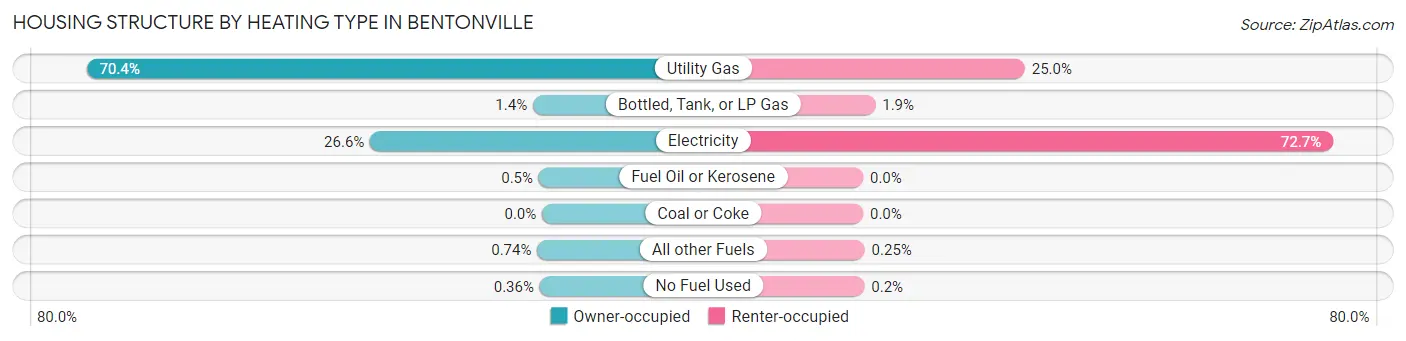
| Heating Type | Owner-occupied | Renter-occupied |
| Utility Gas | 7,656 (70.4%) | 2,493 (25.0%) |
| Bottled, Tank, or LP Gas | 153 (1.4%) | 188 (1.9%) |
| Electricity | 2,889 (26.6%) | 7,244 (72.7%) |
| Fuel Oil or Kerosene | 54 (0.5%) | 0 (0.0%) |
| Coal or Coke | 0 (0.0%) | 0 (0.0%) |
| All other Fuels | 80 (0.7%) | 25 (0.3%) |
| No Fuel Used | 39 (0.4%) | 20 (0.2%) |
| Total | 10,871 (100.0%) | 9,970 (100.0%) |
Household Vehicle Usage in Bentonville
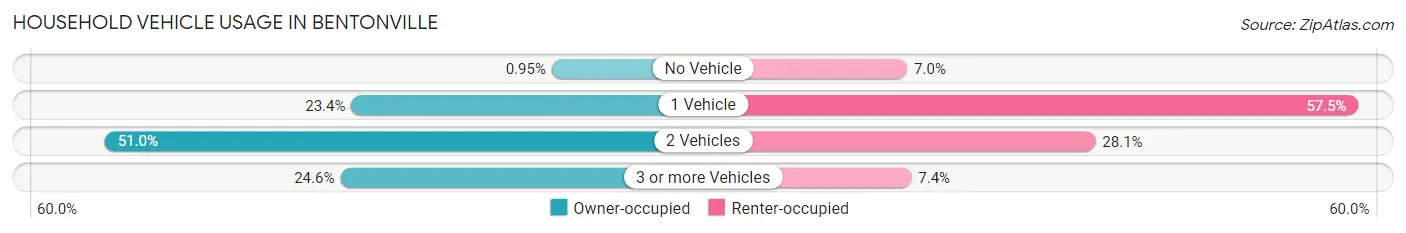
| Vehicles per Household | Owner-occupied | Renter-occupied |
| No Vehicle | 103 (0.9%) | 695 (7.0%) |
| 1 Vehicle | 2,544 (23.4%) | 5,735 (57.5%) |
| 2 Vehicles | 5,545 (51.0%) | 2,798 (28.1%) |
| 3 or more Vehicles | 2,679 (24.6%) | 742 (7.4%) |
| Total | 10,871 (100.0%) | 9,970 (100.0%) |
Real Estate & Mortgages in Bentonville
Real Estate and Mortgage Overview in Bentonville
| Characteristic | Without Mortgage | With Mortgage |
| Housing Units | 2,591 | 8,280 |
| Median Property Value | $345,500 | $337,100 |
| Median Household Income | $101,868 | $3,998 |
| Monthly Housing Costs | $608 | $1,121 |
| Real Estate Taxes | $2,401 | $144 |
Property Value by Mortgage Status in Bentonville
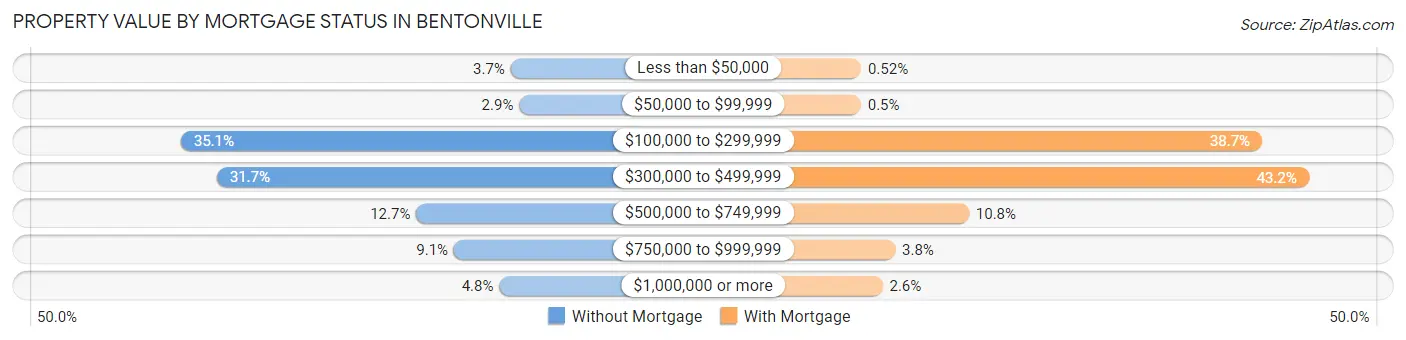
| Property Value | Without Mortgage | With Mortgage |
| Less than $50,000 | 96 (3.7%) | 43 (0.5%) |
| $50,000 to $99,999 | 75 (2.9%) | 41 (0.5%) |
| $100,000 to $299,999 | 910 (35.1%) | 3,204 (38.7%) |
| $300,000 to $499,999 | 821 (31.7%) | 3,574 (43.2%) |
| $500,000 to $749,999 | 329 (12.7%) | 893 (10.8%) |
| $750,000 to $999,999 | 236 (9.1%) | 312 (3.8%) |
| $1,000,000 or more | 124 (4.8%) | 213 (2.6%) |
| Total | 2,591 (100.0%) | 8,280 (100.0%) |
Household Income by Mortgage Status in Bentonville
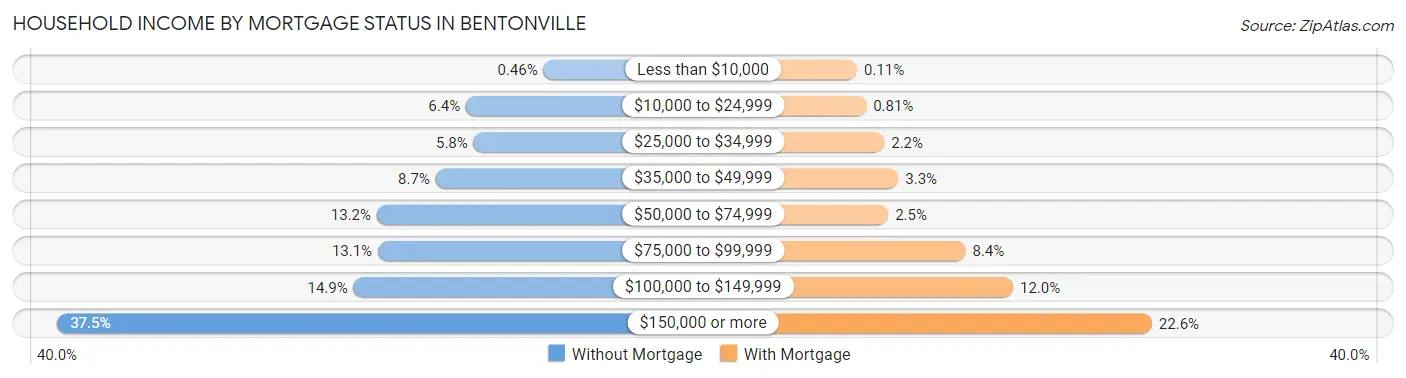
| Household Income | Without Mortgage | With Mortgage |
| Less than $10,000 | 12 (0.5%) | 9 (0.1%) |
| $10,000 to $24,999 | 165 (6.4%) | 67 (0.8%) |
| $25,000 to $34,999 | 150 (5.8%) | 181 (2.2%) |
| $35,000 to $49,999 | 225 (8.7%) | 270 (3.3%) |
| $50,000 to $74,999 | 341 (13.2%) | 206 (2.5%) |
| $75,000 to $99,999 | 339 (13.1%) | 694 (8.4%) |
| $100,000 to $149,999 | 387 (14.9%) | 994 (12.0%) |
| $150,000 or more | 972 (37.5%) | 1,870 (22.6%) |
| Total | 2,591 (100.0%) | 8,280 (100.0%) |
Property Value to Household Income Ratio in Bentonville
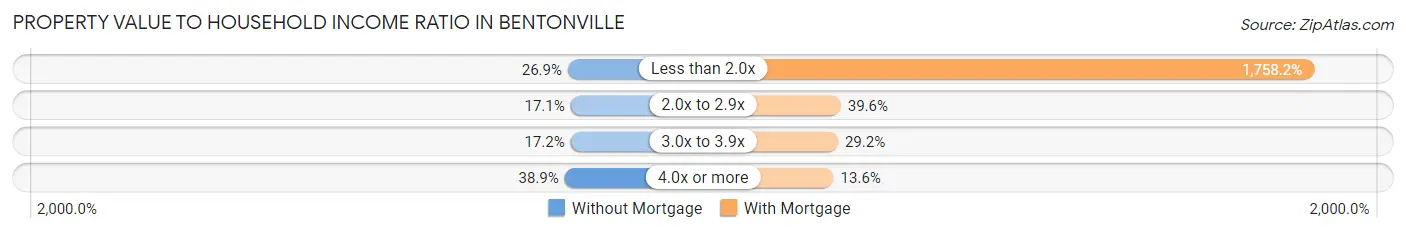
| Value-to-Income Ratio | Without Mortgage | With Mortgage |
| Less than 2.0x | 696 (26.9%) | 145,578 (1,758.2%) |
| 2.0x to 2.9x | 443 (17.1%) | 3,275 (39.6%) |
| 3.0x to 3.9x | 445 (17.2%) | 2,420 (29.2%) |
| 4.0x or more | 1,007 (38.9%) | 1,124 (13.6%) |
| Total | 2,591 (100.0%) | 8,280 (100.0%) |
Real Estate Taxes by Mortgage Status in Bentonville
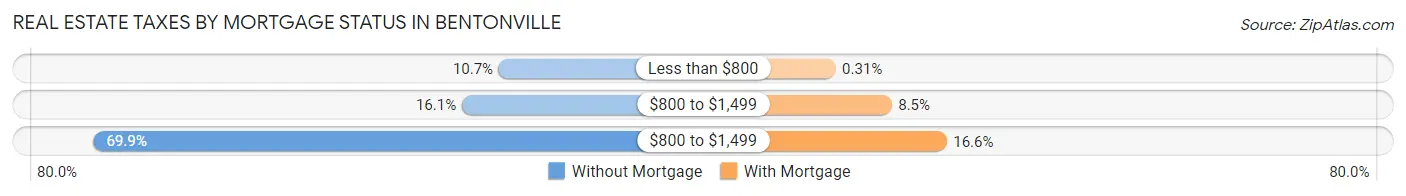
| Property Taxes | Without Mortgage | With Mortgage |
| Less than $800 | 277 (10.7%) | 26 (0.3%) |
| $800 to $1,499 | 417 (16.1%) | 705 (8.5%) |
| $800 to $1,499 | 1,812 (69.9%) | 1,370 (16.6%) |
| Total | 2,591 (100.0%) | 8,280 (100.0%) |
Health & Disability in Bentonville
Health Insurance Coverage by Age in Bentonville
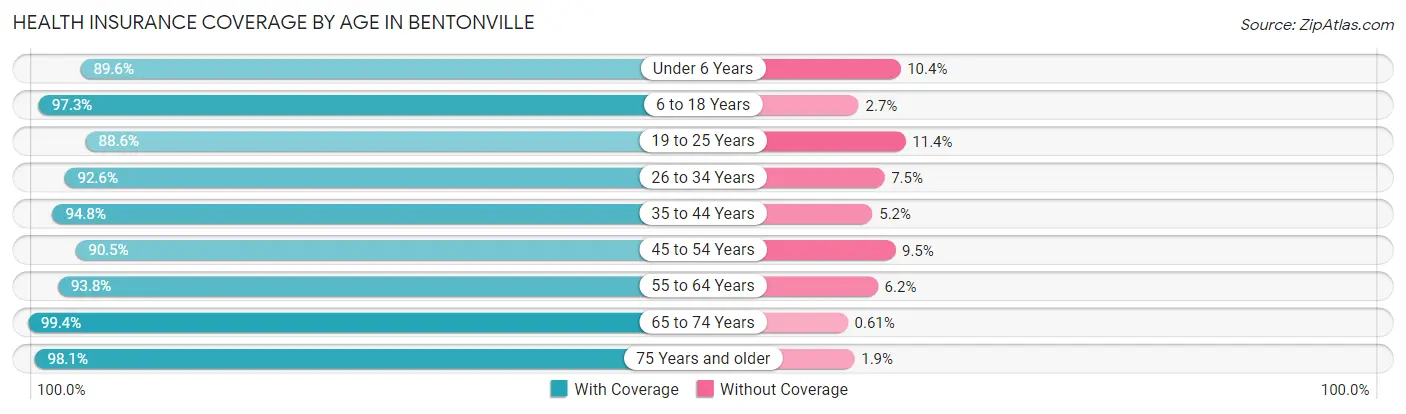
| Age Bracket | With Coverage | Without Coverage |
| Under 6 Years | 4,536 (89.6%) | 528 (10.4%) |
| 6 to 18 Years | 10,085 (97.3%) | 277 (2.7%) |
| 19 to 25 Years | 4,613 (88.6%) | 593 (11.4%) |
| 26 to 34 Years | 8,123 (92.5%) | 654 (7.4%) |
| 35 to 44 Years | 9,176 (94.8%) | 505 (5.2%) |
| 45 to 54 Years | 5,645 (90.5%) | 590 (9.5%) |
| 55 to 64 Years | 4,053 (93.8%) | 269 (6.2%) |
| 65 to 74 Years | 2,464 (99.4%) | 15 (0.6%) |
| 75 Years and older | 1,636 (98.1%) | 31 (1.9%) |
| Total | 50,331 (93.6%) | 3,462 (6.4%) |
Health Insurance Coverage by Citizenship Status in Bentonville
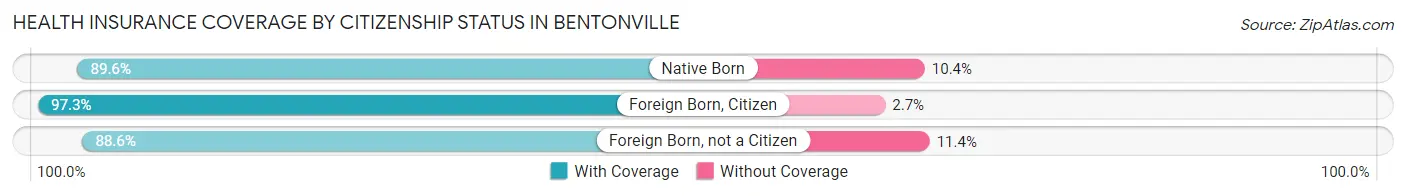
| Citizenship Status | With Coverage | Without Coverage |
| Native Born | 4,536 (89.6%) | 528 (10.4%) |
| Foreign Born, Citizen | 10,085 (97.3%) | 277 (2.7%) |
| Foreign Born, not a Citizen | 4,613 (88.6%) | 593 (11.4%) |
Health Insurance Coverage by Household Income in Bentonville
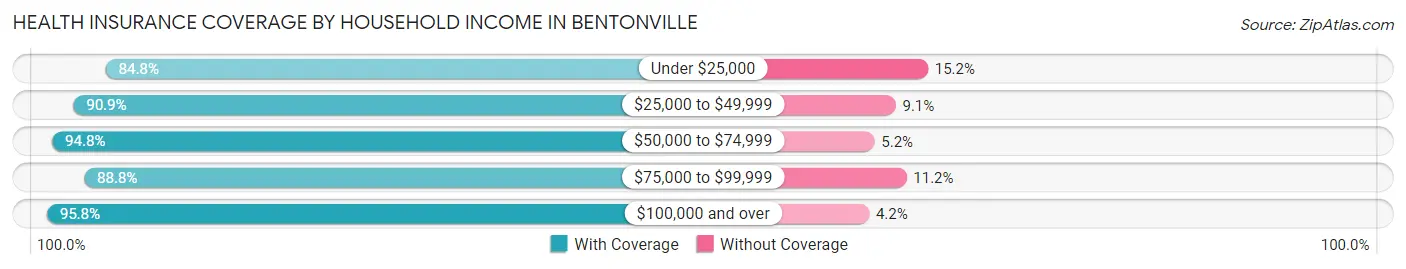
| Household Income | With Coverage | Without Coverage |
| Under $25,000 | 2,458 (84.8%) | 440 (15.2%) |
| $25,000 to $49,999 | 4,268 (90.9%) | 429 (9.1%) |
| $50,000 to $74,999 | 6,342 (94.8%) | 346 (5.2%) |
| $75,000 to $99,999 | 7,211 (88.8%) | 906 (11.2%) |
| $100,000 and over | 29,939 (95.8%) | 1,301 (4.2%) |
Public vs Private Health Insurance Coverage by Age in Bentonville
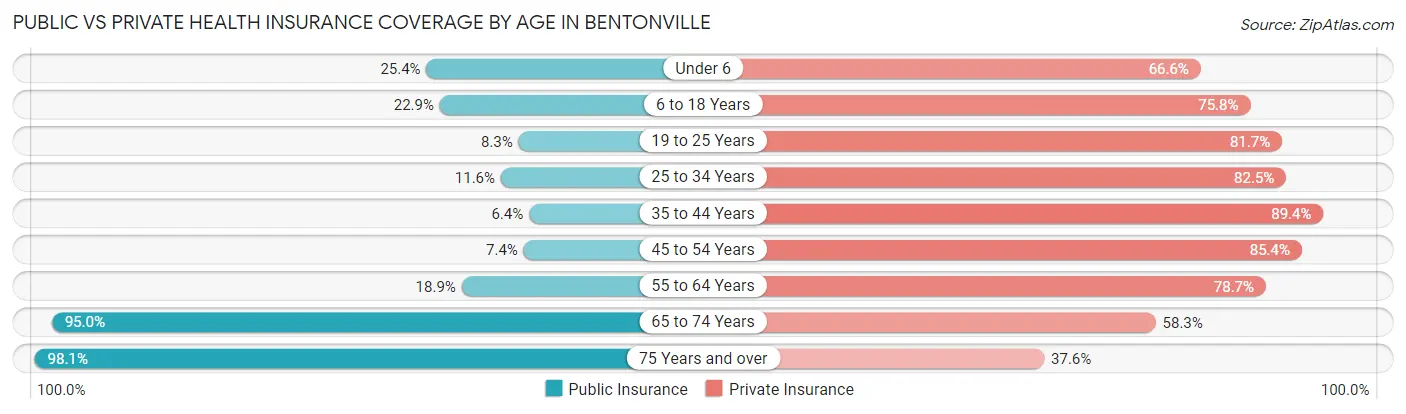
| Age Bracket | Public Insurance | Private Insurance |
| Under 6 | 1,287 (25.4%) | 3,373 (66.6%) |
| 6 to 18 Years | 2,377 (22.9%) | 7,855 (75.8%) |
| 19 to 25 Years | 433 (8.3%) | 4,254 (81.7%) |
| 25 to 34 Years | 1,018 (11.6%) | 7,238 (82.5%) |
| 35 to 44 Years | 617 (6.4%) | 8,653 (89.4%) |
| 45 to 54 Years | 459 (7.4%) | 5,323 (85.4%) |
| 55 to 64 Years | 816 (18.9%) | 3,402 (78.7%) |
| 65 to 74 Years | 2,354 (95.0%) | 1,444 (58.3%) |
| 75 Years and over | 1,636 (98.1%) | 626 (37.6%) |
| Total | 10,997 (20.4%) | 42,168 (78.4%) |
Disability Status by Sex by Age in Bentonville
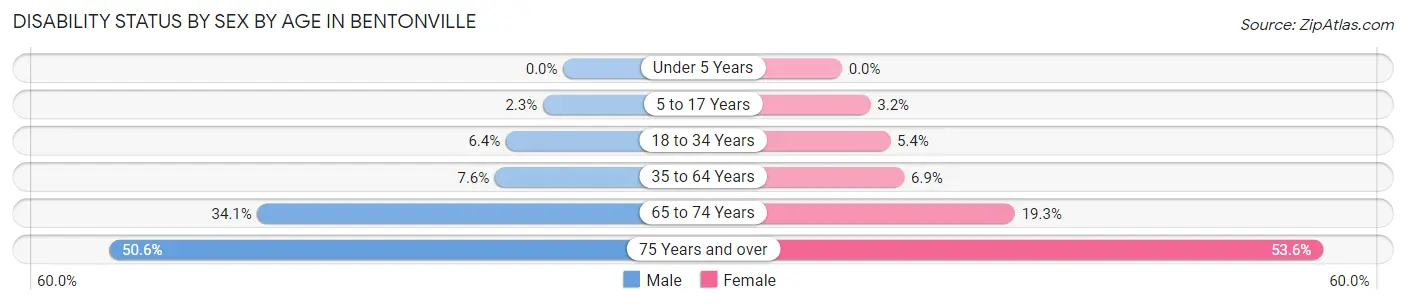
| Age Bracket | Male | Female |
| Under 5 Years | 0 (0.0%) | 0 (0.0%) |
| 5 to 17 Years | 126 (2.3%) | 166 (3.2%) |
| 18 to 34 Years | 490 (6.4%) | 370 (5.4%) |
| 35 to 64 Years | 805 (7.6%) | 670 (6.9%) |
| 65 to 74 Years | 365 (34.1%) | 271 (19.3%) |
| 75 Years and over | 262 (50.6%) | 616 (53.6%) |
Disability Class by Sex by Age in Bentonville
Disability Class: Hearing Difficulty
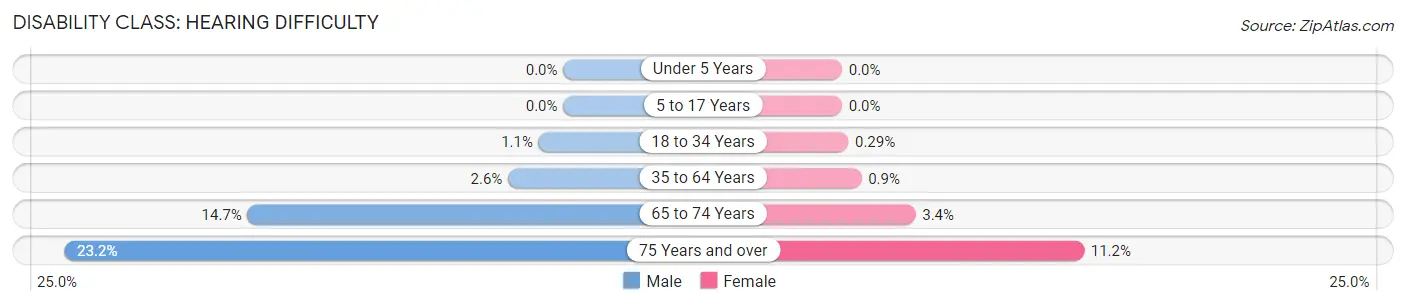
| Age Bracket | Male | Female |
| Under 5 Years | 0 (0.0%) | 0 (0.0%) |
| 5 to 17 Years | 0 (0.0%) | 0 (0.0%) |
| 18 to 34 Years | 88 (1.1%) | 20 (0.3%) |
| 35 to 64 Years | 271 (2.6%) | 87 (0.9%) |
| 65 to 74 Years | 157 (14.6%) | 48 (3.4%) |
| 75 Years and over | 120 (23.2%) | 129 (11.2%) |
Disability Class: Vision Difficulty
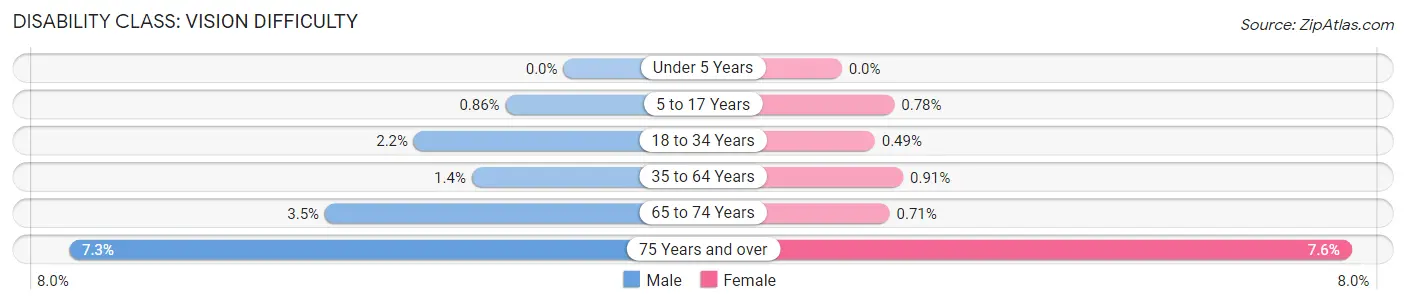
| Age Bracket | Male | Female |
| Under 5 Years | 0 (0.0%) | 0 (0.0%) |
| 5 to 17 Years | 48 (0.9%) | 41 (0.8%) |
| 18 to 34 Years | 171 (2.2%) | 34 (0.5%) |
| 35 to 64 Years | 144 (1.4%) | 88 (0.9%) |
| 65 to 74 Years | 38 (3.5%) | 10 (0.7%) |
| 75 Years and over | 38 (7.3%) | 87 (7.6%) |
Disability Class: Cognitive Difficulty
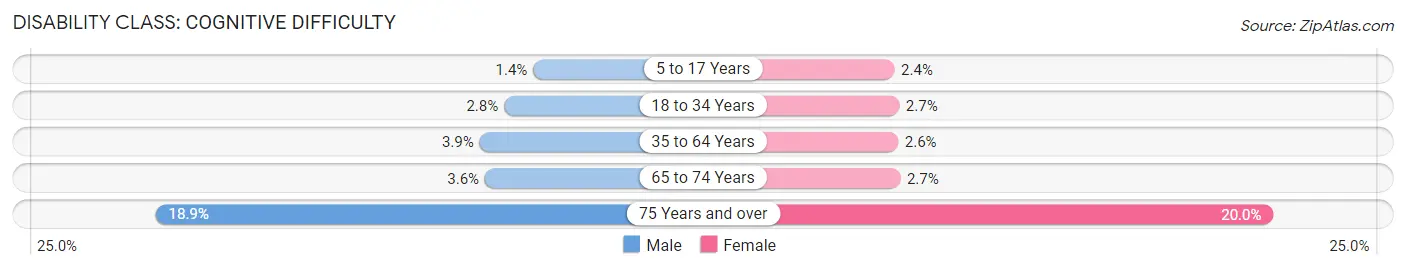
| Age Bracket | Male | Female |
| 5 to 17 Years | 78 (1.4%) | 127 (2.4%) |
| 18 to 34 Years | 211 (2.8%) | 182 (2.6%) |
| 35 to 64 Years | 412 (3.9%) | 251 (2.6%) |
| 65 to 74 Years | 39 (3.6%) | 38 (2.7%) |
| 75 Years and over | 98 (18.9%) | 230 (20.0%) |
Disability Class: Ambulatory Difficulty
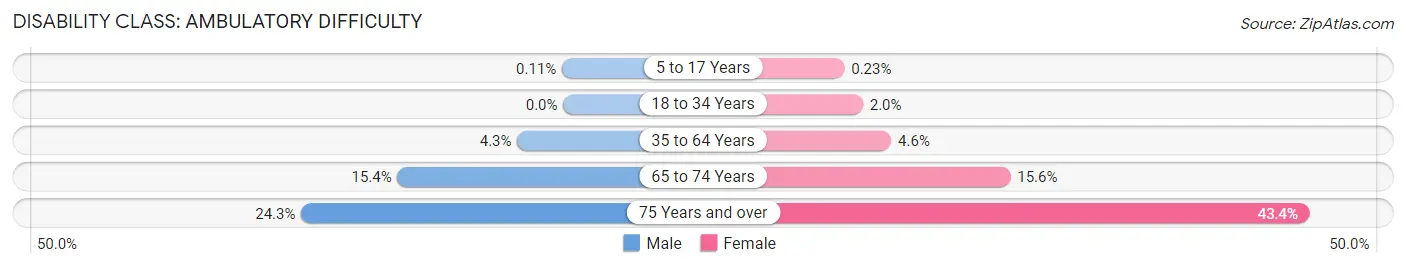
| Age Bracket | Male | Female |
| 5 to 17 Years | 6 (0.1%) | 12 (0.2%) |
| 18 to 34 Years | 0 (0.0%) | 134 (1.9%) |
| 35 to 64 Years | 452 (4.3%) | 442 (4.6%) |
| 65 to 74 Years | 165 (15.4%) | 220 (15.6%) |
| 75 Years and over | 126 (24.3%) | 499 (43.4%) |
Disability Class: Self-Care Difficulty
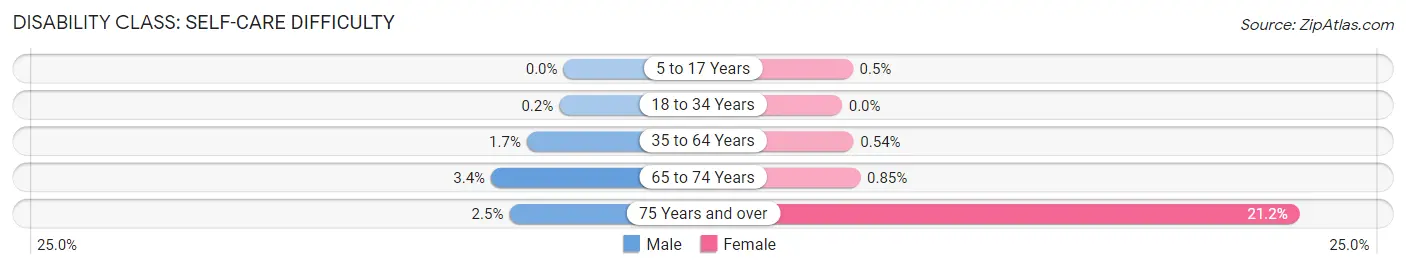
| Age Bracket | Male | Female |
| 5 to 17 Years | 0 (0.0%) | 26 (0.5%) |
| 18 to 34 Years | 15 (0.2%) | 0 (0.0%) |
| 35 to 64 Years | 180 (1.7%) | 52 (0.5%) |
| 65 to 74 Years | 36 (3.4%) | 12 (0.9%) |
| 75 Years and over | 13 (2.5%) | 244 (21.2%) |
Technology Access in Bentonville
Computing Device Access in Bentonville
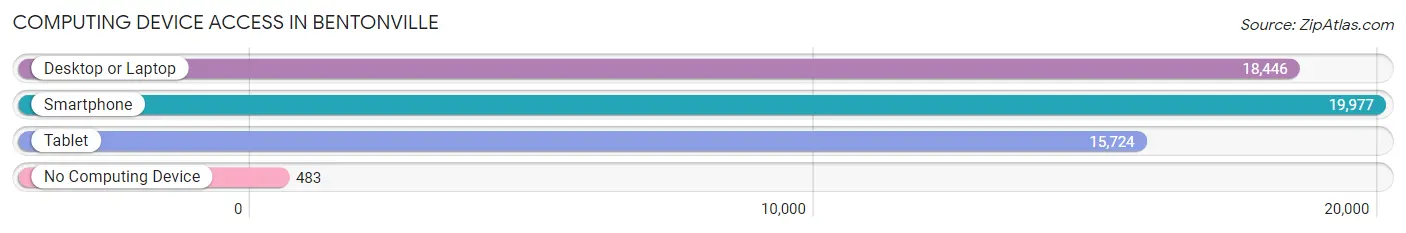
| Device Type | # Households | % Households |
| Desktop or Laptop | 18,446 | 88.5% |
| Smartphone | 19,977 | 95.9% |
| Tablet | 15,724 | 75.4% |
| No Computing Device | 483 | 2.3% |
| Total | 20,841 | 100.0% |
Internet Access in Bentonville
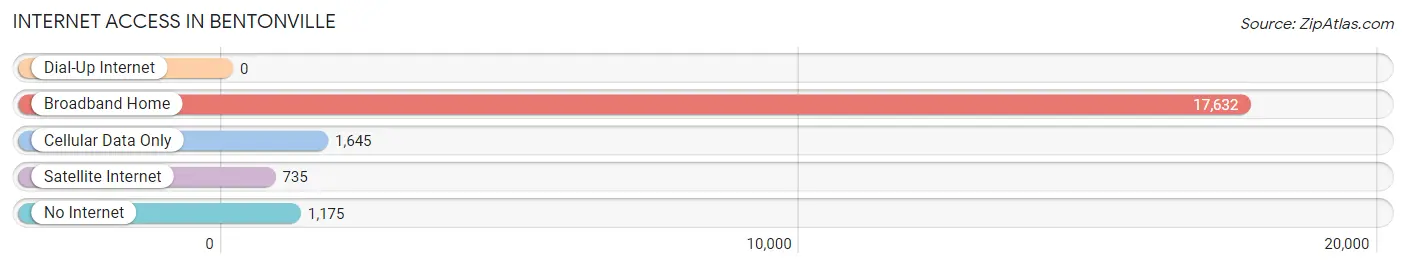
| Internet Type | # Households | % Households |
| Dial-Up Internet | 0 | 0.0% |
| Broadband Home | 17,632 | 84.6% |
| Cellular Data Only | 1,645 | 7.9% |
| Satellite Internet | 735 | 3.5% |
| No Internet | 1,175 | 5.6% |
| Total | 20,841 | 100.0% |
Bentonville Summary
Bentonville, Arkansas is a city located in the northwest corner of the state, in Benton County. It is the county seat and the largest city in the county. The city is located in the Ozark Mountains and is part of the Fayetteville-Springdale-Rogers Metropolitan Statistical Area. As of the 2010 census, the population of Bentonville was 35,301, making it the tenth largest city in Arkansas.
History
Bentonville was founded in 1836 by William Henry Harrison Benton, a settler from Tennessee. The city was named after his father, Thomas Hart Benton, a U.S. Senator from Missouri. The city was incorporated in 1873 and was the site of the Battle of Pea Ridge during the Civil War. The city was also the home of the headquarters of Walmart, the world’s largest retailer, from 1970 until its move to nearby Rogers in 2018.
Geography
Bentonville is located in the northwest corner of Arkansas, in Benton County. It is situated in the Ozark Mountains and is part of the Fayetteville-Springdale-Rogers Metropolitan Statistical Area. The city is located at the intersection of Interstate 49 and U.S. Route 71. The city has a total area of 24.3 square miles, of which 24.2 square miles is land and 0.1 square miles is water.
Economy
Bentonville’s economy is largely driven by the presence of Walmart, the world’s largest retailer. Walmart is the city’s largest employer, with over 15,000 employees in the area. Other major employers in the city include Tyson Foods, J.B. Hunt Transport Services, and the University of Arkansas. The city is also home to a number of technology companies, including Acumen Brands, Brightwater, and RevUnit.
Demographics
As of the 2010 census, the population of Bentonville was 35,301, with a population density of 1,456 people per square mile. The racial makeup of the city was 79.2% White, 8.3% African American, 0.7% Native American, 2.3% Asian, 0.1% Pacific Islander, 6.2% from other races, and 3.3% from two or more races. Hispanic or Latino of any race were 11.3% of the population.
The median income for a household in the city was $45,945, and the median income for a family was $54,844. The per capita income for the city was $25,945. About 8.3% of families and 11.2% of the population were below the poverty line, including 15.2% of those under age 18 and 8.2% of those age 65 or over.
Common Questions
What is Per Capita Income in Bentonville?
Per Capita income in Bentonville is $51,917.
What is the Median Family Income in Bentonville?
Median Family Income in Bentonville is $125,942.
What is the Median Household income in Bentonville?
Median Household Income in Bentonville is $99,074.
What is Income or Wage Gap in Bentonville?
Income or Wage Gap in Bentonville is 42.0%.
Women in Bentonville earn 58.0 cents for every dollar earned by a man.
What is Family Income Deficit in Bentonville?
Family Income Deficit in Bentonville is $10,549.
Families that are below poverty line in Bentonville earn $10,549 less on average than the poverty threshold level.
What is Inequality or Gini Index in Bentonville?
Inequality or Gini Index in Bentonville is 0.44.
What is the Total Population of Bentonville?
Total Population of Bentonville is 54,513.
What is the Total Male Population of Bentonville?
Total Male Population of Bentonville is 28,358.
What is the Total Female Population of Bentonville?
Total Female Population of Bentonville is 26,155.
What is the Ratio of Males per 100 Females in Bentonville?
There are 108.42 Males per 100 Females in Bentonville.
What is the Ratio of Females per 100 Males in Bentonville?
There are 92.23 Females per 100 Males in Bentonville.
What is the Median Population Age in Bentonville?
Median Population Age in Bentonville is 32.2 Years.
What is the Average Family Size in Bentonville
Average Family Size in Bentonville is 3.2 People.
What is the Average Household Size in Bentonville
Average Household Size in Bentonville is 2.6 People.
How Large is the Labor Force in Bentonville?
There are 29,858 People in the Labor Forcein in Bentonville.
What is the Percentage of People in the Labor Force in Bentonville?
72.7% of People are in the Labor Force in Bentonville.
What is the Unemployment Rate in Bentonville?
Unemployment Rate in Bentonville is 3.2%.