Siloam Springs, AR Map & Demographics
Siloam Springs Map
Siloam Springs Overview
$24,890
PER CAPITA INCOME
$70,042
AVG FAMILY INCOME
$59,911
AVG HOUSEHOLD INCOME
21.7%
WAGE / INCOME GAP [ % ]
78.3¢/ $1
WAGE / INCOME GAP [ $ ]
$16,189
FAMILY INCOME DEFICIT
0.43
INEQUALITY / GINI INDEX
17,632
TOTAL POPULATION
8,371
MALE POPULATION
9,261
FEMALE POPULATION
90.39
MALES / 100 FEMALES
110.63
FEMALES / 100 MALES
30.1
MEDIAN AGE
3.2
AVG FAMILY SIZE
2.8
AVG HOUSEHOLD SIZE
8,268
LABOR FORCE [ PEOPLE ]
62.5%
PERCENT IN LABOR FORCE
2.6%
UNEMPLOYMENT RATE
Siloam Springs Zip Codes
Siloam Springs Area Codes
Income in Siloam Springs
Income Overview in Siloam Springs
Per Capita Income in Siloam Springs is $24,890, while median incomes of families and households are $70,042 and $59,911 respectively.
| Characteristic | Number | Measure |
| Per Capita Income | 17,632 | $24,890 |
| Median Family Income | 4,447 | $70,042 |
| Mean Family Income | 4,447 | $82,518 |
| Median Household Income | 5,963 | $59,911 |
| Mean Household Income | 5,963 | $75,088 |
| Income Deficit | 4,447 | $16,189 |
| Wage / Income Gap (%) | 17,632 | 21.66% |
| Wage / Income Gap ($) | 17,632 | 78.34¢ per $1 |
| Gini / Inequality Index | 17,632 | 0.43 |
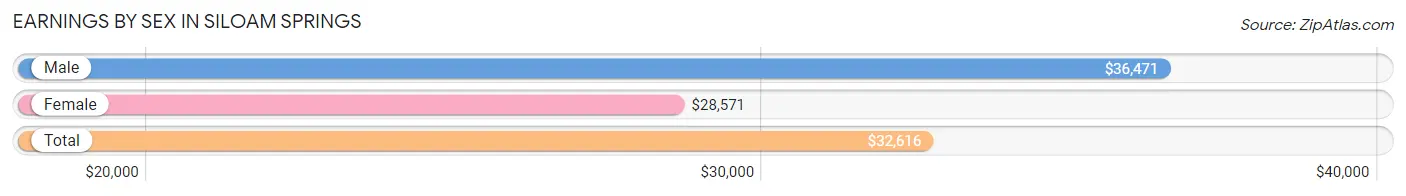
Earnings by Sex in Siloam Springs
Average Earnings in Siloam Springs are $32,616, $36,471 for men and $28,571 for women, a difference of 21.7%.
| Sex | Number | Average Earnings |
| Male | 4,656 (53.8%) | $36,471 |
| Female | 3,992 (46.2%) | $28,571 |
| Total | 8,648 (100.0%) | $32,616 |
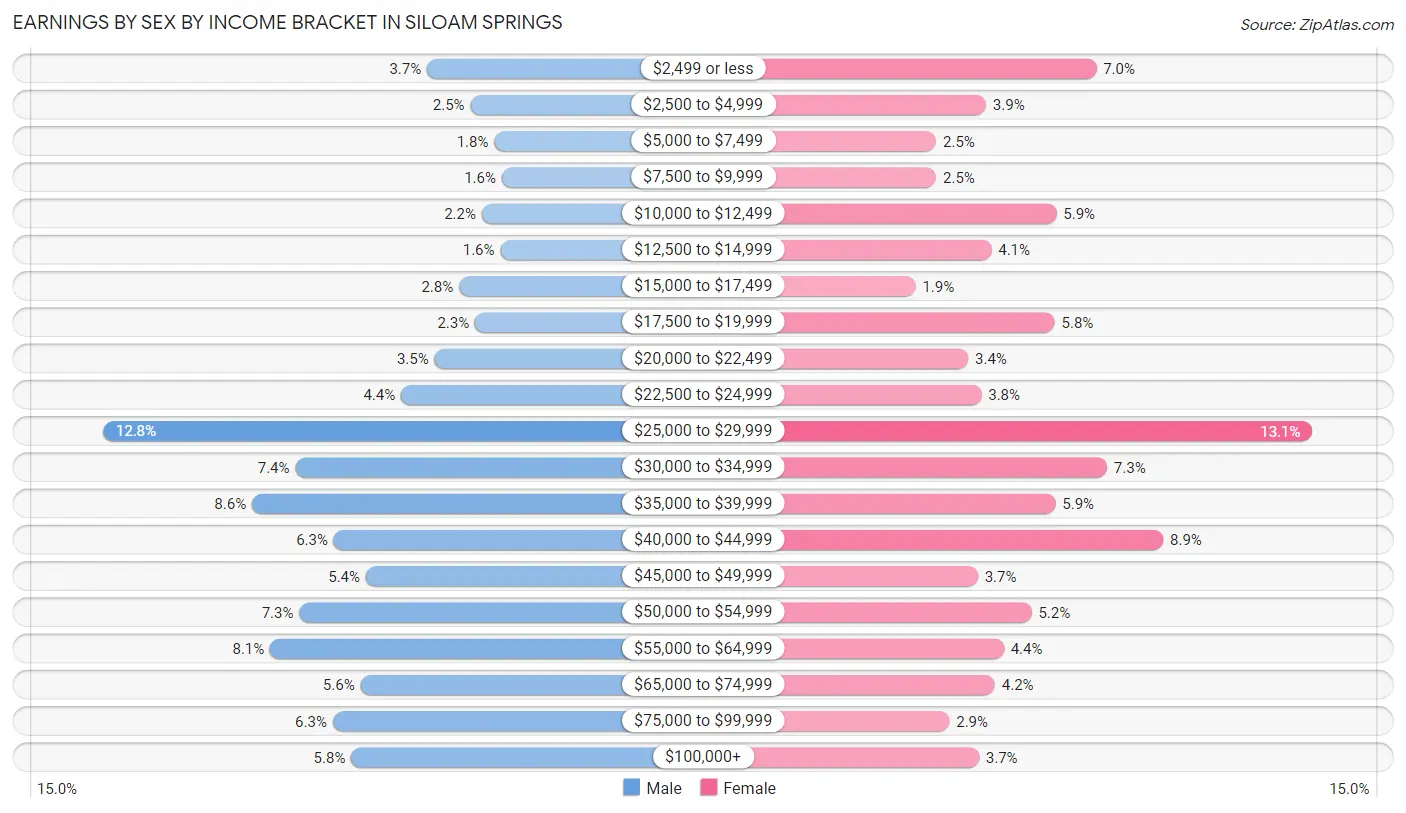
Earnings by Sex by Income Bracket in Siloam Springs
The most common earnings brackets in Siloam Springs are $25,000 to $29,999 for men (596 | 12.8%) and $25,000 to $29,999 for women (522 | 13.1%).
| Income | Male | Female |
| $2,499 or less | 172 (3.7%) | 280 (7.0%) |
| $2,500 to $4,999 | 115 (2.5%) | 156 (3.9%) |
| $5,000 to $7,499 | 84 (1.8%) | 100 (2.5%) |
| $7,500 to $9,999 | 74 (1.6%) | 100 (2.5%) |
| $10,000 to $12,499 | 100 (2.1%) | 235 (5.9%) |
| $12,500 to $14,999 | 76 (1.6%) | 162 (4.1%) |
| $15,000 to $17,499 | 130 (2.8%) | 77 (1.9%) |
| $17,500 to $19,999 | 109 (2.3%) | 233 (5.8%) |
| $20,000 to $22,499 | 162 (3.5%) | 136 (3.4%) |
| $22,500 to $24,999 | 206 (4.4%) | 151 (3.8%) |
| $25,000 to $29,999 | 596 (12.8%) | 522 (13.1%) |
| $30,000 to $34,999 | 344 (7.4%) | 292 (7.3%) |
| $35,000 to $39,999 | 401 (8.6%) | 234 (5.9%) |
| $40,000 to $44,999 | 294 (6.3%) | 355 (8.9%) |
| $45,000 to $49,999 | 252 (5.4%) | 147 (3.7%) |
| $50,000 to $54,999 | 339 (7.3%) | 207 (5.2%) |
| $55,000 to $64,999 | 377 (8.1%) | 176 (4.4%) |
| $65,000 to $74,999 | 259 (5.6%) | 166 (4.2%) |
| $75,000 to $99,999 | 295 (6.3%) | 115 (2.9%) |
| $100,000+ | 271 (5.8%) | 148 (3.7%) |
| Total | 4,656 (100.0%) | 3,992 (100.0%) |
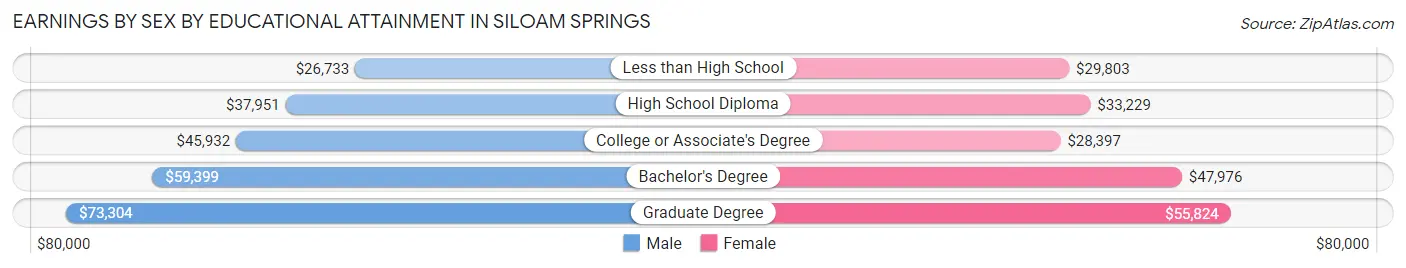
Earnings by Sex by Educational Attainment in Siloam Springs
Average earnings in Siloam Springs are $41,795 for men and $33,709 for women, a difference of 19.4%. Men with an educational attainment of graduate degree enjoy the highest average annual earnings of $73,304, while those with less than high school education earn the least with $26,733. Women with an educational attainment of graduate degree earn the most with the average annual earnings of $55,824, while those with college or associate's degree education have the smallest earnings of $28,397.
| Educational Attainment | Male Income | Female Income |
| Less than High School | $26,733 | $29,803 |
| High School Diploma | $37,951 | $33,229 |
| College or Associate's Degree | $45,932 | $28,397 |
| Bachelor's Degree | $59,399 | $47,976 |
| Graduate Degree | $73,304 | $55,824 |
| Total | $41,795 | $33,709 |
Family Income in Siloam Springs
Family Income Brackets in Siloam Springs
According to the Siloam Springs family income data, there are 823 families falling into the $100,000 to $149,999 income range, which is the most common income bracket and makes up 18.5% of all families. Conversely, the $10,000 to $14,999 income bracket is the least frequent group with only 44 families (1.0%) belonging to this category.
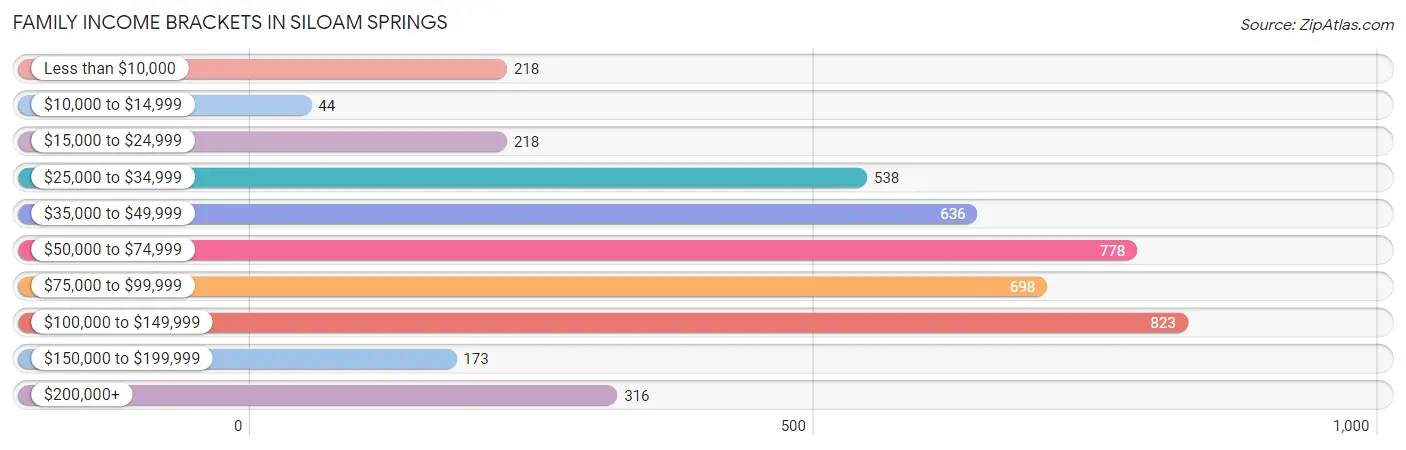
| Income Bracket | # Families | % Families |
| Less than $10,000 | 218 | 4.9% |
| $10,000 to $14,999 | 44 | 1.0% |
| $15,000 to $24,999 | 218 | 4.9% |
| $25,000 to $34,999 | 538 | 12.1% |
| $35,000 to $49,999 | 636 | 14.3% |
| $50,000 to $74,999 | 778 | 17.5% |
| $75,000 to $99,999 | 698 | 15.7% |
| $100,000 to $149,999 | 823 | 18.5% |
| $150,000 to $199,999 | 173 | 3.9% |
| $200,000+ | 316 | 7.1% |
Family Income by Famaliy Size in Siloam Springs
4-person families (1,349 | 30.3%) account for the highest median family income in Siloam Springs with $93,639 per family, while 4-person families (1,349 | 30.3%) have the highest median income of $23,410 per family member.
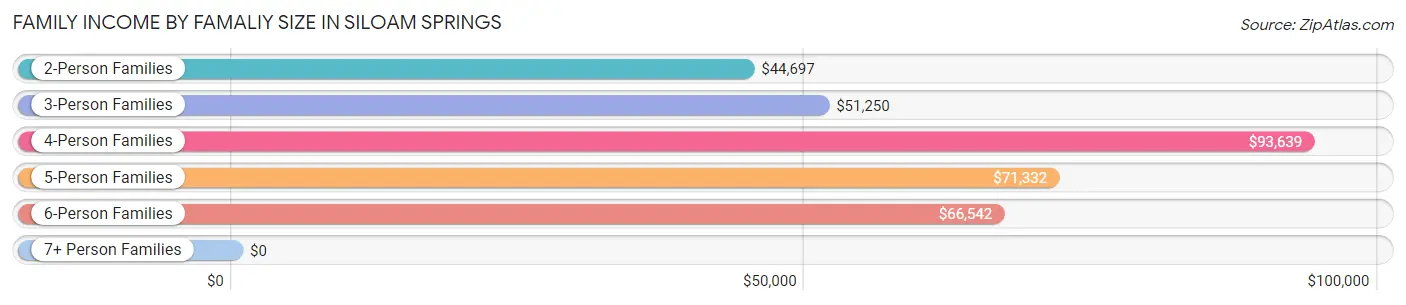
| Income Bracket | # Families | Median Income |
| 2-Person Families | 1,581 (35.5%) | $44,697 |
| 3-Person Families | 684 (15.4%) | $51,250 |
| 4-Person Families | 1,349 (30.3%) | $93,639 |
| 5-Person Families | 549 (12.3%) | $71,332 |
| 6-Person Families | 117 (2.6%) | $66,542 |
| 7+ Person Families | 167 (3.8%) | $0 |
| Total | 4,447 (100.0%) | $70,042 |
Family Income by Number of Earners in Siloam Springs
The median family income in Siloam Springs is $70,042, with families comprising 3+ earners (652) having the highest median family income of $103,955, while families with no earners (653) have the lowest median family income of $25,654, accounting for 14.7% and 14.7% of families, respectively.
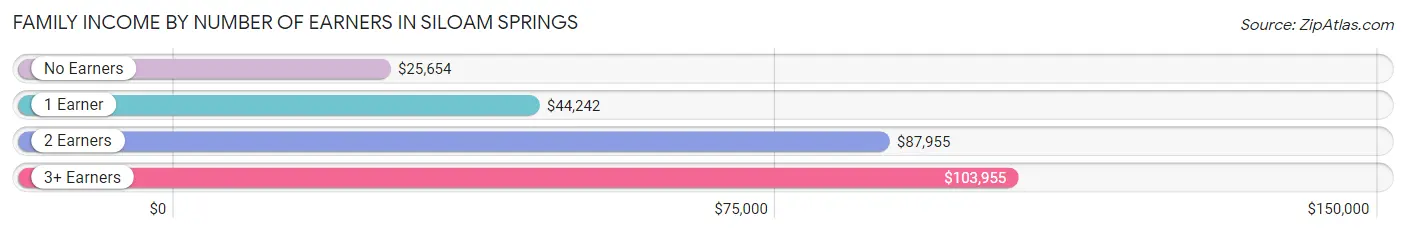
| Number of Earners | # Families | Median Income |
| No Earners | 653 (14.7%) | $25,654 |
| 1 Earner | 1,484 (33.4%) | $44,242 |
| 2 Earners | 1,658 (37.3%) | $87,955 |
| 3+ Earners | 652 (14.7%) | $103,955 |
| Total | 4,447 (100.0%) | $70,042 |
Household Income in Siloam Springs
Household Income Brackets in Siloam Springs
With 1,073 households falling in the category, the $50,000 to $74,999 income range is the most frequent in Siloam Springs, accounting for 18.0% of all households. In contrast, only 167 households (2.8%) fall into the $10,000 to $14,999 income bracket, making it the least populous group.
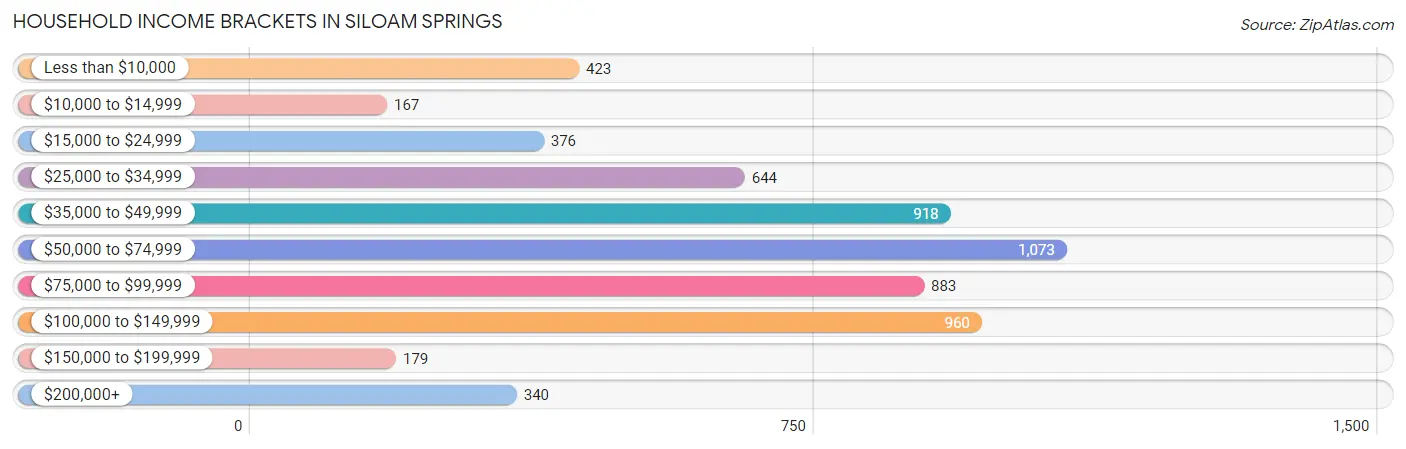
| Income Bracket | # Households | % Households |
| Less than $10,000 | 423 | 7.1% |
| $10,000 to $14,999 | 167 | 2.8% |
| $15,000 to $24,999 | 376 | 6.3% |
| $25,000 to $34,999 | 644 | 10.8% |
| $35,000 to $49,999 | 918 | 15.4% |
| $50,000 to $74,999 | 1,073 | 18.0% |
| $75,000 to $99,999 | 883 | 14.8% |
| $100,000 to $149,999 | 960 | 16.1% |
| $150,000 to $199,999 | 179 | 3.0% |
| $200,000+ | 340 | 5.7% |
Household Income by Householder Age in Siloam Springs
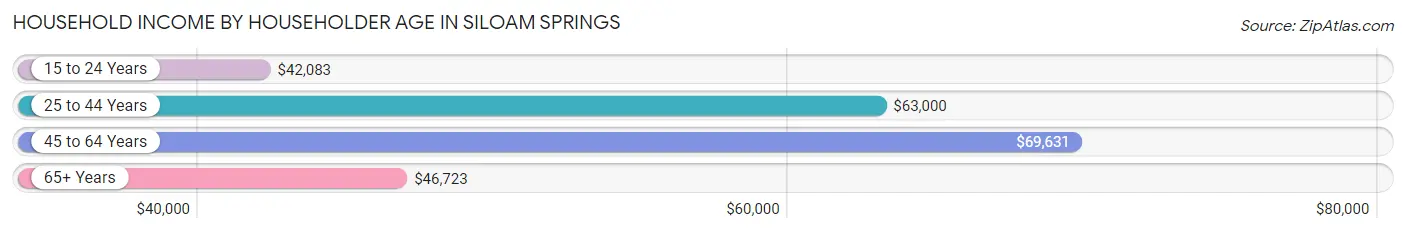
The median household income in Siloam Springs is $59,911, with the highest median household income of $69,631 found in the 45 to 64 years age bracket for the primary householder. A total of 2,403 households (40.3%) fall into this category. Meanwhile, the 15 to 24 years age bracket for the primary householder has the lowest median household income of $42,083, with 439 households (7.4%) in this group.
| Income Bracket | # Households | Median Income |
| 15 to 24 Years | 439 (7.4%) | $42,083 |
| 25 to 44 Years | 2,214 (37.1%) | $63,000 |
| 45 to 64 Years | 2,403 (40.3%) | $69,631 |
| 65+ Years | 907 (15.2%) | $46,723 |
| Total | 5,963 (100.0%) | $59,911 |
Poverty in Siloam Springs
Income Below Poverty by Sex and Age in Siloam Springs
With 12.7% poverty level for males and 18.7% for females among the residents of Siloam Springs, 15 year old males and 12 to 14 year old females are the most vulnerable to poverty, with 71 males (53.8%) and 166 females (53.7%) in their respective age groups living below the poverty level.
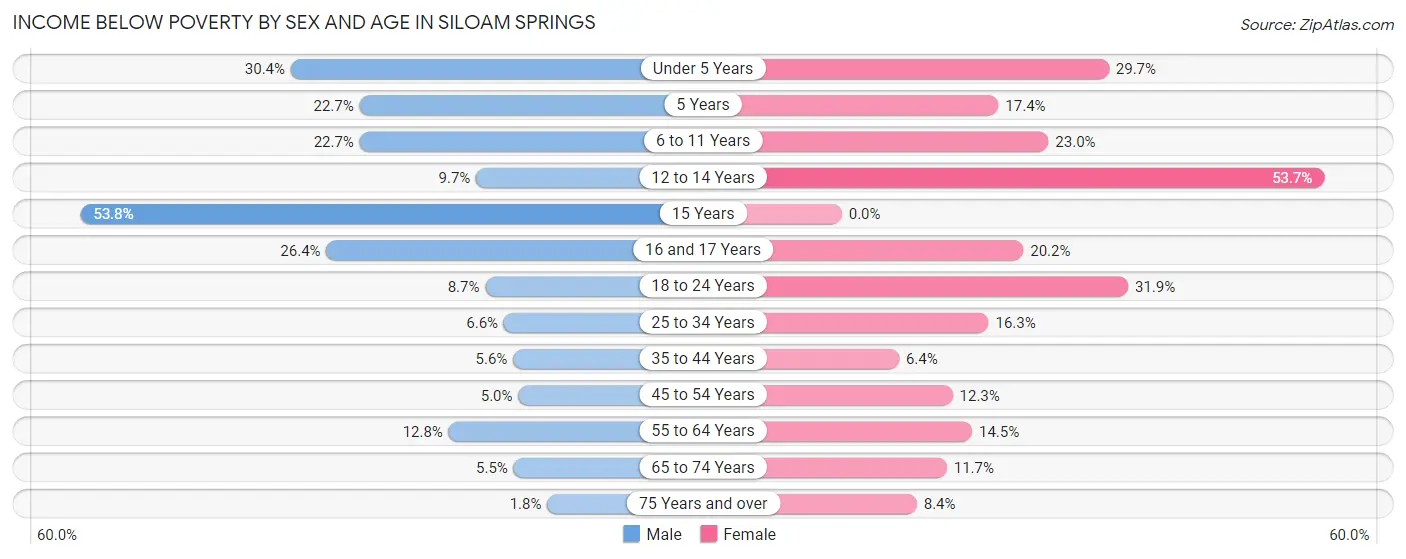
| Age Bracket | Male | Female |
| Under 5 Years | 190 (30.3%) | 273 (29.7%) |
| 5 Years | 32 (22.7%) | 15 (17.4%) |
| 6 to 11 Years | 161 (22.7%) | 220 (23.0%) |
| 12 to 14 Years | 37 (9.7%) | 166 (53.7%) |
| 15 Years | 71 (53.8%) | 0 (0.0%) |
| 16 and 17 Years | 90 (26.4%) | 57 (20.2%) |
| 18 to 24 Years | 84 (8.7%) | 198 (31.9%) |
| 25 to 34 Years | 77 (6.6%) | 244 (16.3%) |
| 35 to 44 Years | 49 (5.6%) | 49 (6.4%) |
| 45 to 54 Years | 35 (5.0%) | 97 (12.3%) |
| 55 to 64 Years | 150 (12.8%) | 202 (14.5%) |
| 65 to 74 Years | 25 (5.5%) | 56 (11.7%) |
| 75 Years and over | 5 (1.8%) | 33 (8.4%) |
| Total | 1,006 (12.7%) | 1,610 (18.7%) |
Income Above Poverty by Sex and Age in Siloam Springs
According to the poverty statistics in Siloam Springs, males aged 75 years and over and females aged 15 years are the age groups that are most secure financially, with 98.2% of males and 100.0% of females in these age groups living above the poverty line.
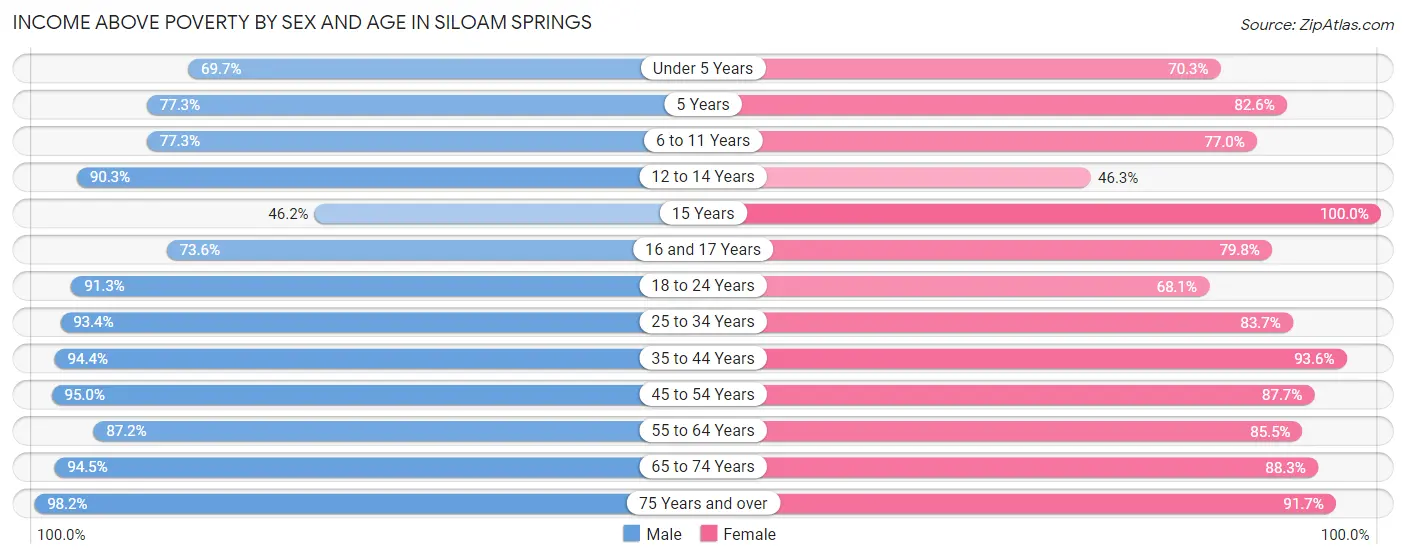
| Age Bracket | Male | Female |
| Under 5 Years | 436 (69.7%) | 645 (70.3%) |
| 5 Years | 109 (77.3%) | 71 (82.6%) |
| 6 to 11 Years | 549 (77.3%) | 736 (77.0%) |
| 12 to 14 Years | 344 (90.3%) | 143 (46.3%) |
| 15 Years | 61 (46.2%) | 108 (100.0%) |
| 16 and 17 Years | 251 (73.6%) | 225 (79.8%) |
| 18 to 24 Years | 883 (91.3%) | 423 (68.1%) |
| 25 to 34 Years | 1,087 (93.4%) | 1,249 (83.7%) |
| 35 to 44 Years | 827 (94.4%) | 720 (93.6%) |
| 45 to 54 Years | 663 (95.0%) | 689 (87.7%) |
| 55 to 64 Years | 1,025 (87.2%) | 1,190 (85.5%) |
| 65 to 74 Years | 427 (94.5%) | 423 (88.3%) |
| 75 Years and over | 275 (98.2%) | 362 (91.6%) |
| Total | 6,937 (87.3%) | 6,984 (81.3%) |
Income Below Poverty Among Married-Couple Families in Siloam Springs
The poverty statistics for married-couple families in Siloam Springs show that 5.1% or 181 of the total 3,564 families live below the poverty line. Families with 5 or more children have the highest poverty rate of 100.0%, comprising of 12 families. On the other hand, families with no children have the lowest poverty rate of 3.4%, which includes 61 families.
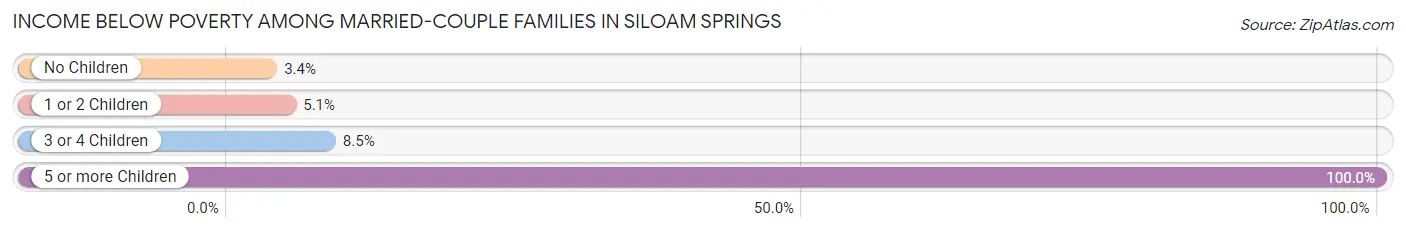
| Children | Above Poverty | Below Poverty |
| No Children | 1,728 (96.6%) | 61 (3.4%) |
| 1 or 2 Children | 1,161 (94.9%) | 62 (5.1%) |
| 3 or 4 Children | 494 (91.5%) | 46 (8.5%) |
| 5 or more Children | 0 (0.0%) | 12 (100.0%) |
| Total | 3,383 (94.9%) | 181 (5.1%) |
Income Below Poverty Among Single-Parent Households in Siloam Springs
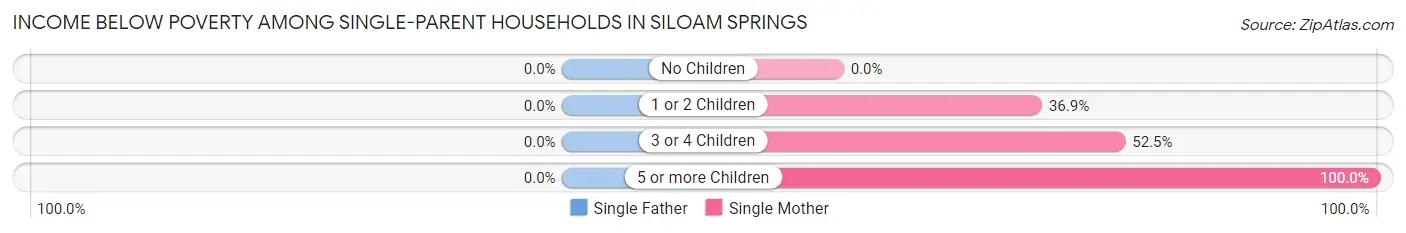
| Children | Single Father | Single Mother |
| No Children | 0 (0.0%) | 0 (0.0%) |
| 1 or 2 Children | 0 (0.0%) | 140 (36.9%) |
| 3 or 4 Children | 0 (0.0%) | 75 (52.4%) |
| 5 or more Children | 0 (0.0%) | 88 (100.0%) |
| Total | 0 (0.0%) | 303 (44.5%) |
Income Below Poverty Among Married-Couple vs Single-Parent Households in Siloam Springs
The poverty data for Siloam Springs shows that 181 of the married-couple family households (5.1%) and 303 of the single-parent households (34.3%) are living below the poverty level. Within the married-couple family households, those with 5 or more children have the highest poverty rate, with 12 households (100.0%) falling below the poverty line. Among the single-parent households, those with 5 or more children have the highest poverty rate, with 88 household (100.0%) living below poverty.
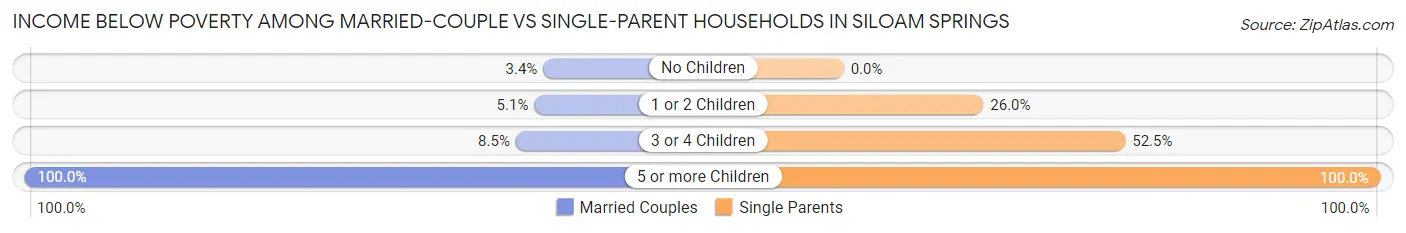
| Children | Married-Couple Families | Single-Parent Households |
| No Children | 61 (3.4%) | 0 (0.0%) |
| 1 or 2 Children | 62 (5.1%) | 140 (26.0%) |
| 3 or 4 Children | 46 (8.5%) | 75 (52.4%) |
| 5 or more Children | 12 (100.0%) | 88 (100.0%) |
| Total | 181 (5.1%) | 303 (34.3%) |
Race in Siloam Springs
The most populous races in Siloam Springs are White / Caucasian (11,284 | 64.0%), Hispanic or Latino (4,337 | 24.6%), and Two or more Races (3,722 | 21.1%).
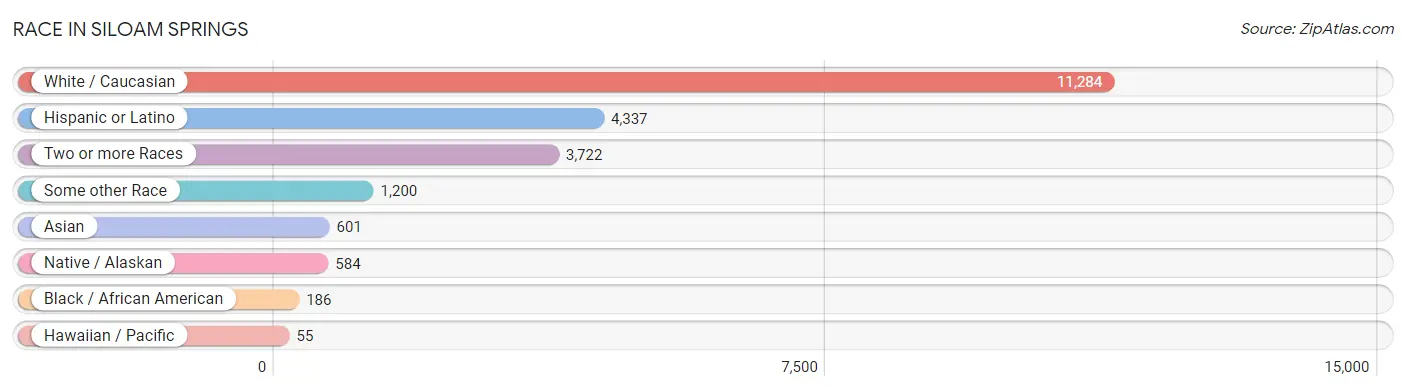
| Race | # Population | % Population |
| Asian | 601 | 3.4% |
| Black / African American | 186 | 1.1% |
| Hawaiian / Pacific | 55 | 0.3% |
| Hispanic or Latino | 4,337 | 24.6% |
| Native / Alaskan | 584 | 3.3% |
| White / Caucasian | 11,284 | 64.0% |
| Two or more Races | 3,722 | 21.1% |
| Some other Race | 1,200 | 6.8% |
| Total | 17,632 | 100.0% |
Ancestry in Siloam Springs
The most populous ancestries reported in Siloam Springs are Central American (1,836 | 10.4%), Mexican (1,821 | 10.3%), Salvadoran (1,741 | 9.9%), German (1,483 | 8.4%), and English (1,458 | 8.3%), together accounting for 47.3% of all Siloam Springs residents.
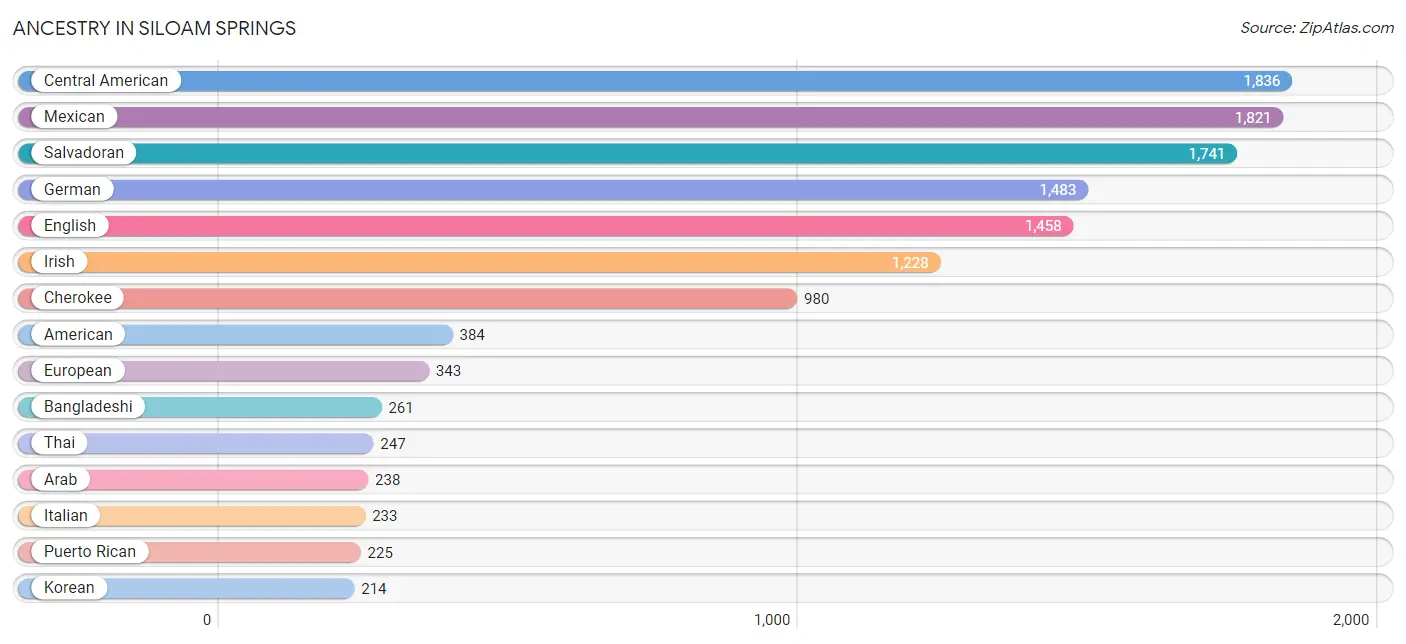
| Ancestry | # Population | % Population |
| African | 6 | 0.0% |
| American | 384 | 2.2% |
| Apache | 6 | 0.0% |
| Arab | 238 | 1.3% |
| Bahamian | 8 | 0.1% |
| Bangladeshi | 261 | 1.5% |
| Belgian | 8 | 0.1% |
| Bhutanese | 43 | 0.2% |
| Blackfeet | 13 | 0.1% |
| British | 83 | 0.5% |
| Burmese | 47 | 0.3% |
| Central American | 1,836 | 10.4% |
| Cherokee | 980 | 5.6% |
| Choctaw | 30 | 0.2% |
| Creek | 69 | 0.4% |
| Cuban | 5 | 0.0% |
| Czech | 36 | 0.2% |
| Czechoslovakian | 33 | 0.2% |
| Danish | 30 | 0.2% |
| Dutch | 170 | 1.0% |
| Dutch West Indian | 9 | 0.1% |
| Eastern European | 9 | 0.1% |
| Ecuadorian | 12 | 0.1% |
| Egyptian | 190 | 1.1% |
| English | 1,458 | 8.3% |
| European | 343 | 1.9% |
| Fijian | 15 | 0.1% |
| Finnish | 75 | 0.4% |
| French | 194 | 1.1% |
| French American Indian | 11 | 0.1% |
| French Canadian | 44 | 0.3% |
| German | 1,483 | 8.4% |
| Greek | 70 | 0.4% |
| Guatemalan | 76 | 0.4% |
| Haitian | 67 | 0.4% |
| Hungarian | 8 | 0.1% |
| Indian (Asian) | 86 | 0.5% |
| Irish | 1,228 | 7.0% |
| Iroquois | 14 | 0.1% |
| Italian | 233 | 1.3% |
| Japanese | 40 | 0.2% |
| Kenyan | 5 | 0.0% |
| Korean | 214 | 1.2% |
| Lebanese | 32 | 0.2% |
| Lithuanian | 9 | 0.1% |
| Mexican | 1,821 | 10.3% |
| Native Hawaiian | 40 | 0.2% |
| Navajo | 19 | 0.1% |
| New Zealander | 7 | 0.0% |
| Nicaraguan | 10 | 0.1% |
| Nigerian | 14 | 0.1% |
| Norwegian | 124 | 0.7% |
| Panamanian | 9 | 0.1% |
| Polish | 49 | 0.3% |
| Portuguese | 31 | 0.2% |
| Puerto Rican | 225 | 1.3% |
| Russian | 15 | 0.1% |
| Salvadoran | 1,741 | 9.9% |
| Scandinavian | 66 | 0.4% |
| Scotch-Irish | 103 | 0.6% |
| Scottish | 214 | 1.2% |
| South American | 87 | 0.5% |
| Spanish | 63 | 0.4% |
| Subsaharan African | 25 | 0.1% |
| Swedish | 200 | 1.1% |
| Swiss | 47 | 0.3% |
| Thai | 247 | 1.4% |
| Ukrainian | 9 | 0.1% |
| Venezuelan | 75 | 0.4% |
| Welsh | 104 | 0.6% | View All 70 Rows |
Immigrants in Siloam Springs
The most numerous immigrant groups reported in Siloam Springs came from Latin America (1,761 | 10.0%), Central America (1,681 | 9.5%), El Salvador (1,058 | 6.0%), Mexico (526 | 3.0%), and Asia (300 | 1.7%), together accounting for 30.2% of all Siloam Springs residents.
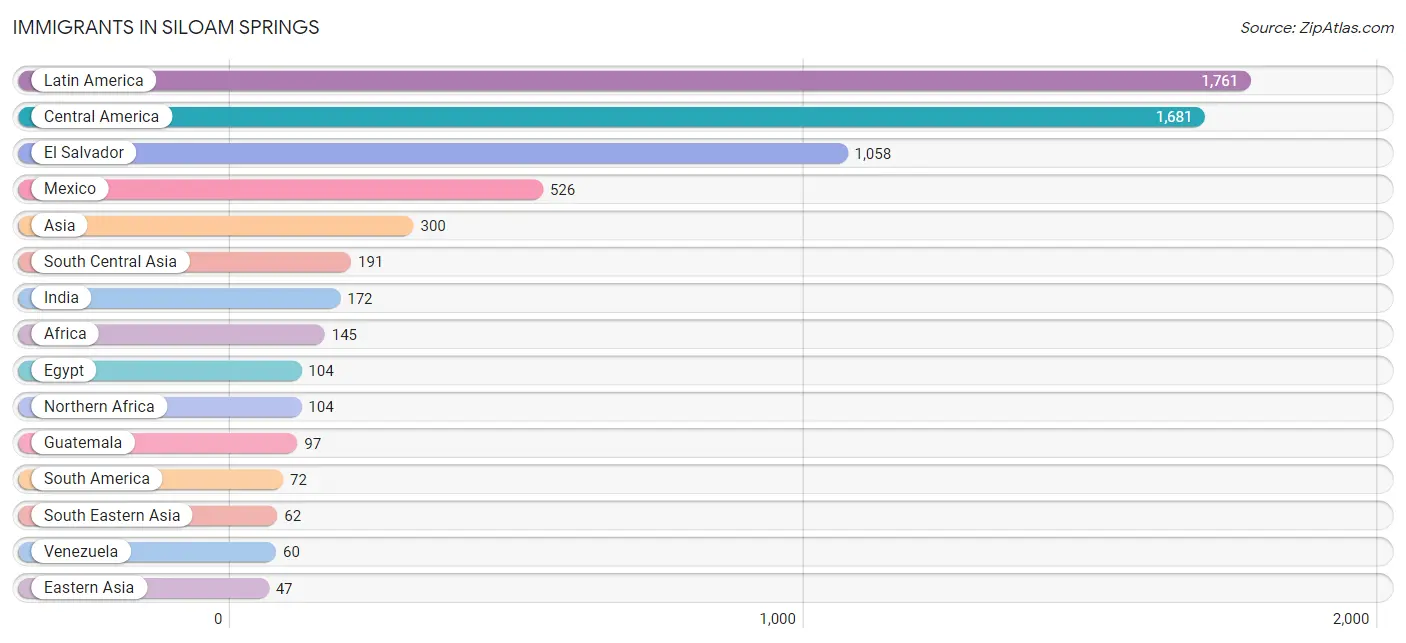
| Immigration Origin | # Population | % Population |
| Africa | 145 | 0.8% |
| Asia | 300 | 1.7% |
| Bahamas | 8 | 0.1% |
| Cambodia | 40 | 0.2% |
| Caribbean | 8 | 0.1% |
| Central America | 1,681 | 9.5% |
| China | 18 | 0.1% |
| Eastern Africa | 5 | 0.0% |
| Eastern Asia | 47 | 0.3% |
| Ecuador | 12 | 0.1% |
| Egypt | 104 | 0.6% |
| El Salvador | 1,058 | 6.0% |
| Europe | 28 | 0.2% |
| France | 11 | 0.1% |
| Germany | 9 | 0.1% |
| Greece | 8 | 0.1% |
| Guatemala | 97 | 0.5% |
| India | 172 | 1.0% |
| Japan | 16 | 0.1% |
| Kenya | 5 | 0.0% |
| Korea | 13 | 0.1% |
| Laos | 10 | 0.1% |
| Latin America | 1,761 | 10.0% |
| Mexico | 526 | 3.0% |
| Nepal | 19 | 0.1% |
| Nigeria | 14 | 0.1% |
| Northern Africa | 104 | 0.6% |
| Oceania | 24 | 0.1% |
| Philippines | 12 | 0.1% |
| South Africa | 6 | 0.0% |
| South America | 72 | 0.4% |
| South Central Asia | 191 | 1.1% |
| South Eastern Asia | 62 | 0.4% |
| Southern Europe | 8 | 0.1% |
| Venezuela | 60 | 0.3% |
| Western Africa | 14 | 0.1% |
| Western Europe | 20 | 0.1% | View All 37 Rows |
Sex and Age in Siloam Springs
Sex and Age in Siloam Springs
The most populous age groups in Siloam Springs are 20 to 24 Years (899 | 10.7%) for men and Under 5 Years (954 | 10.3%) for women.
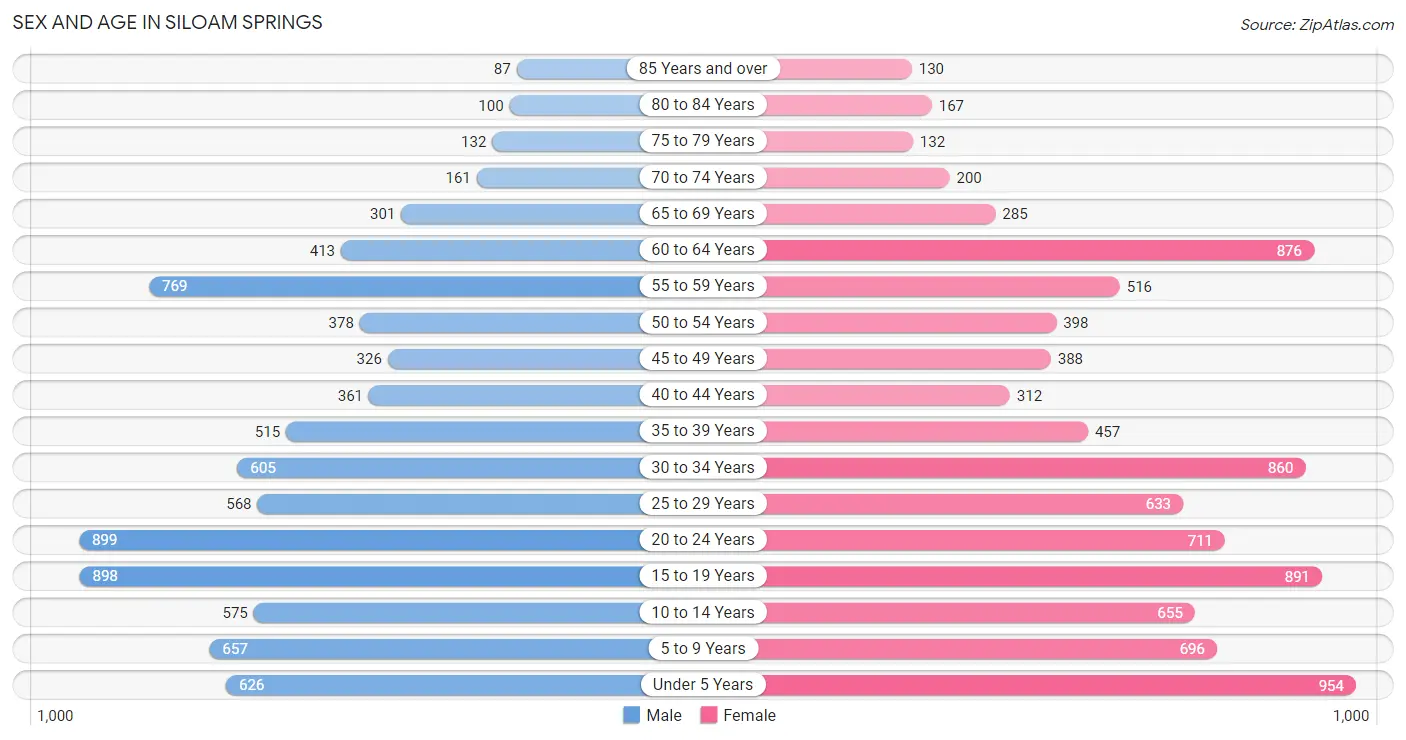
| Age Bracket | Male | Female |
| Under 5 Years | 626 (7.5%) | 954 (10.3%) |
| 5 to 9 Years | 657 (7.9%) | 696 (7.5%) |
| 10 to 14 Years | 575 (6.9%) | 655 (7.1%) |
| 15 to 19 Years | 898 (10.7%) | 891 (9.6%) |
| 20 to 24 Years | 899 (10.7%) | 711 (7.7%) |
| 25 to 29 Years | 568 (6.8%) | 633 (6.8%) |
| 30 to 34 Years | 605 (7.2%) | 860 (9.3%) |
| 35 to 39 Years | 515 (6.1%) | 457 (4.9%) |
| 40 to 44 Years | 361 (4.3%) | 312 (3.4%) |
| 45 to 49 Years | 326 (3.9%) | 388 (4.2%) |
| 50 to 54 Years | 378 (4.5%) | 398 (4.3%) |
| 55 to 59 Years | 769 (9.2%) | 516 (5.6%) |
| 60 to 64 Years | 413 (4.9%) | 876 (9.5%) |
| 65 to 69 Years | 301 (3.6%) | 285 (3.1%) |
| 70 to 74 Years | 161 (1.9%) | 200 (2.2%) |
| 75 to 79 Years | 132 (1.6%) | 132 (1.4%) |
| 80 to 84 Years | 100 (1.2%) | 167 (1.8%) |
| 85 Years and over | 87 (1.0%) | 130 (1.4%) |
| Total | 8,371 (100.0%) | 9,261 (100.0%) |
Families and Households in Siloam Springs
Median Family Size in Siloam Springs
The median family size in Siloam Springs is 3.18 persons per family, with single female/mother families (681 | 15.3%) accounting for the largest median family size of 3.42 persons per family. On the other hand, single male/father families (202 | 4.5%) represent the smallest median family size with 2.49 persons per family.
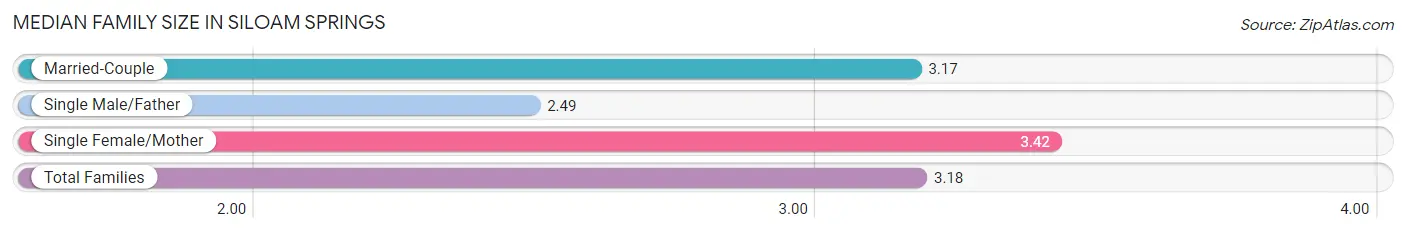
| Family Type | # Families | Family Size |
| Married-Couple | 3,564 (80.1%) | 3.17 |
| Single Male/Father | 202 (4.5%) | 2.49 |
| Single Female/Mother | 681 (15.3%) | 3.42 |
| Total Families | 4,447 (100.0%) | 3.18 |
Median Household Size in Siloam Springs
The median household size in Siloam Springs is 2.77 persons per household, with single female/mother households (681 | 11.4%) accounting for the largest median household size of 3.76 persons per household. non-family households (1,516 | 25.4%) represent the smallest median household size with 1.24 persons per household.
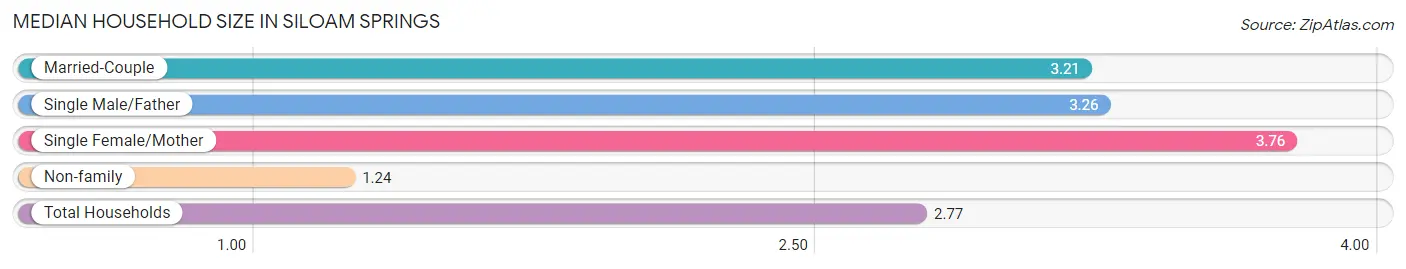
| Household Type | # Households | Household Size |
| Married-Couple | 3,564 (59.8%) | 3.21 |
| Single Male/Father | 202 (3.4%) | 3.26 |
| Single Female/Mother | 681 (11.4%) | 3.76 |
| Non-family | 1,516 (25.4%) | 1.24 |
| Total Households | 5,963 (100.0%) | 2.77 |
Household Size by Marriage Status in Siloam Springs
Out of a total of 5,963 households in Siloam Springs, 4,447 (74.6%) are family households, while 1,516 (25.4%) are nonfamily households. The most numerous type of family households are 2-person households, comprising 1,412, and the most common type of nonfamily households are 1-person households, comprising 1,256.
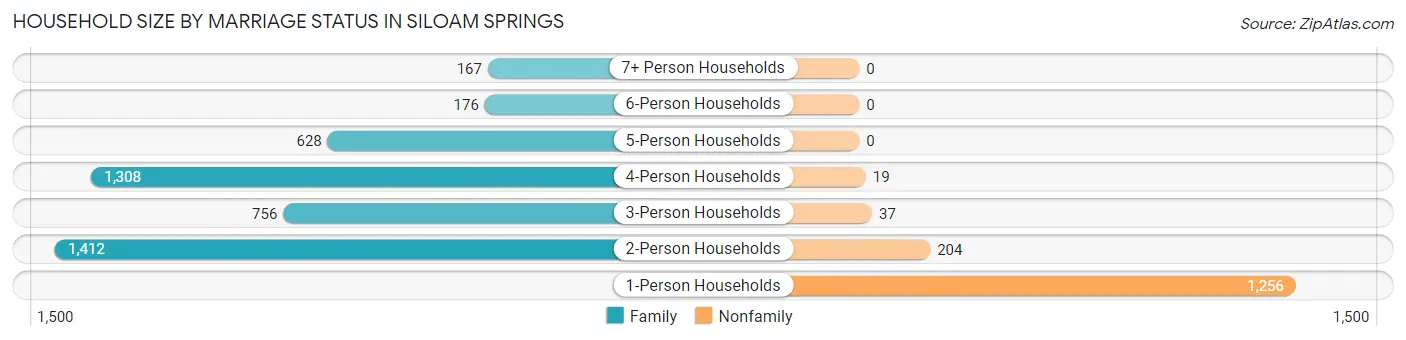
| Household Size | Family Households | Nonfamily Households |
| 1-Person Households | - | 1,256 (21.1%) |
| 2-Person Households | 1,412 (23.7%) | 204 (3.4%) |
| 3-Person Households | 756 (12.7%) | 37 (0.6%) |
| 4-Person Households | 1,308 (21.9%) | 19 (0.3%) |
| 5-Person Households | 628 (10.5%) | 0 (0.0%) |
| 6-Person Households | 176 (2.9%) | 0 (0.0%) |
| 7+ Person Households | 167 (2.8%) | 0 (0.0%) |
| Total | 4,447 (74.6%) | 1,516 (25.4%) |
Female Fertility in Siloam Springs
Fertility by Age in Siloam Springs
Average fertility rate in Siloam Springs is 59.0 births per 1,000 women. Women in the age bracket of 20 to 34 years have the highest fertility rate with 104.0 births per 1,000 women. Women in the age bracket of 20 to 34 years acount for 90.5% of all women with births.
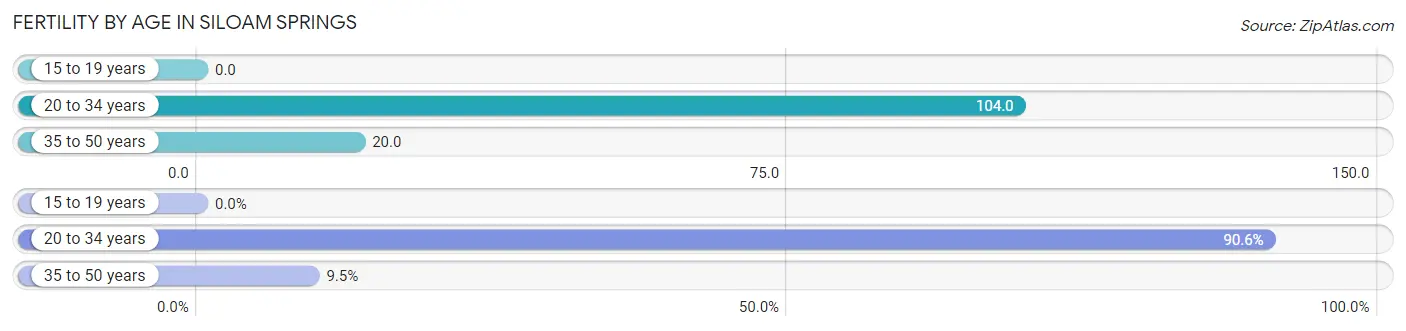
| Age Bracket | Women with Births | Births / 1,000 Women |
| 15 to 19 years | 0 (0.0%) | 0.0 |
| 20 to 34 years | 230 (90.5%) | 104.0 |
| 35 to 50 years | 24 (9.5%) | 20.0 |
| Total | 254 (100.0%) | 59.0 |
Fertility by Age by Marriage Status in Siloam Springs
72.8% of women with births (254) in Siloam Springs are married. The highest percentage of unmarried women with births falls into 20 to 34 years age bracket with 30.0% of them unmarried at the time of birth, while the lowest percentage of unmarried women with births belong to 35 to 50 years age bracket with 0.0% of them unmarried.
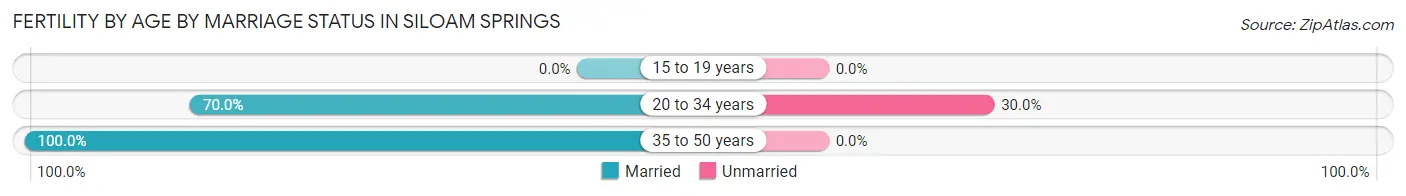
| Age Bracket | Married | Unmarried |
| 15 to 19 years | 0 (0.0%) | 0 (0.0%) |
| 20 to 34 years | 161 (70.0%) | 69 (30.0%) |
| 35 to 50 years | 24 (100.0%) | 0 (0.0%) |
| Total | 185 (72.8%) | 69 (27.2%) |
Fertility by Education in Siloam Springs
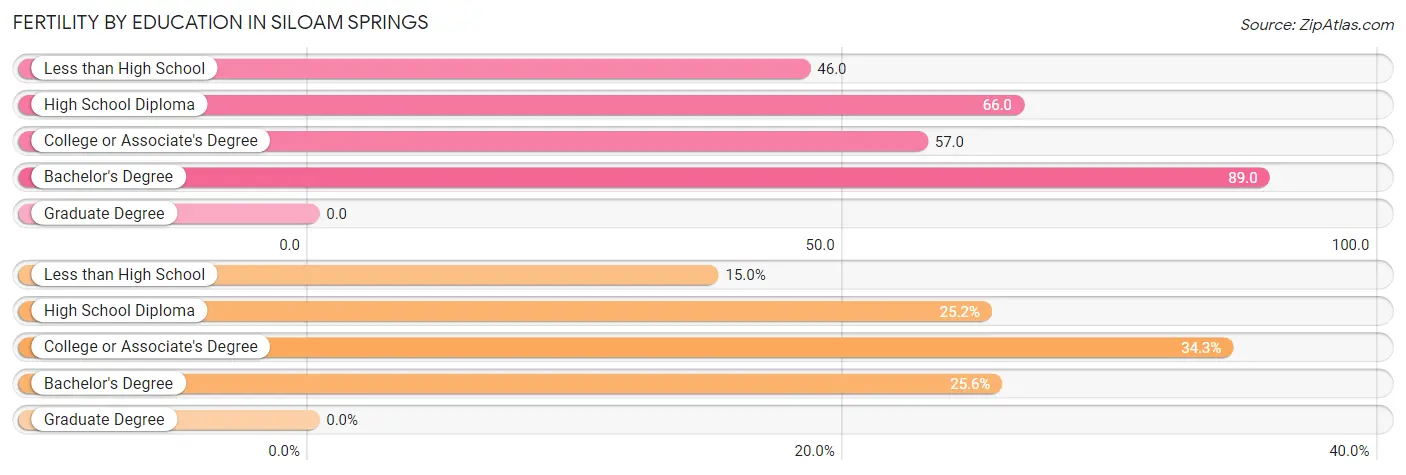
| Educational Attainment | Women with Births | Births / 1,000 Women |
| Less than High School | 38 (15.0%) | 46.0 |
| High School Diploma | 64 (25.2%) | 66.0 |
| College or Associate's Degree | 87 (34.3%) | 57.0 |
| Bachelor's Degree | 65 (25.6%) | 89.0 |
| Graduate Degree | 0 (0.0%) | 0.0 |
| Total | 254 (100.0%) | 59.0 |
Fertility by Education by Marriage Status in Siloam Springs
27.2% of women with births in Siloam Springs are unmarried. Women with the educational attainment of high school diploma are most likely to be married with 100.0% of them married at childbirth, while women with the educational attainment of less than high school are least likely to be married with 100.0% of them unmarried at childbirth.
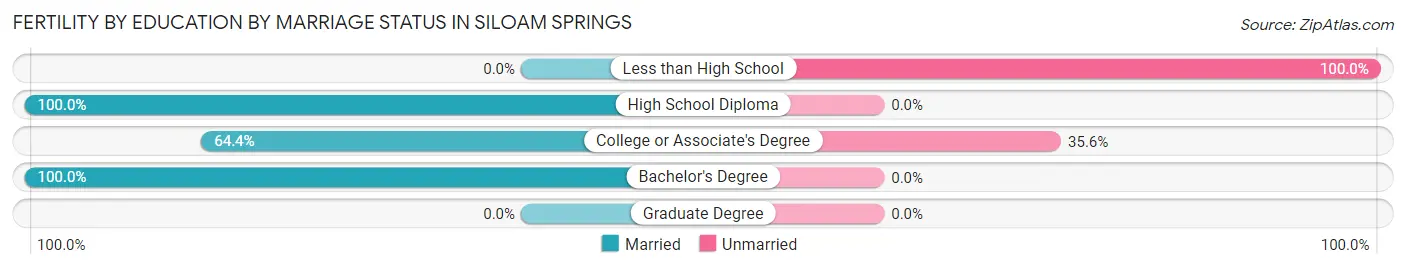
| Educational Attainment | Married | Unmarried |
| Less than High School | 0 (0.0%) | 38 (100.0%) |
| High School Diploma | 64 (100.0%) | 0 (0.0%) |
| College or Associate's Degree | 56 (64.4%) | 31 (35.6%) |
| Bachelor's Degree | 65 (100.0%) | 0 (0.0%) |
| Graduate Degree | 0 (0.0%) | 0 (0.0%) |
| Total | 185 (72.8%) | 69 (27.2%) |
Employment Characteristics in Siloam Springs
Employment by Class of Employer in Siloam Springs
Among the 7,928 employed individuals in Siloam Springs, private company employees (5,878 | 74.1%), not-for-profit organizations (757 | 9.6%), and local government employees (405 | 5.1%) make up the most common classes of employment.
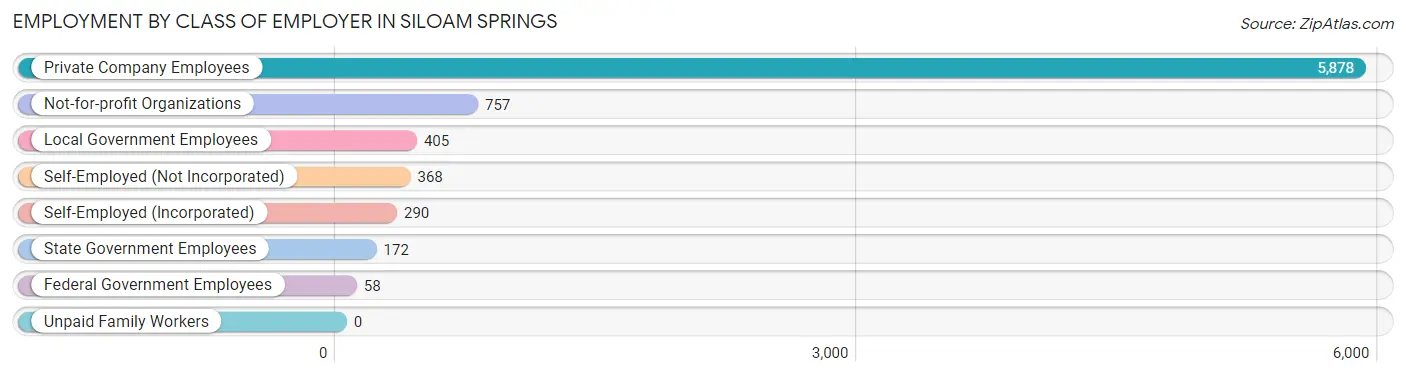
| Employer Class | # Employees | % Employees |
| Private Company Employees | 5,878 | 74.1% |
| Self-Employed (Incorporated) | 290 | 3.7% |
| Self-Employed (Not Incorporated) | 368 | 4.6% |
| Not-for-profit Organizations | 757 | 9.6% |
| Local Government Employees | 405 | 5.1% |
| State Government Employees | 172 | 2.2% |
| Federal Government Employees | 58 | 0.7% |
| Unpaid Family Workers | 0 | 0.0% |
| Total | 7,928 | 100.0% |
Employment Status by Age in Siloam Springs
According to the labor force statistics for Siloam Springs, out of the total population over 16 years of age (13,229), 62.5% or 8,268 individuals are in the labor force, with 2.6% or 215 of them unemployed. The age group with the highest labor force participation rate is 30 to 34 years, with 88.9% or 1,302 individuals in the labor force. Within the labor force, the 25 to 29 years age range has the highest percentage of unemployed individuals, with 9.4% or 96 of them being unemployed.
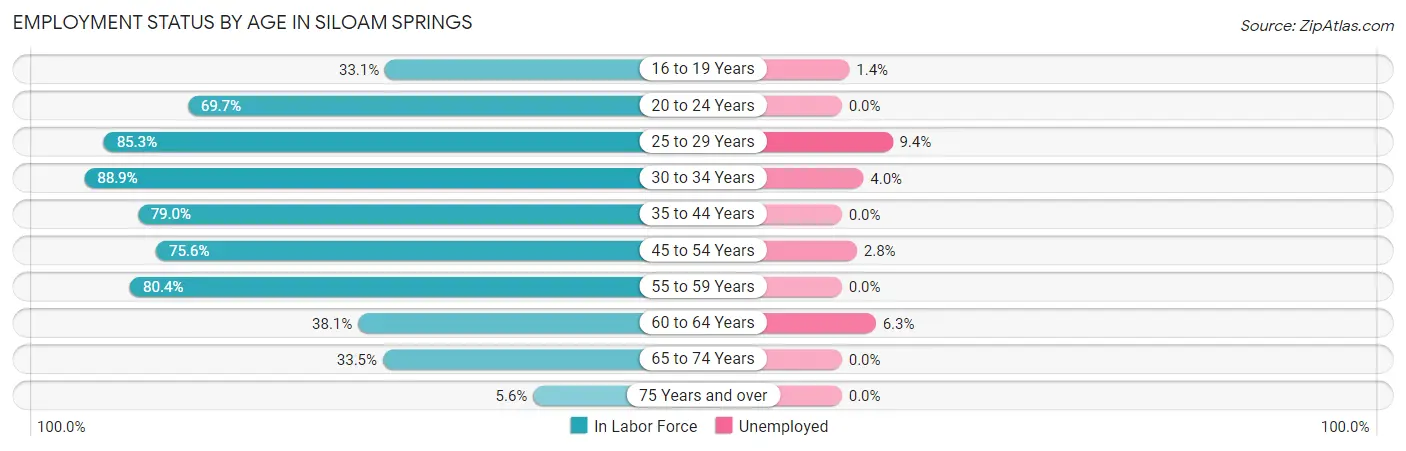
| Age Bracket | In Labor Force | Unemployed |
| 16 to 19 Years | 513 (33.1%) | 7 (1.4%) |
| 20 to 24 Years | 1,122 (69.7%) | 0 (0.0%) |
| 25 to 29 Years | 1,024 (85.3%) | 96 (9.4%) |
| 30 to 34 Years | 1,302 (88.9%) | 52 (4.0%) |
| 35 to 44 Years | 1,300 (79.0%) | 0 (0.0%) |
| 45 to 54 Years | 1,126 (75.6%) | 32 (2.8%) |
| 55 to 59 Years | 1,033 (80.4%) | 0 (0.0%) |
| 60 to 64 Years | 491 (38.1%) | 31 (6.3%) |
| 65 to 74 Years | 317 (33.5%) | 0 (0.0%) |
| 75 Years and over | 42 (5.6%) | 0 (0.0%) |
| Total | 8,268 (62.5%) | 215 (2.6%) |
Employment Status by Educational Attainment in Siloam Springs
According to labor force statistics for Siloam Springs, 74.9% of individuals (6,273) out of the total population between 25 and 64 years of age (8,375) are in the labor force, with 3.3% or 207 of them being unemployed. The group with the highest labor force participation rate are those with the educational attainment of bachelor's degree or higher, with 86.6% or 1,901 individuals in the labor force. Within the labor force, individuals with less than high school education have the highest percentage of unemployment, with 6.1% or 61 of them being unemployed.
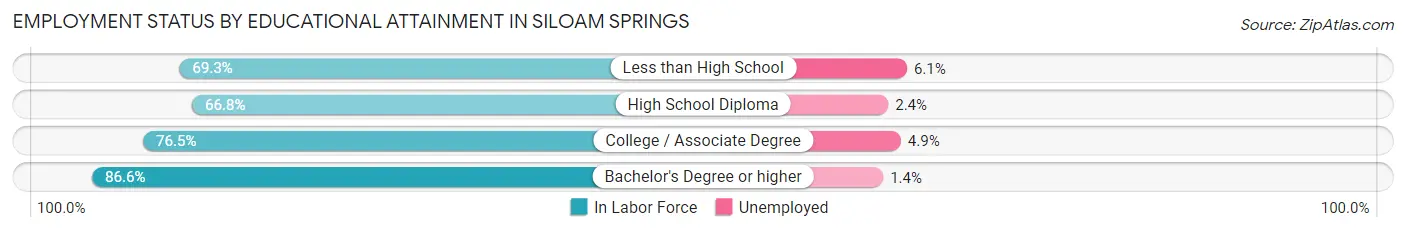
| Educational Attainment | In Labor Force | Unemployed |
| Less than High School | 1,003 (69.3%) | 88 (6.1%) |
| High School Diploma | 1,700 (66.8%) | 61 (2.4%) |
| College / Associate Degree | 1,673 (76.5%) | 107 (4.9%) |
| Bachelor's Degree or higher | 1,901 (86.6%) | 31 (1.4%) |
| Total | 6,273 (74.9%) | 276 (3.3%) |
Employment Occupations by Sex in Siloam Springs
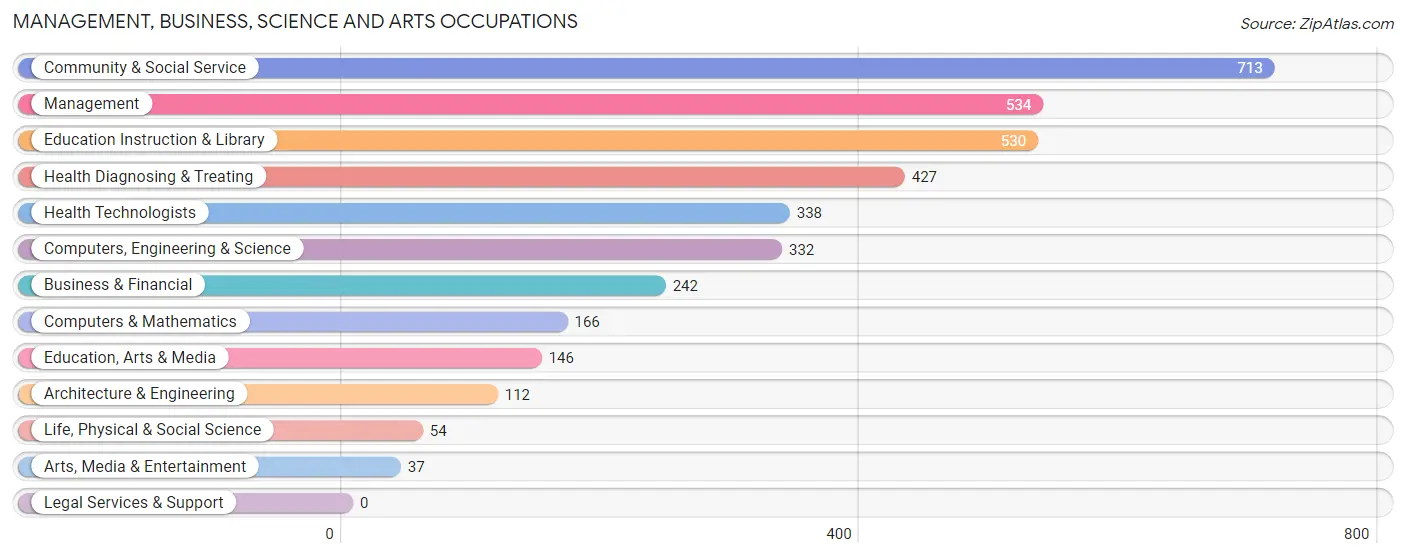
Management, Business, Science and Arts Occupations
The most common Management, Business, Science and Arts occupations in Siloam Springs are Community & Social Service (713 | 8.8%), Management (534 | 6.6%), Education Instruction & Library (530 | 6.6%), Health Diagnosing & Treating (427 | 5.3%), and Health Technologists (338 | 4.2%).
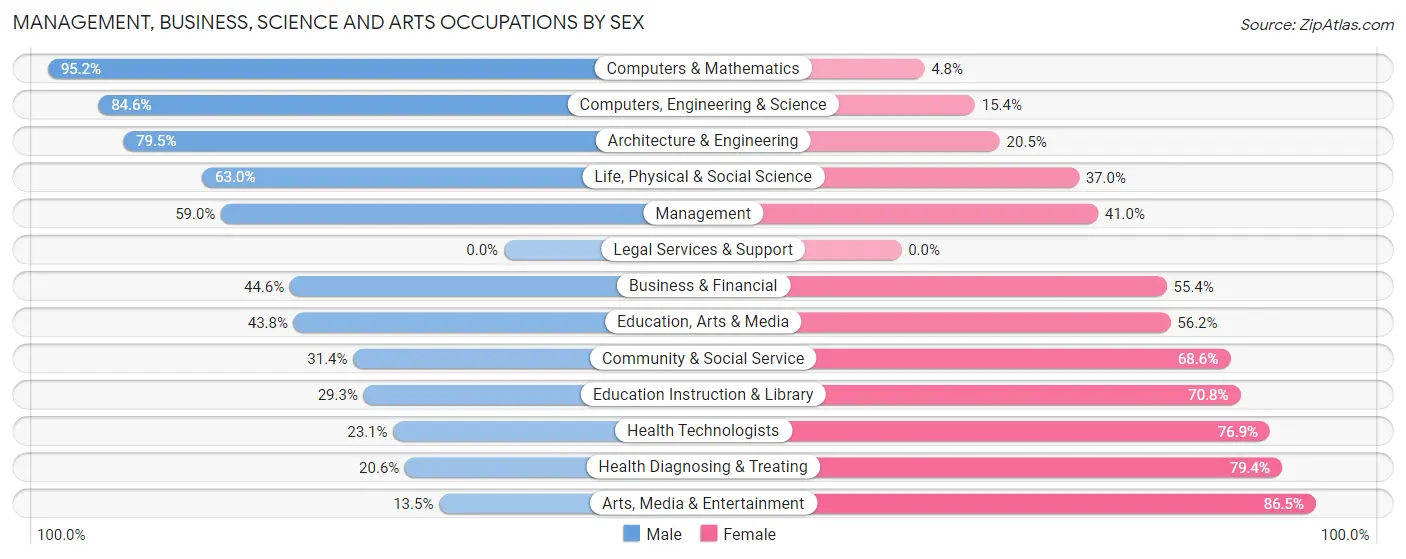
Management, Business, Science and Arts Occupations by Sex
Within the Management, Business, Science and Arts occupations in Siloam Springs, the most male-oriented occupations are Computers & Mathematics (95.2%), Computers, Engineering & Science (84.6%), and Architecture & Engineering (79.5%), while the most female-oriented occupations are Arts, Media & Entertainment (86.5%), Health Diagnosing & Treating (79.4%), and Health Technologists (76.9%).
| Occupation | Male | Female |
| Management | 315 (59.0%) | 219 (41.0%) |
| Business & Financial | 108 (44.6%) | 134 (55.4%) |
| Computers, Engineering & Science | 281 (84.6%) | 51 (15.4%) |
| Computers & Mathematics | 158 (95.2%) | 8 (4.8%) |
| Architecture & Engineering | 89 (79.5%) | 23 (20.5%) |
| Life, Physical & Social Science | 34 (63.0%) | 20 (37.0%) |
| Community & Social Service | 224 (31.4%) | 489 (68.6%) |
| Education, Arts & Media | 64 (43.8%) | 82 (56.2%) |
| Legal Services & Support | 0 (0.0%) | 0 (0.0%) |
| Education Instruction & Library | 155 (29.2%) | 375 (70.8%) |
| Arts, Media & Entertainment | 5 (13.5%) | 32 (86.5%) |
| Health Diagnosing & Treating | 88 (20.6%) | 339 (79.4%) |
| Health Technologists | 78 (23.1%) | 260 (76.9%) |
| Total (Category) | 1,016 (45.2%) | 1,232 (54.8%) |
| Total (Overall) | 4,395 (54.6%) | 3,658 (45.4%) |
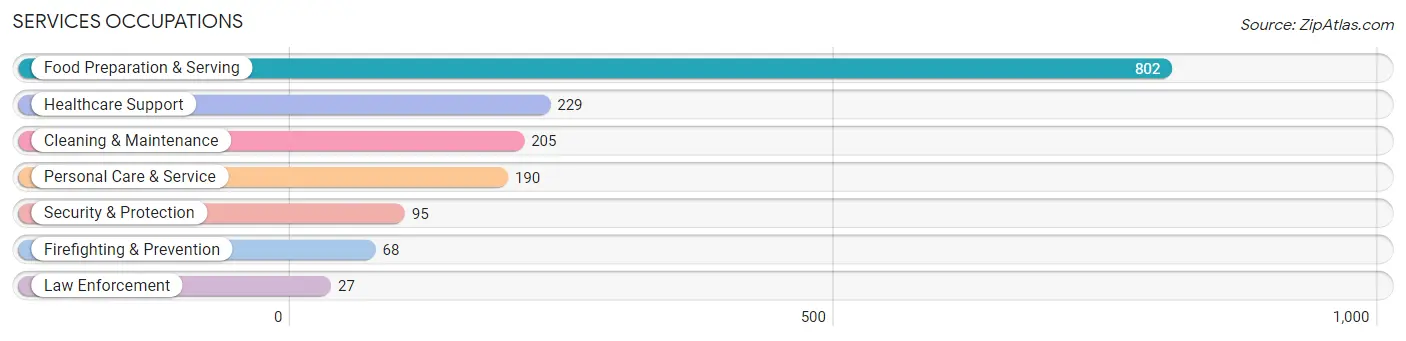
Services Occupations
The most common Services occupations in Siloam Springs are Food Preparation & Serving (802 | 10.0%), Healthcare Support (229 | 2.8%), Cleaning & Maintenance (205 | 2.5%), Personal Care & Service (190 | 2.4%), and Security & Protection (95 | 1.2%).
Services Occupations by Sex
Within the Services occupations in Siloam Springs, the most male-oriented occupations are Security & Protection (100.0%), Firefighting & Prevention (100.0%), and Law Enforcement (100.0%), while the most female-oriented occupations are Personal Care & Service (93.7%), Healthcare Support (89.1%), and Food Preparation & Serving (43.5%).

| Occupation | Male | Female |
| Healthcare Support | 25 (10.9%) | 204 (89.1%) |
| Security & Protection | 95 (100.0%) | 0 (0.0%) |
| Firefighting & Prevention | 68 (100.0%) | 0 (0.0%) |
| Law Enforcement | 27 (100.0%) | 0 (0.0%) |
| Food Preparation & Serving | 453 (56.5%) | 349 (43.5%) |
| Cleaning & Maintenance | 122 (59.5%) | 83 (40.5%) |
| Personal Care & Service | 12 (6.3%) | 178 (93.7%) |
| Total (Category) | 707 (46.5%) | 814 (53.5%) |
| Total (Overall) | 4,395 (54.6%) | 3,658 (45.4%) |
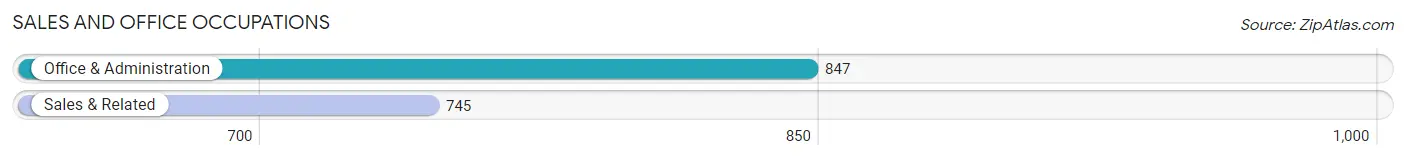
Sales and Office Occupations
The most common Sales and Office occupations in Siloam Springs are Office & Administration (847 | 10.5%), and Sales & Related (745 | 9.2%).
Sales and Office Occupations by Sex
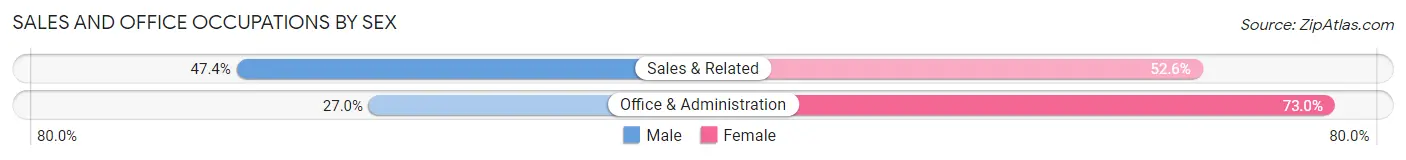
| Occupation | Male | Female |
| Sales & Related | 353 (47.4%) | 392 (52.6%) |
| Office & Administration | 229 (27.0%) | 618 (73.0%) |
| Total (Category) | 582 (36.6%) | 1,010 (63.4%) |
| Total (Overall) | 4,395 (54.6%) | 3,658 (45.4%) |
Natural Resources, Construction and Maintenance Occupations
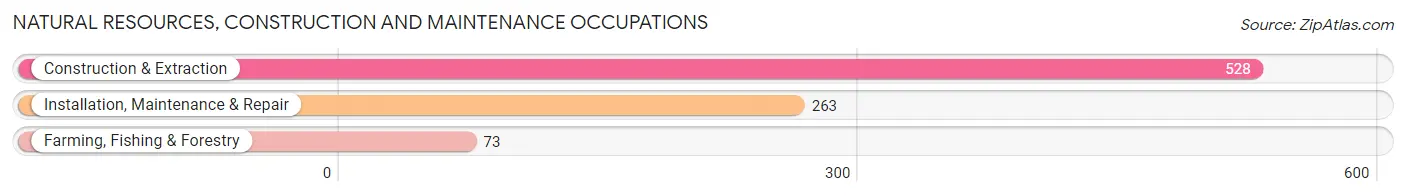
The most common Natural Resources, Construction and Maintenance occupations in Siloam Springs are Construction & Extraction (528 | 6.6%), Installation, Maintenance & Repair (263 | 3.3%), and Farming, Fishing & Forestry (73 | 0.9%).
Natural Resources, Construction and Maintenance Occupations by Sex
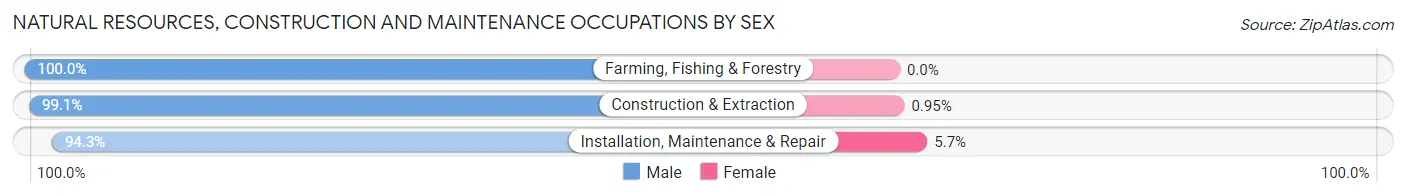
| Occupation | Male | Female |
| Farming, Fishing & Forestry | 73 (100.0%) | 0 (0.0%) |
| Construction & Extraction | 523 (99.1%) | 5 (0.9%) |
| Installation, Maintenance & Repair | 248 (94.3%) | 15 (5.7%) |
| Total (Category) | 844 (97.7%) | 20 (2.3%) |
| Total (Overall) | 4,395 (54.6%) | 3,658 (45.4%) |
Production, Transportation and Moving Occupations
The most common Production, Transportation and Moving occupations in Siloam Springs are Production (1,115 | 13.9%), Material Moving (422 | 5.2%), and Transportation (291 | 3.6%).
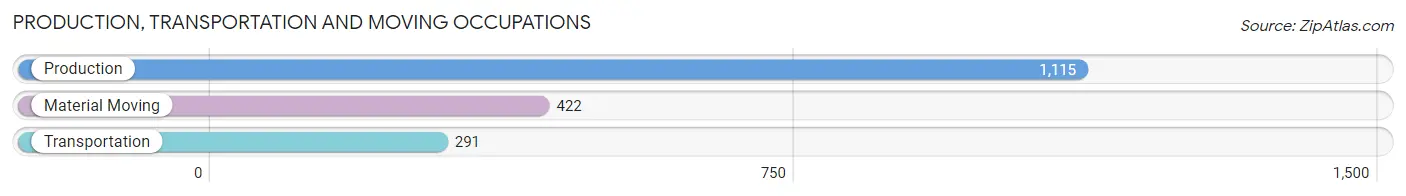
Production, Transportation and Moving Occupations by Sex
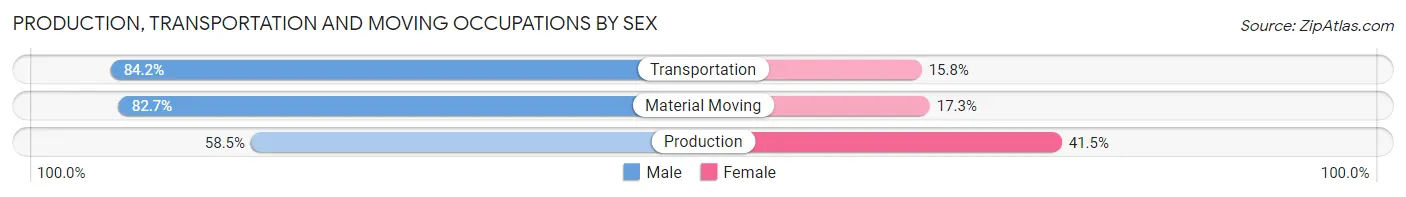
| Occupation | Male | Female |
| Production | 652 (58.5%) | 463 (41.5%) |
| Transportation | 245 (84.2%) | 46 (15.8%) |
| Material Moving | 349 (82.7%) | 73 (17.3%) |
| Total (Category) | 1,246 (68.2%) | 582 (31.8%) |
| Total (Overall) | 4,395 (54.6%) | 3,658 (45.4%) |
Employment Industries by Sex in Siloam Springs
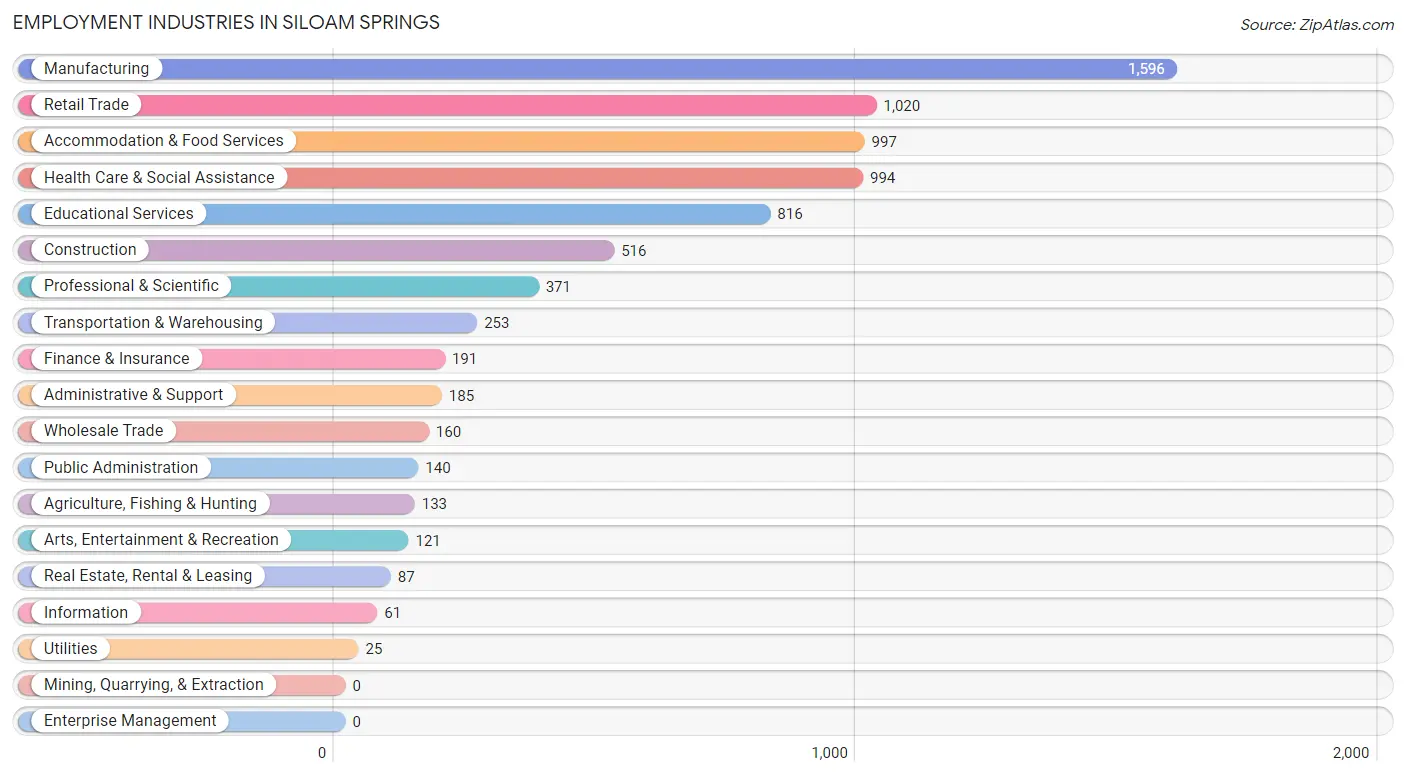
Employment Industries in Siloam Springs
The major employment industries in Siloam Springs include Manufacturing (1,596 | 19.8%), Retail Trade (1,020 | 12.7%), Accommodation & Food Services (997 | 12.4%), Health Care & Social Assistance (994 | 12.3%), and Educational Services (816 | 10.1%).
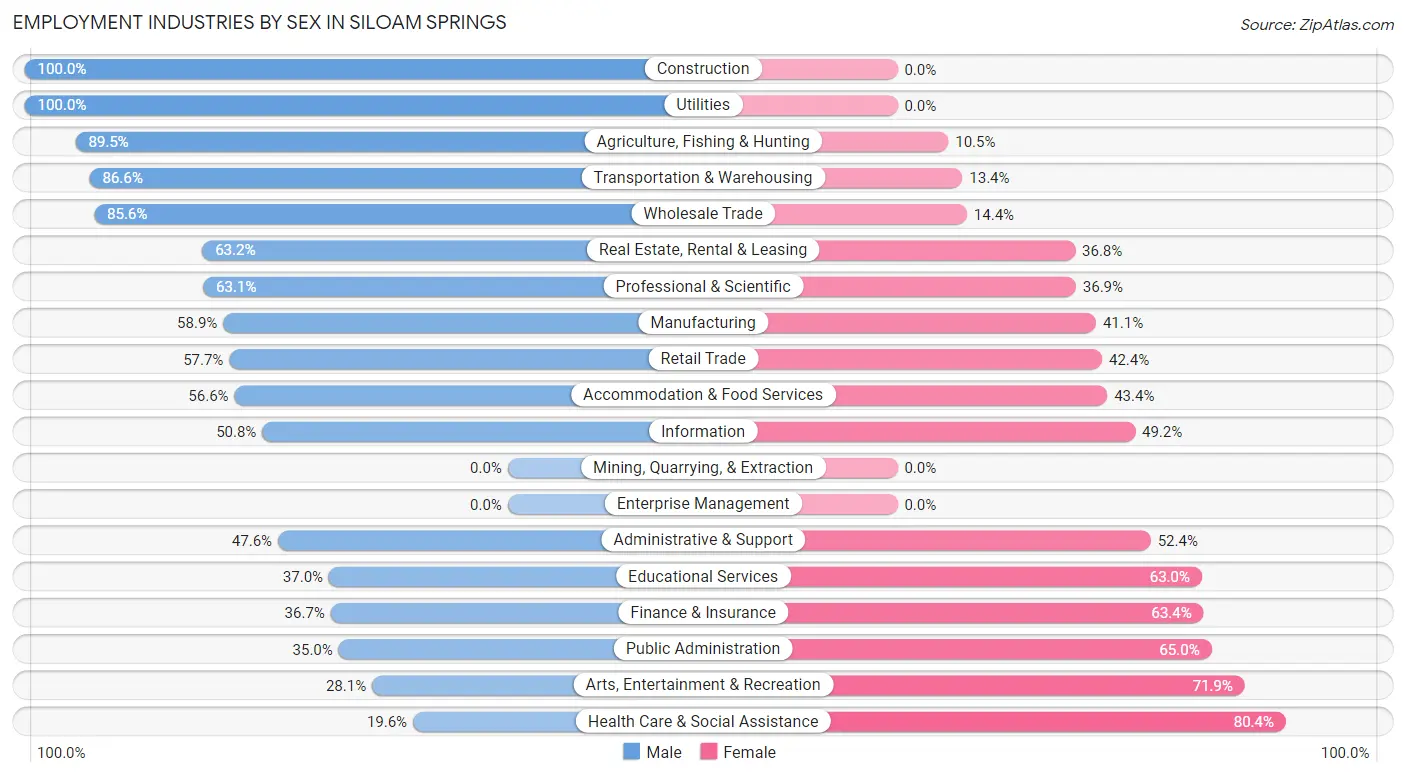
Employment Industries by Sex in Siloam Springs
The Siloam Springs industries that see more men than women are Construction (100.0%), Utilities (100.0%), and Agriculture, Fishing & Hunting (89.5%), whereas the industries that tend to have a higher number of women are Health Care & Social Assistance (80.4%), Arts, Entertainment & Recreation (71.9%), and Public Administration (65.0%).
| Industry | Male | Female |
| Agriculture, Fishing & Hunting | 119 (89.5%) | 14 (10.5%) |
| Mining, Quarrying, & Extraction | 0 (0.0%) | 0 (0.0%) |
| Construction | 516 (100.0%) | 0 (0.0%) |
| Manufacturing | 940 (58.9%) | 656 (41.1%) |
| Wholesale Trade | 137 (85.6%) | 23 (14.4%) |
| Retail Trade | 588 (57.7%) | 432 (42.3%) |
| Transportation & Warehousing | 219 (86.6%) | 34 (13.4%) |
| Utilities | 25 (100.0%) | 0 (0.0%) |
| Information | 31 (50.8%) | 30 (49.2%) |
| Finance & Insurance | 70 (36.6%) | 121 (63.3%) |
| Real Estate, Rental & Leasing | 55 (63.2%) | 32 (36.8%) |
| Professional & Scientific | 234 (63.1%) | 137 (36.9%) |
| Enterprise Management | 0 (0.0%) | 0 (0.0%) |
| Administrative & Support | 88 (47.6%) | 97 (52.4%) |
| Educational Services | 302 (37.0%) | 514 (63.0%) |
| Health Care & Social Assistance | 195 (19.6%) | 799 (80.4%) |
| Arts, Entertainment & Recreation | 34 (28.1%) | 87 (71.9%) |
| Accommodation & Food Services | 564 (56.6%) | 433 (43.4%) |
| Public Administration | 49 (35.0%) | 91 (65.0%) |
| Total | 4,395 (54.6%) | 3,658 (45.4%) |
Education in Siloam Springs
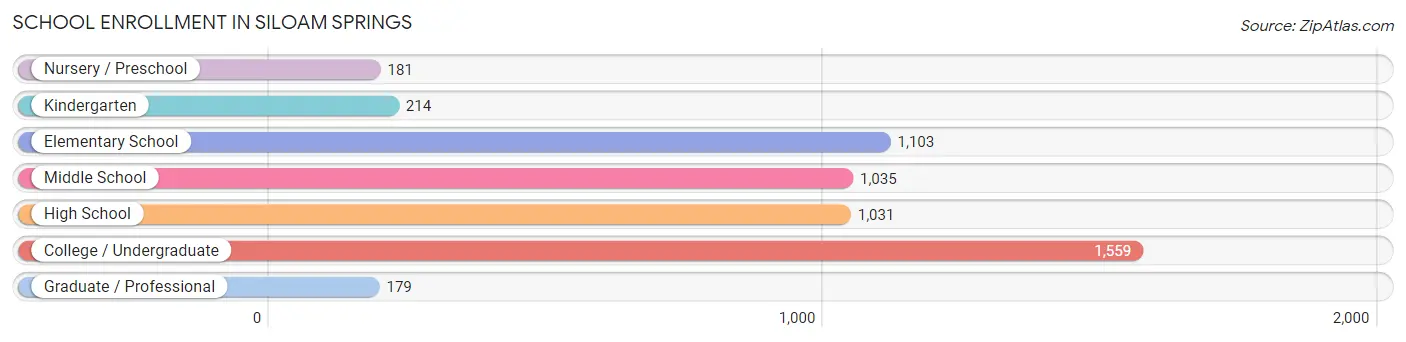
School Enrollment in Siloam Springs
The most common levels of schooling among the 5,302 students in Siloam Springs are college / undergraduate (1,559 | 29.4%), elementary school (1,103 | 20.8%), and middle school (1,035 | 19.5%).
| School Level | # Students | % Students |
| Nursery / Preschool | 181 | 3.4% |
| Kindergarten | 214 | 4.0% |
| Elementary School | 1,103 | 20.8% |
| Middle School | 1,035 | 19.5% |
| High School | 1,031 | 19.5% |
| College / Undergraduate | 1,559 | 29.4% |
| Graduate / Professional | 179 | 3.4% |
| Total | 5,302 | 100.0% |
School Enrollment by Age by Funding Source in Siloam Springs
Out of a total of 5,302 students who are enrolled in schools in Siloam Springs, 1,331 (25.1%) attend a private institution, while the remaining 3,971 (74.9%) are enrolled in public schools. The age group of 20 to 24 year olds has the highest likelihood of being enrolled in private schools, with 549 (66.5% in the age bracket) enrolled. Conversely, the age group of 15 to 17 year olds has the lowest likelihood of being enrolled in a private school, with 819 (97.2% in the age bracket) attending a public institution.
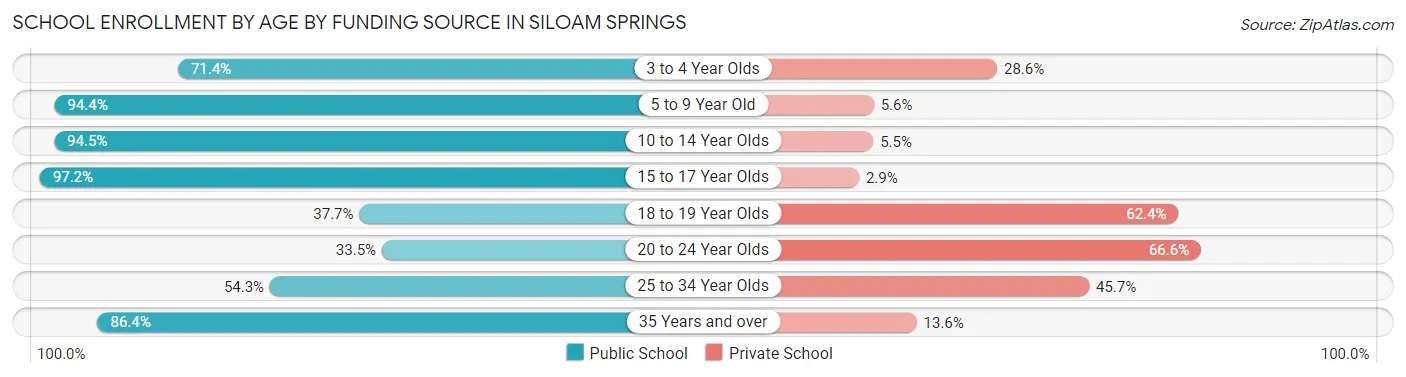
| Age Bracket | Public School | Private School |
| 3 to 4 Year Olds | 105 (71.4%) | 42 (28.6%) |
| 5 to 9 Year Old | 1,165 (94.4%) | 69 (5.6%) |
| 10 to 14 Year Olds | 1,115 (94.5%) | 65 (5.5%) |
| 15 to 17 Year Olds | 819 (97.2%) | 24 (2.9%) |
| 18 to 19 Year Olds | 282 (37.7%) | 467 (62.4%) |
| 20 to 24 Year Olds | 276 (33.5%) | 549 (66.5%) |
| 25 to 34 Year Olds | 120 (54.3%) | 101 (45.7%) |
| 35 Years and over | 89 (86.4%) | 14 (13.6%) |
| Total | 3,971 (74.9%) | 1,331 (25.1%) |
Educational Attainment by Field of Study in Siloam Springs
Education (549 | 19.7%), business (535 | 19.2%), science & technology (267 | 9.6%), physical & health sciences (242 | 8.7%), and liberal arts & history (204 | 7.3%) are the most common fields of study among 2,793 individuals in Siloam Springs who have obtained a bachelor's degree or higher.
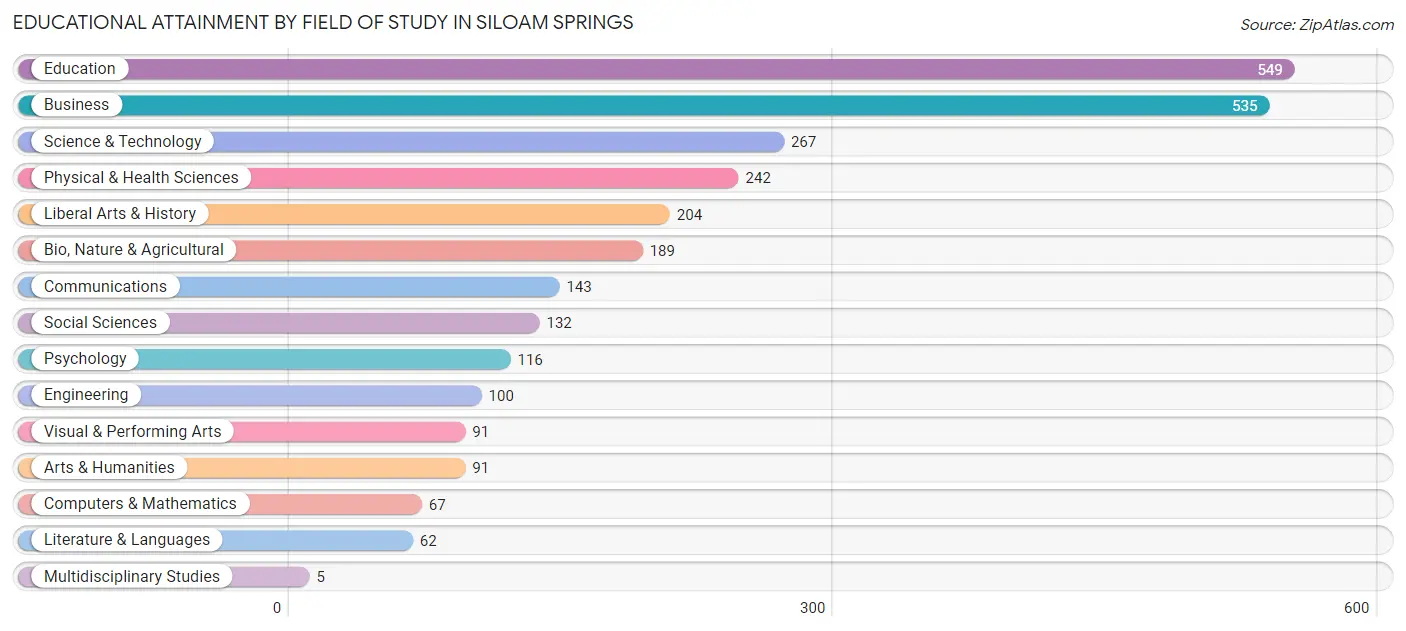
| Field of Study | # Graduates | % Graduates |
| Computers & Mathematics | 67 | 2.4% |
| Bio, Nature & Agricultural | 189 | 6.8% |
| Physical & Health Sciences | 242 | 8.7% |
| Psychology | 116 | 4.2% |
| Social Sciences | 132 | 4.7% |
| Engineering | 100 | 3.6% |
| Multidisciplinary Studies | 5 | 0.2% |
| Science & Technology | 267 | 9.6% |
| Business | 535 | 19.2% |
| Education | 549 | 19.7% |
| Literature & Languages | 62 | 2.2% |
| Liberal Arts & History | 204 | 7.3% |
| Visual & Performing Arts | 91 | 3.3% |
| Communications | 143 | 5.1% |
| Arts & Humanities | 91 | 3.3% |
| Total | 2,793 | 100.0% |
Transportation & Commute in Siloam Springs
Vehicle Availability by Sex in Siloam Springs
The most prevalent vehicle ownership categories in Siloam Springs are males with 2 vehicles (1,751, accounting for 41.4%) and females with 2 vehicles (1,498, making up 50.6%).
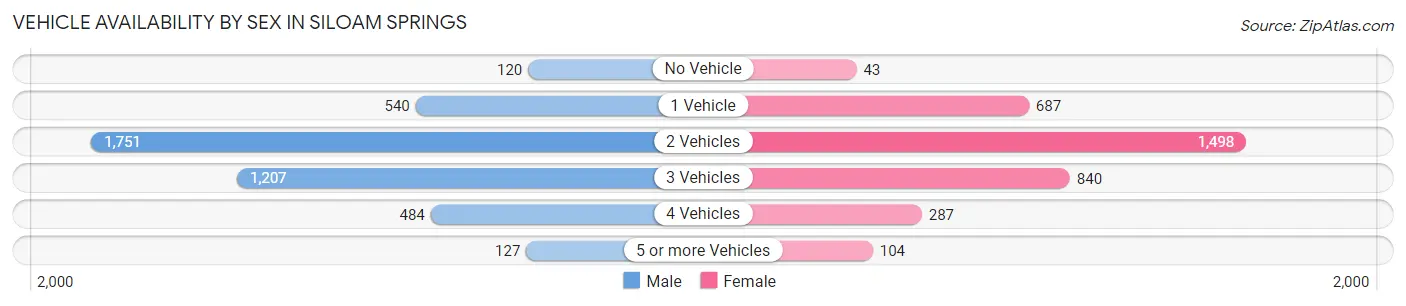
| Vehicles Available | Male | Female |
| No Vehicle | 120 (2.8%) | 43 (1.2%) |
| 1 Vehicle | 540 (12.8%) | 687 (19.9%) |
| 2 Vehicles | 1,751 (41.4%) | 1,498 (43.3%) |
| 3 Vehicles | 1,207 (28.5%) | 840 (24.3%) |
| 4 Vehicles | 484 (11.4%) | 287 (8.3%) |
| 5 or more Vehicles | 127 (3.0%) | 104 (3.0%) |
| Total | 4,229 (100.0%) | 3,459 (100.0%) |
Commute Time in Siloam Springs
The most frequently occuring commute durations in Siloam Springs are 5 to 9 minutes (1,747 commuters, 23.5%), 10 to 14 minutes (1,482 commuters, 20.0%), and 15 to 19 minutes (781 commuters, 10.5%).
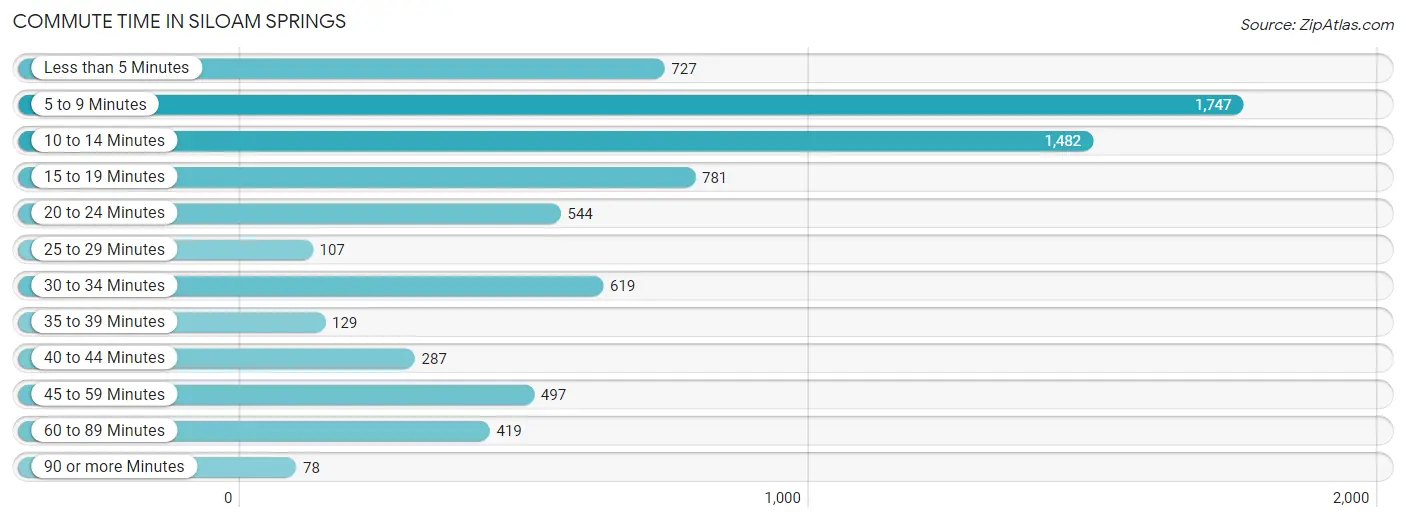
| Commute Time | # Commuters | % Commuters |
| Less than 5 Minutes | 727 | 9.8% |
| 5 to 9 Minutes | 1,747 | 23.5% |
| 10 to 14 Minutes | 1,482 | 20.0% |
| 15 to 19 Minutes | 781 | 10.5% |
| 20 to 24 Minutes | 544 | 7.3% |
| 25 to 29 Minutes | 107 | 1.4% |
| 30 to 34 Minutes | 619 | 8.4% |
| 35 to 39 Minutes | 129 | 1.7% |
| 40 to 44 Minutes | 287 | 3.9% |
| 45 to 59 Minutes | 497 | 6.7% |
| 60 to 89 Minutes | 419 | 5.7% |
| 90 or more Minutes | 78 | 1.1% |
Commute Time by Sex in Siloam Springs
The most common commute times in Siloam Springs are 5 to 9 minutes (852 commuters, 21.1%) for males and 5 to 9 minutes (895 commuters, 26.4%) for females.
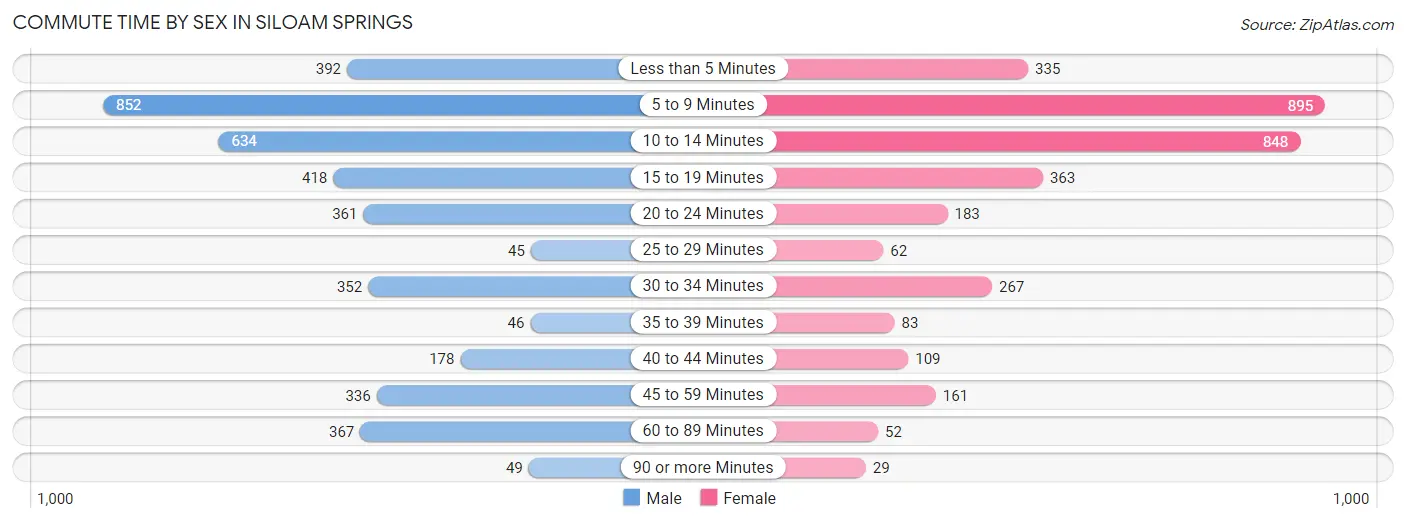
| Commute Time | Male | Female |
| Less than 5 Minutes | 392 (9.7%) | 335 (9.9%) |
| 5 to 9 Minutes | 852 (21.1%) | 895 (26.4%) |
| 10 to 14 Minutes | 634 (15.7%) | 848 (25.0%) |
| 15 to 19 Minutes | 418 (10.4%) | 363 (10.7%) |
| 20 to 24 Minutes | 361 (9.0%) | 183 (5.4%) |
| 25 to 29 Minutes | 45 (1.1%) | 62 (1.8%) |
| 30 to 34 Minutes | 352 (8.7%) | 267 (7.9%) |
| 35 to 39 Minutes | 46 (1.1%) | 83 (2.5%) |
| 40 to 44 Minutes | 178 (4.4%) | 109 (3.2%) |
| 45 to 59 Minutes | 336 (8.3%) | 161 (4.8%) |
| 60 to 89 Minutes | 367 (9.1%) | 52 (1.5%) |
| 90 or more Minutes | 49 (1.2%) | 29 (0.9%) |
Time of Departure to Work by Sex in Siloam Springs
The most frequent times of departure to work in Siloam Springs are 7:00 AM to 7:29 AM (688, 17.1%) for males and 7:00 AM to 7:29 AM (735, 21.7%) for females.
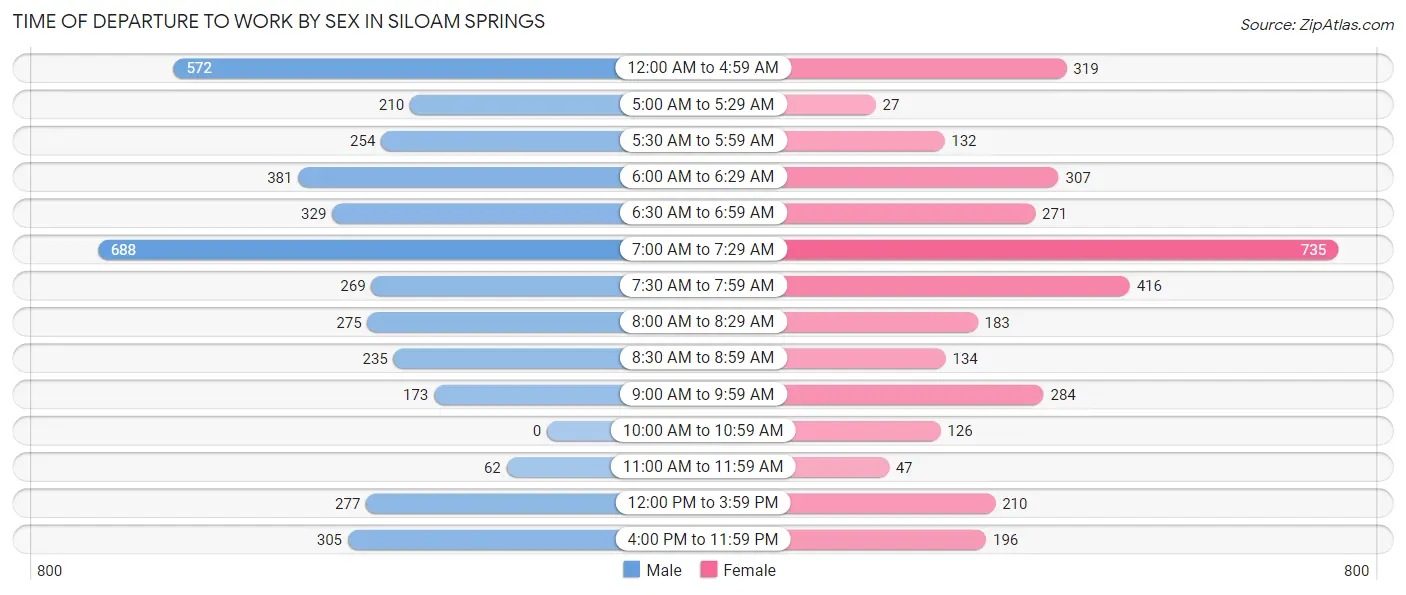
| Time of Departure | Male | Female |
| 12:00 AM to 4:59 AM | 572 (14.2%) | 319 (9.4%) |
| 5:00 AM to 5:29 AM | 210 (5.2%) | 27 (0.8%) |
| 5:30 AM to 5:59 AM | 254 (6.3%) | 132 (3.9%) |
| 6:00 AM to 6:29 AM | 381 (9.5%) | 307 (9.1%) |
| 6:30 AM to 6:59 AM | 329 (8.2%) | 271 (8.0%) |
| 7:00 AM to 7:29 AM | 688 (17.1%) | 735 (21.7%) |
| 7:30 AM to 7:59 AM | 269 (6.7%) | 416 (12.3%) |
| 8:00 AM to 8:29 AM | 275 (6.8%) | 183 (5.4%) |
| 8:30 AM to 8:59 AM | 235 (5.8%) | 134 (4.0%) |
| 9:00 AM to 9:59 AM | 173 (4.3%) | 284 (8.4%) |
| 10:00 AM to 10:59 AM | 0 (0.0%) | 126 (3.7%) |
| 11:00 AM to 11:59 AM | 62 (1.5%) | 47 (1.4%) |
| 12:00 PM to 3:59 PM | 277 (6.9%) | 210 (6.2%) |
| 4:00 PM to 11:59 PM | 305 (7.6%) | 196 (5.8%) |
| Total | 4,030 (100.0%) | 3,387 (100.0%) |
Housing Occupancy in Siloam Springs
Occupancy by Ownership in Siloam Springs
Of the total 5,963 dwellings in Siloam Springs, owner-occupied units account for 3,464 (58.1%), while renter-occupied units make up 2,499 (41.9%).
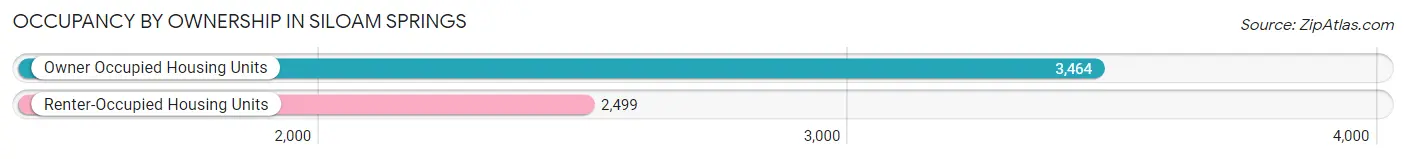
| Occupancy | # Housing Units | % Housing Units |
| Owner Occupied Housing Units | 3,464 | 58.1% |
| Renter-Occupied Housing Units | 2,499 | 41.9% |
| Total Occupied Housing Units | 5,963 | 100.0% |
Occupancy by Household Size in Siloam Springs
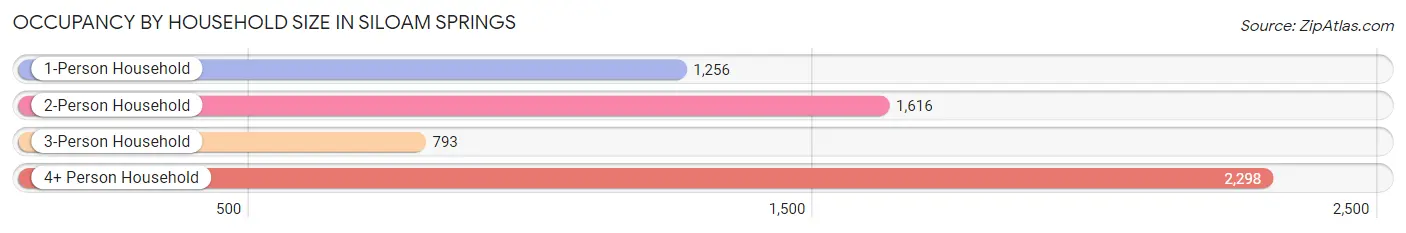
| Household Size | # Housing Units | % Housing Units |
| 1-Person Household | 1,256 | 21.1% |
| 2-Person Household | 1,616 | 27.1% |
| 3-Person Household | 793 | 13.3% |
| 4+ Person Household | 2,298 | 38.5% |
| Total Housing Units | 5,963 | 100.0% |
Occupancy by Ownership by Household Size in Siloam Springs
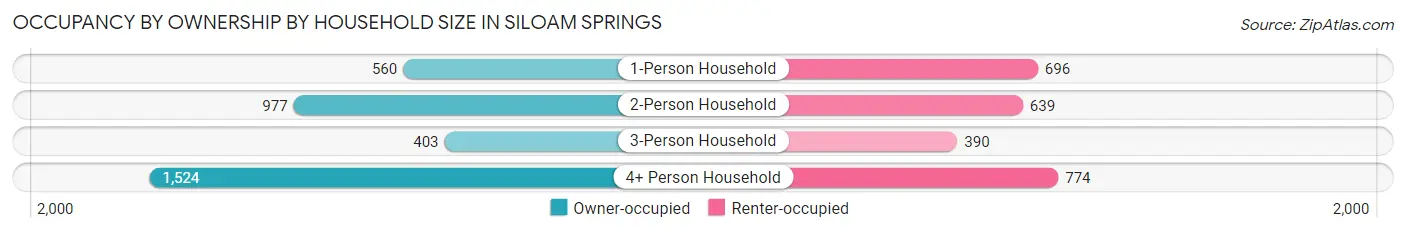
| Household Size | Owner-occupied | Renter-occupied |
| 1-Person Household | 560 (44.6%) | 696 (55.4%) |
| 2-Person Household | 977 (60.5%) | 639 (39.5%) |
| 3-Person Household | 403 (50.8%) | 390 (49.2%) |
| 4+ Person Household | 1,524 (66.3%) | 774 (33.7%) |
| Total Housing Units | 3,464 (58.1%) | 2,499 (41.9%) |
Occupancy by Educational Attainment in Siloam Springs
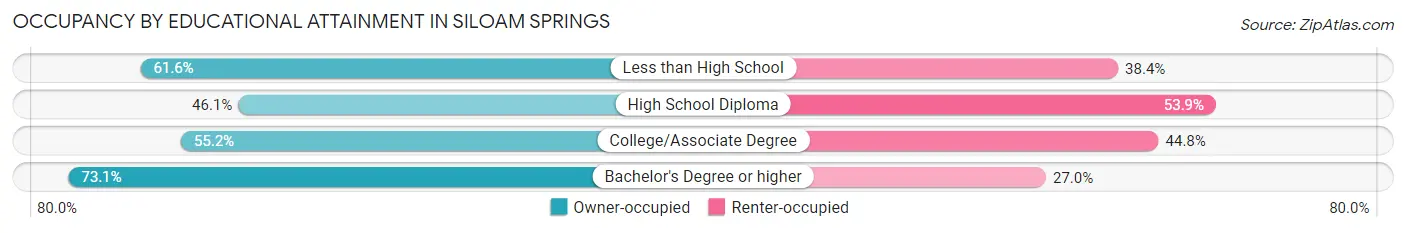
| Household Size | Owner-occupied | Renter-occupied |
| Less than High School | 557 (61.6%) | 347 (38.4%) |
| High School Diploma | 793 (46.1%) | 926 (53.9%) |
| College/Associate Degree | 1,008 (55.2%) | 818 (44.8%) |
| Bachelor's Degree or higher | 1,106 (73.1%) | 408 (27.0%) |
Occupancy by Age of Householder in Siloam Springs
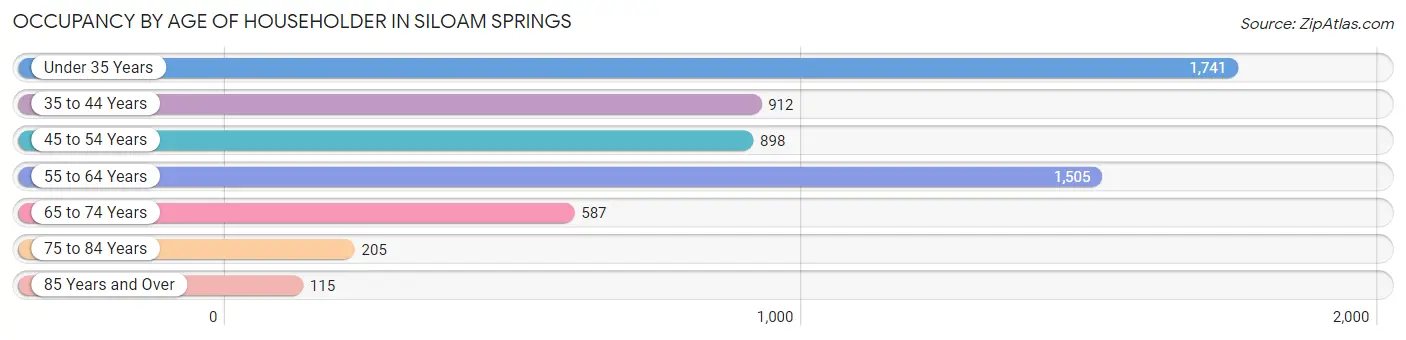
| Age Bracket | # Households | % Households |
| Under 35 Years | 1,741 | 29.2% |
| 35 to 44 Years | 912 | 15.3% |
| 45 to 54 Years | 898 | 15.1% |
| 55 to 64 Years | 1,505 | 25.2% |
| 65 to 74 Years | 587 | 9.8% |
| 75 to 84 Years | 205 | 3.4% |
| 85 Years and Over | 115 | 1.9% |
| Total | 5,963 | 100.0% |
Housing Finances in Siloam Springs
Median Income by Occupancy in Siloam Springs
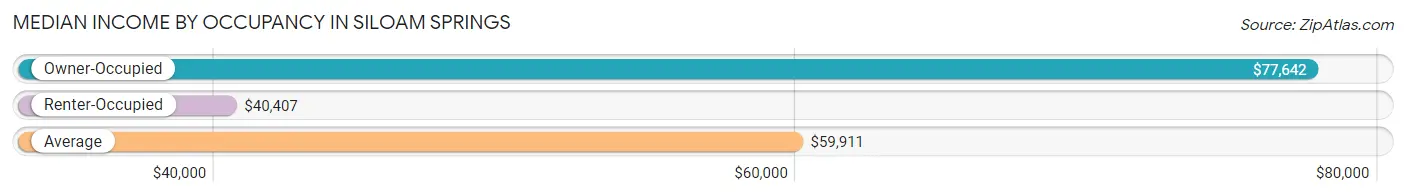
| Occupancy Type | # Households | Median Income |
| Owner-Occupied | 3,464 (58.1%) | $77,642 |
| Renter-Occupied | 2,499 (41.9%) | $40,407 |
| Average | 5,963 (100.0%) | $59,911 |
Occupancy by Householder Income Bracket in Siloam Springs
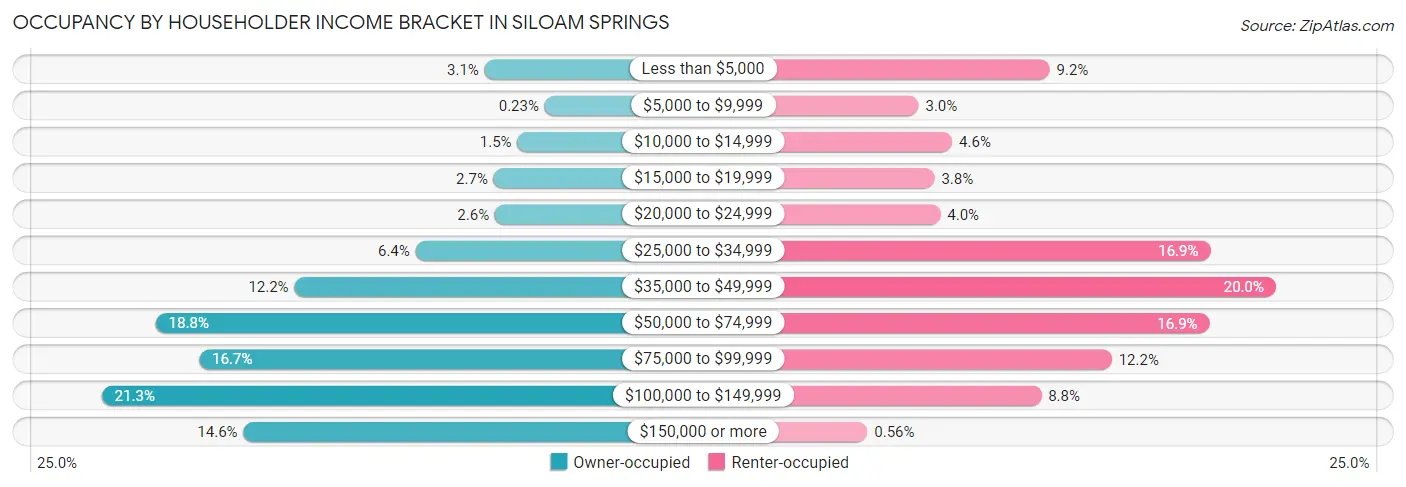
| Income Bracket | Owner-occupied | Renter-occupied |
| Less than $5,000 | 107 (3.1%) | 231 (9.2%) |
| $5,000 to $9,999 | 8 (0.2%) | 75 (3.0%) |
| $10,000 to $14,999 | 53 (1.5%) | 115 (4.6%) |
| $15,000 to $19,999 | 92 (2.7%) | 94 (3.8%) |
| $20,000 to $24,999 | 90 (2.6%) | 101 (4.0%) |
| $25,000 to $34,999 | 221 (6.4%) | 422 (16.9%) |
| $35,000 to $49,999 | 421 (12.1%) | 500 (20.0%) |
| $50,000 to $74,999 | 650 (18.8%) | 421 (16.9%) |
| $75,000 to $99,999 | 578 (16.7%) | 305 (12.2%) |
| $100,000 to $149,999 | 739 (21.3%) | 221 (8.8%) |
| $150,000 or more | 505 (14.6%) | 14 (0.6%) |
| Total | 3,464 (100.0%) | 2,499 (100.0%) |
Monthly Housing Cost Tiers in Siloam Springs
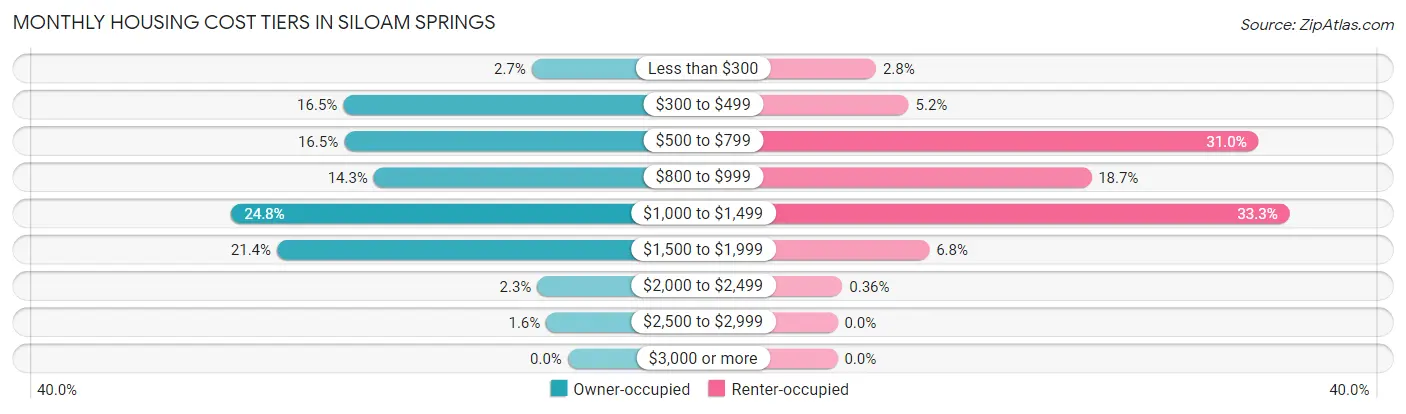
| Monthly Cost | Owner-occupied | Renter-occupied |
| Less than $300 | 92 (2.7%) | 71 (2.8%) |
| $300 to $499 | 573 (16.5%) | 131 (5.2%) |
| $500 to $799 | 571 (16.5%) | 775 (31.0%) |
| $800 to $999 | 495 (14.3%) | 467 (18.7%) |
| $1,000 to $1,499 | 858 (24.8%) | 832 (33.3%) |
| $1,500 to $1,999 | 742 (21.4%) | 169 (6.8%) |
| $2,000 to $2,499 | 78 (2.2%) | 9 (0.4%) |
| $2,500 to $2,999 | 55 (1.6%) | 0 (0.0%) |
| $3,000 or more | 0 (0.0%) | 0 (0.0%) |
| Total | 3,464 (100.0%) | 2,499 (100.0%) |
Physical Housing Characteristics in Siloam Springs
Housing Structures in Siloam Springs
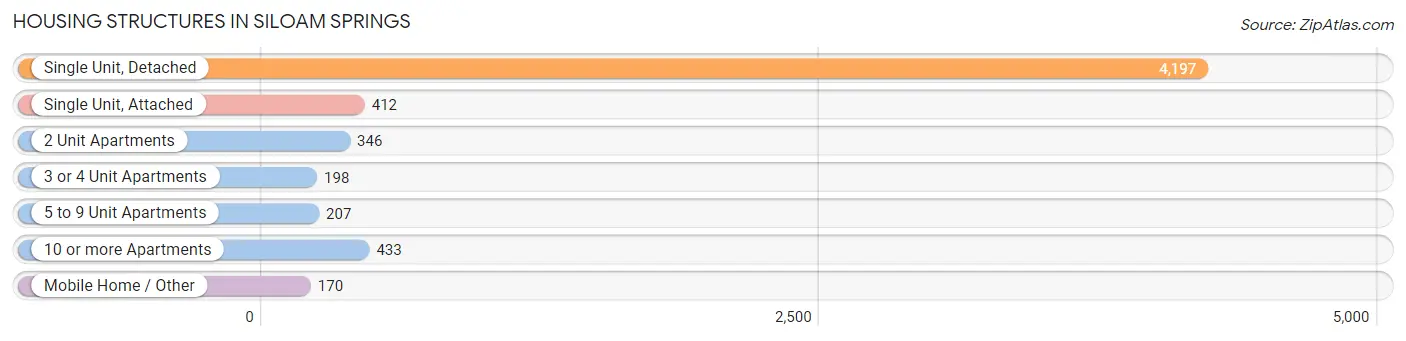
| Structure Type | # Housing Units | % Housing Units |
| Single Unit, Detached | 4,197 | 70.4% |
| Single Unit, Attached | 412 | 6.9% |
| 2 Unit Apartments | 346 | 5.8% |
| 3 or 4 Unit Apartments | 198 | 3.3% |
| 5 to 9 Unit Apartments | 207 | 3.5% |
| 10 or more Apartments | 433 | 7.3% |
| Mobile Home / Other | 170 | 2.9% |
| Total | 5,963 | 100.0% |
Housing Structures by Occupancy in Siloam Springs
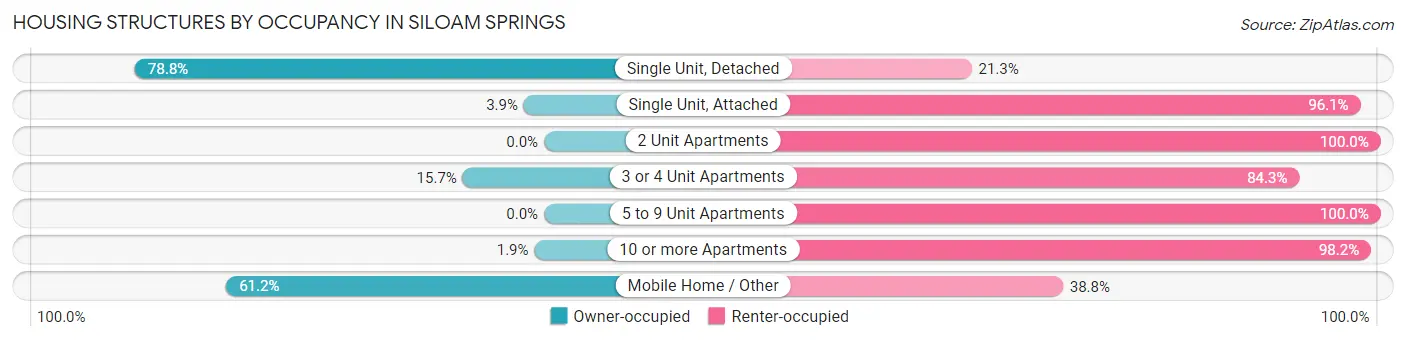
| Structure Type | Owner-occupied | Renter-occupied |
| Single Unit, Detached | 3,305 (78.7%) | 892 (21.2%) |
| Single Unit, Attached | 16 (3.9%) | 396 (96.1%) |
| 2 Unit Apartments | 0 (0.0%) | 346 (100.0%) |
| 3 or 4 Unit Apartments | 31 (15.7%) | 167 (84.3%) |
| 5 to 9 Unit Apartments | 0 (0.0%) | 207 (100.0%) |
| 10 or more Apartments | 8 (1.8%) | 425 (98.2%) |
| Mobile Home / Other | 104 (61.2%) | 66 (38.8%) |
| Total | 3,464 (58.1%) | 2,499 (41.9%) |
Housing Structures by Number of Rooms in Siloam Springs
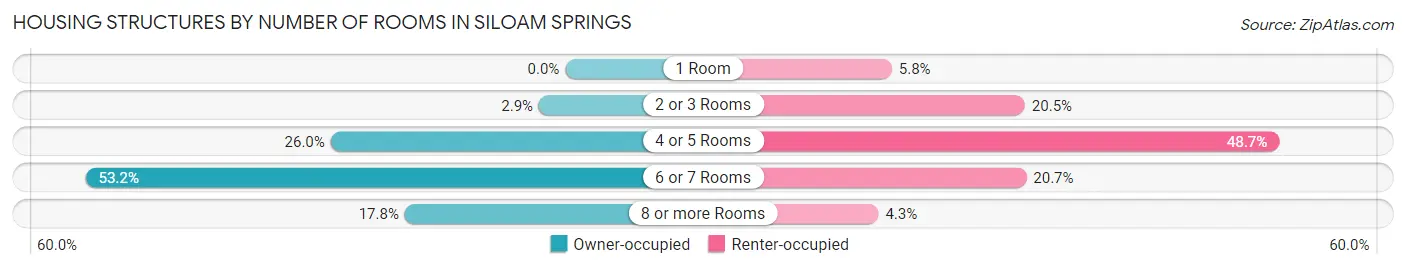
| Number of Rooms | Owner-occupied | Renter-occupied |
| 1 Room | 0 (0.0%) | 144 (5.8%) |
| 2 or 3 Rooms | 101 (2.9%) | 513 (20.5%) |
| 4 or 5 Rooms | 902 (26.0%) | 1,218 (48.7%) |
| 6 or 7 Rooms | 1,844 (53.2%) | 517 (20.7%) |
| 8 or more Rooms | 617 (17.8%) | 107 (4.3%) |
| Total | 3,464 (100.0%) | 2,499 (100.0%) |
Housing Structure by Heating Type in Siloam Springs
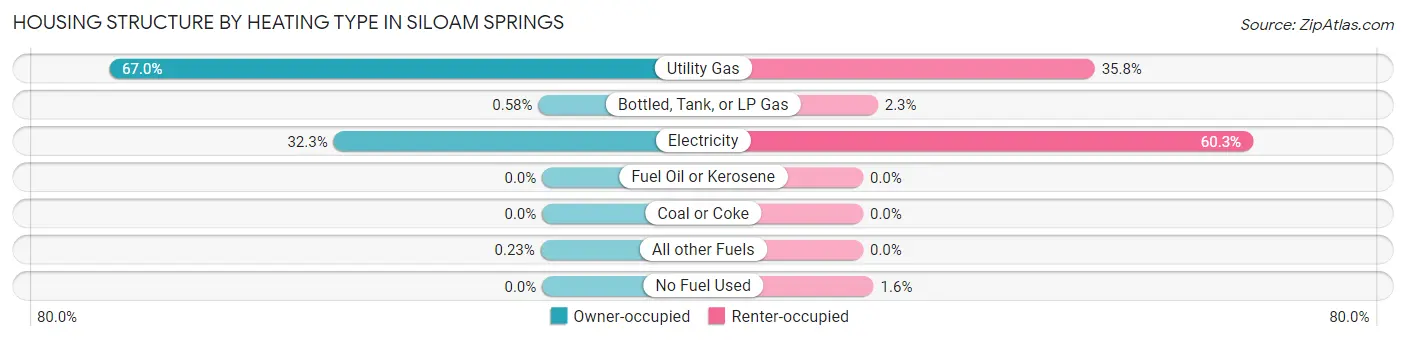
| Heating Type | Owner-occupied | Renter-occupied |
| Utility Gas | 2,319 (66.9%) | 895 (35.8%) |
| Bottled, Tank, or LP Gas | 20 (0.6%) | 57 (2.3%) |
| Electricity | 1,117 (32.3%) | 1,506 (60.3%) |
| Fuel Oil or Kerosene | 0 (0.0%) | 0 (0.0%) |
| Coal or Coke | 0 (0.0%) | 0 (0.0%) |
| All other Fuels | 8 (0.2%) | 0 (0.0%) |
| No Fuel Used | 0 (0.0%) | 41 (1.6%) |
| Total | 3,464 (100.0%) | 2,499 (100.0%) |
Household Vehicle Usage in Siloam Springs
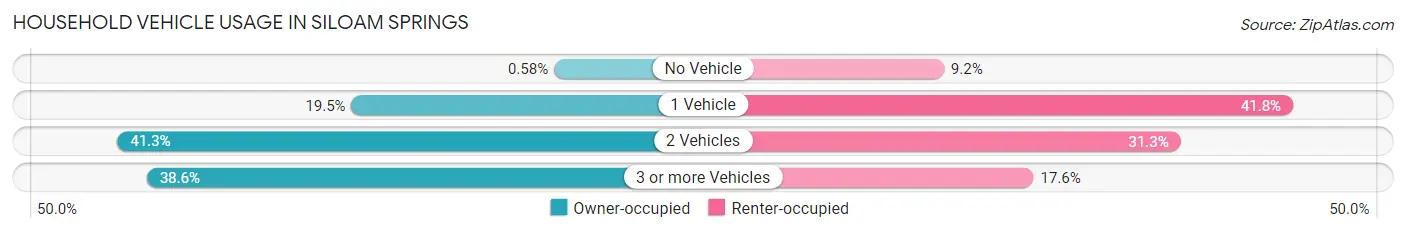
| Vehicles per Household | Owner-occupied | Renter-occupied |
| No Vehicle | 20 (0.6%) | 231 (9.2%) |
| 1 Vehicle | 675 (19.5%) | 1,045 (41.8%) |
| 2 Vehicles | 1,432 (41.3%) | 783 (31.3%) |
| 3 or more Vehicles | 1,337 (38.6%) | 440 (17.6%) |
| Total | 3,464 (100.0%) | 2,499 (100.0%) |
Real Estate & Mortgages in Siloam Springs
Real Estate and Mortgage Overview in Siloam Springs
| Characteristic | Without Mortgage | With Mortgage |
| Housing Units | 1,125 | 2,339 |
| Median Property Value | $181,700 | $193,400 |
| Median Household Income | $49,018 | $347 |
| Monthly Housing Costs | $464 | $0 |
| Real Estate Taxes | $988 | $70 |
Property Value by Mortgage Status in Siloam Springs
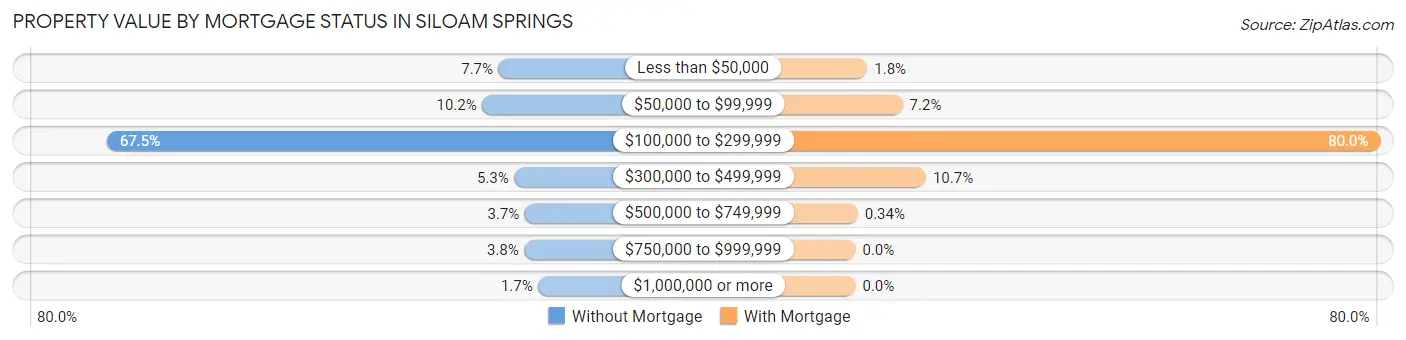
| Property Value | Without Mortgage | With Mortgage |
| Less than $50,000 | 87 (7.7%) | 42 (1.8%) |
| $50,000 to $99,999 | 115 (10.2%) | 168 (7.2%) |
| $100,000 to $299,999 | 759 (67.5%) | 1,870 (79.9%) |
| $300,000 to $499,999 | 60 (5.3%) | 251 (10.7%) |
| $500,000 to $749,999 | 42 (3.7%) | 8 (0.3%) |
| $750,000 to $999,999 | 43 (3.8%) | 0 (0.0%) |
| $1,000,000 or more | 19 (1.7%) | 0 (0.0%) |
| Total | 1,125 (100.0%) | 2,339 (100.0%) |
Household Income by Mortgage Status in Siloam Springs
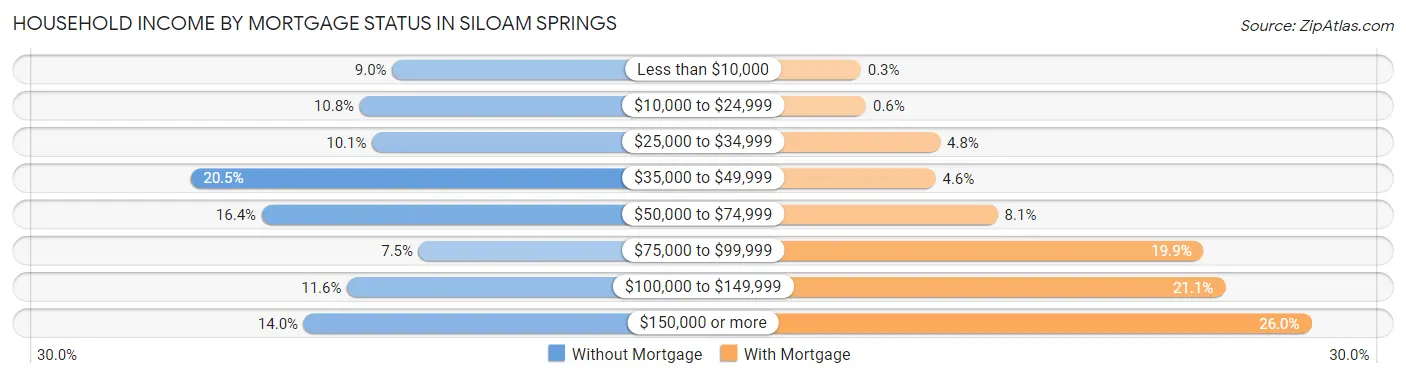
| Household Income | Without Mortgage | With Mortgage |
| Less than $10,000 | 101 (9.0%) | 7 (0.3%) |
| $10,000 to $24,999 | 122 (10.8%) | 14 (0.6%) |
| $25,000 to $34,999 | 114 (10.1%) | 113 (4.8%) |
| $35,000 to $49,999 | 231 (20.5%) | 107 (4.6%) |
| $50,000 to $74,999 | 185 (16.4%) | 190 (8.1%) |
| $75,000 to $99,999 | 84 (7.5%) | 465 (19.9%) |
| $100,000 to $149,999 | 130 (11.6%) | 494 (21.1%) |
| $150,000 or more | 158 (14.0%) | 609 (26.0%) |
| Total | 1,125 (100.0%) | 2,339 (100.0%) |
Property Value to Household Income Ratio in Siloam Springs
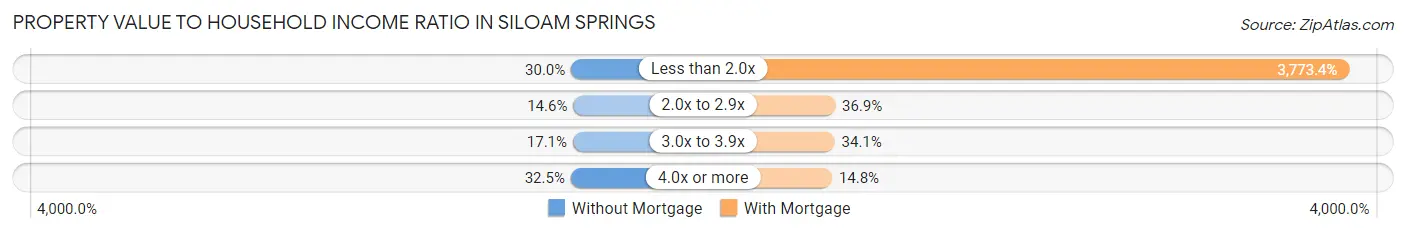
| Value-to-Income Ratio | Without Mortgage | With Mortgage |
| Less than 2.0x | 338 (30.0%) | 88,259 (3,773.4%) |
| 2.0x to 2.9x | 164 (14.6%) | 864 (36.9%) |
| 3.0x to 3.9x | 192 (17.1%) | 798 (34.1%) |
| 4.0x or more | 366 (32.5%) | 345 (14.7%) |
| Total | 1,125 (100.0%) | 2,339 (100.0%) |
Real Estate Taxes by Mortgage Status in Siloam Springs
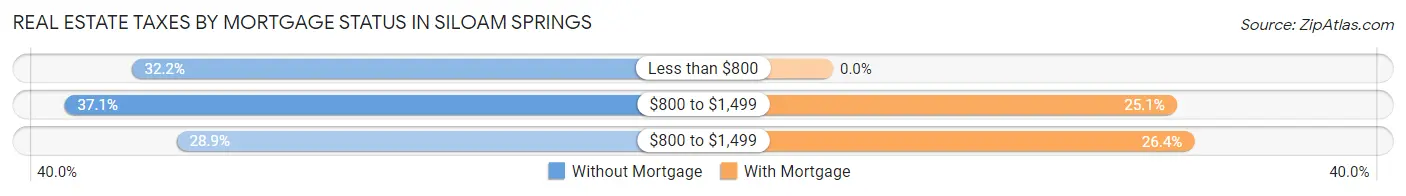
| Property Taxes | Without Mortgage | With Mortgage |
| Less than $800 | 362 (32.2%) | 0 (0.0%) |
| $800 to $1,499 | 417 (37.1%) | 587 (25.1%) |
| $800 to $1,499 | 325 (28.9%) | 617 (26.4%) |
| Total | 1,125 (100.0%) | 2,339 (100.0%) |
Health & Disability in Siloam Springs
Health Insurance Coverage by Age in Siloam Springs
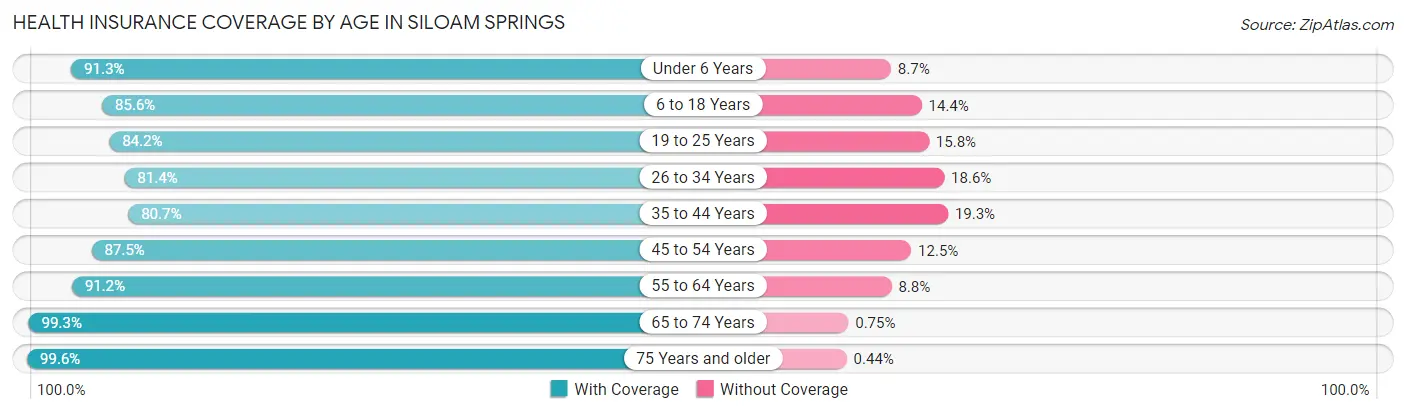
| Age Bracket | With Coverage | Without Coverage |
| Under 6 Years | 1,650 (91.3%) | 157 (8.7%) |
| 6 to 18 Years | 3,081 (85.6%) | 519 (14.4%) |
| 19 to 25 Years | 1,975 (84.2%) | 370 (15.8%) |
| 26 to 34 Years | 2,015 (81.4%) | 461 (18.6%) |
| 35 to 44 Years | 1,327 (80.7%) | 318 (19.3%) |
| 45 to 54 Years | 1,299 (87.5%) | 185 (12.5%) |
| 55 to 64 Years | 2,341 (91.2%) | 226 (8.8%) |
| 65 to 74 Years | 924 (99.3%) | 7 (0.7%) |
| 75 Years and older | 672 (99.6%) | 3 (0.4%) |
| Total | 15,284 (87.2%) | 2,246 (12.8%) |
Health Insurance Coverage by Citizenship Status in Siloam Springs
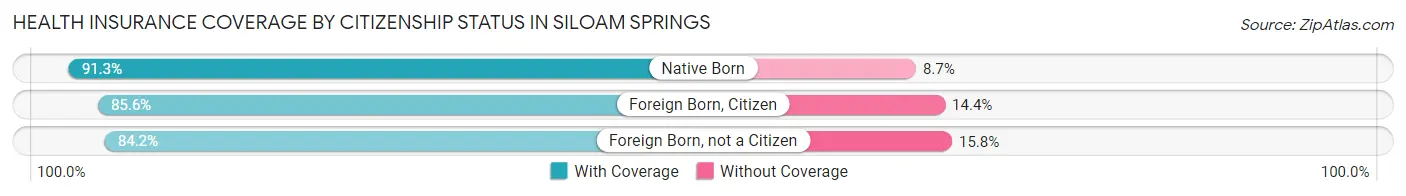
| Citizenship Status | With Coverage | Without Coverage |
| Native Born | 1,650 (91.3%) | 157 (8.7%) |
| Foreign Born, Citizen | 3,081 (85.6%) | 519 (14.4%) |
| Foreign Born, not a Citizen | 1,975 (84.2%) | 370 (15.8%) |
Health Insurance Coverage by Household Income in Siloam Springs
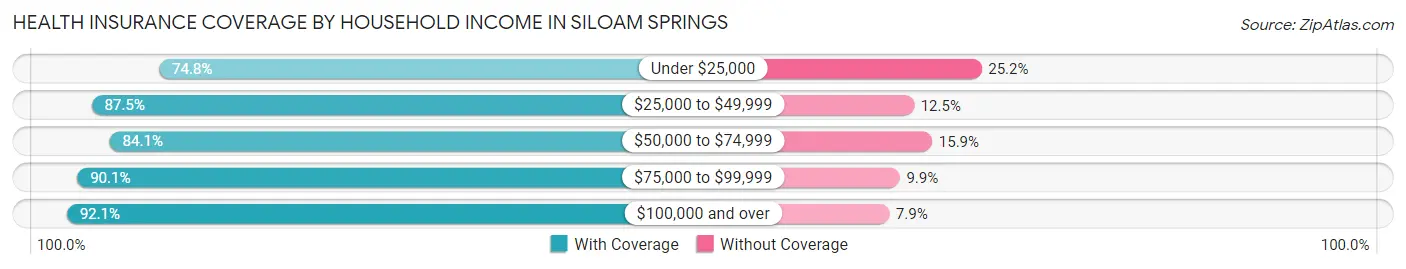
| Household Income | With Coverage | Without Coverage |
| Under $25,000 | 1,600 (74.8%) | 539 (25.2%) |
| $25,000 to $49,999 | 3,097 (87.5%) | 444 (12.5%) |
| $50,000 to $74,999 | 2,921 (84.1%) | 554 (15.9%) |
| $75,000 to $99,999 | 2,675 (90.1%) | 293 (9.9%) |
| $100,000 and over | 4,075 (92.1%) | 349 (7.9%) |
Public vs Private Health Insurance Coverage by Age in Siloam Springs
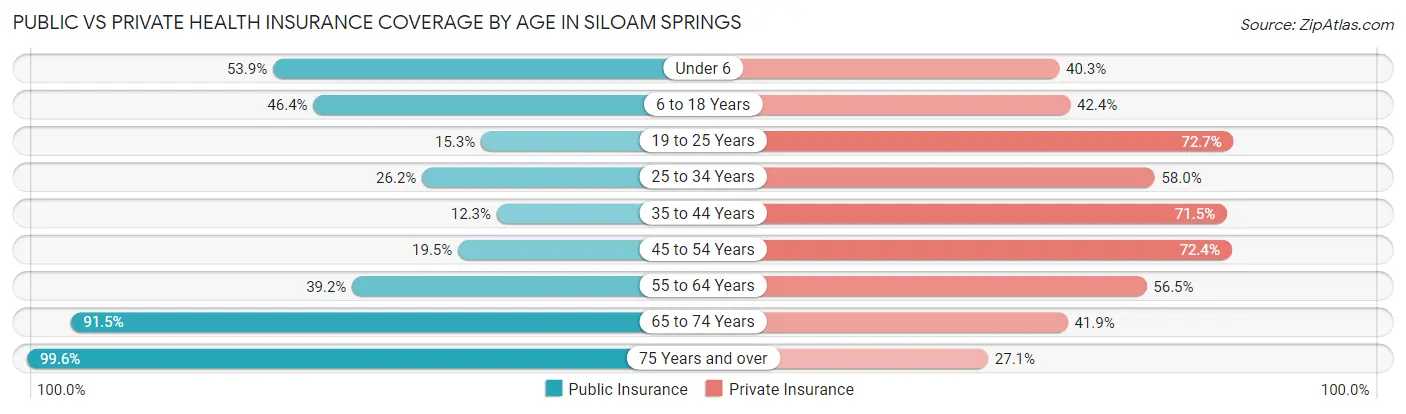
| Age Bracket | Public Insurance | Private Insurance |
| Under 6 | 974 (53.9%) | 729 (40.3%) |
| 6 to 18 Years | 1,670 (46.4%) | 1,525 (42.4%) |
| 19 to 25 Years | 358 (15.3%) | 1,705 (72.7%) |
| 25 to 34 Years | 649 (26.2%) | 1,437 (58.0%) |
| 35 to 44 Years | 203 (12.3%) | 1,176 (71.5%) |
| 45 to 54 Years | 290 (19.5%) | 1,074 (72.4%) |
| 55 to 64 Years | 1,006 (39.2%) | 1,451 (56.5%) |
| 65 to 74 Years | 852 (91.5%) | 390 (41.9%) |
| 75 Years and over | 672 (99.6%) | 183 (27.1%) |
| Total | 6,674 (38.1%) | 9,670 (55.2%) |
Disability Status by Sex by Age in Siloam Springs
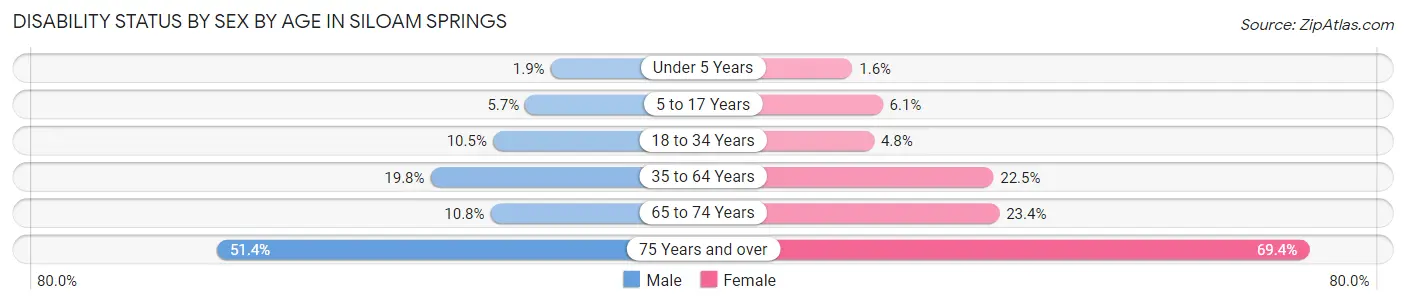
| Age Bracket | Male | Female |
| Under 5 Years | 12 (1.9%) | 15 (1.6%) |
| 5 to 17 Years | 97 (5.7%) | 106 (6.1%) |
| 18 to 34 Years | 262 (10.5%) | 129 (4.8%) |
| 35 to 64 Years | 543 (19.8%) | 663 (22.5%) |
| 65 to 74 Years | 49 (10.8%) | 112 (23.4%) |
| 75 Years and over | 144 (51.4%) | 274 (69.4%) |
Disability Class by Sex by Age in Siloam Springs
Disability Class: Hearing Difficulty
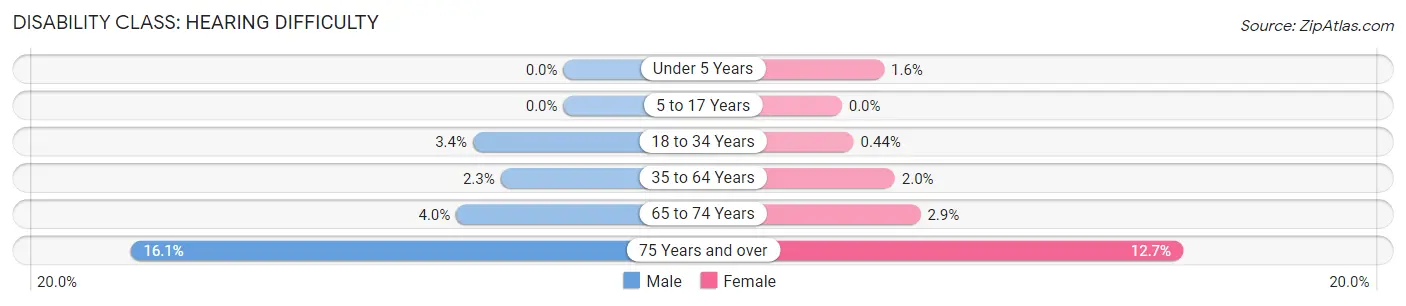
| Age Bracket | Male | Female |
| Under 5 Years | 0 (0.0%) | 15 (1.6%) |
| 5 to 17 Years | 0 (0.0%) | 0 (0.0%) |
| 18 to 34 Years | 84 (3.4%) | 12 (0.4%) |
| 35 to 64 Years | 64 (2.3%) | 58 (2.0%) |
| 65 to 74 Years | 18 (4.0%) | 14 (2.9%) |
| 75 Years and over | 45 (16.1%) | 50 (12.7%) |
Disability Class: Vision Difficulty
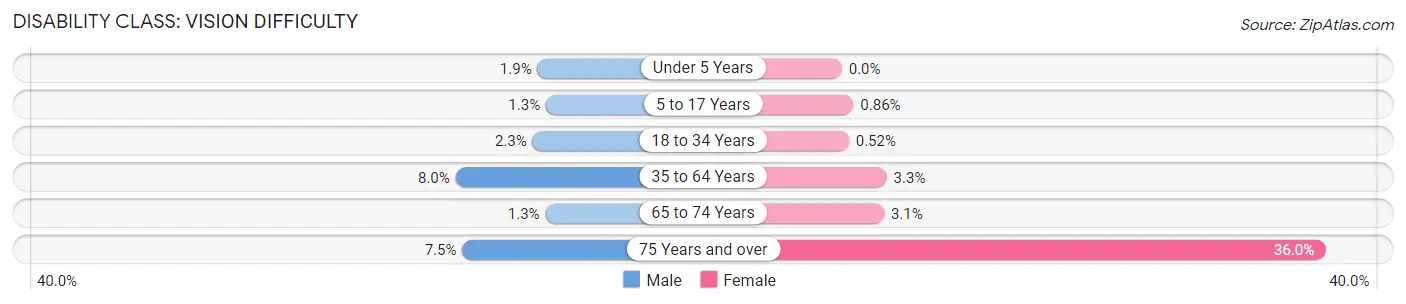
| Age Bracket | Male | Female |
| Under 5 Years | 12 (1.9%) | 0 (0.0%) |
| 5 to 17 Years | 22 (1.3%) | 15 (0.9%) |
| 18 to 34 Years | 57 (2.3%) | 14 (0.5%) |
| 35 to 64 Years | 220 (8.0%) | 98 (3.3%) |
| 65 to 74 Years | 6 (1.3%) | 15 (3.1%) |
| 75 Years and over | 21 (7.5%) | 142 (35.9%) |
Disability Class: Cognitive Difficulty
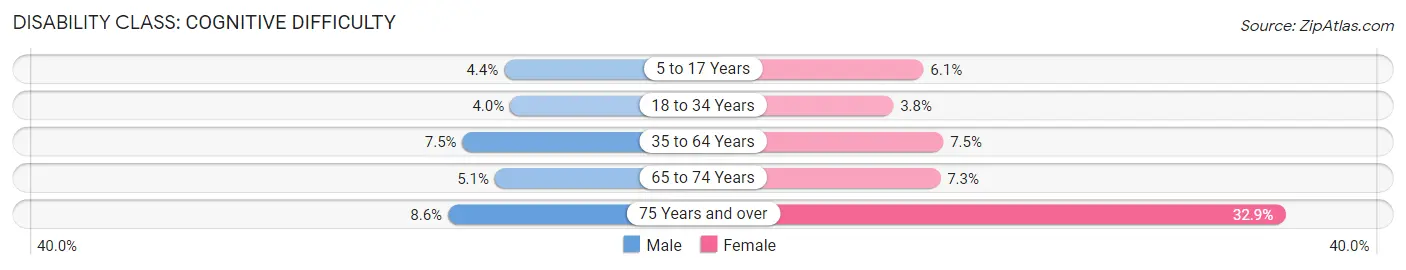
| Age Bracket | Male | Female |
| 5 to 17 Years | 75 (4.4%) | 106 (6.1%) |
| 18 to 34 Years | 99 (4.0%) | 103 (3.8%) |
| 35 to 64 Years | 206 (7.5%) | 222 (7.5%) |
| 65 to 74 Years | 23 (5.1%) | 35 (7.3%) |
| 75 Years and over | 24 (8.6%) | 130 (32.9%) |
Disability Class: Ambulatory Difficulty
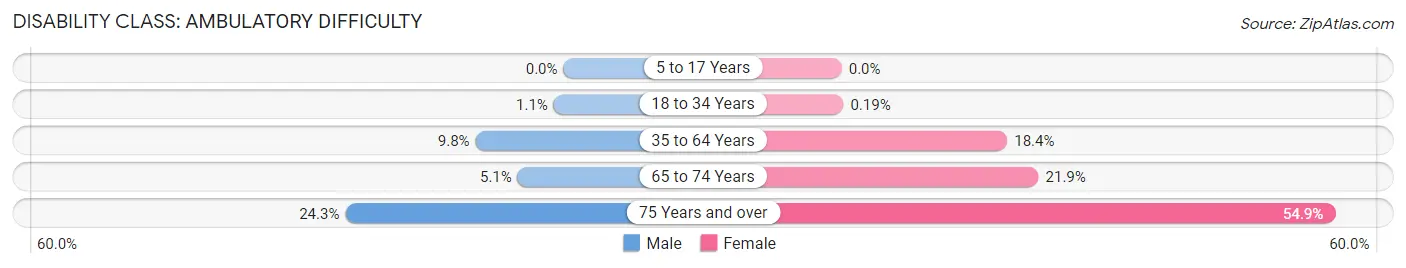
| Age Bracket | Male | Female |
| 5 to 17 Years | 0 (0.0%) | 0 (0.0%) |
| 18 to 34 Years | 27 (1.1%) | 5 (0.2%) |
| 35 to 64 Years | 269 (9.8%) | 543 (18.4%) |
| 65 to 74 Years | 23 (5.1%) | 105 (21.9%) |
| 75 Years and over | 68 (24.3%) | 217 (54.9%) |
Disability Class: Self-Care Difficulty
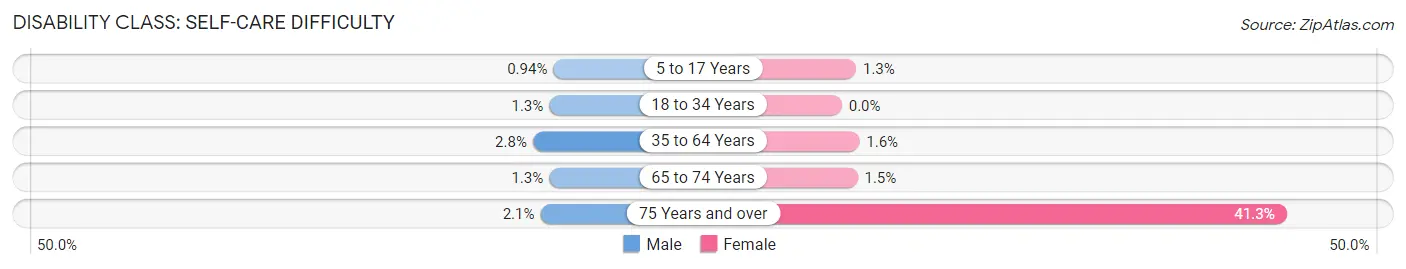
| Age Bracket | Male | Female |
| 5 to 17 Years | 16 (0.9%) | 23 (1.3%) |
| 18 to 34 Years | 33 (1.3%) | 0 (0.0%) |
| 35 to 64 Years | 78 (2.8%) | 48 (1.6%) |
| 65 to 74 Years | 6 (1.3%) | 7 (1.5%) |
| 75 Years and over | 6 (2.1%) | 163 (41.3%) |
Technology Access in Siloam Springs
Computing Device Access in Siloam Springs
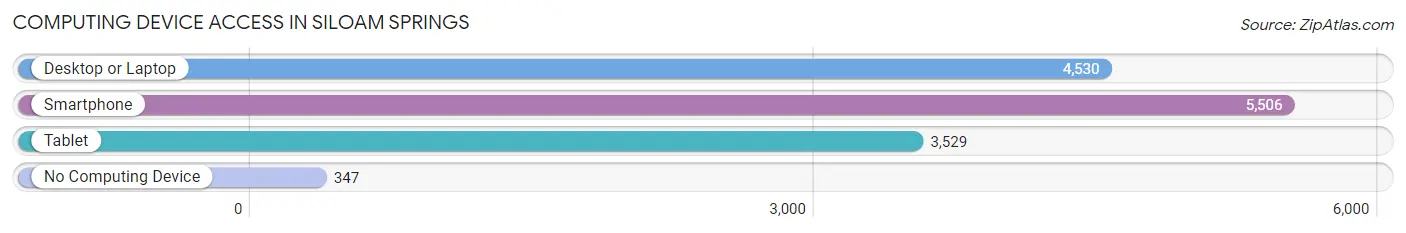
| Device Type | # Households | % Households |
| Desktop or Laptop | 4,530 | 76.0% |
| Smartphone | 5,506 | 92.3% |
| Tablet | 3,529 | 59.2% |
| No Computing Device | 347 | 5.8% |
| Total | 5,963 | 100.0% |
Internet Access in Siloam Springs
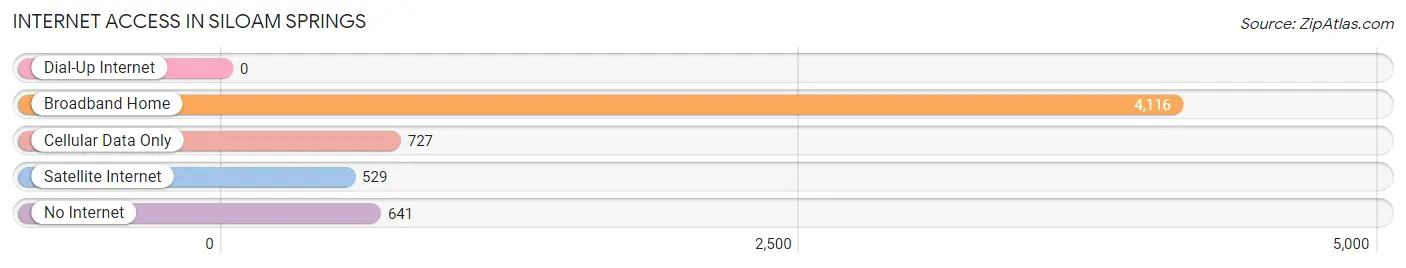
| Internet Type | # Households | % Households |
| Dial-Up Internet | 0 | 0.0% |
| Broadband Home | 4,116 | 69.0% |
| Cellular Data Only | 727 | 12.2% |
| Satellite Internet | 529 | 8.9% |
| No Internet | 641 | 10.7% |
| Total | 5,963 | 100.0% |
Siloam Springs Summary
Siloam Springs is a city located in the northwest corner of Arkansas, in Benton County. It is situated in the Ozark Mountains, near the Oklahoma border. The city is known for its natural beauty, with its rolling hills, lush forests, and crystal-clear streams. It is also home to a vibrant economy, with a diverse mix of industries and businesses.
History
Siloam Springs was first settled in 1829 by a group of Cherokee Indians who had been forced to leave their ancestral lands in Georgia and Alabama. The city was named after a nearby spring, which was believed to have healing properties. The city was incorporated in 1881, and the first mayor was elected in 1882.
In the late 19th century, Siloam Springs became a popular destination for tourists, who came to enjoy the natural beauty of the area. The city was also home to a number of resorts, which attracted visitors from all over the country.
In the early 20th century, Siloam Springs experienced a period of rapid growth. The city was home to a number of industries, including a cotton mill, a flour mill, and a canning factory. The city also became a center for education, with the establishment of John Brown University in 1919.
Geography
Siloam Springs is located in the northwest corner of Arkansas, in Benton County. It is situated in the Ozark Mountains, near the Oklahoma border. The city is located at the intersection of two major highways, US Highway 412 and Arkansas Highway 59.
The city has a total area of 16.3 square miles, of which 16.2 square miles is land and 0.1 square miles is water. The city is located at an elevation of 1,068 feet above sea level.
Economy
Siloam Springs is home to a diverse economy, with a mix of industries and businesses. The city is home to a number of manufacturing companies, including a steel mill, a plastics plant, and a paper mill. The city is also home to a number of retail stores, restaurants, and other businesses.
The city is also home to John Brown University, which is a private, Christian university. The university has an enrollment of over 2,000 students, and offers a variety of degree programs.
Demographics
As of the 2010 census, Siloam Springs had a population of 15,039. The racial makeup of the city was 81.3% White, 1.3% African American, 0.7% Native American, 0.7% Asian, 0.1% Pacific Islander, 14.2% from other races, and 2.1% from two or more races. Hispanic or Latino of any race were 22.3% of the population.
The median income for a household in the city was $37,945, and the median income for a family was $45,945. The per capita income for the city was $20,945. About 14.2% of families and 18.2% of the population were below the poverty line, including 25.2% of those under age 18 and 10.2% of those age 65 or over.
Common Questions
What is Per Capita Income in Siloam Springs?
Per Capita income in Siloam Springs is $24,890.
What is the Median Family Income in Siloam Springs?
Median Family Income in Siloam Springs is $70,042.
What is the Median Household income in Siloam Springs?
Median Household Income in Siloam Springs is $59,911.
What is Income or Wage Gap in Siloam Springs?
Income or Wage Gap in Siloam Springs is 21.7%.
Women in Siloam Springs earn 78.3 cents for every dollar earned by a man.
What is Family Income Deficit in Siloam Springs?
Family Income Deficit in Siloam Springs is $16,189.
Families that are below poverty line in Siloam Springs earn $16,189 less on average than the poverty threshold level.
What is Inequality or Gini Index in Siloam Springs?
Inequality or Gini Index in Siloam Springs is 0.43.
What is the Total Population of Siloam Springs?
Total Population of Siloam Springs is 17,632.
What is the Total Male Population of Siloam Springs?
Total Male Population of Siloam Springs is 8,371.
What is the Total Female Population of Siloam Springs?
Total Female Population of Siloam Springs is 9,261.
What is the Ratio of Males per 100 Females in Siloam Springs?
There are 90.39 Males per 100 Females in Siloam Springs.
What is the Ratio of Females per 100 Males in Siloam Springs?
There are 110.63 Females per 100 Males in Siloam Springs.
What is the Median Population Age in Siloam Springs?
Median Population Age in Siloam Springs is 30.1 Years.
What is the Average Family Size in Siloam Springs
Average Family Size in Siloam Springs is 3.2 People.
What is the Average Household Size in Siloam Springs
Average Household Size in Siloam Springs is 2.8 People.
How Large is the Labor Force in Siloam Springs?
There are 8,268 People in the Labor Forcein in Siloam Springs.
What is the Percentage of People in the Labor Force in Siloam Springs?
62.5% of People are in the Labor Force in Siloam Springs.
What is the Unemployment Rate in Siloam Springs?
Unemployment Rate in Siloam Springs is 2.6%.