Boone County, AR Map & Demographics
Boone County Map
Boone County Overview
$28,886
PER CAPITA INCOME
$66,617
AVG FAMILY INCOME
$52,275
AVG HOUSEHOLD INCOME
29.9%
WAGE / INCOME GAP [ % ]
70.1¢/ $1
WAGE / INCOME GAP [ $ ]
$9,120
FAMILY INCOME DEFICIT
0.45
INEQUALITY / GINI INDEX
37,662
TOTAL POPULATION
18,657
MALE POPULATION
19,005
FEMALE POPULATION
98.17
MALES / 100 FEMALES
101.87
FEMALES / 100 MALES
41.9
MEDIAN AGE
3.0
AVG FAMILY SIZE
2.5
AVG HOUSEHOLD SIZE
16,986
LABOR FORCE [ PEOPLE ]
56.7%
PERCENT IN LABOR FORCE
4.4%
UNEMPLOYMENT RATE
Boone County Area Codes
Income in Boone County
Income Overview in Boone County
Per Capita Income in Boone County is $28,886, while median incomes of families and households are $66,617 and $52,275 respectively.
| Characteristic | Number | Measure |
| Per Capita Income | 37,662 | $28,886 |
| Median Family Income | 10,021 | $66,617 |
| Mean Family Income | 10,021 | $84,801 |
| Median Household Income | 15,172 | $52,275 |
| Mean Household Income | 15,172 | $69,322 |
| Income Deficit | 10,021 | $9,120 |
| Wage / Income Gap (%) | 37,662 | 29.87% |
| Wage / Income Gap ($) | 37,662 | 70.13¢ per $1 |
| Gini / Inequality Index | 37,662 | 0.45 |
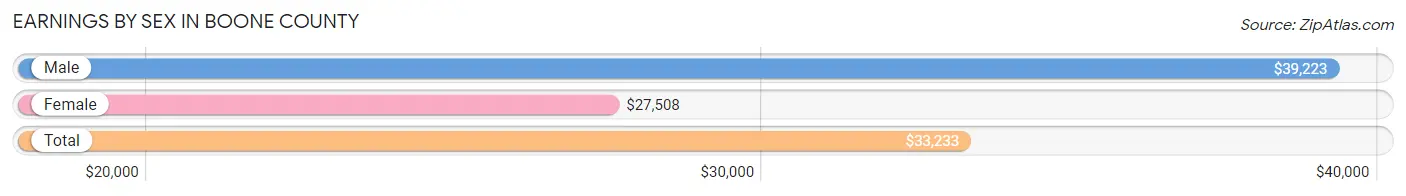
Earnings by Sex in Boone County
Average Earnings in Boone County are $33,233, $39,223 for men and $27,508 for women, a difference of 29.9%.
| Sex | Number | Average Earnings |
| Male | 9,156 (51.6%) | $39,223 |
| Female | 8,581 (48.4%) | $27,508 |
| Total | 17,737 (100.0%) | $33,233 |
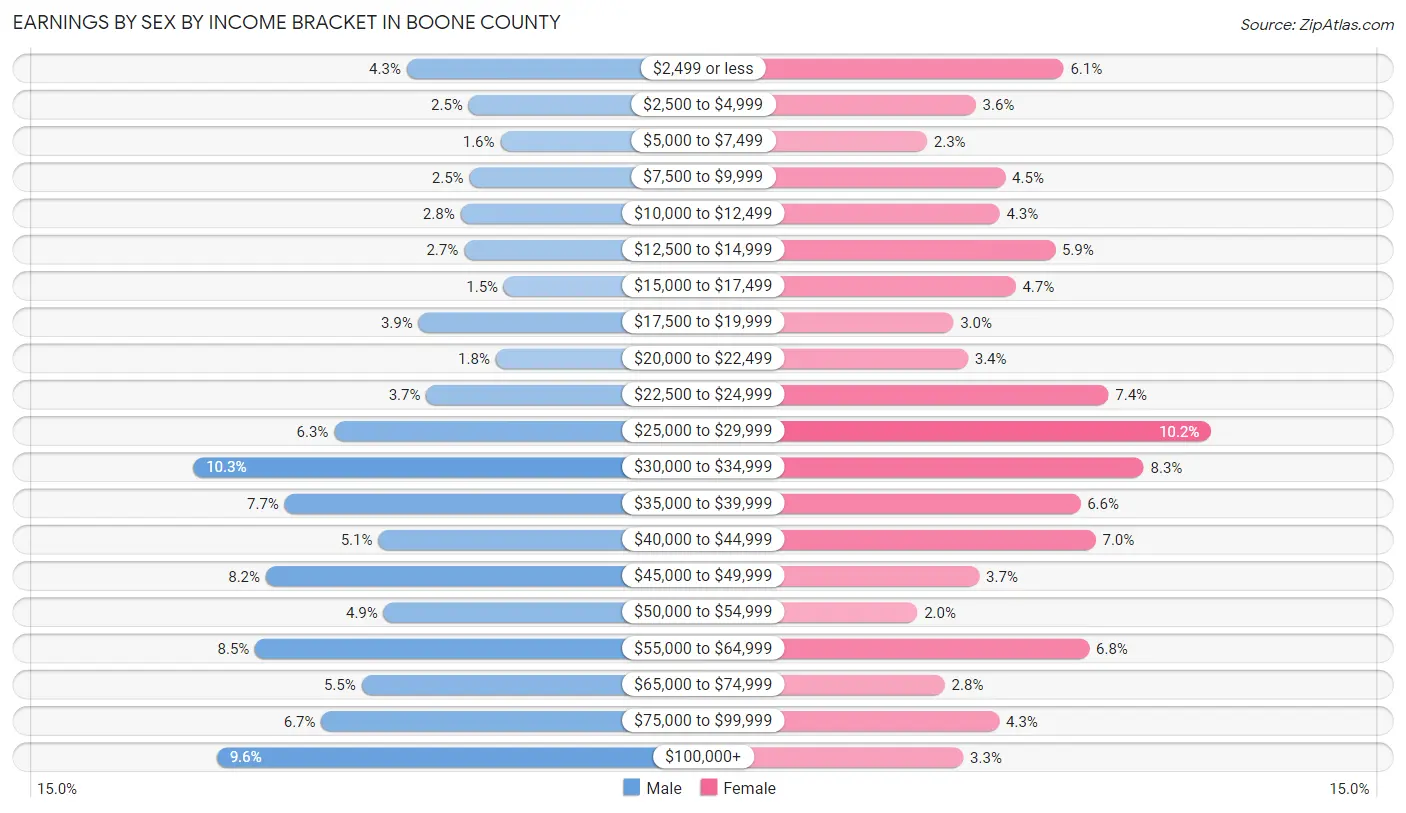
Earnings by Sex by Income Bracket in Boone County
The most common earnings brackets in Boone County are $30,000 to $34,999 for men (939 | 10.3%) and $25,000 to $29,999 for women (879 | 10.2%).
| Income | Male | Female |
| $2,499 or less | 390 (4.3%) | 523 (6.1%) |
| $2,500 to $4,999 | 231 (2.5%) | 311 (3.6%) |
| $5,000 to $7,499 | 149 (1.6%) | 193 (2.2%) |
| $7,500 to $9,999 | 229 (2.5%) | 382 (4.4%) |
| $10,000 to $12,499 | 252 (2.8%) | 368 (4.3%) |
| $12,500 to $14,999 | 243 (2.6%) | 502 (5.9%) |
| $15,000 to $17,499 | 140 (1.5%) | 407 (4.7%) |
| $17,500 to $19,999 | 360 (3.9%) | 257 (3.0%) |
| $20,000 to $22,499 | 161 (1.8%) | 292 (3.4%) |
| $22,500 to $24,999 | 340 (3.7%) | 631 (7.3%) |
| $25,000 to $29,999 | 577 (6.3%) | 879 (10.2%) |
| $30,000 to $34,999 | 939 (10.3%) | 716 (8.3%) |
| $35,000 to $39,999 | 704 (7.7%) | 563 (6.6%) |
| $40,000 to $44,999 | 463 (5.1%) | 600 (7.0%) |
| $45,000 to $49,999 | 753 (8.2%) | 319 (3.7%) |
| $50,000 to $54,999 | 450 (4.9%) | 170 (2.0%) |
| $55,000 to $64,999 | 780 (8.5%) | 584 (6.8%) |
| $65,000 to $74,999 | 506 (5.5%) | 236 (2.8%) |
| $75,000 to $99,999 | 610 (6.7%) | 367 (4.3%) |
| $100,000+ | 879 (9.6%) | 281 (3.3%) |
| Total | 9,156 (100.0%) | 8,581 (100.0%) |
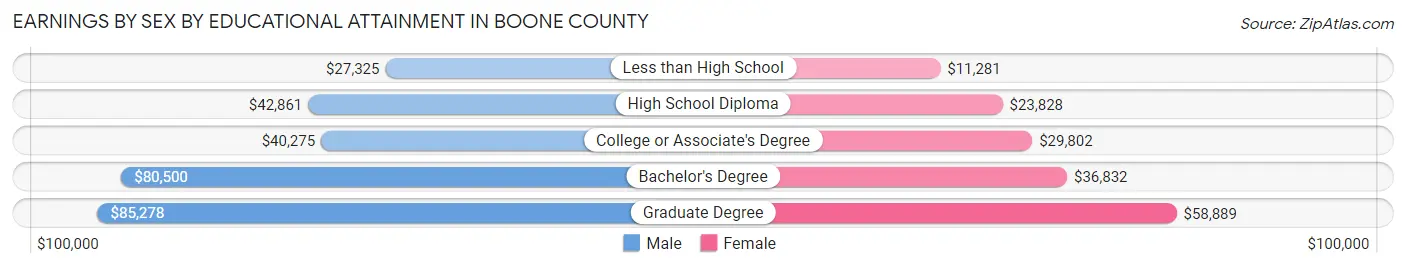
Earnings by Sex by Educational Attainment in Boone County
Average earnings in Boone County are $43,253 for men and $29,774 for women, a difference of 31.2%. Men with an educational attainment of graduate degree enjoy the highest average annual earnings of $85,278, while those with less than high school education earn the least with $27,325. Women with an educational attainment of graduate degree earn the most with the average annual earnings of $58,889, while those with less than high school education have the smallest earnings of $11,281.
| Educational Attainment | Male Income | Female Income |
| Less than High School | $27,325 | $11,281 |
| High School Diploma | $42,861 | $23,828 |
| College or Associate's Degree | $40,275 | $29,802 |
| Bachelor's Degree | $80,500 | $36,832 |
| Graduate Degree | $85,278 | $58,889 |
| Total | $43,253 | $29,774 |
Family Income in Boone County
Family Income Brackets in Boone County
According to the Boone County family income data, there are 2,395 families falling into the $50,000 to $74,999 income range, which is the most common income bracket and makes up 23.9% of all families. Conversely, the less than $10,000 income bracket is the least frequent group with only 281 families (2.8%) belonging to this category.
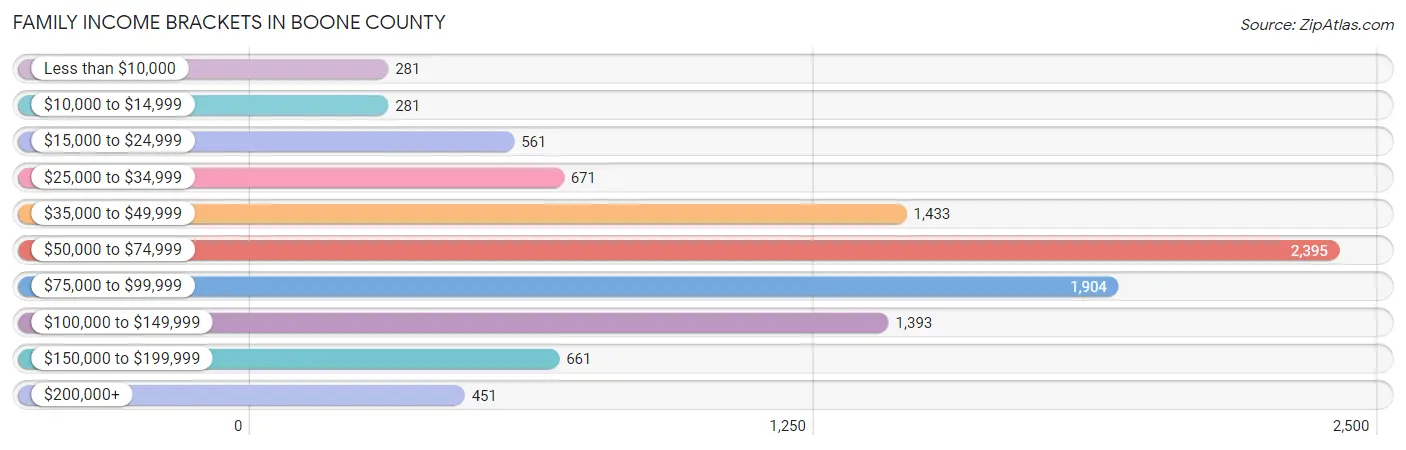
| Income Bracket | # Families | % Families |
| Less than $10,000 | 281 | 2.8% |
| $10,000 to $14,999 | 281 | 2.8% |
| $15,000 to $24,999 | 561 | 5.6% |
| $25,000 to $34,999 | 671 | 6.7% |
| $35,000 to $49,999 | 1,433 | 14.3% |
| $50,000 to $74,999 | 2,395 | 23.9% |
| $75,000 to $99,999 | 1,904 | 19.0% |
| $100,000 to $149,999 | 1,393 | 13.9% |
| $150,000 to $199,999 | 661 | 6.6% |
| $200,000+ | 451 | 4.5% |
Family Income by Famaliy Size in Boone County
6-person families (201 | 2.0%) account for the highest median family income in Boone County with $108,365 per family, while 2-person families (4,989 | 49.8%) have the highest median income of $28,912 per family member.
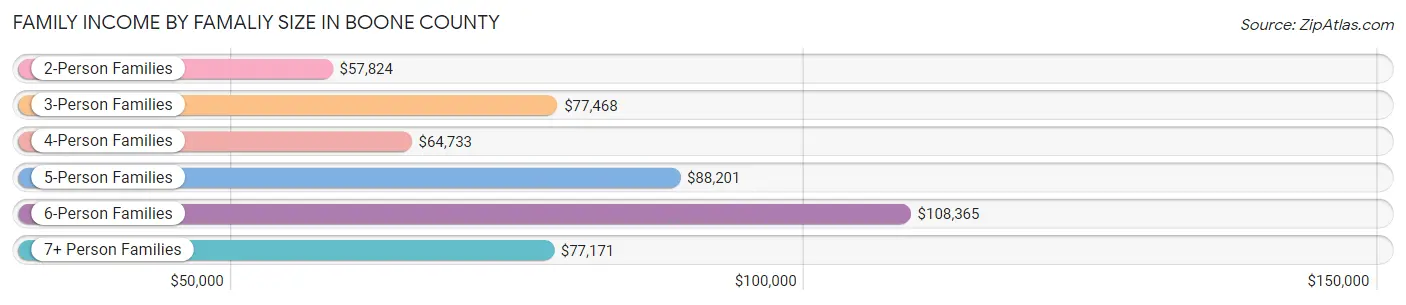
| Income Bracket | # Families | Median Income |
| 2-Person Families | 4,989 (49.8%) | $57,824 |
| 3-Person Families | 2,284 (22.8%) | $77,468 |
| 4-Person Families | 1,537 (15.3%) | $64,733 |
| 5-Person Families | 861 (8.6%) | $88,201 |
| 6-Person Families | 201 (2.0%) | $108,365 |
| 7+ Person Families | 149 (1.5%) | $77,171 |
| Total | 10,021 (100.0%) | $66,617 |
Family Income by Number of Earners in Boone County
The median family income in Boone County is $66,617, with families comprising 3+ earners (905) having the highest median family income of $93,629, while families with no earners (2,252) have the lowest median family income of $39,868, accounting for 9.0% and 22.5% of families, respectively.
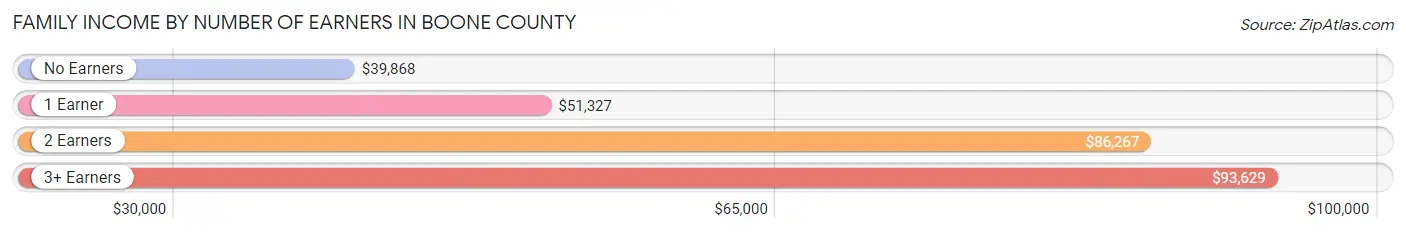
| Number of Earners | # Families | Median Income |
| No Earners | 2,252 (22.5%) | $39,868 |
| 1 Earner | 2,702 (27.0%) | $51,327 |
| 2 Earners | 4,162 (41.5%) | $86,267 |
| 3+ Earners | 905 (9.0%) | $93,629 |
| Total | 10,021 (100.0%) | $66,617 |
Household Income in Boone County
Household Income Brackets in Boone County
With 3,125 households falling in the category, the $50,000 to $74,999 income range is the most frequent in Boone County, accounting for 20.6% of all households. In contrast, only 501 households (3.3%) fall into the $200,000+ income bracket, making it the least populous group.
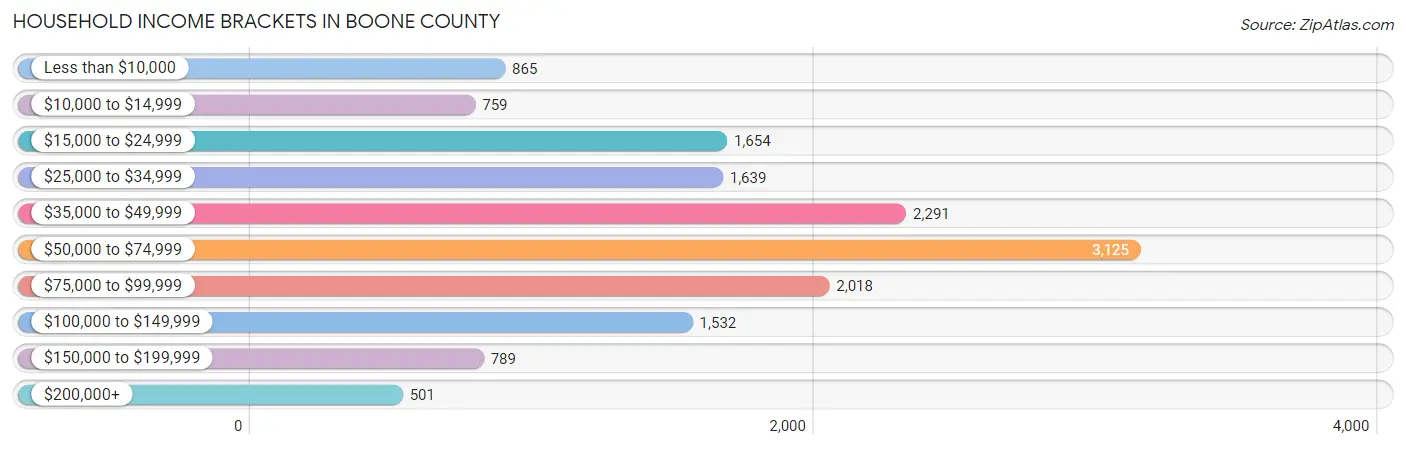
| Income Bracket | # Households | % Households |
| Less than $10,000 | 865 | 5.7% |
| $10,000 to $14,999 | 759 | 5.0% |
| $15,000 to $24,999 | 1,654 | 10.9% |
| $25,000 to $34,999 | 1,639 | 10.8% |
| $35,000 to $49,999 | 2,291 | 15.1% |
| $50,000 to $74,999 | 3,125 | 20.6% |
| $75,000 to $99,999 | 2,018 | 13.3% |
| $100,000 to $149,999 | 1,532 | 10.1% |
| $150,000 to $199,999 | 789 | 5.2% |
| $200,000+ | 501 | 3.3% |
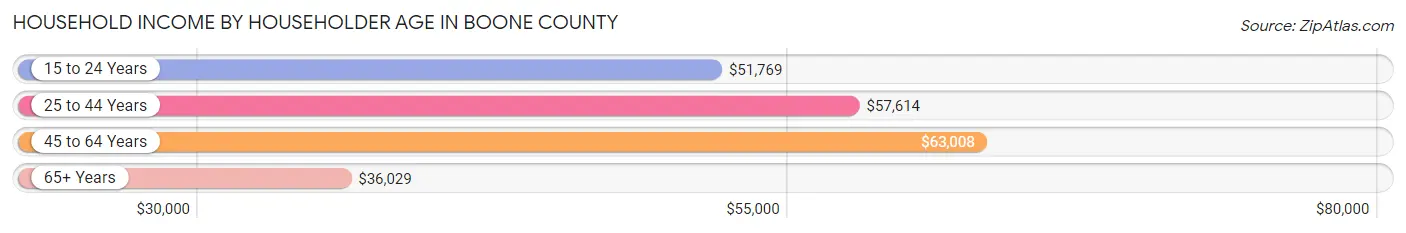
Household Income by Householder Age in Boone County
The median household income in Boone County is $52,275, with the highest median household income of $63,008 found in the 45 to 64 years age bracket for the primary householder. A total of 5,583 households (36.8%) fall into this category. Meanwhile, the 65+ years age bracket for the primary householder has the lowest median household income of $36,029, with 4,812 households (31.7%) in this group.
| Income Bracket | # Households | Median Income |
| 15 to 24 Years | 657 (4.3%) | $51,769 |
| 25 to 44 Years | 4,120 (27.2%) | $57,614 |
| 45 to 64 Years | 5,583 (36.8%) | $63,008 |
| 65+ Years | 4,812 (31.7%) | $36,029 |
| Total | 15,172 (100.0%) | $52,275 |
Poverty in Boone County
Income Below Poverty by Sex and Age in Boone County
With 11.6% poverty level for males and 14.6% for females among the residents of Boone County, 12 to 14 year old males and under 5 year old females are the most vulnerable to poverty, with 199 males (26.3%) and 308 females (29.3%) in their respective age groups living below the poverty level.
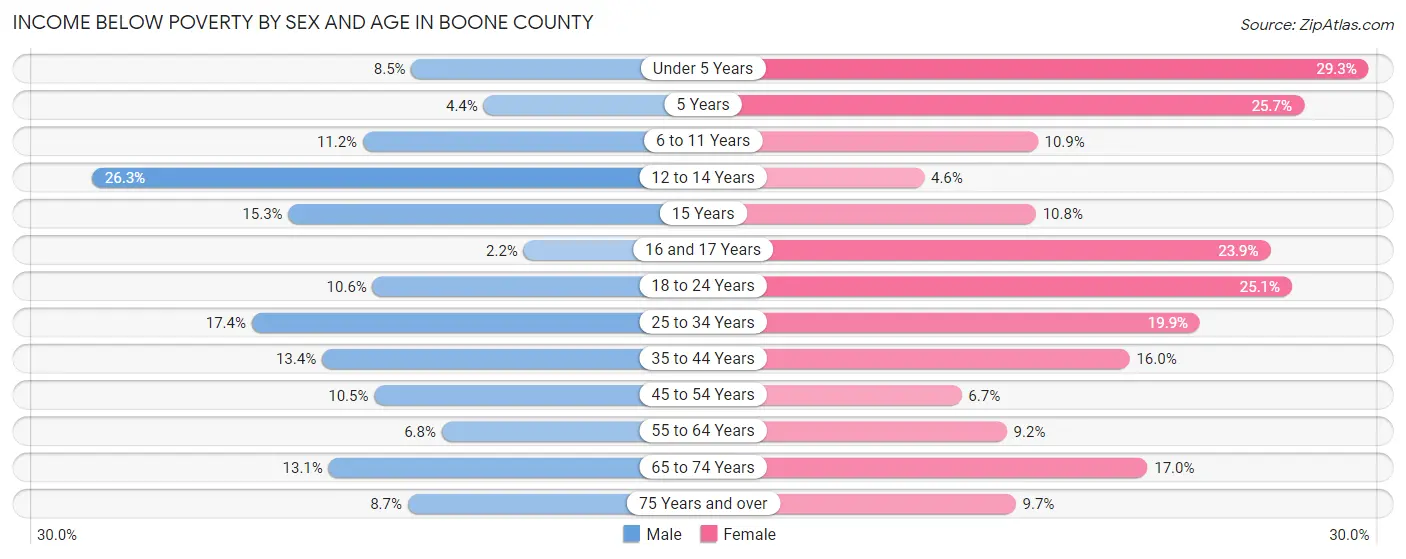
| Age Bracket | Male | Female |
| Under 5 Years | 85 (8.5%) | 308 (29.3%) |
| 5 Years | 10 (4.4%) | 71 (25.7%) |
| 6 to 11 Years | 165 (11.2%) | 139 (10.9%) |
| 12 to 14 Years | 199 (26.3%) | 28 (4.6%) |
| 15 Years | 32 (15.3%) | 54 (10.8%) |
| 16 and 17 Years | 12 (2.2%) | 68 (23.9%) |
| 18 to 24 Years | 166 (10.6%) | 318 (25.1%) |
| 25 to 34 Years | 366 (17.3%) | 441 (19.9%) |
| 35 to 44 Years | 283 (13.4%) | 345 (16.0%) |
| 45 to 54 Years | 250 (10.5%) | 154 (6.7%) |
| 55 to 64 Years | 165 (6.8%) | 239 (9.2%) |
| 65 to 74 Years | 281 (13.1%) | 400 (17.0%) |
| 75 Years and over | 115 (8.7%) | 175 (9.7%) |
| Total | 2,129 (11.6%) | 2,740 (14.6%) |
Income Above Poverty by Sex and Age in Boone County
According to the poverty statistics in Boone County, males aged 16 and 17 years and females aged 12 to 14 years are the age groups that are most secure financially, with 97.8% of males and 95.4% of females in these age groups living above the poverty line.
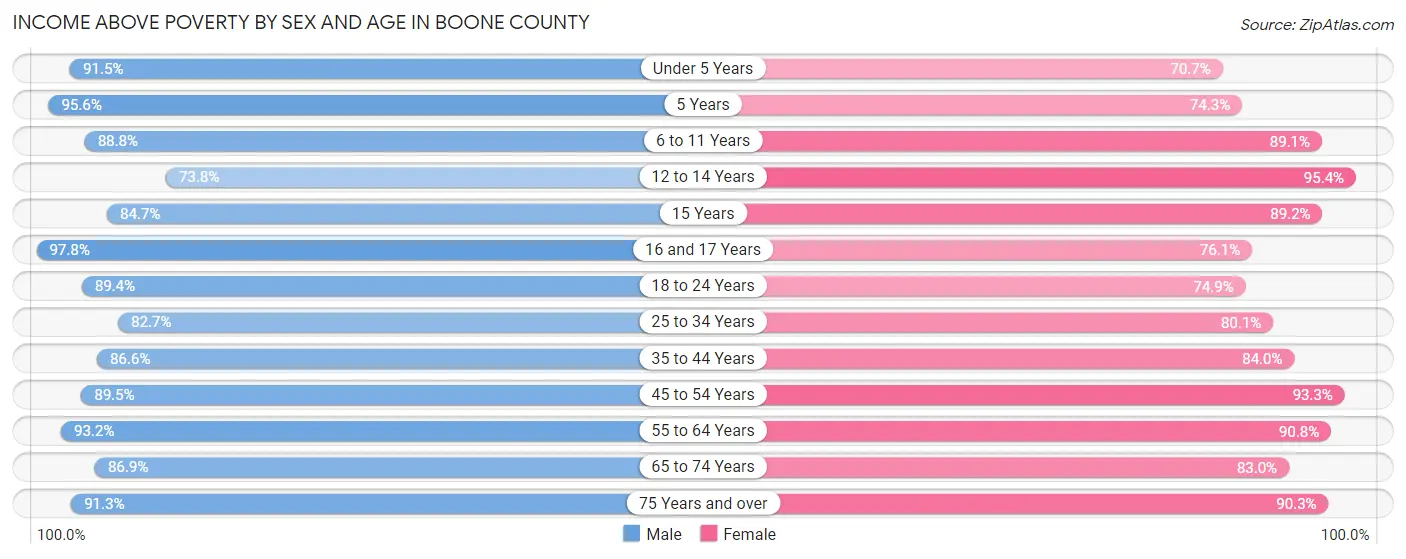
| Age Bracket | Male | Female |
| Under 5 Years | 920 (91.5%) | 742 (70.7%) |
| 5 Years | 215 (95.6%) | 205 (74.3%) |
| 6 to 11 Years | 1,313 (88.8%) | 1,136 (89.1%) |
| 12 to 14 Years | 559 (73.8%) | 583 (95.4%) |
| 15 Years | 177 (84.7%) | 446 (89.2%) |
| 16 and 17 Years | 531 (97.8%) | 217 (76.1%) |
| 18 to 24 Years | 1,397 (89.4%) | 951 (74.9%) |
| 25 to 34 Years | 1,743 (82.7%) | 1,771 (80.1%) |
| 35 to 44 Years | 1,822 (86.6%) | 1,808 (84.0%) |
| 45 to 54 Years | 2,124 (89.5%) | 2,159 (93.3%) |
| 55 to 64 Years | 2,272 (93.2%) | 2,365 (90.8%) |
| 65 to 74 Years | 1,869 (86.9%) | 1,952 (83.0%) |
| 75 Years and over | 1,213 (91.3%) | 1,632 (90.3%) |
| Total | 16,155 (88.4%) | 15,967 (85.4%) |
Income Below Poverty Among Married-Couple Families in Boone County
The poverty statistics for married-couple families in Boone County show that 5.9% or 481 of the total 8,172 families live below the poverty line. Families with 5 or more children have the highest poverty rate of 14.9%, comprising of 10 families. On the other hand, families with 1 or 2 children have the lowest poverty rate of 4.0%, which includes 94 families.
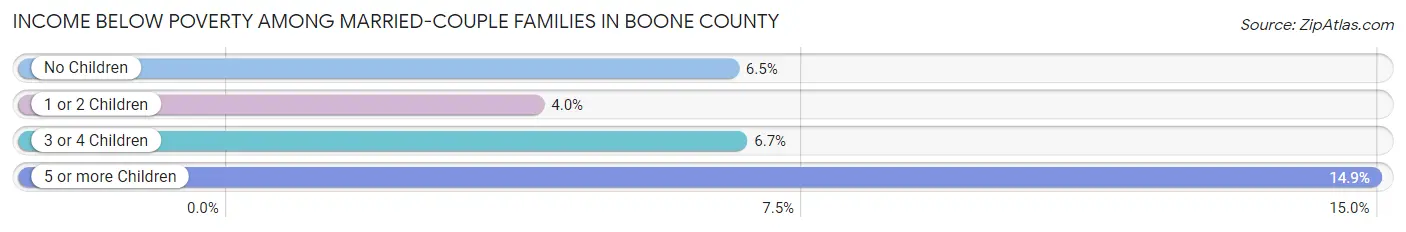
| Children | Above Poverty | Below Poverty |
| No Children | 4,605 (93.5%) | 322 (6.5%) |
| 1 or 2 Children | 2,257 (96.0%) | 94 (4.0%) |
| 3 or 4 Children | 772 (93.3%) | 55 (6.7%) |
| 5 or more Children | 57 (85.1%) | 10 (14.9%) |
| Total | 7,691 (94.1%) | 481 (5.9%) |
Income Below Poverty Among Single-Parent Households in Boone County
According to the poverty data in Boone County, 21.2% or 109 single-father households and 26.1% or 349 single-mother households are living below the poverty line. Among single-father households, those with 1 or 2 children have the highest poverty rate, with 57 households (28.9%) experiencing poverty. Likewise, among single-mother households, those with 3 or 4 children have the highest poverty rate, with 83 households (58.9%) falling below the poverty line.
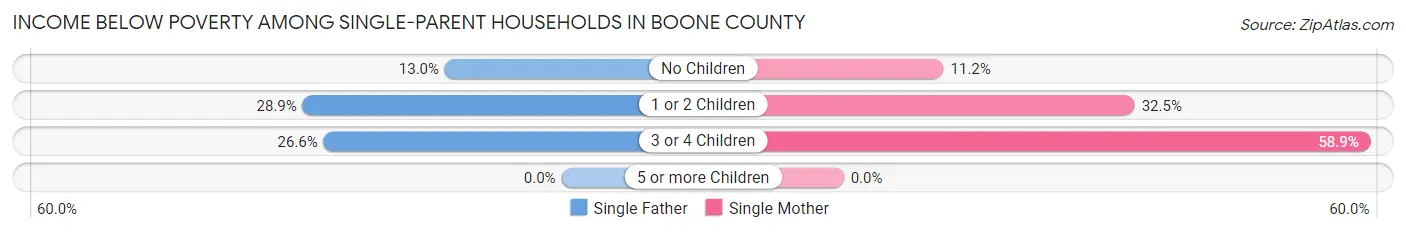
| Children | Single Father | Single Mother |
| No Children | 31 (13.0%) | 64 (11.2%) |
| 1 or 2 Children | 57 (28.9%) | 202 (32.5%) |
| 3 or 4 Children | 21 (26.6%) | 83 (58.9%) |
| 5 or more Children | 0 (0.0%) | 0 (0.0%) |
| Total | 109 (21.2%) | 349 (26.1%) |
Income Below Poverty Among Married-Couple vs Single-Parent Households in Boone County
The poverty data for Boone County shows that 481 of the married-couple family households (5.9%) and 458 of the single-parent households (24.8%) are living below the poverty level. Within the married-couple family households, those with 5 or more children have the highest poverty rate, with 10 households (14.9%) falling below the poverty line. Among the single-parent households, those with 3 or 4 children have the highest poverty rate, with 104 household (47.3%) living below poverty.
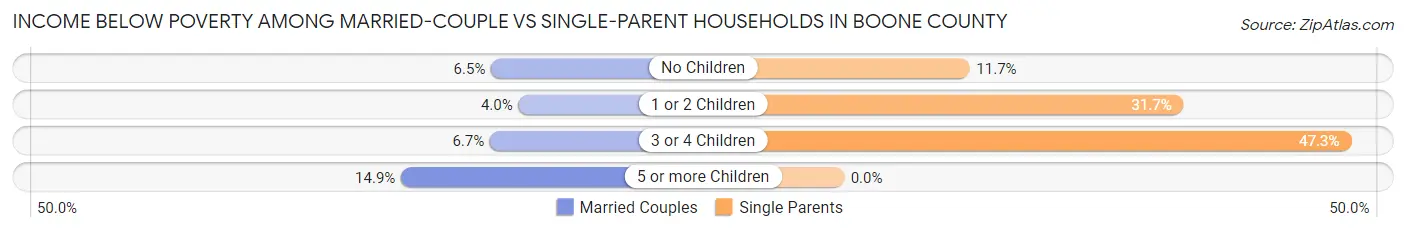
| Children | Married-Couple Families | Single-Parent Households |
| No Children | 322 (6.5%) | 95 (11.7%) |
| 1 or 2 Children | 94 (4.0%) | 259 (31.7%) |
| 3 or 4 Children | 55 (6.7%) | 104 (47.3%) |
| 5 or more Children | 10 (14.9%) | 0 (0.0%) |
| Total | 481 (5.9%) | 458 (24.8%) |
Race in Boone County
The most populous races in Boone County are White / Caucasian (35,724 | 94.9%), Two or more Races (1,303 | 3.5%), and Hispanic or Latino (1,089 | 2.9%).
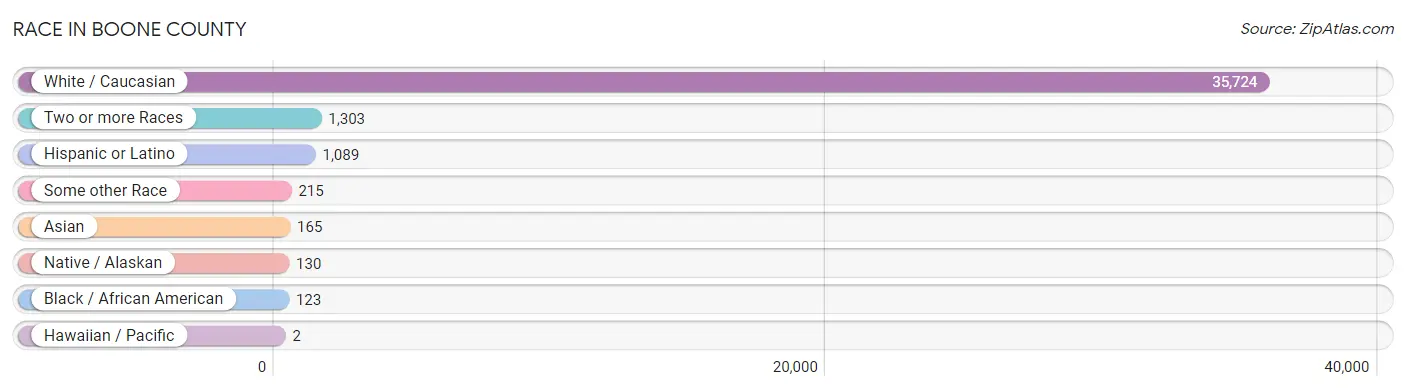
| Race | # Population | % Population |
| Asian | 165 | 0.4% |
| Black / African American | 123 | 0.3% |
| Hawaiian / Pacific | 2 | 0.0% |
| Hispanic or Latino | 1,089 | 2.9% |
| Native / Alaskan | 130 | 0.4% |
| White / Caucasian | 35,724 | 94.9% |
| Two or more Races | 1,303 | 3.5% |
| Some other Race | 215 | 0.6% |
| Total | 37,662 | 100.0% |
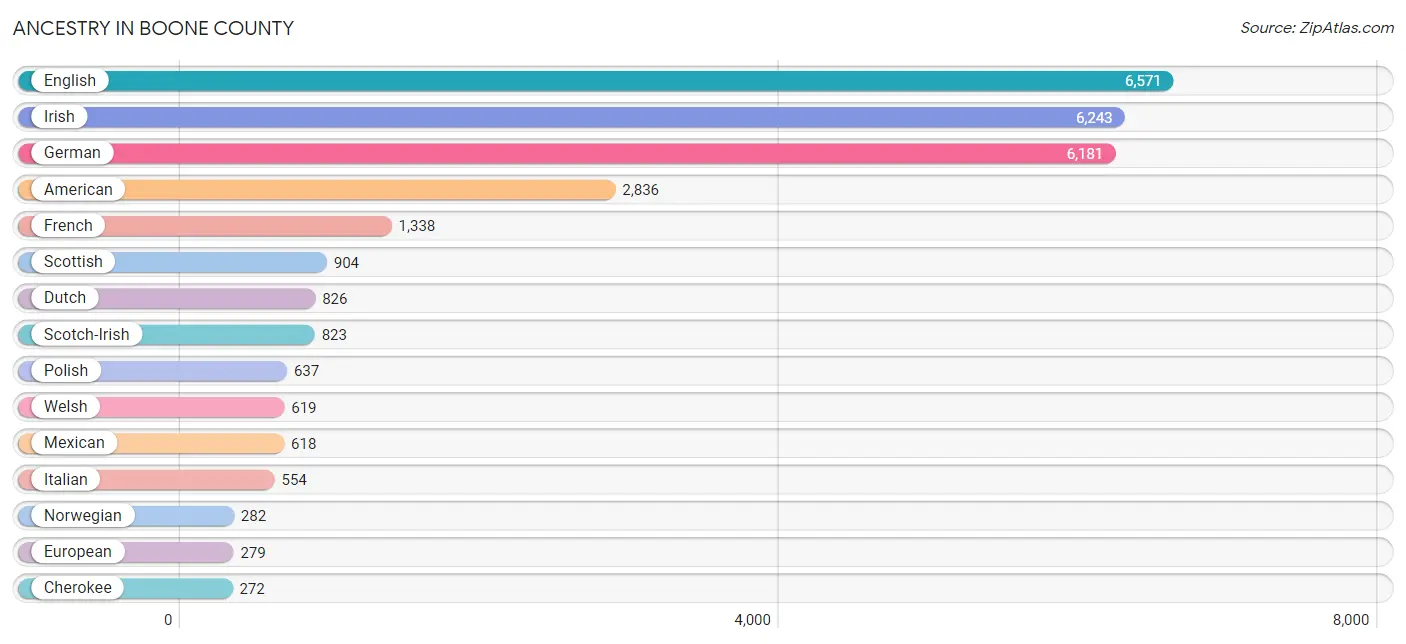
Ancestry in Boone County
The most populous ancestries reported in Boone County are English (6,571 | 17.4%), Irish (6,243 | 16.6%), German (6,181 | 16.4%), American (2,836 | 7.5%), and French (1,338 | 3.5%), together accounting for 61.5% of all Boone County residents.
| Ancestry | # Population | % Population |
| African | 3 | 0.0% |
| Alaskan Athabascan | 12 | 0.0% |
| American | 2,836 | 7.5% |
| Apache | 4 | 0.0% |
| Arab | 11 | 0.0% |
| Arapaho | 2 | 0.0% |
| Austrian | 9 | 0.0% |
| Basque | 16 | 0.0% |
| Belgian | 27 | 0.1% |
| Bhutanese | 198 | 0.5% |
| Blackfeet | 34 | 0.1% |
| Brazilian | 2 | 0.0% |
| British | 71 | 0.2% |
| Bulgarian | 22 | 0.1% |
| Cajun | 33 | 0.1% |
| Canadian | 6 | 0.0% |
| Celtic | 14 | 0.0% |
| Central American | 240 | 0.6% |
| Central American Indian | 12 | 0.0% |
| Cherokee | 272 | 0.7% |
| Cheyenne | 3 | 0.0% |
| Chickasaw | 4 | 0.0% |
| Chippewa | 77 | 0.2% |
| Choctaw | 4 | 0.0% |
| Creek | 32 | 0.1% |
| Cuban | 37 | 0.1% |
| Czech | 130 | 0.4% |
| Czechoslovakian | 37 | 0.1% |
| Danish | 17 | 0.1% |
| Dominican | 1 | 0.0% |
| Dutch | 826 | 2.2% |
| Dutch West Indian | 24 | 0.1% |
| English | 6,571 | 17.4% |
| European | 279 | 0.7% |
| Finnish | 16 | 0.0% |
| French | 1,338 | 3.5% |
| French Canadian | 100 | 0.3% |
| German | 6,181 | 16.4% |
| Greek | 40 | 0.1% |
| Guamanian / Chamorro | 2 | 0.0% |
| Guatemalan | 13 | 0.0% |
| Honduran | 182 | 0.5% |
| Hungarian | 19 | 0.1% |
| Indian (Asian) | 61 | 0.2% |
| Inupiat | 23 | 0.1% |
| Irish | 6,243 | 16.6% |
| Iroquois | 1 | 0.0% |
| Italian | 554 | 1.5% |
| Korean | 83 | 0.2% |
| Laotian | 29 | 0.1% |
| Latvian | 8 | 0.0% |
| Lithuanian | 79 | 0.2% |
| Menominee | 16 | 0.0% |
| Mexican | 618 | 1.6% |
| Native Hawaiian | 2 | 0.0% |
| Navajo | 17 | 0.1% |
| Nigerian | 3 | 0.0% |
| Norwegian | 282 | 0.7% |
| Osage | 24 | 0.1% |
| Panamanian | 13 | 0.0% |
| Polish | 637 | 1.7% |
| Portuguese | 13 | 0.0% |
| Potawatomi | 11 | 0.0% |
| Puerto Rican | 41 | 0.1% |
| Romanian | 9 | 0.0% |
| Russian | 199 | 0.5% |
| Salvadoran | 32 | 0.1% |
| Scandinavian | 152 | 0.4% |
| Scotch-Irish | 823 | 2.2% |
| Scottish | 904 | 2.4% |
| Sioux | 17 | 0.1% |
| Slavic | 1 | 0.0% |
| Slovak | 21 | 0.1% |
| Spaniard | 14 | 0.0% |
| Spanish | 115 | 0.3% |
| Sri Lankan | 14 | 0.0% |
| Subsaharan African | 7 | 0.0% |
| Swedish | 147 | 0.4% |
| Swiss | 126 | 0.3% |
| Syrian | 11 | 0.0% |
| Ukrainian | 13 | 0.0% |
| Welsh | 619 | 1.6% |
| Yaqui | 25 | 0.1% |
| Yugoslavian | 13 | 0.0% | View All 84 Rows |
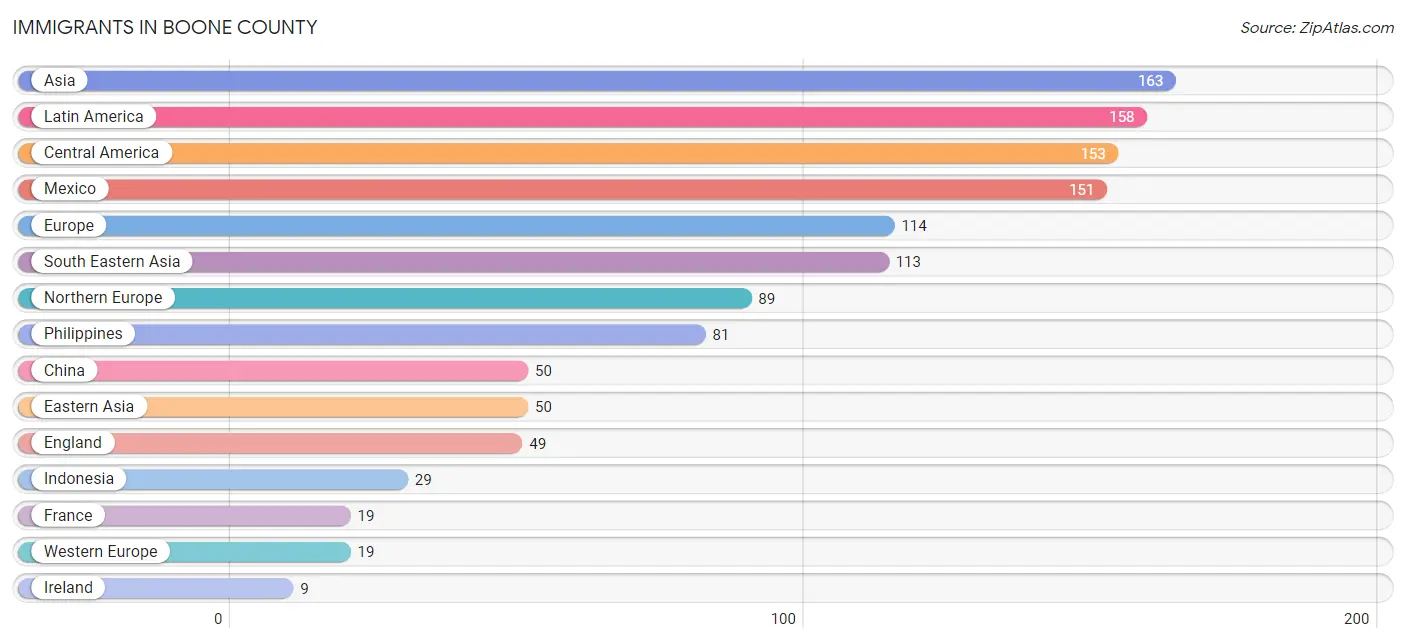
Immigrants in Boone County
The most numerous immigrant groups reported in Boone County came from Asia (163 | 0.4%), Latin America (158 | 0.4%), Central America (153 | 0.4%), Mexico (151 | 0.4%), and Europe (114 | 0.3%), together accounting for 2.0% of all Boone County residents.
| Immigration Origin | # Population | % Population |
| Asia | 163 | 0.4% |
| Brazil | 4 | 0.0% |
| Bulgaria | 6 | 0.0% |
| Canada | 6 | 0.0% |
| Caribbean | 1 | 0.0% |
| Central America | 153 | 0.4% |
| China | 50 | 0.1% |
| Dominican Republic | 1 | 0.0% |
| Eastern Asia | 50 | 0.1% |
| Eastern Europe | 6 | 0.0% |
| England | 49 | 0.1% |
| Europe | 114 | 0.3% |
| France | 19 | 0.1% |
| Guatemala | 2 | 0.0% |
| Indonesia | 29 | 0.1% |
| Ireland | 9 | 0.0% |
| Latin America | 158 | 0.4% |
| Mexico | 151 | 0.4% |
| Northern Europe | 89 | 0.2% |
| Norway | 8 | 0.0% |
| Philippines | 81 | 0.2% |
| South America | 4 | 0.0% |
| South Eastern Asia | 113 | 0.3% |
| Vietnam | 3 | 0.0% |
| Western Europe | 19 | 0.1% | View All 25 Rows |
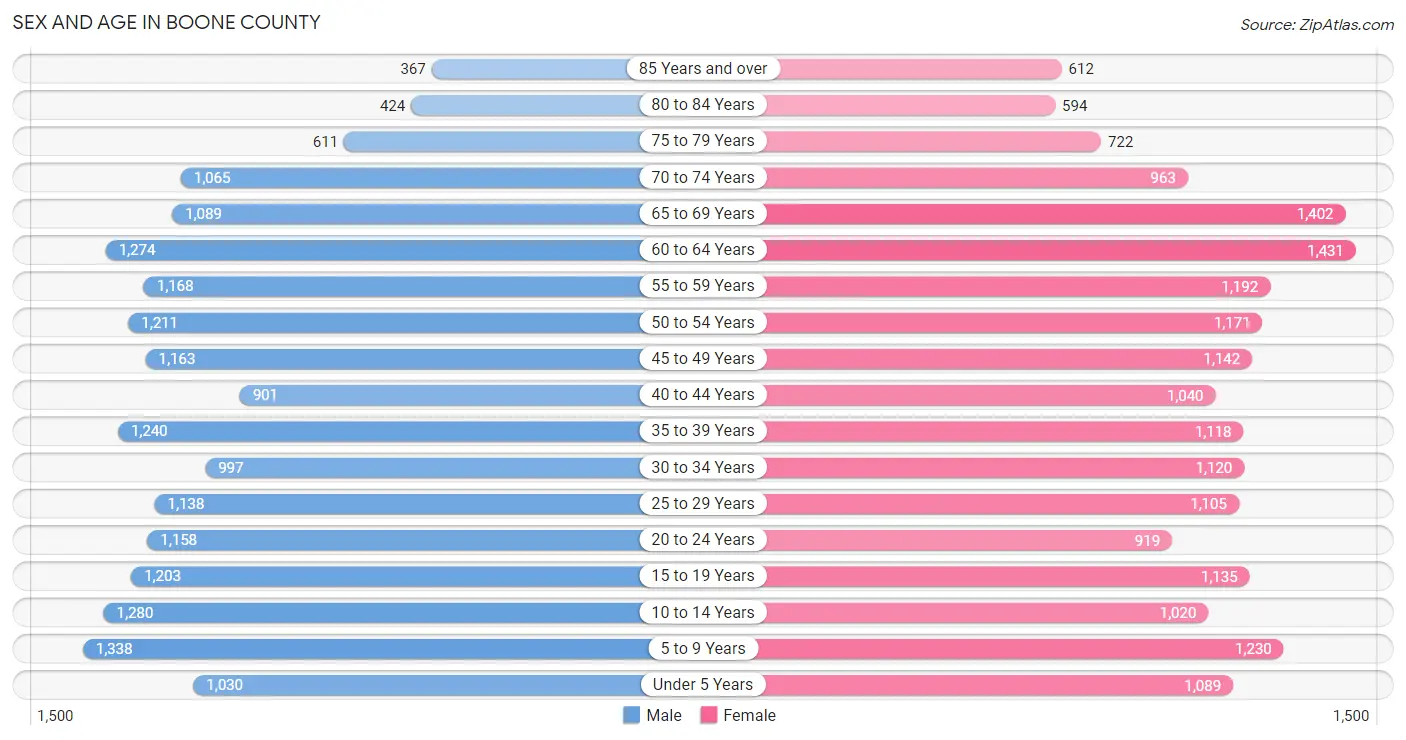
Sex and Age in Boone County
Sex and Age in Boone County
The most populous age groups in Boone County are 5 to 9 Years (1,338 | 7.2%) for men and 60 to 64 Years (1,431 | 7.5%) for women.
| Age Bracket | Male | Female |
| Under 5 Years | 1,030 (5.5%) | 1,089 (5.7%) |
| 5 to 9 Years | 1,338 (7.2%) | 1,230 (6.5%) |
| 10 to 14 Years | 1,280 (6.9%) | 1,020 (5.4%) |
| 15 to 19 Years | 1,203 (6.5%) | 1,135 (6.0%) |
| 20 to 24 Years | 1,158 (6.2%) | 919 (4.8%) |
| 25 to 29 Years | 1,138 (6.1%) | 1,105 (5.8%) |
| 30 to 34 Years | 997 (5.3%) | 1,120 (5.9%) |
| 35 to 39 Years | 1,240 (6.7%) | 1,118 (5.9%) |
| 40 to 44 Years | 901 (4.8%) | 1,040 (5.5%) |
| 45 to 49 Years | 1,163 (6.2%) | 1,142 (6.0%) |
| 50 to 54 Years | 1,211 (6.5%) | 1,171 (6.2%) |
| 55 to 59 Years | 1,168 (6.3%) | 1,192 (6.3%) |
| 60 to 64 Years | 1,274 (6.8%) | 1,431 (7.5%) |
| 65 to 69 Years | 1,089 (5.8%) | 1,402 (7.4%) |
| 70 to 74 Years | 1,065 (5.7%) | 963 (5.1%) |
| 75 to 79 Years | 611 (3.3%) | 722 (3.8%) |
| 80 to 84 Years | 424 (2.3%) | 594 (3.1%) |
| 85 Years and over | 367 (2.0%) | 612 (3.2%) |
| Total | 18,657 (100.0%) | 19,005 (100.0%) |
Families and Households in Boone County
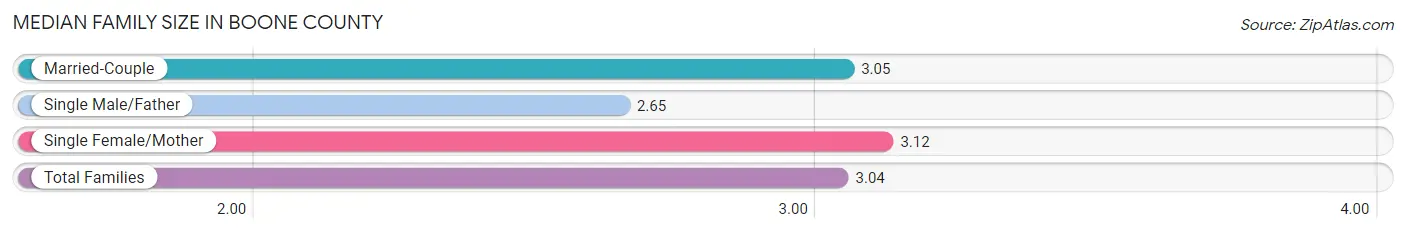
Median Family Size in Boone County
The median family size in Boone County is 3.04 persons per family, with single female/mother families (1,335 | 13.3%) accounting for the largest median family size of 3.12 persons per family. On the other hand, single male/father families (514 | 5.1%) represent the smallest median family size with 2.65 persons per family.
| Family Type | # Families | Family Size |
| Married-Couple | 8,172 (81.6%) | 3.05 |
| Single Male/Father | 514 (5.1%) | 2.65 |
| Single Female/Mother | 1,335 (13.3%) | 3.12 |
| Total Families | 10,021 (100.0%) | 3.04 |
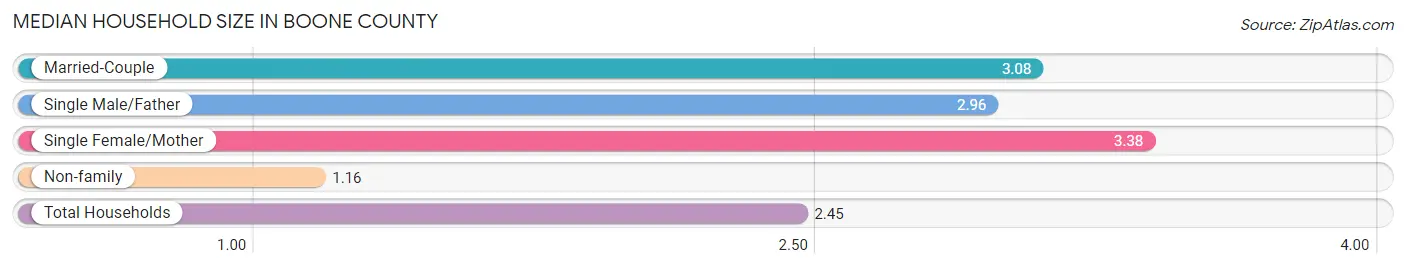
Median Household Size in Boone County
The median household size in Boone County is 2.45 persons per household, with single female/mother households (1,335 | 8.8%) accounting for the largest median household size of 3.38 persons per household. non-family households (5,151 | 34.0%) represent the smallest median household size with 1.16 persons per household.
| Household Type | # Households | Household Size |
| Married-Couple | 8,172 (53.9%) | 3.08 |
| Single Male/Father | 514 (3.4%) | 2.96 |
| Single Female/Mother | 1,335 (8.8%) | 3.38 |
| Non-family | 5,151 (34.0%) | 1.16 |
| Total Households | 15,172 (100.0%) | 2.45 |
Household Size by Marriage Status in Boone County
Out of a total of 15,172 households in Boone County, 10,021 (66.0%) are family households, while 5,151 (34.0%) are nonfamily households. The most numerous type of family households are 2-person households, comprising 4,786, and the most common type of nonfamily households are 1-person households, comprising 4,548.
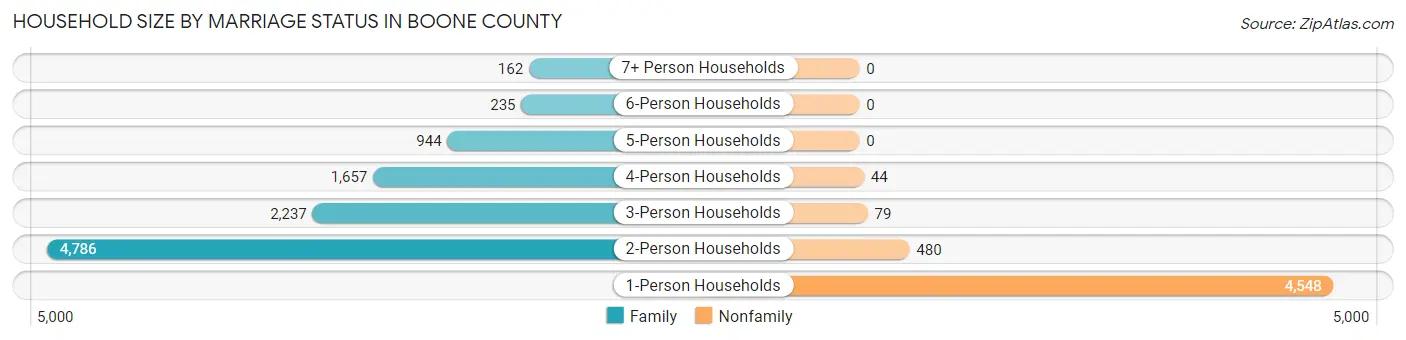
| Household Size | Family Households | Nonfamily Households |
| 1-Person Households | - | 4,548 (30.0%) |
| 2-Person Households | 4,786 (31.5%) | 480 (3.2%) |
| 3-Person Households | 2,237 (14.7%) | 79 (0.5%) |
| 4-Person Households | 1,657 (10.9%) | 44 (0.3%) |
| 5-Person Households | 944 (6.2%) | 0 (0.0%) |
| 6-Person Households | 235 (1.5%) | 0 (0.0%) |
| 7+ Person Households | 162 (1.1%) | 0 (0.0%) |
| Total | 10,021 (66.0%) | 5,151 (34.0%) |
Female Fertility in Boone County
Fertility by Age in Boone County
Average fertility rate in Boone County is 56.0 births per 1,000 women. Women in the age bracket of 20 to 34 years have the highest fertility rate with 109.0 births per 1,000 women. Women in the age bracket of 20 to 34 years acount for 79.1% of all women with births.
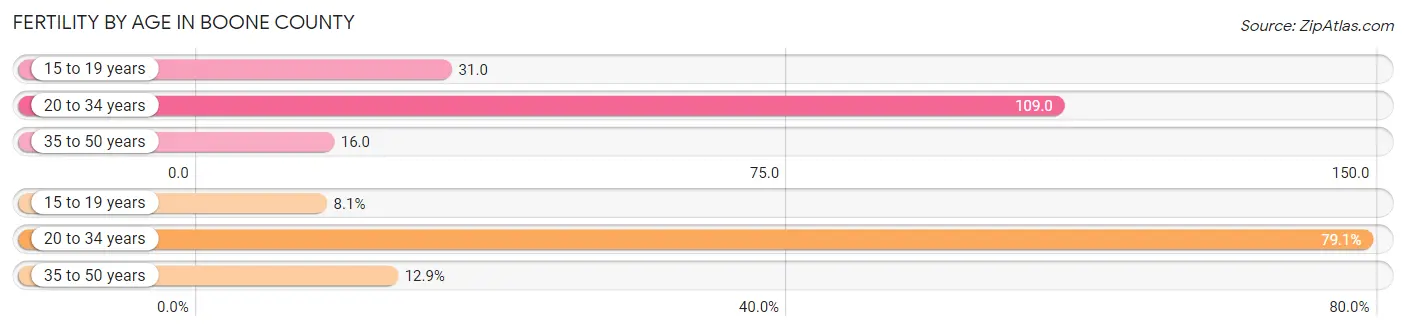
| Age Bracket | Women with Births | Births / 1,000 Women |
| 15 to 19 years | 35 (8.1%) | 31.0 |
| 20 to 34 years | 344 (79.1%) | 109.0 |
| 35 to 50 years | 56 (12.9%) | 16.0 |
| Total | 435 (100.0%) | 56.0 |
Fertility by Age by Marriage Status in Boone County
76.3% of women with births (435) in Boone County are married. The highest percentage of unmarried women with births falls into 15 to 19 years age bracket with 100.0% of them unmarried at the time of birth, while the lowest percentage of unmarried women with births belong to 35 to 50 years age bracket with 0.0% of them unmarried.
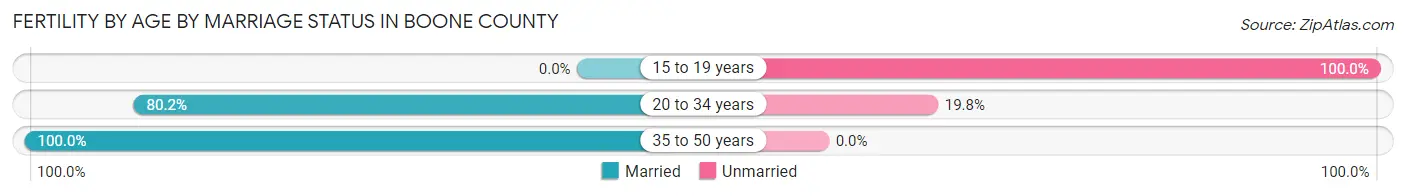
| Age Bracket | Married | Unmarried |
| 15 to 19 years | 0 (0.0%) | 35 (100.0%) |
| 20 to 34 years | 276 (80.2%) | 68 (19.8%) |
| 35 to 50 years | 56 (100.0%) | 0 (0.0%) |
| Total | 332 (76.3%) | 103 (23.7%) |
Fertility by Education in Boone County
Average fertility rate in Boone County is 56.0 births per 1,000 women. Women with the education attainment of high school diploma have the highest fertility rate of 108.0 births per 1,000 women, while women with the education attainment of less than high school have the lowest fertility at 10.0 births per 1,000 women. Women with the education attainment of high school diploma represent 53.6% of all women with births.
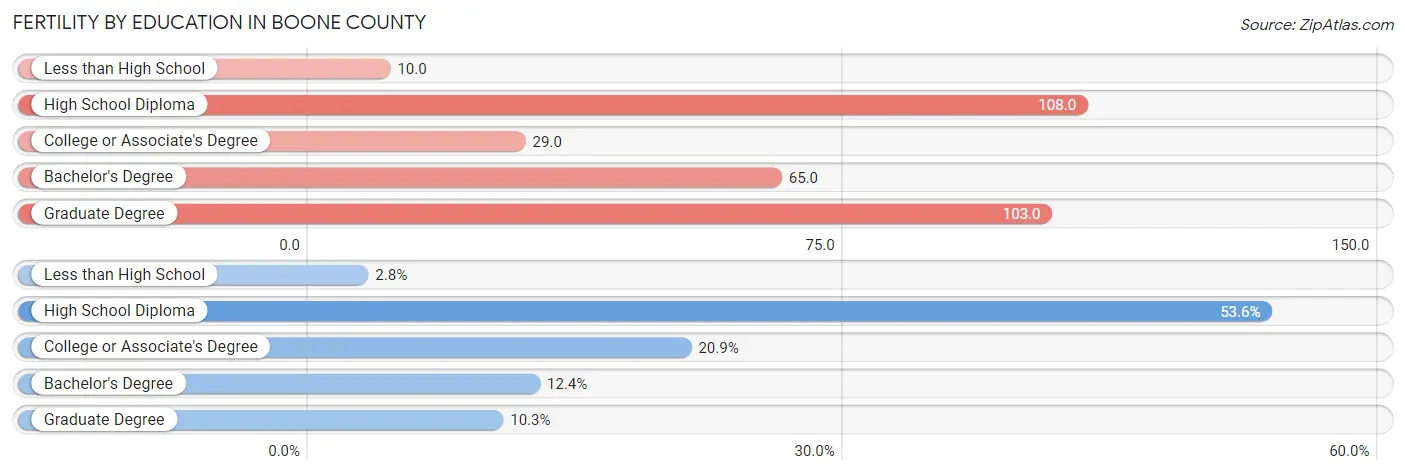
| Educational Attainment | Women with Births | Births / 1,000 Women |
| Less than High School | 12 (2.8%) | 10.0 |
| High School Diploma | 233 (53.6%) | 108.0 |
| College or Associate's Degree | 91 (20.9%) | 29.0 |
| Bachelor's Degree | 54 (12.4%) | 65.0 |
| Graduate Degree | 45 (10.3%) | 103.0 |
| Total | 435 (100.0%) | 56.0 |
Fertility by Education by Marriage Status in Boone County
23.7% of women with births in Boone County are unmarried. Women with the educational attainment of bachelor's degree are most likely to be married with 100.0% of them married at childbirth, while women with the educational attainment of less than high school are least likely to be married with 75.0% of them unmarried at childbirth.
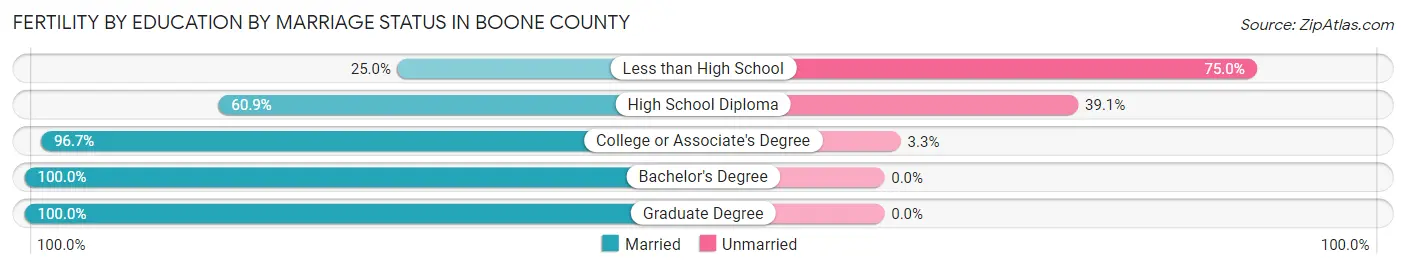
| Educational Attainment | Married | Unmarried |
| Less than High School | 3 (25.0%) | 9 (75.0%) |
| High School Diploma | 142 (60.9%) | 91 (39.1%) |
| College or Associate's Degree | 88 (96.7%) | 3 (3.3%) |
| Bachelor's Degree | 54 (100.0%) | 0 (0.0%) |
| Graduate Degree | 45 (100.0%) | 0 (0.0%) |
| Total | 332 (76.3%) | 103 (23.7%) |
Employment Characteristics in Boone County
Employment by Class of Employer in Boone County
Among the 15,850 employed individuals in Boone County, private company employees (10,262 | 64.7%), not-for-profit organizations (1,458 | 9.2%), and self-employed (not incorporated) (1,051 | 6.6%) make up the most common classes of employment.
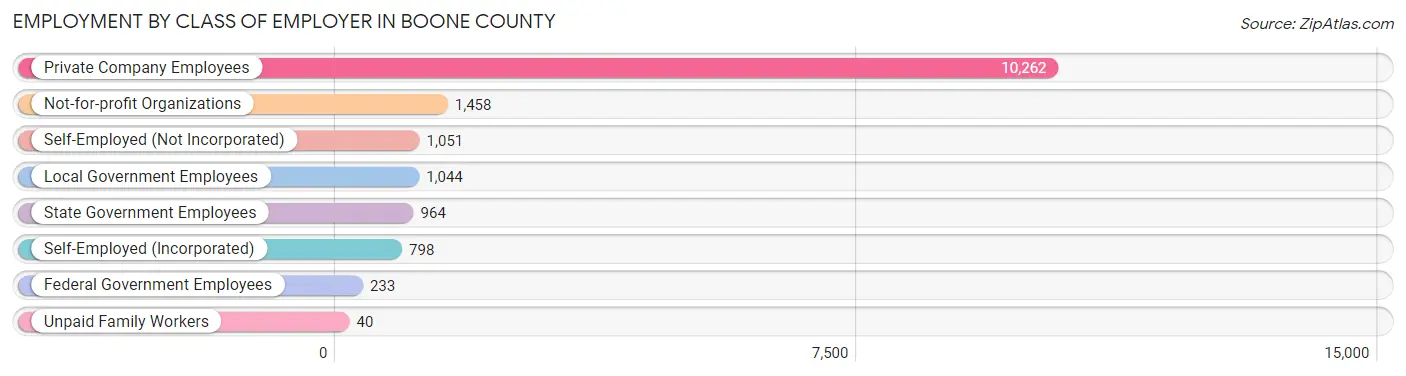
| Employer Class | # Employees | % Employees |
| Private Company Employees | 10,262 | 64.7% |
| Self-Employed (Incorporated) | 798 | 5.0% |
| Self-Employed (Not Incorporated) | 1,051 | 6.6% |
| Not-for-profit Organizations | 1,458 | 9.2% |
| Local Government Employees | 1,044 | 6.6% |
| State Government Employees | 964 | 6.1% |
| Federal Government Employees | 233 | 1.5% |
| Unpaid Family Workers | 40 | 0.3% |
| Total | 15,850 | 100.0% |
Employment Status by Age in Boone County
According to the labor force statistics for Boone County, out of the total population over 16 years of age (29,957), 56.7% or 16,986 individuals are in the labor force, with 4.4% or 747 of them unemployed. The age group with the highest labor force participation rate is 30 to 34 years, with 81.1% or 1,717 individuals in the labor force. Within the labor force, the 16 to 19 years age range has the highest percentage of unemployed individuals, with 14.0% or 97 of them being unemployed.
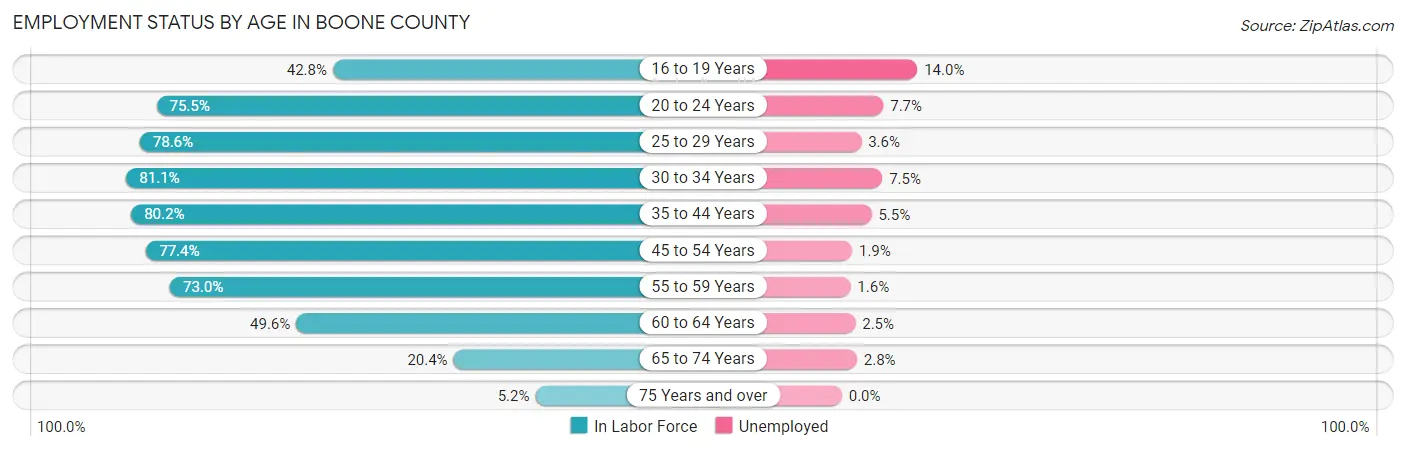
| Age Bracket | In Labor Force | Unemployed |
| 16 to 19 Years | 693 (42.8%) | 97 (14.0%) |
| 20 to 24 Years | 1,568 (75.5%) | 121 (7.7%) |
| 25 to 29 Years | 1,763 (78.6%) | 63 (3.6%) |
| 30 to 34 Years | 1,717 (81.1%) | 129 (7.5%) |
| 35 to 44 Years | 3,448 (80.2%) | 190 (5.5%) |
| 45 to 54 Years | 3,628 (77.4%) | 69 (1.9%) |
| 55 to 59 Years | 1,723 (73.0%) | 28 (1.6%) |
| 60 to 64 Years | 1,342 (49.6%) | 34 (2.5%) |
| 65 to 74 Years | 922 (20.4%) | 26 (2.8%) |
| 75 Years and over | 173 (5.2%) | 0 (0.0%) |
| Total | 16,986 (56.7%) | 747 (4.4%) |
Employment Status by Educational Attainment in Boone County
According to labor force statistics for Boone County, 74.0% of individuals (13,624) out of the total population between 25 and 64 years of age (18,411) are in the labor force, with 3.7% or 504 of them being unemployed. The group with the highest labor force participation rate are those with the educational attainment of bachelor's degree or higher, with 82.0% or 2,583 individuals in the labor force. Within the labor force, individuals with less than high school education have the highest percentage of unemployment, with 12.4% or 99 of them being unemployed.
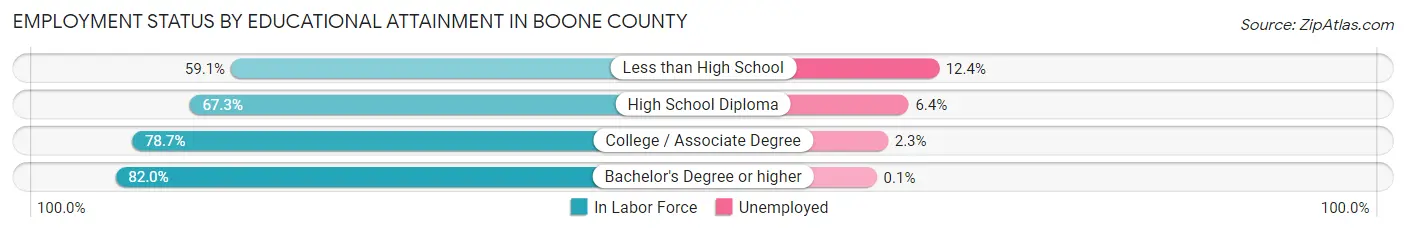
| Educational Attainment | In Labor Force | Unemployed |
| Less than High School | 798 (59.1%) | 168 (12.4%) |
| High School Diploma | 4,194 (67.3%) | 399 (6.4%) |
| College / Associate Degree | 6,043 (78.7%) | 177 (2.3%) |
| Bachelor's Degree or higher | 2,583 (82.0%) | 3 (0.1%) |
| Total | 13,624 (74.0%) | 681 (3.7%) |
Employment Occupations by Sex in Boone County
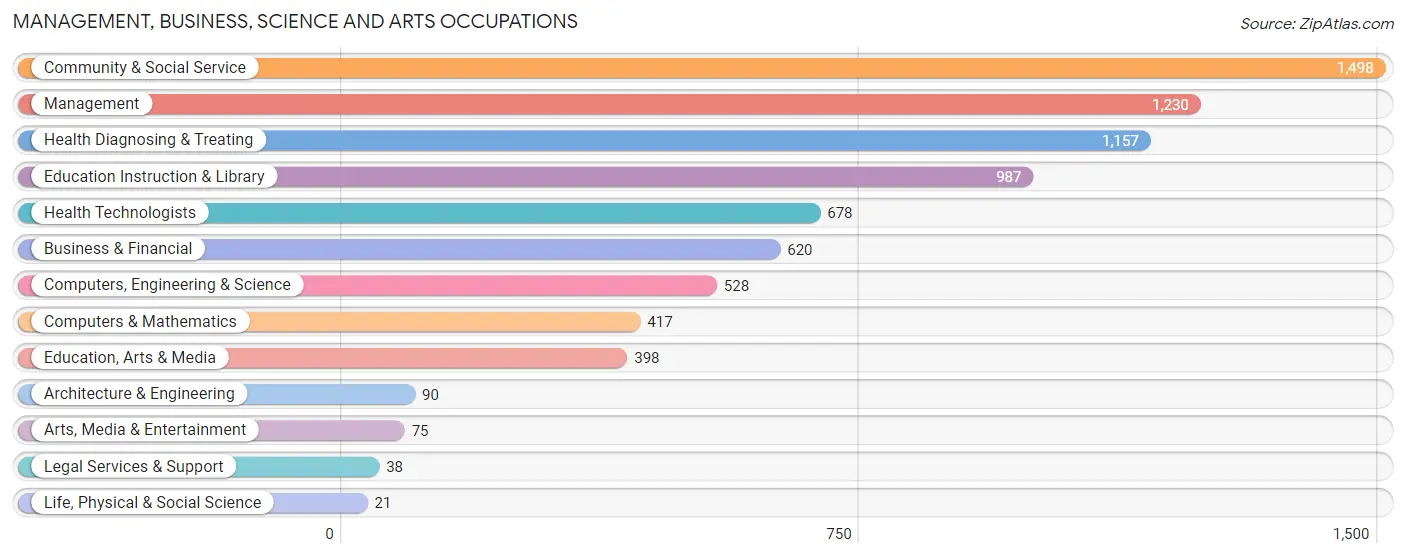
Management, Business, Science and Arts Occupations
The most common Management, Business, Science and Arts occupations in Boone County are Community & Social Service (1,498 | 9.2%), Management (1,230 | 7.6%), Health Diagnosing & Treating (1,157 | 7.1%), Education Instruction & Library (987 | 6.1%), and Health Technologists (678 | 4.2%).
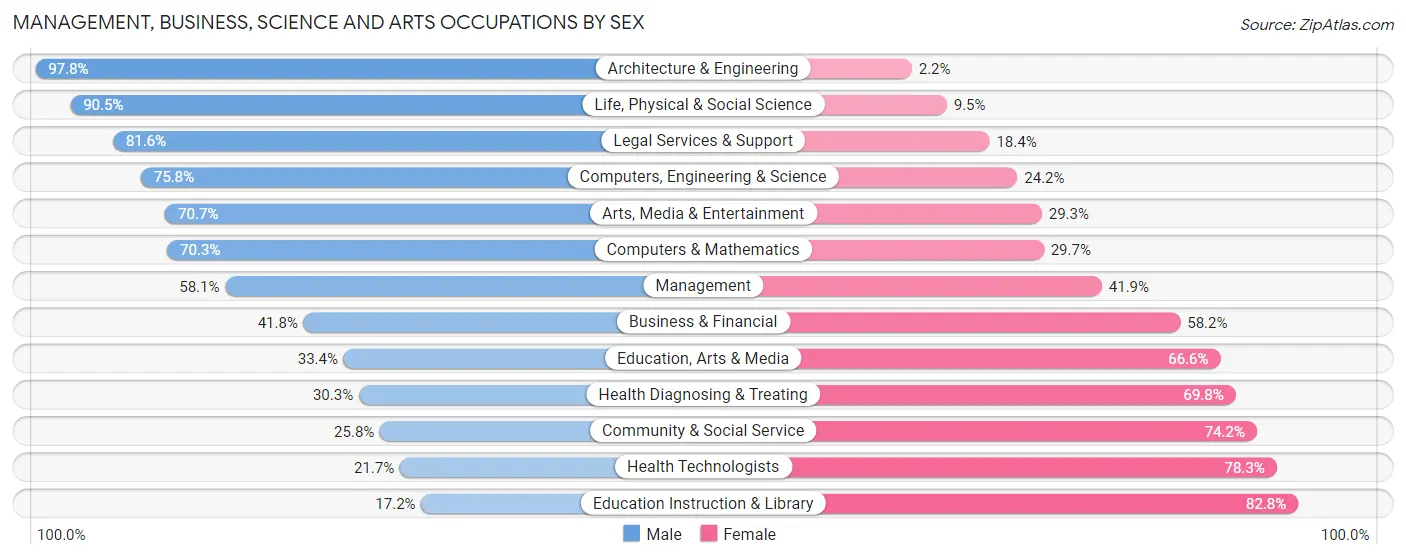
Management, Business, Science and Arts Occupations by Sex
Within the Management, Business, Science and Arts occupations in Boone County, the most male-oriented occupations are Architecture & Engineering (97.8%), Life, Physical & Social Science (90.5%), and Legal Services & Support (81.6%), while the most female-oriented occupations are Education Instruction & Library (82.8%), Health Technologists (78.3%), and Community & Social Service (74.2%).
| Occupation | Male | Female |
| Management | 715 (58.1%) | 515 (41.9%) |
| Business & Financial | 259 (41.8%) | 361 (58.2%) |
| Computers, Engineering & Science | 400 (75.8%) | 128 (24.2%) |
| Computers & Mathematics | 293 (70.3%) | 124 (29.7%) |
| Architecture & Engineering | 88 (97.8%) | 2 (2.2%) |
| Life, Physical & Social Science | 19 (90.5%) | 2 (9.5%) |
| Community & Social Service | 387 (25.8%) | 1,111 (74.2%) |
| Education, Arts & Media | 133 (33.4%) | 265 (66.6%) |
| Legal Services & Support | 31 (81.6%) | 7 (18.4%) |
| Education Instruction & Library | 170 (17.2%) | 817 (82.8%) |
| Arts, Media & Entertainment | 53 (70.7%) | 22 (29.3%) |
| Health Diagnosing & Treating | 350 (30.2%) | 807 (69.8%) |
| Health Technologists | 147 (21.7%) | 531 (78.3%) |
| Total (Category) | 2,111 (41.9%) | 2,922 (58.1%) |
| Total (Overall) | 8,465 (52.2%) | 7,759 (47.8%) |
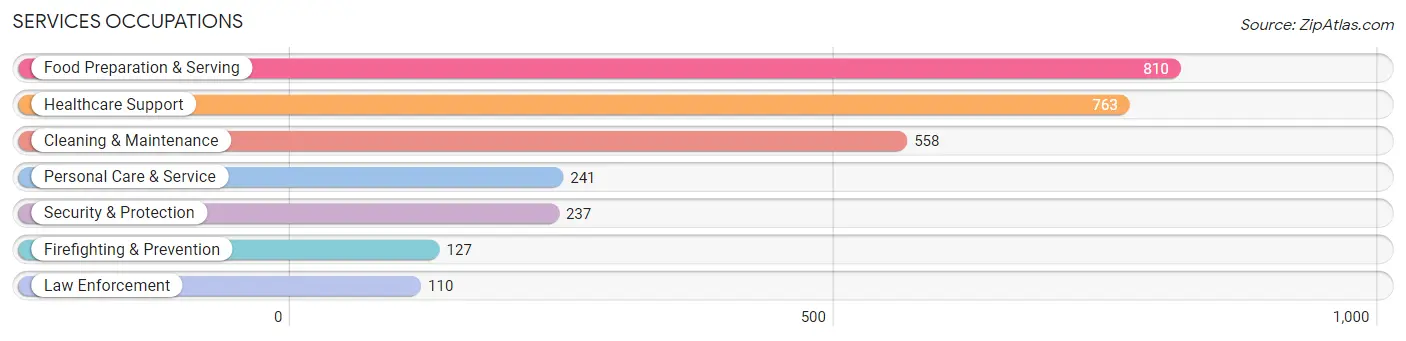
Services Occupations
The most common Services occupations in Boone County are Food Preparation & Serving (810 | 5.0%), Healthcare Support (763 | 4.7%), Cleaning & Maintenance (558 | 3.4%), Personal Care & Service (241 | 1.5%), and Security & Protection (237 | 1.5%).
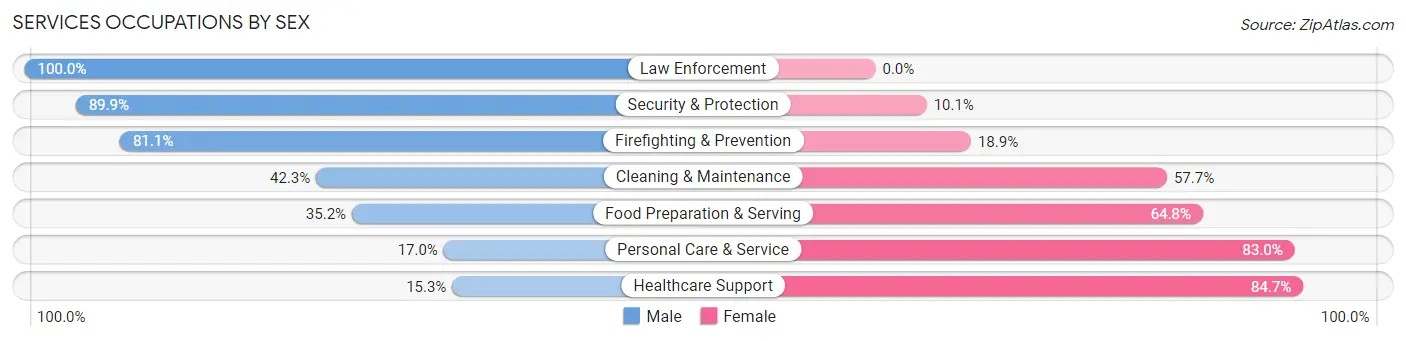
Services Occupations by Sex
Within the Services occupations in Boone County, the most male-oriented occupations are Law Enforcement (100.0%), Security & Protection (89.9%), and Firefighting & Prevention (81.1%), while the most female-oriented occupations are Healthcare Support (84.7%), Personal Care & Service (83.0%), and Food Preparation & Serving (64.8%).
| Occupation | Male | Female |
| Healthcare Support | 117 (15.3%) | 646 (84.7%) |
| Security & Protection | 213 (89.9%) | 24 (10.1%) |
| Firefighting & Prevention | 103 (81.1%) | 24 (18.9%) |
| Law Enforcement | 110 (100.0%) | 0 (0.0%) |
| Food Preparation & Serving | 285 (35.2%) | 525 (64.8%) |
| Cleaning & Maintenance | 236 (42.3%) | 322 (57.7%) |
| Personal Care & Service | 41 (17.0%) | 200 (83.0%) |
| Total (Category) | 892 (34.2%) | 1,717 (65.8%) |
| Total (Overall) | 8,465 (52.2%) | 7,759 (47.8%) |
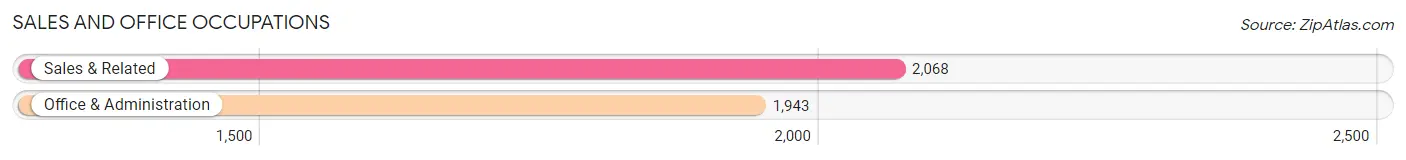
Sales and Office Occupations
The most common Sales and Office occupations in Boone County are Sales & Related (2,068 | 12.8%), and Office & Administration (1,943 | 12.0%).
Sales and Office Occupations by Sex
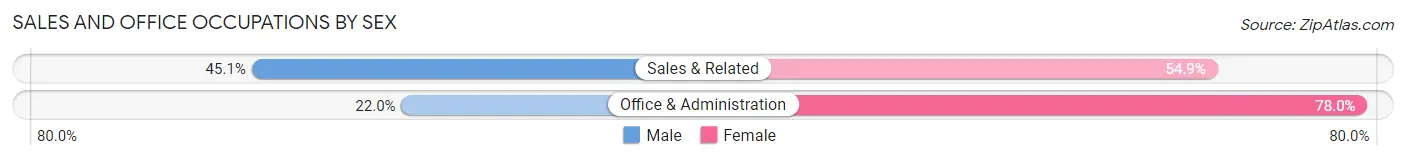
| Occupation | Male | Female |
| Sales & Related | 932 (45.1%) | 1,136 (54.9%) |
| Office & Administration | 428 (22.0%) | 1,515 (78.0%) |
| Total (Category) | 1,360 (33.9%) | 2,651 (66.1%) |
| Total (Overall) | 8,465 (52.2%) | 7,759 (47.8%) |
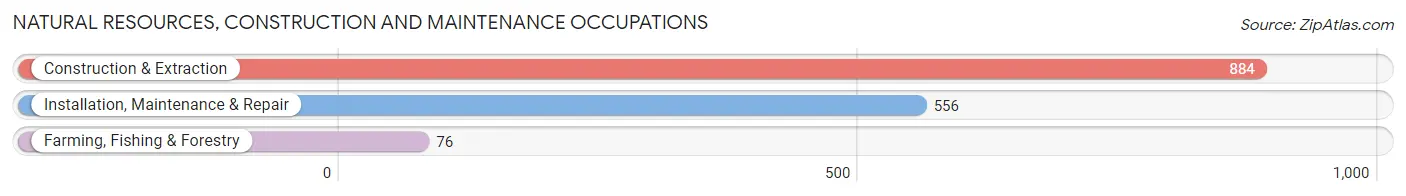
Natural Resources, Construction and Maintenance Occupations
The most common Natural Resources, Construction and Maintenance occupations in Boone County are Construction & Extraction (884 | 5.4%), Installation, Maintenance & Repair (556 | 3.4%), and Farming, Fishing & Forestry (76 | 0.5%).
Natural Resources, Construction and Maintenance Occupations by Sex
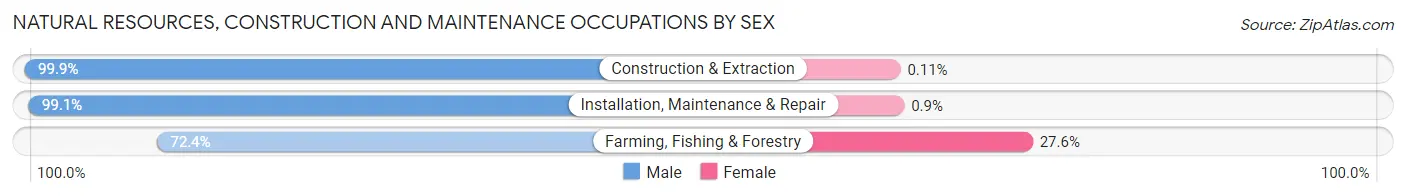
| Occupation | Male | Female |
| Farming, Fishing & Forestry | 55 (72.4%) | 21 (27.6%) |
| Construction & Extraction | 883 (99.9%) | 1 (0.1%) |
| Installation, Maintenance & Repair | 551 (99.1%) | 5 (0.9%) |
| Total (Category) | 1,489 (98.2%) | 27 (1.8%) |
| Total (Overall) | 8,465 (52.2%) | 7,759 (47.8%) |
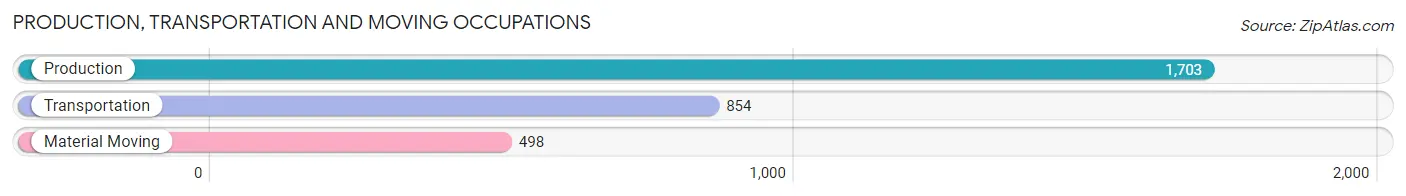
Production, Transportation and Moving Occupations
The most common Production, Transportation and Moving occupations in Boone County are Production (1,703 | 10.5%), Transportation (854 | 5.3%), and Material Moving (498 | 3.1%).
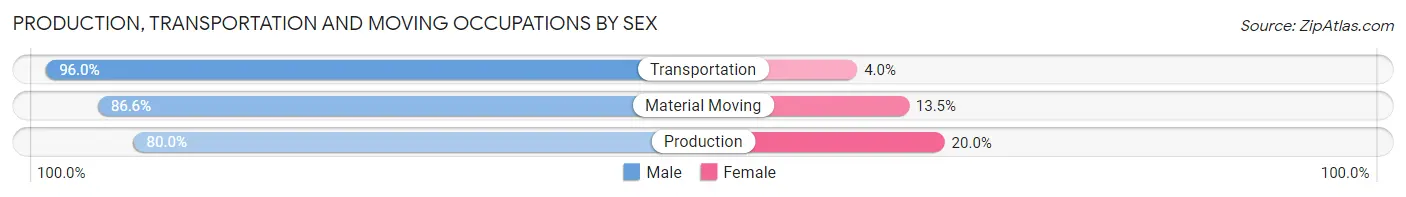
Production, Transportation and Moving Occupations by Sex
| Occupation | Male | Female |
| Production | 1,362 (80.0%) | 341 (20.0%) |
| Transportation | 820 (96.0%) | 34 (4.0%) |
| Material Moving | 431 (86.6%) | 67 (13.5%) |
| Total (Category) | 2,613 (85.5%) | 442 (14.5%) |
| Total (Overall) | 8,465 (52.2%) | 7,759 (47.8%) |
Employment Industries by Sex in Boone County
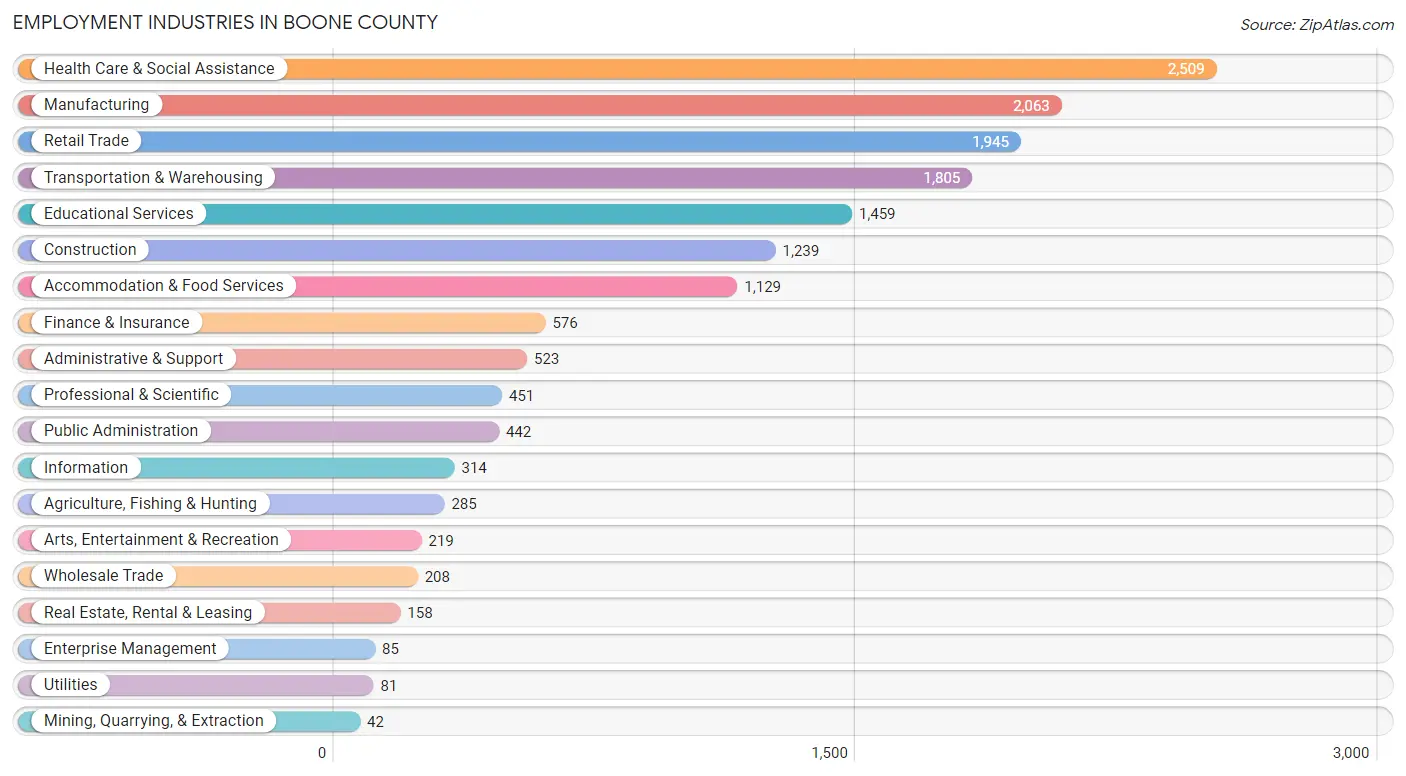
Employment Industries in Boone County
The major employment industries in Boone County include Health Care & Social Assistance (2,509 | 15.5%), Manufacturing (2,063 | 12.7%), Retail Trade (1,945 | 12.0%), Transportation & Warehousing (1,805 | 11.1%), and Educational Services (1,459 | 9.0%).
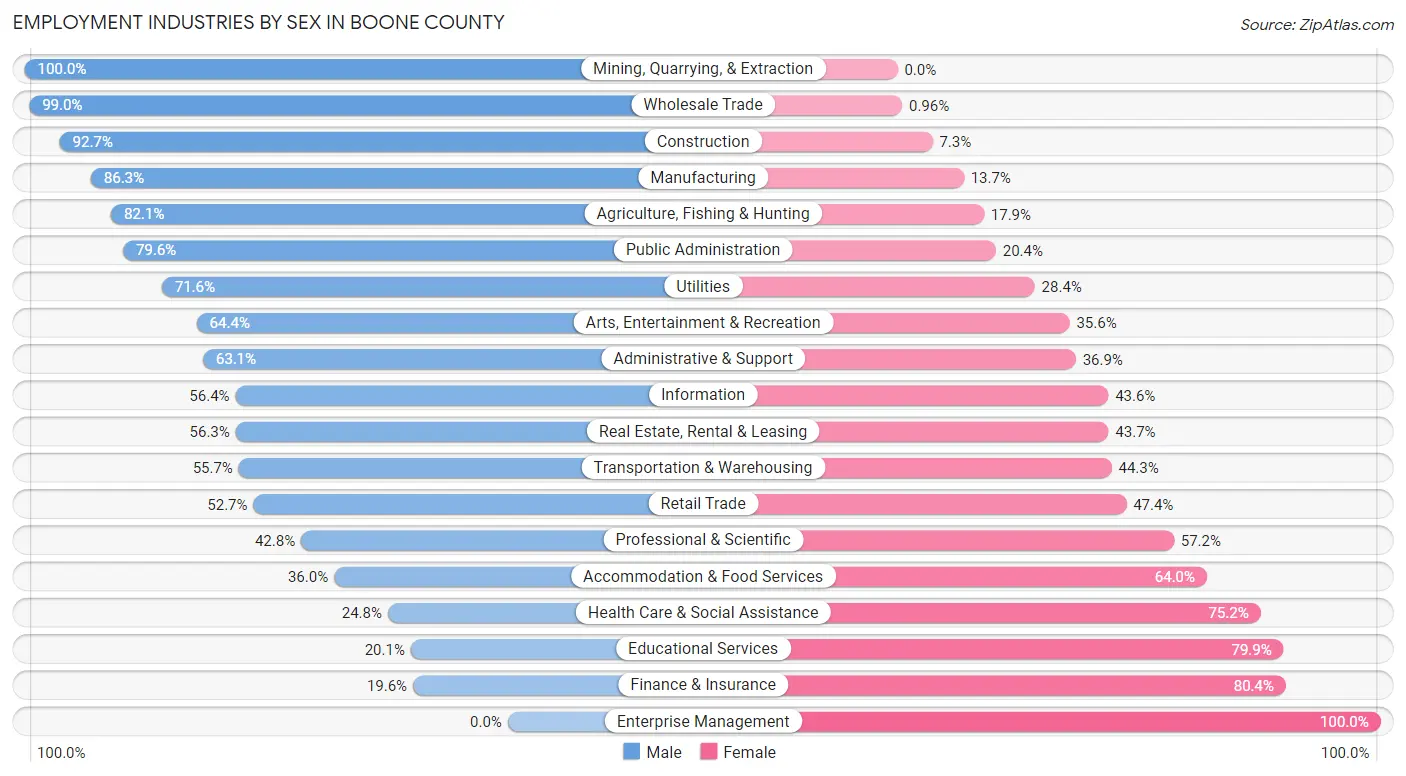
Employment Industries by Sex in Boone County
The Boone County industries that see more men than women are Mining, Quarrying, & Extraction (100.0%), Wholesale Trade (99.0%), and Construction (92.7%), whereas the industries that tend to have a higher number of women are Enterprise Management (100.0%), Finance & Insurance (80.4%), and Educational Services (79.9%).
| Industry | Male | Female |
| Agriculture, Fishing & Hunting | 234 (82.1%) | 51 (17.9%) |
| Mining, Quarrying, & Extraction | 42 (100.0%) | 0 (0.0%) |
| Construction | 1,149 (92.7%) | 90 (7.3%) |
| Manufacturing | 1,780 (86.3%) | 283 (13.7%) |
| Wholesale Trade | 206 (99.0%) | 2 (1.0%) |
| Retail Trade | 1,024 (52.6%) | 921 (47.3%) |
| Transportation & Warehousing | 1,005 (55.7%) | 800 (44.3%) |
| Utilities | 58 (71.6%) | 23 (28.4%) |
| Information | 177 (56.4%) | 137 (43.6%) |
| Finance & Insurance | 113 (19.6%) | 463 (80.4%) |
| Real Estate, Rental & Leasing | 89 (56.3%) | 69 (43.7%) |
| Professional & Scientific | 193 (42.8%) | 258 (57.2%) |
| Enterprise Management | 0 (0.0%) | 85 (100.0%) |
| Administrative & Support | 330 (63.1%) | 193 (36.9%) |
| Educational Services | 293 (20.1%) | 1,166 (79.9%) |
| Health Care & Social Assistance | 623 (24.8%) | 1,886 (75.2%) |
| Arts, Entertainment & Recreation | 141 (64.4%) | 78 (35.6%) |
| Accommodation & Food Services | 406 (36.0%) | 723 (64.0%) |
| Public Administration | 352 (79.6%) | 90 (20.4%) |
| Total | 8,465 (52.2%) | 7,759 (47.8%) |
Education in Boone County
School Enrollment in Boone County
The most common levels of schooling among the 7,759 students in Boone County are elementary school (2,125 | 27.4%), high school (1,875 | 24.2%), and middle school (1,837 | 23.7%).
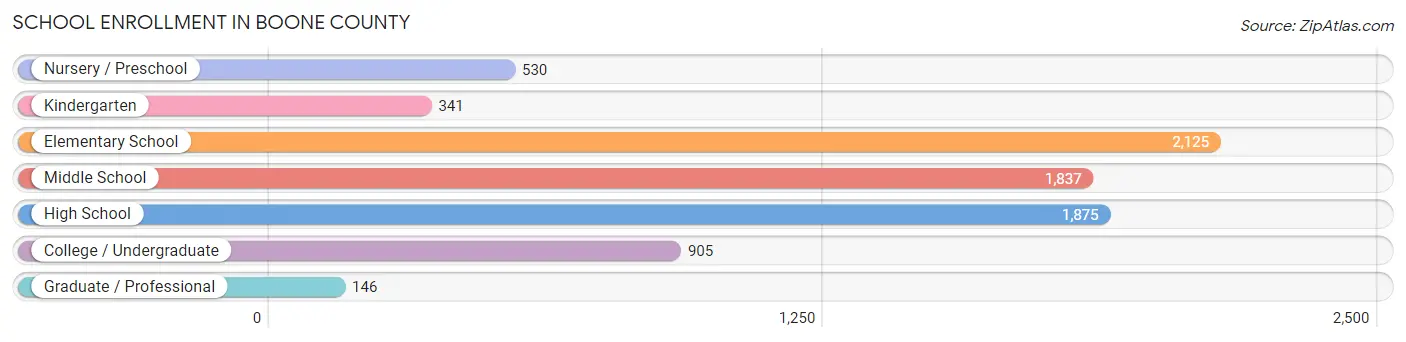
| School Level | # Students | % Students |
| Nursery / Preschool | 530 | 6.8% |
| Kindergarten | 341 | 4.4% |
| Elementary School | 2,125 | 27.4% |
| Middle School | 1,837 | 23.7% |
| High School | 1,875 | 24.2% |
| College / Undergraduate | 905 | 11.7% |
| Graduate / Professional | 146 | 1.9% |
| Total | 7,759 | 100.0% |
School Enrollment by Age by Funding Source in Boone County
Out of a total of 7,759 students who are enrolled in schools in Boone County, 590 (7.6%) attend a private institution, while the remaining 7,169 (92.4%) are enrolled in public schools. The age group of 35 years and over has the highest likelihood of being enrolled in private schools, with 43 (16.7% in the age bracket) enrolled. Conversely, the age group of 18 to 19 year olds has the lowest likelihood of being enrolled in a private school, with 424 (99.8% in the age bracket) attending a public institution.
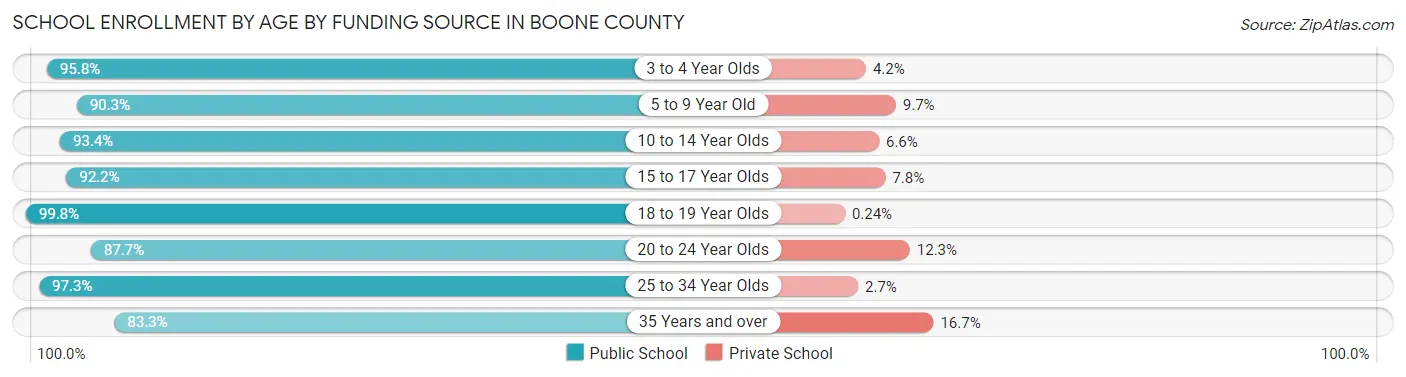
| Age Bracket | Public School | Private School |
| 3 to 4 Year Olds | 346 (95.8%) | 15 (4.2%) |
| 5 to 9 Year Old | 2,164 (90.3%) | 233 (9.7%) |
| 10 to 14 Year Olds | 2,071 (93.4%) | 146 (6.6%) |
| 15 to 17 Year Olds | 1,352 (92.2%) | 114 (7.8%) |
| 18 to 19 Year Olds | 424 (99.8%) | 1 (0.2%) |
| 20 to 24 Year Olds | 199 (87.7%) | 28 (12.3%) |
| 25 to 34 Year Olds | 398 (97.3%) | 11 (2.7%) |
| 35 Years and over | 214 (83.3%) | 43 (16.7%) |
| Total | 7,169 (92.4%) | 590 (7.6%) |
Educational Attainment by Field of Study in Boone County
Business (1,100 | 23.3%), education (759 | 16.1%), science & technology (410 | 8.7%), bio, nature & agricultural (406 | 8.6%), and psychology (358 | 7.6%) are the most common fields of study among 4,722 individuals in Boone County who have obtained a bachelor's degree or higher.
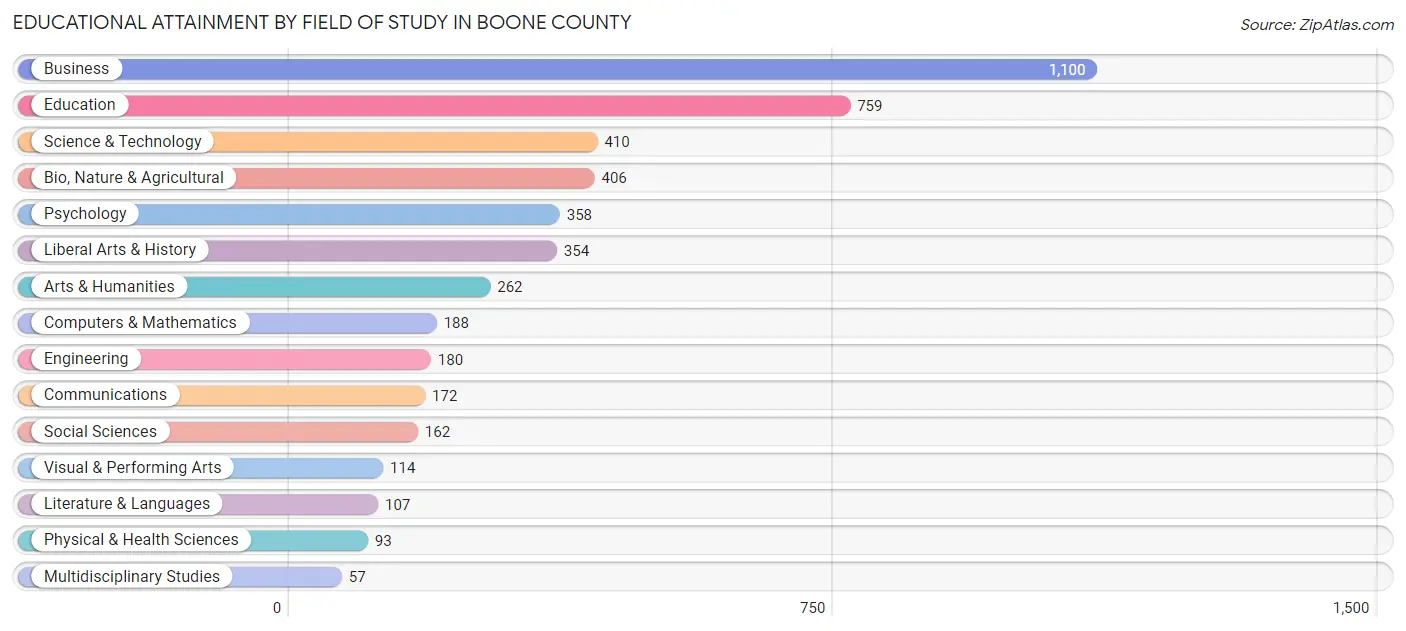
| Field of Study | # Graduates | % Graduates |
| Computers & Mathematics | 188 | 4.0% |
| Bio, Nature & Agricultural | 406 | 8.6% |
| Physical & Health Sciences | 93 | 2.0% |
| Psychology | 358 | 7.6% |
| Social Sciences | 162 | 3.4% |
| Engineering | 180 | 3.8% |
| Multidisciplinary Studies | 57 | 1.2% |
| Science & Technology | 410 | 8.7% |
| Business | 1,100 | 23.3% |
| Education | 759 | 16.1% |
| Literature & Languages | 107 | 2.3% |
| Liberal Arts & History | 354 | 7.5% |
| Visual & Performing Arts | 114 | 2.4% |
| Communications | 172 | 3.6% |
| Arts & Humanities | 262 | 5.6% |
| Total | 4,722 | 100.0% |
Transportation & Commute in Boone County
Vehicle Availability by Sex in Boone County
The most prevalent vehicle ownership categories in Boone County are males with 2 vehicles (3,440, accounting for 41.5%) and females with 2 vehicles (2,836, making up 45.9%).
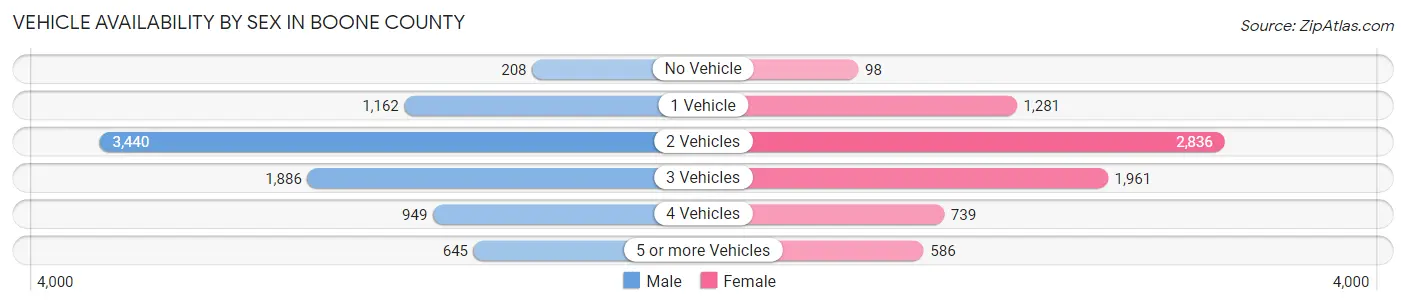
| Vehicles Available | Male | Female |
| No Vehicle | 208 (2.5%) | 98 (1.3%) |
| 1 Vehicle | 1,162 (14.0%) | 1,281 (17.1%) |
| 2 Vehicles | 3,440 (41.5%) | 2,836 (37.8%) |
| 3 Vehicles | 1,886 (22.8%) | 1,961 (26.1%) |
| 4 Vehicles | 949 (11.5%) | 739 (9.9%) |
| 5 or more Vehicles | 645 (7.8%) | 586 (7.8%) |
| Total | 8,290 (100.0%) | 7,501 (100.0%) |
Commute Time in Boone County
The most frequently occuring commute durations in Boone County are 10 to 14 minutes (3,166 commuters, 21.8%), 5 to 9 minutes (2,747 commuters, 18.9%), and 15 to 19 minutes (2,294 commuters, 15.8%).
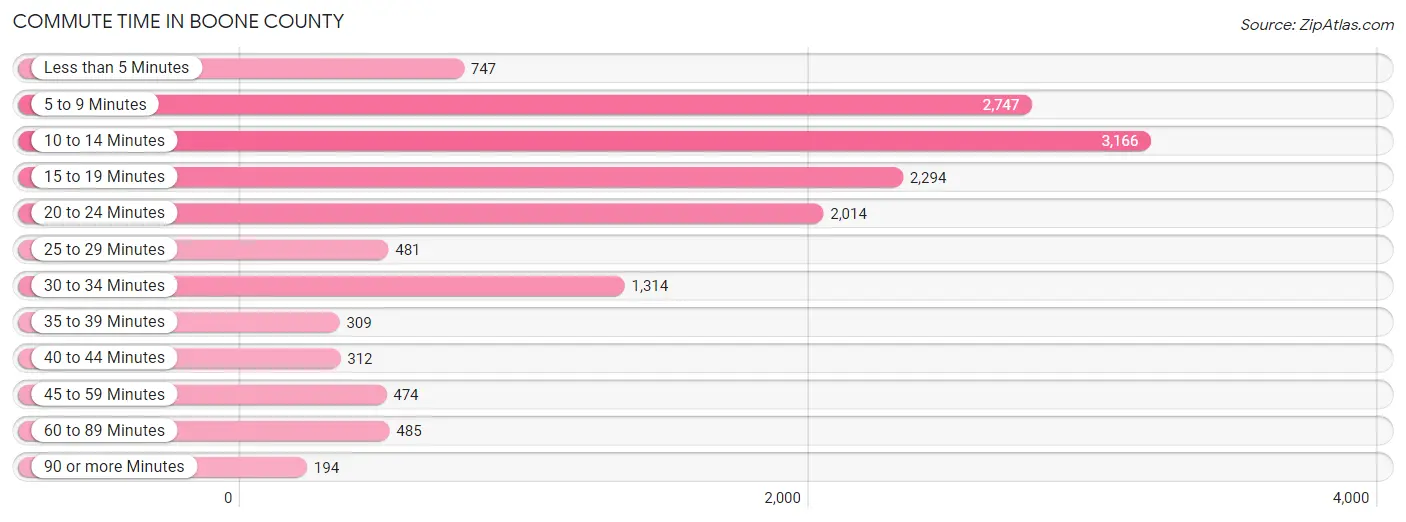
| Commute Time | # Commuters | % Commuters |
| Less than 5 Minutes | 747 | 5.1% |
| 5 to 9 Minutes | 2,747 | 18.9% |
| 10 to 14 Minutes | 3,166 | 21.8% |
| 15 to 19 Minutes | 2,294 | 15.8% |
| 20 to 24 Minutes | 2,014 | 13.9% |
| 25 to 29 Minutes | 481 | 3.3% |
| 30 to 34 Minutes | 1,314 | 9.0% |
| 35 to 39 Minutes | 309 | 2.1% |
| 40 to 44 Minutes | 312 | 2.1% |
| 45 to 59 Minutes | 474 | 3.3% |
| 60 to 89 Minutes | 485 | 3.3% |
| 90 or more Minutes | 194 | 1.3% |
Commute Time by Sex in Boone County
The most common commute times in Boone County are 5 to 9 minutes (1,608 commuters, 21.4%) for males and 10 to 14 minutes (1,964 commuters, 27.9%) for females.
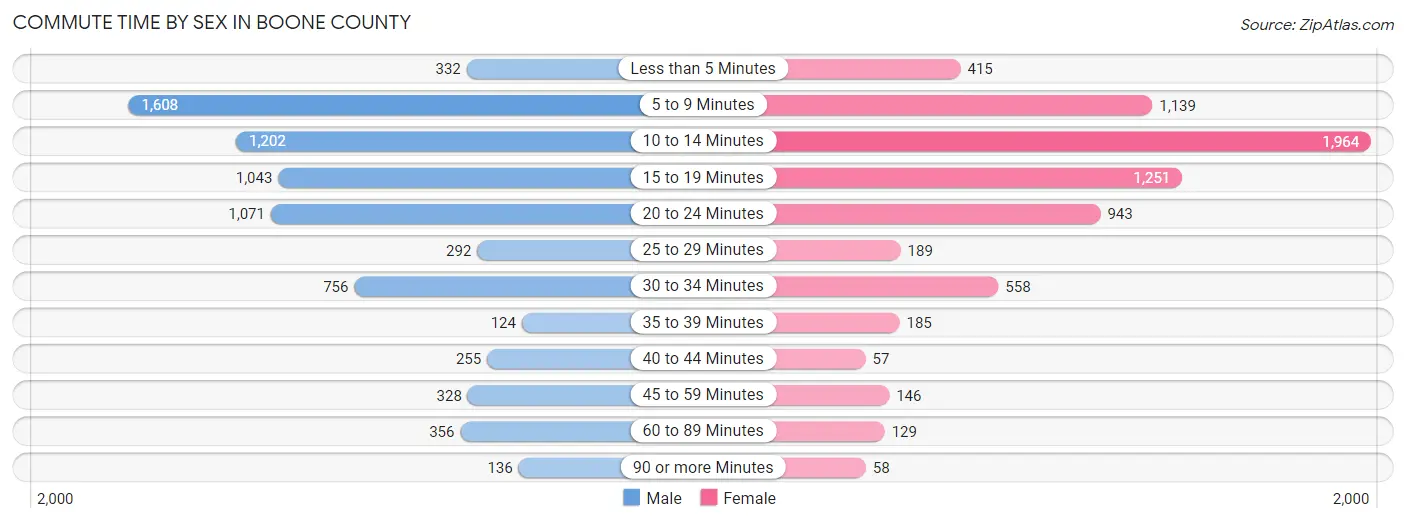
| Commute Time | Male | Female |
| Less than 5 Minutes | 332 (4.4%) | 415 (5.9%) |
| 5 to 9 Minutes | 1,608 (21.4%) | 1,139 (16.2%) |
| 10 to 14 Minutes | 1,202 (16.0%) | 1,964 (27.9%) |
| 15 to 19 Minutes | 1,043 (13.9%) | 1,251 (17.8%) |
| 20 to 24 Minutes | 1,071 (14.3%) | 943 (13.4%) |
| 25 to 29 Minutes | 292 (3.9%) | 189 (2.7%) |
| 30 to 34 Minutes | 756 (10.1%) | 558 (7.9%) |
| 35 to 39 Minutes | 124 (1.7%) | 185 (2.6%) |
| 40 to 44 Minutes | 255 (3.4%) | 57 (0.8%) |
| 45 to 59 Minutes | 328 (4.4%) | 146 (2.1%) |
| 60 to 89 Minutes | 356 (4.7%) | 129 (1.8%) |
| 90 or more Minutes | 136 (1.8%) | 58 (0.8%) |
Time of Departure to Work by Sex in Boone County
The most frequent times of departure to work in Boone County are 7:30 AM to 7:59 AM (1,245, 16.6%) for males and 7:30 AM to 7:59 AM (1,963, 27.9%) for females.
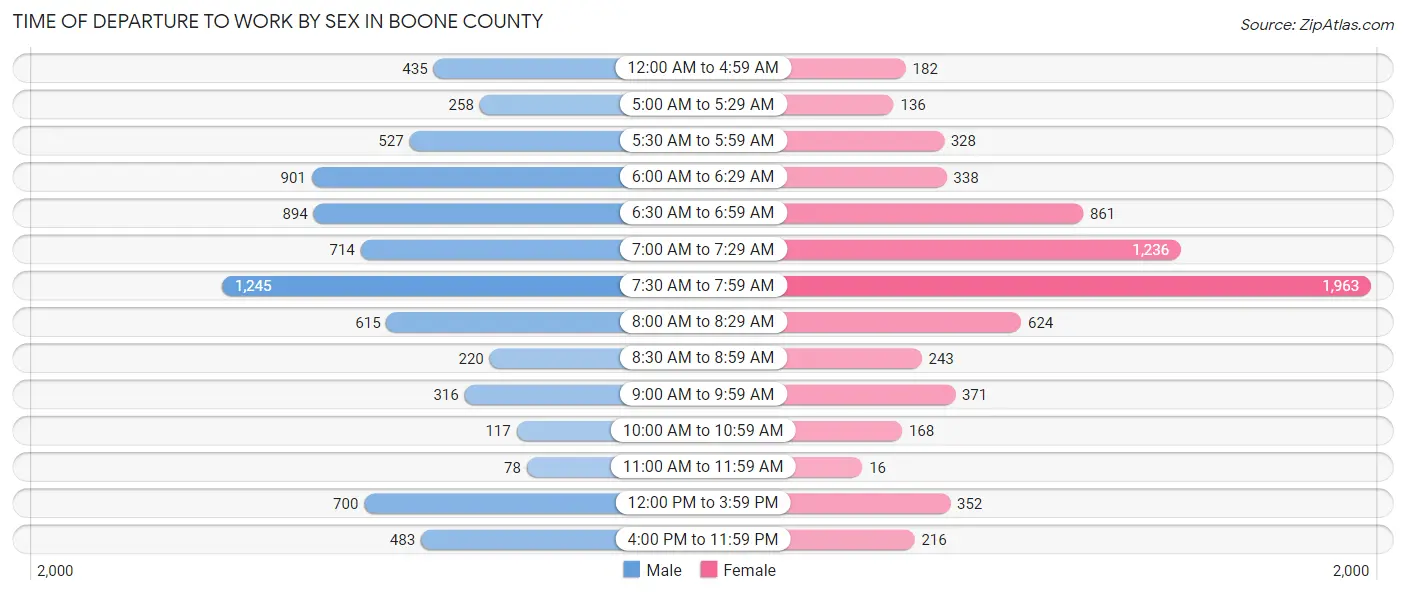
| Time of Departure | Male | Female |
| 12:00 AM to 4:59 AM | 435 (5.8%) | 182 (2.6%) |
| 5:00 AM to 5:29 AM | 258 (3.4%) | 136 (1.9%) |
| 5:30 AM to 5:59 AM | 527 (7.0%) | 328 (4.7%) |
| 6:00 AM to 6:29 AM | 901 (12.0%) | 338 (4.8%) |
| 6:30 AM to 6:59 AM | 894 (11.9%) | 861 (12.2%) |
| 7:00 AM to 7:29 AM | 714 (9.5%) | 1,236 (17.6%) |
| 7:30 AM to 7:59 AM | 1,245 (16.6%) | 1,963 (27.9%) |
| 8:00 AM to 8:29 AM | 615 (8.2%) | 624 (8.9%) |
| 8:30 AM to 8:59 AM | 220 (2.9%) | 243 (3.5%) |
| 9:00 AM to 9:59 AM | 316 (4.2%) | 371 (5.3%) |
| 10:00 AM to 10:59 AM | 117 (1.6%) | 168 (2.4%) |
| 11:00 AM to 11:59 AM | 78 (1.0%) | 16 (0.2%) |
| 12:00 PM to 3:59 PM | 700 (9.3%) | 352 (5.0%) |
| 4:00 PM to 11:59 PM | 483 (6.4%) | 216 (3.1%) |
| Total | 7,503 (100.0%) | 7,034 (100.0%) |
Housing Occupancy in Boone County
Occupancy by Ownership in Boone County
Of the total 15,172 dwellings in Boone County, owner-occupied units account for 10,640 (70.1%), while renter-occupied units make up 4,532 (29.9%).
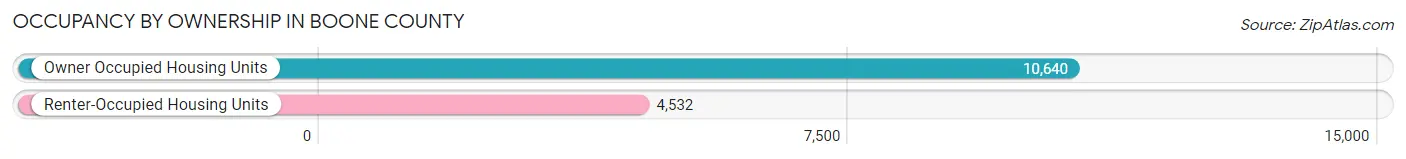
| Occupancy | # Housing Units | % Housing Units |
| Owner Occupied Housing Units | 10,640 | 70.1% |
| Renter-Occupied Housing Units | 4,532 | 29.9% |
| Total Occupied Housing Units | 15,172 | 100.0% |
Occupancy by Household Size in Boone County
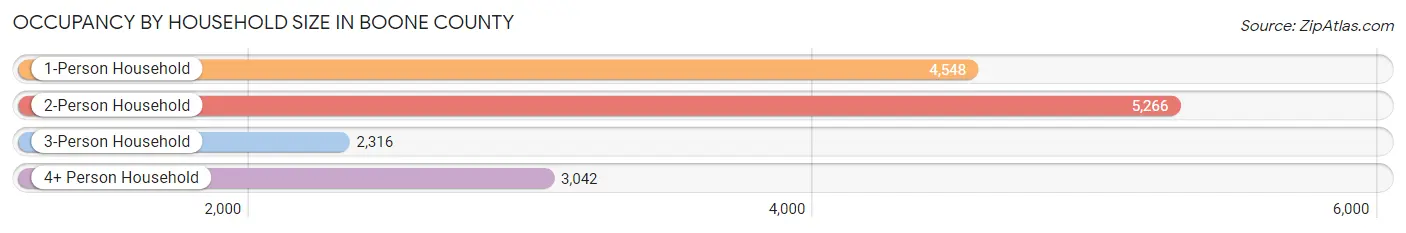
| Household Size | # Housing Units | % Housing Units |
| 1-Person Household | 4,548 | 30.0% |
| 2-Person Household | 5,266 | 34.7% |
| 3-Person Household | 2,316 | 15.3% |
| 4+ Person Household | 3,042 | 20.1% |
| Total Housing Units | 15,172 | 100.0% |
Occupancy by Ownership by Household Size in Boone County
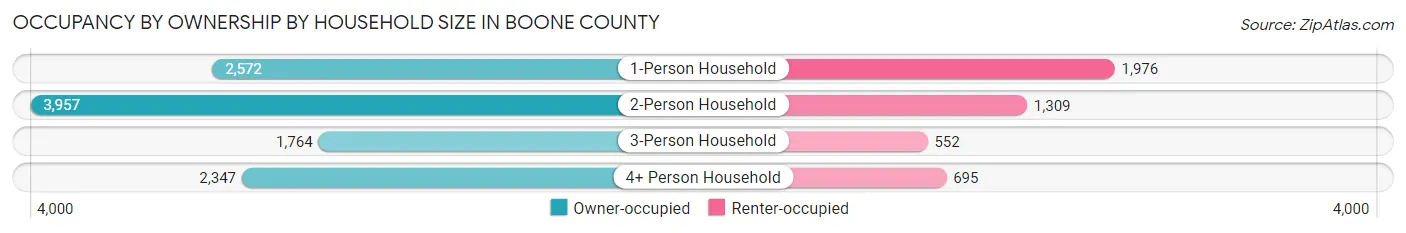
| Household Size | Owner-occupied | Renter-occupied |
| 1-Person Household | 2,572 (56.6%) | 1,976 (43.4%) |
| 2-Person Household | 3,957 (75.1%) | 1,309 (24.9%) |
| 3-Person Household | 1,764 (76.2%) | 552 (23.8%) |
| 4+ Person Household | 2,347 (77.1%) | 695 (22.9%) |
| Total Housing Units | 10,640 (70.1%) | 4,532 (29.9%) |
Occupancy by Educational Attainment in Boone County
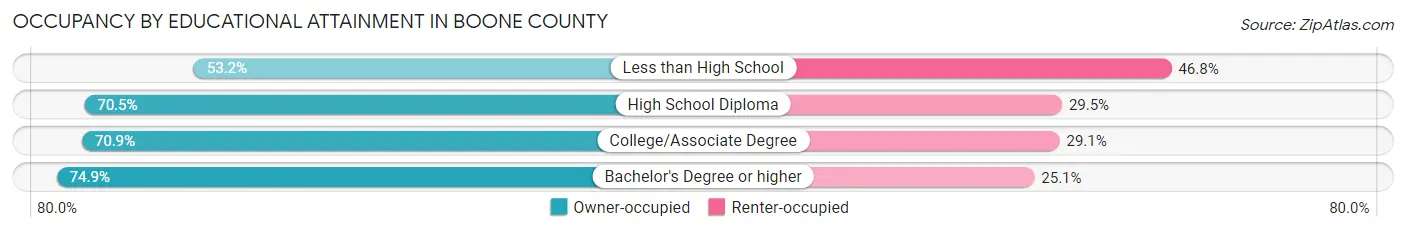
| Household Size | Owner-occupied | Renter-occupied |
| Less than High School | 622 (53.2%) | 548 (46.8%) |
| High School Diploma | 3,558 (70.5%) | 1,487 (29.5%) |
| College/Associate Degree | 4,430 (70.9%) | 1,817 (29.1%) |
| Bachelor's Degree or higher | 2,030 (74.9%) | 680 (25.1%) |
Occupancy by Age of Householder in Boone County
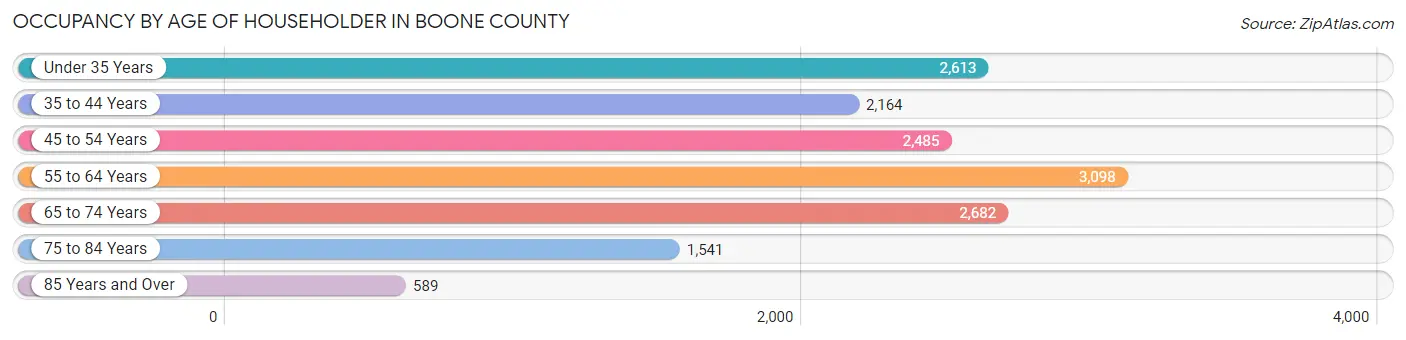
| Age Bracket | # Households | % Households |
| Under 35 Years | 2,613 | 17.2% |
| 35 to 44 Years | 2,164 | 14.3% |
| 45 to 54 Years | 2,485 | 16.4% |
| 55 to 64 Years | 3,098 | 20.4% |
| 65 to 74 Years | 2,682 | 17.7% |
| 75 to 84 Years | 1,541 | 10.2% |
| 85 Years and Over | 589 | 3.9% |
| Total | 15,172 | 100.0% |
Housing Finances in Boone County
Median Income by Occupancy in Boone County
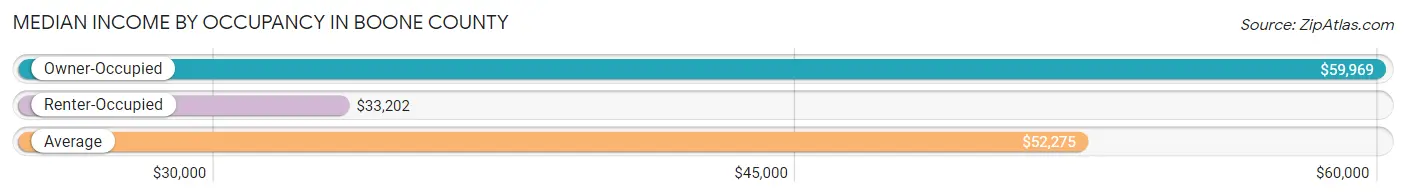
| Occupancy Type | # Households | Median Income |
| Owner-Occupied | 10,640 (70.1%) | $59,969 |
| Renter-Occupied | 4,532 (29.9%) | $33,202 |
| Average | 15,172 (100.0%) | $52,275 |
Occupancy by Householder Income Bracket in Boone County
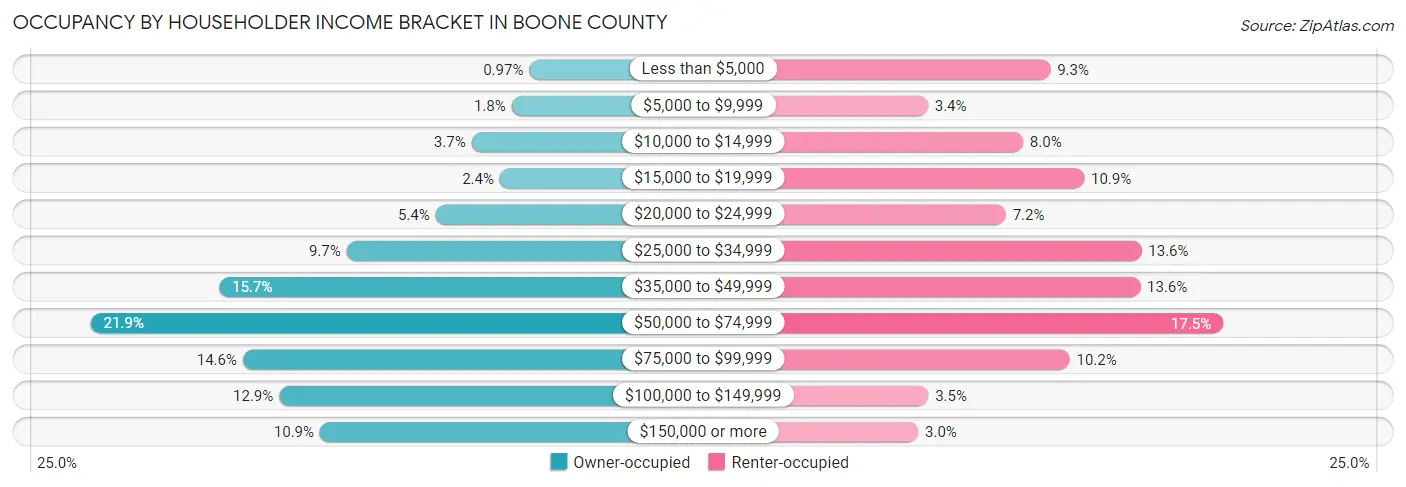
| Income Bracket | Owner-occupied | Renter-occupied |
| Less than $5,000 | 103 (1.0%) | 420 (9.3%) |
| $5,000 to $9,999 | 193 (1.8%) | 156 (3.4%) |
| $10,000 to $14,999 | 396 (3.7%) | 361 (8.0%) |
| $15,000 to $19,999 | 252 (2.4%) | 493 (10.9%) |
| $20,000 to $24,999 | 578 (5.4%) | 324 (7.1%) |
| $25,000 to $34,999 | 1,029 (9.7%) | 617 (13.6%) |
| $35,000 to $49,999 | 1,675 (15.7%) | 614 (13.6%) |
| $50,000 to $74,999 | 2,326 (21.9%) | 793 (17.5%) |
| $75,000 to $99,999 | 1,554 (14.6%) | 462 (10.2%) |
| $100,000 to $149,999 | 1,370 (12.9%) | 157 (3.5%) |
| $150,000 or more | 1,164 (10.9%) | 135 (3.0%) |
| Total | 10,640 (100.0%) | 4,532 (100.0%) |
Monthly Housing Cost Tiers in Boone County
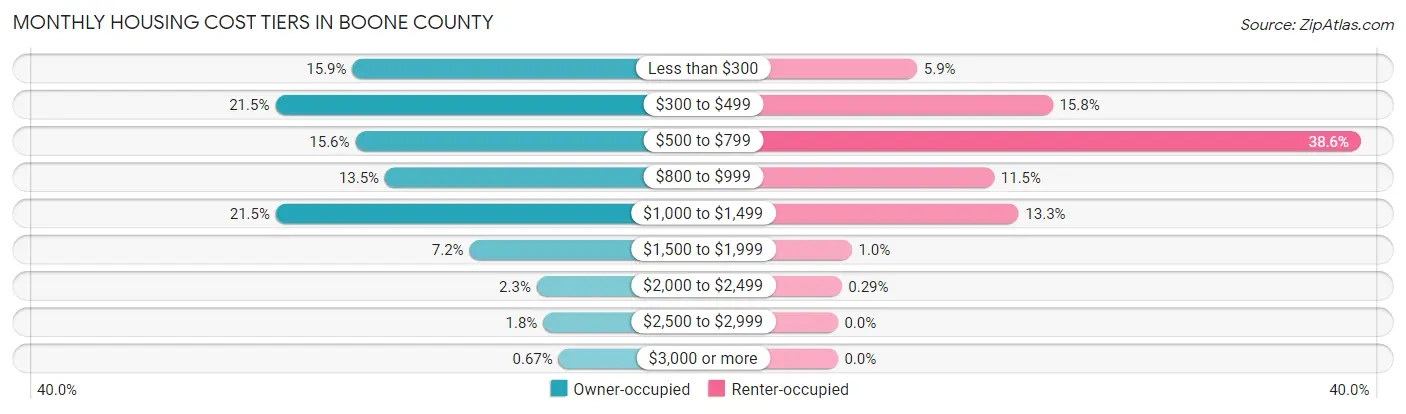
| Monthly Cost | Owner-occupied | Renter-occupied |
| Less than $300 | 1,687 (15.9%) | 265 (5.9%) |
| $300 to $499 | 2,292 (21.5%) | 718 (15.8%) |
| $500 to $799 | 1,664 (15.6%) | 1,747 (38.6%) |
| $800 to $999 | 1,432 (13.5%) | 522 (11.5%) |
| $1,000 to $1,499 | 2,288 (21.5%) | 604 (13.3%) |
| $1,500 to $1,999 | 770 (7.2%) | 47 (1.0%) |
| $2,000 to $2,499 | 243 (2.3%) | 13 (0.3%) |
| $2,500 to $2,999 | 193 (1.8%) | 0 (0.0%) |
| $3,000 or more | 71 (0.7%) | 0 (0.0%) |
| Total | 10,640 (100.0%) | 4,532 (100.0%) |
Physical Housing Characteristics in Boone County
Housing Structures in Boone County
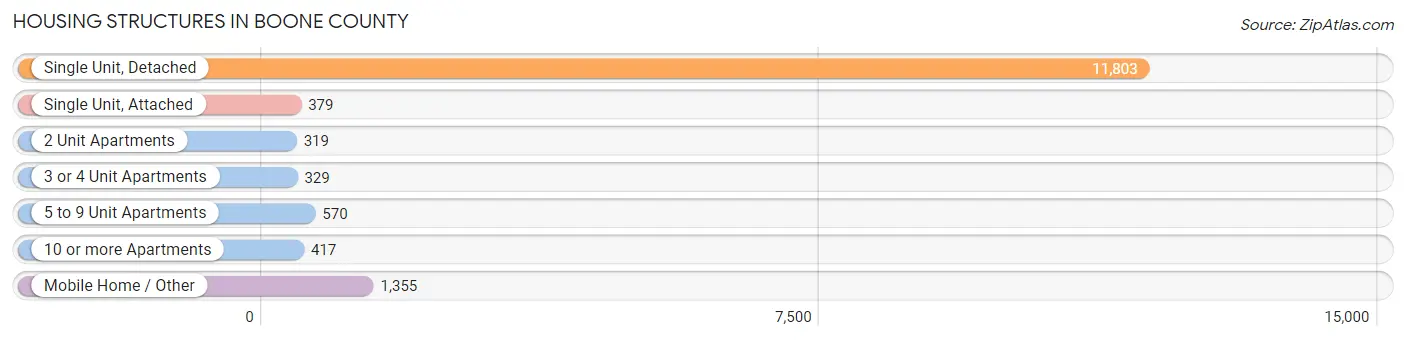
| Structure Type | # Housing Units | % Housing Units |
| Single Unit, Detached | 11,803 | 77.8% |
| Single Unit, Attached | 379 | 2.5% |
| 2 Unit Apartments | 319 | 2.1% |
| 3 or 4 Unit Apartments | 329 | 2.2% |
| 5 to 9 Unit Apartments | 570 | 3.8% |
| 10 or more Apartments | 417 | 2.8% |
| Mobile Home / Other | 1,355 | 8.9% |
| Total | 15,172 | 100.0% |
Housing Structures by Occupancy in Boone County
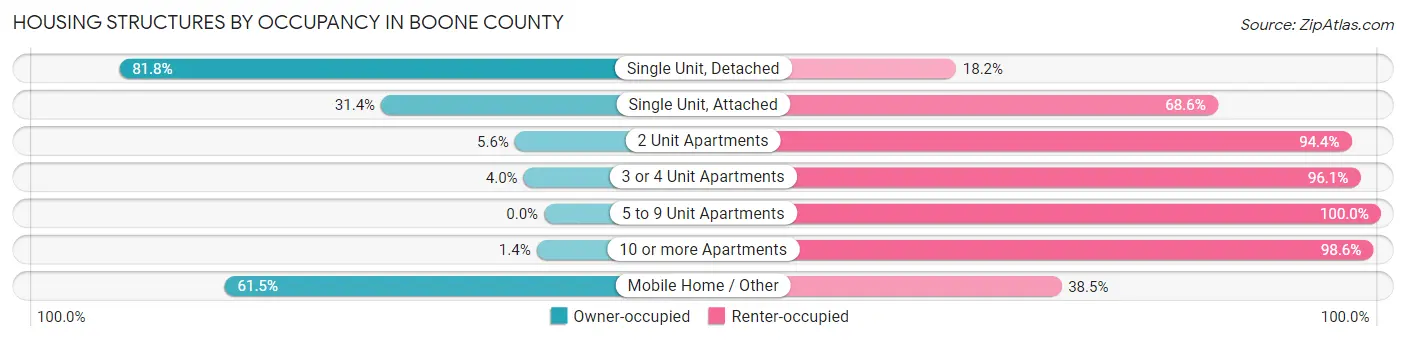
| Structure Type | Owner-occupied | Renter-occupied |
| Single Unit, Detached | 9,651 (81.8%) | 2,152 (18.2%) |
| Single Unit, Attached | 119 (31.4%) | 260 (68.6%) |
| 2 Unit Apartments | 18 (5.6%) | 301 (94.4%) |
| 3 or 4 Unit Apartments | 13 (4.0%) | 316 (96.1%) |
| 5 to 9 Unit Apartments | 0 (0.0%) | 570 (100.0%) |
| 10 or more Apartments | 6 (1.4%) | 411 (98.6%) |
| Mobile Home / Other | 833 (61.5%) | 522 (38.5%) |
| Total | 10,640 (70.1%) | 4,532 (29.9%) |
Housing Structures by Number of Rooms in Boone County
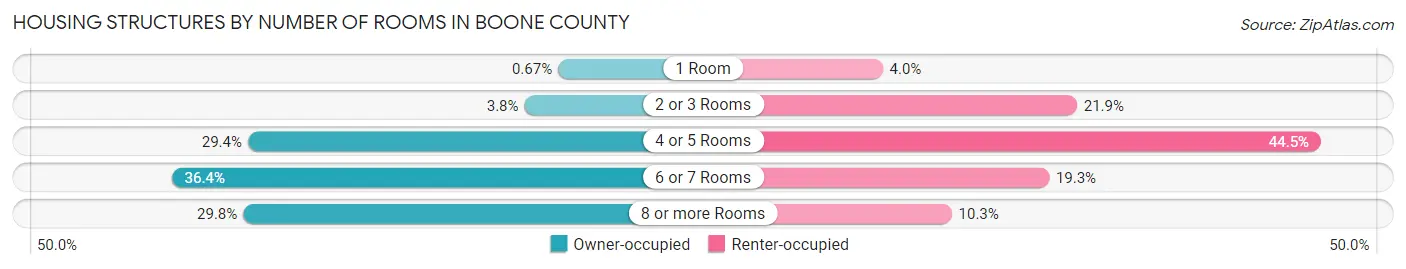
| Number of Rooms | Owner-occupied | Renter-occupied |
| 1 Room | 71 (0.7%) | 179 (4.0%) |
| 2 or 3 Rooms | 402 (3.8%) | 993 (21.9%) |
| 4 or 5 Rooms | 3,124 (29.4%) | 2,016 (44.5%) |
| 6 or 7 Rooms | 3,873 (36.4%) | 876 (19.3%) |
| 8 or more Rooms | 3,170 (29.8%) | 468 (10.3%) |
| Total | 10,640 (100.0%) | 4,532 (100.0%) |
Housing Structure by Heating Type in Boone County
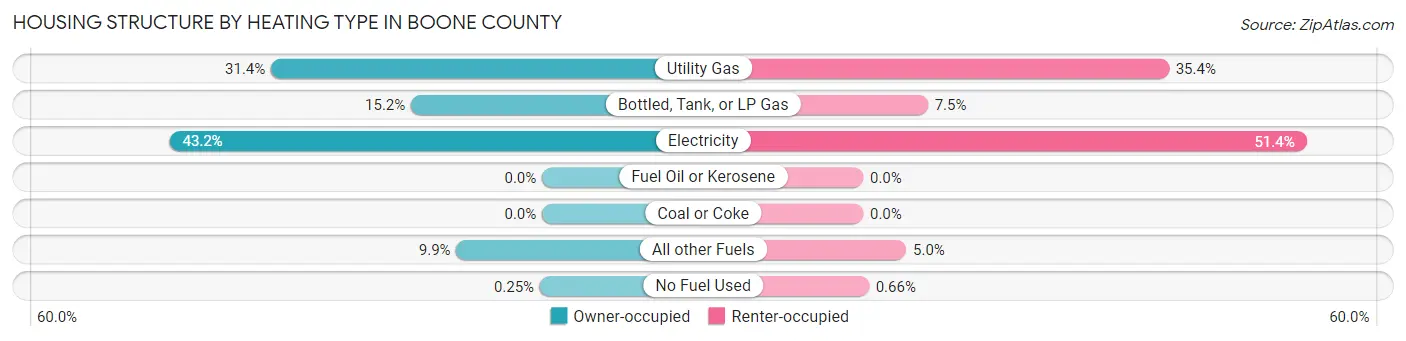
| Heating Type | Owner-occupied | Renter-occupied |
| Utility Gas | 3,343 (31.4%) | 1,606 (35.4%) |
| Bottled, Tank, or LP Gas | 1,616 (15.2%) | 340 (7.5%) |
| Electricity | 4,597 (43.2%) | 2,330 (51.4%) |
| Fuel Oil or Kerosene | 0 (0.0%) | 0 (0.0%) |
| Coal or Coke | 0 (0.0%) | 0 (0.0%) |
| All other Fuels | 1,057 (9.9%) | 226 (5.0%) |
| No Fuel Used | 27 (0.3%) | 30 (0.7%) |
| Total | 10,640 (100.0%) | 4,532 (100.0%) |
Household Vehicle Usage in Boone County
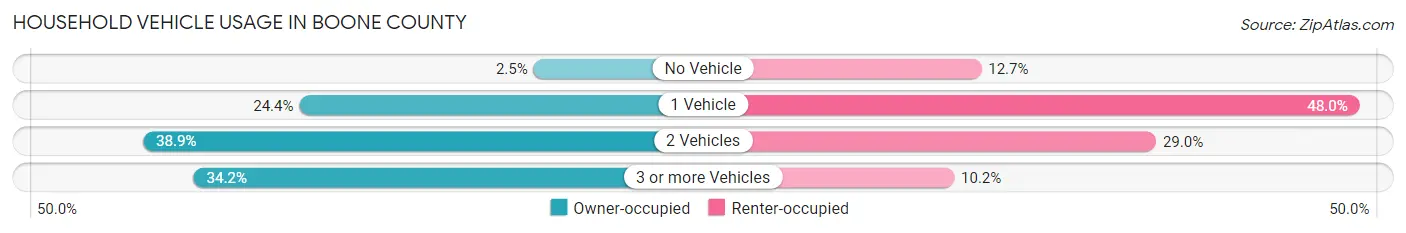
| Vehicles per Household | Owner-occupied | Renter-occupied |
| No Vehicle | 265 (2.5%) | 577 (12.7%) |
| 1 Vehicle | 2,592 (24.4%) | 2,177 (48.0%) |
| 2 Vehicles | 4,142 (38.9%) | 1,316 (29.0%) |
| 3 or more Vehicles | 3,641 (34.2%) | 462 (10.2%) |
| Total | 10,640 (100.0%) | 4,532 (100.0%) |
Real Estate & Mortgages in Boone County
Real Estate and Mortgage Overview in Boone County
| Characteristic | Without Mortgage | With Mortgage |
| Housing Units | 5,222 | 5,418 |
| Median Property Value | $154,200 | $159,600 |
| Median Household Income | $46,564 | $714 |
| Monthly Housing Costs | $380 | $62 |
| Real Estate Taxes | $843 | $86 |
Property Value by Mortgage Status in Boone County
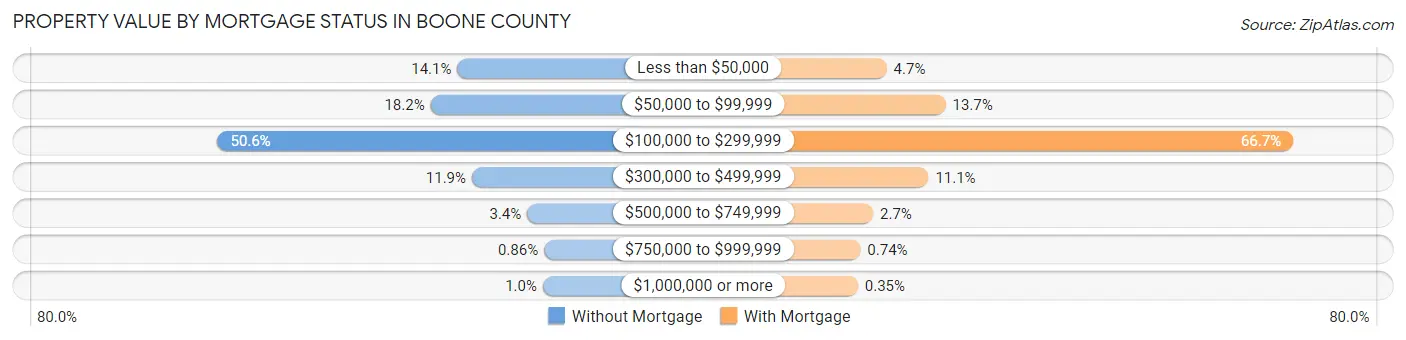
| Property Value | Without Mortgage | With Mortgage |
| Less than $50,000 | 734 (14.1%) | 257 (4.7%) |
| $50,000 to $99,999 | 948 (18.1%) | 743 (13.7%) |
| $100,000 to $299,999 | 2,643 (50.6%) | 3,612 (66.7%) |
| $300,000 to $499,999 | 619 (11.8%) | 602 (11.1%) |
| $500,000 to $749,999 | 179 (3.4%) | 145 (2.7%) |
| $750,000 to $999,999 | 45 (0.9%) | 40 (0.7%) |
| $1,000,000 or more | 54 (1.0%) | 19 (0.4%) |
| Total | 5,222 (100.0%) | 5,418 (100.0%) |
Household Income by Mortgage Status in Boone County
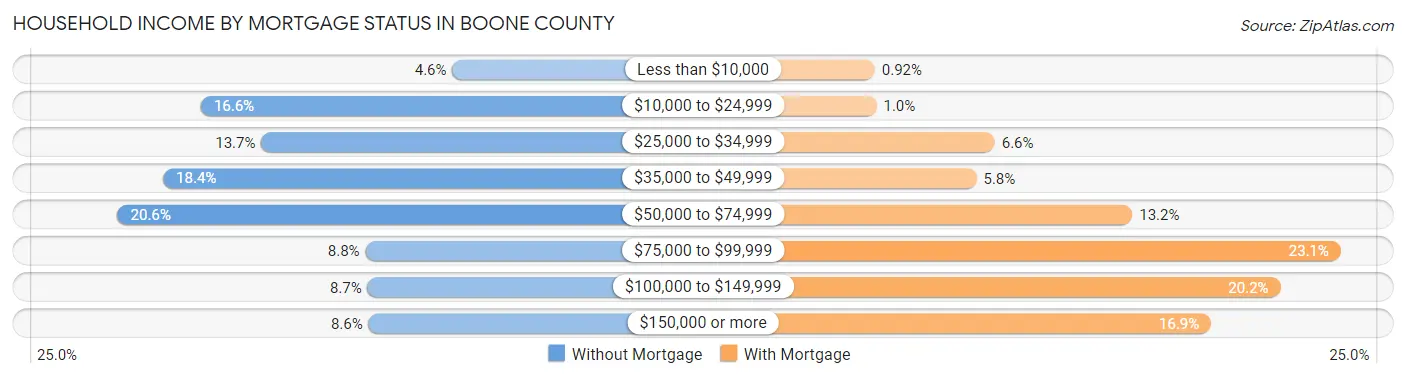
| Household Income | Without Mortgage | With Mortgage |
| Less than $10,000 | 242 (4.6%) | 50 (0.9%) |
| $10,000 to $24,999 | 867 (16.6%) | 54 (1.0%) |
| $25,000 to $34,999 | 717 (13.7%) | 359 (6.6%) |
| $35,000 to $49,999 | 961 (18.4%) | 312 (5.8%) |
| $50,000 to $74,999 | 1,074 (20.6%) | 714 (13.2%) |
| $75,000 to $99,999 | 458 (8.8%) | 1,252 (23.1%) |
| $100,000 to $149,999 | 453 (8.7%) | 1,096 (20.2%) |
| $150,000 or more | 450 (8.6%) | 917 (16.9%) |
| Total | 5,222 (100.0%) | 5,418 (100.0%) |
Property Value to Household Income Ratio in Boone County
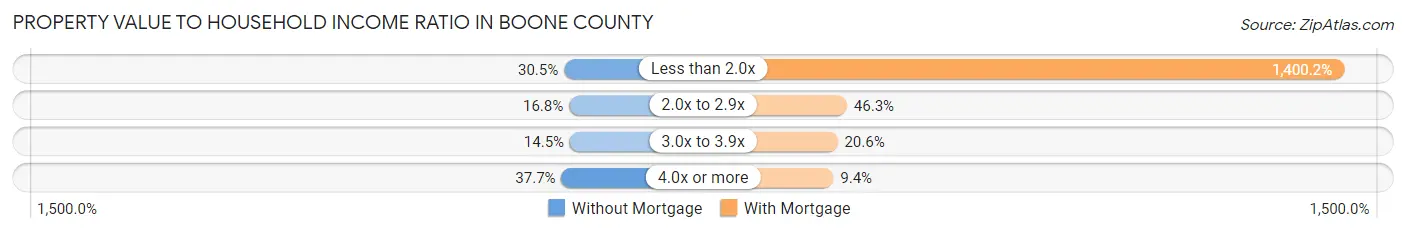
| Value-to-Income Ratio | Without Mortgage | With Mortgage |
| Less than 2.0x | 1,590 (30.4%) | 75,865 (1,400.2%) |
| 2.0x to 2.9x | 878 (16.8%) | 2,509 (46.3%) |
| 3.0x to 3.9x | 757 (14.5%) | 1,115 (20.6%) |
| 4.0x or more | 1,968 (37.7%) | 509 (9.4%) |
| Total | 5,222 (100.0%) | 5,418 (100.0%) |
Real Estate Taxes by Mortgage Status in Boone County
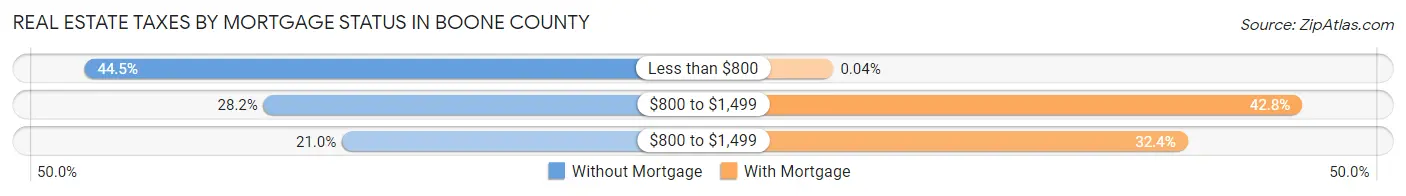
| Property Taxes | Without Mortgage | With Mortgage |
| Less than $800 | 2,325 (44.5%) | 2 (0.0%) |
| $800 to $1,499 | 1,471 (28.2%) | 2,321 (42.8%) |
| $800 to $1,499 | 1,097 (21.0%) | 1,754 (32.4%) |
| Total | 5,222 (100.0%) | 5,418 (100.0%) |
Health & Disability in Boone County
Health Insurance Coverage by Age in Boone County
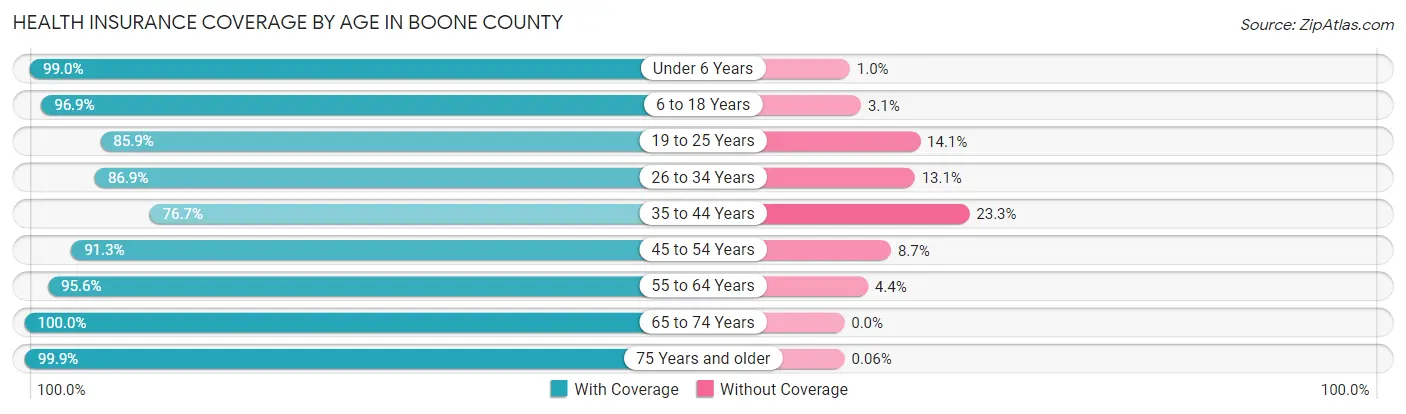
| Age Bracket | With Coverage | Without Coverage |
| Under 6 Years | 2,606 (99.0%) | 27 (1.0%) |
| 6 to 18 Years | 6,120 (96.9%) | 197 (3.1%) |
| 19 to 25 Years | 2,441 (85.9%) | 402 (14.1%) |
| 26 to 34 Years | 3,362 (86.9%) | 508 (13.1%) |
| 35 to 44 Years | 3,265 (76.7%) | 993 (23.3%) |
| 45 to 54 Years | 4,279 (91.3%) | 408 (8.7%) |
| 55 to 64 Years | 4,819 (95.6%) | 222 (4.4%) |
| 65 to 74 Years | 4,502 (100.0%) | 0 (0.0%) |
| 75 Years and older | 3,133 (99.9%) | 2 (0.1%) |
| Total | 34,527 (92.6%) | 2,759 (7.4%) |
Health Insurance Coverage by Citizenship Status in Boone County
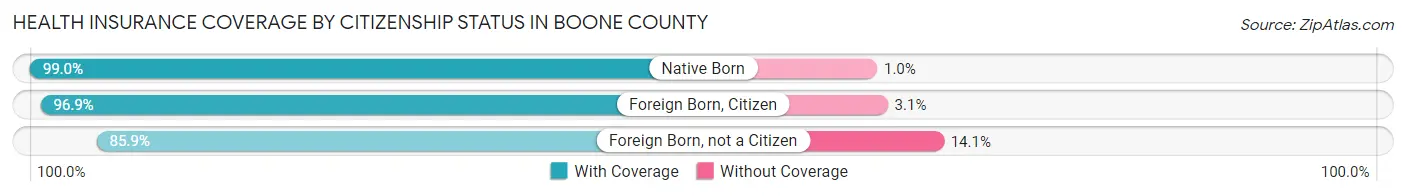
| Citizenship Status | With Coverage | Without Coverage |
| Native Born | 2,606 (99.0%) | 27 (1.0%) |
| Foreign Born, Citizen | 6,120 (96.9%) | 197 (3.1%) |
| Foreign Born, not a Citizen | 2,441 (85.9%) | 402 (14.1%) |
Health Insurance Coverage by Household Income in Boone County
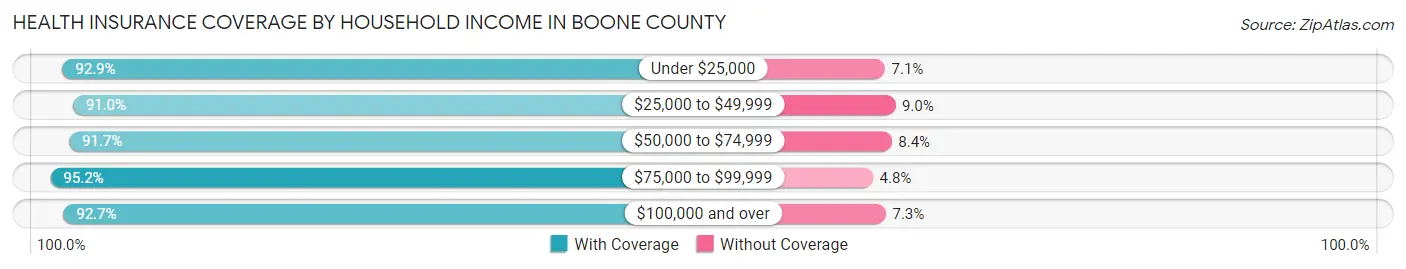
| Household Income | With Coverage | Without Coverage |
| Under $25,000 | 4,805 (92.9%) | 366 (7.1%) |
| $25,000 to $49,999 | 7,110 (91.0%) | 706 (9.0%) |
| $50,000 to $74,999 | 7,592 (91.6%) | 692 (8.4%) |
| $75,000 to $99,999 | 6,387 (95.2%) | 325 (4.8%) |
| $100,000 and over | 8,547 (92.7%) | 669 (7.3%) |
Public vs Private Health Insurance Coverage by Age in Boone County
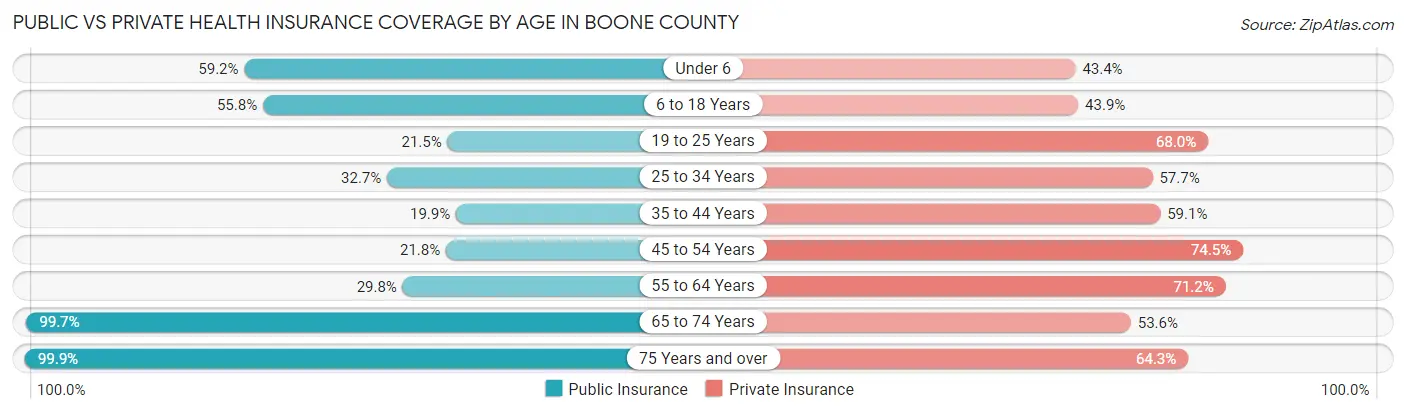
| Age Bracket | Public Insurance | Private Insurance |
| Under 6 | 1,559 (59.2%) | 1,142 (43.4%) |
| 6 to 18 Years | 3,522 (55.7%) | 2,771 (43.9%) |
| 19 to 25 Years | 611 (21.5%) | 1,933 (68.0%) |
| 25 to 34 Years | 1,266 (32.7%) | 2,232 (57.7%) |
| 35 to 44 Years | 848 (19.9%) | 2,517 (59.1%) |
| 45 to 54 Years | 1,021 (21.8%) | 3,491 (74.5%) |
| 55 to 64 Years | 1,503 (29.8%) | 3,590 (71.2%) |
| 65 to 74 Years | 4,487 (99.7%) | 2,415 (53.6%) |
| 75 Years and over | 3,133 (99.9%) | 2,015 (64.3%) |
| Total | 17,950 (48.1%) | 22,106 (59.3%) |
Disability Status by Sex by Age in Boone County
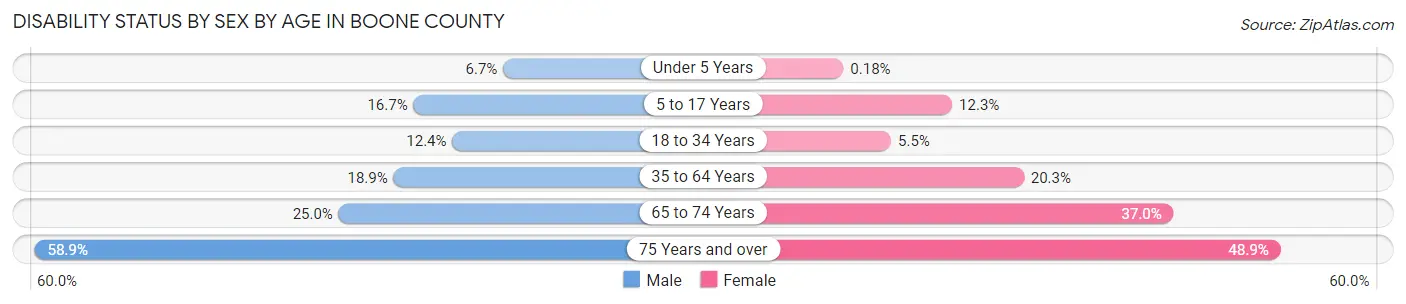
| Age Bracket | Male | Female |
| Under 5 Years | 69 (6.7%) | 2 (0.2%) |
| 5 to 17 Years | 560 (16.7%) | 373 (12.3%) |
| 18 to 34 Years | 454 (12.4%) | 191 (5.5%) |
| 35 to 64 Years | 1,308 (18.9%) | 1,433 (20.3%) |
| 65 to 74 Years | 538 (25.0%) | 869 (36.9%) |
| 75 Years and over | 782 (58.9%) | 883 (48.9%) |
Disability Class by Sex by Age in Boone County
Disability Class: Hearing Difficulty
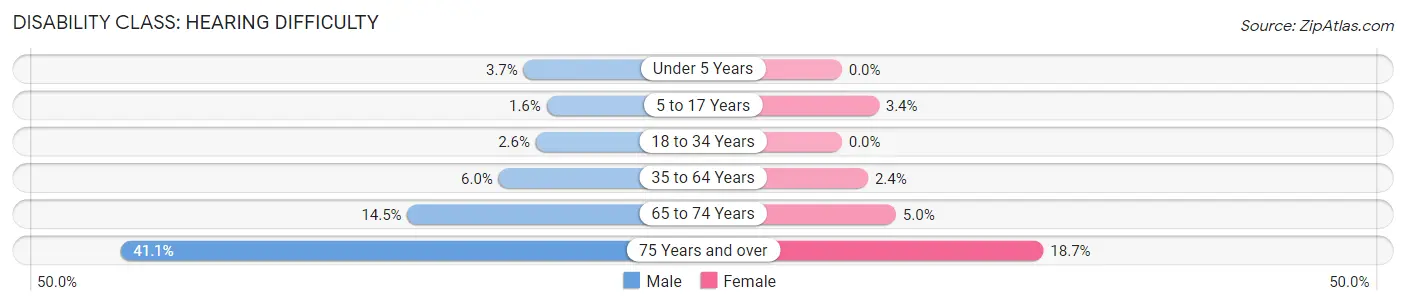
| Age Bracket | Male | Female |
| Under 5 Years | 38 (3.7%) | 0 (0.0%) |
| 5 to 17 Years | 52 (1.5%) | 104 (3.4%) |
| 18 to 34 Years | 94 (2.6%) | 0 (0.0%) |
| 35 to 64 Years | 415 (6.0%) | 172 (2.4%) |
| 65 to 74 Years | 311 (14.5%) | 118 (5.0%) |
| 75 Years and over | 546 (41.1%) | 338 (18.7%) |
Disability Class: Vision Difficulty
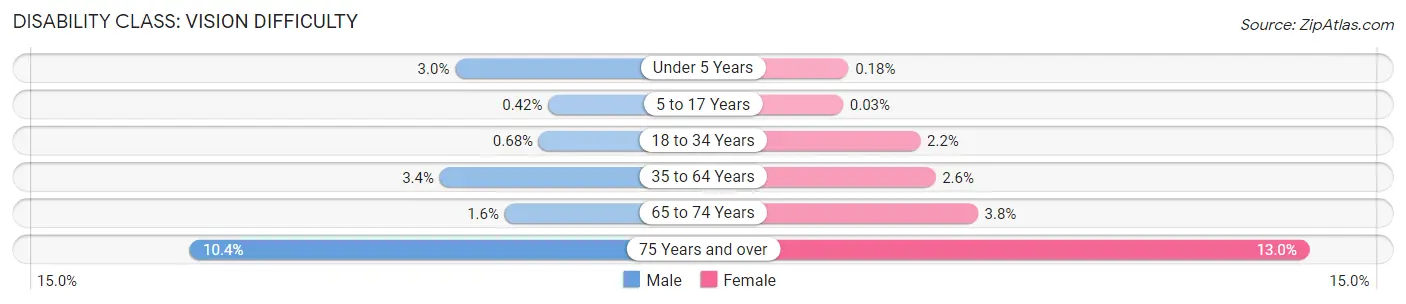
| Age Bracket | Male | Female |
| Under 5 Years | 31 (3.0%) | 2 (0.2%) |
| 5 to 17 Years | 14 (0.4%) | 1 (0.0%) |
| 18 to 34 Years | 25 (0.7%) | 76 (2.2%) |
| 35 to 64 Years | 238 (3.4%) | 184 (2.6%) |
| 65 to 74 Years | 35 (1.6%) | 89 (3.8%) |
| 75 Years and over | 138 (10.4%) | 235 (13.0%) |
Disability Class: Cognitive Difficulty
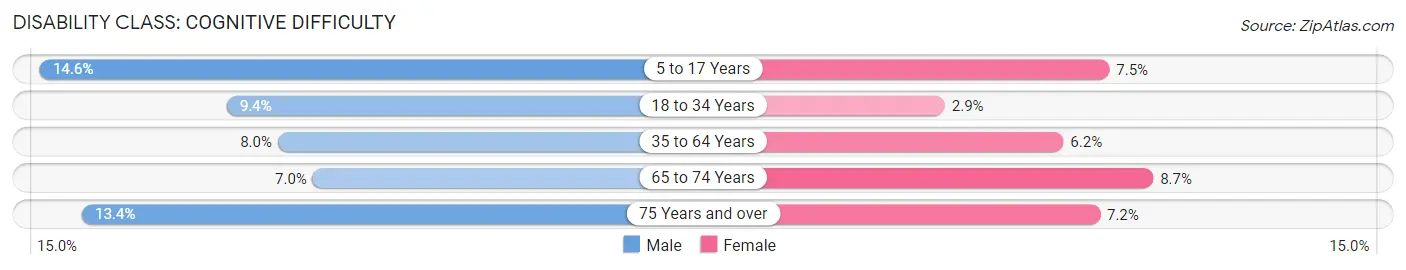
| Age Bracket | Male | Female |
| 5 to 17 Years | 489 (14.6%) | 226 (7.4%) |
| 18 to 34 Years | 344 (9.4%) | 100 (2.9%) |
| 35 to 64 Years | 550 (8.0%) | 436 (6.2%) |
| 65 to 74 Years | 150 (7.0%) | 204 (8.7%) |
| 75 Years and over | 178 (13.4%) | 130 (7.2%) |
Disability Class: Ambulatory Difficulty
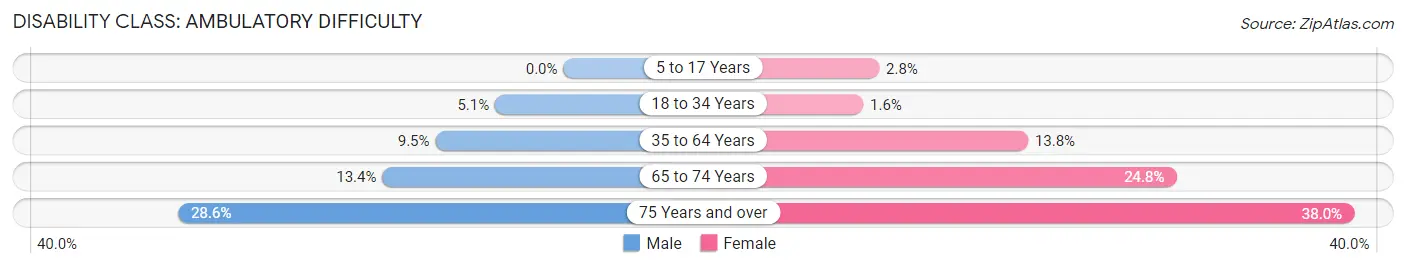
| Age Bracket | Male | Female |
| 5 to 17 Years | 0 (0.0%) | 84 (2.8%) |
| 18 to 34 Years | 186 (5.1%) | 55 (1.6%) |
| 35 to 64 Years | 657 (9.5%) | 977 (13.8%) |
| 65 to 74 Years | 289 (13.4%) | 584 (24.8%) |
| 75 Years and over | 380 (28.6%) | 687 (38.0%) |
Disability Class: Self-Care Difficulty
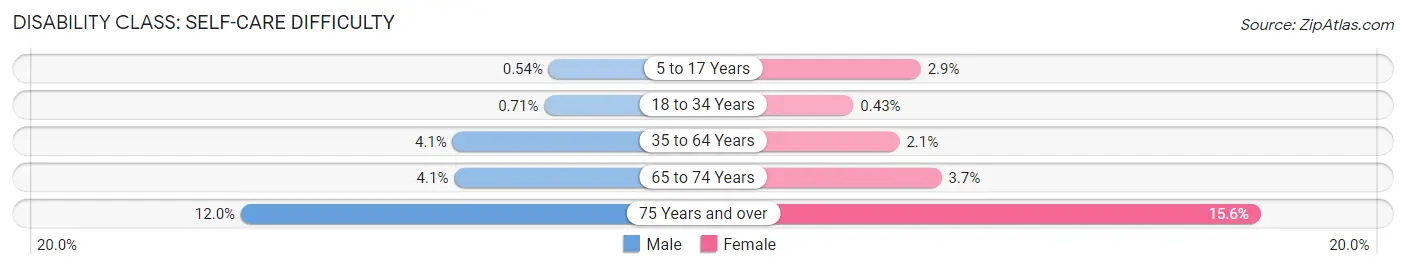
| Age Bracket | Male | Female |
| 5 to 17 Years | 18 (0.5%) | 89 (2.9%) |
| 18 to 34 Years | 26 (0.7%) | 15 (0.4%) |
| 35 to 64 Years | 284 (4.1%) | 151 (2.1%) |
| 65 to 74 Years | 87 (4.1%) | 87 (3.7%) |
| 75 Years and over | 159 (12.0%) | 281 (15.5%) |
Technology Access in Boone County
Computing Device Access in Boone County
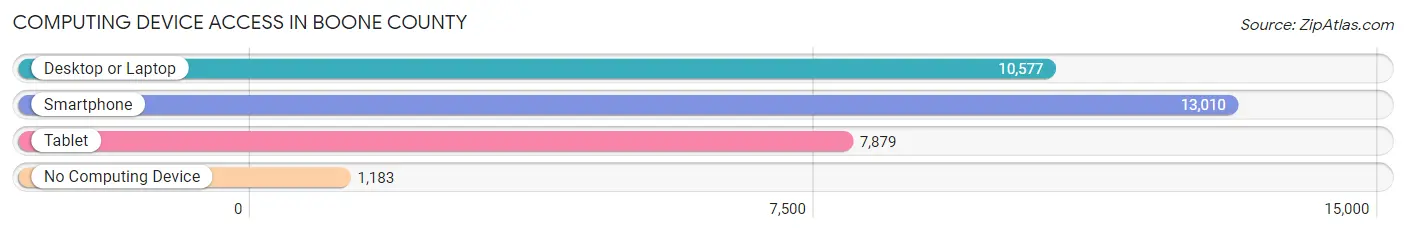
| Device Type | # Households | % Households |
| Desktop or Laptop | 10,577 | 69.7% |
| Smartphone | 13,010 | 85.8% |
| Tablet | 7,879 | 51.9% |
| No Computing Device | 1,183 | 7.8% |
| Total | 15,172 | 100.0% |
Internet Access in Boone County
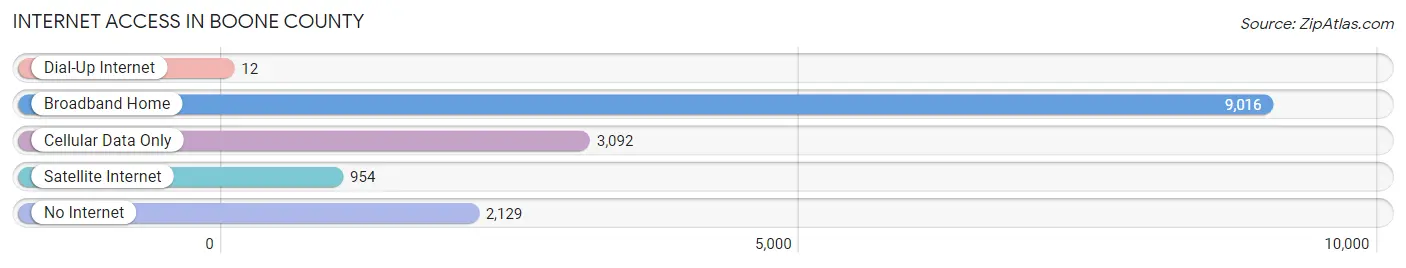
| Internet Type | # Households | % Households |
| Dial-Up Internet | 12 | 0.1% |
| Broadband Home | 9,016 | 59.4% |
| Cellular Data Only | 3,092 | 20.4% |
| Satellite Internet | 954 | 6.3% |
| No Internet | 2,129 | 14.0% |
| Total | 15,172 | 100.0% |
Boone County Summary
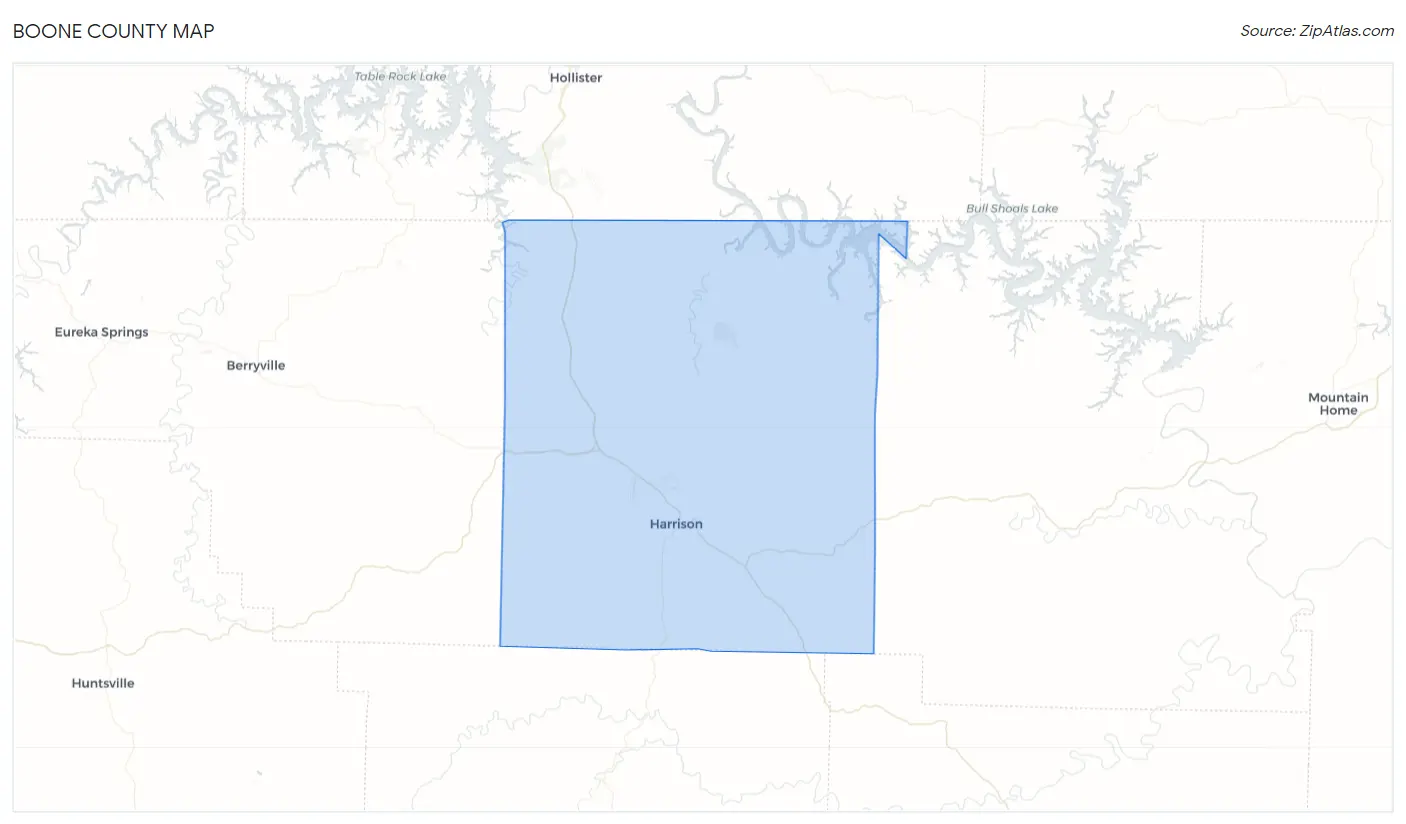
Boone County, Arkansas is located in the northwest corner of the state and is part of the Ozark Mountains region. It is bordered by Carroll County to the north, Newton County to the east, Searcy County to the south, and Madison County to the west. The county seat is Harrison, which is also the largest city in the county.
Geography
Boone County is located in the Ozark Mountains region of Arkansas. The county is mostly mountainous, with elevations ranging from 1,000 to 2,500 feet above sea level. The highest point in the county is Mount Sherman, which has an elevation of 2,500 feet. The county is drained by the White River and its tributaries, including the Buffalo River, Crooked Creek, and Big Piney Creek. The county is mostly forested, with oak, hickory, and pine trees being the most common.
The county has a total area of 602 square miles, of which 599 square miles is land and 3 square miles is water.
Demographics
As of the 2010 census, Boone County had a population of 36,903. The racial makeup of the county was 95.3% White, 0.7% Black or African American, 0.7% Native American, 0.4% Asian, 0.1% Pacific Islander, 1.3% from other races, and 1.5% from two or more races. Hispanic or Latino of any race were 3.2% of the population.
The median income for a household in the county was $35,945, and the median income for a family was $43,945. The per capita income for the county was $19,845. About 13.2% of families and 17.2% of the population were below the poverty line, including 22.2% of those under age 18 and 11.2% of those age 65 or over.
Economy
Boone County is largely rural and agricultural. The county is home to several large poultry farms, as well as beef and dairy farms. The county is also home to several manufacturing companies, including a furniture factory, a plastics factory, and a metal fabrication plant.
The county is also home to several tourist attractions, including the Buffalo National River, the Ozark Folk Center State Park, and the Harrison Country Club.
History
Boone County was formed in 1869 from parts of Carroll, Newton, and Searcy counties. It was named for Daniel Boone, the famous frontiersman. The county seat was originally located in the town of Osage, but was moved to Harrison in 1876.
The county was largely rural and agricultural until the early 20th century, when the timber industry began to boom. The county was home to several large sawmills, and the timber industry provided jobs for many of the county's residents.
The county was also home to several resorts, including the Harrison Country Club, which opened in the 1920s. The resort was popular with wealthy tourists from around the country, and it helped to boost the local economy.
In the 1950s, the poultry industry began to take off in the county. Several large poultry farms were established, and the industry provided jobs for many of the county's residents.
Today, Boone County is still largely rural and agricultural. The county is home to several large poultry farms, as well as beef and dairy farms. The county is also home to several manufacturing companies, and tourism is an important part of the local economy.
Common Questions
What is Per Capita Income in Boone County?
Per Capita income in Boone County is $28,886.
What is the Median Family Income in Boone County?
Median Family Income in Boone County is $66,617.
What is the Median Household income in Boone County?
Median Household Income in Boone County is $52,275.
What is Income or Wage Gap in Boone County?
Income or Wage Gap in Boone County is 29.9%.
Women in Boone County earn 70.1 cents for every dollar earned by a man.
What is Family Income Deficit in Boone County?
Family Income Deficit in Boone County is $9,120.
Families that are below poverty line in Boone County earn $9,120 less on average than the poverty threshold level.
What is Inequality or Gini Index in Boone County?
Inequality or Gini Index in Boone County is 0.45.
What is the Total Population of Boone County?
Total Population of Boone County is 37,662.
What is the Total Male Population of Boone County?
Total Male Population of Boone County is 18,657.
What is the Total Female Population of Boone County?
Total Female Population of Boone County is 19,005.
What is the Ratio of Males per 100 Females in Boone County?
There are 98.17 Males per 100 Females in Boone County.
What is the Ratio of Females per 100 Males in Boone County?
There are 101.87 Females per 100 Males in Boone County.
What is the Median Population Age in Boone County?
Median Population Age in Boone County is 41.9 Years.
What is the Average Family Size in Boone County
Average Family Size in Boone County is 3.0 People.
What is the Average Household Size in Boone County
Average Household Size in Boone County is 2.5 People.
How Large is the Labor Force in Boone County?
There are 16,986 People in the Labor Forcein in Boone County.
What is the Percentage of People in the Labor Force in Boone County?
56.7% of People are in the Labor Force in Boone County.
What is the Unemployment Rate in Boone County?
Unemployment Rate in Boone County is 4.4%.