Poinsett County, AR Map & Demographics
Poinsett County Overview
$24,807
PER CAPITA INCOME
$56,293
AVG FAMILY INCOME
$43,440
AVG HOUSEHOLD INCOME
27.3%
WAGE / INCOME GAP [ % ]
72.7¢/ $1
WAGE / INCOME GAP [ $ ]
$9,947
FAMILY INCOME DEFICIT
0.47
INEQUALITY / GINI INDEX
22,997
TOTAL POPULATION
11,246
MALE POPULATION
11,751
FEMALE POPULATION
95.70
MALES / 100 FEMALES
104.49
FEMALES / 100 MALES
39.9
MEDIAN AGE
3.1
AVG FAMILY SIZE
2.5
AVG HOUSEHOLD SIZE
9,930
LABOR FORCE [ PEOPLE ]
54.9%
PERCENT IN LABOR FORCE
5.1%
UNEMPLOYMENT RATE
Poinsett County Area Codes
Income in Poinsett County
Income Overview in Poinsett County
Per Capita Income in Poinsett County is $24,807, while median incomes of families and households are $56,293 and $43,440 respectively.
| Characteristic | Number | Measure |
| Per Capita Income | 22,997 | $24,807 |
| Median Family Income | 5,833 | $56,293 |
| Mean Family Income | 5,833 | $73,644 |
| Median Household Income | 9,082 | $43,440 |
| Mean Household Income | 9,082 | $60,498 |
| Income Deficit | 5,833 | $9,947 |
| Wage / Income Gap (%) | 22,997 | 27.35% |
| Wage / Income Gap ($) | 22,997 | 72.65¢ per $1 |
| Gini / Inequality Index | 22,997 | 0.47 |
Earnings by Sex in Poinsett County
Average Earnings in Poinsett County are $33,310, $38,627 for men and $28,063 for women, a difference of 27.4%.
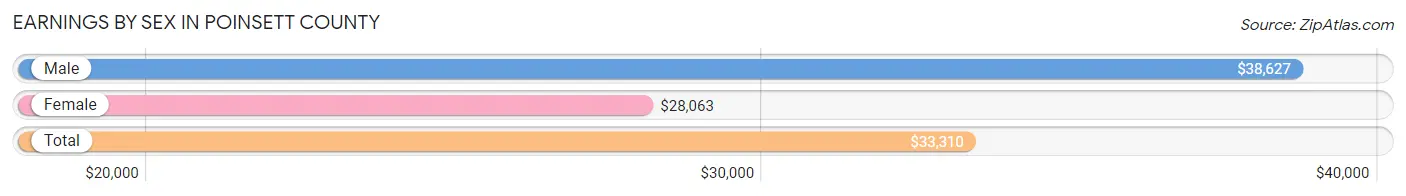
| Sex | Number | Average Earnings |
| Male | 5,618 (53.5%) | $38,627 |
| Female | 4,874 (46.5%) | $28,063 |
| Total | 10,492 (100.0%) | $33,310 |
Earnings by Sex by Income Bracket in Poinsett County
The most common earnings brackets in Poinsett County are $55,000 to $64,999 for men (675 | 12.0%) and $25,000 to $29,999 for women (532 | 10.9%).
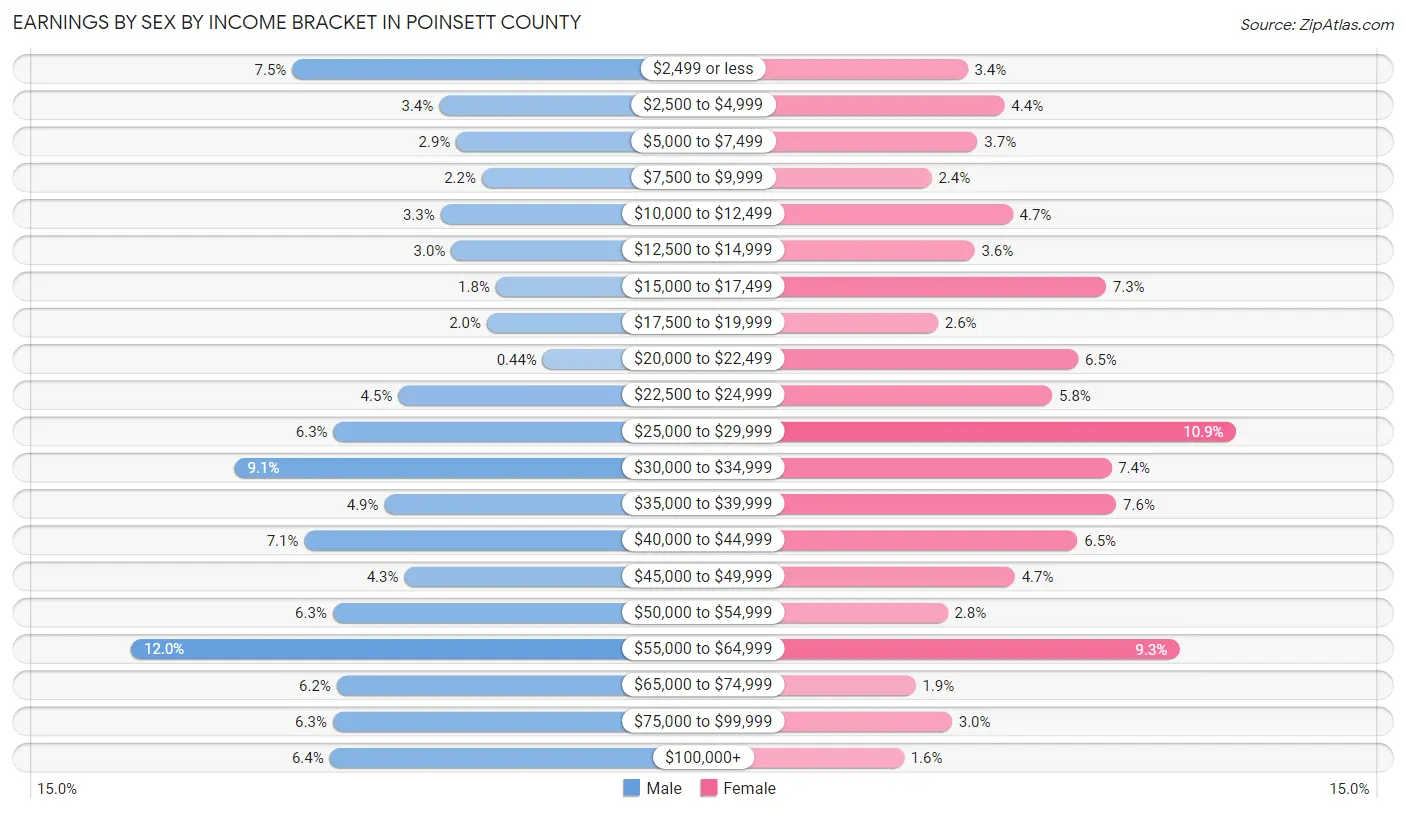
| Income | Male | Female |
| $2,499 or less | 420 (7.5%) | 165 (3.4%) |
| $2,500 to $4,999 | 188 (3.4%) | 216 (4.4%) |
| $5,000 to $7,499 | 161 (2.9%) | 179 (3.7%) |
| $7,500 to $9,999 | 121 (2.1%) | 116 (2.4%) |
| $10,000 to $12,499 | 186 (3.3%) | 227 (4.7%) |
| $12,500 to $14,999 | 169 (3.0%) | 175 (3.6%) |
| $15,000 to $17,499 | 99 (1.8%) | 355 (7.3%) |
| $17,500 to $19,999 | 113 (2.0%) | 125 (2.6%) |
| $20,000 to $22,499 | 25 (0.4%) | 317 (6.5%) |
| $22,500 to $24,999 | 253 (4.5%) | 281 (5.8%) |
| $25,000 to $29,999 | 355 (6.3%) | 532 (10.9%) |
| $30,000 to $34,999 | 511 (9.1%) | 362 (7.4%) |
| $35,000 to $39,999 | 275 (4.9%) | 369 (7.6%) |
| $40,000 to $44,999 | 401 (7.1%) | 316 (6.5%) |
| $45,000 to $49,999 | 243 (4.3%) | 230 (4.7%) |
| $50,000 to $54,999 | 356 (6.3%) | 138 (2.8%) |
| $55,000 to $64,999 | 675 (12.0%) | 455 (9.3%) |
| $65,000 to $74,999 | 350 (6.2%) | 94 (1.9%) |
| $75,000 to $99,999 | 356 (6.3%) | 144 (2.9%) |
| $100,000+ | 361 (6.4%) | 78 (1.6%) |
| Total | 5,618 (100.0%) | 4,874 (100.0%) |
Earnings by Sex by Educational Attainment in Poinsett County
Average earnings in Poinsett County are $42,376 for men and $29,480 for women, a difference of 30.4%. Men with an educational attainment of bachelor's degree enjoy the highest average annual earnings of $55,104, while those with less than high school education earn the least with $30,806. Women with an educational attainment of graduate degree earn the most with the average annual earnings of $60,063, while those with less than high school education have the smallest earnings of $18,920.
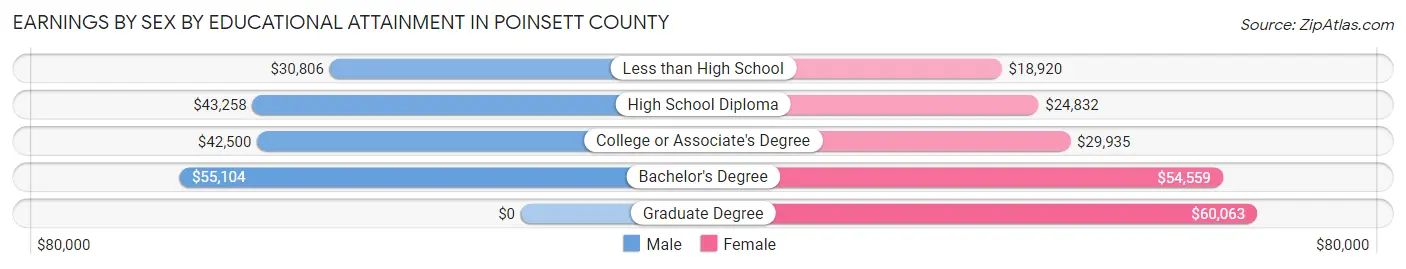
| Educational Attainment | Male Income | Female Income |
| Less than High School | $30,806 | $18,920 |
| High School Diploma | $43,258 | $24,832 |
| College or Associate's Degree | $42,500 | $29,935 |
| Bachelor's Degree | $55,104 | $54,559 |
| Graduate Degree | - | - |
| Total | $42,376 | $29,480 |
Family Income in Poinsett County
Family Income Brackets in Poinsett County
According to the Poinsett County family income data, there are 1,196 families falling into the $50,000 to $74,999 income range, which is the most common income bracket and makes up 20.5% of all families. Conversely, the $10,000 to $14,999 income bracket is the least frequent group with only 175 families (3.0%) belonging to this category.
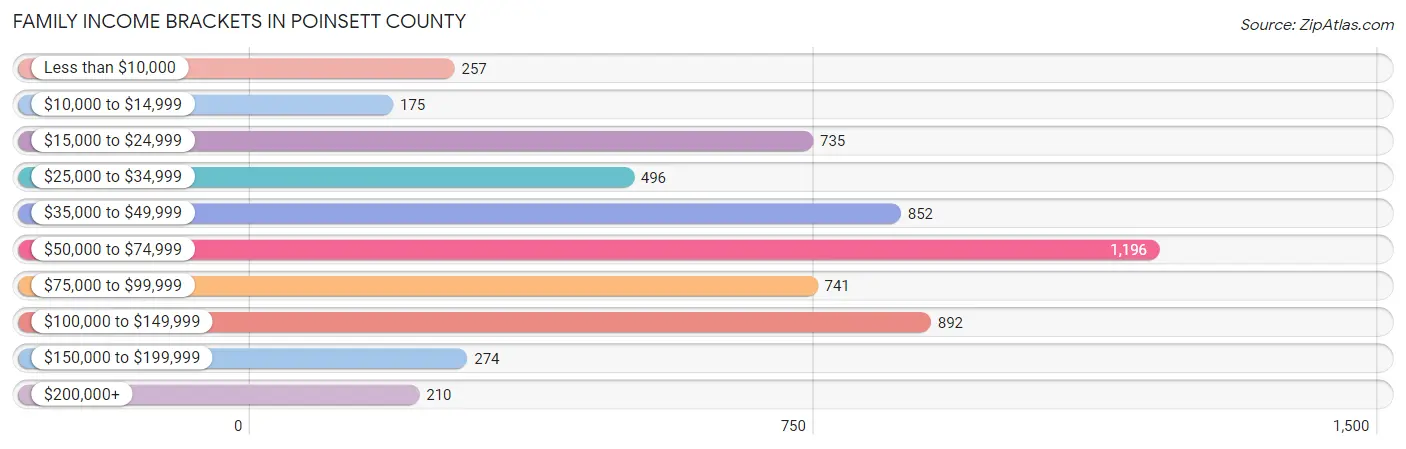
| Income Bracket | # Families | % Families |
| Less than $10,000 | 257 | 4.4% |
| $10,000 to $14,999 | 175 | 3.0% |
| $15,000 to $24,999 | 735 | 12.6% |
| $25,000 to $34,999 | 496 | 8.5% |
| $35,000 to $49,999 | 852 | 14.6% |
| $50,000 to $74,999 | 1,196 | 20.5% |
| $75,000 to $99,999 | 741 | 12.7% |
| $100,000 to $149,999 | 892 | 15.3% |
| $150,000 to $199,999 | 274 | 4.7% |
| $200,000+ | 210 | 3.6% |
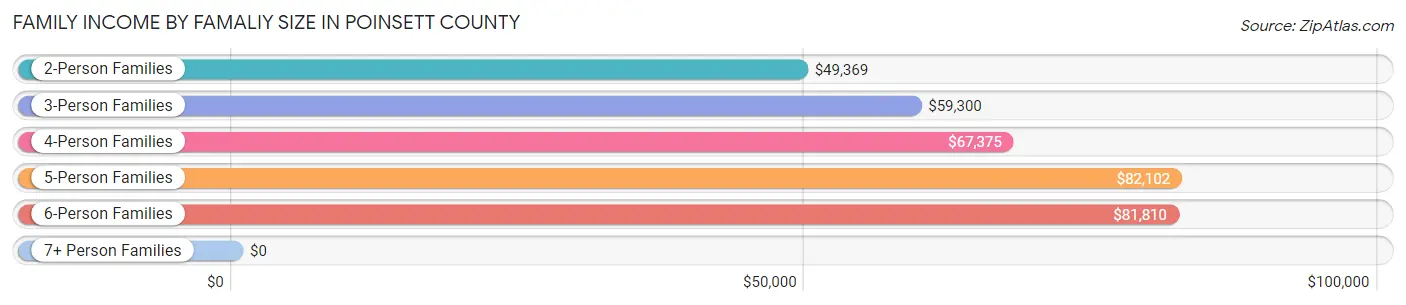
Family Income by Famaliy Size in Poinsett County
5-person families (321 | 5.5%) account for the highest median family income in Poinsett County with $82,102 per family, while 2-person families (2,824 | 48.4%) have the highest median income of $24,684 per family member.
| Income Bracket | # Families | Median Income |
| 2-Person Families | 2,824 (48.4%) | $49,369 |
| 3-Person Families | 1,306 (22.4%) | $59,300 |
| 4-Person Families | 1,191 (20.4%) | $67,375 |
| 5-Person Families | 321 (5.5%) | $82,102 |
| 6-Person Families | 168 (2.9%) | $81,810 |
| 7+ Person Families | 23 (0.4%) | $0 |
| Total | 5,833 (100.0%) | $56,293 |
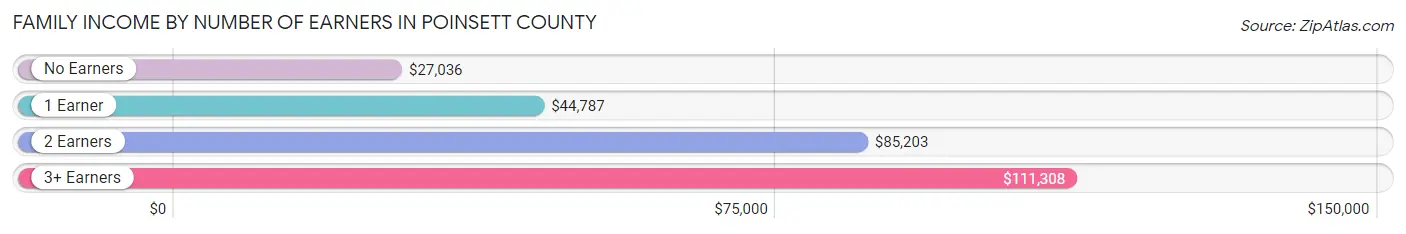
Family Income by Number of Earners in Poinsett County
The median family income in Poinsett County is $56,293, with families comprising 3+ earners (427) having the highest median family income of $111,308, while families with no earners (1,192) have the lowest median family income of $27,036, accounting for 7.3% and 20.4% of families, respectively.
| Number of Earners | # Families | Median Income |
| No Earners | 1,192 (20.4%) | $27,036 |
| 1 Earner | 2,188 (37.5%) | $44,787 |
| 2 Earners | 2,026 (34.7%) | $85,203 |
| 3+ Earners | 427 (7.3%) | $111,308 |
| Total | 5,833 (100.0%) | $56,293 |
Household Income in Poinsett County
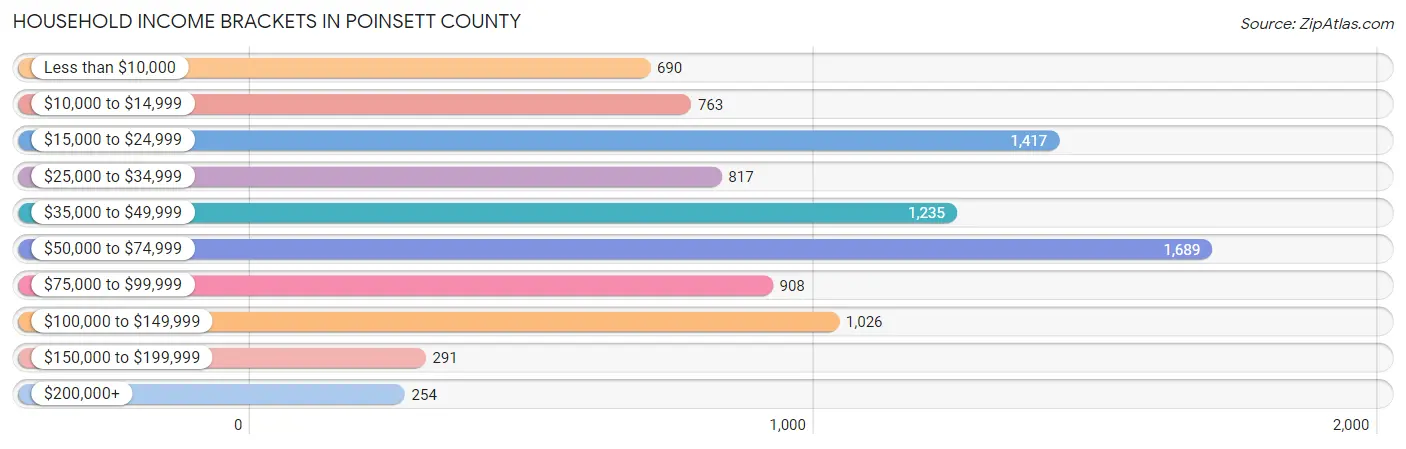
Household Income Brackets in Poinsett County
With 1,689 households falling in the category, the $50,000 to $74,999 income range is the most frequent in Poinsett County, accounting for 18.6% of all households. In contrast, only 254 households (2.8%) fall into the $200,000+ income bracket, making it the least populous group.
| Income Bracket | # Households | % Households |
| Less than $10,000 | 690 | 7.6% |
| $10,000 to $14,999 | 763 | 8.4% |
| $15,000 to $24,999 | 1,417 | 15.6% |
| $25,000 to $34,999 | 817 | 9.0% |
| $35,000 to $49,999 | 1,235 | 13.6% |
| $50,000 to $74,999 | 1,689 | 18.6% |
| $75,000 to $99,999 | 908 | 10.0% |
| $100,000 to $149,999 | 1,026 | 11.3% |
| $150,000 to $199,999 | 291 | 3.2% |
| $200,000+ | 254 | 2.8% |
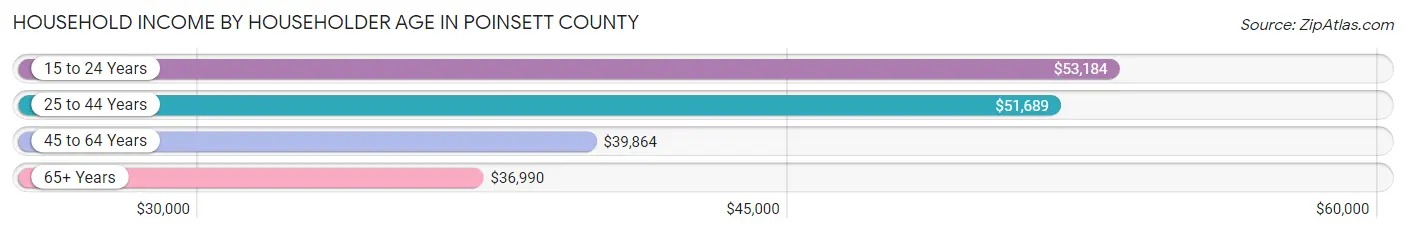
Household Income by Householder Age in Poinsett County
The median household income in Poinsett County is $43,440, with the highest median household income of $53,184 found in the 15 to 24 years age bracket for the primary householder. A total of 387 households (4.3%) fall into this category. Meanwhile, the 65+ years age bracket for the primary householder has the lowest median household income of $36,990, with 2,596 households (28.6%) in this group.
| Income Bracket | # Households | Median Income |
| 15 to 24 Years | 387 (4.3%) | $53,184 |
| 25 to 44 Years | 2,685 (29.6%) | $51,689 |
| 45 to 64 Years | 3,414 (37.6%) | $39,864 |
| 65+ Years | 2,596 (28.6%) | $36,990 |
| Total | 9,082 (100.0%) | $43,440 |
Poverty in Poinsett County
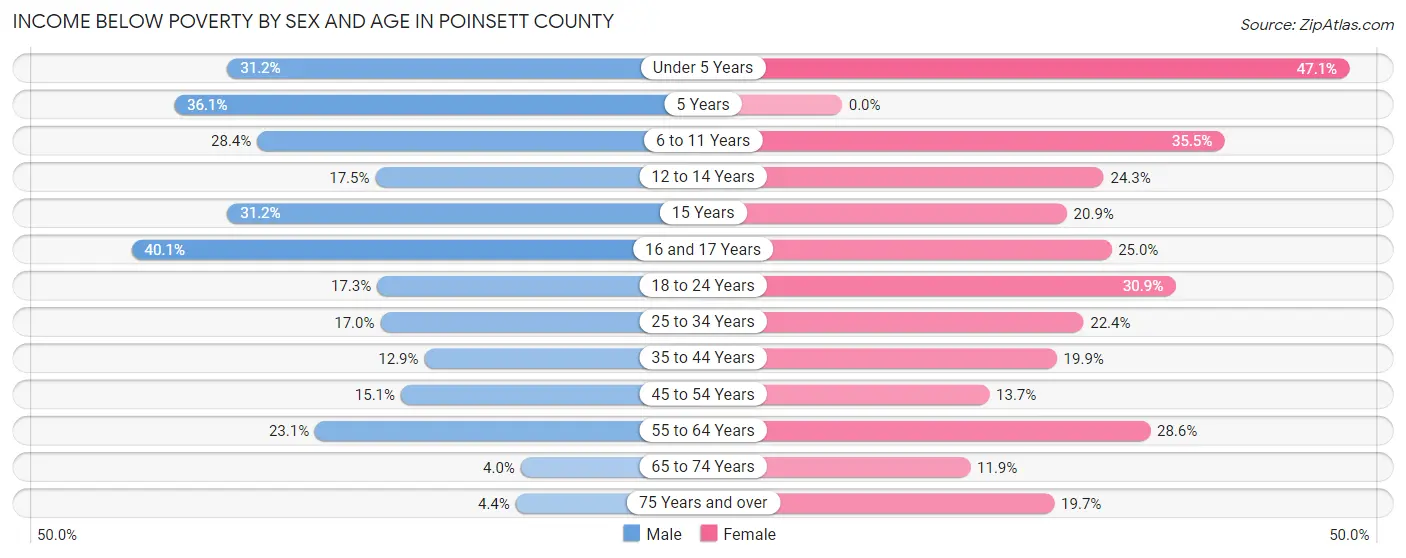
Income Below Poverty by Sex and Age in Poinsett County
With 18.0% poverty level for males and 23.7% for females among the residents of Poinsett County, 16 and 17 year old males and under 5 year old females are the most vulnerable to poverty, with 131 males (40.1%) and 344 females (47.1%) in their respective age groups living below the poverty level.
| Age Bracket | Male | Female |
| Under 5 Years | 227 (31.2%) | 344 (47.1%) |
| 5 Years | 43 (36.1%) | 0 (0.0%) |
| 6 to 11 Years | 243 (28.4%) | 308 (35.5%) |
| 12 to 14 Years | 93 (17.4%) | 120 (24.3%) |
| 15 Years | 53 (31.2%) | 43 (20.9%) |
| 16 and 17 Years | 131 (40.1%) | 64 (25.0%) |
| 18 to 24 Years | 156 (17.3%) | 295 (30.9%) |
| 25 to 34 Years | 239 (17.0%) | 324 (22.4%) |
| 35 to 44 Years | 162 (12.9%) | 248 (19.9%) |
| 45 to 54 Years | 225 (15.1%) | 200 (13.7%) |
| 55 to 64 Years | 343 (23.1%) | 446 (28.6%) |
| 65 to 74 Years | 42 (4.0%) | 159 (11.9%) |
| 75 Years and over | 30 (4.4%) | 178 (19.7%) |
| Total | 1,987 (18.0%) | 2,729 (23.7%) |
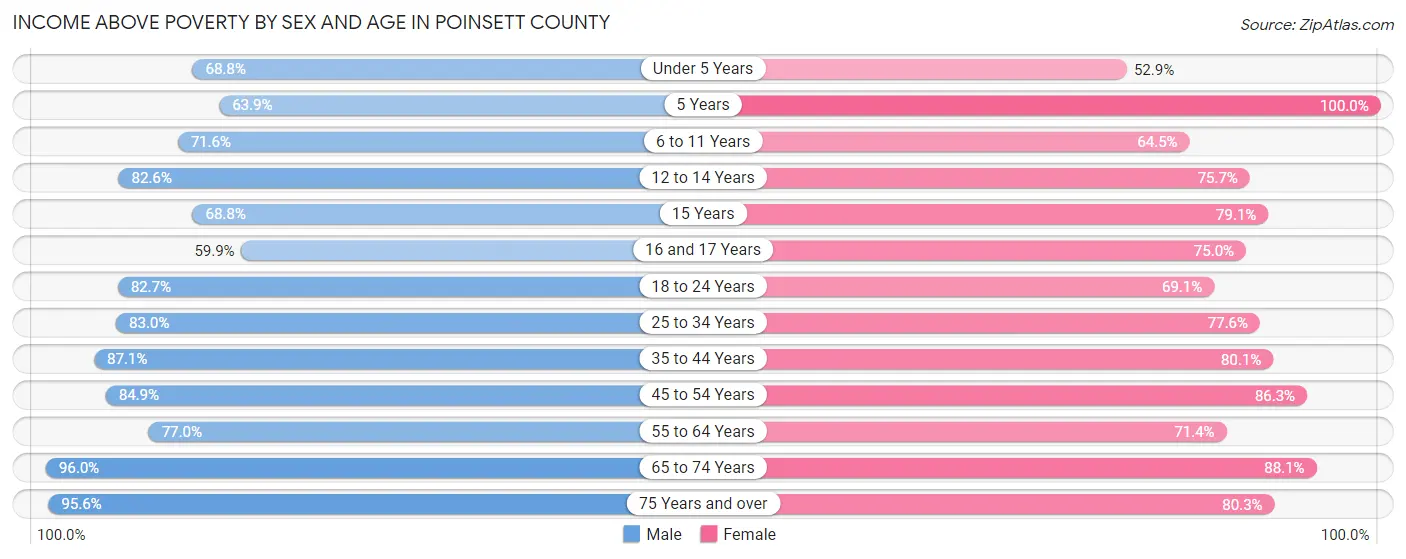
Income Above Poverty by Sex and Age in Poinsett County
According to the poverty statistics in Poinsett County, males aged 65 to 74 years and females aged 5 years are the age groups that are most secure financially, with 96.0% of males and 100.0% of females in these age groups living above the poverty line.
| Age Bracket | Male | Female |
| Under 5 Years | 501 (68.8%) | 387 (52.9%) |
| 5 Years | 76 (63.9%) | 36 (100.0%) |
| 6 to 11 Years | 612 (71.6%) | 560 (64.5%) |
| 12 to 14 Years | 440 (82.6%) | 374 (75.7%) |
| 15 Years | 117 (68.8%) | 163 (79.1%) |
| 16 and 17 Years | 196 (59.9%) | 192 (75.0%) |
| 18 to 24 Years | 746 (82.7%) | 659 (69.1%) |
| 25 to 34 Years | 1,168 (83.0%) | 1,122 (77.6%) |
| 35 to 44 Years | 1,094 (87.1%) | 996 (80.1%) |
| 45 to 54 Years | 1,267 (84.9%) | 1,263 (86.3%) |
| 55 to 64 Years | 1,145 (76.9%) | 1,113 (71.4%) |
| 65 to 74 Years | 1,018 (96.0%) | 1,176 (88.1%) |
| 75 Years and over | 647 (95.6%) | 725 (80.3%) |
| Total | 9,027 (82.0%) | 8,766 (76.3%) |
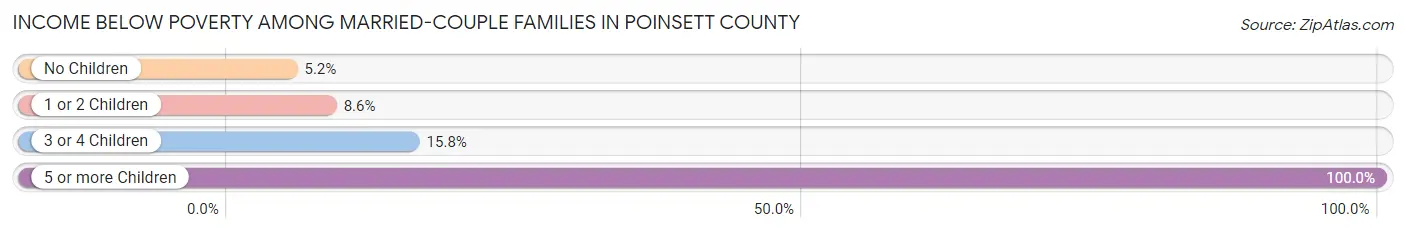
Income Below Poverty Among Married-Couple Families in Poinsett County
The poverty statistics for married-couple families in Poinsett County show that 7.5% or 295 of the total 3,922 families live below the poverty line. Families with 5 or more children have the highest poverty rate of 100.0%, comprising of 17 families. On the other hand, families with no children have the lowest poverty rate of 5.2%, which includes 115 families.
| Children | Above Poverty | Below Poverty |
| No Children | 2,105 (94.8%) | 115 (5.2%) |
| 1 or 2 Children | 1,309 (91.4%) | 123 (8.6%) |
| 3 or 4 Children | 213 (84.2%) | 40 (15.8%) |
| 5 or more Children | 0 (0.0%) | 17 (100.0%) |
| Total | 3,627 (92.5%) | 295 (7.5%) |
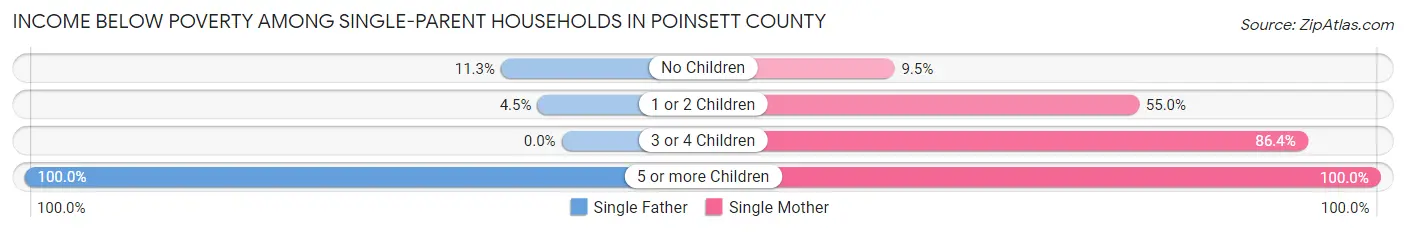
Income Below Poverty Among Single-Parent Households in Poinsett County
According to the poverty data in Poinsett County, 8.1% or 42 single-father households and 42.8% or 596 single-mother households are living below the poverty line. Among single-father households, those with 5 or more children have the highest poverty rate, with 9 households (100.0%) experiencing poverty. Likewise, among single-mother households, those with 5 or more children have the highest poverty rate, with 8 households (100.0%) falling below the poverty line.
| Children | Single Father | Single Mother |
| No Children | 19 (11.3%) | 44 (9.5%) |
| 1 or 2 Children | 14 (4.5%) | 436 (55.0%) |
| 3 or 4 Children | 0 (0.0%) | 108 (86.4%) |
| 5 or more Children | 9 (100.0%) | 8 (100.0%) |
| Total | 42 (8.1%) | 596 (42.8%) |
Income Below Poverty Among Married-Couple vs Single-Parent Households in Poinsett County
The poverty data for Poinsett County shows that 295 of the married-couple family households (7.5%) and 638 of the single-parent households (33.4%) are living below the poverty level. Within the married-couple family households, those with 5 or more children have the highest poverty rate, with 17 households (100.0%) falling below the poverty line. Among the single-parent households, those with 5 or more children have the highest poverty rate, with 17 household (100.0%) living below poverty.
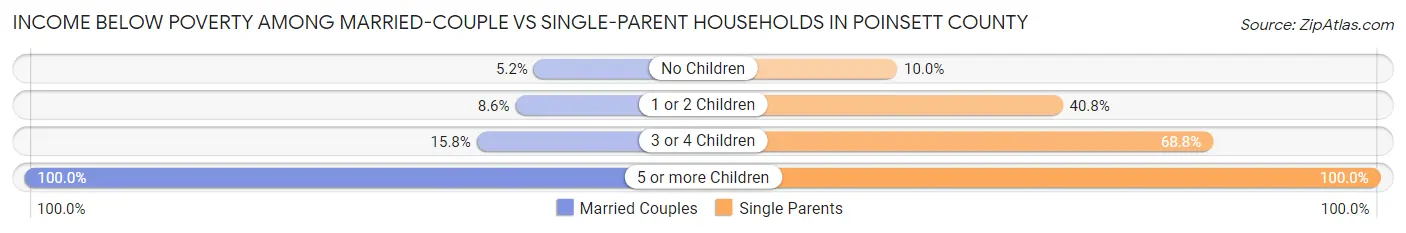
| Children | Married-Couple Families | Single-Parent Households |
| No Children | 115 (5.2%) | 63 (10.0%) |
| 1 or 2 Children | 123 (8.6%) | 450 (40.8%) |
| 3 or 4 Children | 40 (15.8%) | 108 (68.8%) |
| 5 or more Children | 17 (100.0%) | 17 (100.0%) |
| Total | 295 (7.5%) | 638 (33.4%) |
Race in Poinsett County
The most populous races in Poinsett County are White / Caucasian (19,685 | 85.6%), Two or more Races (2,025 | 8.8%), and Black / African American (988 | 4.3%).
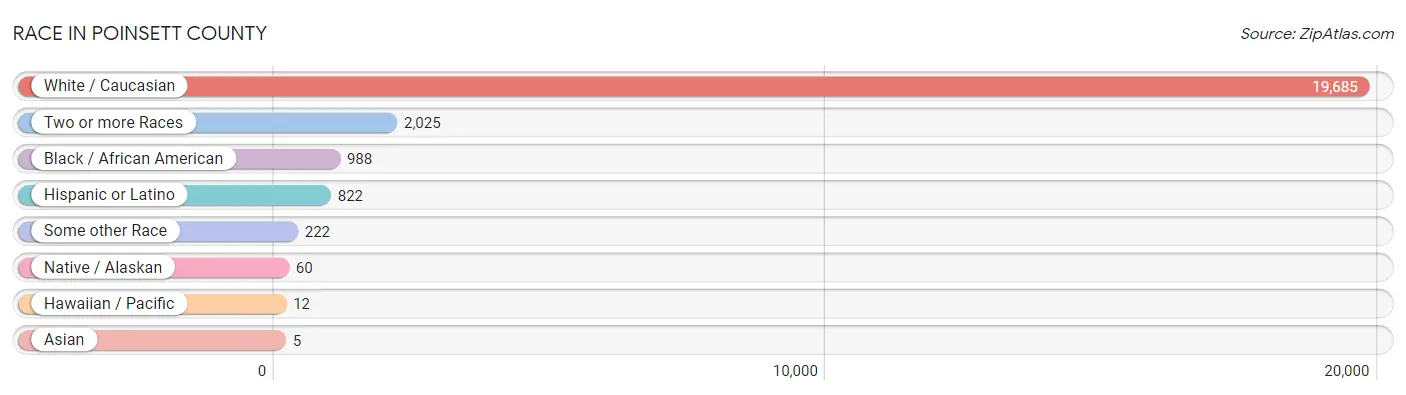
| Race | # Population | % Population |
| Asian | 5 | 0.0% |
| Black / African American | 988 | 4.3% |
| Hawaiian / Pacific | 12 | 0.1% |
| Hispanic or Latino | 822 | 3.6% |
| Native / Alaskan | 60 | 0.3% |
| White / Caucasian | 19,685 | 85.6% |
| Two or more Races | 2,025 | 8.8% |
| Some other Race | 222 | 1.0% |
| Total | 22,997 | 100.0% |
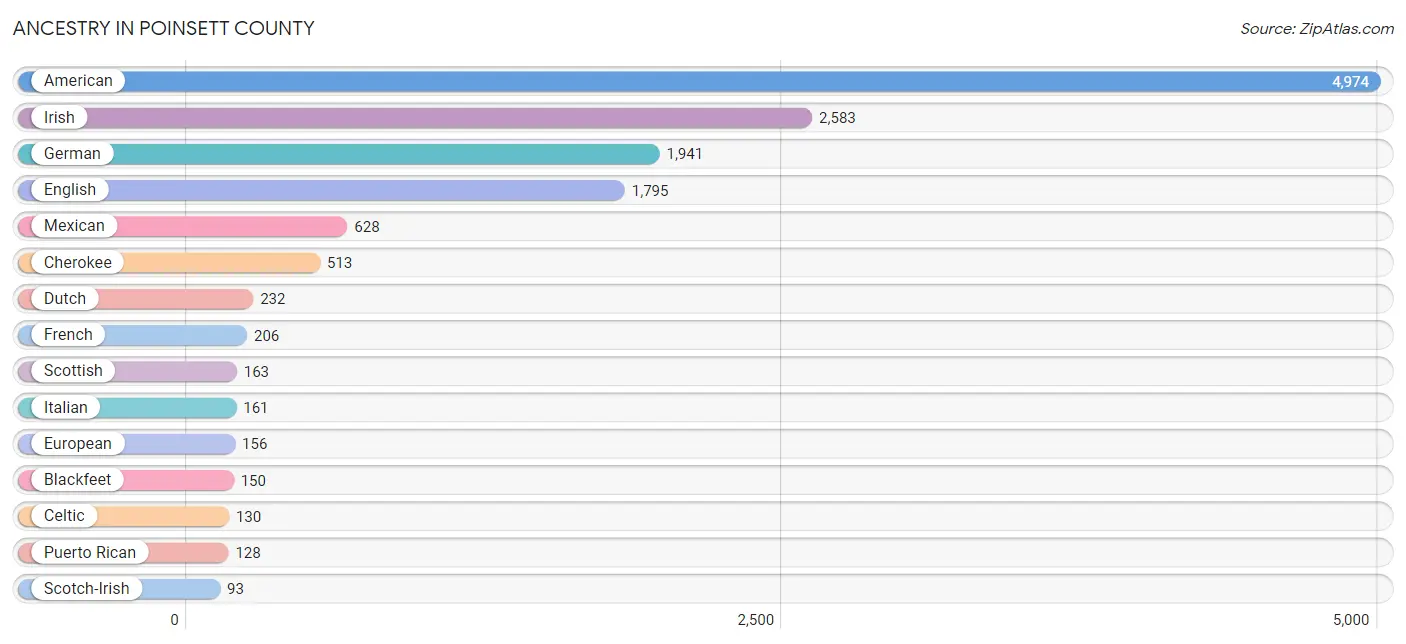
Ancestry in Poinsett County
The most populous ancestries reported in Poinsett County are American (4,974 | 21.6%), Irish (2,583 | 11.2%), German (1,941 | 8.4%), English (1,795 | 7.8%), and Mexican (628 | 2.7%), together accounting for 51.8% of all Poinsett County residents.
| Ancestry | # Population | % Population |
| African | 54 | 0.2% |
| American | 4,974 | 21.6% |
| Apache | 45 | 0.2% |
| Blackfeet | 150 | 0.6% |
| British | 84 | 0.4% |
| Bulgarian | 6 | 0.0% |
| Burmese | 2 | 0.0% |
| Canadian | 50 | 0.2% |
| Celtic | 130 | 0.6% |
| Cherokee | 513 | 2.2% |
| Cheyenne | 3 | 0.0% |
| Chickasaw | 33 | 0.1% |
| Choctaw | 74 | 0.3% |
| Czechoslovakian | 44 | 0.2% |
| Dutch | 232 | 1.0% |
| Dutch West Indian | 26 | 0.1% |
| Eastern European | 20 | 0.1% |
| English | 1,795 | 7.8% |
| European | 156 | 0.7% |
| French | 206 | 0.9% |
| French Canadian | 60 | 0.3% |
| German | 1,941 | 8.4% |
| Hungarian | 5 | 0.0% |
| Indian (Asian) | 31 | 0.1% |
| Irish | 2,583 | 11.2% |
| Italian | 161 | 0.7% |
| Korean | 11 | 0.1% |
| Mexican | 628 | 2.7% |
| Native Hawaiian | 12 | 0.1% |
| Navajo | 18 | 0.1% |
| Nigerian | 16 | 0.1% |
| Norwegian | 58 | 0.3% |
| Pennsylvania German | 8 | 0.0% |
| Polish | 33 | 0.1% |
| Portuguese | 8 | 0.0% |
| Potawatomi | 15 | 0.1% |
| Puerto Rican | 128 | 0.6% |
| Russian | 14 | 0.1% |
| Scotch-Irish | 93 | 0.4% |
| Scottish | 163 | 0.7% |
| Slovak | 10 | 0.0% |
| Spaniard | 6 | 0.0% |
| Spanish | 5 | 0.0% |
| Sri Lankan | 19 | 0.1% |
| Subsaharan African | 70 | 0.3% |
| Swedish | 6 | 0.0% |
| Swiss | 60 | 0.3% |
| Thai | 4 | 0.0% |
| Welsh | 22 | 0.1% | View All 49 Rows |
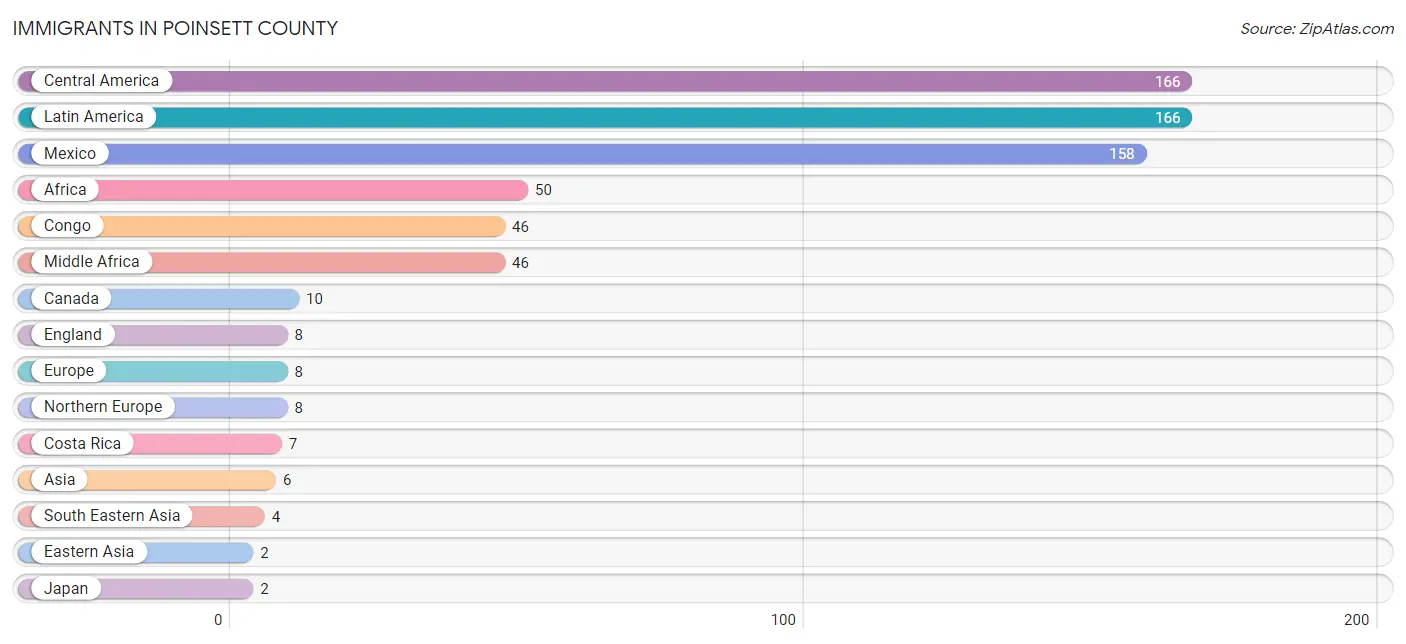
Immigrants in Poinsett County
The most numerous immigrant groups reported in Poinsett County came from Central America (166 | 0.7%), Latin America (166 | 0.7%), Mexico (158 | 0.7%), Africa (50 | 0.2%), and Congo (46 | 0.2%), together accounting for 2.6% of all Poinsett County residents.
| Immigration Origin | # Population | % Population |
| Africa | 50 | 0.2% |
| Asia | 6 | 0.0% |
| Canada | 10 | 0.0% |
| Central America | 166 | 0.7% |
| Congo | 46 | 0.2% |
| Costa Rica | 7 | 0.0% |
| Eastern Asia | 2 | 0.0% |
| El Salvador | 1 | 0.0% |
| England | 8 | 0.0% |
| Europe | 8 | 0.0% |
| Japan | 2 | 0.0% |
| Latin America | 166 | 0.7% |
| Mexico | 158 | 0.7% |
| Middle Africa | 46 | 0.2% |
| Northern Europe | 8 | 0.0% |
| Philippines | 2 | 0.0% |
| South Eastern Asia | 4 | 0.0% |
| Vietnam | 2 | 0.0% | View All 18 Rows |
Sex and Age in Poinsett County
Sex and Age in Poinsett County
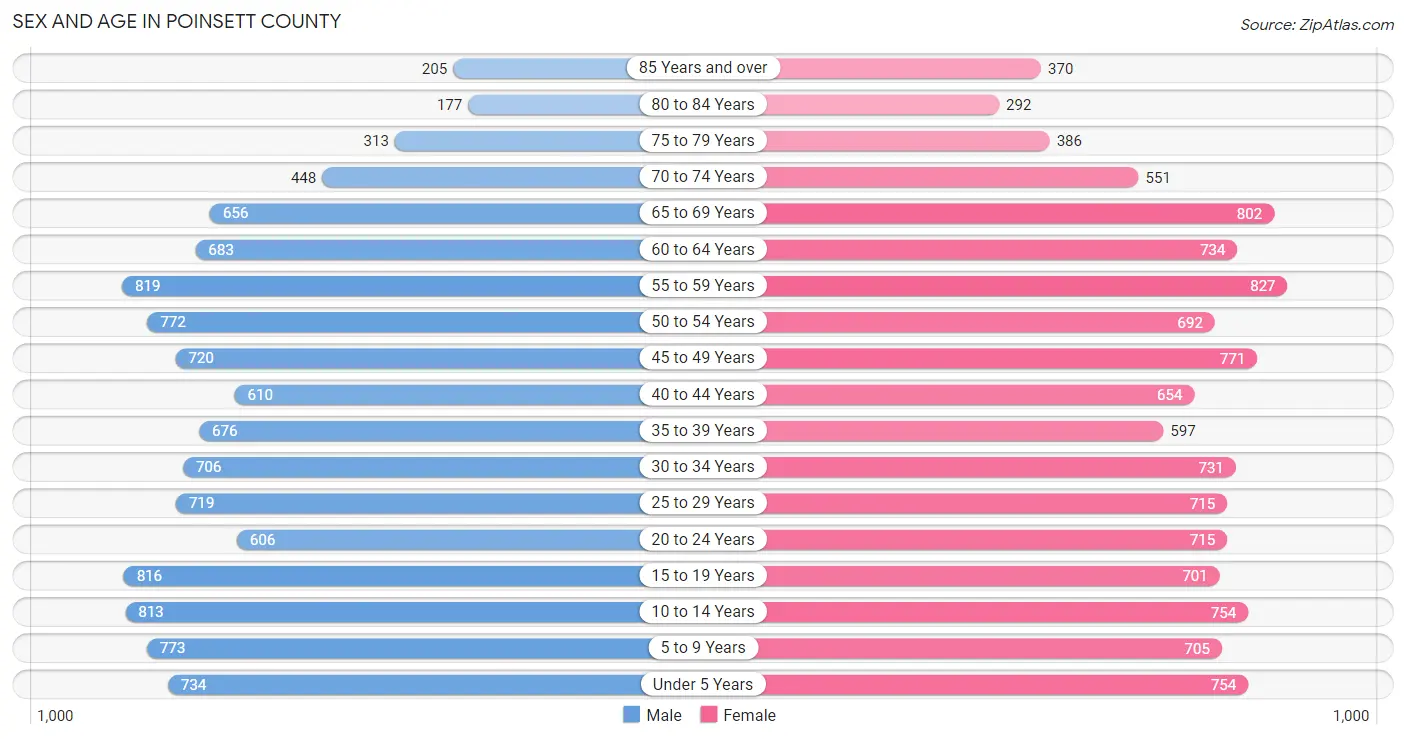
The most populous age groups in Poinsett County are 55 to 59 Years (819 | 7.3%) for men and 55 to 59 Years (827 | 7.0%) for women.
| Age Bracket | Male | Female |
| Under 5 Years | 734 (6.5%) | 754 (6.4%) |
| 5 to 9 Years | 773 (6.9%) | 705 (6.0%) |
| 10 to 14 Years | 813 (7.2%) | 754 (6.4%) |
| 15 to 19 Years | 816 (7.3%) | 701 (6.0%) |
| 20 to 24 Years | 606 (5.4%) | 715 (6.1%) |
| 25 to 29 Years | 719 (6.4%) | 715 (6.1%) |
| 30 to 34 Years | 706 (6.3%) | 731 (6.2%) |
| 35 to 39 Years | 676 (6.0%) | 597 (5.1%) |
| 40 to 44 Years | 610 (5.4%) | 654 (5.6%) |
| 45 to 49 Years | 720 (6.4%) | 771 (6.6%) |
| 50 to 54 Years | 772 (6.9%) | 692 (5.9%) |
| 55 to 59 Years | 819 (7.3%) | 827 (7.0%) |
| 60 to 64 Years | 683 (6.1%) | 734 (6.2%) |
| 65 to 69 Years | 656 (5.8%) | 802 (6.8%) |
| 70 to 74 Years | 448 (4.0%) | 551 (4.7%) |
| 75 to 79 Years | 313 (2.8%) | 386 (3.3%) |
| 80 to 84 Years | 177 (1.6%) | 292 (2.5%) |
| 85 Years and over | 205 (1.8%) | 370 (3.2%) |
| Total | 11,246 (100.0%) | 11,751 (100.0%) |
Families and Households in Poinsett County
Median Family Size in Poinsett County
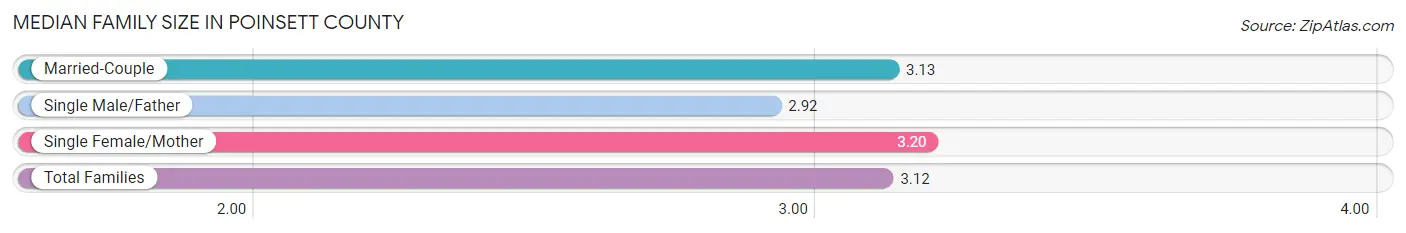
The median family size in Poinsett County is 3.12 persons per family, with single female/mother families (1,391 | 23.8%) accounting for the largest median family size of 3.2 persons per family. On the other hand, single male/father families (520 | 8.9%) represent the smallest median family size with 2.92 persons per family.
| Family Type | # Families | Family Size |
| Married-Couple | 3,922 (67.2%) | 3.13 |
| Single Male/Father | 520 (8.9%) | 2.92 |
| Single Female/Mother | 1,391 (23.8%) | 3.20 |
| Total Families | 5,833 (100.0%) | 3.12 |
Median Household Size in Poinsett County
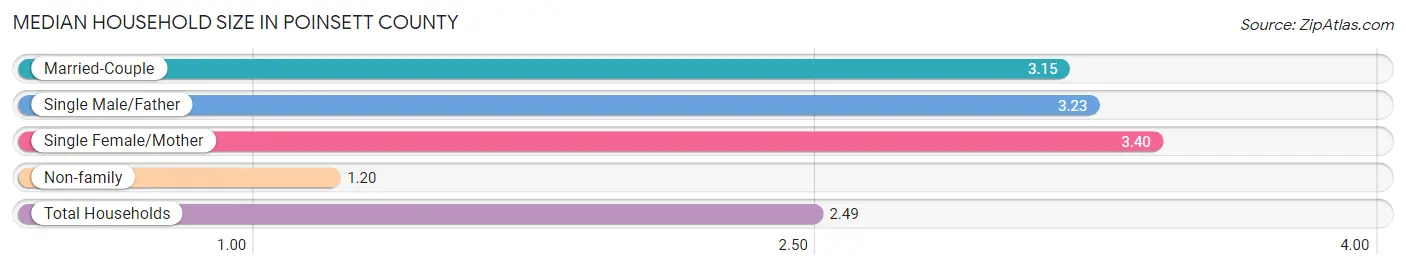
The median household size in Poinsett County is 2.49 persons per household, with single female/mother households (1,391 | 15.3%) accounting for the largest median household size of 3.4 persons per household. non-family households (3,249 | 35.8%) represent the smallest median household size with 1.20 persons per household.
| Household Type | # Households | Household Size |
| Married-Couple | 3,922 (43.2%) | 3.15 |
| Single Male/Father | 520 (5.7%) | 3.23 |
| Single Female/Mother | 1,391 (15.3%) | 3.40 |
| Non-family | 3,249 (35.8%) | 1.20 |
| Total Households | 9,082 (100.0%) | 2.49 |
Household Size by Marriage Status in Poinsett County
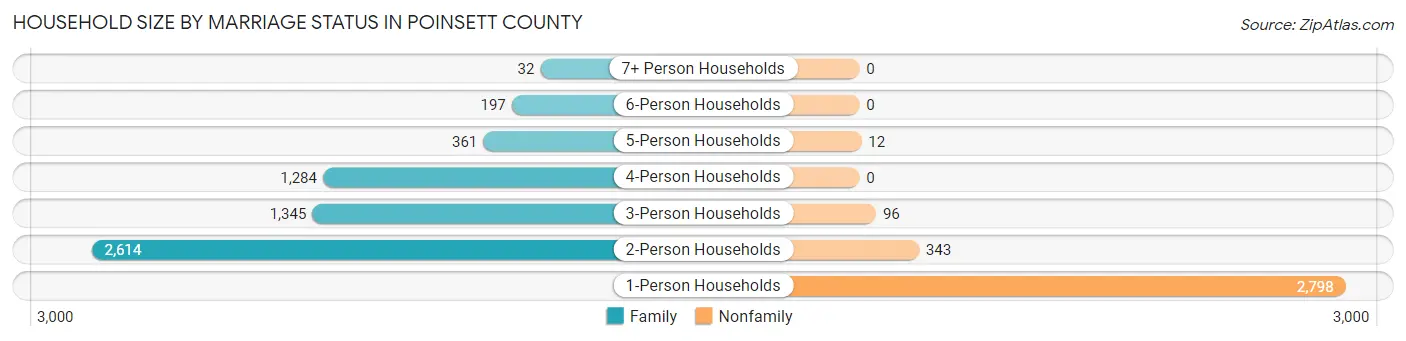
Out of a total of 9,082 households in Poinsett County, 5,833 (64.2%) are family households, while 3,249 (35.8%) are nonfamily households. The most numerous type of family households are 2-person households, comprising 2,614, and the most common type of nonfamily households are 1-person households, comprising 2,798.
| Household Size | Family Households | Nonfamily Households |
| 1-Person Households | - | 2,798 (30.8%) |
| 2-Person Households | 2,614 (28.8%) | 343 (3.8%) |
| 3-Person Households | 1,345 (14.8%) | 96 (1.1%) |
| 4-Person Households | 1,284 (14.1%) | 0 (0.0%) |
| 5-Person Households | 361 (4.0%) | 12 (0.1%) |
| 6-Person Households | 197 (2.2%) | 0 (0.0%) |
| 7+ Person Households | 32 (0.4%) | 0 (0.0%) |
| Total | 5,833 (64.2%) | 3,249 (35.8%) |
Female Fertility in Poinsett County
Fertility by Age in Poinsett County
Average fertility rate in Poinsett County is 37.0 births per 1,000 women. Women in the age bracket of 20 to 34 years have the highest fertility rate with 82.0 births per 1,000 women. Women in the age bracket of 20 to 34 years acount for 93.7% of all women with births.
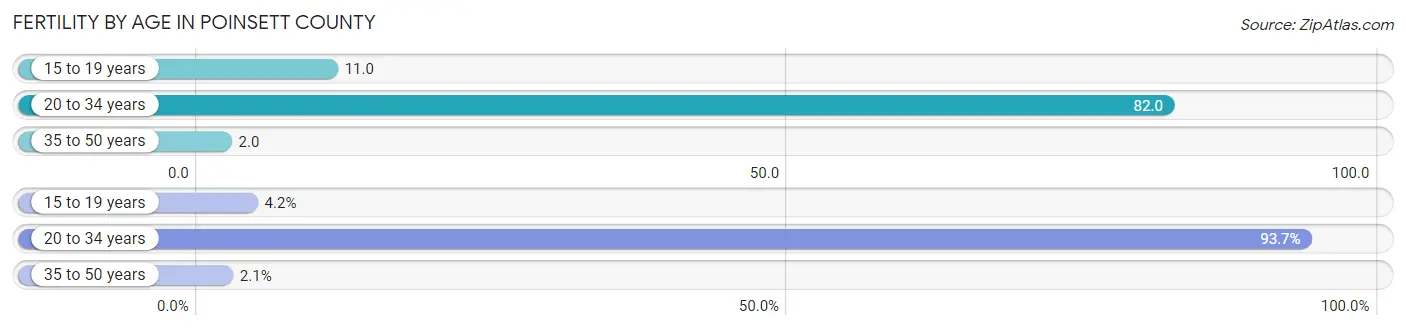
| Age Bracket | Women with Births | Births / 1,000 Women |
| 15 to 19 years | 8 (4.2%) | 11.0 |
| 20 to 34 years | 178 (93.7%) | 82.0 |
| 35 to 50 years | 4 (2.1%) | 2.0 |
| Total | 190 (100.0%) | 37.0 |
Fertility by Age by Marriage Status in Poinsett County
94.7% of women with births (190) in Poinsett County are married. The highest percentage of unmarried women with births falls into 15 to 19 years age bracket with 100.0% of them unmarried at the time of birth, while the lowest percentage of unmarried women with births belong to 35 to 50 years age bracket with 0.0% of them unmarried.
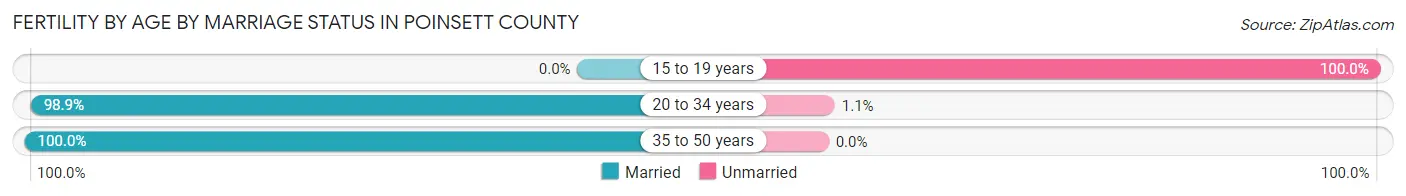
| Age Bracket | Married | Unmarried |
| 15 to 19 years | 0 (0.0%) | 8 (100.0%) |
| 20 to 34 years | 176 (98.9%) | 2 (1.1%) |
| 35 to 50 years | 4 (100.0%) | 0 (0.0%) |
| Total | 180 (94.7%) | 10 (5.3%) |
Fertility by Education in Poinsett County
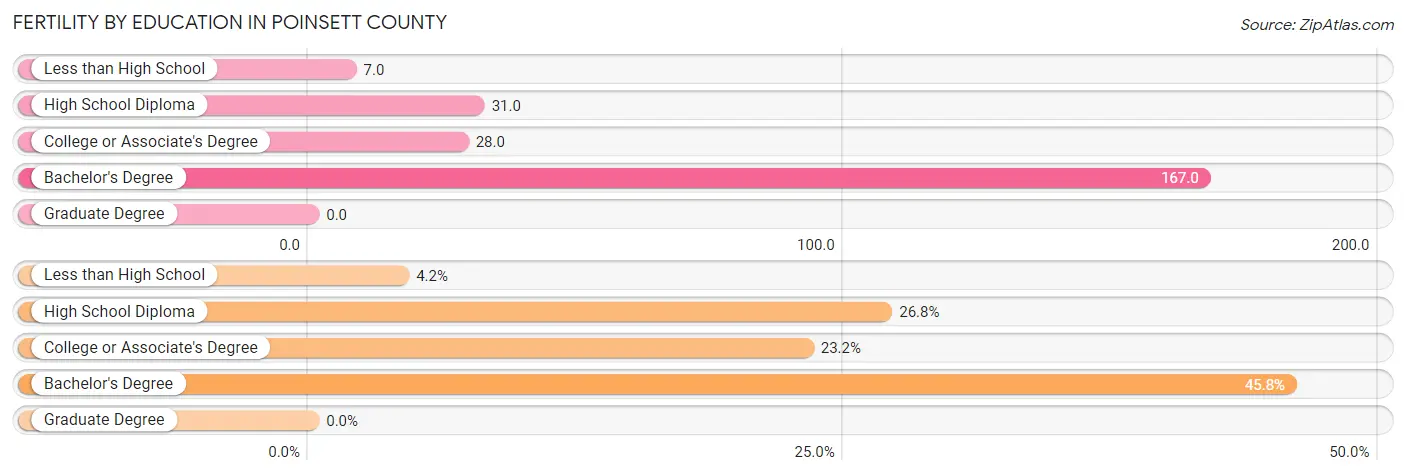
| Educational Attainment | Women with Births | Births / 1,000 Women |
| Less than High School | 8 (4.2%) | 7.0 |
| High School Diploma | 51 (26.8%) | 31.0 |
| College or Associate's Degree | 44 (23.2%) | 28.0 |
| Bachelor's Degree | 87 (45.8%) | 167.0 |
| Graduate Degree | 0 (0.0%) | 0.0 |
| Total | 190 (100.0%) | 37.0 |
Fertility by Education by Marriage Status in Poinsett County
5.3% of women with births in Poinsett County are unmarried. Women with the educational attainment of college or associate's degree are most likely to be married with 100.0% of them married at childbirth, while women with the educational attainment of less than high school are least likely to be married with 100.0% of them unmarried at childbirth.
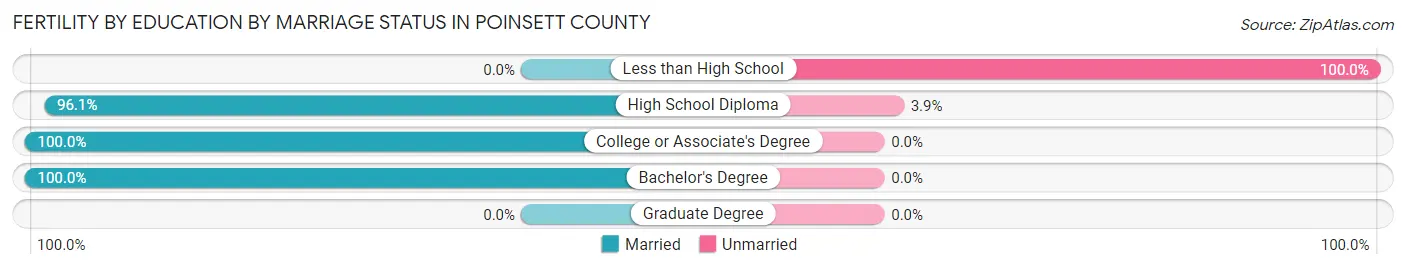
| Educational Attainment | Married | Unmarried |
| Less than High School | 0 (0.0%) | 8 (100.0%) |
| High School Diploma | 49 (96.1%) | 2 (3.9%) |
| College or Associate's Degree | 44 (100.0%) | 0 (0.0%) |
| Bachelor's Degree | 87 (100.0%) | 0 (0.0%) |
| Graduate Degree | 0 (0.0%) | 0 (0.0%) |
| Total | 180 (94.7%) | 10 (5.3%) |
Employment Characteristics in Poinsett County
Employment by Class of Employer in Poinsett County
Among the 9,114 employed individuals in Poinsett County, private company employees (6,541 | 71.8%), local government employees (681 | 7.5%), and self-employed (not incorporated) (600 | 6.6%) make up the most common classes of employment.
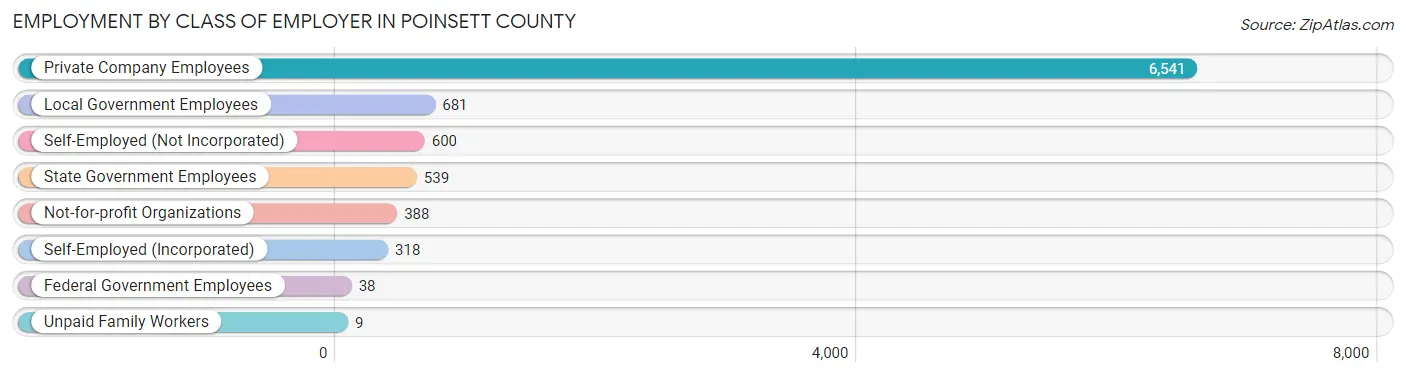
| Employer Class | # Employees | % Employees |
| Private Company Employees | 6,541 | 71.8% |
| Self-Employed (Incorporated) | 318 | 3.5% |
| Self-Employed (Not Incorporated) | 600 | 6.6% |
| Not-for-profit Organizations | 388 | 4.3% |
| Local Government Employees | 681 | 7.5% |
| State Government Employees | 539 | 5.9% |
| Federal Government Employees | 38 | 0.4% |
| Unpaid Family Workers | 9 | 0.1% |
| Total | 9,114 | 100.0% |
Employment Status by Age in Poinsett County
According to the labor force statistics for Poinsett County, out of the total population over 16 years of age (18,088), 54.9% or 9,930 individuals are in the labor force, with 5.1% or 506 of them unemployed. The age group with the highest labor force participation rate is 20 to 24 years, with 79.9% or 1,055 individuals in the labor force. Within the labor force, the 16 to 19 years age range has the highest percentage of unemployed individuals, with 13.8% or 53 of them being unemployed.
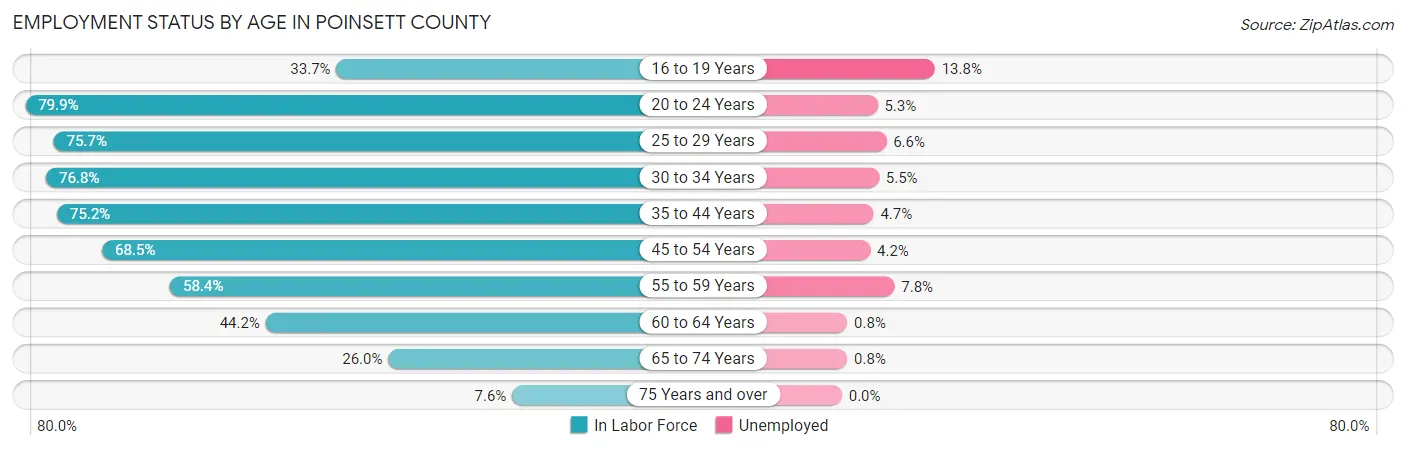
| Age Bracket | In Labor Force | Unemployed |
| 16 to 19 Years | 385 (33.7%) | 53 (13.8%) |
| 20 to 24 Years | 1,055 (79.9%) | 56 (5.3%) |
| 25 to 29 Years | 1,086 (75.7%) | 72 (6.6%) |
| 30 to 34 Years | 1,104 (76.8%) | 61 (5.5%) |
| 35 to 44 Years | 1,908 (75.2%) | 90 (4.7%) |
| 45 to 54 Years | 2,024 (68.5%) | 85 (4.2%) |
| 55 to 59 Years | 961 (58.4%) | 75 (7.8%) |
| 60 to 64 Years | 626 (44.2%) | 5 (0.8%) |
| 65 to 74 Years | 639 (26.0%) | 5 (0.8%) |
| 75 Years and over | 132 (7.6%) | 0 (0.0%) |
| Total | 9,930 (54.9%) | 506 (5.1%) |
Employment Status by Educational Attainment in Poinsett County
According to labor force statistics for Poinsett County, 67.5% of individuals (7,713) out of the total population between 25 and 64 years of age (11,426) are in the labor force, with 5.0% or 386 of them being unemployed. The group with the highest labor force participation rate are those with the educational attainment of bachelor's degree or higher, with 88.5% or 1,304 individuals in the labor force. Within the labor force, individuals with less than high school education have the highest percentage of unemployment, with 12.3% or 94 of them being unemployed.
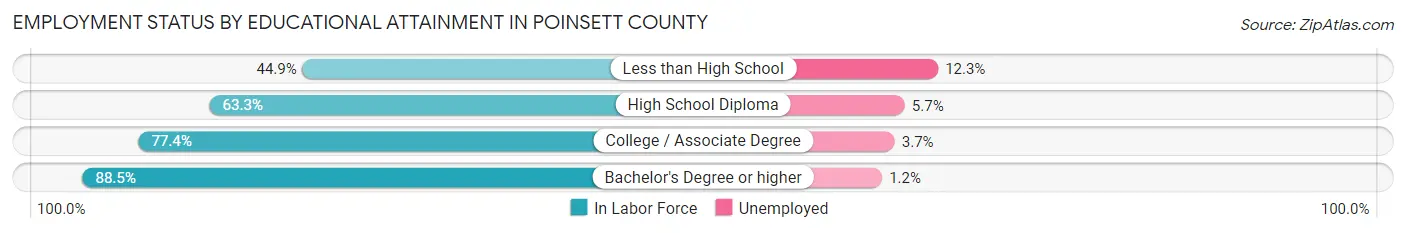
| Educational Attainment | In Labor Force | Unemployed |
| Less than High School | 762 (44.9%) | 209 (12.3%) |
| High School Diploma | 3,341 (63.3%) | 301 (5.7%) |
| College / Associate Degree | 2,305 (77.4%) | 110 (3.7%) |
| Bachelor's Degree or higher | 1,304 (88.5%) | 18 (1.2%) |
| Total | 7,713 (67.5%) | 571 (5.0%) |
Employment Occupations by Sex in Poinsett County
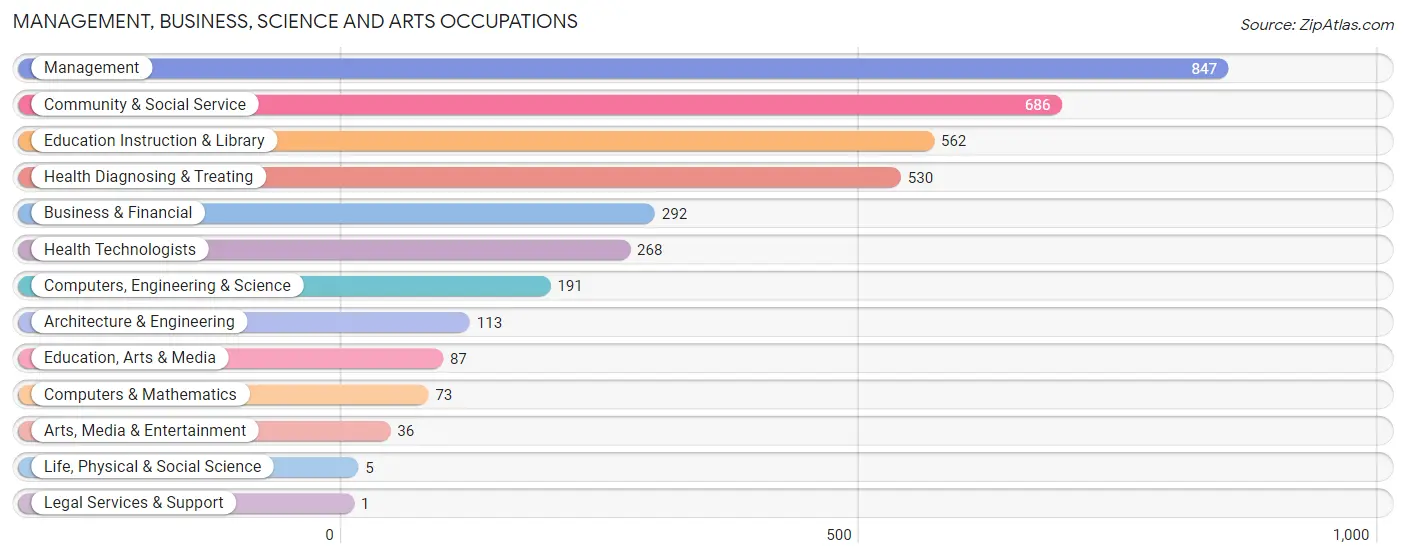
Management, Business, Science and Arts Occupations
The most common Management, Business, Science and Arts occupations in Poinsett County are Management (847 | 9.0%), Community & Social Service (686 | 7.3%), Education Instruction & Library (562 | 6.0%), Health Diagnosing & Treating (530 | 5.6%), and Business & Financial (292 | 3.1%).
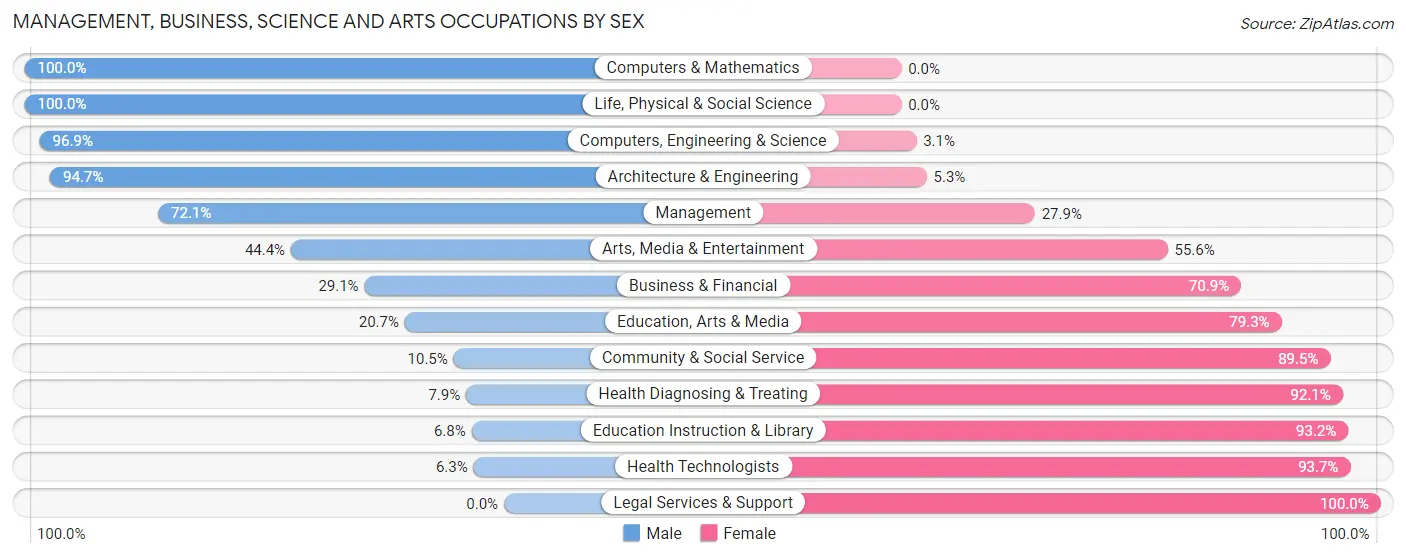
Management, Business, Science and Arts Occupations by Sex
Within the Management, Business, Science and Arts occupations in Poinsett County, the most male-oriented occupations are Computers & Mathematics (100.0%), Life, Physical & Social Science (100.0%), and Computers, Engineering & Science (96.9%), while the most female-oriented occupations are Legal Services & Support (100.0%), Health Technologists (93.7%), and Education Instruction & Library (93.2%).
| Occupation | Male | Female |
| Management | 611 (72.1%) | 236 (27.9%) |
| Business & Financial | 85 (29.1%) | 207 (70.9%) |
| Computers, Engineering & Science | 185 (96.9%) | 6 (3.1%) |
| Computers & Mathematics | 73 (100.0%) | 0 (0.0%) |
| Architecture & Engineering | 107 (94.7%) | 6 (5.3%) |
| Life, Physical & Social Science | 5 (100.0%) | 0 (0.0%) |
| Community & Social Service | 72 (10.5%) | 614 (89.5%) |
| Education, Arts & Media | 18 (20.7%) | 69 (79.3%) |
| Legal Services & Support | 0 (0.0%) | 1 (100.0%) |
| Education Instruction & Library | 38 (6.8%) | 524 (93.2%) |
| Arts, Media & Entertainment | 16 (44.4%) | 20 (55.6%) |
| Health Diagnosing & Treating | 42 (7.9%) | 488 (92.1%) |
| Health Technologists | 17 (6.3%) | 251 (93.7%) |
| Total (Category) | 995 (39.1%) | 1,551 (60.9%) |
| Total (Overall) | 4,970 (52.8%) | 4,449 (47.2%) |
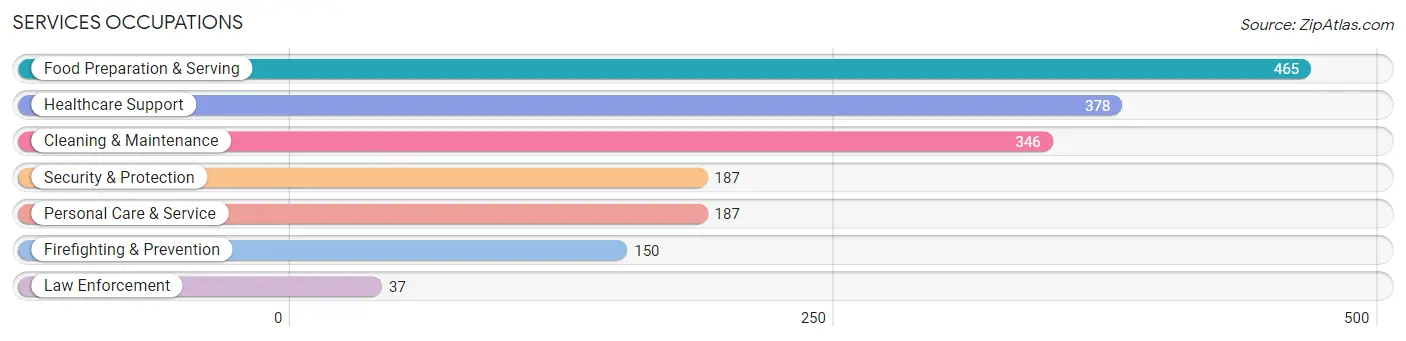
Services Occupations
The most common Services occupations in Poinsett County are Food Preparation & Serving (465 | 4.9%), Healthcare Support (378 | 4.0%), Cleaning & Maintenance (346 | 3.7%), Security & Protection (187 | 2.0%), and Personal Care & Service (187 | 2.0%).
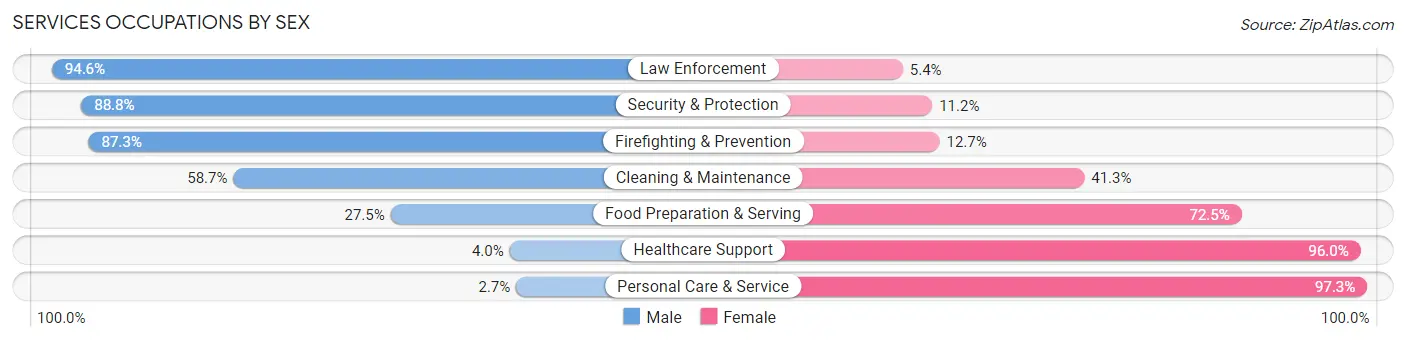
Services Occupations by Sex
Within the Services occupations in Poinsett County, the most male-oriented occupations are Law Enforcement (94.6%), Security & Protection (88.8%), and Firefighting & Prevention (87.3%), while the most female-oriented occupations are Personal Care & Service (97.3%), Healthcare Support (96.0%), and Food Preparation & Serving (72.5%).
| Occupation | Male | Female |
| Healthcare Support | 15 (4.0%) | 363 (96.0%) |
| Security & Protection | 166 (88.8%) | 21 (11.2%) |
| Firefighting & Prevention | 131 (87.3%) | 19 (12.7%) |
| Law Enforcement | 35 (94.6%) | 2 (5.4%) |
| Food Preparation & Serving | 128 (27.5%) | 337 (72.5%) |
| Cleaning & Maintenance | 203 (58.7%) | 143 (41.3%) |
| Personal Care & Service | 5 (2.7%) | 182 (97.3%) |
| Total (Category) | 517 (33.1%) | 1,046 (66.9%) |
| Total (Overall) | 4,970 (52.8%) | 4,449 (47.2%) |
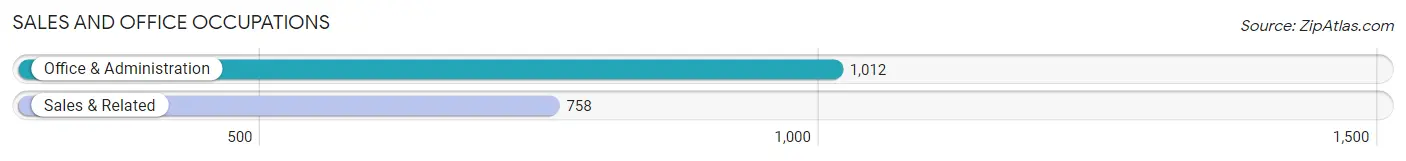
Sales and Office Occupations
The most common Sales and Office occupations in Poinsett County are Office & Administration (1,012 | 10.7%), and Sales & Related (758 | 8.1%).
Sales and Office Occupations by Sex

| Occupation | Male | Female |
| Sales & Related | 353 (46.6%) | 405 (53.4%) |
| Office & Administration | 139 (13.7%) | 873 (86.3%) |
| Total (Category) | 492 (27.8%) | 1,278 (72.2%) |
| Total (Overall) | 4,970 (52.8%) | 4,449 (47.2%) |
Natural Resources, Construction and Maintenance Occupations
The most common Natural Resources, Construction and Maintenance occupations in Poinsett County are Installation, Maintenance & Repair (448 | 4.8%), Farming, Fishing & Forestry (311 | 3.3%), and Construction & Extraction (280 | 3.0%).

Natural Resources, Construction and Maintenance Occupations by Sex
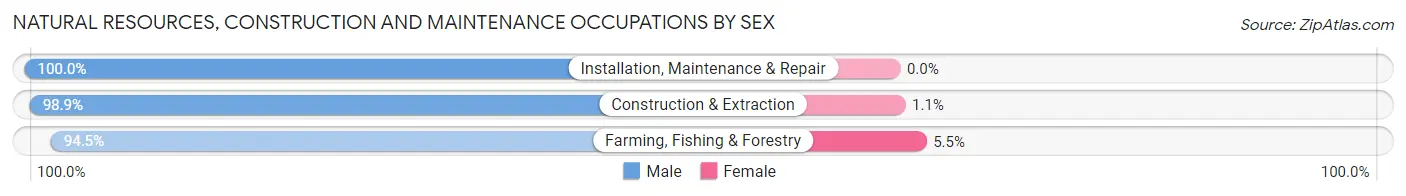
| Occupation | Male | Female |
| Farming, Fishing & Forestry | 294 (94.5%) | 17 (5.5%) |
| Construction & Extraction | 277 (98.9%) | 3 (1.1%) |
| Installation, Maintenance & Repair | 448 (100.0%) | 0 (0.0%) |
| Total (Category) | 1,019 (98.1%) | 20 (1.9%) |
| Total (Overall) | 4,970 (52.8%) | 4,449 (47.2%) |
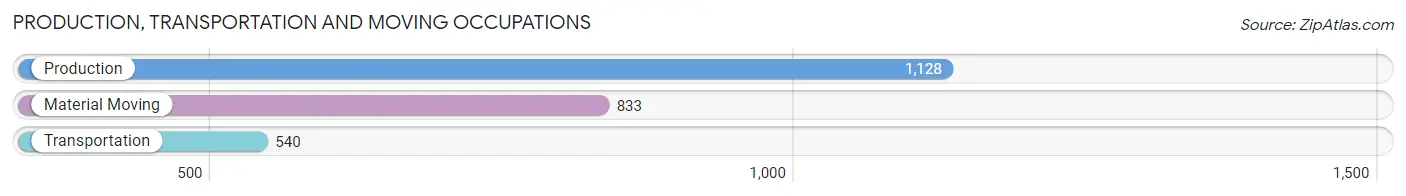
Production, Transportation and Moving Occupations
The most common Production, Transportation and Moving occupations in Poinsett County are Production (1,128 | 12.0%), Material Moving (833 | 8.8%), and Transportation (540 | 5.7%).
Production, Transportation and Moving Occupations by Sex
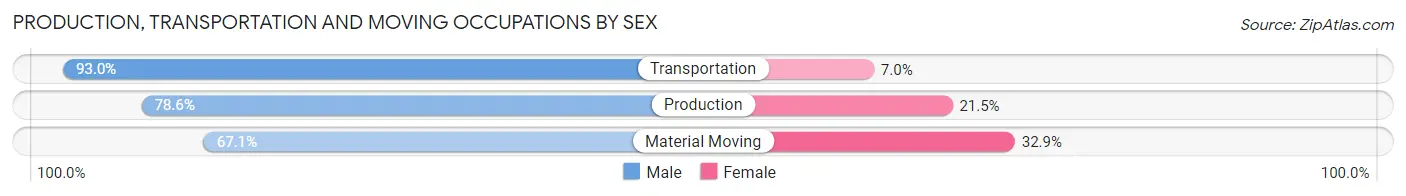
| Occupation | Male | Female |
| Production | 886 (78.5%) | 242 (21.4%) |
| Transportation | 502 (93.0%) | 38 (7.0%) |
| Material Moving | 559 (67.1%) | 274 (32.9%) |
| Total (Category) | 1,947 (77.8%) | 554 (22.2%) |
| Total (Overall) | 4,970 (52.8%) | 4,449 (47.2%) |
Employment Industries by Sex in Poinsett County
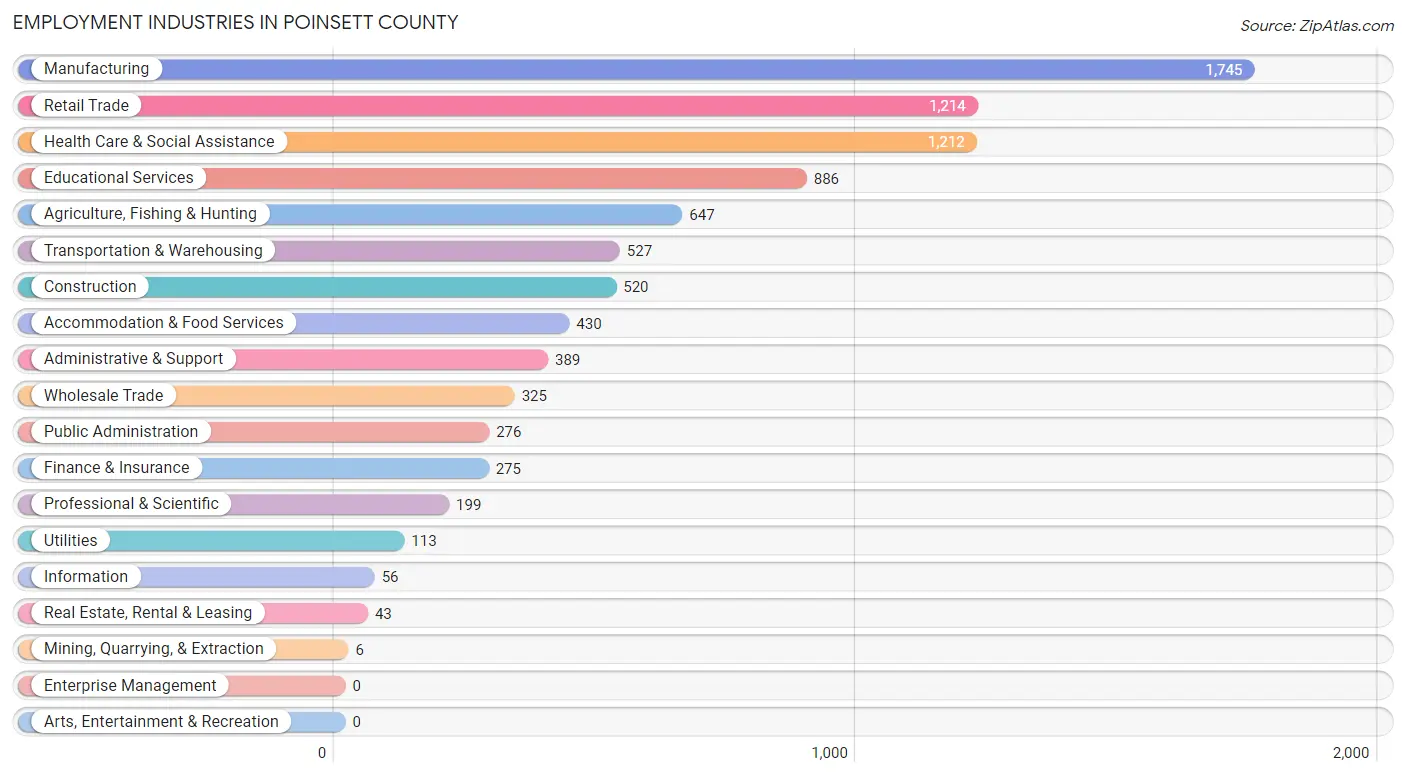
Employment Industries in Poinsett County
The major employment industries in Poinsett County include Manufacturing (1,745 | 18.5%), Retail Trade (1,214 | 12.9%), Health Care & Social Assistance (1,212 | 12.9%), Educational Services (886 | 9.4%), and Agriculture, Fishing & Hunting (647 | 6.9%).
Employment Industries by Sex in Poinsett County
The Poinsett County industries that see more men than women are Wholesale Trade (93.2%), Agriculture, Fishing & Hunting (89.2%), and Construction (88.3%), whereas the industries that tend to have a higher number of women are Finance & Insurance (88.7%), Health Care & Social Assistance (88.0%), and Educational Services (76.9%).
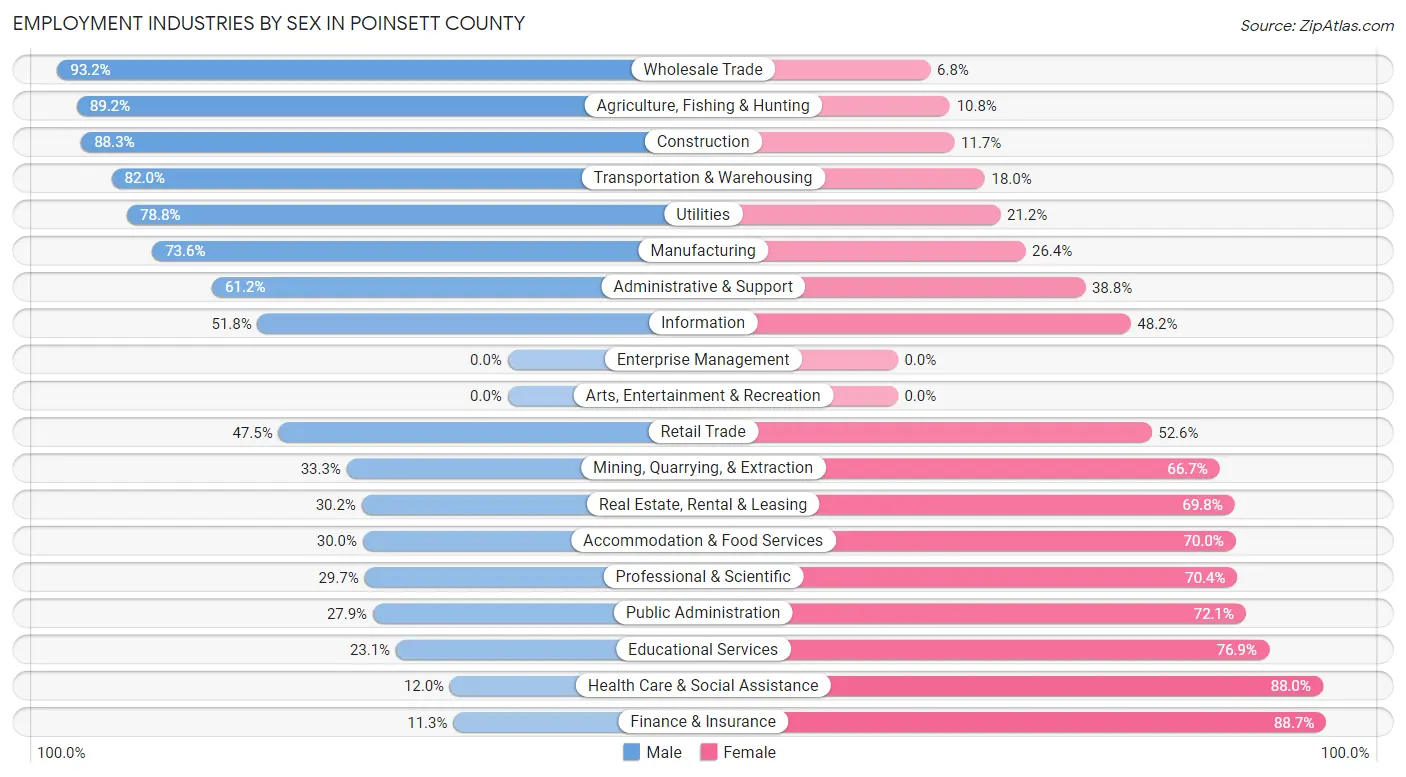
| Industry | Male | Female |
| Agriculture, Fishing & Hunting | 577 (89.2%) | 70 (10.8%) |
| Mining, Quarrying, & Extraction | 2 (33.3%) | 4 (66.7%) |
| Construction | 459 (88.3%) | 61 (11.7%) |
| Manufacturing | 1,284 (73.6%) | 461 (26.4%) |
| Wholesale Trade | 303 (93.2%) | 22 (6.8%) |
| Retail Trade | 576 (47.4%) | 638 (52.5%) |
| Transportation & Warehousing | 432 (82.0%) | 95 (18.0%) |
| Utilities | 89 (78.8%) | 24 (21.2%) |
| Information | 29 (51.8%) | 27 (48.2%) |
| Finance & Insurance | 31 (11.3%) | 244 (88.7%) |
| Real Estate, Rental & Leasing | 13 (30.2%) | 30 (69.8%) |
| Professional & Scientific | 59 (29.6%) | 140 (70.4%) |
| Enterprise Management | 0 (0.0%) | 0 (0.0%) |
| Administrative & Support | 238 (61.2%) | 151 (38.8%) |
| Educational Services | 205 (23.1%) | 681 (76.9%) |
| Health Care & Social Assistance | 145 (12.0%) | 1,067 (88.0%) |
| Arts, Entertainment & Recreation | 0 (0.0%) | 0 (0.0%) |
| Accommodation & Food Services | 129 (30.0%) | 301 (70.0%) |
| Public Administration | 77 (27.9%) | 199 (72.1%) |
| Total | 4,970 (52.8%) | 4,449 (47.2%) |
Education in Poinsett County
School Enrollment in Poinsett County
The most common levels of schooling among the 5,133 students in Poinsett County are high school (1,295 | 25.2%), middle school (1,281 | 25.0%), and elementary school (1,246 | 24.3%).
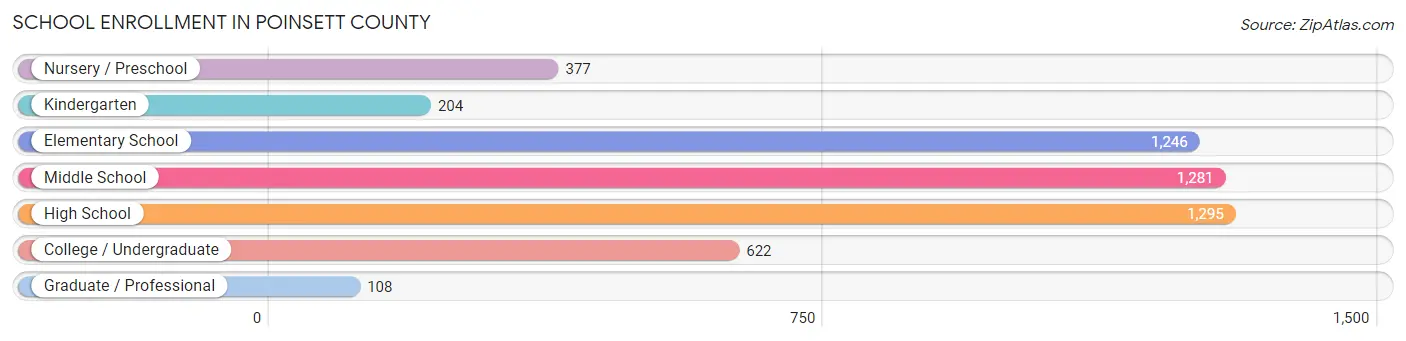
| School Level | # Students | % Students |
| Nursery / Preschool | 377 | 7.3% |
| Kindergarten | 204 | 4.0% |
| Elementary School | 1,246 | 24.3% |
| Middle School | 1,281 | 25.0% |
| High School | 1,295 | 25.2% |
| College / Undergraduate | 622 | 12.1% |
| Graduate / Professional | 108 | 2.1% |
| Total | 5,133 | 100.0% |
School Enrollment by Age by Funding Source in Poinsett County
Out of a total of 5,133 students who are enrolled in schools in Poinsett County, 431 (8.4%) attend a private institution, while the remaining 4,702 (91.6%) are enrolled in public schools. The age group of 35 years and over has the highest likelihood of being enrolled in private schools, with 103 (46.8% in the age bracket) enrolled. Conversely, the age group of 20 to 24 year olds has the lowest likelihood of being enrolled in a private school, with 330 (100.0% in the age bracket) attending a public institution.
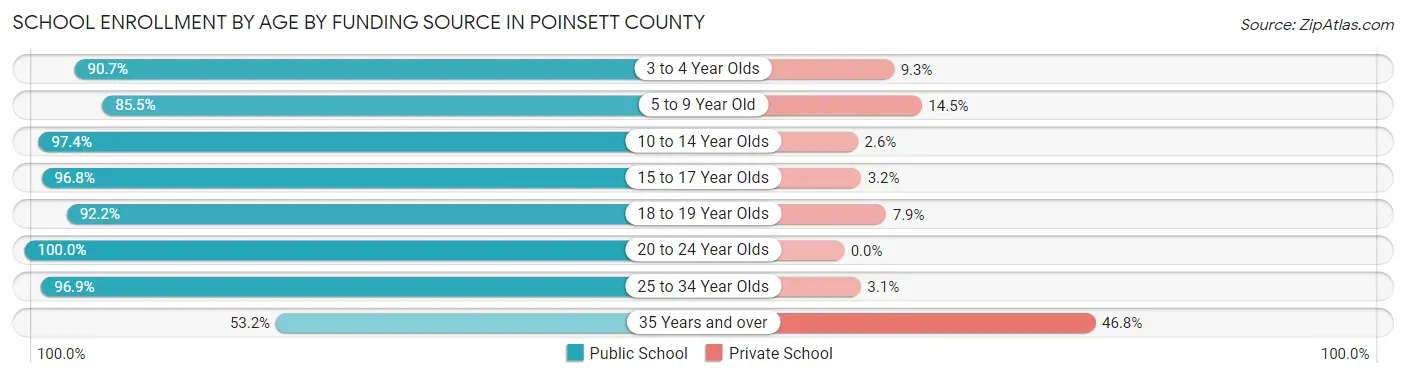
| Age Bracket | Public School | Private School |
| 3 to 4 Year Olds | 292 (90.7%) | 30 (9.3%) |
| 5 to 9 Year Old | 1,181 (85.5%) | 200 (14.5%) |
| 10 to 14 Year Olds | 1,497 (97.4%) | 40 (2.6%) |
| 15 to 17 Year Olds | 887 (96.8%) | 29 (3.2%) |
| 18 to 19 Year Olds | 305 (92.1%) | 26 (7.9%) |
| 20 to 24 Year Olds | 330 (100.0%) | 0 (0.0%) |
| 25 to 34 Year Olds | 93 (96.9%) | 3 (3.1%) |
| 35 Years and over | 117 (53.2%) | 103 (46.8%) |
| Total | 4,702 (91.6%) | 431 (8.4%) |
Educational Attainment by Field of Study in Poinsett County
Education (501 | 27.0%), business (372 | 20.1%), science & technology (259 | 14.0%), bio, nature & agricultural (239 | 12.9%), and liberal arts & history (81 | 4.4%) are the most common fields of study among 1,853 individuals in Poinsett County who have obtained a bachelor's degree or higher.
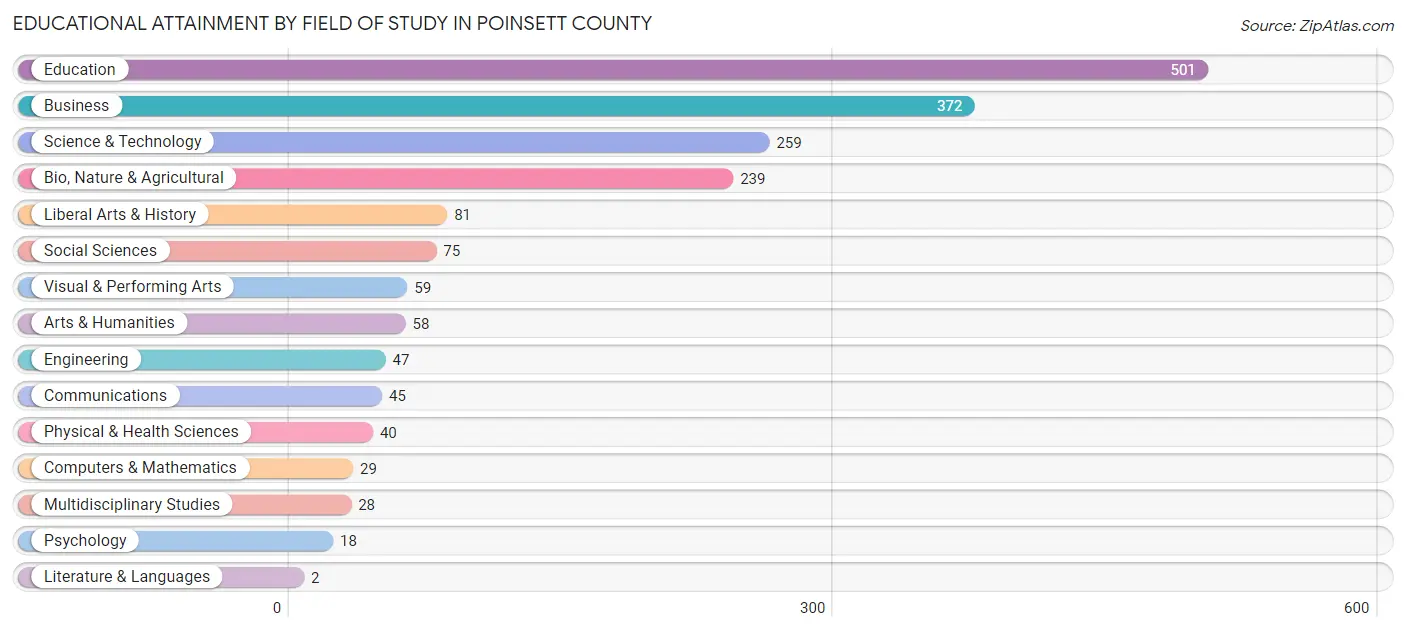
| Field of Study | # Graduates | % Graduates |
| Computers & Mathematics | 29 | 1.6% |
| Bio, Nature & Agricultural | 239 | 12.9% |
| Physical & Health Sciences | 40 | 2.2% |
| Psychology | 18 | 1.0% |
| Social Sciences | 75 | 4.1% |
| Engineering | 47 | 2.5% |
| Multidisciplinary Studies | 28 | 1.5% |
| Science & Technology | 259 | 14.0% |
| Business | 372 | 20.1% |
| Education | 501 | 27.0% |
| Literature & Languages | 2 | 0.1% |
| Liberal Arts & History | 81 | 4.4% |
| Visual & Performing Arts | 59 | 3.2% |
| Communications | 45 | 2.4% |
| Arts & Humanities | 58 | 3.1% |
| Total | 1,853 | 100.0% |
Transportation & Commute in Poinsett County
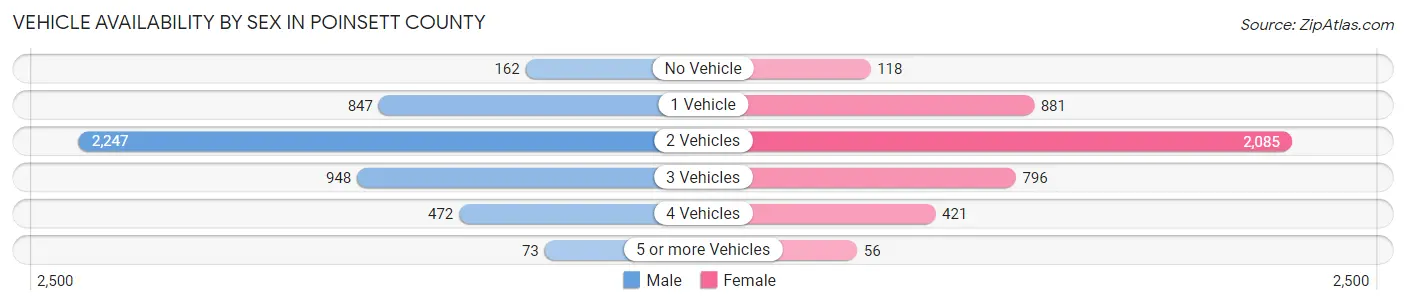
Vehicle Availability by Sex in Poinsett County
The most prevalent vehicle ownership categories in Poinsett County are males with 2 vehicles (2,247, accounting for 47.3%) and females with 2 vehicles (2,085, making up 51.6%).
| Vehicles Available | Male | Female |
| No Vehicle | 162 (3.4%) | 118 (2.7%) |
| 1 Vehicle | 847 (17.8%) | 881 (20.2%) |
| 2 Vehicles | 2,247 (47.3%) | 2,085 (47.8%) |
| 3 Vehicles | 948 (20.0%) | 796 (18.3%) |
| 4 Vehicles | 472 (9.9%) | 421 (9.7%) |
| 5 or more Vehicles | 73 (1.5%) | 56 (1.3%) |
| Total | 4,749 (100.0%) | 4,357 (100.0%) |
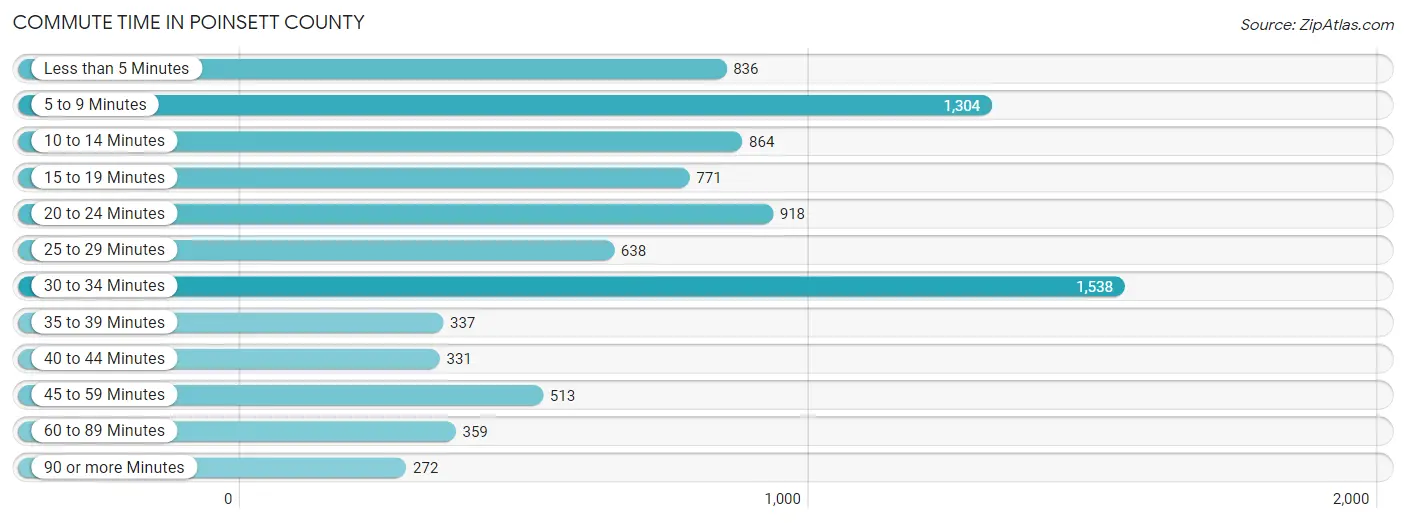
Commute Time in Poinsett County
The most frequently occuring commute durations in Poinsett County are 30 to 34 minutes (1,538 commuters, 17.7%), 5 to 9 minutes (1,304 commuters, 15.0%), and 20 to 24 minutes (918 commuters, 10.6%).
| Commute Time | # Commuters | % Commuters |
| Less than 5 Minutes | 836 | 9.6% |
| 5 to 9 Minutes | 1,304 | 15.0% |
| 10 to 14 Minutes | 864 | 10.0% |
| 15 to 19 Minutes | 771 | 8.9% |
| 20 to 24 Minutes | 918 | 10.6% |
| 25 to 29 Minutes | 638 | 7.3% |
| 30 to 34 Minutes | 1,538 | 17.7% |
| 35 to 39 Minutes | 337 | 3.9% |
| 40 to 44 Minutes | 331 | 3.8% |
| 45 to 59 Minutes | 513 | 5.9% |
| 60 to 89 Minutes | 359 | 4.1% |
| 90 or more Minutes | 272 | 3.1% |
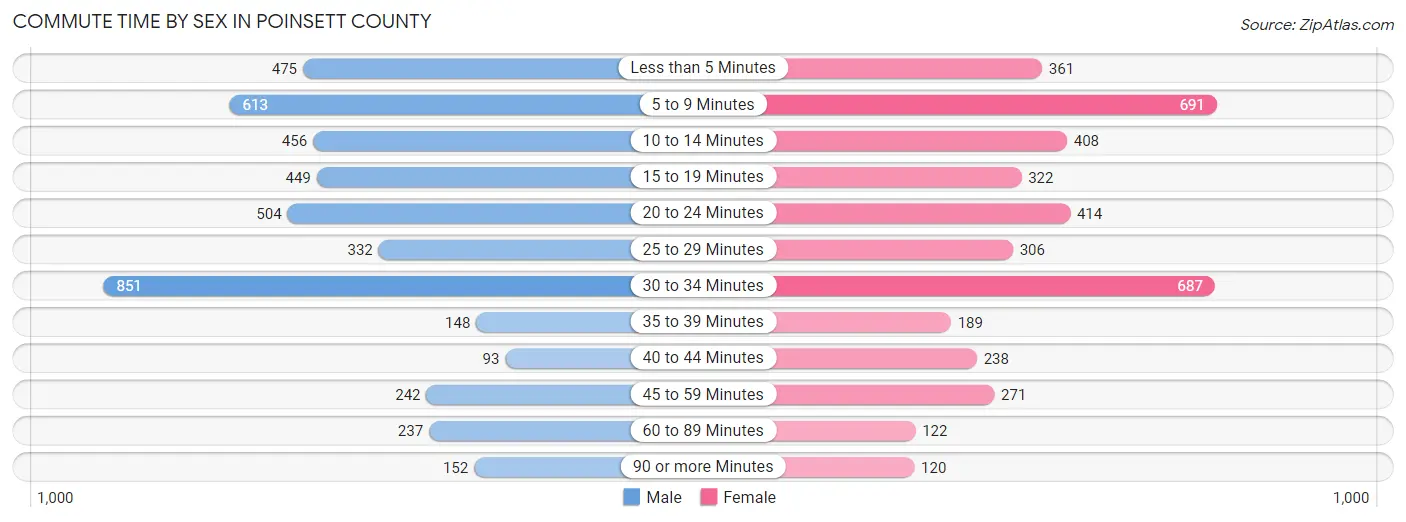
Commute Time by Sex in Poinsett County
The most common commute times in Poinsett County are 30 to 34 minutes (851 commuters, 18.7%) for males and 5 to 9 minutes (691 commuters, 16.7%) for females.
| Commute Time | Male | Female |
| Less than 5 Minutes | 475 (10.4%) | 361 (8.7%) |
| 5 to 9 Minutes | 613 (13.5%) | 691 (16.7%) |
| 10 to 14 Minutes | 456 (10.0%) | 408 (9.9%) |
| 15 to 19 Minutes | 449 (9.9%) | 322 (7.8%) |
| 20 to 24 Minutes | 504 (11.1%) | 414 (10.0%) |
| 25 to 29 Minutes | 332 (7.3%) | 306 (7.4%) |
| 30 to 34 Minutes | 851 (18.7%) | 687 (16.6%) |
| 35 to 39 Minutes | 148 (3.3%) | 189 (4.6%) |
| 40 to 44 Minutes | 93 (2.0%) | 238 (5.8%) |
| 45 to 59 Minutes | 242 (5.3%) | 271 (6.6%) |
| 60 to 89 Minutes | 237 (5.2%) | 122 (2.9%) |
| 90 or more Minutes | 152 (3.3%) | 120 (2.9%) |
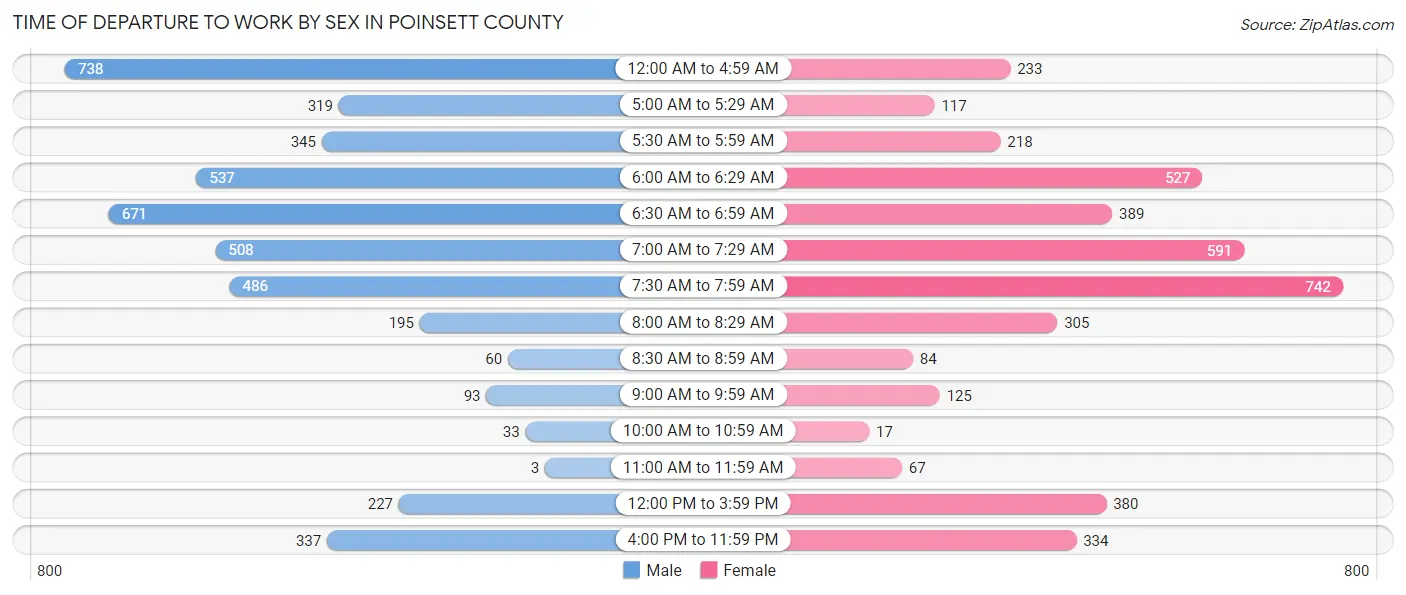
Time of Departure to Work by Sex in Poinsett County
The most frequent times of departure to work in Poinsett County are 12:00 AM to 4:59 AM (738, 16.2%) for males and 7:30 AM to 7:59 AM (742, 18.0%) for females.
| Time of Departure | Male | Female |
| 12:00 AM to 4:59 AM | 738 (16.2%) | 233 (5.6%) |
| 5:00 AM to 5:29 AM | 319 (7.0%) | 117 (2.8%) |
| 5:30 AM to 5:59 AM | 345 (7.6%) | 218 (5.3%) |
| 6:00 AM to 6:29 AM | 537 (11.8%) | 527 (12.8%) |
| 6:30 AM to 6:59 AM | 671 (14.7%) | 389 (9.4%) |
| 7:00 AM to 7:29 AM | 508 (11.2%) | 591 (14.3%) |
| 7:30 AM to 7:59 AM | 486 (10.7%) | 742 (18.0%) |
| 8:00 AM to 8:29 AM | 195 (4.3%) | 305 (7.4%) |
| 8:30 AM to 8:59 AM | 60 (1.3%) | 84 (2.0%) |
| 9:00 AM to 9:59 AM | 93 (2.0%) | 125 (3.0%) |
| 10:00 AM to 10:59 AM | 33 (0.7%) | 17 (0.4%) |
| 11:00 AM to 11:59 AM | 3 (0.1%) | 67 (1.6%) |
| 12:00 PM to 3:59 PM | 227 (5.0%) | 380 (9.2%) |
| 4:00 PM to 11:59 PM | 337 (7.4%) | 334 (8.1%) |
| Total | 4,552 (100.0%) | 4,129 (100.0%) |
Housing Occupancy in Poinsett County
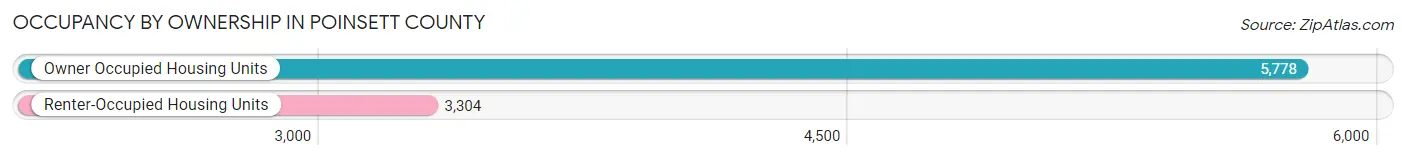
Occupancy by Ownership in Poinsett County
Of the total 9,082 dwellings in Poinsett County, owner-occupied units account for 5,778 (63.6%), while renter-occupied units make up 3,304 (36.4%).
| Occupancy | # Housing Units | % Housing Units |
| Owner Occupied Housing Units | 5,778 | 63.6% |
| Renter-Occupied Housing Units | 3,304 | 36.4% |
| Total Occupied Housing Units | 9,082 | 100.0% |
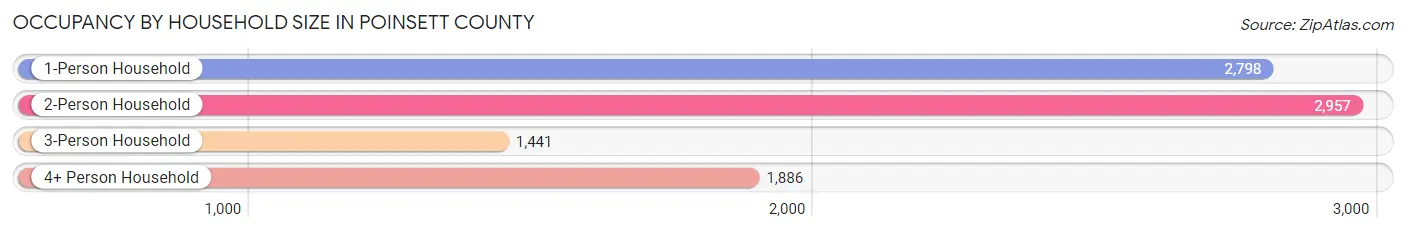
Occupancy by Household Size in Poinsett County
| Household Size | # Housing Units | % Housing Units |
| 1-Person Household | 2,798 | 30.8% |
| 2-Person Household | 2,957 | 32.6% |
| 3-Person Household | 1,441 | 15.9% |
| 4+ Person Household | 1,886 | 20.8% |
| Total Housing Units | 9,082 | 100.0% |
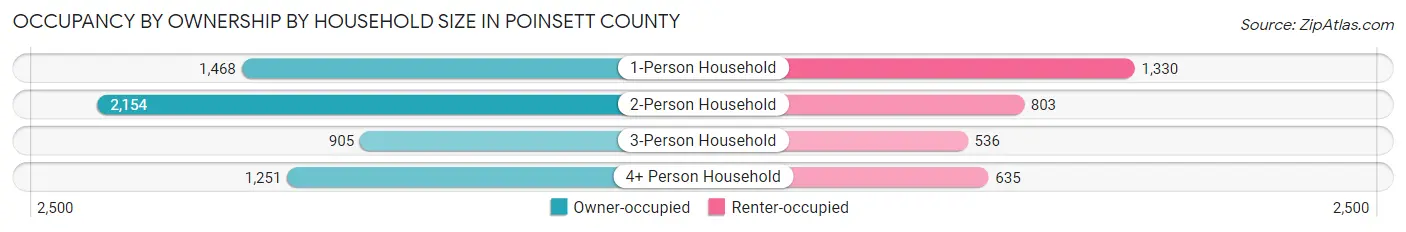
Occupancy by Ownership by Household Size in Poinsett County
| Household Size | Owner-occupied | Renter-occupied |
| 1-Person Household | 1,468 (52.5%) | 1,330 (47.5%) |
| 2-Person Household | 2,154 (72.8%) | 803 (27.2%) |
| 3-Person Household | 905 (62.8%) | 536 (37.2%) |
| 4+ Person Household | 1,251 (66.3%) | 635 (33.7%) |
| Total Housing Units | 5,778 (63.6%) | 3,304 (36.4%) |
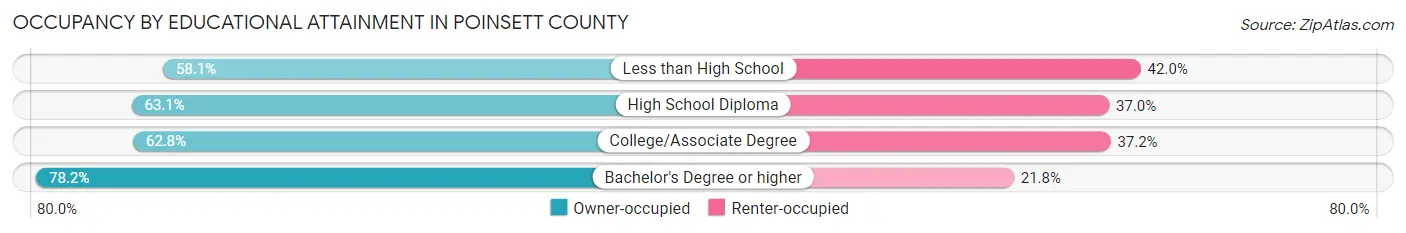
Occupancy by Educational Attainment in Poinsett County
| Household Size | Owner-occupied | Renter-occupied |
| Less than High School | 977 (58.1%) | 706 (41.9%) |
| High School Diploma | 2,652 (63.0%) | 1,554 (36.9%) |
| College/Associate Degree | 1,422 (62.8%) | 841 (37.2%) |
| Bachelor's Degree or higher | 727 (78.2%) | 203 (21.8%) |
Occupancy by Age of Householder in Poinsett County
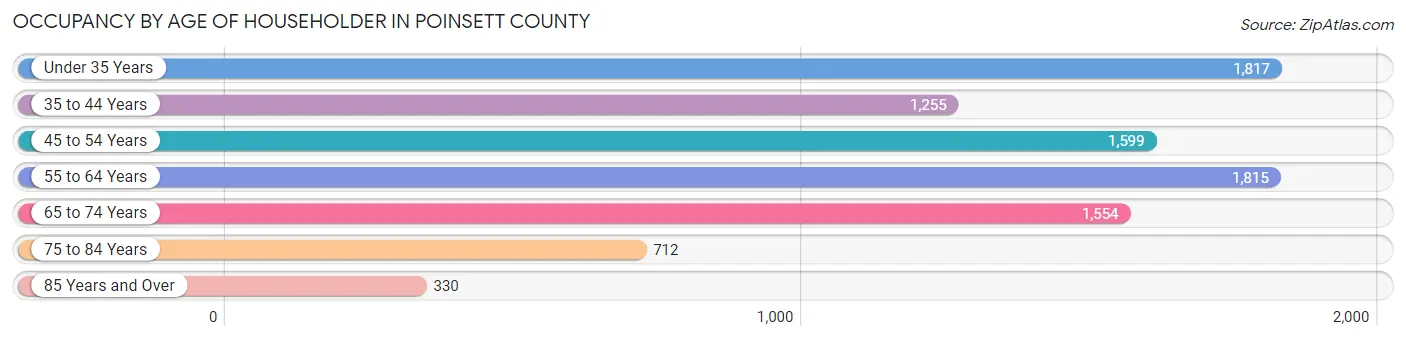
| Age Bracket | # Households | % Households |
| Under 35 Years | 1,817 | 20.0% |
| 35 to 44 Years | 1,255 | 13.8% |
| 45 to 54 Years | 1,599 | 17.6% |
| 55 to 64 Years | 1,815 | 20.0% |
| 65 to 74 Years | 1,554 | 17.1% |
| 75 to 84 Years | 712 | 7.8% |
| 85 Years and Over | 330 | 3.6% |
| Total | 9,082 | 100.0% |
Housing Finances in Poinsett County
Median Income by Occupancy in Poinsett County
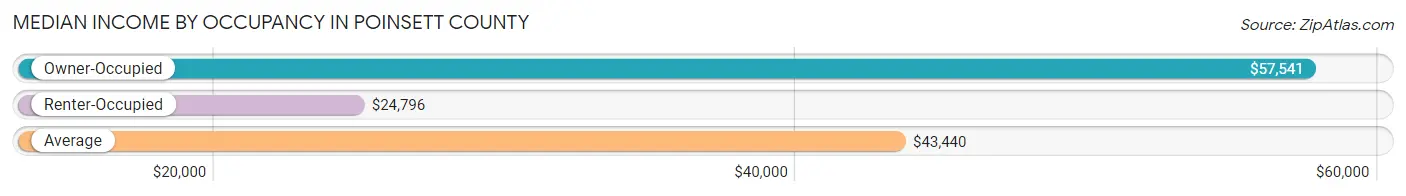
| Occupancy Type | # Households | Median Income |
| Owner-Occupied | 5,778 (63.6%) | $57,541 |
| Renter-Occupied | 3,304 (36.4%) | $24,796 |
| Average | 9,082 (100.0%) | $43,440 |
Occupancy by Householder Income Bracket in Poinsett County
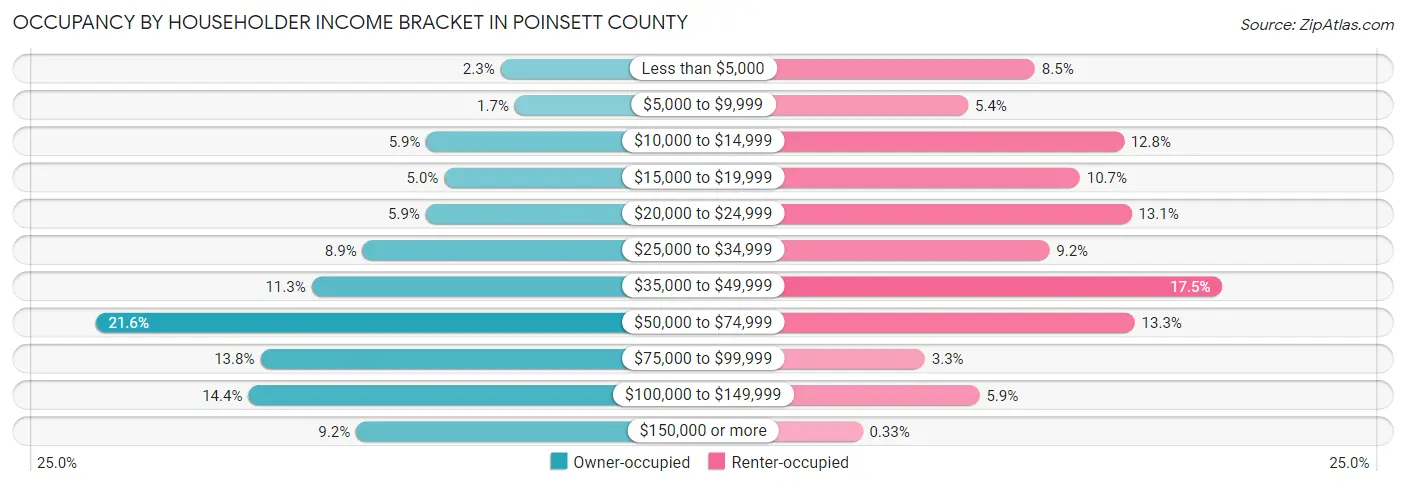
| Income Bracket | Owner-occupied | Renter-occupied |
| Less than $5,000 | 135 (2.3%) | 282 (8.5%) |
| $5,000 to $9,999 | 96 (1.7%) | 177 (5.4%) |
| $10,000 to $14,999 | 339 (5.9%) | 422 (12.8%) |
| $15,000 to $19,999 | 290 (5.0%) | 353 (10.7%) |
| $20,000 to $24,999 | 341 (5.9%) | 434 (13.1%) |
| $25,000 to $34,999 | 515 (8.9%) | 305 (9.2%) |
| $35,000 to $49,999 | 655 (11.3%) | 577 (17.5%) |
| $50,000 to $74,999 | 1,249 (21.6%) | 439 (13.3%) |
| $75,000 to $99,999 | 796 (13.8%) | 109 (3.3%) |
| $100,000 to $149,999 | 829 (14.3%) | 195 (5.9%) |
| $150,000 or more | 533 (9.2%) | 11 (0.3%) |
| Total | 5,778 (100.0%) | 3,304 (100.0%) |
Monthly Housing Cost Tiers in Poinsett County
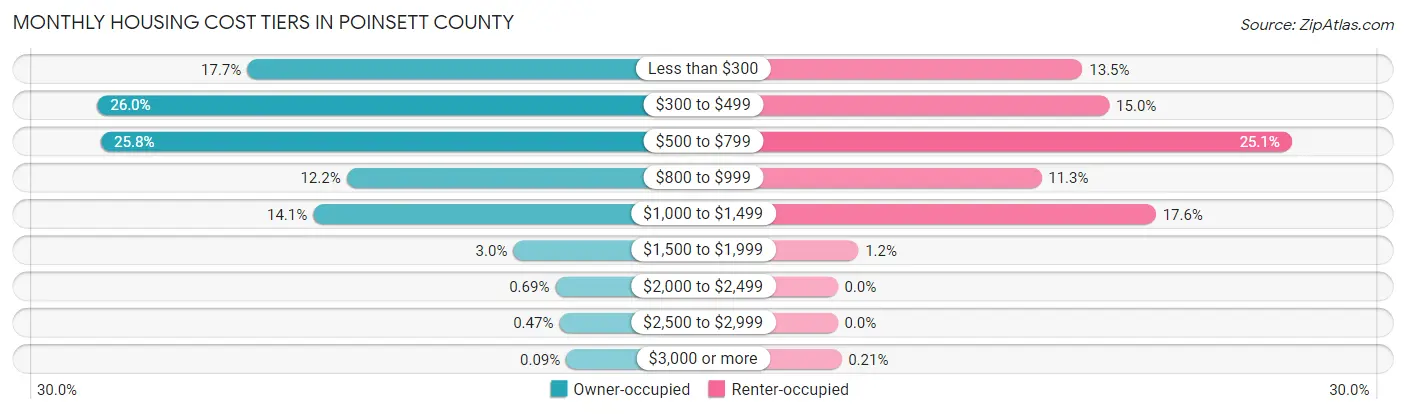
| Monthly Cost | Owner-occupied | Renter-occupied |
| Less than $300 | 1,023 (17.7%) | 447 (13.5%) |
| $300 to $499 | 1,501 (26.0%) | 496 (15.0%) |
| $500 to $799 | 1,489 (25.8%) | 829 (25.1%) |
| $800 to $999 | 706 (12.2%) | 372 (11.3%) |
| $1,000 to $1,499 | 813 (14.1%) | 581 (17.6%) |
| $1,500 to $1,999 | 174 (3.0%) | 38 (1.1%) |
| $2,000 to $2,499 | 40 (0.7%) | 0 (0.0%) |
| $2,500 to $2,999 | 27 (0.5%) | 0 (0.0%) |
| $3,000 or more | 5 (0.1%) | 7 (0.2%) |
| Total | 5,778 (100.0%) | 3,304 (100.0%) |
Physical Housing Characteristics in Poinsett County
Housing Structures in Poinsett County
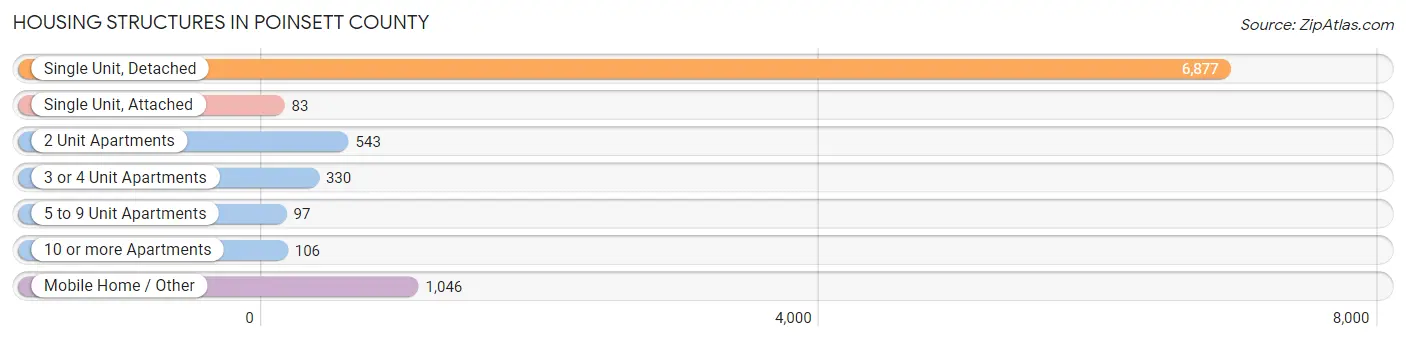
| Structure Type | # Housing Units | % Housing Units |
| Single Unit, Detached | 6,877 | 75.7% |
| Single Unit, Attached | 83 | 0.9% |
| 2 Unit Apartments | 543 | 6.0% |
| 3 or 4 Unit Apartments | 330 | 3.6% |
| 5 to 9 Unit Apartments | 97 | 1.1% |
| 10 or more Apartments | 106 | 1.2% |
| Mobile Home / Other | 1,046 | 11.5% |
| Total | 9,082 | 100.0% |
Housing Structures by Occupancy in Poinsett County
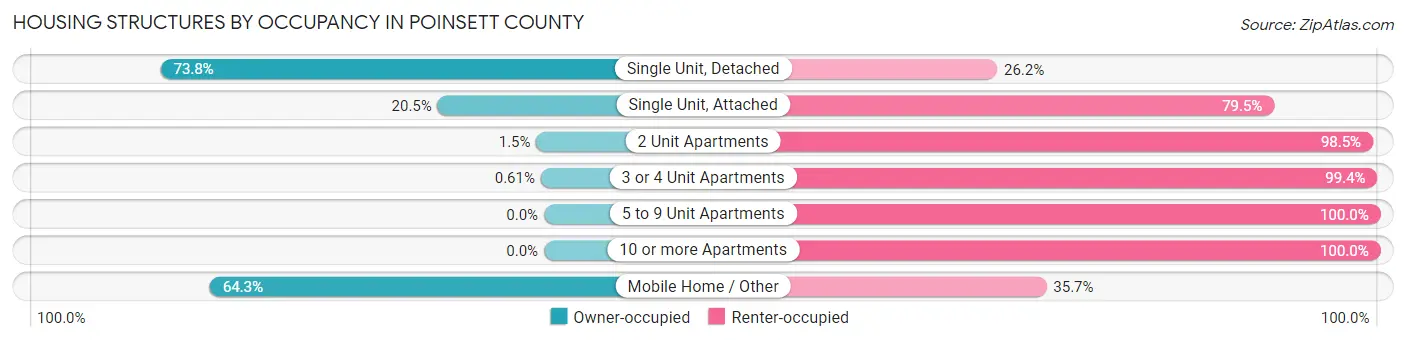
| Structure Type | Owner-occupied | Renter-occupied |
| Single Unit, Detached | 5,078 (73.8%) | 1,799 (26.2%) |
| Single Unit, Attached | 17 (20.5%) | 66 (79.5%) |
| 2 Unit Apartments | 8 (1.5%) | 535 (98.5%) |
| 3 or 4 Unit Apartments | 2 (0.6%) | 328 (99.4%) |
| 5 to 9 Unit Apartments | 0 (0.0%) | 97 (100.0%) |
| 10 or more Apartments | 0 (0.0%) | 106 (100.0%) |
| Mobile Home / Other | 673 (64.3%) | 373 (35.7%) |
| Total | 5,778 (63.6%) | 3,304 (36.4%) |
Housing Structures by Number of Rooms in Poinsett County
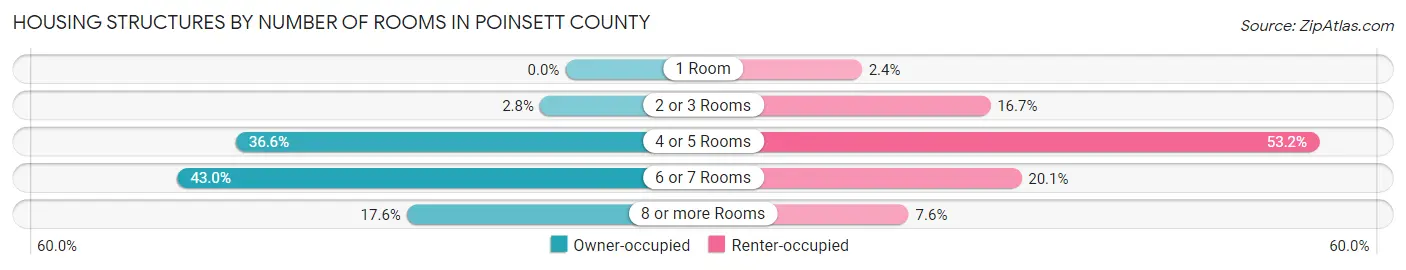
| Number of Rooms | Owner-occupied | Renter-occupied |
| 1 Room | 0 (0.0%) | 80 (2.4%) |
| 2 or 3 Rooms | 163 (2.8%) | 551 (16.7%) |
| 4 or 5 Rooms | 2,112 (36.5%) | 1,756 (53.1%) |
| 6 or 7 Rooms | 2,486 (43.0%) | 665 (20.1%) |
| 8 or more Rooms | 1,017 (17.6%) | 252 (7.6%) |
| Total | 5,778 (100.0%) | 3,304 (100.0%) |
Housing Structure by Heating Type in Poinsett County
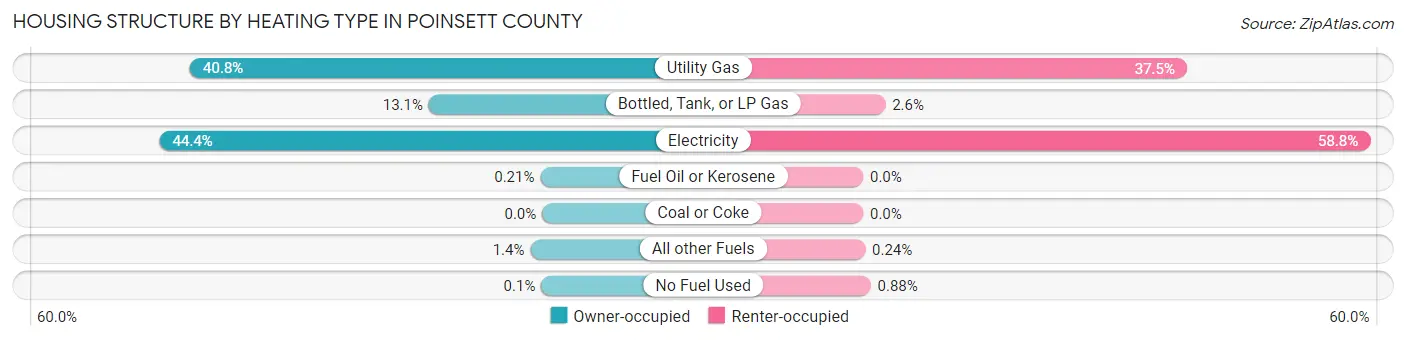
| Heating Type | Owner-occupied | Renter-occupied |
| Utility Gas | 2,359 (40.8%) | 1,240 (37.5%) |
| Bottled, Tank, or LP Gas | 759 (13.1%) | 85 (2.6%) |
| Electricity | 2,563 (44.4%) | 1,942 (58.8%) |
| Fuel Oil or Kerosene | 12 (0.2%) | 0 (0.0%) |
| Coal or Coke | 0 (0.0%) | 0 (0.0%) |
| All other Fuels | 79 (1.4%) | 8 (0.2%) |
| No Fuel Used | 6 (0.1%) | 29 (0.9%) |
| Total | 5,778 (100.0%) | 3,304 (100.0%) |
Household Vehicle Usage in Poinsett County
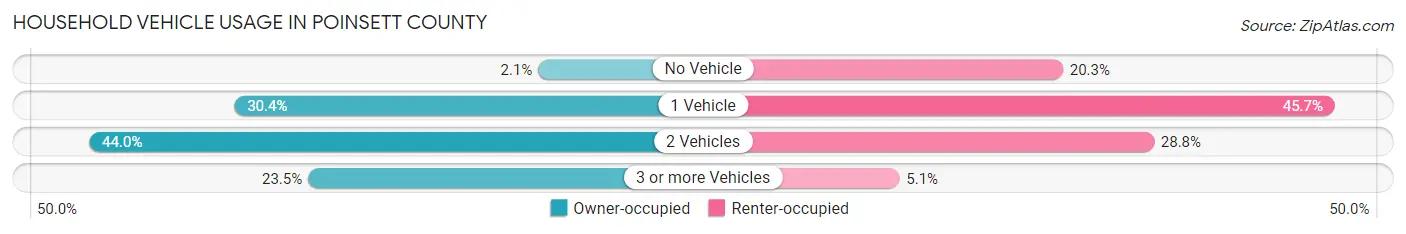
| Vehicles per Household | Owner-occupied | Renter-occupied |
| No Vehicle | 119 (2.1%) | 672 (20.3%) |
| 1 Vehicle | 1,758 (30.4%) | 1,511 (45.7%) |
| 2 Vehicles | 2,541 (44.0%) | 953 (28.8%) |
| 3 or more Vehicles | 1,360 (23.5%) | 168 (5.1%) |
| Total | 5,778 (100.0%) | 3,304 (100.0%) |
Real Estate & Mortgages in Poinsett County
Real Estate and Mortgage Overview in Poinsett County
| Characteristic | Without Mortgage | With Mortgage |
| Housing Units | 3,379 | 2,399 |
| Median Property Value | $81,200 | $110,800 |
| Median Household Income | $43,877 | $288 |
| Monthly Housing Costs | $373 | $5 |
| Real Estate Taxes | $450 | $188 |
Property Value by Mortgage Status in Poinsett County
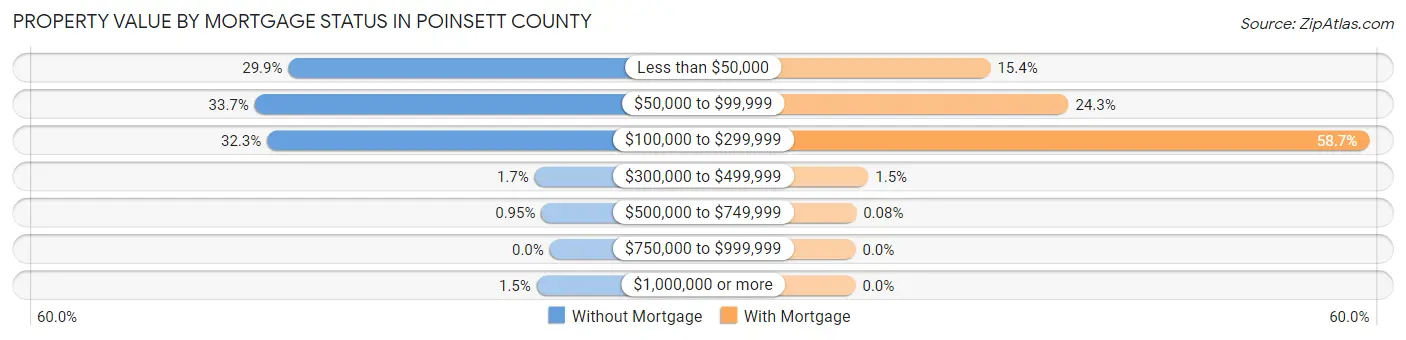
| Property Value | Without Mortgage | With Mortgage |
| Less than $50,000 | 1,009 (29.9%) | 370 (15.4%) |
| $50,000 to $99,999 | 1,139 (33.7%) | 584 (24.3%) |
| $100,000 to $299,999 | 1,091 (32.3%) | 1,408 (58.7%) |
| $300,000 to $499,999 | 58 (1.7%) | 35 (1.5%) |
| $500,000 to $749,999 | 32 (0.9%) | 2 (0.1%) |
| $750,000 to $999,999 | 0 (0.0%) | 0 (0.0%) |
| $1,000,000 or more | 50 (1.5%) | 0 (0.0%) |
| Total | 3,379 (100.0%) | 2,399 (100.0%) |
Household Income by Mortgage Status in Poinsett County
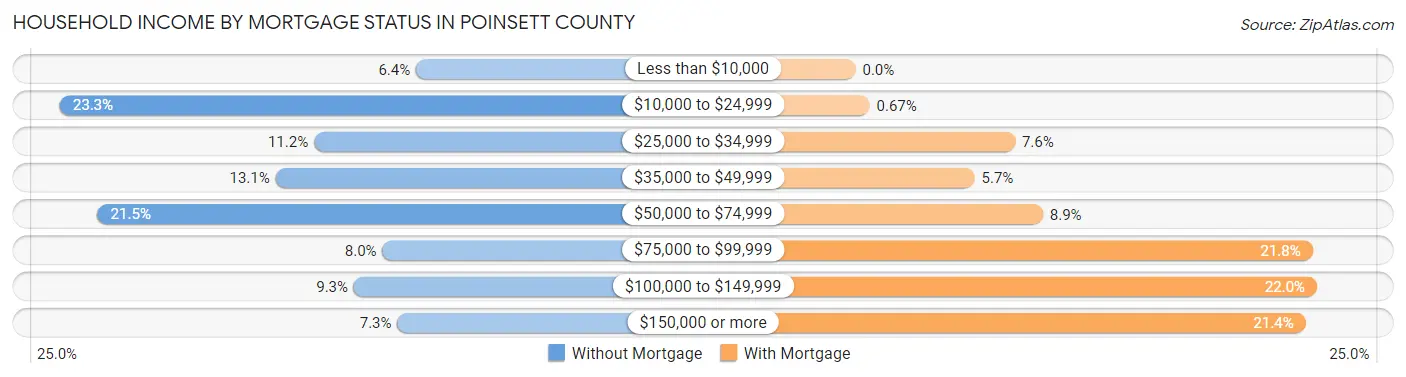
| Household Income | Without Mortgage | With Mortgage |
| Less than $10,000 | 215 (6.4%) | 0 (0.0%) |
| $10,000 to $24,999 | 788 (23.3%) | 16 (0.7%) |
| $25,000 to $34,999 | 379 (11.2%) | 182 (7.6%) |
| $35,000 to $49,999 | 441 (13.1%) | 136 (5.7%) |
| $50,000 to $74,999 | 727 (21.5%) | 214 (8.9%) |
| $75,000 to $99,999 | 269 (8.0%) | 522 (21.8%) |
| $100,000 to $149,999 | 315 (9.3%) | 527 (22.0%) |
| $150,000 or more | 245 (7.2%) | 514 (21.4%) |
| Total | 3,379 (100.0%) | 2,399 (100.0%) |
Property Value to Household Income Ratio in Poinsett County
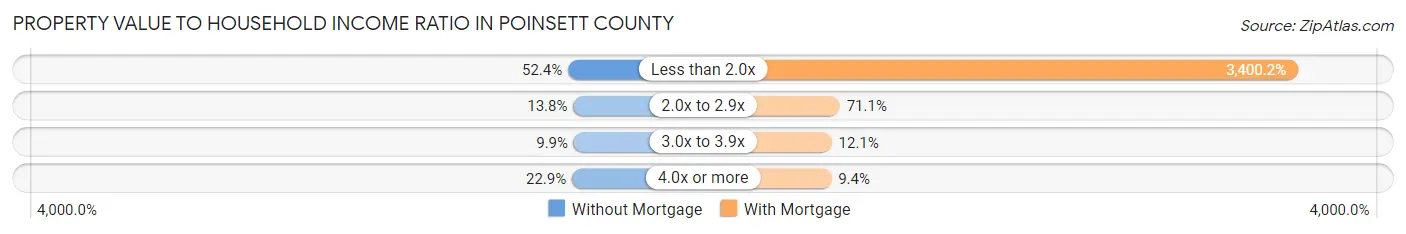
| Value-to-Income Ratio | Without Mortgage | With Mortgage |
| Less than 2.0x | 1,772 (52.4%) | 81,571 (3,400.2%) |
| 2.0x to 2.9x | 466 (13.8%) | 1,706 (71.1%) |
| 3.0x to 3.9x | 335 (9.9%) | 291 (12.1%) |
| 4.0x or more | 775 (22.9%) | 225 (9.4%) |
| Total | 3,379 (100.0%) | 2,399 (100.0%) |
Real Estate Taxes by Mortgage Status in Poinsett County
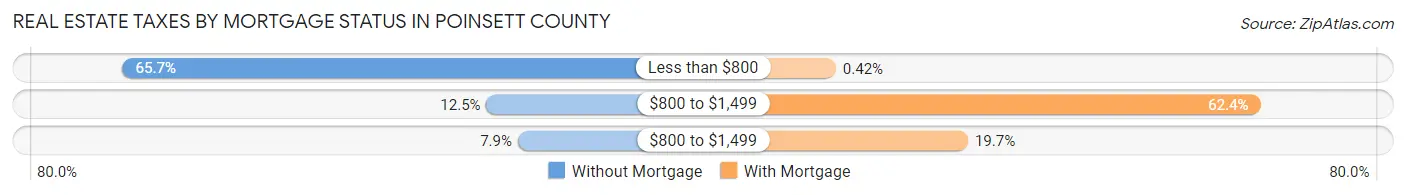
| Property Taxes | Without Mortgage | With Mortgage |
| Less than $800 | 2,219 (65.7%) | 10 (0.4%) |
| $800 to $1,499 | 423 (12.5%) | 1,498 (62.4%) |
| $800 to $1,499 | 268 (7.9%) | 473 (19.7%) |
| Total | 3,379 (100.0%) | 2,399 (100.0%) |
Health & Disability in Poinsett County
Health Insurance Coverage by Age in Poinsett County
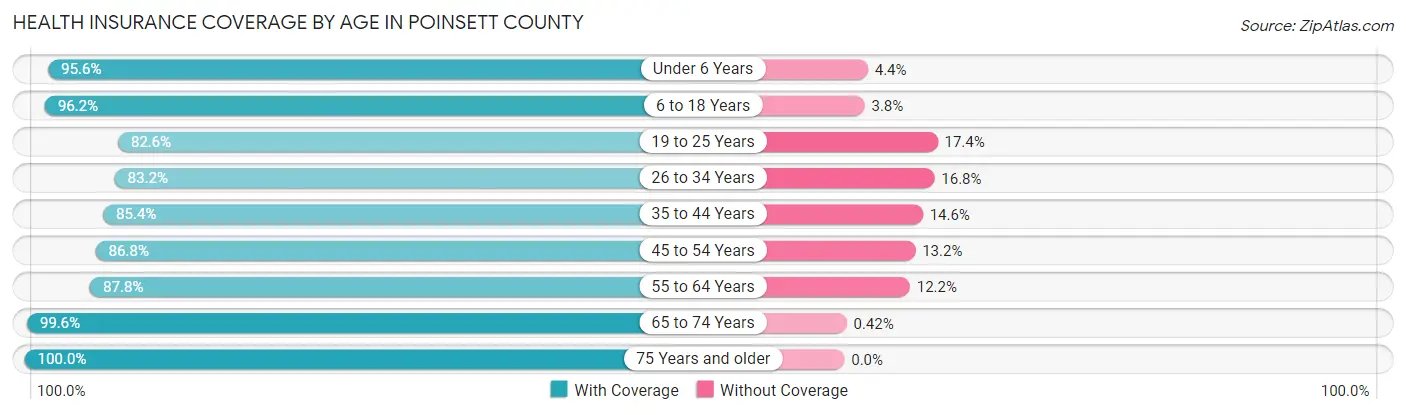
| Age Bracket | With Coverage | Without Coverage |
| Under 6 Years | 1,571 (95.6%) | 72 (4.4%) |
| 6 to 18 Years | 4,020 (96.2%) | 158 (3.8%) |
| 19 to 25 Years | 1,558 (82.6%) | 328 (17.4%) |
| 26 to 34 Years | 2,075 (83.2%) | 419 (16.8%) |
| 35 to 44 Years | 2,132 (85.4%) | 365 (14.6%) |
| 45 to 54 Years | 2,564 (86.8%) | 391 (13.2%) |
| 55 to 64 Years | 2,675 (87.8%) | 372 (12.2%) |
| 65 to 74 Years | 2,385 (99.6%) | 10 (0.4%) |
| 75 Years and older | 1,580 (100.0%) | 0 (0.0%) |
| Total | 20,560 (90.7%) | 2,115 (9.3%) |
Health Insurance Coverage by Citizenship Status in Poinsett County
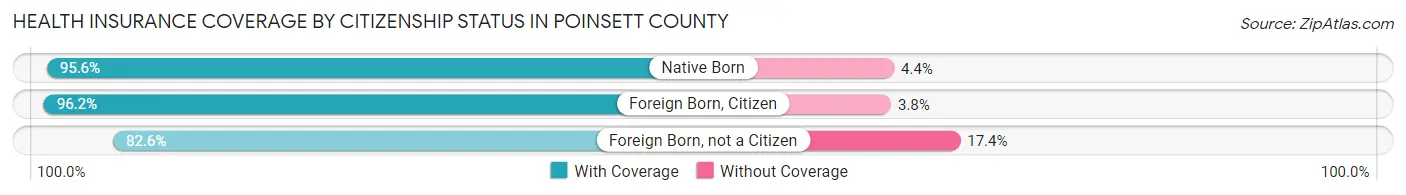
| Citizenship Status | With Coverage | Without Coverage |
| Native Born | 1,571 (95.6%) | 72 (4.4%) |
| Foreign Born, Citizen | 4,020 (96.2%) | 158 (3.8%) |
| Foreign Born, not a Citizen | 1,558 (82.6%) | 328 (17.4%) |
Health Insurance Coverage by Household Income in Poinsett County
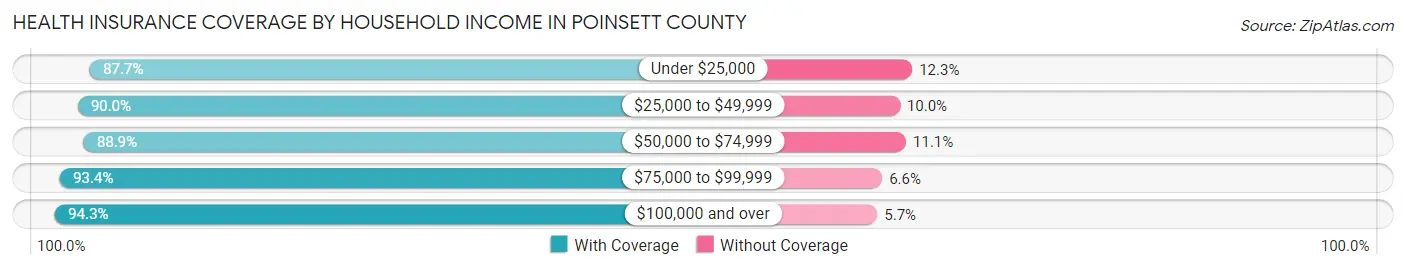
| Household Income | With Coverage | Without Coverage |
| Under $25,000 | 4,574 (87.7%) | 639 (12.3%) |
| $25,000 to $49,999 | 4,450 (90.0%) | 492 (10.0%) |
| $50,000 to $74,999 | 3,929 (88.9%) | 491 (11.1%) |
| $75,000 to $99,999 | 2,700 (93.4%) | 192 (6.6%) |
| $100,000 and over | 4,885 (94.3%) | 297 (5.7%) |
Public vs Private Health Insurance Coverage by Age in Poinsett County
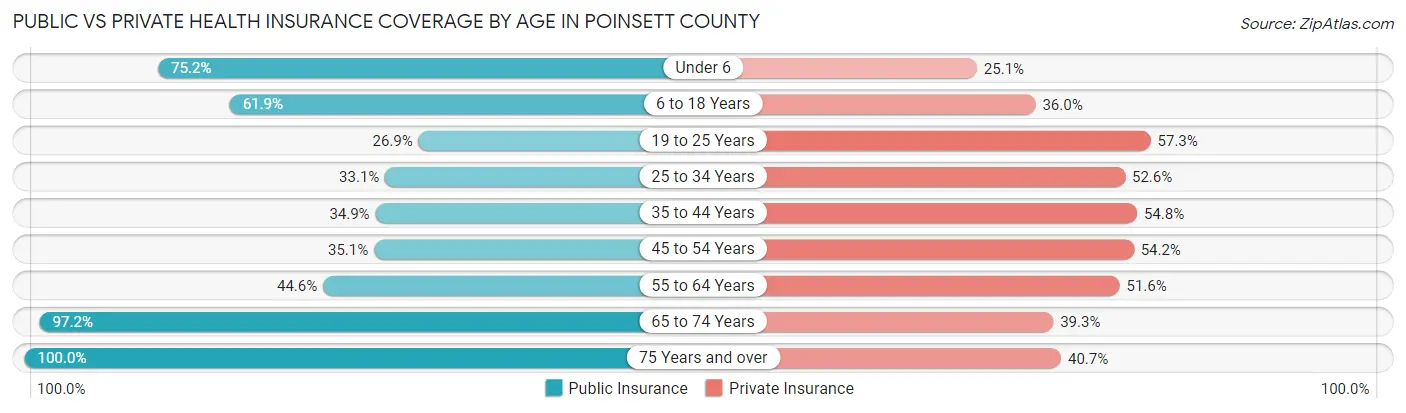
| Age Bracket | Public Insurance | Private Insurance |
| Under 6 | 1,236 (75.2%) | 412 (25.1%) |
| 6 to 18 Years | 2,587 (61.9%) | 1,502 (35.9%) |
| 19 to 25 Years | 507 (26.9%) | 1,081 (57.3%) |
| 25 to 34 Years | 825 (33.1%) | 1,311 (52.6%) |
| 35 to 44 Years | 871 (34.9%) | 1,368 (54.8%) |
| 45 to 54 Years | 1,038 (35.1%) | 1,601 (54.2%) |
| 55 to 64 Years | 1,359 (44.6%) | 1,571 (51.6%) |
| 65 to 74 Years | 2,328 (97.2%) | 940 (39.3%) |
| 75 Years and over | 1,580 (100.0%) | 643 (40.7%) |
| Total | 12,331 (54.4%) | 10,429 (46.0%) |
Disability Status by Sex by Age in Poinsett County
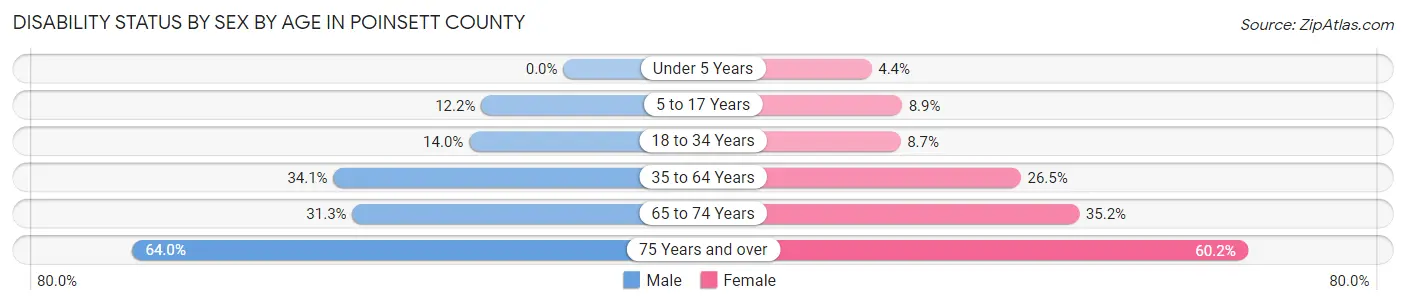
| Age Bracket | Male | Female |
| Under 5 Years | 0 (0.0%) | 33 (4.4%) |
| 5 to 17 Years | 254 (12.2%) | 171 (8.9%) |
| 18 to 34 Years | 323 (14.0%) | 208 (8.7%) |
| 35 to 64 Years | 1,445 (34.1%) | 1,132 (26.5%) |
| 65 to 74 Years | 332 (31.3%) | 470 (35.2%) |
| 75 Years and over | 433 (64.0%) | 544 (60.2%) |
Disability Class by Sex by Age in Poinsett County
Disability Class: Hearing Difficulty
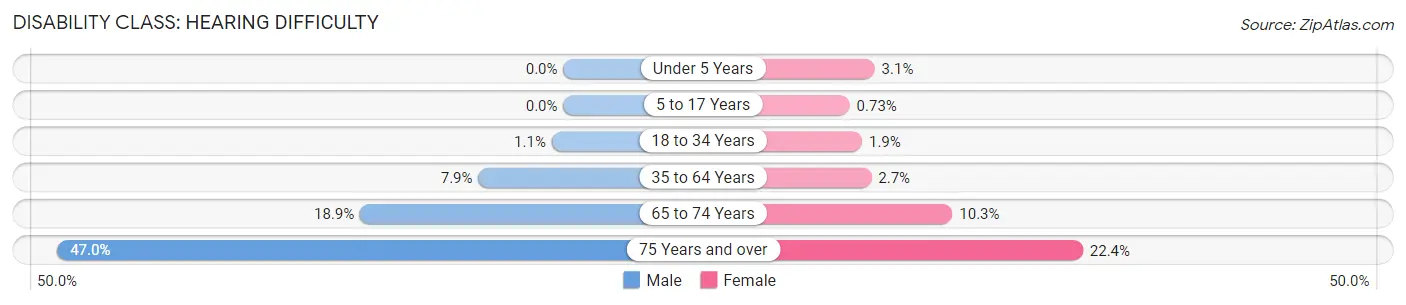
| Age Bracket | Male | Female |
| Under 5 Years | 0 (0.0%) | 23 (3.0%) |
| 5 to 17 Years | 0 (0.0%) | 14 (0.7%) |
| 18 to 34 Years | 25 (1.1%) | 45 (1.9%) |
| 35 to 64 Years | 334 (7.9%) | 117 (2.7%) |
| 65 to 74 Years | 200 (18.9%) | 137 (10.3%) |
| 75 Years and over | 318 (47.0%) | 202 (22.4%) |
Disability Class: Vision Difficulty
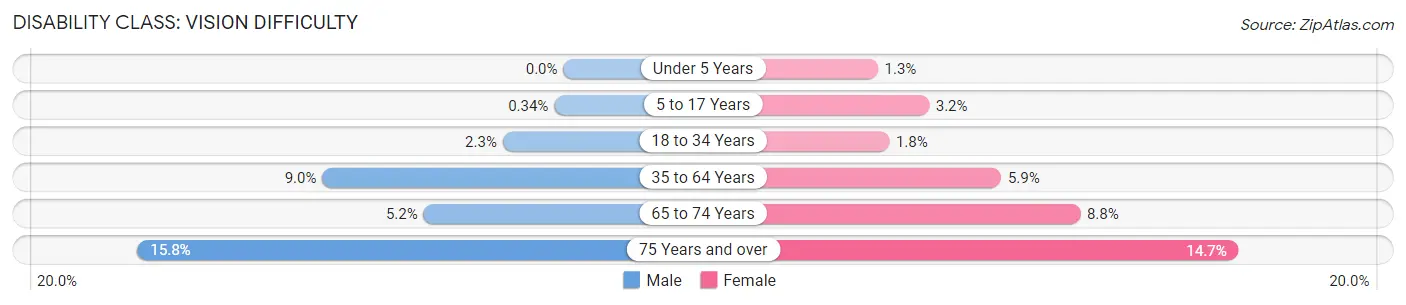
| Age Bracket | Male | Female |
| Under 5 Years | 0 (0.0%) | 10 (1.3%) |
| 5 to 17 Years | 7 (0.3%) | 62 (3.2%) |
| 18 to 34 Years | 52 (2.2%) | 42 (1.8%) |
| 35 to 64 Years | 379 (8.9%) | 252 (5.9%) |
| 65 to 74 Years | 55 (5.2%) | 118 (8.8%) |
| 75 Years and over | 107 (15.8%) | 133 (14.7%) |
Disability Class: Cognitive Difficulty
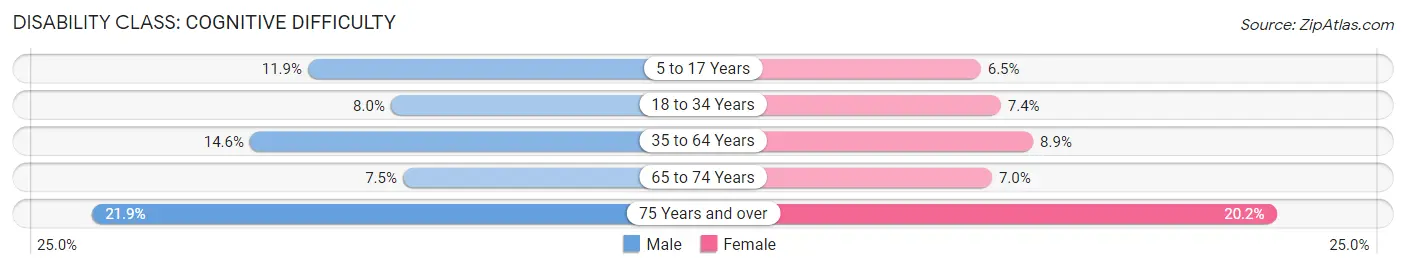
| Age Bracket | Male | Female |
| 5 to 17 Years | 247 (11.9%) | 124 (6.5%) |
| 18 to 34 Years | 185 (8.0%) | 177 (7.4%) |
| 35 to 64 Years | 616 (14.5%) | 379 (8.9%) |
| 65 to 74 Years | 79 (7.4%) | 93 (7.0%) |
| 75 Years and over | 148 (21.9%) | 182 (20.2%) |
Disability Class: Ambulatory Difficulty
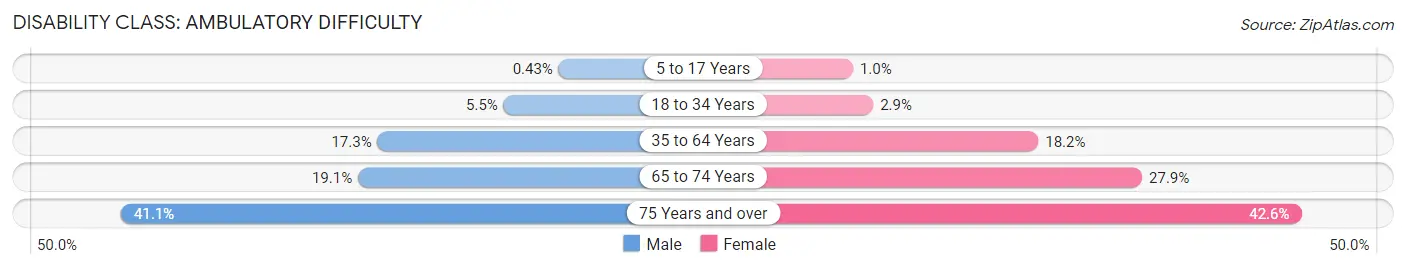
| Age Bracket | Male | Female |
| 5 to 17 Years | 9 (0.4%) | 20 (1.0%) |
| 18 to 34 Years | 128 (5.5%) | 70 (2.9%) |
| 35 to 64 Years | 730 (17.2%) | 778 (18.2%) |
| 65 to 74 Years | 202 (19.1%) | 372 (27.9%) |
| 75 Years and over | 278 (41.1%) | 385 (42.6%) |
Disability Class: Self-Care Difficulty
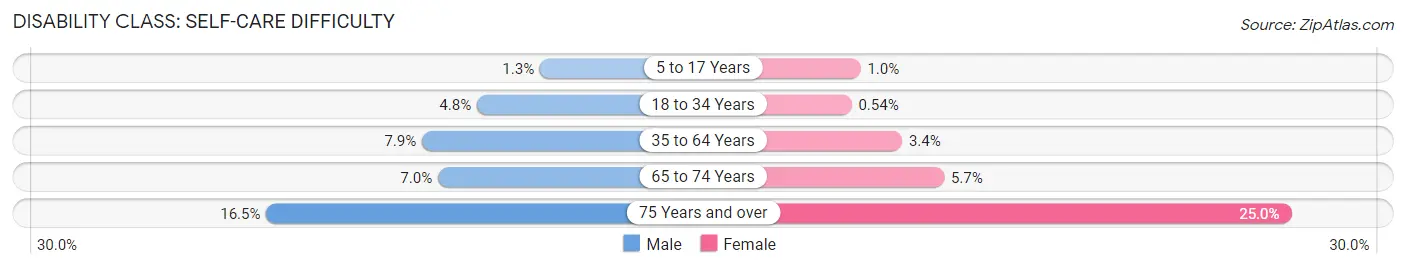
| Age Bracket | Male | Female |
| 5 to 17 Years | 27 (1.3%) | 20 (1.0%) |
| 18 to 34 Years | 111 (4.8%) | 13 (0.5%) |
| 35 to 64 Years | 333 (7.9%) | 143 (3.4%) |
| 65 to 74 Years | 74 (7.0%) | 76 (5.7%) |
| 75 Years and over | 112 (16.5%) | 226 (25.0%) |
Technology Access in Poinsett County
Computing Device Access in Poinsett County
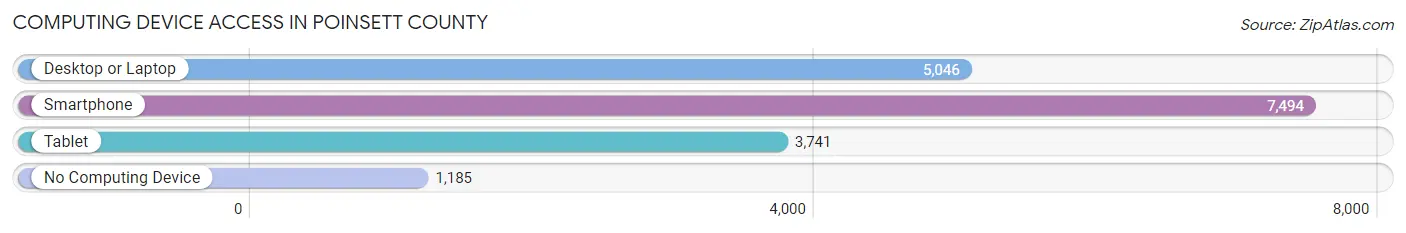
| Device Type | # Households | % Households |
| Desktop or Laptop | 5,046 | 55.6% |
| Smartphone | 7,494 | 82.5% |
| Tablet | 3,741 | 41.2% |
| No Computing Device | 1,185 | 13.1% |
| Total | 9,082 | 100.0% |
Internet Access in Poinsett County
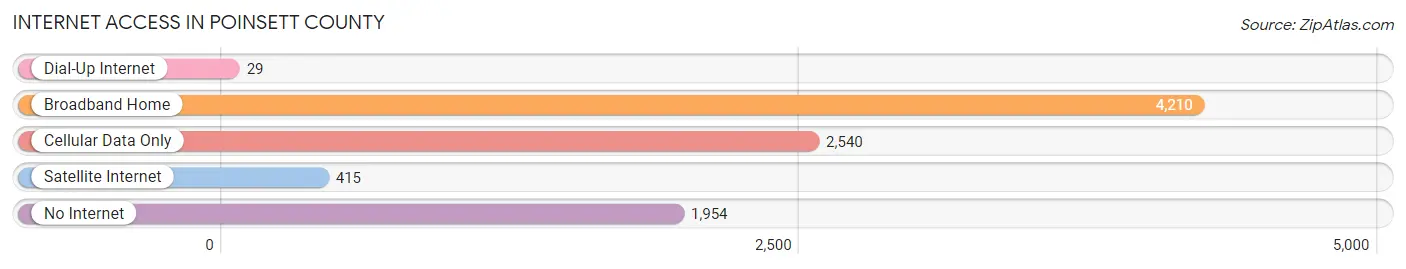
| Internet Type | # Households | % Households |
| Dial-Up Internet | 29 | 0.3% |
| Broadband Home | 4,210 | 46.4% |
| Cellular Data Only | 2,540 | 28.0% |
| Satellite Internet | 415 | 4.6% |
| No Internet | 1,954 | 21.5% |
| Total | 9,082 | 100.0% |
Poinsett County Summary
Poinsett County is located in the northeast corner of Arkansas, and is bordered by Craighead, Mississippi, and Cross Counties. It is part of the Jonesboro, Arkansas Metropolitan Statistical Area. The county was named after Joel Roberts Poinsett, the first United States Minister to Mexico. The county seat is Harrisburg.
Geography
Poinsett County is located in the northeast corner of Arkansas, and is bordered by Craighead, Mississippi, and Cross Counties. It is part of the Jonesboro, Arkansas Metropolitan Statistical Area. The county has a total area of 590 square miles, of which 588 square miles is land and 2 square miles (0.3%) is water. The county is located in the Arkansas Delta region, and is characterized by flat, fertile farmland. The St. Francis River runs through the county, and the L'Anguille River runs through the western part of the county.
Demographics
As of the 2010 census, there were 24,583 people, 9,541 households, and 6,817 families residing in the county. The population density was 41.9 people per square mile. The racial makeup of the county was 79.2% White, 18.2% Black or African American, 0.3% Native American, 0.2% Asian, 0.1% Pacific Islander, 0.7% from other races, and 1.3% from two or more races. 1.7% of the population were Hispanic or Latino of any race.
The median income for a household in the county was $30,945, and the median income for a family was $37,945. The per capita income for the county was $15,945. About 17.2% of families and 21.2% of the population were below the poverty line, including 28.2% of those under age 18 and 17.2% of those age 65 or over.
Economy
Agriculture is the main economic activity in Poinsett County. The county is the leading producer of rice in Arkansas, and is also a major producer of soybeans, cotton, and corn. Other agricultural products include hay, wheat, and sorghum. The county also has a thriving timber industry, and is home to several lumber mills.
The county is also home to several manufacturing companies, including a furniture manufacturer, a plastics manufacturer, and a metal fabrication company. The county also has a growing tourism industry, with several attractions, including the Poinsett County Museum, the Poinsett County Historical Society, and the Poinsett County Fair.
History
Poinsett County was formed in 1838 from parts of Cross and St. Francis Counties. It was named after Joel Roberts Poinsett, the first United States Minister to Mexico. The county seat is Harrisburg, which was founded in 1839.
The county was largely agricultural in the 19th century, and the economy was based on cotton and other crops. The county was also home to several sawmills and gristmills.
In the early 20th century, the county began to diversify its economy, and the timber industry began to grow. The county also began to attract manufacturing companies, and the population began to grow.
In the late 20th century, the county began to attract tourism, and the county began to promote its historical sites and attractions. The county also began to attract retirees, and the population began to grow.
Today, Poinsett County is a thriving agricultural and industrial county, with a growing tourism industry. The county is home to several historical sites and attractions, and is a popular destination for retirees.
Common Questions
What is Per Capita Income in Poinsett County?
Per Capita income in Poinsett County is $24,807.
What is the Median Family Income in Poinsett County?
Median Family Income in Poinsett County is $56,293.
What is the Median Household income in Poinsett County?
Median Household Income in Poinsett County is $43,440.
What is Income or Wage Gap in Poinsett County?
Income or Wage Gap in Poinsett County is 27.3%.
Women in Poinsett County earn 72.7 cents for every dollar earned by a man.
What is Family Income Deficit in Poinsett County?
Family Income Deficit in Poinsett County is $9,947.
Families that are below poverty line in Poinsett County earn $9,947 less on average than the poverty threshold level.
What is Inequality or Gini Index in Poinsett County?
Inequality or Gini Index in Poinsett County is 0.47.
What is the Total Population of Poinsett County?
Total Population of Poinsett County is 22,997.
What is the Total Male Population of Poinsett County?
Total Male Population of Poinsett County is 11,246.
What is the Total Female Population of Poinsett County?
Total Female Population of Poinsett County is 11,751.
What is the Ratio of Males per 100 Females in Poinsett County?
There are 95.70 Males per 100 Females in Poinsett County.
What is the Ratio of Females per 100 Males in Poinsett County?
There are 104.49 Females per 100 Males in Poinsett County.
What is the Median Population Age in Poinsett County?
Median Population Age in Poinsett County is 39.9 Years.
What is the Average Family Size in Poinsett County
Average Family Size in Poinsett County is 3.1 People.
What is the Average Household Size in Poinsett County
Average Household Size in Poinsett County is 2.5 People.
How Large is the Labor Force in Poinsett County?
There are 9,930 People in the Labor Forcein in Poinsett County.
What is the Percentage of People in the Labor Force in Poinsett County?
54.9% of People are in the Labor Force in Poinsett County.
What is the Unemployment Rate in Poinsett County?
Unemployment Rate in Poinsett County is 5.1%.