Blytheville, AR Map & Demographics
Blytheville Map
Blytheville Overview
$27,283
PER CAPITA INCOME
$61,775
AVG FAMILY INCOME
$45,746
AVG HOUSEHOLD INCOME
30.8%
WAGE / INCOME GAP [ % ]
69.2¢/ $1
WAGE / INCOME GAP [ $ ]
0.50
INEQUALITY / GINI INDEX
13,276
TOTAL POPULATION
5,751
MALE POPULATION
7,525
FEMALE POPULATION
76.43
MALES / 100 FEMALES
130.85
FEMALES / 100 MALES
38.1
MEDIAN AGE
3.1
AVG FAMILY SIZE
2.4
AVG HOUSEHOLD SIZE
6,735
LABOR FORCE [ PEOPLE ]
64.5%
PERCENT IN LABOR FORCE
13.6%
UNEMPLOYMENT RATE
Blytheville Zip Codes
Blytheville Area Codes
Income in Blytheville
Income Overview in Blytheville
Per Capita Income in Blytheville is $27,283, while median incomes of families and households are $61,775 and $45,746 respectively.
| Characteristic | Number | Measure |
| Per Capita Income | 13,276 | $27,283 |
| Median Family Income | 3,311 | $61,775 |
| Mean Family Income | 3,311 | $80,903 |
| Median Household Income | 5,395 | $45,746 |
| Mean Household Income | 5,395 | $64,514 |
| Income Deficit | 3,311 | $0 |
| Wage / Income Gap (%) | 13,276 | 30.80% |
| Wage / Income Gap ($) | 13,276 | 69.20¢ per $1 |
| Gini / Inequality Index | 13,276 | 0.50 |
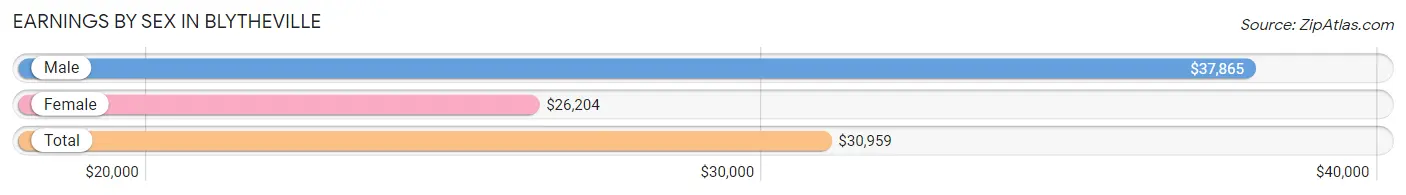
Earnings by Sex in Blytheville
Average Earnings in Blytheville are $30,959, $37,865 for men and $26,204 for women, a difference of 30.8%.
| Sex | Number | Average Earnings |
| Male | 3,156 (47.6%) | $37,865 |
| Female | 3,470 (52.4%) | $26,204 |
| Total | 6,626 (100.0%) | $30,959 |
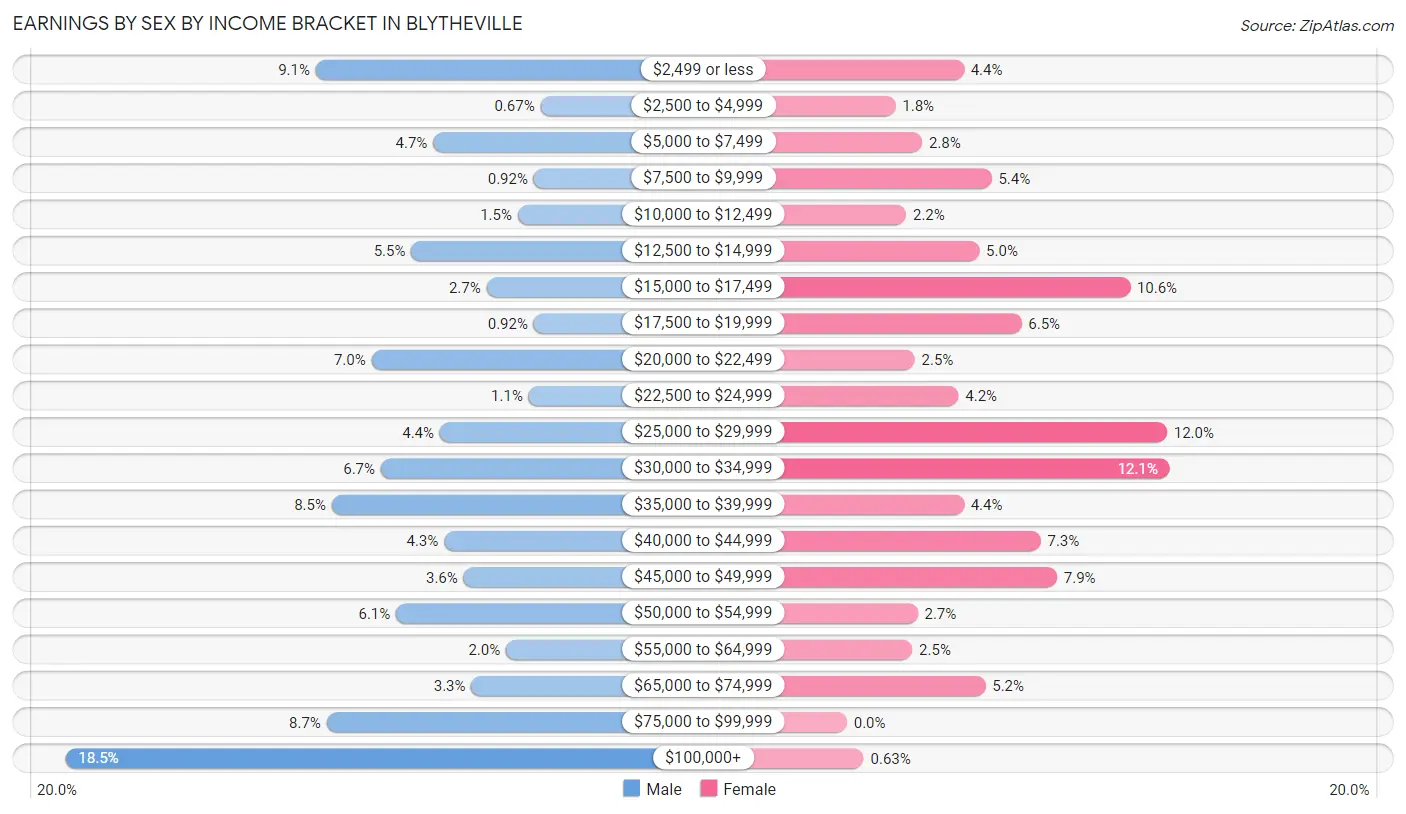
Earnings by Sex by Income Bracket in Blytheville
The most common earnings brackets in Blytheville are $100,000+ for men (583 | 18.5%) and $30,000 to $34,999 for women (420 | 12.1%).
| Income | Male | Female |
| $2,499 or less | 287 (9.1%) | 152 (4.4%) |
| $2,500 to $4,999 | 21 (0.7%) | 63 (1.8%) |
| $5,000 to $7,499 | 148 (4.7%) | 98 (2.8%) |
| $7,500 to $9,999 | 29 (0.9%) | 188 (5.4%) |
| $10,000 to $12,499 | 48 (1.5%) | 77 (2.2%) |
| $12,500 to $14,999 | 174 (5.5%) | 172 (5.0%) |
| $15,000 to $17,499 | 85 (2.7%) | 368 (10.6%) |
| $17,500 to $19,999 | 29 (0.9%) | 227 (6.5%) |
| $20,000 to $22,499 | 221 (7.0%) | 88 (2.5%) |
| $22,500 to $24,999 | 35 (1.1%) | 145 (4.2%) |
| $25,000 to $29,999 | 140 (4.4%) | 416 (12.0%) |
| $30,000 to $34,999 | 210 (6.7%) | 420 (12.1%) |
| $35,000 to $39,999 | 268 (8.5%) | 152 (4.4%) |
| $40,000 to $44,999 | 135 (4.3%) | 252 (7.3%) |
| $45,000 to $49,999 | 112 (3.5%) | 273 (7.9%) |
| $50,000 to $54,999 | 192 (6.1%) | 92 (2.6%) |
| $55,000 to $64,999 | 62 (2.0%) | 85 (2.5%) |
| $65,000 to $74,999 | 103 (3.3%) | 180 (5.2%) |
| $75,000 to $99,999 | 274 (8.7%) | 0 (0.0%) |
| $100,000+ | 583 (18.5%) | 22 (0.6%) |
| Total | 3,156 (100.0%) | 3,470 (100.0%) |
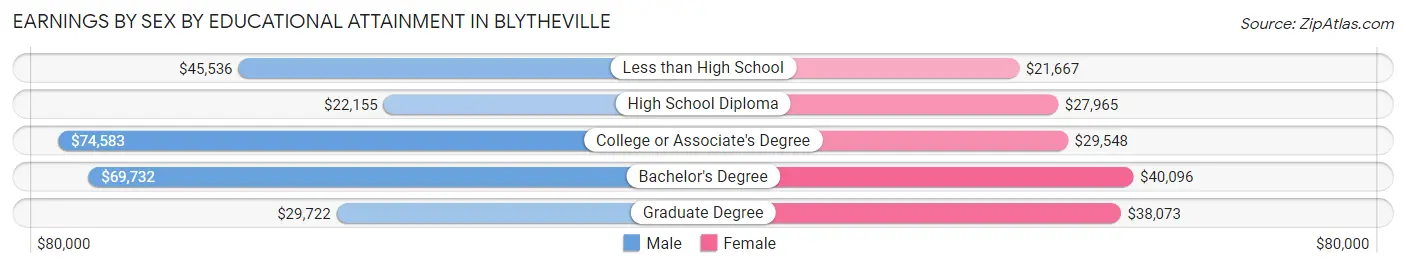
Earnings by Sex by Educational Attainment in Blytheville
Average earnings in Blytheville are $37,803 for men and $28,653 for women, a difference of 24.2%. Men with an educational attainment of college or associate's degree enjoy the highest average annual earnings of $74,583, while those with high school diploma education earn the least with $22,155. Women with an educational attainment of bachelor's degree earn the most with the average annual earnings of $40,096, while those with less than high school education have the smallest earnings of $21,667.
| Educational Attainment | Male Income | Female Income |
| Less than High School | $45,536 | $21,667 |
| High School Diploma | $22,155 | $27,965 |
| College or Associate's Degree | $74,583 | $29,548 |
| Bachelor's Degree | $69,732 | $40,096 |
| Graduate Degree | $29,722 | $38,073 |
| Total | $37,803 | $28,653 |
Family Income in Blytheville
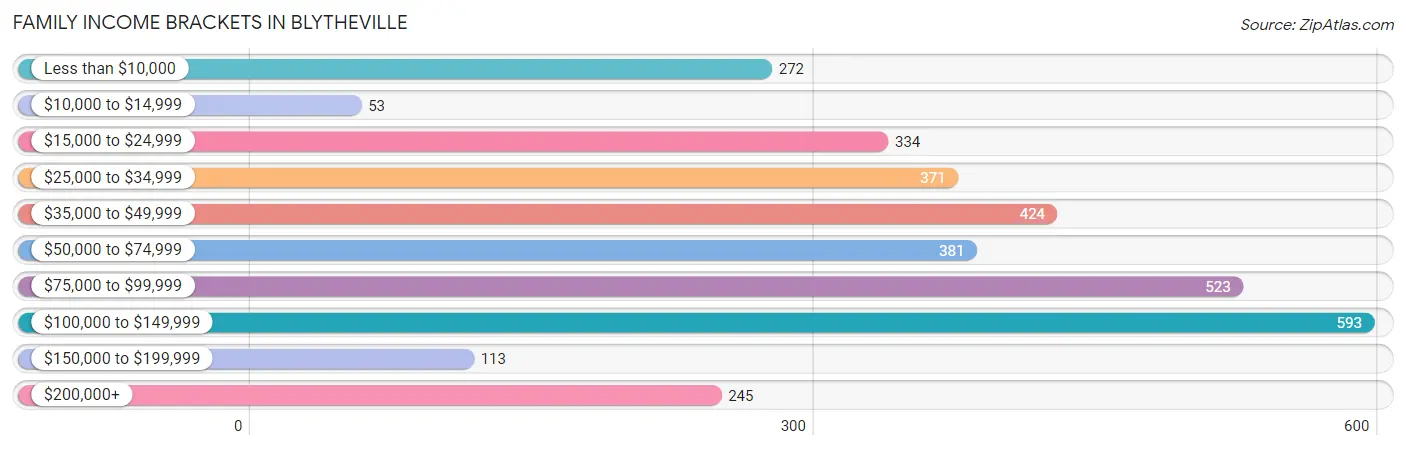
Family Income Brackets in Blytheville
According to the Blytheville family income data, there are 593 families falling into the $100,000 to $149,999 income range, which is the most common income bracket and makes up 17.9% of all families. Conversely, the $10,000 to $14,999 income bracket is the least frequent group with only 53 families (1.6%) belonging to this category.
| Income Bracket | # Families | % Families |
| Less than $10,000 | 272 | 8.2% |
| $10,000 to $14,999 | 53 | 1.6% |
| $15,000 to $24,999 | 334 | 10.1% |
| $25,000 to $34,999 | 371 | 11.2% |
| $35,000 to $49,999 | 424 | 12.8% |
| $50,000 to $74,999 | 381 | 11.5% |
| $75,000 to $99,999 | 523 | 15.8% |
| $100,000 to $149,999 | 593 | 17.9% |
| $150,000 to $199,999 | 113 | 3.4% |
| $200,000+ | 245 | 7.4% |
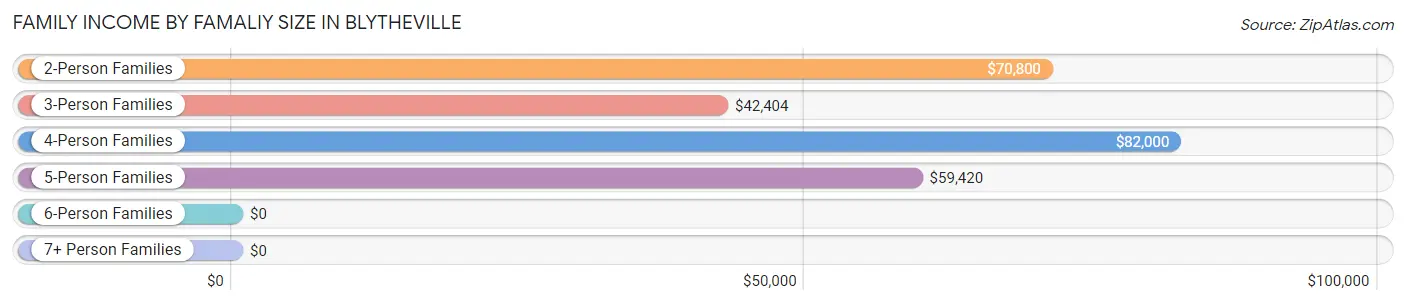
Family Income by Famaliy Size in Blytheville
4-person families (400 | 12.1%) account for the highest median family income in Blytheville with $82,000 per family, while 2-person families (2,026 | 61.2%) have the highest median income of $35,400 per family member.
| Income Bracket | # Families | Median Income |
| 2-Person Families | 2,026 (61.2%) | $70,800 |
| 3-Person Families | 653 (19.7%) | $42,404 |
| 4-Person Families | 400 (12.1%) | $82,000 |
| 5-Person Families | 103 (3.1%) | $59,420 |
| 6-Person Families | 22 (0.7%) | $0 |
| 7+ Person Families | 107 (3.2%) | $0 |
| Total | 3,311 (100.0%) | $61,775 |
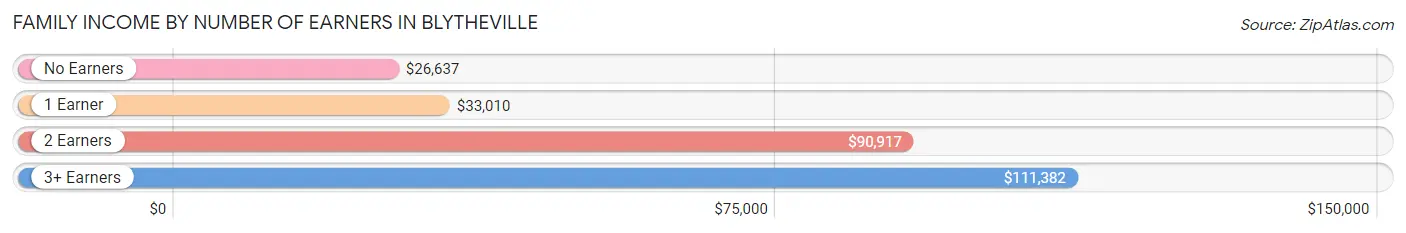
Family Income by Number of Earners in Blytheville
The median family income in Blytheville is $61,775, with families comprising 3+ earners (223) having the highest median family income of $111,382, while families with no earners (509) have the lowest median family income of $26,637, accounting for 6.7% and 15.4% of families, respectively.
| Number of Earners | # Families | Median Income |
| No Earners | 509 (15.4%) | $26,637 |
| 1 Earner | 1,170 (35.3%) | $33,010 |
| 2 Earners | 1,409 (42.6%) | $90,917 |
| 3+ Earners | 223 (6.7%) | $111,382 |
| Total | 3,311 (100.0%) | $61,775 |
Household Income in Blytheville
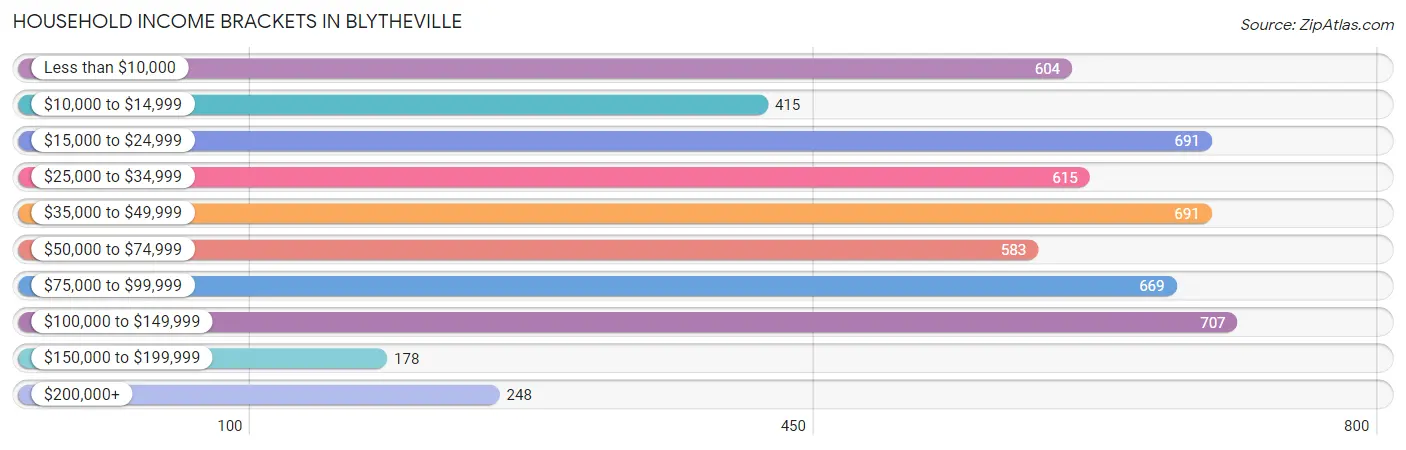
Household Income Brackets in Blytheville
With 707 households falling in the category, the $100,000 to $149,999 income range is the most frequent in Blytheville, accounting for 13.1% of all households. In contrast, only 178 households (3.3%) fall into the $150,000 to $199,999 income bracket, making it the least populous group.
| Income Bracket | # Households | % Households |
| Less than $10,000 | 604 | 11.2% |
| $10,000 to $14,999 | 415 | 7.7% |
| $15,000 to $24,999 | 691 | 12.8% |
| $25,000 to $34,999 | 615 | 11.4% |
| $35,000 to $49,999 | 691 | 12.8% |
| $50,000 to $74,999 | 583 | 10.8% |
| $75,000 to $99,999 | 669 | 12.4% |
| $100,000 to $149,999 | 707 | 13.1% |
| $150,000 to $199,999 | 178 | 3.3% |
| $200,000+ | 248 | 4.6% |
Household Income by Householder Age in Blytheville
The median household income in Blytheville is $45,746, with the highest median household income of $49,125 found in the 15 to 24 years age bracket for the primary householder. A total of 414 households (7.7%) fall into this category. Meanwhile, the 25 to 44 years age bracket for the primary householder has the lowest median household income of $41,875, with 1,514 households (28.1%) in this group.
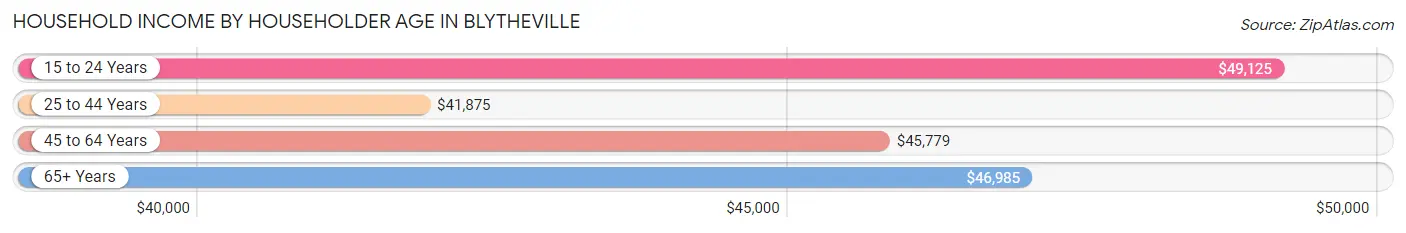
| Income Bracket | # Households | Median Income |
| 15 to 24 Years | 414 (7.7%) | $49,125 |
| 25 to 44 Years | 1,514 (28.1%) | $41,875 |
| 45 to 64 Years | 1,985 (36.8%) | $45,779 |
| 65+ Years | 1,482 (27.5%) | $46,985 |
| Total | 5,395 (100.0%) | $45,746 |
Poverty in Blytheville
Income Below Poverty by Sex and Age in Blytheville
With 22.0% poverty level for males and 24.4% for females among the residents of Blytheville, 6 to 11 year old males and 5 year old females are the most vulnerable to poverty, with 259 males (81.2%) and 168 females (60.9%) in their respective age groups living below the poverty level.
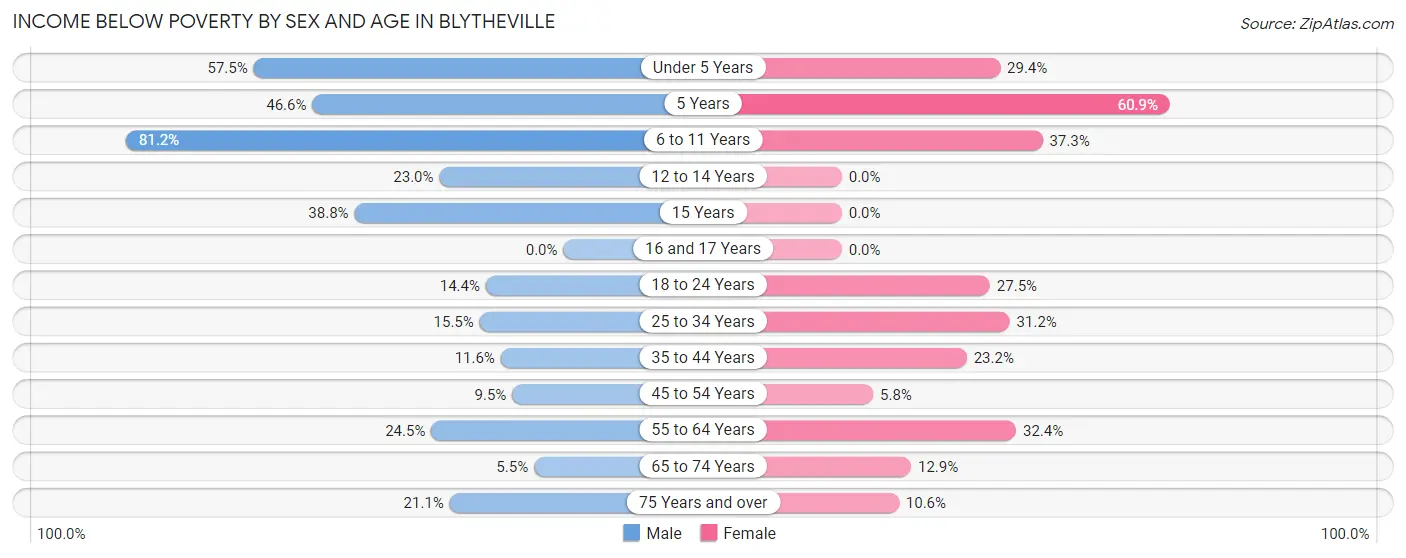
| Age Bracket | Male | Female |
| Under 5 Years | 222 (57.5%) | 154 (29.4%) |
| 5 Years | 96 (46.6%) | 168 (60.9%) |
| 6 to 11 Years | 259 (81.2%) | 238 (37.2%) |
| 12 to 14 Years | 29 (23.0%) | 0 (0.0%) |
| 15 Years | 19 (38.8%) | 0 (0.0%) |
| 16 and 17 Years | 0 (0.0%) | 0 (0.0%) |
| 18 to 24 Years | 93 (14.4%) | 149 (27.5%) |
| 25 to 34 Years | 110 (15.5%) | 335 (31.2%) |
| 35 to 44 Years | 90 (11.6%) | 218 (23.2%) |
| 45 to 54 Years | 64 (9.5%) | 38 (5.8%) |
| 55 to 64 Years | 166 (24.5%) | 352 (32.4%) |
| 65 to 74 Years | 37 (5.4%) | 97 (12.9%) |
| 75 Years and over | 65 (21.1%) | 47 (10.6%) |
| Total | 1,250 (22.0%) | 1,796 (24.4%) |
Income Above Poverty by Sex and Age in Blytheville
According to the poverty statistics in Blytheville, males aged 16 and 17 years and females aged 12 to 14 years are the age groups that are most secure financially, with 100.0% of males and 100.0% of females in these age groups living above the poverty line.
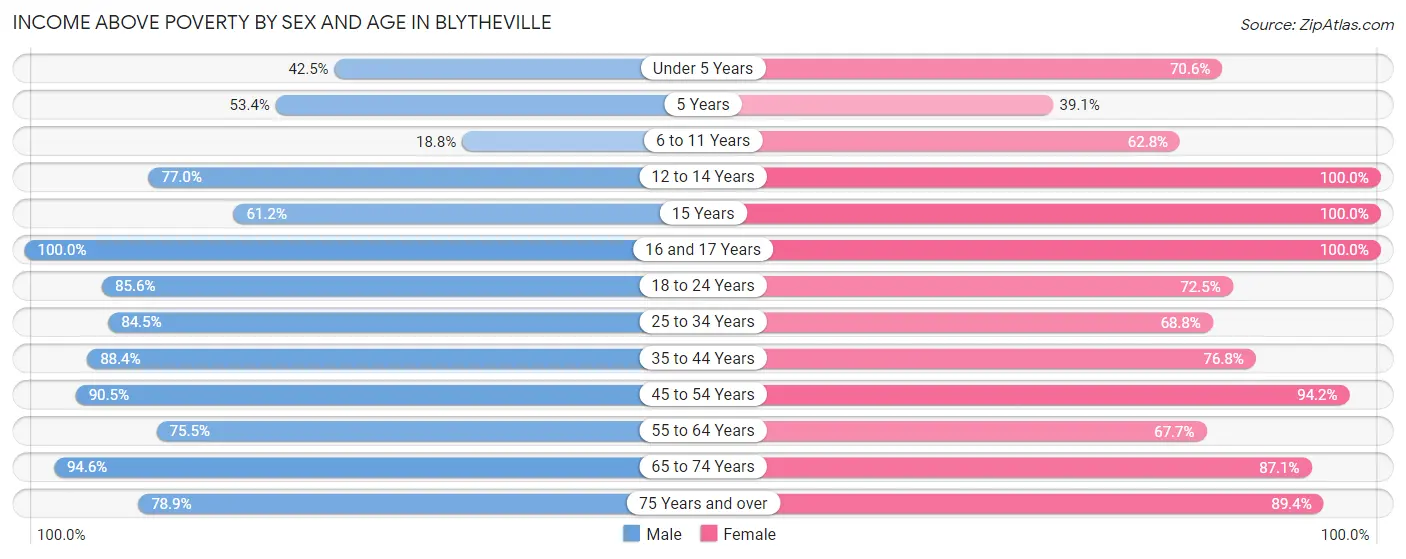
| Age Bracket | Male | Female |
| Under 5 Years | 164 (42.5%) | 370 (70.6%) |
| 5 Years | 110 (53.4%) | 108 (39.1%) |
| 6 to 11 Years | 60 (18.8%) | 401 (62.7%) |
| 12 to 14 Years | 97 (77.0%) | 89 (100.0%) |
| 15 Years | 30 (61.2%) | 51 (100.0%) |
| 16 and 17 Years | 133 (100.0%) | 275 (100.0%) |
| 18 to 24 Years | 553 (85.6%) | 393 (72.5%) |
| 25 to 34 Years | 598 (84.5%) | 740 (68.8%) |
| 35 to 44 Years | 684 (88.4%) | 722 (76.8%) |
| 45 to 54 Years | 610 (90.5%) | 616 (94.2%) |
| 55 to 64 Years | 511 (75.5%) | 736 (67.6%) |
| 65 to 74 Years | 642 (94.6%) | 657 (87.1%) |
| 75 Years and over | 243 (78.9%) | 397 (89.4%) |
| Total | 4,435 (78.0%) | 5,555 (75.6%) |
Income Below Poverty Among Married-Couple Families in Blytheville
The poverty statistics for married-couple families in Blytheville show that 2.1% or 39 of the total 1,893 families live below the poverty line. Families with no children have the highest poverty rate of 2.7%, comprising of 39 families. On the other hand, families with 1 or 2 children have the lowest poverty rate of 0.0%, which includes 0 families.
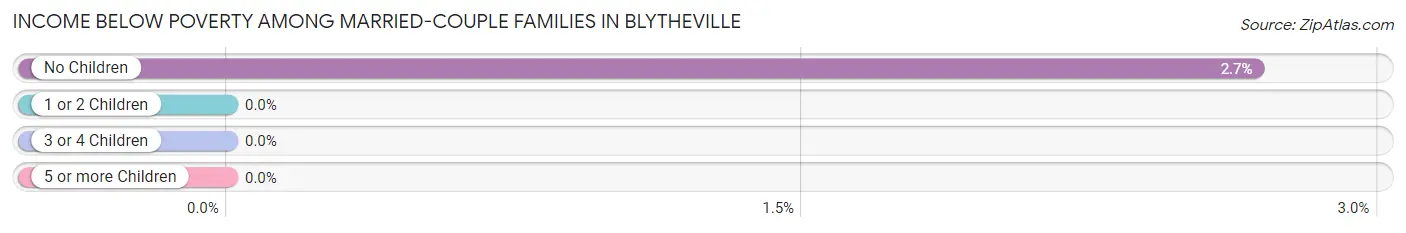
| Children | Above Poverty | Below Poverty |
| No Children | 1,418 (97.3%) | 39 (2.7%) |
| 1 or 2 Children | 368 (100.0%) | 0 (0.0%) |
| 3 or 4 Children | 68 (100.0%) | 0 (0.0%) |
| 5 or more Children | 0 (0.0%) | 0 (0.0%) |
| Total | 1,854 (97.9%) | 39 (2.1%) |
Income Below Poverty Among Single-Parent Households in Blytheville
According to the poverty data in Blytheville, 6.2% or 20 single-father households and 35.0% or 383 single-mother households are living below the poverty line. Among single-father households, those with 1 or 2 children have the highest poverty rate, with 10 households (8.2%) experiencing poverty. Likewise, among single-mother households, those with 5 or more children have the highest poverty rate, with 46 households (100.0%) falling below the poverty line.
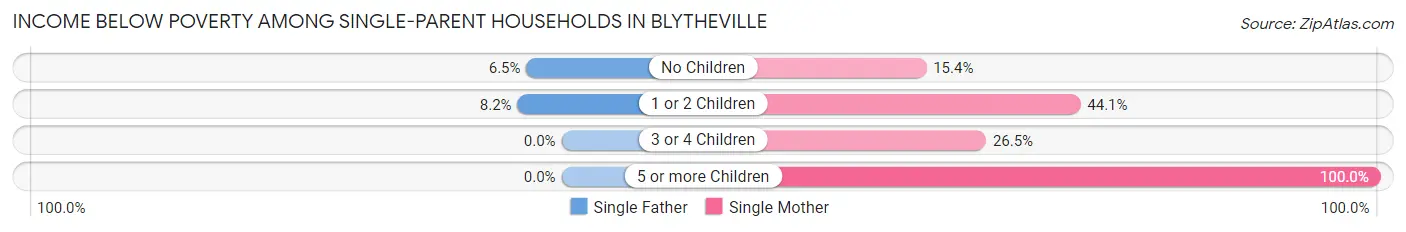
| Children | Single Father | Single Mother |
| No Children | 10 (6.5%) | 56 (15.4%) |
| 1 or 2 Children | 10 (8.2%) | 250 (44.1%) |
| 3 or 4 Children | 0 (0.0%) | 31 (26.5%) |
| 5 or more Children | 0 (0.0%) | 46 (100.0%) |
| Total | 20 (6.2%) | 383 (35.0%) |
Income Below Poverty Among Married-Couple vs Single-Parent Households in Blytheville
The poverty data for Blytheville shows that 39 of the married-couple family households (2.1%) and 403 of the single-parent households (28.4%) are living below the poverty level. Within the married-couple family households, those with no children have the highest poverty rate, with 39 households (2.7%) falling below the poverty line. Among the single-parent households, those with 5 or more children have the highest poverty rate, with 46 household (48.4%) living below poverty.
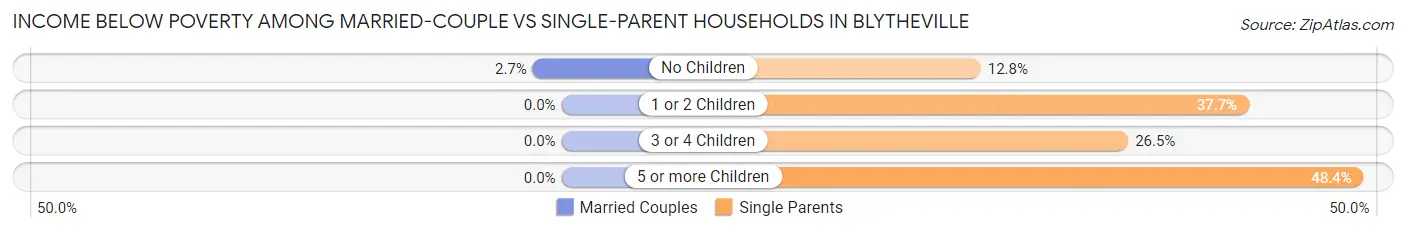
| Children | Married-Couple Families | Single-Parent Households |
| No Children | 39 (2.7%) | 66 (12.8%) |
| 1 or 2 Children | 0 (0.0%) | 260 (37.7%) |
| 3 or 4 Children | 0 (0.0%) | 31 (26.5%) |
| 5 or more Children | 0 (0.0%) | 46 (48.4%) |
| Total | 39 (2.1%) | 403 (28.4%) |
Race in Blytheville
The most populous races in Blytheville are Black / African American (8,074 | 60.8%), White / Caucasian (4,526 | 34.1%), and Hispanic or Latino (614 | 4.6%).
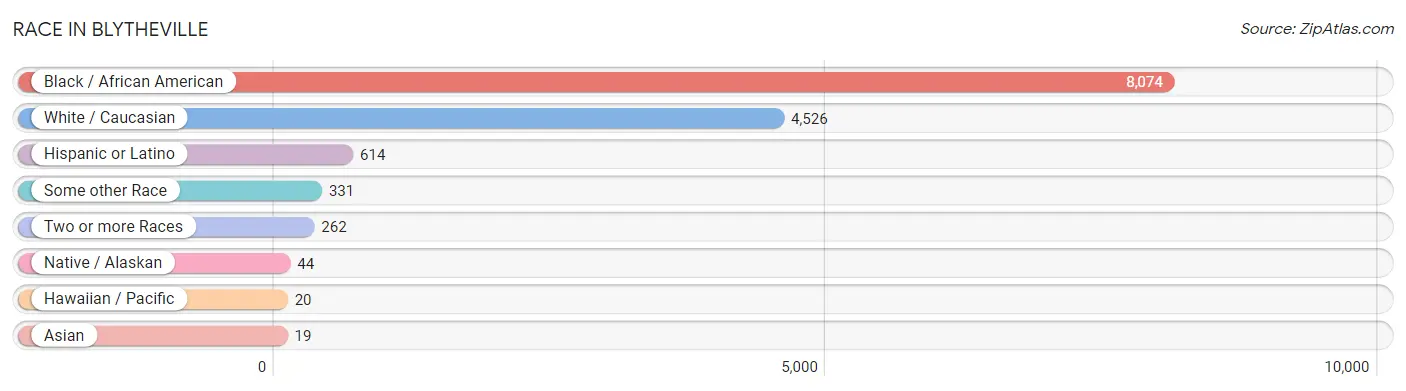
| Race | # Population | % Population |
| Asian | 19 | 0.1% |
| Black / African American | 8,074 | 60.8% |
| Hawaiian / Pacific | 20 | 0.2% |
| Hispanic or Latino | 614 | 4.6% |
| Native / Alaskan | 44 | 0.3% |
| White / Caucasian | 4,526 | 34.1% |
| Two or more Races | 262 | 2.0% |
| Some other Race | 331 | 2.5% |
| Total | 13,276 | 100.0% |
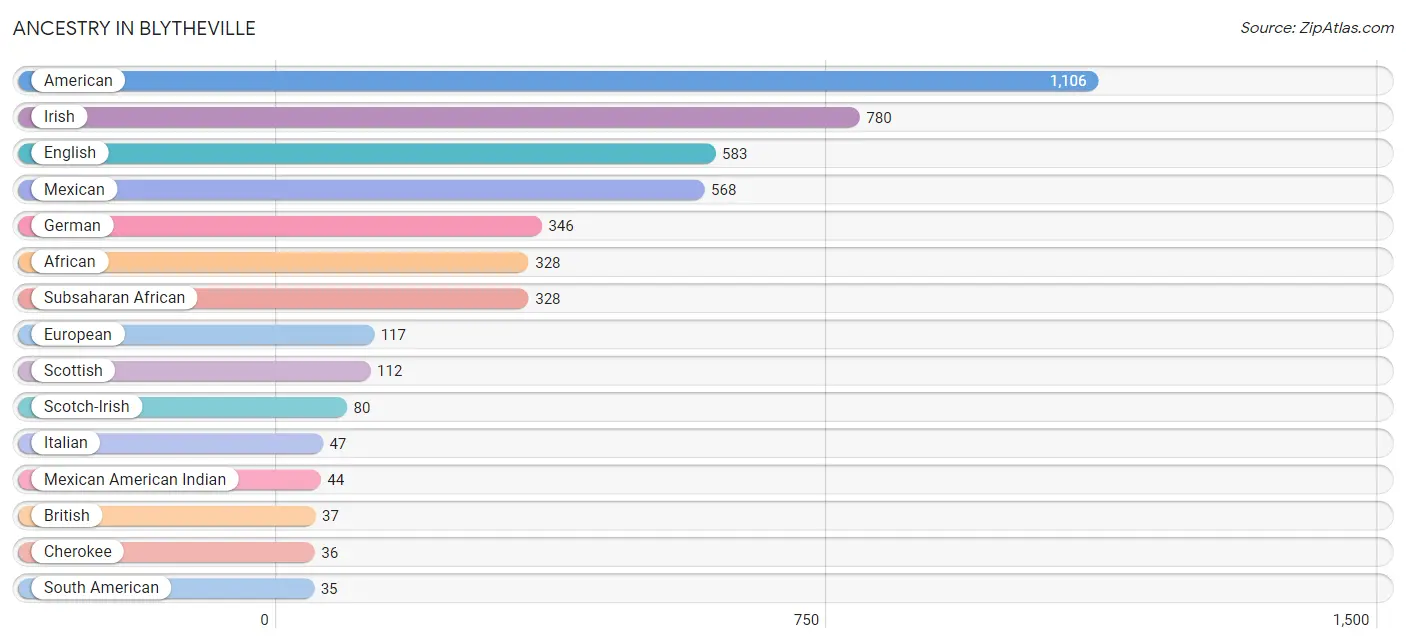
Ancestry in Blytheville
The most populous ancestries reported in Blytheville are American (1,106 | 8.3%), Irish (780 | 5.9%), English (583 | 4.4%), Mexican (568 | 4.3%), and German (346 | 2.6%), together accounting for 25.5% of all Blytheville residents.
| Ancestry | # Population | % Population |
| African | 328 | 2.5% |
| American | 1,106 | 8.3% |
| Austrian | 7 | 0.1% |
| Blackfeet | 28 | 0.2% |
| British | 37 | 0.3% |
| Cherokee | 36 | 0.3% |
| Choctaw | 6 | 0.1% |
| Danish | 5 | 0.0% |
| Dutch | 10 | 0.1% |
| English | 583 | 4.4% |
| European | 117 | 0.9% |
| French | 16 | 0.1% |
| German | 346 | 2.6% |
| Haitian | 8 | 0.1% |
| Irish | 780 | 5.9% |
| Italian | 47 | 0.4% |
| Korean | 2 | 0.0% |
| Mexican | 568 | 4.3% |
| Mexican American Indian | 44 | 0.3% |
| Navajo | 2 | 0.0% |
| Peruvian | 13 | 0.1% |
| Polish | 20 | 0.2% |
| Portuguese | 29 | 0.2% |
| Puerto Rican | 11 | 0.1% |
| Samoan | 20 | 0.2% |
| Scotch-Irish | 80 | 0.6% |
| Scottish | 112 | 0.8% |
| South American | 35 | 0.3% |
| Subsaharan African | 328 | 2.5% |
| Thai | 17 | 0.1% |
| Venezuelan | 22 | 0.2% |
| Welsh | 33 | 0.3% | View All 32 Rows |
Immigrants in Blytheville
The most numerous immigrant groups reported in Blytheville came from Latin America (346 | 2.6%), Central America (311 | 2.3%), Mexico (311 | 2.3%), South America (35 | 0.3%), and Venezuela (22 | 0.2%), together accounting for 7.7% of all Blytheville residents.
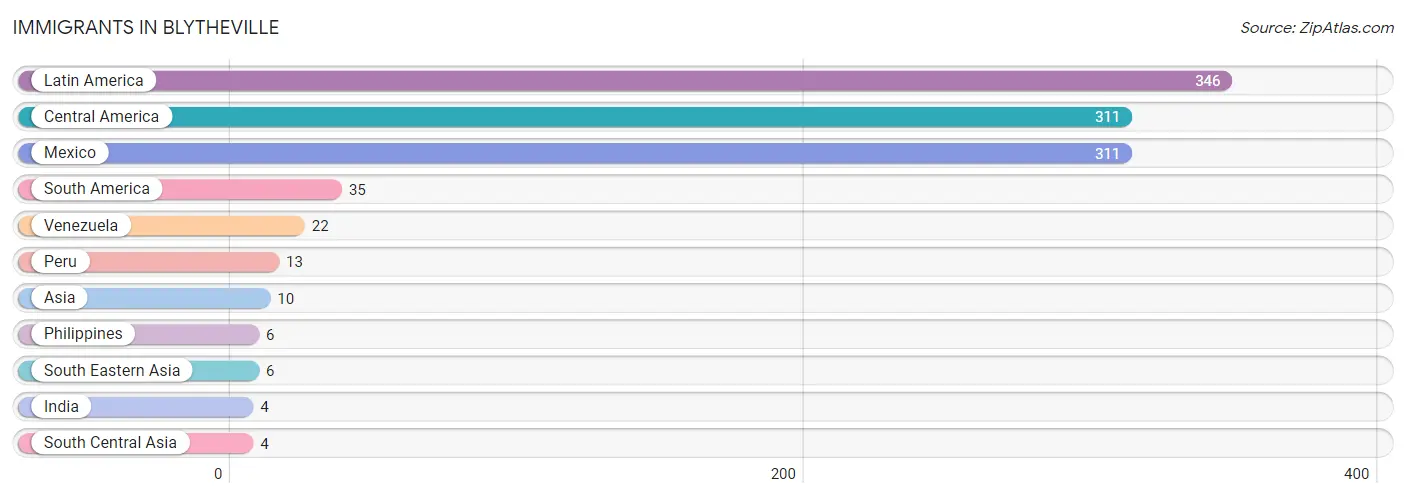
| Immigration Origin | # Population | % Population |
| Asia | 10 | 0.1% |
| Central America | 311 | 2.3% |
| India | 4 | 0.0% |
| Latin America | 346 | 2.6% |
| Mexico | 311 | 2.3% |
| Peru | 13 | 0.1% |
| Philippines | 6 | 0.1% |
| South America | 35 | 0.3% |
| South Central Asia | 4 | 0.0% |
| South Eastern Asia | 6 | 0.1% |
| Venezuela | 22 | 0.2% | View All 11 Rows |
Sex and Age in Blytheville
Sex and Age in Blytheville
The most populous age groups in Blytheville are 20 to 24 Years (515 | 8.9%) for men and 5 to 9 Years (911 | 12.1%) for women.
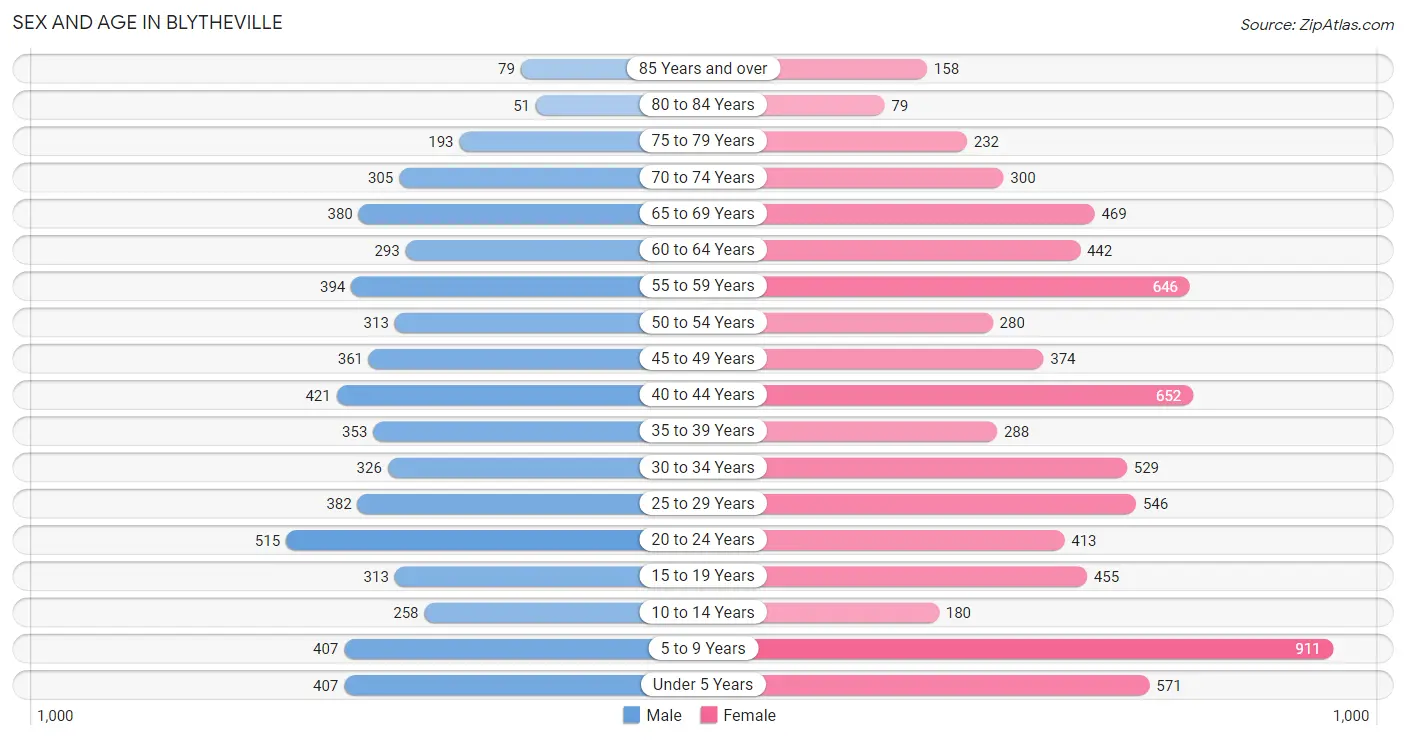
| Age Bracket | Male | Female |
| Under 5 Years | 407 (7.1%) | 571 (7.6%) |
| 5 to 9 Years | 407 (7.1%) | 911 (12.1%) |
| 10 to 14 Years | 258 (4.5%) | 180 (2.4%) |
| 15 to 19 Years | 313 (5.4%) | 455 (6.0%) |
| 20 to 24 Years | 515 (8.9%) | 413 (5.5%) |
| 25 to 29 Years | 382 (6.6%) | 546 (7.3%) |
| 30 to 34 Years | 326 (5.7%) | 529 (7.0%) |
| 35 to 39 Years | 353 (6.1%) | 288 (3.8%) |
| 40 to 44 Years | 421 (7.3%) | 652 (8.7%) |
| 45 to 49 Years | 361 (6.3%) | 374 (5.0%) |
| 50 to 54 Years | 313 (5.4%) | 280 (3.7%) |
| 55 to 59 Years | 394 (6.9%) | 646 (8.6%) |
| 60 to 64 Years | 293 (5.1%) | 442 (5.9%) |
| 65 to 69 Years | 380 (6.6%) | 469 (6.2%) |
| 70 to 74 Years | 305 (5.3%) | 300 (4.0%) |
| 75 to 79 Years | 193 (3.4%) | 232 (3.1%) |
| 80 to 84 Years | 51 (0.9%) | 79 (1.1%) |
| 85 Years and over | 79 (1.4%) | 158 (2.1%) |
| Total | 5,751 (100.0%) | 7,525 (100.0%) |
Families and Households in Blytheville
Median Family Size in Blytheville
The median family size in Blytheville is 3.07 persons per family, with single female/mother families (1,094 | 33.0%) accounting for the largest median family size of 3.57 persons per family. On the other hand, married-couple families (1,893 | 57.2%) represent the smallest median family size with 2.80 persons per family.
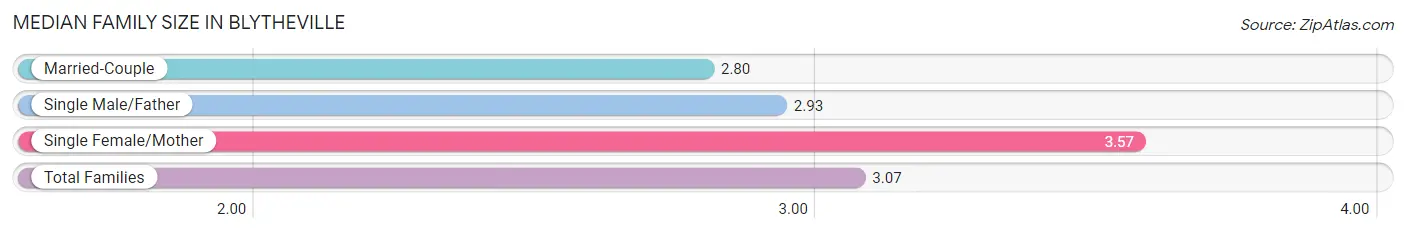
| Family Type | # Families | Family Size |
| Married-Couple | 1,893 (57.2%) | 2.80 |
| Single Male/Father | 324 (9.8%) | 2.93 |
| Single Female/Mother | 1,094 (33.0%) | 3.57 |
| Total Families | 3,311 (100.0%) | 3.07 |
Median Household Size in Blytheville
The median household size in Blytheville is 2.44 persons per household, with single female/mother households (1,094 | 20.3%) accounting for the largest median household size of 3.84 persons per household. non-family households (2,084 | 38.6%) represent the smallest median household size with 1.18 persons per household.
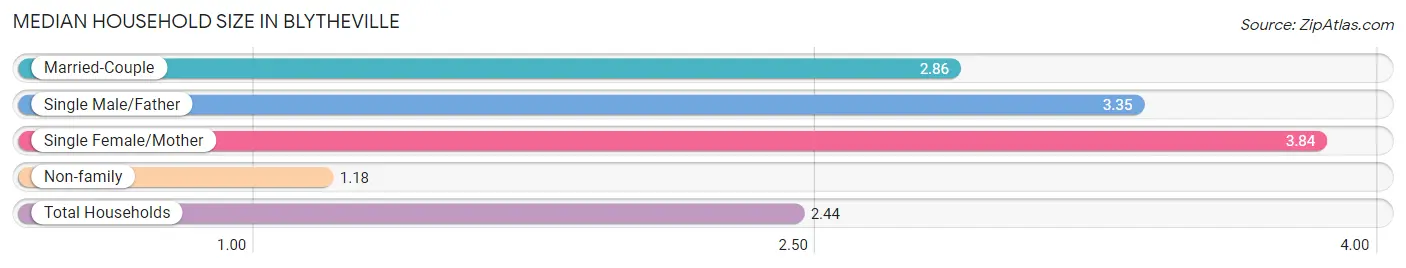
| Household Type | # Households | Household Size |
| Married-Couple | 1,893 (35.1%) | 2.86 |
| Single Male/Father | 324 (6.0%) | 3.35 |
| Single Female/Mother | 1,094 (20.3%) | 3.84 |
| Non-family | 2,084 (38.6%) | 1.18 |
| Total Households | 5,395 (100.0%) | 2.44 |
Household Size by Marriage Status in Blytheville
Out of a total of 5,395 households in Blytheville, 3,311 (61.4%) are family households, while 2,084 (38.6%) are nonfamily households. The most numerous type of family households are 2-person households, comprising 1,787, and the most common type of nonfamily households are 1-person households, comprising 1,924.
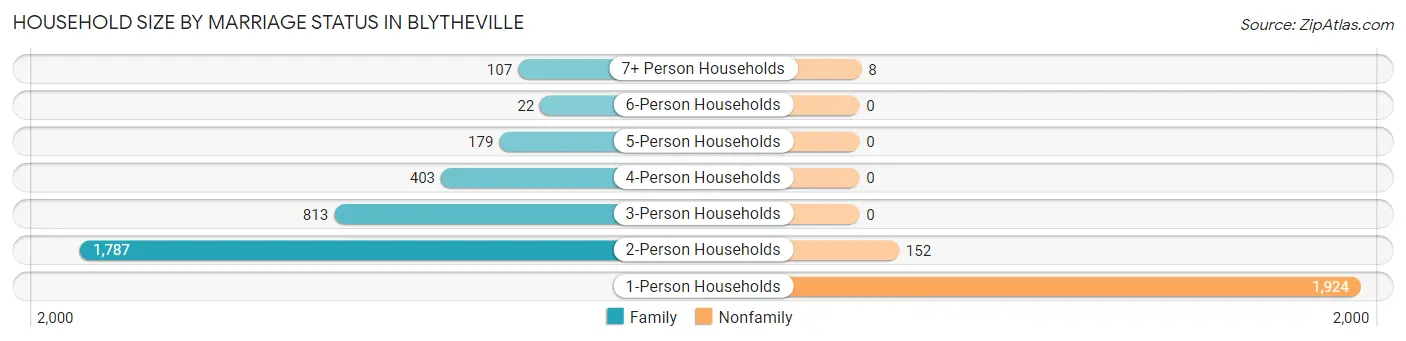
| Household Size | Family Households | Nonfamily Households |
| 1-Person Households | - | 1,924 (35.7%) |
| 2-Person Households | 1,787 (33.1%) | 152 (2.8%) |
| 3-Person Households | 813 (15.1%) | 0 (0.0%) |
| 4-Person Households | 403 (7.5%) | 0 (0.0%) |
| 5-Person Households | 179 (3.3%) | 0 (0.0%) |
| 6-Person Households | 22 (0.4%) | 0 (0.0%) |
| 7+ Person Households | 107 (2.0%) | 8 (0.2%) |
| Total | 3,311 (61.4%) | 2,084 (38.6%) |
Female Fertility in Blytheville
Fertility by Age in Blytheville
Average fertility rate in Blytheville is 85.0 births per 1,000 women. Women in the age bracket of 20 to 34 years have the highest fertility rate with 151.0 births per 1,000 women. Women in the age bracket of 20 to 34 years acount for 80.0% of all women with births.
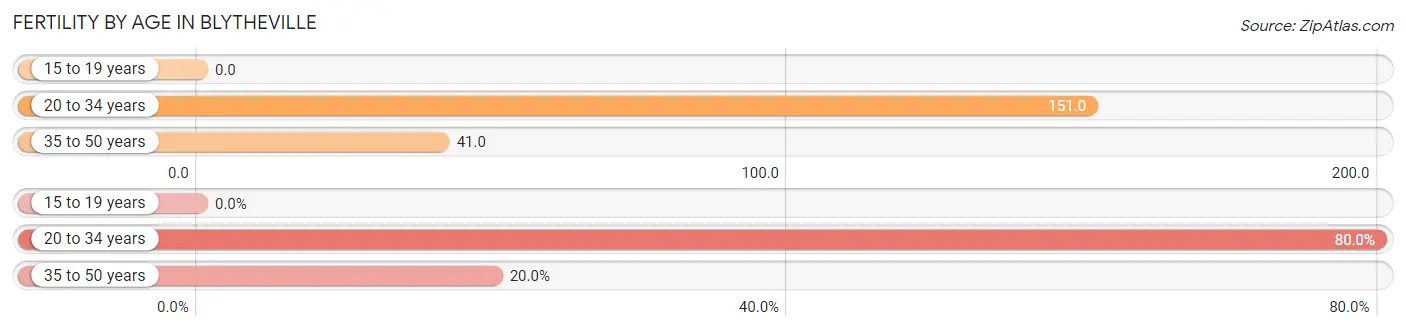
| Age Bracket | Women with Births | Births / 1,000 Women |
| 15 to 19 years | 0 (0.0%) | 0.0 |
| 20 to 34 years | 224 (80.0%) | 151.0 |
| 35 to 50 years | 56 (20.0%) | 41.0 |
| Total | 280 (100.0%) | 85.0 |
Fertility by Age by Marriage Status in Blytheville
0.4% of women with births (280) in Blytheville are married. The highest percentage of unmarried women with births falls into 20 to 34 years age bracket with 100.0% of them unmarried at the time of birth, while the lowest percentage of unmarried women with births belong to 35 to 50 years age bracket with 98.2% of them unmarried.
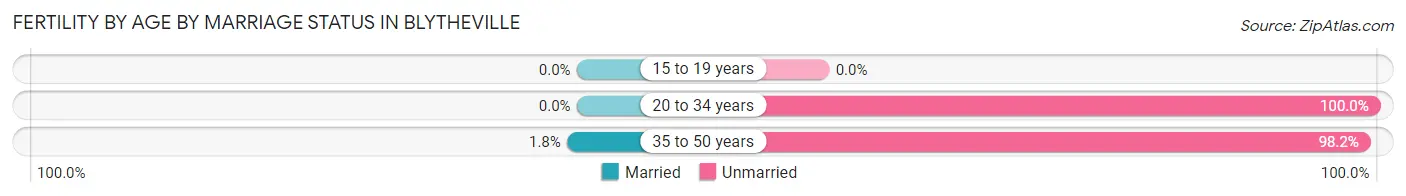
| Age Bracket | Married | Unmarried |
| 15 to 19 years | 0 (0.0%) | 0 (0.0%) |
| 20 to 34 years | 0 (0.0%) | 224 (100.0%) |
| 35 to 50 years | 1 (1.8%) | 55 (98.2%) |
| Total | 1 (0.4%) | 279 (99.6%) |
Fertility by Education in Blytheville
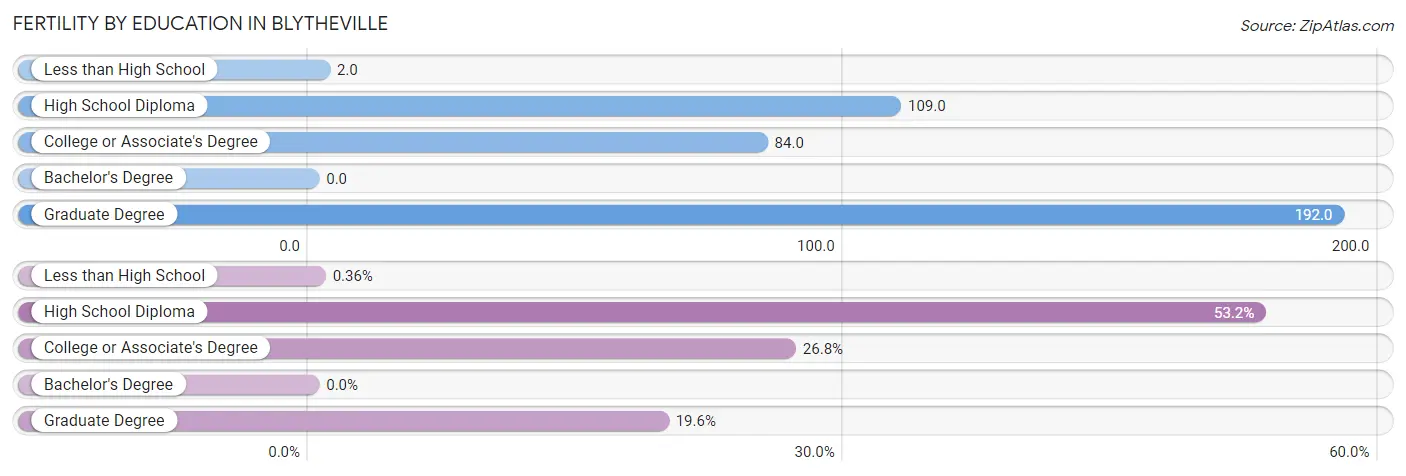
| Educational Attainment | Women with Births | Births / 1,000 Women |
| Less than High School | 1 (0.4%) | 2.0 |
| High School Diploma | 149 (53.2%) | 109.0 |
| College or Associate's Degree | 75 (26.8%) | 84.0 |
| Bachelor's Degree | 0 (0.0%) | 0.0 |
| Graduate Degree | 55 (19.6%) | 192.0 |
| Total | 280 (100.0%) | 85.0 |
Fertility by Education by Marriage Status in Blytheville
99.6% of women with births in Blytheville are unmarried. Women with the educational attainment of college or associate's degree are most likely to be married with 1.3% of them married at childbirth, while women with the educational attainment of less than high school are least likely to be married with 100.0% of them unmarried at childbirth.
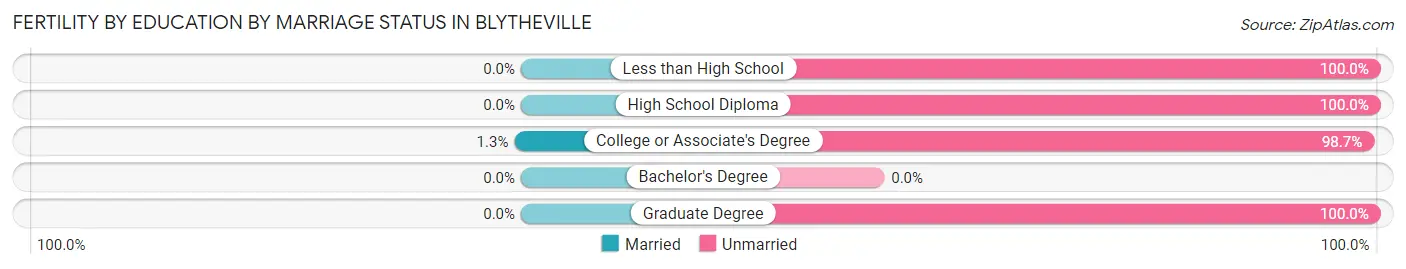
| Educational Attainment | Married | Unmarried |
| Less than High School | 0 (0.0%) | 1 (100.0%) |
| High School Diploma | 0 (0.0%) | 149 (100.0%) |
| College or Associate's Degree | 1 (1.3%) | 74 (98.7%) |
| Bachelor's Degree | 0 (0.0%) | 0 (0.0%) |
| Graduate Degree | 0 (0.0%) | 55 (100.0%) |
| Total | 1 (0.4%) | 279 (99.6%) |
Employment Characteristics in Blytheville
Employment by Class of Employer in Blytheville
Among the 5,709 employed individuals in Blytheville, private company employees (3,821 | 66.9%), local government employees (721 | 12.6%), and self-employed (incorporated) (378 | 6.6%) make up the most common classes of employment.
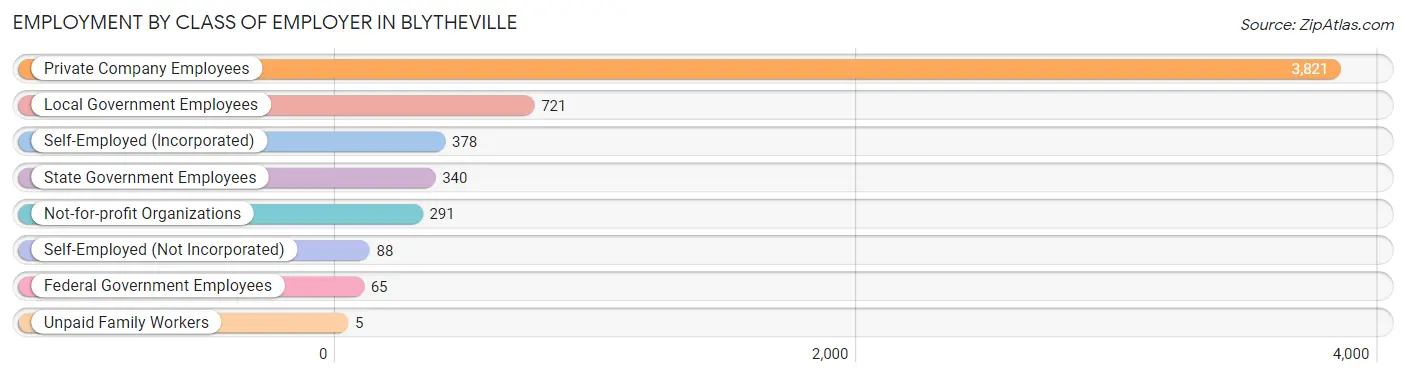
| Employer Class | # Employees | % Employees |
| Private Company Employees | 3,821 | 66.9% |
| Self-Employed (Incorporated) | 378 | 6.6% |
| Self-Employed (Not Incorporated) | 88 | 1.5% |
| Not-for-profit Organizations | 291 | 5.1% |
| Local Government Employees | 721 | 12.6% |
| State Government Employees | 340 | 6.0% |
| Federal Government Employees | 65 | 1.1% |
| Unpaid Family Workers | 5 | 0.1% |
| Total | 5,709 | 100.0% |
Employment Status by Age in Blytheville
According to the labor force statistics for Blytheville, out of the total population over 16 years of age (10,442), 64.5% or 6,735 individuals are in the labor force, with 13.6% or 916 of them unemployed. The age group with the highest labor force participation rate is 30 to 34 years, with 97.0% or 829 individuals in the labor force. Within the labor force, the 16 to 19 years age range has the highest percentage of unemployed individuals, with 48.5% or 211 of them being unemployed.
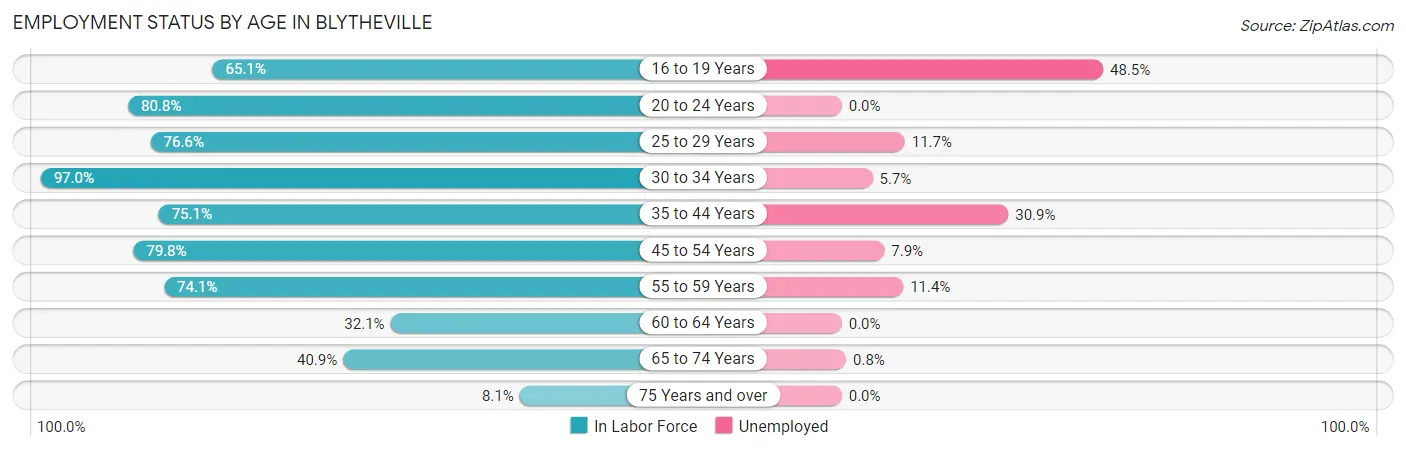
| Age Bracket | In Labor Force | Unemployed |
| 16 to 19 Years | 435 (65.1%) | 211 (48.5%) |
| 20 to 24 Years | 750 (80.8%) | 0 (0.0%) |
| 25 to 29 Years | 711 (76.6%) | 83 (11.7%) |
| 30 to 34 Years | 829 (97.0%) | 47 (5.7%) |
| 35 to 44 Years | 1,287 (75.1%) | 398 (30.9%) |
| 45 to 54 Years | 1,060 (79.8%) | 84 (7.9%) |
| 55 to 59 Years | 771 (74.1%) | 88 (11.4%) |
| 60 to 64 Years | 236 (32.1%) | 0 (0.0%) |
| 65 to 74 Years | 595 (40.9%) | 5 (0.8%) |
| 75 Years and over | 64 (8.1%) | 0 (0.0%) |
| Total | 6,735 (64.5%) | 916 (13.6%) |
Employment Status by Educational Attainment in Blytheville
According to labor force statistics for Blytheville, 74.2% of individuals (4,897) out of the total population between 25 and 64 years of age (6,600) are in the labor force, with 14.3% or 700 of them being unemployed. The group with the highest labor force participation rate are those with the educational attainment of bachelor's degree or higher, with 91.0% or 983 individuals in the labor force. Within the labor force, individuals with less than high school education have the highest percentage of unemployment, with 26.4% or 81 of them being unemployed.
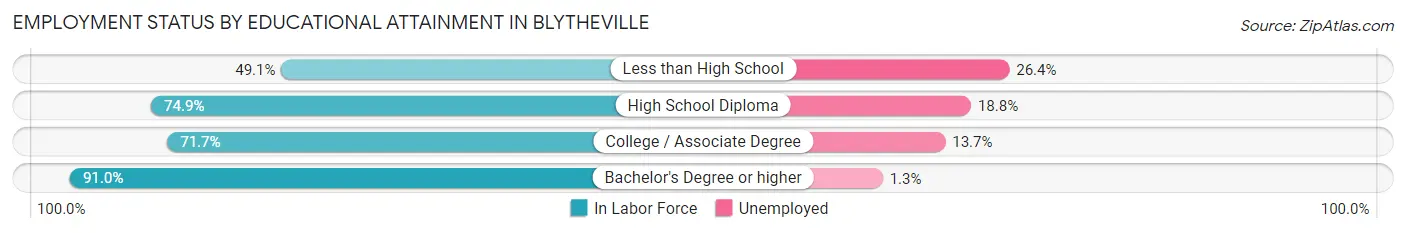
| Educational Attainment | In Labor Force | Unemployed |
| Less than High School | 307 (49.1%) | 165 (26.4%) |
| High School Diploma | 2,207 (74.9%) | 554 (18.8%) |
| College / Associate Degree | 1,397 (71.7%) | 267 (13.7%) |
| Bachelor's Degree or higher | 983 (91.0%) | 14 (1.3%) |
| Total | 4,897 (74.2%) | 944 (14.3%) |
Employment Occupations by Sex in Blytheville
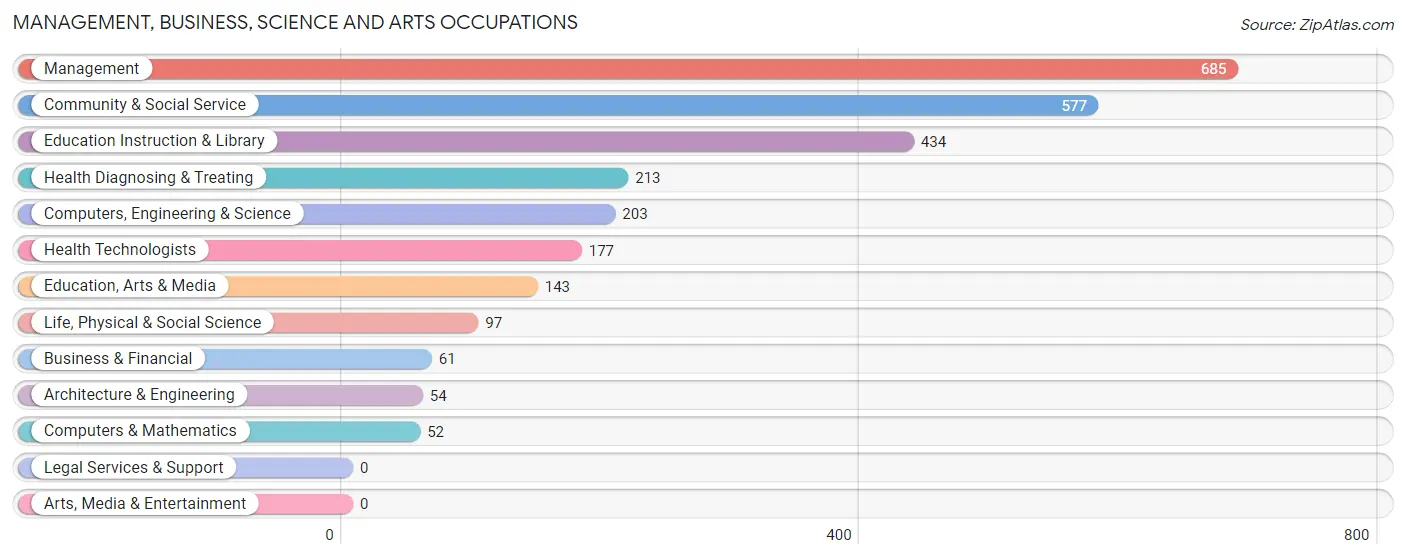
Management, Business, Science and Arts Occupations
The most common Management, Business, Science and Arts occupations in Blytheville are Management (685 | 11.8%), Community & Social Service (577 | 9.9%), Education Instruction & Library (434 | 7.4%), Health Diagnosing & Treating (213 | 3.7%), and Computers, Engineering & Science (203 | 3.5%).
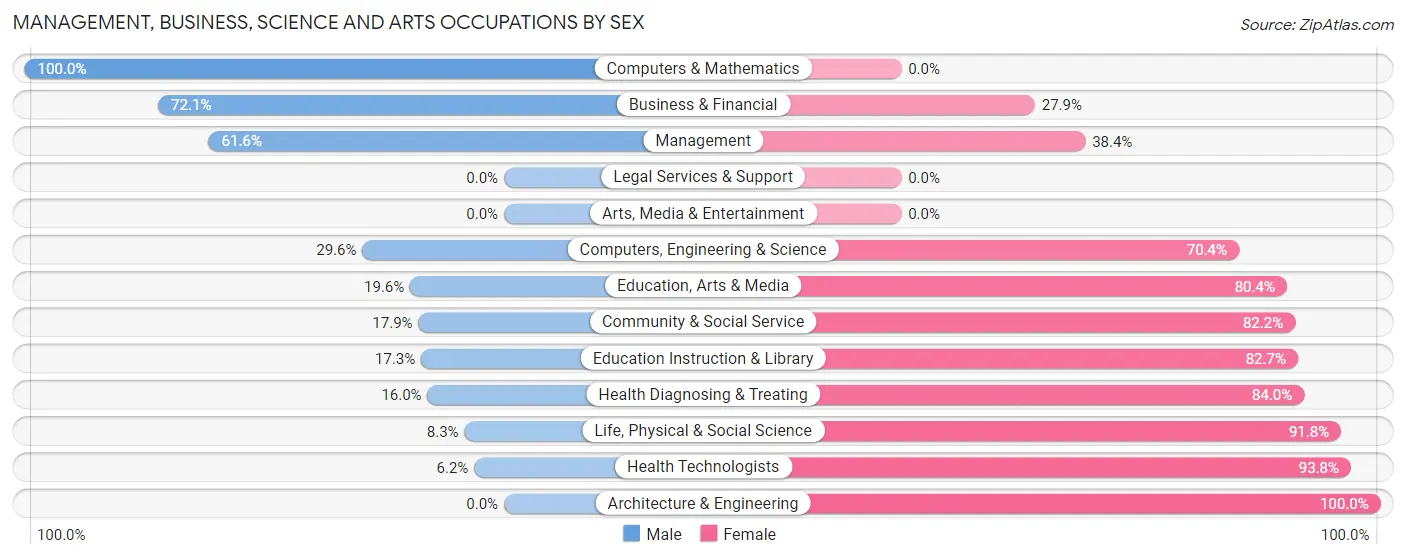
Management, Business, Science and Arts Occupations by Sex
Within the Management, Business, Science and Arts occupations in Blytheville, the most male-oriented occupations are Computers & Mathematics (100.0%), Business & Financial (72.1%), and Management (61.6%), while the most female-oriented occupations are Architecture & Engineering (100.0%), Health Technologists (93.8%), and Life, Physical & Social Science (91.7%).
| Occupation | Male | Female |
| Management | 422 (61.6%) | 263 (38.4%) |
| Business & Financial | 44 (72.1%) | 17 (27.9%) |
| Computers, Engineering & Science | 60 (29.6%) | 143 (70.4%) |
| Computers & Mathematics | 52 (100.0%) | 0 (0.0%) |
| Architecture & Engineering | 0 (0.0%) | 54 (100.0%) |
| Life, Physical & Social Science | 8 (8.3%) | 89 (91.7%) |
| Community & Social Service | 103 (17.8%) | 474 (82.2%) |
| Education, Arts & Media | 28 (19.6%) | 115 (80.4%) |
| Legal Services & Support | 0 (0.0%) | 0 (0.0%) |
| Education Instruction & Library | 75 (17.3%) | 359 (82.7%) |
| Arts, Media & Entertainment | 0 (0.0%) | 0 (0.0%) |
| Health Diagnosing & Treating | 34 (16.0%) | 179 (84.0%) |
| Health Technologists | 11 (6.2%) | 166 (93.8%) |
| Total (Category) | 663 (38.1%) | 1,076 (61.9%) |
| Total (Overall) | 2,689 (46.2%) | 3,133 (53.8%) |
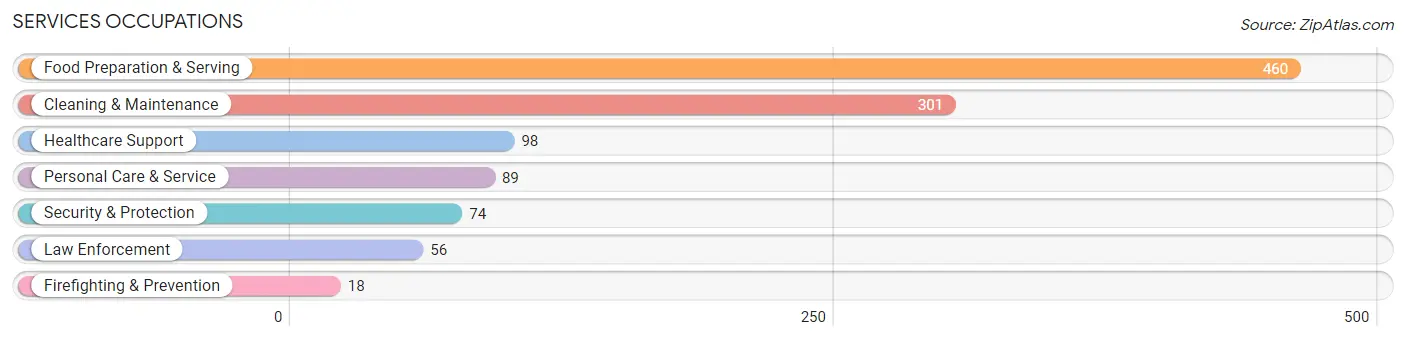
Services Occupations
The most common Services occupations in Blytheville are Food Preparation & Serving (460 | 7.9%), Cleaning & Maintenance (301 | 5.2%), Healthcare Support (98 | 1.7%), Personal Care & Service (89 | 1.5%), and Security & Protection (74 | 1.3%).
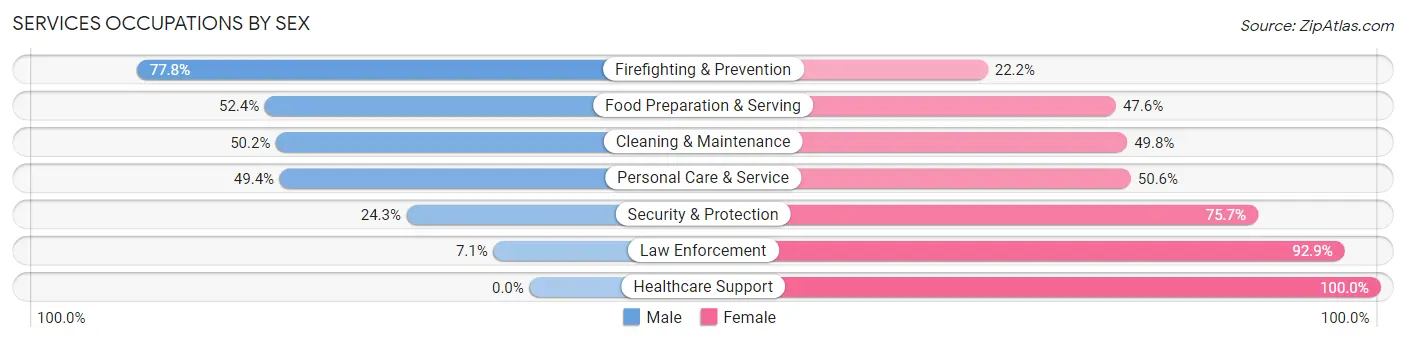
Services Occupations by Sex
Within the Services occupations in Blytheville, the most male-oriented occupations are Firefighting & Prevention (77.8%), Food Preparation & Serving (52.4%), and Cleaning & Maintenance (50.2%), while the most female-oriented occupations are Healthcare Support (100.0%), Law Enforcement (92.9%), and Security & Protection (75.7%).
| Occupation | Male | Female |
| Healthcare Support | 0 (0.0%) | 98 (100.0%) |
| Security & Protection | 18 (24.3%) | 56 (75.7%) |
| Firefighting & Prevention | 14 (77.8%) | 4 (22.2%) |
| Law Enforcement | 4 (7.1%) | 52 (92.9%) |
| Food Preparation & Serving | 241 (52.4%) | 219 (47.6%) |
| Cleaning & Maintenance | 151 (50.2%) | 150 (49.8%) |
| Personal Care & Service | 44 (49.4%) | 45 (50.6%) |
| Total (Category) | 454 (44.4%) | 568 (55.6%) |
| Total (Overall) | 2,689 (46.2%) | 3,133 (53.8%) |
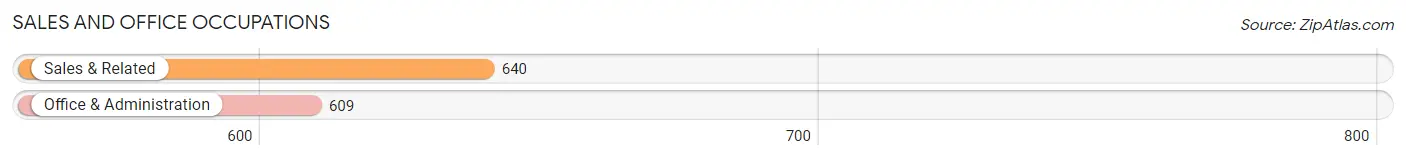
Sales and Office Occupations
The most common Sales and Office occupations in Blytheville are Sales & Related (640 | 11.0%), and Office & Administration (609 | 10.5%).
Sales and Office Occupations by Sex
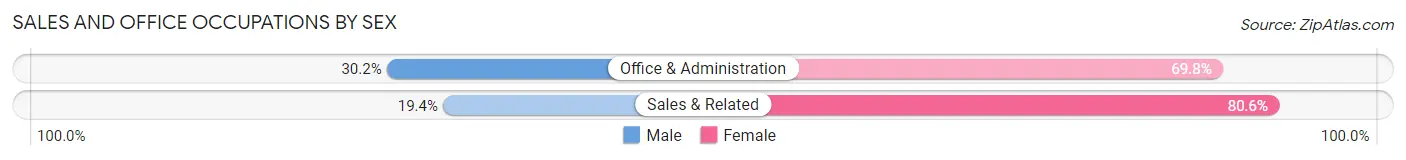
| Occupation | Male | Female |
| Sales & Related | 124 (19.4%) | 516 (80.6%) |
| Office & Administration | 184 (30.2%) | 425 (69.8%) |
| Total (Category) | 308 (24.7%) | 941 (75.3%) |
| Total (Overall) | 2,689 (46.2%) | 3,133 (53.8%) |
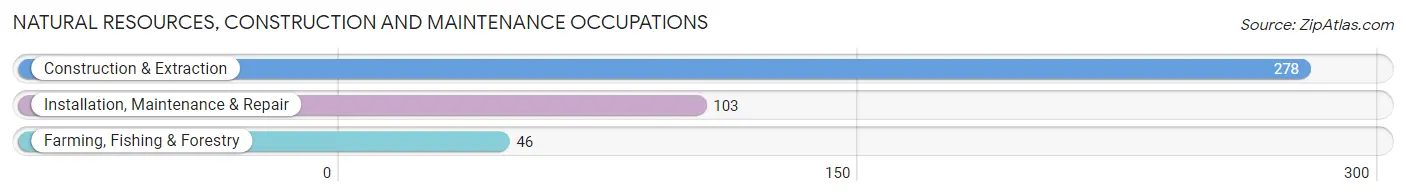
Natural Resources, Construction and Maintenance Occupations
The most common Natural Resources, Construction and Maintenance occupations in Blytheville are Construction & Extraction (278 | 4.8%), Installation, Maintenance & Repair (103 | 1.8%), and Farming, Fishing & Forestry (46 | 0.8%).
Natural Resources, Construction and Maintenance Occupations by Sex
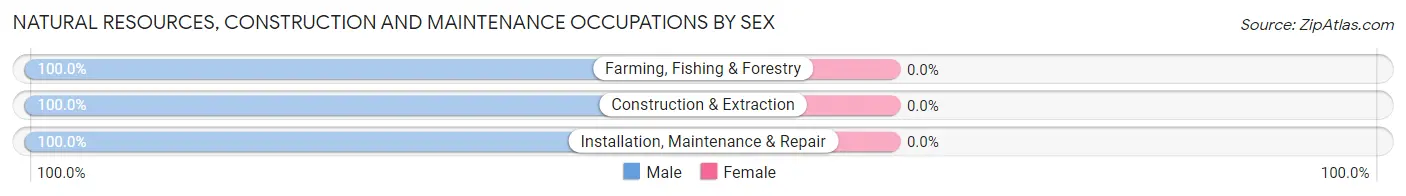
| Occupation | Male | Female |
| Farming, Fishing & Forestry | 46 (100.0%) | 0 (0.0%) |
| Construction & Extraction | 278 (100.0%) | 0 (0.0%) |
| Installation, Maintenance & Repair | 103 (100.0%) | 0 (0.0%) |
| Total (Category) | 427 (100.0%) | 0 (0.0%) |
| Total (Overall) | 2,689 (46.2%) | 3,133 (53.8%) |
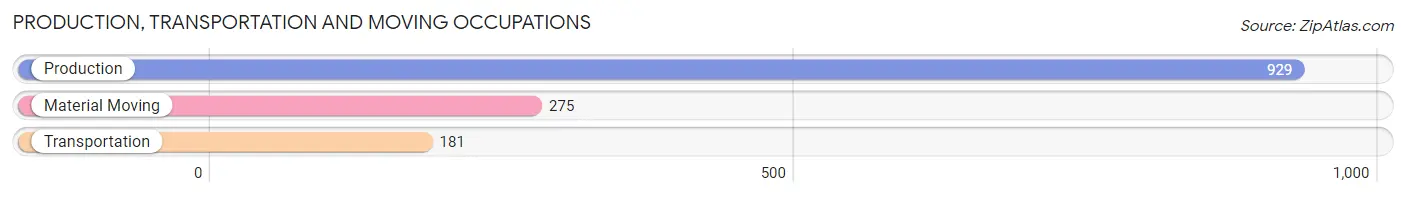
Production, Transportation and Moving Occupations
The most common Production, Transportation and Moving occupations in Blytheville are Production (929 | 16.0%), Material Moving (275 | 4.7%), and Transportation (181 | 3.1%).
Production, Transportation and Moving Occupations by Sex
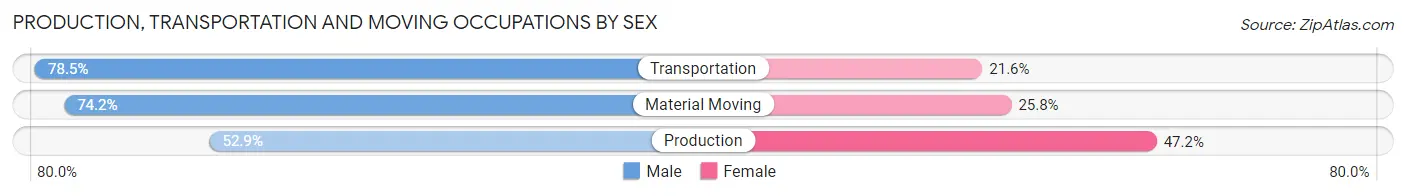
| Occupation | Male | Female |
| Production | 491 (52.8%) | 438 (47.1%) |
| Transportation | 142 (78.4%) | 39 (21.5%) |
| Material Moving | 204 (74.2%) | 71 (25.8%) |
| Total (Category) | 837 (60.4%) | 548 (39.6%) |
| Total (Overall) | 2,689 (46.2%) | 3,133 (53.8%) |
Employment Industries by Sex in Blytheville
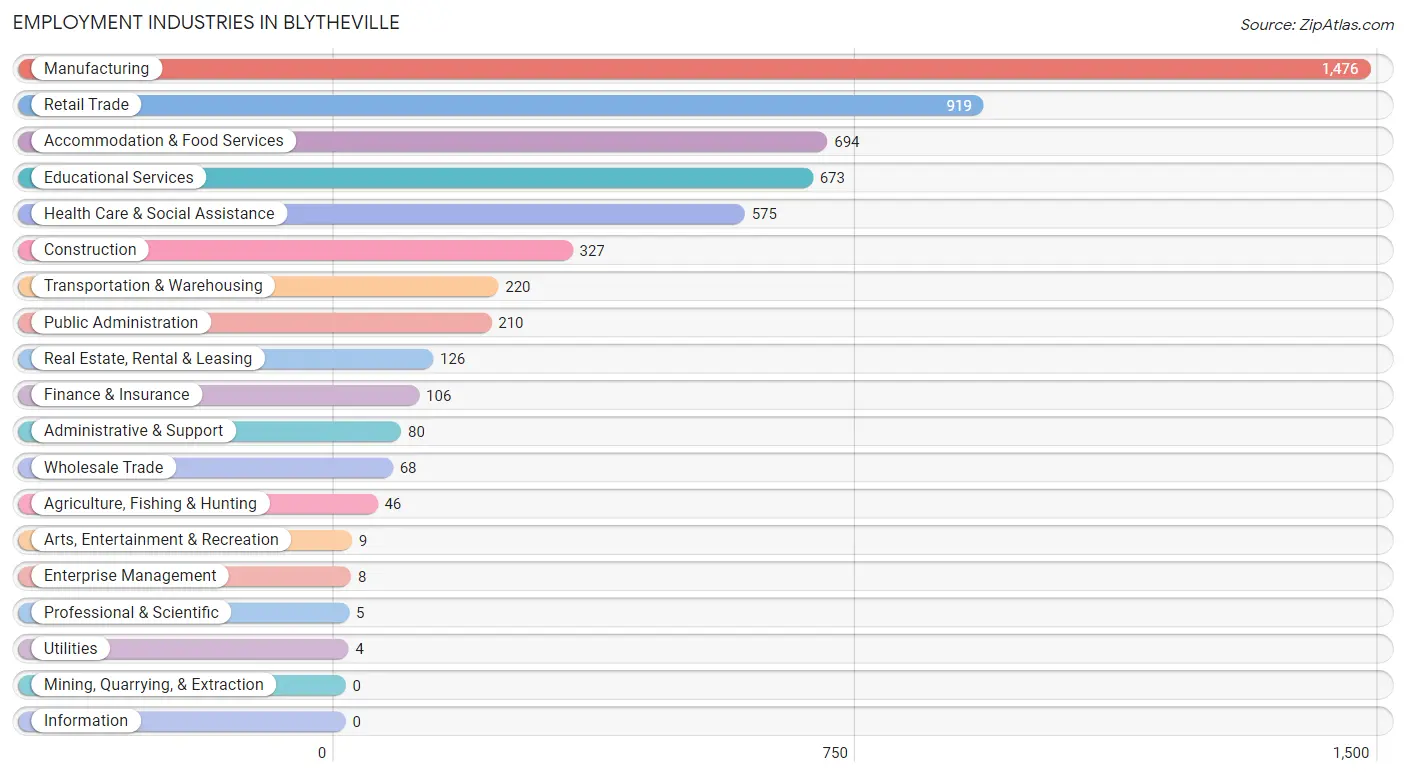
Employment Industries in Blytheville
The major employment industries in Blytheville include Manufacturing (1,476 | 25.4%), Retail Trade (919 | 15.8%), Accommodation & Food Services (694 | 11.9%), Educational Services (673 | 11.6%), and Health Care & Social Assistance (575 | 9.9%).
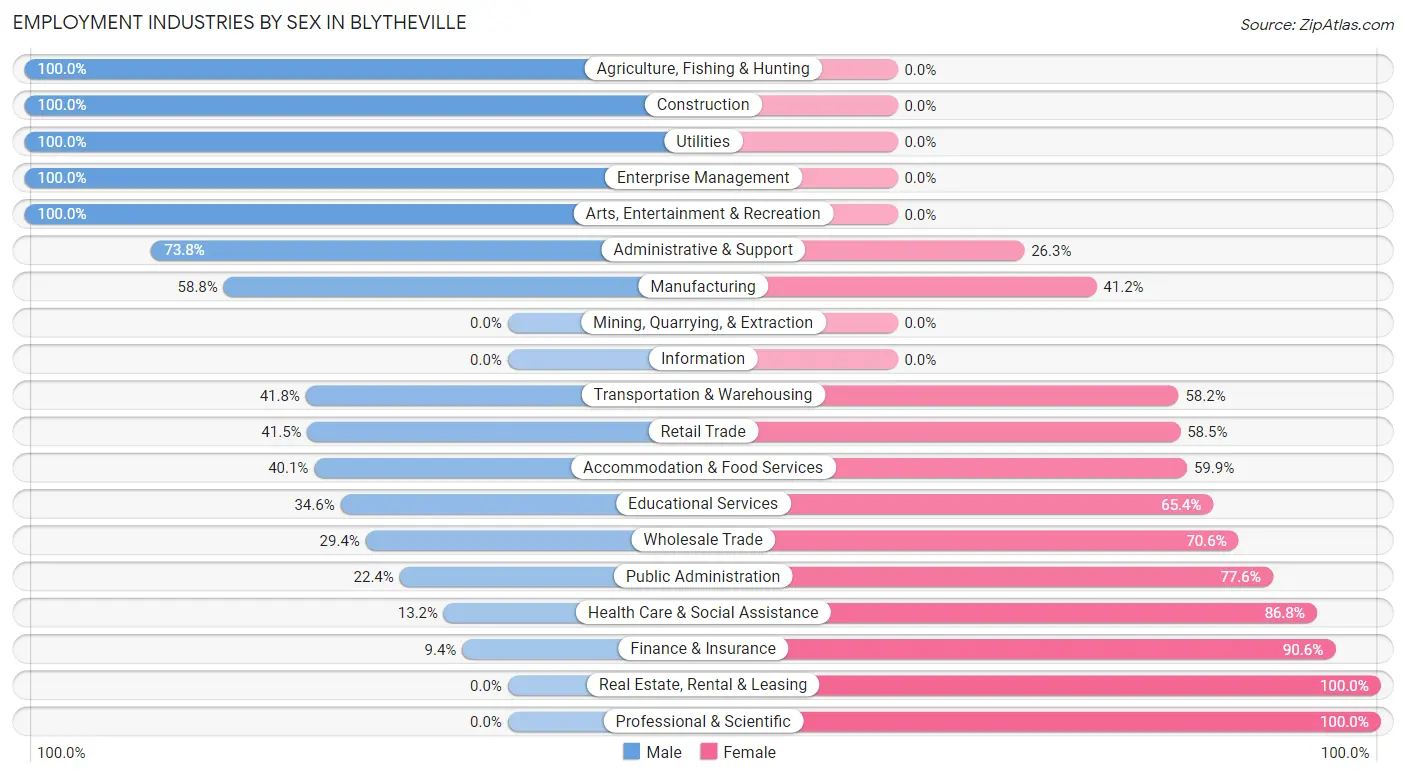
Employment Industries by Sex in Blytheville
The Blytheville industries that see more men than women are Agriculture, Fishing & Hunting (100.0%), Construction (100.0%), and Utilities (100.0%), whereas the industries that tend to have a higher number of women are Real Estate, Rental & Leasing (100.0%), Professional & Scientific (100.0%), and Finance & Insurance (90.6%).
| Industry | Male | Female |
| Agriculture, Fishing & Hunting | 46 (100.0%) | 0 (0.0%) |
| Mining, Quarrying, & Extraction | 0 (0.0%) | 0 (0.0%) |
| Construction | 327 (100.0%) | 0 (0.0%) |
| Manufacturing | 868 (58.8%) | 608 (41.2%) |
| Wholesale Trade | 20 (29.4%) | 48 (70.6%) |
| Retail Trade | 381 (41.5%) | 538 (58.5%) |
| Transportation & Warehousing | 92 (41.8%) | 128 (58.2%) |
| Utilities | 4 (100.0%) | 0 (0.0%) |
| Information | 0 (0.0%) | 0 (0.0%) |
| Finance & Insurance | 10 (9.4%) | 96 (90.6%) |
| Real Estate, Rental & Leasing | 0 (0.0%) | 126 (100.0%) |
| Professional & Scientific | 0 (0.0%) | 5 (100.0%) |
| Enterprise Management | 8 (100.0%) | 0 (0.0%) |
| Administrative & Support | 59 (73.8%) | 21 (26.3%) |
| Educational Services | 233 (34.6%) | 440 (65.4%) |
| Health Care & Social Assistance | 76 (13.2%) | 499 (86.8%) |
| Arts, Entertainment & Recreation | 9 (100.0%) | 0 (0.0%) |
| Accommodation & Food Services | 278 (40.1%) | 416 (59.9%) |
| Public Administration | 47 (22.4%) | 163 (77.6%) |
| Total | 2,689 (46.2%) | 3,133 (53.8%) |
Education in Blytheville
School Enrollment in Blytheville
The most common levels of schooling among the 3,121 students in Blytheville are elementary school (712 | 22.8%), high school (589 | 18.9%), and nursery / preschool (546 | 17.5%).
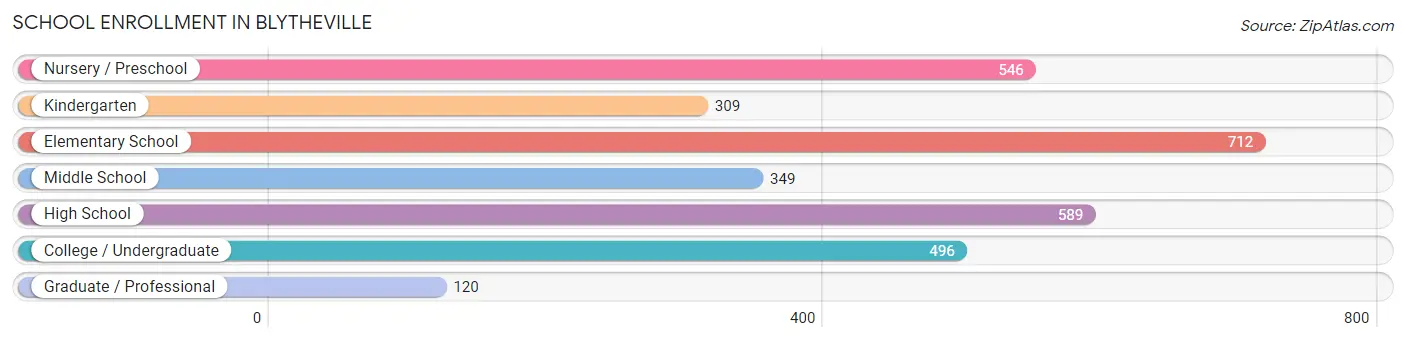
| School Level | # Students | % Students |
| Nursery / Preschool | 546 | 17.5% |
| Kindergarten | 309 | 9.9% |
| Elementary School | 712 | 22.8% |
| Middle School | 349 | 11.2% |
| High School | 589 | 18.9% |
| College / Undergraduate | 496 | 15.9% |
| Graduate / Professional | 120 | 3.8% |
| Total | 3,121 | 100.0% |
School Enrollment by Age by Funding Source in Blytheville
Out of a total of 3,121 students who are enrolled in schools in Blytheville, 325 (10.4%) attend a private institution, while the remaining 2,796 (89.6%) are enrolled in public schools. The age group of 25 to 34 year olds has the highest likelihood of being enrolled in private schools, with 83 (55.0% in the age bracket) enrolled. Conversely, the age group of 15 to 17 year olds has the lowest likelihood of being enrolled in a private school, with 477 (100.0% in the age bracket) attending a public institution.
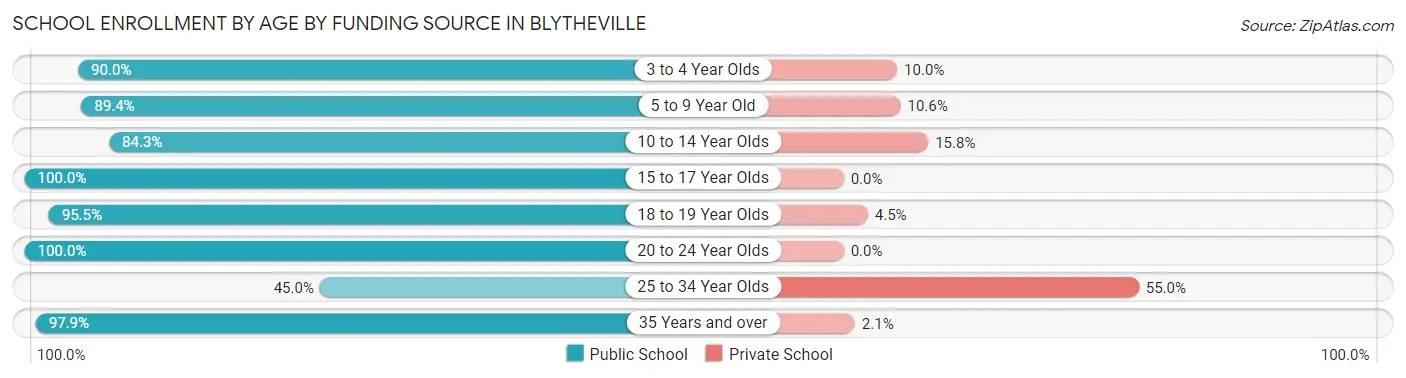
| Age Bracket | Public School | Private School |
| 3 to 4 Year Olds | 226 (90.0%) | 25 (10.0%) |
| 5 to 9 Year Old | 1,123 (89.4%) | 133 (10.6%) |
| 10 to 14 Year Olds | 369 (84.3%) | 69 (15.8%) |
| 15 to 17 Year Olds | 477 (100.0%) | 0 (0.0%) |
| 18 to 19 Year Olds | 233 (95.5%) | 11 (4.5%) |
| 20 to 24 Year Olds | 113 (100.0%) | 0 (0.0%) |
| 25 to 34 Year Olds | 68 (45.0%) | 83 (55.0%) |
| 35 Years and over | 187 (97.9%) | 4 (2.1%) |
| Total | 2,796 (89.6%) | 325 (10.4%) |
Educational Attainment by Field of Study in Blytheville
Education (475 | 31.6%), bio, nature & agricultural (220 | 14.6%), business (160 | 10.6%), arts & humanities (102 | 6.8%), and science & technology (95 | 6.3%) are the most common fields of study among 1,505 individuals in Blytheville who have obtained a bachelor's degree or higher.
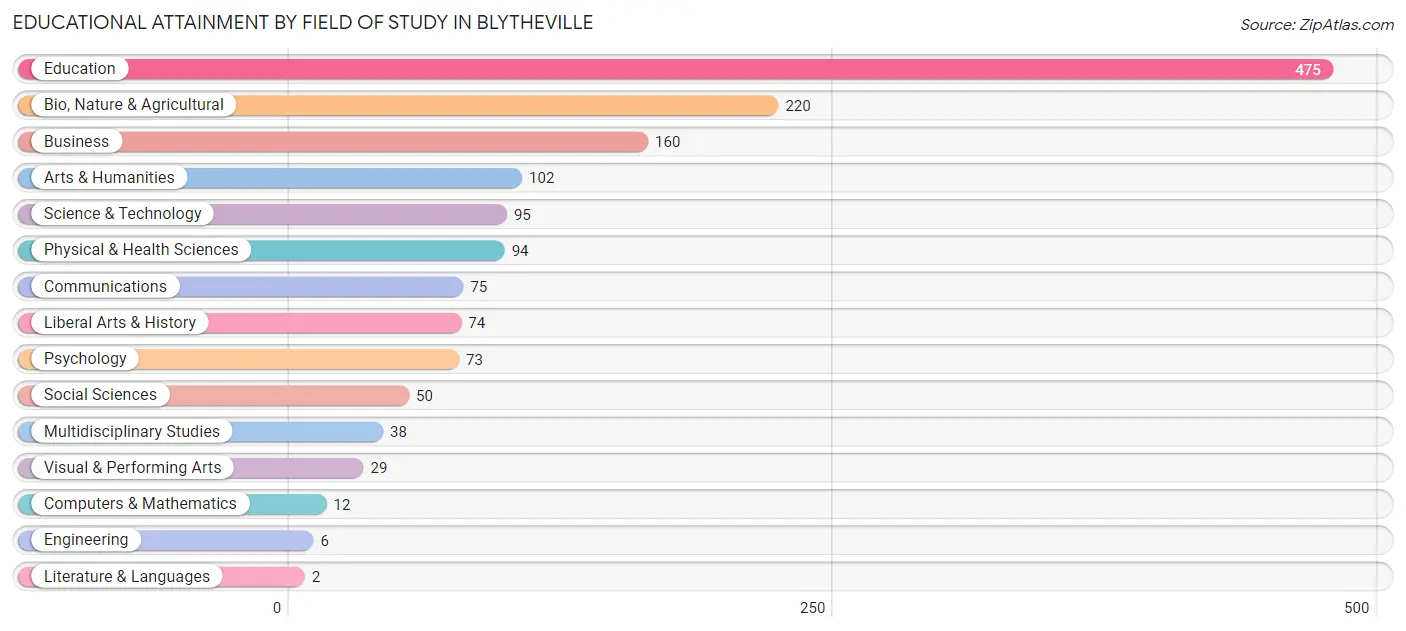
| Field of Study | # Graduates | % Graduates |
| Computers & Mathematics | 12 | 0.8% |
| Bio, Nature & Agricultural | 220 | 14.6% |
| Physical & Health Sciences | 94 | 6.2% |
| Psychology | 73 | 4.9% |
| Social Sciences | 50 | 3.3% |
| Engineering | 6 | 0.4% |
| Multidisciplinary Studies | 38 | 2.5% |
| Science & Technology | 95 | 6.3% |
| Business | 160 | 10.6% |
| Education | 475 | 31.6% |
| Literature & Languages | 2 | 0.1% |
| Liberal Arts & History | 74 | 4.9% |
| Visual & Performing Arts | 29 | 1.9% |
| Communications | 75 | 5.0% |
| Arts & Humanities | 102 | 6.8% |
| Total | 1,505 | 100.0% |
Transportation & Commute in Blytheville
Vehicle Availability by Sex in Blytheville
The most prevalent vehicle ownership categories in Blytheville are males with 2 vehicles (1,079, accounting for 40.3%) and females with 2 vehicles (899, making up 35.8%).
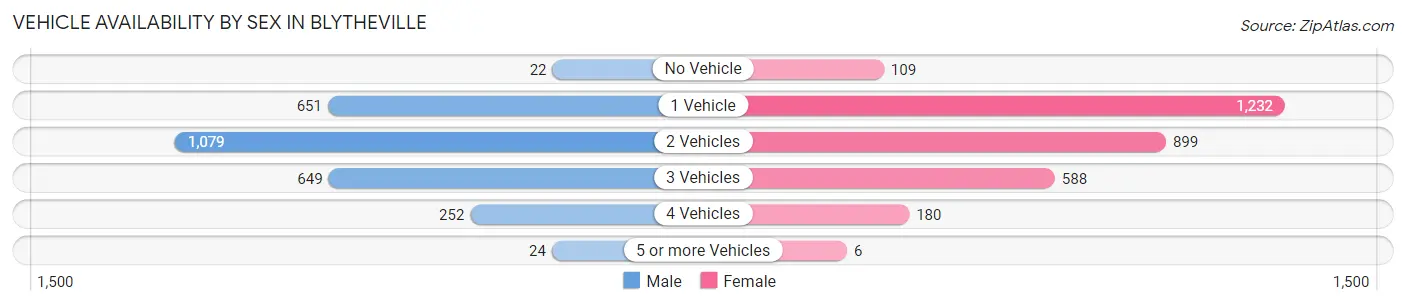
| Vehicles Available | Male | Female |
| No Vehicle | 22 (0.8%) | 109 (3.6%) |
| 1 Vehicle | 651 (24.3%) | 1,232 (40.9%) |
| 2 Vehicles | 1,079 (40.3%) | 899 (29.8%) |
| 3 Vehicles | 649 (24.2%) | 588 (19.5%) |
| 4 Vehicles | 252 (9.4%) | 180 (6.0%) |
| 5 or more Vehicles | 24 (0.9%) | 6 (0.2%) |
| Total | 2,677 (100.0%) | 3,014 (100.0%) |
Commute Time in Blytheville
The most frequently occuring commute durations in Blytheville are 5 to 9 minutes (1,599 commuters, 28.1%), 10 to 14 minutes (1,273 commuters, 22.4%), and 15 to 19 minutes (1,157 commuters, 20.3%).
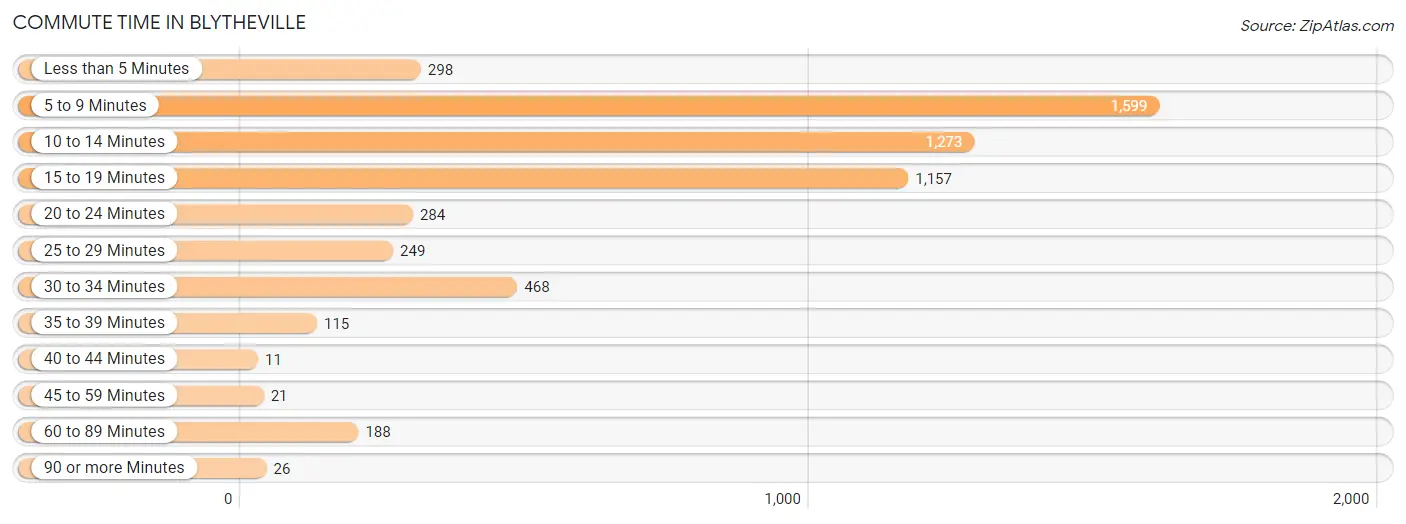
| Commute Time | # Commuters | % Commuters |
| Less than 5 Minutes | 298 | 5.2% |
| 5 to 9 Minutes | 1,599 | 28.1% |
| 10 to 14 Minutes | 1,273 | 22.4% |
| 15 to 19 Minutes | 1,157 | 20.3% |
| 20 to 24 Minutes | 284 | 5.0% |
| 25 to 29 Minutes | 249 | 4.4% |
| 30 to 34 Minutes | 468 | 8.2% |
| 35 to 39 Minutes | 115 | 2.0% |
| 40 to 44 Minutes | 11 | 0.2% |
| 45 to 59 Minutes | 21 | 0.4% |
| 60 to 89 Minutes | 188 | 3.3% |
| 90 or more Minutes | 26 | 0.5% |
Commute Time by Sex in Blytheville
The most common commute times in Blytheville are 5 to 9 minutes (841 commuters, 31.3%) for males and 5 to 9 minutes (758 commuters, 25.3%) for females.
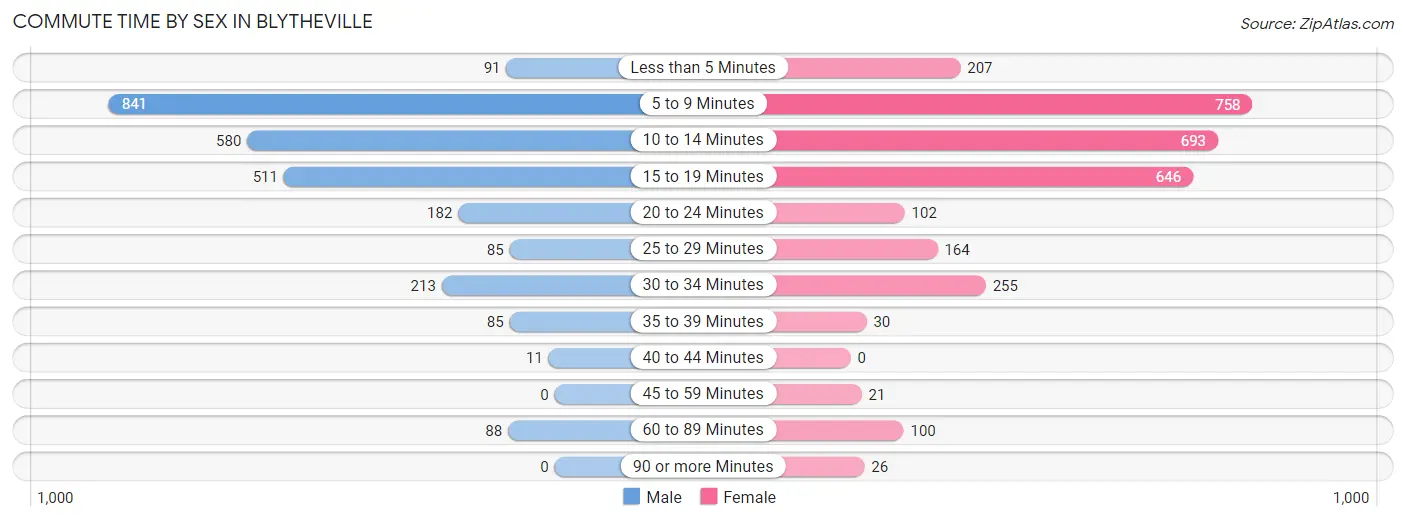
| Commute Time | Male | Female |
| Less than 5 Minutes | 91 (3.4%) | 207 (6.9%) |
| 5 to 9 Minutes | 841 (31.3%) | 758 (25.3%) |
| 10 to 14 Minutes | 580 (21.6%) | 693 (23.1%) |
| 15 to 19 Minutes | 511 (19.0%) | 646 (21.5%) |
| 20 to 24 Minutes | 182 (6.8%) | 102 (3.4%) |
| 25 to 29 Minutes | 85 (3.2%) | 164 (5.5%) |
| 30 to 34 Minutes | 213 (7.9%) | 255 (8.5%) |
| 35 to 39 Minutes | 85 (3.2%) | 30 (1.0%) |
| 40 to 44 Minutes | 11 (0.4%) | 0 (0.0%) |
| 45 to 59 Minutes | 0 (0.0%) | 21 (0.7%) |
| 60 to 89 Minutes | 88 (3.3%) | 100 (3.3%) |
| 90 or more Minutes | 0 (0.0%) | 26 (0.9%) |
Time of Departure to Work by Sex in Blytheville
The most frequent times of departure to work in Blytheville are 8:30 AM to 8:59 AM (431, 16.0%) for males and 12:00 AM to 4:59 AM (581, 19.4%) for females.
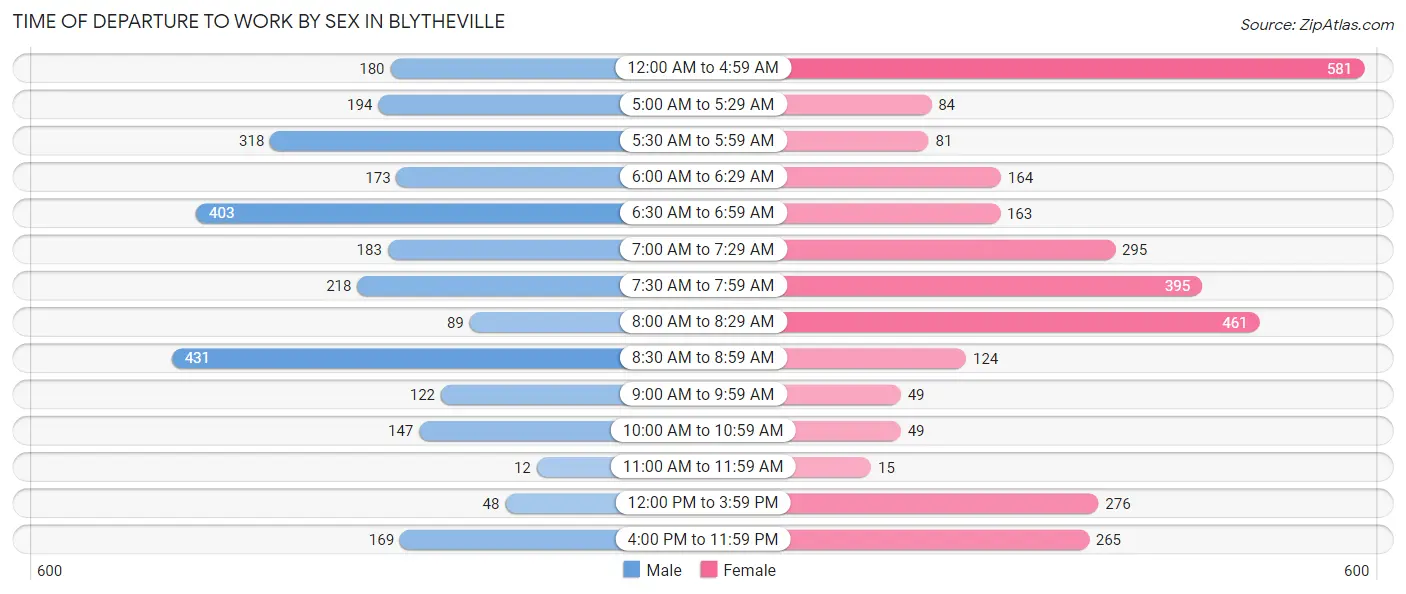
| Time of Departure | Male | Female |
| 12:00 AM to 4:59 AM | 180 (6.7%) | 581 (19.4%) |
| 5:00 AM to 5:29 AM | 194 (7.2%) | 84 (2.8%) |
| 5:30 AM to 5:59 AM | 318 (11.8%) | 81 (2.7%) |
| 6:00 AM to 6:29 AM | 173 (6.4%) | 164 (5.5%) |
| 6:30 AM to 6:59 AM | 403 (15.0%) | 163 (5.4%) |
| 7:00 AM to 7:29 AM | 183 (6.8%) | 295 (9.8%) |
| 7:30 AM to 7:59 AM | 218 (8.1%) | 395 (13.2%) |
| 8:00 AM to 8:29 AM | 89 (3.3%) | 461 (15.4%) |
| 8:30 AM to 8:59 AM | 431 (16.0%) | 124 (4.1%) |
| 9:00 AM to 9:59 AM | 122 (4.5%) | 49 (1.6%) |
| 10:00 AM to 10:59 AM | 147 (5.5%) | 49 (1.6%) |
| 11:00 AM to 11:59 AM | 12 (0.4%) | 15 (0.5%) |
| 12:00 PM to 3:59 PM | 48 (1.8%) | 276 (9.2%) |
| 4:00 PM to 11:59 PM | 169 (6.3%) | 265 (8.8%) |
| Total | 2,687 (100.0%) | 3,002 (100.0%) |
Housing Occupancy in Blytheville
Occupancy by Ownership in Blytheville
Of the total 5,395 dwellings in Blytheville, owner-occupied units account for 2,754 (51.0%), while renter-occupied units make up 2,641 (48.9%).
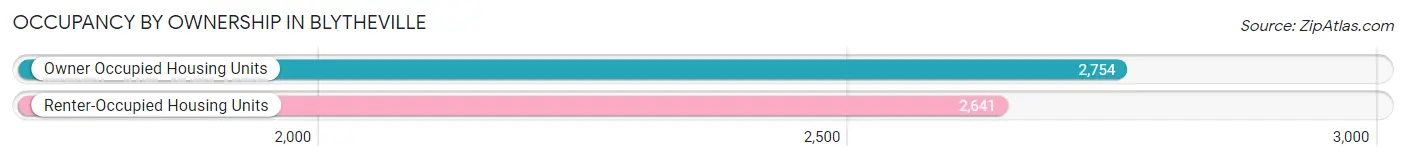
| Occupancy | # Housing Units | % Housing Units |
| Owner Occupied Housing Units | 2,754 | 51.0% |
| Renter-Occupied Housing Units | 2,641 | 48.9% |
| Total Occupied Housing Units | 5,395 | 100.0% |
Occupancy by Household Size in Blytheville
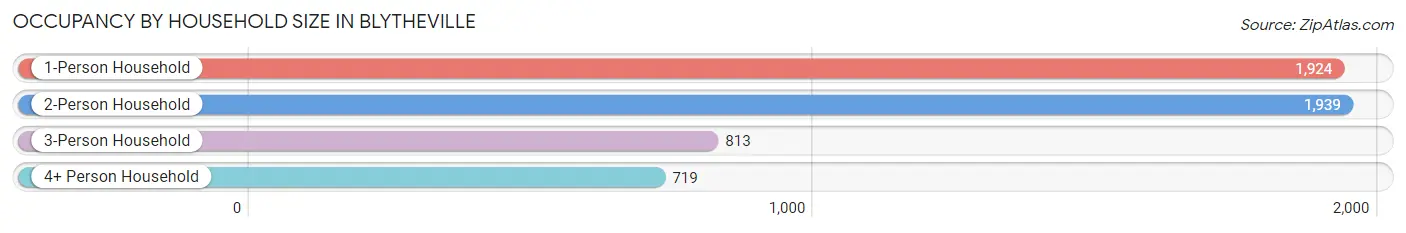
| Household Size | # Housing Units | % Housing Units |
| 1-Person Household | 1,924 | 35.7% |
| 2-Person Household | 1,939 | 35.9% |
| 3-Person Household | 813 | 15.1% |
| 4+ Person Household | 719 | 13.3% |
| Total Housing Units | 5,395 | 100.0% |
Occupancy by Ownership by Household Size in Blytheville
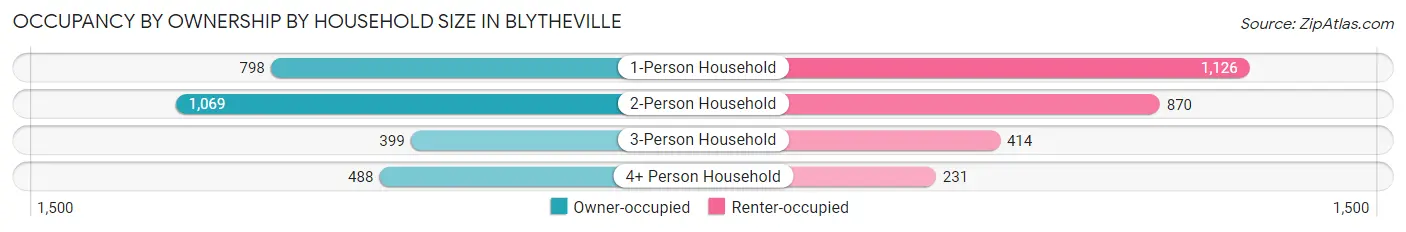
| Household Size | Owner-occupied | Renter-occupied |
| 1-Person Household | 798 (41.5%) | 1,126 (58.5%) |
| 2-Person Household | 1,069 (55.1%) | 870 (44.9%) |
| 3-Person Household | 399 (49.1%) | 414 (50.9%) |
| 4+ Person Household | 488 (67.9%) | 231 (32.1%) |
| Total Housing Units | 2,754 (51.0%) | 2,641 (48.9%) |
Occupancy by Educational Attainment in Blytheville
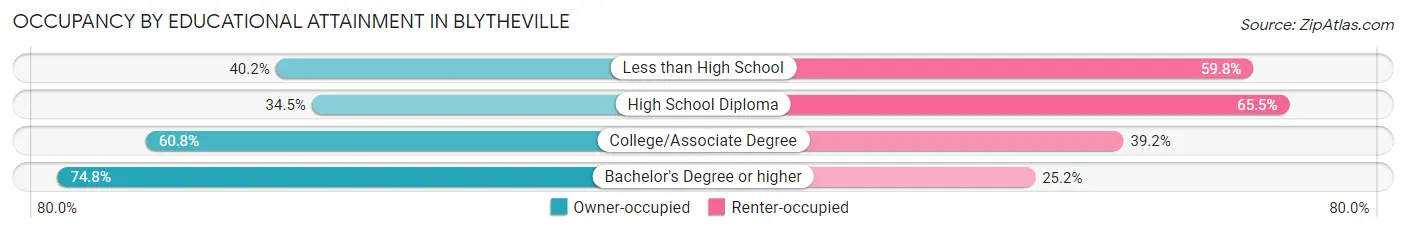
| Household Size | Owner-occupied | Renter-occupied |
| Less than High School | 312 (40.2%) | 464 (59.8%) |
| High School Diploma | 676 (34.5%) | 1,285 (65.5%) |
| College/Associate Degree | 960 (60.8%) | 620 (39.2%) |
| Bachelor's Degree or higher | 806 (74.8%) | 272 (25.2%) |
Occupancy by Age of Householder in Blytheville
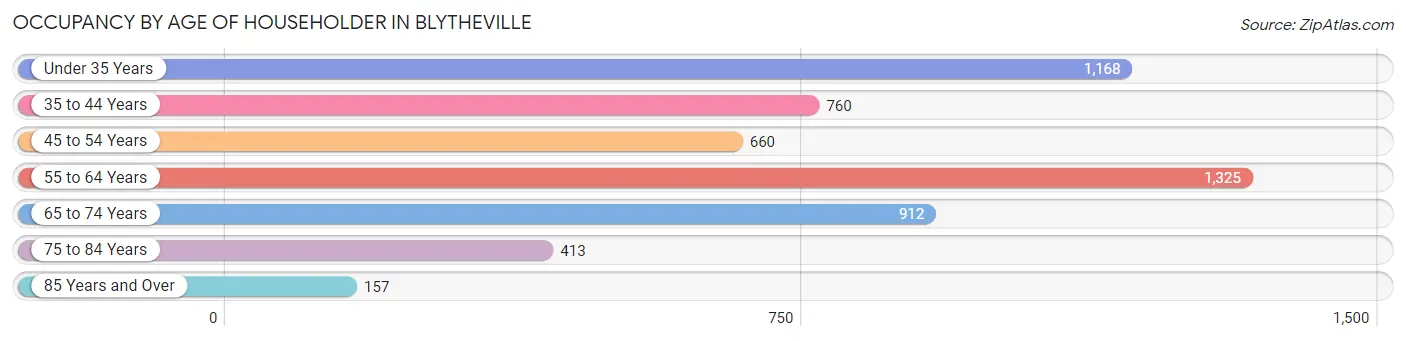
| Age Bracket | # Households | % Households |
| Under 35 Years | 1,168 | 21.6% |
| 35 to 44 Years | 760 | 14.1% |
| 45 to 54 Years | 660 | 12.2% |
| 55 to 64 Years | 1,325 | 24.6% |
| 65 to 74 Years | 912 | 16.9% |
| 75 to 84 Years | 413 | 7.7% |
| 85 Years and Over | 157 | 2.9% |
| Total | 5,395 | 100.0% |
Housing Finances in Blytheville
Median Income by Occupancy in Blytheville
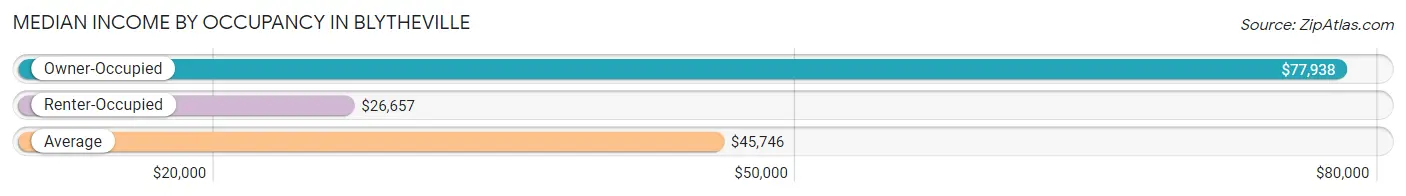
| Occupancy Type | # Households | Median Income |
| Owner-Occupied | 2,754 (51.0%) | $77,938 |
| Renter-Occupied | 2,641 (48.9%) | $26,657 |
| Average | 5,395 (100.0%) | $45,746 |
Occupancy by Householder Income Bracket in Blytheville
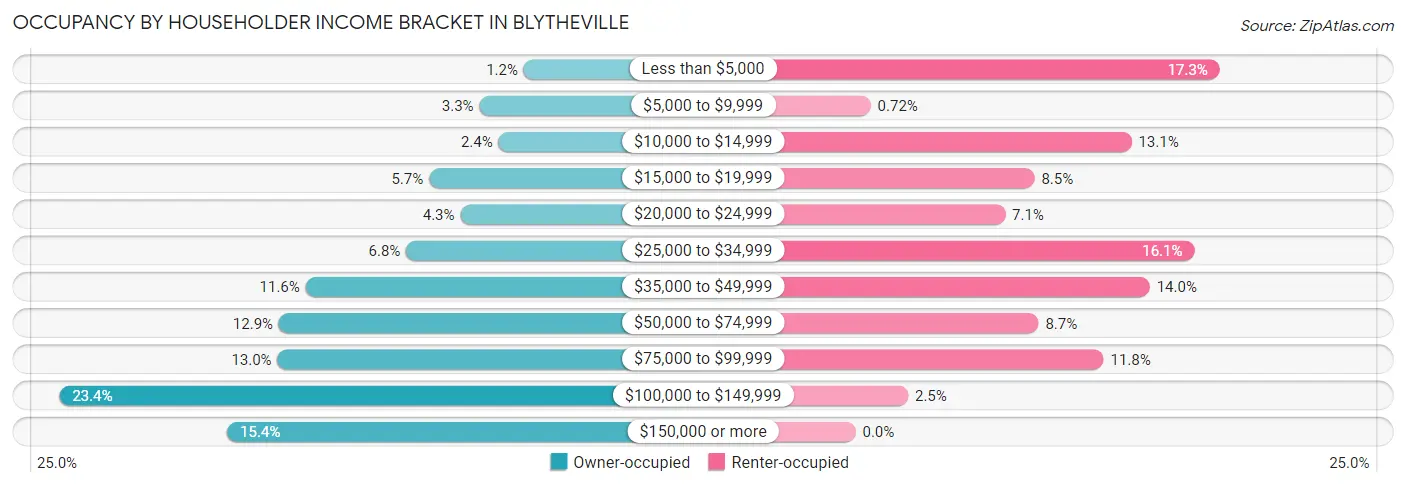
| Income Bracket | Owner-occupied | Renter-occupied |
| Less than $5,000 | 34 (1.2%) | 458 (17.3%) |
| $5,000 to $9,999 | 92 (3.3%) | 19 (0.7%) |
| $10,000 to $14,999 | 67 (2.4%) | 347 (13.1%) |
| $15,000 to $19,999 | 158 (5.7%) | 225 (8.5%) |
| $20,000 to $24,999 | 117 (4.3%) | 188 (7.1%) |
| $25,000 to $34,999 | 188 (6.8%) | 426 (16.1%) |
| $35,000 to $49,999 | 320 (11.6%) | 370 (14.0%) |
| $50,000 to $74,999 | 355 (12.9%) | 230 (8.7%) |
| $75,000 to $99,999 | 357 (13.0%) | 312 (11.8%) |
| $100,000 to $149,999 | 643 (23.4%) | 66 (2.5%) |
| $150,000 or more | 423 (15.4%) | 0 (0.0%) |
| Total | 2,754 (100.0%) | 2,641 (100.0%) |
Monthly Housing Cost Tiers in Blytheville
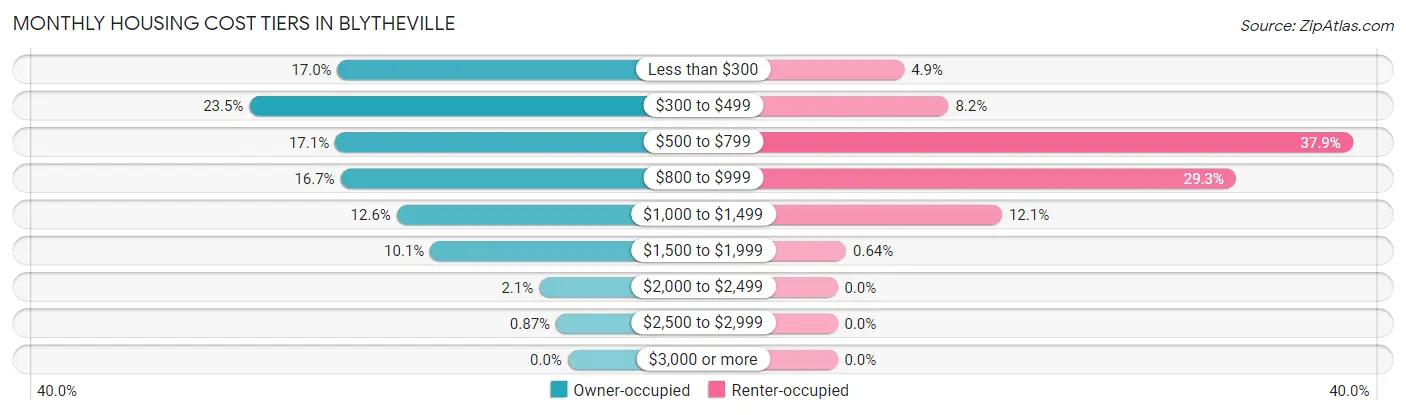
| Monthly Cost | Owner-occupied | Renter-occupied |
| Less than $300 | 467 (17.0%) | 130 (4.9%) |
| $300 to $499 | 646 (23.5%) | 216 (8.2%) |
| $500 to $799 | 472 (17.1%) | 1,002 (37.9%) |
| $800 to $999 | 461 (16.7%) | 775 (29.3%) |
| $1,000 to $1,499 | 347 (12.6%) | 320 (12.1%) |
| $1,500 to $1,999 | 279 (10.1%) | 17 (0.6%) |
| $2,000 to $2,499 | 58 (2.1%) | 0 (0.0%) |
| $2,500 to $2,999 | 24 (0.9%) | 0 (0.0%) |
| $3,000 or more | 0 (0.0%) | 0 (0.0%) |
| Total | 2,754 (100.0%) | 2,641 (100.0%) |
Physical Housing Characteristics in Blytheville
Housing Structures in Blytheville
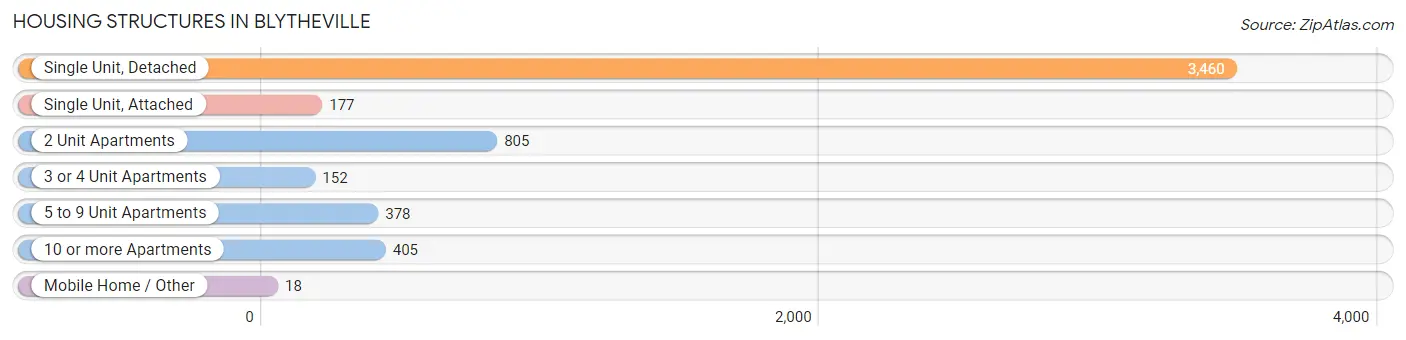
| Structure Type | # Housing Units | % Housing Units |
| Single Unit, Detached | 3,460 | 64.1% |
| Single Unit, Attached | 177 | 3.3% |
| 2 Unit Apartments | 805 | 14.9% |
| 3 or 4 Unit Apartments | 152 | 2.8% |
| 5 to 9 Unit Apartments | 378 | 7.0% |
| 10 or more Apartments | 405 | 7.5% |
| Mobile Home / Other | 18 | 0.3% |
| Total | 5,395 | 100.0% |
Housing Structures by Occupancy in Blytheville
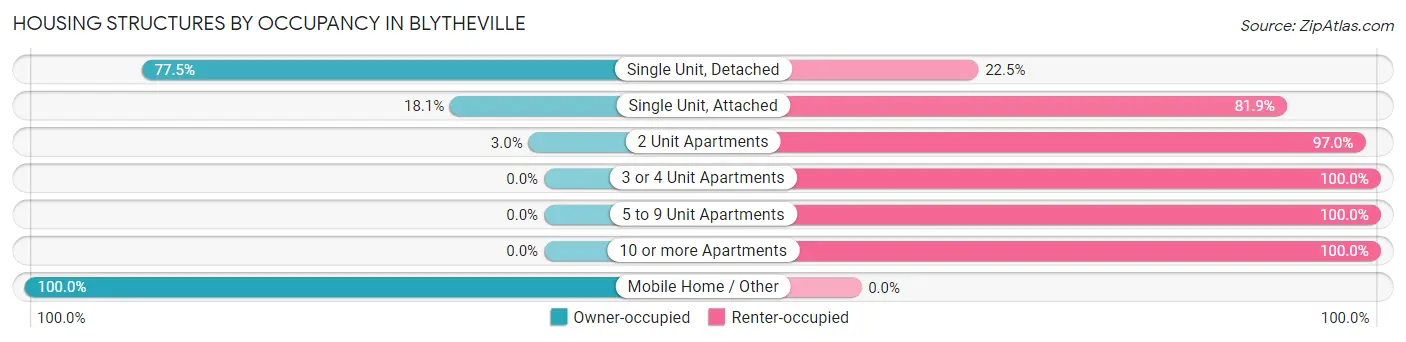
| Structure Type | Owner-occupied | Renter-occupied |
| Single Unit, Detached | 2,680 (77.5%) | 780 (22.5%) |
| Single Unit, Attached | 32 (18.1%) | 145 (81.9%) |
| 2 Unit Apartments | 24 (3.0%) | 781 (97.0%) |
| 3 or 4 Unit Apartments | 0 (0.0%) | 152 (100.0%) |
| 5 to 9 Unit Apartments | 0 (0.0%) | 378 (100.0%) |
| 10 or more Apartments | 0 (0.0%) | 405 (100.0%) |
| Mobile Home / Other | 18 (100.0%) | 0 (0.0%) |
| Total | 2,754 (51.0%) | 2,641 (48.9%) |
Housing Structures by Number of Rooms in Blytheville
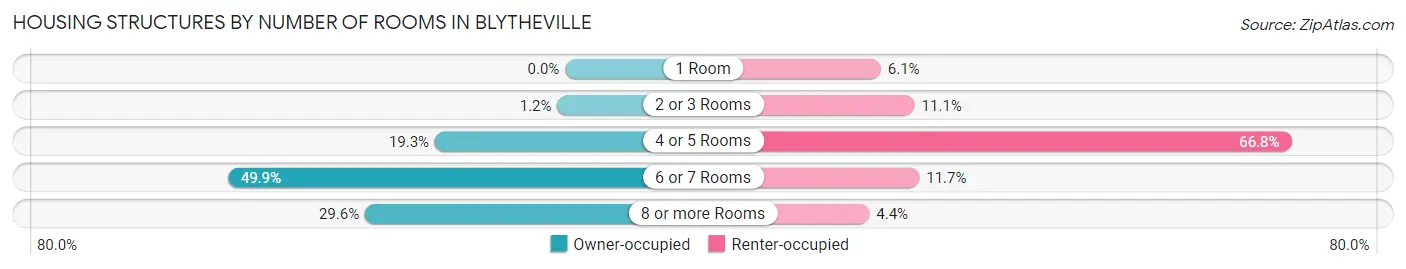
| Number of Rooms | Owner-occupied | Renter-occupied |
| 1 Room | 0 (0.0%) | 160 (6.1%) |
| 2 or 3 Rooms | 32 (1.2%) | 292 (11.1%) |
| 4 or 5 Rooms | 531 (19.3%) | 1,764 (66.8%) |
| 6 or 7 Rooms | 1,375 (49.9%) | 310 (11.7%) |
| 8 or more Rooms | 816 (29.6%) | 115 (4.3%) |
| Total | 2,754 (100.0%) | 2,641 (100.0%) |
Housing Structure by Heating Type in Blytheville
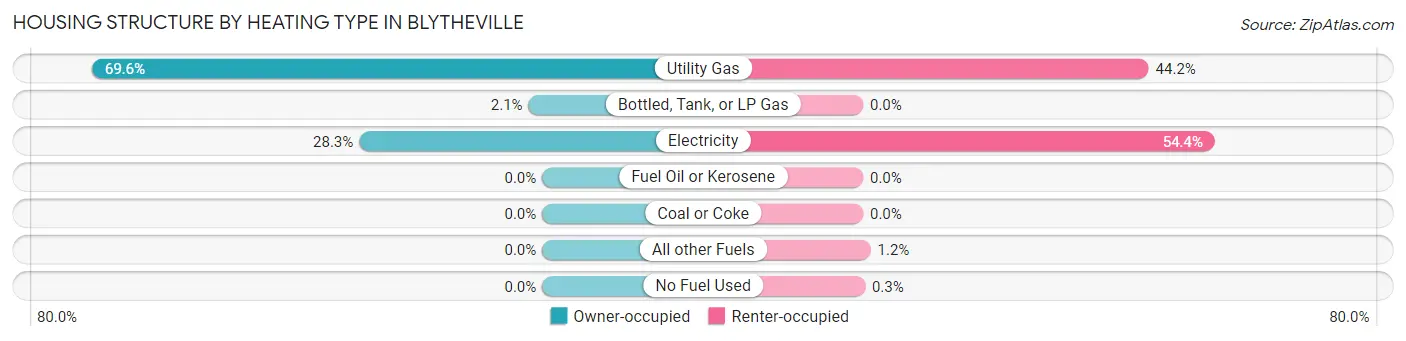
| Heating Type | Owner-occupied | Renter-occupied |
| Utility Gas | 1,917 (69.6%) | 1,166 (44.2%) |
| Bottled, Tank, or LP Gas | 58 (2.1%) | 0 (0.0%) |
| Electricity | 779 (28.3%) | 1,436 (54.4%) |
| Fuel Oil or Kerosene | 0 (0.0%) | 0 (0.0%) |
| Coal or Coke | 0 (0.0%) | 0 (0.0%) |
| All other Fuels | 0 (0.0%) | 31 (1.2%) |
| No Fuel Used | 0 (0.0%) | 8 (0.3%) |
| Total | 2,754 (100.0%) | 2,641 (100.0%) |
Household Vehicle Usage in Blytheville
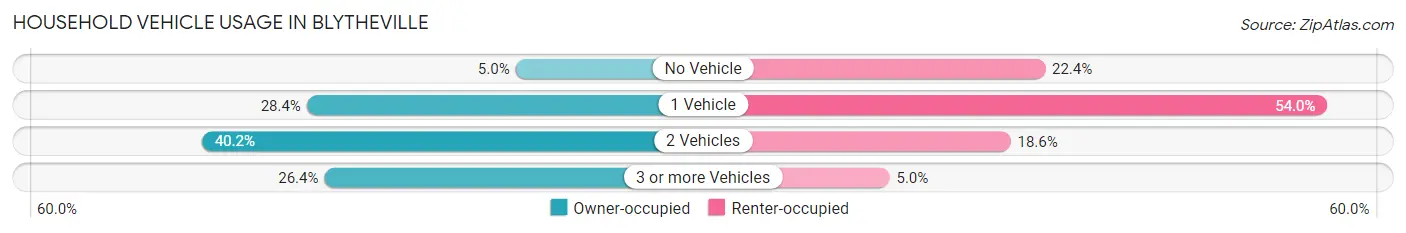
| Vehicles per Household | Owner-occupied | Renter-occupied |
| No Vehicle | 138 (5.0%) | 592 (22.4%) |
| 1 Vehicle | 782 (28.4%) | 1,427 (54.0%) |
| 2 Vehicles | 1,106 (40.2%) | 490 (18.5%) |
| 3 or more Vehicles | 728 (26.4%) | 132 (5.0%) |
| Total | 2,754 (100.0%) | 2,641 (100.0%) |
Real Estate & Mortgages in Blytheville
Real Estate and Mortgage Overview in Blytheville
| Characteristic | Without Mortgage | With Mortgage |
| Housing Units | 1,510 | 1,244 |
| Median Property Value | $72,800 | $140,800 |
| Median Household Income | $60,807 | $273 |
| Monthly Housing Costs | $377 | $0 |
| Real Estate Taxes | $348 | $136 |
Property Value by Mortgage Status in Blytheville
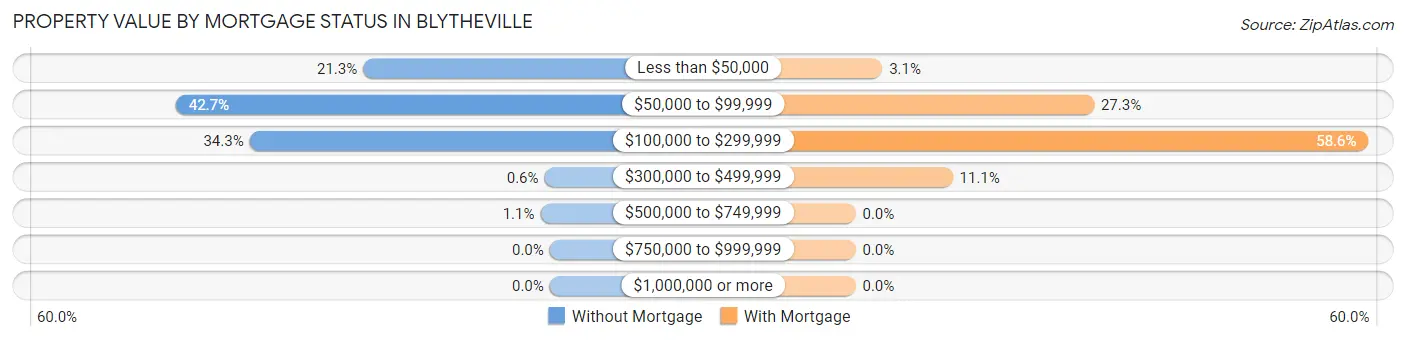
| Property Value | Without Mortgage | With Mortgage |
| Less than $50,000 | 322 (21.3%) | 38 (3.0%) |
| $50,000 to $99,999 | 645 (42.7%) | 339 (27.3%) |
| $100,000 to $299,999 | 518 (34.3%) | 729 (58.6%) |
| $300,000 to $499,999 | 9 (0.6%) | 138 (11.1%) |
| $500,000 to $749,999 | 16 (1.1%) | 0 (0.0%) |
| $750,000 to $999,999 | 0 (0.0%) | 0 (0.0%) |
| $1,000,000 or more | 0 (0.0%) | 0 (0.0%) |
| Total | 1,510 (100.0%) | 1,244 (100.0%) |
Household Income by Mortgage Status in Blytheville
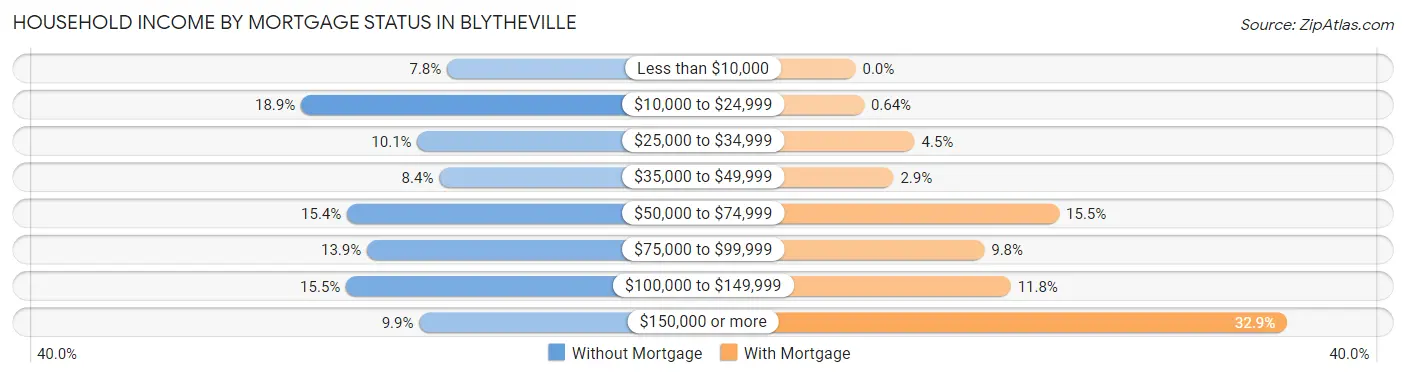
| Household Income | Without Mortgage | With Mortgage |
| Less than $10,000 | 118 (7.8%) | 0 (0.0%) |
| $10,000 to $24,999 | 286 (18.9%) | 8 (0.6%) |
| $25,000 to $34,999 | 152 (10.1%) | 56 (4.5%) |
| $35,000 to $49,999 | 127 (8.4%) | 36 (2.9%) |
| $50,000 to $74,999 | 233 (15.4%) | 193 (15.5%) |
| $75,000 to $99,999 | 210 (13.9%) | 122 (9.8%) |
| $100,000 to $149,999 | 234 (15.5%) | 147 (11.8%) |
| $150,000 or more | 150 (9.9%) | 409 (32.9%) |
| Total | 1,510 (100.0%) | 1,244 (100.0%) |
Property Value to Household Income Ratio in Blytheville
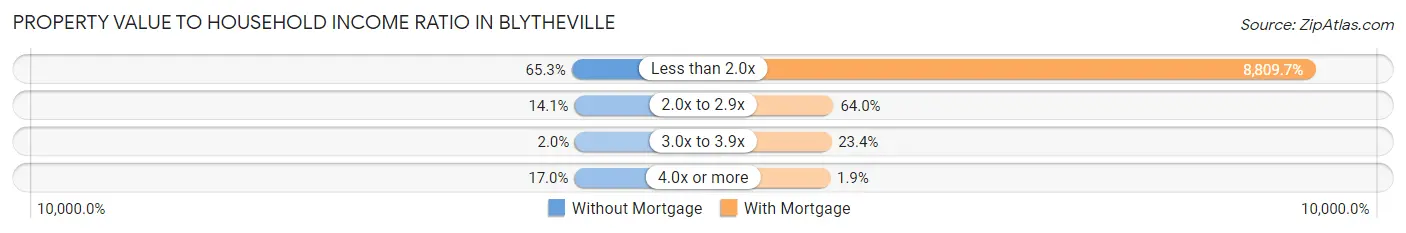
| Value-to-Income Ratio | Without Mortgage | With Mortgage |
| Less than 2.0x | 986 (65.3%) | 109,592 (8,809.7%) |
| 2.0x to 2.9x | 213 (14.1%) | 796 (64.0%) |
| 3.0x to 3.9x | 30 (2.0%) | 291 (23.4%) |
| 4.0x or more | 256 (17.0%) | 23 (1.8%) |
| Total | 1,510 (100.0%) | 1,244 (100.0%) |
Real Estate Taxes by Mortgage Status in Blytheville
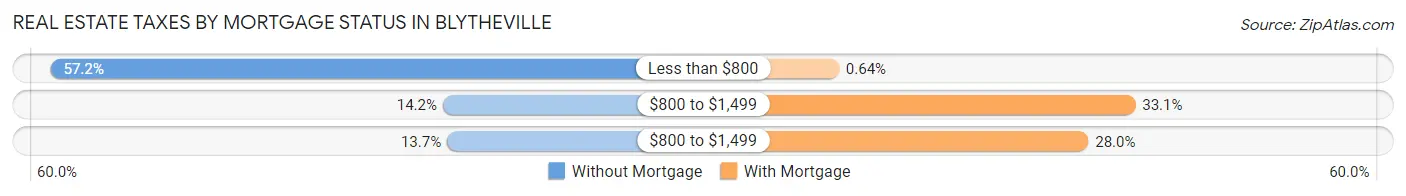
| Property Taxes | Without Mortgage | With Mortgage |
| Less than $800 | 863 (57.2%) | 8 (0.6%) |
| $800 to $1,499 | 214 (14.2%) | 412 (33.1%) |
| $800 to $1,499 | 207 (13.7%) | 348 (28.0%) |
| Total | 1,510 (100.0%) | 1,244 (100.0%) |
Health & Disability in Blytheville
Health Insurance Coverage by Age in Blytheville
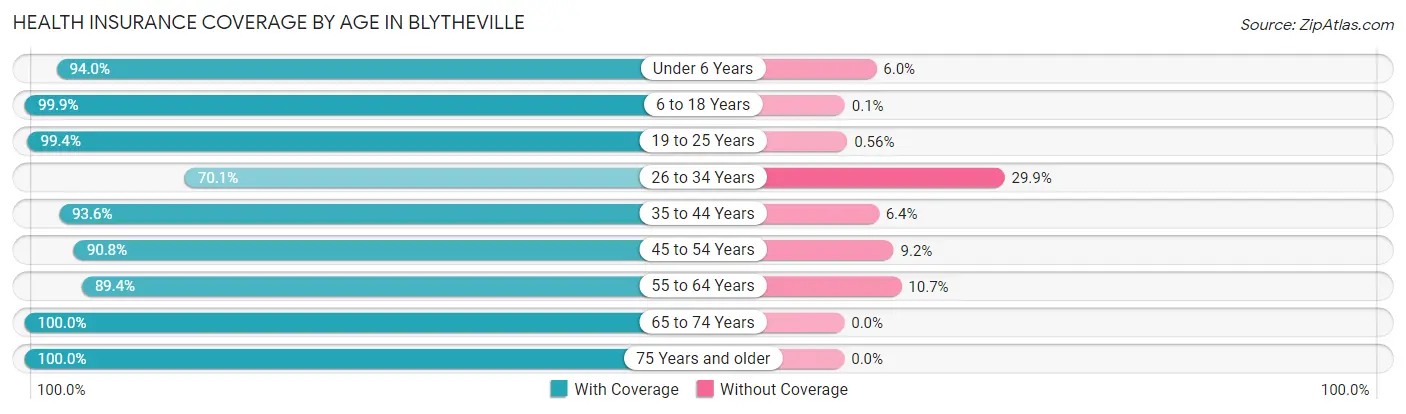
| Age Bracket | With Coverage | Without Coverage |
| Under 6 Years | 1,386 (94.0%) | 88 (6.0%) |
| 6 to 18 Years | 1,911 (99.9%) | 2 (0.1%) |
| 19 to 25 Years | 1,250 (99.4%) | 7 (0.6%) |
| 26 to 34 Years | 1,100 (70.1%) | 469 (29.9%) |
| 35 to 44 Years | 1,604 (93.6%) | 110 (6.4%) |
| 45 to 54 Years | 1,206 (90.8%) | 122 (9.2%) |
| 55 to 64 Years | 1,577 (89.3%) | 188 (10.6%) |
| 65 to 74 Years | 1,433 (100.0%) | 0 (0.0%) |
| 75 Years and older | 752 (100.0%) | 0 (0.0%) |
| Total | 12,219 (92.5%) | 986 (7.5%) |
Health Insurance Coverage by Citizenship Status in Blytheville
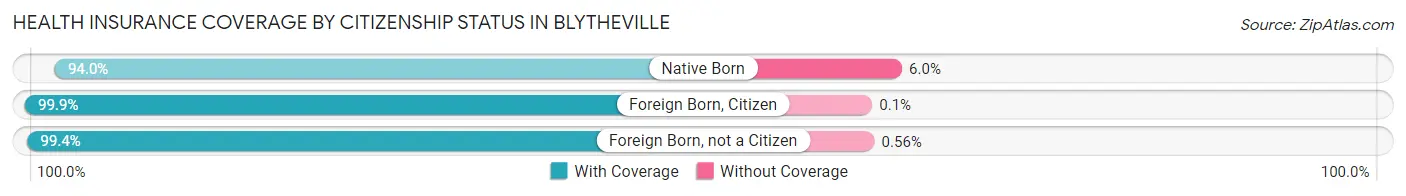
| Citizenship Status | With Coverage | Without Coverage |
| Native Born | 1,386 (94.0%) | 88 (6.0%) |
| Foreign Born, Citizen | 1,911 (99.9%) | 2 (0.1%) |
| Foreign Born, not a Citizen | 1,250 (99.4%) | 7 (0.6%) |
Health Insurance Coverage by Household Income in Blytheville
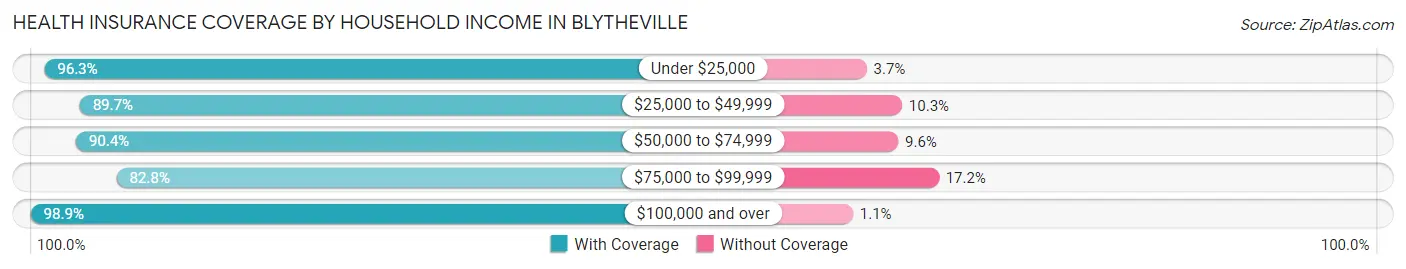
| Household Income | With Coverage | Without Coverage |
| Under $25,000 | 3,112 (96.3%) | 120 (3.7%) |
| $25,000 to $49,999 | 2,760 (89.7%) | 318 (10.3%) |
| $50,000 to $74,999 | 1,720 (90.4%) | 183 (9.6%) |
| $75,000 to $99,999 | 1,558 (82.8%) | 324 (17.2%) |
| $100,000 and over | 3,034 (98.9%) | 35 (1.1%) |
Public vs Private Health Insurance Coverage by Age in Blytheville
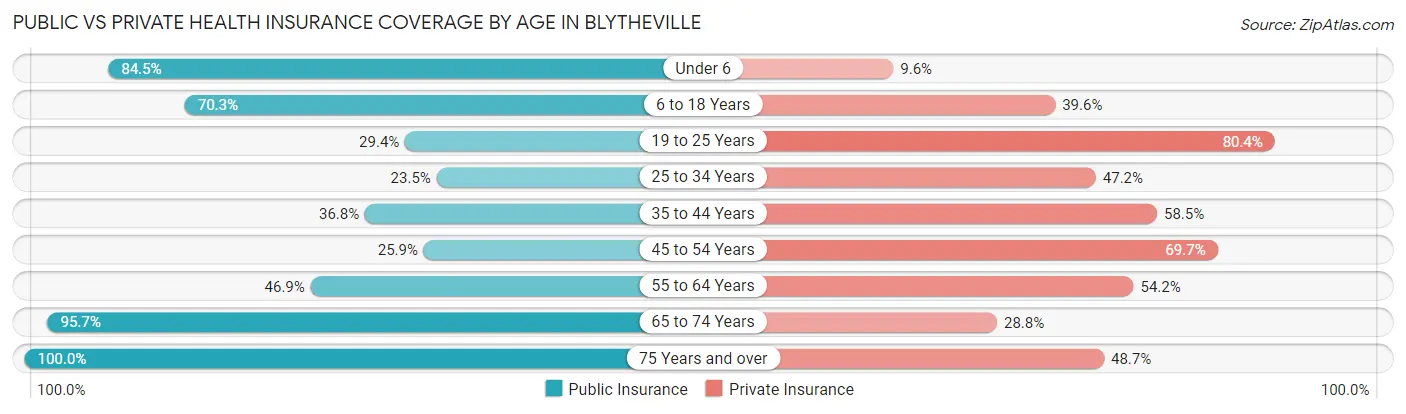
| Age Bracket | Public Insurance | Private Insurance |
| Under 6 | 1,245 (84.5%) | 141 (9.6%) |
| 6 to 18 Years | 1,344 (70.3%) | 758 (39.6%) |
| 19 to 25 Years | 369 (29.4%) | 1,010 (80.3%) |
| 25 to 34 Years | 369 (23.5%) | 740 (47.2%) |
| 35 to 44 Years | 631 (36.8%) | 1,003 (58.5%) |
| 45 to 54 Years | 344 (25.9%) | 926 (69.7%) |
| 55 to 64 Years | 828 (46.9%) | 956 (54.2%) |
| 65 to 74 Years | 1,372 (95.7%) | 413 (28.8%) |
| 75 Years and over | 752 (100.0%) | 366 (48.7%) |
| Total | 7,254 (54.9%) | 6,313 (47.8%) |
Disability Status by Sex by Age in Blytheville
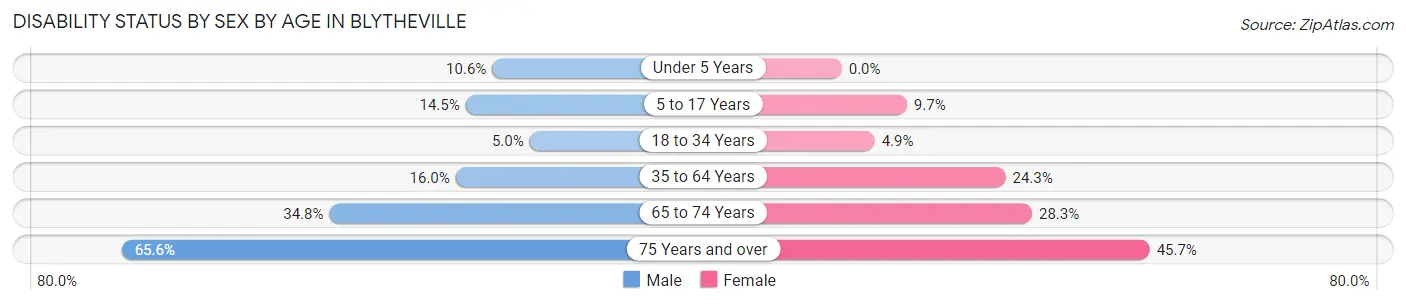
| Age Bracket | Male | Female |
| Under 5 Years | 43 (10.6%) | 0 (0.0%) |
| 5 to 17 Years | 123 (14.5%) | 137 (9.7%) |
| 18 to 34 Years | 68 (5.0%) | 79 (4.9%) |
| 35 to 64 Years | 340 (16.0%) | 652 (24.3%) |
| 65 to 74 Years | 236 (34.8%) | 213 (28.2%) |
| 75 Years and over | 202 (65.6%) | 203 (45.7%) |
Disability Class by Sex by Age in Blytheville
Disability Class: Hearing Difficulty
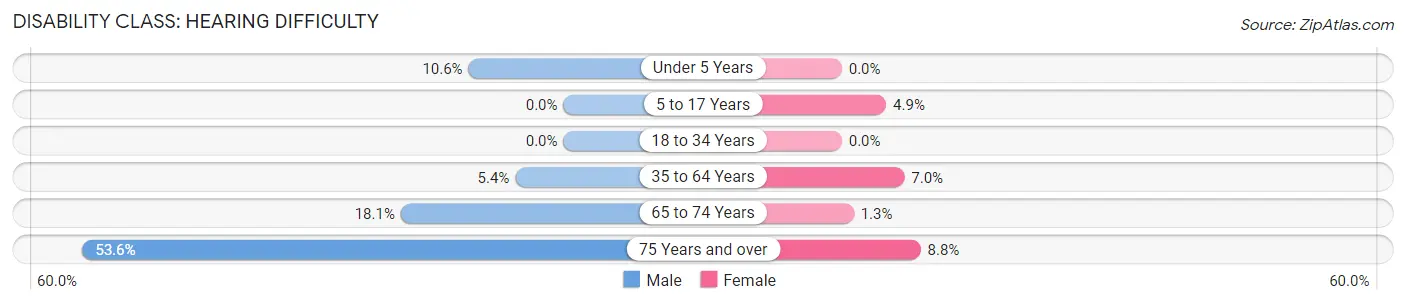
| Age Bracket | Male | Female |
| Under 5 Years | 43 (10.6%) | 0 (0.0%) |
| 5 to 17 Years | 0 (0.0%) | 70 (4.9%) |
| 18 to 34 Years | 0 (0.0%) | 0 (0.0%) |
| 35 to 64 Years | 114 (5.4%) | 187 (7.0%) |
| 65 to 74 Years | 123 (18.1%) | 10 (1.3%) |
| 75 Years and over | 165 (53.6%) | 39 (8.8%) |
Disability Class: Vision Difficulty
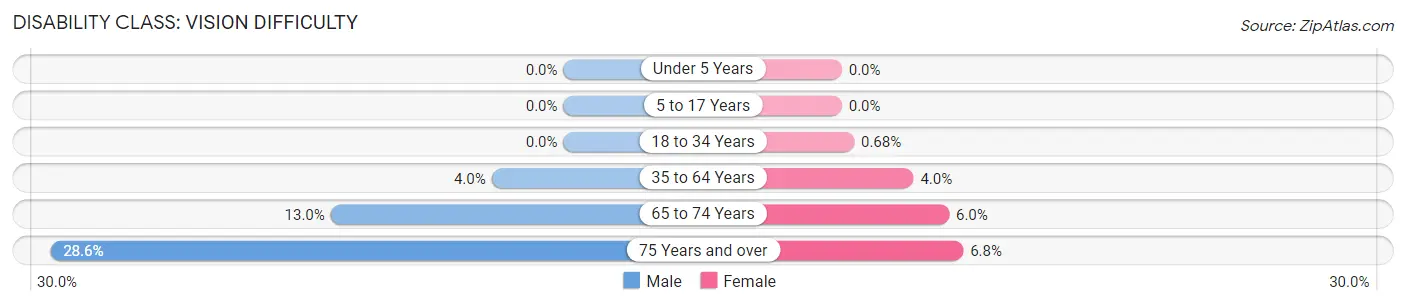
| Age Bracket | Male | Female |
| Under 5 Years | 0 (0.0%) | 0 (0.0%) |
| 5 to 17 Years | 0 (0.0%) | 0 (0.0%) |
| 18 to 34 Years | 0 (0.0%) | 11 (0.7%) |
| 35 to 64 Years | 85 (4.0%) | 107 (4.0%) |
| 65 to 74 Years | 88 (13.0%) | 45 (6.0%) |
| 75 Years and over | 88 (28.6%) | 30 (6.8%) |
Disability Class: Cognitive Difficulty
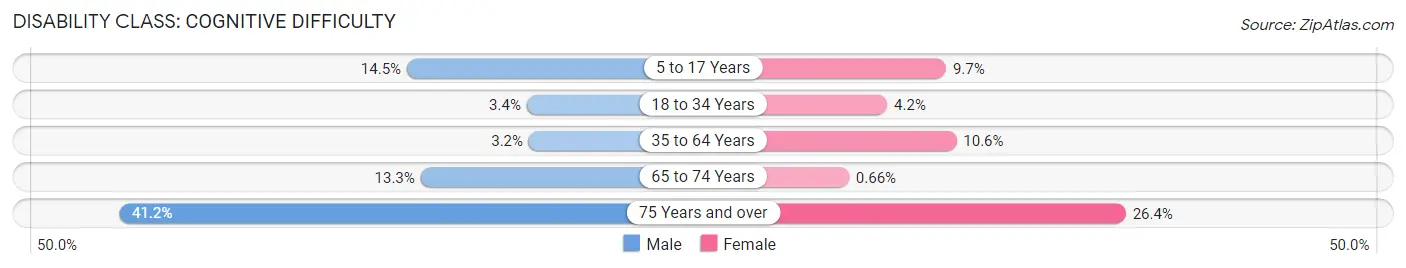
| Age Bracket | Male | Female |
| 5 to 17 Years | 123 (14.5%) | 137 (9.7%) |
| 18 to 34 Years | 46 (3.4%) | 68 (4.2%) |
| 35 to 64 Years | 68 (3.2%) | 285 (10.6%) |
| 65 to 74 Years | 90 (13.3%) | 5 (0.7%) |
| 75 Years and over | 127 (41.2%) | 117 (26.4%) |
Disability Class: Ambulatory Difficulty
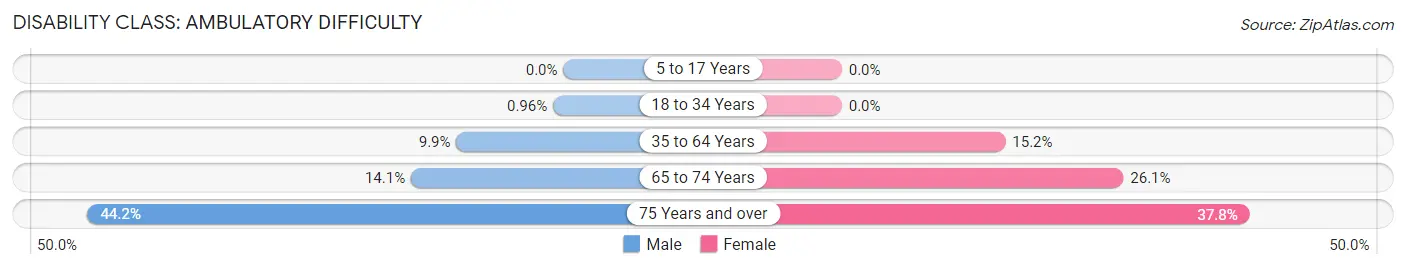
| Age Bracket | Male | Female |
| 5 to 17 Years | 0 (0.0%) | 0 (0.0%) |
| 18 to 34 Years | 13 (1.0%) | 0 (0.0%) |
| 35 to 64 Years | 211 (9.9%) | 407 (15.2%) |
| 65 to 74 Years | 96 (14.1%) | 197 (26.1%) |
| 75 Years and over | 136 (44.2%) | 168 (37.8%) |
Disability Class: Self-Care Difficulty
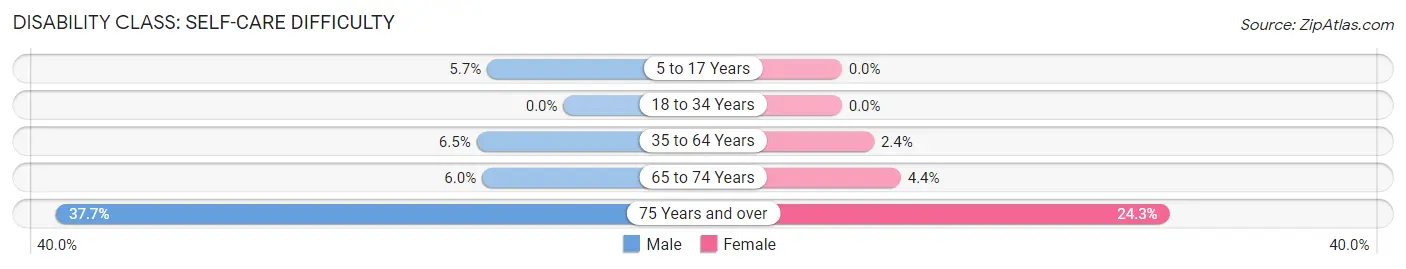
| Age Bracket | Male | Female |
| 5 to 17 Years | 48 (5.7%) | 0 (0.0%) |
| 18 to 34 Years | 0 (0.0%) | 0 (0.0%) |
| 35 to 64 Years | 137 (6.5%) | 64 (2.4%) |
| 65 to 74 Years | 41 (6.0%) | 33 (4.4%) |
| 75 Years and over | 116 (37.7%) | 108 (24.3%) |
Technology Access in Blytheville
Computing Device Access in Blytheville
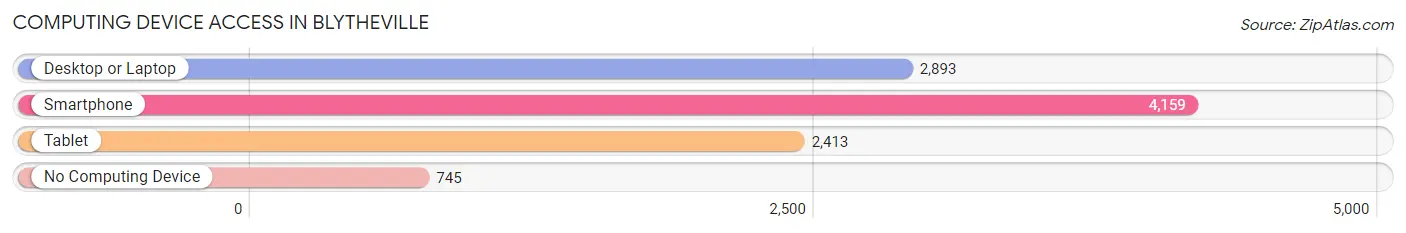
| Device Type | # Households | % Households |
| Desktop or Laptop | 2,893 | 53.6% |
| Smartphone | 4,159 | 77.1% |
| Tablet | 2,413 | 44.7% |
| No Computing Device | 745 | 13.8% |
| Total | 5,395 | 100.0% |
Internet Access in Blytheville
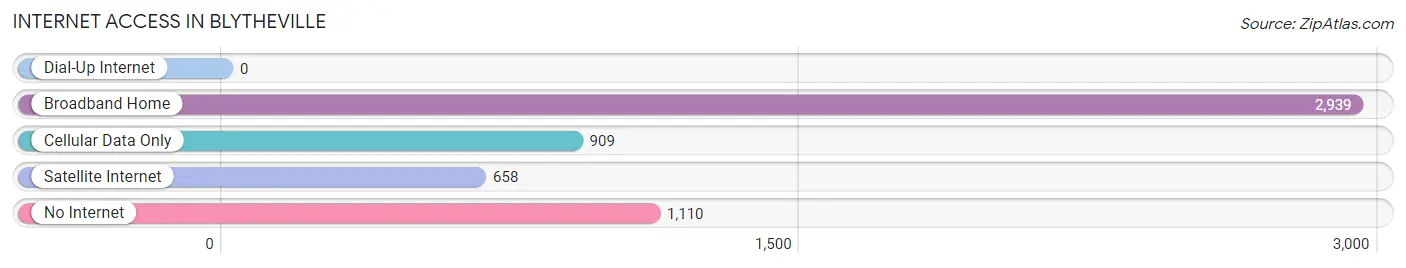
| Internet Type | # Households | % Households |
| Dial-Up Internet | 0 | 0.0% |
| Broadband Home | 2,939 | 54.5% |
| Cellular Data Only | 909 | 16.9% |
| Satellite Internet | 658 | 12.2% |
| No Internet | 1,110 | 20.6% |
| Total | 5,395 | 100.0% |
Blytheville Summary
Blytheville, Arkansas is a city located in Mississippi County in the northeastern corner of the state. It is the county seat and the largest city in the county. The city is situated on the banks of the Mississippi River and is part of the Arkansas Delta region. The city has a population of approximately 15,620 people, according to the 2010 census.
History
Blytheville was founded in 1879 by William Blythe, a former Confederate soldier. The city was named after him and was incorporated in 1892. The city was originally a small farming community, but it quickly grew into a major industrial center. The city was home to several large factories, including a cotton mill, a lumber mill, and a brick factory. The city also had a large railroad yard and a number of warehouses.
In the early 20th century, Blytheville was a major center for the cotton industry. The city was home to several cotton gins and warehouses, and it was a major shipping point for cotton. The city was also home to several large cotton mills, which employed hundreds of people.
In the 1950s, Blytheville began to experience a decline in its industrial base. The city's factories began to close, and the city's population began to decline. In the 1960s, the city began to experience a resurgence in its economy. The city was home to several large manufacturing plants, including a steel mill and a paper mill. The city also became a major center for the poultry industry.
Geography
Blytheville is located in the Arkansas Delta region of the state. The city is situated on the banks of the Mississippi River and is surrounded by flat, fertile farmland. The city is located in the Mississippi Alluvial Plain, which is a flat, low-lying area that is prone to flooding. The city is located about 40 miles north of Memphis, Tennessee and about 100 miles south of Little Rock, Arkansas.
Economy
Blytheville's economy is largely based on agriculture and manufacturing. The city is home to several large manufacturing plants, including a steel mill and a paper mill. The city is also home to several large poultry processing plants. The city is also home to several large retail stores, including Walmart and Target.
Demographics
According to the 2010 census, Blytheville has a population of 15,620 people. The city has a median household income of $30,945 and a median family income of $37,945. The city has a poverty rate of 22.3%, which is higher than the national average. The city is predominantly white, with African Americans making up the largest minority group. The city also has a large Hispanic population, with Hispanics making up 8.3% of the population.
Common Questions
What is Per Capita Income in Blytheville?
Per Capita income in Blytheville is $27,283.
What is the Median Family Income in Blytheville?
Median Family Income in Blytheville is $61,775.
What is the Median Household income in Blytheville?
Median Household Income in Blytheville is $45,746.
What is Income or Wage Gap in Blytheville?
Income or Wage Gap in Blytheville is 30.8%.
Women in Blytheville earn 69.2 cents for every dollar earned by a man.
What is Inequality or Gini Index in Blytheville?
Inequality or Gini Index in Blytheville is 0.50.
What is the Total Population of Blytheville?
Total Population of Blytheville is 13,276.
What is the Total Male Population of Blytheville?
Total Male Population of Blytheville is 5,751.
What is the Total Female Population of Blytheville?
Total Female Population of Blytheville is 7,525.
What is the Ratio of Males per 100 Females in Blytheville?
There are 76.43 Males per 100 Females in Blytheville.
What is the Ratio of Females per 100 Males in Blytheville?
There are 130.85 Females per 100 Males in Blytheville.
What is the Median Population Age in Blytheville?
Median Population Age in Blytheville is 38.1 Years.
What is the Average Family Size in Blytheville
Average Family Size in Blytheville is 3.1 People.
What is the Average Household Size in Blytheville
Average Household Size in Blytheville is 2.4 People.
How Large is the Labor Force in Blytheville?
There are 6,735 People in the Labor Forcein in Blytheville.
What is the Percentage of People in the Labor Force in Blytheville?
64.5% of People are in the Labor Force in Blytheville.
What is the Unemployment Rate in Blytheville?
Unemployment Rate in Blytheville is 13.6%.