Pulaski County, AR Map & Demographics
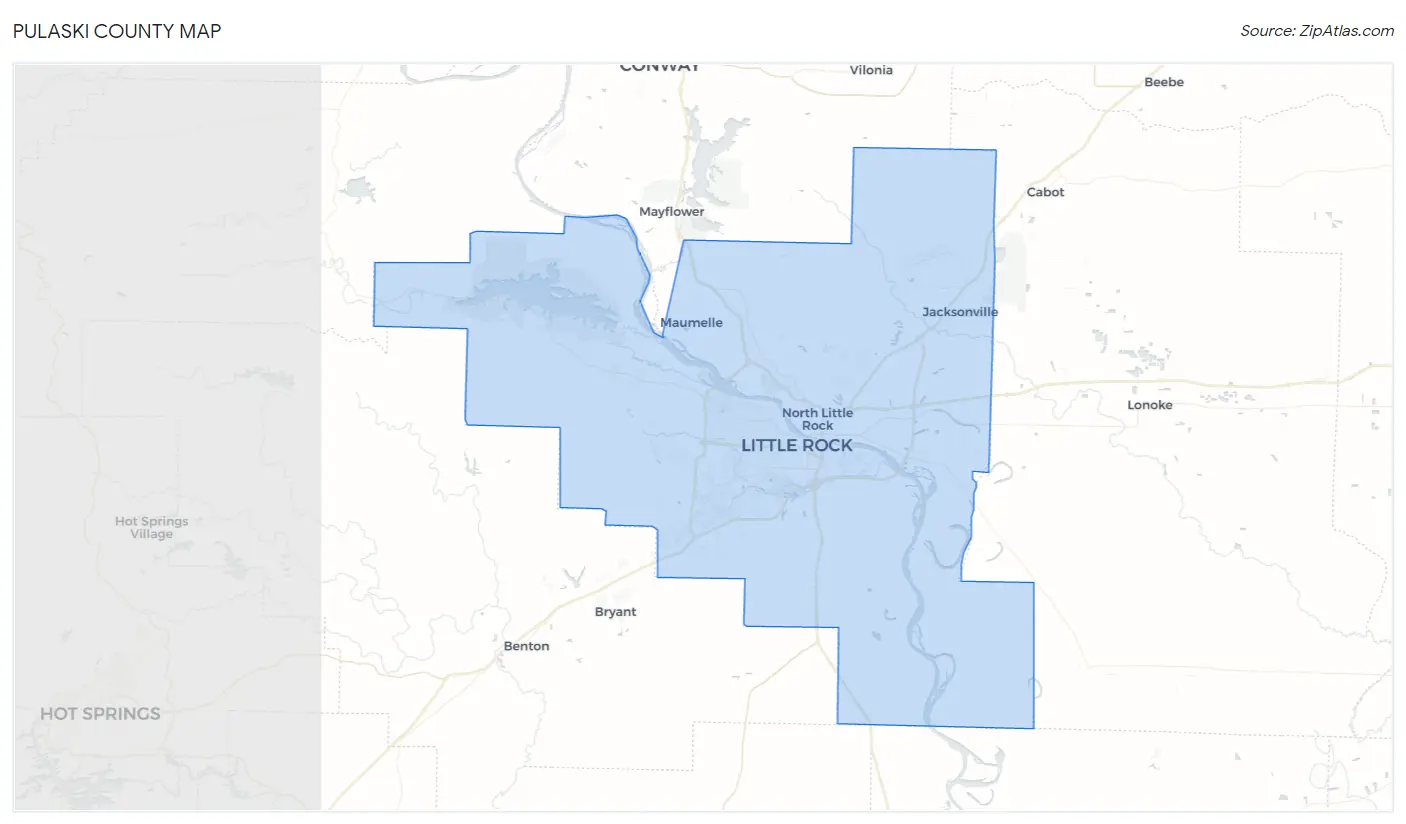
Pulaski County Map
Pulaski County Overview
$39,146
PER CAPITA INCOME
$79,879
AVG FAMILY INCOME
$58,326
AVG HOUSEHOLD INCOME
17.5%
WAGE / INCOME GAP [ % ]
82.5¢/ $1
WAGE / INCOME GAP [ $ ]
$11,376
FAMILY INCOME DEFICIT
0.52
INEQUALITY / GINI INDEX
398,322
TOTAL POPULATION
190,970
MALE POPULATION
207,352
FEMALE POPULATION
92.10
MALES / 100 FEMALES
108.58
FEMALES / 100 MALES
37.7
MEDIAN AGE
3.1
AVG FAMILY SIZE
2.3
AVG HOUSEHOLD SIZE
199,494
LABOR FORCE [ PEOPLE ]
63.1%
PERCENT IN LABOR FORCE
5.2%
UNEMPLOYMENT RATE
Pulaski County Area Codes
Income in Pulaski County
Income Overview in Pulaski County
Per Capita Income in Pulaski County is $39,146, while median incomes of families and households are $79,879 and $58,326 respectively.
| Characteristic | Number | Measure |
| Per Capita Income | 398,322 | $39,146 |
| Median Family Income | 96,857 | $79,879 |
| Mean Family Income | 96,857 | $115,101 |
| Median Household Income | 167,768 | $58,326 |
| Mean Household Income | 167,768 | $90,292 |
| Income Deficit | 96,857 | $11,376 |
| Wage / Income Gap (%) | 398,322 | 17.51% |
| Wage / Income Gap ($) | 398,322 | 82.49¢ per $1 |
| Gini / Inequality Index | 398,322 | 0.52 |
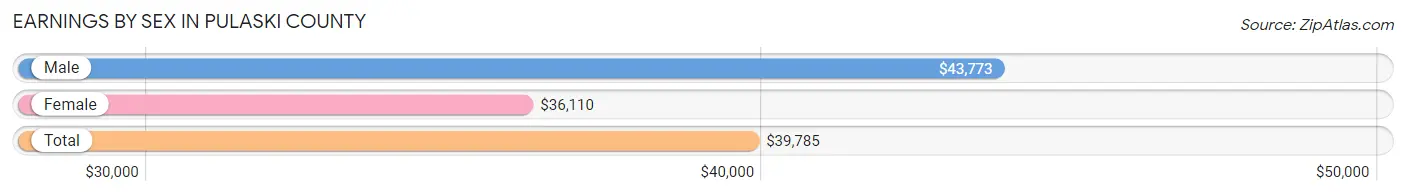
Earnings by Sex in Pulaski County
Average Earnings in Pulaski County are $39,785, $43,773 for men and $36,110 for women, a difference of 17.5%.
| Sex | Number | Average Earnings |
| Male | 101,359 (49.4%) | $43,773 |
| Female | 103,614 (50.5%) | $36,110 |
| Total | 204,973 (100.0%) | $39,785 |
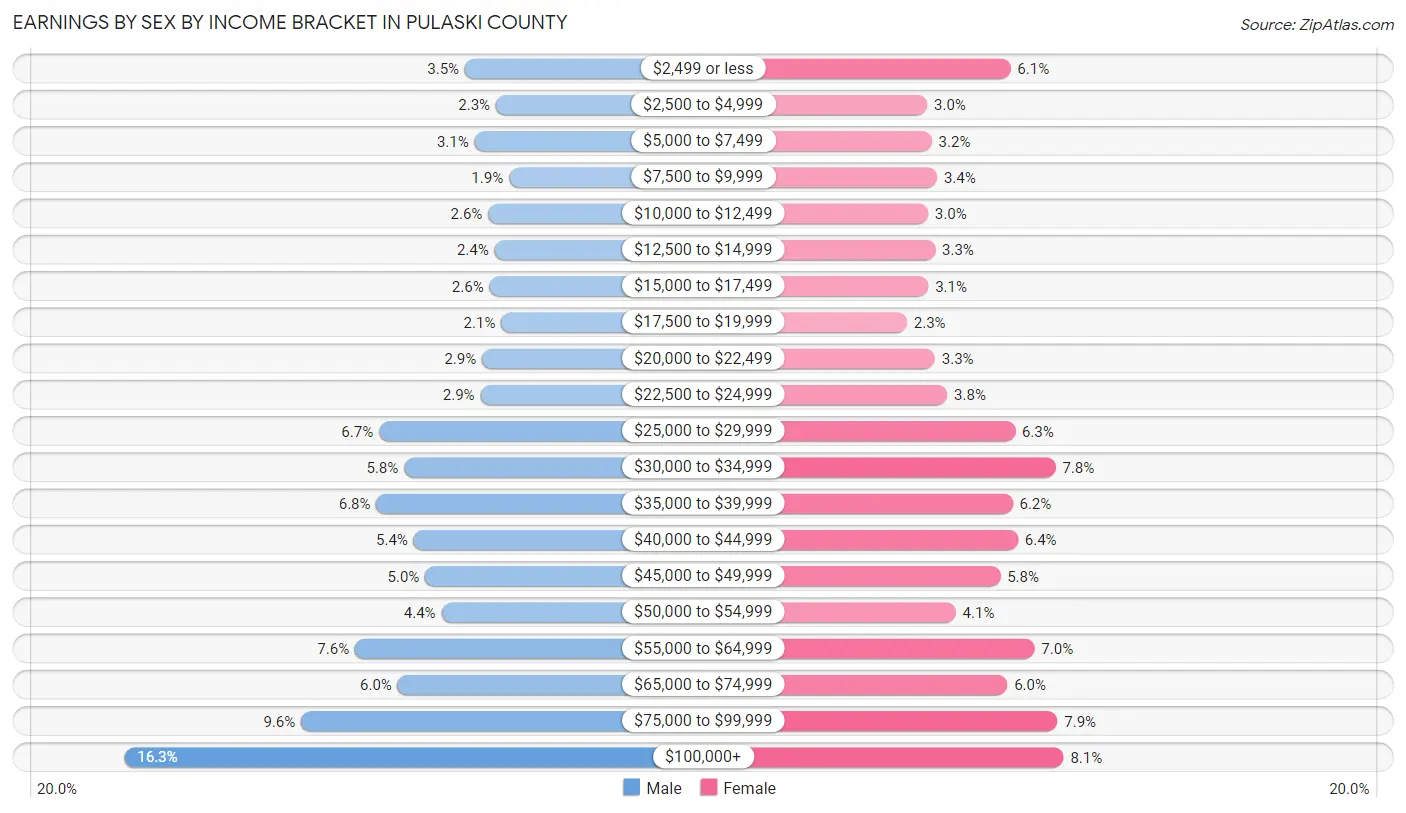
Earnings by Sex by Income Bracket in Pulaski County
The most common earnings brackets in Pulaski County are $100,000+ for men (16,476 | 16.3%) and $100,000+ for women (8,416 | 8.1%).
| Income | Male | Female |
| $2,499 or less | 3,545 (3.5%) | 6,350 (6.1%) |
| $2,500 to $4,999 | 2,368 (2.3%) | 3,116 (3.0%) |
| $5,000 to $7,499 | 3,186 (3.1%) | 3,291 (3.2%) |
| $7,500 to $9,999 | 1,877 (1.8%) | 3,497 (3.4%) |
| $10,000 to $12,499 | 2,667 (2.6%) | 3,146 (3.0%) |
| $12,500 to $14,999 | 2,422 (2.4%) | 3,426 (3.3%) |
| $15,000 to $17,499 | 2,620 (2.6%) | 3,157 (3.0%) |
| $17,500 to $19,999 | 2,169 (2.1%) | 2,327 (2.2%) |
| $20,000 to $22,499 | 2,894 (2.9%) | 3,418 (3.3%) |
| $22,500 to $24,999 | 2,962 (2.9%) | 3,892 (3.8%) |
| $25,000 to $29,999 | 6,809 (6.7%) | 6,529 (6.3%) |
| $30,000 to $34,999 | 5,860 (5.8%) | 8,100 (7.8%) |
| $35,000 to $39,999 | 6,917 (6.8%) | 6,436 (6.2%) |
| $40,000 to $44,999 | 5,492 (5.4%) | 6,641 (6.4%) |
| $45,000 to $49,999 | 5,053 (5.0%) | 5,954 (5.8%) |
| $50,000 to $54,999 | 4,441 (4.4%) | 4,224 (4.1%) |
| $55,000 to $64,999 | 7,725 (7.6%) | 7,285 (7.0%) |
| $65,000 to $74,999 | 6,106 (6.0%) | 6,231 (6.0%) |
| $75,000 to $99,999 | 9,770 (9.6%) | 8,178 (7.9%) |
| $100,000+ | 16,476 (16.3%) | 8,416 (8.1%) |
| Total | 101,359 (100.0%) | 103,614 (100.0%) |
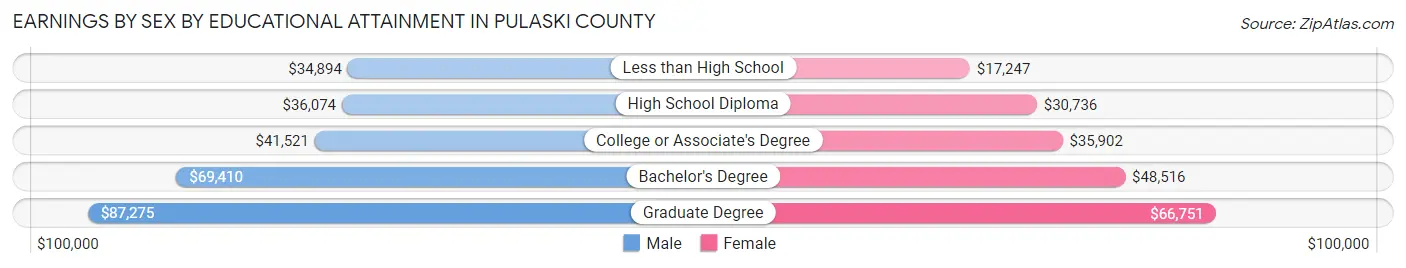
Earnings by Sex by Educational Attainment in Pulaski County
Average earnings in Pulaski County are $49,323 for men and $40,441 for women, a difference of 18.0%. Men with an educational attainment of graduate degree enjoy the highest average annual earnings of $87,275, while those with less than high school education earn the least with $34,894. Women with an educational attainment of graduate degree earn the most with the average annual earnings of $66,751, while those with less than high school education have the smallest earnings of $17,247.
| Educational Attainment | Male Income | Female Income |
| Less than High School | $34,894 | $17,247 |
| High School Diploma | $36,074 | $30,736 |
| College or Associate's Degree | $41,521 | $35,902 |
| Bachelor's Degree | $69,410 | $48,516 |
| Graduate Degree | $87,275 | $66,751 |
| Total | $49,323 | $40,441 |
Family Income in Pulaski County
Family Income Brackets in Pulaski County
According to the Pulaski County family income data, there are 16,853 families falling into the $100,000 to $149,999 income range, which is the most common income bracket and makes up 17.4% of all families. Conversely, the $10,000 to $14,999 income bracket is the least frequent group with only 2,615 families (2.7%) belonging to this category.
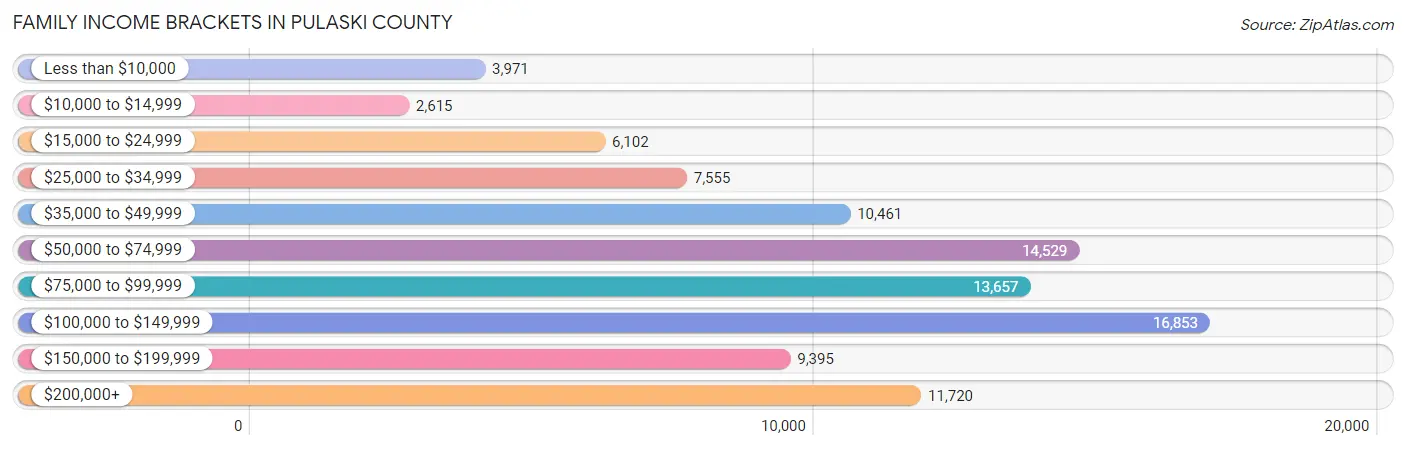
| Income Bracket | # Families | % Families |
| Less than $10,000 | 3,971 | 4.1% |
| $10,000 to $14,999 | 2,615 | 2.7% |
| $15,000 to $24,999 | 6,102 | 6.3% |
| $25,000 to $34,999 | 7,555 | 7.8% |
| $35,000 to $49,999 | 10,461 | 10.8% |
| $50,000 to $74,999 | 14,529 | 15.0% |
| $75,000 to $99,999 | 13,657 | 14.1% |
| $100,000 to $149,999 | 16,853 | 17.4% |
| $150,000 to $199,999 | 9,395 | 9.7% |
| $200,000+ | 11,720 | 12.1% |
Family Income by Famaliy Size in Pulaski County
4-person families (14,608 | 15.1%) account for the highest median family income in Pulaski County with $93,283 per family, while 2-person families (48,682 | 50.3%) have the highest median income of $37,485 per family member.
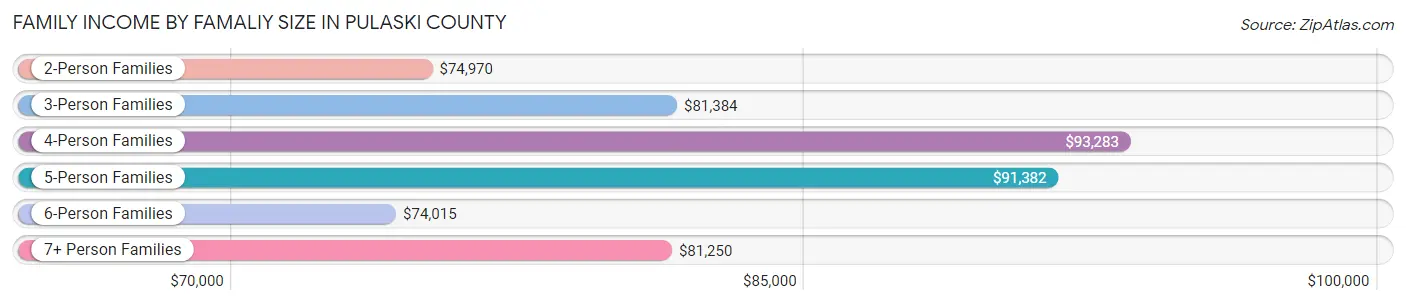
| Income Bracket | # Families | Median Income |
| 2-Person Families | 48,682 (50.3%) | $74,970 |
| 3-Person Families | 23,281 (24.0%) | $81,384 |
| 4-Person Families | 14,608 (15.1%) | $93,283 |
| 5-Person Families | 6,868 (7.1%) | $91,382 |
| 6-Person Families | 2,446 (2.5%) | $74,015 |
| 7+ Person Families | 972 (1.0%) | $81,250 |
| Total | 96,857 (100.0%) | $79,879 |
Family Income by Number of Earners in Pulaski County
The median family income in Pulaski County is $79,879, with families comprising 3+ earners (7,377) having the highest median family income of $136,502, while families with no earners (16,057) have the lowest median family income of $41,051, accounting for 7.6% and 16.6% of families, respectively.
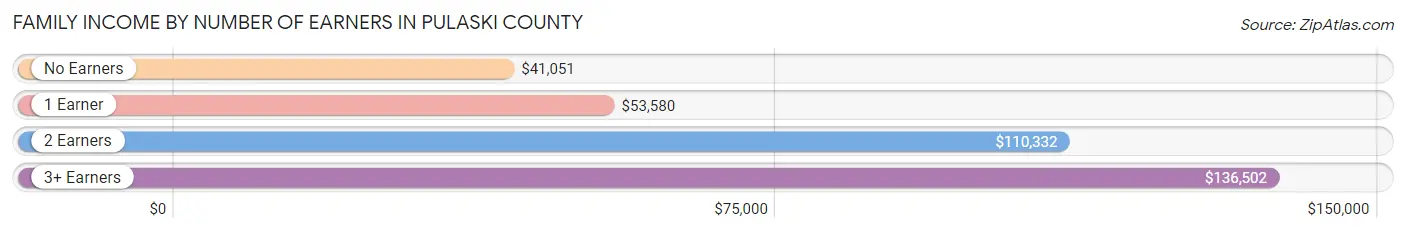
| Number of Earners | # Families | Median Income |
| No Earners | 16,057 (16.6%) | $41,051 |
| 1 Earner | 34,644 (35.8%) | $53,580 |
| 2 Earners | 38,779 (40.0%) | $110,332 |
| 3+ Earners | 7,377 (7.6%) | $136,502 |
| Total | 96,857 (100.0%) | $79,879 |
Household Income in Pulaski County
Household Income Brackets in Pulaski County
With 27,011 households falling in the category, the $50,000 to $74,999 income range is the most frequent in Pulaski County, accounting for 16.1% of all households. In contrast, only 7,550 households (4.5%) fall into the $10,000 to $14,999 income bracket, making it the least populous group.
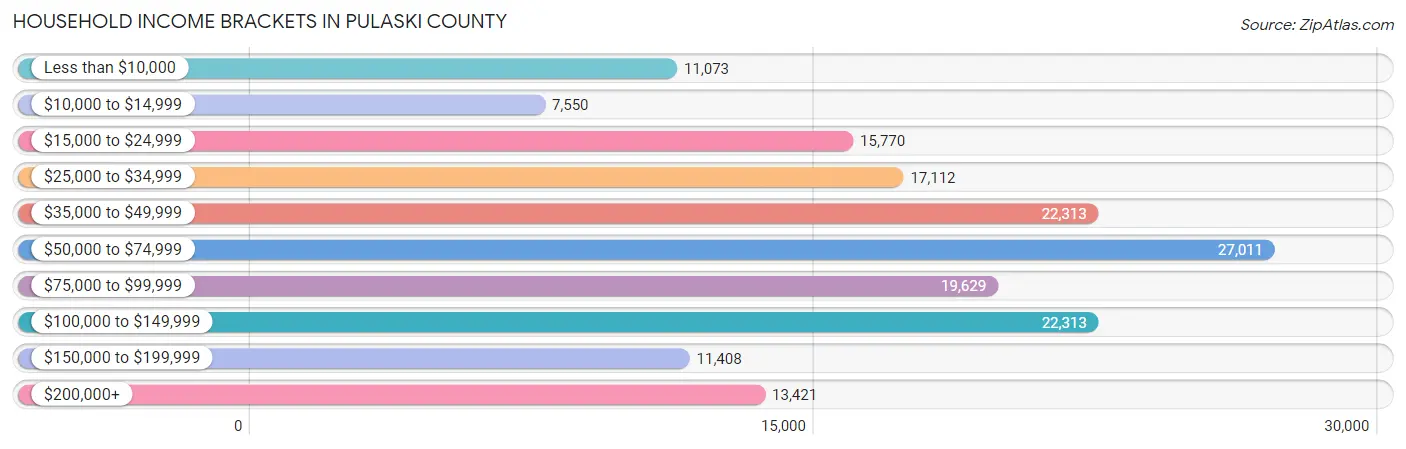
| Income Bracket | # Households | % Households |
| Less than $10,000 | 11,073 | 6.6% |
| $10,000 to $14,999 | 7,550 | 4.5% |
| $15,000 to $24,999 | 15,770 | 9.4% |
| $25,000 to $34,999 | 17,112 | 10.2% |
| $35,000 to $49,999 | 22,313 | 13.3% |
| $50,000 to $74,999 | 27,011 | 16.1% |
| $75,000 to $99,999 | 19,629 | 11.7% |
| $100,000 to $149,999 | 22,313 | 13.3% |
| $150,000 to $199,999 | 11,408 | 6.8% |
| $200,000+ | 13,421 | 8.0% |
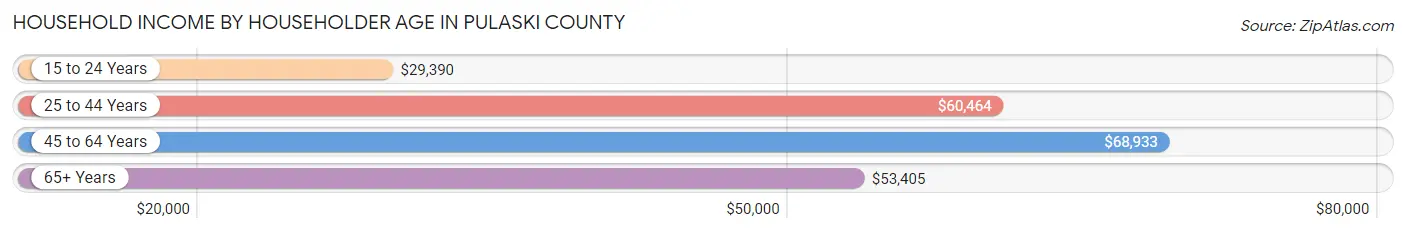
Household Income by Householder Age in Pulaski County
The median household income in Pulaski County is $58,326, with the highest median household income of $68,933 found in the 45 to 64 years age bracket for the primary householder. A total of 58,832 households (35.1%) fall into this category. Meanwhile, the 15 to 24 years age bracket for the primary householder has the lowest median household income of $29,390, with 8,668 households (5.2%) in this group.
| Income Bracket | # Households | Median Income |
| 15 to 24 Years | 8,668 (5.2%) | $29,390 |
| 25 to 44 Years | 58,377 (34.8%) | $60,464 |
| 45 to 64 Years | 58,832 (35.1%) | $68,933 |
| 65+ Years | 41,891 (25.0%) | $53,405 |
| Total | 167,768 (100.0%) | $58,326 |
Poverty in Pulaski County
Income Below Poverty by Sex and Age in Pulaski County
With 15.2% poverty level for males and 17.8% for females among the residents of Pulaski County, under 5 year old males and 12 to 14 year old females are the most vulnerable to poverty, with 3,653 males (28.8%) and 2,511 females (34.9%) in their respective age groups living below the poverty level.
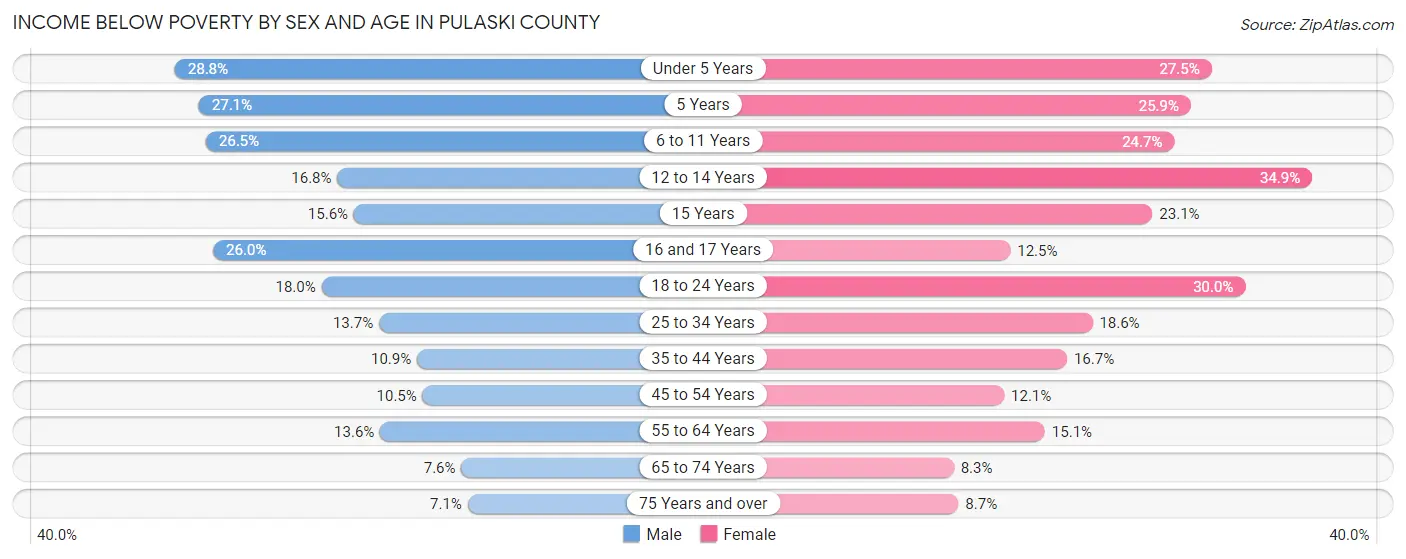
| Age Bracket | Male | Female |
| Under 5 Years | 3,653 (28.8%) | 3,355 (27.5%) |
| 5 Years | 578 (27.1%) | 622 (25.9%) |
| 6 to 11 Years | 4,190 (26.5%) | 3,728 (24.7%) |
| 12 to 14 Years | 1,325 (16.8%) | 2,511 (34.9%) |
| 15 Years | 417 (15.5%) | 641 (23.1%) |
| 16 and 17 Years | 1,273 (26.0%) | 577 (12.5%) |
| 18 to 24 Years | 3,047 (17.9%) | 5,057 (29.9%) |
| 25 to 34 Years | 3,697 (13.7%) | 5,526 (18.6%) |
| 35 to 44 Years | 2,653 (10.9%) | 4,460 (16.7%) |
| 45 to 54 Years | 2,309 (10.4%) | 2,965 (12.0%) |
| 55 to 64 Years | 3,180 (13.6%) | 3,997 (15.1%) |
| 65 to 74 Years | 1,327 (7.6%) | 1,774 (8.3%) |
| 75 Years and over | 656 (7.1%) | 1,250 (8.7%) |
| Total | 28,305 (15.2%) | 36,463 (17.8%) |
Income Above Poverty by Sex and Age in Pulaski County
According to the poverty statistics in Pulaski County, males aged 75 years and over and females aged 65 to 74 years are the age groups that are most secure financially, with 92.9% of males and 91.7% of females in these age groups living above the poverty line.
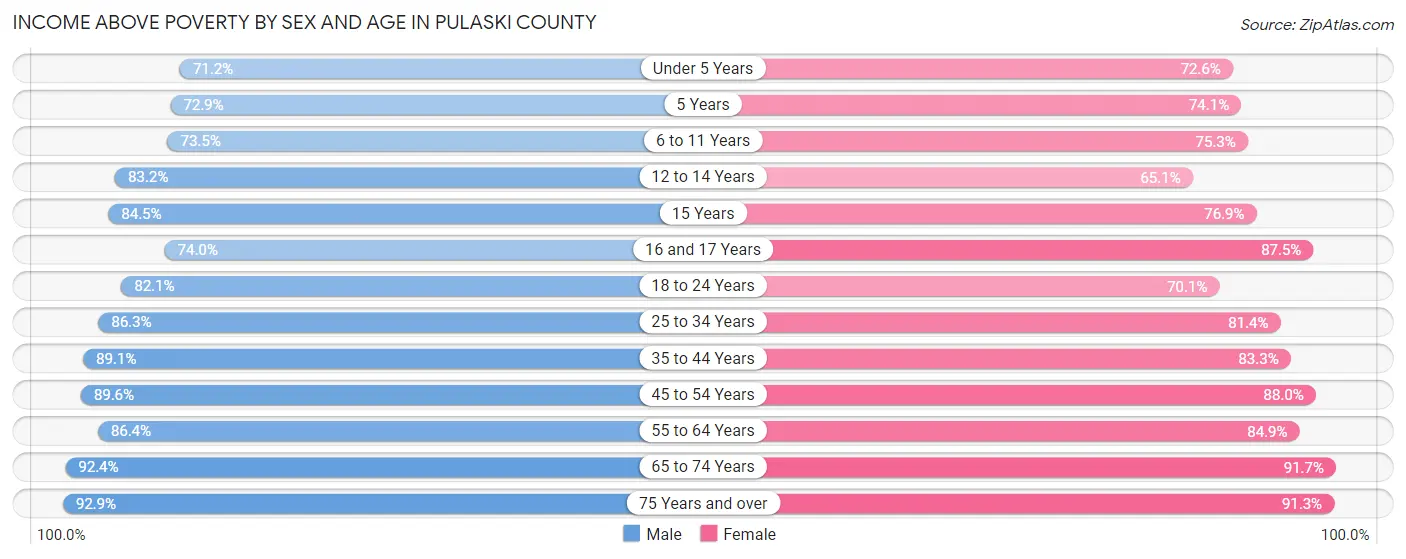
| Age Bracket | Male | Female |
| Under 5 Years | 9,013 (71.2%) | 8,866 (72.6%) |
| 5 Years | 1,558 (72.9%) | 1,779 (74.1%) |
| 6 to 11 Years | 11,596 (73.5%) | 11,380 (75.3%) |
| 12 to 14 Years | 6,572 (83.2%) | 4,681 (65.1%) |
| 15 Years | 2,264 (84.5%) | 2,139 (76.9%) |
| 16 and 17 Years | 3,623 (74.0%) | 4,036 (87.5%) |
| 18 to 24 Years | 13,931 (82.1%) | 11,829 (70.1%) |
| 25 to 34 Years | 23,313 (86.3%) | 24,164 (81.4%) |
| 35 to 44 Years | 21,787 (89.1%) | 22,208 (83.3%) |
| 45 to 54 Years | 19,778 (89.5%) | 21,640 (87.9%) |
| 55 to 64 Years | 20,197 (86.4%) | 22,501 (84.9%) |
| 65 to 74 Years | 16,201 (92.4%) | 19,570 (91.7%) |
| 75 Years and over | 8,579 (92.9%) | 13,186 (91.3%) |
| Total | 158,412 (84.8%) | 167,979 (82.2%) |
Income Below Poverty Among Married-Couple Families in Pulaski County
The poverty statistics for married-couple families in Pulaski County show that 5.7% or 3,674 of the total 64,731 families live below the poverty line. Families with 5 or more children have the highest poverty rate of 55.7%, comprising of 243 families. On the other hand, families with no children have the lowest poverty rate of 3.8%, which includes 1,478 families.
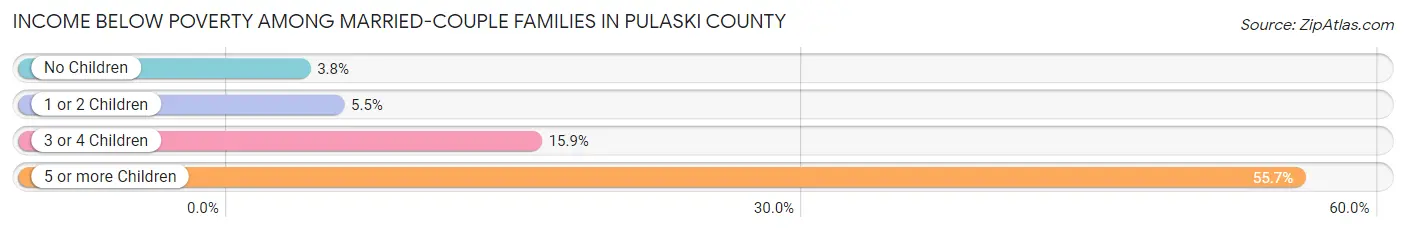
| Children | Above Poverty | Below Poverty |
| No Children | 37,728 (96.2%) | 1,478 (3.8%) |
| 1 or 2 Children | 18,541 (94.5%) | 1,087 (5.5%) |
| 3 or 4 Children | 4,595 (84.1%) | 866 (15.9%) |
| 5 or more Children | 193 (44.3%) | 243 (55.7%) |
| Total | 61,057 (94.3%) | 3,674 (5.7%) |
Income Below Poverty Among Single-Parent Households in Pulaski County
According to the poverty data in Pulaski County, 15.9% or 1,028 single-father households and 27.8% or 7,139 single-mother households are living below the poverty line. Among single-father households, those with 5 or more children have the highest poverty rate, with 55 households (100.0%) experiencing poverty. Likewise, among single-mother households, those with 3 or 4 children have the highest poverty rate, with 2,014 households (65.9%) falling below the poverty line.
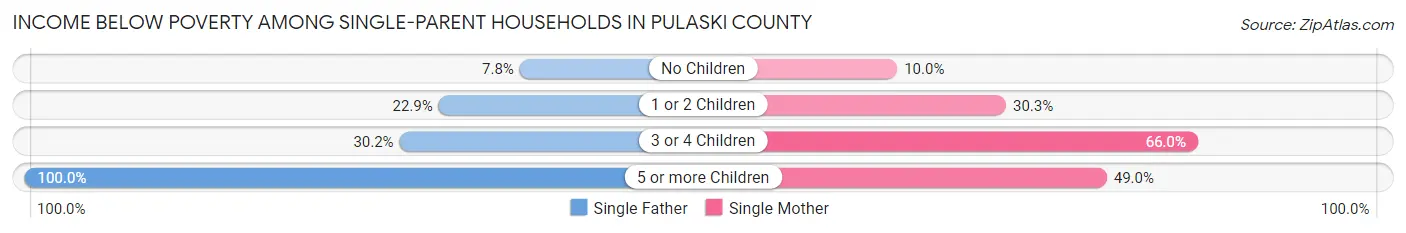
| Children | Single Father | Single Mother |
| No Children | 271 (7.8%) | 877 (10.0%) |
| 1 or 2 Children | 568 (22.9%) | 4,074 (30.2%) |
| 3 or 4 Children | 134 (30.2%) | 2,014 (65.9%) |
| 5 or more Children | 55 (100.0%) | 174 (49.0%) |
| Total | 1,028 (15.9%) | 7,139 (27.8%) |
Income Below Poverty Among Married-Couple vs Single-Parent Households in Pulaski County
The poverty data for Pulaski County shows that 3,674 of the married-couple family households (5.7%) and 8,167 of the single-parent households (25.4%) are living below the poverty level. Within the married-couple family households, those with 5 or more children have the highest poverty rate, with 243 households (55.7%) falling below the poverty line. Among the single-parent households, those with 3 or 4 children have the highest poverty rate, with 2,148 household (61.4%) living below poverty.
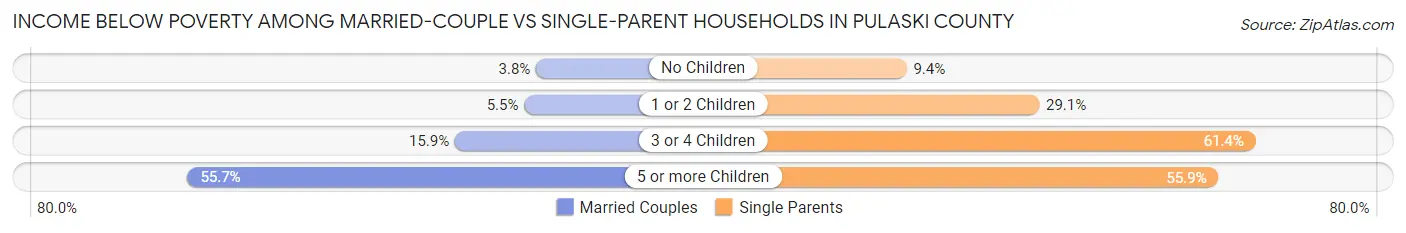
| Children | Married-Couple Families | Single-Parent Households |
| No Children | 1,478 (3.8%) | 1,148 (9.4%) |
| 1 or 2 Children | 1,087 (5.5%) | 4,642 (29.1%) |
| 3 or 4 Children | 866 (15.9%) | 2,148 (61.4%) |
| 5 or more Children | 243 (55.7%) | 229 (55.8%) |
| Total | 3,674 (5.7%) | 8,167 (25.4%) |
Race in Pulaski County
The most populous races in Pulaski County are White / Caucasian (209,994 | 52.7%), Black / African American (148,791 | 37.3%), and Hispanic or Latino (25,329 | 6.4%).
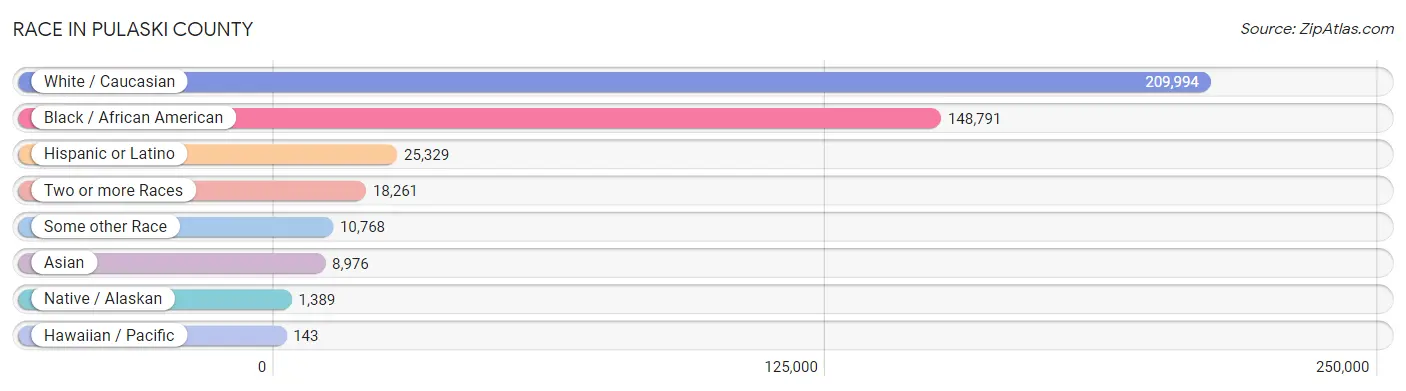
| Race | # Population | % Population |
| Asian | 8,976 | 2.2% |
| Black / African American | 148,791 | 37.3% |
| Hawaiian / Pacific | 143 | 0.0% |
| Hispanic or Latino | 25,329 | 6.4% |
| Native / Alaskan | 1,389 | 0.4% |
| White / Caucasian | 209,994 | 52.7% |
| Two or more Races | 18,261 | 4.6% |
| Some other Race | 10,768 | 2.7% |
| Total | 398,322 | 100.0% |
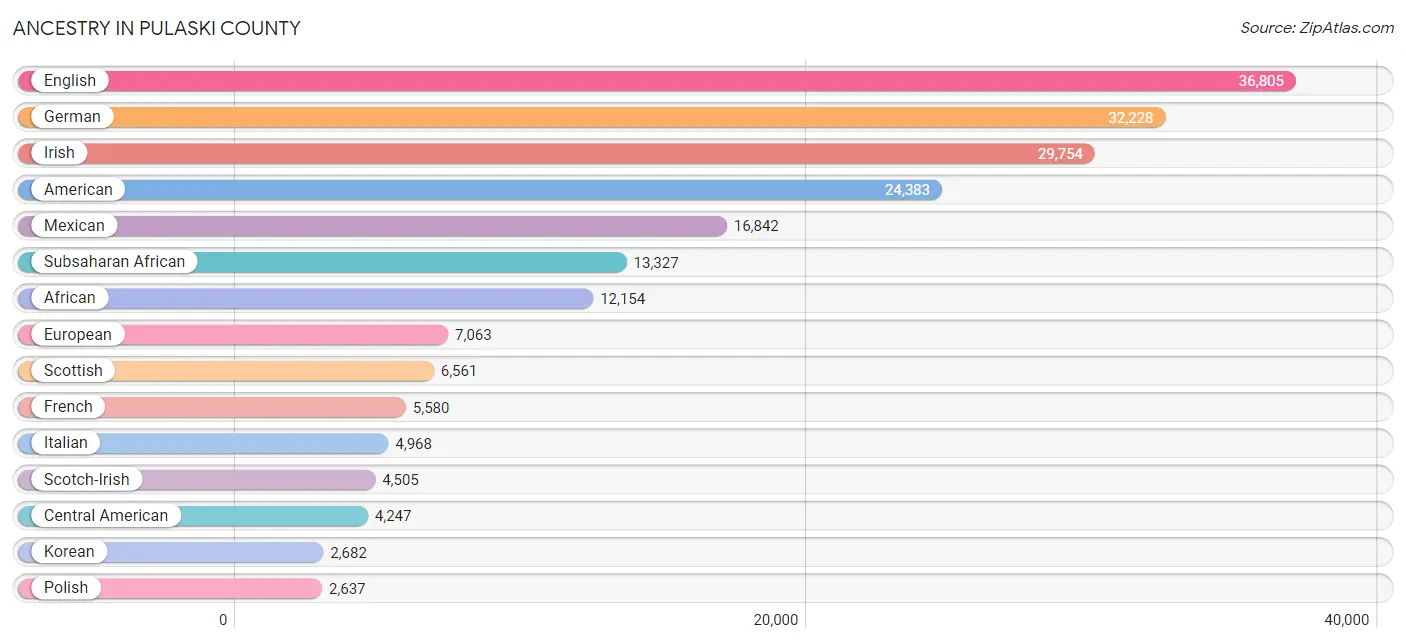
Ancestry in Pulaski County
The most populous ancestries reported in Pulaski County are English (36,805 | 9.2%), German (32,228 | 8.1%), Irish (29,754 | 7.5%), American (24,383 | 6.1%), and Mexican (16,842 | 4.2%), together accounting for 35.1% of all Pulaski County residents.
| Ancestry | # Population | % Population |
| Afghan | 28 | 0.0% |
| African | 12,154 | 3.0% |
| Alsatian | 3 | 0.0% |
| American | 24,383 | 6.1% |
| Apache | 62 | 0.0% |
| Arab | 1,251 | 0.3% |
| Argentinean | 157 | 0.0% |
| Armenian | 85 | 0.0% |
| Assyrian / Chaldean / Syriac | 93 | 0.0% |
| Australian | 3 | 0.0% |
| Austrian | 234 | 0.1% |
| Bahamian | 22 | 0.0% |
| Bangladeshi | 70 | 0.0% |
| Barbadian | 6 | 0.0% |
| Basque | 12 | 0.0% |
| Belgian | 131 | 0.0% |
| Belizean | 43 | 0.0% |
| Bermudan | 13 | 0.0% |
| Bhutanese | 1,001 | 0.3% |
| Blackfeet | 225 | 0.1% |
| Bolivian | 45 | 0.0% |
| Brazilian | 68 | 0.0% |
| British | 2,355 | 0.6% |
| British West Indian | 27 | 0.0% |
| Bulgarian | 15 | 0.0% |
| Burmese | 911 | 0.2% |
| Cajun | 116 | 0.0% |
| Cambodian | 45 | 0.0% |
| Canadian | 239 | 0.1% |
| Celtic | 14 | 0.0% |
| Central American | 4,247 | 1.1% |
| Central American Indian | 82 | 0.0% |
| Cherokee | 1,456 | 0.4% |
| Cheyenne | 32 | 0.0% |
| Chickasaw | 10 | 0.0% |
| Chilean | 275 | 0.1% |
| Chinese | 3 | 0.0% |
| Chippewa | 3 | 0.0% |
| Choctaw | 421 | 0.1% |
| Colombian | 165 | 0.0% |
| Comanche | 36 | 0.0% |
| Costa Rican | 33 | 0.0% |
| Cree | 3 | 0.0% |
| Creek | 17 | 0.0% |
| Croatian | 137 | 0.0% |
| Cuban | 352 | 0.1% |
| Czech | 796 | 0.2% |
| Czechoslovakian | 131 | 0.0% |
| Danish | 655 | 0.2% |
| Dominican | 12 | 0.0% |
| Dutch | 2,514 | 0.6% |
| Dutch West Indian | 25 | 0.0% |
| Eastern European | 367 | 0.1% |
| Ecuadorian | 77 | 0.0% |
| Egyptian | 308 | 0.1% |
| English | 36,805 | 9.2% |
| Estonian | 14 | 0.0% |
| Ethiopian | 11 | 0.0% |
| European | 7,063 | 1.8% |
| Fijian | 52 | 0.0% |
| Filipino | 22 | 0.0% |
| Finnish | 136 | 0.0% |
| French | 5,580 | 1.4% |
| French Canadian | 819 | 0.2% |
| German | 32,228 | 8.1% |
| German Russian | 5 | 0.0% |
| Ghanaian | 238 | 0.1% |
| Greek | 385 | 0.1% |
| Guamanian / Chamorro | 20 | 0.0% |
| Guatemalan | 1,501 | 0.4% |
| Guyanese | 71 | 0.0% |
| Haitian | 116 | 0.0% |
| Honduran | 445 | 0.1% |
| Hungarian | 294 | 0.1% |
| Indian (Asian) | 1,333 | 0.3% |
| Inupiat | 21 | 0.0% |
| Iranian | 267 | 0.1% |
| Irish | 29,754 | 7.5% |
| Iroquois | 26 | 0.0% |
| Israeli | 72 | 0.0% |
| Italian | 4,968 | 1.3% |
| Jamaican | 449 | 0.1% |
| Japanese | 64 | 0.0% |
| Jordanian | 31 | 0.0% |
| Kenyan | 32 | 0.0% |
| Kiowa | 17 | 0.0% |
| Korean | 2,682 | 0.7% |
| Laotian | 232 | 0.1% |
| Latvian | 15 | 0.0% |
| Lebanese | 164 | 0.0% |
| Lithuanian | 285 | 0.1% |
| Luxembourger | 18 | 0.0% |
| Macedonian | 26 | 0.0% |
| Malaysian | 161 | 0.0% |
| Mexican | 16,842 | 4.2% |
| Mexican American Indian | 417 | 0.1% |
| Mongolian | 18 | 0.0% |
| Moroccan | 63 | 0.0% |
| Native Hawaiian | 115 | 0.0% |
| Navajo | 21 | 0.0% |
| Nicaraguan | 470 | 0.1% |
| Nigerian | 389 | 0.1% |
| Northern European | 436 | 0.1% |
| Norwegian | 1,675 | 0.4% |
| Osage | 63 | 0.0% |
| Paiute | 13 | 0.0% |
| Pakistani | 458 | 0.1% |
| Palestinian | 127 | 0.0% |
| Panamanian | 165 | 0.0% |
| Pennsylvania German | 43 | 0.0% |
| Peruvian | 122 | 0.0% |
| Polish | 2,637 | 0.7% |
| Portuguese | 211 | 0.1% |
| Potawatomi | 5 | 0.0% |
| Pueblo | 6 | 0.0% |
| Puerto Rican | 628 | 0.2% |
| Romanian | 99 | 0.0% |
| Russian | 548 | 0.1% |
| Salvadoran | 1,490 | 0.4% |
| Scandinavian | 639 | 0.2% |
| Scotch-Irish | 4,505 | 1.1% |
| Scottish | 6,561 | 1.7% |
| Seminole | 20 | 0.0% |
| Serbian | 11 | 0.0% |
| Sioux | 55 | 0.0% |
| Slavic | 36 | 0.0% |
| Slovak | 84 | 0.0% |
| Slovene | 26 | 0.0% |
| South African | 106 | 0.0% |
| South American | 1,133 | 0.3% |
| South American Indian | 7 | 0.0% |
| Spaniard | 190 | 0.1% |
| Spanish | 384 | 0.1% |
| Spanish American | 7 | 0.0% |
| Sri Lankan | 861 | 0.2% |
| Subsaharan African | 13,327 | 3.4% |
| Swedish | 1,440 | 0.4% |
| Swiss | 802 | 0.2% |
| Syrian | 328 | 0.1% |
| Thai | 2,334 | 0.6% |
| Tohono O'Odham | 60 | 0.0% |
| Trinidadian and Tobagonian | 63 | 0.0% |
| Turkish | 84 | 0.0% |
| U.S. Virgin Islander | 43 | 0.0% |
| Ukrainian | 226 | 0.1% |
| Ute | 18 | 0.0% |
| Venezuelan | 292 | 0.1% |
| Vietnamese | 60 | 0.0% |
| Welsh | 1,808 | 0.4% |
| West Indian | 434 | 0.1% |
| Yugoslavian | 26 | 0.0% | View All 151 Rows |
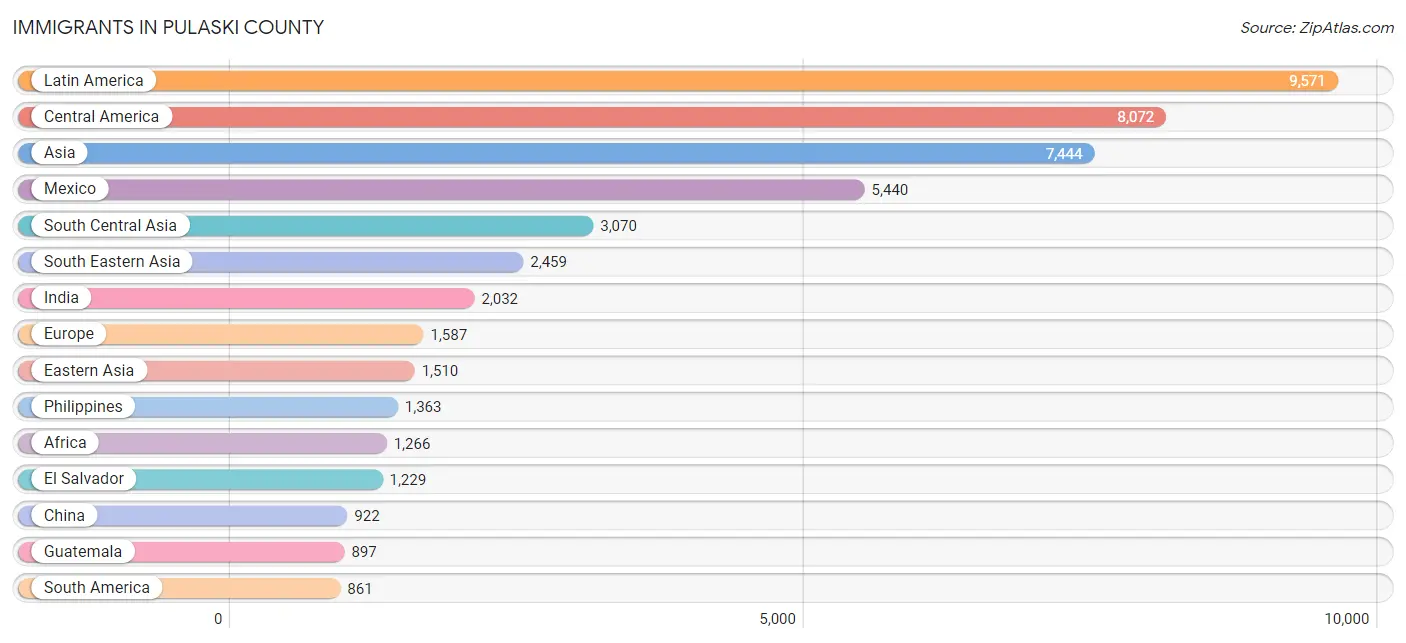
Immigrants in Pulaski County
The most numerous immigrant groups reported in Pulaski County came from Latin America (9,571 | 2.4%), Central America (8,072 | 2.0%), Asia (7,444 | 1.9%), Mexico (5,440 | 1.4%), and South Central Asia (3,070 | 0.8%), together accounting for 8.4% of all Pulaski County residents.
| Immigration Origin | # Population | % Population |
| Afghanistan | 28 | 0.0% |
| Africa | 1,266 | 0.3% |
| Argentina | 157 | 0.0% |
| Asia | 7,444 | 1.9% |
| Australia | 15 | 0.0% |
| Austria | 5 | 0.0% |
| Bahamas | 75 | 0.0% |
| Bangladesh | 75 | 0.0% |
| Barbados | 20 | 0.0% |
| Belarus | 86 | 0.0% |
| Belgium | 33 | 0.0% |
| Belize | 16 | 0.0% |
| Bolivia | 26 | 0.0% |
| Brazil | 134 | 0.0% |
| Cambodia | 27 | 0.0% |
| Cameroon | 69 | 0.0% |
| Canada | 201 | 0.1% |
| Caribbean | 638 | 0.2% |
| Central America | 8,072 | 2.0% |
| Chile | 49 | 0.0% |
| China | 922 | 0.2% |
| Colombia | 110 | 0.0% |
| Costa Rica | 33 | 0.0% |
| Cuba | 73 | 0.0% |
| Denmark | 27 | 0.0% |
| Dominica | 312 | 0.1% |
| Dominican Republic | 12 | 0.0% |
| Eastern Africa | 336 | 0.1% |
| Eastern Asia | 1,510 | 0.4% |
| Eastern Europe | 352 | 0.1% |
| Ecuador | 23 | 0.0% |
| Egypt | 189 | 0.1% |
| El Salvador | 1,229 | 0.3% |
| England | 192 | 0.1% |
| Europe | 1,587 | 0.4% |
| France | 189 | 0.1% |
| Germany | 317 | 0.1% |
| Ghana | 170 | 0.0% |
| Greece | 11 | 0.0% |
| Guatemala | 897 | 0.2% |
| Guyana | 33 | 0.0% |
| Haiti | 6 | 0.0% |
| Honduras | 286 | 0.1% |
| Hong Kong | 39 | 0.0% |
| Hungary | 20 | 0.0% |
| India | 2,032 | 0.5% |
| Indonesia | 224 | 0.1% |
| Iran | 170 | 0.0% |
| Iraq | 51 | 0.0% |
| Ireland | 81 | 0.0% |
| Israel | 44 | 0.0% |
| Italy | 60 | 0.0% |
| Jamaica | 46 | 0.0% |
| Japan | 104 | 0.0% |
| Jordan | 74 | 0.0% |
| Kenya | 78 | 0.0% |
| Korea | 439 | 0.1% |
| Kuwait | 70 | 0.0% |
| Laos | 55 | 0.0% |
| Latin America | 9,571 | 2.4% |
| Malaysia | 18 | 0.0% |
| Mexico | 5,440 | 1.4% |
| Middle Africa | 81 | 0.0% |
| Morocco | 38 | 0.0% |
| Nepal | 25 | 0.0% |
| Netherlands | 19 | 0.0% |
| Nicaragua | 164 | 0.0% |
| Nigeria | 290 | 0.1% |
| Northern Africa | 227 | 0.1% |
| Northern Europe | 546 | 0.1% |
| Norway | 59 | 0.0% |
| Oceania | 72 | 0.0% |
| Pakistan | 715 | 0.2% |
| Panama | 7 | 0.0% |
| Peru | 42 | 0.0% |
| Philippines | 1,363 | 0.3% |
| Poland | 75 | 0.0% |
| Romania | 10 | 0.0% |
| Russia | 53 | 0.0% |
| Saudi Arabia | 26 | 0.0% |
| Scotland | 28 | 0.0% |
| South Africa | 116 | 0.0% |
| South America | 861 | 0.2% |
| South Central Asia | 3,070 | 0.8% |
| South Eastern Asia | 2,459 | 0.6% |
| Southern Europe | 91 | 0.0% |
| Spain | 20 | 0.0% |
| Sri Lanka | 25 | 0.0% |
| St. Vincent and the Grenadines | 17 | 0.0% |
| Sweden | 19 | 0.0% |
| Switzerland | 14 | 0.0% |
| Syria | 50 | 0.0% |
| Taiwan | 79 | 0.0% |
| Thailand | 201 | 0.1% |
| Trinidad and Tobago | 45 | 0.0% |
| Turkey | 40 | 0.0% |
| Ukraine | 63 | 0.0% |
| Venezuela | 247 | 0.1% |
| Vietnam | 555 | 0.1% |
| Western Africa | 506 | 0.1% |
| Western Asia | 392 | 0.1% |
| Western Europe | 577 | 0.1% |
| Zaire | 12 | 0.0% | View All 103 Rows |
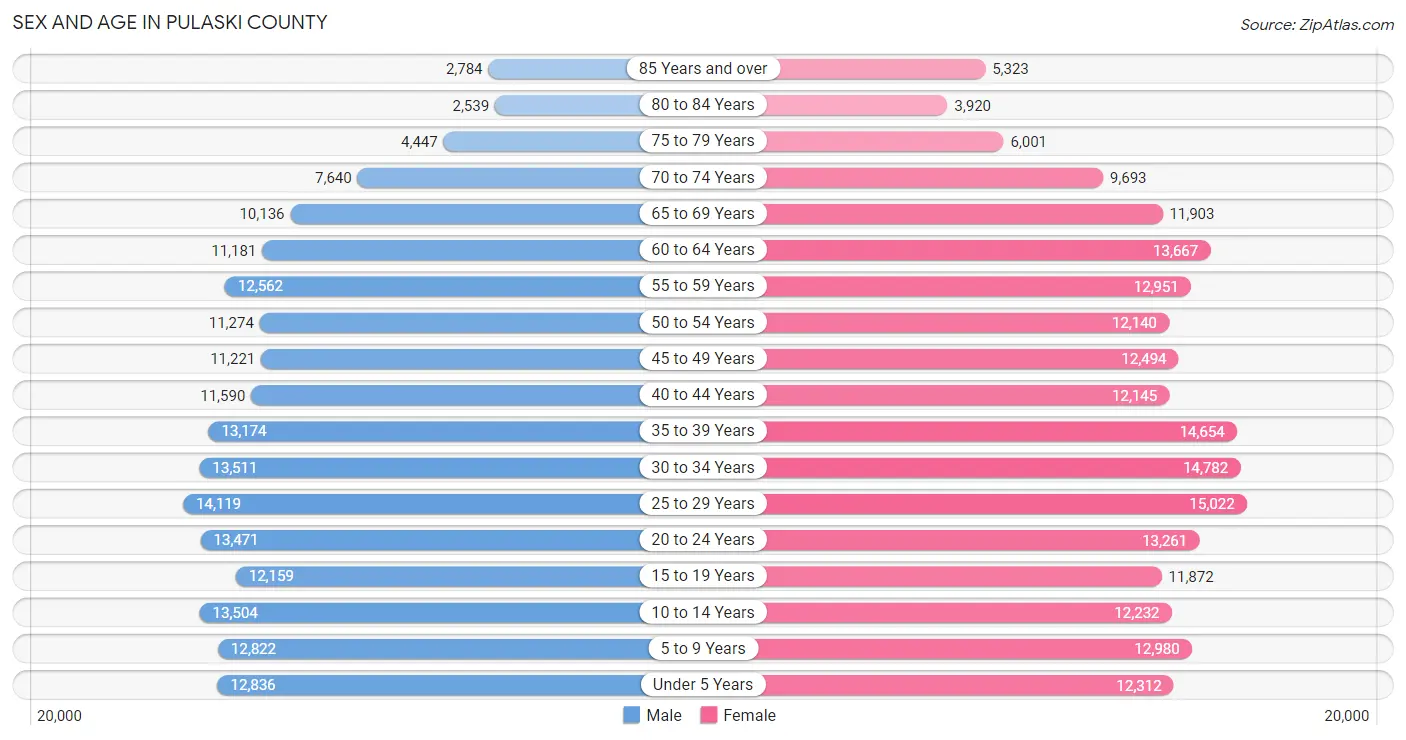
Sex and Age in Pulaski County
Sex and Age in Pulaski County
The most populous age groups in Pulaski County are 25 to 29 Years (14,119 | 7.4%) for men and 25 to 29 Years (15,022 | 7.2%) for women.
| Age Bracket | Male | Female |
| Under 5 Years | 12,836 (6.7%) | 12,312 (5.9%) |
| 5 to 9 Years | 12,822 (6.7%) | 12,980 (6.3%) |
| 10 to 14 Years | 13,504 (7.1%) | 12,232 (5.9%) |
| 15 to 19 Years | 12,159 (6.4%) | 11,872 (5.7%) |
| 20 to 24 Years | 13,471 (7.0%) | 13,261 (6.4%) |
| 25 to 29 Years | 14,119 (7.4%) | 15,022 (7.2%) |
| 30 to 34 Years | 13,511 (7.1%) | 14,782 (7.1%) |
| 35 to 39 Years | 13,174 (6.9%) | 14,654 (7.1%) |
| 40 to 44 Years | 11,590 (6.1%) | 12,145 (5.9%) |
| 45 to 49 Years | 11,221 (5.9%) | 12,494 (6.0%) |
| 50 to 54 Years | 11,274 (5.9%) | 12,140 (5.9%) |
| 55 to 59 Years | 12,562 (6.6%) | 12,951 (6.2%) |
| 60 to 64 Years | 11,181 (5.9%) | 13,667 (6.6%) |
| 65 to 69 Years | 10,136 (5.3%) | 11,903 (5.7%) |
| 70 to 74 Years | 7,640 (4.0%) | 9,693 (4.7%) |
| 75 to 79 Years | 4,447 (2.3%) | 6,001 (2.9%) |
| 80 to 84 Years | 2,539 (1.3%) | 3,920 (1.9%) |
| 85 Years and over | 2,784 (1.5%) | 5,323 (2.6%) |
| Total | 190,970 (100.0%) | 207,352 (100.0%) |
Families and Households in Pulaski County
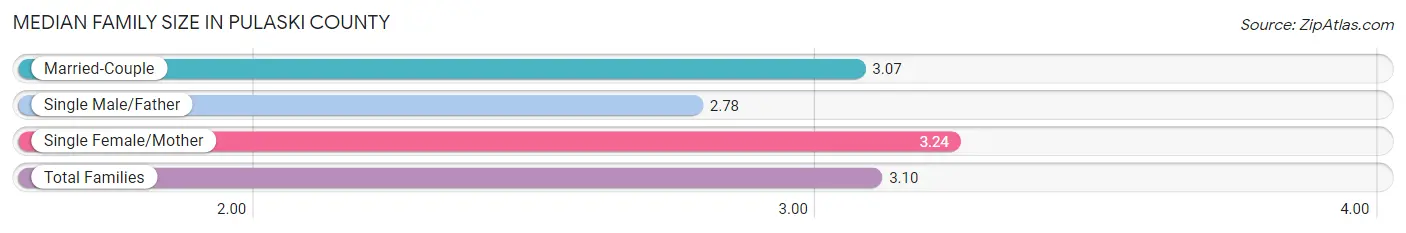
Median Family Size in Pulaski County
The median family size in Pulaski County is 3.10 persons per family, with single female/mother families (25,663 | 26.5%) accounting for the largest median family size of 3.24 persons per family. On the other hand, single male/father families (6,463 | 6.7%) represent the smallest median family size with 2.78 persons per family.
| Family Type | # Families | Family Size |
| Married-Couple | 64,731 (66.8%) | 3.07 |
| Single Male/Father | 6,463 (6.7%) | 2.78 |
| Single Female/Mother | 25,663 (26.5%) | 3.24 |
| Total Families | 96,857 (100.0%) | 3.10 |
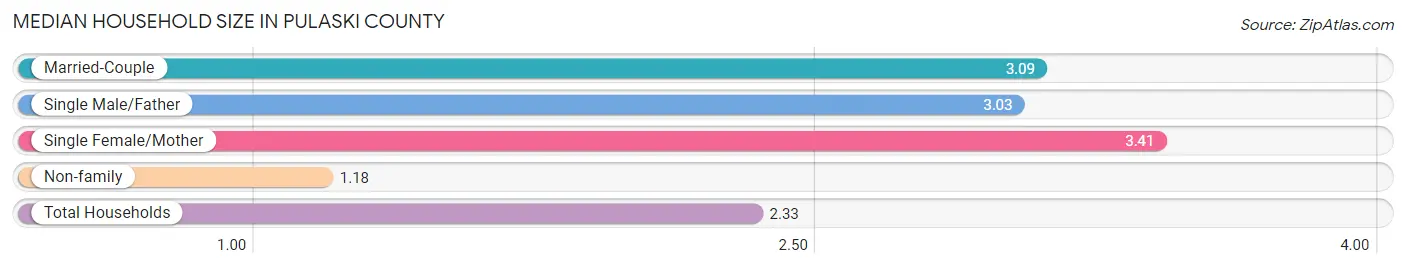
Median Household Size in Pulaski County
The median household size in Pulaski County is 2.33 persons per household, with single female/mother households (25,663 | 15.3%) accounting for the largest median household size of 3.41 persons per household. non-family households (70,911 | 42.3%) represent the smallest median household size with 1.18 persons per household.
| Household Type | # Households | Household Size |
| Married-Couple | 64,731 (38.6%) | 3.09 |
| Single Male/Father | 6,463 (3.8%) | 3.03 |
| Single Female/Mother | 25,663 (15.3%) | 3.41 |
| Non-family | 70,911 (42.3%) | 1.18 |
| Total Households | 167,768 (100.0%) | 2.33 |
Household Size by Marriage Status in Pulaski County
Out of a total of 167,768 households in Pulaski County, 96,857 (57.7%) are family households, while 70,911 (42.3%) are nonfamily households. The most numerous type of family households are 2-person households, comprising 46,102, and the most common type of nonfamily households are 1-person households, comprising 60,922.
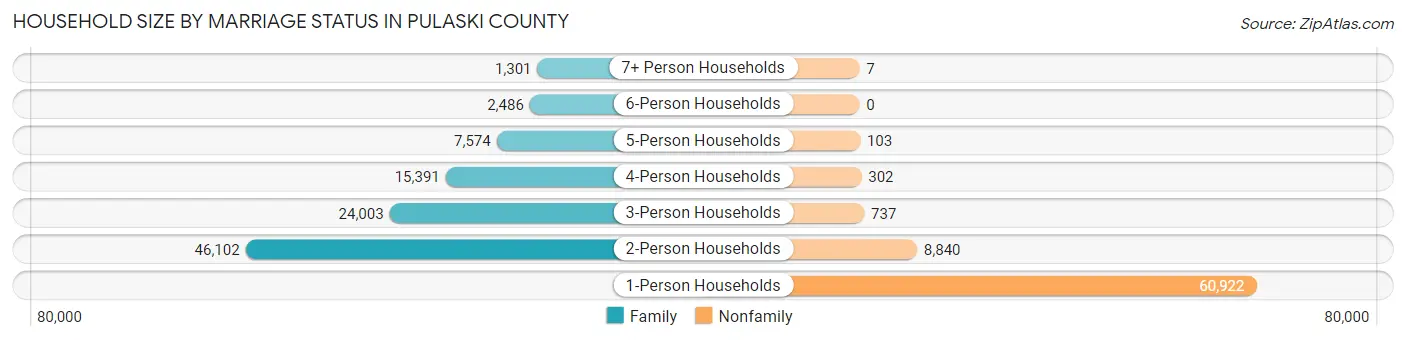
| Household Size | Family Households | Nonfamily Households |
| 1-Person Households | - | 60,922 (36.3%) |
| 2-Person Households | 46,102 (27.5%) | 8,840 (5.3%) |
| 3-Person Households | 24,003 (14.3%) | 737 (0.4%) |
| 4-Person Households | 15,391 (9.2%) | 302 (0.2%) |
| 5-Person Households | 7,574 (4.5%) | 103 (0.1%) |
| 6-Person Households | 2,486 (1.5%) | 0 (0.0%) |
| 7+ Person Households | 1,301 (0.8%) | 7 (0.0%) |
| Total | 96,857 (57.7%) | 70,911 (42.3%) |
Female Fertility in Pulaski County
Fertility by Age in Pulaski County
Average fertility rate in Pulaski County is 51.0 births per 1,000 women. Women in the age bracket of 20 to 34 years have the highest fertility rate with 86.0 births per 1,000 women. Women in the age bracket of 20 to 34 years acount for 75.3% of all women with births.
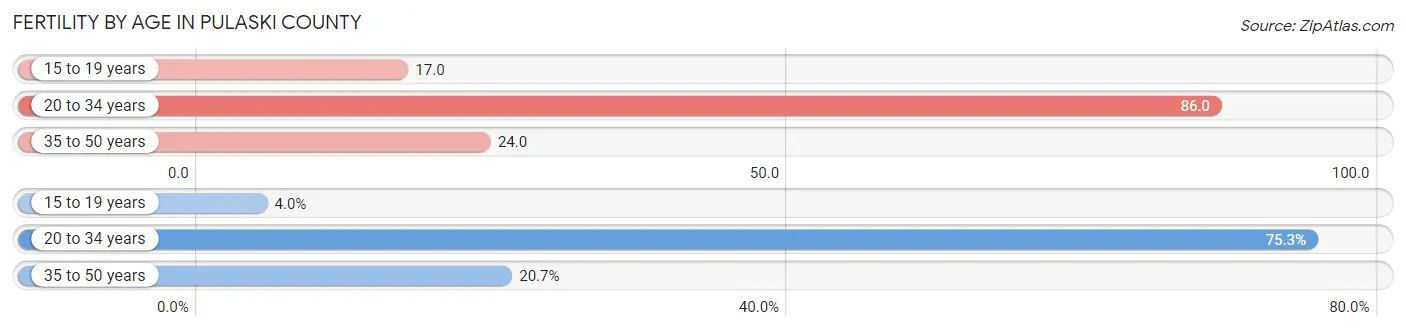
| Age Bracket | Women with Births | Births / 1,000 Women |
| 15 to 19 years | 199 (4.0%) | 17.0 |
| 20 to 34 years | 3,706 (75.3%) | 86.0 |
| 35 to 50 years | 1,016 (20.6%) | 24.0 |
| Total | 4,921 (100.0%) | 51.0 |
Fertility by Age by Marriage Status in Pulaski County
63.8% of women with births (4,921) in Pulaski County are married. The highest percentage of unmarried women with births falls into 15 to 19 years age bracket with 100.0% of them unmarried at the time of birth, while the lowest percentage of unmarried women with births belong to 35 to 50 years age bracket with 23.0% of them unmarried.
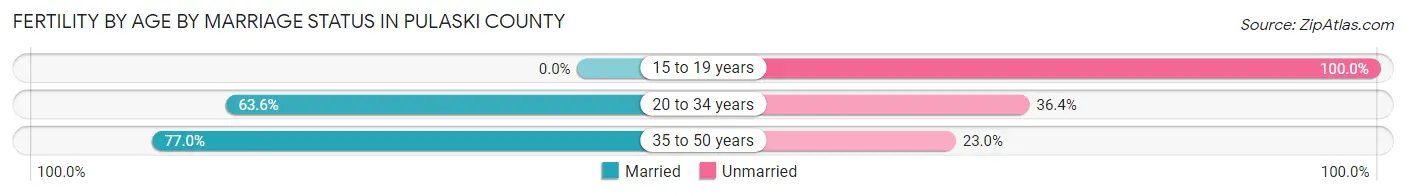
| Age Bracket | Married | Unmarried |
| 15 to 19 years | 0 (0.0%) | 199 (100.0%) |
| 20 to 34 years | 2,357 (63.6%) | 1,349 (36.4%) |
| 35 to 50 years | 782 (77.0%) | 234 (23.0%) |
| Total | 3,140 (63.8%) | 1,781 (36.2%) |
Fertility by Education in Pulaski County
Average fertility rate in Pulaski County is 51.0 births per 1,000 women. Women with the education attainment of graduate degree have the highest fertility rate of 75.0 births per 1,000 women, while women with the education attainment of less than high school have the lowest fertility at 30.0 births per 1,000 women. Women with the education attainment of college or associate's degree represent 31.5% of all women with births.
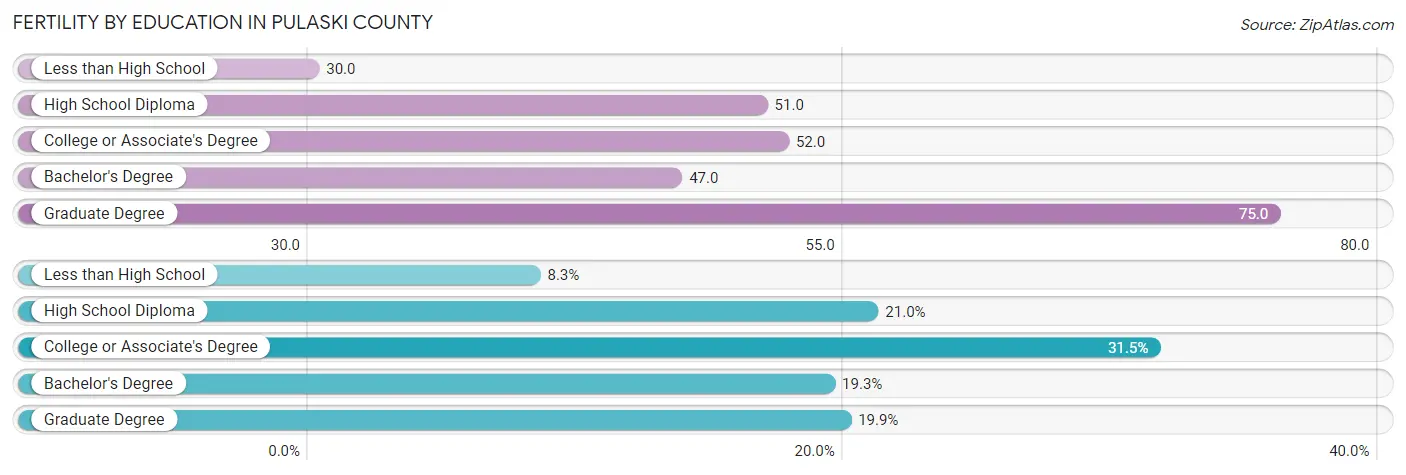
| Educational Attainment | Women with Births | Births / 1,000 Women |
| Less than High School | 408 (8.3%) | 30.0 |
| High School Diploma | 1,031 (20.9%) | 51.0 |
| College or Associate's Degree | 1,550 (31.5%) | 52.0 |
| Bachelor's Degree | 951 (19.3%) | 47.0 |
| Graduate Degree | 981 (19.9%) | 75.0 |
| Total | 4,921 (100.0%) | 51.0 |
Fertility by Education by Marriage Status in Pulaski County
36.2% of women with births in Pulaski County are unmarried. Women with the educational attainment of graduate degree are most likely to be married with 96.6% of them married at childbirth, while women with the educational attainment of less than high school are least likely to be married with 77.2% of them unmarried at childbirth.
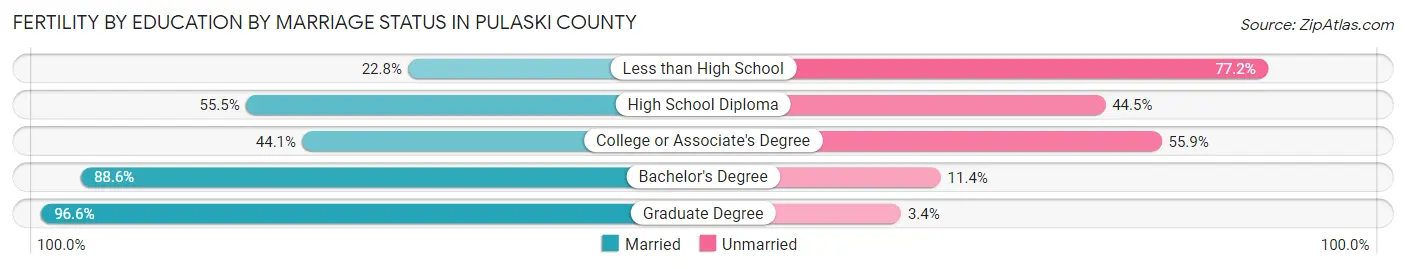
| Educational Attainment | Married | Unmarried |
| Less than High School | 93 (22.8%) | 315 (77.2%) |
| High School Diploma | 572 (55.5%) | 459 (44.5%) |
| College or Associate's Degree | 684 (44.1%) | 866 (55.9%) |
| Bachelor's Degree | 843 (88.6%) | 108 (11.4%) |
| Graduate Degree | 948 (96.6%) | 33 (3.4%) |
| Total | 3,140 (63.8%) | 1,781 (36.2%) |
Employment Characteristics in Pulaski County
Employment by Class of Employer in Pulaski County
Among the 186,769 employed individuals in Pulaski County, private company employees (114,712 | 61.4%), state government employees (18,480 | 9.9%), and not-for-profit organizations (17,280 | 9.2%) make up the most common classes of employment.
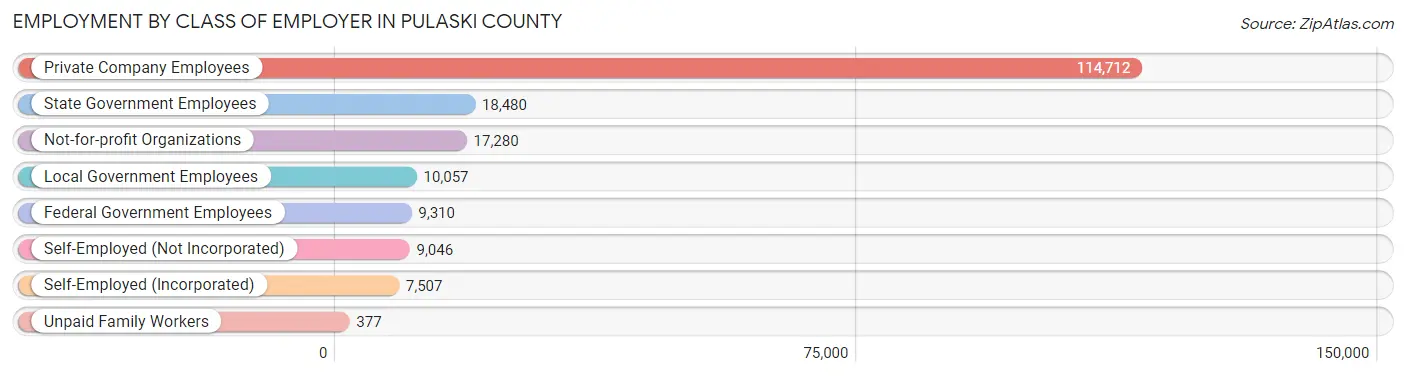
| Employer Class | # Employees | % Employees |
| Private Company Employees | 114,712 | 61.4% |
| Self-Employed (Incorporated) | 7,507 | 4.0% |
| Self-Employed (Not Incorporated) | 9,046 | 4.8% |
| Not-for-profit Organizations | 17,280 | 9.2% |
| Local Government Employees | 10,057 | 5.4% |
| State Government Employees | 18,480 | 9.9% |
| Federal Government Employees | 9,310 | 5.0% |
| Unpaid Family Workers | 377 | 0.2% |
| Total | 186,769 | 100.0% |
Employment Status by Age in Pulaski County
According to the labor force statistics for Pulaski County, out of the total population over 16 years of age (316,156), 63.1% or 199,494 individuals are in the labor force, with 5.2% or 10,374 of them unemployed. The age group with the highest labor force participation rate is 25 to 29 years, with 84.0% or 24,478 individuals in the labor force. Within the labor force, the 16 to 19 years age range has the highest percentage of unemployed individuals, with 13.0% or 791 of them being unemployed.
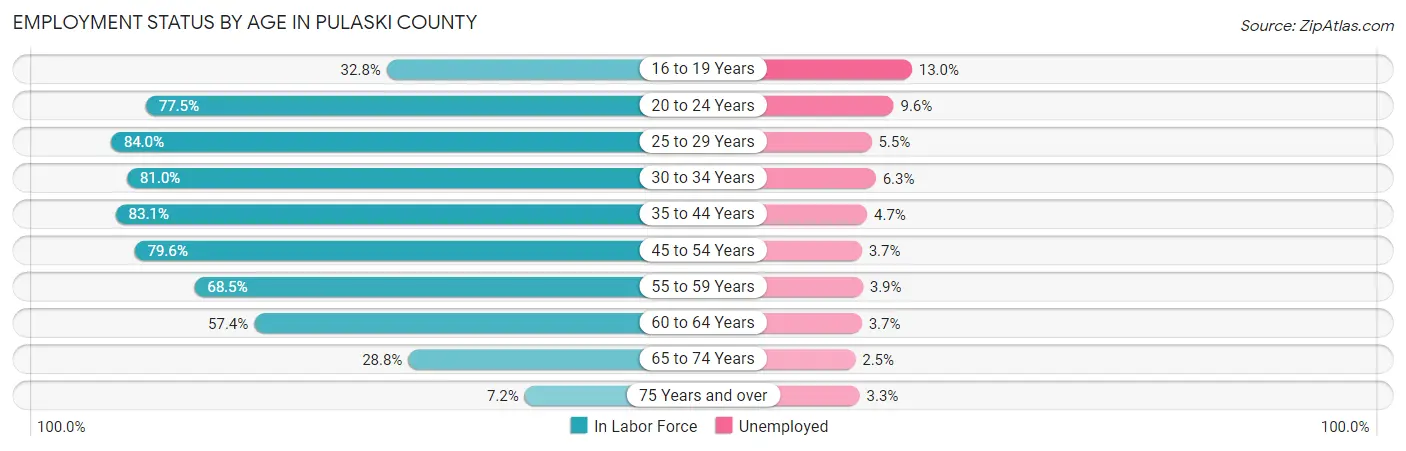
| Age Bracket | In Labor Force | Unemployed |
| 16 to 19 Years | 6,085 (32.8%) | 791 (13.0%) |
| 20 to 24 Years | 20,717 (77.5%) | 1,989 (9.6%) |
| 25 to 29 Years | 24,478 (84.0%) | 1,346 (5.5%) |
| 30 to 34 Years | 22,917 (81.0%) | 1,444 (6.3%) |
| 35 to 44 Years | 42,849 (83.1%) | 2,014 (4.7%) |
| 45 to 54 Years | 37,515 (79.6%) | 1,388 (3.7%) |
| 55 to 59 Years | 17,476 (68.5%) | 682 (3.9%) |
| 60 to 64 Years | 14,263 (57.4%) | 528 (3.7%) |
| 65 to 74 Years | 11,339 (28.8%) | 283 (2.5%) |
| 75 Years and over | 1,801 (7.2%) | 59 (3.3%) |
| Total | 199,494 (63.1%) | 10,374 (5.2%) |
Employment Status by Educational Attainment in Pulaski County
According to labor force statistics for Pulaski County, 77.3% of individuals (159,614) out of the total population between 25 and 64 years of age (206,487) are in the labor force, with 4.6% or 7,342 of them being unemployed. The group with the highest labor force participation rate are those with the educational attainment of bachelor's degree or higher, with 86.9% or 66,982 individuals in the labor force. Within the labor force, individuals with less than high school education have the highest percentage of unemployment, with 12.4% or 983 of them being unemployed.
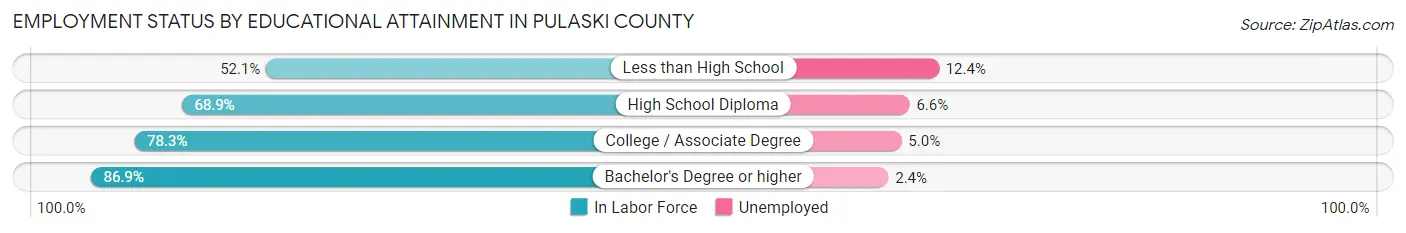
| Educational Attainment | In Labor Force | Unemployed |
| Less than High School | 7,928 (52.1%) | 1,887 (12.4%) |
| High School Diploma | 35,059 (68.9%) | 3,358 (6.6%) |
| College / Associate Degree | 49,569 (78.3%) | 3,165 (5.0%) |
| Bachelor's Degree or higher | 66,982 (86.9%) | 1,850 (2.4%) |
| Total | 159,614 (77.3%) | 9,498 (4.6%) |
Employment Occupations by Sex in Pulaski County
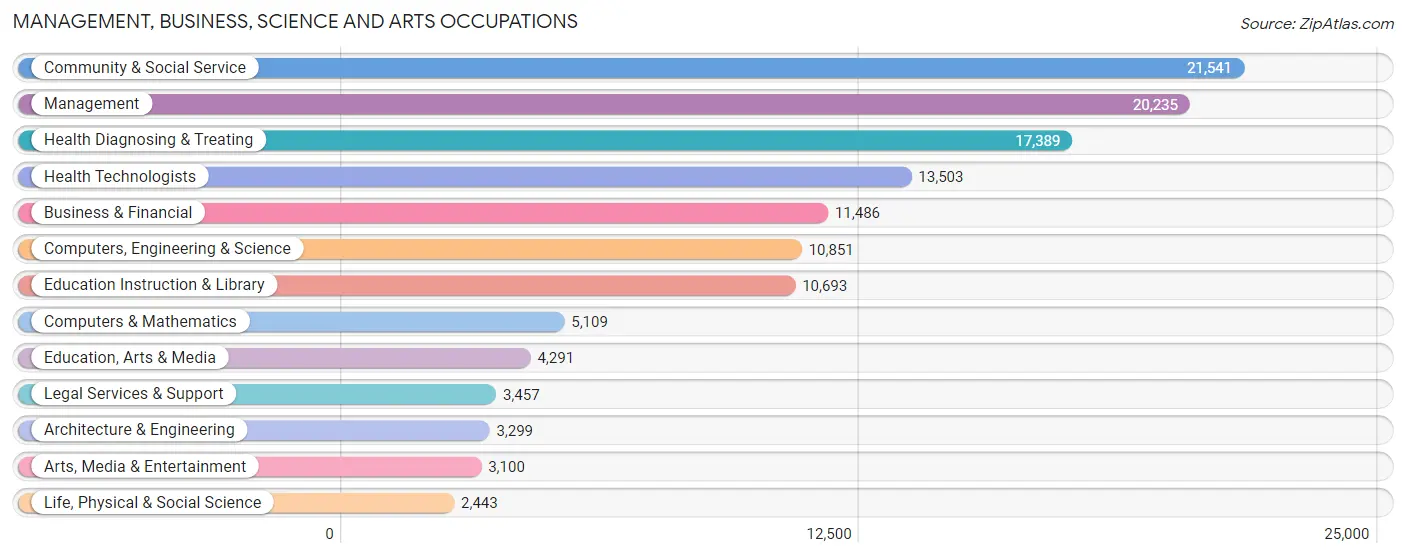
Management, Business, Science and Arts Occupations
The most common Management, Business, Science and Arts occupations in Pulaski County are Community & Social Service (21,541 | 11.5%), Management (20,235 | 10.8%), Health Diagnosing & Treating (17,389 | 9.3%), Health Technologists (13,503 | 7.2%), and Business & Financial (11,486 | 6.1%).
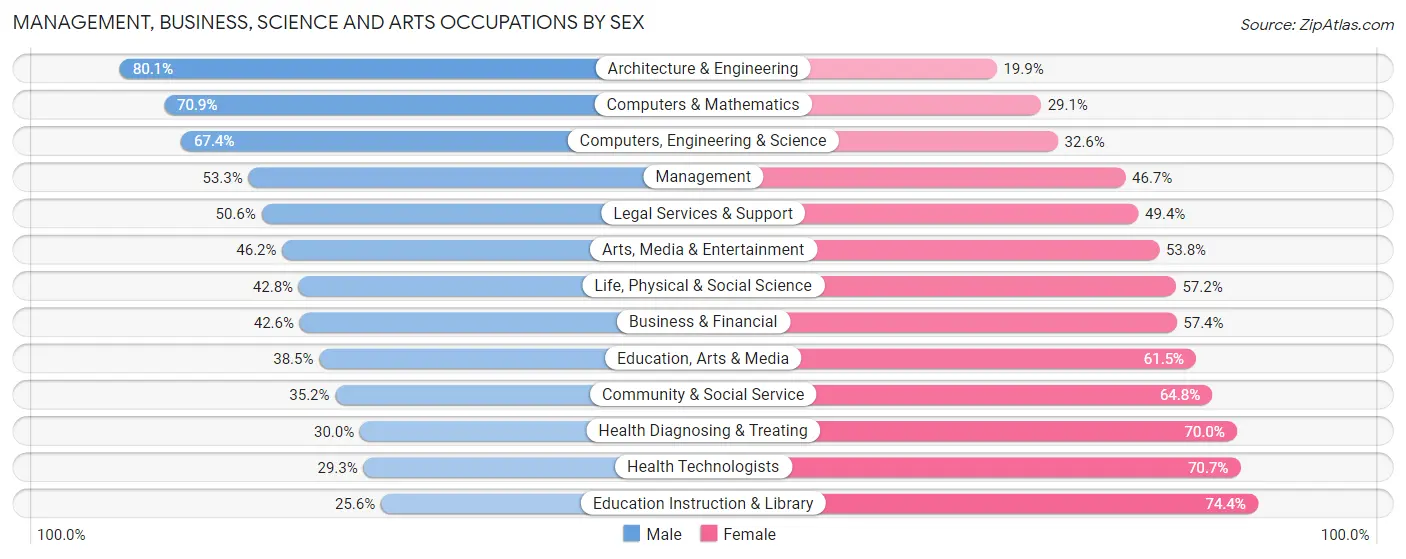
Management, Business, Science and Arts Occupations by Sex
Within the Management, Business, Science and Arts occupations in Pulaski County, the most male-oriented occupations are Architecture & Engineering (80.1%), Computers & Mathematics (70.9%), and Computers, Engineering & Science (67.4%), while the most female-oriented occupations are Education Instruction & Library (74.4%), Health Technologists (70.7%), and Health Diagnosing & Treating (70.0%).
| Occupation | Male | Female |
| Management | 10,782 (53.3%) | 9,453 (46.7%) |
| Business & Financial | 4,892 (42.6%) | 6,594 (57.4%) |
| Computers, Engineering & Science | 7,310 (67.4%) | 3,541 (32.6%) |
| Computers & Mathematics | 3,622 (70.9%) | 1,487 (29.1%) |
| Architecture & Engineering | 2,643 (80.1%) | 656 (19.9%) |
| Life, Physical & Social Science | 1,045 (42.8%) | 1,398 (57.2%) |
| Community & Social Service | 7,576 (35.2%) | 13,965 (64.8%) |
| Education, Arts & Media | 1,653 (38.5%) | 2,638 (61.5%) |
| Legal Services & Support | 1,748 (50.6%) | 1,709 (49.4%) |
| Education Instruction & Library | 2,742 (25.6%) | 7,951 (74.4%) |
| Arts, Media & Entertainment | 1,433 (46.2%) | 1,667 (53.8%) |
| Health Diagnosing & Treating | 5,220 (30.0%) | 12,169 (70.0%) |
| Health Technologists | 3,955 (29.3%) | 9,548 (70.7%) |
| Total (Category) | 35,780 (43.9%) | 45,722 (56.1%) |
| Total (Overall) | 92,231 (49.4%) | 94,390 (50.6%) |
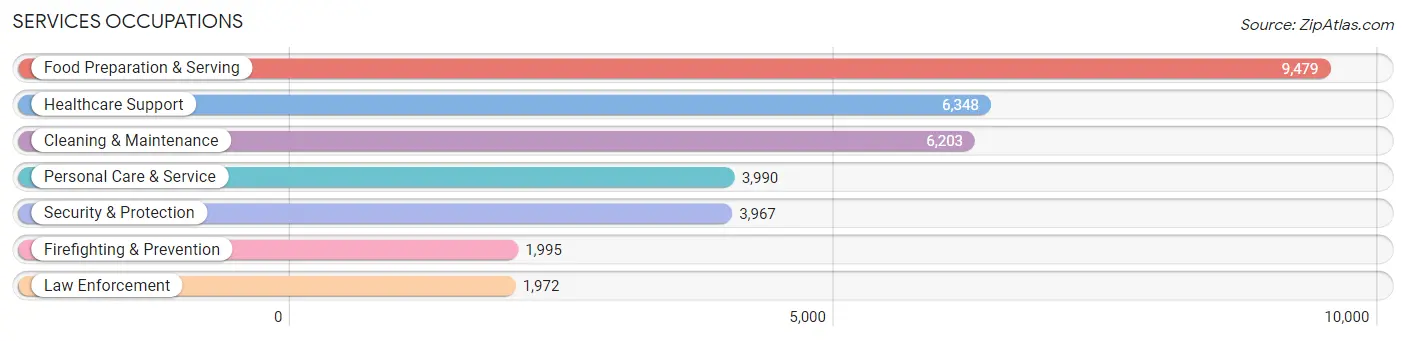
Services Occupations
The most common Services occupations in Pulaski County are Food Preparation & Serving (9,479 | 5.1%), Healthcare Support (6,348 | 3.4%), Cleaning & Maintenance (6,203 | 3.3%), Personal Care & Service (3,990 | 2.1%), and Security & Protection (3,967 | 2.1%).
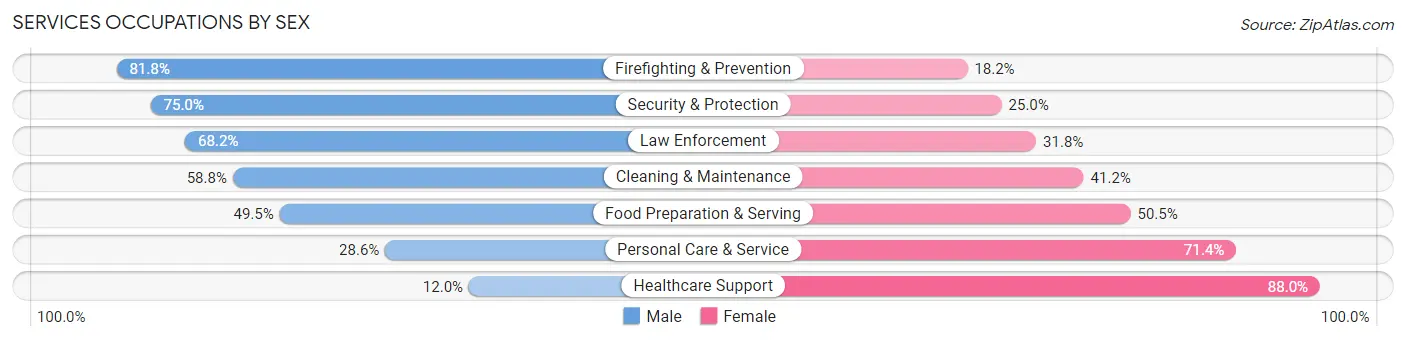
Services Occupations by Sex
Within the Services occupations in Pulaski County, the most male-oriented occupations are Firefighting & Prevention (81.8%), Security & Protection (75.0%), and Law Enforcement (68.2%), while the most female-oriented occupations are Healthcare Support (88.0%), Personal Care & Service (71.4%), and Food Preparation & Serving (50.5%).
| Occupation | Male | Female |
| Healthcare Support | 763 (12.0%) | 5,585 (88.0%) |
| Security & Protection | 2,977 (75.0%) | 990 (25.0%) |
| Firefighting & Prevention | 1,632 (81.8%) | 363 (18.2%) |
| Law Enforcement | 1,345 (68.2%) | 627 (31.8%) |
| Food Preparation & Serving | 4,693 (49.5%) | 4,786 (50.5%) |
| Cleaning & Maintenance | 3,647 (58.8%) | 2,556 (41.2%) |
| Personal Care & Service | 1,141 (28.6%) | 2,849 (71.4%) |
| Total (Category) | 13,221 (44.1%) | 16,766 (55.9%) |
| Total (Overall) | 92,231 (49.4%) | 94,390 (50.6%) |
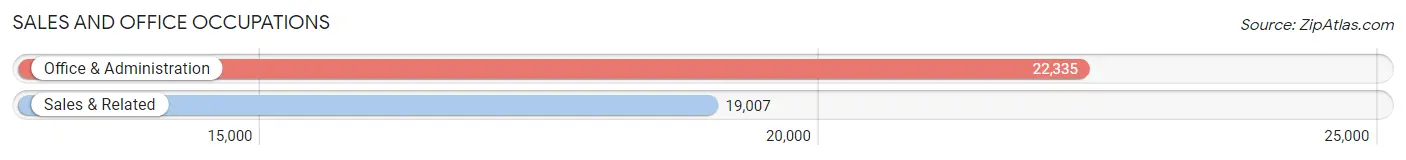
Sales and Office Occupations
The most common Sales and Office occupations in Pulaski County are Office & Administration (22,335 | 12.0%), and Sales & Related (19,007 | 10.2%).
Sales and Office Occupations by Sex
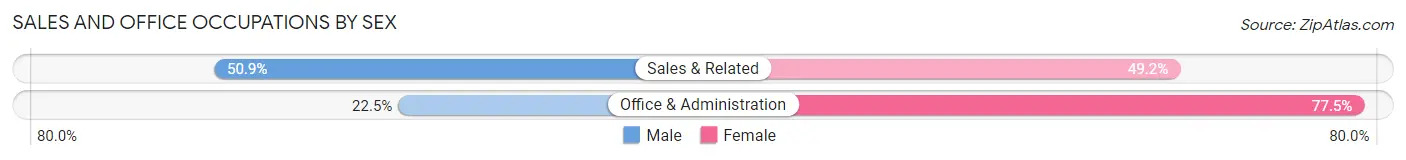
| Occupation | Male | Female |
| Sales & Related | 9,665 (50.8%) | 9,342 (49.1%) |
| Office & Administration | 5,031 (22.5%) | 17,304 (77.5%) |
| Total (Category) | 14,696 (35.5%) | 26,646 (64.4%) |
| Total (Overall) | 92,231 (49.4%) | 94,390 (50.6%) |
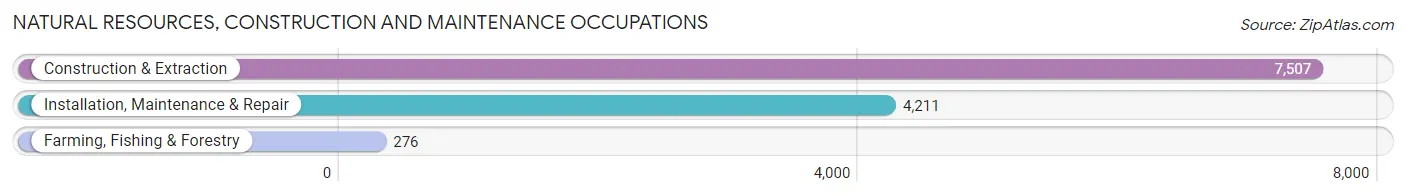
Natural Resources, Construction and Maintenance Occupations
The most common Natural Resources, Construction and Maintenance occupations in Pulaski County are Construction & Extraction (7,507 | 4.0%), Installation, Maintenance & Repair (4,211 | 2.3%), and Farming, Fishing & Forestry (276 | 0.2%).
Natural Resources, Construction and Maintenance Occupations by Sex
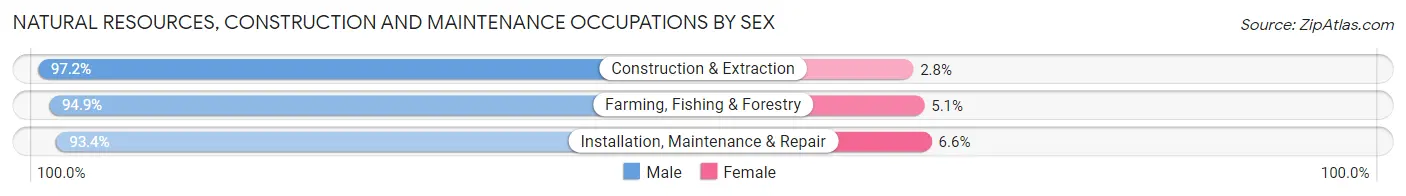
| Occupation | Male | Female |
| Farming, Fishing & Forestry | 262 (94.9%) | 14 (5.1%) |
| Construction & Extraction | 7,300 (97.2%) | 207 (2.8%) |
| Installation, Maintenance & Repair | 3,933 (93.4%) | 278 (6.6%) |
| Total (Category) | 11,495 (95.8%) | 499 (4.2%) |
| Total (Overall) | 92,231 (49.4%) | 94,390 (50.6%) |
Production, Transportation and Moving Occupations
The most common Production, Transportation and Moving occupations in Pulaski County are Production (8,035 | 4.3%), Material Moving (6,966 | 3.7%), and Transportation (6,795 | 3.6%).
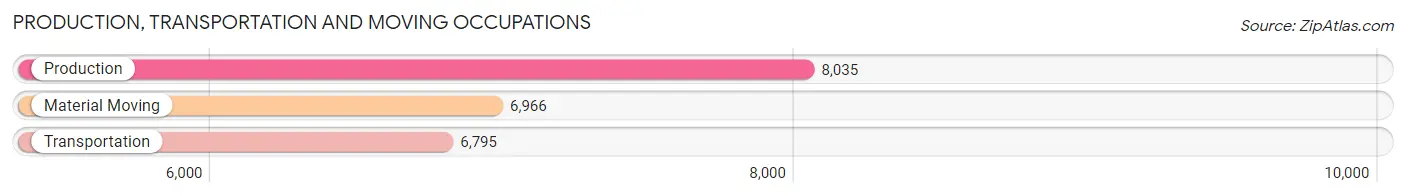
Production, Transportation and Moving Occupations by Sex
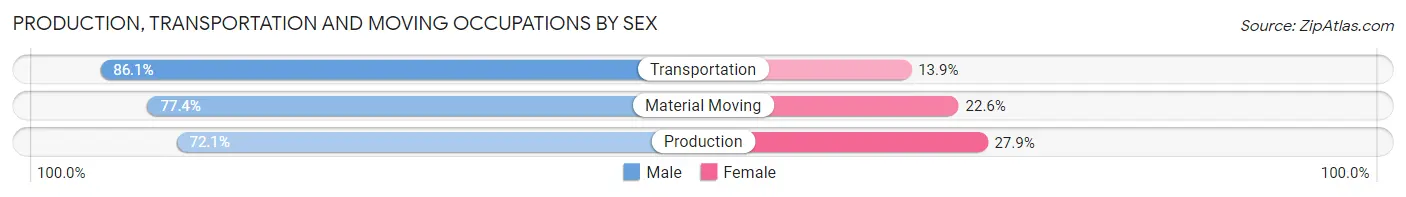
| Occupation | Male | Female |
| Production | 5,795 (72.1%) | 2,240 (27.9%) |
| Transportation | 5,851 (86.1%) | 944 (13.9%) |
| Material Moving | 5,393 (77.4%) | 1,573 (22.6%) |
| Total (Category) | 17,039 (78.2%) | 4,757 (21.8%) |
| Total (Overall) | 92,231 (49.4%) | 94,390 (50.6%) |
Employment Industries by Sex in Pulaski County
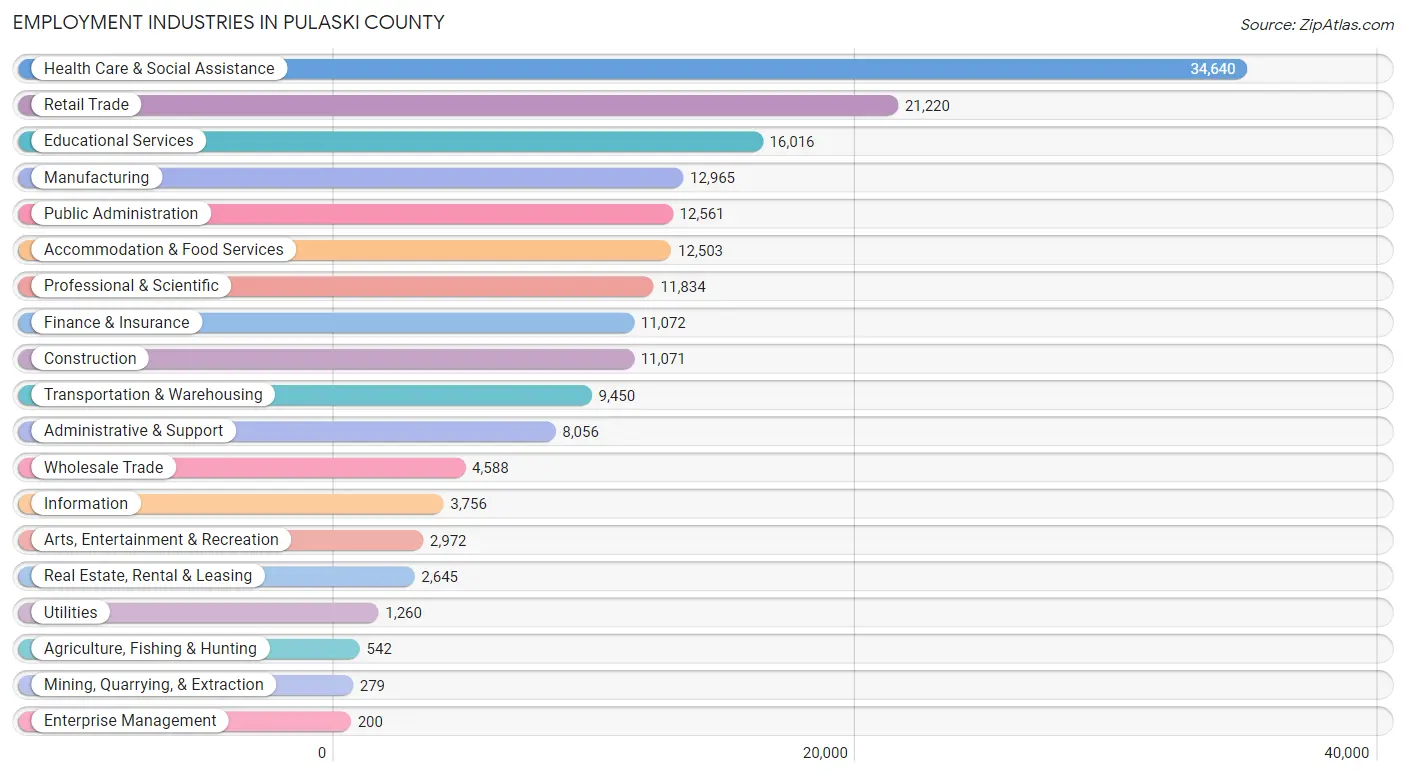
Employment Industries in Pulaski County
The major employment industries in Pulaski County include Health Care & Social Assistance (34,640 | 18.6%), Retail Trade (21,220 | 11.4%), Educational Services (16,016 | 8.6%), Manufacturing (12,965 | 7.0%), and Public Administration (12,561 | 6.7%).
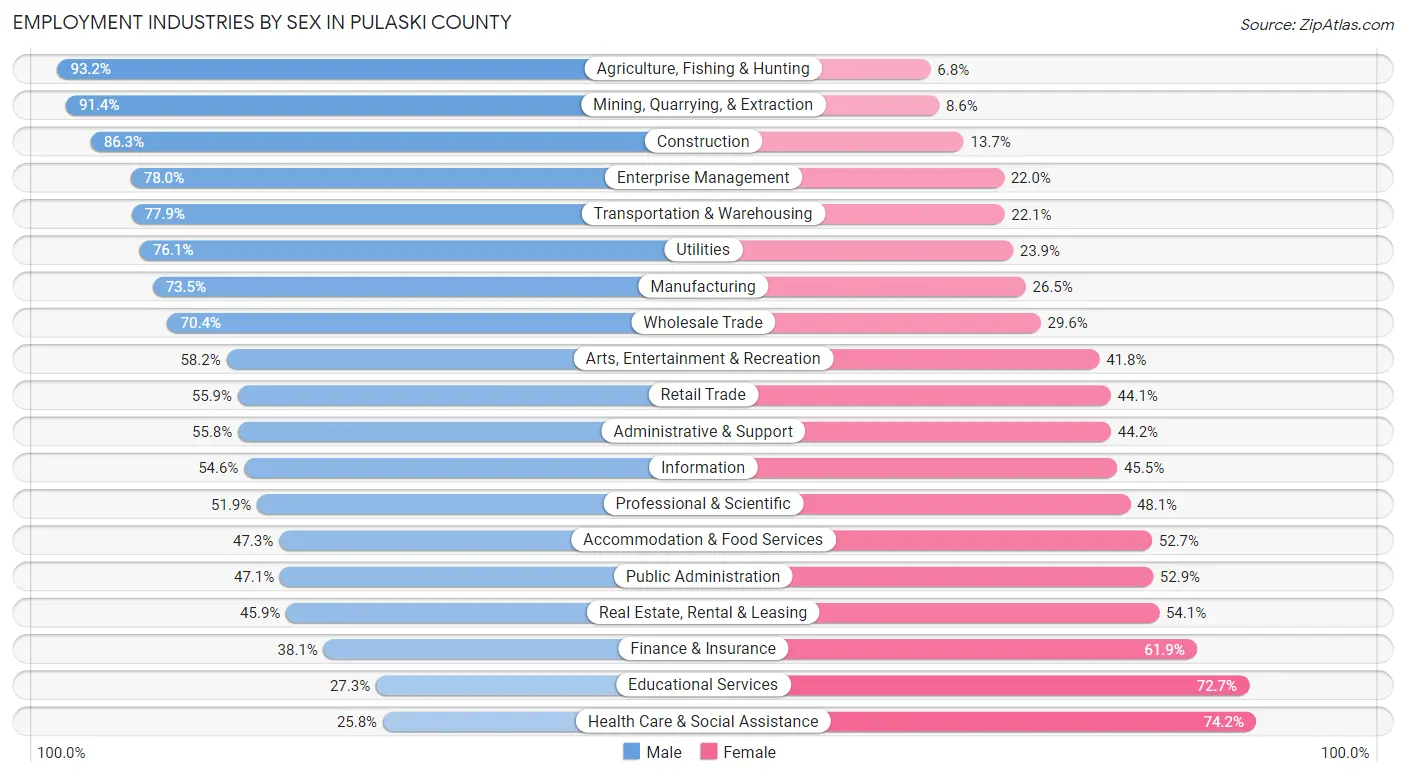
Employment Industries by Sex in Pulaski County
The Pulaski County industries that see more men than women are Agriculture, Fishing & Hunting (93.2%), Mining, Quarrying, & Extraction (91.4%), and Construction (86.3%), whereas the industries that tend to have a higher number of women are Health Care & Social Assistance (74.2%), Educational Services (72.7%), and Finance & Insurance (61.9%).
| Industry | Male | Female |
| Agriculture, Fishing & Hunting | 505 (93.2%) | 37 (6.8%) |
| Mining, Quarrying, & Extraction | 255 (91.4%) | 24 (8.6%) |
| Construction | 9,553 (86.3%) | 1,518 (13.7%) |
| Manufacturing | 9,525 (73.5%) | 3,440 (26.5%) |
| Wholesale Trade | 3,229 (70.4%) | 1,359 (29.6%) |
| Retail Trade | 11,854 (55.9%) | 9,366 (44.1%) |
| Transportation & Warehousing | 7,359 (77.9%) | 2,091 (22.1%) |
| Utilities | 959 (76.1%) | 301 (23.9%) |
| Information | 2,049 (54.5%) | 1,707 (45.5%) |
| Finance & Insurance | 4,219 (38.1%) | 6,853 (61.9%) |
| Real Estate, Rental & Leasing | 1,213 (45.9%) | 1,432 (54.1%) |
| Professional & Scientific | 6,138 (51.9%) | 5,696 (48.1%) |
| Enterprise Management | 156 (78.0%) | 44 (22.0%) |
| Administrative & Support | 4,496 (55.8%) | 3,560 (44.2%) |
| Educational Services | 4,368 (27.3%) | 11,648 (72.7%) |
| Health Care & Social Assistance | 8,947 (25.8%) | 25,693 (74.2%) |
| Arts, Entertainment & Recreation | 1,730 (58.2%) | 1,242 (41.8%) |
| Accommodation & Food Services | 5,918 (47.3%) | 6,585 (52.7%) |
| Public Administration | 5,919 (47.1%) | 6,642 (52.9%) |
| Total | 92,231 (49.4%) | 94,390 (50.6%) |
Education in Pulaski County
School Enrollment in Pulaski County
The most common levels of schooling among the 93,777 students in Pulaski County are elementary school (19,695 | 21.0%), middle school (19,690 | 21.0%), and high school (19,511 | 20.8%).
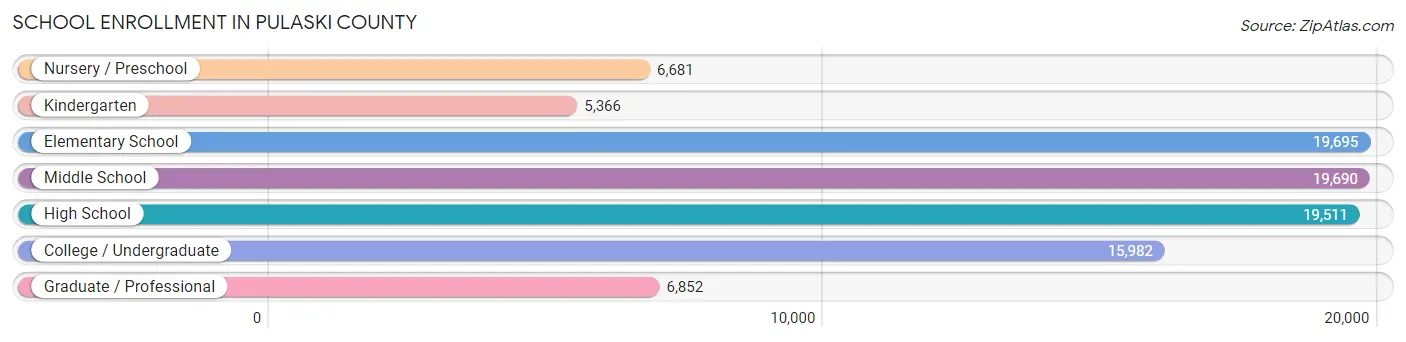
| School Level | # Students | % Students |
| Nursery / Preschool | 6,681 | 7.1% |
| Kindergarten | 5,366 | 5.7% |
| Elementary School | 19,695 | 21.0% |
| Middle School | 19,690 | 21.0% |
| High School | 19,511 | 20.8% |
| College / Undergraduate | 15,982 | 17.0% |
| Graduate / Professional | 6,852 | 7.3% |
| Total | 93,777 | 100.0% |
School Enrollment by Age by Funding Source in Pulaski County
Out of a total of 93,777 students who are enrolled in schools in Pulaski County, 17,724 (18.9%) attend a private institution, while the remaining 76,053 (81.1%) are enrolled in public schools. The age group of 3 to 4 year olds has the highest likelihood of being enrolled in private schools, with 1,724 (30.3% in the age bracket) enrolled. Conversely, the age group of 5 to 9 year old has the lowest likelihood of being enrolled in a private school, with 19,595 (84.6% in the age bracket) attending a public institution.
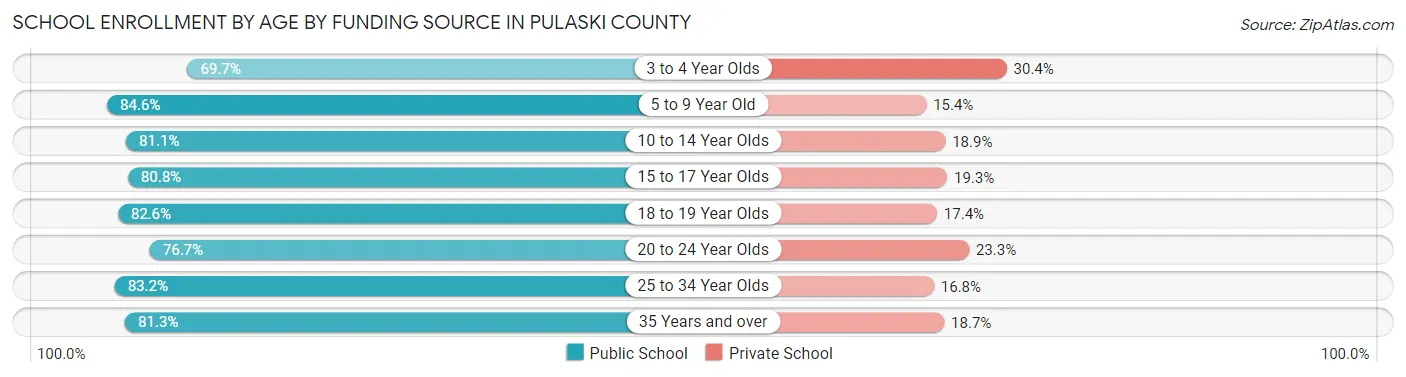
| Age Bracket | Public School | Private School |
| 3 to 4 Year Olds | 3,956 (69.7%) | 1,724 (30.3%) |
| 5 to 9 Year Old | 19,595 (84.6%) | 3,559 (15.4%) |
| 10 to 14 Year Olds | 19,832 (81.1%) | 4,629 (18.9%) |
| 15 to 17 Year Olds | 11,474 (80.7%) | 2,736 (19.3%) |
| 18 to 19 Year Olds | 4,582 (82.6%) | 963 (17.4%) |
| 20 to 24 Year Olds | 6,224 (76.7%) | 1,895 (23.3%) |
| 25 to 34 Year Olds | 5,774 (83.2%) | 1,166 (16.8%) |
| 35 Years and over | 4,607 (81.3%) | 1,061 (18.7%) |
| Total | 76,053 (81.1%) | 17,724 (18.9%) |
Educational Attainment by Field of Study in Pulaski County
Business (22,201 | 20.5%), education (12,326 | 11.4%), science & technology (12,217 | 11.3%), bio, nature & agricultural (9,201 | 8.5%), and arts & humanities (7,027 | 6.5%) are the most common fields of study among 108,182 individuals in Pulaski County who have obtained a bachelor's degree or higher.
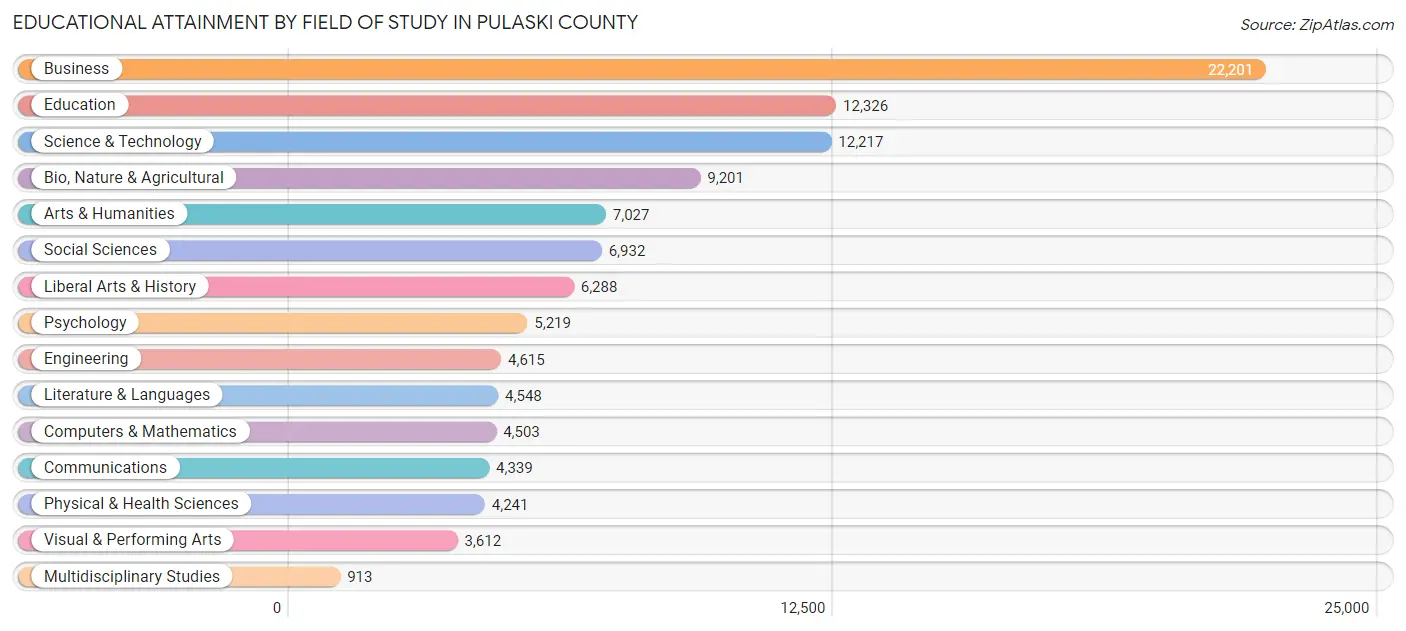
| Field of Study | # Graduates | % Graduates |
| Computers & Mathematics | 4,503 | 4.2% |
| Bio, Nature & Agricultural | 9,201 | 8.5% |
| Physical & Health Sciences | 4,241 | 3.9% |
| Psychology | 5,219 | 4.8% |
| Social Sciences | 6,932 | 6.4% |
| Engineering | 4,615 | 4.3% |
| Multidisciplinary Studies | 913 | 0.8% |
| Science & Technology | 12,217 | 11.3% |
| Business | 22,201 | 20.5% |
| Education | 12,326 | 11.4% |
| Literature & Languages | 4,548 | 4.2% |
| Liberal Arts & History | 6,288 | 5.8% |
| Visual & Performing Arts | 3,612 | 3.3% |
| Communications | 4,339 | 4.0% |
| Arts & Humanities | 7,027 | 6.5% |
| Total | 108,182 | 100.0% |
Transportation & Commute in Pulaski County
Vehicle Availability by Sex in Pulaski County
The most prevalent vehicle ownership categories in Pulaski County are males with 2 vehicles (42,355, accounting for 45.9%) and females with 2 vehicles (37,457, making up 45.6%).
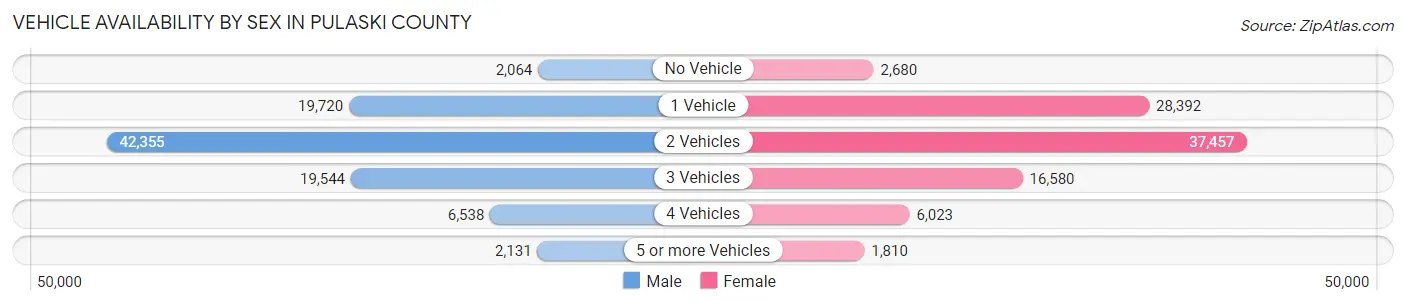
| Vehicles Available | Male | Female |
| No Vehicle | 2,064 (2.2%) | 2,680 (2.9%) |
| 1 Vehicle | 19,720 (21.3%) | 28,392 (30.5%) |
| 2 Vehicles | 42,355 (45.9%) | 37,457 (40.3%) |
| 3 Vehicles | 19,544 (21.2%) | 16,580 (17.8%) |
| 4 Vehicles | 6,538 (7.1%) | 6,023 (6.5%) |
| 5 or more Vehicles | 2,131 (2.3%) | 1,810 (1.9%) |
| Total | 92,352 (100.0%) | 92,942 (100.0%) |
Commute Time in Pulaski County
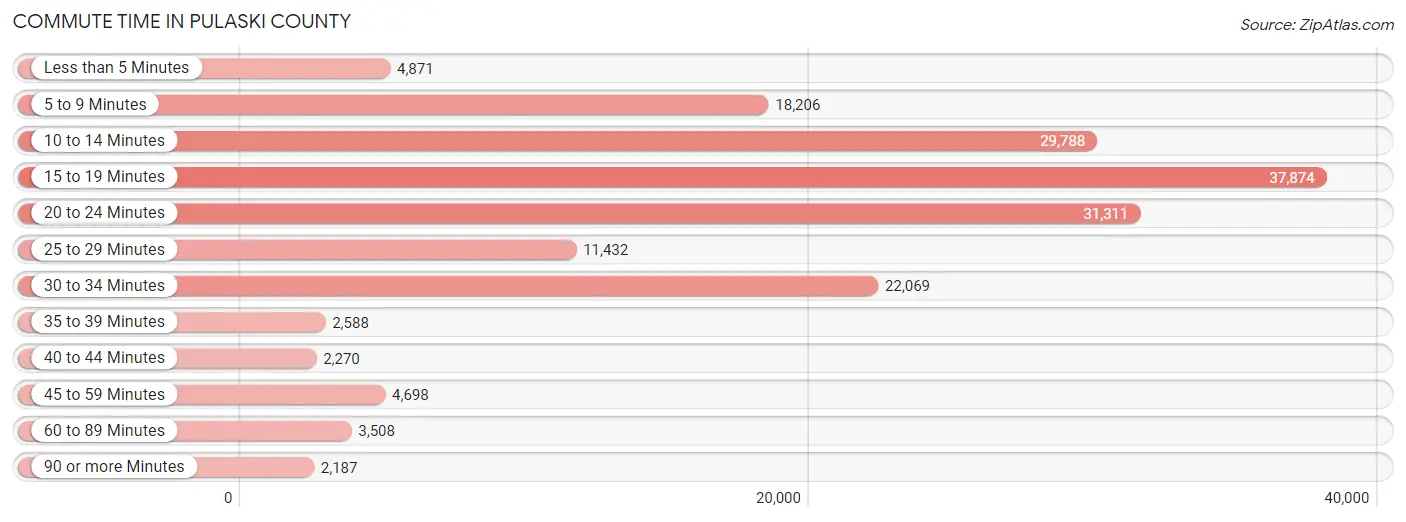
The most frequently occuring commute durations in Pulaski County are 15 to 19 minutes (37,874 commuters, 22.2%), 20 to 24 minutes (31,311 commuters, 18.3%), and 10 to 14 minutes (29,788 commuters, 17.4%).
| Commute Time | # Commuters | % Commuters |
| Less than 5 Minutes | 4,871 | 2.9% |
| 5 to 9 Minutes | 18,206 | 10.7% |
| 10 to 14 Minutes | 29,788 | 17.4% |
| 15 to 19 Minutes | 37,874 | 22.2% |
| 20 to 24 Minutes | 31,311 | 18.3% |
| 25 to 29 Minutes | 11,432 | 6.7% |
| 30 to 34 Minutes | 22,069 | 12.9% |
| 35 to 39 Minutes | 2,588 | 1.5% |
| 40 to 44 Minutes | 2,270 | 1.3% |
| 45 to 59 Minutes | 4,698 | 2.8% |
| 60 to 89 Minutes | 3,508 | 2.1% |
| 90 or more Minutes | 2,187 | 1.3% |
Commute Time by Sex in Pulaski County
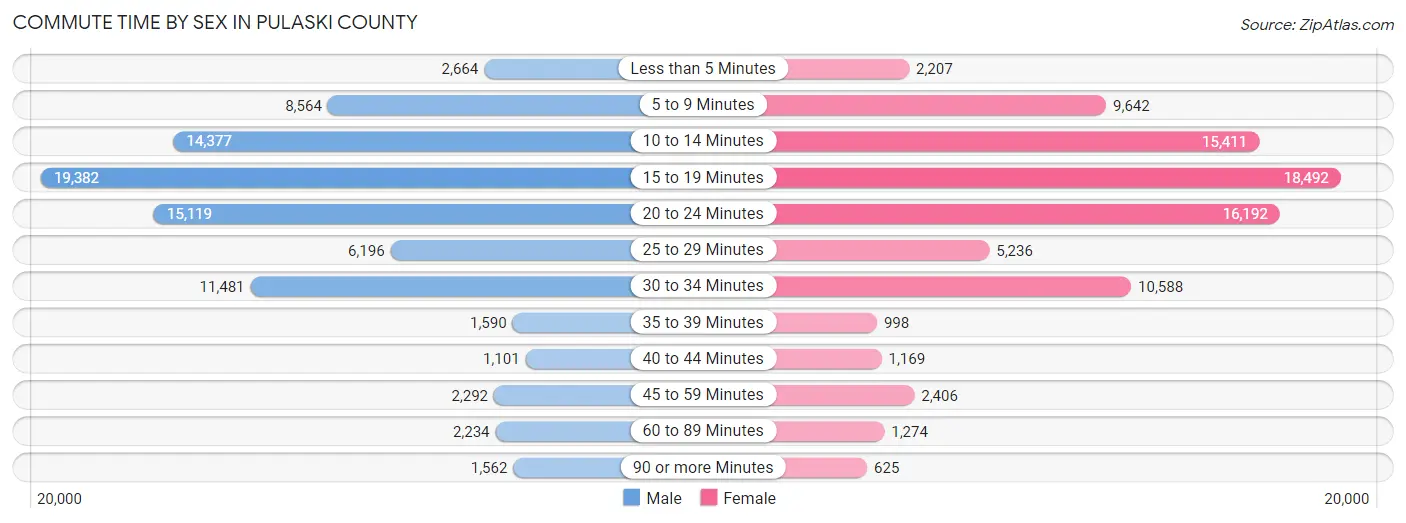
The most common commute times in Pulaski County are 15 to 19 minutes (19,382 commuters, 22.4%) for males and 15 to 19 minutes (18,492 commuters, 22.0%) for females.
| Commute Time | Male | Female |
| Less than 5 Minutes | 2,664 (3.1%) | 2,207 (2.6%) |
| 5 to 9 Minutes | 8,564 (9.9%) | 9,642 (11.5%) |
| 10 to 14 Minutes | 14,377 (16.6%) | 15,411 (18.3%) |
| 15 to 19 Minutes | 19,382 (22.4%) | 18,492 (22.0%) |
| 20 to 24 Minutes | 15,119 (17.5%) | 16,192 (19.2%) |
| 25 to 29 Minutes | 6,196 (7.2%) | 5,236 (6.2%) |
| 30 to 34 Minutes | 11,481 (13.3%) | 10,588 (12.6%) |
| 35 to 39 Minutes | 1,590 (1.8%) | 998 (1.2%) |
| 40 to 44 Minutes | 1,101 (1.3%) | 1,169 (1.4%) |
| 45 to 59 Minutes | 2,292 (2.6%) | 2,406 (2.9%) |
| 60 to 89 Minutes | 2,234 (2.6%) | 1,274 (1.5%) |
| 90 or more Minutes | 1,562 (1.8%) | 625 (0.7%) |
Time of Departure to Work by Sex in Pulaski County
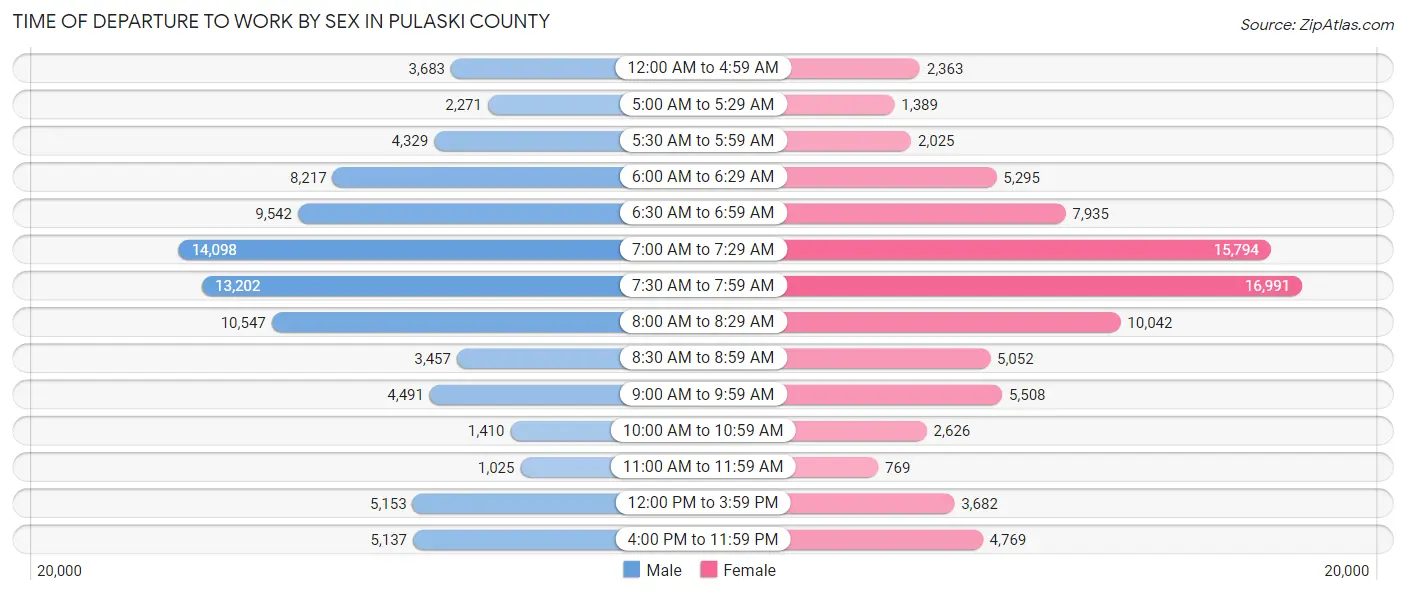
The most frequent times of departure to work in Pulaski County are 7:00 AM to 7:29 AM (14,098, 16.3%) for males and 7:30 AM to 7:59 AM (16,991, 20.2%) for females.
| Time of Departure | Male | Female |
| 12:00 AM to 4:59 AM | 3,683 (4.3%) | 2,363 (2.8%) |
| 5:00 AM to 5:29 AM | 2,271 (2.6%) | 1,389 (1.7%) |
| 5:30 AM to 5:59 AM | 4,329 (5.0%) | 2,025 (2.4%) |
| 6:00 AM to 6:29 AM | 8,217 (9.5%) | 5,295 (6.3%) |
| 6:30 AM to 6:59 AM | 9,542 (11.0%) | 7,935 (9.4%) |
| 7:00 AM to 7:29 AM | 14,098 (16.3%) | 15,794 (18.8%) |
| 7:30 AM to 7:59 AM | 13,202 (15.2%) | 16,991 (20.2%) |
| 8:00 AM to 8:29 AM | 10,547 (12.2%) | 10,042 (11.9%) |
| 8:30 AM to 8:59 AM | 3,457 (4.0%) | 5,052 (6.0%) |
| 9:00 AM to 9:59 AM | 4,491 (5.2%) | 5,508 (6.5%) |
| 10:00 AM to 10:59 AM | 1,410 (1.6%) | 2,626 (3.1%) |
| 11:00 AM to 11:59 AM | 1,025 (1.2%) | 769 (0.9%) |
| 12:00 PM to 3:59 PM | 5,153 (5.9%) | 3,682 (4.4%) |
| 4:00 PM to 11:59 PM | 5,137 (5.9%) | 4,769 (5.7%) |
| Total | 86,562 (100.0%) | 84,240 (100.0%) |
Housing Occupancy in Pulaski County
Occupancy by Ownership in Pulaski County
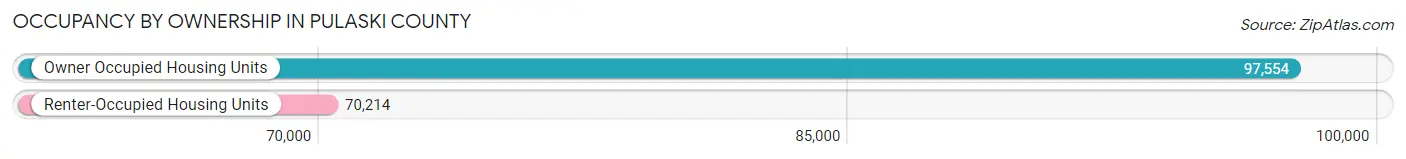
Of the total 167,768 dwellings in Pulaski County, owner-occupied units account for 97,554 (58.2%), while renter-occupied units make up 70,214 (41.8%).
| Occupancy | # Housing Units | % Housing Units |
| Owner Occupied Housing Units | 97,554 | 58.2% |
| Renter-Occupied Housing Units | 70,214 | 41.8% |
| Total Occupied Housing Units | 167,768 | 100.0% |
Occupancy by Household Size in Pulaski County
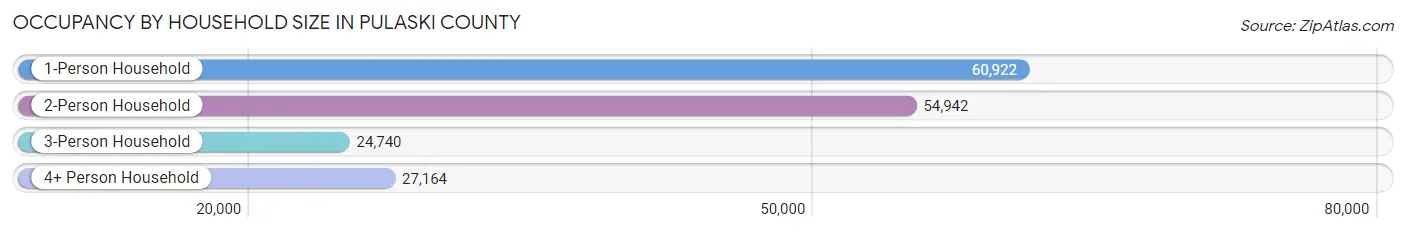
| Household Size | # Housing Units | % Housing Units |
| 1-Person Household | 60,922 | 36.3% |
| 2-Person Household | 54,942 | 32.8% |
| 3-Person Household | 24,740 | 14.7% |
| 4+ Person Household | 27,164 | 16.2% |
| Total Housing Units | 167,768 | 100.0% |
Occupancy by Ownership by Household Size in Pulaski County
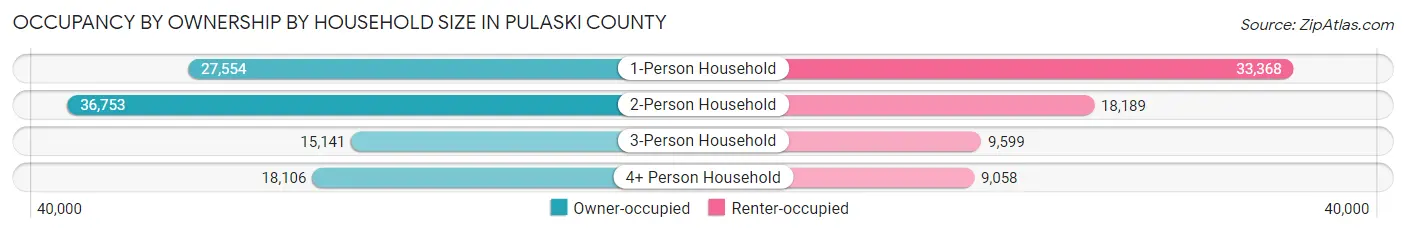
| Household Size | Owner-occupied | Renter-occupied |
| 1-Person Household | 27,554 (45.2%) | 33,368 (54.8%) |
| 2-Person Household | 36,753 (66.9%) | 18,189 (33.1%) |
| 3-Person Household | 15,141 (61.2%) | 9,599 (38.8%) |
| 4+ Person Household | 18,106 (66.6%) | 9,058 (33.4%) |
| Total Housing Units | 97,554 (58.2%) | 70,214 (41.8%) |
Occupancy by Educational Attainment in Pulaski County
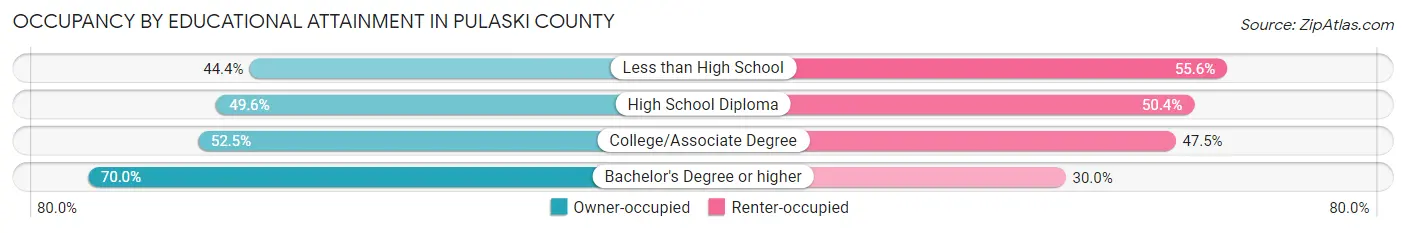
| Household Size | Owner-occupied | Renter-occupied |
| Less than High School | 4,802 (44.4%) | 6,024 (55.6%) |
| High School Diploma | 19,110 (49.6%) | 19,437 (50.4%) |
| College/Associate Degree | 27,700 (52.5%) | 25,027 (47.5%) |
| Bachelor's Degree or higher | 45,942 (70.0%) | 19,726 (30.0%) |
Occupancy by Age of Householder in Pulaski County
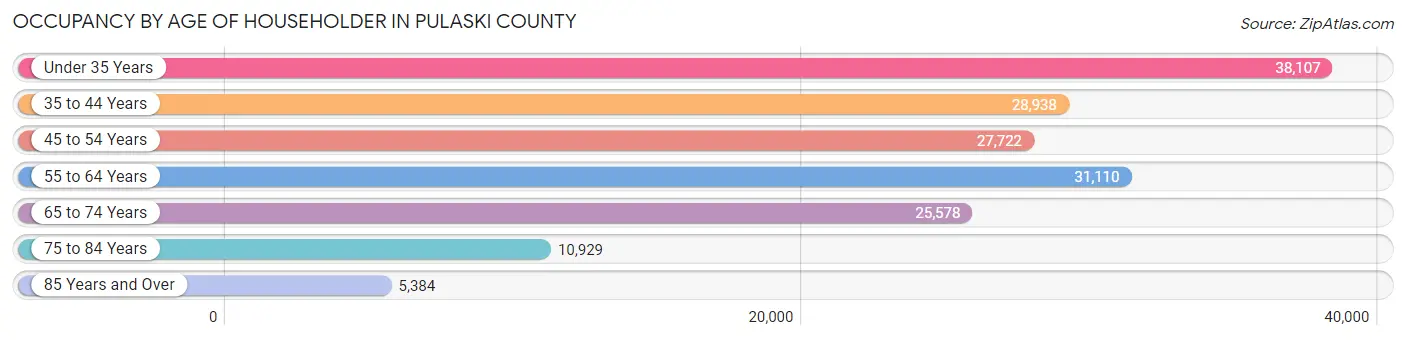
| Age Bracket | # Households | % Households |
| Under 35 Years | 38,107 | 22.7% |
| 35 to 44 Years | 28,938 | 17.2% |
| 45 to 54 Years | 27,722 | 16.5% |
| 55 to 64 Years | 31,110 | 18.5% |
| 65 to 74 Years | 25,578 | 15.2% |
| 75 to 84 Years | 10,929 | 6.5% |
| 85 Years and Over | 5,384 | 3.2% |
| Total | 167,768 | 100.0% |
Housing Finances in Pulaski County
Median Income by Occupancy in Pulaski County
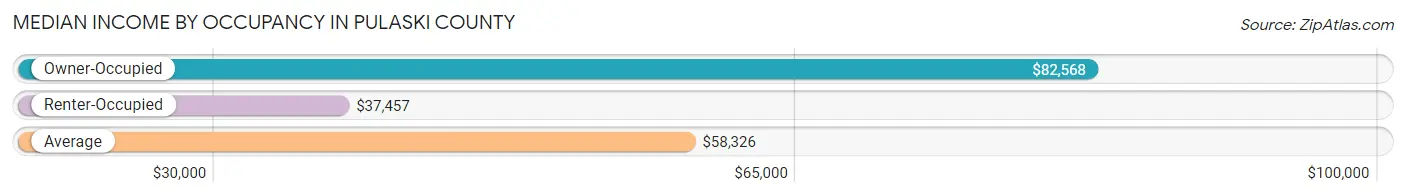
| Occupancy Type | # Households | Median Income |
| Owner-Occupied | 97,554 (58.2%) | $82,568 |
| Renter-Occupied | 70,214 (41.8%) | $37,457 |
| Average | 167,768 (100.0%) | $58,326 |
Occupancy by Householder Income Bracket in Pulaski County
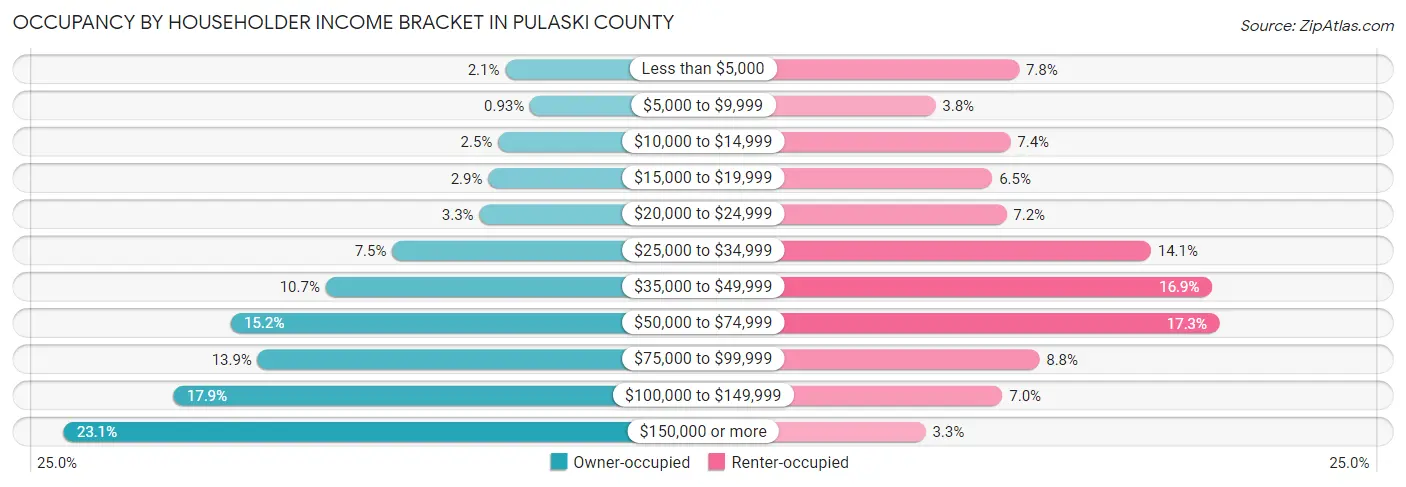
| Income Bracket | Owner-occupied | Renter-occupied |
| Less than $5,000 | 2,063 (2.1%) | 5,461 (7.8%) |
| $5,000 to $9,999 | 910 (0.9%) | 2,667 (3.8%) |
| $10,000 to $14,999 | 2,392 (2.5%) | 5,172 (7.4%) |
| $15,000 to $19,999 | 2,852 (2.9%) | 4,568 (6.5%) |
| $20,000 to $24,999 | 3,257 (3.3%) | 5,044 (7.2%) |
| $25,000 to $34,999 | 7,304 (7.5%) | 9,875 (14.1%) |
| $35,000 to $49,999 | 10,397 (10.7%) | 11,894 (16.9%) |
| $50,000 to $74,999 | 14,802 (15.2%) | 12,144 (17.3%) |
| $75,000 to $99,999 | 13,560 (13.9%) | 6,147 (8.7%) |
| $100,000 to $149,999 | 17,450 (17.9%) | 4,907 (7.0%) |
| $150,000 or more | 22,567 (23.1%) | 2,335 (3.3%) |
| Total | 97,554 (100.0%) | 70,214 (100.0%) |
Monthly Housing Cost Tiers in Pulaski County
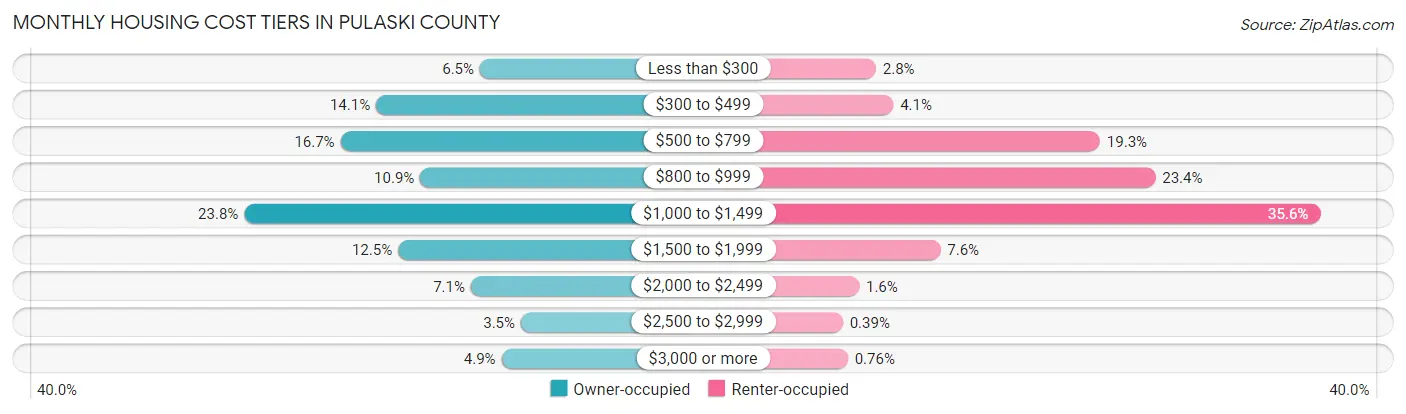
| Monthly Cost | Owner-occupied | Renter-occupied |
| Less than $300 | 6,312 (6.5%) | 1,984 (2.8%) |
| $300 to $499 | 13,776 (14.1%) | 2,887 (4.1%) |
| $500 to $799 | 16,327 (16.7%) | 13,575 (19.3%) |
| $800 to $999 | 10,603 (10.9%) | 16,436 (23.4%) |
| $1,000 to $1,499 | 23,246 (23.8%) | 24,959 (35.5%) |
| $1,500 to $1,999 | 12,194 (12.5%) | 5,319 (7.6%) |
| $2,000 to $2,499 | 6,970 (7.1%) | 1,119 (1.6%) |
| $2,500 to $2,999 | 3,368 (3.5%) | 271 (0.4%) |
| $3,000 or more | 4,758 (4.9%) | 535 (0.8%) |
| Total | 97,554 (100.0%) | 70,214 (100.0%) |
Physical Housing Characteristics in Pulaski County
Housing Structures in Pulaski County
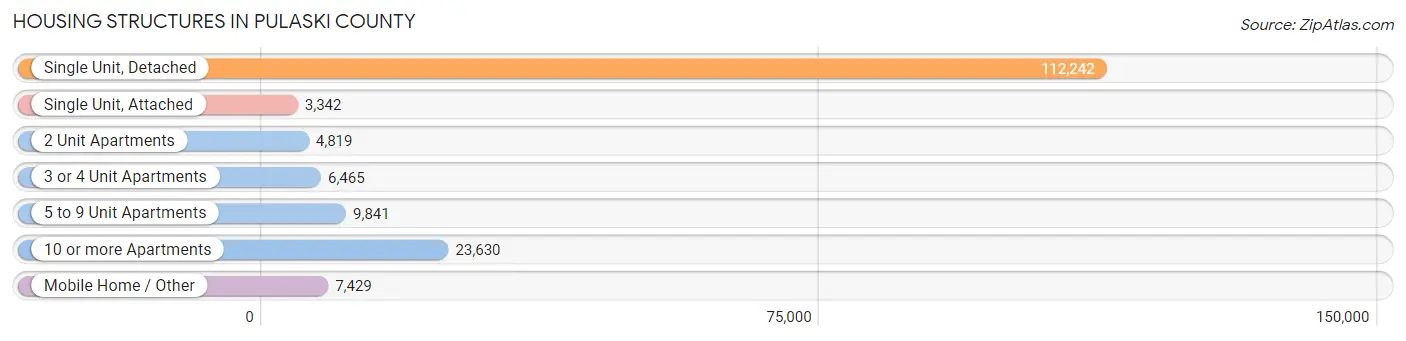
| Structure Type | # Housing Units | % Housing Units |
| Single Unit, Detached | 112,242 | 66.9% |
| Single Unit, Attached | 3,342 | 2.0% |
| 2 Unit Apartments | 4,819 | 2.9% |
| 3 or 4 Unit Apartments | 6,465 | 3.8% |
| 5 to 9 Unit Apartments | 9,841 | 5.9% |
| 10 or more Apartments | 23,630 | 14.1% |
| Mobile Home / Other | 7,429 | 4.4% |
| Total | 167,768 | 100.0% |
Housing Structures by Occupancy in Pulaski County
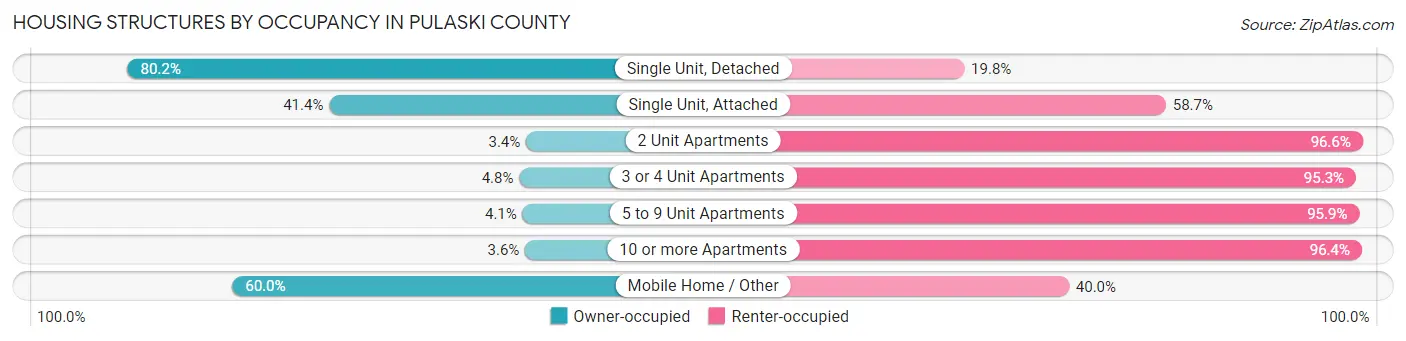
| Structure Type | Owner-occupied | Renter-occupied |
| Single Unit, Detached | 89,982 (80.2%) | 22,260 (19.8%) |
| Single Unit, Attached | 1,382 (41.3%) | 1,960 (58.7%) |
| 2 Unit Apartments | 166 (3.4%) | 4,653 (96.6%) |
| 3 or 4 Unit Apartments | 307 (4.8%) | 6,158 (95.3%) |
| 5 to 9 Unit Apartments | 404 (4.1%) | 9,437 (95.9%) |
| 10 or more Apartments | 855 (3.6%) | 22,775 (96.4%) |
| Mobile Home / Other | 4,458 (60.0%) | 2,971 (40.0%) |
| Total | 97,554 (58.2%) | 70,214 (41.8%) |
Housing Structures by Number of Rooms in Pulaski County
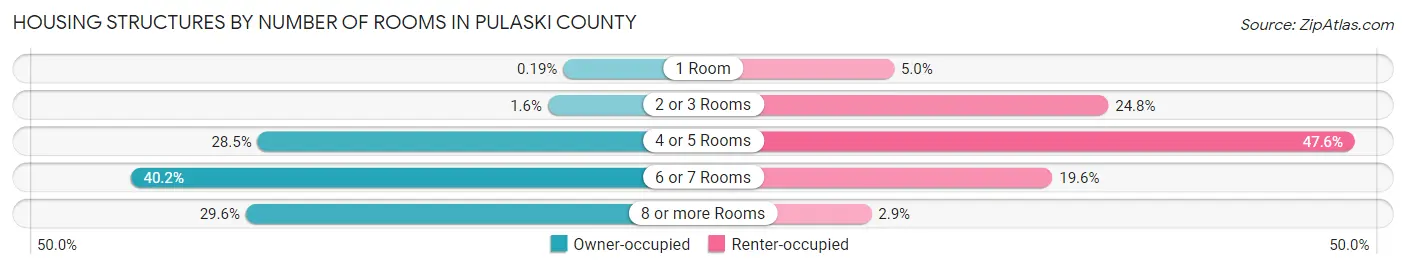
| Number of Rooms | Owner-occupied | Renter-occupied |
| 1 Room | 181 (0.2%) | 3,514 (5.0%) |
| 2 or 3 Rooms | 1,573 (1.6%) | 17,428 (24.8%) |
| 4 or 5 Rooms | 27,760 (28.5%) | 33,438 (47.6%) |
| 6 or 7 Rooms | 39,217 (40.2%) | 13,792 (19.6%) |
| 8 or more Rooms | 28,823 (29.5%) | 2,042 (2.9%) |
| Total | 97,554 (100.0%) | 70,214 (100.0%) |
Housing Structure by Heating Type in Pulaski County
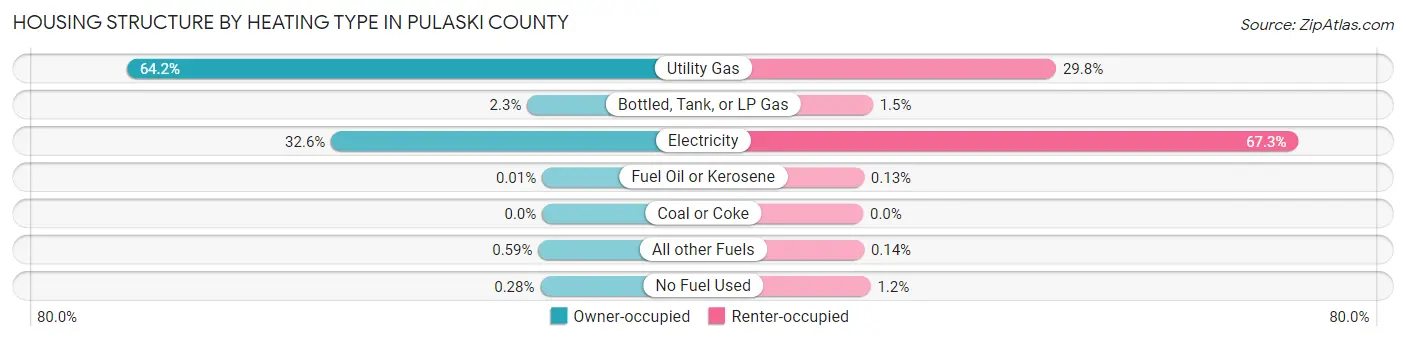
| Heating Type | Owner-occupied | Renter-occupied |
| Utility Gas | 62,642 (64.2%) | 20,943 (29.8%) |
| Bottled, Tank, or LP Gas | 2,245 (2.3%) | 1,044 (1.5%) |
| Electricity | 31,816 (32.6%) | 47,230 (67.3%) |
| Fuel Oil or Kerosene | 7 (0.0%) | 93 (0.1%) |
| Coal or Coke | 0 (0.0%) | 0 (0.0%) |
| All other Fuels | 573 (0.6%) | 95 (0.1%) |
| No Fuel Used | 271 (0.3%) | 809 (1.1%) |
| Total | 97,554 (100.0%) | 70,214 (100.0%) |
Household Vehicle Usage in Pulaski County
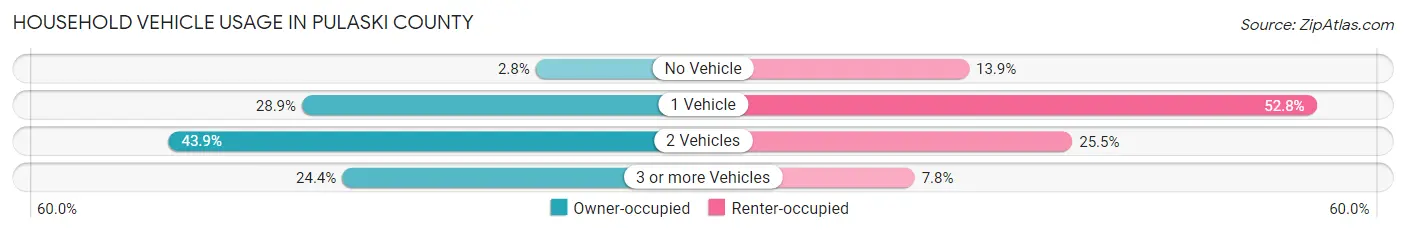
| Vehicles per Household | Owner-occupied | Renter-occupied |
| No Vehicle | 2,690 (2.8%) | 9,761 (13.9%) |
| 1 Vehicle | 28,230 (28.9%) | 37,078 (52.8%) |
| 2 Vehicles | 42,800 (43.9%) | 17,883 (25.5%) |
| 3 or more Vehicles | 23,834 (24.4%) | 5,492 (7.8%) |
| Total | 97,554 (100.0%) | 70,214 (100.0%) |
Real Estate & Mortgages in Pulaski County
Real Estate and Mortgage Overview in Pulaski County
| Characteristic | Without Mortgage | With Mortgage |
| Housing Units | 36,834 | 60,720 |
| Median Property Value | $168,700 | $199,100 |
| Median Household Income | $62,071 | $16,668 |
| Monthly Housing Costs | $484 | $4,709 |
| Real Estate Taxes | $1,306 | $3,137 |
Property Value by Mortgage Status in Pulaski County
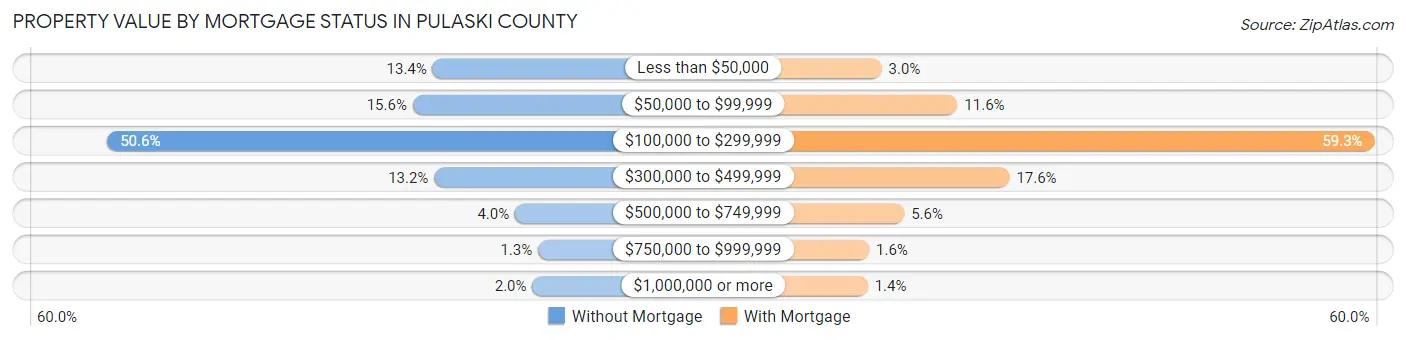
| Property Value | Without Mortgage | With Mortgage |
| Less than $50,000 | 4,926 (13.4%) | 1,809 (3.0%) |
| $50,000 to $99,999 | 5,761 (15.6%) | 7,066 (11.6%) |
| $100,000 to $299,999 | 18,620 (50.5%) | 36,009 (59.3%) |
| $300,000 to $499,999 | 4,859 (13.2%) | 10,678 (17.6%) |
| $500,000 to $749,999 | 1,456 (4.0%) | 3,376 (5.6%) |
| $750,000 to $999,999 | 485 (1.3%) | 940 (1.5%) |
| $1,000,000 or more | 727 (2.0%) | 842 (1.4%) |
| Total | 36,834 (100.0%) | 60,720 (100.0%) |
Household Income by Mortgage Status in Pulaski County
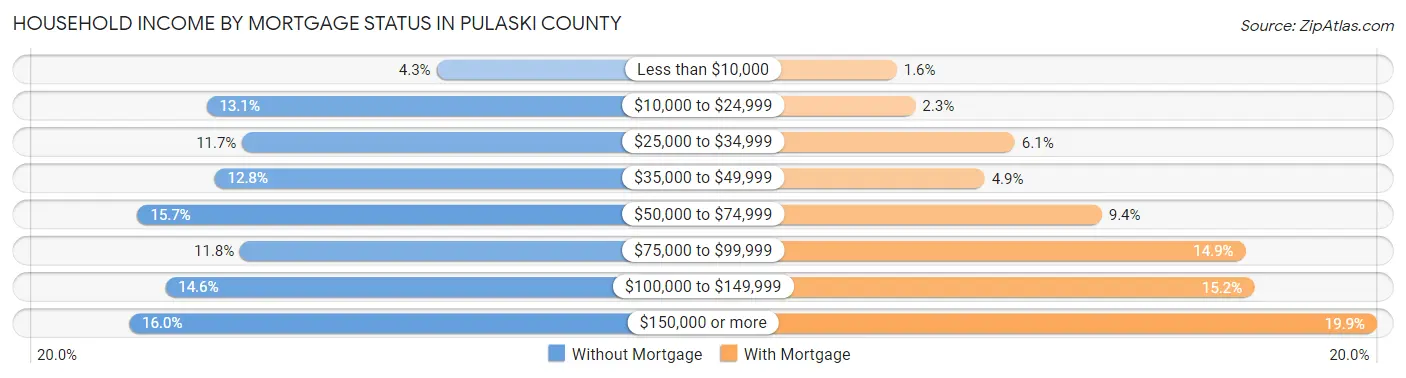
| Household Income | Without Mortgage | With Mortgage |
| Less than $10,000 | 1,589 (4.3%) | 952 (1.6%) |
| $10,000 to $24,999 | 4,813 (13.1%) | 1,384 (2.3%) |
| $25,000 to $34,999 | 4,314 (11.7%) | 3,688 (6.1%) |
| $35,000 to $49,999 | 4,700 (12.8%) | 2,990 (4.9%) |
| $50,000 to $74,999 | 5,784 (15.7%) | 5,697 (9.4%) |
| $75,000 to $99,999 | 4,343 (11.8%) | 9,018 (14.8%) |
| $100,000 to $149,999 | 5,392 (14.6%) | 9,217 (15.2%) |
| $150,000 or more | 5,899 (16.0%) | 12,058 (19.9%) |
| Total | 36,834 (100.0%) | 60,720 (100.0%) |
Property Value to Household Income Ratio in Pulaski County
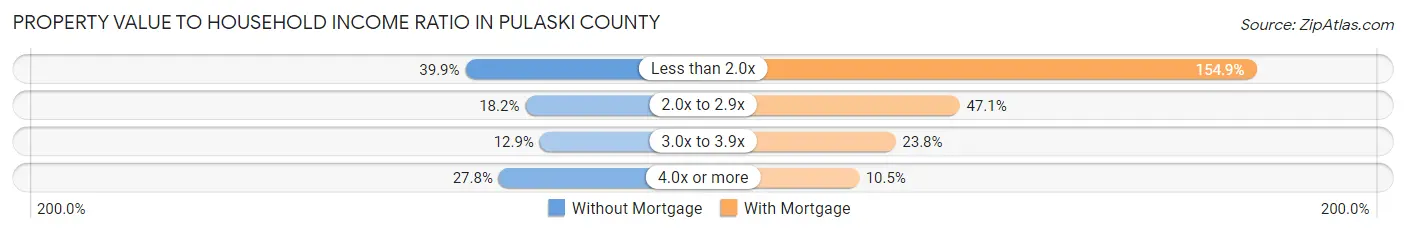
| Value-to-Income Ratio | Without Mortgage | With Mortgage |
| Less than 2.0x | 14,695 (39.9%) | 94,040 (154.9%) |
| 2.0x to 2.9x | 6,690 (18.2%) | 28,577 (47.1%) |
| 3.0x to 3.9x | 4,755 (12.9%) | 14,432 (23.8%) |
| 4.0x or more | 10,231 (27.8%) | 6,348 (10.4%) |
| Total | 36,834 (100.0%) | 60,720 (100.0%) |
Real Estate Taxes by Mortgage Status in Pulaski County
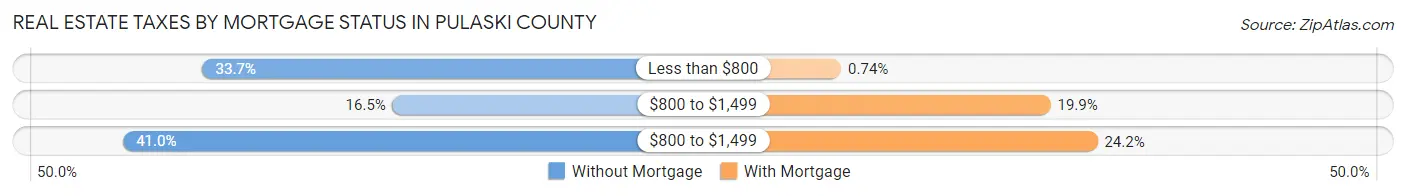
| Property Taxes | Without Mortgage | With Mortgage |
| Less than $800 | 12,428 (33.7%) | 447 (0.7%) |
| $800 to $1,499 | 6,070 (16.5%) | 12,061 (19.9%) |
| $800 to $1,499 | 15,100 (41.0%) | 14,666 (24.1%) |
| Total | 36,834 (100.0%) | 60,720 (100.0%) |
Health & Disability in Pulaski County
Health Insurance Coverage by Age in Pulaski County
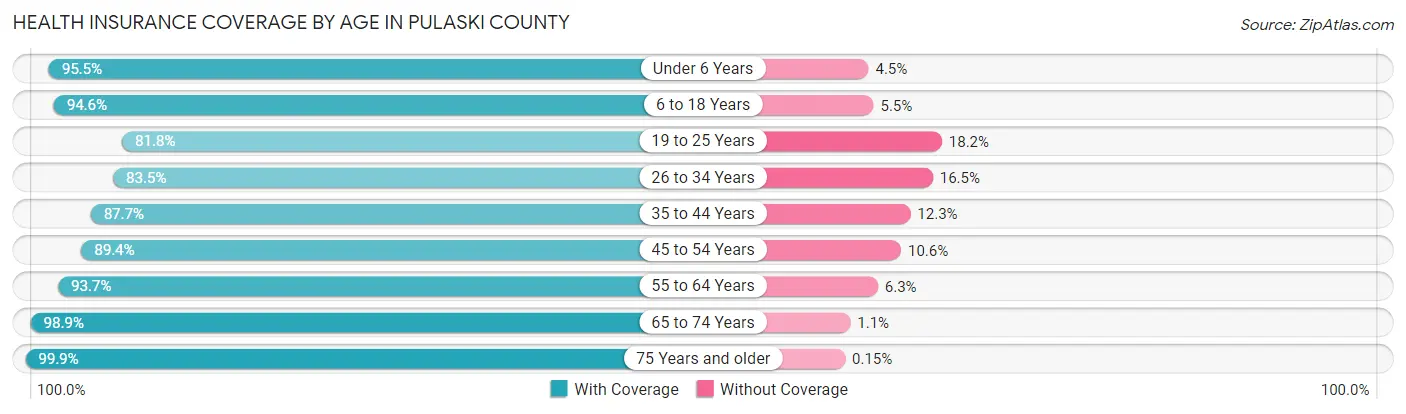
| Age Bracket | With Coverage | Without Coverage |
| Under 6 Years | 28,440 (95.5%) | 1,345 (4.5%) |
| 6 to 18 Years | 62,831 (94.6%) | 3,624 (5.4%) |
| 19 to 25 Years | 28,379 (81.8%) | 6,310 (18.2%) |
| 26 to 34 Years | 42,502 (83.5%) | 8,407 (16.5%) |
| 35 to 44 Years | 44,396 (87.7%) | 6,242 (12.3%) |
| 45 to 54 Years | 41,718 (89.4%) | 4,939 (10.6%) |
| 55 to 64 Years | 46,731 (93.7%) | 3,122 (6.3%) |
| 65 to 74 Years | 38,434 (98.9%) | 438 (1.1%) |
| 75 Years and older | 23,636 (99.9%) | 35 (0.2%) |
| Total | 357,067 (91.2%) | 34,462 (8.8%) |
Health Insurance Coverage by Citizenship Status in Pulaski County
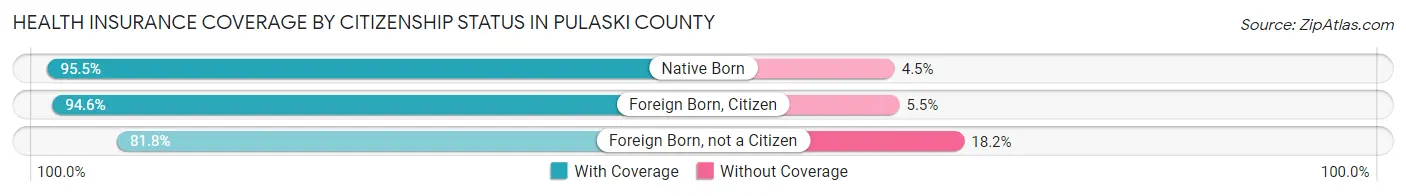
| Citizenship Status | With Coverage | Without Coverage |
| Native Born | 28,440 (95.5%) | 1,345 (4.5%) |
| Foreign Born, Citizen | 62,831 (94.6%) | 3,624 (5.4%) |
| Foreign Born, not a Citizen | 28,379 (81.8%) | 6,310 (18.2%) |
Health Insurance Coverage by Household Income in Pulaski County
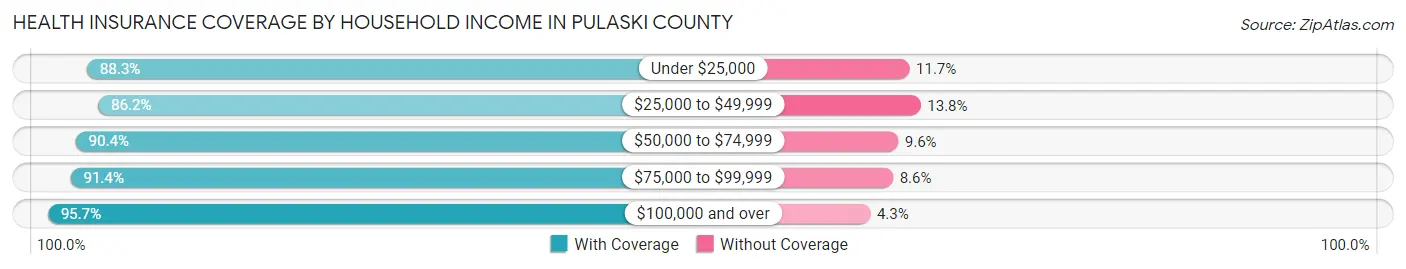
| Household Income | With Coverage | Without Coverage |
| Under $25,000 | 55,086 (88.3%) | 7,285 (11.7%) |
| $25,000 to $49,999 | 67,675 (86.2%) | 10,815 (13.8%) |
| $50,000 to $74,999 | 55,125 (90.4%) | 5,831 (9.6%) |
| $75,000 to $99,999 | 44,698 (91.4%) | 4,211 (8.6%) |
| $100,000 and over | 132,444 (95.7%) | 6,012 (4.3%) |
Public vs Private Health Insurance Coverage by Age in Pulaski County
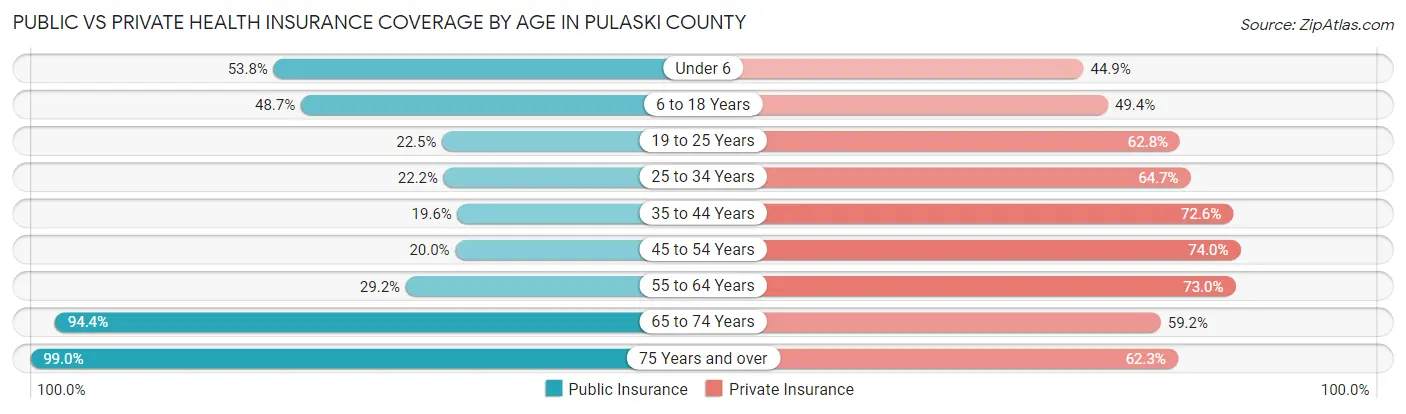
| Age Bracket | Public Insurance | Private Insurance |
| Under 6 | 16,012 (53.8%) | 13,365 (44.9%) |
| 6 to 18 Years | 32,357 (48.7%) | 32,842 (49.4%) |
| 19 to 25 Years | 7,793 (22.5%) | 21,769 (62.7%) |
| 25 to 34 Years | 11,290 (22.2%) | 32,942 (64.7%) |
| 35 to 44 Years | 9,935 (19.6%) | 36,769 (72.6%) |
| 45 to 54 Years | 9,346 (20.0%) | 34,512 (74.0%) |
| 55 to 64 Years | 14,569 (29.2%) | 36,414 (73.0%) |
| 65 to 74 Years | 36,688 (94.4%) | 23,015 (59.2%) |
| 75 Years and over | 23,422 (99.0%) | 14,756 (62.3%) |
| Total | 161,412 (41.2%) | 246,384 (62.9%) |
Disability Status by Sex by Age in Pulaski County
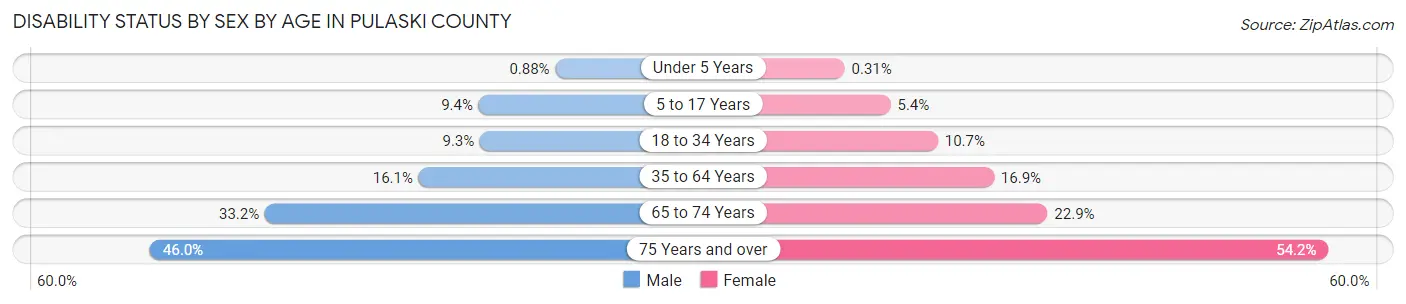
| Age Bracket | Male | Female |
| Under 5 Years | 113 (0.9%) | 38 (0.3%) |
| 5 to 17 Years | 3,192 (9.4%) | 1,771 (5.4%) |
| 18 to 34 Years | 3,998 (9.3%) | 5,031 (10.7%) |
| 35 to 64 Years | 11,182 (16.1%) | 13,163 (16.9%) |
| 65 to 74 Years | 5,822 (33.2%) | 4,887 (22.9%) |
| 75 Years and over | 4,252 (46.0%) | 7,821 (54.2%) |
Disability Class by Sex by Age in Pulaski County
Disability Class: Hearing Difficulty
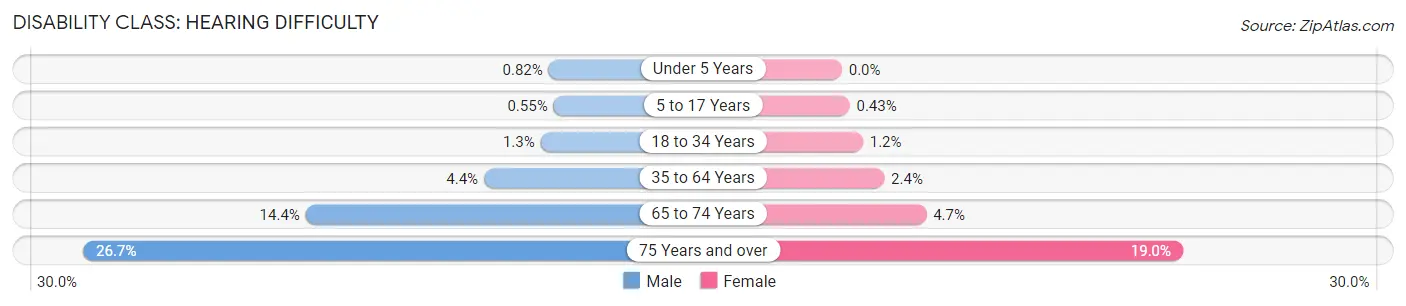
| Age Bracket | Male | Female |
| Under 5 Years | 105 (0.8%) | 0 (0.0%) |
| 5 to 17 Years | 185 (0.5%) | 141 (0.4%) |
| 18 to 34 Years | 546 (1.3%) | 550 (1.2%) |
| 35 to 64 Years | 3,072 (4.4%) | 1,831 (2.4%) |
| 65 to 74 Years | 2,515 (14.3%) | 1,003 (4.7%) |
| 75 Years and over | 2,469 (26.7%) | 2,741 (19.0%) |
Disability Class: Vision Difficulty
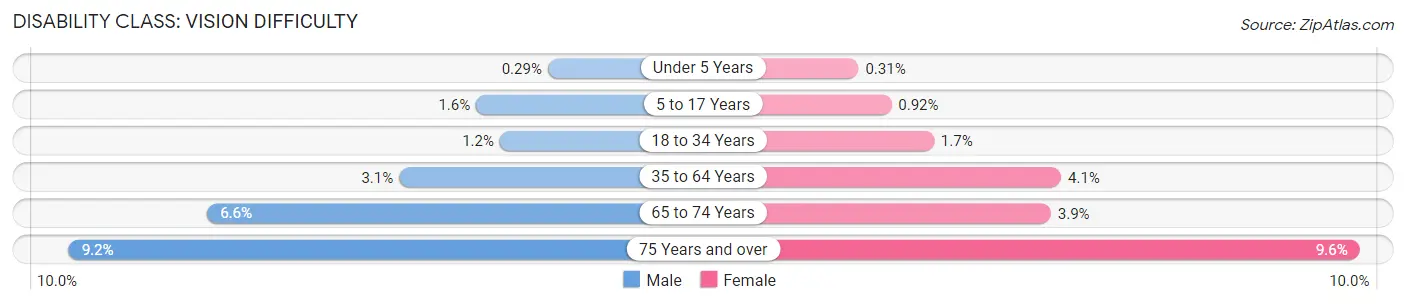
| Age Bracket | Male | Female |
| Under 5 Years | 37 (0.3%) | 38 (0.3%) |
| 5 to 17 Years | 548 (1.6%) | 301 (0.9%) |
| 18 to 34 Years | 509 (1.2%) | 803 (1.7%) |
| 35 to 64 Years | 2,121 (3.0%) | 3,160 (4.1%) |
| 65 to 74 Years | 1,159 (6.6%) | 828 (3.9%) |
| 75 Years and over | 848 (9.2%) | 1,388 (9.6%) |
Disability Class: Cognitive Difficulty
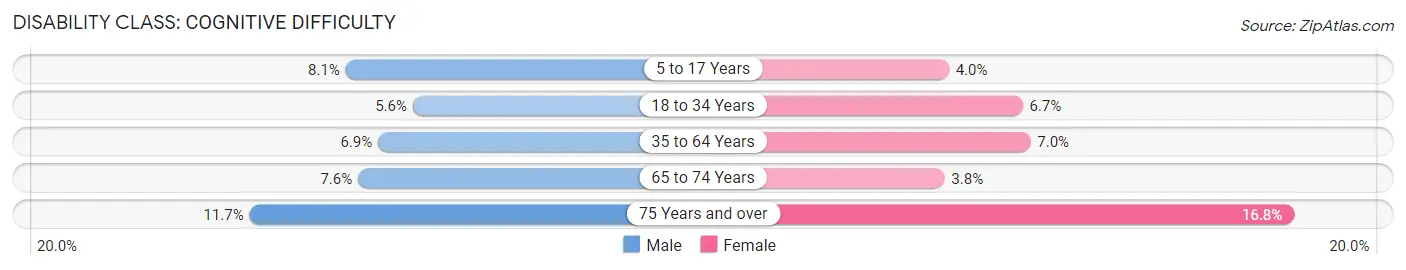
| Age Bracket | Male | Female |
| 5 to 17 Years | 2,738 (8.1%) | 1,295 (4.0%) |
| 18 to 34 Years | 2,410 (5.6%) | 3,159 (6.7%) |
| 35 to 64 Years | 4,779 (6.9%) | 5,440 (7.0%) |
| 65 to 74 Years | 1,335 (7.6%) | 814 (3.8%) |
| 75 Years and over | 1,076 (11.7%) | 2,424 (16.8%) |
Disability Class: Ambulatory Difficulty
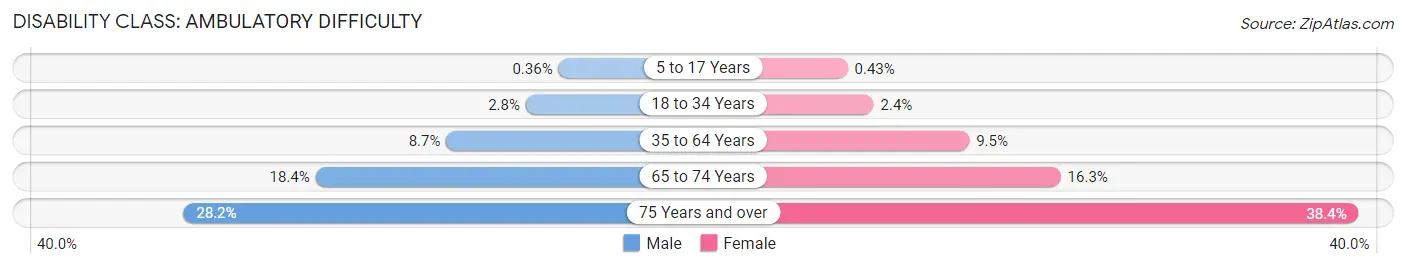
| Age Bracket | Male | Female |
| 5 to 17 Years | 123 (0.4%) | 139 (0.4%) |
| 18 to 34 Years | 1,205 (2.8%) | 1,111 (2.4%) |
| 35 to 64 Years | 6,038 (8.7%) | 7,350 (9.5%) |
| 65 to 74 Years | 3,225 (18.4%) | 3,468 (16.3%) |
| 75 Years and over | 2,605 (28.2%) | 5,537 (38.4%) |
Disability Class: Self-Care Difficulty
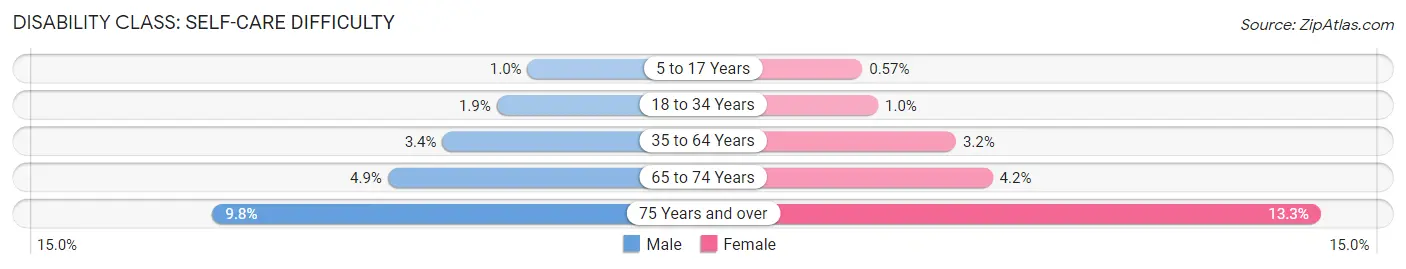
| Age Bracket | Male | Female |
| 5 to 17 Years | 339 (1.0%) | 186 (0.6%) |
| 18 to 34 Years | 803 (1.9%) | 477 (1.0%) |
| 35 to 64 Years | 2,343 (3.4%) | 2,467 (3.2%) |
| 65 to 74 Years | 857 (4.9%) | 897 (4.2%) |
| 75 Years and over | 902 (9.8%) | 1,924 (13.3%) |
Technology Access in Pulaski County
Computing Device Access in Pulaski County
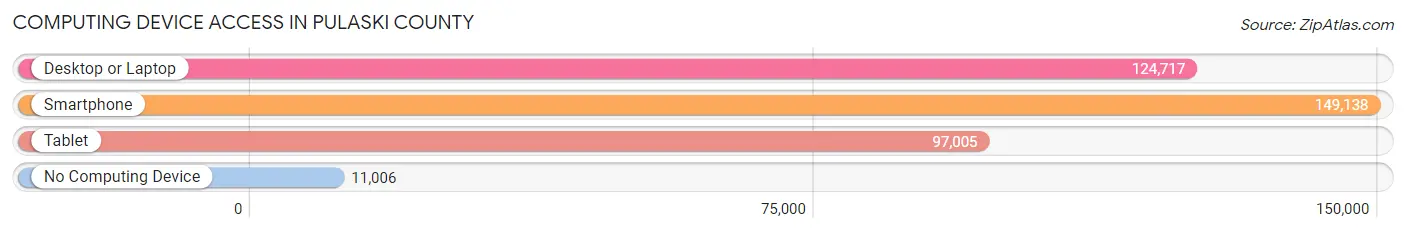
| Device Type | # Households | % Households |
| Desktop or Laptop | 124,717 | 74.3% |
| Smartphone | 149,138 | 88.9% |
| Tablet | 97,005 | 57.8% |
| No Computing Device | 11,006 | 6.6% |
| Total | 167,768 | 100.0% |
Internet Access in Pulaski County
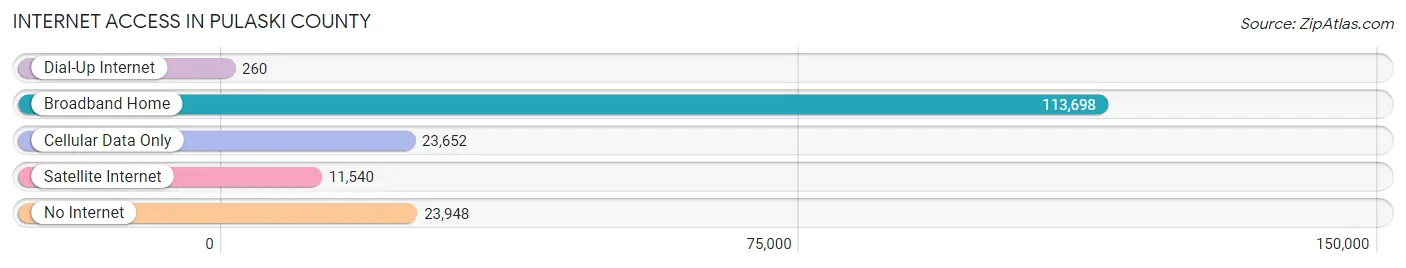
| Internet Type | # Households | % Households |
| Dial-Up Internet | 260 | 0.2% |
| Broadband Home | 113,698 | 67.8% |
| Cellular Data Only | 23,652 | 14.1% |
| Satellite Internet | 11,540 | 6.9% |
| No Internet | 23,948 | 14.3% |
| Total | 167,768 | 100.0% |
Pulaski County Summary
Pulaski County, Arkansas is located in the central part of the state and is the most populous county in the state. It is bordered by Faulkner County to the north, Lonoke County to the east, Grant County to the south, and Perry County to the west. The county seat is Little Rock, the state capital.
History
Pulaski County was established in 1818 and named after Kazimierz Pułaski, a Polish-born Revolutionary War hero. The county was originally part of Arkansas Territory, which was created in 1819. The county was initially divided into two parts, with the western part becoming Conway County in 1825.
In the early 19th century, the county was home to several Native American tribes, including the Quapaw, Osage, and Caddo. The first settlers in the area were French trappers and traders, who were followed by American settlers in the 1820s.
The county was the site of several Civil War battles, including the Battle of Little Rock in 1863. After the war, the county experienced a period of economic growth, with the development of railroads and the establishment of several industries.
Geography
Pulaski County covers an area of 841 square miles and is located in the Ouachita Mountains region of Arkansas. The county is mostly flat, with some rolling hills in the northern and western parts. The Arkansas River forms the eastern border of the county.
The county is home to several state parks, including Pinnacle Mountain State Park, which is located in the western part of the county. The park features hiking trails, camping sites, and a variety of wildlife.
Economy
The economy of Pulaski County is largely based on government, healthcare, and education. The county is home to several major employers, including the University of Arkansas for Medical Sciences, the Little Rock Air Force Base, and the Arkansas Department of Human Services.
The county is also home to several major corporations, including Dillard’s, Windstream Communications, and Acxiom Corporation. The county’s largest employer is the Little Rock School District, which employs over 10,000 people.
Demographics
As of the 2010 census, Pulaski County had a population of 381,748. The racial makeup of the county was 68.3% White, 25.3% Black or African American, 0.7% Native American, 2.2% Asian, 0.1% Pacific Islander, 1.3% from other races, and 2.3% from two or more races. Hispanic or Latino of any race were 4.2% of the population.
The median household income in the county was $45,890, and the median family income was $54,817. The per capita income was $25,845. About 15.2% of the population was below the poverty line.
Pulaski County is a diverse and vibrant county with a rich history and a strong economy. It is home to a variety of industries, educational institutions, and recreational opportunities. The county is a great place to live, work, and play.
Common Questions
What is Per Capita Income in Pulaski County?
Per Capita income in Pulaski County is $39,146.
What is the Median Family Income in Pulaski County?
Median Family Income in Pulaski County is $79,879.
What is the Median Household income in Pulaski County?
Median Household Income in Pulaski County is $58,326.
What is Income or Wage Gap in Pulaski County?
Income or Wage Gap in Pulaski County is 17.5%.
Women in Pulaski County earn 82.5 cents for every dollar earned by a man.
What is Family Income Deficit in Pulaski County?
Family Income Deficit in Pulaski County is $11,376.
Families that are below poverty line in Pulaski County earn $11,376 less on average than the poverty threshold level.
What is Inequality or Gini Index in Pulaski County?
Inequality or Gini Index in Pulaski County is 0.52.
What is the Total Population of Pulaski County?
Total Population of Pulaski County is 398,322.
What is the Total Male Population of Pulaski County?
Total Male Population of Pulaski County is 190,970.
What is the Total Female Population of Pulaski County?
Total Female Population of Pulaski County is 207,352.
What is the Ratio of Males per 100 Females in Pulaski County?
There are 92.10 Males per 100 Females in Pulaski County.
What is the Ratio of Females per 100 Males in Pulaski County?
There are 108.58 Females per 100 Males in Pulaski County.
What is the Median Population Age in Pulaski County?
Median Population Age in Pulaski County is 37.7 Years.
What is the Average Family Size in Pulaski County
Average Family Size in Pulaski County is 3.1 People.
What is the Average Household Size in Pulaski County
Average Household Size in Pulaski County is 2.3 People.
How Large is the Labor Force in Pulaski County?
There are 199,494 People in the Labor Forcein in Pulaski County.
What is the Percentage of People in the Labor Force in Pulaski County?
63.1% of People are in the Labor Force in Pulaski County.
What is the Unemployment Rate in Pulaski County?
Unemployment Rate in Pulaski County is 5.2%.