Washington County, AR Map & Demographics
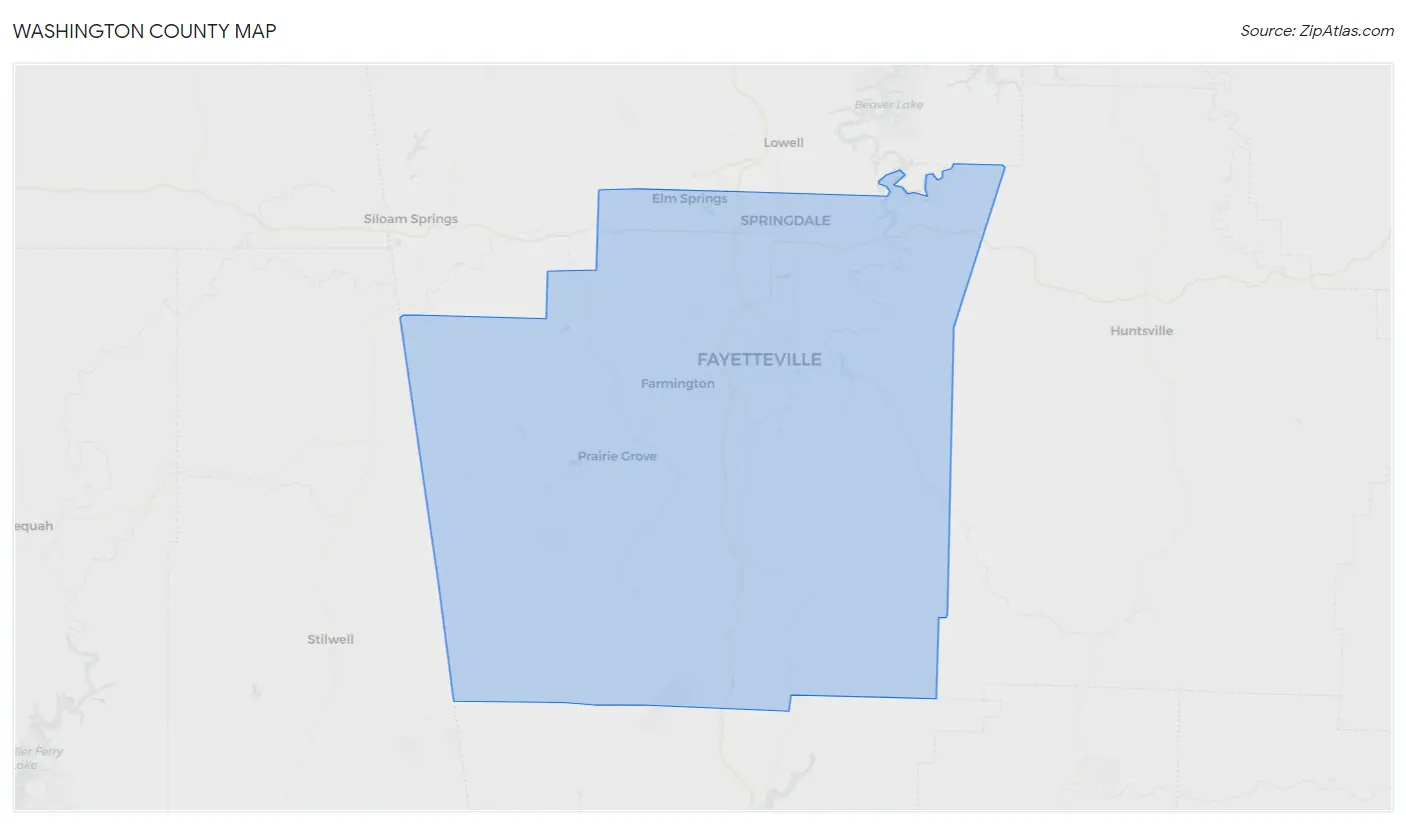
Washington County Map
Washington County Overview
$34,531
PER CAPITA INCOME
$79,154
AVG FAMILY INCOME
$61,985
AVG HOUSEHOLD INCOME
23.2%
WAGE / INCOME GAP [ % ]
76.8¢/ $1
WAGE / INCOME GAP [ $ ]
$10,503
FAMILY INCOME DEFICIT
0.48
INEQUALITY / GINI INDEX
247,331
TOTAL POPULATION
124,636
MALE POPULATION
122,695
FEMALE POPULATION
101.58
MALES / 100 FEMALES
98.44
FEMALES / 100 MALES
32.3
MEDIAN AGE
3.1
AVG FAMILY SIZE
2.5
AVG HOUSEHOLD SIZE
126,416
LABOR FORCE [ PEOPLE ]
64.7%
PERCENT IN LABOR FORCE
4.3%
UNEMPLOYMENT RATE
Washington County Area Codes
Income in Washington County
Income Overview in Washington County
Per Capita Income in Washington County is $34,531, while median incomes of families and households are $79,154 and $61,985 respectively.
| Characteristic | Number | Measure |
| Per Capita Income | 247,331 | $34,531 |
| Median Family Income | 58,021 | $79,154 |
| Mean Family Income | 58,021 | $110,610 |
| Median Household Income | 93,781 | $61,985 |
| Mean Household Income | 93,781 | $89,423 |
| Income Deficit | 58,021 | $10,503 |
| Wage / Income Gap (%) | 247,331 | 23.16% |
| Wage / Income Gap ($) | 247,331 | 76.84¢ per $1 |
| Gini / Inequality Index | 247,331 | 0.48 |
Earnings by Sex in Washington County
Average Earnings in Washington County are $35,981, $40,439 for men and $31,074 for women, a difference of 23.2%.
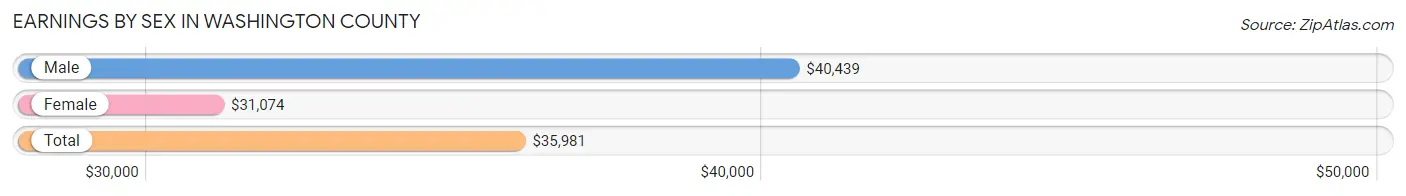
| Sex | Number | Average Earnings |
| Male | 72,431 (54.3%) | $40,439 |
| Female | 60,887 (45.7%) | $31,074 |
| Total | 133,318 (100.0%) | $35,981 |
Earnings by Sex by Income Bracket in Washington County
The most common earnings brackets in Washington County are $100,000+ for men (10,010 | 13.8%) and $25,000 to $29,999 for women (5,237 | 8.6%).
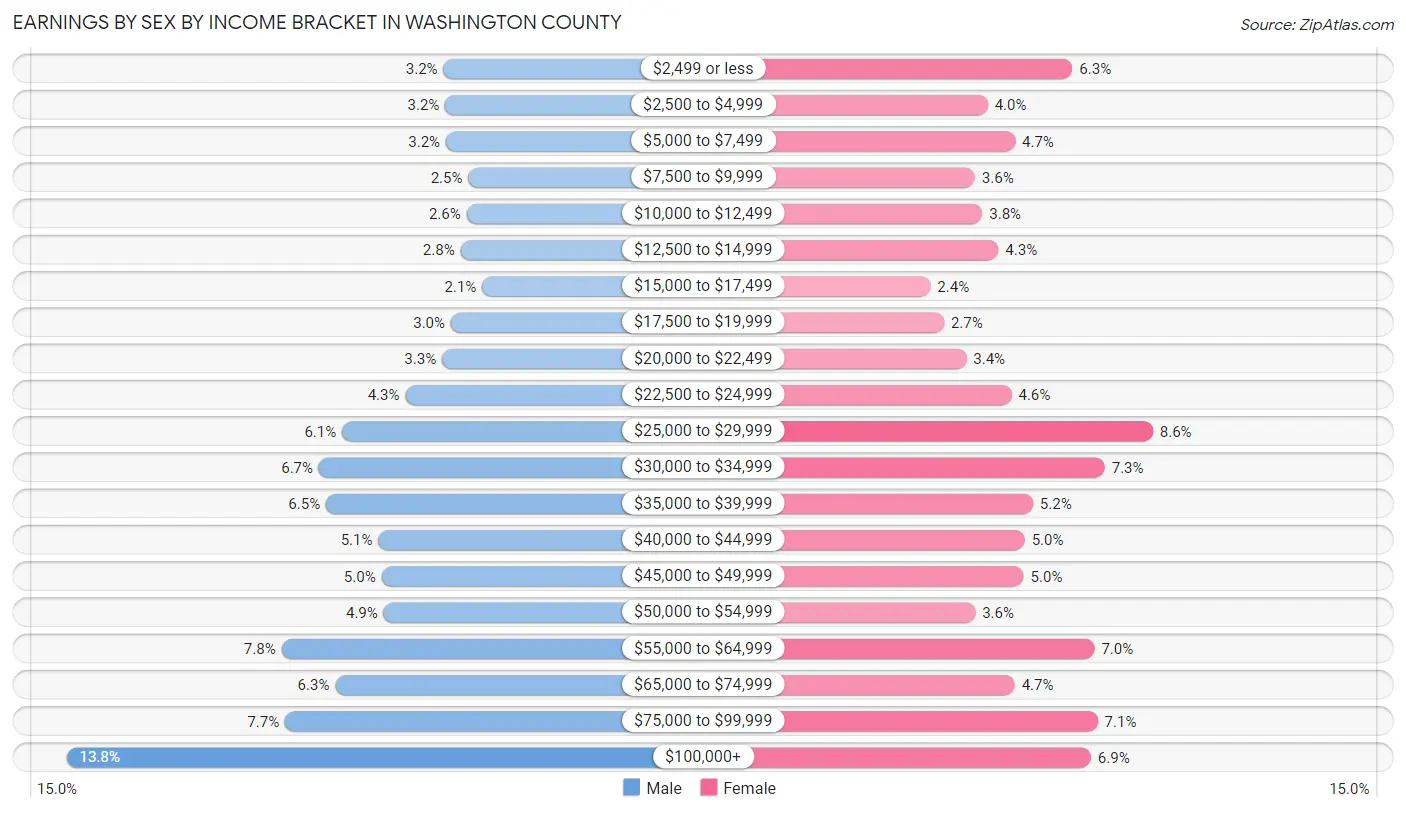
| Income | Male | Female |
| $2,499 or less | 2,340 (3.2%) | 3,860 (6.3%) |
| $2,500 to $4,999 | 2,303 (3.2%) | 2,414 (4.0%) |
| $5,000 to $7,499 | 2,292 (3.2%) | 2,878 (4.7%) |
| $7,500 to $9,999 | 1,834 (2.5%) | 2,189 (3.6%) |
| $10,000 to $12,499 | 1,866 (2.6%) | 2,321 (3.8%) |
| $12,500 to $14,999 | 1,992 (2.8%) | 2,593 (4.3%) |
| $15,000 to $17,499 | 1,551 (2.1%) | 1,428 (2.4%) |
| $17,500 to $19,999 | 2,188 (3.0%) | 1,664 (2.7%) |
| $20,000 to $22,499 | 2,371 (3.3%) | 2,043 (3.4%) |
| $22,500 to $24,999 | 3,114 (4.3%) | 2,817 (4.6%) |
| $25,000 to $29,999 | 4,403 (6.1%) | 5,237 (8.6%) |
| $30,000 to $34,999 | 4,872 (6.7%) | 4,414 (7.2%) |
| $35,000 to $39,999 | 4,728 (6.5%) | 3,184 (5.2%) |
| $40,000 to $44,999 | 3,667 (5.1%) | 3,045 (5.0%) |
| $45,000 to $49,999 | 3,597 (5.0%) | 3,026 (5.0%) |
| $50,000 to $54,999 | 3,559 (4.9%) | 2,198 (3.6%) |
| $55,000 to $64,999 | 5,638 (7.8%) | 4,238 (7.0%) |
| $65,000 to $74,999 | 4,542 (6.3%) | 2,871 (4.7%) |
| $75,000 to $99,999 | 5,564 (7.7%) | 4,290 (7.0%) |
| $100,000+ | 10,010 (13.8%) | 4,177 (6.9%) |
| Total | 72,431 (100.0%) | 60,887 (100.0%) |
Earnings by Sex by Educational Attainment in Washington County
Average earnings in Washington County are $48,371 for men and $37,253 for women, a difference of 23.0%. Men with an educational attainment of graduate degree enjoy the highest average annual earnings of $88,263, while those with less than high school education earn the least with $33,644. Women with an educational attainment of graduate degree earn the most with the average annual earnings of $64,874, while those with less than high school education have the smallest earnings of $24,859.
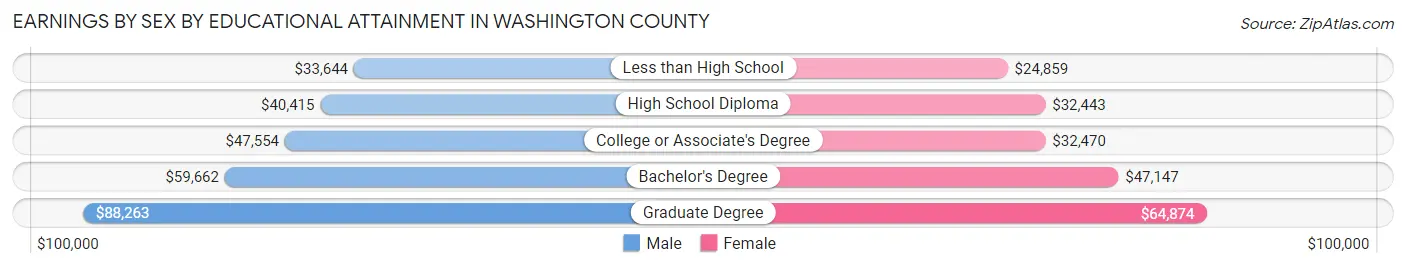
| Educational Attainment | Male Income | Female Income |
| Less than High School | $33,644 | $24,859 |
| High School Diploma | $40,415 | $32,443 |
| College or Associate's Degree | $47,554 | $32,470 |
| Bachelor's Degree | $59,662 | $47,147 |
| Graduate Degree | $88,263 | $64,874 |
| Total | $48,371 | $37,253 |
Family Income in Washington County
Family Income Brackets in Washington County
According to the Washington County family income data, there are 10,618 families falling into the $100,000 to $149,999 income range, which is the most common income bracket and makes up 18.3% of all families. Conversely, the $10,000 to $14,999 income bracket is the least frequent group with only 1,044 families (1.8%) belonging to this category.
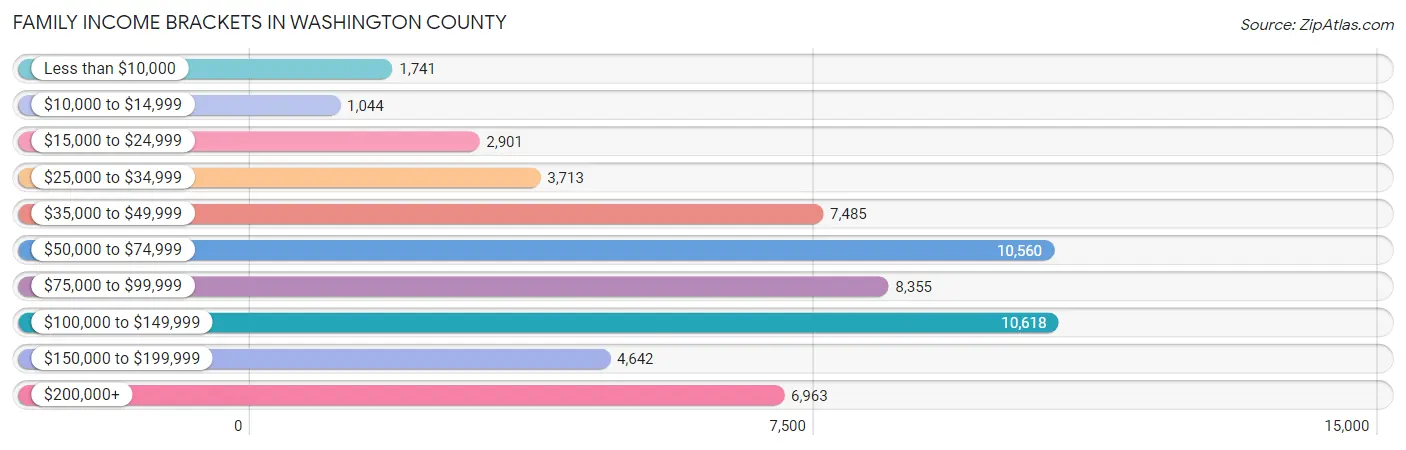
| Income Bracket | # Families | % Families |
| Less than $10,000 | 1,741 | 3.0% |
| $10,000 to $14,999 | 1,044 | 1.8% |
| $15,000 to $24,999 | 2,901 | 5.0% |
| $25,000 to $34,999 | 3,713 | 6.4% |
| $35,000 to $49,999 | 7,485 | 12.9% |
| $50,000 to $74,999 | 10,560 | 18.2% |
| $75,000 to $99,999 | 8,355 | 14.4% |
| $100,000 to $149,999 | 10,618 | 18.3% |
| $150,000 to $199,999 | 4,642 | 8.0% |
| $200,000+ | 6,963 | 12.0% |
Family Income by Famaliy Size in Washington County
4-person families (9,887 | 17.0%) account for the highest median family income in Washington County with $95,978 per family, while 2-person families (25,917 | 44.7%) have the highest median income of $36,009 per family member.
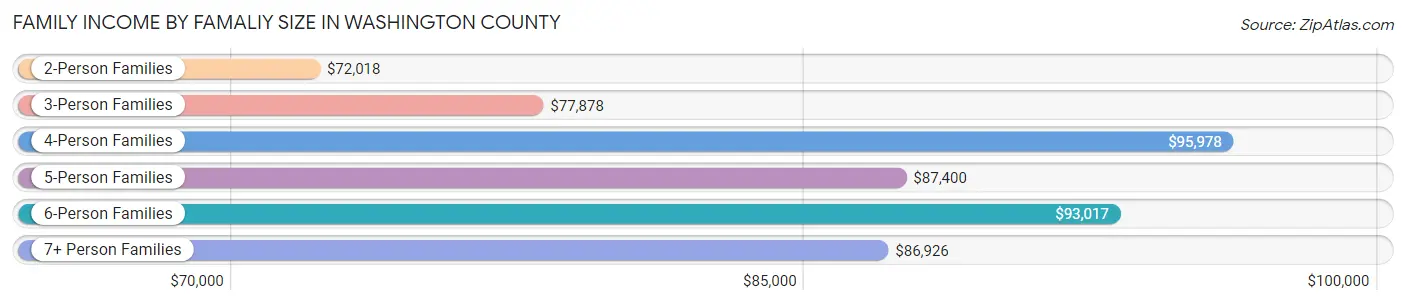
| Income Bracket | # Families | Median Income |
| 2-Person Families | 25,917 (44.7%) | $72,018 |
| 3-Person Families | 14,295 (24.6%) | $77,878 |
| 4-Person Families | 9,887 (17.0%) | $95,978 |
| 5-Person Families | 4,975 (8.6%) | $87,400 |
| 6-Person Families | 1,983 (3.4%) | $93,017 |
| 7+ Person Families | 964 (1.7%) | $86,926 |
| Total | 58,021 (100.0%) | $79,154 |
Family Income by Number of Earners in Washington County
The median family income in Washington County is $79,154, with families comprising 3+ earners (5,516) having the highest median family income of $123,168, while families with no earners (6,345) have the lowest median family income of $44,194, accounting for 9.5% and 10.9% of families, respectively.
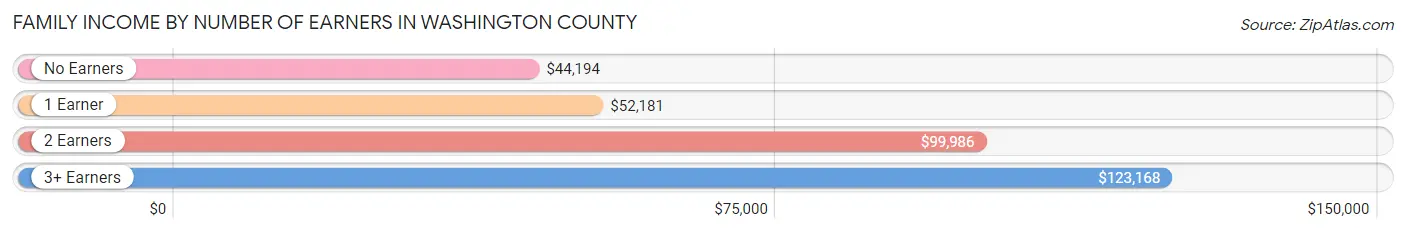
| Number of Earners | # Families | Median Income |
| No Earners | 6,345 (10.9%) | $44,194 |
| 1 Earner | 20,515 (35.4%) | $52,181 |
| 2 Earners | 25,645 (44.2%) | $99,986 |
| 3+ Earners | 5,516 (9.5%) | $123,168 |
| Total | 58,021 (100.0%) | $79,154 |
Household Income in Washington County
Household Income Brackets in Washington County
With 16,881 households falling in the category, the $50,000 to $74,999 income range is the most frequent in Washington County, accounting for 18.0% of all households. In contrast, only 3,657 households (3.9%) fall into the $10,000 to $14,999 income bracket, making it the least populous group.
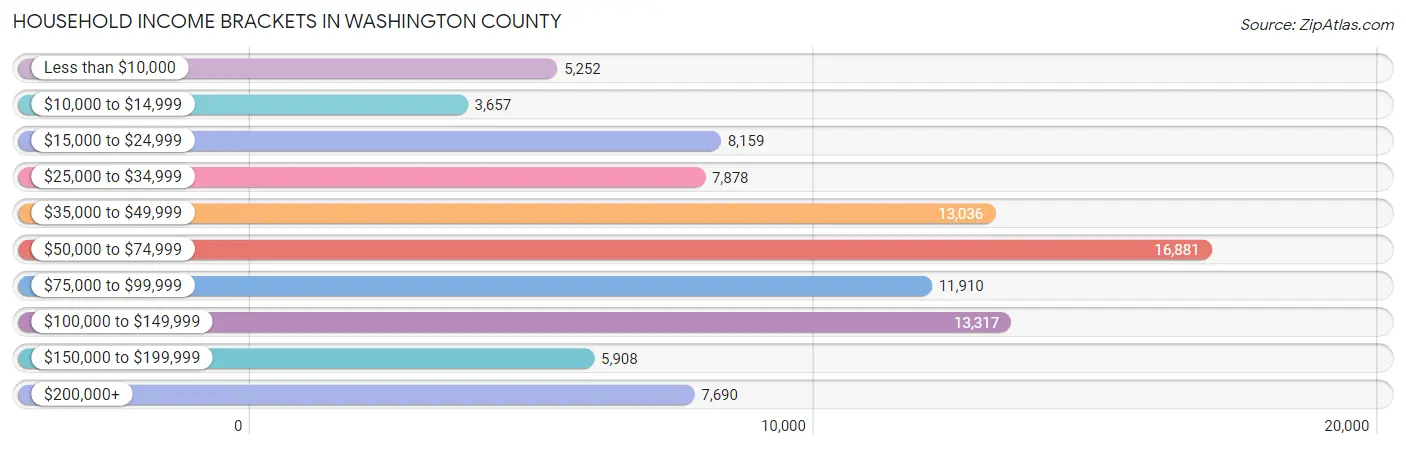
| Income Bracket | # Households | % Households |
| Less than $10,000 | 5,252 | 5.6% |
| $10,000 to $14,999 | 3,657 | 3.9% |
| $15,000 to $24,999 | 8,159 | 8.7% |
| $25,000 to $34,999 | 7,878 | 8.4% |
| $35,000 to $49,999 | 13,036 | 13.9% |
| $50,000 to $74,999 | 16,881 | 18.0% |
| $75,000 to $99,999 | 11,910 | 12.7% |
| $100,000 to $149,999 | 13,317 | 14.2% |
| $150,000 to $199,999 | 5,908 | 6.3% |
| $200,000+ | 7,690 | 8.2% |
Household Income by Householder Age in Washington County
The median household income in Washington County is $61,985, with the highest median household income of $76,073 found in the 45 to 64 years age bracket for the primary householder. A total of 30,291 households (32.3%) fall into this category. Meanwhile, the 15 to 24 years age bracket for the primary householder has the lowest median household income of $35,267, with 9,873 households (10.5%) in this group.
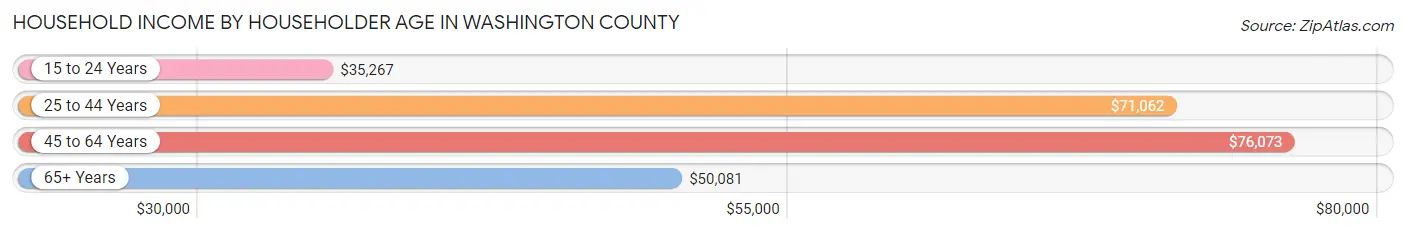
| Income Bracket | # Households | Median Income |
| 15 to 24 Years | 9,873 (10.5%) | $35,267 |
| 25 to 44 Years | 35,339 (37.7%) | $71,062 |
| 45 to 64 Years | 30,291 (32.3%) | $76,073 |
| 65+ Years | 18,278 (19.5%) | $50,081 |
| Total | 93,781 (100.0%) | $61,985 |
Poverty in Washington County
Income Below Poverty by Sex and Age in Washington County
With 14.1% poverty level for males and 16.3% for females among the residents of Washington County, 18 to 24 year old males and 18 to 24 year old females are the most vulnerable to poverty, with 4,909 males (29.8%) and 5,902 females (39.8%) in their respective age groups living below the poverty level.
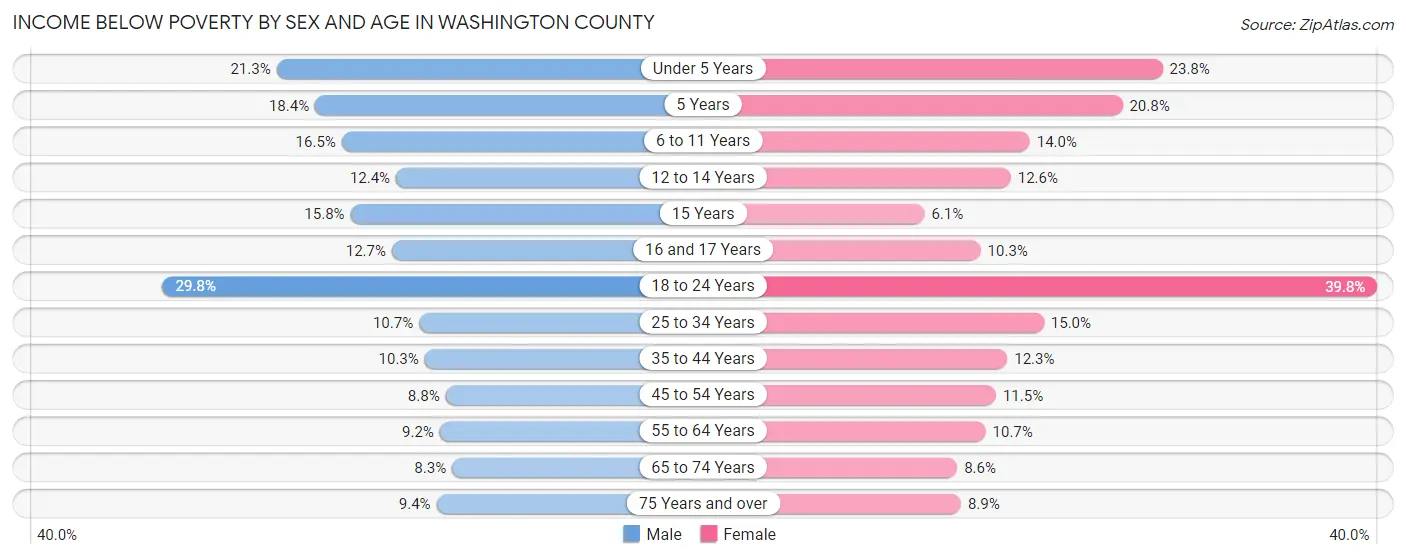
| Age Bracket | Male | Female |
| Under 5 Years | 1,717 (21.3%) | 1,790 (23.8%) |
| 5 Years | 289 (18.4%) | 375 (20.8%) |
| 6 to 11 Years | 1,679 (16.5%) | 1,363 (14.0%) |
| 12 to 14 Years | 581 (12.4%) | 543 (12.6%) |
| 15 Years | 239 (15.8%) | 111 (6.1%) |
| 16 and 17 Years | 471 (12.7%) | 296 (10.3%) |
| 18 to 24 Years | 4,909 (29.8%) | 5,902 (39.8%) |
| 25 to 34 Years | 2,014 (10.7%) | 2,609 (15.0%) |
| 35 to 44 Years | 1,721 (10.3%) | 1,946 (12.3%) |
| 45 to 54 Years | 1,204 (8.7%) | 1,529 (11.5%) |
| 55 to 64 Years | 1,134 (9.2%) | 1,330 (10.7%) |
| 65 to 74 Years | 680 (8.3%) | 807 (8.6%) |
| 75 Years and over | 440 (9.4%) | 579 (8.8%) |
| Total | 17,078 (14.1%) | 19,180 (16.3%) |
Income Above Poverty by Sex and Age in Washington County
According to the poverty statistics in Washington County, males aged 65 to 74 years and females aged 15 years are the age groups that are most secure financially, with 91.7% of males and 93.9% of females in these age groups living above the poverty line.
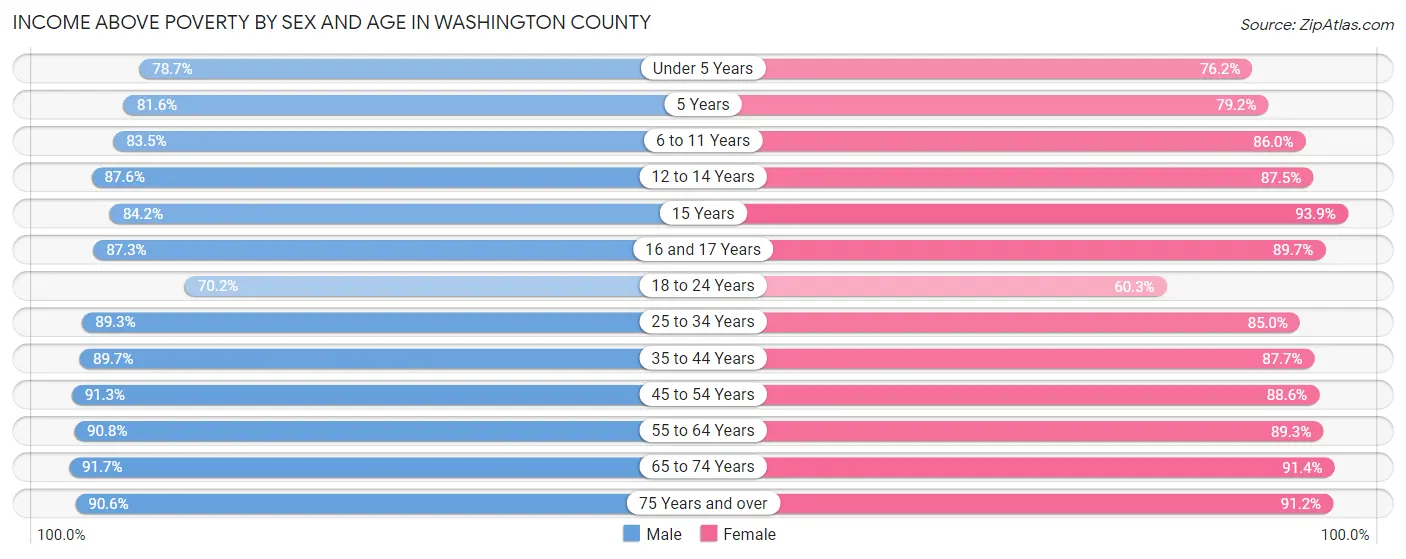
| Age Bracket | Male | Female |
| Under 5 Years | 6,343 (78.7%) | 5,726 (76.2%) |
| 5 Years | 1,278 (81.6%) | 1,424 (79.2%) |
| 6 to 11 Years | 8,523 (83.5%) | 8,404 (86.0%) |
| 12 to 14 Years | 4,094 (87.6%) | 3,782 (87.5%) |
| 15 Years | 1,273 (84.2%) | 1,698 (93.9%) |
| 16 and 17 Years | 3,227 (87.3%) | 2,575 (89.7%) |
| 18 to 24 Years | 11,584 (70.2%) | 8,946 (60.3%) |
| 25 to 34 Years | 16,780 (89.3%) | 14,788 (85.0%) |
| 35 to 44 Years | 14,990 (89.7%) | 13,883 (87.7%) |
| 45 to 54 Years | 12,557 (91.2%) | 11,820 (88.5%) |
| 55 to 64 Years | 11,213 (90.8%) | 11,124 (89.3%) |
| 65 to 74 Years | 7,544 (91.7%) | 8,608 (91.4%) |
| 75 Years and over | 4,231 (90.6%) | 5,966 (91.1%) |
| Total | 103,637 (85.9%) | 98,744 (83.7%) |
Income Below Poverty Among Married-Couple Families in Washington County
The poverty statistics for married-couple families in Washington County show that 4.9% or 2,097 of the total 43,000 families live below the poverty line. Families with 5 or more children have the highest poverty rate of 18.4%, comprising of 65 families. On the other hand, families with no children have the lowest poverty rate of 2.8%, which includes 630 families.
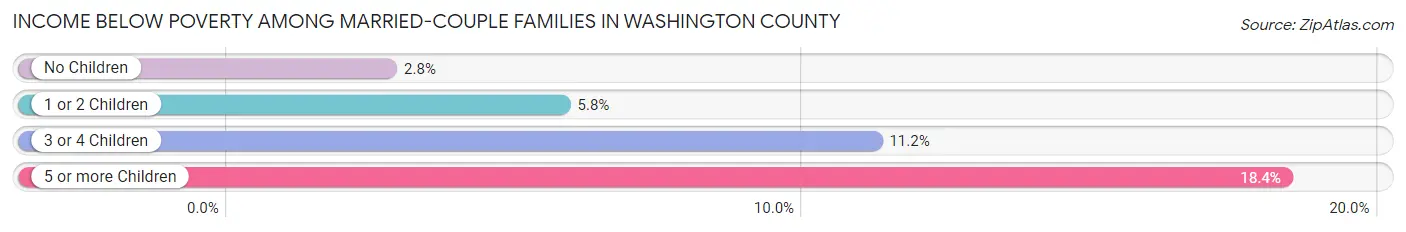
| Children | Above Poverty | Below Poverty |
| No Children | 22,100 (97.2%) | 630 (2.8%) |
| 1 or 2 Children | 14,456 (94.2%) | 889 (5.8%) |
| 3 or 4 Children | 4,058 (88.8%) | 513 (11.2%) |
| 5 or more Children | 289 (81.6%) | 65 (18.4%) |
| Total | 40,903 (95.1%) | 2,097 (4.9%) |
Income Below Poverty Among Single-Parent Households in Washington County
According to the poverty data in Washington County, 19.6% or 1,070 single-father households and 23.1% or 2,212 single-mother households are living below the poverty line. Among single-father households, those with 5 or more children have the highest poverty rate, with 8 households (100.0%) experiencing poverty. Likewise, among single-mother households, those with 5 or more children have the highest poverty rate, with 31 households (67.4%) falling below the poverty line.
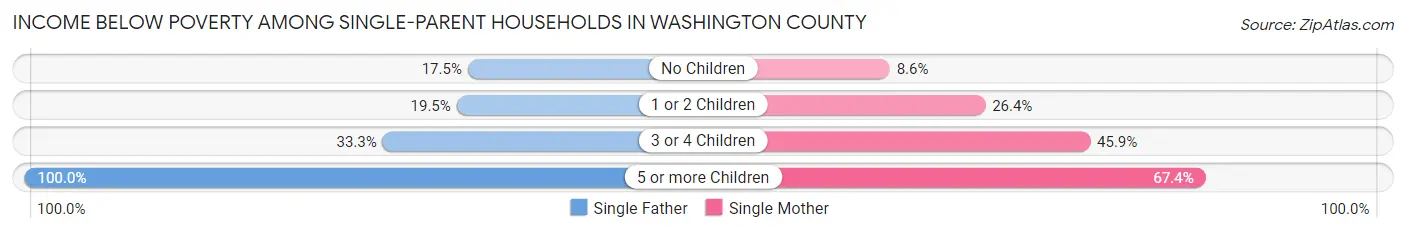
| Children | Single Father | Single Mother |
| No Children | 335 (17.5%) | 286 (8.6%) |
| 1 or 2 Children | 636 (19.5%) | 1,273 (26.4%) |
| 3 or 4 Children | 91 (33.3%) | 622 (45.9%) |
| 5 or more Children | 8 (100.0%) | 31 (67.4%) |
| Total | 1,070 (19.6%) | 2,212 (23.1%) |
Income Below Poverty Among Married-Couple vs Single-Parent Households in Washington County
The poverty data for Washington County shows that 2,097 of the married-couple family households (4.9%) and 3,282 of the single-parent households (21.8%) are living below the poverty level. Within the married-couple family households, those with 5 or more children have the highest poverty rate, with 65 households (18.4%) falling below the poverty line. Among the single-parent households, those with 5 or more children have the highest poverty rate, with 39 household (72.2%) living below poverty.
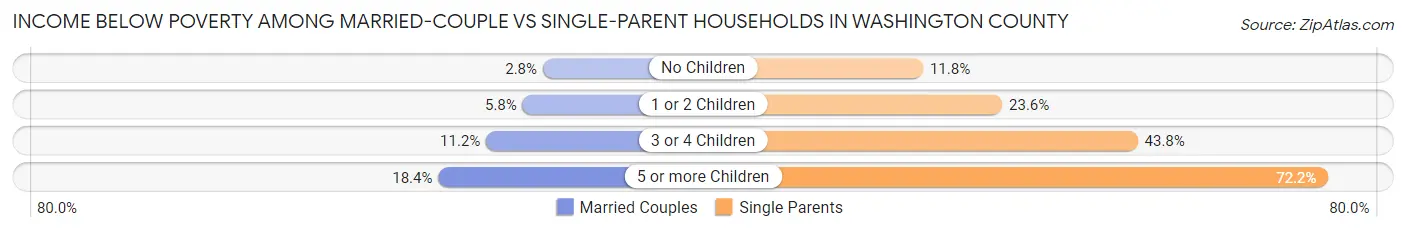
| Children | Married-Couple Families | Single-Parent Households |
| No Children | 630 (2.8%) | 621 (11.8%) |
| 1 or 2 Children | 889 (5.8%) | 1,909 (23.6%) |
| 3 or 4 Children | 513 (11.2%) | 713 (43.8%) |
| 5 or more Children | 65 (18.4%) | 39 (72.2%) |
| Total | 2,097 (4.9%) | 3,282 (21.8%) |
Race in Washington County
The most populous races in Washington County are White / Caucasian (174,159 | 70.4%), Hispanic or Latino (42,812 | 17.3%), and Two or more Races (32,101 | 13.0%).
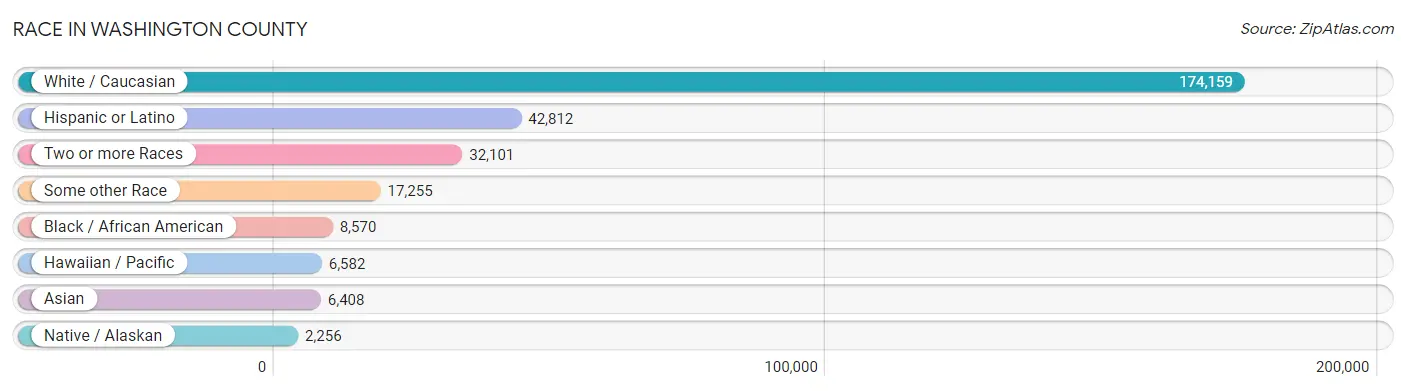
| Race | # Population | % Population |
| Asian | 6,408 | 2.6% |
| Black / African American | 8,570 | 3.5% |
| Hawaiian / Pacific | 6,582 | 2.7% |
| Hispanic or Latino | 42,812 | 17.3% |
| Native / Alaskan | 2,256 | 0.9% |
| White / Caucasian | 174,159 | 70.4% |
| Two or more Races | 32,101 | 13.0% |
| Some other Race | 17,255 | 7.0% |
| Total | 247,331 | 100.0% |
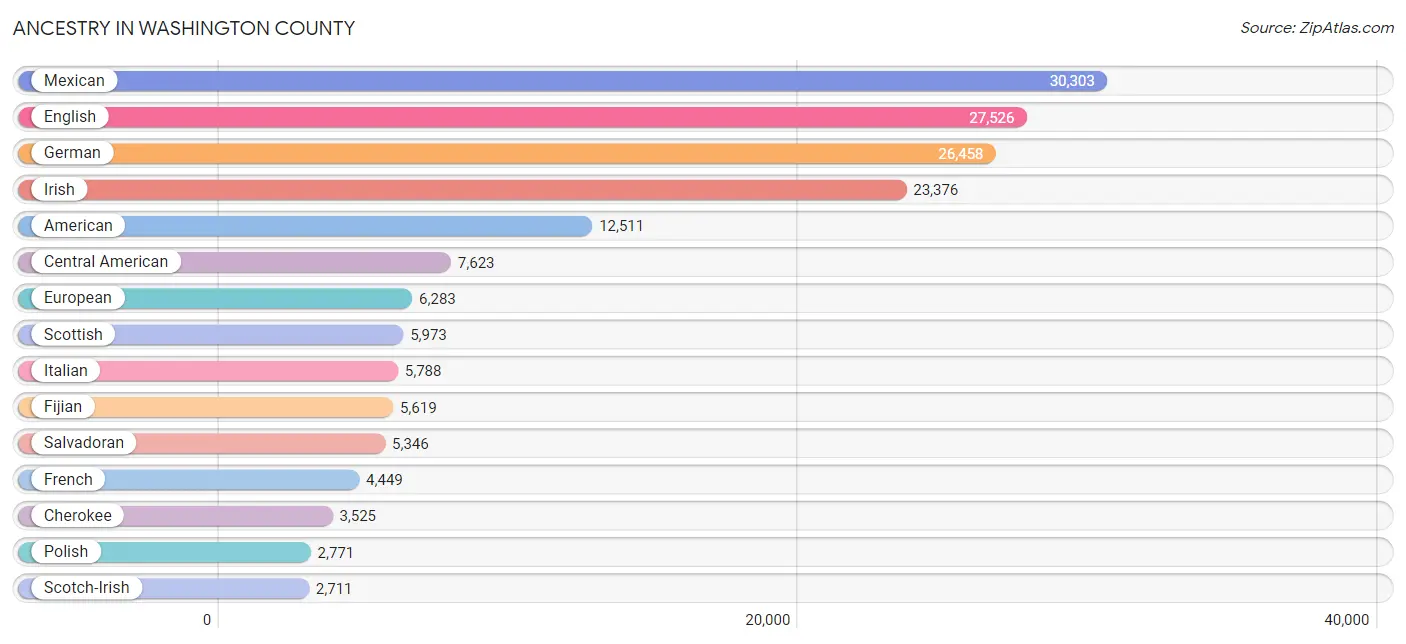
Ancestry in Washington County
The most populous ancestries reported in Washington County are Mexican (30,303 | 12.2%), English (27,526 | 11.1%), German (26,458 | 10.7%), Irish (23,376 | 9.5%), and American (12,511 | 5.1%), together accounting for 48.6% of all Washington County residents.
| Ancestry | # Population | % Population |
| Afghan | 25 | 0.0% |
| African | 702 | 0.3% |
| Alaska Native | 12 | 0.0% |
| Albanian | 22 | 0.0% |
| American | 12,511 | 5.1% |
| Apache | 189 | 0.1% |
| Arab | 1,059 | 0.4% |
| Argentinean | 78 | 0.0% |
| Armenian | 20 | 0.0% |
| Australian | 20 | 0.0% |
| Austrian | 341 | 0.1% |
| Bahamian | 5 | 0.0% |
| Bangladeshi | 518 | 0.2% |
| Barbadian | 14 | 0.0% |
| Belgian | 71 | 0.0% |
| Belizean | 6 | 0.0% |
| Bhutanese | 776 | 0.3% |
| Blackfeet | 100 | 0.0% |
| Bolivian | 95 | 0.0% |
| Brazilian | 430 | 0.2% |
| British | 2,226 | 0.9% |
| Bulgarian | 55 | 0.0% |
| Burmese | 389 | 0.2% |
| Cajun | 63 | 0.0% |
| Canadian | 263 | 0.1% |
| Celtic | 21 | 0.0% |
| Central American | 7,623 | 3.1% |
| Central American Indian | 242 | 0.1% |
| Cherokee | 3,525 | 1.4% |
| Chickasaw | 105 | 0.0% |
| Chilean | 52 | 0.0% |
| Chinese | 16 | 0.0% |
| Chippewa | 7 | 0.0% |
| Choctaw | 769 | 0.3% |
| Colombian | 306 | 0.1% |
| Comanche | 43 | 0.0% |
| Costa Rican | 75 | 0.0% |
| Cree | 4 | 0.0% |
| Creek | 130 | 0.1% |
| Croatian | 71 | 0.0% |
| Cuban | 320 | 0.1% |
| Czech | 1,376 | 0.6% |
| Czechoslovakian | 119 | 0.1% |
| Danish | 462 | 0.2% |
| Delaware | 74 | 0.0% |
| Dominican | 15 | 0.0% |
| Dutch | 2,534 | 1.0% |
| Dutch West Indian | 95 | 0.0% |
| Eastern European | 215 | 0.1% |
| Ecuadorian | 69 | 0.0% |
| Egyptian | 14 | 0.0% |
| English | 27,526 | 11.1% |
| Estonian | 4 | 0.0% |
| European | 6,283 | 2.5% |
| Fijian | 5,619 | 2.3% |
| Filipino | 21 | 0.0% |
| Finnish | 119 | 0.1% |
| French | 4,449 | 1.8% |
| French Canadian | 473 | 0.2% |
| German | 26,458 | 10.7% |
| German Russian | 8 | 0.0% |
| Greek | 601 | 0.2% |
| Guamanian / Chamorro | 51 | 0.0% |
| Guatemalan | 1,339 | 0.5% |
| Haitian | 270 | 0.1% |
| Honduran | 734 | 0.3% |
| Hungarian | 326 | 0.1% |
| Icelander | 22 | 0.0% |
| Indian (Asian) | 1,582 | 0.6% |
| Indonesian | 127 | 0.1% |
| Iranian | 230 | 0.1% |
| Iraqi | 188 | 0.1% |
| Irish | 23,376 | 9.5% |
| Iroquois | 42 | 0.0% |
| Israeli | 23 | 0.0% |
| Italian | 5,788 | 2.3% |
| Jamaican | 138 | 0.1% |
| Japanese | 16 | 0.0% |
| Jordanian | 43 | 0.0% |
| Kenyan | 36 | 0.0% |
| Kiowa | 10 | 0.0% |
| Korean | 1,176 | 0.5% |
| Laotian | 11 | 0.0% |
| Lebanese | 321 | 0.1% |
| Lithuanian | 179 | 0.1% |
| Malaysian | 1,764 | 0.7% |
| Maltese | 22 | 0.0% |
| Mexican | 30,303 | 12.2% |
| Mexican American Indian | 564 | 0.2% |
| Mongolian | 2 | 0.0% |
| Native Hawaiian | 584 | 0.2% |
| Navajo | 71 | 0.0% |
| Nigerian | 89 | 0.0% |
| Northern European | 419 | 0.2% |
| Norwegian | 1,622 | 0.7% |
| Okinawan | 159 | 0.1% |
| Osage | 78 | 0.0% |
| Pakistani | 233 | 0.1% |
| Palestinian | 45 | 0.0% |
| Panamanian | 129 | 0.1% |
| Pennsylvania German | 18 | 0.0% |
| Peruvian | 115 | 0.1% |
| Polish | 2,771 | 1.1% |
| Portuguese | 256 | 0.1% |
| Potawatomi | 90 | 0.0% |
| Pueblo | 4 | 0.0% |
| Puerto Rican | 1,384 | 0.6% |
| Romanian | 111 | 0.0% |
| Russian | 408 | 0.2% |
| Salvadoran | 5,346 | 2.2% |
| Samoan | 496 | 0.2% |
| Scandinavian | 745 | 0.3% |
| Scotch-Irish | 2,711 | 1.1% |
| Scottish | 5,973 | 2.4% |
| Serbian | 97 | 0.0% |
| Shoshone | 3 | 0.0% |
| Sioux | 25 | 0.0% |
| Slavic | 88 | 0.0% |
| Slovak | 111 | 0.0% |
| South African | 73 | 0.0% |
| South American | 914 | 0.4% |
| Spaniard | 468 | 0.2% |
| Spanish | 509 | 0.2% |
| Spanish American | 14 | 0.0% |
| Sri Lankan | 624 | 0.3% |
| Subsaharan African | 1,191 | 0.5% |
| Swedish | 1,498 | 0.6% |
| Swiss | 383 | 0.2% |
| Syrian | 78 | 0.0% |
| Thai | 712 | 0.3% |
| Tongan | 12 | 0.0% |
| Turkish | 72 | 0.0% |
| Ukrainian | 350 | 0.1% |
| Uruguayan | 27 | 0.0% |
| Venezuelan | 172 | 0.1% |
| Vietnamese | 247 | 0.1% |
| Welsh | 1,679 | 0.7% |
| West Indian | 15 | 0.0% |
| Yup'ik | 4 | 0.0% |
| Zimbabwean | 44 | 0.0% | View All 140 Rows |
Immigrants in Washington County
The most numerous immigrant groups reported in Washington County came from Latin America (17,223 | 7.0%), Central America (15,776 | 6.4%), Mexico (11,440 | 4.6%), Asia (4,473 | 1.8%), and Oceania (4,405 | 1.8%), together accounting for 21.6% of all Washington County residents.
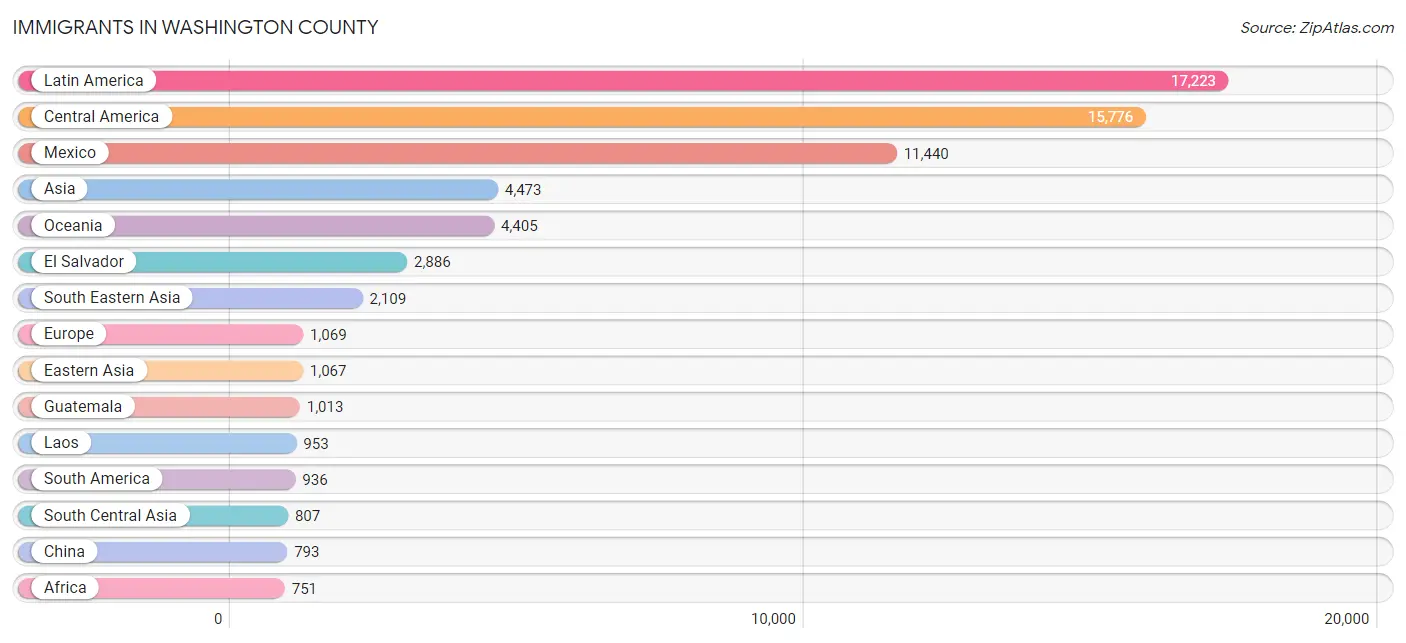
| Immigration Origin | # Population | % Population |
| Afghanistan | 29 | 0.0% |
| Africa | 751 | 0.3% |
| Argentina | 68 | 0.0% |
| Asia | 4,473 | 1.8% |
| Australia | 20 | 0.0% |
| Bahamas | 67 | 0.0% |
| Bangladesh | 243 | 0.1% |
| Barbados | 14 | 0.0% |
| Belarus | 3 | 0.0% |
| Belgium | 16 | 0.0% |
| Belize | 6 | 0.0% |
| Bolivia | 24 | 0.0% |
| Brazil | 388 | 0.2% |
| Bulgaria | 20 | 0.0% |
| Cambodia | 40 | 0.0% |
| Cameroon | 205 | 0.1% |
| Canada | 284 | 0.1% |
| Caribbean | 511 | 0.2% |
| Central America | 15,776 | 6.4% |
| China | 793 | 0.3% |
| Colombia | 198 | 0.1% |
| Congo | 10 | 0.0% |
| Costa Rica | 98 | 0.0% |
| Cuba | 16 | 0.0% |
| Czechoslovakia | 121 | 0.1% |
| Denmark | 15 | 0.0% |
| Eastern Africa | 246 | 0.1% |
| Eastern Asia | 1,067 | 0.4% |
| Eastern Europe | 358 | 0.1% |
| Ecuador | 64 | 0.0% |
| Egypt | 14 | 0.0% |
| El Salvador | 2,886 | 1.2% |
| England | 147 | 0.1% |
| Europe | 1,069 | 0.4% |
| France | 19 | 0.0% |
| Germany | 252 | 0.1% |
| Greece | 9 | 0.0% |
| Guatemala | 1,013 | 0.4% |
| Haiti | 324 | 0.1% |
| Honduras | 207 | 0.1% |
| Hong Kong | 2 | 0.0% |
| India | 306 | 0.1% |
| Indonesia | 138 | 0.1% |
| Iran | 161 | 0.1% |
| Iraq | 166 | 0.1% |
| Ireland | 13 | 0.0% |
| Israel | 6 | 0.0% |
| Italy | 13 | 0.0% |
| Jamaica | 90 | 0.0% |
| Japan | 179 | 0.1% |
| Jordan | 110 | 0.0% |
| Kenya | 48 | 0.0% |
| Korea | 95 | 0.0% |
| Laos | 953 | 0.4% |
| Latin America | 17,223 | 7.0% |
| Malaysia | 35 | 0.0% |
| Mexico | 11,440 | 4.6% |
| Middle Africa | 288 | 0.1% |
| Moldova | 40 | 0.0% |
| Nepal | 49 | 0.0% |
| Netherlands | 23 | 0.0% |
| Nigeria | 89 | 0.0% |
| Northern Africa | 58 | 0.0% |
| Northern Europe | 350 | 0.1% |
| Oceania | 4,405 | 1.8% |
| Pakistan | 3 | 0.0% |
| Panama | 105 | 0.0% |
| Peru | 101 | 0.0% |
| Philippines | 399 | 0.2% |
| Poland | 64 | 0.0% |
| Romania | 44 | 0.0% |
| Russia | 32 | 0.0% |
| Saudi Arabia | 58 | 0.0% |
| Scotland | 29 | 0.0% |
| Singapore | 62 | 0.0% |
| South Africa | 50 | 0.0% |
| South America | 936 | 0.4% |
| South Central Asia | 807 | 0.3% |
| South Eastern Asia | 2,109 | 0.9% |
| Southern Europe | 51 | 0.0% |
| Spain | 29 | 0.0% |
| Sri Lanka | 16 | 0.0% |
| Sweden | 34 | 0.0% |
| Taiwan | 27 | 0.0% |
| Thailand | 156 | 0.1% |
| Turkey | 61 | 0.0% |
| Ukraine | 34 | 0.0% |
| Venezuela | 74 | 0.0% |
| Vietnam | 217 | 0.1% |
| Western Africa | 89 | 0.0% |
| Western Asia | 490 | 0.2% |
| Western Europe | 310 | 0.1% |
| Zaire | 73 | 0.0% |
| Zimbabwe | 44 | 0.0% | View All 94 Rows |
Sex and Age in Washington County
Sex and Age in Washington County
The most populous age groups in Washington County are 20 to 24 Years (13,627 | 10.9%) for men and 20 to 24 Years (12,743 | 10.4%) for women.
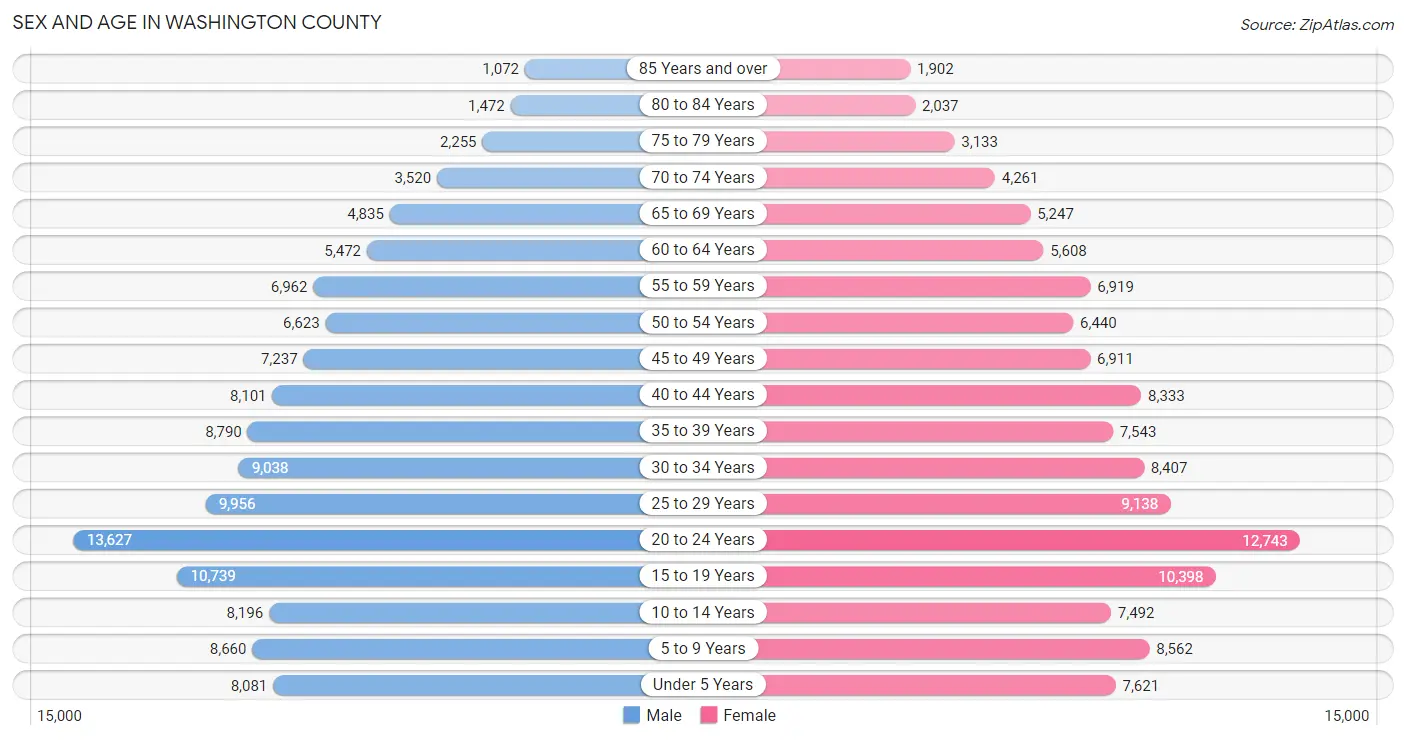
| Age Bracket | Male | Female |
| Under 5 Years | 8,081 (6.5%) | 7,621 (6.2%) |
| 5 to 9 Years | 8,660 (7.0%) | 8,562 (7.0%) |
| 10 to 14 Years | 8,196 (6.6%) | 7,492 (6.1%) |
| 15 to 19 Years | 10,739 (8.6%) | 10,398 (8.5%) |
| 20 to 24 Years | 13,627 (10.9%) | 12,743 (10.4%) |
| 25 to 29 Years | 9,956 (8.0%) | 9,138 (7.4%) |
| 30 to 34 Years | 9,038 (7.2%) | 8,407 (6.9%) |
| 35 to 39 Years | 8,790 (7.0%) | 7,543 (6.1%) |
| 40 to 44 Years | 8,101 (6.5%) | 8,333 (6.8%) |
| 45 to 49 Years | 7,237 (5.8%) | 6,911 (5.6%) |
| 50 to 54 Years | 6,623 (5.3%) | 6,440 (5.2%) |
| 55 to 59 Years | 6,962 (5.6%) | 6,919 (5.6%) |
| 60 to 64 Years | 5,472 (4.4%) | 5,608 (4.6%) |
| 65 to 69 Years | 4,835 (3.9%) | 5,247 (4.3%) |
| 70 to 74 Years | 3,520 (2.8%) | 4,261 (3.5%) |
| 75 to 79 Years | 2,255 (1.8%) | 3,133 (2.5%) |
| 80 to 84 Years | 1,472 (1.2%) | 2,037 (1.7%) |
| 85 Years and over | 1,072 (0.9%) | 1,902 (1.5%) |
| Total | 124,636 (100.0%) | 122,695 (100.0%) |
Families and Households in Washington County
Median Family Size in Washington County
The median family size in Washington County is 3.15 persons per family, with married-couple families (43,000 | 74.1%) accounting for the largest median family size of 3.23 persons per family. On the other hand, single male/father families (5,457 | 9.4%) represent the smallest median family size with 2.62 persons per family.
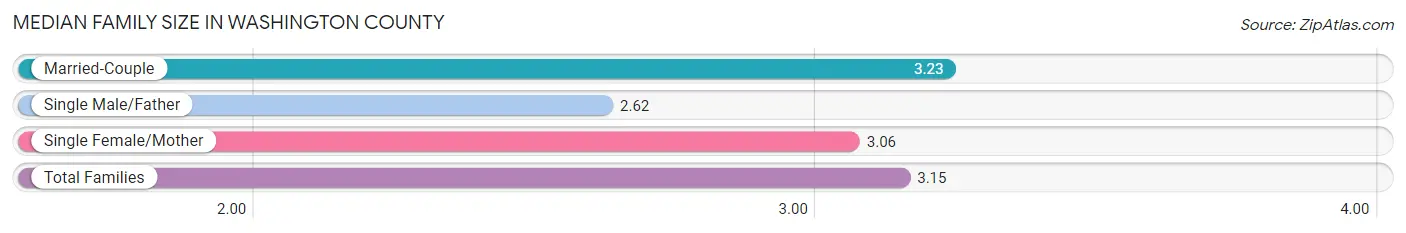
| Family Type | # Families | Family Size |
| Married-Couple | 43,000 (74.1%) | 3.23 |
| Single Male/Father | 5,457 (9.4%) | 2.62 |
| Single Female/Mother | 9,564 (16.5%) | 3.06 |
| Total Families | 58,021 (100.0%) | 3.15 |
Median Household Size in Washington County
The median household size in Washington County is 2.55 persons per household, with single female/mother households (9,564 | 10.2%) accounting for the largest median household size of 3.34 persons per household. non-family households (35,760 | 38.1%) represent the smallest median household size with 1.44 persons per household.
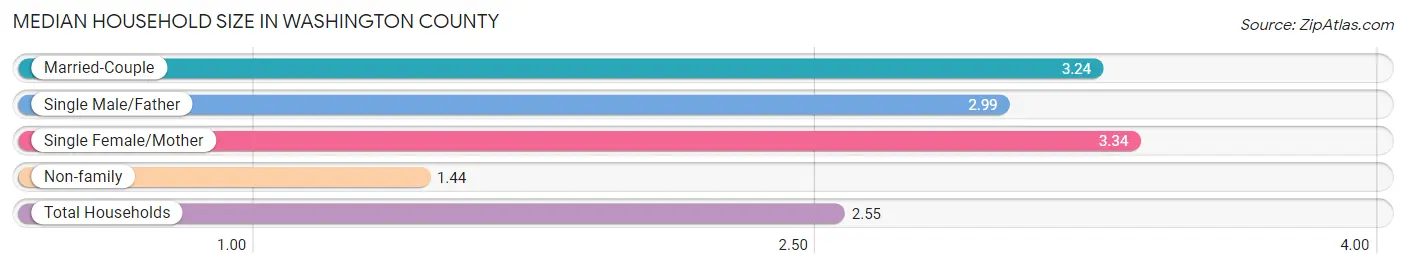
| Household Type | # Households | Household Size |
| Married-Couple | 43,000 (45.9%) | 3.24 |
| Single Male/Father | 5,457 (5.8%) | 2.99 |
| Single Female/Mother | 9,564 (10.2%) | 3.34 |
| Non-family | 35,760 (38.1%) | 1.44 |
| Total Households | 93,781 (100.0%) | 2.55 |
Household Size by Marriage Status in Washington County
Out of a total of 93,781 households in Washington County, 58,021 (61.9%) are family households, while 35,760 (38.1%) are nonfamily households. The most numerous type of family households are 2-person households, comprising 24,003, and the most common type of nonfamily households are 1-person households, comprising 26,050.
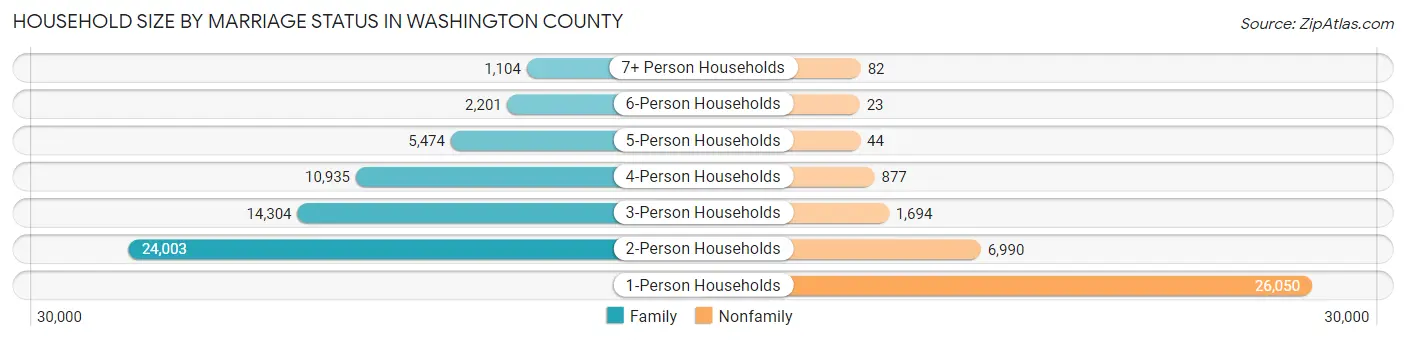
| Household Size | Family Households | Nonfamily Households |
| 1-Person Households | - | 26,050 (27.8%) |
| 2-Person Households | 24,003 (25.6%) | 6,990 (7.4%) |
| 3-Person Households | 14,304 (15.2%) | 1,694 (1.8%) |
| 4-Person Households | 10,935 (11.7%) | 877 (0.9%) |
| 5-Person Households | 5,474 (5.8%) | 44 (0.1%) |
| 6-Person Households | 2,201 (2.4%) | 23 (0.0%) |
| 7+ Person Households | 1,104 (1.2%) | 82 (0.1%) |
| Total | 58,021 (61.9%) | 35,760 (38.1%) |
Female Fertility in Washington County
Fertility by Age in Washington County
Average fertility rate in Washington County is 53.0 births per 1,000 women. Women in the age bracket of 20 to 34 years have the highest fertility rate with 93.0 births per 1,000 women. Women in the age bracket of 20 to 34 years acount for 81.1% of all women with births.
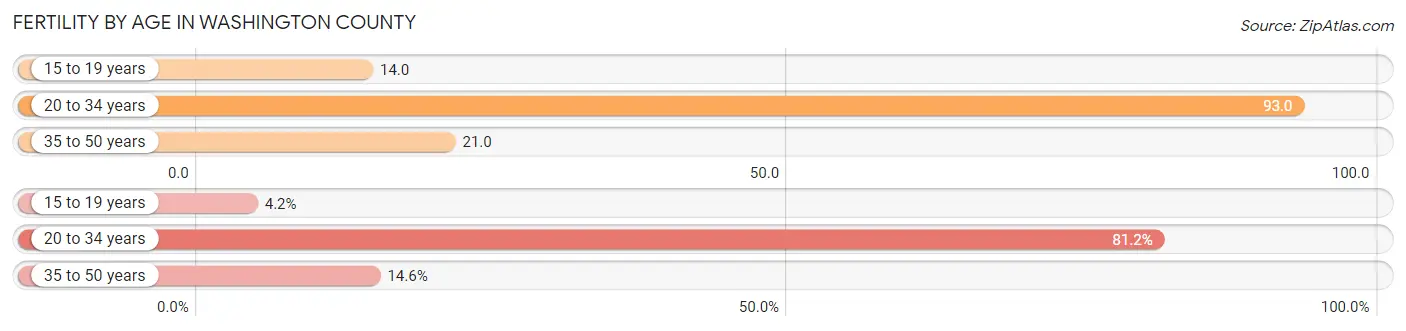
| Age Bracket | Women with Births | Births / 1,000 Women |
| 15 to 19 years | 146 (4.2%) | 14.0 |
| 20 to 34 years | 2,807 (81.1%) | 93.0 |
| 35 to 50 years | 506 (14.6%) | 21.0 |
| Total | 3,459 (100.0%) | 53.0 |
Fertility by Age by Marriage Status in Washington County
74.1% of women with births (3,459) in Washington County are married. The highest percentage of unmarried women with births falls into 15 to 19 years age bracket with 40.4% of them unmarried at the time of birth, while the lowest percentage of unmarried women with births belong to 20 to 34 years age bracket with 23.9% of them unmarried.
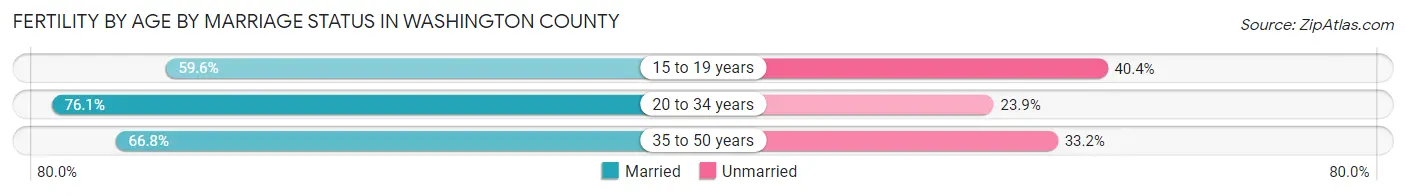
| Age Bracket | Married | Unmarried |
| 15 to 19 years | 87 (59.6%) | 59 (40.4%) |
| 20 to 34 years | 2,136 (76.1%) | 671 (23.9%) |
| 35 to 50 years | 338 (66.8%) | 168 (33.2%) |
| Total | 2,563 (74.1%) | 896 (25.9%) |
Fertility by Education in Washington County
Average fertility rate in Washington County is 53.0 births per 1,000 women. Women with the education attainment of graduate degree have the highest fertility rate of 69.0 births per 1,000 women, while women with the education attainment of college or associate's degree have the lowest fertility at 49.0 births per 1,000 women. Women with the education attainment of college or associate's degree represent 31.8% of all women with births.
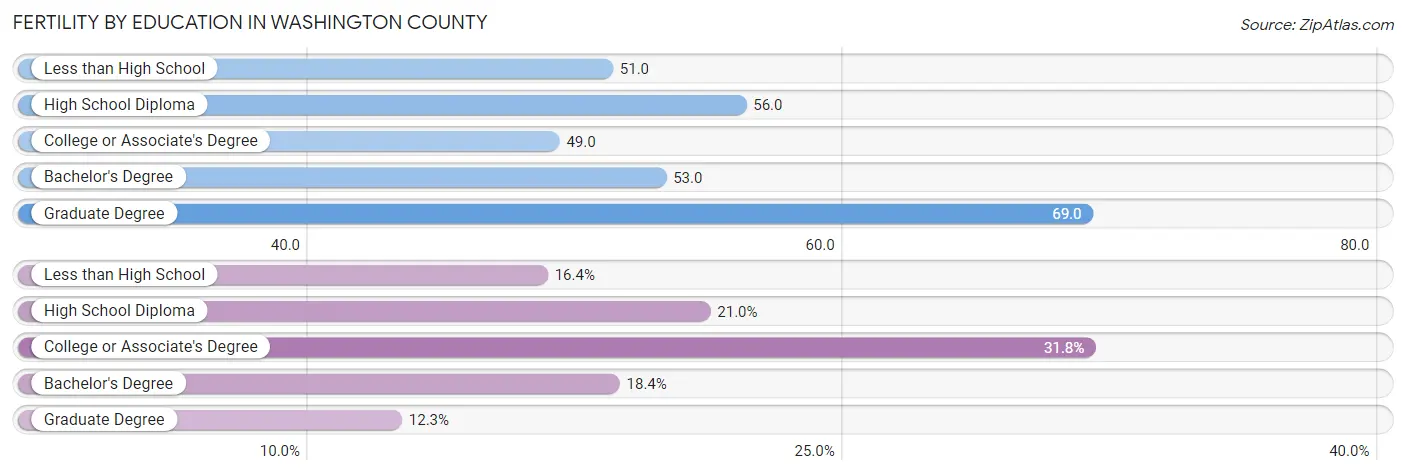
| Educational Attainment | Women with Births | Births / 1,000 Women |
| Less than High School | 568 (16.4%) | 51.0 |
| High School Diploma | 726 (21.0%) | 56.0 |
| College or Associate's Degree | 1,101 (31.8%) | 49.0 |
| Bachelor's Degree | 638 (18.4%) | 53.0 |
| Graduate Degree | 426 (12.3%) | 69.0 |
| Total | 3,459 (100.0%) | 53.0 |
Fertility by Education by Marriage Status in Washington County
25.9% of women with births in Washington County are unmarried. Women with the educational attainment of graduate degree are most likely to be married with 100.0% of them married at childbirth, while women with the educational attainment of high school diploma are least likely to be married with 50.8% of them unmarried at childbirth.
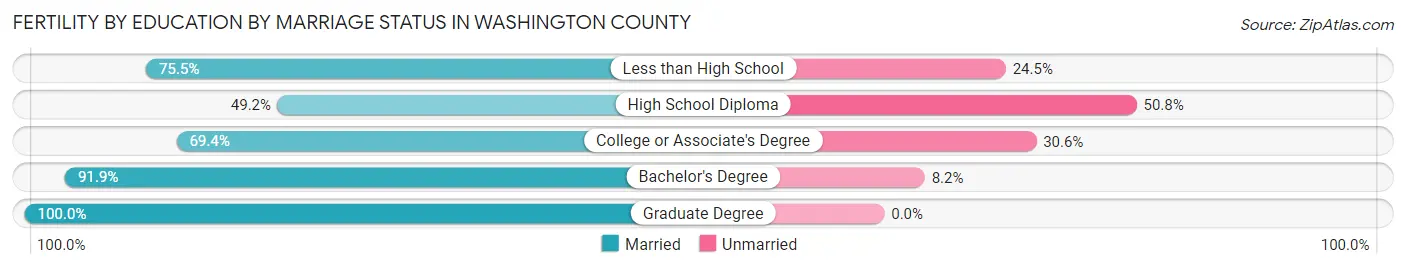
| Educational Attainment | Married | Unmarried |
| Less than High School | 429 (75.5%) | 139 (24.5%) |
| High School Diploma | 357 (49.2%) | 369 (50.8%) |
| College or Associate's Degree | 764 (69.4%) | 337 (30.6%) |
| Bachelor's Degree | 586 (91.8%) | 52 (8.2%) |
| Graduate Degree | 426 (100.0%) | 0 (0.0%) |
| Total | 2,563 (74.1%) | 896 (25.9%) |
Employment Characteristics in Washington County
Employment by Class of Employer in Washington County
Among the 119,440 employed individuals in Washington County, private company employees (81,443 | 68.2%), not-for-profit organizations (9,382 | 7.9%), and self-employed (not incorporated) (8,408 | 7.0%) make up the most common classes of employment.
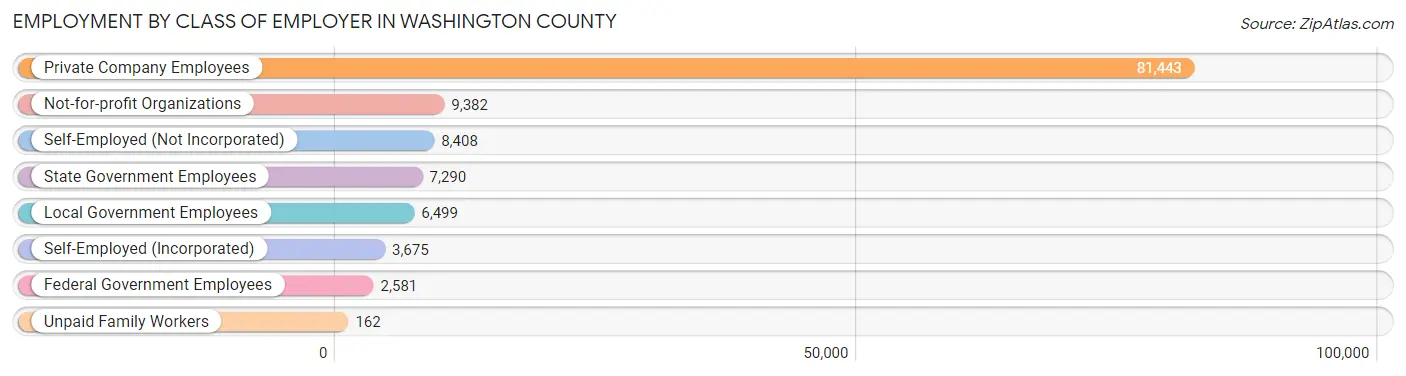
| Employer Class | # Employees | % Employees |
| Private Company Employees | 81,443 | 68.2% |
| Self-Employed (Incorporated) | 3,675 | 3.1% |
| Self-Employed (Not Incorporated) | 8,408 | 7.0% |
| Not-for-profit Organizations | 9,382 | 7.9% |
| Local Government Employees | 6,499 | 5.4% |
| State Government Employees | 7,290 | 6.1% |
| Federal Government Employees | 2,581 | 2.2% |
| Unpaid Family Workers | 162 | 0.1% |
| Total | 119,440 | 100.0% |
Employment Status by Age in Washington County
According to the labor force statistics for Washington County, out of the total population over 16 years of age (195,388), 64.7% or 126,416 individuals are in the labor force, with 4.3% or 5,436 of them unemployed. The age group with the highest labor force participation rate is 25 to 29 years, with 86.4% or 16,497 individuals in the labor force. Within the labor force, the 16 to 19 years age range has the highest percentage of unemployed individuals, with 19.7% or 1,301 of them being unemployed.
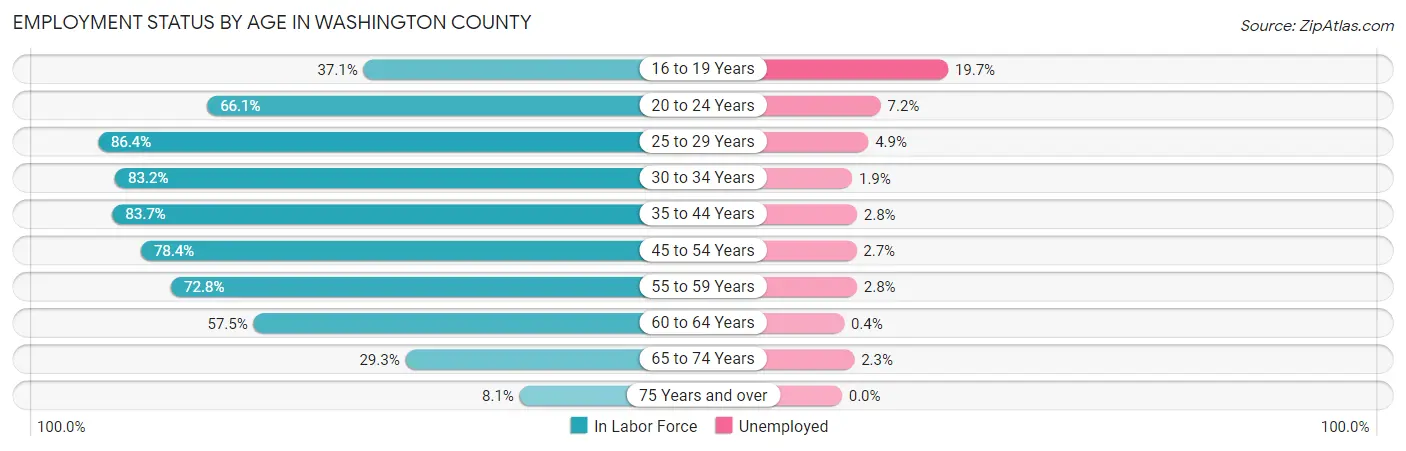
| Age Bracket | In Labor Force | Unemployed |
| 16 to 19 Years | 6,606 (37.1%) | 1,301 (19.7%) |
| 20 to 24 Years | 17,431 (66.1%) | 1,255 (7.2%) |
| 25 to 29 Years | 16,497 (86.4%) | 808 (4.9%) |
| 30 to 34 Years | 14,514 (83.2%) | 276 (1.9%) |
| 35 to 44 Years | 27,426 (83.7%) | 768 (2.8%) |
| 45 to 54 Years | 21,333 (78.4%) | 576 (2.7%) |
| 55 to 59 Years | 10,105 (72.8%) | 283 (2.8%) |
| 60 to 64 Years | 6,371 (57.5%) | 25 (0.4%) |
| 65 to 74 Years | 5,234 (29.3%) | 120 (2.3%) |
| 75 Years and over | 962 (8.1%) | 0 (0.0%) |
| Total | 126,416 (64.7%) | 5,436 (4.3%) |
Employment Status by Educational Attainment in Washington County
According to labor force statistics for Washington County, 79.2% of individuals (96,211) out of the total population between 25 and 64 years of age (121,478) are in the labor force, with 2.9% or 2,790 of them being unemployed. The group with the highest labor force participation rate are those with the educational attainment of bachelor's degree or higher, with 85.9% or 37,393 individuals in the labor force. Within the labor force, individuals with high school diploma education have the highest percentage of unemployment, with 4.2% or 1,006 of them being unemployed.
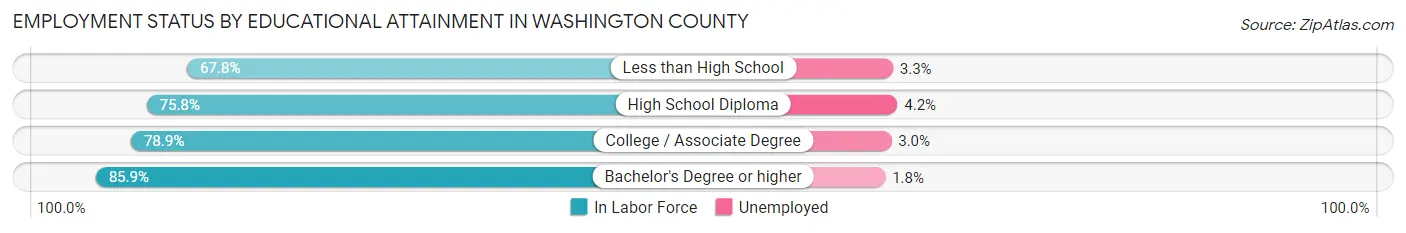
| Educational Attainment | In Labor Force | Unemployed |
| Less than High School | 10,394 (67.8%) | 506 (3.3%) |
| High School Diploma | 23,945 (75.8%) | 1,327 (4.2%) |
| College / Associate Degree | 24,480 (78.9%) | 931 (3.0%) |
| Bachelor's Degree or higher | 37,393 (85.9%) | 784 (1.8%) |
| Total | 96,211 (79.2%) | 3,523 (2.9%) |
Employment Occupations by Sex in Washington County
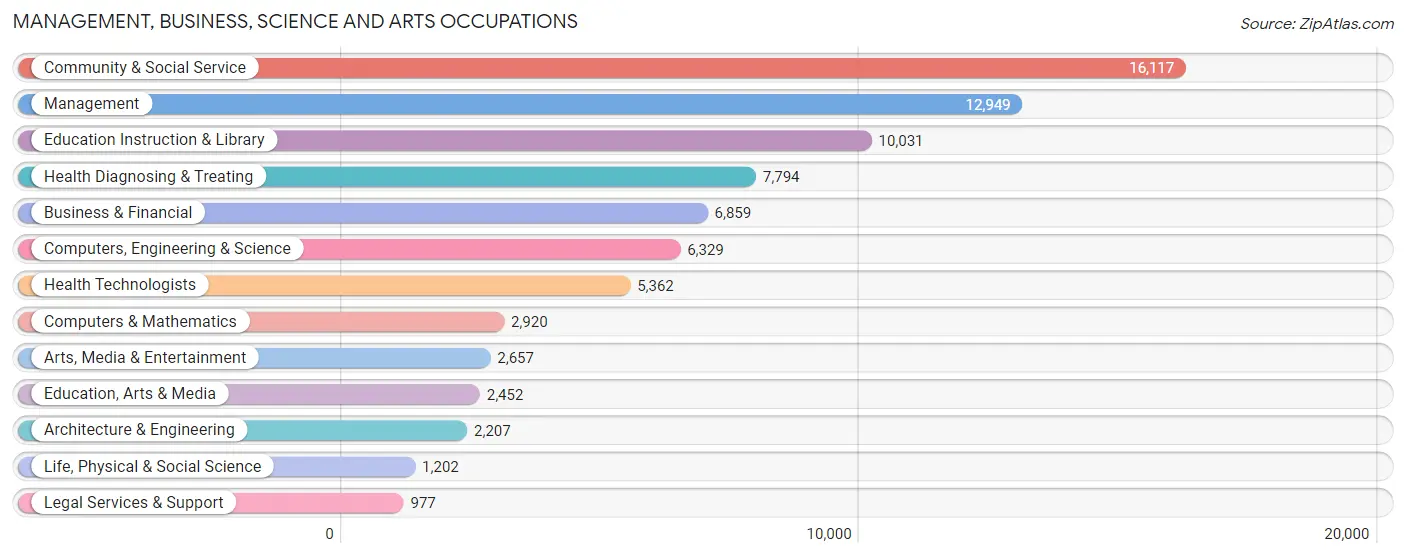
Management, Business, Science and Arts Occupations
The most common Management, Business, Science and Arts occupations in Washington County are Community & Social Service (16,117 | 13.3%), Management (12,949 | 10.7%), Education Instruction & Library (10,031 | 8.3%), Health Diagnosing & Treating (7,794 | 6.4%), and Business & Financial (6,859 | 5.7%).
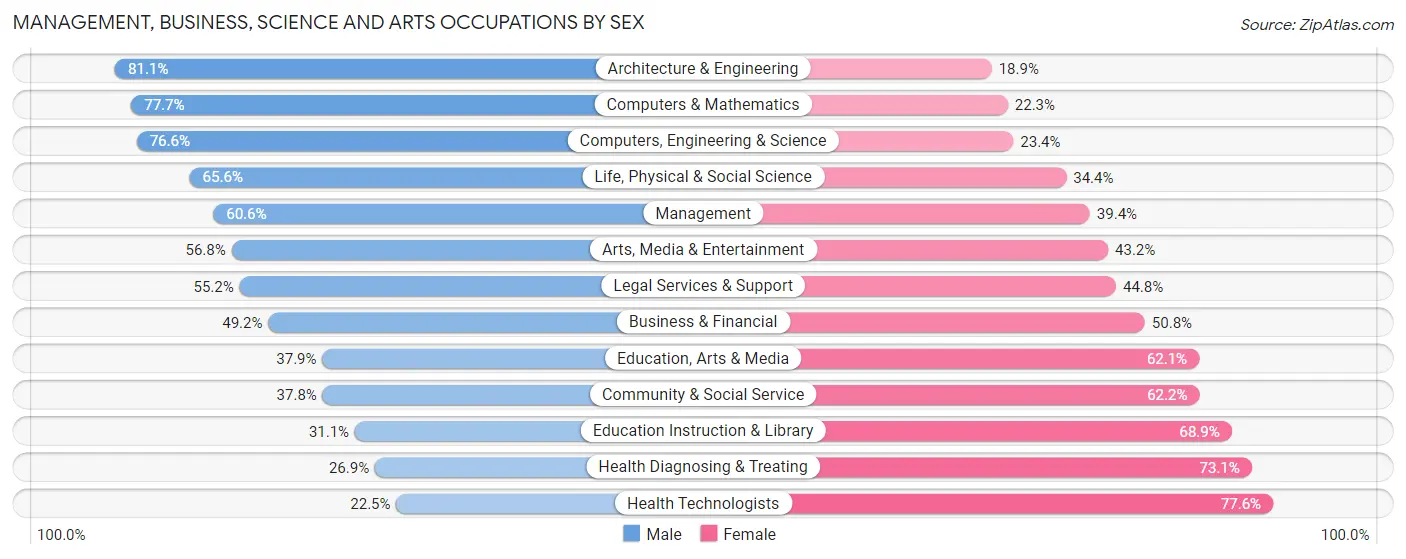
Management, Business, Science and Arts Occupations by Sex
Within the Management, Business, Science and Arts occupations in Washington County, the most male-oriented occupations are Architecture & Engineering (81.1%), Computers & Mathematics (77.7%), and Computers, Engineering & Science (76.6%), while the most female-oriented occupations are Health Technologists (77.5%), Health Diagnosing & Treating (73.1%), and Education Instruction & Library (68.9%).
| Occupation | Male | Female |
| Management | 7,851 (60.6%) | 5,098 (39.4%) |
| Business & Financial | 3,372 (49.2%) | 3,487 (50.8%) |
| Computers, Engineering & Science | 4,848 (76.6%) | 1,481 (23.4%) |
| Computers & Mathematics | 2,270 (77.7%) | 650 (22.3%) |
| Architecture & Engineering | 1,790 (81.1%) | 417 (18.9%) |
| Life, Physical & Social Science | 788 (65.6%) | 414 (34.4%) |
| Community & Social Service | 6,097 (37.8%) | 10,020 (62.2%) |
| Education, Arts & Media | 929 (37.9%) | 1,523 (62.1%) |
| Legal Services & Support | 539 (55.2%) | 438 (44.8%) |
| Education Instruction & Library | 3,119 (31.1%) | 6,912 (68.9%) |
| Arts, Media & Entertainment | 1,510 (56.8%) | 1,147 (43.2%) |
| Health Diagnosing & Treating | 2,097 (26.9%) | 5,697 (73.1%) |
| Health Technologists | 1,204 (22.5%) | 4,158 (77.5%) |
| Total (Category) | 24,265 (48.5%) | 25,783 (51.5%) |
| Total (Overall) | 66,611 (55.0%) | 54,380 (45.0%) |
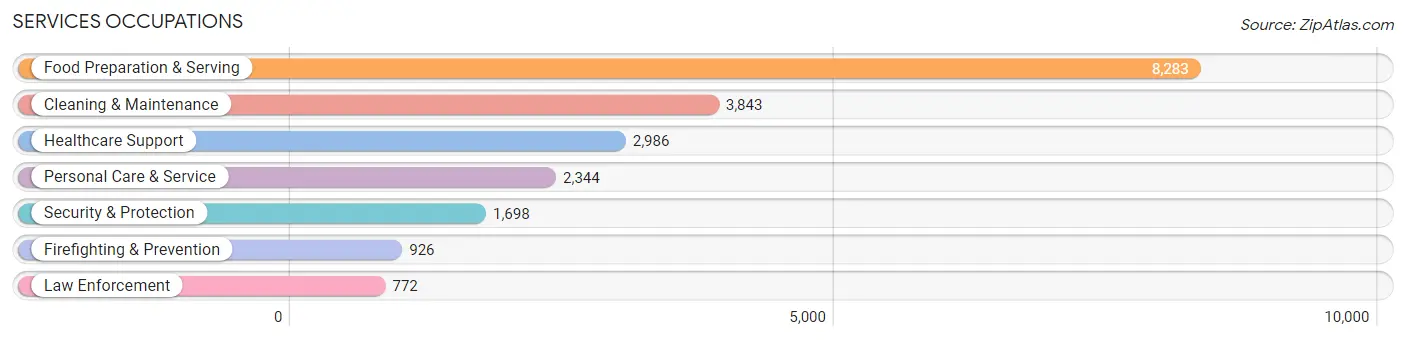
Services Occupations
The most common Services occupations in Washington County are Food Preparation & Serving (8,283 | 6.9%), Cleaning & Maintenance (3,843 | 3.2%), Healthcare Support (2,986 | 2.5%), Personal Care & Service (2,344 | 1.9%), and Security & Protection (1,698 | 1.4%).
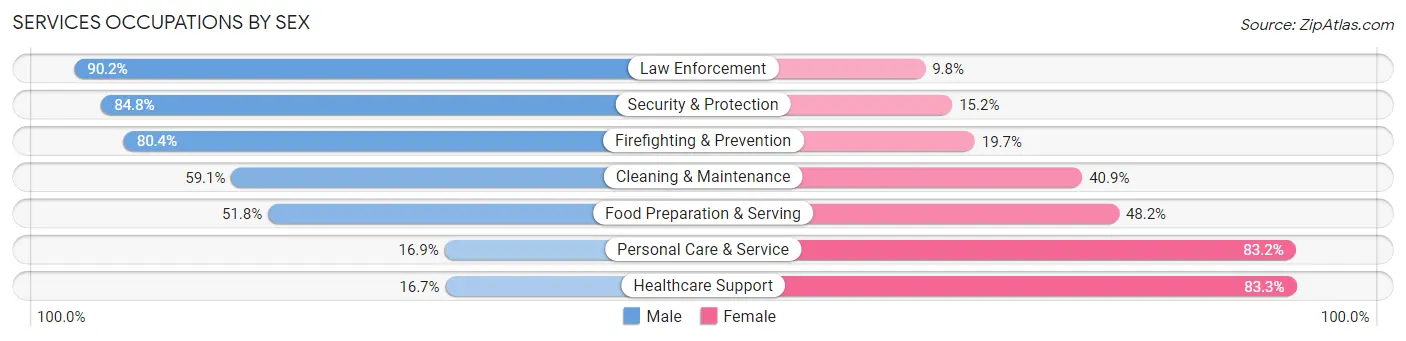
Services Occupations by Sex
Within the Services occupations in Washington County, the most male-oriented occupations are Law Enforcement (90.2%), Security & Protection (84.8%), and Firefighting & Prevention (80.3%), while the most female-oriented occupations are Healthcare Support (83.3%), Personal Care & Service (83.2%), and Food Preparation & Serving (48.2%).
| Occupation | Male | Female |
| Healthcare Support | 498 (16.7%) | 2,488 (83.3%) |
| Security & Protection | 1,440 (84.8%) | 258 (15.2%) |
| Firefighting & Prevention | 744 (80.3%) | 182 (19.7%) |
| Law Enforcement | 696 (90.2%) | 76 (9.8%) |
| Food Preparation & Serving | 4,291 (51.8%) | 3,992 (48.2%) |
| Cleaning & Maintenance | 2,270 (59.1%) | 1,573 (40.9%) |
| Personal Care & Service | 395 (16.9%) | 1,949 (83.2%) |
| Total (Category) | 8,894 (46.4%) | 10,260 (53.6%) |
| Total (Overall) | 66,611 (55.0%) | 54,380 (45.0%) |
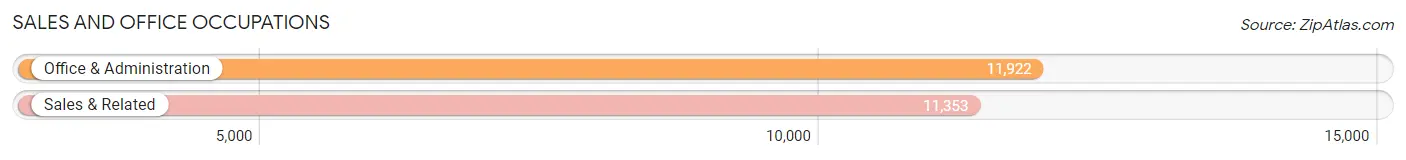
Sales and Office Occupations
The most common Sales and Office occupations in Washington County are Office & Administration (11,922 | 9.9%), and Sales & Related (11,353 | 9.4%).
Sales and Office Occupations by Sex
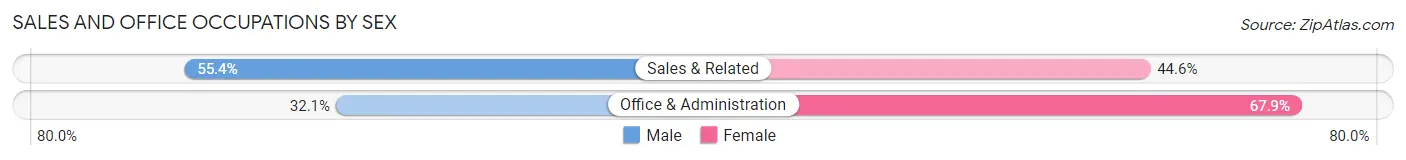
| Occupation | Male | Female |
| Sales & Related | 6,293 (55.4%) | 5,060 (44.6%) |
| Office & Administration | 3,828 (32.1%) | 8,094 (67.9%) |
| Total (Category) | 10,121 (43.5%) | 13,154 (56.5%) |
| Total (Overall) | 66,611 (55.0%) | 54,380 (45.0%) |
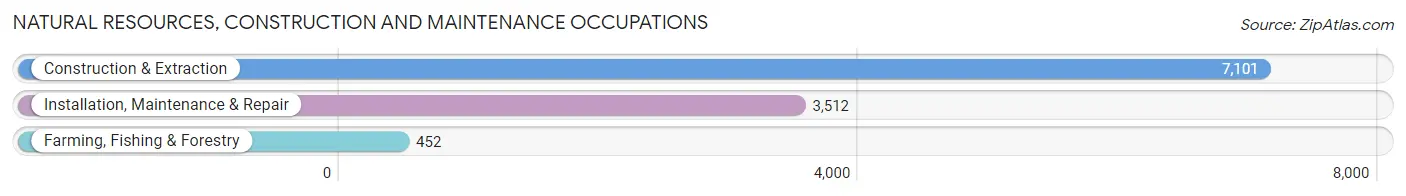
Natural Resources, Construction and Maintenance Occupations
The most common Natural Resources, Construction and Maintenance occupations in Washington County are Construction & Extraction (7,101 | 5.9%), Installation, Maintenance & Repair (3,512 | 2.9%), and Farming, Fishing & Forestry (452 | 0.4%).
Natural Resources, Construction and Maintenance Occupations by Sex
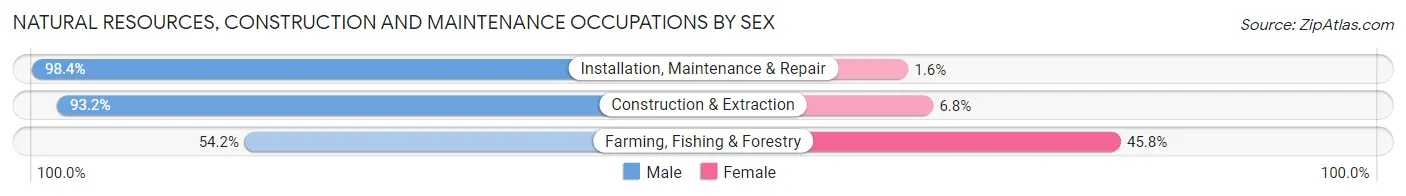
| Occupation | Male | Female |
| Farming, Fishing & Forestry | 245 (54.2%) | 207 (45.8%) |
| Construction & Extraction | 6,620 (93.2%) | 481 (6.8%) |
| Installation, Maintenance & Repair | 3,457 (98.4%) | 55 (1.6%) |
| Total (Category) | 10,322 (93.3%) | 743 (6.7%) |
| Total (Overall) | 66,611 (55.0%) | 54,380 (45.0%) |
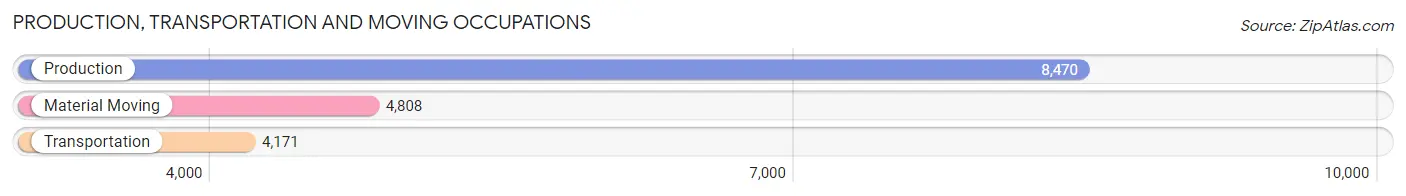
Production, Transportation and Moving Occupations
The most common Production, Transportation and Moving occupations in Washington County are Production (8,470 | 7.0%), Material Moving (4,808 | 4.0%), and Transportation (4,171 | 3.5%).
Production, Transportation and Moving Occupations by Sex
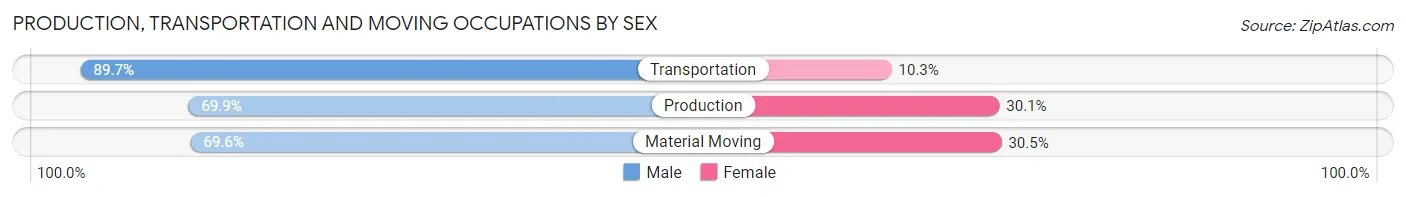
| Occupation | Male | Female |
| Production | 5,923 (69.9%) | 2,547 (30.1%) |
| Transportation | 3,742 (89.7%) | 429 (10.3%) |
| Material Moving | 3,344 (69.6%) | 1,464 (30.4%) |
| Total (Category) | 13,009 (74.6%) | 4,440 (25.5%) |
| Total (Overall) | 66,611 (55.0%) | 54,380 (45.0%) |
Employment Industries by Sex in Washington County
Employment Industries in Washington County
The major employment industries in Washington County include Health Care & Social Assistance (16,410 | 13.6%), Retail Trade (14,991 | 12.4%), Manufacturing (14,195 | 11.7%), Educational Services (13,737 | 11.4%), and Construction (10,222 | 8.5%).
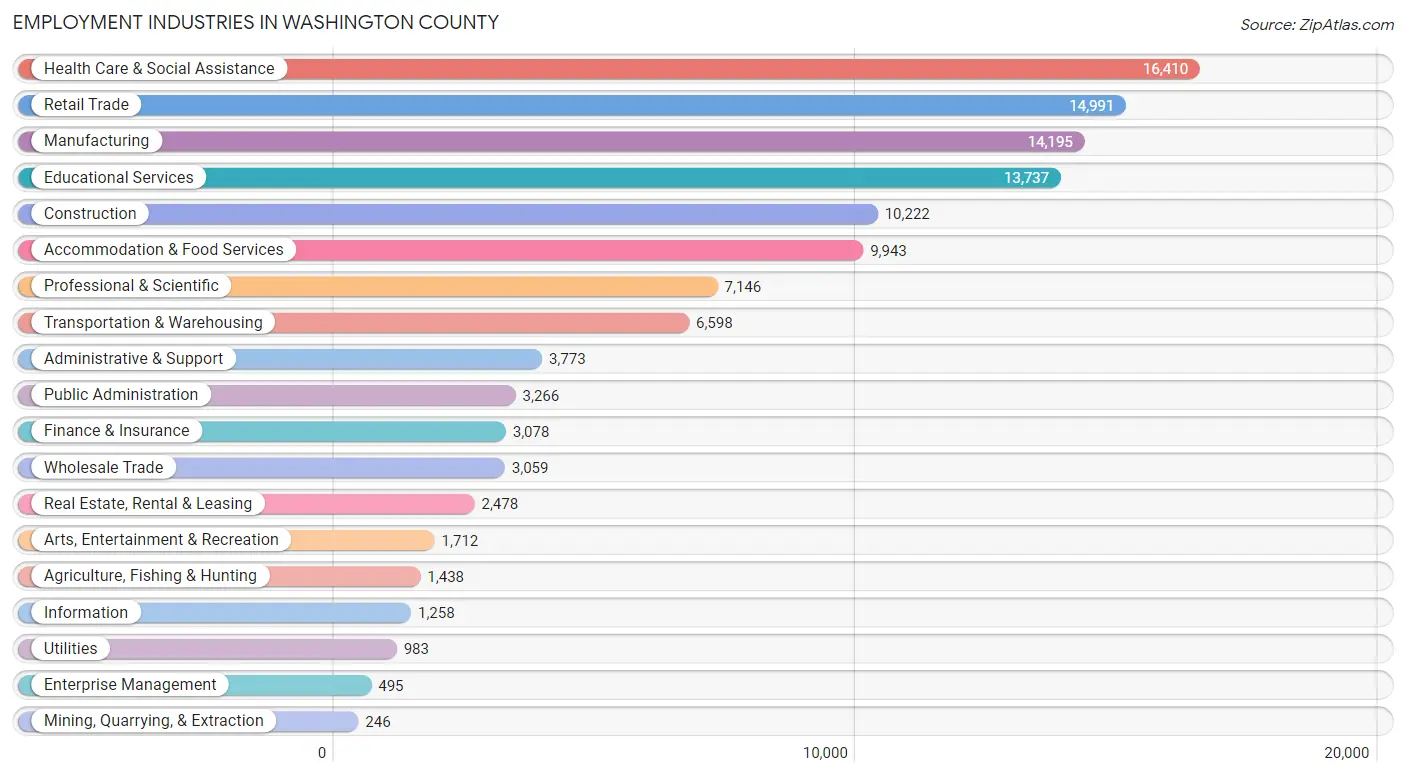
Employment Industries by Sex in Washington County
The Washington County industries that see more men than women are Mining, Quarrying, & Extraction (94.7%), Construction (91.5%), and Wholesale Trade (75.9%), whereas the industries that tend to have a higher number of women are Health Care & Social Assistance (76.4%), Educational Services (63.4%), and Finance & Insurance (49.5%).
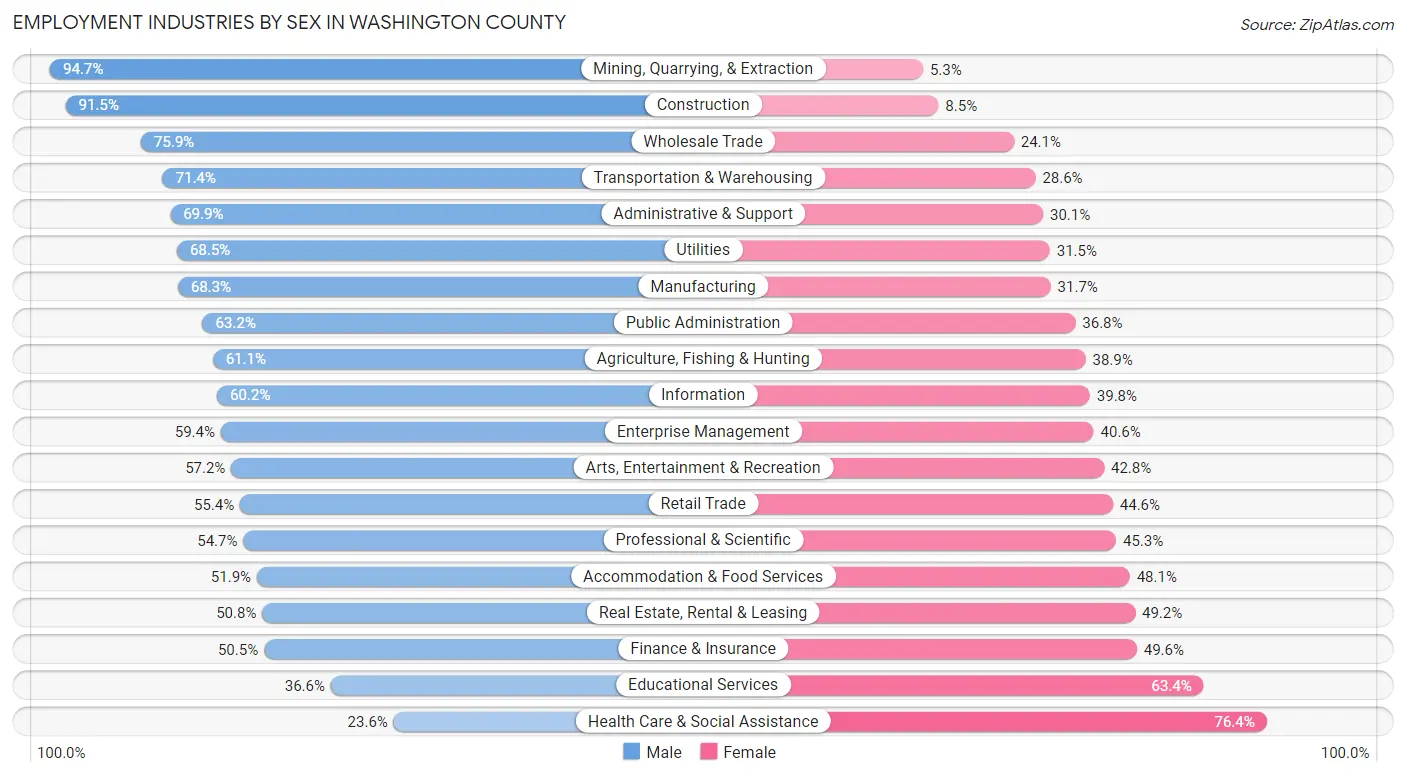
| Industry | Male | Female |
| Agriculture, Fishing & Hunting | 878 (61.1%) | 560 (38.9%) |
| Mining, Quarrying, & Extraction | 233 (94.7%) | 13 (5.3%) |
| Construction | 9,355 (91.5%) | 867 (8.5%) |
| Manufacturing | 9,693 (68.3%) | 4,502 (31.7%) |
| Wholesale Trade | 2,322 (75.9%) | 737 (24.1%) |
| Retail Trade | 8,306 (55.4%) | 6,685 (44.6%) |
| Transportation & Warehousing | 4,713 (71.4%) | 1,885 (28.6%) |
| Utilities | 673 (68.5%) | 310 (31.5%) |
| Information | 757 (60.2%) | 501 (39.8%) |
| Finance & Insurance | 1,553 (50.4%) | 1,525 (49.5%) |
| Real Estate, Rental & Leasing | 1,259 (50.8%) | 1,219 (49.2%) |
| Professional & Scientific | 3,912 (54.7%) | 3,234 (45.3%) |
| Enterprise Management | 294 (59.4%) | 201 (40.6%) |
| Administrative & Support | 2,636 (69.9%) | 1,137 (30.1%) |
| Educational Services | 5,031 (36.6%) | 8,706 (63.4%) |
| Health Care & Social Assistance | 3,874 (23.6%) | 12,536 (76.4%) |
| Arts, Entertainment & Recreation | 980 (57.2%) | 732 (42.8%) |
| Accommodation & Food Services | 5,162 (51.9%) | 4,781 (48.1%) |
| Public Administration | 2,063 (63.2%) | 1,203 (36.8%) |
| Total | 66,611 (55.0%) | 54,380 (45.0%) |
Education in Washington County
School Enrollment in Washington County
The most common levels of schooling among the 72,837 students in Washington County are college / undergraduate (22,344 | 30.7%), high school (13,357 | 18.3%), and elementary school (12,990 | 17.8%).
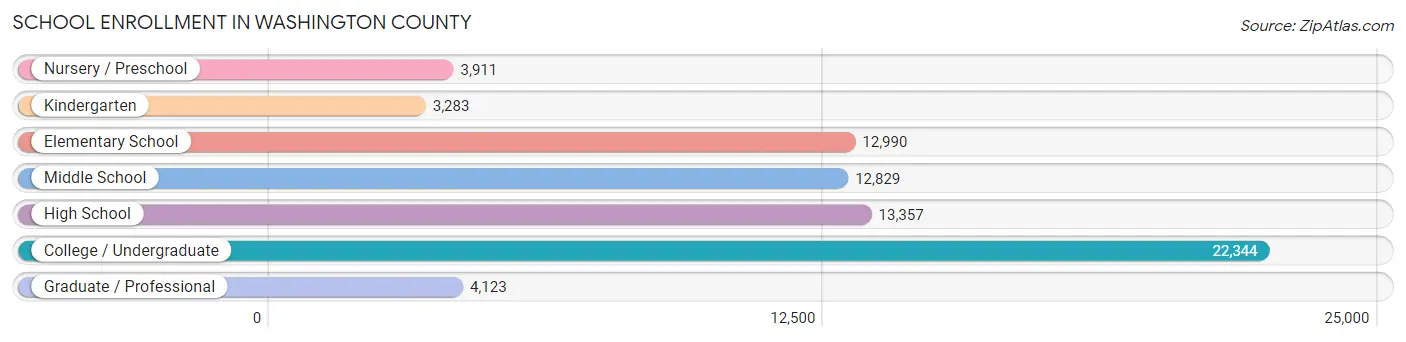
| School Level | # Students | % Students |
| Nursery / Preschool | 3,911 | 5.4% |
| Kindergarten | 3,283 | 4.5% |
| Elementary School | 12,990 | 17.8% |
| Middle School | 12,829 | 17.6% |
| High School | 13,357 | 18.3% |
| College / Undergraduate | 22,344 | 30.7% |
| Graduate / Professional | 4,123 | 5.7% |
| Total | 72,837 | 100.0% |
School Enrollment by Age by Funding Source in Washington County
Out of a total of 72,837 students who are enrolled in schools in Washington County, 7,065 (9.7%) attend a private institution, while the remaining 65,772 (90.3%) are enrolled in public schools. The age group of 3 to 4 year olds has the highest likelihood of being enrolled in private schools, with 1,082 (38.5% in the age bracket) enrolled. Conversely, the age group of 20 to 24 year olds has the lowest likelihood of being enrolled in a private school, with 13,033 (97.2% in the age bracket) attending a public institution.
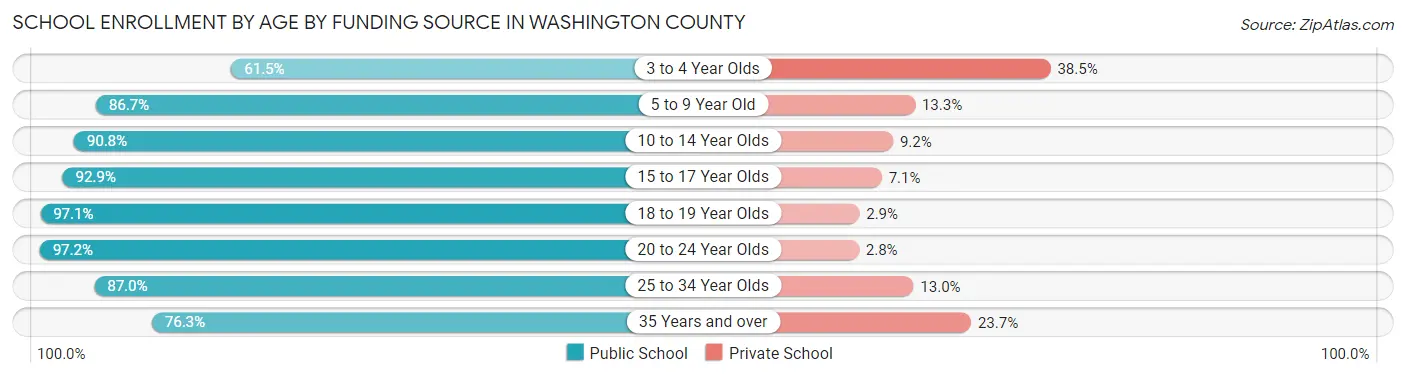
| Age Bracket | Public School | Private School |
| 3 to 4 Year Olds | 1,727 (61.5%) | 1,082 (38.5%) |
| 5 to 9 Year Old | 13,720 (86.7%) | 2,101 (13.3%) |
| 10 to 14 Year Olds | 13,886 (90.8%) | 1,403 (9.2%) |
| 15 to 17 Year Olds | 8,882 (92.9%) | 677 (7.1%) |
| 18 to 19 Year Olds | 8,669 (97.1%) | 260 (2.9%) |
| 20 to 24 Year Olds | 13,033 (97.2%) | 378 (2.8%) |
| 25 to 34 Year Olds | 4,012 (87.0%) | 599 (13.0%) |
| 35 Years and over | 1,837 (76.3%) | 571 (23.7%) |
| Total | 65,772 (90.3%) | 7,065 (9.7%) |
Educational Attainment by Field of Study in Washington County
Business (10,452 | 18.5%), education (7,896 | 14.0%), science & technology (4,995 | 8.9%), bio, nature & agricultural (4,596 | 8.2%), and social sciences (4,364 | 7.7%) are the most common fields of study among 56,404 individuals in Washington County who have obtained a bachelor's degree or higher.
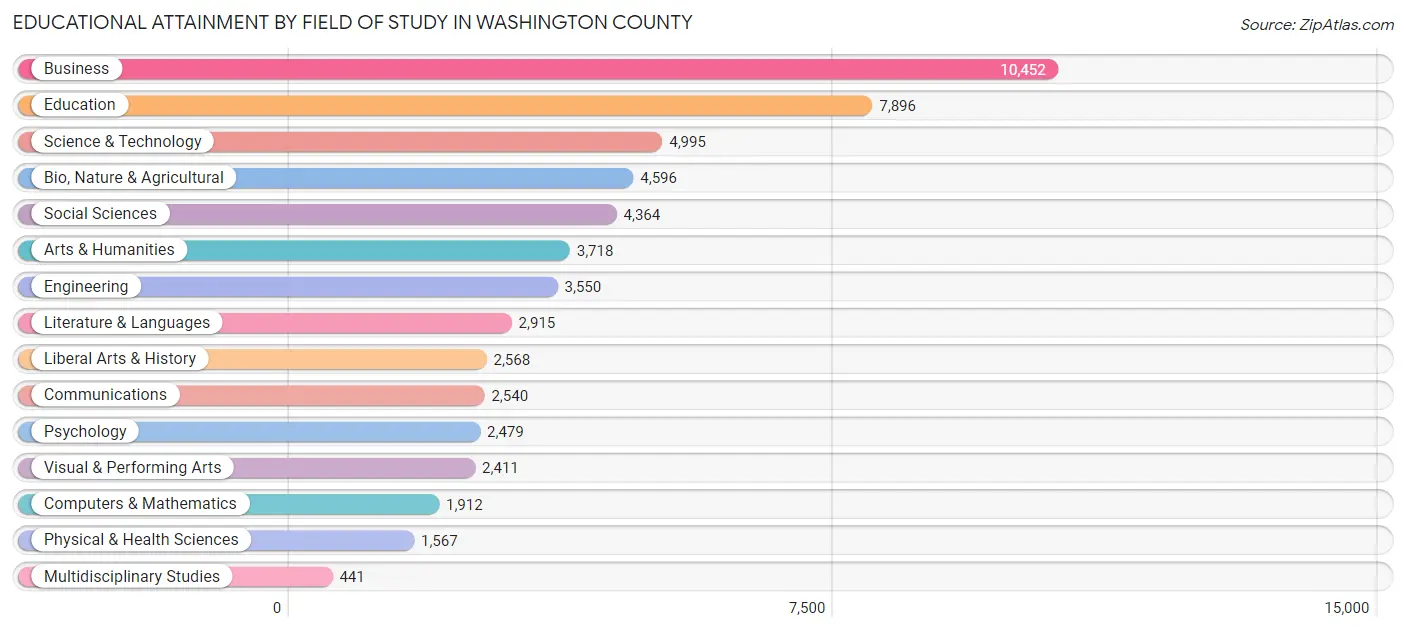
| Field of Study | # Graduates | % Graduates |
| Computers & Mathematics | 1,912 | 3.4% |
| Bio, Nature & Agricultural | 4,596 | 8.2% |
| Physical & Health Sciences | 1,567 | 2.8% |
| Psychology | 2,479 | 4.4% |
| Social Sciences | 4,364 | 7.7% |
| Engineering | 3,550 | 6.3% |
| Multidisciplinary Studies | 441 | 0.8% |
| Science & Technology | 4,995 | 8.9% |
| Business | 10,452 | 18.5% |
| Education | 7,896 | 14.0% |
| Literature & Languages | 2,915 | 5.2% |
| Liberal Arts & History | 2,568 | 4.5% |
| Visual & Performing Arts | 2,411 | 4.3% |
| Communications | 2,540 | 4.5% |
| Arts & Humanities | 3,718 | 6.6% |
| Total | 56,404 | 100.0% |
Transportation & Commute in Washington County
Vehicle Availability by Sex in Washington County
The most prevalent vehicle ownership categories in Washington County are males with 2 vehicles (28,547, accounting for 44.0%) and females with 2 vehicles (24,043, making up 53.6%).
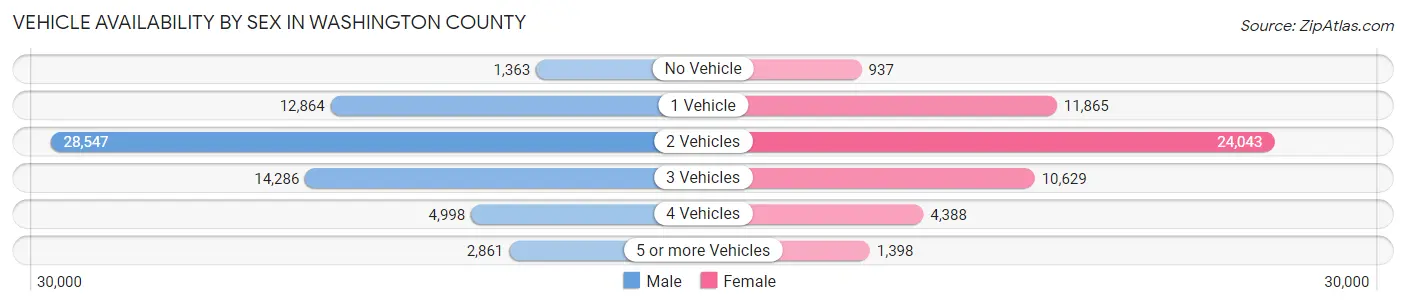
| Vehicles Available | Male | Female |
| No Vehicle | 1,363 (2.1%) | 937 (1.8%) |
| 1 Vehicle | 12,864 (19.8%) | 11,865 (22.3%) |
| 2 Vehicles | 28,547 (44.0%) | 24,043 (45.1%) |
| 3 Vehicles | 14,286 (22.0%) | 10,629 (20.0%) |
| 4 Vehicles | 4,998 (7.7%) | 4,388 (8.2%) |
| 5 or more Vehicles | 2,861 (4.4%) | 1,398 (2.6%) |
| Total | 64,919 (100.0%) | 53,260 (100.0%) |
Commute Time in Washington County
The most frequently occuring commute durations in Washington County are 15 to 19 minutes (20,825 commuters, 19.3%), 10 to 14 minutes (20,786 commuters, 19.3%), and 20 to 24 minutes (16,193 commuters, 15.0%).
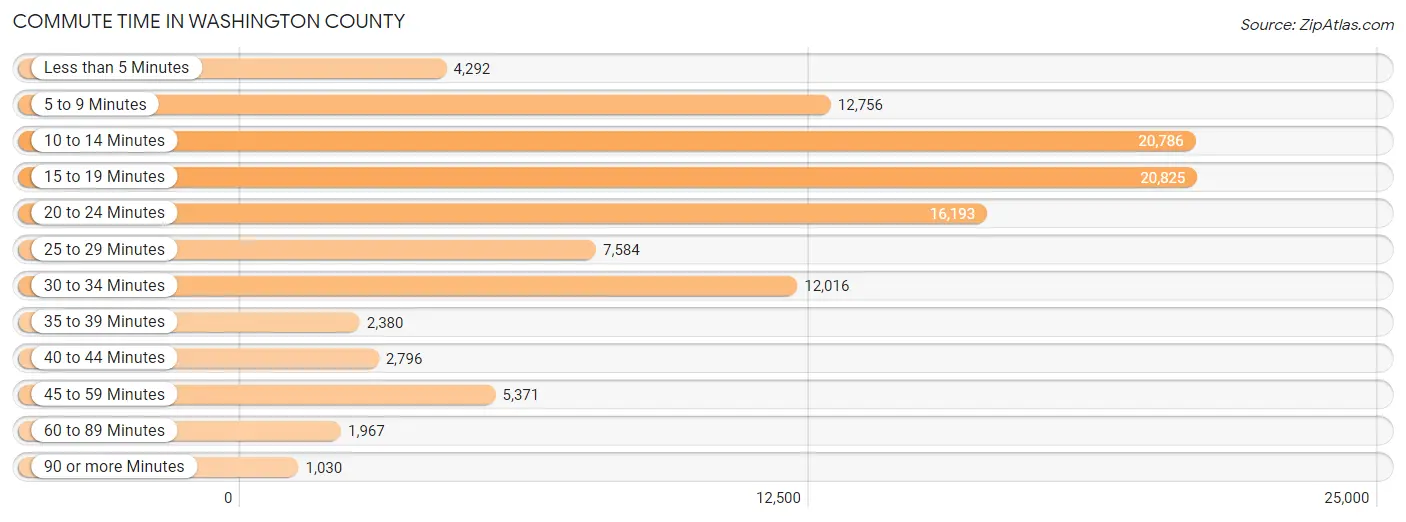
| Commute Time | # Commuters | % Commuters |
| Less than 5 Minutes | 4,292 | 4.0% |
| 5 to 9 Minutes | 12,756 | 11.8% |
| 10 to 14 Minutes | 20,786 | 19.3% |
| 15 to 19 Minutes | 20,825 | 19.3% |
| 20 to 24 Minutes | 16,193 | 15.0% |
| 25 to 29 Minutes | 7,584 | 7.0% |
| 30 to 34 Minutes | 12,016 | 11.1% |
| 35 to 39 Minutes | 2,380 | 2.2% |
| 40 to 44 Minutes | 2,796 | 2.6% |
| 45 to 59 Minutes | 5,371 | 5.0% |
| 60 to 89 Minutes | 1,967 | 1.8% |
| 90 or more Minutes | 1,030 | 0.9% |
Commute Time by Sex in Washington County
The most common commute times in Washington County are 15 to 19 minutes (11,064 commuters, 18.5%) for males and 10 to 14 minutes (9,854 commuters, 20.5%) for females.
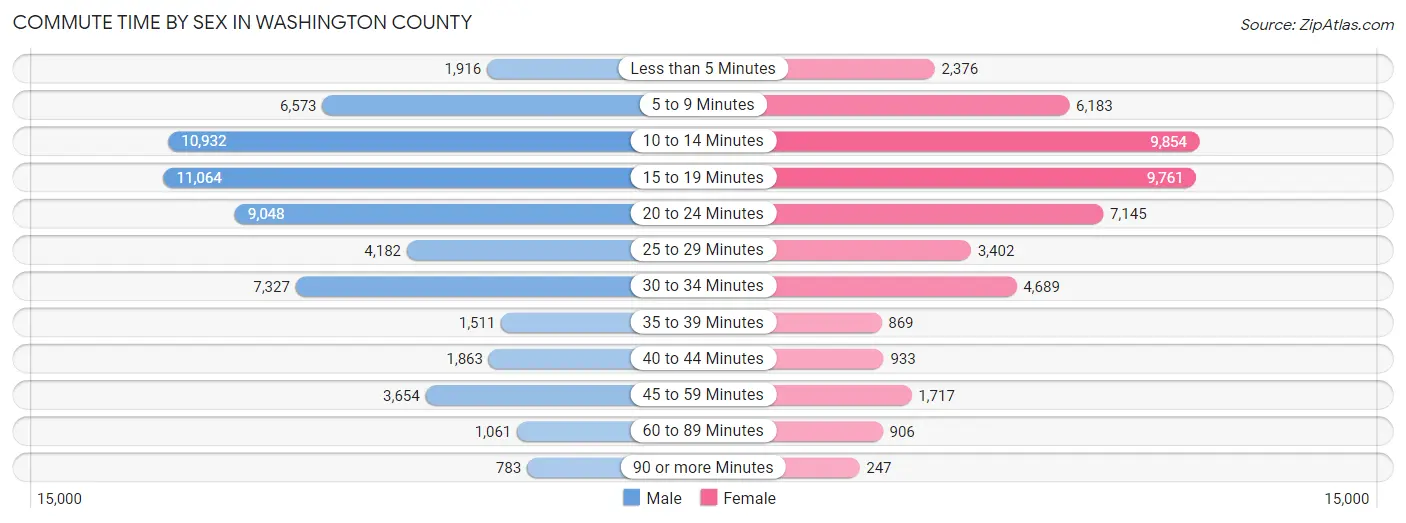
| Commute Time | Male | Female |
| Less than 5 Minutes | 1,916 (3.2%) | 2,376 (4.9%) |
| 5 to 9 Minutes | 6,573 (11.0%) | 6,183 (12.9%) |
| 10 to 14 Minutes | 10,932 (18.2%) | 9,854 (20.5%) |
| 15 to 19 Minutes | 11,064 (18.5%) | 9,761 (20.3%) |
| 20 to 24 Minutes | 9,048 (15.1%) | 7,145 (14.9%) |
| 25 to 29 Minutes | 4,182 (7.0%) | 3,402 (7.1%) |
| 30 to 34 Minutes | 7,327 (12.2%) | 4,689 (9.8%) |
| 35 to 39 Minutes | 1,511 (2.5%) | 869 (1.8%) |
| 40 to 44 Minutes | 1,863 (3.1%) | 933 (1.9%) |
| 45 to 59 Minutes | 3,654 (6.1%) | 1,717 (3.6%) |
| 60 to 89 Minutes | 1,061 (1.8%) | 906 (1.9%) |
| 90 or more Minutes | 783 (1.3%) | 247 (0.5%) |
Time of Departure to Work by Sex in Washington County
The most frequent times of departure to work in Washington County are 7:00 AM to 7:29 AM (9,981, 16.7%) for males and 7:00 AM to 7:29 AM (8,554, 17.8%) for females.
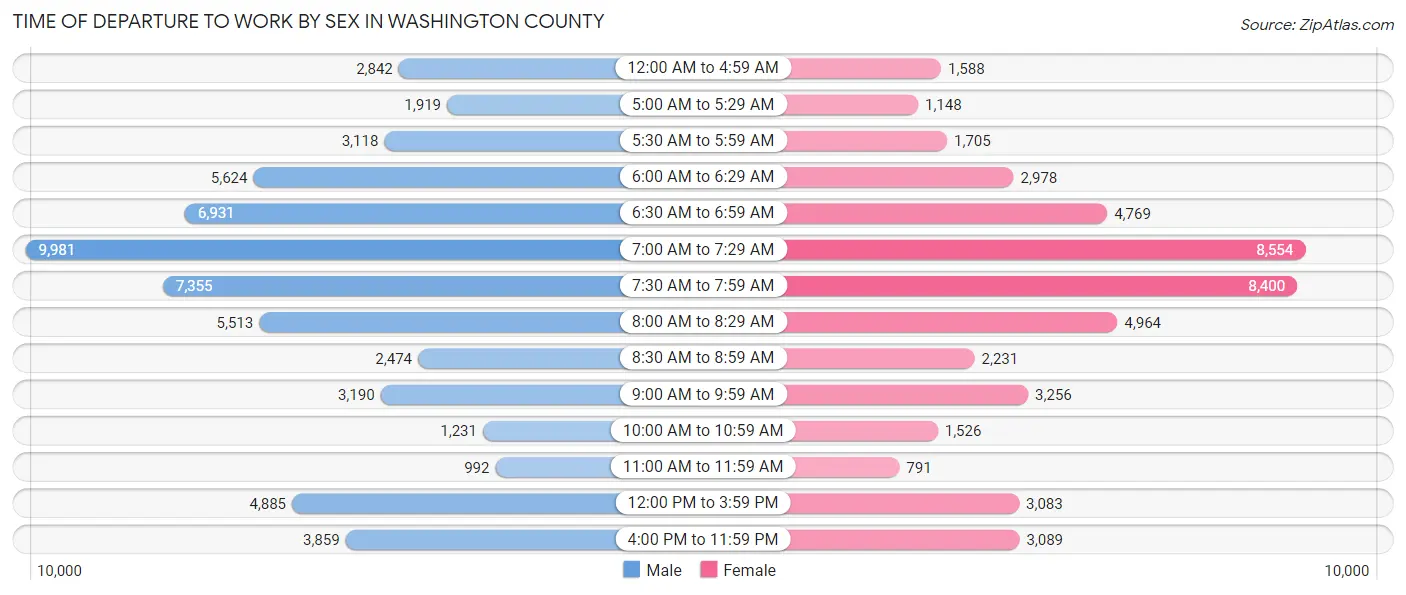
| Time of Departure | Male | Female |
| 12:00 AM to 4:59 AM | 2,842 (4.7%) | 1,588 (3.3%) |
| 5:00 AM to 5:29 AM | 1,919 (3.2%) | 1,148 (2.4%) |
| 5:30 AM to 5:59 AM | 3,118 (5.2%) | 1,705 (3.5%) |
| 6:00 AM to 6:29 AM | 5,624 (9.4%) | 2,978 (6.2%) |
| 6:30 AM to 6:59 AM | 6,931 (11.6%) | 4,769 (9.9%) |
| 7:00 AM to 7:29 AM | 9,981 (16.7%) | 8,554 (17.8%) |
| 7:30 AM to 7:59 AM | 7,355 (12.3%) | 8,400 (17.5%) |
| 8:00 AM to 8:29 AM | 5,513 (9.2%) | 4,964 (10.3%) |
| 8:30 AM to 8:59 AM | 2,474 (4.1%) | 2,231 (4.6%) |
| 9:00 AM to 9:59 AM | 3,190 (5.3%) | 3,256 (6.8%) |
| 10:00 AM to 10:59 AM | 1,231 (2.1%) | 1,526 (3.2%) |
| 11:00 AM to 11:59 AM | 992 (1.7%) | 791 (1.7%) |
| 12:00 PM to 3:59 PM | 4,885 (8.2%) | 3,083 (6.4%) |
| 4:00 PM to 11:59 PM | 3,859 (6.4%) | 3,089 (6.4%) |
| Total | 59,914 (100.0%) | 48,082 (100.0%) |
Housing Occupancy in Washington County
Occupancy by Ownership in Washington County
Of the total 93,781 dwellings in Washington County, owner-occupied units account for 51,179 (54.6%), while renter-occupied units make up 42,602 (45.4%).
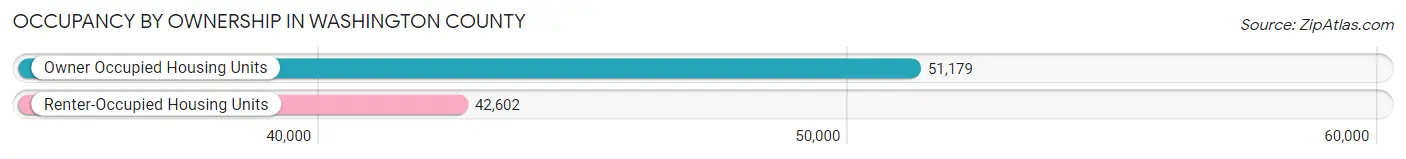
| Occupancy | # Housing Units | % Housing Units |
| Owner Occupied Housing Units | 51,179 | 54.6% |
| Renter-Occupied Housing Units | 42,602 | 45.4% |
| Total Occupied Housing Units | 93,781 | 100.0% |
Occupancy by Household Size in Washington County
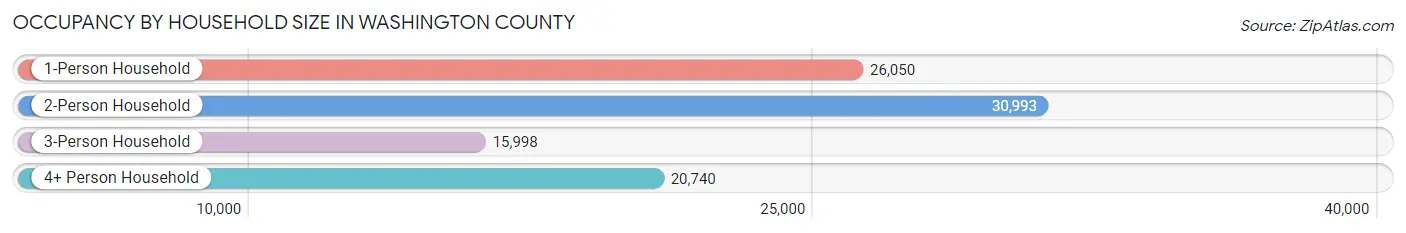
| Household Size | # Housing Units | % Housing Units |
| 1-Person Household | 26,050 | 27.8% |
| 2-Person Household | 30,993 | 33.1% |
| 3-Person Household | 15,998 | 17.1% |
| 4+ Person Household | 20,740 | 22.1% |
| Total Housing Units | 93,781 | 100.0% |
Occupancy by Ownership by Household Size in Washington County
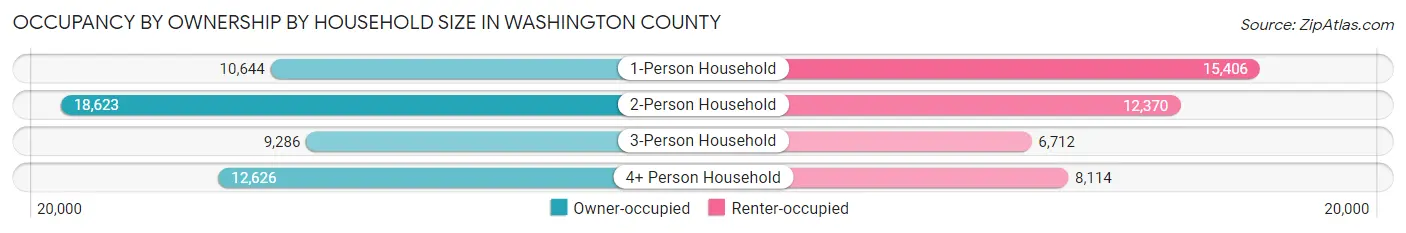
| Household Size | Owner-occupied | Renter-occupied |
| 1-Person Household | 10,644 (40.9%) | 15,406 (59.1%) |
| 2-Person Household | 18,623 (60.1%) | 12,370 (39.9%) |
| 3-Person Household | 9,286 (58.0%) | 6,712 (42.0%) |
| 4+ Person Household | 12,626 (60.9%) | 8,114 (39.1%) |
| Total Housing Units | 51,179 (54.6%) | 42,602 (45.4%) |
Occupancy by Educational Attainment in Washington County
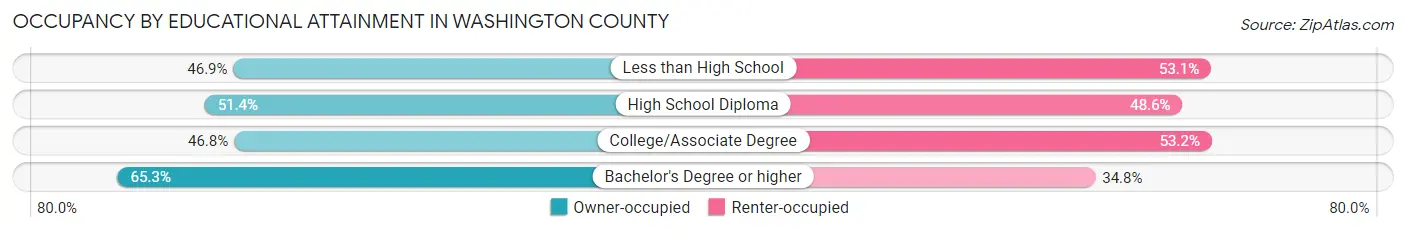
| Household Size | Owner-occupied | Renter-occupied |
| Less than High School | 4,623 (46.9%) | 5,237 (53.1%) |
| High School Diploma | 12,316 (51.4%) | 11,630 (48.6%) |
| College/Associate Degree | 12,395 (46.8%) | 14,101 (53.2%) |
| Bachelor's Degree or higher | 21,845 (65.2%) | 11,634 (34.7%) |
Occupancy by Age of Householder in Washington County
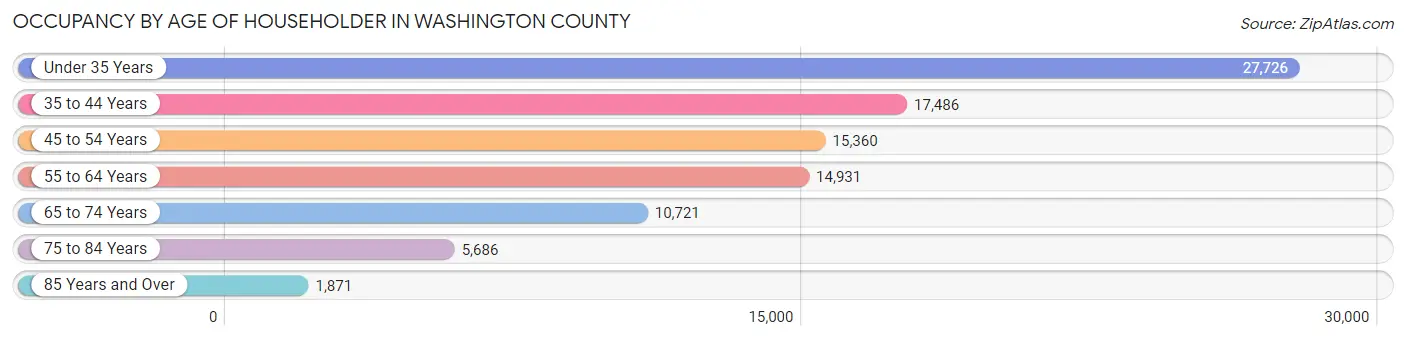
| Age Bracket | # Households | % Households |
| Under 35 Years | 27,726 | 29.6% |
| 35 to 44 Years | 17,486 | 18.6% |
| 45 to 54 Years | 15,360 | 16.4% |
| 55 to 64 Years | 14,931 | 15.9% |
| 65 to 74 Years | 10,721 | 11.4% |
| 75 to 84 Years | 5,686 | 6.1% |
| 85 Years and Over | 1,871 | 2.0% |
| Total | 93,781 | 100.0% |
Housing Finances in Washington County
Median Income by Occupancy in Washington County
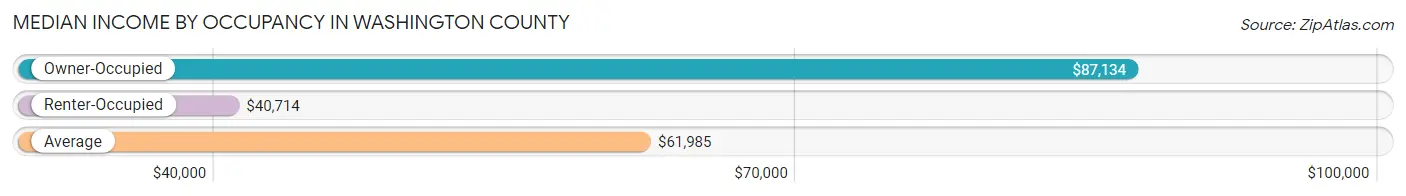
| Occupancy Type | # Households | Median Income |
| Owner-Occupied | 51,179 (54.6%) | $87,134 |
| Renter-Occupied | 42,602 (45.4%) | $40,714 |
| Average | 93,781 (100.0%) | $61,985 |
Occupancy by Householder Income Bracket in Washington County
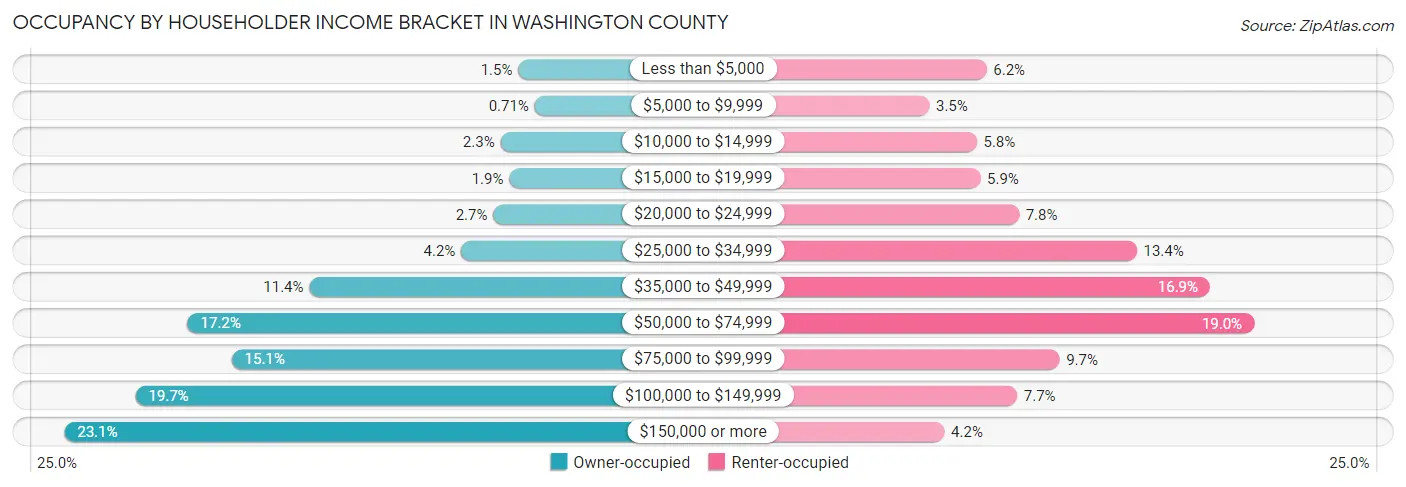
| Income Bracket | Owner-occupied | Renter-occupied |
| Less than $5,000 | 765 (1.5%) | 2,652 (6.2%) |
| $5,000 to $9,999 | 361 (0.7%) | 1,490 (3.5%) |
| $10,000 to $14,999 | 1,196 (2.3%) | 2,454 (5.8%) |
| $15,000 to $19,999 | 985 (1.9%) | 2,528 (5.9%) |
| $20,000 to $24,999 | 1,373 (2.7%) | 3,310 (7.8%) |
| $25,000 to $34,999 | 2,156 (4.2%) | 5,699 (13.4%) |
| $35,000 to $49,999 | 5,854 (11.4%) | 7,187 (16.9%) |
| $50,000 to $74,999 | 8,822 (17.2%) | 8,081 (19.0%) |
| $75,000 to $99,999 | 7,751 (15.1%) | 4,134 (9.7%) |
| $100,000 to $149,999 | 10,090 (19.7%) | 3,271 (7.7%) |
| $150,000 or more | 11,826 (23.1%) | 1,796 (4.2%) |
| Total | 51,179 (100.0%) | 42,602 (100.0%) |
Monthly Housing Cost Tiers in Washington County
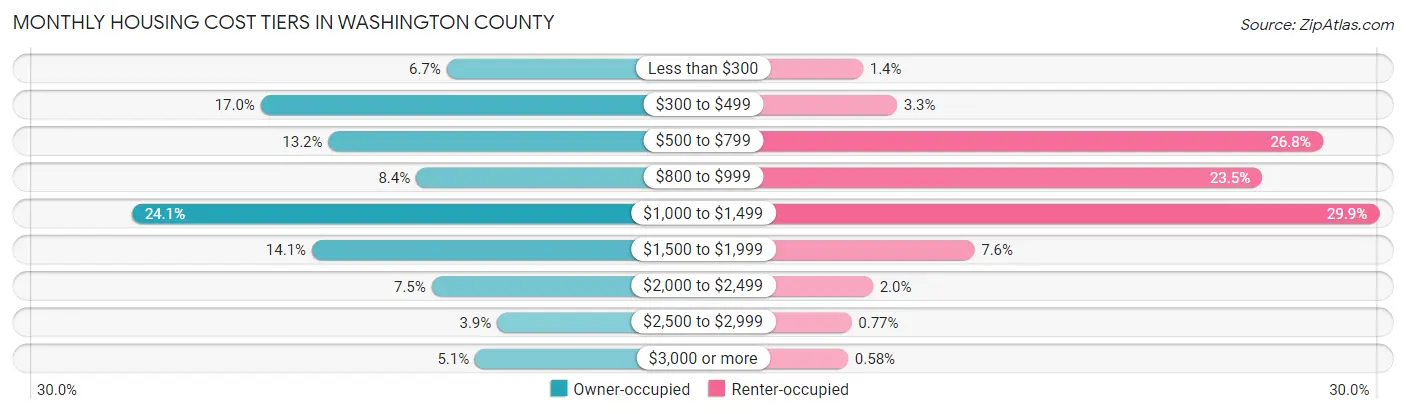
| Monthly Cost | Owner-occupied | Renter-occupied |
| Less than $300 | 3,425 (6.7%) | 596 (1.4%) |
| $300 to $499 | 8,678 (17.0%) | 1,396 (3.3%) |
| $500 to $799 | 6,764 (13.2%) | 11,414 (26.8%) |
| $800 to $999 | 4,291 (8.4%) | 9,992 (23.4%) |
| $1,000 to $1,499 | 12,326 (24.1%) | 12,745 (29.9%) |
| $1,500 to $1,999 | 7,230 (14.1%) | 3,219 (7.6%) |
| $2,000 to $2,499 | 3,848 (7.5%) | 831 (1.9%) |
| $2,500 to $2,999 | 1,998 (3.9%) | 329 (0.8%) |
| $3,000 or more | 2,619 (5.1%) | 246 (0.6%) |
| Total | 51,179 (100.0%) | 42,602 (100.0%) |
Physical Housing Characteristics in Washington County
Housing Structures in Washington County
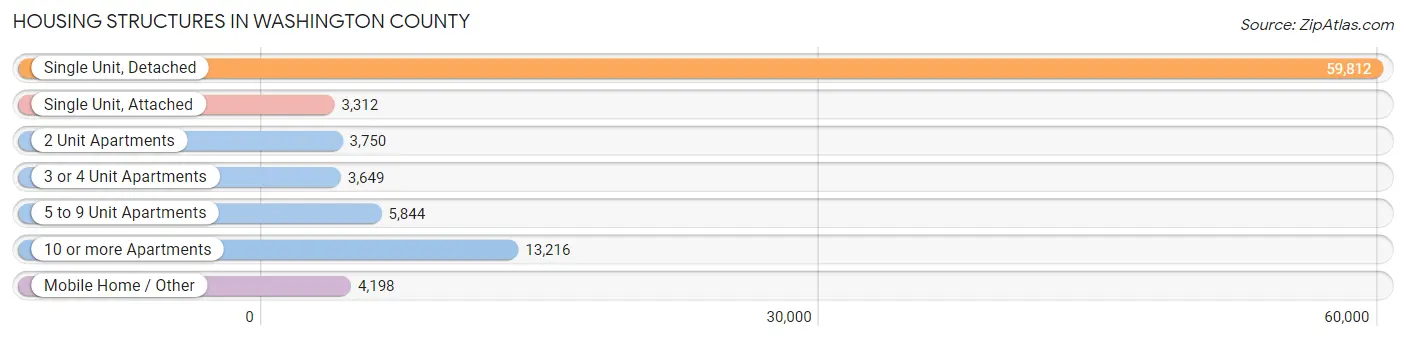
| Structure Type | # Housing Units | % Housing Units |
| Single Unit, Detached | 59,812 | 63.8% |
| Single Unit, Attached | 3,312 | 3.5% |
| 2 Unit Apartments | 3,750 | 4.0% |
| 3 or 4 Unit Apartments | 3,649 | 3.9% |
| 5 to 9 Unit Apartments | 5,844 | 6.2% |
| 10 or more Apartments | 13,216 | 14.1% |
| Mobile Home / Other | 4,198 | 4.5% |
| Total | 93,781 | 100.0% |
Housing Structures by Occupancy in Washington County
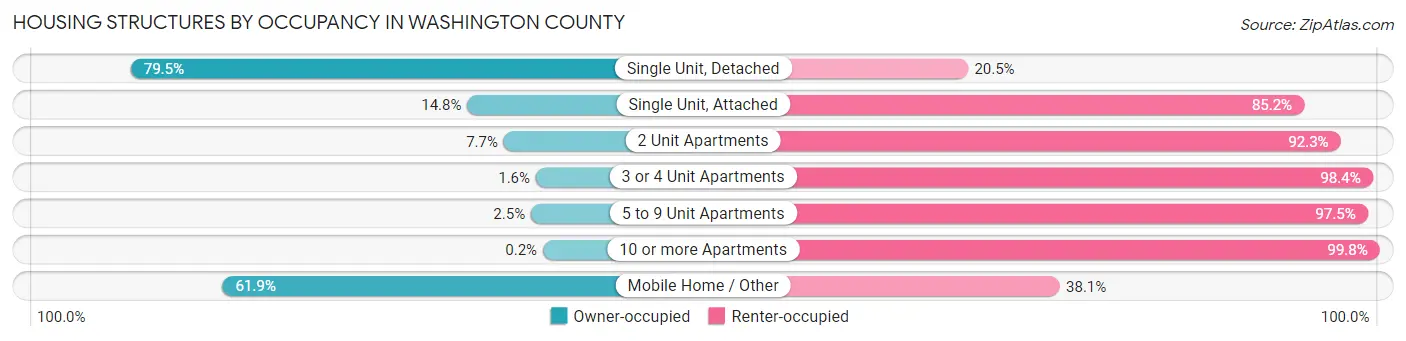
| Structure Type | Owner-occupied | Renter-occupied |
| Single Unit, Detached | 47,572 (79.5%) | 12,240 (20.5%) |
| Single Unit, Attached | 489 (14.8%) | 2,823 (85.2%) |
| 2 Unit Apartments | 290 (7.7%) | 3,460 (92.3%) |
| 3 or 4 Unit Apartments | 57 (1.6%) | 3,592 (98.4%) |
| 5 to 9 Unit Apartments | 146 (2.5%) | 5,698 (97.5%) |
| 10 or more Apartments | 27 (0.2%) | 13,189 (99.8%) |
| Mobile Home / Other | 2,598 (61.9%) | 1,600 (38.1%) |
| Total | 51,179 (54.6%) | 42,602 (45.4%) |
Housing Structures by Number of Rooms in Washington County
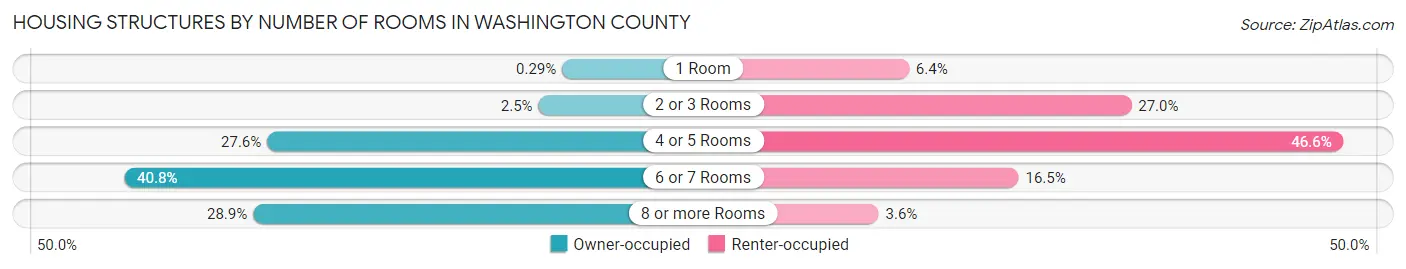
| Number of Rooms | Owner-occupied | Renter-occupied |
| 1 Room | 146 (0.3%) | 2,717 (6.4%) |
| 2 or 3 Rooms | 1,271 (2.5%) | 11,481 (27.0%) |
| 4 or 5 Rooms | 14,109 (27.6%) | 19,839 (46.6%) |
| 6 or 7 Rooms | 20,877 (40.8%) | 7,038 (16.5%) |
| 8 or more Rooms | 14,776 (28.9%) | 1,527 (3.6%) |
| Total | 51,179 (100.0%) | 42,602 (100.0%) |
Housing Structure by Heating Type in Washington County
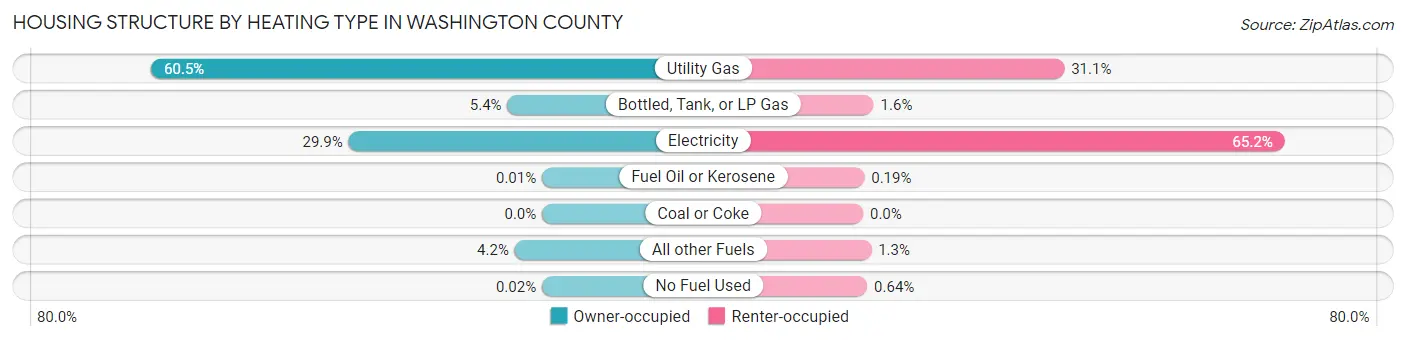
| Heating Type | Owner-occupied | Renter-occupied |
| Utility Gas | 30,945 (60.5%) | 13,249 (31.1%) |
| Bottled, Tank, or LP Gas | 2,744 (5.4%) | 698 (1.6%) |
| Electricity | 15,313 (29.9%) | 27,763 (65.2%) |
| Fuel Oil or Kerosene | 4 (0.0%) | 81 (0.2%) |
| Coal or Coke | 0 (0.0%) | 0 (0.0%) |
| All other Fuels | 2,164 (4.2%) | 537 (1.3%) |
| No Fuel Used | 9 (0.0%) | 274 (0.6%) |
| Total | 51,179 (100.0%) | 42,602 (100.0%) |
Household Vehicle Usage in Washington County
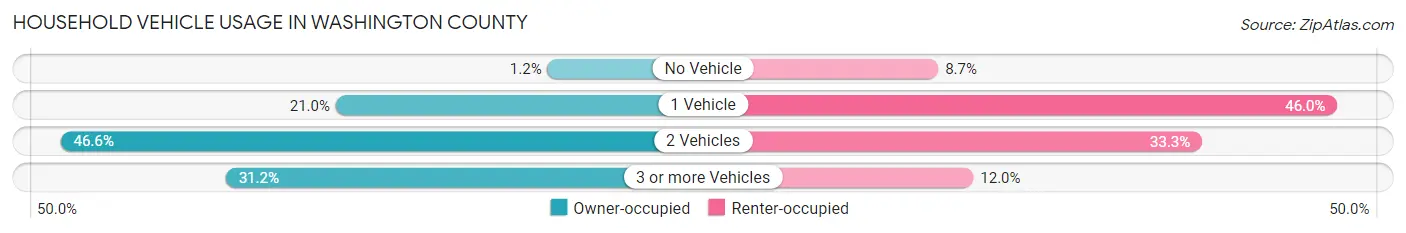
| Vehicles per Household | Owner-occupied | Renter-occupied |
| No Vehicle | 608 (1.2%) | 3,710 (8.7%) |
| 1 Vehicle | 10,722 (20.9%) | 19,581 (46.0%) |
| 2 Vehicles | 23,869 (46.6%) | 14,203 (33.3%) |
| 3 or more Vehicles | 15,980 (31.2%) | 5,108 (12.0%) |
| Total | 51,179 (100.0%) | 42,602 (100.0%) |
Real Estate & Mortgages in Washington County
Real Estate and Mortgage Overview in Washington County
| Characteristic | Without Mortgage | With Mortgage |
| Housing Units | 19,373 | 31,806 |
| Median Property Value | $209,700 | $246,800 |
| Median Household Income | $60,336 | $9,294 |
| Monthly Housing Costs | $451 | $2,579 |
| Real Estate Taxes | $1,261 | $945 |
Property Value by Mortgage Status in Washington County
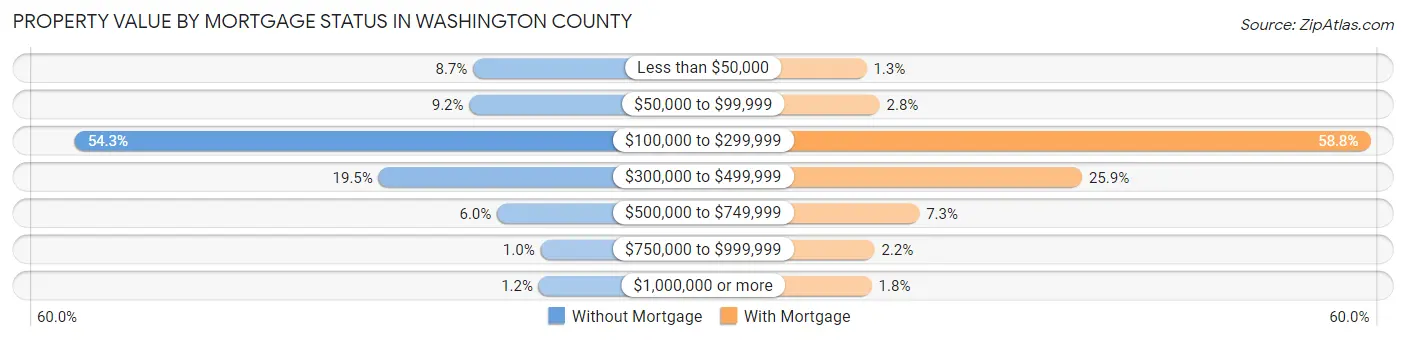
| Property Value | Without Mortgage | With Mortgage |
| Less than $50,000 | 1,693 (8.7%) | 398 (1.3%) |
| $50,000 to $99,999 | 1,777 (9.2%) | 876 (2.8%) |
| $100,000 to $299,999 | 10,514 (54.3%) | 18,711 (58.8%) |
| $300,000 to $499,999 | 3,786 (19.5%) | 8,232 (25.9%) |
| $500,000 to $749,999 | 1,162 (6.0%) | 2,317 (7.3%) |
| $750,000 to $999,999 | 202 (1.0%) | 686 (2.2%) |
| $1,000,000 or more | 239 (1.2%) | 586 (1.8%) |
| Total | 19,373 (100.0%) | 31,806 (100.0%) |
Household Income by Mortgage Status in Washington County
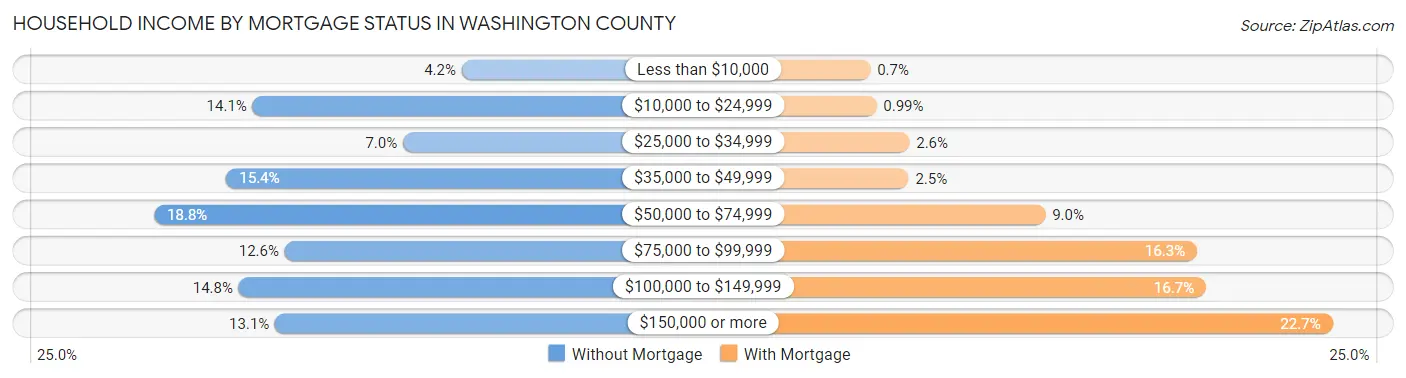
| Household Income | Without Mortgage | With Mortgage |
| Less than $10,000 | 810 (4.2%) | 224 (0.7%) |
| $10,000 to $24,999 | 2,739 (14.1%) | 316 (1.0%) |
| $25,000 to $34,999 | 1,353 (7.0%) | 815 (2.6%) |
| $35,000 to $49,999 | 2,981 (15.4%) | 803 (2.5%) |
| $50,000 to $74,999 | 3,649 (18.8%) | 2,873 (9.0%) |
| $75,000 to $99,999 | 2,442 (12.6%) | 5,173 (16.3%) |
| $100,000 to $149,999 | 2,867 (14.8%) | 5,309 (16.7%) |
| $150,000 or more | 2,532 (13.1%) | 7,223 (22.7%) |
| Total | 19,373 (100.0%) | 31,806 (100.0%) |
Property Value to Household Income Ratio in Washington County
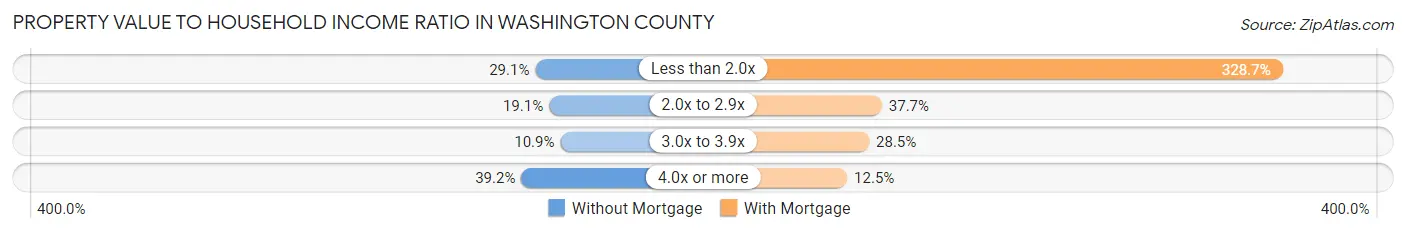
| Value-to-Income Ratio | Without Mortgage | With Mortgage |
| Less than 2.0x | 5,632 (29.1%) | 104,558 (328.7%) |
| 2.0x to 2.9x | 3,693 (19.1%) | 11,996 (37.7%) |
| 3.0x to 3.9x | 2,103 (10.9%) | 9,059 (28.5%) |
| 4.0x or more | 7,598 (39.2%) | 3,977 (12.5%) |
| Total | 19,373 (100.0%) | 31,806 (100.0%) |
Real Estate Taxes by Mortgage Status in Washington County
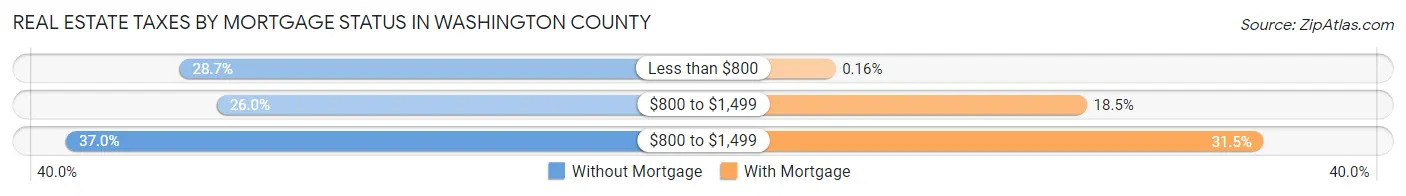
| Property Taxes | Without Mortgage | With Mortgage |
| Less than $800 | 5,557 (28.7%) | 51 (0.2%) |
| $800 to $1,499 | 5,030 (26.0%) | 5,895 (18.5%) |
| $800 to $1,499 | 7,163 (37.0%) | 10,006 (31.5%) |
| Total | 19,373 (100.0%) | 31,806 (100.0%) |
Health & Disability in Washington County
Health Insurance Coverage by Age in Washington County
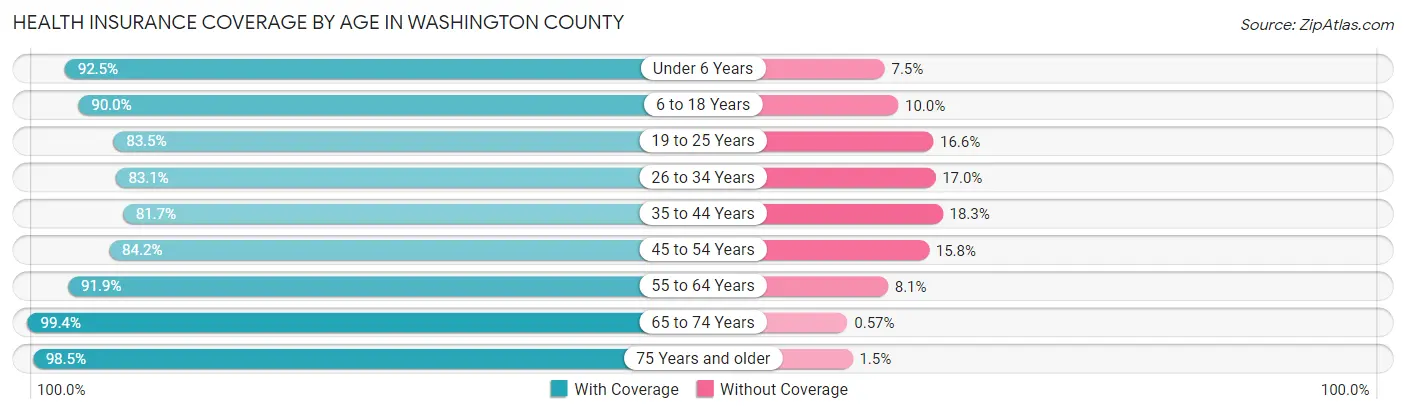
| Age Bracket | With Coverage | Without Coverage |
| Under 6 Years | 17,645 (92.5%) | 1,432 (7.5%) |
| 6 to 18 Years | 40,114 (90.0%) | 4,467 (10.0%) |
| 19 to 25 Years | 29,572 (83.5%) | 5,863 (16.6%) |
| 26 to 34 Years | 27,400 (83.1%) | 5,591 (17.0%) |
| 35 to 44 Years | 26,579 (81.7%) | 5,961 (18.3%) |
| 45 to 54 Years | 22,834 (84.2%) | 4,272 (15.8%) |
| 55 to 64 Years | 22,780 (91.9%) | 2,011 (8.1%) |
| 65 to 74 Years | 17,538 (99.4%) | 101 (0.6%) |
| 75 Years and older | 11,045 (98.5%) | 171 (1.5%) |
| Total | 215,507 (87.8%) | 29,869 (12.2%) |
Health Insurance Coverage by Citizenship Status in Washington County
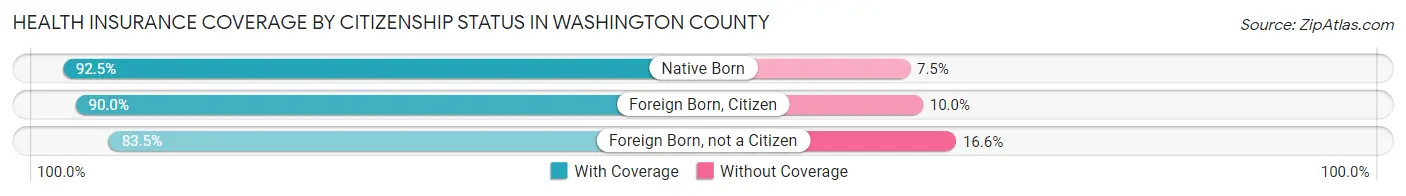
| Citizenship Status | With Coverage | Without Coverage |
| Native Born | 17,645 (92.5%) | 1,432 (7.5%) |
| Foreign Born, Citizen | 40,114 (90.0%) | 4,467 (10.0%) |
| Foreign Born, not a Citizen | 29,572 (83.5%) | 5,863 (16.6%) |
Health Insurance Coverage by Household Income in Washington County
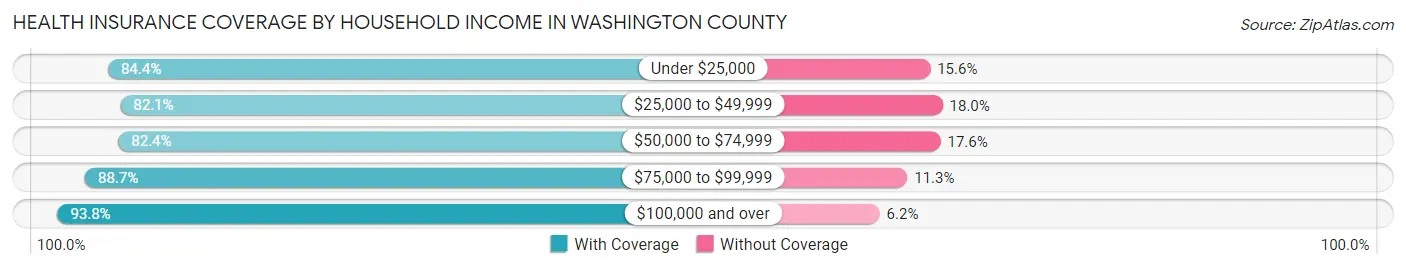
| Household Income | With Coverage | Without Coverage |
| Under $25,000 | 26,253 (84.4%) | 4,864 (15.6%) |
| $25,000 to $49,999 | 37,878 (82.1%) | 8,289 (17.9%) |
| $50,000 to $74,999 | 36,050 (82.4%) | 7,683 (17.6%) |
| $75,000 to $99,999 | 30,080 (88.7%) | 3,844 (11.3%) |
| $100,000 and over | 78,933 (93.8%) | 5,178 (6.2%) |
Public vs Private Health Insurance Coverage by Age in Washington County
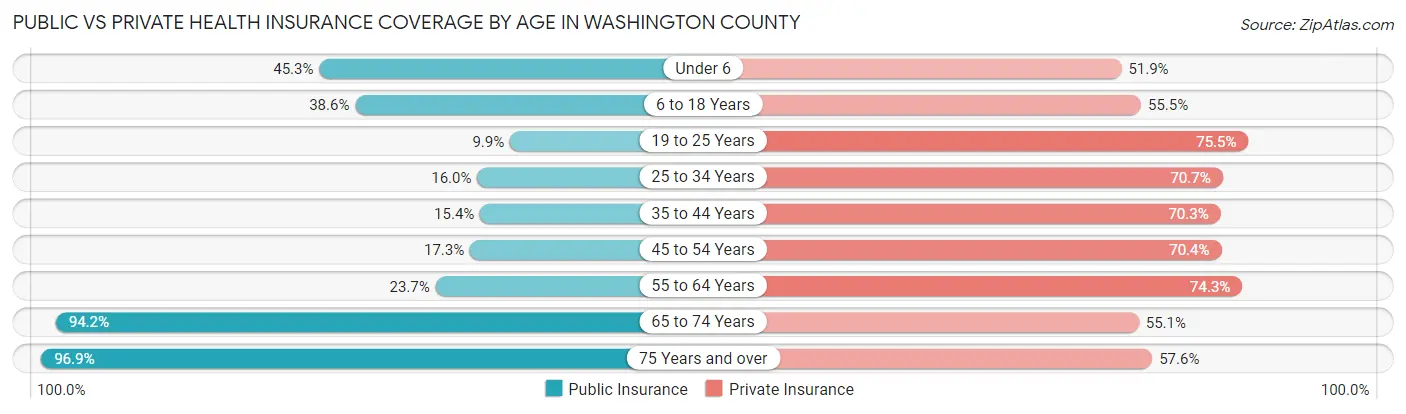
| Age Bracket | Public Insurance | Private Insurance |
| Under 6 | 8,641 (45.3%) | 9,902 (51.9%) |
| 6 to 18 Years | 17,222 (38.6%) | 24,759 (55.5%) |
| 19 to 25 Years | 3,504 (9.9%) | 26,735 (75.4%) |
| 25 to 34 Years | 5,271 (16.0%) | 23,310 (70.7%) |
| 35 to 44 Years | 5,025 (15.4%) | 22,869 (70.3%) |
| 45 to 54 Years | 4,696 (17.3%) | 19,093 (70.4%) |
| 55 to 64 Years | 5,880 (23.7%) | 18,422 (74.3%) |
| 65 to 74 Years | 16,618 (94.2%) | 9,723 (55.1%) |
| 75 Years and over | 10,869 (96.9%) | 6,463 (57.6%) |
| Total | 77,726 (31.7%) | 161,276 (65.7%) |
Disability Status by Sex by Age in Washington County
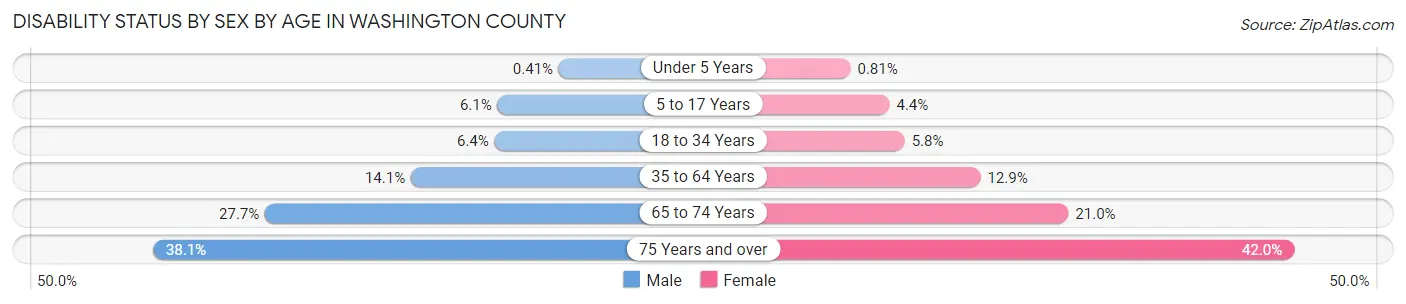
| Age Bracket | Male | Female |
| Under 5 Years | 33 (0.4%) | 62 (0.8%) |
| 5 to 17 Years | 1,348 (6.1%) | 919 (4.4%) |
| 18 to 34 Years | 2,410 (6.4%) | 2,089 (5.8%) |
| 35 to 64 Years | 6,051 (14.1%) | 5,358 (12.9%) |
| 65 to 74 Years | 2,276 (27.7%) | 1,980 (21.0%) |
| 75 Years and over | 1,779 (38.1%) | 2,747 (42.0%) |
Disability Class by Sex by Age in Washington County
Disability Class: Hearing Difficulty
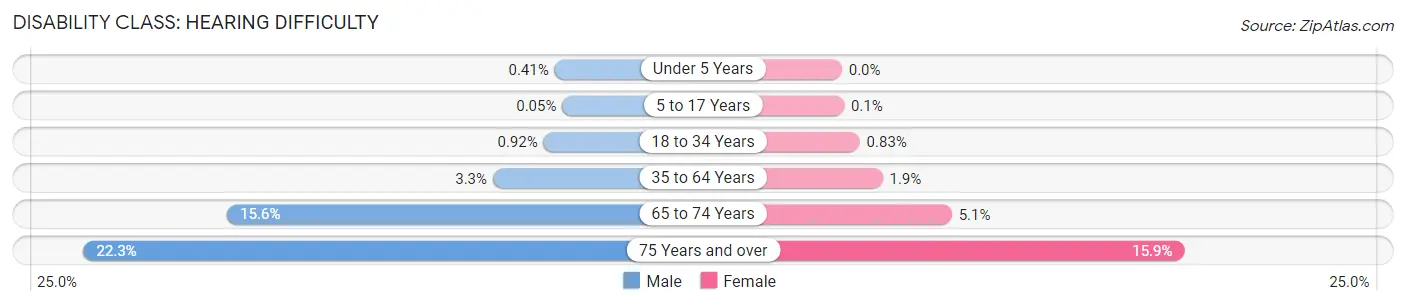
| Age Bracket | Male | Female |
| Under 5 Years | 33 (0.4%) | 0 (0.0%) |
| 5 to 17 Years | 11 (0.1%) | 21 (0.1%) |
| 18 to 34 Years | 348 (0.9%) | 296 (0.8%) |
| 35 to 64 Years | 1,399 (3.3%) | 787 (1.9%) |
| 65 to 74 Years | 1,283 (15.6%) | 480 (5.1%) |
| 75 Years and over | 1,040 (22.3%) | 1,040 (15.9%) |
Disability Class: Vision Difficulty
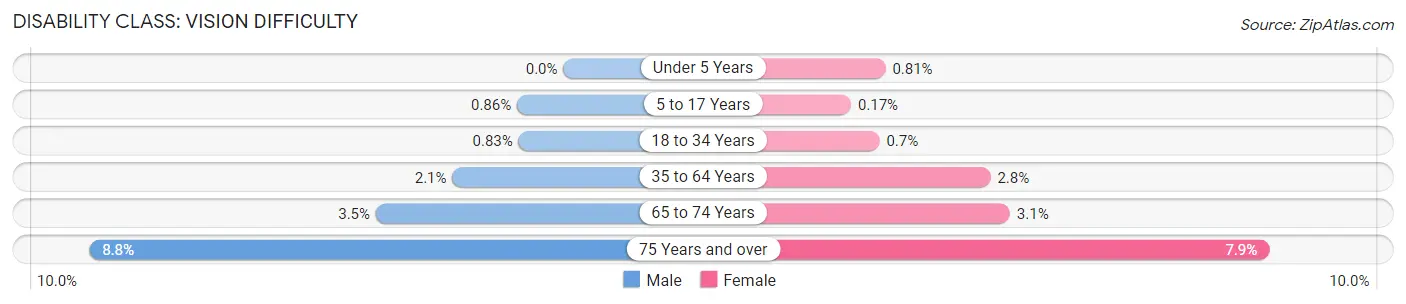
| Age Bracket | Male | Female |
| Under 5 Years | 0 (0.0%) | 62 (0.8%) |
| 5 to 17 Years | 190 (0.9%) | 36 (0.2%) |
| 18 to 34 Years | 314 (0.8%) | 252 (0.7%) |
| 35 to 64 Years | 882 (2.1%) | 1,149 (2.8%) |
| 65 to 74 Years | 286 (3.5%) | 294 (3.1%) |
| 75 Years and over | 411 (8.8%) | 519 (7.9%) |
Disability Class: Cognitive Difficulty
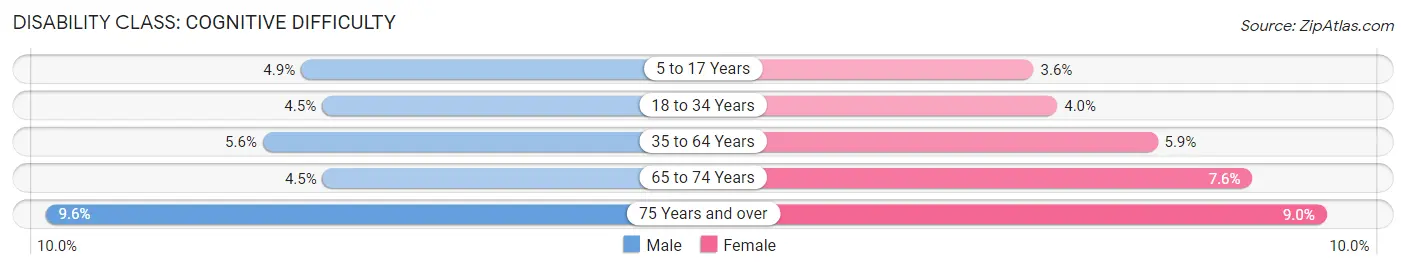
| Age Bracket | Male | Female |
| 5 to 17 Years | 1,074 (4.9%) | 739 (3.6%) |
| 18 to 34 Years | 1,692 (4.5%) | 1,430 (4.0%) |
| 35 to 64 Years | 2,387 (5.6%) | 2,439 (5.9%) |
| 65 to 74 Years | 368 (4.5%) | 717 (7.6%) |
| 75 Years and over | 449 (9.6%) | 589 (9.0%) |
Disability Class: Ambulatory Difficulty
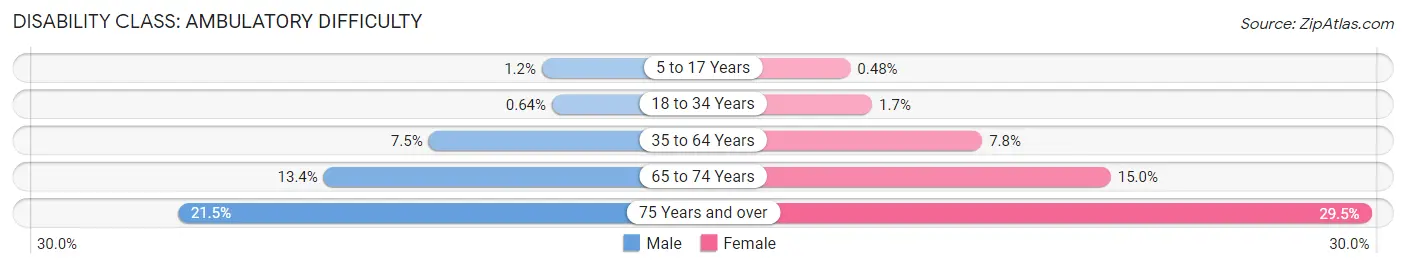
| Age Bracket | Male | Female |
| 5 to 17 Years | 264 (1.2%) | 100 (0.5%) |
| 18 to 34 Years | 242 (0.6%) | 605 (1.7%) |
| 35 to 64 Years | 3,214 (7.5%) | 3,257 (7.8%) |
| 65 to 74 Years | 1,098 (13.4%) | 1,410 (15.0%) |
| 75 Years and over | 1,003 (21.5%) | 1,930 (29.5%) |
Disability Class: Self-Care Difficulty
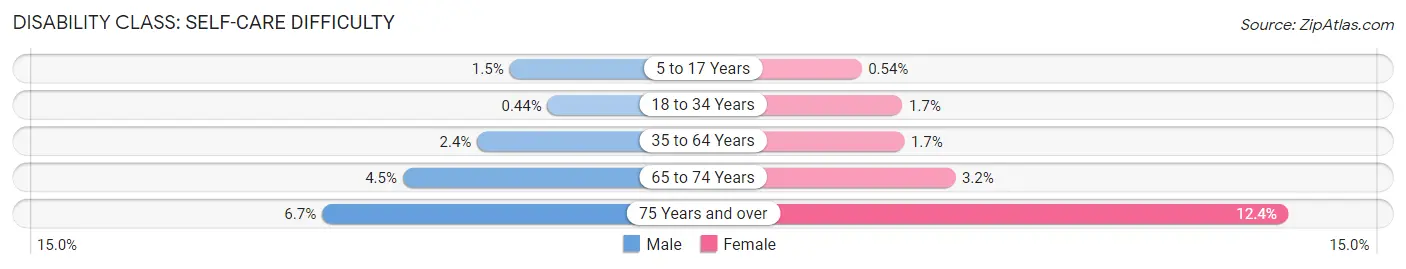
| Age Bracket | Male | Female |
| 5 to 17 Years | 331 (1.5%) | 112 (0.5%) |
| 18 to 34 Years | 165 (0.4%) | 602 (1.7%) |
| 35 to 64 Years | 1,026 (2.4%) | 720 (1.7%) |
| 65 to 74 Years | 368 (4.5%) | 297 (3.2%) |
| 75 Years and over | 314 (6.7%) | 814 (12.4%) |
Technology Access in Washington County
Computing Device Access in Washington County
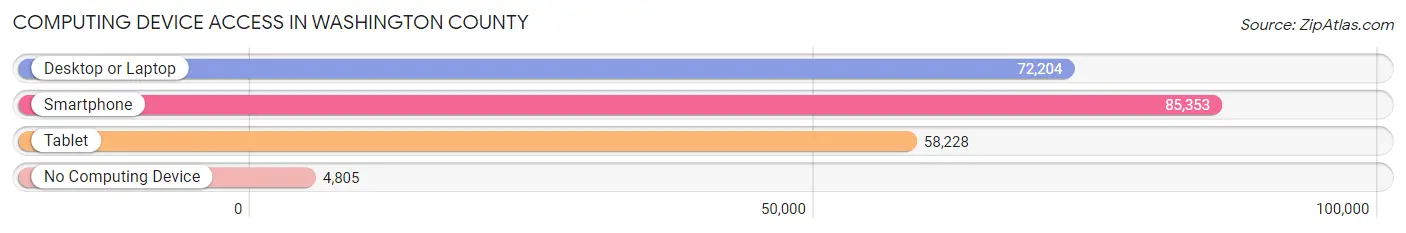
| Device Type | # Households | % Households |
| Desktop or Laptop | 72,204 | 77.0% |
| Smartphone | 85,353 | 91.0% |
| Tablet | 58,228 | 62.1% |
| No Computing Device | 4,805 | 5.1% |
| Total | 93,781 | 100.0% |
Internet Access in Washington County
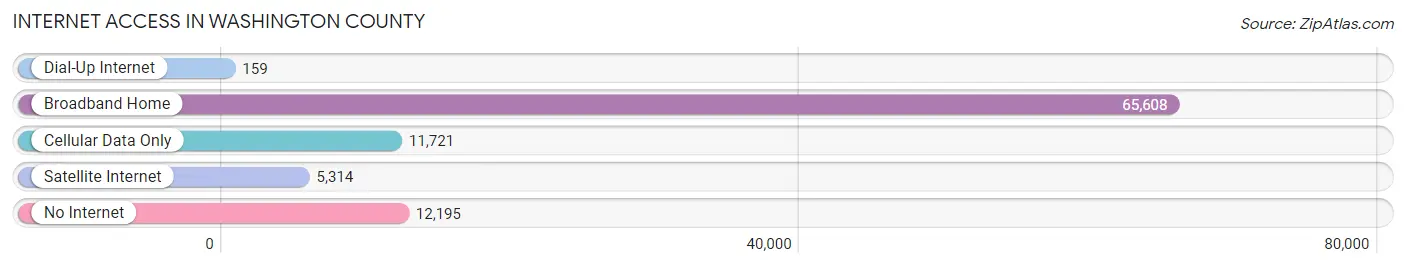
| Internet Type | # Households | % Households |
| Dial-Up Internet | 159 | 0.2% |
| Broadband Home | 65,608 | 70.0% |
| Cellular Data Only | 11,721 | 12.5% |
| Satellite Internet | 5,314 | 5.7% |
| No Internet | 12,195 | 13.0% |
| Total | 93,781 | 100.0% |
Washington County Summary
Introduction
Washington County, Arkansas is located in the northwest corner of the state and is the third most populous county in the state. It is bordered by Madison County to the north, Benton County to the east, Carroll County to the south, and Oklahoma to the west. The county seat is Fayetteville, which is also the largest city in the county. Washington County is home to the University of Arkansas, the state’s flagship university, and is part of the Fayetteville-Springdale-Rogers Metropolitan Statistical Area.
History
Washington County was established in 1828 and named after George Washington, the first president of the United States. The county was originally part of the Cherokee Nation, but was ceded to the United States in 1828. The county was initially divided into two townships, Fayetteville and Washington, and the county seat was established in Fayetteville.
In the early 19th century, Washington County was a major center for the cotton industry, and the county was home to several large plantations. The county was also home to several Native American tribes, including the Cherokee, Choctaw, and Osage.
In the late 19th century, the county experienced a period of rapid growth and development. The St. Louis and San Francisco Railway was built through the county in 1881, connecting Fayetteville to the rest of the state. The University of Arkansas was established in 1871, and the city of Fayetteville was incorporated in 1875.
Geography
Washington County is located in the northwest corner of Arkansas and is bordered by Madison County to the north, Benton County to the east, Carroll County to the south, and Oklahoma to the west. The county covers an area of 1,053 square miles and is divided into twenty-one townships. The county is located in the Ozark Mountains and is home to several rivers, including the White River, the Kings River, and the Illinois River.
The county is home to several state parks, including Devil’s Den State Park, Lake Fort Smith State Park, and Hobbs State Park. The county is also home to several national forests, including the Ozark National Forest and the Ouachita National Forest.
Economy
Washington County has a diverse economy, with a mix of manufacturing, agriculture, and services. The county is home to several large employers, including Tyson Foods, Walmart, and J.B. Hunt. The county is also home to several universities, including the University of Arkansas, John Brown University, and Northwest Arkansas Community College.
Agriculture is an important part of the county’s economy, with the county producing a variety of crops, including corn, soybeans, wheat, and hay. The county is also home to several wineries and vineyards, and is a popular destination for wine tourism.
Demographics
As of the 2010 census, Washington County had a population of 203,065. The population is fairly evenly split between men and women, with 50.3% of the population being male and 49.7% being female. The median age of the population is 33.7 years, and the median household income is $50,945.
The racial makeup of the county is 79.2% White, 11.3% Black or African American, 1.7% Native American, 2.7% Asian, 0.2% Pacific Islander, and 4.1% from other races. The largest ancestry groups in the county are German (17.3%), Irish (14.2%), English (13.2%), and American (10.2%).
Conclusion
Washington County, Arkansas is a diverse and vibrant county located in the northwest corner of the state. The county has a rich history, and is home to several large employers, universities, and state parks. The county has a diverse economy, with a mix of manufacturing, agriculture, and services. The population of the county is fairly evenly split between men and women, and the largest ancestry groups are German, Irish, English, and American.
Common Questions
What is Per Capita Income in Washington County?
Per Capita income in Washington County is $34,531.
What is the Median Family Income in Washington County?
Median Family Income in Washington County is $79,154.
What is the Median Household income in Washington County?
Median Household Income in Washington County is $61,985.
What is Income or Wage Gap in Washington County?
Income or Wage Gap in Washington County is 23.2%.
Women in Washington County earn 76.8 cents for every dollar earned by a man.
What is Family Income Deficit in Washington County?
Family Income Deficit in Washington County is $10,503.
Families that are below poverty line in Washington County earn $10,503 less on average than the poverty threshold level.
What is Inequality or Gini Index in Washington County?
Inequality or Gini Index in Washington County is 0.48.
What is the Total Population of Washington County?
Total Population of Washington County is 247,331.
What is the Total Male Population of Washington County?
Total Male Population of Washington County is 124,636.
What is the Total Female Population of Washington County?
Total Female Population of Washington County is 122,695.
What is the Ratio of Males per 100 Females in Washington County?
There are 101.58 Males per 100 Females in Washington County.
What is the Ratio of Females per 100 Males in Washington County?
There are 98.44 Females per 100 Males in Washington County.
What is the Median Population Age in Washington County?
Median Population Age in Washington County is 32.3 Years.
What is the Average Family Size in Washington County
Average Family Size in Washington County is 3.1 People.
What is the Average Household Size in Washington County
Average Household Size in Washington County is 2.5 People.
How Large is the Labor Force in Washington County?
There are 126,416 People in the Labor Forcein in Washington County.
What is the Percentage of People in the Labor Force in Washington County?
64.7% of People are in the Labor Force in Washington County.
What is the Unemployment Rate in Washington County?
Unemployment Rate in Washington County is 4.3%.