Carroll County, AR Map & Demographics
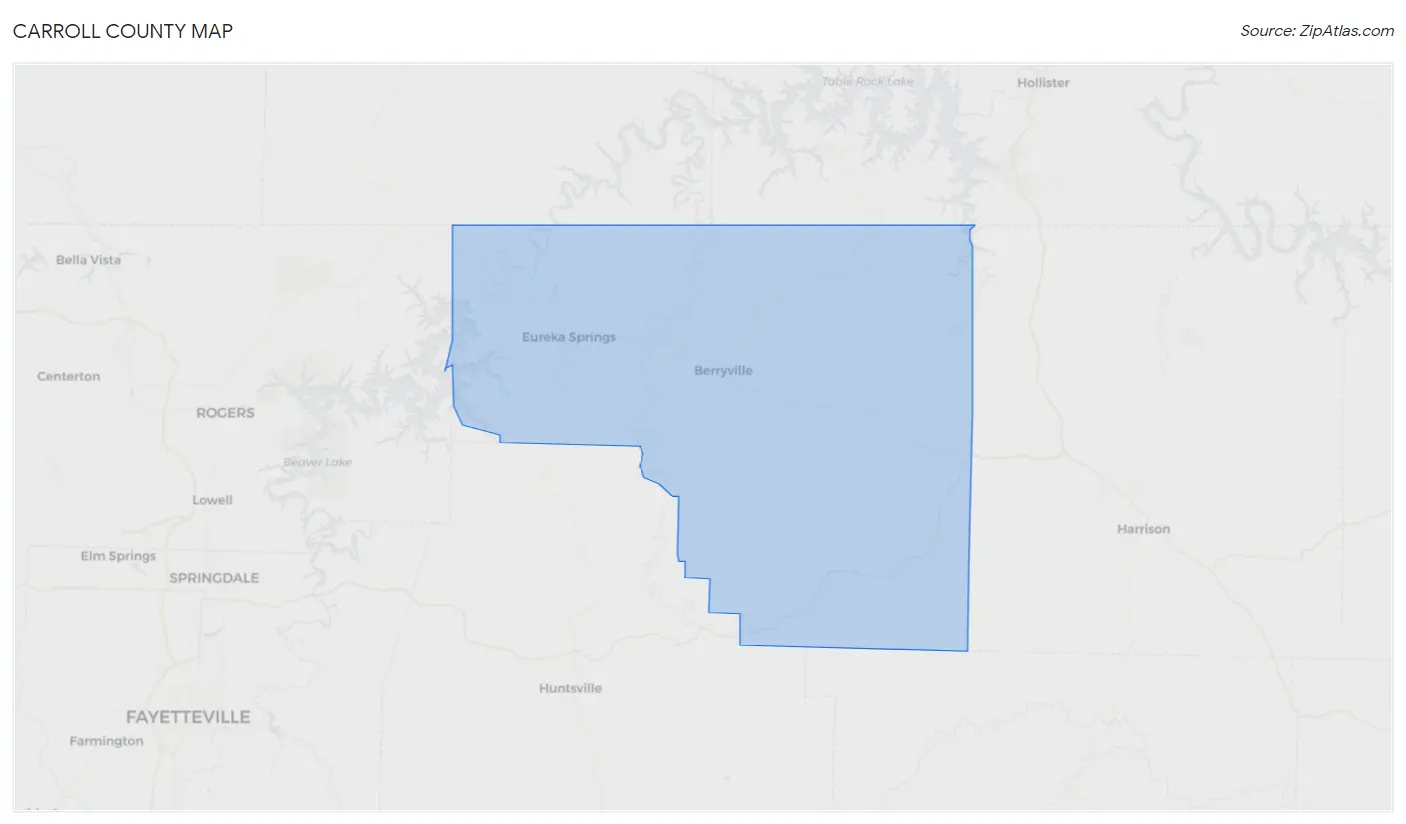
Carroll County Map
Carroll County Overview
$29,123
PER CAPITA INCOME
$68,994
AVG FAMILY INCOME
$56,826
AVG HOUSEHOLD INCOME
13.3%
WAGE / INCOME GAP [ % ]
86.7¢/ $1
WAGE / INCOME GAP [ $ ]
$9,647
FAMILY INCOME DEFICIT
0.45
INEQUALITY / GINI INDEX
28,362
TOTAL POPULATION
14,305
MALE POPULATION
14,057
FEMALE POPULATION
101.76
MALES / 100 FEMALES
98.27
FEMALES / 100 MALES
44.6
MEDIAN AGE
3.0
AVG FAMILY SIZE
2.5
AVG HOUSEHOLD SIZE
12,228
LABOR FORCE [ PEOPLE ]
53.1%
PERCENT IN LABOR FORCE
3.1%
UNEMPLOYMENT RATE
Income in Carroll County
Income Overview in Carroll County
Per Capita Income in Carroll County is $29,123, while median incomes of families and households are $68,994 and $56,826 respectively.
| Characteristic | Number | Measure |
| Per Capita Income | 28,362 | $29,123 |
| Median Family Income | 7,957 | $68,994 |
| Mean Family Income | 7,957 | $86,536 |
| Median Household Income | 11,357 | $56,826 |
| Mean Household Income | 11,357 | $71,631 |
| Income Deficit | 7,957 | $9,647 |
| Wage / Income Gap (%) | 28,362 | 13.27% |
| Wage / Income Gap ($) | 28,362 | 86.73¢ per $1 |
| Gini / Inequality Index | 28,362 | 0.45 |
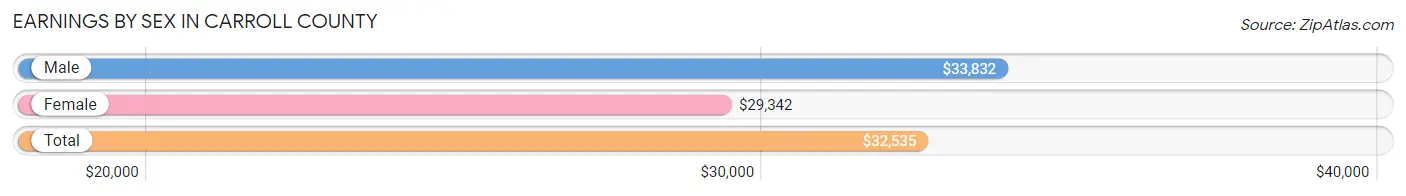
Earnings by Sex in Carroll County
Average Earnings in Carroll County are $32,535, $33,832 for men and $29,342 for women, a difference of 13.3%.
| Sex | Number | Average Earnings |
| Male | 7,486 (57.1%) | $33,832 |
| Female | 5,630 (42.9%) | $29,342 |
| Total | 13,116 (100.0%) | $32,535 |
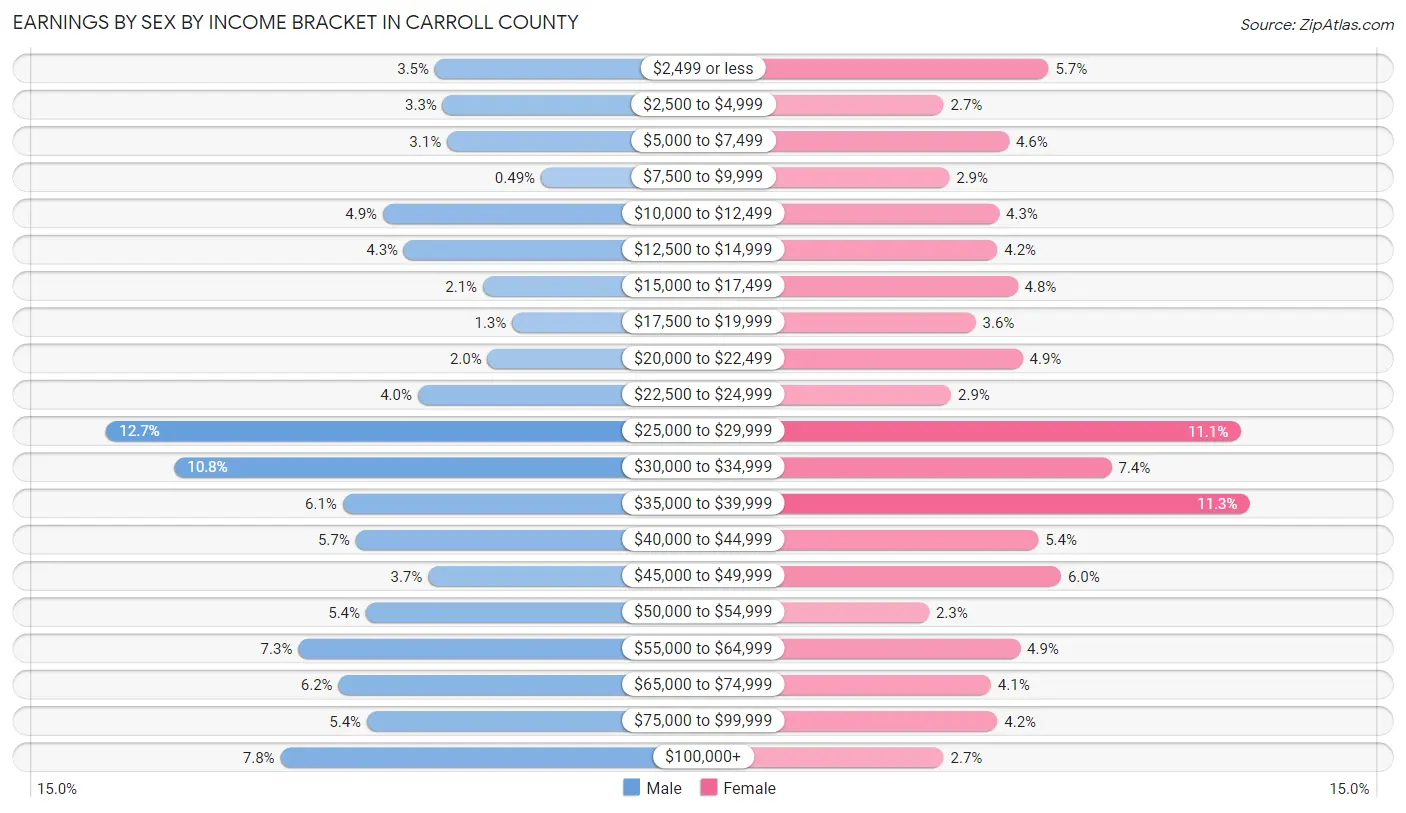
Earnings by Sex by Income Bracket in Carroll County
The most common earnings brackets in Carroll County are $25,000 to $29,999 for men (951 | 12.7%) and $35,000 to $39,999 for women (637 | 11.3%).
| Income | Male | Female |
| $2,499 or less | 260 (3.5%) | 319 (5.7%) |
| $2,500 to $4,999 | 243 (3.3%) | 153 (2.7%) |
| $5,000 to $7,499 | 234 (3.1%) | 257 (4.6%) |
| $7,500 to $9,999 | 37 (0.5%) | 162 (2.9%) |
| $10,000 to $12,499 | 369 (4.9%) | 241 (4.3%) |
| $12,500 to $14,999 | 325 (4.3%) | 238 (4.2%) |
| $15,000 to $17,499 | 159 (2.1%) | 270 (4.8%) |
| $17,500 to $19,999 | 97 (1.3%) | 204 (3.6%) |
| $20,000 to $22,499 | 149 (2.0%) | 278 (4.9%) |
| $22,500 to $24,999 | 296 (4.0%) | 165 (2.9%) |
| $25,000 to $29,999 | 951 (12.7%) | 622 (11.1%) |
| $30,000 to $34,999 | 808 (10.8%) | 419 (7.4%) |
| $35,000 to $39,999 | 454 (6.1%) | 637 (11.3%) |
| $40,000 to $44,999 | 427 (5.7%) | 303 (5.4%) |
| $45,000 to $49,999 | 274 (3.7%) | 339 (6.0%) |
| $50,000 to $54,999 | 405 (5.4%) | 130 (2.3%) |
| $55,000 to $64,999 | 547 (7.3%) | 274 (4.9%) |
| $65,000 to $74,999 | 463 (6.2%) | 228 (4.1%) |
| $75,000 to $99,999 | 403 (5.4%) | 238 (4.2%) |
| $100,000+ | 585 (7.8%) | 153 (2.7%) |
| Total | 7,486 (100.0%) | 5,630 (100.0%) |
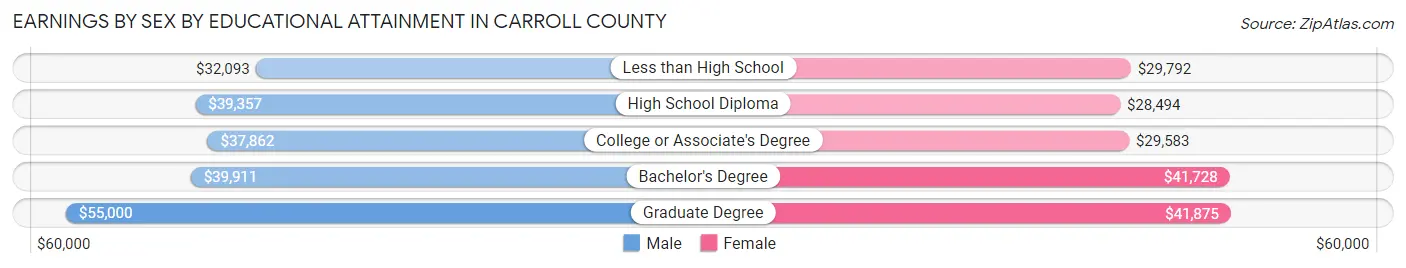
Earnings by Sex by Educational Attainment in Carroll County
Average earnings in Carroll County are $36,983 for men and $32,115 for women, a difference of 13.2%. Men with an educational attainment of graduate degree enjoy the highest average annual earnings of $55,000, while those with less than high school education earn the least with $32,093. Women with an educational attainment of graduate degree earn the most with the average annual earnings of $41,875, while those with high school diploma education have the smallest earnings of $28,494.
| Educational Attainment | Male Income | Female Income |
| Less than High School | $32,093 | $29,792 |
| High School Diploma | $39,357 | $28,494 |
| College or Associate's Degree | $37,862 | $29,583 |
| Bachelor's Degree | $39,911 | $41,728 |
| Graduate Degree | $55,000 | $41,875 |
| Total | $36,983 | $32,115 |
Family Income in Carroll County
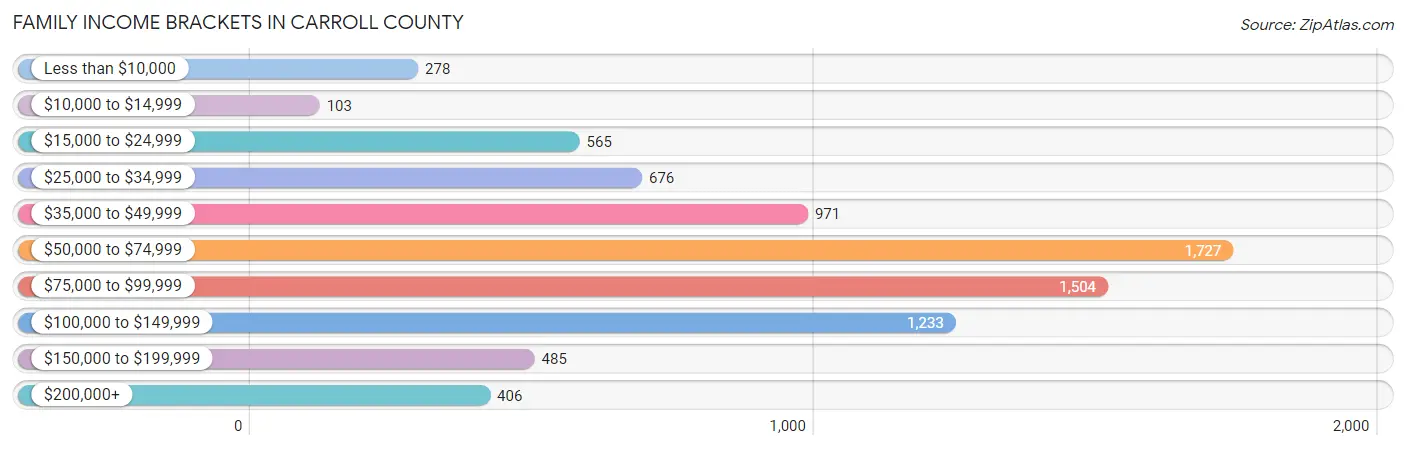
Family Income Brackets in Carroll County
According to the Carroll County family income data, there are 1,727 families falling into the $50,000 to $74,999 income range, which is the most common income bracket and makes up 21.7% of all families. Conversely, the $10,000 to $14,999 income bracket is the least frequent group with only 103 families (1.3%) belonging to this category.
| Income Bracket | # Families | % Families |
| Less than $10,000 | 278 | 3.5% |
| $10,000 to $14,999 | 103 | 1.3% |
| $15,000 to $24,999 | 565 | 7.1% |
| $25,000 to $34,999 | 676 | 8.5% |
| $35,000 to $49,999 | 971 | 12.2% |
| $50,000 to $74,999 | 1,727 | 21.7% |
| $75,000 to $99,999 | 1,504 | 18.9% |
| $100,000 to $149,999 | 1,233 | 15.5% |
| $150,000 to $199,999 | 485 | 6.1% |
| $200,000+ | 406 | 5.1% |
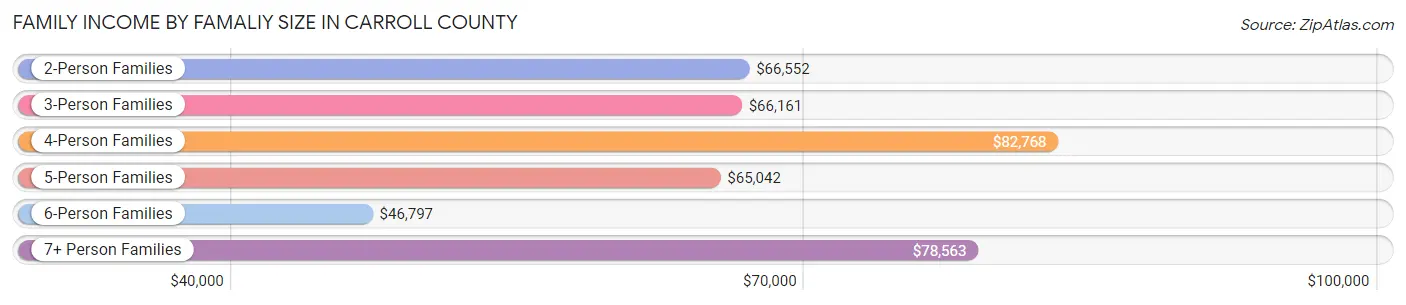
Family Income by Famaliy Size in Carroll County
4-person families (751 | 9.4%) account for the highest median family income in Carroll County with $82,768 per family, while 2-person families (4,344 | 54.6%) have the highest median income of $33,276 per family member.
| Income Bracket | # Families | Median Income |
| 2-Person Families | 4,344 (54.6%) | $66,552 |
| 3-Person Families | 1,499 (18.8%) | $66,161 |
| 4-Person Families | 751 (9.4%) | $82,768 |
| 5-Person Families | 831 (10.4%) | $65,042 |
| 6-Person Families | 391 (4.9%) | $46,797 |
| 7+ Person Families | 141 (1.8%) | $78,563 |
| Total | 7,957 (100.0%) | $68,994 |
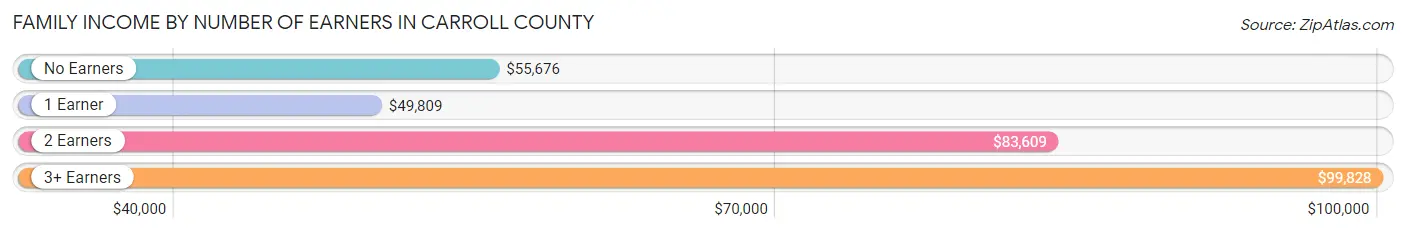
Family Income by Number of Earners in Carroll County
The median family income in Carroll County is $68,994, with families comprising 3+ earners (662) having the highest median family income of $99,828, while families with 1 earner (2,923) have the lowest median family income of $49,809, accounting for 8.3% and 36.7% of families, respectively.
| Number of Earners | # Families | Median Income |
| No Earners | 1,433 (18.0%) | $55,676 |
| 1 Earner | 2,923 (36.7%) | $49,809 |
| 2 Earners | 2,939 (36.9%) | $83,609 |
| 3+ Earners | 662 (8.3%) | $99,828 |
| Total | 7,957 (100.0%) | $68,994 |
Household Income in Carroll County
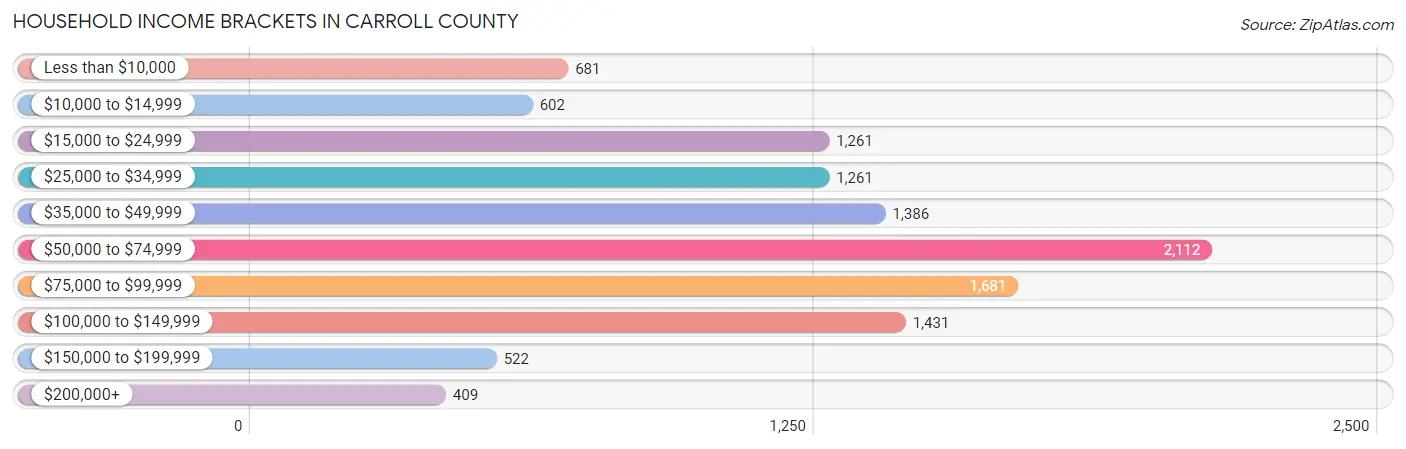
Household Income Brackets in Carroll County
With 2,112 households falling in the category, the $50,000 to $74,999 income range is the most frequent in Carroll County, accounting for 18.6% of all households. In contrast, only 409 households (3.6%) fall into the $200,000+ income bracket, making it the least populous group.
| Income Bracket | # Households | % Households |
| Less than $10,000 | 681 | 6.0% |
| $10,000 to $14,999 | 602 | 5.3% |
| $15,000 to $24,999 | 1,261 | 11.1% |
| $25,000 to $34,999 | 1,261 | 11.1% |
| $35,000 to $49,999 | 1,386 | 12.2% |
| $50,000 to $74,999 | 2,112 | 18.6% |
| $75,000 to $99,999 | 1,681 | 14.8% |
| $100,000 to $149,999 | 1,431 | 12.6% |
| $150,000 to $199,999 | 522 | 4.6% |
| $200,000+ | 409 | 3.6% |
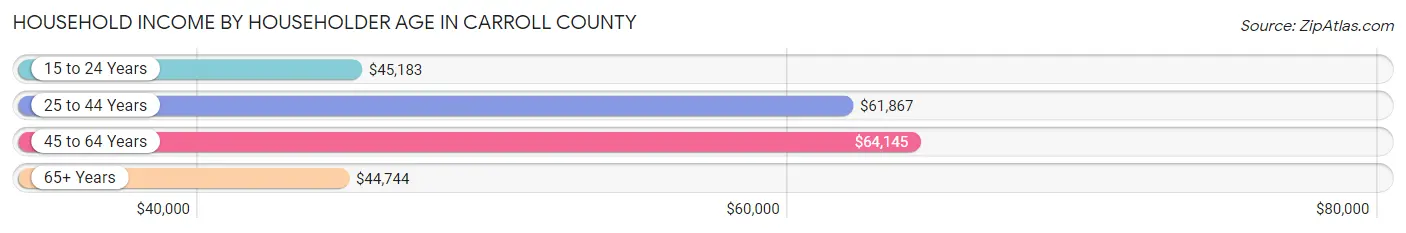
Household Income by Householder Age in Carroll County
The median household income in Carroll County is $56,826, with the highest median household income of $64,145 found in the 45 to 64 years age bracket for the primary householder. A total of 4,027 households (35.5%) fall into this category. Meanwhile, the 65+ years age bracket for the primary householder has the lowest median household income of $44,744, with 4,242 households (37.3%) in this group.
| Income Bracket | # Households | Median Income |
| 15 to 24 Years | 306 (2.7%) | $45,183 |
| 25 to 44 Years | 2,782 (24.5%) | $61,867 |
| 45 to 64 Years | 4,027 (35.5%) | $64,145 |
| 65+ Years | 4,242 (37.3%) | $44,744 |
| Total | 11,357 (100.0%) | $56,826 |
Poverty in Carroll County
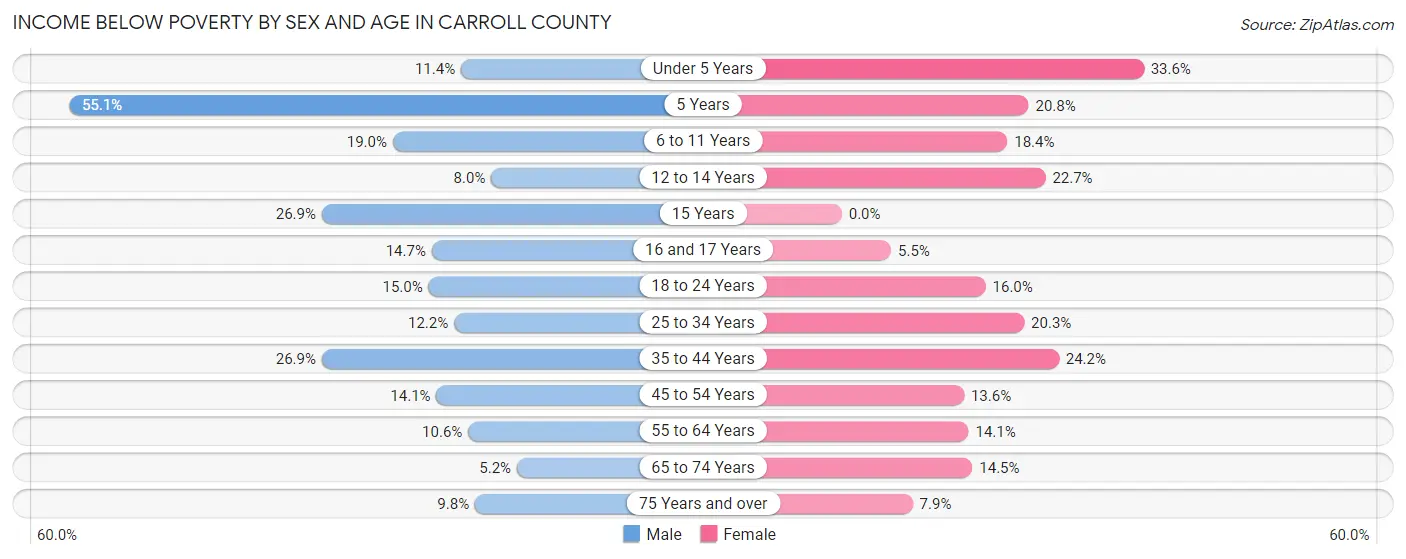
Income Below Poverty by Sex and Age in Carroll County
With 14.2% poverty level for males and 16.7% for females among the residents of Carroll County, 5 year old males and under 5 year old females are the most vulnerable to poverty, with 136 males (55.1%) and 236 females (33.6%) in their respective age groups living below the poverty level.
| Age Bracket | Male | Female |
| Under 5 Years | 89 (11.4%) | 236 (33.6%) |
| 5 Years | 136 (55.1%) | 52 (20.8%) |
| 6 to 11 Years | 217 (19.0%) | 146 (18.4%) |
| 12 to 14 Years | 38 (8.0%) | 127 (22.7%) |
| 15 Years | 46 (26.9%) | 0 (0.0%) |
| 16 and 17 Years | 79 (14.7%) | 20 (5.5%) |
| 18 to 24 Years | 148 (15.0%) | 144 (16.0%) |
| 25 to 34 Years | 193 (12.2%) | 311 (20.3%) |
| 35 to 44 Years | 399 (26.9%) | 355 (24.2%) |
| 45 to 54 Years | 239 (14.1%) | 223 (13.6%) |
| 55 to 64 Years | 221 (10.6%) | 287 (14.1%) |
| 65 to 74 Years | 96 (5.2%) | 315 (14.5%) |
| 75 Years and over | 108 (9.8%) | 104 (7.9%) |
| Total | 2,009 (14.2%) | 2,320 (16.7%) |
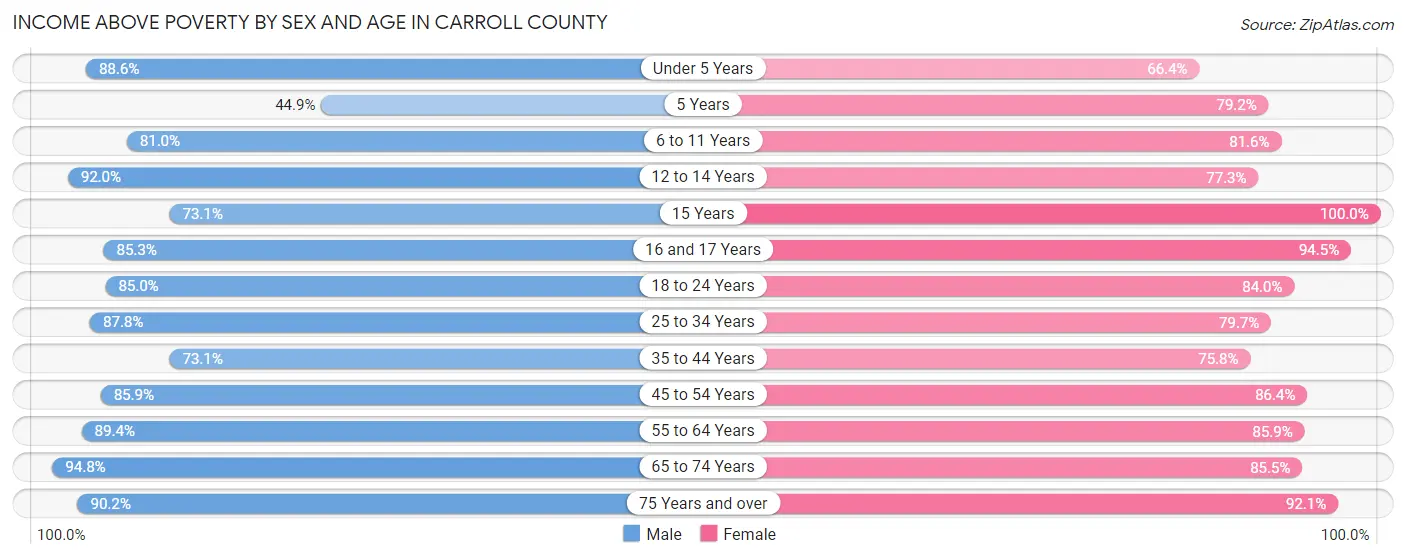
Income Above Poverty by Sex and Age in Carroll County
According to the poverty statistics in Carroll County, males aged 65 to 74 years and females aged 15 years are the age groups that are most secure financially, with 94.8% of males and 100.0% of females in these age groups living above the poverty line.
| Age Bracket | Male | Female |
| Under 5 Years | 692 (88.6%) | 466 (66.4%) |
| 5 Years | 111 (44.9%) | 198 (79.2%) |
| 6 to 11 Years | 926 (81.0%) | 646 (81.6%) |
| 12 to 14 Years | 435 (92.0%) | 433 (77.3%) |
| 15 Years | 125 (73.1%) | 185 (100.0%) |
| 16 and 17 Years | 460 (85.3%) | 344 (94.5%) |
| 18 to 24 Years | 838 (85.0%) | 755 (84.0%) |
| 25 to 34 Years | 1,393 (87.8%) | 1,220 (79.7%) |
| 35 to 44 Years | 1,084 (73.1%) | 1,114 (75.8%) |
| 45 to 54 Years | 1,451 (85.9%) | 1,415 (86.4%) |
| 55 to 64 Years | 1,863 (89.4%) | 1,745 (85.9%) |
| 65 to 74 Years | 1,762 (94.8%) | 1,852 (85.5%) |
| 75 Years and over | 990 (90.2%) | 1,214 (92.1%) |
| Total | 12,130 (85.8%) | 11,587 (83.3%) |
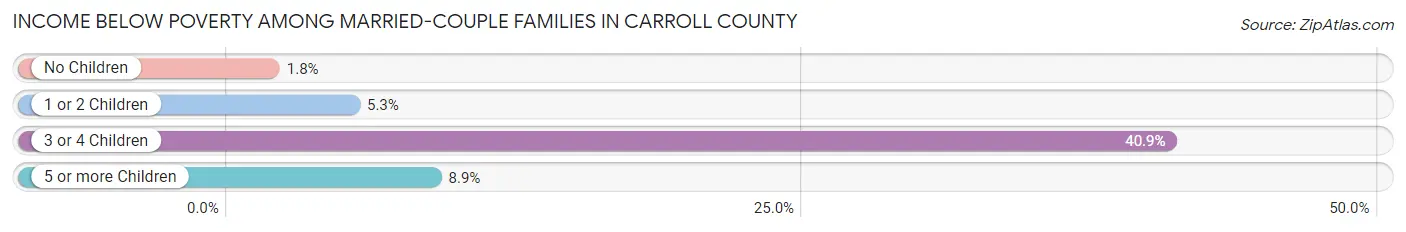
Income Below Poverty Among Married-Couple Families in Carroll County
The poverty statistics for married-couple families in Carroll County show that 7.2% or 450 of the total 6,254 families live below the poverty line. Families with 3 or 4 children have the highest poverty rate of 40.9%, comprising of 289 families. On the other hand, families with no children have the lowest poverty rate of 1.8%, which includes 71 families.
| Children | Above Poverty | Below Poverty |
| No Children | 3,835 (98.2%) | 71 (1.8%) |
| 1 or 2 Children | 1,479 (94.7%) | 83 (5.3%) |
| 3 or 4 Children | 418 (59.1%) | 289 (40.9%) |
| 5 or more Children | 72 (91.1%) | 7 (8.9%) |
| Total | 5,804 (92.8%) | 450 (7.2%) |
Income Below Poverty Among Single-Parent Households in Carroll County
According to the poverty data in Carroll County, 11.3% or 37 single-father households and 30.7% or 422 single-mother households are living below the poverty line. Among single-father households, those with 3 or 4 children have the highest poverty rate, with 1 households (100.0%) experiencing poverty. Likewise, among single-mother households, those with 1 or 2 children have the highest poverty rate, with 216 households (43.4%) falling below the poverty line.
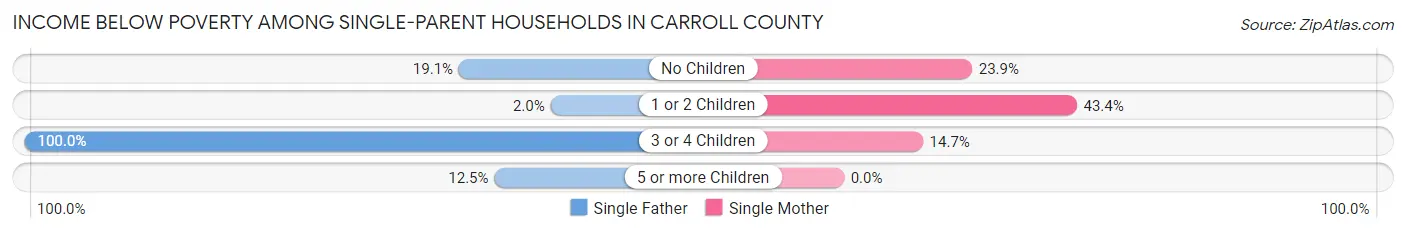
| Children | Single Father | Single Mother |
| No Children | 30 (19.1%) | 201 (23.9%) |
| 1 or 2 Children | 3 (2.0%) | 216 (43.4%) |
| 3 or 4 Children | 1 (100.0%) | 5 (14.7%) |
| 5 or more Children | 3 (12.5%) | 0 (0.0%) |
| Total | 37 (11.3%) | 422 (30.7%) |
Income Below Poverty Among Married-Couple vs Single-Parent Households in Carroll County
The poverty data for Carroll County shows that 450 of the married-couple family households (7.2%) and 459 of the single-parent households (27.0%) are living below the poverty level. Within the married-couple family households, those with 3 or 4 children have the highest poverty rate, with 289 households (40.9%) falling below the poverty line. Among the single-parent households, those with 1 or 2 children have the highest poverty rate, with 219 household (34.0%) living below poverty.
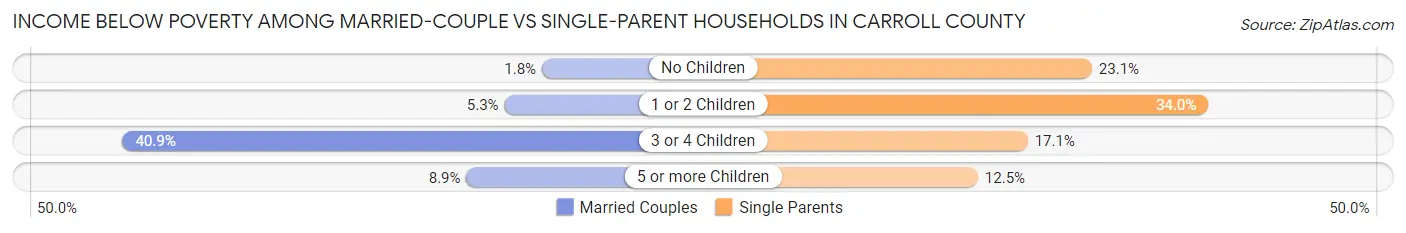
| Children | Married-Couple Families | Single-Parent Households |
| No Children | 71 (1.8%) | 231 (23.1%) |
| 1 or 2 Children | 83 (5.3%) | 219 (34.0%) |
| 3 or 4 Children | 289 (40.9%) | 6 (17.1%) |
| 5 or more Children | 7 (8.9%) | 3 (12.5%) |
| Total | 450 (7.2%) | 459 (27.0%) |
Race in Carroll County
The most populous races in Carroll County are White / Caucasian (22,594 | 79.7%), Hispanic or Latino (4,417 | 15.6%), and Two or more Races (4,106 | 14.5%).
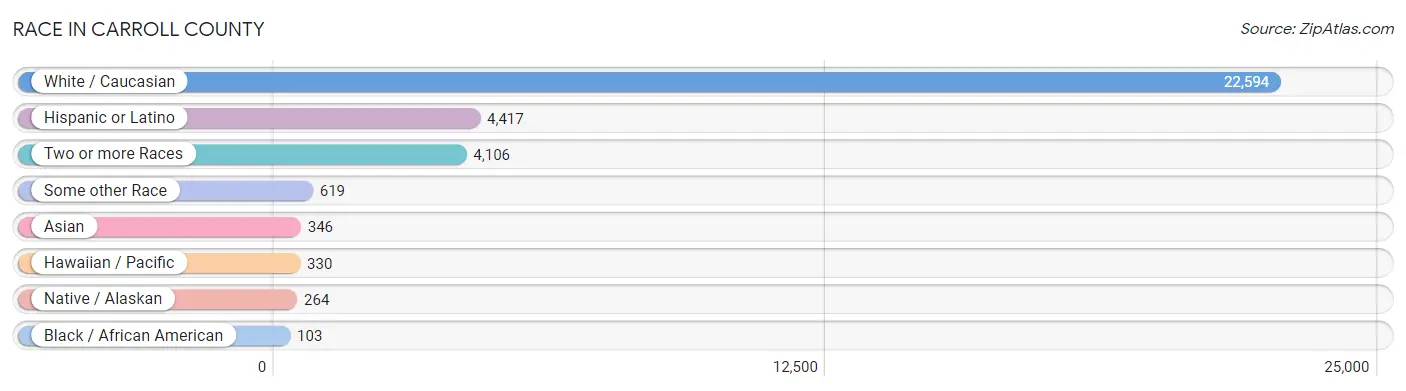
| Race | # Population | % Population |
| Asian | 346 | 1.2% |
| Black / African American | 103 | 0.4% |
| Hawaiian / Pacific | 330 | 1.2% |
| Hispanic or Latino | 4,417 | 15.6% |
| Native / Alaskan | 264 | 0.9% |
| White / Caucasian | 22,594 | 79.7% |
| Two or more Races | 4,106 | 14.5% |
| Some other Race | 619 | 2.2% |
| Total | 28,362 | 100.0% |
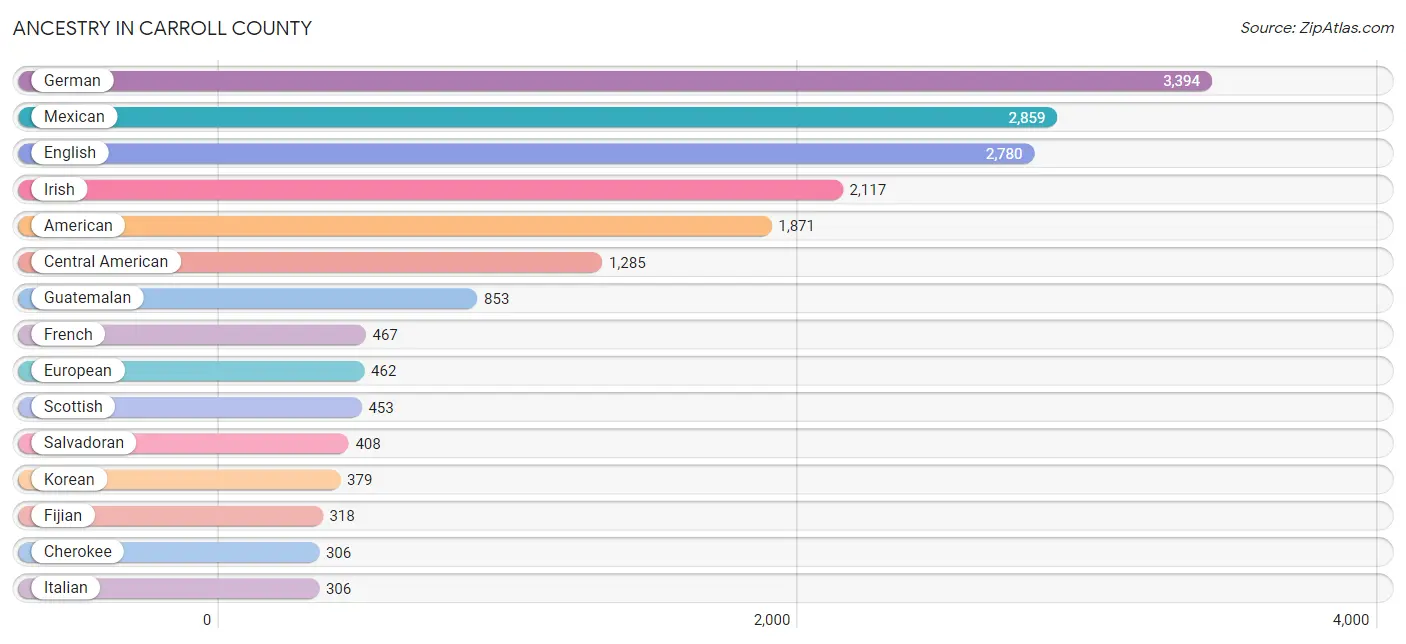
Ancestry in Carroll County
The most populous ancestries reported in Carroll County are German (3,394 | 12.0%), Mexican (2,859 | 10.1%), English (2,780 | 9.8%), Irish (2,117 | 7.5%), and American (1,871 | 6.6%), together accounting for 45.9% of all Carroll County residents.
| Ancestry | # Population | % Population |
| Afghan | 4 | 0.0% |
| American | 1,871 | 6.6% |
| Arab | 19 | 0.1% |
| Armenian | 16 | 0.1% |
| Austrian | 11 | 0.0% |
| Bangladeshi | 29 | 0.1% |
| Bhutanese | 1 | 0.0% |
| Blackfeet | 24 | 0.1% |
| British | 143 | 0.5% |
| Burmese | 53 | 0.2% |
| Canadian | 2 | 0.0% |
| Celtic | 3 | 0.0% |
| Central American | 1,285 | 4.5% |
| Cherokee | 306 | 1.1% |
| Chickasaw | 159 | 0.6% |
| Chippewa | 9 | 0.0% |
| Choctaw | 8 | 0.0% |
| Colombian | 9 | 0.0% |
| Costa Rican | 6 | 0.0% |
| Creek | 10 | 0.0% |
| Croatian | 10 | 0.0% |
| Czech | 177 | 0.6% |
| Czechoslovakian | 23 | 0.1% |
| Danish | 32 | 0.1% |
| Delaware | 3 | 0.0% |
| Dominican | 17 | 0.1% |
| Dutch | 237 | 0.8% |
| Eastern European | 76 | 0.3% |
| Ecuadorian | 29 | 0.1% |
| English | 2,780 | 9.8% |
| European | 462 | 1.6% |
| Fijian | 318 | 1.1% |
| Filipino | 2 | 0.0% |
| Finnish | 27 | 0.1% |
| French | 467 | 1.7% |
| French Canadian | 34 | 0.1% |
| German | 3,394 | 12.0% |
| Greek | 18 | 0.1% |
| Guatemalan | 853 | 3.0% |
| Houma | 1 | 0.0% |
| Hungarian | 26 | 0.1% |
| Indian (Asian) | 37 | 0.1% |
| Indonesian | 36 | 0.1% |
| Irish | 2,117 | 7.5% |
| Israeli | 80 | 0.3% |
| Italian | 306 | 1.1% |
| Korean | 379 | 1.3% |
| Mexican | 2,859 | 10.1% |
| Moroccan | 16 | 0.1% |
| Native Hawaiian | 67 | 0.2% |
| Navajo | 3 | 0.0% |
| Northern European | 108 | 0.4% |
| Norwegian | 245 | 0.9% |
| Panamanian | 18 | 0.1% |
| Pennsylvania German | 16 | 0.1% |
| Polish | 165 | 0.6% |
| Portuguese | 14 | 0.1% |
| Potawatomi | 3 | 0.0% |
| Puerto Rican | 112 | 0.4% |
| Romanian | 17 | 0.1% |
| Russian | 22 | 0.1% |
| Salvadoran | 408 | 1.4% |
| Scandinavian | 129 | 0.4% |
| Scotch-Irish | 259 | 0.9% |
| Scottish | 453 | 1.6% |
| Serbian | 9 | 0.0% |
| Sioux | 3 | 0.0% |
| Slovak | 46 | 0.2% |
| South American | 38 | 0.1% |
| Spaniard | 32 | 0.1% |
| Spanish | 45 | 0.2% |
| Swedish | 140 | 0.5% |
| Swiss | 45 | 0.2% |
| Thai | 37 | 0.1% |
| Tongan | 29 | 0.1% |
| Ukrainian | 119 | 0.4% |
| Welsh | 246 | 0.9% |
| Yaqui | 137 | 0.5% | View All 78 Rows |
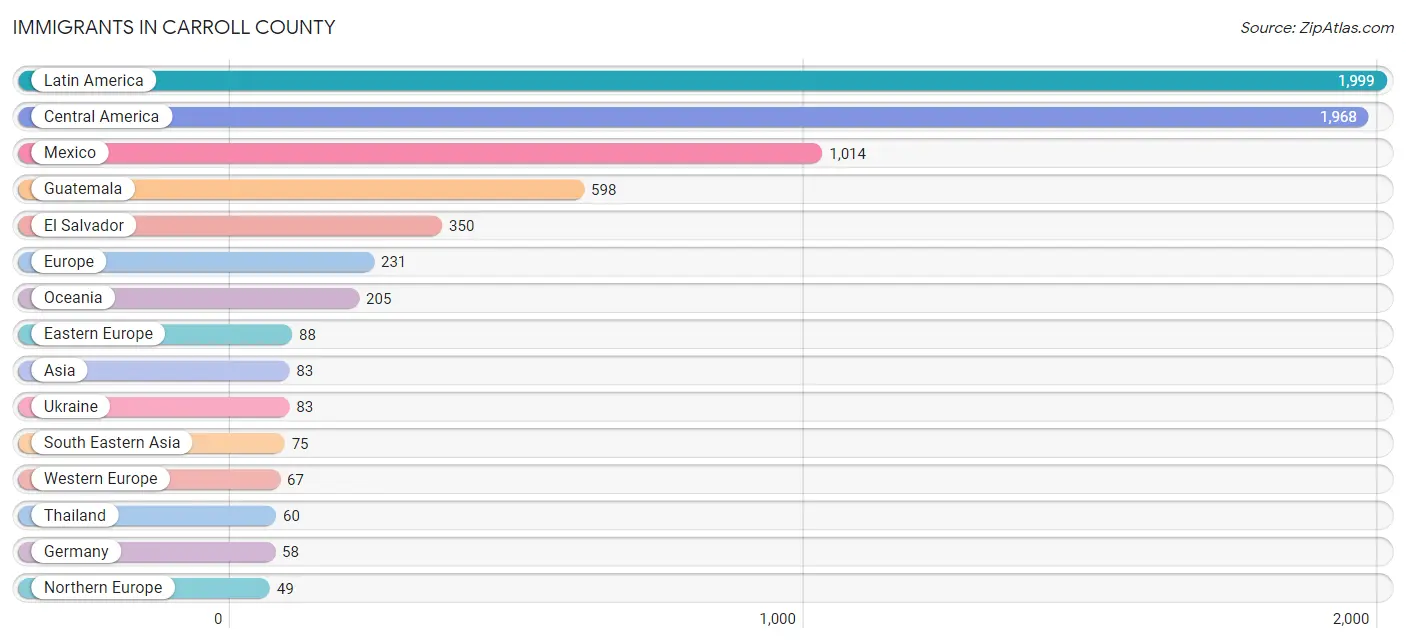
Immigrants in Carroll County
The most numerous immigrant groups reported in Carroll County came from Latin America (1,999 | 7.0%), Central America (1,968 | 6.9%), Mexico (1,014 | 3.6%), Guatemala (598 | 2.1%), and El Salvador (350 | 1.2%), together accounting for 20.9% of all Carroll County residents.
| Immigration Origin | # Population | % Population |
| Africa | 9 | 0.0% |
| Asia | 83 | 0.3% |
| Brazil | 8 | 0.0% |
| Canada | 10 | 0.0% |
| Caribbean | 13 | 0.1% |
| Central America | 1,968 | 6.9% |
| China | 2 | 0.0% |
| Costa Rica | 6 | 0.0% |
| Dominican Republic | 13 | 0.1% |
| Eastern Asia | 8 | 0.0% |
| Eastern Europe | 88 | 0.3% |
| El Salvador | 350 | 1.2% |
| Europe | 231 | 0.8% |
| France | 9 | 0.0% |
| Germany | 58 | 0.2% |
| Guatemala | 598 | 2.1% |
| Hungary | 5 | 0.0% |
| Korea | 6 | 0.0% |
| Latin America | 1,999 | 7.0% |
| Mexico | 1,014 | 3.6% |
| Northern Europe | 49 | 0.2% |
| Oceania | 205 | 0.7% |
| Philippines | 7 | 0.0% |
| South Africa | 9 | 0.0% |
| South America | 18 | 0.1% |
| South Eastern Asia | 75 | 0.3% |
| Southern Europe | 27 | 0.1% |
| Spain | 27 | 0.1% |
| Taiwan | 2 | 0.0% |
| Thailand | 60 | 0.2% |
| Ukraine | 83 | 0.3% |
| Western Europe | 67 | 0.2% | View All 32 Rows |
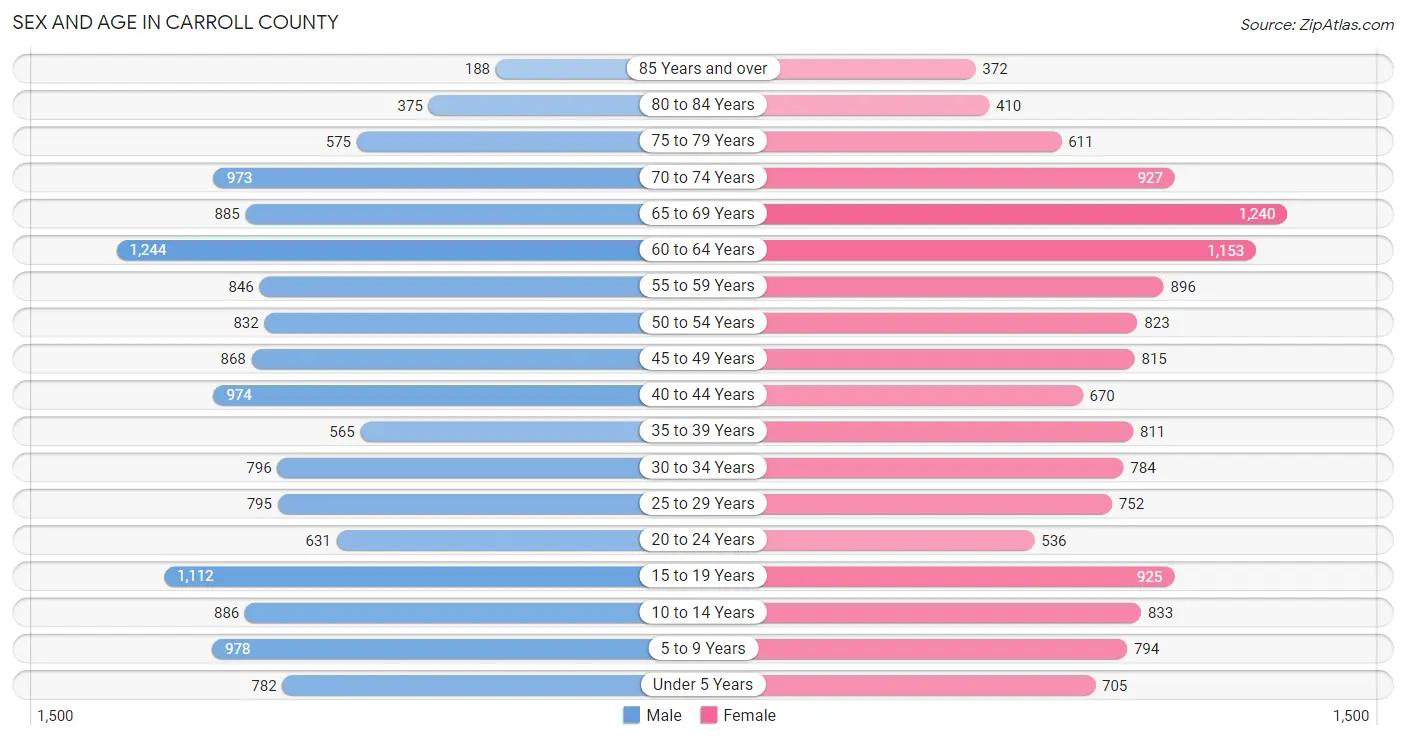
Sex and Age in Carroll County
Sex and Age in Carroll County
The most populous age groups in Carroll County are 60 to 64 Years (1,244 | 8.7%) for men and 65 to 69 Years (1,240 | 8.8%) for women.
| Age Bracket | Male | Female |
| Under 5 Years | 782 (5.5%) | 705 (5.0%) |
| 5 to 9 Years | 978 (6.8%) | 794 (5.7%) |
| 10 to 14 Years | 886 (6.2%) | 833 (5.9%) |
| 15 to 19 Years | 1,112 (7.8%) | 925 (6.6%) |
| 20 to 24 Years | 631 (4.4%) | 536 (3.8%) |
| 25 to 29 Years | 795 (5.6%) | 752 (5.3%) |
| 30 to 34 Years | 796 (5.6%) | 784 (5.6%) |
| 35 to 39 Years | 565 (4.0%) | 811 (5.8%) |
| 40 to 44 Years | 974 (6.8%) | 670 (4.8%) |
| 45 to 49 Years | 868 (6.1%) | 815 (5.8%) |
| 50 to 54 Years | 832 (5.8%) | 823 (5.9%) |
| 55 to 59 Years | 846 (5.9%) | 896 (6.4%) |
| 60 to 64 Years | 1,244 (8.7%) | 1,153 (8.2%) |
| 65 to 69 Years | 885 (6.2%) | 1,240 (8.8%) |
| 70 to 74 Years | 973 (6.8%) | 927 (6.6%) |
| 75 to 79 Years | 575 (4.0%) | 611 (4.3%) |
| 80 to 84 Years | 375 (2.6%) | 410 (2.9%) |
| 85 Years and over | 188 (1.3%) | 372 (2.6%) |
| Total | 14,305 (100.0%) | 14,057 (100.0%) |
Families and Households in Carroll County
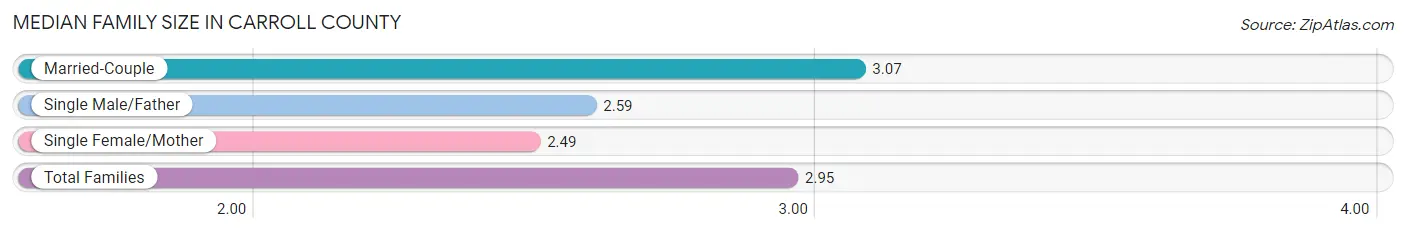
Median Family Size in Carroll County
The median family size in Carroll County is 2.95 persons per family, with married-couple families (6,254 | 78.6%) accounting for the largest median family size of 3.07 persons per family. On the other hand, single female/mother families (1,374 | 17.3%) represent the smallest median family size with 2.49 persons per family.
| Family Type | # Families | Family Size |
| Married-Couple | 6,254 (78.6%) | 3.07 |
| Single Male/Father | 329 (4.1%) | 2.59 |
| Single Female/Mother | 1,374 (17.3%) | 2.49 |
| Total Families | 7,957 (100.0%) | 2.95 |
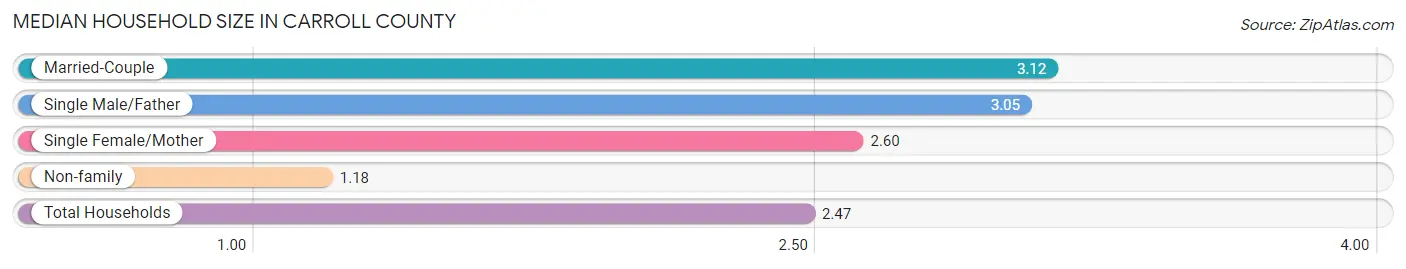
Median Household Size in Carroll County
The median household size in Carroll County is 2.47 persons per household, with married-couple households (6,254 | 55.1%) accounting for the largest median household size of 3.12 persons per household. non-family households (3,400 | 29.9%) represent the smallest median household size with 1.18 persons per household.
| Household Type | # Households | Household Size |
| Married-Couple | 6,254 (55.1%) | 3.12 |
| Single Male/Father | 329 (2.9%) | 3.05 |
| Single Female/Mother | 1,374 (12.1%) | 2.60 |
| Non-family | 3,400 (29.9%) | 1.18 |
| Total Households | 11,357 (100.0%) | 2.47 |
Household Size by Marriage Status in Carroll County
Out of a total of 11,357 households in Carroll County, 7,957 (70.1%) are family households, while 3,400 (29.9%) are nonfamily households. The most numerous type of family households are 2-person households, comprising 4,097, and the most common type of nonfamily households are 1-person households, comprising 2,879.
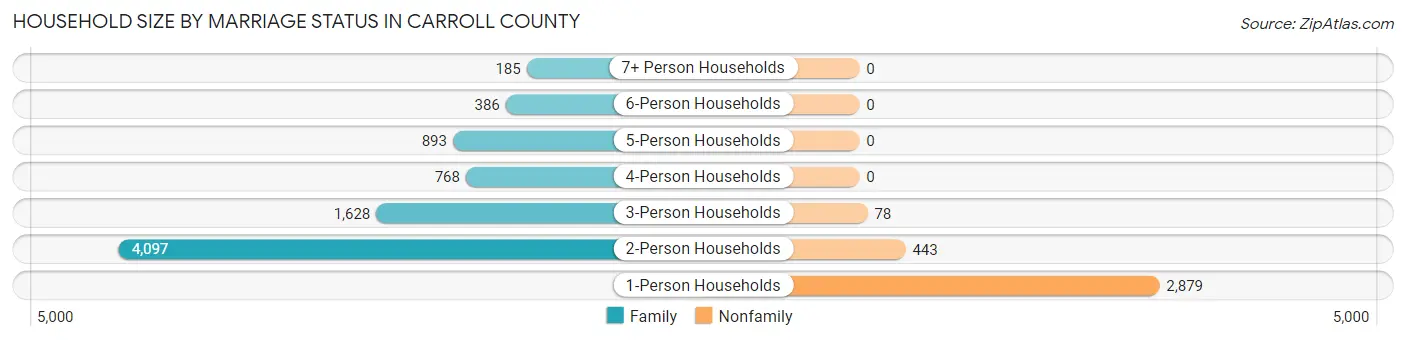
| Household Size | Family Households | Nonfamily Households |
| 1-Person Households | - | 2,879 (25.4%) |
| 2-Person Households | 4,097 (36.1%) | 443 (3.9%) |
| 3-Person Households | 1,628 (14.3%) | 78 (0.7%) |
| 4-Person Households | 768 (6.8%) | 0 (0.0%) |
| 5-Person Households | 893 (7.9%) | 0 (0.0%) |
| 6-Person Households | 386 (3.4%) | 0 (0.0%) |
| 7+ Person Households | 185 (1.6%) | 0 (0.0%) |
| Total | 7,957 (70.1%) | 3,400 (29.9%) |
Female Fertility in Carroll County
Fertility by Age in Carroll County
Average fertility rate in Carroll County is 47.0 births per 1,000 women. Women in the age bracket of 20 to 34 years have the highest fertility rate with 111.0 births per 1,000 women. Women in the age bracket of 20 to 34 years acount for 90.5% of all women with births.
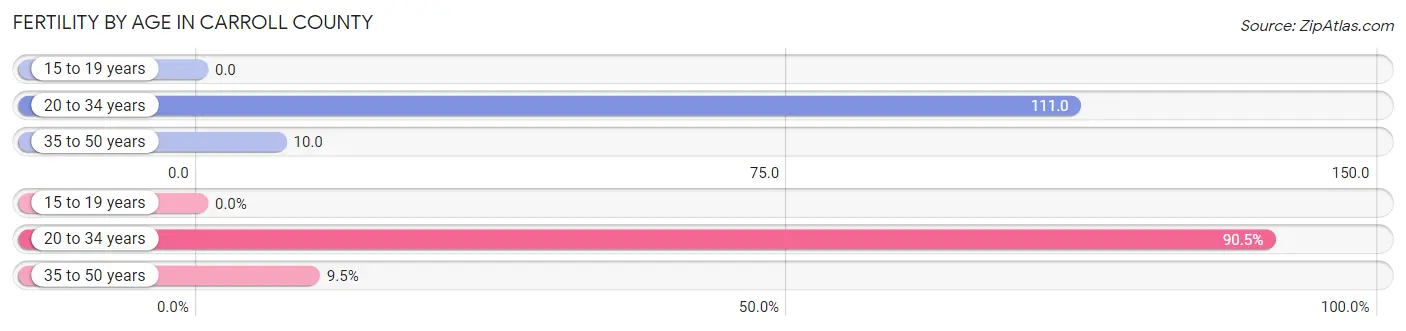
| Age Bracket | Women with Births | Births / 1,000 Women |
| 15 to 19 years | 0 (0.0%) | 0.0 |
| 20 to 34 years | 229 (90.5%) | 111.0 |
| 35 to 50 years | 24 (9.5%) | 10.0 |
| Total | 253 (100.0%) | 47.0 |
Fertility by Age by Marriage Status in Carroll County
57.7% of women with births (253) in Carroll County are married. The highest percentage of unmarried women with births falls into 35 to 50 years age bracket with 83.3% of them unmarried at the time of birth, while the lowest percentage of unmarried women with births belong to 20 to 34 years age bracket with 38.0% of them unmarried.
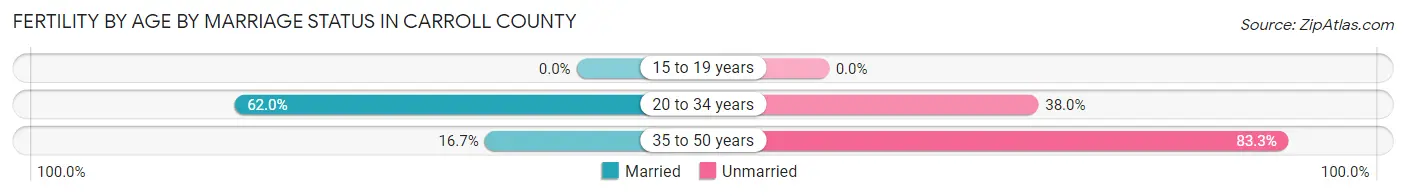
| Age Bracket | Married | Unmarried |
| 15 to 19 years | 0 (0.0%) | 0 (0.0%) |
| 20 to 34 years | 142 (62.0%) | 87 (38.0%) |
| 35 to 50 years | 4 (16.7%) | 20 (83.3%) |
| Total | 146 (57.7%) | 107 (42.3%) |
Fertility by Education in Carroll County
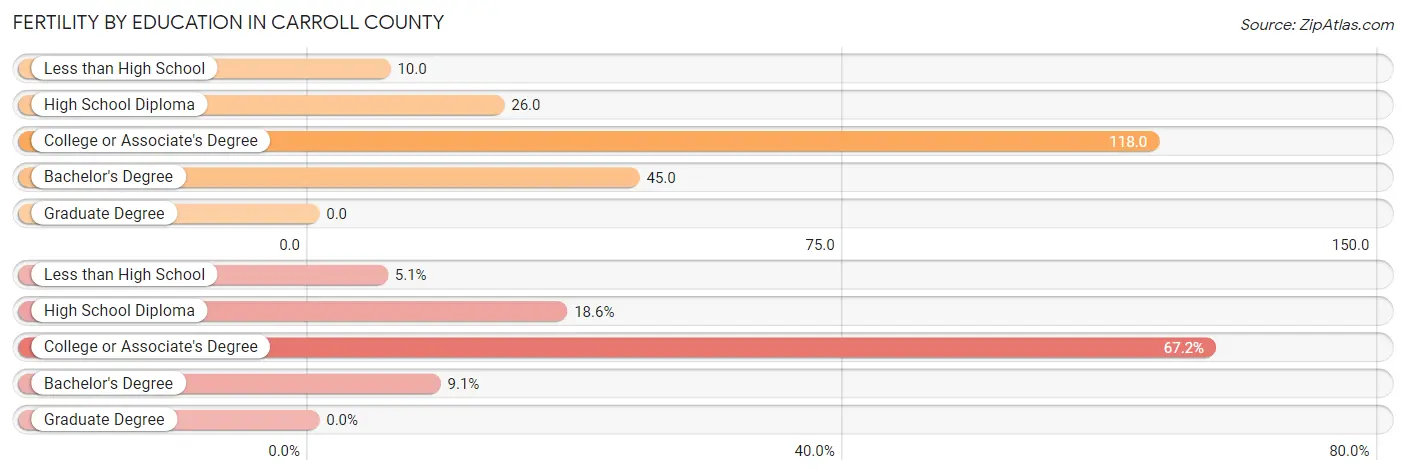
| Educational Attainment | Women with Births | Births / 1,000 Women |
| Less than High School | 13 (5.1%) | 10.0 |
| High School Diploma | 47 (18.6%) | 26.0 |
| College or Associate's Degree | 170 (67.2%) | 118.0 |
| Bachelor's Degree | 23 (9.1%) | 45.0 |
| Graduate Degree | 0 (0.0%) | 0.0 |
| Total | 253 (100.0%) | 47.0 |
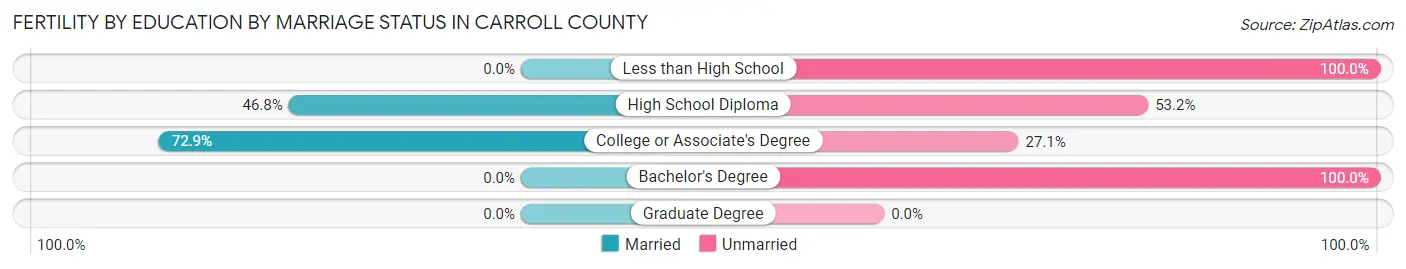
Fertility by Education by Marriage Status in Carroll County
42.3% of women with births in Carroll County are unmarried. Women with the educational attainment of college or associate's degree are most likely to be married with 72.9% of them married at childbirth, while women with the educational attainment of less than high school are least likely to be married with 100.0% of them unmarried at childbirth.
| Educational Attainment | Married | Unmarried |
| Less than High School | 0 (0.0%) | 13 (100.0%) |
| High School Diploma | 22 (46.8%) | 25 (53.2%) |
| College or Associate's Degree | 124 (72.9%) | 46 (27.1%) |
| Bachelor's Degree | 0 (0.0%) | 23 (100.0%) |
| Graduate Degree | 0 (0.0%) | 0 (0.0%) |
| Total | 146 (57.7%) | 107 (42.3%) |
Employment Characteristics in Carroll County
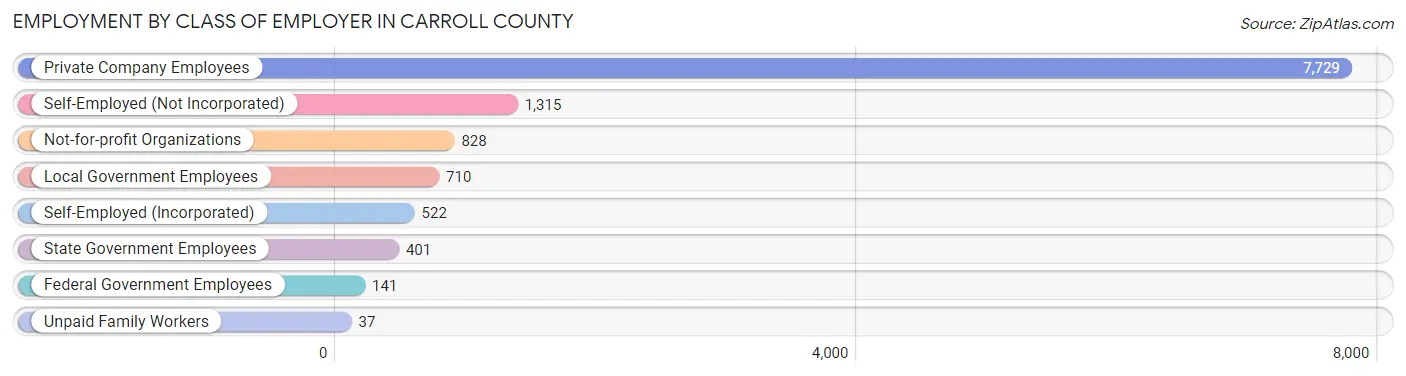
Employment by Class of Employer in Carroll County
Among the 11,683 employed individuals in Carroll County, private company employees (7,729 | 66.2%), self-employed (not incorporated) (1,315 | 11.3%), and not-for-profit organizations (828 | 7.1%) make up the most common classes of employment.
| Employer Class | # Employees | % Employees |
| Private Company Employees | 7,729 | 66.2% |
| Self-Employed (Incorporated) | 522 | 4.5% |
| Self-Employed (Not Incorporated) | 1,315 | 11.3% |
| Not-for-profit Organizations | 828 | 7.1% |
| Local Government Employees | 710 | 6.1% |
| State Government Employees | 401 | 3.4% |
| Federal Government Employees | 141 | 1.2% |
| Unpaid Family Workers | 37 | 0.3% |
| Total | 11,683 | 100.0% |
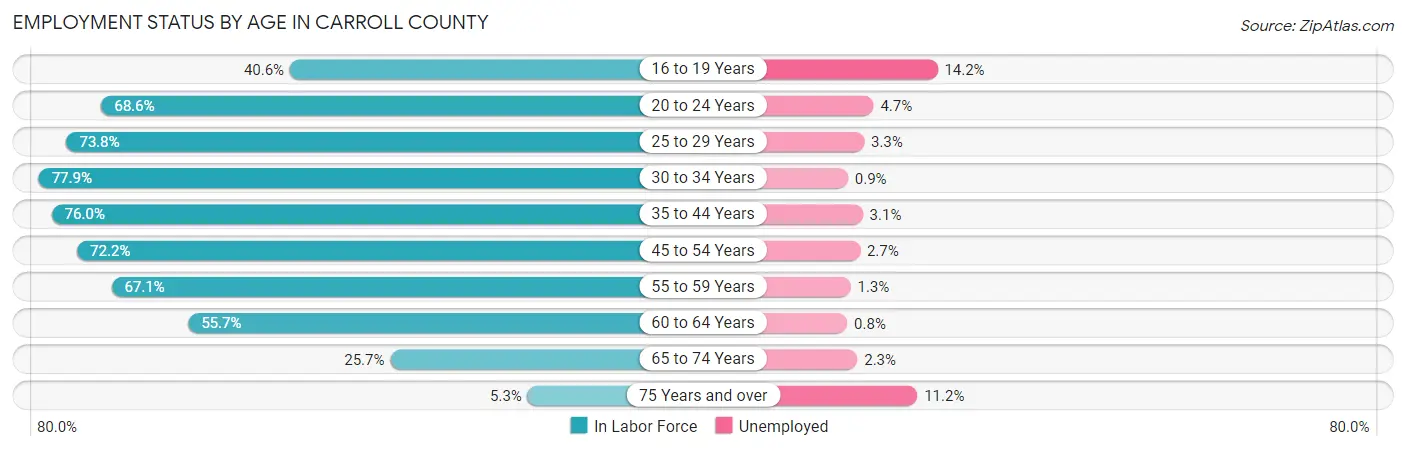
Employment Status by Age in Carroll County
According to the labor force statistics for Carroll County, out of the total population over 16 years of age (23,028), 53.1% or 12,228 individuals are in the labor force, with 3.1% or 379 of them unemployed. The age group with the highest labor force participation rate is 30 to 34 years, with 77.9% or 1,231 individuals in the labor force. Within the labor force, the 16 to 19 years age range has the highest percentage of unemployed individuals, with 14.2% or 97 of them being unemployed.
| Age Bracket | In Labor Force | Unemployed |
| 16 to 19 Years | 682 (40.6%) | 97 (14.2%) |
| 20 to 24 Years | 801 (68.6%) | 38 (4.7%) |
| 25 to 29 Years | 1,142 (73.8%) | 38 (3.3%) |
| 30 to 34 Years | 1,231 (77.9%) | 11 (0.9%) |
| 35 to 44 Years | 2,295 (76.0%) | 71 (3.1%) |
| 45 to 54 Years | 2,410 (72.2%) | 65 (2.7%) |
| 55 to 59 Years | 1,169 (67.1%) | 15 (1.3%) |
| 60 to 64 Years | 1,335 (55.7%) | 11 (0.8%) |
| 65 to 74 Years | 1,034 (25.7%) | 24 (2.3%) |
| 75 Years and over | 134 (5.3%) | 15 (11.2%) |
| Total | 12,228 (53.1%) | 379 (3.1%) |
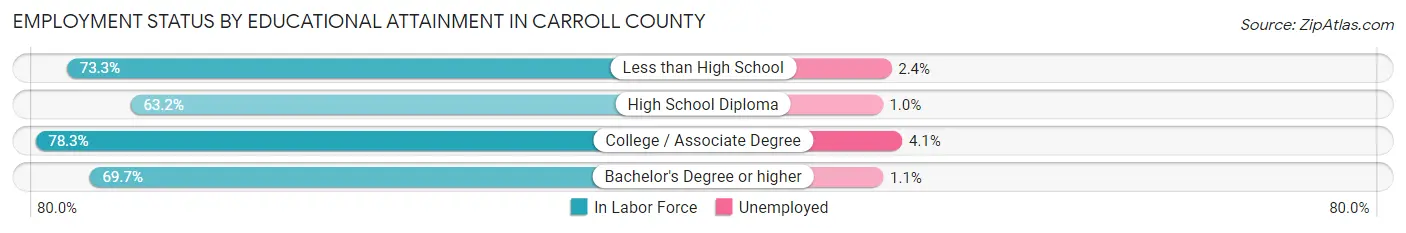
Employment Status by Educational Attainment in Carroll County
According to labor force statistics for Carroll County, 70.3% of individuals (9,578) out of the total population between 25 and 64 years of age (13,624) are in the labor force, with 2.2% or 211 of them being unemployed. The group with the highest labor force participation rate are those with the educational attainment of college / associate degree, with 78.3% or 2,953 individuals in the labor force. Within the labor force, individuals with college / associate degree education have the highest percentage of unemployment, with 4.1% or 121 of them being unemployed.
| Educational Attainment | In Labor Force | Unemployed |
| Less than High School | 1,642 (73.3%) | 54 (2.4%) |
| High School Diploma | 3,118 (63.2%) | 49 (1.0%) |
| College / Associate Degree | 2,953 (78.3%) | 155 (4.1%) |
| Bachelor's Degree or higher | 1,867 (69.7%) | 29 (1.1%) |
| Total | 9,578 (70.3%) | 300 (2.2%) |
Employment Occupations by Sex in Carroll County
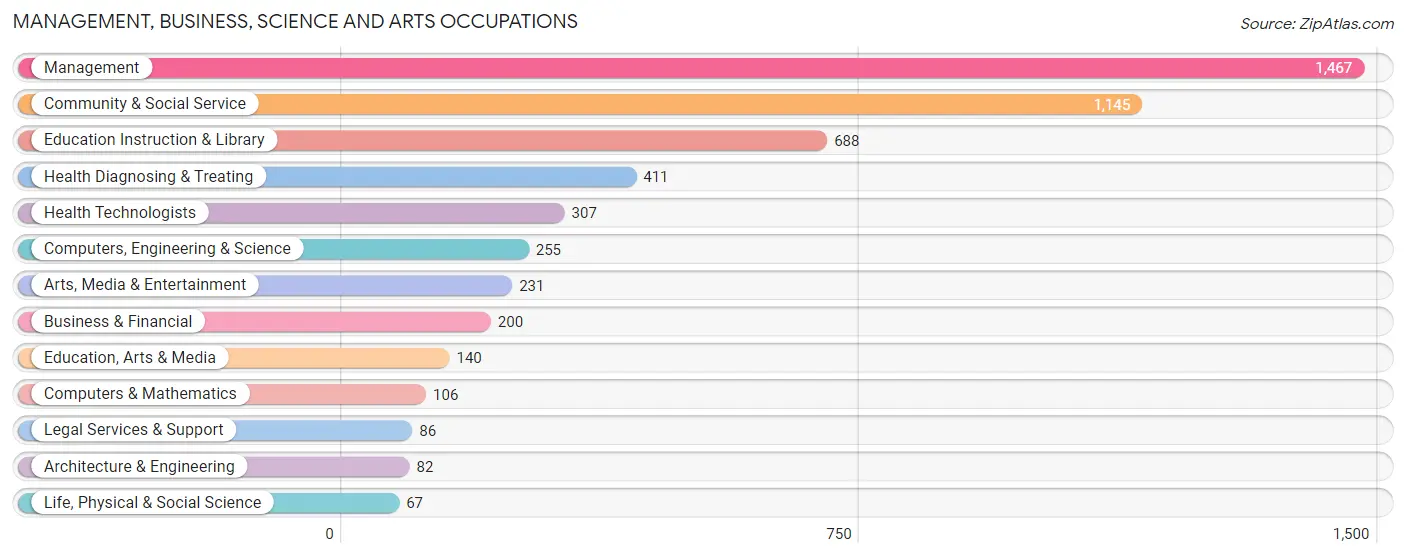
Management, Business, Science and Arts Occupations
The most common Management, Business, Science and Arts occupations in Carroll County are Management (1,467 | 12.4%), Community & Social Service (1,145 | 9.7%), Education Instruction & Library (688 | 5.8%), Health Diagnosing & Treating (411 | 3.5%), and Health Technologists (307 | 2.6%).
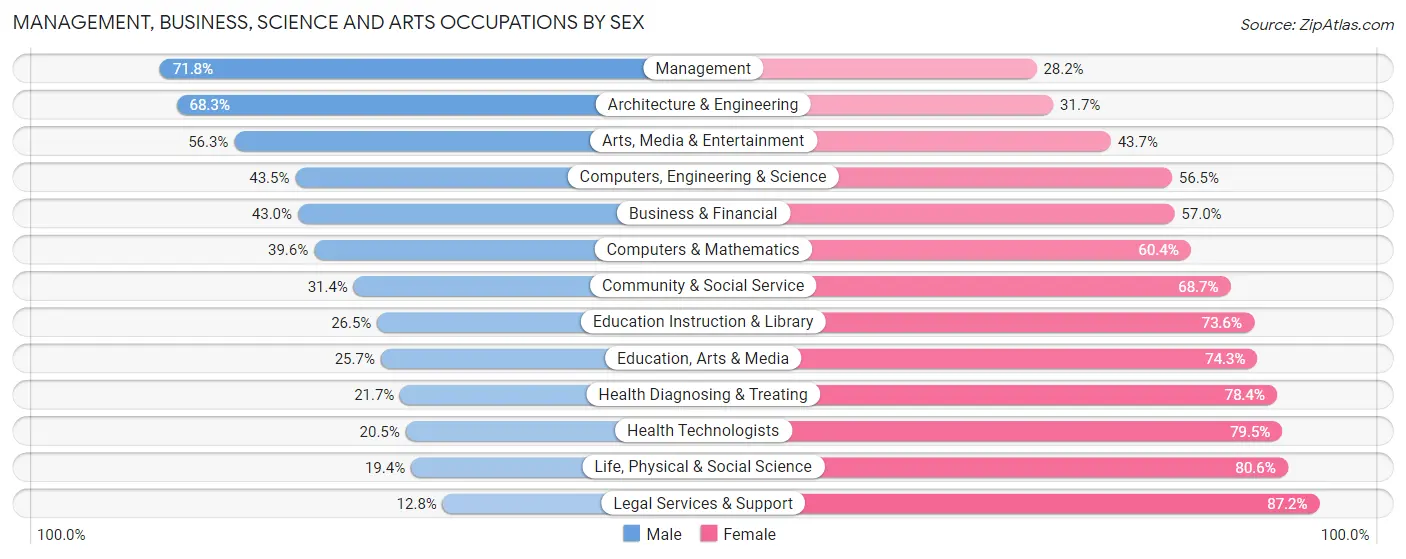
Management, Business, Science and Arts Occupations by Sex
Within the Management, Business, Science and Arts occupations in Carroll County, the most male-oriented occupations are Management (71.8%), Architecture & Engineering (68.3%), and Arts, Media & Entertainment (56.3%), while the most female-oriented occupations are Legal Services & Support (87.2%), Life, Physical & Social Science (80.6%), and Health Technologists (79.5%).
| Occupation | Male | Female |
| Management | 1,053 (71.8%) | 414 (28.2%) |
| Business & Financial | 86 (43.0%) | 114 (57.0%) |
| Computers, Engineering & Science | 111 (43.5%) | 144 (56.5%) |
| Computers & Mathematics | 42 (39.6%) | 64 (60.4%) |
| Architecture & Engineering | 56 (68.3%) | 26 (31.7%) |
| Life, Physical & Social Science | 13 (19.4%) | 54 (80.6%) |
| Community & Social Service | 359 (31.4%) | 786 (68.6%) |
| Education, Arts & Media | 36 (25.7%) | 104 (74.3%) |
| Legal Services & Support | 11 (12.8%) | 75 (87.2%) |
| Education Instruction & Library | 182 (26.5%) | 506 (73.6%) |
| Arts, Media & Entertainment | 130 (56.3%) | 101 (43.7%) |
| Health Diagnosing & Treating | 89 (21.6%) | 322 (78.3%) |
| Health Technologists | 63 (20.5%) | 244 (79.5%) |
| Total (Category) | 1,698 (48.8%) | 1,780 (51.2%) |
| Total (Overall) | 6,706 (56.9%) | 5,088 (43.1%) |
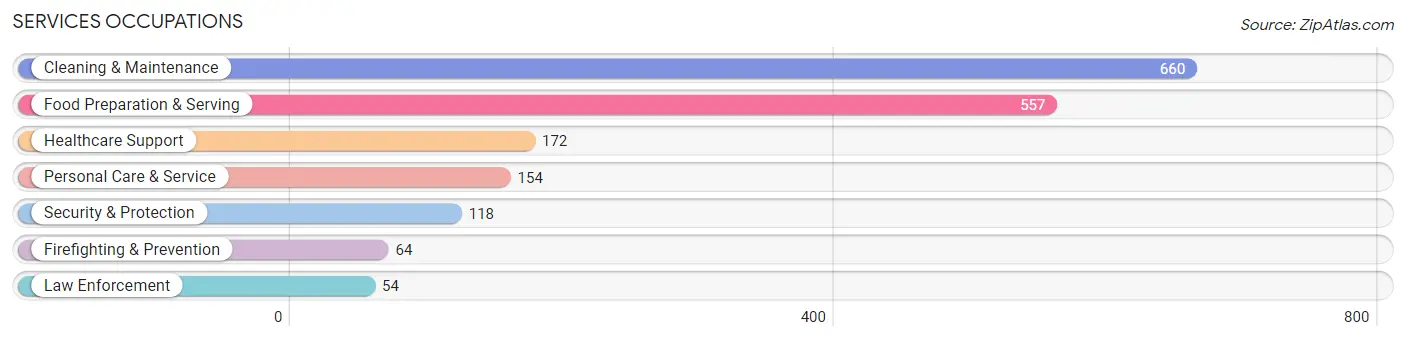
Services Occupations
The most common Services occupations in Carroll County are Cleaning & Maintenance (660 | 5.6%), Food Preparation & Serving (557 | 4.7%), Healthcare Support (172 | 1.5%), Personal Care & Service (154 | 1.3%), and Security & Protection (118 | 1.0%).
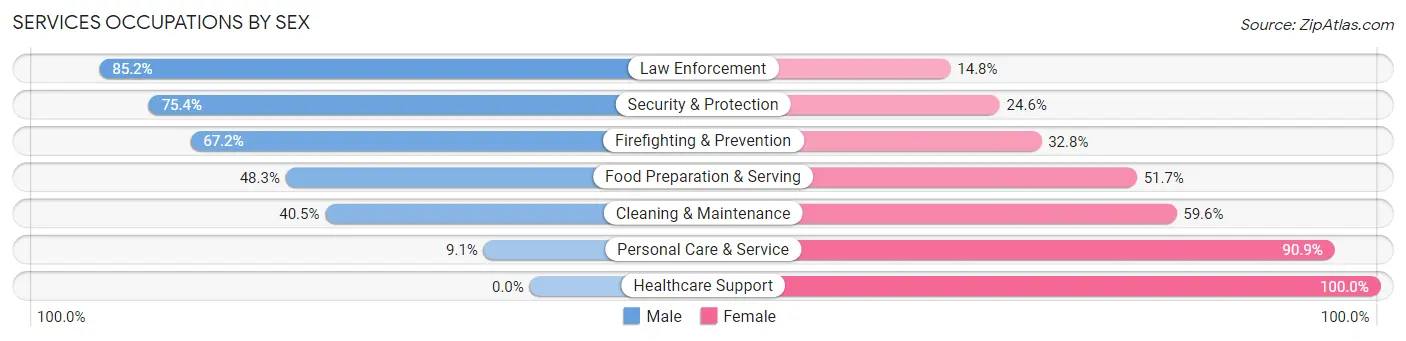
Services Occupations by Sex
Within the Services occupations in Carroll County, the most male-oriented occupations are Law Enforcement (85.2%), Security & Protection (75.4%), and Firefighting & Prevention (67.2%), while the most female-oriented occupations are Healthcare Support (100.0%), Personal Care & Service (90.9%), and Cleaning & Maintenance (59.6%).
| Occupation | Male | Female |
| Healthcare Support | 0 (0.0%) | 172 (100.0%) |
| Security & Protection | 89 (75.4%) | 29 (24.6%) |
| Firefighting & Prevention | 43 (67.2%) | 21 (32.8%) |
| Law Enforcement | 46 (85.2%) | 8 (14.8%) |
| Food Preparation & Serving | 269 (48.3%) | 288 (51.7%) |
| Cleaning & Maintenance | 267 (40.5%) | 393 (59.6%) |
| Personal Care & Service | 14 (9.1%) | 140 (90.9%) |
| Total (Category) | 639 (38.5%) | 1,022 (61.5%) |
| Total (Overall) | 6,706 (56.9%) | 5,088 (43.1%) |
Sales and Office Occupations
The most common Sales and Office occupations in Carroll County are Sales & Related (1,113 | 9.4%), and Office & Administration (1,081 | 9.2%).
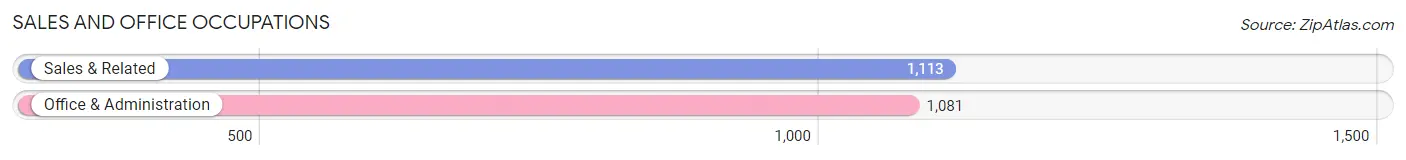
Sales and Office Occupations by Sex
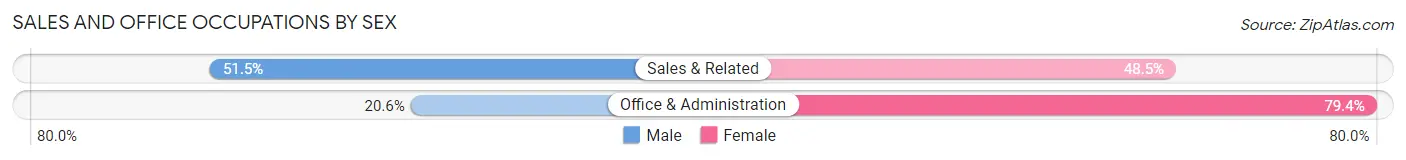
| Occupation | Male | Female |
| Sales & Related | 573 (51.5%) | 540 (48.5%) |
| Office & Administration | 223 (20.6%) | 858 (79.4%) |
| Total (Category) | 796 (36.3%) | 1,398 (63.7%) |
| Total (Overall) | 6,706 (56.9%) | 5,088 (43.1%) |
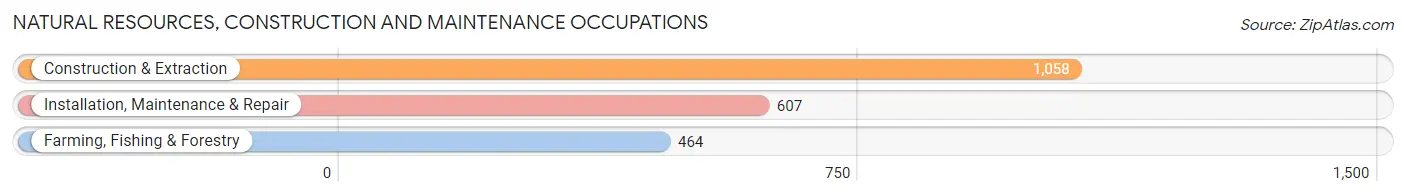
Natural Resources, Construction and Maintenance Occupations
The most common Natural Resources, Construction and Maintenance occupations in Carroll County are Construction & Extraction (1,058 | 9.0%), Installation, Maintenance & Repair (607 | 5.1%), and Farming, Fishing & Forestry (464 | 3.9%).
Natural Resources, Construction and Maintenance Occupations by Sex
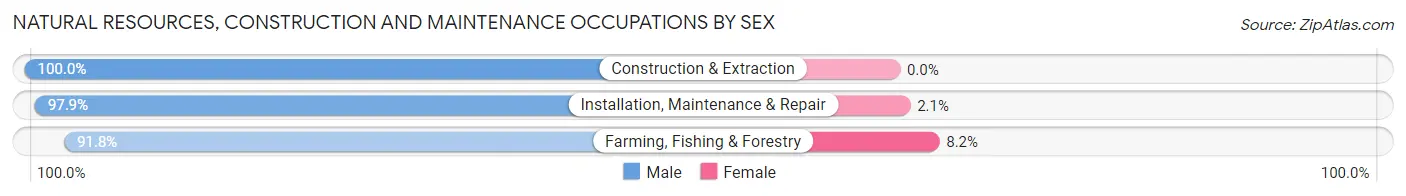
| Occupation | Male | Female |
| Farming, Fishing & Forestry | 426 (91.8%) | 38 (8.2%) |
| Construction & Extraction | 1,058 (100.0%) | 0 (0.0%) |
| Installation, Maintenance & Repair | 594 (97.9%) | 13 (2.1%) |
| Total (Category) | 2,078 (97.6%) | 51 (2.4%) |
| Total (Overall) | 6,706 (56.9%) | 5,088 (43.1%) |
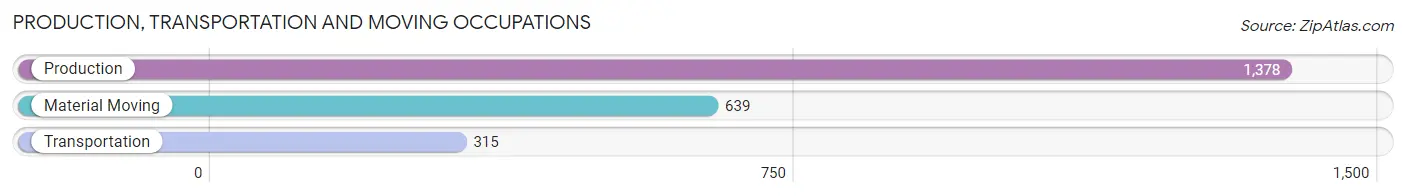
Production, Transportation and Moving Occupations
The most common Production, Transportation and Moving occupations in Carroll County are Production (1,378 | 11.7%), Material Moving (639 | 5.4%), and Transportation (315 | 2.7%).
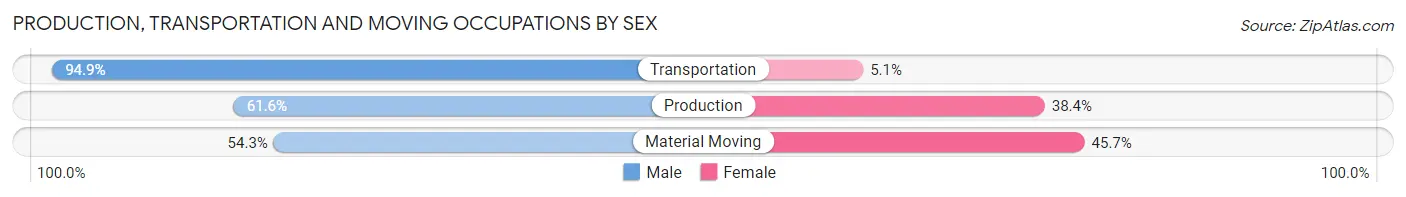
Production, Transportation and Moving Occupations by Sex
| Occupation | Male | Female |
| Production | 849 (61.6%) | 529 (38.4%) |
| Transportation | 299 (94.9%) | 16 (5.1%) |
| Material Moving | 347 (54.3%) | 292 (45.7%) |
| Total (Category) | 1,495 (64.1%) | 837 (35.9%) |
| Total (Overall) | 6,706 (56.9%) | 5,088 (43.1%) |
Employment Industries by Sex in Carroll County
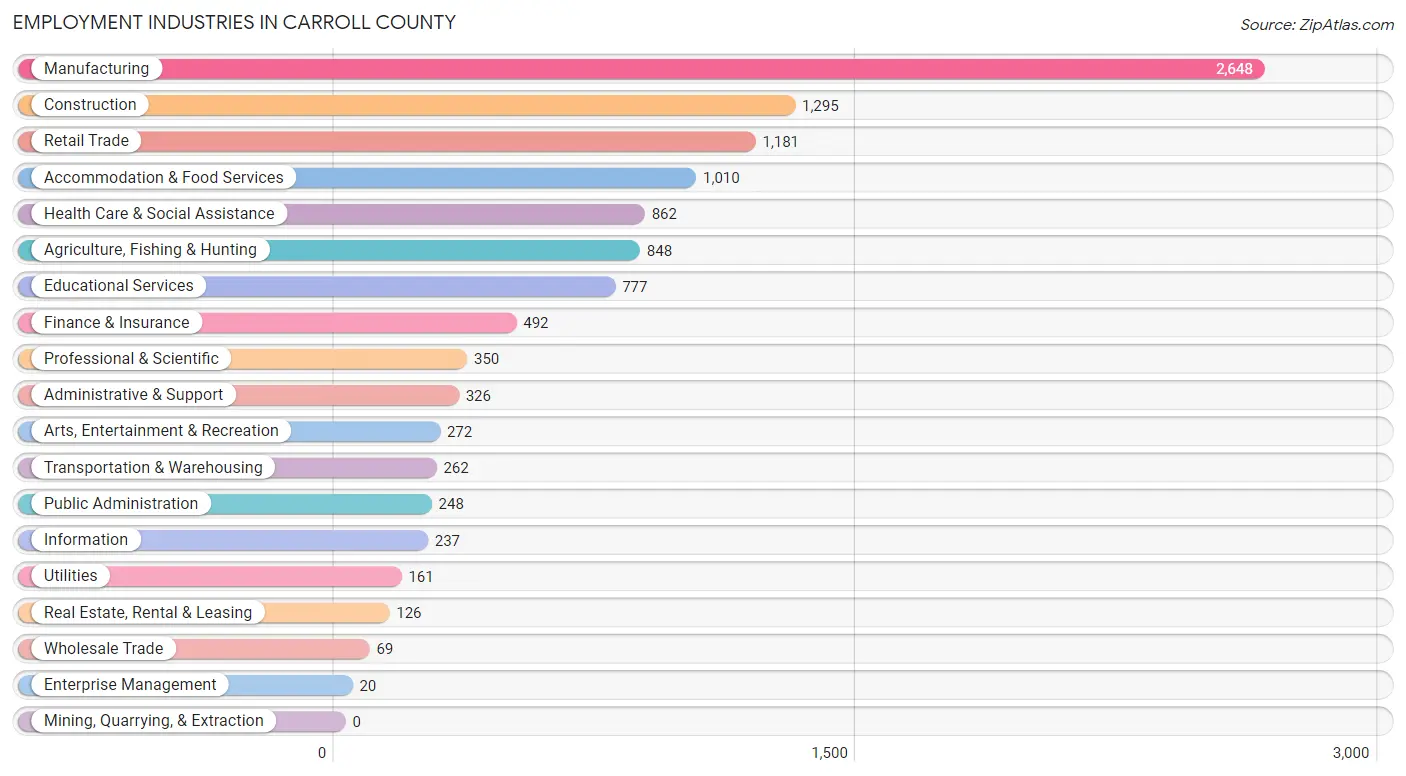
Employment Industries in Carroll County
The major employment industries in Carroll County include Manufacturing (2,648 | 22.5%), Construction (1,295 | 11.0%), Retail Trade (1,181 | 10.0%), Accommodation & Food Services (1,010 | 8.6%), and Health Care & Social Assistance (862 | 7.3%).
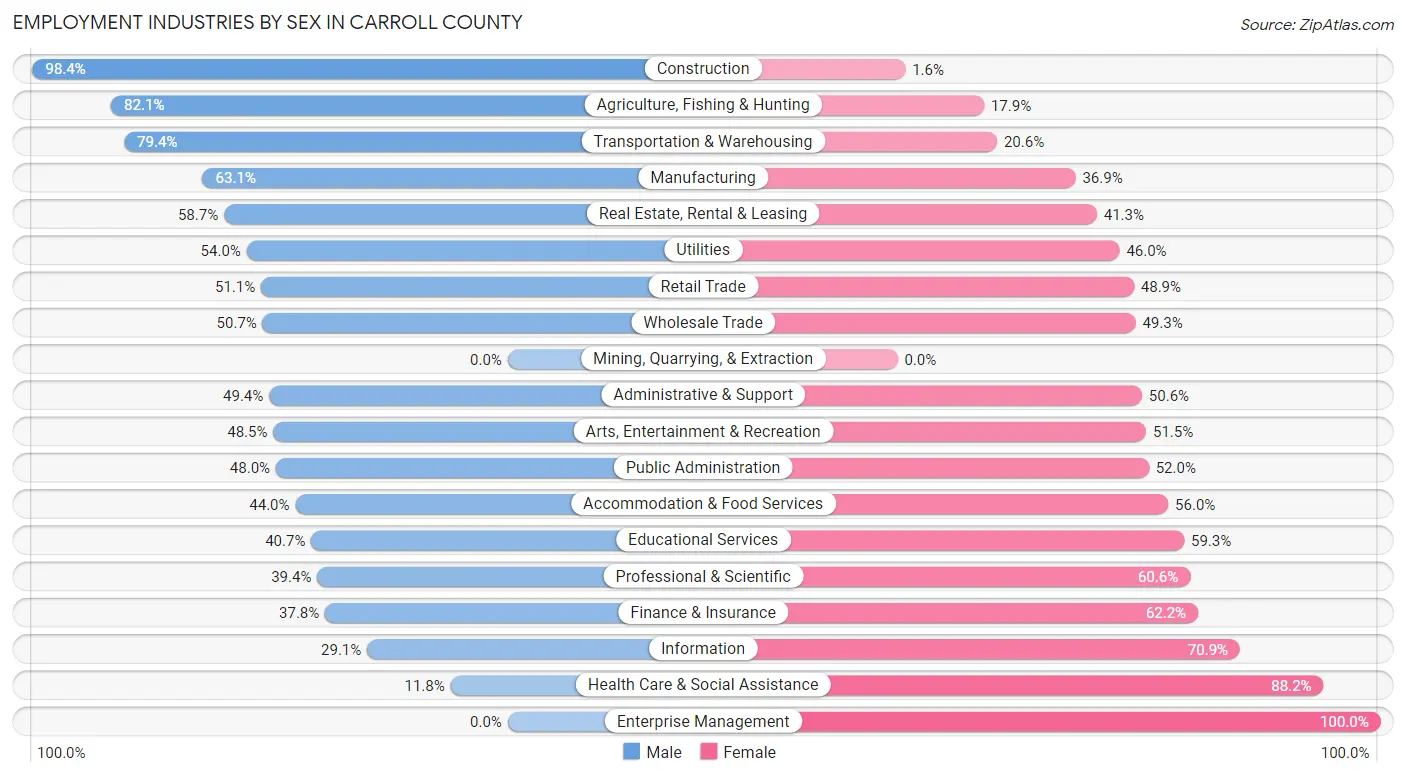
Employment Industries by Sex in Carroll County
The Carroll County industries that see more men than women are Construction (98.4%), Agriculture, Fishing & Hunting (82.1%), and Transportation & Warehousing (79.4%), whereas the industries that tend to have a higher number of women are Enterprise Management (100.0%), Health Care & Social Assistance (88.2%), and Information (70.9%).
| Industry | Male | Female |
| Agriculture, Fishing & Hunting | 696 (82.1%) | 152 (17.9%) |
| Mining, Quarrying, & Extraction | 0 (0.0%) | 0 (0.0%) |
| Construction | 1,274 (98.4%) | 21 (1.6%) |
| Manufacturing | 1,672 (63.1%) | 976 (36.9%) |
| Wholesale Trade | 35 (50.7%) | 34 (49.3%) |
| Retail Trade | 603 (51.1%) | 578 (48.9%) |
| Transportation & Warehousing | 208 (79.4%) | 54 (20.6%) |
| Utilities | 87 (54.0%) | 74 (46.0%) |
| Information | 69 (29.1%) | 168 (70.9%) |
| Finance & Insurance | 186 (37.8%) | 306 (62.2%) |
| Real Estate, Rental & Leasing | 74 (58.7%) | 52 (41.3%) |
| Professional & Scientific | 138 (39.4%) | 212 (60.6%) |
| Enterprise Management | 0 (0.0%) | 20 (100.0%) |
| Administrative & Support | 161 (49.4%) | 165 (50.6%) |
| Educational Services | 316 (40.7%) | 461 (59.3%) |
| Health Care & Social Assistance | 102 (11.8%) | 760 (88.2%) |
| Arts, Entertainment & Recreation | 132 (48.5%) | 140 (51.5%) |
| Accommodation & Food Services | 444 (44.0%) | 566 (56.0%) |
| Public Administration | 119 (48.0%) | 129 (52.0%) |
| Total | 6,706 (56.9%) | 5,088 (43.1%) |
Education in Carroll County
School Enrollment in Carroll County
The most common levels of schooling among the 5,894 students in Carroll County are high school (1,551 | 26.3%), middle school (1,371 | 23.3%), and elementary school (1,321 | 22.4%).
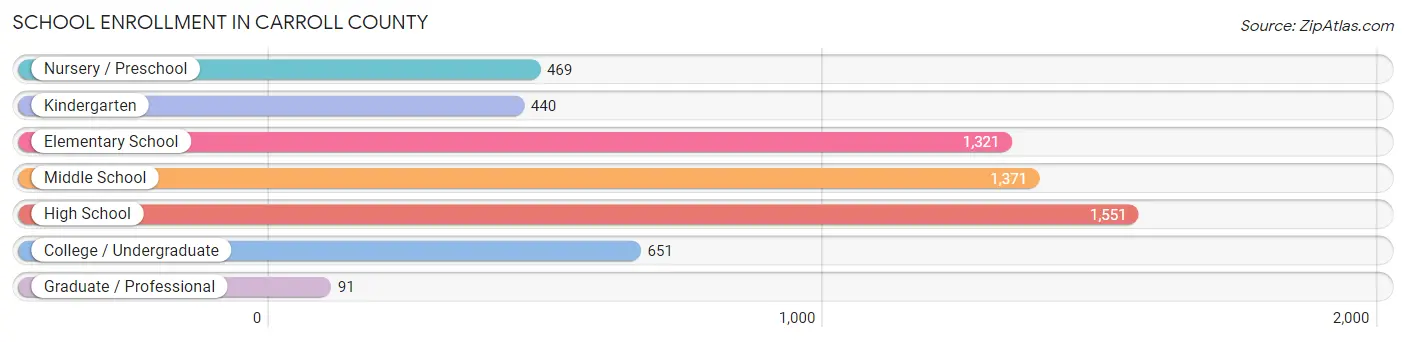
| School Level | # Students | % Students |
| Nursery / Preschool | 469 | 8.0% |
| Kindergarten | 440 | 7.5% |
| Elementary School | 1,321 | 22.4% |
| Middle School | 1,371 | 23.3% |
| High School | 1,551 | 26.3% |
| College / Undergraduate | 651 | 11.1% |
| Graduate / Professional | 91 | 1.5% |
| Total | 5,894 | 100.0% |
School Enrollment by Age by Funding Source in Carroll County
Out of a total of 5,894 students who are enrolled in schools in Carroll County, 855 (14.5%) attend a private institution, while the remaining 5,039 (85.5%) are enrolled in public schools. The age group of 3 to 4 year olds has the highest likelihood of being enrolled in private schools, with 111 (26.9% in the age bracket) enrolled. Conversely, the age group of 25 to 34 year olds has the lowest likelihood of being enrolled in a private school, with 81 (100.0% in the age bracket) attending a public institution.
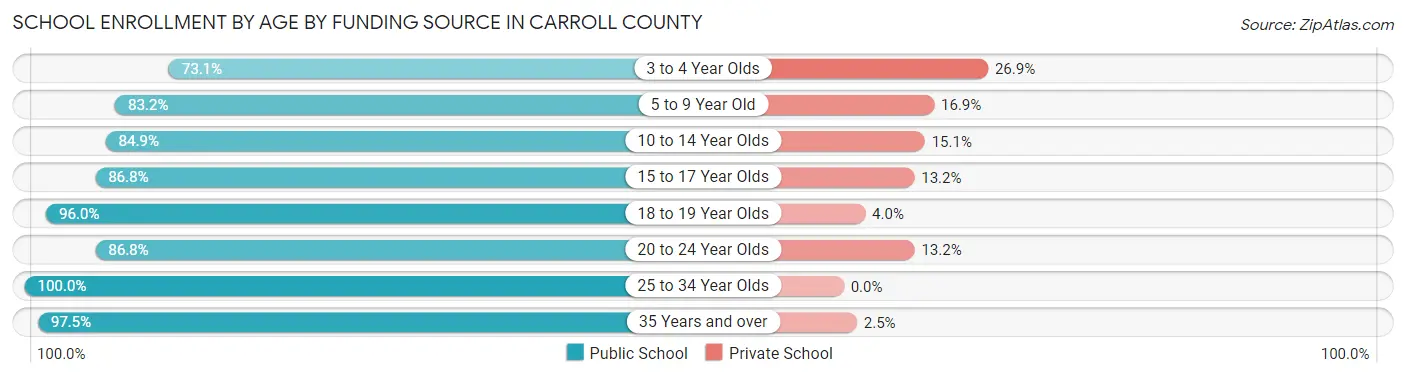
| Age Bracket | Public School | Private School |
| 3 to 4 Year Olds | 302 (73.1%) | 111 (26.9%) |
| 5 to 9 Year Old | 1,372 (83.2%) | 278 (16.9%) |
| 10 to 14 Year Olds | 1,445 (84.9%) | 257 (15.1%) |
| 15 to 17 Year Olds | 1,029 (86.8%) | 156 (13.2%) |
| 18 to 19 Year Olds | 408 (96.0%) | 17 (4.0%) |
| 20 to 24 Year Olds | 204 (86.8%) | 31 (13.2%) |
| 25 to 34 Year Olds | 81 (100.0%) | 0 (0.0%) |
| 35 Years and over | 198 (97.5%) | 5 (2.5%) |
| Total | 5,039 (85.5%) | 855 (14.5%) |
Educational Attainment by Field of Study in Carroll County
Business (1,039 | 22.2%), education (1,017 | 21.7%), science & technology (480 | 10.3%), bio, nature & agricultural (313 | 6.7%), and arts & humanities (302 | 6.5%) are the most common fields of study among 4,676 individuals in Carroll County who have obtained a bachelor's degree or higher.
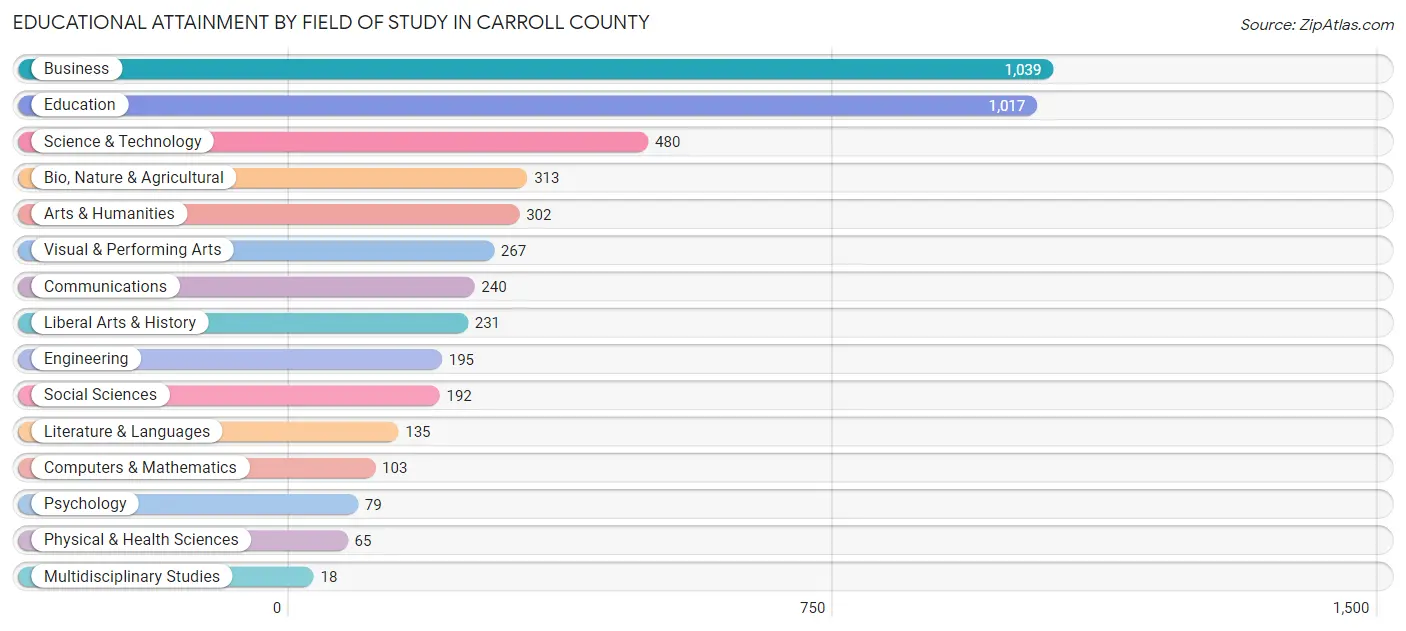
| Field of Study | # Graduates | % Graduates |
| Computers & Mathematics | 103 | 2.2% |
| Bio, Nature & Agricultural | 313 | 6.7% |
| Physical & Health Sciences | 65 | 1.4% |
| Psychology | 79 | 1.7% |
| Social Sciences | 192 | 4.1% |
| Engineering | 195 | 4.2% |
| Multidisciplinary Studies | 18 | 0.4% |
| Science & Technology | 480 | 10.3% |
| Business | 1,039 | 22.2% |
| Education | 1,017 | 21.7% |
| Literature & Languages | 135 | 2.9% |
| Liberal Arts & History | 231 | 4.9% |
| Visual & Performing Arts | 267 | 5.7% |
| Communications | 240 | 5.1% |
| Arts & Humanities | 302 | 6.5% |
| Total | 4,676 | 100.0% |
Transportation & Commute in Carroll County
Vehicle Availability by Sex in Carroll County
The most prevalent vehicle ownership categories in Carroll County are males with 3 vehicles (2,113, accounting for 32.1%) and females with 3 vehicles (1,479, making up 41.5%).
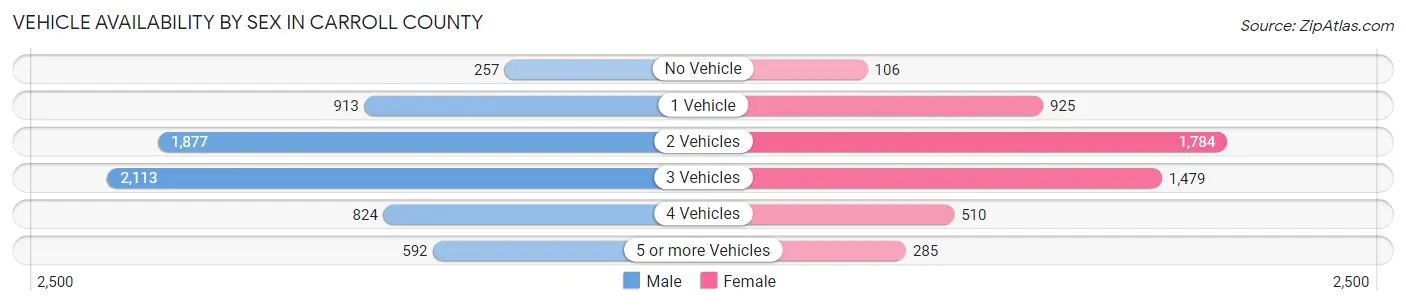
| Vehicles Available | Male | Female |
| No Vehicle | 257 (3.9%) | 106 (2.1%) |
| 1 Vehicle | 913 (13.9%) | 925 (18.2%) |
| 2 Vehicles | 1,877 (28.5%) | 1,784 (35.1%) |
| 3 Vehicles | 2,113 (32.1%) | 1,479 (29.1%) |
| 4 Vehicles | 824 (12.5%) | 510 (10.0%) |
| 5 or more Vehicles | 592 (9.0%) | 285 (5.6%) |
| Total | 6,576 (100.0%) | 5,089 (100.0%) |
Commute Time in Carroll County
The most frequently occuring commute durations in Carroll County are 5 to 9 minutes (1,961 commuters, 18.4%), 10 to 14 minutes (1,870 commuters, 17.5%), and 15 to 19 minutes (1,715 commuters, 16.1%).
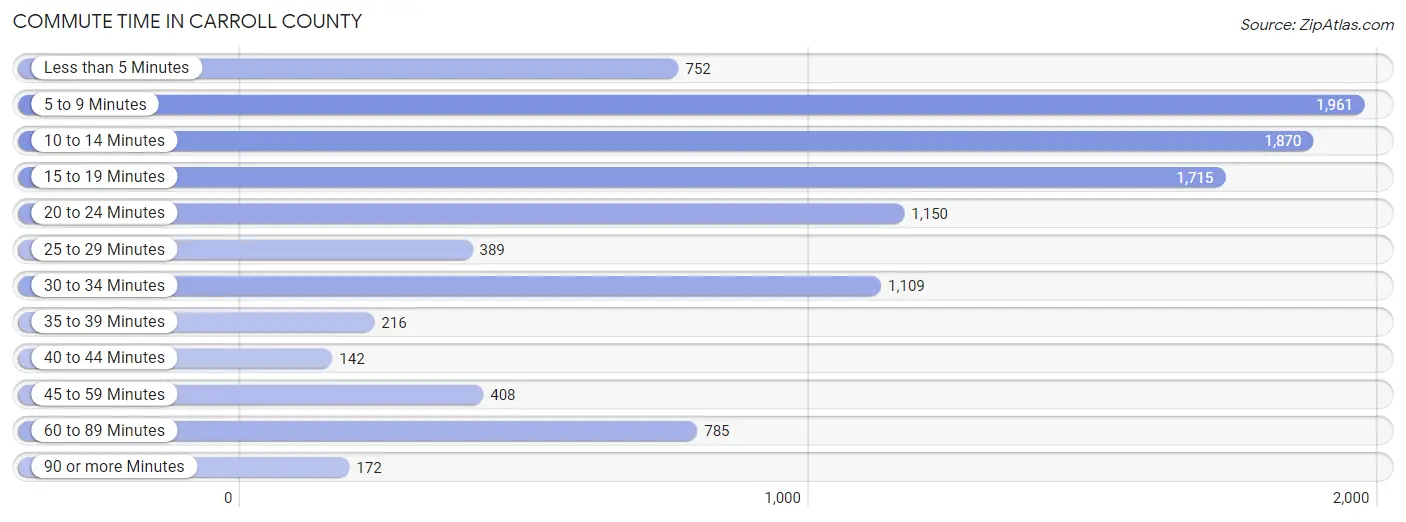
| Commute Time | # Commuters | % Commuters |
| Less than 5 Minutes | 752 | 7.0% |
| 5 to 9 Minutes | 1,961 | 18.4% |
| 10 to 14 Minutes | 1,870 | 17.5% |
| 15 to 19 Minutes | 1,715 | 16.1% |
| 20 to 24 Minutes | 1,150 | 10.8% |
| 25 to 29 Minutes | 389 | 3.6% |
| 30 to 34 Minutes | 1,109 | 10.4% |
| 35 to 39 Minutes | 216 | 2.0% |
| 40 to 44 Minutes | 142 | 1.3% |
| 45 to 59 Minutes | 408 | 3.8% |
| 60 to 89 Minutes | 785 | 7.4% |
| 90 or more Minutes | 172 | 1.6% |
Commute Time by Sex in Carroll County
The most common commute times in Carroll County are 10 to 14 minutes (1,079 commuters, 18.0%) for males and 5 to 9 minutes (989 commuters, 21.1%) for females.
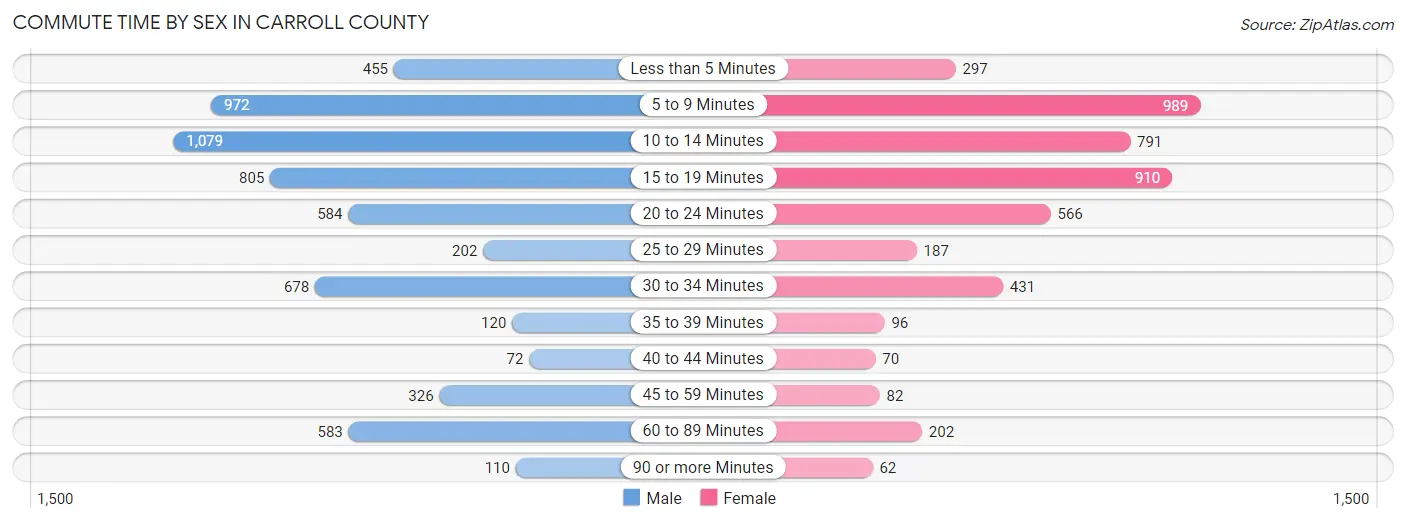
| Commute Time | Male | Female |
| Less than 5 Minutes | 455 (7.6%) | 297 (6.3%) |
| 5 to 9 Minutes | 972 (16.2%) | 989 (21.1%) |
| 10 to 14 Minutes | 1,079 (18.0%) | 791 (16.9%) |
| 15 to 19 Minutes | 805 (13.5%) | 910 (19.4%) |
| 20 to 24 Minutes | 584 (9.8%) | 566 (12.1%) |
| 25 to 29 Minutes | 202 (3.4%) | 187 (4.0%) |
| 30 to 34 Minutes | 678 (11.3%) | 431 (9.2%) |
| 35 to 39 Minutes | 120 (2.0%) | 96 (2.1%) |
| 40 to 44 Minutes | 72 (1.2%) | 70 (1.5%) |
| 45 to 59 Minutes | 326 (5.4%) | 82 (1.8%) |
| 60 to 89 Minutes | 583 (9.7%) | 202 (4.3%) |
| 90 or more Minutes | 110 (1.8%) | 62 (1.3%) |
Time of Departure to Work by Sex in Carroll County
The most frequent times of departure to work in Carroll County are 7:00 AM to 7:29 AM (1,013, 16.9%) for males and 7:30 AM to 7:59 AM (767, 16.4%) for females.
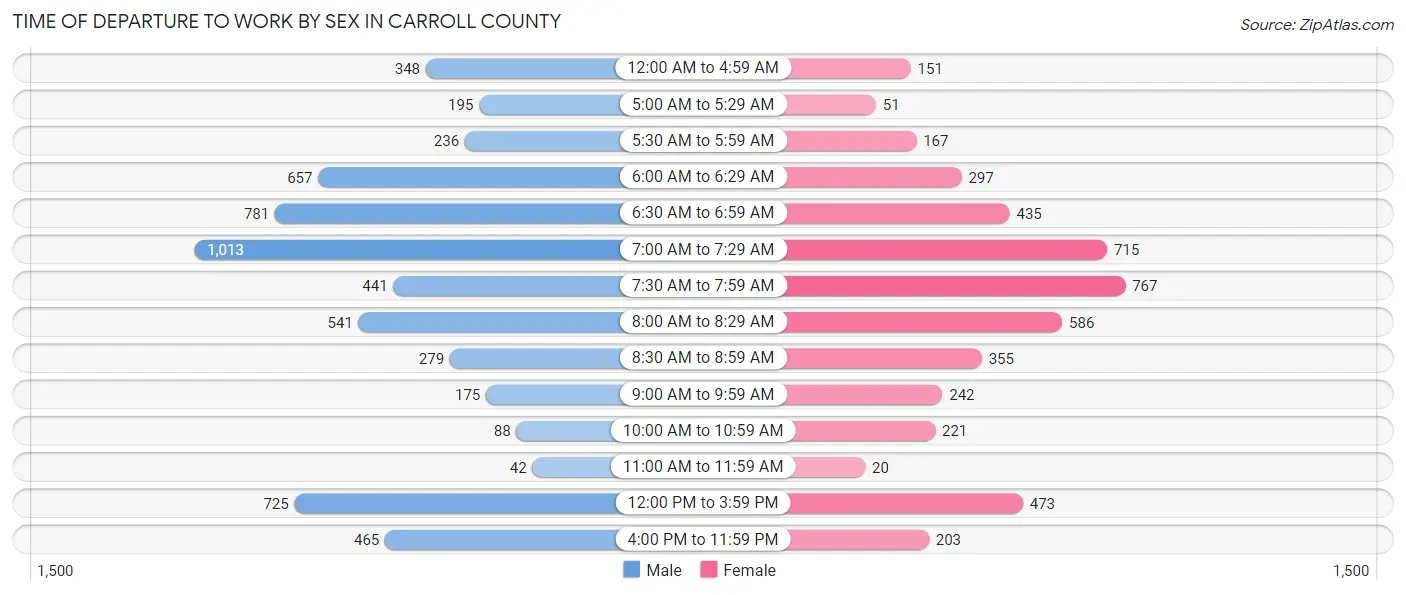
| Time of Departure | Male | Female |
| 12:00 AM to 4:59 AM | 348 (5.8%) | 151 (3.2%) |
| 5:00 AM to 5:29 AM | 195 (3.3%) | 51 (1.1%) |
| 5:30 AM to 5:59 AM | 236 (3.9%) | 167 (3.6%) |
| 6:00 AM to 6:29 AM | 657 (11.0%) | 297 (6.3%) |
| 6:30 AM to 6:59 AM | 781 (13.1%) | 435 (9.3%) |
| 7:00 AM to 7:29 AM | 1,013 (16.9%) | 715 (15.3%) |
| 7:30 AM to 7:59 AM | 441 (7.4%) | 767 (16.4%) |
| 8:00 AM to 8:29 AM | 541 (9.0%) | 586 (12.5%) |
| 8:30 AM to 8:59 AM | 279 (4.7%) | 355 (7.6%) |
| 9:00 AM to 9:59 AM | 175 (2.9%) | 242 (5.2%) |
| 10:00 AM to 10:59 AM | 88 (1.5%) | 221 (4.7%) |
| 11:00 AM to 11:59 AM | 42 (0.7%) | 20 (0.4%) |
| 12:00 PM to 3:59 PM | 725 (12.1%) | 473 (10.1%) |
| 4:00 PM to 11:59 PM | 465 (7.8%) | 203 (4.3%) |
| Total | 5,986 (100.0%) | 4,683 (100.0%) |
Housing Occupancy in Carroll County
Occupancy by Ownership in Carroll County
Of the total 11,357 dwellings in Carroll County, owner-occupied units account for 8,682 (76.4%), while renter-occupied units make up 2,675 (23.5%).
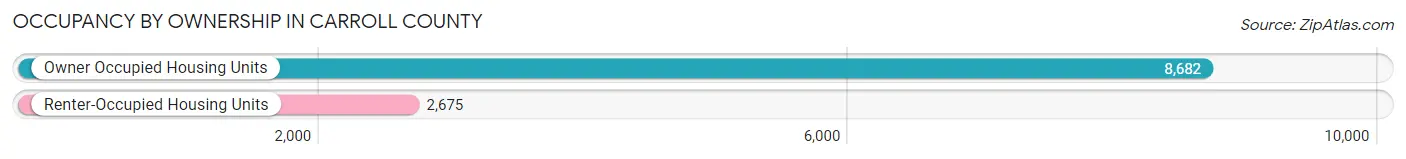
| Occupancy | # Housing Units | % Housing Units |
| Owner Occupied Housing Units | 8,682 | 76.4% |
| Renter-Occupied Housing Units | 2,675 | 23.5% |
| Total Occupied Housing Units | 11,357 | 100.0% |
Occupancy by Household Size in Carroll County
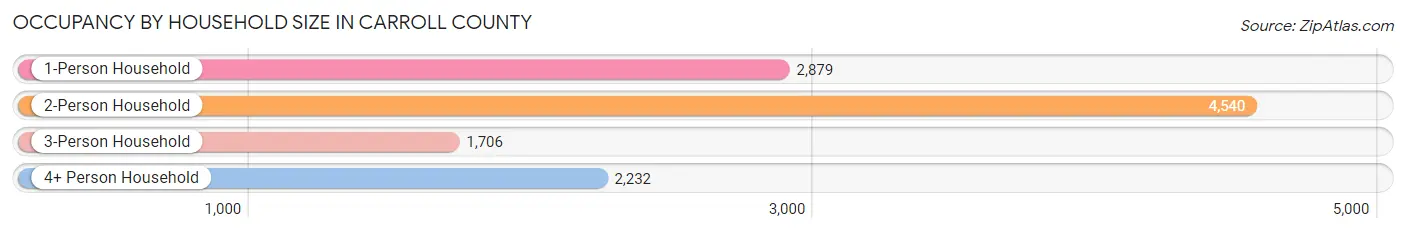
| Household Size | # Housing Units | % Housing Units |
| 1-Person Household | 2,879 | 25.4% |
| 2-Person Household | 4,540 | 40.0% |
| 3-Person Household | 1,706 | 15.0% |
| 4+ Person Household | 2,232 | 19.7% |
| Total Housing Units | 11,357 | 100.0% |
Occupancy by Ownership by Household Size in Carroll County
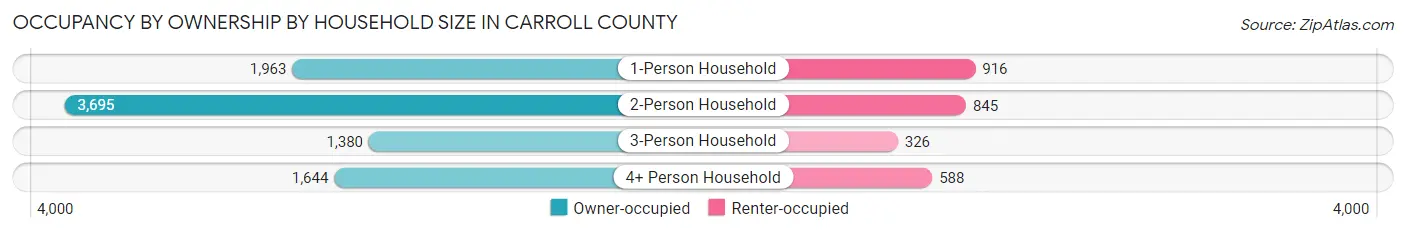
| Household Size | Owner-occupied | Renter-occupied |
| 1-Person Household | 1,963 (68.2%) | 916 (31.8%) |
| 2-Person Household | 3,695 (81.4%) | 845 (18.6%) |
| 3-Person Household | 1,380 (80.9%) | 326 (19.1%) |
| 4+ Person Household | 1,644 (73.7%) | 588 (26.3%) |
| Total Housing Units | 8,682 (76.4%) | 2,675 (23.5%) |
Occupancy by Educational Attainment in Carroll County
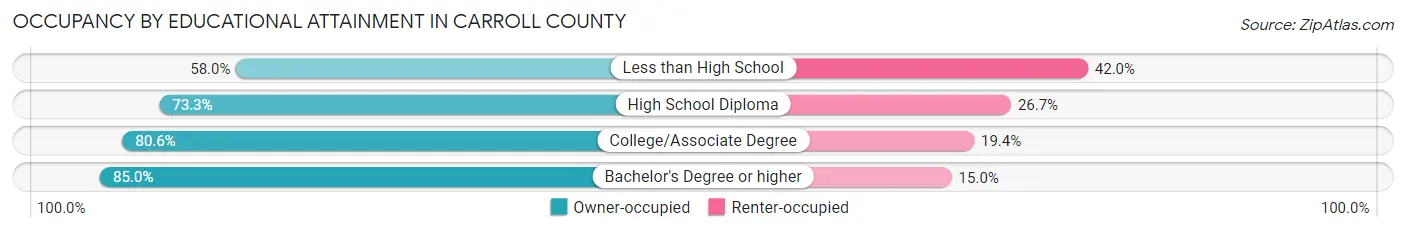
| Household Size | Owner-occupied | Renter-occupied |
| Less than High School | 820 (58.0%) | 593 (42.0%) |
| High School Diploma | 2,809 (73.3%) | 1,024 (26.7%) |
| College/Associate Degree | 2,605 (80.6%) | 627 (19.4%) |
| Bachelor's Degree or higher | 2,448 (85.0%) | 431 (15.0%) |
Occupancy by Age of Householder in Carroll County
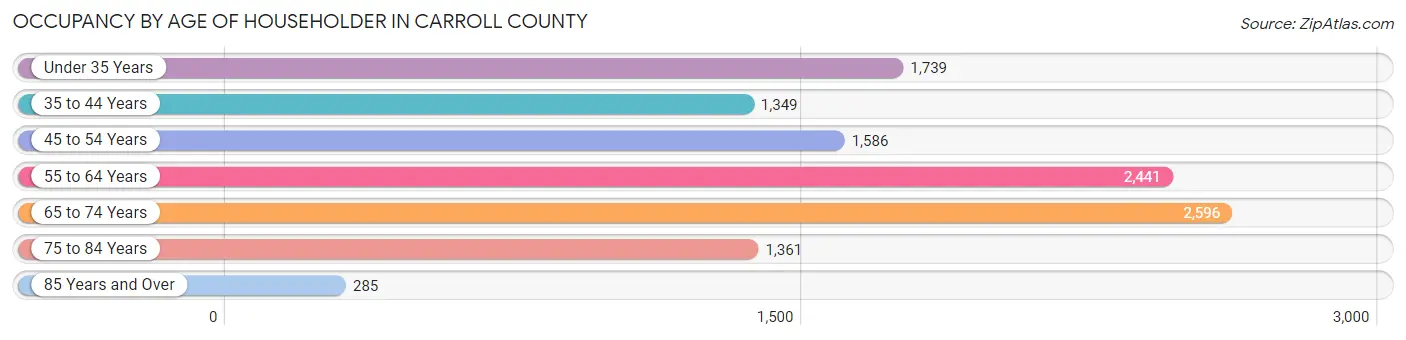
| Age Bracket | # Households | % Households |
| Under 35 Years | 1,739 | 15.3% |
| 35 to 44 Years | 1,349 | 11.9% |
| 45 to 54 Years | 1,586 | 14.0% |
| 55 to 64 Years | 2,441 | 21.5% |
| 65 to 74 Years | 2,596 | 22.9% |
| 75 to 84 Years | 1,361 | 12.0% |
| 85 Years and Over | 285 | 2.5% |
| Total | 11,357 | 100.0% |
Housing Finances in Carroll County
Median Income by Occupancy in Carroll County
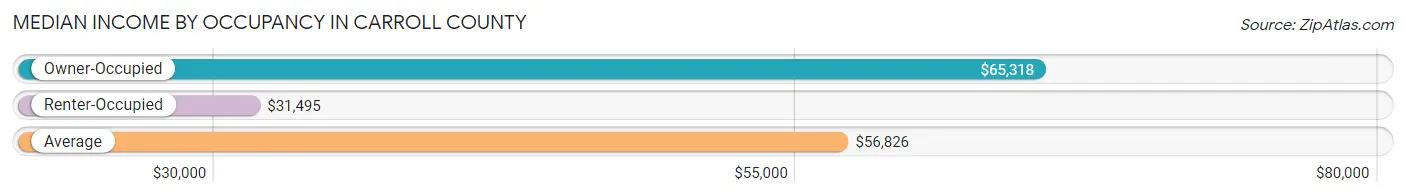
| Occupancy Type | # Households | Median Income |
| Owner-Occupied | 8,682 (76.4%) | $65,318 |
| Renter-Occupied | 2,675 (23.5%) | $31,495 |
| Average | 11,357 (100.0%) | $56,826 |
Occupancy by Householder Income Bracket in Carroll County
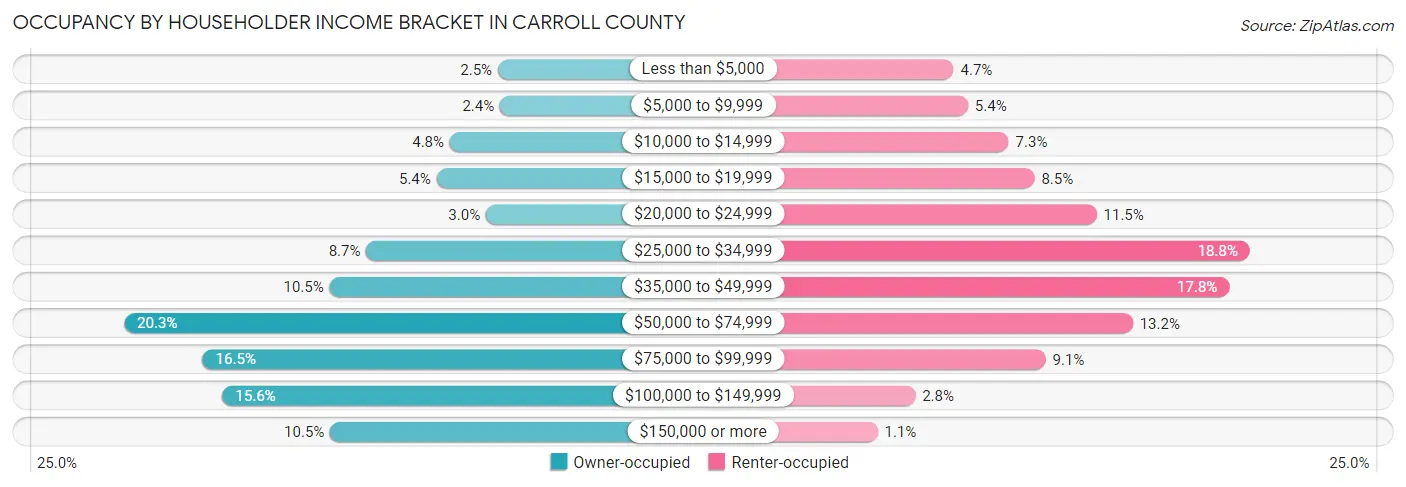
| Income Bracket | Owner-occupied | Renter-occupied |
| Less than $5,000 | 214 (2.5%) | 125 (4.7%) |
| $5,000 to $9,999 | 205 (2.4%) | 143 (5.3%) |
| $10,000 to $14,999 | 412 (4.8%) | 195 (7.3%) |
| $15,000 to $19,999 | 467 (5.4%) | 228 (8.5%) |
| $20,000 to $24,999 | 263 (3.0%) | 307 (11.5%) |
| $25,000 to $34,999 | 758 (8.7%) | 502 (18.8%) |
| $35,000 to $49,999 | 910 (10.5%) | 476 (17.8%) |
| $50,000 to $74,999 | 1,759 (20.3%) | 353 (13.2%) |
| $75,000 to $99,999 | 1,434 (16.5%) | 242 (9.0%) |
| $100,000 to $149,999 | 1,353 (15.6%) | 76 (2.8%) |
| $150,000 or more | 907 (10.4%) | 28 (1.1%) |
| Total | 8,682 (100.0%) | 2,675 (100.0%) |
Monthly Housing Cost Tiers in Carroll County
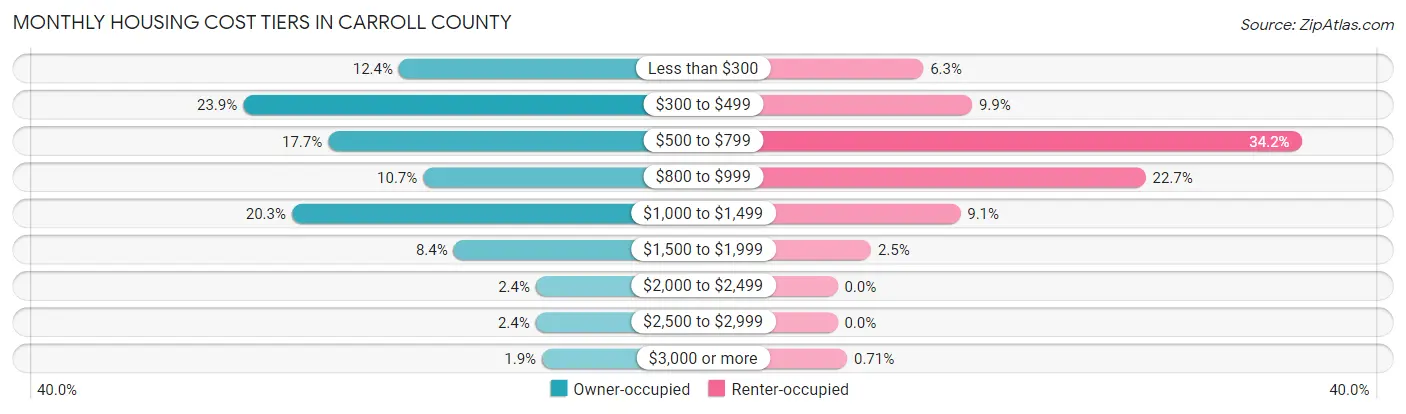
| Monthly Cost | Owner-occupied | Renter-occupied |
| Less than $300 | 1,080 (12.4%) | 169 (6.3%) |
| $300 to $499 | 2,076 (23.9%) | 265 (9.9%) |
| $500 to $799 | 1,532 (17.6%) | 914 (34.2%) |
| $800 to $999 | 925 (10.6%) | 607 (22.7%) |
| $1,000 to $1,499 | 1,764 (20.3%) | 242 (9.0%) |
| $1,500 to $1,999 | 730 (8.4%) | 66 (2.5%) |
| $2,000 to $2,499 | 204 (2.4%) | 0 (0.0%) |
| $2,500 to $2,999 | 206 (2.4%) | 0 (0.0%) |
| $3,000 or more | 165 (1.9%) | 19 (0.7%) |
| Total | 8,682 (100.0%) | 2,675 (100.0%) |
Physical Housing Characteristics in Carroll County
Housing Structures in Carroll County
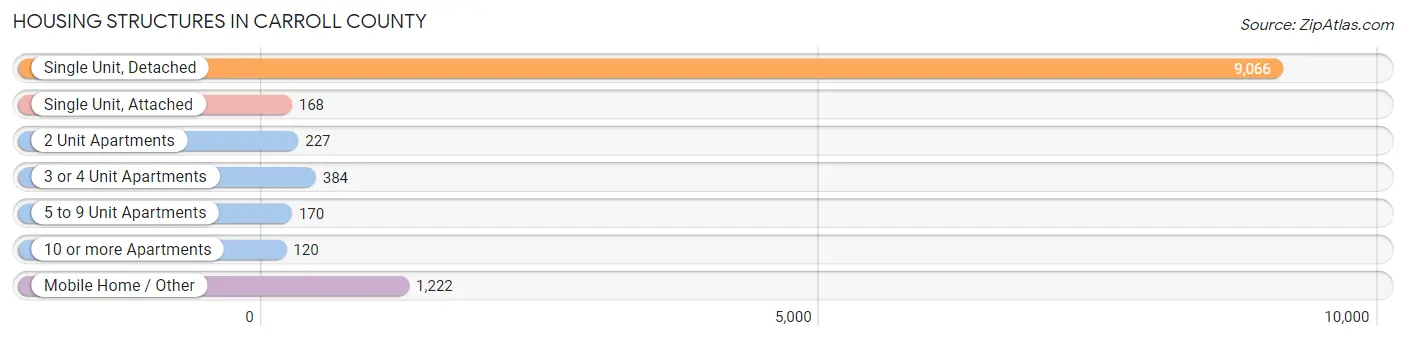
| Structure Type | # Housing Units | % Housing Units |
| Single Unit, Detached | 9,066 | 79.8% |
| Single Unit, Attached | 168 | 1.5% |
| 2 Unit Apartments | 227 | 2.0% |
| 3 or 4 Unit Apartments | 384 | 3.4% |
| 5 to 9 Unit Apartments | 170 | 1.5% |
| 10 or more Apartments | 120 | 1.1% |
| Mobile Home / Other | 1,222 | 10.8% |
| Total | 11,357 | 100.0% |
Housing Structures by Occupancy in Carroll County
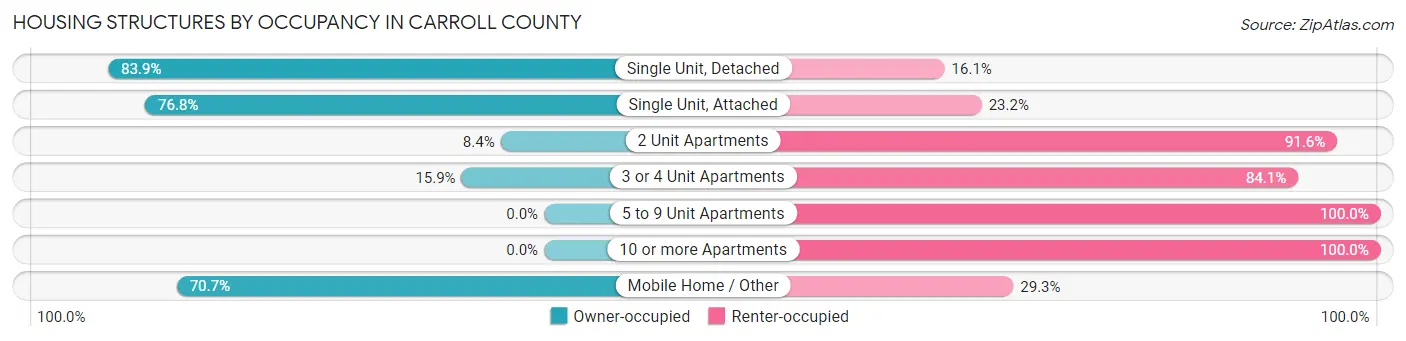
| Structure Type | Owner-occupied | Renter-occupied |
| Single Unit, Detached | 7,609 (83.9%) | 1,457 (16.1%) |
| Single Unit, Attached | 129 (76.8%) | 39 (23.2%) |
| 2 Unit Apartments | 19 (8.4%) | 208 (91.6%) |
| 3 or 4 Unit Apartments | 61 (15.9%) | 323 (84.1%) |
| 5 to 9 Unit Apartments | 0 (0.0%) | 170 (100.0%) |
| 10 or more Apartments | 0 (0.0%) | 120 (100.0%) |
| Mobile Home / Other | 864 (70.7%) | 358 (29.3%) |
| Total | 8,682 (76.4%) | 2,675 (23.5%) |
Housing Structures by Number of Rooms in Carroll County
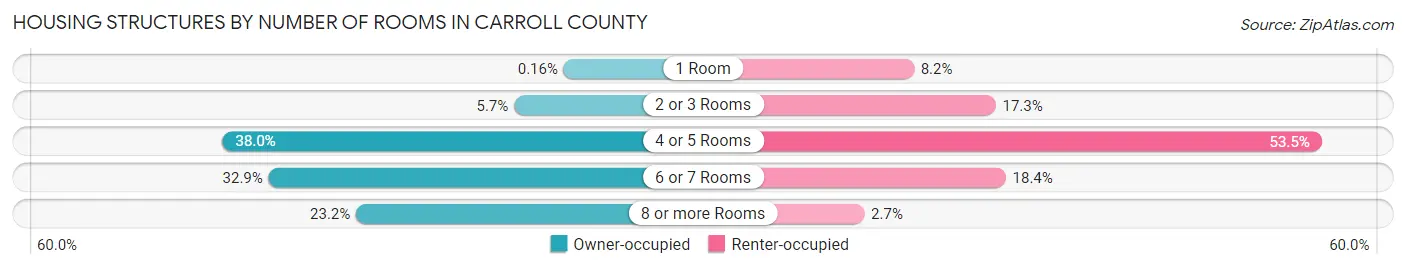
| Number of Rooms | Owner-occupied | Renter-occupied |
| 1 Room | 14 (0.2%) | 219 (8.2%) |
| 2 or 3 Rooms | 492 (5.7%) | 462 (17.3%) |
| 4 or 5 Rooms | 3,303 (38.0%) | 1,430 (53.5%) |
| 6 or 7 Rooms | 2,858 (32.9%) | 492 (18.4%) |
| 8 or more Rooms | 2,015 (23.2%) | 72 (2.7%) |
| Total | 8,682 (100.0%) | 2,675 (100.0%) |
Housing Structure by Heating Type in Carroll County
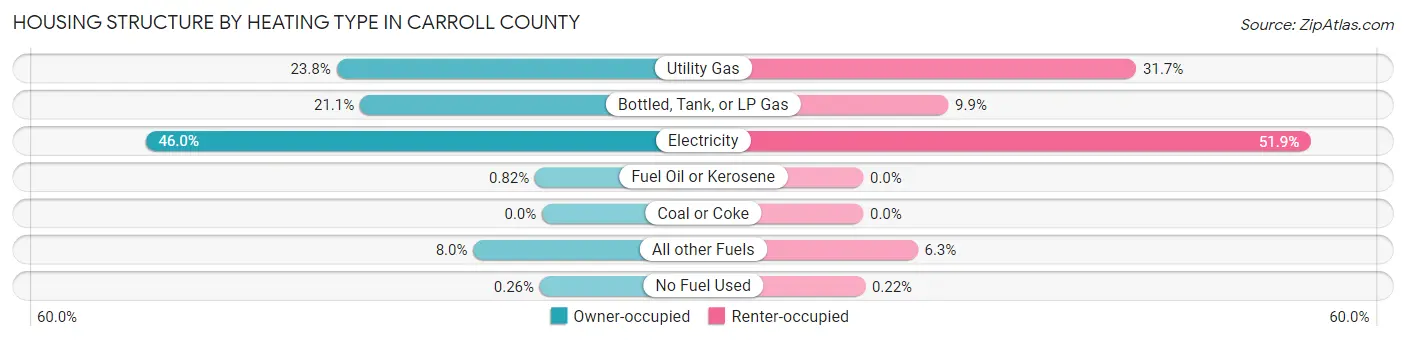
| Heating Type | Owner-occupied | Renter-occupied |
| Utility Gas | 2,070 (23.8%) | 847 (31.7%) |
| Bottled, Tank, or LP Gas | 1,833 (21.1%) | 264 (9.9%) |
| Electricity | 3,992 (46.0%) | 1,389 (51.9%) |
| Fuel Oil or Kerosene | 71 (0.8%) | 0 (0.0%) |
| Coal or Coke | 0 (0.0%) | 0 (0.0%) |
| All other Fuels | 693 (8.0%) | 169 (6.3%) |
| No Fuel Used | 23 (0.3%) | 6 (0.2%) |
| Total | 8,682 (100.0%) | 2,675 (100.0%) |
Household Vehicle Usage in Carroll County
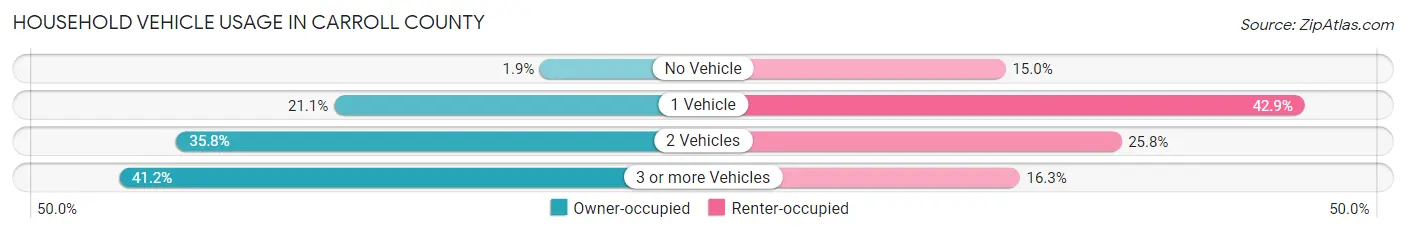
| Vehicles per Household | Owner-occupied | Renter-occupied |
| No Vehicle | 162 (1.9%) | 401 (15.0%) |
| 1 Vehicle | 1,833 (21.1%) | 1,148 (42.9%) |
| 2 Vehicles | 3,111 (35.8%) | 690 (25.8%) |
| 3 or more Vehicles | 3,576 (41.2%) | 436 (16.3%) |
| Total | 8,682 (100.0%) | 2,675 (100.0%) |
Real Estate & Mortgages in Carroll County
Real Estate and Mortgage Overview in Carroll County
| Characteristic | Without Mortgage | With Mortgage |
| Housing Units | 4,366 | 4,316 |
| Median Property Value | $156,900 | $187,800 |
| Median Household Income | $52,746 | $479 |
| Monthly Housing Costs | $396 | $165 |
| Real Estate Taxes | $870 | $70 |
Property Value by Mortgage Status in Carroll County
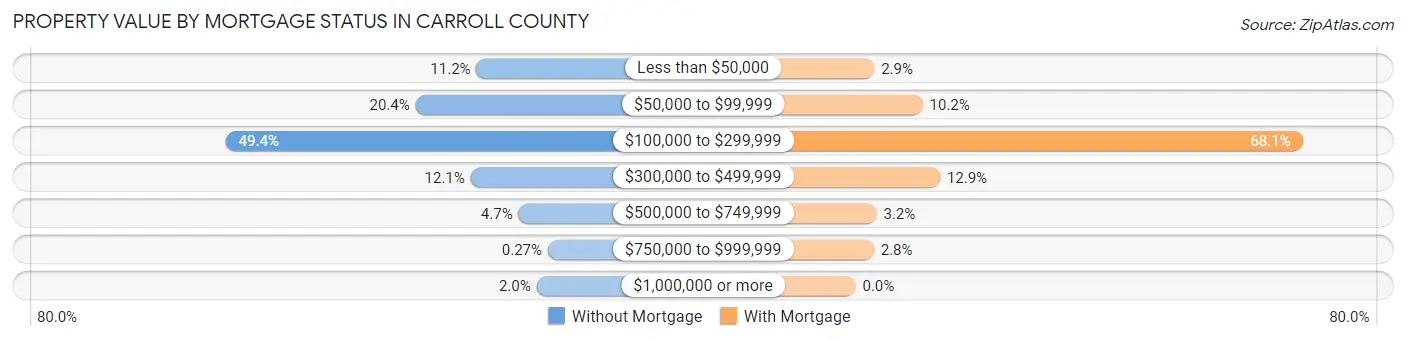
| Property Value | Without Mortgage | With Mortgage |
| Less than $50,000 | 487 (11.2%) | 123 (2.9%) |
| $50,000 to $99,999 | 892 (20.4%) | 441 (10.2%) |
| $100,000 to $299,999 | 2,155 (49.4%) | 2,939 (68.1%) |
| $300,000 to $499,999 | 526 (12.0%) | 555 (12.9%) |
| $500,000 to $749,999 | 207 (4.7%) | 138 (3.2%) |
| $750,000 to $999,999 | 12 (0.3%) | 120 (2.8%) |
| $1,000,000 or more | 87 (2.0%) | 0 (0.0%) |
| Total | 4,366 (100.0%) | 4,316 (100.0%) |
Household Income by Mortgage Status in Carroll County
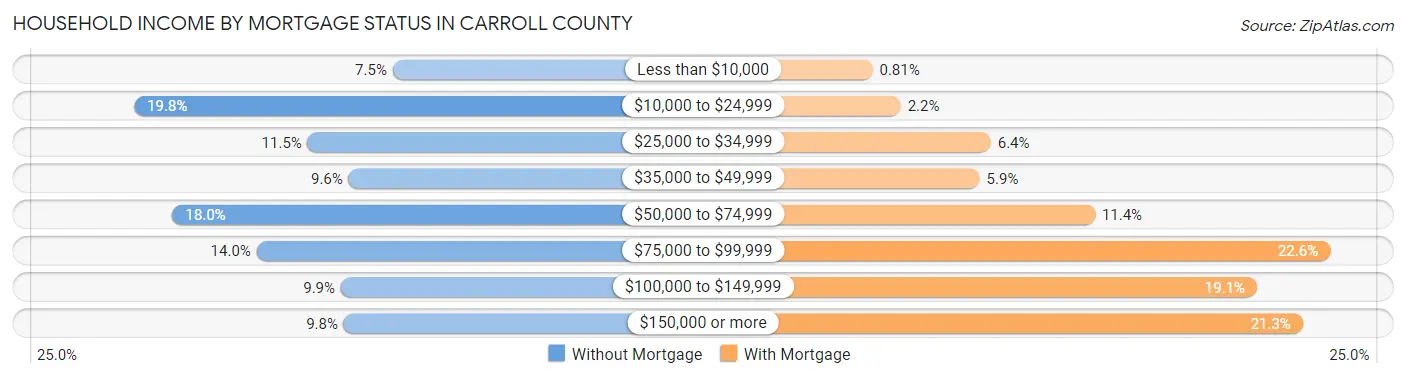
| Household Income | Without Mortgage | With Mortgage |
| Less than $10,000 | 326 (7.5%) | 35 (0.8%) |
| $10,000 to $24,999 | 864 (19.8%) | 93 (2.1%) |
| $25,000 to $34,999 | 503 (11.5%) | 278 (6.4%) |
| $35,000 to $49,999 | 418 (9.6%) | 255 (5.9%) |
| $50,000 to $74,999 | 784 (18.0%) | 492 (11.4%) |
| $75,000 to $99,999 | 609 (14.0%) | 975 (22.6%) |
| $100,000 to $149,999 | 434 (9.9%) | 825 (19.1%) |
| $150,000 or more | 428 (9.8%) | 919 (21.3%) |
| Total | 4,366 (100.0%) | 4,316 (100.0%) |
Property Value to Household Income Ratio in Carroll County
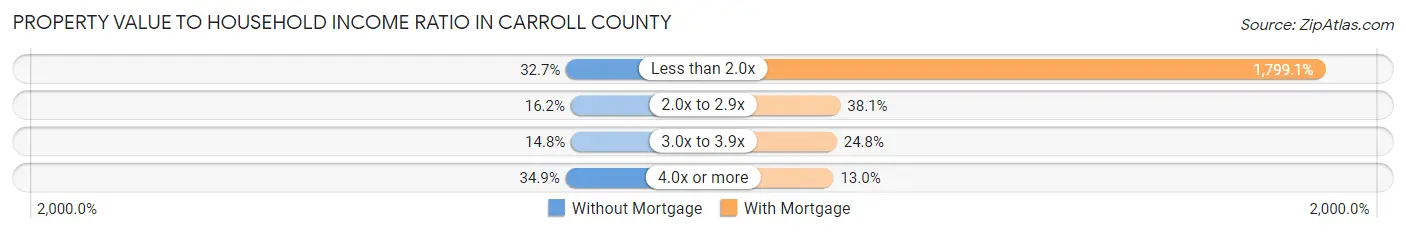
| Value-to-Income Ratio | Without Mortgage | With Mortgage |
| Less than 2.0x | 1,426 (32.7%) | 77,648 (1,799.1%) |
| 2.0x to 2.9x | 706 (16.2%) | 1,644 (38.1%) |
| 3.0x to 3.9x | 646 (14.8%) | 1,072 (24.8%) |
| 4.0x or more | 1,524 (34.9%) | 563 (13.0%) |
| Total | 4,366 (100.0%) | 4,316 (100.0%) |
Real Estate Taxes by Mortgage Status in Carroll County
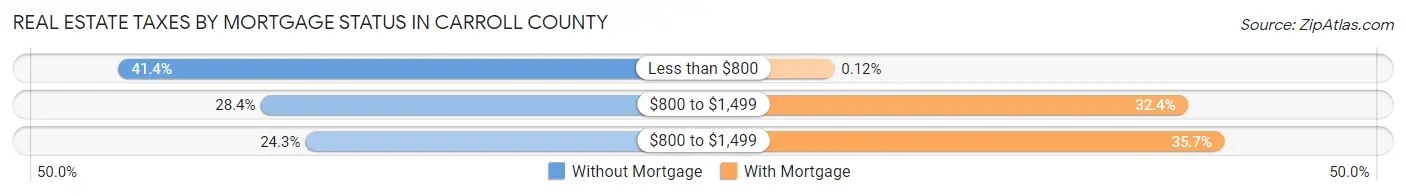
| Property Taxes | Without Mortgage | With Mortgage |
| Less than $800 | 1,808 (41.4%) | 5 (0.1%) |
| $800 to $1,499 | 1,239 (28.4%) | 1,397 (32.4%) |
| $800 to $1,499 | 1,060 (24.3%) | 1,540 (35.7%) |
| Total | 4,366 (100.0%) | 4,316 (100.0%) |
Health & Disability in Carroll County
Health Insurance Coverage by Age in Carroll County
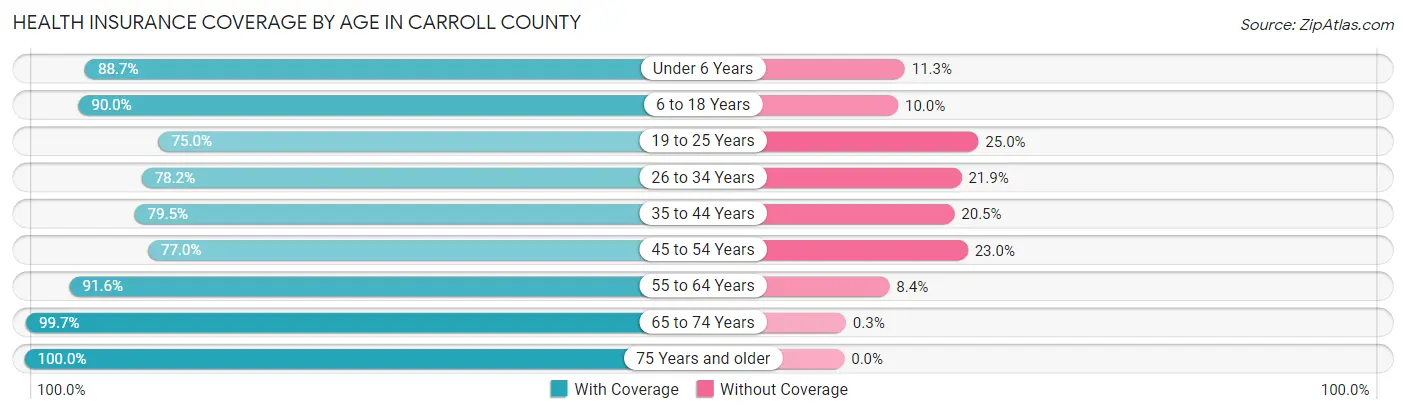
| Age Bracket | With Coverage | Without Coverage |
| Under 6 Years | 1,760 (88.7%) | 224 (11.3%) |
| 6 to 18 Years | 4,139 (90.0%) | 461 (10.0%) |
| 19 to 25 Years | 1,301 (75.0%) | 434 (25.0%) |
| 26 to 34 Years | 2,285 (78.1%) | 639 (21.8%) |
| 35 to 44 Years | 2,346 (79.5%) | 606 (20.5%) |
| 45 to 54 Years | 2,562 (77.0%) | 766 (23.0%) |
| 55 to 64 Years | 3,770 (91.6%) | 346 (8.4%) |
| 65 to 74 Years | 4,013 (99.7%) | 12 (0.3%) |
| 75 Years and older | 2,416 (100.0%) | 0 (0.0%) |
| Total | 24,592 (87.6%) | 3,488 (12.4%) |
Health Insurance Coverage by Citizenship Status in Carroll County
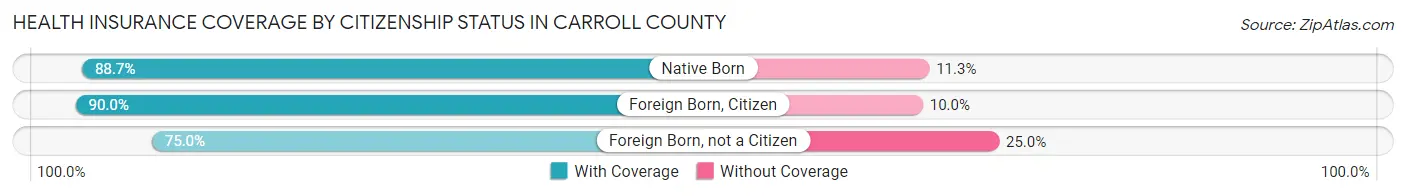
| Citizenship Status | With Coverage | Without Coverage |
| Native Born | 1,760 (88.7%) | 224 (11.3%) |
| Foreign Born, Citizen | 4,139 (90.0%) | 461 (10.0%) |
| Foreign Born, not a Citizen | 1,301 (75.0%) | 434 (25.0%) |
Health Insurance Coverage by Household Income in Carroll County
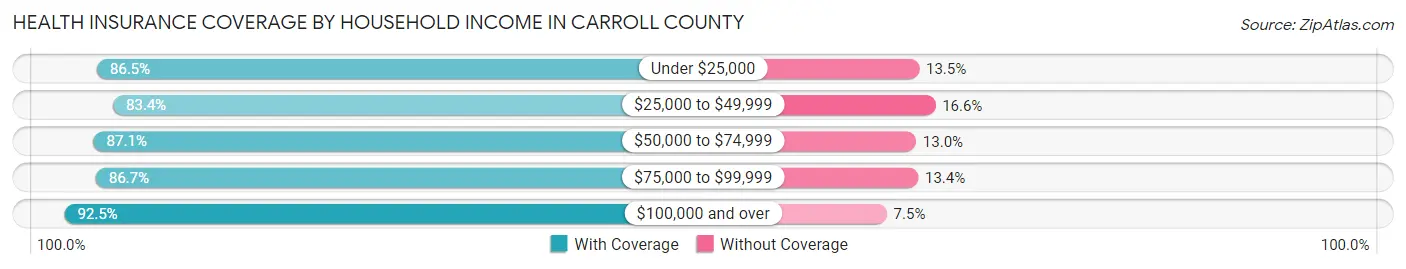
| Household Income | With Coverage | Without Coverage |
| Under $25,000 | 3,435 (86.5%) | 538 (13.5%) |
| $25,000 to $49,999 | 4,987 (83.4%) | 990 (16.6%) |
| $50,000 to $74,999 | 4,852 (87.1%) | 722 (13.0%) |
| $75,000 to $99,999 | 4,425 (86.7%) | 682 (13.4%) |
| $100,000 and over | 6,822 (92.5%) | 551 (7.5%) |
Public vs Private Health Insurance Coverage by Age in Carroll County
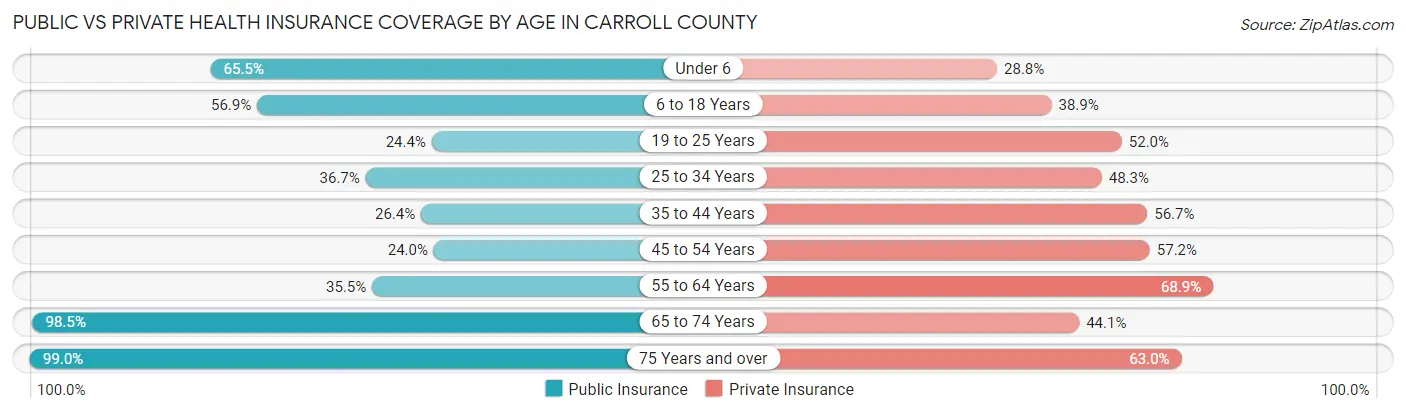
| Age Bracket | Public Insurance | Private Insurance |
| Under 6 | 1,299 (65.5%) | 572 (28.8%) |
| 6 to 18 Years | 2,615 (56.9%) | 1,791 (38.9%) |
| 19 to 25 Years | 424 (24.4%) | 902 (52.0%) |
| 25 to 34 Years | 1,073 (36.7%) | 1,411 (48.3%) |
| 35 to 44 Years | 780 (26.4%) | 1,674 (56.7%) |
| 45 to 54 Years | 800 (24.0%) | 1,903 (57.2%) |
| 55 to 64 Years | 1,461 (35.5%) | 2,836 (68.9%) |
| 65 to 74 Years | 3,966 (98.5%) | 1,774 (44.1%) |
| 75 Years and over | 2,392 (99.0%) | 1,523 (63.0%) |
| Total | 14,810 (52.7%) | 14,386 (51.2%) |
Disability Status by Sex by Age in Carroll County
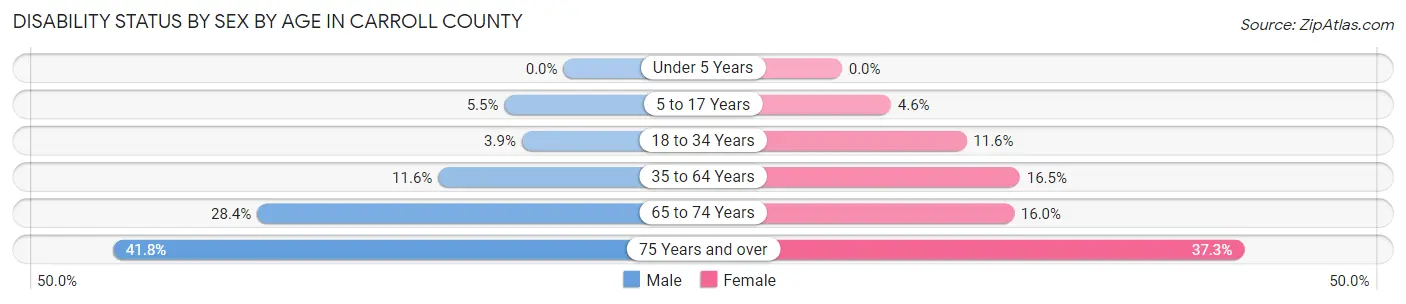
| Age Bracket | Male | Female |
| Under 5 Years | 0 (0.0%) | 0 (0.0%) |
| 5 to 17 Years | 141 (5.5%) | 99 (4.5%) |
| 18 to 34 Years | 101 (3.9%) | 276 (11.6%) |
| 35 to 64 Years | 611 (11.6%) | 849 (16.5%) |
| 65 to 74 Years | 528 (28.4%) | 346 (16.0%) |
| 75 Years and over | 459 (41.8%) | 492 (37.3%) |
Disability Class by Sex by Age in Carroll County
Disability Class: Hearing Difficulty
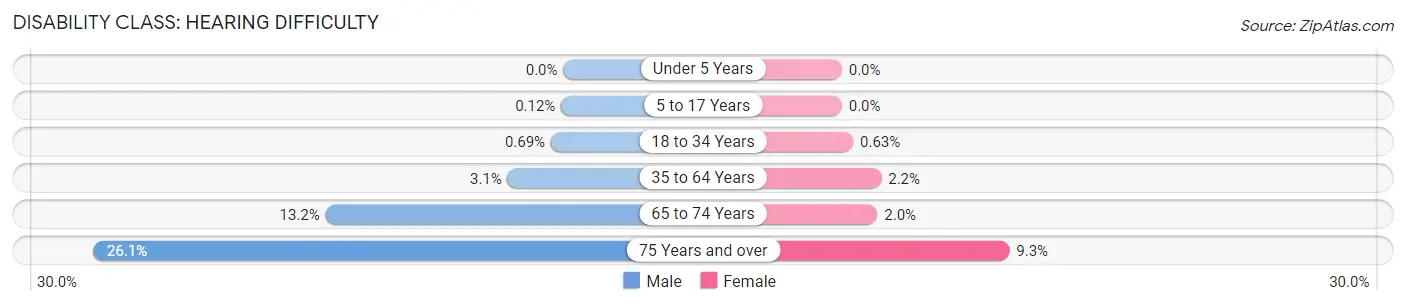
| Age Bracket | Male | Female |
| Under 5 Years | 0 (0.0%) | 0 (0.0%) |
| 5 to 17 Years | 3 (0.1%) | 0 (0.0%) |
| 18 to 34 Years | 18 (0.7%) | 15 (0.6%) |
| 35 to 64 Years | 163 (3.1%) | 113 (2.2%) |
| 65 to 74 Years | 246 (13.2%) | 43 (2.0%) |
| 75 Years and over | 287 (26.1%) | 123 (9.3%) |
Disability Class: Vision Difficulty
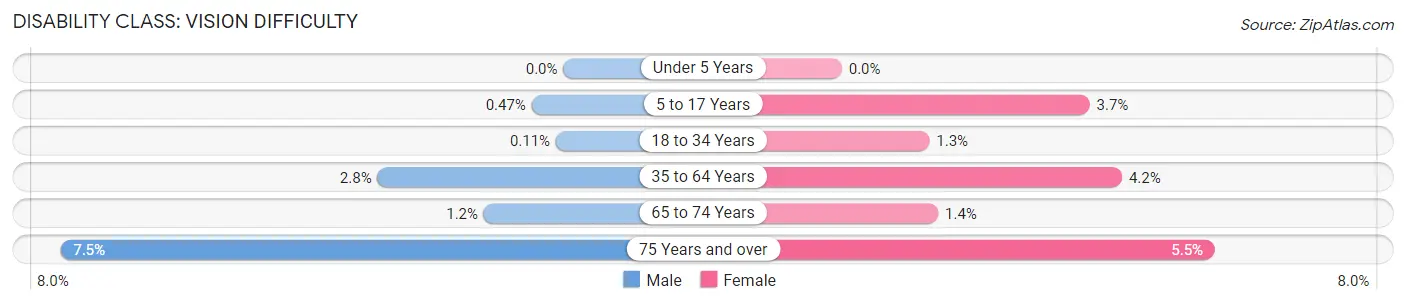
| Age Bracket | Male | Female |
| Under 5 Years | 0 (0.0%) | 0 (0.0%) |
| 5 to 17 Years | 12 (0.5%) | 80 (3.7%) |
| 18 to 34 Years | 3 (0.1%) | 31 (1.3%) |
| 35 to 64 Years | 145 (2.8%) | 214 (4.2%) |
| 65 to 74 Years | 22 (1.2%) | 31 (1.4%) |
| 75 Years and over | 82 (7.5%) | 73 (5.5%) |
Disability Class: Cognitive Difficulty
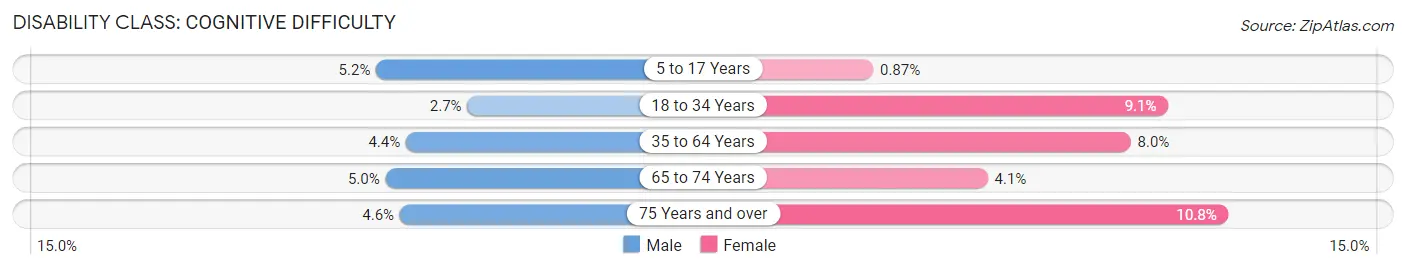
| Age Bracket | Male | Female |
| 5 to 17 Years | 134 (5.2%) | 19 (0.9%) |
| 18 to 34 Years | 70 (2.7%) | 217 (9.1%) |
| 35 to 64 Years | 230 (4.4%) | 413 (8.0%) |
| 65 to 74 Years | 92 (5.0%) | 88 (4.1%) |
| 75 Years and over | 50 (4.5%) | 142 (10.8%) |
Disability Class: Ambulatory Difficulty
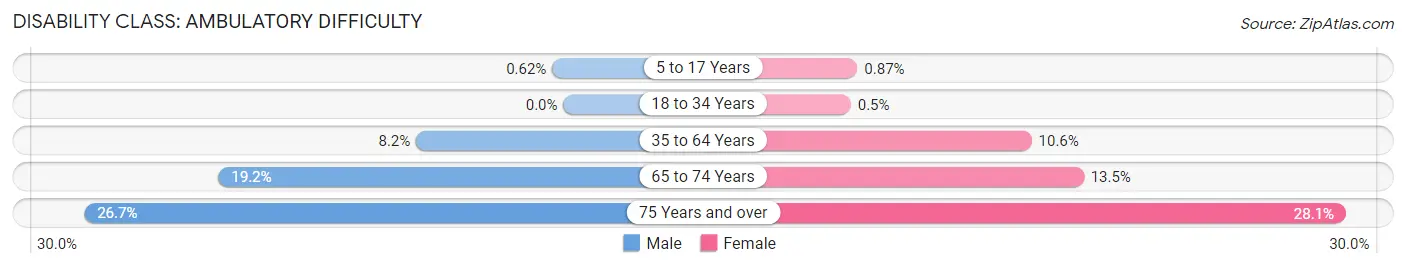
| Age Bracket | Male | Female |
| 5 to 17 Years | 16 (0.6%) | 19 (0.9%) |
| 18 to 34 Years | 0 (0.0%) | 12 (0.5%) |
| 35 to 64 Years | 431 (8.2%) | 543 (10.6%) |
| 65 to 74 Years | 357 (19.2%) | 292 (13.5%) |
| 75 Years and over | 293 (26.7%) | 370 (28.1%) |
Disability Class: Self-Care Difficulty
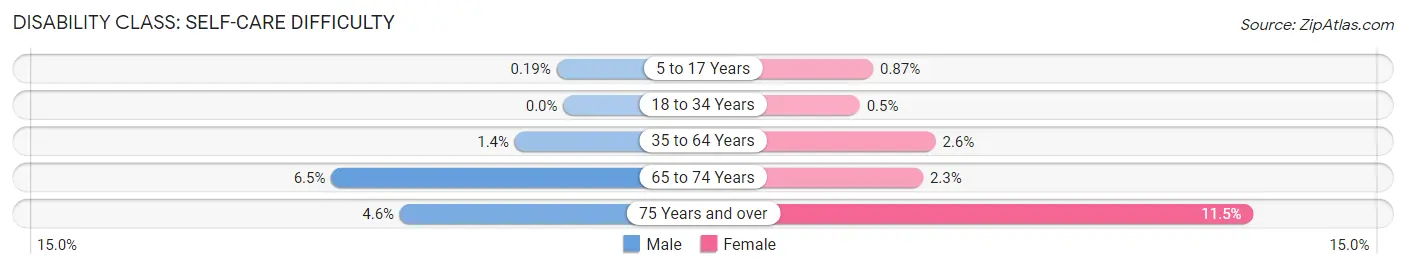
| Age Bracket | Male | Female |
| 5 to 17 Years | 5 (0.2%) | 19 (0.9%) |
| 18 to 34 Years | 0 (0.0%) | 12 (0.5%) |
| 35 to 64 Years | 71 (1.3%) | 134 (2.6%) |
| 65 to 74 Years | 120 (6.5%) | 49 (2.3%) |
| 75 Years and over | 50 (4.5%) | 151 (11.5%) |
Technology Access in Carroll County
Computing Device Access in Carroll County
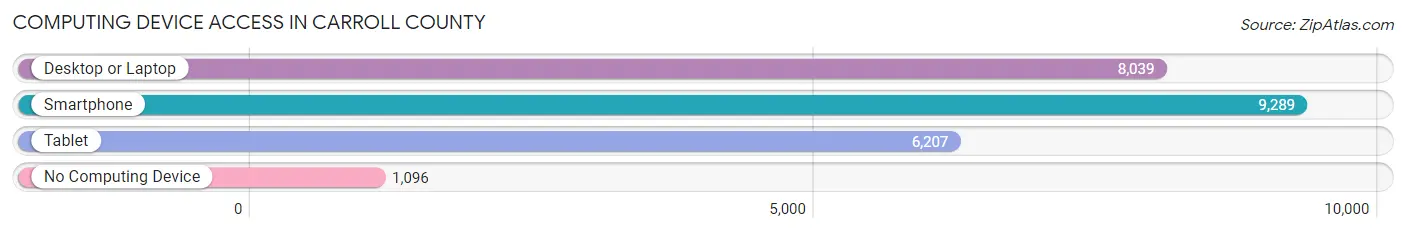
| Device Type | # Households | % Households |
| Desktop or Laptop | 8,039 | 70.8% |
| Smartphone | 9,289 | 81.8% |
| Tablet | 6,207 | 54.6% |
| No Computing Device | 1,096 | 9.7% |
| Total | 11,357 | 100.0% |
Internet Access in Carroll County
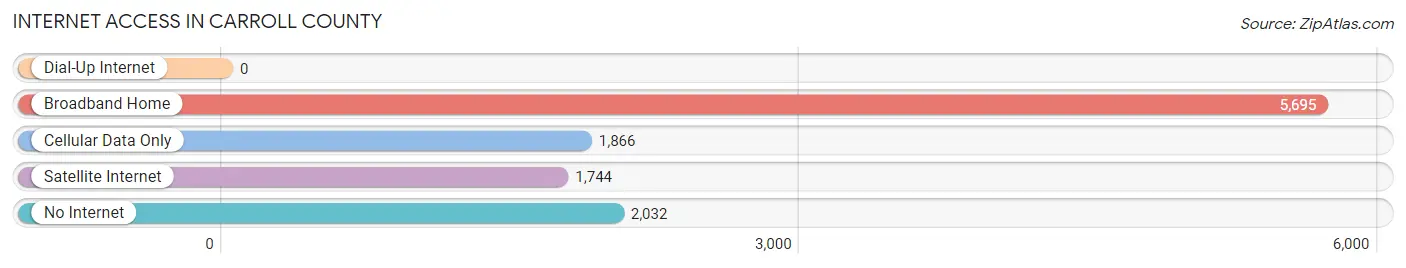
| Internet Type | # Households | % Households |
| Dial-Up Internet | 0 | 0.0% |
| Broadband Home | 5,695 | 50.1% |
| Cellular Data Only | 1,866 | 16.4% |
| Satellite Internet | 1,744 | 15.4% |
| No Internet | 2,032 | 17.9% |
| Total | 11,357 | 100.0% |
Carroll County Summary
Carroll County is located in the northwest corner of Arkansas, and is bordered by Missouri to the north, Madison County to the east, Benton County to the south, and Washington County to the west. The county seat is Berryville, and the county is named for Charles Carroll of Carrollton, the last surviving signer of the Declaration of Independence.
History
Carroll County was established in 1833, and was originally part of the Cherokee Nation. The county was created from parts of Madison and Washington counties, and was named for Charles Carroll of Carrollton, the last surviving signer of the Declaration of Independence. The first settlers in the area were mostly from Tennessee and Kentucky, and the county was largely agricultural.
During the Civil War, Carroll County was divided in its loyalties, with some supporting the Union and some supporting the Confederacy. The county was the site of several skirmishes, and the Battle of Prairie Grove was fought in the county in 1862. After the war, the county was largely agricultural, and the economy was based on cotton and timber.
Geography
Carroll County is located in the northwest corner of Arkansas, and is bordered by Missouri to the north, Madison County to the east, Benton County to the south, and Washington County to the west. The county has a total area of 602 square miles, of which 599 square miles is land and 3 square miles is water. The county is mostly hilly, with the Ozark Mountains in the north and the Boston Mountains in the south. The White River runs through the county, and there are several small lakes and streams.
Economy
The economy of Carroll County is largely based on agriculture, with the main crops being cotton, soybeans, corn, and wheat. The county also has a thriving timber industry, and there are several manufacturing plants in the area. Tourism is also an important part of the economy, with the Ozark National Forest and the Buffalo National River providing recreational opportunities.
Demographics
As of the 2010 census, there were 27,446 people, 10,845 households, and 7,817 families living in Carroll County. The population density was 45.7 people per square mile. The racial makeup of the county was 94.3% White, 0.7% Black or African American, 0.7% Native American, 0.4% Asian, 0.1% Pacific Islander, 2.3% from other races, and 1.5% from two or more races. Hispanic or Latino of any race were 4.3% of the population.
The median income for a household in the county was $37,845, and the median income for a family was $45,945. The per capita income for the county was $19,845. About 11.3% of families and 14.7% of the population were below the poverty line, including 19.2% of those under age 18 and 11.2% of those age 65 or over.
Overall, Carroll County is a rural county with a strong agricultural base. The county has a diverse population, and the economy is largely based on agriculture and tourism. The county is home to several recreational areas, and is a popular destination for outdoor enthusiasts.
Common Questions
What is Per Capita Income in Carroll County?
Per Capita income in Carroll County is $29,123.
What is the Median Family Income in Carroll County?
Median Family Income in Carroll County is $68,994.
What is the Median Household income in Carroll County?
Median Household Income in Carroll County is $56,826.
What is Income or Wage Gap in Carroll County?
Income or Wage Gap in Carroll County is 13.3%.
Women in Carroll County earn 86.7 cents for every dollar earned by a man.
What is Family Income Deficit in Carroll County?
Family Income Deficit in Carroll County is $9,647.
Families that are below poverty line in Carroll County earn $9,647 less on average than the poverty threshold level.
What is Inequality or Gini Index in Carroll County?
Inequality or Gini Index in Carroll County is 0.45.
What is the Total Population of Carroll County?
Total Population of Carroll County is 28,362.
What is the Total Male Population of Carroll County?
Total Male Population of Carroll County is 14,305.
What is the Total Female Population of Carroll County?
Total Female Population of Carroll County is 14,057.
What is the Ratio of Males per 100 Females in Carroll County?
There are 101.76 Males per 100 Females in Carroll County.
What is the Ratio of Females per 100 Males in Carroll County?
There are 98.27 Females per 100 Males in Carroll County.
What is the Median Population Age in Carroll County?
Median Population Age in Carroll County is 44.6 Years.
What is the Average Family Size in Carroll County
Average Family Size in Carroll County is 3.0 People.
What is the Average Household Size in Carroll County
Average Household Size in Carroll County is 2.5 People.
How Large is the Labor Force in Carroll County?
There are 12,228 People in the Labor Forcein in Carroll County.
What is the Percentage of People in the Labor Force in Carroll County?
53.1% of People are in the Labor Force in Carroll County.
What is the Unemployment Rate in Carroll County?
Unemployment Rate in Carroll County is 3.1%.