Texarkana, AR Map & Demographics
Texarkana Map
Texarkana Overview
$26,827
PER CAPITA INCOME
$56,680
AVG FAMILY INCOME
$45,233
AVG HOUSEHOLD INCOME
26.5%
WAGE / INCOME GAP [ % ]
73.5¢/ $1
WAGE / INCOME GAP [ $ ]
$12,101
FAMILY INCOME DEFICIT
0.50
INEQUALITY / GINI INDEX
29,404
TOTAL POPULATION
14,131
MALE POPULATION
15,273
FEMALE POPULATION
92.52
MALES / 100 FEMALES
108.08
FEMALES / 100 MALES
39.1
MEDIAN AGE
3.4
AVG FAMILY SIZE
2.5
AVG HOUSEHOLD SIZE
12,548
LABOR FORCE [ PEOPLE ]
53.8%
PERCENT IN LABOR FORCE
8.3%
UNEMPLOYMENT RATE
Texarkana Zip Codes
Texarkana Area Codes
Income in Texarkana
Income Overview in Texarkana
Per Capita Income in Texarkana is $26,827, while median incomes of families and households are $56,680 and $45,233 respectively.
| Characteristic | Number | Measure |
| Per Capita Income | 29,404 | $26,827 |
| Median Family Income | 6,641 | $56,680 |
| Mean Family Income | 6,641 | $75,381 |
| Median Household Income | 11,077 | $45,233 |
| Mean Household Income | 11,077 | $64,238 |
| Income Deficit | 6,641 | $12,101 |
| Wage / Income Gap (%) | 29,404 | 26.48% |
| Wage / Income Gap ($) | 29,404 | 73.52¢ per $1 |
| Gini / Inequality Index | 29,404 | 0.50 |
Earnings by Sex in Texarkana
Average Earnings in Texarkana are $34,672, $41,738 for men and $30,687 for women, a difference of 26.5%.

| Sex | Number | Average Earnings |
| Male | 6,544 (50.3%) | $41,738 |
| Female | 6,474 (49.7%) | $30,687 |
| Total | 13,018 (100.0%) | $34,672 |
Earnings by Sex by Income Bracket in Texarkana
The most common earnings brackets in Texarkana are $75,000 to $99,999 for men (832 | 12.7%) and $25,000 to $29,999 for women (544 | 8.4%).
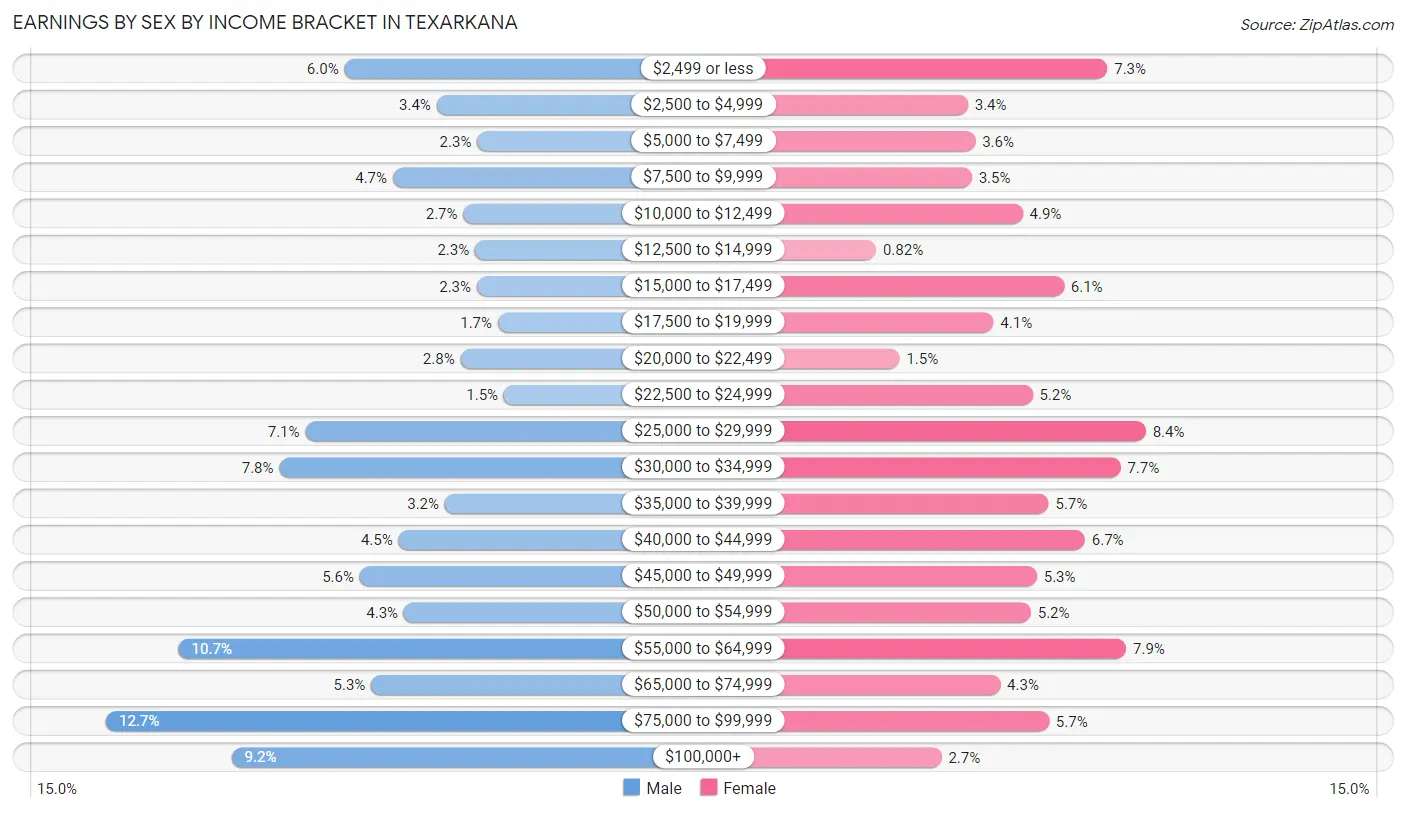
| Income | Male | Female |
| $2,499 or less | 393 (6.0%) | 474 (7.3%) |
| $2,500 to $4,999 | 224 (3.4%) | 220 (3.4%) |
| $5,000 to $7,499 | 149 (2.3%) | 234 (3.6%) |
| $7,500 to $9,999 | 304 (4.6%) | 227 (3.5%) |
| $10,000 to $12,499 | 175 (2.7%) | 320 (4.9%) |
| $12,500 to $14,999 | 153 (2.3%) | 53 (0.8%) |
| $15,000 to $17,499 | 150 (2.3%) | 395 (6.1%) |
| $17,500 to $19,999 | 111 (1.7%) | 267 (4.1%) |
| $20,000 to $22,499 | 180 (2.8%) | 96 (1.5%) |
| $22,500 to $24,999 | 100 (1.5%) | 338 (5.2%) |
| $25,000 to $29,999 | 465 (7.1%) | 544 (8.4%) |
| $30,000 to $34,999 | 513 (7.8%) | 498 (7.7%) |
| $35,000 to $39,999 | 209 (3.2%) | 367 (5.7%) |
| $40,000 to $44,999 | 294 (4.5%) | 433 (6.7%) |
| $45,000 to $49,999 | 365 (5.6%) | 346 (5.3%) |
| $50,000 to $54,999 | 284 (4.3%) | 335 (5.2%) |
| $55,000 to $64,999 | 698 (10.7%) | 508 (7.9%) |
| $65,000 to $74,999 | 344 (5.3%) | 279 (4.3%) |
| $75,000 to $99,999 | 832 (12.7%) | 368 (5.7%) |
| $100,000+ | 601 (9.2%) | 172 (2.7%) |
| Total | 6,544 (100.0%) | 6,474 (100.0%) |
Earnings by Sex by Educational Attainment in Texarkana
Average earnings in Texarkana are $46,880 for men and $33,649 for women, a difference of 28.2%. Men with an educational attainment of graduate degree enjoy the highest average annual earnings of $72,727, while those with less than high school education earn the least with $33,103. Women with an educational attainment of graduate degree earn the most with the average annual earnings of $65,389, while those with less than high school education have the smallest earnings of $13,929.
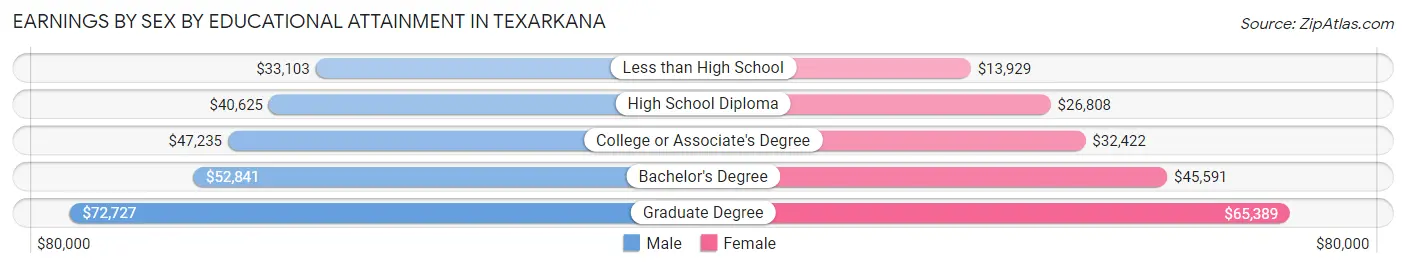
| Educational Attainment | Male Income | Female Income |
| Less than High School | $33,103 | $13,929 |
| High School Diploma | $40,625 | $26,808 |
| College or Associate's Degree | $47,235 | $32,422 |
| Bachelor's Degree | $52,841 | $45,591 |
| Graduate Degree | $72,727 | $65,389 |
| Total | $46,880 | $33,649 |
Family Income in Texarkana
Family Income Brackets in Texarkana
According to the Texarkana family income data, there are 1,169 families falling into the $50,000 to $74,999 income range, which is the most common income bracket and makes up 17.6% of all families. Conversely, the $10,000 to $14,999 income bracket is the least frequent group with only 193 families (2.9%) belonging to this category.
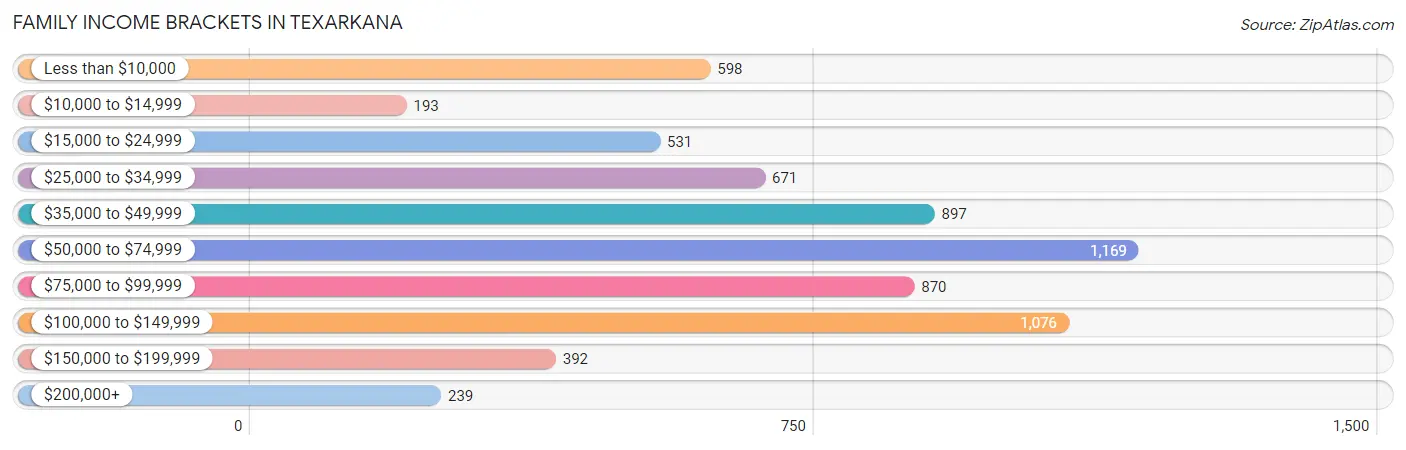
| Income Bracket | # Families | % Families |
| Less than $10,000 | 598 | 9.0% |
| $10,000 to $14,999 | 193 | 2.9% |
| $15,000 to $24,999 | 531 | 8.0% |
| $25,000 to $34,999 | 671 | 10.1% |
| $35,000 to $49,999 | 897 | 13.5% |
| $50,000 to $74,999 | 1,169 | 17.6% |
| $75,000 to $99,999 | 870 | 13.1% |
| $100,000 to $149,999 | 1,076 | 16.2% |
| $150,000 to $199,999 | 392 | 5.9% |
| $200,000+ | 239 | 3.6% |
Family Income by Famaliy Size in Texarkana
7+ person families (80 | 1.2%) account for the highest median family income in Texarkana with $146,406 per family, while 2-person families (3,494 | 52.6%) have the highest median income of $26,542 per family member.
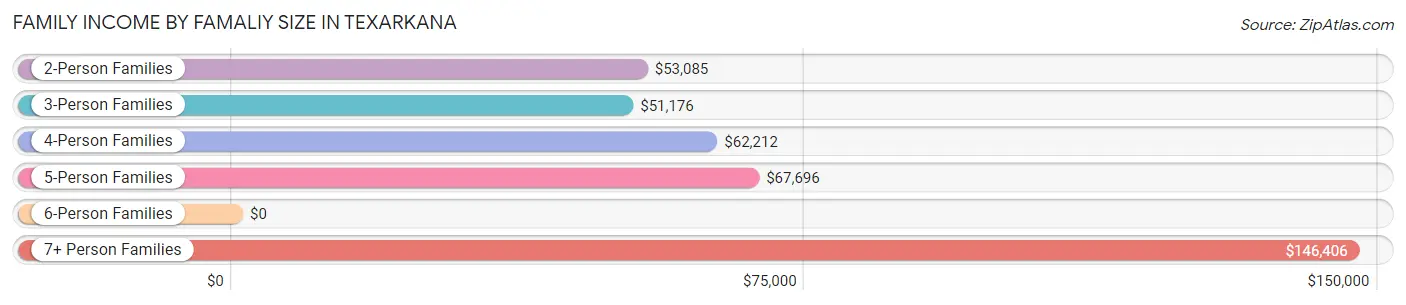
| Income Bracket | # Families | Median Income |
| 2-Person Families | 3,494 (52.6%) | $53,085 |
| 3-Person Families | 1,529 (23.0%) | $51,176 |
| 4-Person Families | 976 (14.7%) | $62,212 |
| 5-Person Families | 413 (6.2%) | $67,696 |
| 6-Person Families | 149 (2.2%) | $0 |
| 7+ Person Families | 80 (1.2%) | $146,406 |
| Total | 6,641 (100.0%) | $56,680 |
Family Income by Number of Earners in Texarkana
The median family income in Texarkana is $56,680, with families comprising 3+ earners (297) having the highest median family income of $146,226, while families with no earners (1,583) have the lowest median family income of $27,097, accounting for 4.5% and 23.8% of families, respectively.
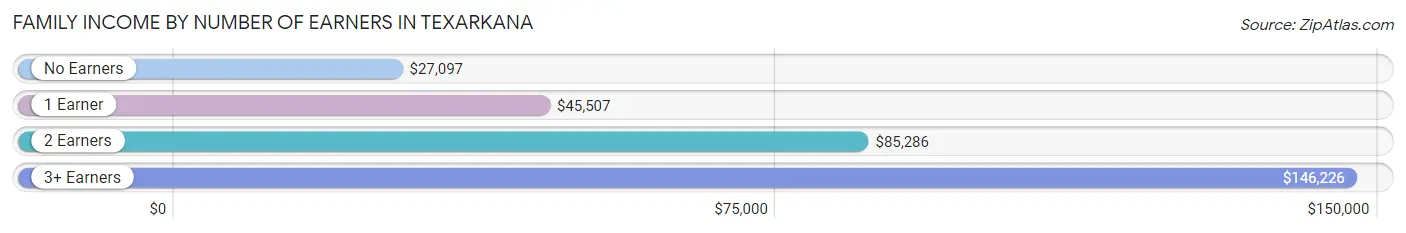
| Number of Earners | # Families | Median Income |
| No Earners | 1,583 (23.8%) | $27,097 |
| 1 Earner | 2,529 (38.1%) | $45,507 |
| 2 Earners | 2,232 (33.6%) | $85,286 |
| 3+ Earners | 297 (4.5%) | $146,226 |
| Total | 6,641 (100.0%) | $56,680 |
Household Income in Texarkana
Household Income Brackets in Texarkana
With 1,717 households falling in the category, the $50,000 to $74,999 income range is the most frequent in Texarkana, accounting for 15.5% of all households. In contrast, only 366 households (3.3%) fall into the $200,000+ income bracket, making it the least populous group.
| Income Bracket | # Households | % Households |
| Less than $10,000 | 1,318 | 11.9% |
| $10,000 to $14,999 | 709 | 6.4% |
| $15,000 to $24,999 | 1,141 | 10.3% |
| $25,000 to $34,999 | 1,374 | 12.4% |
| $35,000 to $49,999 | 1,551 | 14.0% |
| $50,000 to $74,999 | 1,717 | 15.5% |
| $75,000 to $99,999 | 1,074 | 9.7% |
| $100,000 to $149,999 | 1,340 | 12.1% |
| $150,000 to $199,999 | 476 | 4.3% |
| $200,000+ | 366 | 3.3% |
Household Income by Householder Age in Texarkana
The median household income in Texarkana is $45,233, with the highest median household income of $58,276 found in the 45 to 64 years age bracket for the primary householder. A total of 4,182 households (37.8%) fall into this category. Meanwhile, the 15 to 24 years age bracket for the primary householder has the lowest median household income of $23,365, with 505 households (4.6%) in this group.

| Income Bracket | # Households | Median Income |
| 15 to 24 Years | 505 (4.6%) | $23,365 |
| 25 to 44 Years | 3,462 (31.2%) | $46,012 |
| 45 to 64 Years | 4,182 (37.8%) | $58,276 |
| 65+ Years | 2,928 (26.4%) | $37,637 |
| Total | 11,077 (100.0%) | $45,233 |
Poverty in Texarkana
Income Below Poverty by Sex and Age in Texarkana
With 20.7% poverty level for males and 24.8% for females among the residents of Texarkana, under 5 year old males and 18 to 24 year old females are the most vulnerable to poverty, with 408 males (44.1%) and 546 females (50.7%) in their respective age groups living below the poverty level.
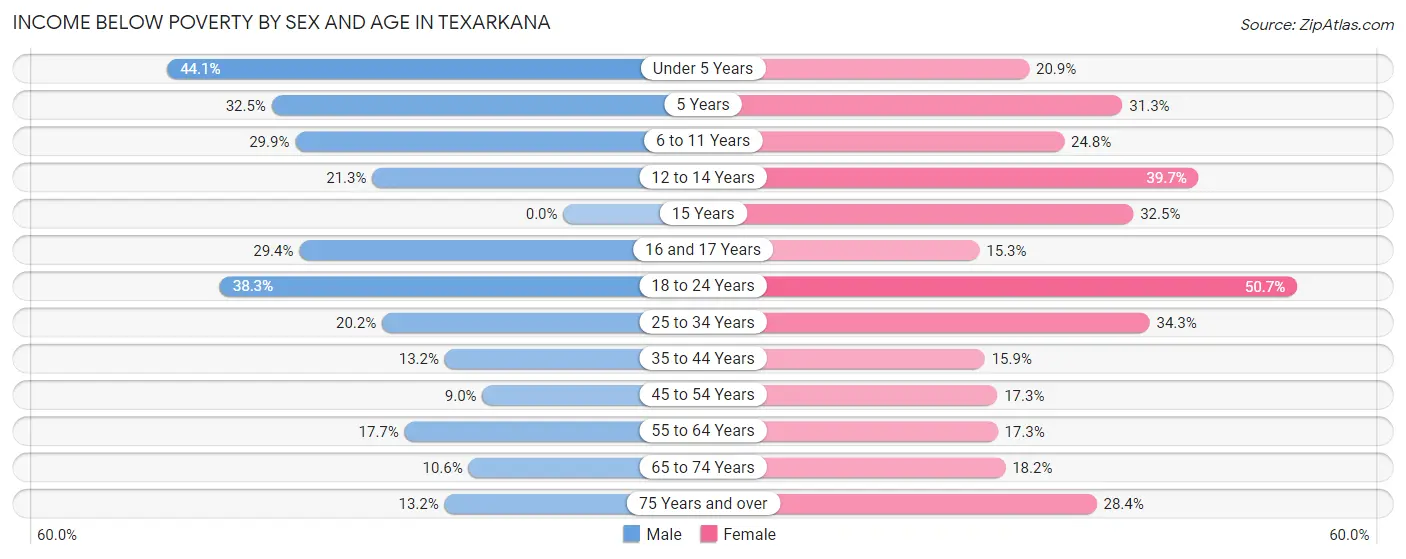
| Age Bracket | Male | Female |
| Under 5 Years | 408 (44.1%) | 177 (20.8%) |
| 5 Years | 51 (32.5%) | 40 (31.2%) |
| 6 to 11 Years | 287 (29.9%) | 324 (24.7%) |
| 12 to 14 Years | 173 (21.3%) | 215 (39.7%) |
| 15 Years | 0 (0.0%) | 62 (32.5%) |
| 16 and 17 Years | 100 (29.4%) | 57 (15.3%) |
| 18 to 24 Years | 467 (38.3%) | 546 (50.7%) |
| 25 to 34 Years | 332 (20.2%) | 746 (34.3%) |
| 35 to 44 Years | 219 (13.2%) | 299 (15.9%) |
| 45 to 54 Years | 144 (9.0%) | 319 (17.3%) |
| 55 to 64 Years | 299 (17.7%) | 339 (17.3%) |
| 65 to 74 Years | 135 (10.6%) | 286 (18.2%) |
| 75 Years and over | 100 (13.2%) | 309 (28.4%) |
| Total | 2,715 (20.7%) | 3,719 (24.8%) |
Income Above Poverty by Sex and Age in Texarkana
According to the poverty statistics in Texarkana, males aged 15 years and females aged 16 and 17 years are the age groups that are most secure financially, with 100.0% of males and 84.7% of females in these age groups living above the poverty line.
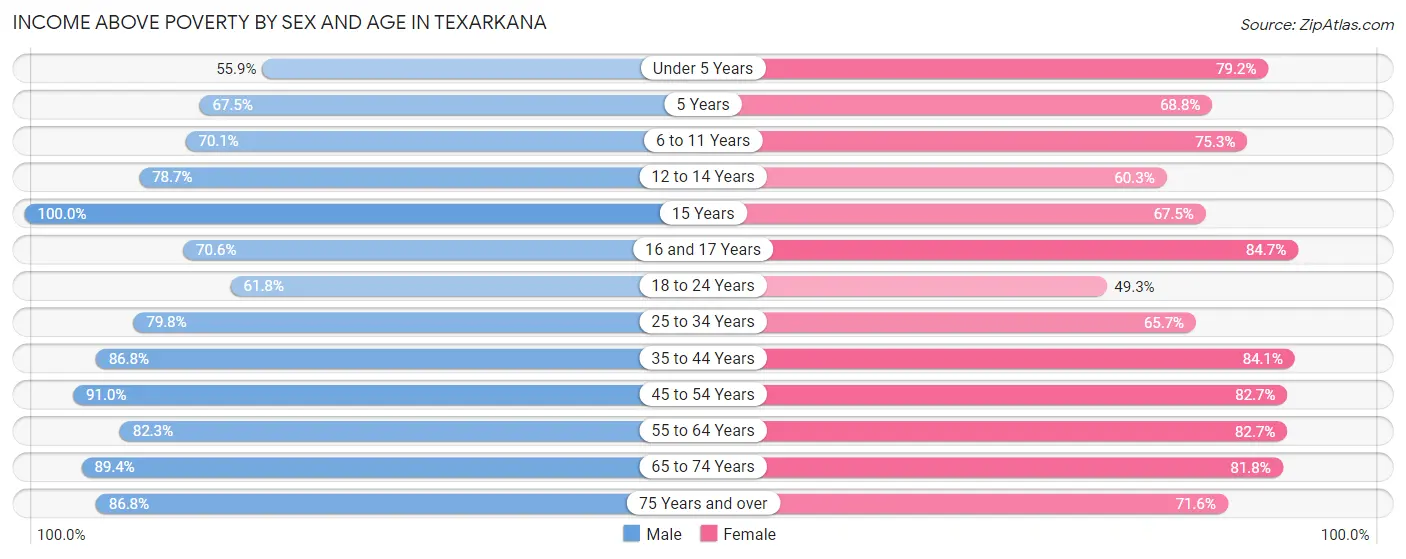
| Age Bracket | Male | Female |
| Under 5 Years | 517 (55.9%) | 672 (79.1%) |
| 5 Years | 106 (67.5%) | 88 (68.8%) |
| 6 to 11 Years | 674 (70.1%) | 985 (75.2%) |
| 12 to 14 Years | 640 (78.7%) | 326 (60.3%) |
| 15 Years | 98 (100.0%) | 129 (67.5%) |
| 16 and 17 Years | 240 (70.6%) | 315 (84.7%) |
| 18 to 24 Years | 754 (61.8%) | 531 (49.3%) |
| 25 to 34 Years | 1,312 (79.8%) | 1,431 (65.7%) |
| 35 to 44 Years | 1,440 (86.8%) | 1,579 (84.1%) |
| 45 to 54 Years | 1,454 (91.0%) | 1,524 (82.7%) |
| 55 to 64 Years | 1,392 (82.3%) | 1,616 (82.7%) |
| 65 to 74 Years | 1,144 (89.4%) | 1,285 (81.8%) |
| 75 Years and over | 656 (86.8%) | 780 (71.6%) |
| Total | 10,427 (79.3%) | 11,261 (75.2%) |
Income Below Poverty Among Married-Couple Families in Texarkana
The poverty statistics for married-couple families in Texarkana show that 6.6% or 258 of the total 3,896 families live below the poverty line. Families with 3 or 4 children have the highest poverty rate of 23.5%, comprising of 78 families. On the other hand, families with 5 or more children have the lowest poverty rate of 0.0%, which includes 0 families.
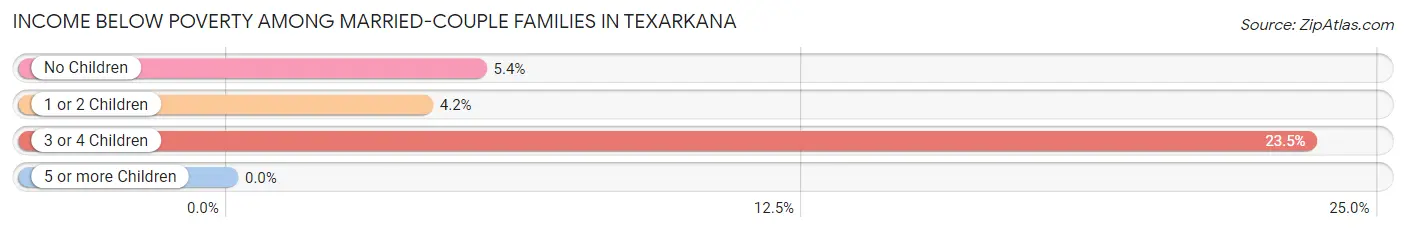
| Children | Above Poverty | Below Poverty |
| No Children | 2,377 (94.6%) | 136 (5.4%) |
| 1 or 2 Children | 994 (95.8%) | 44 (4.2%) |
| 3 or 4 Children | 254 (76.5%) | 78 (23.5%) |
| 5 or more Children | 13 (100.0%) | 0 (0.0%) |
| Total | 3,638 (93.4%) | 258 (6.6%) |
Income Below Poverty Among Single-Parent Households in Texarkana
According to the poverty data in Texarkana, 24.6% or 118 single-father households and 40.1% or 909 single-mother households are living below the poverty line. Among single-father households, those with 1 or 2 children have the highest poverty rate, with 38 households (30.9%) experiencing poverty. Likewise, among single-mother households, those with 5 or more children have the highest poverty rate, with 11 households (100.0%) falling below the poverty line.
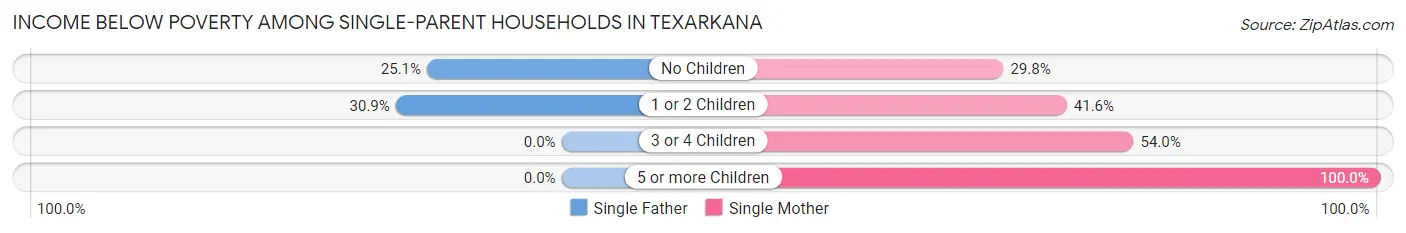
| Children | Single Father | Single Mother |
| No Children | 80 (25.1%) | 217 (29.8%) |
| 1 or 2 Children | 38 (30.9%) | 478 (41.6%) |
| 3 or 4 Children | 0 (0.0%) | 203 (54.0%) |
| 5 or more Children | 0 (0.0%) | 11 (100.0%) |
| Total | 118 (24.6%) | 909 (40.1%) |
Income Below Poverty Among Married-Couple vs Single-Parent Households in Texarkana
The poverty data for Texarkana shows that 258 of the married-couple family households (6.6%) and 1,027 of the single-parent households (37.4%) are living below the poverty level. Within the married-couple family households, those with 3 or 4 children have the highest poverty rate, with 78 households (23.5%) falling below the poverty line. Among the single-parent households, those with 5 or more children have the highest poverty rate, with 11 household (100.0%) living below poverty.
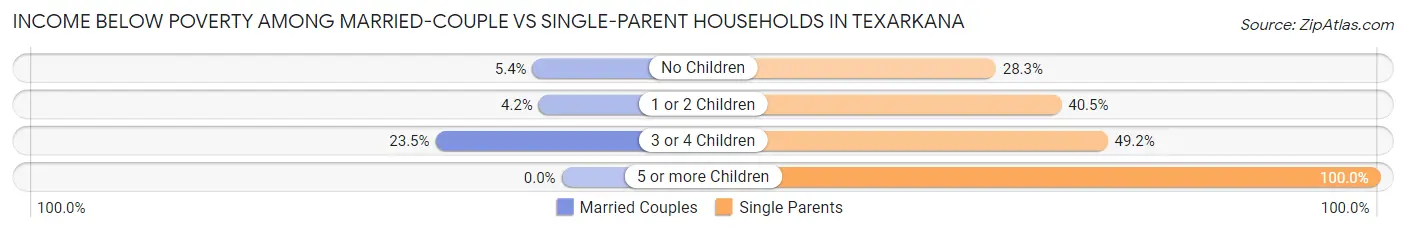
| Children | Married-Couple Families | Single-Parent Households |
| No Children | 136 (5.4%) | 297 (28.3%) |
| 1 or 2 Children | 44 (4.2%) | 516 (40.5%) |
| 3 or 4 Children | 78 (23.5%) | 203 (49.1%) |
| 5 or more Children | 0 (0.0%) | 11 (100.0%) |
| Total | 258 (6.6%) | 1,027 (37.4%) |
Race in Texarkana
The most populous races in Texarkana are White / Caucasian (17,094 | 58.1%), Black / African American (10,209 | 34.7%), and Hispanic or Latino (1,355 | 4.6%).
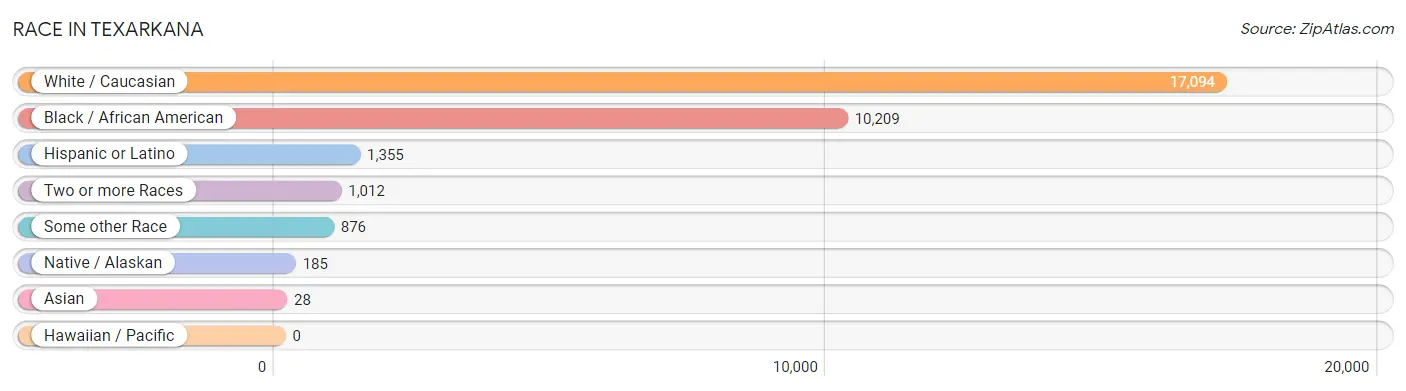
| Race | # Population | % Population |
| Asian | 28 | 0.1% |
| Black / African American | 10,209 | 34.7% |
| Hawaiian / Pacific | 0 | 0.0% |
| Hispanic or Latino | 1,355 | 4.6% |
| Native / Alaskan | 185 | 0.6% |
| White / Caucasian | 17,094 | 58.1% |
| Two or more Races | 1,012 | 3.4% |
| Some other Race | 876 | 3.0% |
| Total | 29,404 | 100.0% |
Ancestry in Texarkana
The most populous ancestries reported in Texarkana are American (3,770 | 12.8%), Irish (2,290 | 7.8%), English (2,232 | 7.6%), German (1,352 | 4.6%), and Mexican (1,051 | 3.6%), together accounting for 36.4% of all Texarkana residents.
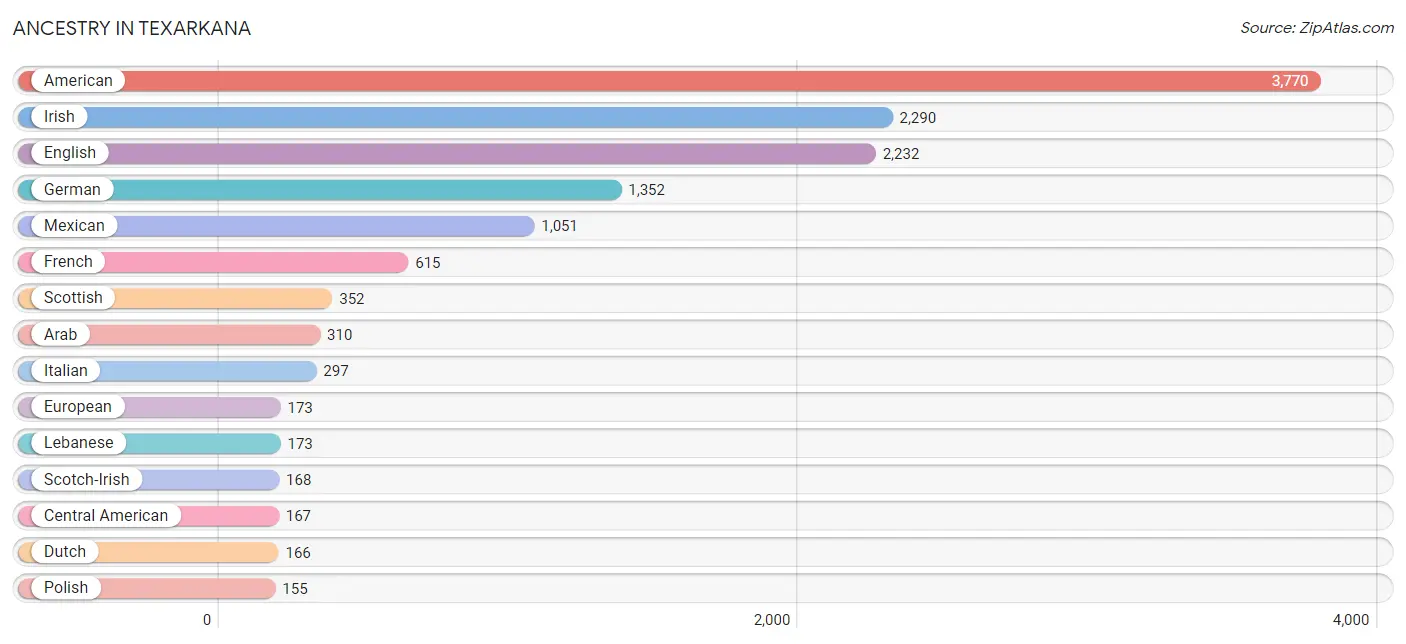
| Ancestry | # Population | % Population |
| African | 45 | 0.2% |
| American | 3,770 | 12.8% |
| Arab | 310 | 1.1% |
| Austrian | 51 | 0.2% |
| Bhutanese | 13 | 0.0% |
| Blackfeet | 145 | 0.5% |
| British | 147 | 0.5% |
| Cajun | 7 | 0.0% |
| Canadian | 41 | 0.1% |
| Central American | 167 | 0.6% |
| Central American Indian | 61 | 0.2% |
| Cherokee | 135 | 0.5% |
| Choctaw | 123 | 0.4% |
| Comanche | 32 | 0.1% |
| Costa Rican | 11 | 0.0% |
| Cuban | 31 | 0.1% |
| Czech | 22 | 0.1% |
| Danish | 10 | 0.0% |
| Dominican | 22 | 0.1% |
| Dutch | 166 | 0.6% |
| Dutch West Indian | 40 | 0.1% |
| Eastern European | 41 | 0.1% |
| Ecuadorian | 22 | 0.1% |
| English | 2,232 | 7.6% |
| European | 173 | 0.6% |
| Finnish | 12 | 0.0% |
| French | 615 | 2.1% |
| French Canadian | 11 | 0.0% |
| German | 1,352 | 4.6% |
| Greek | 12 | 0.0% |
| Hungarian | 3 | 0.0% |
| Irish | 2,290 | 7.8% |
| Italian | 297 | 1.0% |
| Korean | 28 | 0.1% |
| Latvian | 12 | 0.0% |
| Lebanese | 173 | 0.6% |
| Mexican | 1,051 | 3.6% |
| Moroccan | 31 | 0.1% |
| Navajo | 4 | 0.0% |
| Northern European | 16 | 0.1% |
| Norwegian | 94 | 0.3% |
| Panamanian | 93 | 0.3% |
| Polish | 155 | 0.5% |
| Portuguese | 4 | 0.0% |
| Puerto Rican | 14 | 0.1% |
| Salvadoran | 63 | 0.2% |
| Samoan | 83 | 0.3% |
| Scandinavian | 7 | 0.0% |
| Scotch-Irish | 168 | 0.6% |
| Scottish | 352 | 1.2% |
| South American | 22 | 0.1% |
| Sri Lankan | 10 | 0.0% |
| Subsaharan African | 45 | 0.2% |
| Swedish | 106 | 0.4% |
| Swiss | 11 | 0.0% |
| Ukrainian | 11 | 0.0% |
| Ute | 8 | 0.0% |
| Welsh | 75 | 0.3% | View All 58 Rows |
Immigrants in Texarkana
The most numerous immigrant groups reported in Texarkana came from Central America (540 | 1.8%), Latin America (540 | 1.8%), Mexico (490 | 1.7%), Asia (45 | 0.2%), and Europe (38 | 0.1%), together accounting for 5.6% of all Texarkana residents.
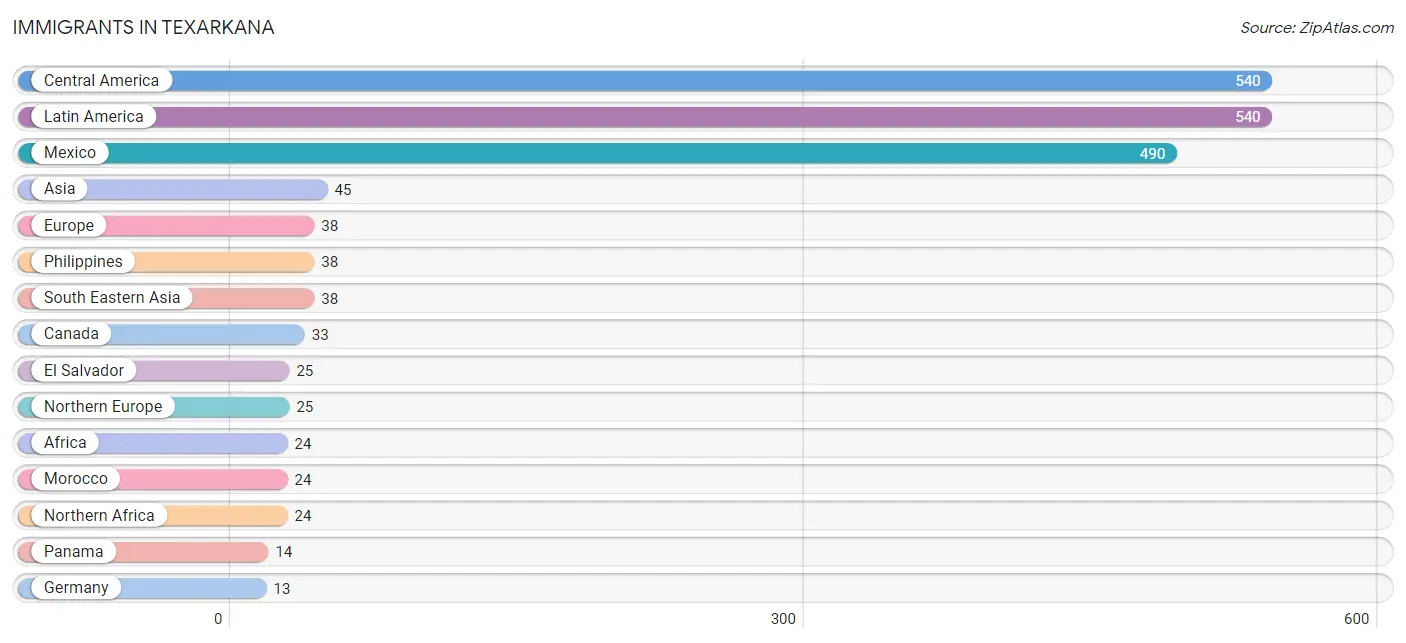
| Immigration Origin | # Population | % Population |
| Africa | 24 | 0.1% |
| Asia | 45 | 0.2% |
| Canada | 33 | 0.1% |
| Central America | 540 | 1.8% |
| Costa Rica | 11 | 0.0% |
| El Salvador | 25 | 0.1% |
| Europe | 38 | 0.1% |
| Germany | 13 | 0.0% |
| Latin America | 540 | 1.8% |
| Mexico | 490 | 1.7% |
| Morocco | 24 | 0.1% |
| Northern Africa | 24 | 0.1% |
| Northern Europe | 25 | 0.1% |
| Pakistan | 7 | 0.0% |
| Panama | 14 | 0.1% |
| Philippines | 38 | 0.1% |
| Scotland | 11 | 0.0% |
| South Central Asia | 7 | 0.0% |
| South Eastern Asia | 38 | 0.1% |
| Sweden | 9 | 0.0% |
| Western Europe | 13 | 0.0% | View All 21 Rows |
Sex and Age in Texarkana
Sex and Age in Texarkana
The most populous age groups in Texarkana are 10 to 14 Years (1,127 | 8.0%) for men and 40 to 44 Years (1,210 | 7.9%) for women.
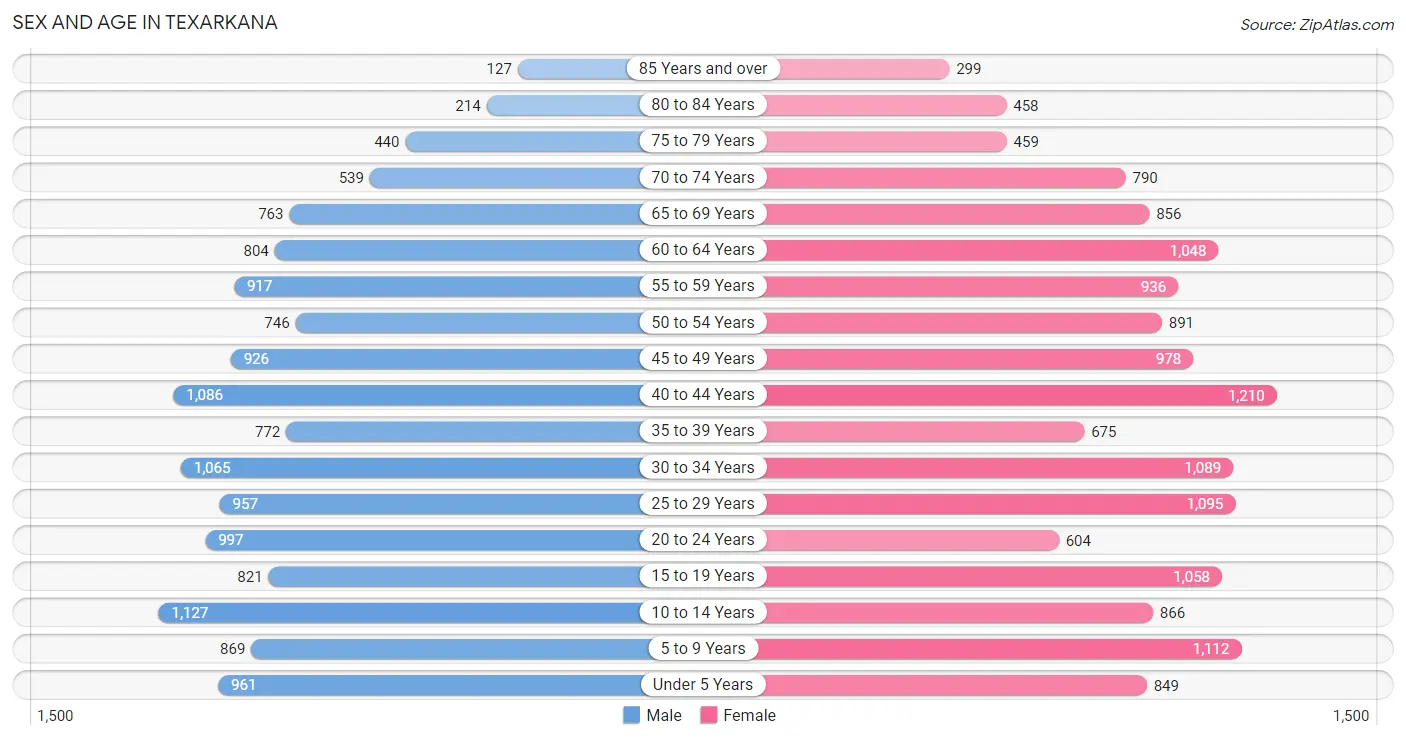
| Age Bracket | Male | Female |
| Under 5 Years | 961 (6.8%) | 849 (5.6%) |
| 5 to 9 Years | 869 (6.1%) | 1,112 (7.3%) |
| 10 to 14 Years | 1,127 (8.0%) | 866 (5.7%) |
| 15 to 19 Years | 821 (5.8%) | 1,058 (6.9%) |
| 20 to 24 Years | 997 (7.1%) | 604 (4.0%) |
| 25 to 29 Years | 957 (6.8%) | 1,095 (7.2%) |
| 30 to 34 Years | 1,065 (7.5%) | 1,089 (7.1%) |
| 35 to 39 Years | 772 (5.5%) | 675 (4.4%) |
| 40 to 44 Years | 1,086 (7.7%) | 1,210 (7.9%) |
| 45 to 49 Years | 926 (6.6%) | 978 (6.4%) |
| 50 to 54 Years | 746 (5.3%) | 891 (5.8%) |
| 55 to 59 Years | 917 (6.5%) | 936 (6.1%) |
| 60 to 64 Years | 804 (5.7%) | 1,048 (6.9%) |
| 65 to 69 Years | 763 (5.4%) | 856 (5.6%) |
| 70 to 74 Years | 539 (3.8%) | 790 (5.2%) |
| 75 to 79 Years | 440 (3.1%) | 459 (3.0%) |
| 80 to 84 Years | 214 (1.5%) | 458 (3.0%) |
| 85 Years and over | 127 (0.9%) | 299 (2.0%) |
| Total | 14,131 (100.0%) | 15,273 (100.0%) |
Families and Households in Texarkana
Median Family Size in Texarkana
The median family size in Texarkana is 3.35 persons per family, with single female/mother families (2,266 | 34.1%) accounting for the largest median family size of 3.65 persons per family. On the other hand, married-couple families (3,896 | 58.7%) represent the smallest median family size with 3.17 persons per family.
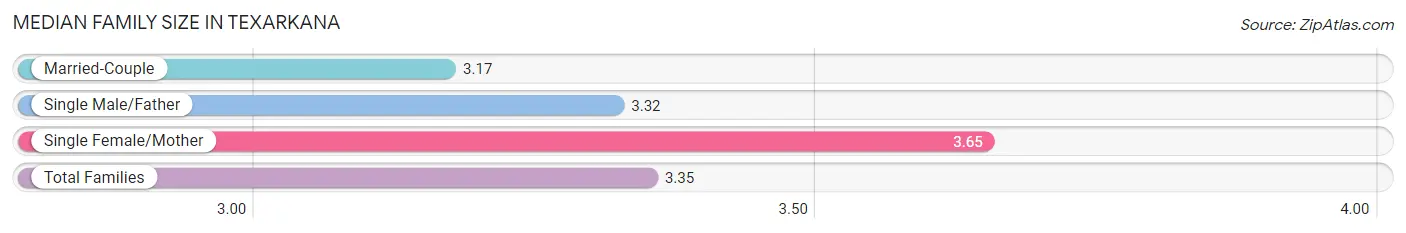
| Family Type | # Families | Family Size |
| Married-Couple | 3,896 (58.7%) | 3.17 |
| Single Male/Father | 479 (7.2%) | 3.32 |
| Single Female/Mother | 2,266 (34.1%) | 3.65 |
| Total Families | 6,641 (100.0%) | 3.35 |
Median Household Size in Texarkana
The median household size in Texarkana is 2.53 persons per household, with single female/mother households (2,266 | 20.5%) accounting for the largest median household size of 3.82 persons per household. non-family households (4,436 | 40.1%) represent the smallest median household size with 1.19 persons per household.
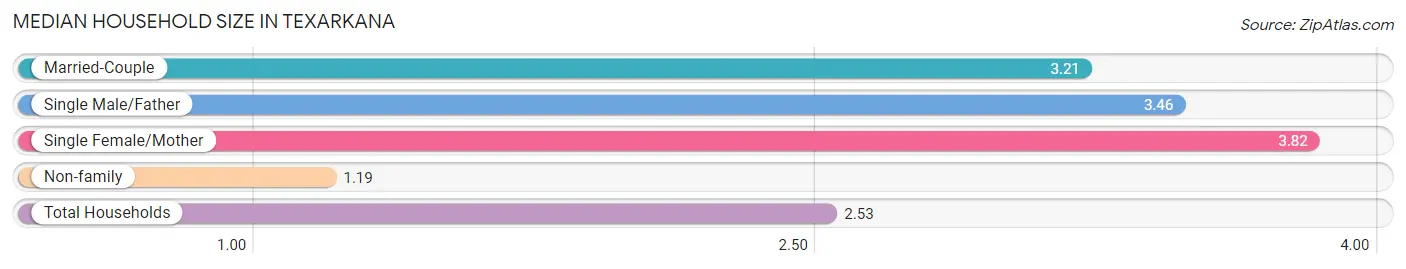
| Household Type | # Households | Household Size |
| Married-Couple | 3,896 (35.2%) | 3.21 |
| Single Male/Father | 479 (4.3%) | 3.46 |
| Single Female/Mother | 2,266 (20.5%) | 3.82 |
| Non-family | 4,436 (40.1%) | 1.19 |
| Total Households | 11,077 (100.0%) | 2.53 |
Household Size by Marriage Status in Texarkana
Out of a total of 11,077 households in Texarkana, 6,641 (60.0%) are family households, while 4,436 (40.1%) are nonfamily households. The most numerous type of family households are 2-person households, comprising 3,281, and the most common type of nonfamily households are 1-person households, comprising 3,948.
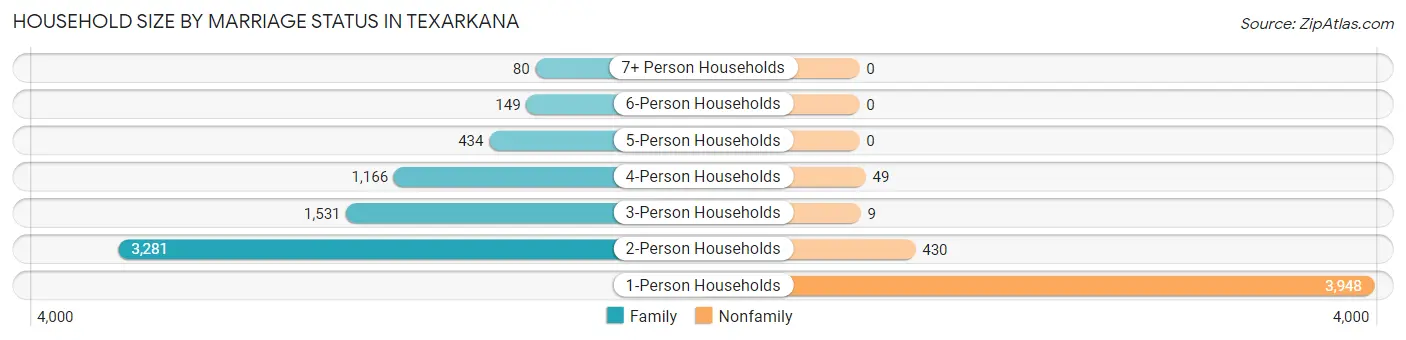
| Household Size | Family Households | Nonfamily Households |
| 1-Person Households | - | 3,948 (35.6%) |
| 2-Person Households | 3,281 (29.6%) | 430 (3.9%) |
| 3-Person Households | 1,531 (13.8%) | 9 (0.1%) |
| 4-Person Households | 1,166 (10.5%) | 49 (0.4%) |
| 5-Person Households | 434 (3.9%) | 0 (0.0%) |
| 6-Person Households | 149 (1.3%) | 0 (0.0%) |
| 7+ Person Households | 80 (0.7%) | 0 (0.0%) |
| Total | 6,641 (60.0%) | 4,436 (40.1%) |
Female Fertility in Texarkana
Fertility by Age in Texarkana
Average fertility rate in Texarkana is 64.0 births per 1,000 women. Women in the age bracket of 20 to 34 years have the highest fertility rate with 119.0 births per 1,000 women. Women in the age bracket of 20 to 34 years acount for 76.5% of all women with births.
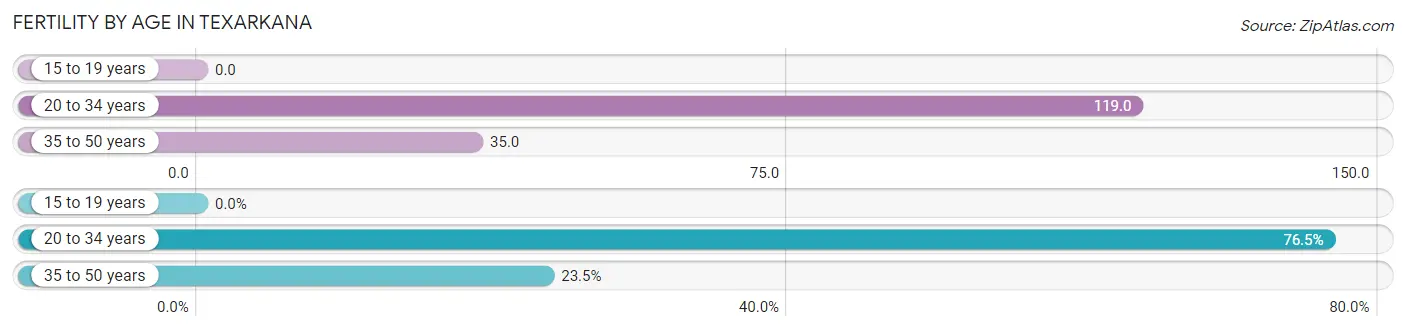
| Age Bracket | Women with Births | Births / 1,000 Women |
| 15 to 19 years | 0 (0.0%) | 0.0 |
| 20 to 34 years | 332 (76.5%) | 119.0 |
| 35 to 50 years | 102 (23.5%) | 35.0 |
| Total | 434 (100.0%) | 64.0 |
Fertility by Age by Marriage Status in Texarkana
53.0% of women with births (434) in Texarkana are married. The highest percentage of unmarried women with births falls into 20 to 34 years age bracket with 50.3% of them unmarried at the time of birth, while the lowest percentage of unmarried women with births belong to 35 to 50 years age bracket with 36.3% of them unmarried.
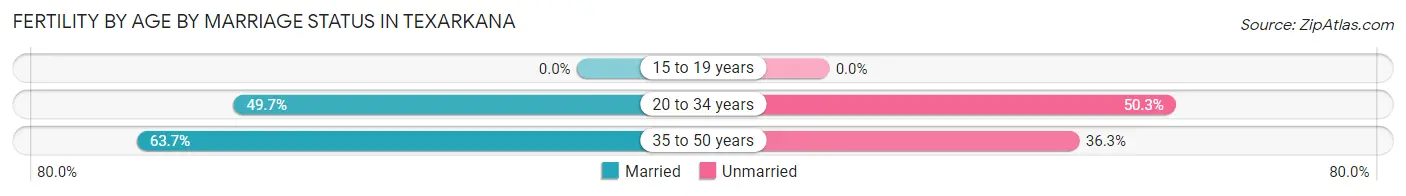
| Age Bracket | Married | Unmarried |
| 15 to 19 years | 0 (0.0%) | 0 (0.0%) |
| 20 to 34 years | 165 (49.7%) | 167 (50.3%) |
| 35 to 50 years | 65 (63.7%) | 37 (36.3%) |
| Total | 230 (53.0%) | 204 (47.0%) |
Fertility by Education in Texarkana
Average fertility rate in Texarkana is 64.0 births per 1,000 women. Women with the education attainment of graduate degree have the highest fertility rate of 119.0 births per 1,000 women, while women with the education attainment of less than high school have the lowest fertility at 48.0 births per 1,000 women. Women with the education attainment of college or associate's degree represent 39.4% of all women with births.
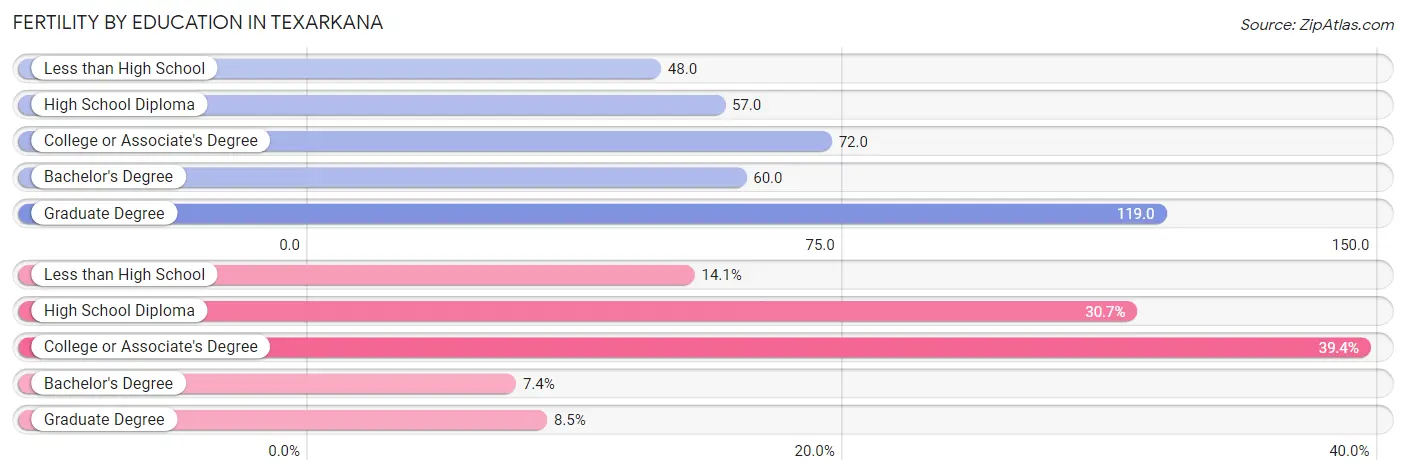
| Educational Attainment | Women with Births | Births / 1,000 Women |
| Less than High School | 61 (14.1%) | 48.0 |
| High School Diploma | 133 (30.6%) | 57.0 |
| College or Associate's Degree | 171 (39.4%) | 72.0 |
| Bachelor's Degree | 32 (7.4%) | 60.0 |
| Graduate Degree | 37 (8.5%) | 119.0 |
| Total | 434 (100.0%) | 64.0 |
Fertility by Education by Marriage Status in Texarkana
47.0% of women with births in Texarkana are unmarried. Women with the educational attainment of graduate degree are most likely to be married with 100.0% of them married at childbirth, while women with the educational attainment of high school diploma are least likely to be married with 71.4% of them unmarried at childbirth.
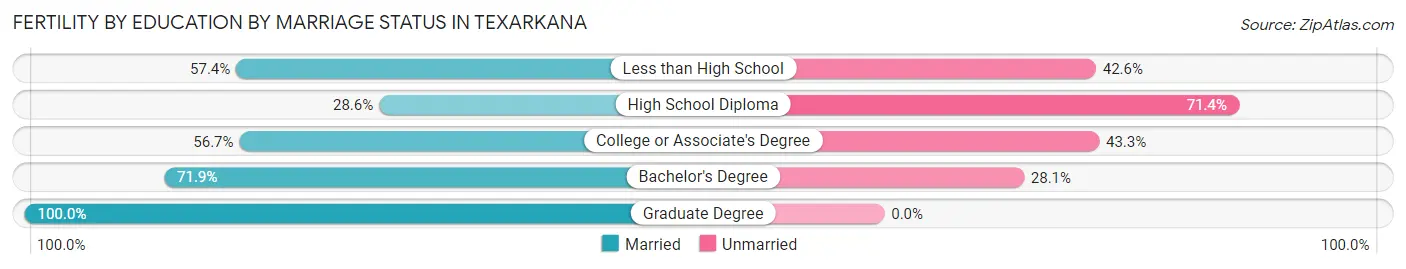
| Educational Attainment | Married | Unmarried |
| Less than High School | 35 (57.4%) | 26 (42.6%) |
| High School Diploma | 38 (28.6%) | 95 (71.4%) |
| College or Associate's Degree | 97 (56.7%) | 74 (43.3%) |
| Bachelor's Degree | 23 (71.9%) | 9 (28.1%) |
| Graduate Degree | 37 (100.0%) | 0 (0.0%) |
| Total | 230 (53.0%) | 204 (47.0%) |
Employment Characteristics in Texarkana
Employment by Class of Employer in Texarkana
Among the 11,361 employed individuals in Texarkana, private company employees (7,733 | 68.1%), local government employees (1,019 | 9.0%), and not-for-profit organizations (801 | 7.0%) make up the most common classes of employment.
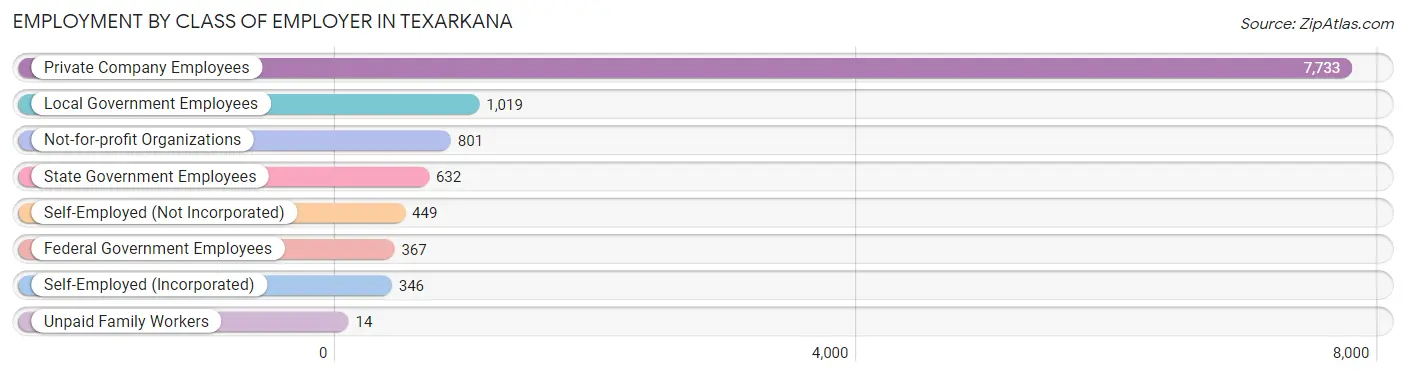
| Employer Class | # Employees | % Employees |
| Private Company Employees | 7,733 | 68.1% |
| Self-Employed (Incorporated) | 346 | 3.0% |
| Self-Employed (Not Incorporated) | 449 | 4.0% |
| Not-for-profit Organizations | 801 | 7.0% |
| Local Government Employees | 1,019 | 9.0% |
| State Government Employees | 632 | 5.6% |
| Federal Government Employees | 367 | 3.2% |
| Unpaid Family Workers | 14 | 0.1% |
| Total | 11,361 | 100.0% |
Employment Status by Age in Texarkana
According to the labor force statistics for Texarkana, out of the total population over 16 years of age (23,324), 53.8% or 12,548 individuals are in the labor force, with 8.3% or 1,041 of them unemployed. The age group with the highest labor force participation rate is 35 to 44 years, with 71.1% or 2,661 individuals in the labor force. Within the labor force, the 16 to 19 years age range has the highest percentage of unemployed individuals, with 51.5% or 316 of them being unemployed.
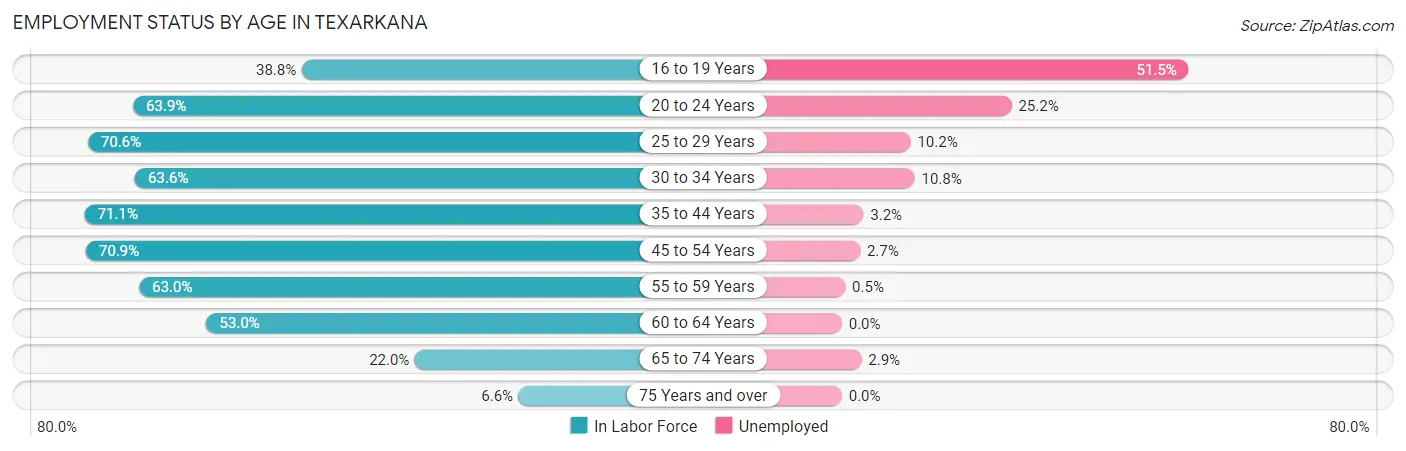
| Age Bracket | In Labor Force | Unemployed |
| 16 to 19 Years | 614 (38.8%) | 316 (51.5%) |
| 20 to 24 Years | 1,023 (63.9%) | 258 (25.2%) |
| 25 to 29 Years | 1,449 (70.6%) | 148 (10.2%) |
| 30 to 34 Years | 1,370 (63.6%) | 148 (10.8%) |
| 35 to 44 Years | 2,661 (71.1%) | 85 (3.2%) |
| 45 to 54 Years | 2,511 (70.9%) | 68 (2.7%) |
| 55 to 59 Years | 1,167 (63.0%) | 6 (0.5%) |
| 60 to 64 Years | 982 (53.0%) | 0 (0.0%) |
| 65 to 74 Years | 649 (22.0%) | 19 (2.9%) |
| 75 Years and over | 132 (6.6%) | 0 (0.0%) |
| Total | 12,548 (53.8%) | 1,041 (8.3%) |
Employment Status by Educational Attainment in Texarkana
According to labor force statistics for Texarkana, 66.7% of individuals (10,135) out of the total population between 25 and 64 years of age (15,195) are in the labor force, with 4.5% or 456 of them being unemployed. The group with the highest labor force participation rate are those with the educational attainment of bachelor's degree or higher, with 84.0% or 1,747 individuals in the labor force. Within the labor force, individuals with less than high school education have the highest percentage of unemployment, with 6.4% or 58 of them being unemployed.
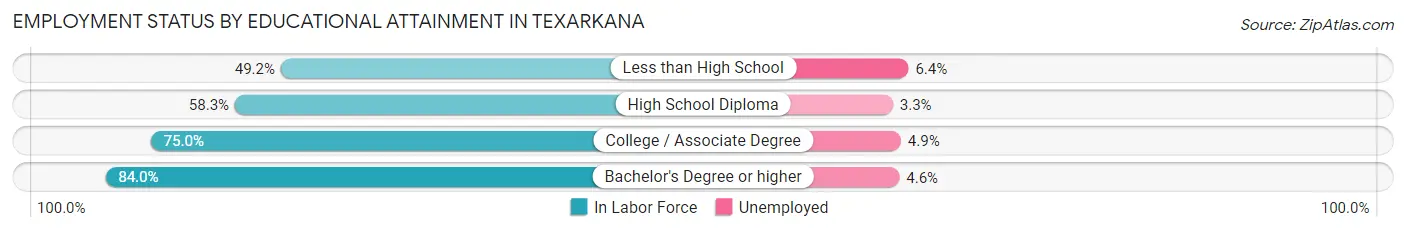
| Educational Attainment | In Labor Force | Unemployed |
| Less than High School | 902 (49.2%) | 117 (6.4%) |
| High School Diploma | 3,405 (58.3%) | 193 (3.3%) |
| College / Associate Degree | 4,081 (75.0%) | 267 (4.9%) |
| Bachelor's Degree or higher | 1,747 (84.0%) | 96 (4.6%) |
| Total | 10,135 (66.7%) | 684 (4.5%) |
Employment Occupations by Sex in Texarkana
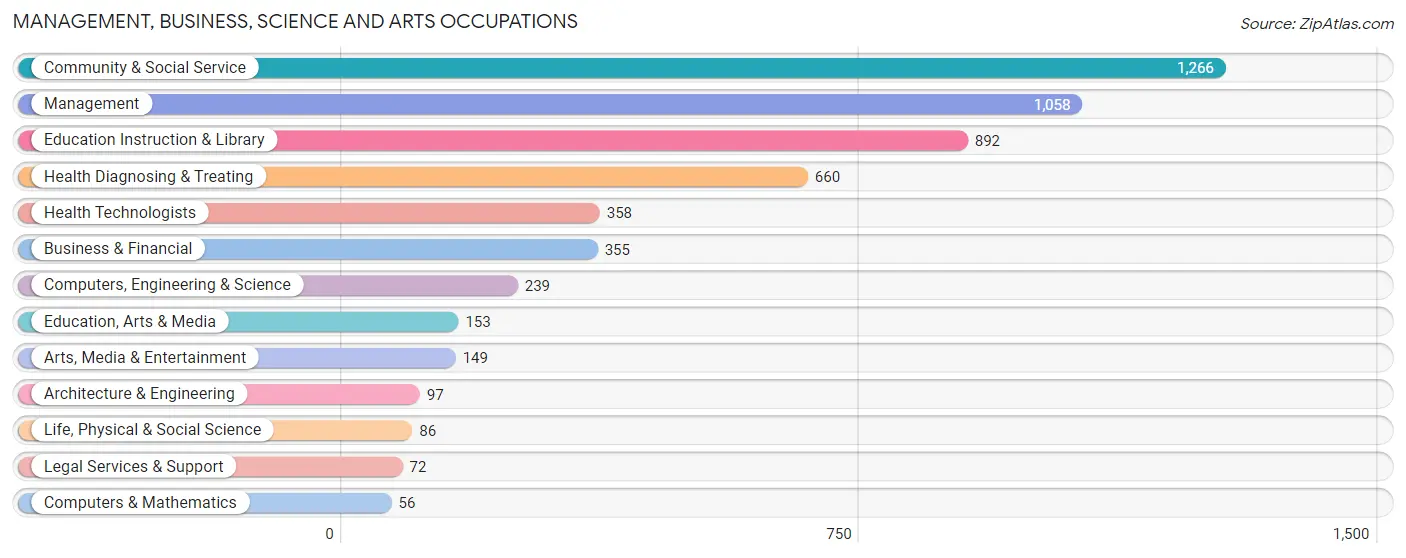
Management, Business, Science and Arts Occupations
The most common Management, Business, Science and Arts occupations in Texarkana are Community & Social Service (1,266 | 11.0%), Management (1,058 | 9.2%), Education Instruction & Library (892 | 7.8%), Health Diagnosing & Treating (660 | 5.7%), and Health Technologists (358 | 3.1%).
Management, Business, Science and Arts Occupations by Sex
Within the Management, Business, Science and Arts occupations in Texarkana, the most male-oriented occupations are Computers & Mathematics (100.0%), Architecture & Engineering (85.6%), and Management (63.0%), while the most female-oriented occupations are Life, Physical & Social Science (100.0%), Education Instruction & Library (88.0%), and Health Diagnosing & Treating (87.9%).
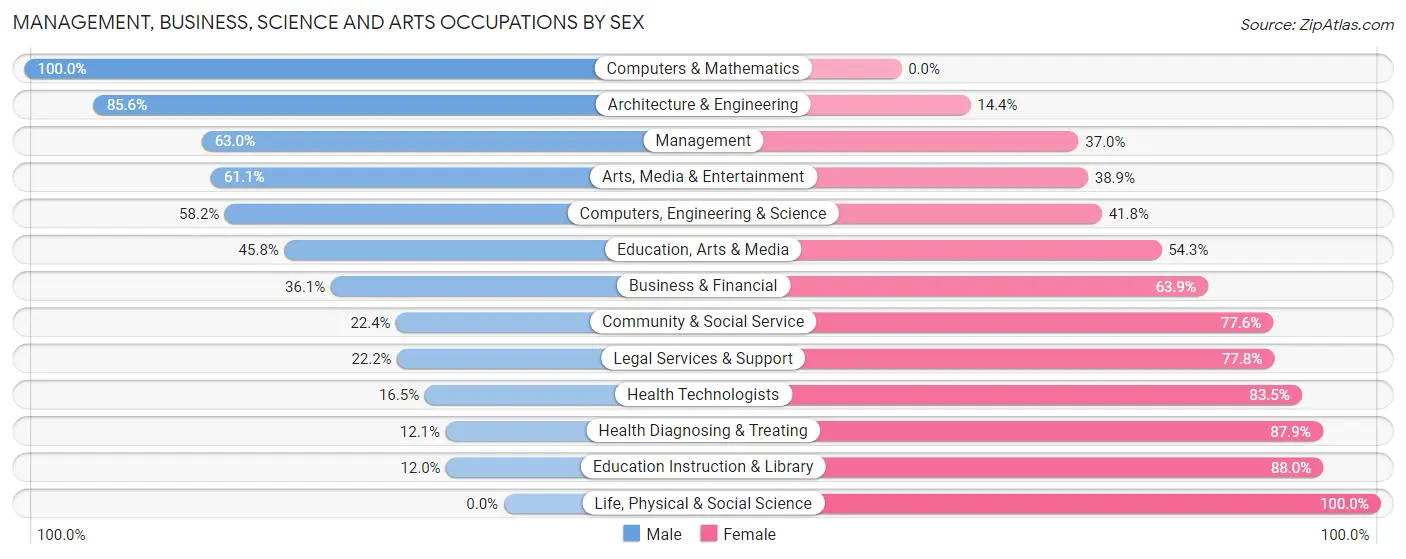
| Occupation | Male | Female |
| Management | 667 (63.0%) | 391 (37.0%) |
| Business & Financial | 128 (36.1%) | 227 (63.9%) |
| Computers, Engineering & Science | 139 (58.2%) | 100 (41.8%) |
| Computers & Mathematics | 56 (100.0%) | 0 (0.0%) |
| Architecture & Engineering | 83 (85.6%) | 14 (14.4%) |
| Life, Physical & Social Science | 0 (0.0%) | 86 (100.0%) |
| Community & Social Service | 284 (22.4%) | 982 (77.6%) |
| Education, Arts & Media | 70 (45.8%) | 83 (54.2%) |
| Legal Services & Support | 16 (22.2%) | 56 (77.8%) |
| Education Instruction & Library | 107 (12.0%) | 785 (88.0%) |
| Arts, Media & Entertainment | 91 (61.1%) | 58 (38.9%) |
| Health Diagnosing & Treating | 80 (12.1%) | 580 (87.9%) |
| Health Technologists | 59 (16.5%) | 299 (83.5%) |
| Total (Category) | 1,298 (36.3%) | 2,280 (63.7%) |
| Total (Overall) | 5,691 (49.5%) | 5,798 (50.5%) |
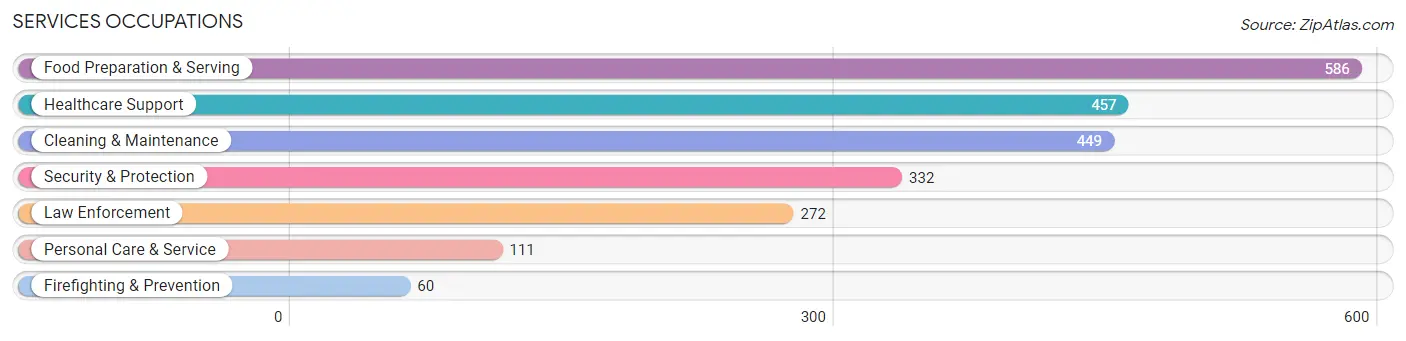
Services Occupations
The most common Services occupations in Texarkana are Food Preparation & Serving (586 | 5.1%), Healthcare Support (457 | 4.0%), Cleaning & Maintenance (449 | 3.9%), Security & Protection (332 | 2.9%), and Law Enforcement (272 | 2.4%).
Services Occupations by Sex
Within the Services occupations in Texarkana, the most male-oriented occupations are Firefighting & Prevention (100.0%), Security & Protection (89.8%), and Law Enforcement (87.5%), while the most female-oriented occupations are Personal Care & Service (94.6%), Healthcare Support (88.8%), and Food Preparation & Serving (79.2%).
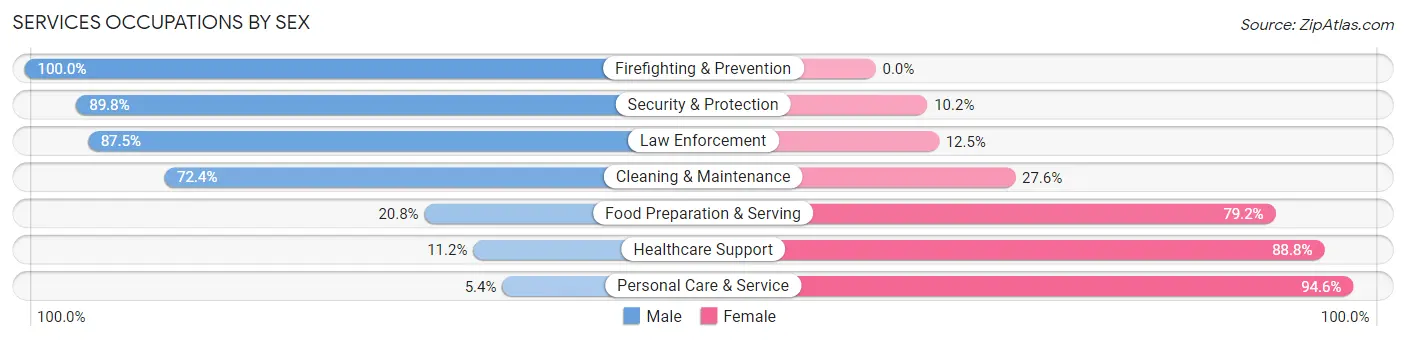
| Occupation | Male | Female |
| Healthcare Support | 51 (11.2%) | 406 (88.8%) |
| Security & Protection | 298 (89.8%) | 34 (10.2%) |
| Firefighting & Prevention | 60 (100.0%) | 0 (0.0%) |
| Law Enforcement | 238 (87.5%) | 34 (12.5%) |
| Food Preparation & Serving | 122 (20.8%) | 464 (79.2%) |
| Cleaning & Maintenance | 325 (72.4%) | 124 (27.6%) |
| Personal Care & Service | 6 (5.4%) | 105 (94.6%) |
| Total (Category) | 802 (41.4%) | 1,133 (58.6%) |
| Total (Overall) | 5,691 (49.5%) | 5,798 (50.5%) |
Sales and Office Occupations
The most common Sales and Office occupations in Texarkana are Office & Administration (1,336 | 11.6%), and Sales & Related (1,305 | 11.4%).

Sales and Office Occupations by Sex

| Occupation | Male | Female |
| Sales & Related | 580 (44.4%) | 725 (55.6%) |
| Office & Administration | 210 (15.7%) | 1,126 (84.3%) |
| Total (Category) | 790 (29.9%) | 1,851 (70.1%) |
| Total (Overall) | 5,691 (49.5%) | 5,798 (50.5%) |
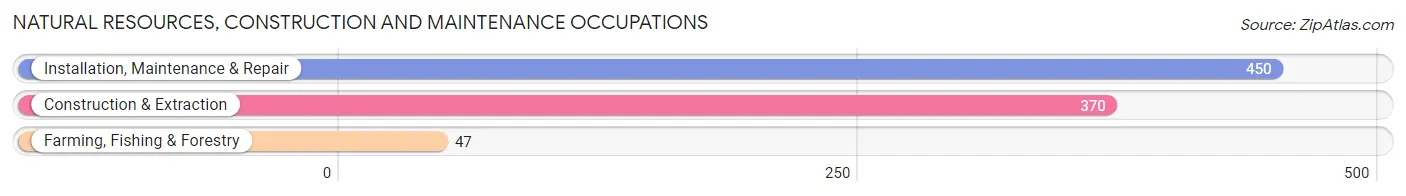
Natural Resources, Construction and Maintenance Occupations
The most common Natural Resources, Construction and Maintenance occupations in Texarkana are Installation, Maintenance & Repair (450 | 3.9%), Construction & Extraction (370 | 3.2%), and Farming, Fishing & Forestry (47 | 0.4%).
Natural Resources, Construction and Maintenance Occupations by Sex
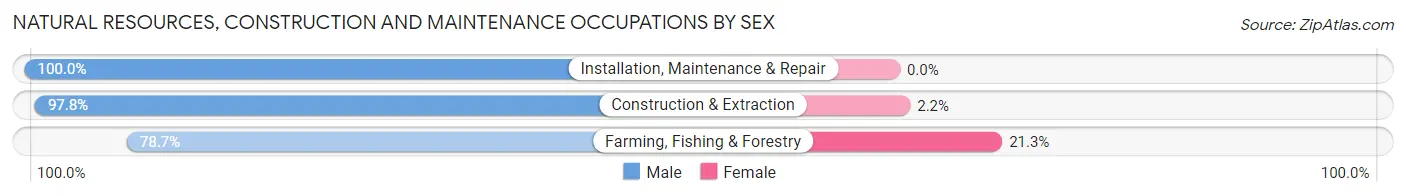
| Occupation | Male | Female |
| Farming, Fishing & Forestry | 37 (78.7%) | 10 (21.3%) |
| Construction & Extraction | 362 (97.8%) | 8 (2.2%) |
| Installation, Maintenance & Repair | 450 (100.0%) | 0 (0.0%) |
| Total (Category) | 849 (97.9%) | 18 (2.1%) |
| Total (Overall) | 5,691 (49.5%) | 5,798 (50.5%) |
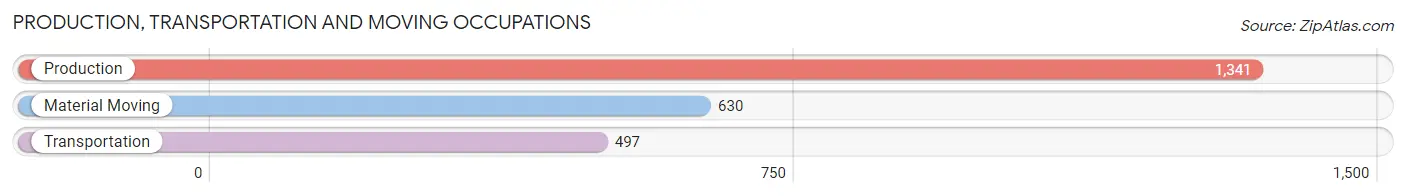
Production, Transportation and Moving Occupations
The most common Production, Transportation and Moving occupations in Texarkana are Production (1,341 | 11.7%), Material Moving (630 | 5.5%), and Transportation (497 | 4.3%).
Production, Transportation and Moving Occupations by Sex
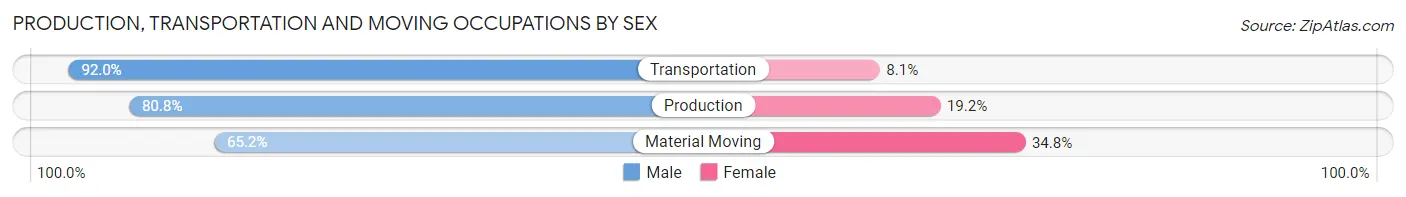
| Occupation | Male | Female |
| Production | 1,084 (80.8%) | 257 (19.2%) |
| Transportation | 457 (91.9%) | 40 (8.1%) |
| Material Moving | 411 (65.2%) | 219 (34.8%) |
| Total (Category) | 1,952 (79.1%) | 516 (20.9%) |
| Total (Overall) | 5,691 (49.5%) | 5,798 (50.5%) |
Employment Industries by Sex in Texarkana
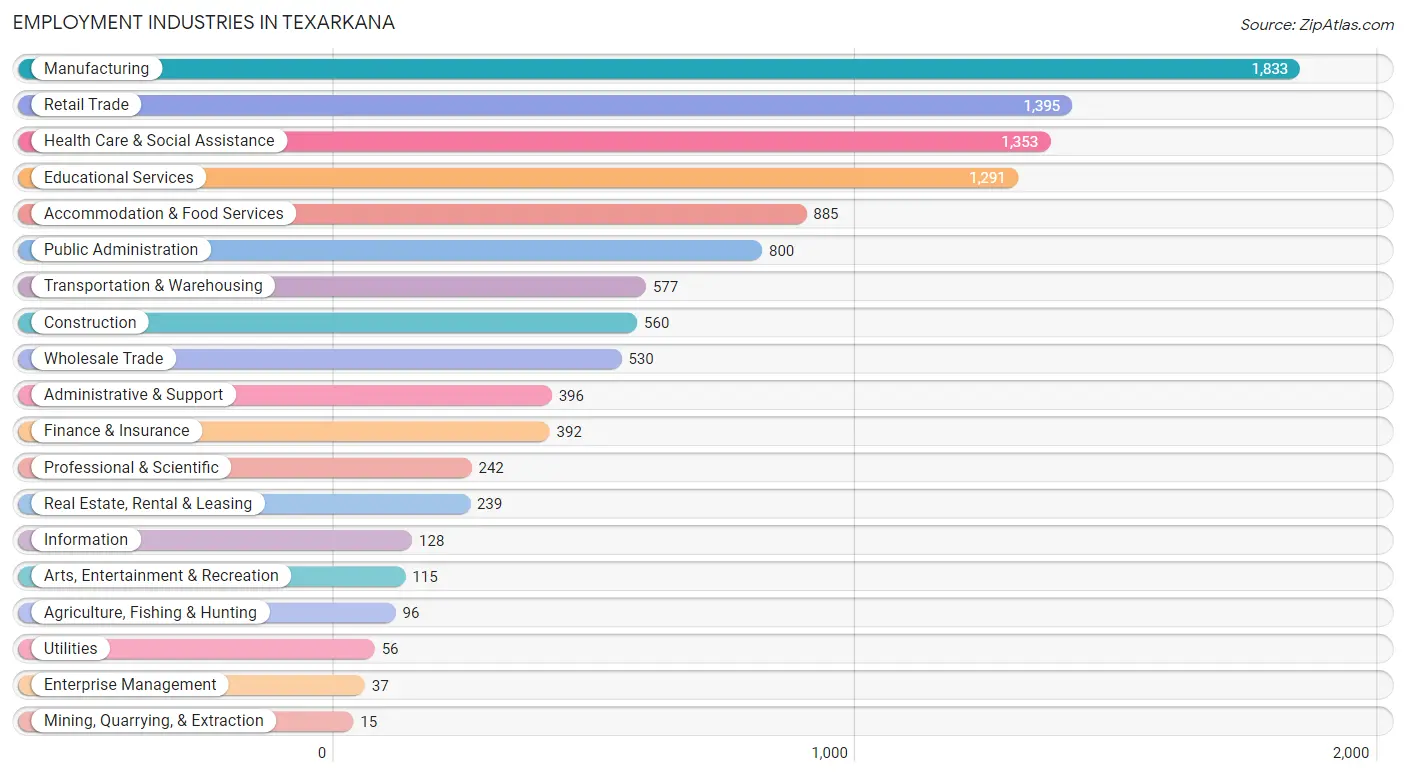
Employment Industries in Texarkana
The major employment industries in Texarkana include Manufacturing (1,833 | 16.0%), Retail Trade (1,395 | 12.1%), Health Care & Social Assistance (1,353 | 11.8%), Educational Services (1,291 | 11.2%), and Accommodation & Food Services (885 | 7.7%).
Employment Industries by Sex in Texarkana
The Texarkana industries that see more men than women are Mining, Quarrying, & Extraction (100.0%), Agriculture, Fishing & Hunting (95.8%), and Construction (95.7%), whereas the industries that tend to have a higher number of women are Enterprise Management (100.0%), Health Care & Social Assistance (80.0%), and Educational Services (77.5%).
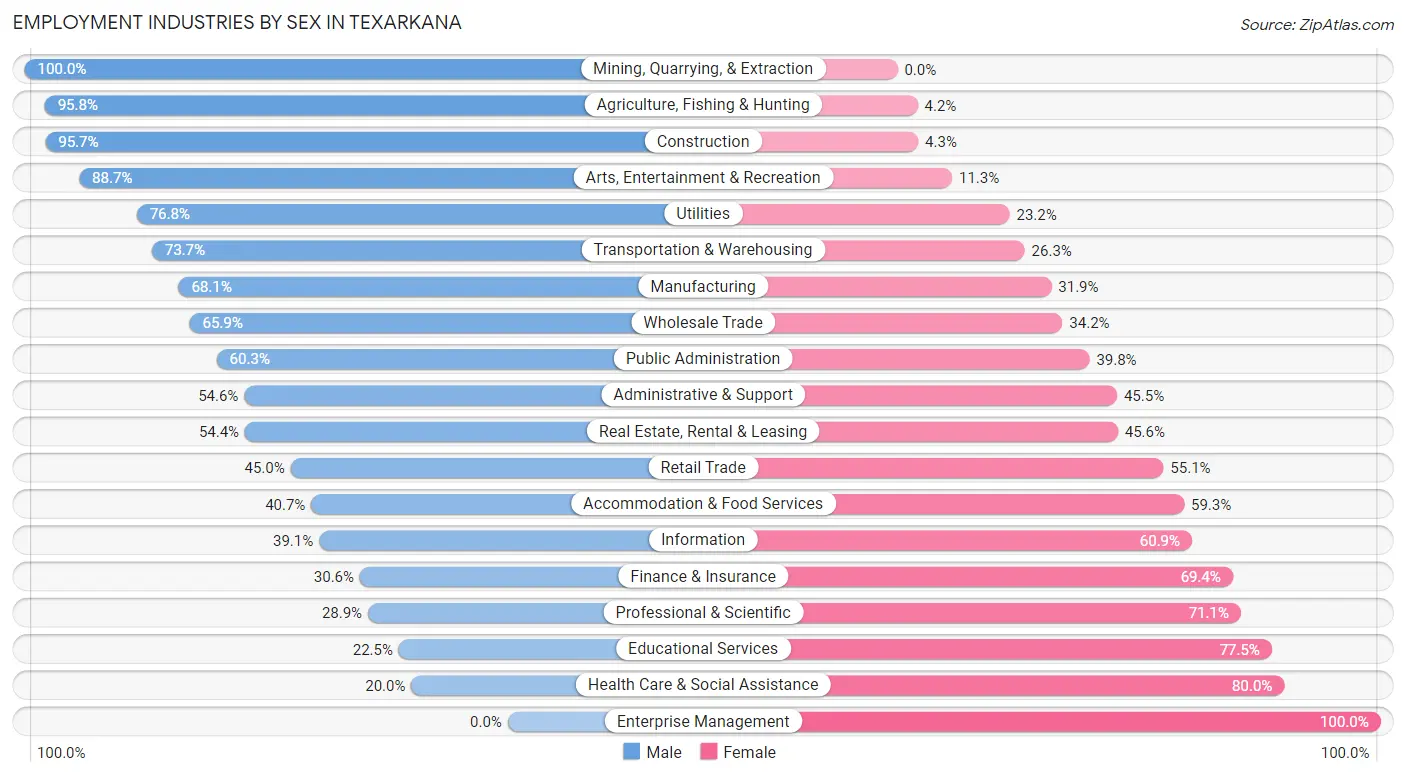
| Industry | Male | Female |
| Agriculture, Fishing & Hunting | 92 (95.8%) | 4 (4.2%) |
| Mining, Quarrying, & Extraction | 15 (100.0%) | 0 (0.0%) |
| Construction | 536 (95.7%) | 24 (4.3%) |
| Manufacturing | 1,249 (68.1%) | 584 (31.9%) |
| Wholesale Trade | 349 (65.8%) | 181 (34.2%) |
| Retail Trade | 627 (45.0%) | 768 (55.0%) |
| Transportation & Warehousing | 425 (73.7%) | 152 (26.3%) |
| Utilities | 43 (76.8%) | 13 (23.2%) |
| Information | 50 (39.1%) | 78 (60.9%) |
| Finance & Insurance | 120 (30.6%) | 272 (69.4%) |
| Real Estate, Rental & Leasing | 130 (54.4%) | 109 (45.6%) |
| Professional & Scientific | 70 (28.9%) | 172 (71.1%) |
| Enterprise Management | 0 (0.0%) | 37 (100.0%) |
| Administrative & Support | 216 (54.5%) | 180 (45.5%) |
| Educational Services | 291 (22.5%) | 1,000 (77.5%) |
| Health Care & Social Assistance | 270 (20.0%) | 1,083 (80.0%) |
| Arts, Entertainment & Recreation | 102 (88.7%) | 13 (11.3%) |
| Accommodation & Food Services | 360 (40.7%) | 525 (59.3%) |
| Public Administration | 482 (60.3%) | 318 (39.8%) |
| Total | 5,691 (49.5%) | 5,798 (50.5%) |
Education in Texarkana
School Enrollment in Texarkana
The most common levels of schooling among the 6,819 students in Texarkana are elementary school (1,644 | 24.1%), middle school (1,591 | 23.3%), and high school (1,484 | 21.8%).
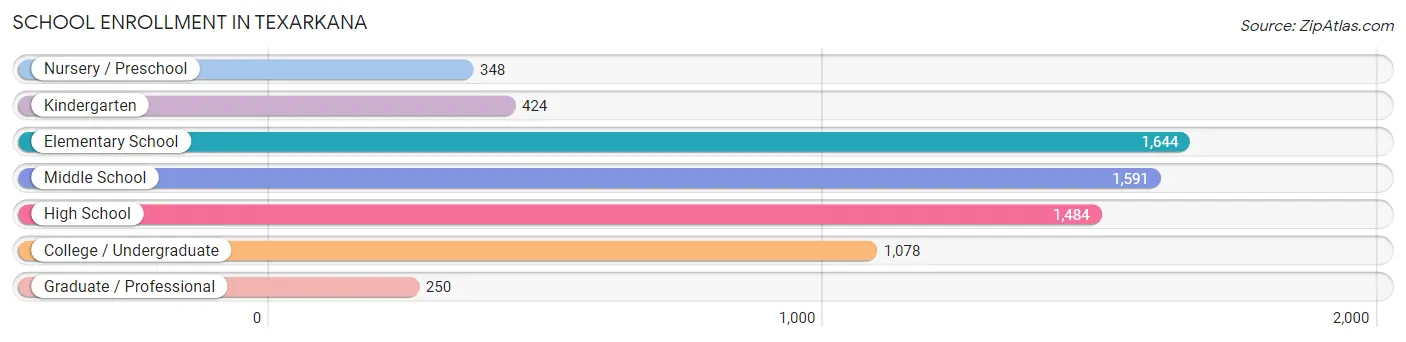
| School Level | # Students | % Students |
| Nursery / Preschool | 348 | 5.1% |
| Kindergarten | 424 | 6.2% |
| Elementary School | 1,644 | 24.1% |
| Middle School | 1,591 | 23.3% |
| High School | 1,484 | 21.8% |
| College / Undergraduate | 1,078 | 15.8% |
| Graduate / Professional | 250 | 3.7% |
| Total | 6,819 | 100.0% |
School Enrollment by Age by Funding Source in Texarkana
Out of a total of 6,819 students who are enrolled in schools in Texarkana, 655 (9.6%) attend a private institution, while the remaining 6,164 (90.4%) are enrolled in public schools. The age group of 20 to 24 year olds has the highest likelihood of being enrolled in private schools, with 76 (35.7% in the age bracket) enrolled. Conversely, the age group of 15 to 17 year olds has the lowest likelihood of being enrolled in a private school, with 996 (94.6% in the age bracket) attending a public institution.
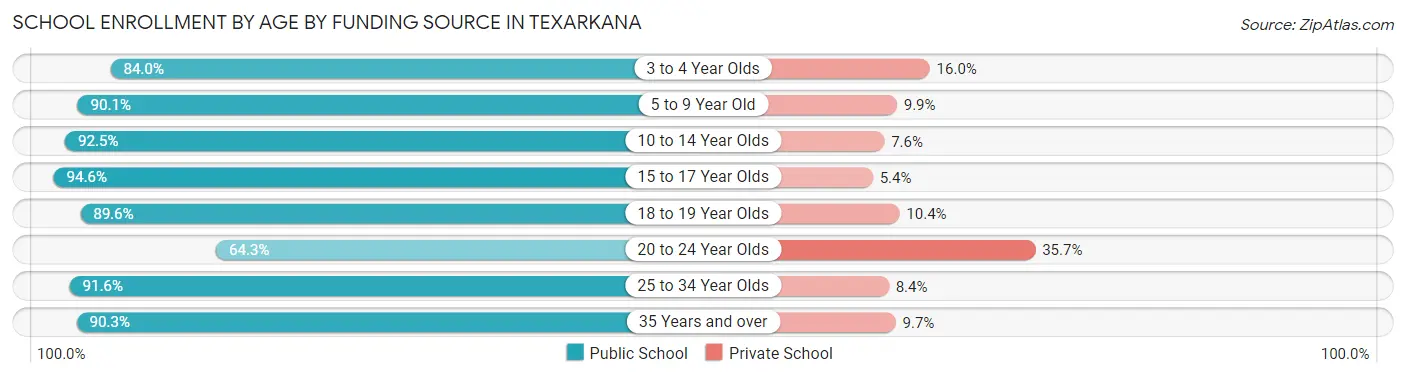
| Age Bracket | Public School | Private School |
| 3 to 4 Year Olds | 304 (84.0%) | 58 (16.0%) |
| 5 to 9 Year Old | 1,703 (90.1%) | 187 (9.9%) |
| 10 to 14 Year Olds | 1,813 (92.4%) | 148 (7.5%) |
| 15 to 17 Year Olds | 996 (94.6%) | 57 (5.4%) |
| 18 to 19 Year Olds | 406 (89.6%) | 47 (10.4%) |
| 20 to 24 Year Olds | 137 (64.3%) | 76 (35.7%) |
| 25 to 34 Year Olds | 415 (91.6%) | 38 (8.4%) |
| 35 Years and over | 392 (90.3%) | 42 (9.7%) |
| Total | 6,164 (90.4%) | 655 (9.6%) |
Educational Attainment by Field of Study in Texarkana
Education (785 | 23.3%), business (783 | 23.3%), science & technology (254 | 7.5%), psychology (221 | 6.6%), and arts & humanities (221 | 6.6%) are the most common fields of study among 3,363 individuals in Texarkana who have obtained a bachelor's degree or higher.
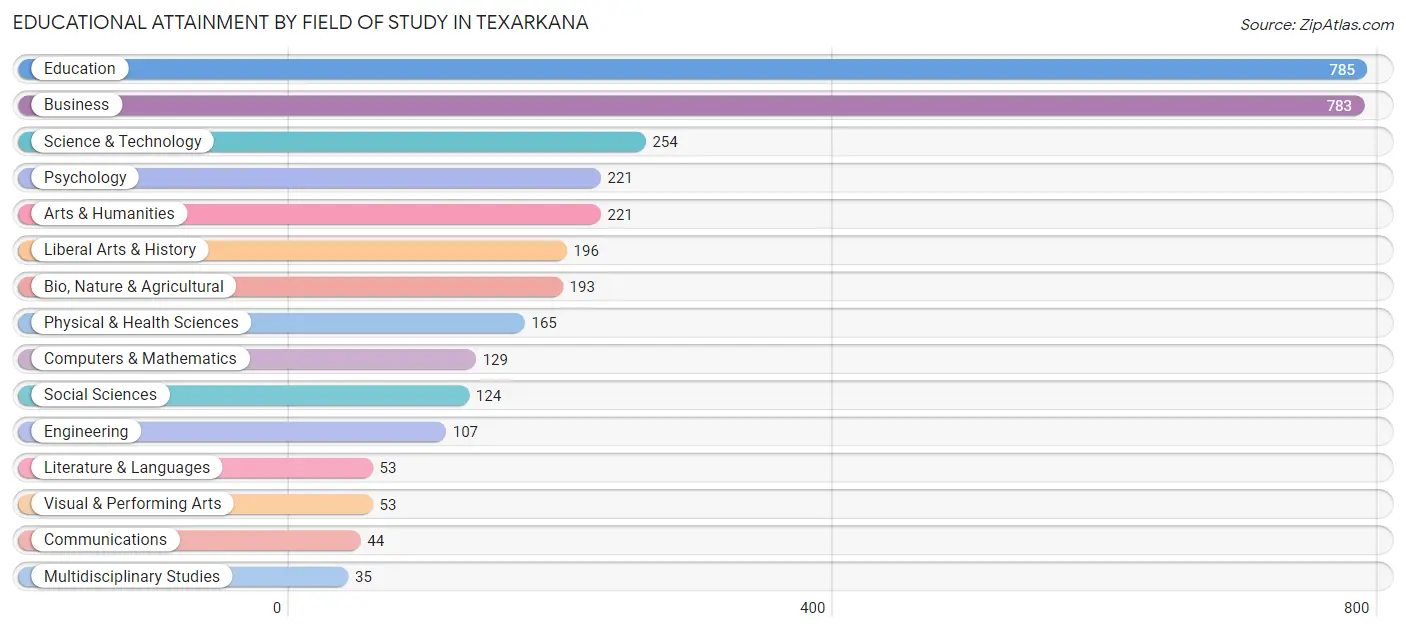
| Field of Study | # Graduates | % Graduates |
| Computers & Mathematics | 129 | 3.8% |
| Bio, Nature & Agricultural | 193 | 5.7% |
| Physical & Health Sciences | 165 | 4.9% |
| Psychology | 221 | 6.6% |
| Social Sciences | 124 | 3.7% |
| Engineering | 107 | 3.2% |
| Multidisciplinary Studies | 35 | 1.0% |
| Science & Technology | 254 | 7.5% |
| Business | 783 | 23.3% |
| Education | 785 | 23.3% |
| Literature & Languages | 53 | 1.6% |
| Liberal Arts & History | 196 | 5.8% |
| Visual & Performing Arts | 53 | 1.6% |
| Communications | 44 | 1.3% |
| Arts & Humanities | 221 | 6.6% |
| Total | 3,363 | 100.0% |
Transportation & Commute in Texarkana
Vehicle Availability by Sex in Texarkana
The most prevalent vehicle ownership categories in Texarkana are males with 2 vehicles (2,636, accounting for 46.6%) and females with 2 vehicles (1,821, making up 46.7%).
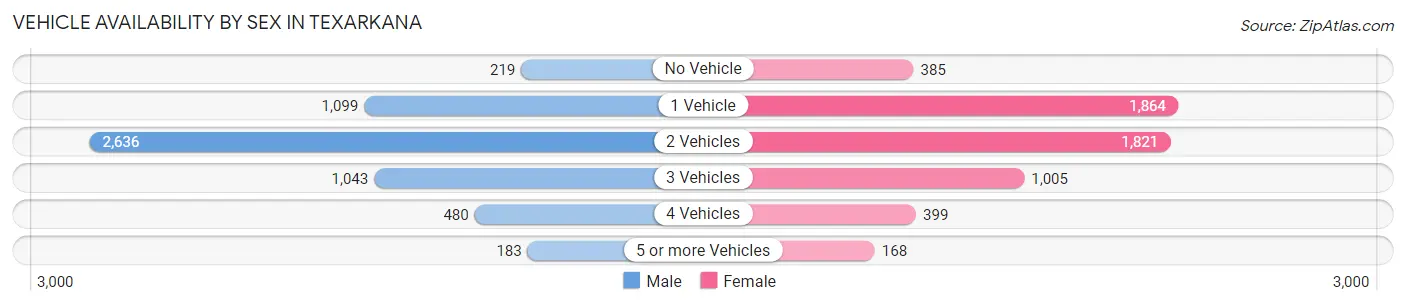
| Vehicles Available | Male | Female |
| No Vehicle | 219 (3.9%) | 385 (6.8%) |
| 1 Vehicle | 1,099 (19.4%) | 1,864 (33.0%) |
| 2 Vehicles | 2,636 (46.6%) | 1,821 (32.3%) |
| 3 Vehicles | 1,043 (18.4%) | 1,005 (17.8%) |
| 4 Vehicles | 480 (8.5%) | 399 (7.1%) |
| 5 or more Vehicles | 183 (3.2%) | 168 (3.0%) |
| Total | 5,660 (100.0%) | 5,642 (100.0%) |
Commute Time in Texarkana
The most frequently occuring commute durations in Texarkana are 15 to 19 minutes (2,894 commuters, 26.3%), 10 to 14 minutes (2,890 commuters, 26.2%), and 5 to 9 minutes (1,722 commuters, 15.6%).
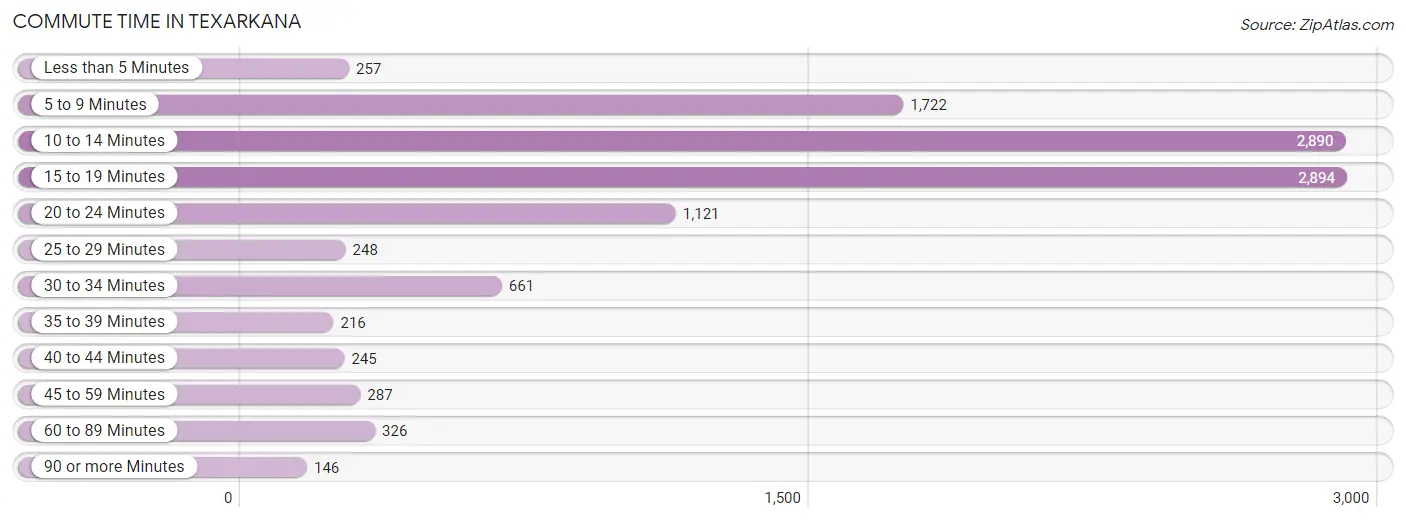
| Commute Time | # Commuters | % Commuters |
| Less than 5 Minutes | 257 | 2.3% |
| 5 to 9 Minutes | 1,722 | 15.6% |
| 10 to 14 Minutes | 2,890 | 26.2% |
| 15 to 19 Minutes | 2,894 | 26.3% |
| 20 to 24 Minutes | 1,121 | 10.2% |
| 25 to 29 Minutes | 248 | 2.2% |
| 30 to 34 Minutes | 661 | 6.0% |
| 35 to 39 Minutes | 216 | 2.0% |
| 40 to 44 Minutes | 245 | 2.2% |
| 45 to 59 Minutes | 287 | 2.6% |
| 60 to 89 Minutes | 326 | 3.0% |
| 90 or more Minutes | 146 | 1.3% |
Commute Time by Sex in Texarkana
The most common commute times in Texarkana are 15 to 19 minutes (1,367 commuters, 24.7%) for males and 10 to 14 minutes (1,583 commuters, 28.9%) for females.
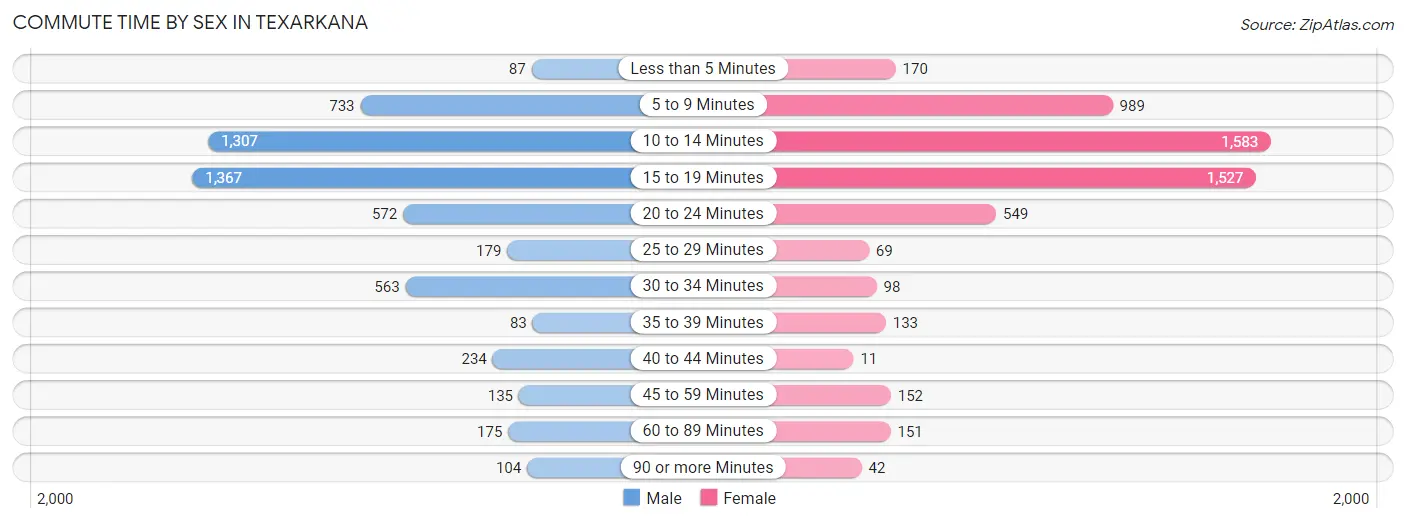
| Commute Time | Male | Female |
| Less than 5 Minutes | 87 (1.6%) | 170 (3.1%) |
| 5 to 9 Minutes | 733 (13.2%) | 989 (18.1%) |
| 10 to 14 Minutes | 1,307 (23.6%) | 1,583 (28.9%) |
| 15 to 19 Minutes | 1,367 (24.7%) | 1,527 (27.9%) |
| 20 to 24 Minutes | 572 (10.3%) | 549 (10.0%) |
| 25 to 29 Minutes | 179 (3.2%) | 69 (1.3%) |
| 30 to 34 Minutes | 563 (10.2%) | 98 (1.8%) |
| 35 to 39 Minutes | 83 (1.5%) | 133 (2.4%) |
| 40 to 44 Minutes | 234 (4.2%) | 11 (0.2%) |
| 45 to 59 Minutes | 135 (2.4%) | 152 (2.8%) |
| 60 to 89 Minutes | 175 (3.2%) | 151 (2.8%) |
| 90 or more Minutes | 104 (1.9%) | 42 (0.8%) |
Time of Departure to Work by Sex in Texarkana
The most frequent times of departure to work in Texarkana are 7:00 AM to 7:29 AM (1,140, 20.6%) for males and 7:30 AM to 7:59 AM (1,471, 26.9%) for females.
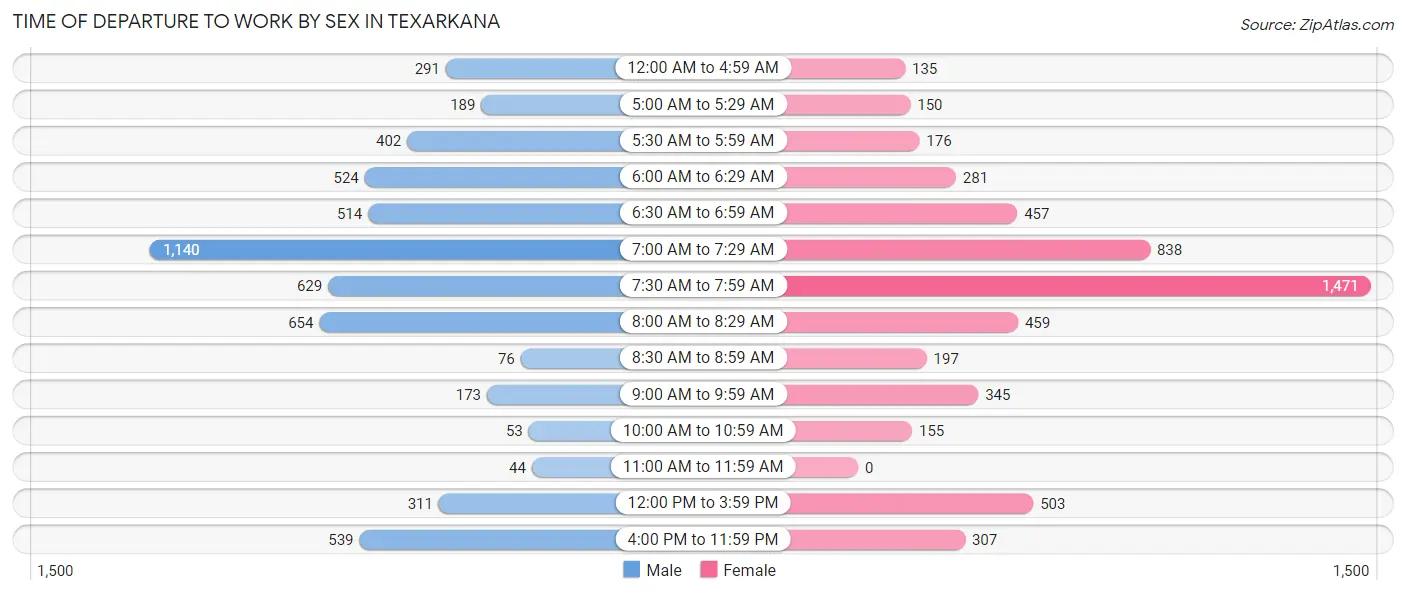
| Time of Departure | Male | Female |
| 12:00 AM to 4:59 AM | 291 (5.2%) | 135 (2.5%) |
| 5:00 AM to 5:29 AM | 189 (3.4%) | 150 (2.7%) |
| 5:30 AM to 5:59 AM | 402 (7.3%) | 176 (3.2%) |
| 6:00 AM to 6:29 AM | 524 (9.5%) | 281 (5.1%) |
| 6:30 AM to 6:59 AM | 514 (9.3%) | 457 (8.4%) |
| 7:00 AM to 7:29 AM | 1,140 (20.6%) | 838 (15.3%) |
| 7:30 AM to 7:59 AM | 629 (11.4%) | 1,471 (26.9%) |
| 8:00 AM to 8:29 AM | 654 (11.8%) | 459 (8.4%) |
| 8:30 AM to 8:59 AM | 76 (1.4%) | 197 (3.6%) |
| 9:00 AM to 9:59 AM | 173 (3.1%) | 345 (6.3%) |
| 10:00 AM to 10:59 AM | 53 (1.0%) | 155 (2.8%) |
| 11:00 AM to 11:59 AM | 44 (0.8%) | 0 (0.0%) |
| 12:00 PM to 3:59 PM | 311 (5.6%) | 503 (9.2%) |
| 4:00 PM to 11:59 PM | 539 (9.7%) | 307 (5.6%) |
| Total | 5,539 (100.0%) | 5,474 (100.0%) |
Housing Occupancy in Texarkana
Occupancy by Ownership in Texarkana
Of the total 11,077 dwellings in Texarkana, owner-occupied units account for 6,328 (57.1%), while renter-occupied units make up 4,749 (42.9%).
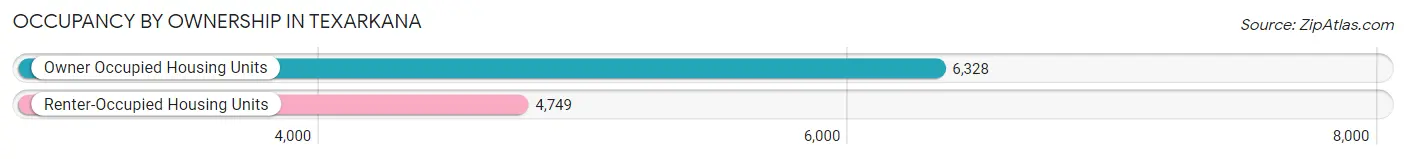
| Occupancy | # Housing Units | % Housing Units |
| Owner Occupied Housing Units | 6,328 | 57.1% |
| Renter-Occupied Housing Units | 4,749 | 42.9% |
| Total Occupied Housing Units | 11,077 | 100.0% |
Occupancy by Household Size in Texarkana
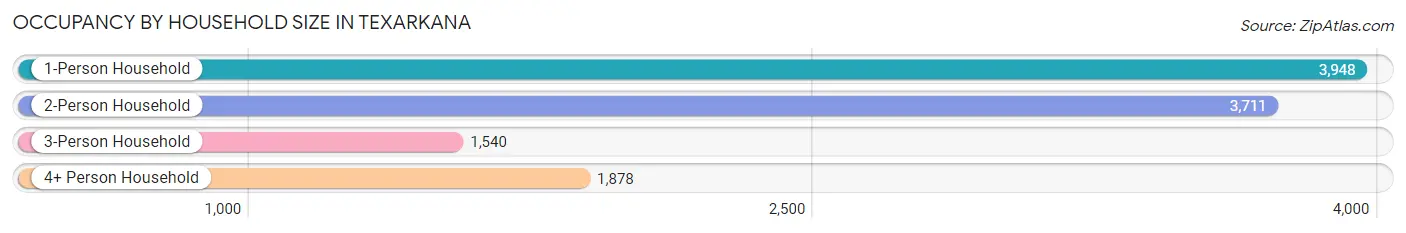
| Household Size | # Housing Units | % Housing Units |
| 1-Person Household | 3,948 | 35.6% |
| 2-Person Household | 3,711 | 33.5% |
| 3-Person Household | 1,540 | 13.9% |
| 4+ Person Household | 1,878 | 17.0% |
| Total Housing Units | 11,077 | 100.0% |
Occupancy by Ownership by Household Size in Texarkana
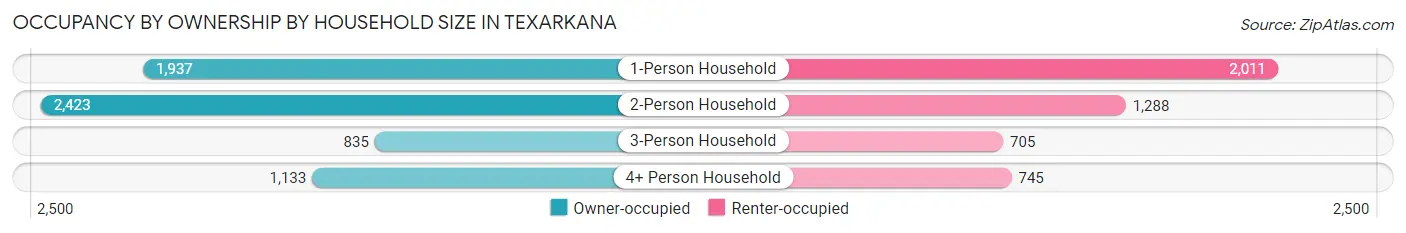
| Household Size | Owner-occupied | Renter-occupied |
| 1-Person Household | 1,937 (49.1%) | 2,011 (50.9%) |
| 2-Person Household | 2,423 (65.3%) | 1,288 (34.7%) |
| 3-Person Household | 835 (54.2%) | 705 (45.8%) |
| 4+ Person Household | 1,133 (60.3%) | 745 (39.7%) |
| Total Housing Units | 6,328 (57.1%) | 4,749 (42.9%) |
Occupancy by Educational Attainment in Texarkana
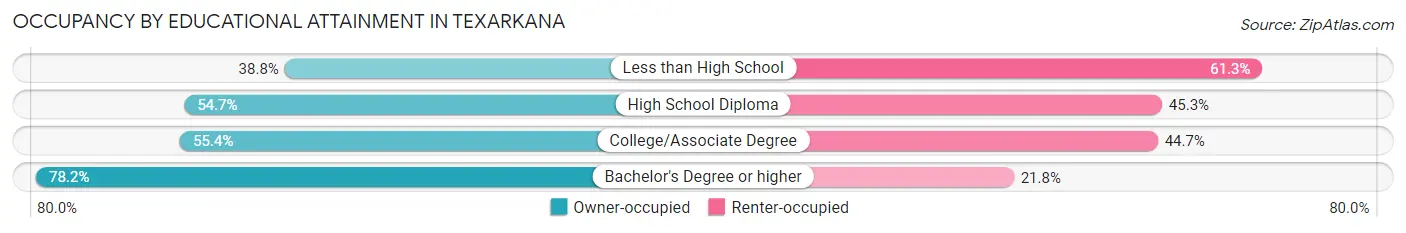
| Household Size | Owner-occupied | Renter-occupied |
| Less than High School | 477 (38.8%) | 754 (61.3%) |
| High School Diploma | 1,932 (54.7%) | 1,601 (45.3%) |
| College/Associate Degree | 2,464 (55.3%) | 1,988 (44.7%) |
| Bachelor's Degree or higher | 1,455 (78.2%) | 406 (21.8%) |
Occupancy by Age of Householder in Texarkana
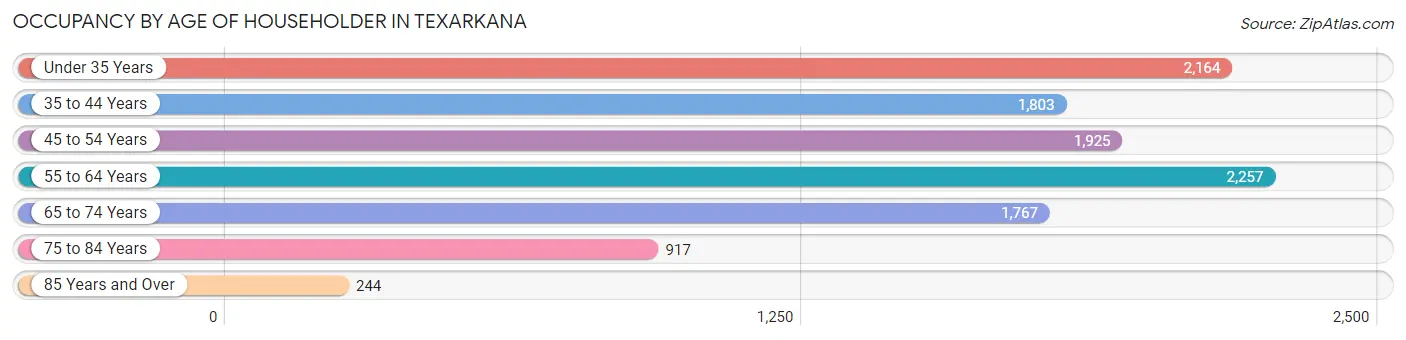
| Age Bracket | # Households | % Households |
| Under 35 Years | 2,164 | 19.5% |
| 35 to 44 Years | 1,803 | 16.3% |
| 45 to 54 Years | 1,925 | 17.4% |
| 55 to 64 Years | 2,257 | 20.4% |
| 65 to 74 Years | 1,767 | 16.0% |
| 75 to 84 Years | 917 | 8.3% |
| 85 Years and Over | 244 | 2.2% |
| Total | 11,077 | 100.0% |
Housing Finances in Texarkana
Median Income by Occupancy in Texarkana
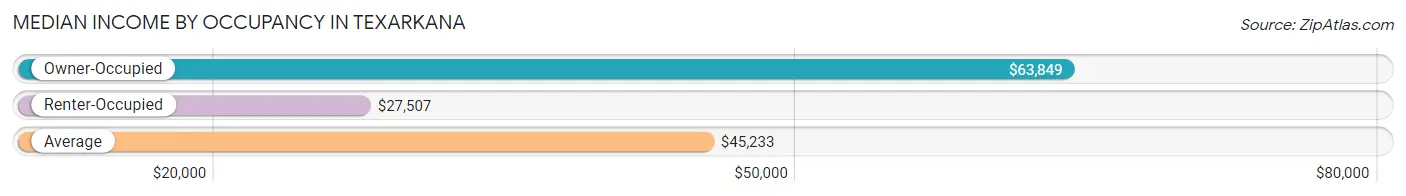
| Occupancy Type | # Households | Median Income |
| Owner-Occupied | 6,328 (57.1%) | $63,849 |
| Renter-Occupied | 4,749 (42.9%) | $27,507 |
| Average | 11,077 (100.0%) | $45,233 |
Occupancy by Householder Income Bracket in Texarkana
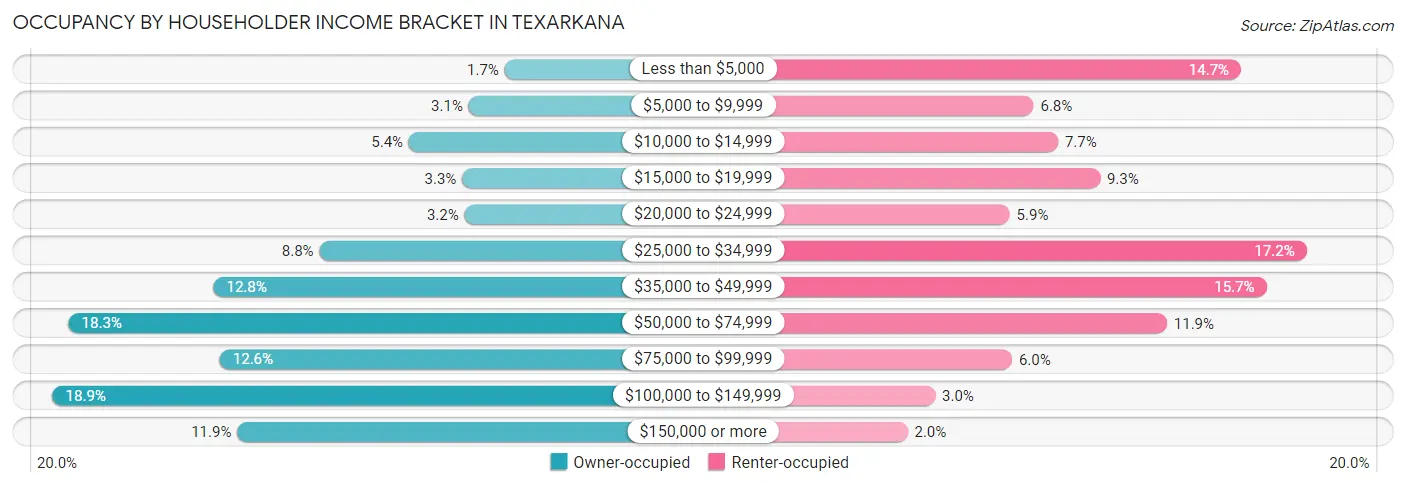
| Income Bracket | Owner-occupied | Renter-occupied |
| Less than $5,000 | 108 (1.7%) | 697 (14.7%) |
| $5,000 to $9,999 | 195 (3.1%) | 322 (6.8%) |
| $10,000 to $14,999 | 339 (5.4%) | 366 (7.7%) |
| $15,000 to $19,999 | 211 (3.3%) | 442 (9.3%) |
| $20,000 to $24,999 | 205 (3.2%) | 279 (5.9%) |
| $25,000 to $34,999 | 555 (8.8%) | 816 (17.2%) |
| $35,000 to $49,999 | 810 (12.8%) | 743 (15.7%) |
| $50,000 to $74,999 | 1,159 (18.3%) | 563 (11.9%) |
| $75,000 to $99,999 | 795 (12.6%) | 283 (6.0%) |
| $100,000 to $149,999 | 1,198 (18.9%) | 144 (3.0%) |
| $150,000 or more | 753 (11.9%) | 94 (2.0%) |
| Total | 6,328 (100.0%) | 4,749 (100.0%) |
Monthly Housing Cost Tiers in Texarkana
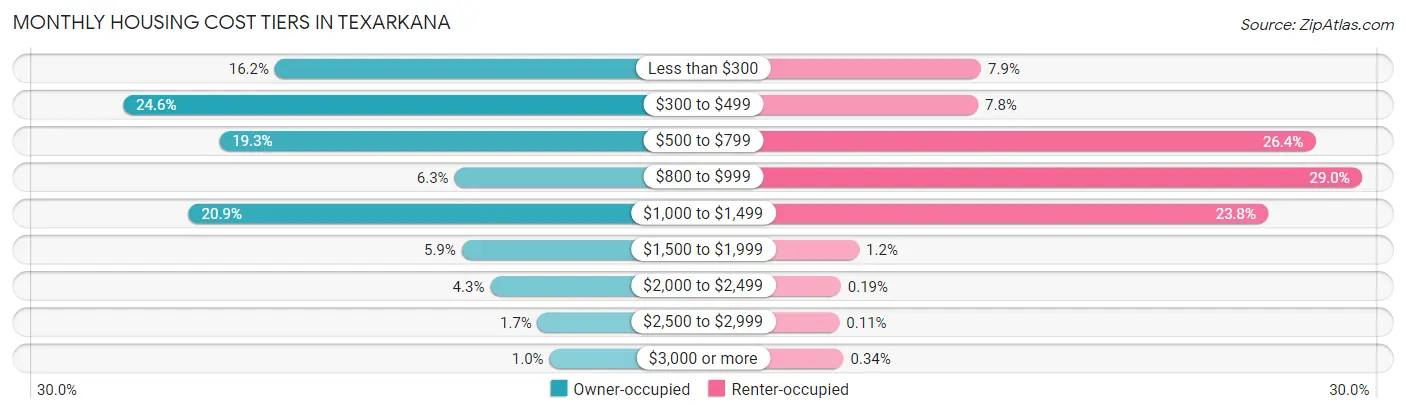
| Monthly Cost | Owner-occupied | Renter-occupied |
| Less than $300 | 1,024 (16.2%) | 377 (7.9%) |
| $300 to $499 | 1,554 (24.6%) | 369 (7.8%) |
| $500 to $799 | 1,218 (19.3%) | 1,253 (26.4%) |
| $800 to $999 | 396 (6.3%) | 1,375 (28.9%) |
| $1,000 to $1,499 | 1,325 (20.9%) | 1,129 (23.8%) |
| $1,500 to $1,999 | 371 (5.9%) | 57 (1.2%) |
| $2,000 to $2,499 | 271 (4.3%) | 9 (0.2%) |
| $2,500 to $2,999 | 105 (1.7%) | 5 (0.1%) |
| $3,000 or more | 64 (1.0%) | 16 (0.3%) |
| Total | 6,328 (100.0%) | 4,749 (100.0%) |
Physical Housing Characteristics in Texarkana
Housing Structures in Texarkana
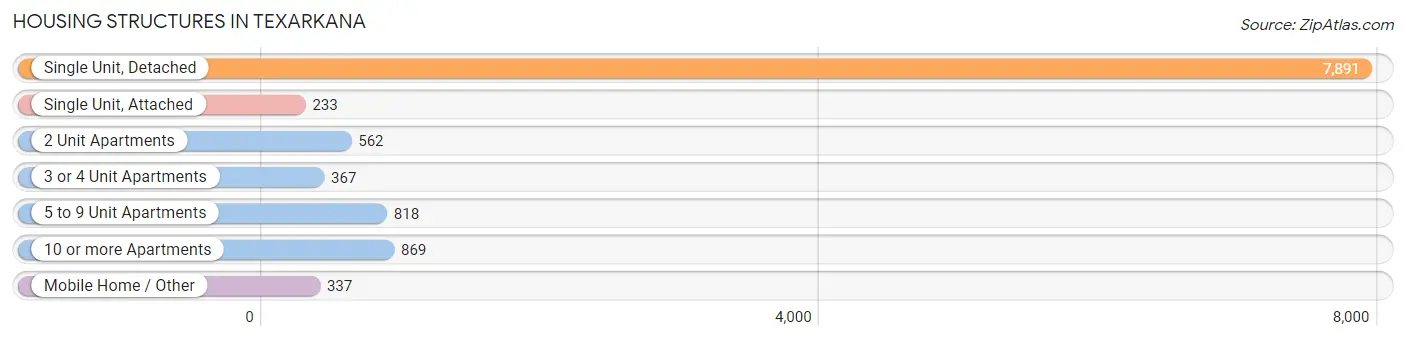
| Structure Type | # Housing Units | % Housing Units |
| Single Unit, Detached | 7,891 | 71.2% |
| Single Unit, Attached | 233 | 2.1% |
| 2 Unit Apartments | 562 | 5.1% |
| 3 or 4 Unit Apartments | 367 | 3.3% |
| 5 to 9 Unit Apartments | 818 | 7.4% |
| 10 or more Apartments | 869 | 7.9% |
| Mobile Home / Other | 337 | 3.0% |
| Total | 11,077 | 100.0% |
Housing Structures by Occupancy in Texarkana
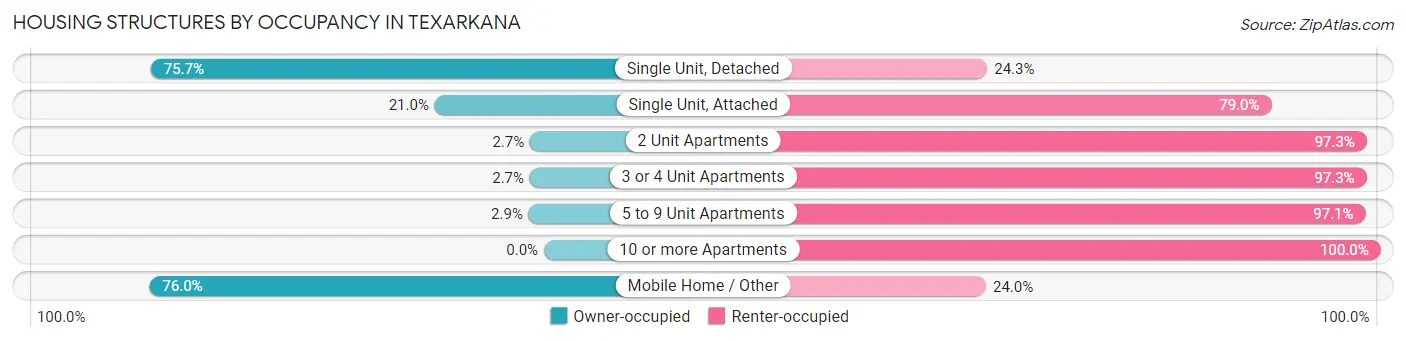
| Structure Type | Owner-occupied | Renter-occupied |
| Single Unit, Detached | 5,974 (75.7%) | 1,917 (24.3%) |
| Single Unit, Attached | 49 (21.0%) | 184 (79.0%) |
| 2 Unit Apartments | 15 (2.7%) | 547 (97.3%) |
| 3 or 4 Unit Apartments | 10 (2.7%) | 357 (97.3%) |
| 5 to 9 Unit Apartments | 24 (2.9%) | 794 (97.1%) |
| 10 or more Apartments | 0 (0.0%) | 869 (100.0%) |
| Mobile Home / Other | 256 (76.0%) | 81 (24.0%) |
| Total | 6,328 (57.1%) | 4,749 (42.9%) |
Housing Structures by Number of Rooms in Texarkana
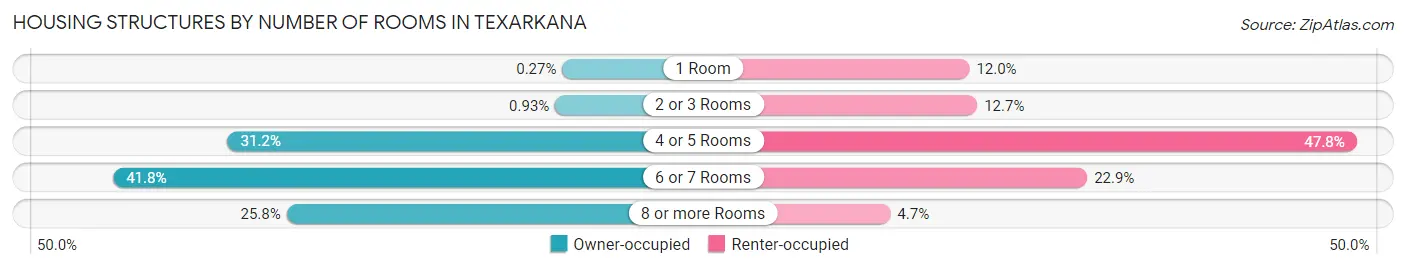
| Number of Rooms | Owner-occupied | Renter-occupied |
| 1 Room | 17 (0.3%) | 569 (12.0%) |
| 2 or 3 Rooms | 59 (0.9%) | 603 (12.7%) |
| 4 or 5 Rooms | 1,976 (31.2%) | 2,269 (47.8%) |
| 6 or 7 Rooms | 2,645 (41.8%) | 1,086 (22.9%) |
| 8 or more Rooms | 1,631 (25.8%) | 222 (4.7%) |
| Total | 6,328 (100.0%) | 4,749 (100.0%) |
Housing Structure by Heating Type in Texarkana
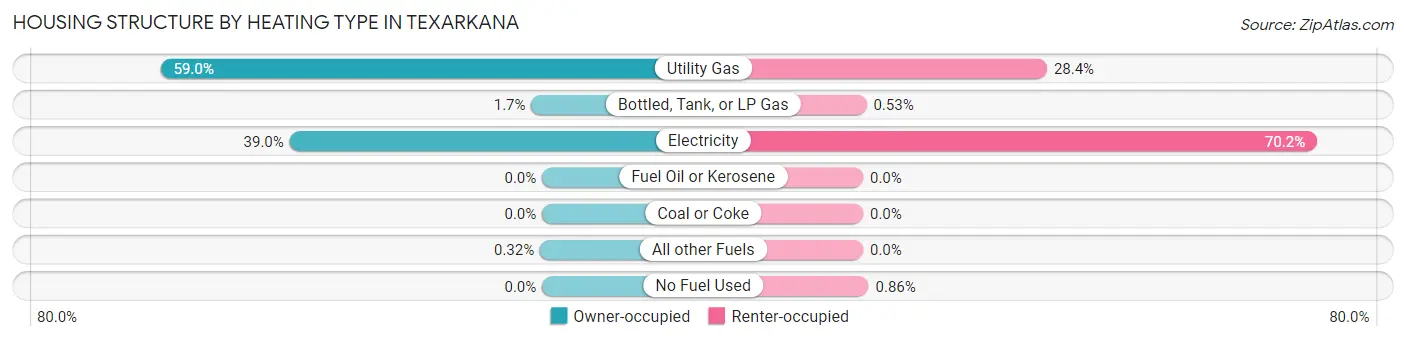
| Heating Type | Owner-occupied | Renter-occupied |
| Utility Gas | 3,733 (59.0%) | 1,350 (28.4%) |
| Bottled, Tank, or LP Gas | 105 (1.7%) | 25 (0.5%) |
| Electricity | 2,470 (39.0%) | 3,333 (70.2%) |
| Fuel Oil or Kerosene | 0 (0.0%) | 0 (0.0%) |
| Coal or Coke | 0 (0.0%) | 0 (0.0%) |
| All other Fuels | 20 (0.3%) | 0 (0.0%) |
| No Fuel Used | 0 (0.0%) | 41 (0.9%) |
| Total | 6,328 (100.0%) | 4,749 (100.0%) |
Household Vehicle Usage in Texarkana
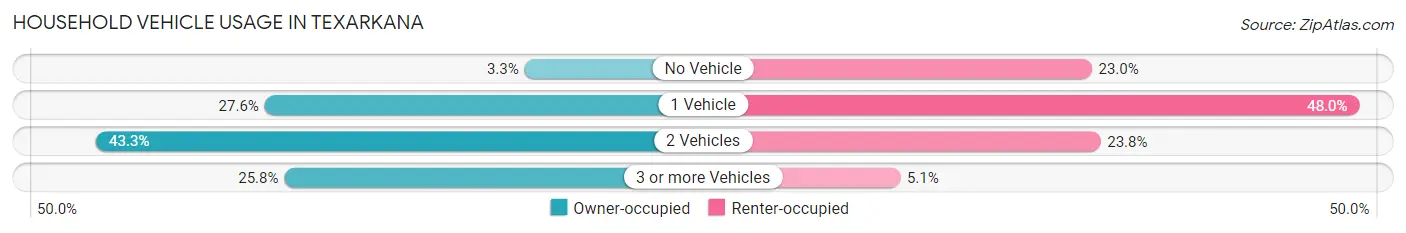
| Vehicles per Household | Owner-occupied | Renter-occupied |
| No Vehicle | 211 (3.3%) | 1,093 (23.0%) |
| 1 Vehicle | 1,746 (27.6%) | 2,280 (48.0%) |
| 2 Vehicles | 2,741 (43.3%) | 1,132 (23.8%) |
| 3 or more Vehicles | 1,630 (25.8%) | 244 (5.1%) |
| Total | 6,328 (100.0%) | 4,749 (100.0%) |
Real Estate & Mortgages in Texarkana
Real Estate and Mortgage Overview in Texarkana
| Characteristic | Without Mortgage | With Mortgage |
| Housing Units | 3,624 | 2,704 |
| Median Property Value | $133,400 | $168,400 |
| Median Household Income | $50,970 | $400 |
| Monthly Housing Costs | $412 | $56 |
| Real Estate Taxes | $804 | $247 |
Property Value by Mortgage Status in Texarkana
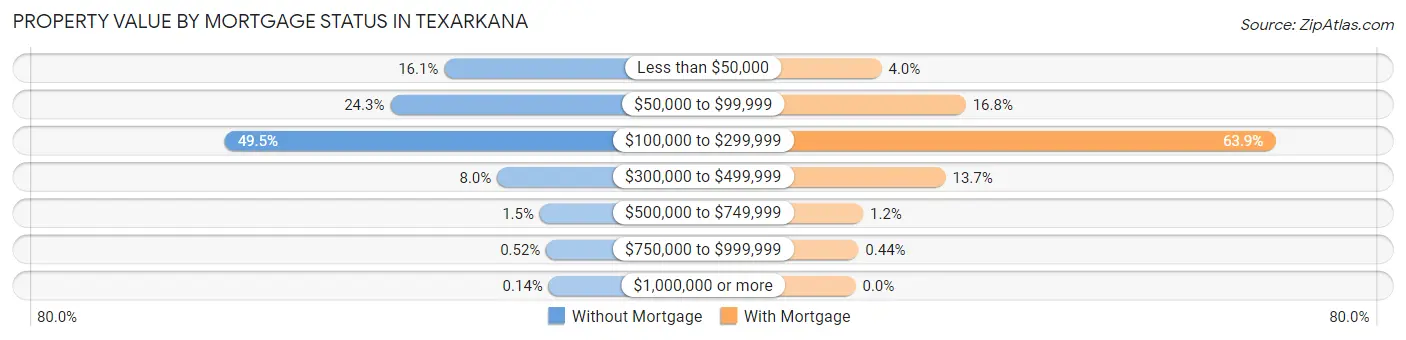
| Property Value | Without Mortgage | With Mortgage |
| Less than $50,000 | 582 (16.1%) | 107 (4.0%) |
| $50,000 to $99,999 | 880 (24.3%) | 454 (16.8%) |
| $100,000 to $299,999 | 1,794 (49.5%) | 1,729 (63.9%) |
| $300,000 to $499,999 | 290 (8.0%) | 371 (13.7%) |
| $500,000 to $749,999 | 54 (1.5%) | 31 (1.1%) |
| $750,000 to $999,999 | 19 (0.5%) | 12 (0.4%) |
| $1,000,000 or more | 5 (0.1%) | 0 (0.0%) |
| Total | 3,624 (100.0%) | 2,704 (100.0%) |
Household Income by Mortgage Status in Texarkana
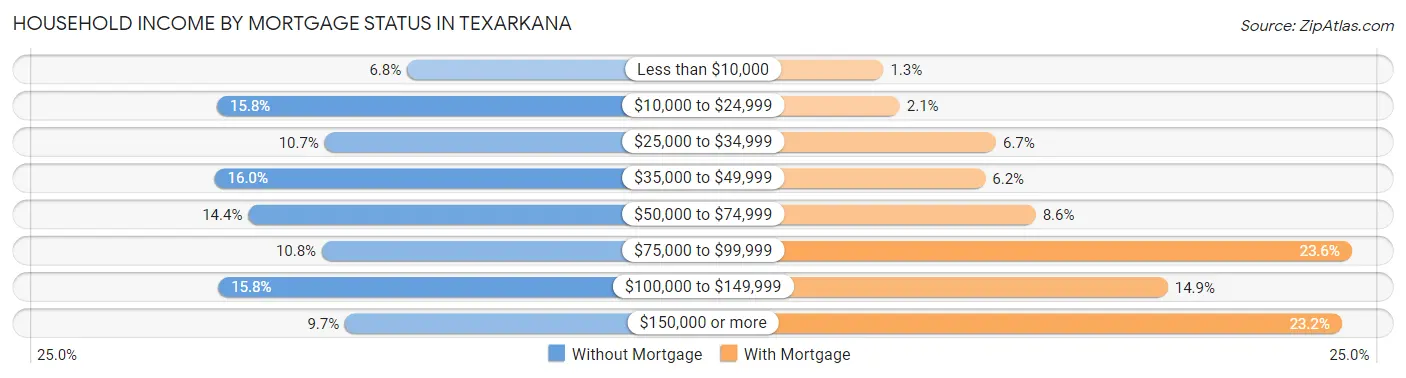
| Household Income | Without Mortgage | With Mortgage |
| Less than $10,000 | 246 (6.8%) | 36 (1.3%) |
| $10,000 to $24,999 | 574 (15.8%) | 57 (2.1%) |
| $25,000 to $34,999 | 388 (10.7%) | 181 (6.7%) |
| $35,000 to $49,999 | 578 (16.0%) | 167 (6.2%) |
| $50,000 to $74,999 | 520 (14.3%) | 232 (8.6%) |
| $75,000 to $99,999 | 393 (10.8%) | 639 (23.6%) |
| $100,000 to $149,999 | 572 (15.8%) | 402 (14.9%) |
| $150,000 or more | 353 (9.7%) | 626 (23.2%) |
| Total | 3,624 (100.0%) | 2,704 (100.0%) |
Property Value to Household Income Ratio in Texarkana
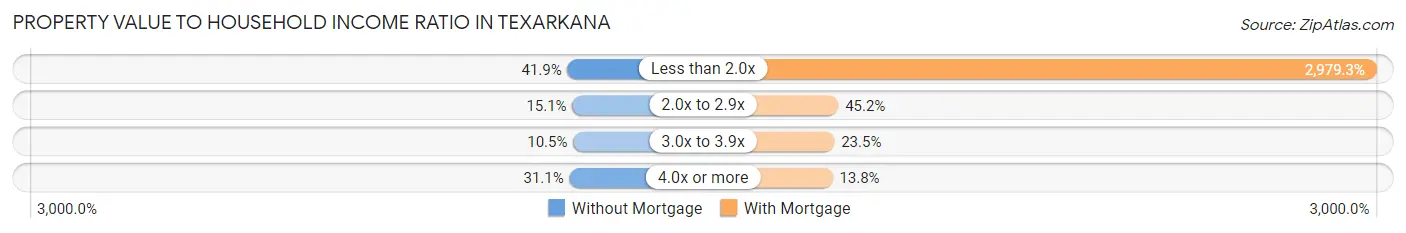
| Value-to-Income Ratio | Without Mortgage | With Mortgage |
| Less than 2.0x | 1,518 (41.9%) | 80,560 (2,979.3%) |
| 2.0x to 2.9x | 548 (15.1%) | 1,222 (45.2%) |
| 3.0x to 3.9x | 379 (10.5%) | 634 (23.4%) |
| 4.0x or more | 1,126 (31.1%) | 373 (13.8%) |
| Total | 3,624 (100.0%) | 2,704 (100.0%) |
Real Estate Taxes by Mortgage Status in Texarkana
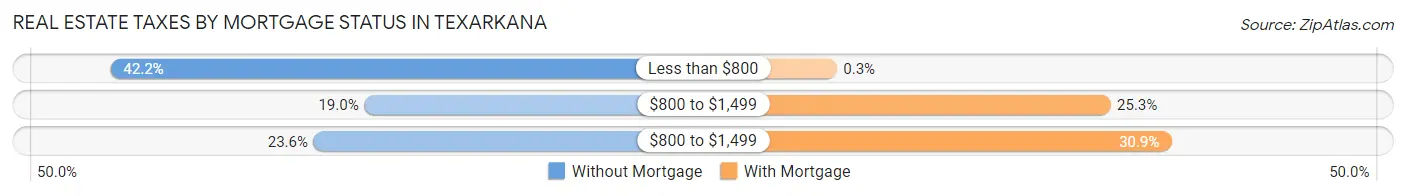
| Property Taxes | Without Mortgage | With Mortgage |
| Less than $800 | 1,528 (42.2%) | 8 (0.3%) |
| $800 to $1,499 | 687 (19.0%) | 684 (25.3%) |
| $800 to $1,499 | 855 (23.6%) | 835 (30.9%) |
| Total | 3,624 (100.0%) | 2,704 (100.0%) |
Health & Disability in Texarkana
Health Insurance Coverage by Age in Texarkana
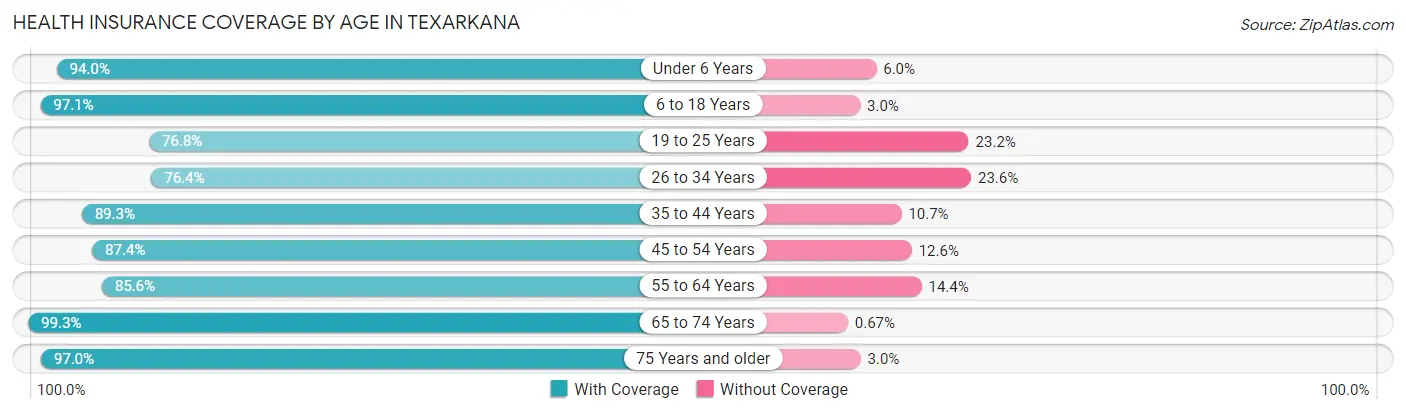
| Age Bracket | With Coverage | Without Coverage |
| Under 6 Years | 1,988 (94.0%) | 126 (6.0%) |
| 6 to 18 Years | 4,767 (97.1%) | 145 (2.9%) |
| 19 to 25 Years | 1,789 (76.8%) | 540 (23.2%) |
| 26 to 34 Years | 2,690 (76.4%) | 833 (23.6%) |
| 35 to 44 Years | 3,160 (89.3%) | 377 (10.7%) |
| 45 to 54 Years | 3,008 (87.4%) | 433 (12.6%) |
| 55 to 64 Years | 3,121 (85.6%) | 525 (14.4%) |
| 65 to 74 Years | 2,831 (99.3%) | 19 (0.7%) |
| 75 Years and older | 1,789 (97.0%) | 56 (3.0%) |
| Total | 25,143 (89.2%) | 3,054 (10.8%) |
Health Insurance Coverage by Citizenship Status in Texarkana
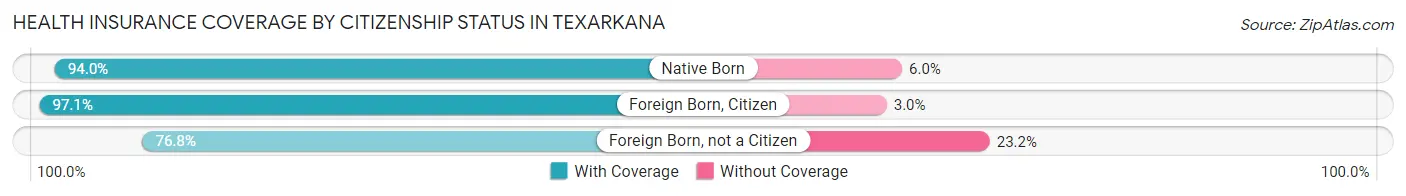
| Citizenship Status | With Coverage | Without Coverage |
| Native Born | 1,988 (94.0%) | 126 (6.0%) |
| Foreign Born, Citizen | 4,767 (97.1%) | 145 (2.9%) |
| Foreign Born, not a Citizen | 1,789 (76.8%) | 540 (23.2%) |
Health Insurance Coverage by Household Income in Texarkana
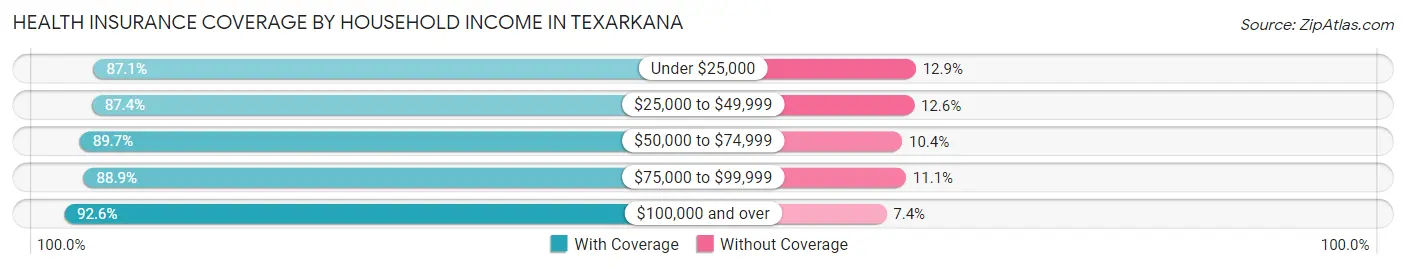
| Household Income | With Coverage | Without Coverage |
| Under $25,000 | 5,493 (87.1%) | 815 (12.9%) |
| $25,000 to $49,999 | 5,581 (87.4%) | 804 (12.6%) |
| $50,000 to $74,999 | 4,635 (89.6%) | 535 (10.3%) |
| $75,000 to $99,999 | 3,068 (88.9%) | 382 (11.1%) |
| $100,000 and over | 6,245 (92.6%) | 500 (7.4%) |
Public vs Private Health Insurance Coverage by Age in Texarkana
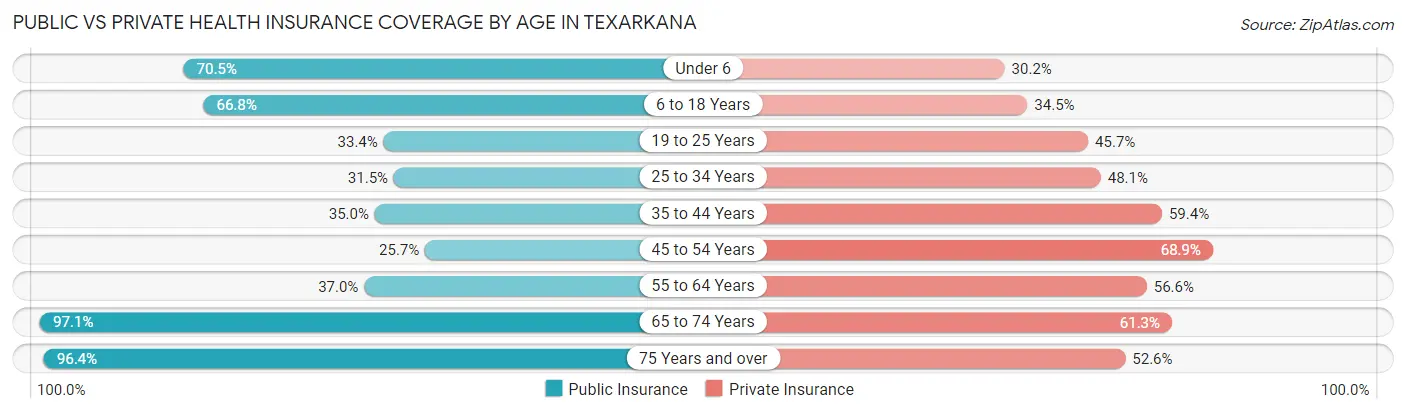
| Age Bracket | Public Insurance | Private Insurance |
| Under 6 | 1,490 (70.5%) | 639 (30.2%) |
| 6 to 18 Years | 3,280 (66.8%) | 1,692 (34.4%) |
| 19 to 25 Years | 777 (33.4%) | 1,065 (45.7%) |
| 25 to 34 Years | 1,108 (31.5%) | 1,694 (48.1%) |
| 35 to 44 Years | 1,238 (35.0%) | 2,102 (59.4%) |
| 45 to 54 Years | 883 (25.7%) | 2,369 (68.9%) |
| 55 to 64 Years | 1,348 (37.0%) | 2,064 (56.6%) |
| 65 to 74 Years | 2,768 (97.1%) | 1,746 (61.3%) |
| 75 Years and over | 1,779 (96.4%) | 971 (52.6%) |
| Total | 14,671 (52.0%) | 14,342 (50.9%) |
Disability Status by Sex by Age in Texarkana
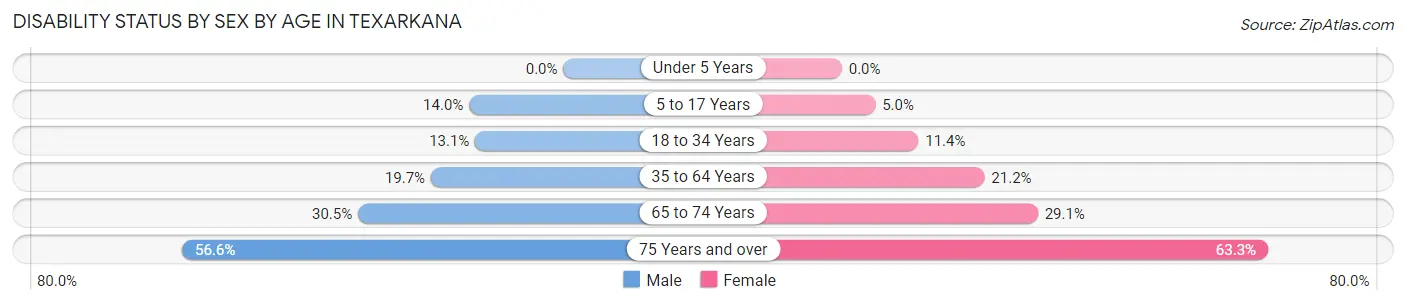
| Age Bracket | Male | Female |
| Under 5 Years | 0 (0.0%) | 0 (0.0%) |
| 5 to 17 Years | 340 (14.0%) | 126 (5.0%) |
| 18 to 34 Years | 375 (13.1%) | 367 (11.4%) |
| 35 to 64 Years | 973 (19.7%) | 1,202 (21.2%) |
| 65 to 74 Years | 390 (30.5%) | 457 (29.1%) |
| 75 Years and over | 428 (56.6%) | 689 (63.3%) |
Disability Class by Sex by Age in Texarkana
Disability Class: Hearing Difficulty
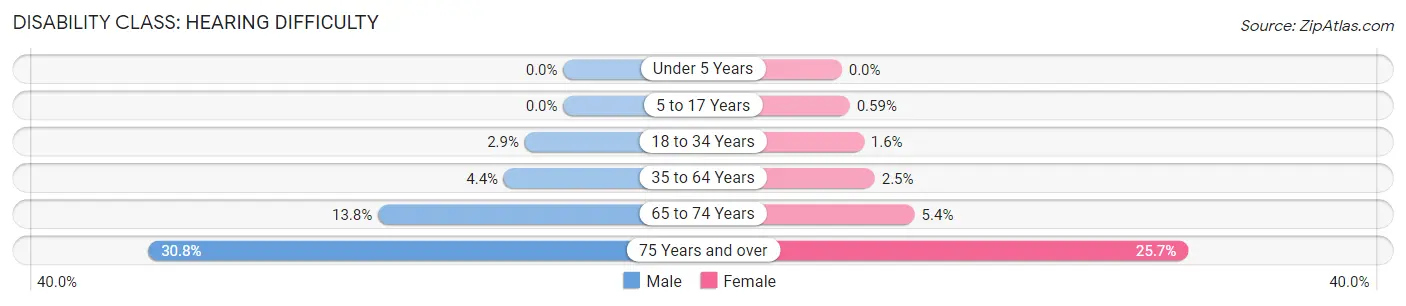
| Age Bracket | Male | Female |
| Under 5 Years | 0 (0.0%) | 0 (0.0%) |
| 5 to 17 Years | 0 (0.0%) | 15 (0.6%) |
| 18 to 34 Years | 82 (2.9%) | 53 (1.6%) |
| 35 to 64 Years | 218 (4.4%) | 139 (2.5%) |
| 65 to 74 Years | 176 (13.8%) | 85 (5.4%) |
| 75 Years and over | 233 (30.8%) | 280 (25.7%) |
Disability Class: Vision Difficulty
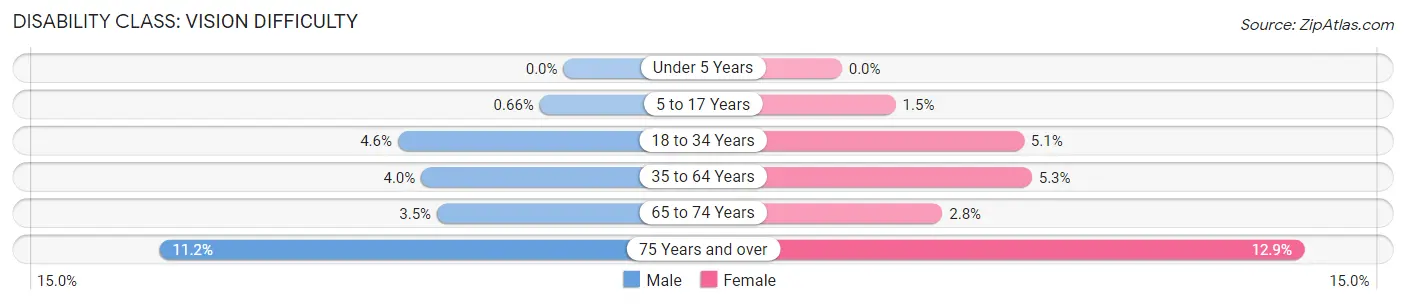
| Age Bracket | Male | Female |
| Under 5 Years | 0 (0.0%) | 0 (0.0%) |
| 5 to 17 Years | 16 (0.7%) | 38 (1.5%) |
| 18 to 34 Years | 132 (4.6%) | 164 (5.1%) |
| 35 to 64 Years | 196 (4.0%) | 300 (5.3%) |
| 65 to 74 Years | 45 (3.5%) | 44 (2.8%) |
| 75 Years and over | 85 (11.2%) | 140 (12.9%) |
Disability Class: Cognitive Difficulty
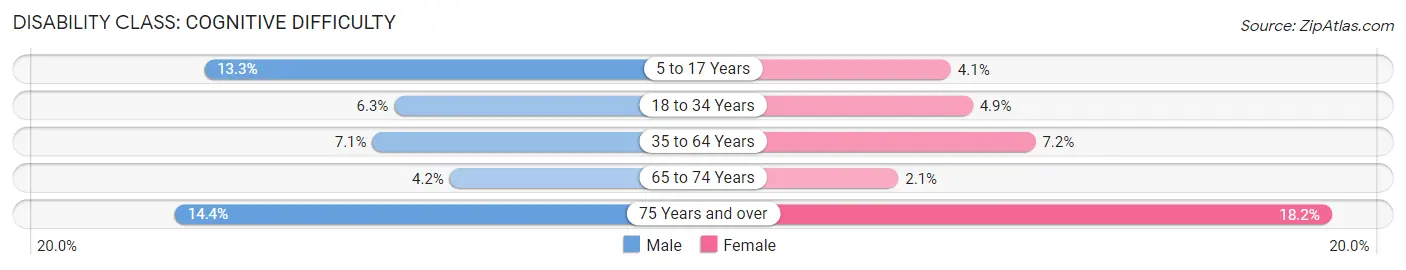
| Age Bracket | Male | Female |
| 5 to 17 Years | 324 (13.3%) | 103 (4.1%) |
| 18 to 34 Years | 180 (6.3%) | 157 (4.9%) |
| 35 to 64 Years | 351 (7.1%) | 408 (7.2%) |
| 65 to 74 Years | 54 (4.2%) | 33 (2.1%) |
| 75 Years and over | 109 (14.4%) | 198 (18.2%) |
Disability Class: Ambulatory Difficulty
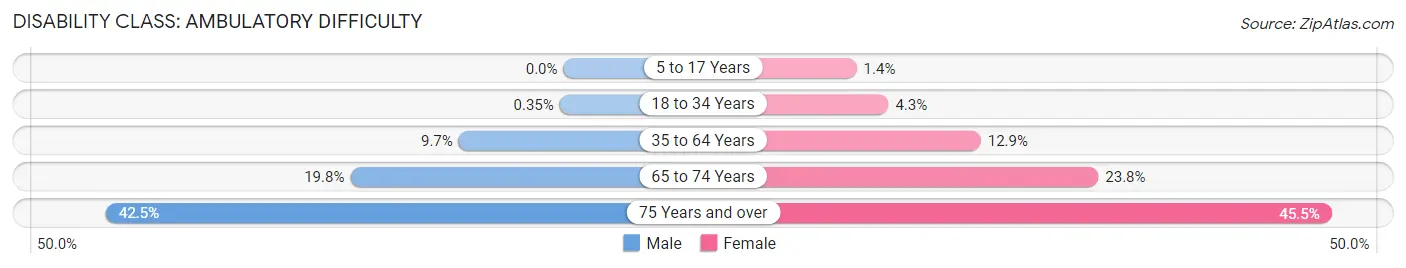
| Age Bracket | Male | Female |
| 5 to 17 Years | 0 (0.0%) | 35 (1.4%) |
| 18 to 34 Years | 10 (0.4%) | 140 (4.3%) |
| 35 to 64 Years | 481 (9.7%) | 732 (12.9%) |
| 65 to 74 Years | 253 (19.8%) | 374 (23.8%) |
| 75 Years and over | 321 (42.5%) | 495 (45.5%) |
Disability Class: Self-Care Difficulty
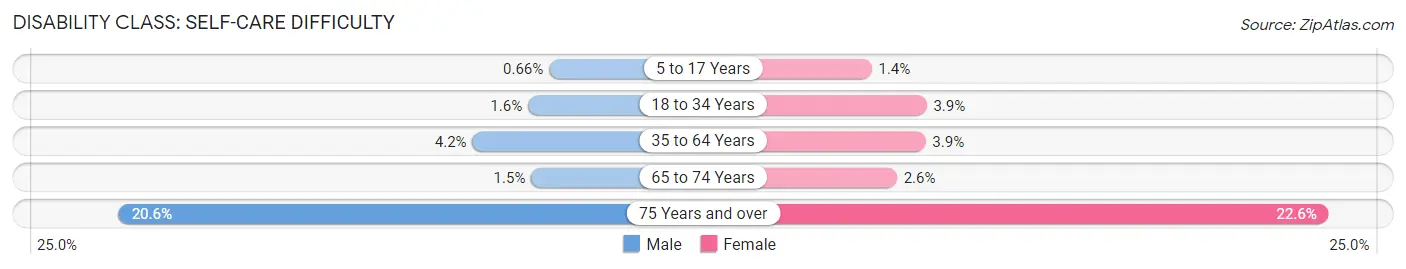
| Age Bracket | Male | Female |
| 5 to 17 Years | 16 (0.7%) | 35 (1.4%) |
| 18 to 34 Years | 47 (1.6%) | 127 (3.9%) |
| 35 to 64 Years | 209 (4.2%) | 220 (3.9%) |
| 65 to 74 Years | 19 (1.5%) | 40 (2.5%) |
| 75 Years and over | 156 (20.6%) | 246 (22.6%) |
Technology Access in Texarkana
Computing Device Access in Texarkana
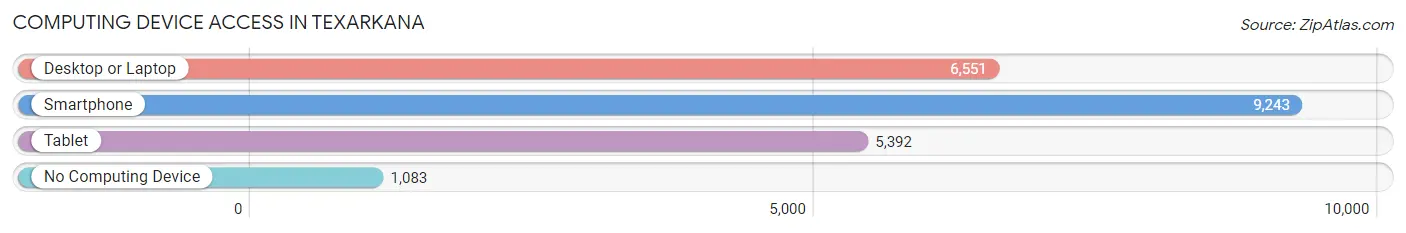
| Device Type | # Households | % Households |
| Desktop or Laptop | 6,551 | 59.1% |
| Smartphone | 9,243 | 83.4% |
| Tablet | 5,392 | 48.7% |
| No Computing Device | 1,083 | 9.8% |
| Total | 11,077 | 100.0% |
Internet Access in Texarkana
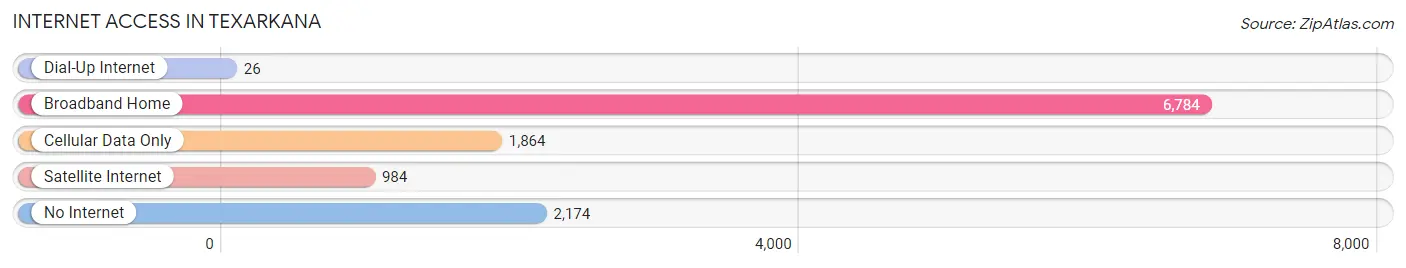
| Internet Type | # Households | % Households |
| Dial-Up Internet | 26 | 0.2% |
| Broadband Home | 6,784 | 61.2% |
| Cellular Data Only | 1,864 | 16.8% |
| Satellite Internet | 984 | 8.9% |
| No Internet | 2,174 | 19.6% |
| Total | 11,077 | 100.0% |
Texarkana Summary
Texarkana is a city located in the state of Arkansas and Texas, United States. It is the county seat of Miller County, Arkansas and Bowie County, Texas. The city is located on the border of the two states, and is the only city in the United States that is split into two states. The city is located in the Ark-La-Tex region, and is the largest city in the region.
History
The area that is now Texarkana was first inhabited by the Caddo Indians, who lived in the area for thousands of years before the arrival of Europeans. The first Europeans to settle in the area were French traders, who established a trading post in the area in the late 1700s. The area was part of the Spanish Empire until 1819, when it was ceded to the United States.
In 1873, the city of Texarkana was founded by the Texas and Pacific Railway. The city was named after the railroad, which was named after the two states that it served, Texas and Arkansas. The city quickly grew, and by 1880, it had a population of over 1,000 people.
In the late 1800s, the city became a major center for the timber industry, and it was also a major center for the cotton industry. The city was also a major center for the railroad industry, and it was the site of the first railroad bridge to span the Red River.
In the early 1900s, the city became a major center for the oil industry, and it was also a major center for the manufacturing industry. The city was also a major center for the entertainment industry, and it was the site of the first drive-in movie theater in the United States.
Geography
Texarkana is located in the Ark-La-Tex region of the United States, and is the largest city in the region. The city is located on the border of Arkansas and Texas, and is the only city in the United States that is split into two states. The city is located in the Piney Woods region of the United States, and is surrounded by forests and rolling hills.
The city is located at the intersection of Interstate 30 and U.S. Highway 59, and is located about 100 miles east of Dallas, Texas. The city is located about 150 miles south of Little Rock, Arkansas, and about 200 miles north of Shreveport, Louisiana.
Economy
The economy of Texarkana is largely based on the manufacturing industry, and the city is home to several major manufacturing companies. The city is also a major center for the oil and gas industry, and is home to several major oil and gas companies. The city is also a major center for the timber industry, and is home to several major timber companies.
The city is also a major center for the entertainment industry, and is home to several major entertainment companies. The city is also a major center for the retail industry, and is home to several major retail stores.
Demographics
As of the 2010 census, the population of Texarkana was 36,411. The population is made up of a diverse mix of people, including African Americans, Hispanics, and Native Americans. The median household income in the city is $37,845, and the median age is 36.7 years. The city has a population density of 1,092 people per square mile.
Common Questions
What is Per Capita Income in Texarkana?
Per Capita income in Texarkana is $26,827.
What is the Median Family Income in Texarkana?
Median Family Income in Texarkana is $56,680.
What is the Median Household income in Texarkana?
Median Household Income in Texarkana is $45,233.
What is Income or Wage Gap in Texarkana?
Income or Wage Gap in Texarkana is 26.5%.
Women in Texarkana earn 73.5 cents for every dollar earned by a man.
What is Family Income Deficit in Texarkana?
Family Income Deficit in Texarkana is $12,101.
Families that are below poverty line in Texarkana earn $12,101 less on average than the poverty threshold level.
What is Inequality or Gini Index in Texarkana?
Inequality or Gini Index in Texarkana is 0.50.
What is the Total Population of Texarkana?
Total Population of Texarkana is 29,404.
What is the Total Male Population of Texarkana?
Total Male Population of Texarkana is 14,131.
What is the Total Female Population of Texarkana?
Total Female Population of Texarkana is 15,273.
What is the Ratio of Males per 100 Females in Texarkana?
There are 92.52 Males per 100 Females in Texarkana.
What is the Ratio of Females per 100 Males in Texarkana?
There are 108.08 Females per 100 Males in Texarkana.
What is the Median Population Age in Texarkana?
Median Population Age in Texarkana is 39.1 Years.
What is the Average Family Size in Texarkana
Average Family Size in Texarkana is 3.4 People.
What is the Average Household Size in Texarkana
Average Household Size in Texarkana is 2.5 People.
How Large is the Labor Force in Texarkana?
There are 12,548 People in the Labor Forcein in Texarkana.
What is the Percentage of People in the Labor Force in Texarkana?
53.8% of People are in the Labor Force in Texarkana.
What is the Unemployment Rate in Texarkana?
Unemployment Rate in Texarkana is 8.3%.