Fayetteville, AR Map & Demographics
Fayetteville Map
Fayetteville Overview
$35,997
PER CAPITA INCOME
$85,775
AVG FAMILY INCOME
$56,881
AVG HOUSEHOLD INCOME
25.5%
WAGE / INCOME GAP [ % ]
74.5¢/ $1
WAGE / INCOME GAP [ $ ]
$10,805
FAMILY INCOME DEFICIT
0.50
INEQUALITY / GINI INDEX
95,022
TOTAL POPULATION
47,494
MALE POPULATION
47,528
FEMALE POPULATION
99.93
MALES / 100 FEMALES
100.07
FEMALES / 100 MALES
28.5
MEDIAN AGE
2.9
AVG FAMILY SIZE
2.2
AVG HOUSEHOLD SIZE
52,459
LABOR FORCE [ PEOPLE ]
65.7%
PERCENT IN LABOR FORCE
5.3%
UNEMPLOYMENT RATE
Fayetteville Area Codes
Income in Fayetteville
Income Overview in Fayetteville
Per Capita Income in Fayetteville is $35,997, while median incomes of families and households are $85,775 and $56,881 respectively.
| Characteristic | Number | Measure |
| Per Capita Income | 95,022 | $35,997 |
| Median Family Income | 18,963 | $85,775 |
| Mean Family Income | 18,963 | $116,384 |
| Median Household Income | 39,763 | $56,881 |
| Mean Household Income | 39,763 | $84,823 |
| Income Deficit | 18,963 | $10,805 |
| Wage / Income Gap (%) | 95,022 | 25.52% |
| Wage / Income Gap ($) | 95,022 | 74.48¢ per $1 |
| Gini / Inequality Index | 95,022 | 0.50 |
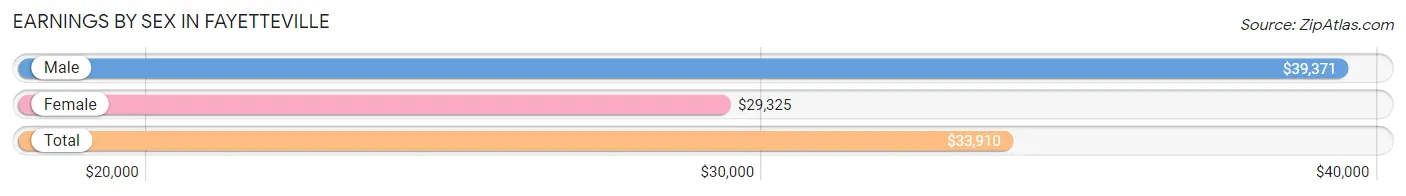
Earnings by Sex in Fayetteville
Average Earnings in Fayetteville are $33,910, $39,371 for men and $29,325 for women, a difference of 25.5%.
| Sex | Number | Average Earnings |
| Male | 29,436 (52.2%) | $39,371 |
| Female | 26,927 (47.8%) | $29,325 |
| Total | 56,363 (100.0%) | $33,910 |
Earnings by Sex by Income Bracket in Fayetteville
The most common earnings brackets in Fayetteville are $100,000+ for men (4,678 | 15.9%) and $55,000 to $64,999 for women (2,144 | 8.0%).
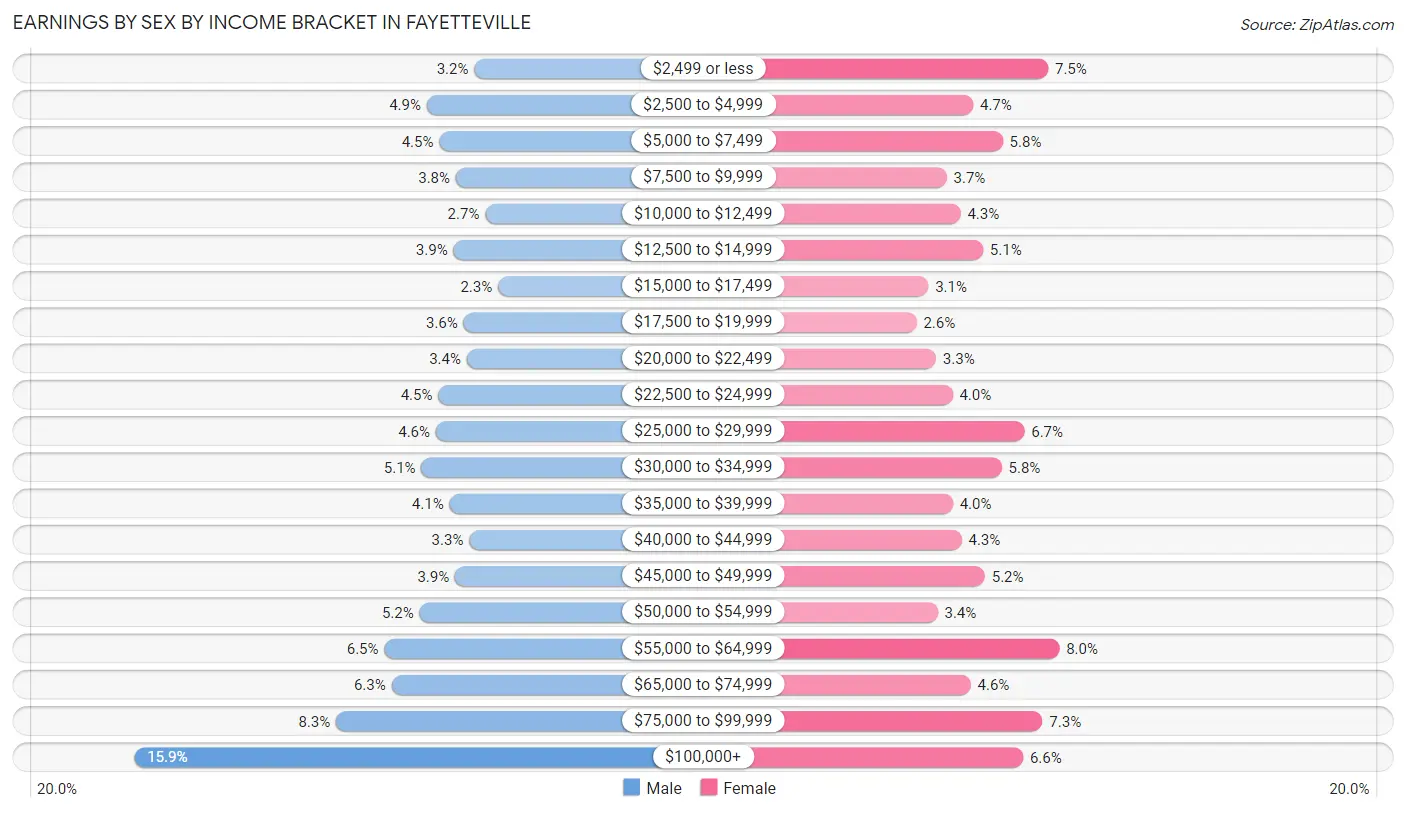
| Income | Male | Female |
| $2,499 or less | 927 (3.2%) | 2,031 (7.5%) |
| $2,500 to $4,999 | 1,452 (4.9%) | 1,274 (4.7%) |
| $5,000 to $7,499 | 1,313 (4.5%) | 1,573 (5.8%) |
| $7,500 to $9,999 | 1,129 (3.8%) | 1,007 (3.7%) |
| $10,000 to $12,499 | 807 (2.7%) | 1,148 (4.3%) |
| $12,500 to $14,999 | 1,156 (3.9%) | 1,374 (5.1%) |
| $15,000 to $17,499 | 666 (2.3%) | 822 (3.0%) |
| $17,500 to $19,999 | 1,046 (3.5%) | 703 (2.6%) |
| $20,000 to $22,499 | 1,011 (3.4%) | 899 (3.3%) |
| $22,500 to $24,999 | 1,324 (4.5%) | 1,066 (4.0%) |
| $25,000 to $29,999 | 1,350 (4.6%) | 1,791 (6.7%) |
| $30,000 to $34,999 | 1,510 (5.1%) | 1,561 (5.8%) |
| $35,000 to $39,999 | 1,202 (4.1%) | 1,069 (4.0%) |
| $40,000 to $44,999 | 984 (3.3%) | 1,159 (4.3%) |
| $45,000 to $49,999 | 1,139 (3.9%) | 1,392 (5.2%) |
| $50,000 to $54,999 | 1,530 (5.2%) | 915 (3.4%) |
| $55,000 to $64,999 | 1,920 (6.5%) | 2,144 (8.0%) |
| $65,000 to $74,999 | 1,839 (6.2%) | 1,249 (4.6%) |
| $75,000 to $99,999 | 2,453 (8.3%) | 1,973 (7.3%) |
| $100,000+ | 4,678 (15.9%) | 1,777 (6.6%) |
| Total | 29,436 (100.0%) | 26,927 (100.0%) |
Earnings by Sex by Educational Attainment in Fayetteville
Average earnings in Fayetteville are $54,625 for men and $41,987 for women, a difference of 23.1%. Men with an educational attainment of graduate degree enjoy the highest average annual earnings of $85,000, while those with less than high school education earn the least with $24,701. Women with an educational attainment of graduate degree earn the most with the average annual earnings of $61,113, while those with less than high school education have the smallest earnings of $19,764.
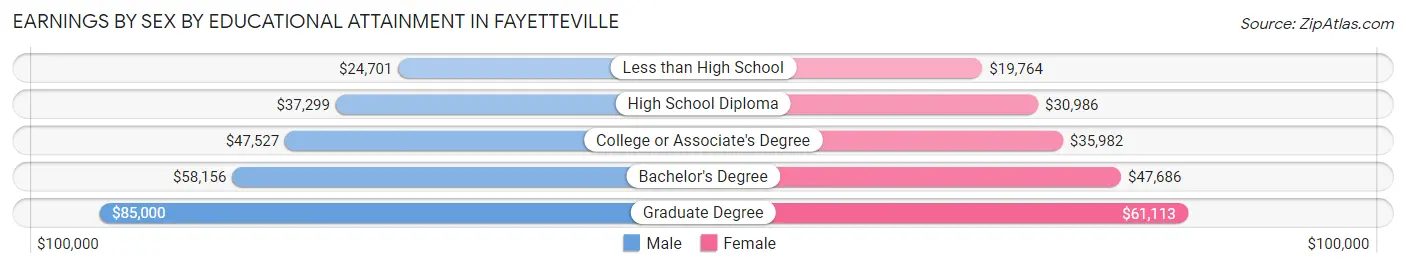
| Educational Attainment | Male Income | Female Income |
| Less than High School | $24,701 | $19,764 |
| High School Diploma | $37,299 | $30,986 |
| College or Associate's Degree | $47,527 | $35,982 |
| Bachelor's Degree | $58,156 | $47,686 |
| Graduate Degree | $85,000 | $61,113 |
| Total | $54,625 | $41,987 |
Family Income in Fayetteville
Family Income Brackets in Fayetteville
According to the Fayetteville family income data, there are 3,300 families falling into the $100,000 to $149,999 income range, which is the most common income bracket and makes up 17.4% of all families. Conversely, the $10,000 to $14,999 income bracket is the least frequent group with only 550 families (2.9%) belonging to this category.
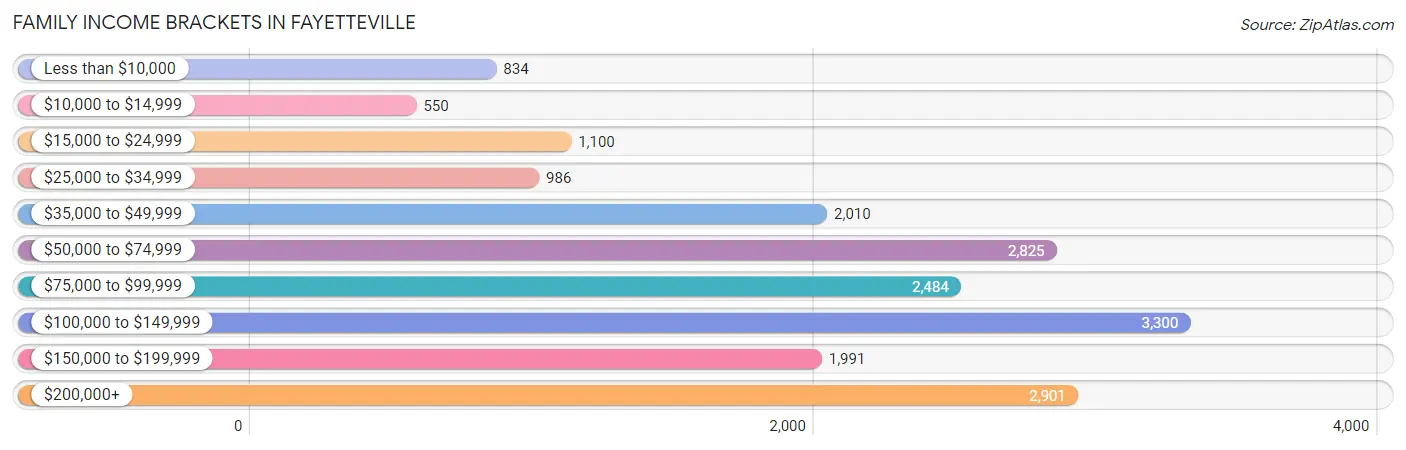
| Income Bracket | # Families | % Families |
| Less than $10,000 | 834 | 4.4% |
| $10,000 to $14,999 | 550 | 2.9% |
| $15,000 to $24,999 | 1,100 | 5.8% |
| $25,000 to $34,999 | 986 | 5.2% |
| $35,000 to $49,999 | 2,010 | 10.6% |
| $50,000 to $74,999 | 2,825 | 14.9% |
| $75,000 to $99,999 | 2,484 | 13.1% |
| $100,000 to $149,999 | 3,300 | 17.4% |
| $150,000 to $199,999 | 1,991 | 10.5% |
| $200,000+ | 2,901 | 15.3% |
Family Income by Famaliy Size in Fayetteville
5-person families (1,294 | 6.8%) account for the highest median family income in Fayetteville with $107,150 per family, while 2-person families (9,676 | 51.0%) have the highest median income of $39,092 per family member.
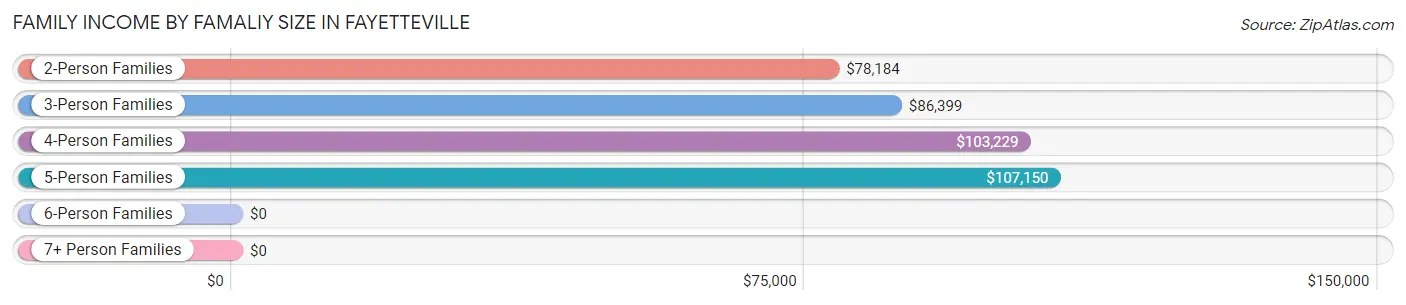
| Income Bracket | # Families | Median Income |
| 2-Person Families | 9,676 (51.0%) | $78,184 |
| 3-Person Families | 5,156 (27.2%) | $86,399 |
| 4-Person Families | 2,637 (13.9%) | $103,229 |
| 5-Person Families | 1,294 (6.8%) | $107,150 |
| 6-Person Families | 160 (0.8%) | $0 |
| 7+ Person Families | 40 (0.2%) | $0 |
| Total | 18,963 (100.0%) | $85,775 |
Family Income by Number of Earners in Fayetteville
The median family income in Fayetteville is $85,775, with families comprising 3+ earners (1,193) having the highest median family income of $141,442, while families with 1 earner (6,553) have the lowest median family income of $50,949, accounting for 6.3% and 34.6% of families, respectively.
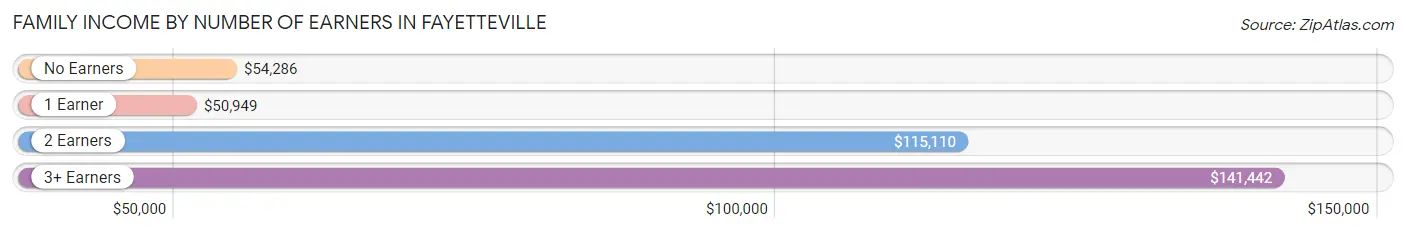
| Number of Earners | # Families | Median Income |
| No Earners | 1,968 (10.4%) | $54,286 |
| 1 Earner | 6,553 (34.6%) | $50,949 |
| 2 Earners | 9,249 (48.8%) | $115,110 |
| 3+ Earners | 1,193 (6.3%) | $141,442 |
| Total | 18,963 (100.0%) | $85,775 |
Household Income in Fayetteville
Household Income Brackets in Fayetteville
With 6,124 households falling in the category, the $50,000 to $74,999 income range is the most frequent in Fayetteville, accounting for 15.4% of all households. In contrast, only 1,789 households (4.5%) fall into the $10,000 to $14,999 income bracket, making it the least populous group.
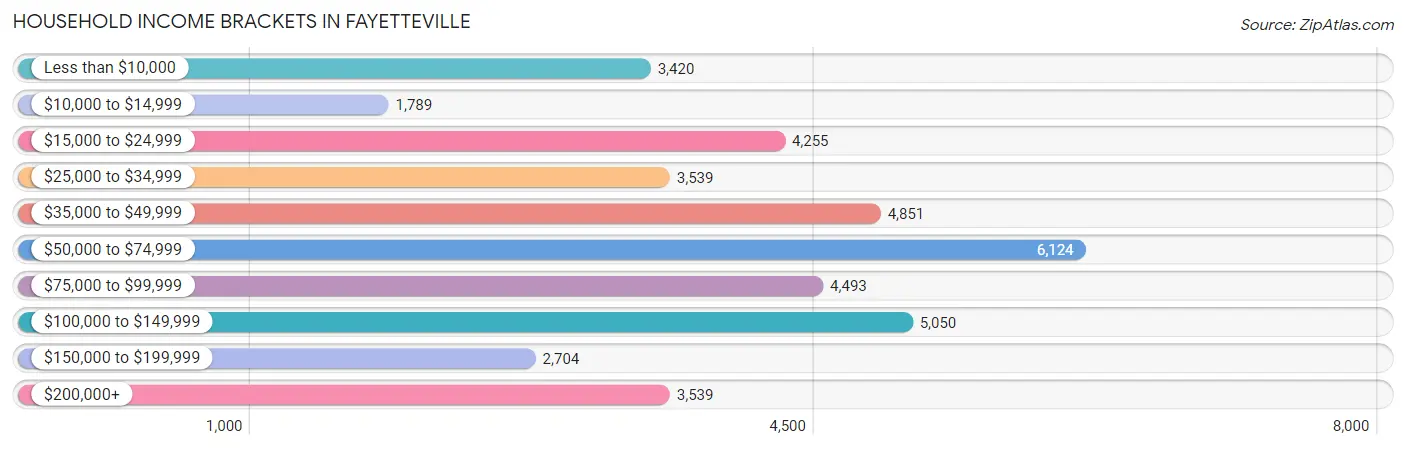
| Income Bracket | # Households | % Households |
| Less than $10,000 | 3,420 | 8.6% |
| $10,000 to $14,999 | 1,789 | 4.5% |
| $15,000 to $24,999 | 4,255 | 10.7% |
| $25,000 to $34,999 | 3,539 | 8.9% |
| $35,000 to $49,999 | 4,851 | 12.2% |
| $50,000 to $74,999 | 6,124 | 15.4% |
| $75,000 to $99,999 | 4,493 | 11.3% |
| $100,000 to $149,999 | 5,050 | 12.7% |
| $150,000 to $199,999 | 2,704 | 6.8% |
| $200,000+ | 3,539 | 8.9% |
Household Income by Householder Age in Fayetteville
The median household income in Fayetteville is $56,881, with the highest median household income of $80,000 found in the 45 to 64 years age bracket for the primary householder. A total of 10,690 households (26.9%) fall into this category. Meanwhile, the 15 to 24 years age bracket for the primary householder has the lowest median household income of $29,941, with 7,370 households (18.5%) in this group.
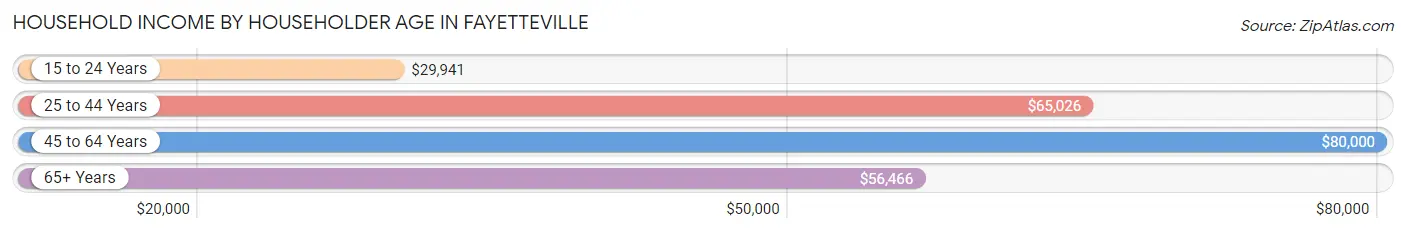
| Income Bracket | # Households | Median Income |
| 15 to 24 Years | 7,370 (18.5%) | $29,941 |
| 25 to 44 Years | 16,043 (40.4%) | $65,026 |
| 45 to 64 Years | 10,690 (26.9%) | $80,000 |
| 65+ Years | 5,660 (14.2%) | $56,466 |
| Total | 39,763 (100.0%) | $56,881 |
Poverty in Fayetteville
Income Below Poverty by Sex and Age in Fayetteville
With 19.3% poverty level for males and 23.2% for females among the residents of Fayetteville, 18 to 24 year old males and 18 to 24 year old females are the most vulnerable to poverty, with 4,045 males (45.0%) and 5,042 females (55.3%) in their respective age groups living below the poverty level.
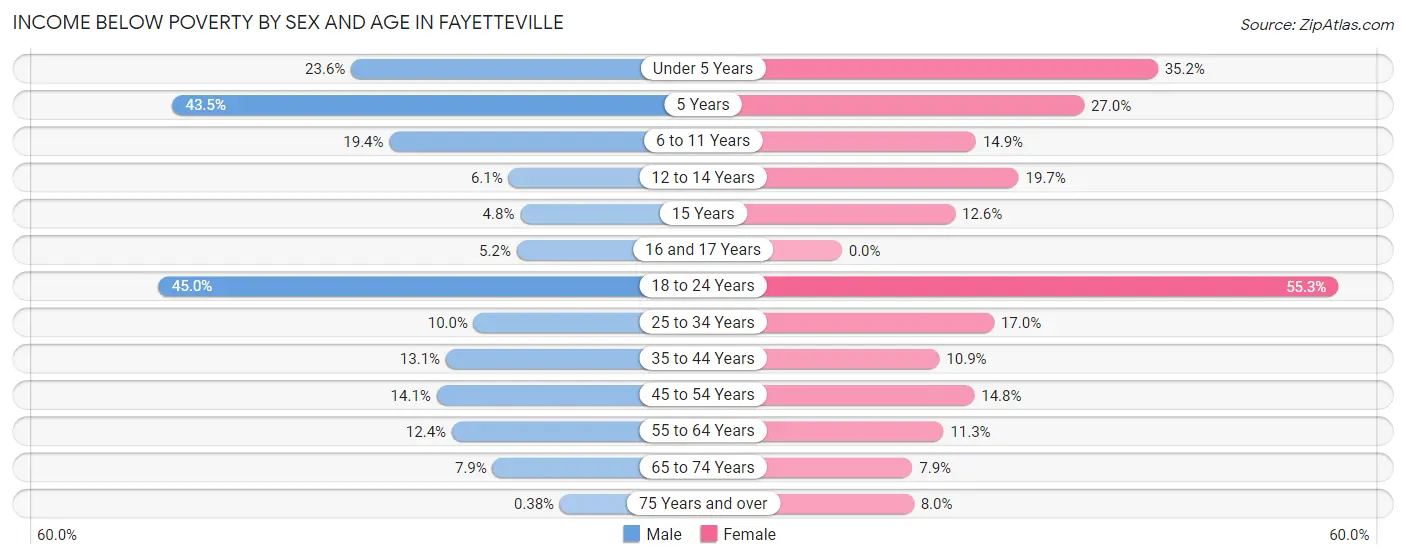
| Age Bracket | Male | Female |
| Under 5 Years | 619 (23.6%) | 845 (35.2%) |
| 5 Years | 151 (43.5%) | 137 (27.0%) |
| 6 to 11 Years | 668 (19.4%) | 426 (14.9%) |
| 12 to 14 Years | 75 (6.1%) | 188 (19.7%) |
| 15 Years | 17 (4.8%) | 39 (12.6%) |
| 16 and 17 Years | 41 (5.2%) | 0 (0.0%) |
| 18 to 24 Years | 4,045 (45.0%) | 5,042 (55.3%) |
| 25 to 34 Years | 892 (10.0%) | 1,314 (17.0%) |
| 35 to 44 Years | 810 (13.1%) | 583 (10.9%) |
| 45 to 54 Years | 550 (14.1%) | 595 (14.8%) |
| 55 to 64 Years | 479 (12.4%) | 510 (11.3%) |
| 65 to 74 Years | 175 (7.9%) | 236 (7.9%) |
| 75 Years and over | 5 (0.4%) | 161 (8.0%) |
| Total | 8,527 (19.3%) | 10,076 (23.2%) |
Income Above Poverty by Sex and Age in Fayetteville
According to the poverty statistics in Fayetteville, males aged 75 years and over and females aged 16 and 17 years are the age groups that are most secure financially, with 99.6% of males and 100.0% of females in these age groups living above the poverty line.
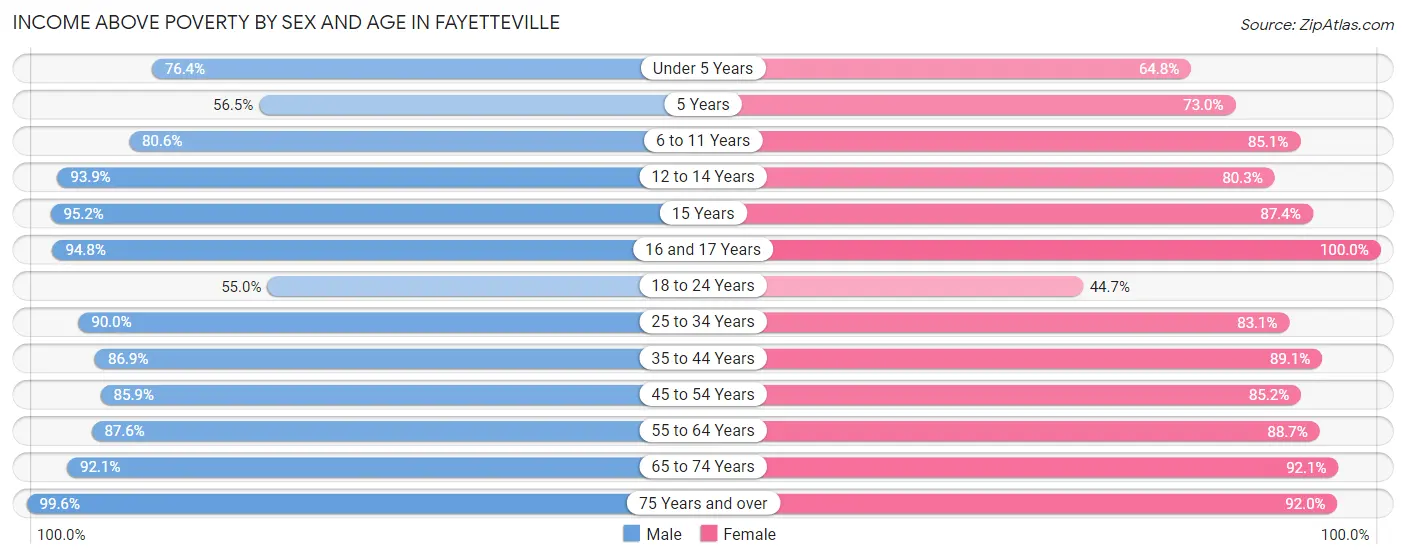
| Age Bracket | Male | Female |
| Under 5 Years | 2,001 (76.4%) | 1,557 (64.8%) |
| 5 Years | 196 (56.5%) | 371 (73.0%) |
| 6 to 11 Years | 2,778 (80.6%) | 2,425 (85.1%) |
| 12 to 14 Years | 1,154 (93.9%) | 767 (80.3%) |
| 15 Years | 337 (95.2%) | 270 (87.4%) |
| 16 and 17 Years | 749 (94.8%) | 613 (100.0%) |
| 18 to 24 Years | 4,936 (55.0%) | 4,079 (44.7%) |
| 25 to 34 Years | 8,058 (90.0%) | 6,436 (83.1%) |
| 35 to 44 Years | 5,381 (86.9%) | 4,782 (89.1%) |
| 45 to 54 Years | 3,349 (85.9%) | 3,437 (85.2%) |
| 55 to 64 Years | 3,382 (87.6%) | 3,994 (88.7%) |
| 65 to 74 Years | 2,046 (92.1%) | 2,766 (92.1%) |
| 75 Years and over | 1,311 (99.6%) | 1,850 (92.0%) |
| Total | 35,678 (80.7%) | 33,347 (76.8%) |
Income Below Poverty Among Married-Couple Families in Fayetteville
The poverty statistics for married-couple families in Fayetteville show that 5.8% or 789 of the total 13,728 families live below the poverty line. Families with 5 or more children have the highest poverty rate of 54.5%, comprising of 18 families. On the other hand, families with no children have the lowest poverty rate of 3.4%, which includes 253 families.
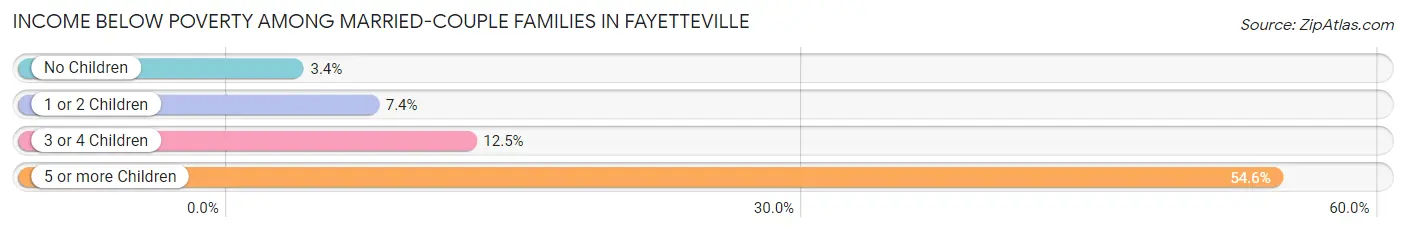
| Children | Above Poverty | Below Poverty |
| No Children | 7,138 (96.6%) | 253 (3.4%) |
| 1 or 2 Children | 4,844 (92.6%) | 384 (7.3%) |
| 3 or 4 Children | 942 (87.5%) | 134 (12.4%) |
| 5 or more Children | 15 (45.5%) | 18 (54.5%) |
| Total | 12,939 (94.3%) | 789 (5.8%) |
Income Below Poverty Among Single-Parent Households in Fayetteville
According to the poverty data in Fayetteville, 24.3% or 494 single-father households and 29.0% or 929 single-mother households are living below the poverty line. Among single-father households, those with 3 or 4 children have the highest poverty rate, with 54 households (100.0%) experiencing poverty. Likewise, among single-mother households, those with 5 or more children have the highest poverty rate, with 31 households (100.0%) falling below the poverty line.
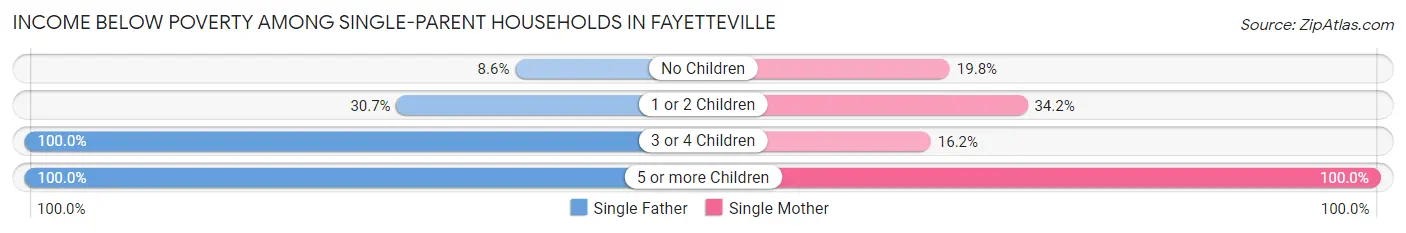
| Children | Single Father | Single Mother |
| No Children | 68 (8.6%) | 227 (19.8%) |
| 1 or 2 Children | 364 (30.7%) | 652 (34.2%) |
| 3 or 4 Children | 54 (100.0%) | 19 (16.2%) |
| 5 or more Children | 8 (100.0%) | 31 (100.0%) |
| Total | 494 (24.3%) | 929 (29.0%) |
Income Below Poverty Among Married-Couple vs Single-Parent Households in Fayetteville
The poverty data for Fayetteville shows that 789 of the married-couple family households (5.8%) and 1,423 of the single-parent households (27.2%) are living below the poverty level. Within the married-couple family households, those with 5 or more children have the highest poverty rate, with 18 households (54.5%) falling below the poverty line. Among the single-parent households, those with 5 or more children have the highest poverty rate, with 39 household (100.0%) living below poverty.
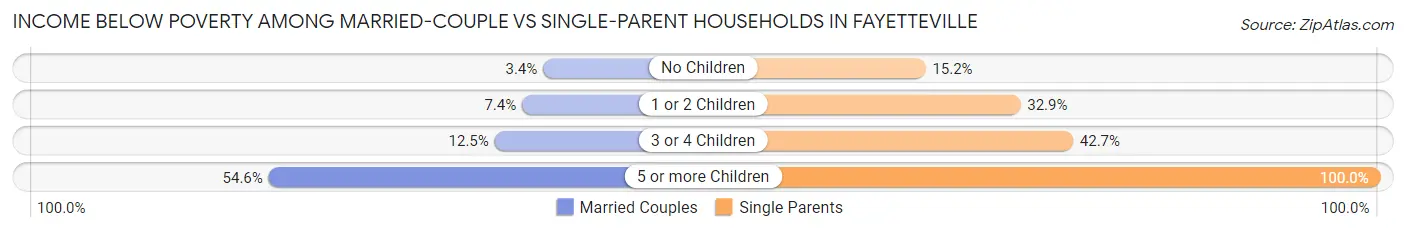
| Children | Married-Couple Families | Single-Parent Households |
| No Children | 253 (3.4%) | 295 (15.2%) |
| 1 or 2 Children | 384 (7.3%) | 1,016 (32.9%) |
| 3 or 4 Children | 134 (12.4%) | 73 (42.7%) |
| 5 or more Children | 18 (54.5%) | 39 (100.0%) |
| Total | 789 (5.8%) | 1,423 (27.2%) |
Race in Fayetteville
The most populous races in Fayetteville are White / Caucasian (74,553 | 78.5%), Two or more Races (8,713 | 9.2%), and Hispanic or Latino (7,254 | 7.6%).
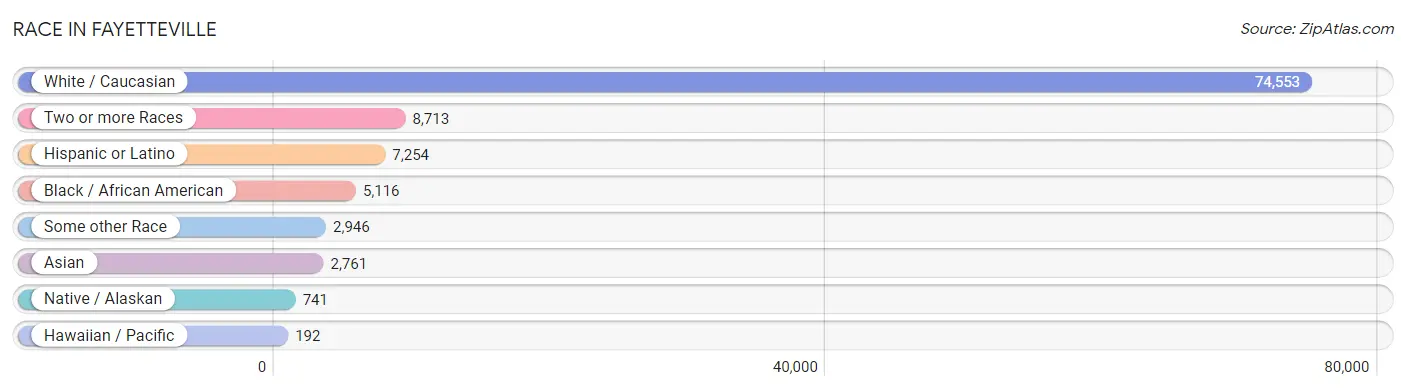
| Race | # Population | % Population |
| Asian | 2,761 | 2.9% |
| Black / African American | 5,116 | 5.4% |
| Hawaiian / Pacific | 192 | 0.2% |
| Hispanic or Latino | 7,254 | 7.6% |
| Native / Alaskan | 741 | 0.8% |
| White / Caucasian | 74,553 | 78.5% |
| Two or more Races | 8,713 | 9.2% |
| Some other Race | 2,946 | 3.1% |
| Total | 95,022 | 100.0% |
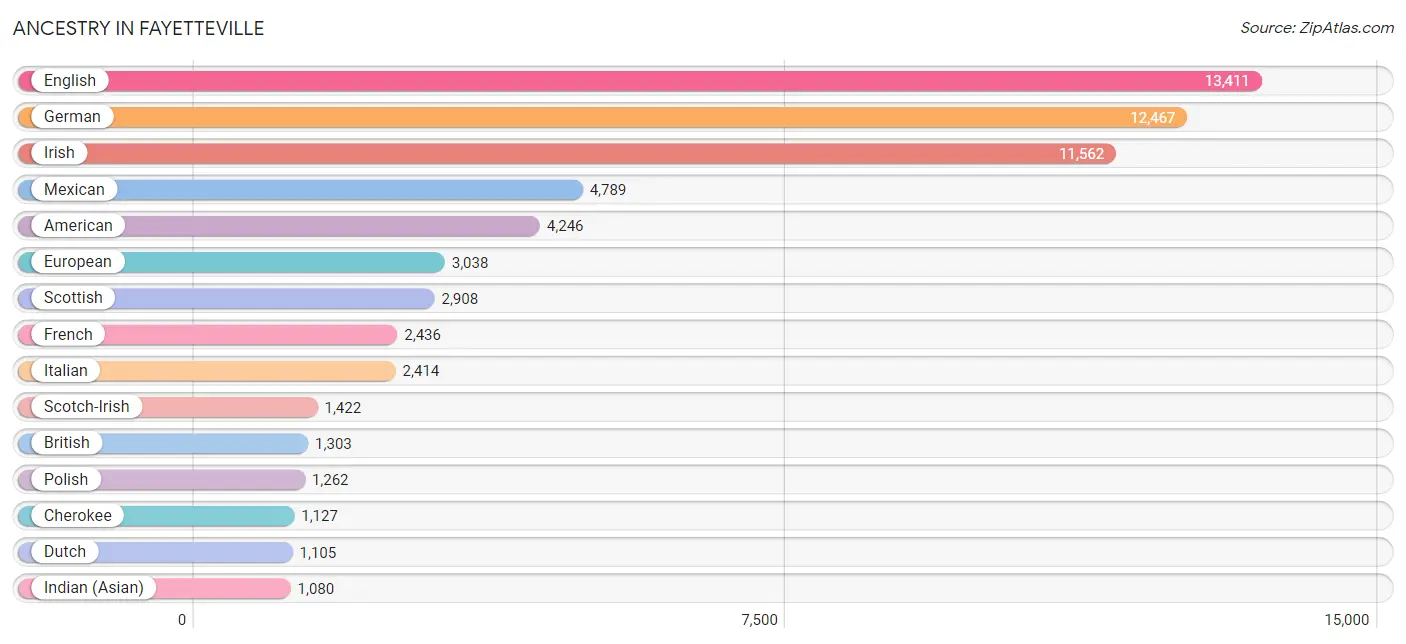
Ancestry in Fayetteville
The most populous ancestries reported in Fayetteville are English (13,411 | 14.1%), German (12,467 | 13.1%), Irish (11,562 | 12.2%), Mexican (4,789 | 5.0%), and American (4,246 | 4.5%), together accounting for 48.9% of all Fayetteville residents.
| Ancestry | # Population | % Population |
| Afghan | 25 | 0.0% |
| African | 506 | 0.5% |
| Alaska Native | 12 | 0.0% |
| American | 4,246 | 4.5% |
| Apache | 55 | 0.1% |
| Arab | 634 | 0.7% |
| Argentinean | 78 | 0.1% |
| Armenian | 20 | 0.0% |
| Austrian | 208 | 0.2% |
| Bahamian | 5 | 0.0% |
| Bangladeshi | 72 | 0.1% |
| Belgian | 25 | 0.0% |
| Bhutanese | 383 | 0.4% |
| Blackfeet | 51 | 0.1% |
| Bolivian | 95 | 0.1% |
| Brazilian | 220 | 0.2% |
| British | 1,303 | 1.4% |
| Bulgarian | 55 | 0.1% |
| Burmese | 119 | 0.1% |
| Canadian | 148 | 0.2% |
| Central American | 772 | 0.8% |
| Central American Indian | 228 | 0.2% |
| Cherokee | 1,127 | 1.2% |
| Chickasaw | 49 | 0.1% |
| Chilean | 52 | 0.1% |
| Chinese | 16 | 0.0% |
| Chippewa | 7 | 0.0% |
| Choctaw | 264 | 0.3% |
| Colombian | 139 | 0.2% |
| Costa Rican | 14 | 0.0% |
| Creek | 27 | 0.0% |
| Cuban | 195 | 0.2% |
| Czech | 665 | 0.7% |
| Czechoslovakian | 54 | 0.1% |
| Danish | 389 | 0.4% |
| Delaware | 64 | 0.1% |
| Dominican | 13 | 0.0% |
| Dutch | 1,105 | 1.2% |
| Dutch West Indian | 35 | 0.0% |
| Eastern European | 77 | 0.1% |
| Ecuadorian | 64 | 0.1% |
| English | 13,411 | 14.1% |
| European | 3,038 | 3.2% |
| Fijian | 148 | 0.2% |
| Filipino | 21 | 0.0% |
| Finnish | 80 | 0.1% |
| French | 2,436 | 2.6% |
| French Canadian | 271 | 0.3% |
| German | 12,467 | 13.1% |
| German Russian | 8 | 0.0% |
| Greek | 532 | 0.6% |
| Guamanian / Chamorro | 49 | 0.1% |
| Guatemalan | 268 | 0.3% |
| Honduran | 143 | 0.2% |
| Hungarian | 279 | 0.3% |
| Icelander | 14 | 0.0% |
| Indian (Asian) | 1,080 | 1.1% |
| Indonesian | 18 | 0.0% |
| Iranian | 230 | 0.2% |
| Iraqi | 188 | 0.2% |
| Irish | 11,562 | 12.2% |
| Iroquois | 33 | 0.0% |
| Israeli | 23 | 0.0% |
| Italian | 2,414 | 2.5% |
| Jamaican | 99 | 0.1% |
| Japanese | 16 | 0.0% |
| Jordanian | 43 | 0.1% |
| Kenyan | 36 | 0.0% |
| Korean | 503 | 0.5% |
| Lebanese | 74 | 0.1% |
| Lithuanian | 84 | 0.1% |
| Malaysian | 92 | 0.1% |
| Maltese | 15 | 0.0% |
| Mexican | 4,789 | 5.0% |
| Mexican American Indian | 82 | 0.1% |
| Native Hawaiian | 91 | 0.1% |
| Navajo | 71 | 0.1% |
| Nigerian | 89 | 0.1% |
| Northern European | 125 | 0.1% |
| Norwegian | 676 | 0.7% |
| Osage | 5 | 0.0% |
| Pakistani | 70 | 0.1% |
| Palestinian | 45 | 0.1% |
| Panamanian | 129 | 0.1% |
| Peruvian | 68 | 0.1% |
| Polish | 1,262 | 1.3% |
| Portuguese | 163 | 0.2% |
| Potawatomi | 40 | 0.0% |
| Puerto Rican | 213 | 0.2% |
| Romanian | 68 | 0.1% |
| Russian | 264 | 0.3% |
| Salvadoran | 218 | 0.2% |
| Samoan | 21 | 0.0% |
| Scandinavian | 460 | 0.5% |
| Scotch-Irish | 1,422 | 1.5% |
| Scottish | 2,908 | 3.1% |
| Serbian | 65 | 0.1% |
| Slavic | 81 | 0.1% |
| Slovak | 57 | 0.1% |
| South African | 73 | 0.1% |
| South American | 594 | 0.6% |
| Spaniard | 204 | 0.2% |
| Spanish | 122 | 0.1% |
| Spanish American | 14 | 0.0% |
| Sri Lankan | 199 | 0.2% |
| Subsaharan African | 995 | 1.1% |
| Swedish | 618 | 0.6% |
| Swiss | 169 | 0.2% |
| Syrian | 55 | 0.1% |
| Thai | 377 | 0.4% |
| Tongan | 12 | 0.0% |
| Turkish | 61 | 0.1% |
| Ukrainian | 289 | 0.3% |
| Venezuelan | 98 | 0.1% |
| Vietnamese | 247 | 0.3% |
| Welsh | 1,079 | 1.1% |
| West Indian | 11 | 0.0% |
| Zimbabwean | 44 | 0.1% | View All 118 Rows |
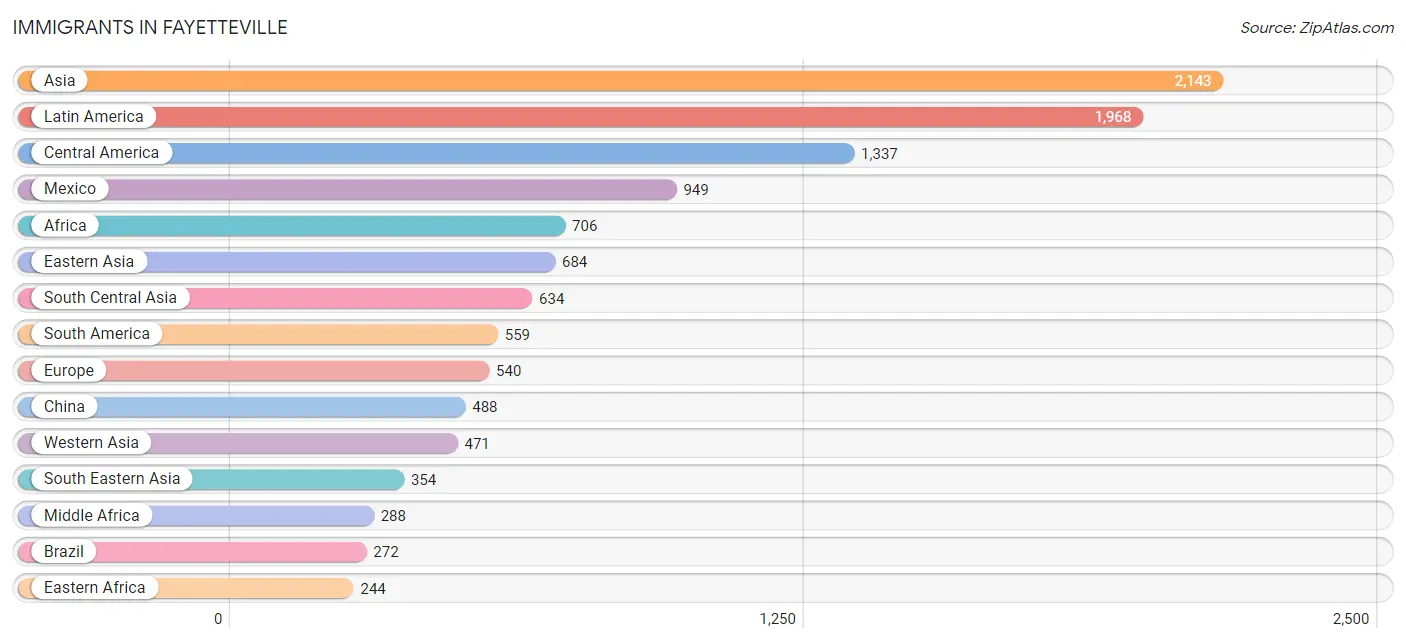
Immigrants in Fayetteville
The most numerous immigrant groups reported in Fayetteville came from Asia (2,143 | 2.3%), Latin America (1,968 | 2.1%), Central America (1,337 | 1.4%), Mexico (949 | 1.0%), and Africa (706 | 0.7%), together accounting for 7.5% of all Fayetteville residents.
| Immigration Origin | # Population | % Population |
| Afghanistan | 29 | 0.0% |
| Africa | 706 | 0.7% |
| Argentina | 68 | 0.1% |
| Asia | 2,143 | 2.3% |
| Bahamas | 5 | 0.0% |
| Bangladesh | 243 | 0.3% |
| Belarus | 3 | 0.0% |
| Belgium | 16 | 0.0% |
| Bolivia | 24 | 0.0% |
| Brazil | 272 | 0.3% |
| Bulgaria | 20 | 0.0% |
| Cameroon | 205 | 0.2% |
| Canada | 166 | 0.2% |
| Caribbean | 72 | 0.1% |
| Central America | 1,337 | 1.4% |
| China | 488 | 0.5% |
| Colombia | 44 | 0.1% |
| Congo | 10 | 0.0% |
| Costa Rica | 41 | 0.0% |
| Cuba | 16 | 0.0% |
| Denmark | 15 | 0.0% |
| Eastern Africa | 244 | 0.3% |
| Eastern Asia | 684 | 0.7% |
| Eastern Europe | 139 | 0.2% |
| Ecuador | 64 | 0.1% |
| El Salvador | 48 | 0.1% |
| England | 90 | 0.1% |
| Europe | 540 | 0.6% |
| France | 19 | 0.0% |
| Germany | 121 | 0.1% |
| Greece | 9 | 0.0% |
| Guatemala | 194 | 0.2% |
| India | 151 | 0.2% |
| Iran | 161 | 0.2% |
| Iraq | 166 | 0.2% |
| Ireland | 13 | 0.0% |
| Italy | 13 | 0.0% |
| Jamaica | 51 | 0.1% |
| Japan | 138 | 0.2% |
| Jordan | 110 | 0.1% |
| Kenya | 48 | 0.1% |
| Korea | 58 | 0.1% |
| Laos | 39 | 0.0% |
| Latin America | 1,968 | 2.1% |
| Malaysia | 35 | 0.0% |
| Mexico | 949 | 1.0% |
| Middle Africa | 288 | 0.3% |
| Moldova | 40 | 0.0% |
| Nepal | 49 | 0.1% |
| Nigeria | 89 | 0.1% |
| Northern Africa | 44 | 0.1% |
| Northern Europe | 194 | 0.2% |
| Oceania | 88 | 0.1% |
| Pakistan | 1 | 0.0% |
| Panama | 105 | 0.1% |
| Peru | 77 | 0.1% |
| Philippines | 120 | 0.1% |
| Poland | 37 | 0.0% |
| Romania | 19 | 0.0% |
| Saudi Arabia | 45 | 0.1% |
| Scotland | 29 | 0.0% |
| Singapore | 29 | 0.0% |
| South Africa | 21 | 0.0% |
| South America | 559 | 0.6% |
| South Central Asia | 634 | 0.7% |
| South Eastern Asia | 354 | 0.4% |
| Southern Europe | 51 | 0.1% |
| Spain | 29 | 0.0% |
| Taiwan | 27 | 0.0% |
| Thailand | 70 | 0.1% |
| Turkey | 61 | 0.1% |
| Ukraine | 20 | 0.0% |
| Vietnam | 61 | 0.1% |
| Western Africa | 89 | 0.1% |
| Western Asia | 471 | 0.5% |
| Western Europe | 156 | 0.2% |
| Zaire | 73 | 0.1% |
| Zimbabwe | 44 | 0.1% | View All 78 Rows |
Sex and Age in Fayetteville
Sex and Age in Fayetteville
The most populous age groups in Fayetteville are 20 to 24 Years (8,537 | 18.0%) for men and 20 to 24 Years (8,988 | 18.9%) for women.
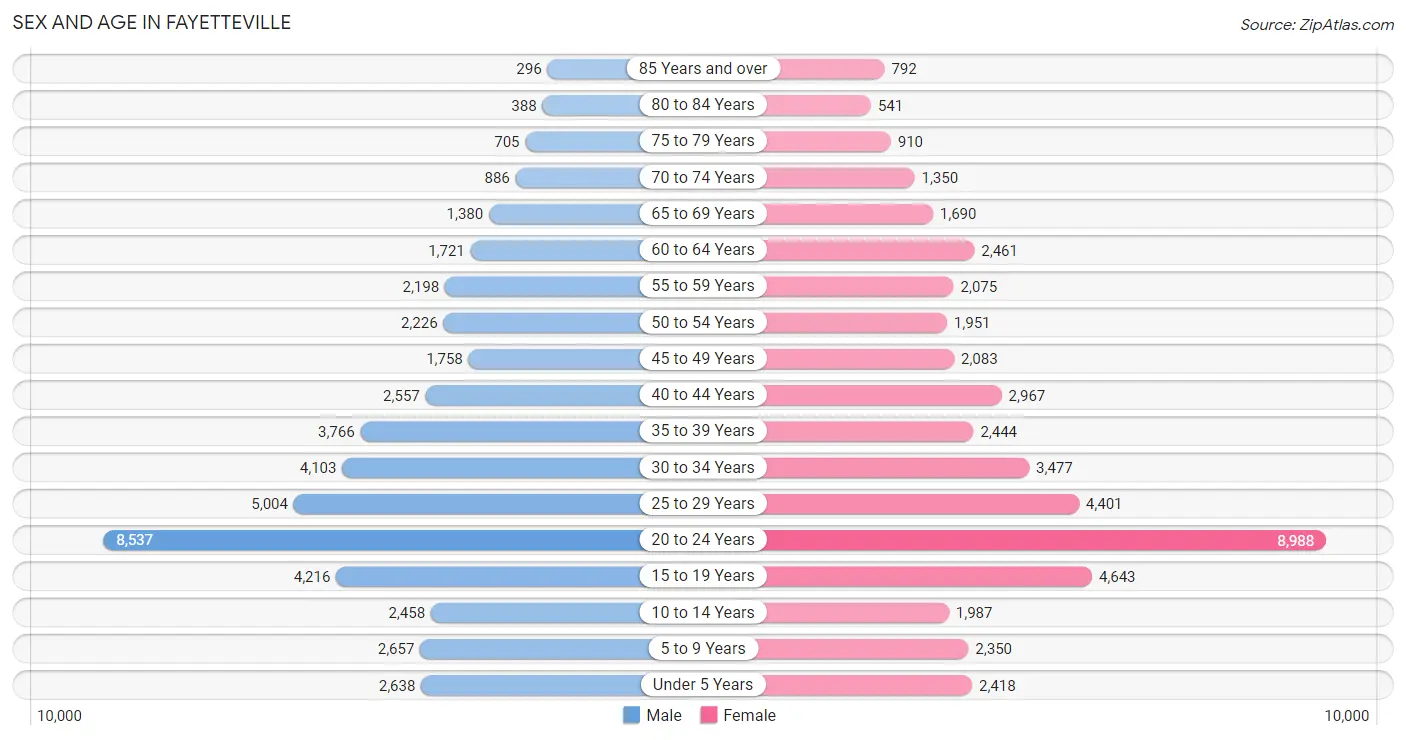
| Age Bracket | Male | Female |
| Under 5 Years | 2,638 (5.6%) | 2,418 (5.1%) |
| 5 to 9 Years | 2,657 (5.6%) | 2,350 (4.9%) |
| 10 to 14 Years | 2,458 (5.2%) | 1,987 (4.2%) |
| 15 to 19 Years | 4,216 (8.9%) | 4,643 (9.8%) |
| 20 to 24 Years | 8,537 (18.0%) | 8,988 (18.9%) |
| 25 to 29 Years | 5,004 (10.5%) | 4,401 (9.3%) |
| 30 to 34 Years | 4,103 (8.6%) | 3,477 (7.3%) |
| 35 to 39 Years | 3,766 (7.9%) | 2,444 (5.1%) |
| 40 to 44 Years | 2,557 (5.4%) | 2,967 (6.2%) |
| 45 to 49 Years | 1,758 (3.7%) | 2,083 (4.4%) |
| 50 to 54 Years | 2,226 (4.7%) | 1,951 (4.1%) |
| 55 to 59 Years | 2,198 (4.6%) | 2,075 (4.4%) |
| 60 to 64 Years | 1,721 (3.6%) | 2,461 (5.2%) |
| 65 to 69 Years | 1,380 (2.9%) | 1,690 (3.6%) |
| 70 to 74 Years | 886 (1.9%) | 1,350 (2.8%) |
| 75 to 79 Years | 705 (1.5%) | 910 (1.9%) |
| 80 to 84 Years | 388 (0.8%) | 541 (1.1%) |
| 85 Years and over | 296 (0.6%) | 792 (1.7%) |
| Total | 47,494 (100.0%) | 47,528 (100.0%) |
Families and Households in Fayetteville
Median Family Size in Fayetteville
The median family size in Fayetteville is 2.87 persons per family, with married-couple families (13,728 | 72.4%) accounting for the largest median family size of 2.97 persons per family. On the other hand, single male/father families (2,036 | 10.7%) represent the smallest median family size with 2.41 persons per family.
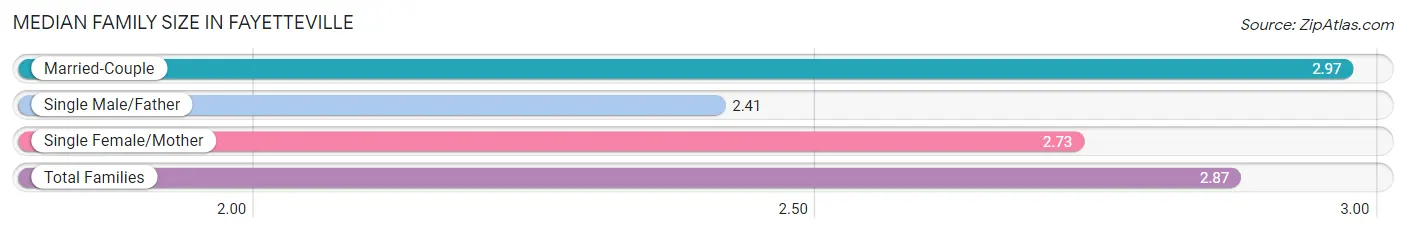
| Family Type | # Families | Family Size |
| Married-Couple | 13,728 (72.4%) | 2.97 |
| Single Male/Father | 2,036 (10.7%) | 2.41 |
| Single Female/Mother | 3,199 (16.9%) | 2.73 |
| Total Families | 18,963 (100.0%) | 2.87 |
Median Household Size in Fayetteville
The median household size in Fayetteville is 2.21 persons per household, with married-couple households (13,728 | 34.5%) accounting for the largest median household size of 2.97 persons per household. non-family households (20,800 | 52.3%) represent the smallest median household size with 1.54 persons per household.
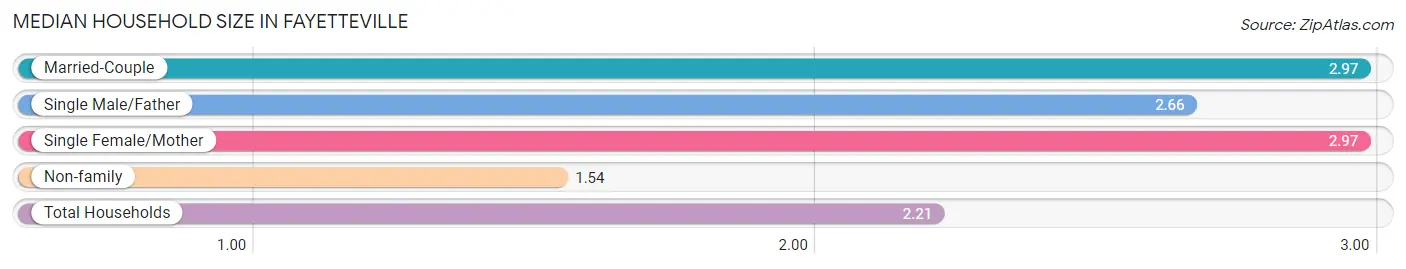
| Household Type | # Households | Household Size |
| Married-Couple | 13,728 (34.5%) | 2.97 |
| Single Male/Father | 2,036 (5.1%) | 2.66 |
| Single Female/Mother | 3,199 (8.1%) | 2.97 |
| Non-family | 20,800 (52.3%) | 1.54 |
| Total Households | 39,763 (100.0%) | 2.21 |
Household Size by Marriage Status in Fayetteville
Out of a total of 39,763 households in Fayetteville, 18,963 (47.7%) are family households, while 20,800 (52.3%) are nonfamily households. The most numerous type of family households are 2-person households, comprising 9,085, and the most common type of nonfamily households are 1-person households, comprising 13,874.
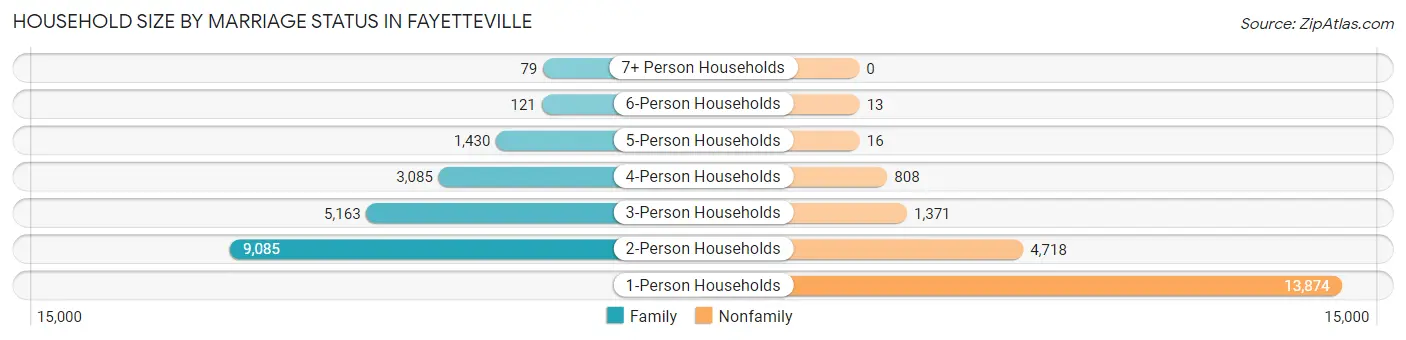
| Household Size | Family Households | Nonfamily Households |
| 1-Person Households | - | 13,874 (34.9%) |
| 2-Person Households | 9,085 (22.9%) | 4,718 (11.9%) |
| 3-Person Households | 5,163 (13.0%) | 1,371 (3.5%) |
| 4-Person Households | 3,085 (7.8%) | 808 (2.0%) |
| 5-Person Households | 1,430 (3.6%) | 16 (0.0%) |
| 6-Person Households | 121 (0.3%) | 13 (0.0%) |
| 7+ Person Households | 79 (0.2%) | 0 (0.0%) |
| Total | 18,963 (47.7%) | 20,800 (52.3%) |
Female Fertility in Fayetteville
Fertility by Age in Fayetteville
Average fertility rate in Fayetteville is 42.0 births per 1,000 women. Women in the age bracket of 20 to 34 years have the highest fertility rate with 61.0 births per 1,000 women. Women in the age bracket of 20 to 34 years acount for 83.9% of all women with births.
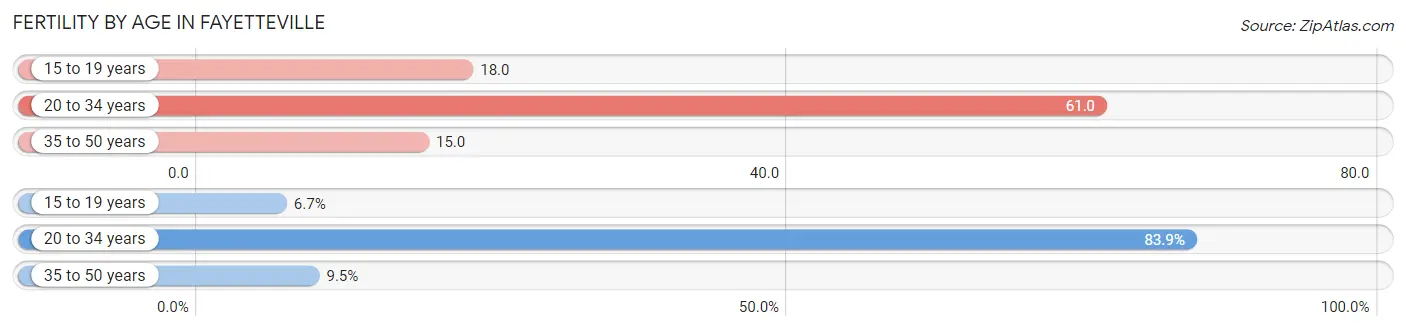
| Age Bracket | Women with Births | Births / 1,000 Women |
| 15 to 19 years | 82 (6.7%) | 18.0 |
| 20 to 34 years | 1,028 (83.9%) | 61.0 |
| 35 to 50 years | 116 (9.5%) | 15.0 |
| Total | 1,226 (100.0%) | 42.0 |
Fertility by Age by Marriage Status in Fayetteville
71.4% of women with births (1,226) in Fayetteville are married. The highest percentage of unmarried women with births falls into 15 to 19 years age bracket with 34.2% of them unmarried at the time of birth, while the lowest percentage of unmarried women with births belong to 35 to 50 years age bracket with 0.0% of them unmarried.
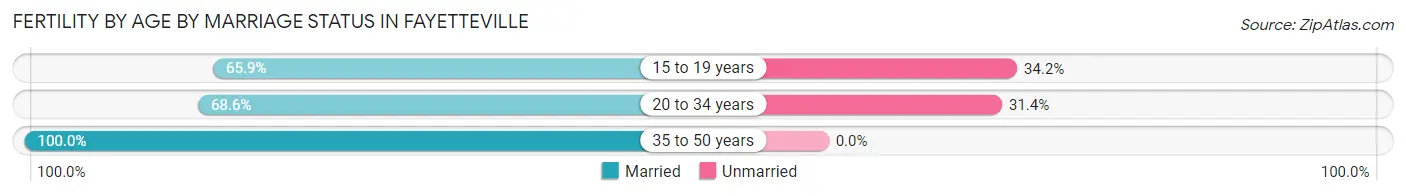
| Age Bracket | Married | Unmarried |
| 15 to 19 years | 54 (65.8%) | 28 (34.2%) |
| 20 to 34 years | 705 (68.6%) | 323 (31.4%) |
| 35 to 50 years | 116 (100.0%) | 0 (0.0%) |
| Total | 875 (71.4%) | 351 (28.6%) |
Fertility by Education in Fayetteville
Average fertility rate in Fayetteville is 42.0 births per 1,000 women. Women with the education attainment of high school diploma have the highest fertility rate of 64.0 births per 1,000 women, while women with the education attainment of less than high school have the lowest fertility at 22.0 births per 1,000 women. Women with the education attainment of college or associate's degree represent 34.3% of all women with births.
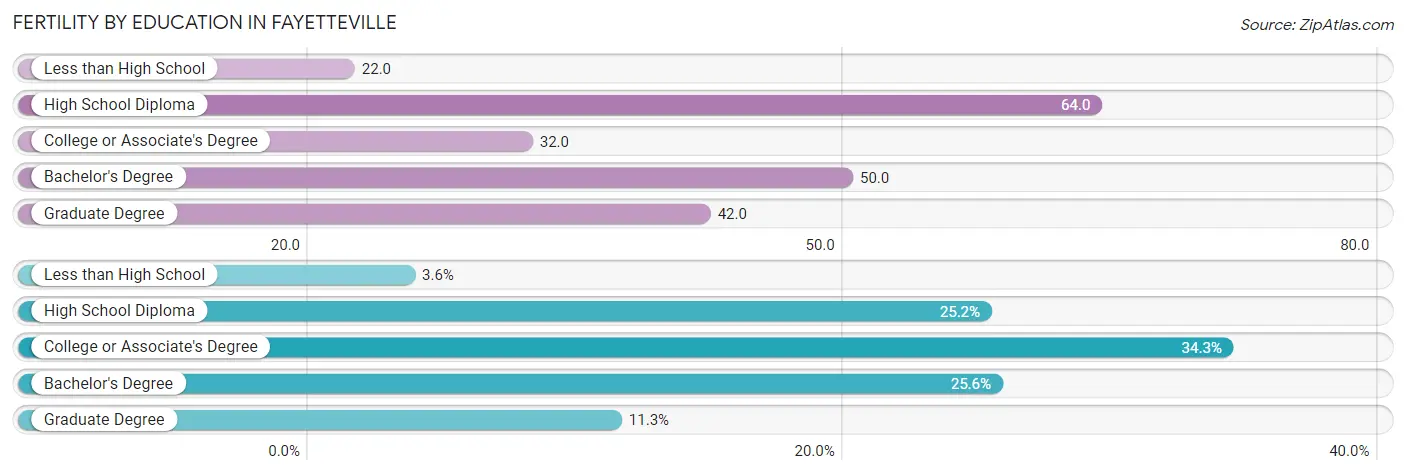
| Educational Attainment | Women with Births | Births / 1,000 Women |
| Less than High School | 44 (3.6%) | 22.0 |
| High School Diploma | 309 (25.2%) | 64.0 |
| College or Associate's Degree | 420 (34.3%) | 32.0 |
| Bachelor's Degree | 314 (25.6%) | 50.0 |
| Graduate Degree | 139 (11.3%) | 42.0 |
| Total | 1,226 (100.0%) | 42.0 |
Fertility by Education by Marriage Status in Fayetteville
28.6% of women with births in Fayetteville are unmarried. Women with the educational attainment of bachelor's degree are most likely to be married with 100.0% of them married at childbirth, while women with the educational attainment of high school diploma are least likely to be married with 70.2% of them unmarried at childbirth.
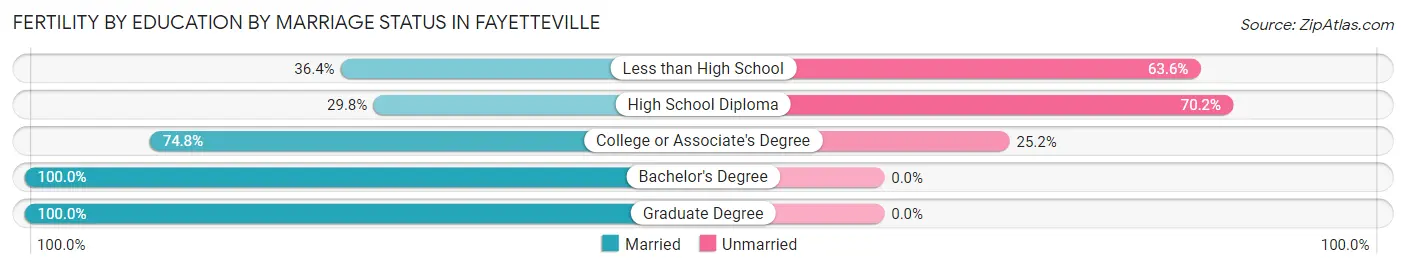
| Educational Attainment | Married | Unmarried |
| Less than High School | 16 (36.4%) | 28 (63.6%) |
| High School Diploma | 92 (29.8%) | 217 (70.2%) |
| College or Associate's Degree | 314 (74.8%) | 106 (25.2%) |
| Bachelor's Degree | 314 (100.0%) | 0 (0.0%) |
| Graduate Degree | 139 (100.0%) | 0 (0.0%) |
| Total | 875 (71.4%) | 351 (28.6%) |
Employment Characteristics in Fayetteville
Employment by Class of Employer in Fayetteville
Among the 49,098 employed individuals in Fayetteville, private company employees (32,284 | 65.7%), not-for-profit organizations (4,716 | 9.6%), and state government employees (4,403 | 9.0%) make up the most common classes of employment.
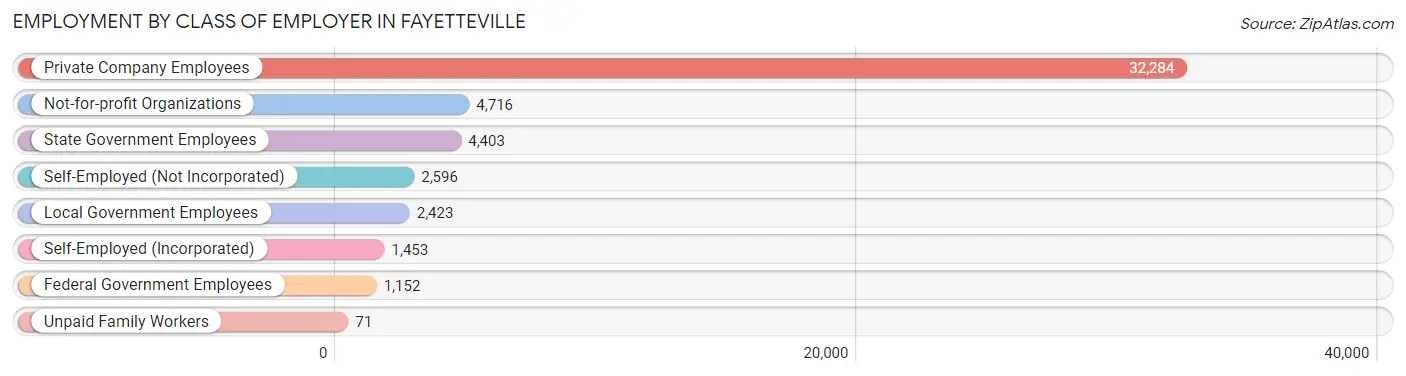
| Employer Class | # Employees | % Employees |
| Private Company Employees | 32,284 | 65.7% |
| Self-Employed (Incorporated) | 1,453 | 3.0% |
| Self-Employed (Not Incorporated) | 2,596 | 5.3% |
| Not-for-profit Organizations | 4,716 | 9.6% |
| Local Government Employees | 2,423 | 4.9% |
| State Government Employees | 4,403 | 9.0% |
| Federal Government Employees | 1,152 | 2.4% |
| Unpaid Family Workers | 71 | 0.1% |
| Total | 49,098 | 100.0% |
Employment Status by Age in Fayetteville
According to the labor force statistics for Fayetteville, out of the total population over 16 years of age (79,846), 65.7% or 52,459 individuals are in the labor force, with 5.3% or 2,780 of them unemployed. The age group with the highest labor force participation rate is 25 to 29 years, with 88.0% or 8,276 individuals in the labor force. Within the labor force, the 16 to 19 years age range has the highest percentage of unemployed individuals, with 24.1% or 665 of them being unemployed.
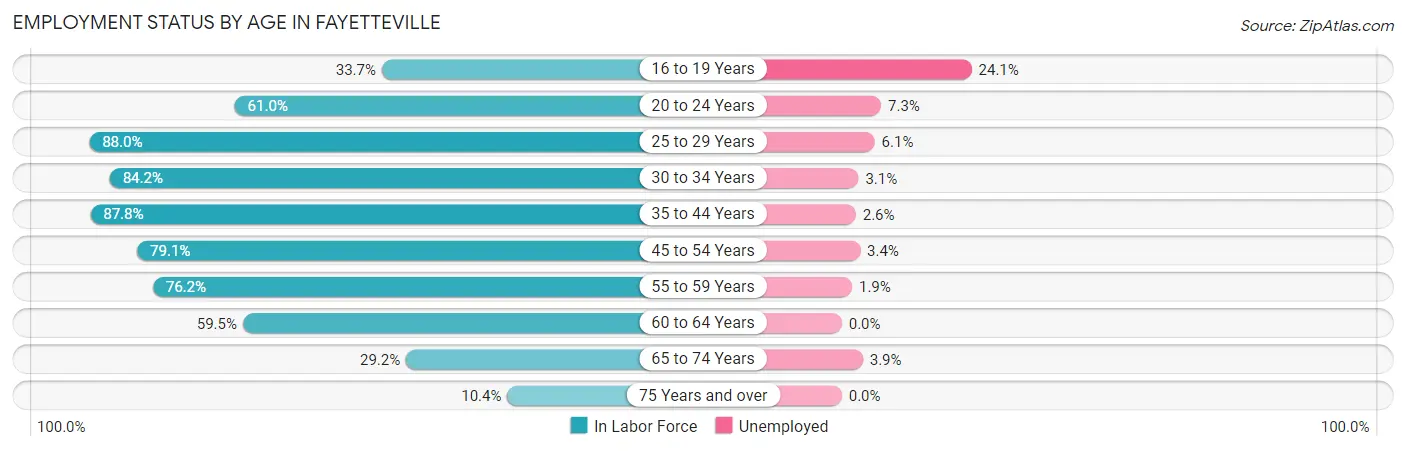
| Age Bracket | In Labor Force | Unemployed |
| 16 to 19 Years | 2,760 (33.7%) | 665 (24.1%) |
| 20 to 24 Years | 10,690 (61.0%) | 780 (7.3%) |
| 25 to 29 Years | 8,276 (88.0%) | 505 (6.1%) |
| 30 to 34 Years | 6,382 (84.2%) | 198 (3.1%) |
| 35 to 44 Years | 10,302 (87.8%) | 268 (2.6%) |
| 45 to 54 Years | 6,342 (79.1%) | 216 (3.4%) |
| 55 to 59 Years | 3,256 (76.2%) | 62 (1.9%) |
| 60 to 64 Years | 2,488 (59.5%) | 0 (0.0%) |
| 65 to 74 Years | 1,549 (29.2%) | 60 (3.9%) |
| 75 Years and over | 378 (10.4%) | 0 (0.0%) |
| Total | 52,459 (65.7%) | 2,780 (5.3%) |
Employment Status by Educational Attainment in Fayetteville
According to labor force statistics for Fayetteville, 82.0% of individuals (37,057) out of the total population between 25 and 64 years of age (45,192) are in the labor force, with 3.4% or 1,260 of them being unemployed. The group with the highest labor force participation rate are those with the educational attainment of bachelor's degree or higher, with 87.8% or 20,427 individuals in the labor force. Within the labor force, individuals with high school diploma education have the highest percentage of unemployment, with 7.8% or 509 of them being unemployed.
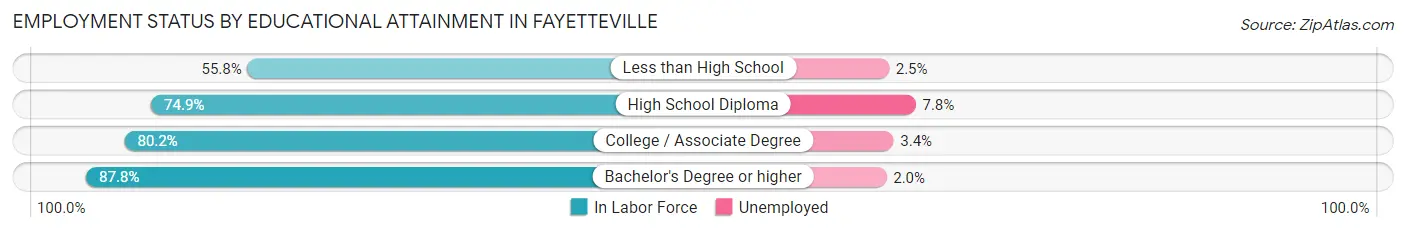
| Educational Attainment | In Labor Force | Unemployed |
| Less than High School | 1,152 (55.8%) | 52 (2.5%) |
| High School Diploma | 6,528 (74.9%) | 680 (7.8%) |
| College / Associate Degree | 8,940 (80.2%) | 379 (3.4%) |
| Bachelor's Degree or higher | 20,427 (87.8%) | 465 (2.0%) |
| Total | 37,057 (82.0%) | 1,537 (3.4%) |
Employment Occupations by Sex in Fayetteville
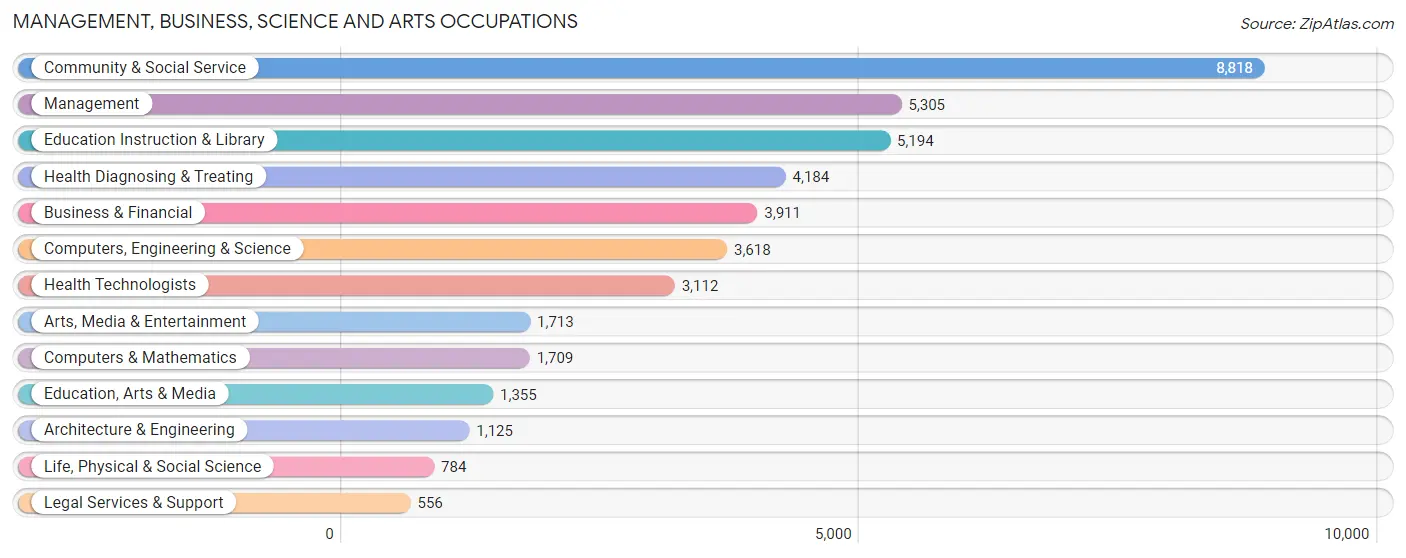
Management, Business, Science and Arts Occupations
The most common Management, Business, Science and Arts occupations in Fayetteville are Community & Social Service (8,818 | 17.8%), Management (5,305 | 10.7%), Education Instruction & Library (5,194 | 10.5%), Health Diagnosing & Treating (4,184 | 8.4%), and Business & Financial (3,911 | 7.9%).
Management, Business, Science and Arts Occupations by Sex
Within the Management, Business, Science and Arts occupations in Fayetteville, the most male-oriented occupations are Computers & Mathematics (79.2%), Computers, Engineering & Science (73.6%), and Life, Physical & Social Science (70.3%), while the most female-oriented occupations are Health Technologists (79.9%), Health Diagnosing & Treating (75.8%), and Education, Arts & Media (73.0%).
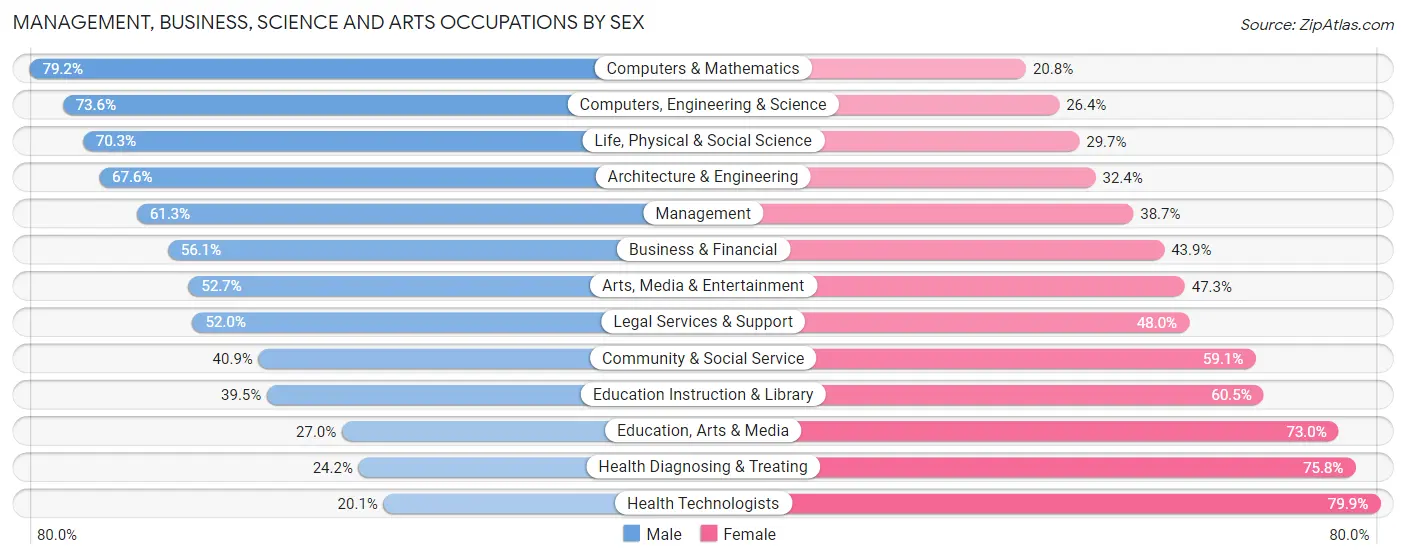
| Occupation | Male | Female |
| Management | 3,250 (61.3%) | 2,055 (38.7%) |
| Business & Financial | 2,194 (56.1%) | 1,717 (43.9%) |
| Computers, Engineering & Science | 2,664 (73.6%) | 954 (26.4%) |
| Computers & Mathematics | 1,353 (79.2%) | 356 (20.8%) |
| Architecture & Engineering | 760 (67.6%) | 365 (32.4%) |
| Life, Physical & Social Science | 551 (70.3%) | 233 (29.7%) |
| Community & Social Service | 3,610 (40.9%) | 5,208 (59.1%) |
| Education, Arts & Media | 366 (27.0%) | 989 (73.0%) |
| Legal Services & Support | 289 (52.0%) | 267 (48.0%) |
| Education Instruction & Library | 2,053 (39.5%) | 3,141 (60.5%) |
| Arts, Media & Entertainment | 902 (52.7%) | 811 (47.3%) |
| Health Diagnosing & Treating | 1,014 (24.2%) | 3,170 (75.8%) |
| Health Technologists | 625 (20.1%) | 2,487 (79.9%) |
| Total (Category) | 12,732 (49.3%) | 13,104 (50.7%) |
| Total (Overall) | 25,917 (52.2%) | 23,707 (47.8%) |
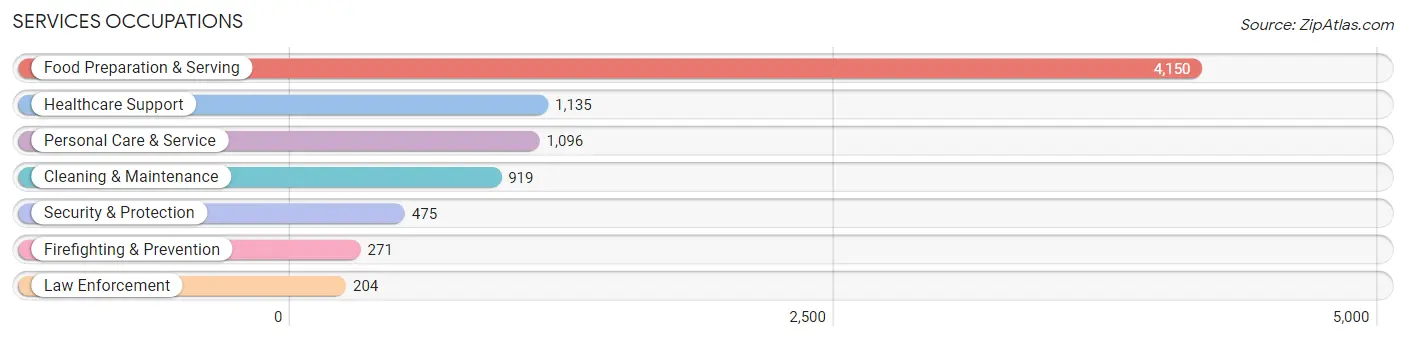
Services Occupations
The most common Services occupations in Fayetteville are Food Preparation & Serving (4,150 | 8.4%), Healthcare Support (1,135 | 2.3%), Personal Care & Service (1,096 | 2.2%), Cleaning & Maintenance (919 | 1.8%), and Security & Protection (475 | 1.0%).
Services Occupations by Sex
Within the Services occupations in Fayetteville, the most male-oriented occupations are Law Enforcement (82.8%), Security & Protection (63.4%), and Cleaning & Maintenance (62.9%), while the most female-oriented occupations are Healthcare Support (90.6%), Personal Care & Service (85.7%), and Firefighting & Prevention (51.3%).
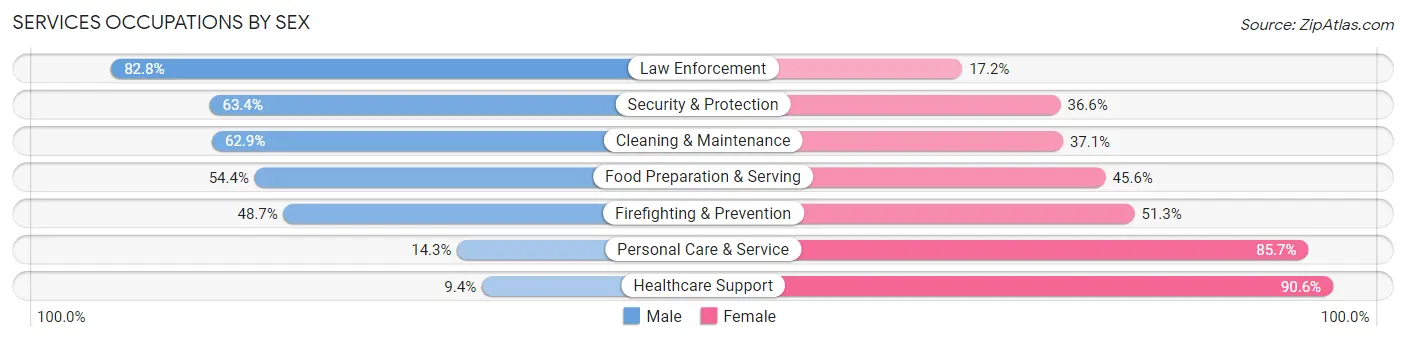
| Occupation | Male | Female |
| Healthcare Support | 107 (9.4%) | 1,028 (90.6%) |
| Security & Protection | 301 (63.4%) | 174 (36.6%) |
| Firefighting & Prevention | 132 (48.7%) | 139 (51.3%) |
| Law Enforcement | 169 (82.8%) | 35 (17.2%) |
| Food Preparation & Serving | 2,259 (54.4%) | 1,891 (45.6%) |
| Cleaning & Maintenance | 578 (62.9%) | 341 (37.1%) |
| Personal Care & Service | 157 (14.3%) | 939 (85.7%) |
| Total (Category) | 3,402 (43.8%) | 4,373 (56.2%) |
| Total (Overall) | 25,917 (52.2%) | 23,707 (47.8%) |
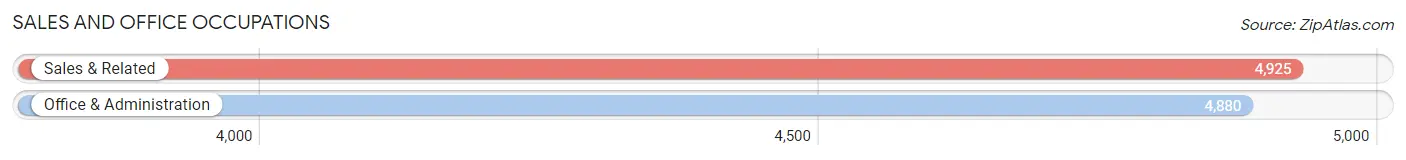
Sales and Office Occupations
The most common Sales and Office occupations in Fayetteville are Sales & Related (4,925 | 9.9%), and Office & Administration (4,880 | 9.8%).
Sales and Office Occupations by Sex
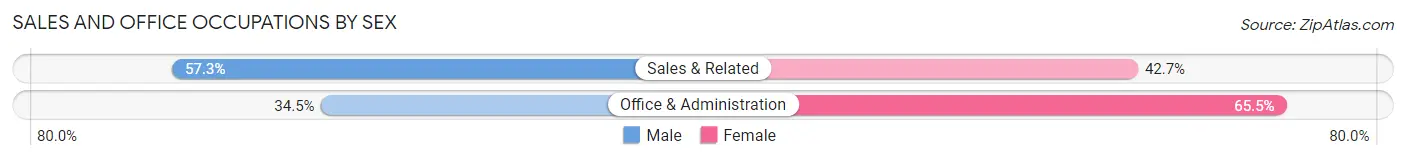
| Occupation | Male | Female |
| Sales & Related | 2,823 (57.3%) | 2,102 (42.7%) |
| Office & Administration | 1,683 (34.5%) | 3,197 (65.5%) |
| Total (Category) | 4,506 (46.0%) | 5,299 (54.0%) |
| Total (Overall) | 25,917 (52.2%) | 23,707 (47.8%) |
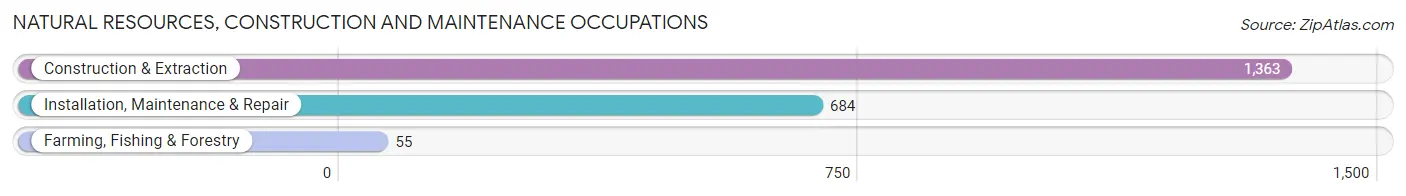
Natural Resources, Construction and Maintenance Occupations
The most common Natural Resources, Construction and Maintenance occupations in Fayetteville are Construction & Extraction (1,363 | 2.8%), Installation, Maintenance & Repair (684 | 1.4%), and Farming, Fishing & Forestry (55 | 0.1%).
Natural Resources, Construction and Maintenance Occupations by Sex
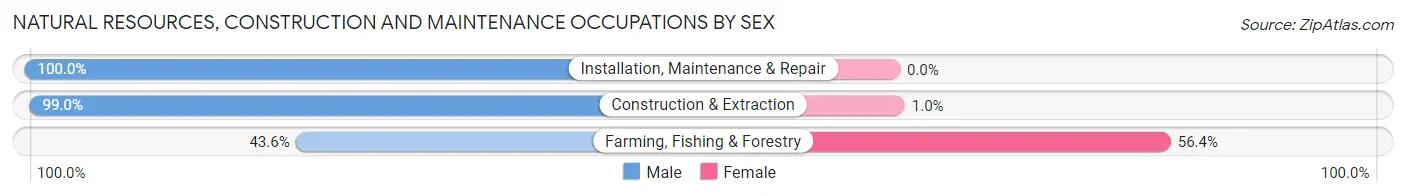
| Occupation | Male | Female |
| Farming, Fishing & Forestry | 24 (43.6%) | 31 (56.4%) |
| Construction & Extraction | 1,349 (99.0%) | 14 (1.0%) |
| Installation, Maintenance & Repair | 684 (100.0%) | 0 (0.0%) |
| Total (Category) | 2,057 (97.9%) | 45 (2.1%) |
| Total (Overall) | 25,917 (52.2%) | 23,707 (47.8%) |
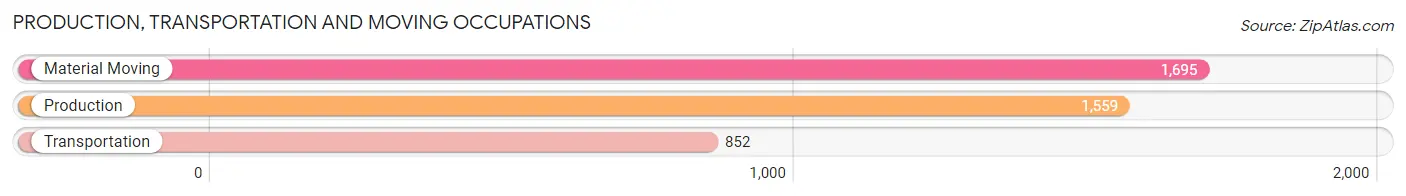
Production, Transportation and Moving Occupations
The most common Production, Transportation and Moving occupations in Fayetteville are Material Moving (1,695 | 3.4%), Production (1,559 | 3.1%), and Transportation (852 | 1.7%).
Production, Transportation and Moving Occupations by Sex
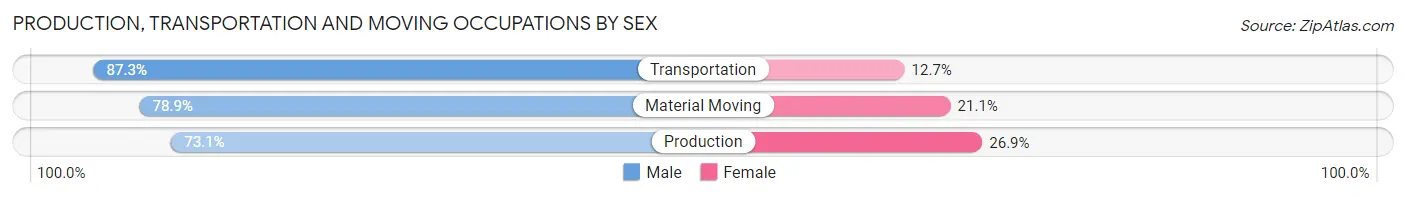
| Occupation | Male | Female |
| Production | 1,139 (73.1%) | 420 (26.9%) |
| Transportation | 744 (87.3%) | 108 (12.7%) |
| Material Moving | 1,337 (78.9%) | 358 (21.1%) |
| Total (Category) | 3,220 (78.4%) | 886 (21.6%) |
| Total (Overall) | 25,917 (52.2%) | 23,707 (47.8%) |
Employment Industries by Sex in Fayetteville
Employment Industries in Fayetteville
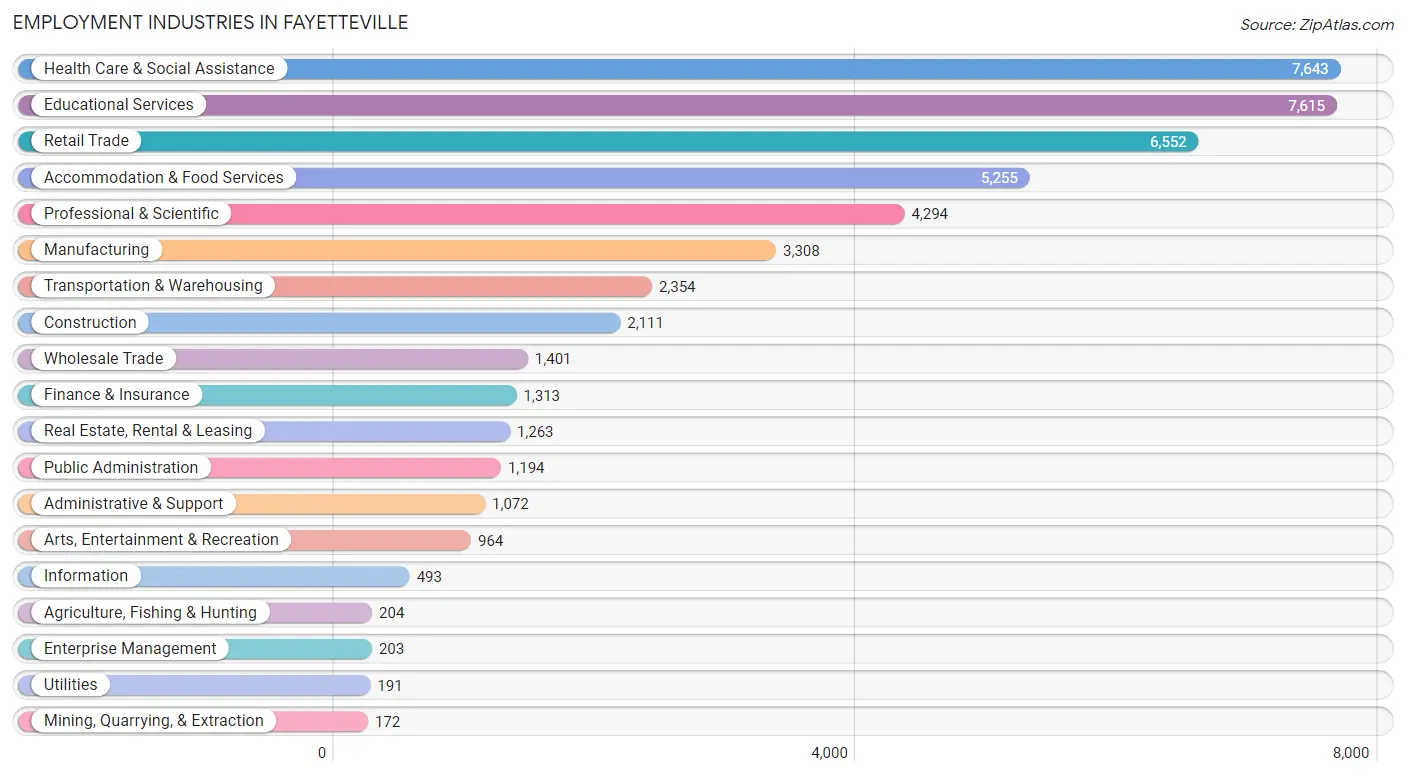
The major employment industries in Fayetteville include Health Care & Social Assistance (7,643 | 15.4%), Educational Services (7,615 | 15.3%), Retail Trade (6,552 | 13.2%), Accommodation & Food Services (5,255 | 10.6%), and Professional & Scientific (4,294 | 8.6%).
Employment Industries by Sex in Fayetteville
The Fayetteville industries that see more men than women are Mining, Quarrying, & Extraction (100.0%), Construction (94.9%), and Utilities (73.8%), whereas the industries that tend to have a higher number of women are Health Care & Social Assistance (79.1%), Enterprise Management (66.0%), and Agriculture, Fishing & Hunting (56.9%).
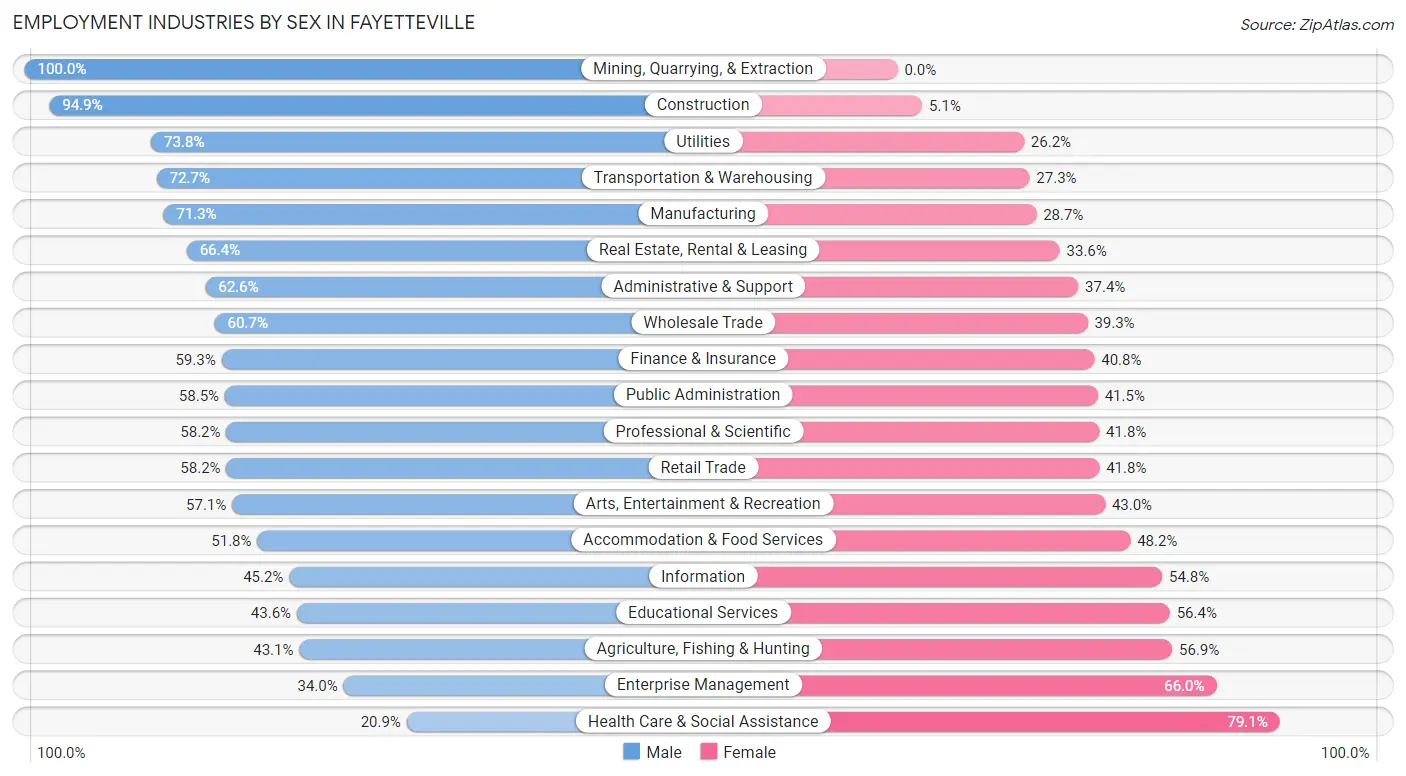
| Industry | Male | Female |
| Agriculture, Fishing & Hunting | 88 (43.1%) | 116 (56.9%) |
| Mining, Quarrying, & Extraction | 172 (100.0%) | 0 (0.0%) |
| Construction | 2,003 (94.9%) | 108 (5.1%) |
| Manufacturing | 2,358 (71.3%) | 950 (28.7%) |
| Wholesale Trade | 850 (60.7%) | 551 (39.3%) |
| Retail Trade | 3,815 (58.2%) | 2,737 (41.8%) |
| Transportation & Warehousing | 1,711 (72.7%) | 643 (27.3%) |
| Utilities | 141 (73.8%) | 50 (26.2%) |
| Information | 223 (45.2%) | 270 (54.8%) |
| Finance & Insurance | 778 (59.3%) | 535 (40.7%) |
| Real Estate, Rental & Leasing | 839 (66.4%) | 424 (33.6%) |
| Professional & Scientific | 2,501 (58.2%) | 1,793 (41.8%) |
| Enterprise Management | 69 (34.0%) | 134 (66.0%) |
| Administrative & Support | 671 (62.6%) | 401 (37.4%) |
| Educational Services | 3,323 (43.6%) | 4,292 (56.4%) |
| Health Care & Social Assistance | 1,598 (20.9%) | 6,045 (79.1%) |
| Arts, Entertainment & Recreation | 550 (57.1%) | 414 (42.9%) |
| Accommodation & Food Services | 2,723 (51.8%) | 2,532 (48.2%) |
| Public Administration | 699 (58.5%) | 495 (41.5%) |
| Total | 25,917 (52.2%) | 23,707 (47.8%) |
Education in Fayetteville
School Enrollment in Fayetteville
The most common levels of schooling among the 34,079 students in Fayetteville are college / undergraduate (18,022 | 52.9%), elementary school (4,077 | 12.0%), and graduate / professional (3,300 | 9.7%).
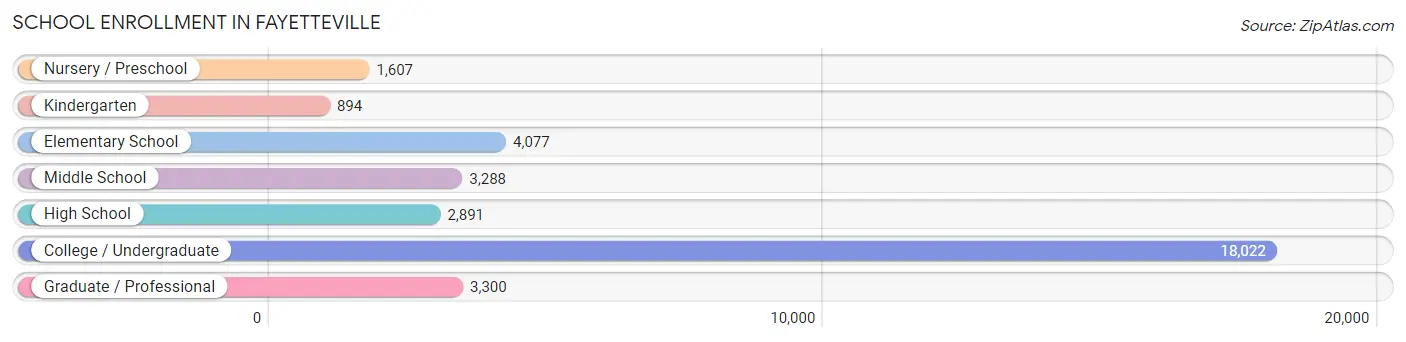
| School Level | # Students | % Students |
| Nursery / Preschool | 1,607 | 4.7% |
| Kindergarten | 894 | 2.6% |
| Elementary School | 4,077 | 12.0% |
| Middle School | 3,288 | 9.7% |
| High School | 2,891 | 8.5% |
| College / Undergraduate | 18,022 | 52.9% |
| Graduate / Professional | 3,300 | 9.7% |
| Total | 34,079 | 100.0% |
School Enrollment by Age by Funding Source in Fayetteville
Out of a total of 34,079 students who are enrolled in schools in Fayetteville, 2,897 (8.5%) attend a private institution, while the remaining 31,182 (91.5%) are enrolled in public schools. The age group of 3 to 4 year olds has the highest likelihood of being enrolled in private schools, with 684 (53.8% in the age bracket) enrolled. Conversely, the age group of 18 to 19 year olds has the lowest likelihood of being enrolled in a private school, with 6,077 (99.2% in the age bracket) attending a public institution.
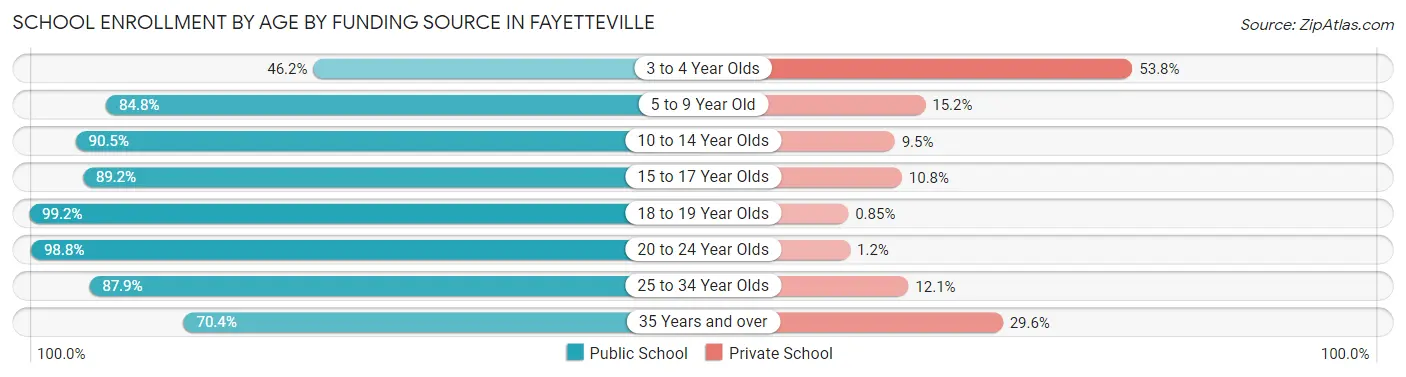
| Age Bracket | Public School | Private School |
| 3 to 4 Year Olds | 588 (46.2%) | 684 (53.8%) |
| 5 to 9 Year Old | 4,028 (84.8%) | 722 (15.2%) |
| 10 to 14 Year Olds | 3,911 (90.5%) | 411 (9.5%) |
| 15 to 17 Year Olds | 1,743 (89.2%) | 212 (10.8%) |
| 18 to 19 Year Olds | 6,077 (99.2%) | 52 (0.9%) |
| 20 to 24 Year Olds | 11,323 (98.8%) | 138 (1.2%) |
| 25 to 34 Year Olds | 2,880 (87.9%) | 395 (12.1%) |
| 35 Years and over | 644 (70.4%) | 271 (29.6%) |
| Total | 31,182 (91.5%) | 2,897 (8.5%) |
Educational Attainment by Field of Study in Fayetteville
Business (5,105 | 17.0%), education (3,552 | 11.8%), social sciences (2,545 | 8.5%), science & technology (2,452 | 8.2%), and bio, nature & agricultural (2,205 | 7.3%) are the most common fields of study among 30,013 individuals in Fayetteville who have obtained a bachelor's degree or higher.
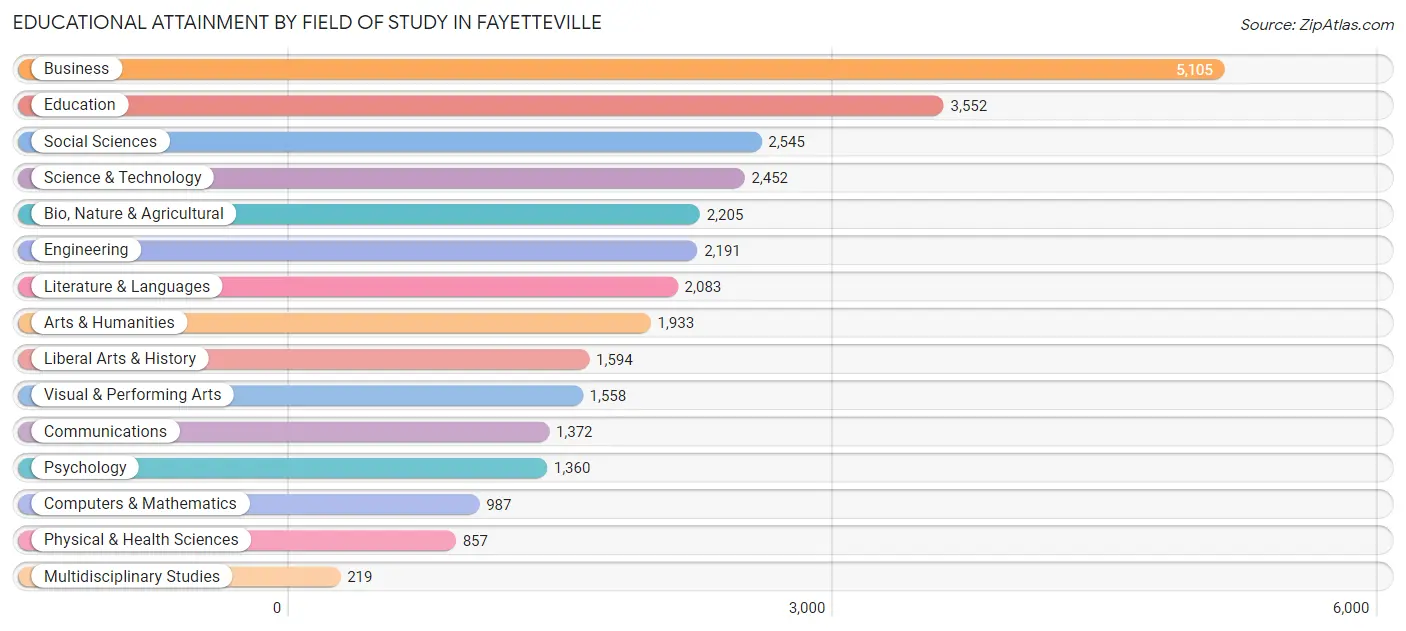
| Field of Study | # Graduates | % Graduates |
| Computers & Mathematics | 987 | 3.3% |
| Bio, Nature & Agricultural | 2,205 | 7.3% |
| Physical & Health Sciences | 857 | 2.9% |
| Psychology | 1,360 | 4.5% |
| Social Sciences | 2,545 | 8.5% |
| Engineering | 2,191 | 7.3% |
| Multidisciplinary Studies | 219 | 0.7% |
| Science & Technology | 2,452 | 8.2% |
| Business | 5,105 | 17.0% |
| Education | 3,552 | 11.8% |
| Literature & Languages | 2,083 | 6.9% |
| Liberal Arts & History | 1,594 | 5.3% |
| Visual & Performing Arts | 1,558 | 5.2% |
| Communications | 1,372 | 4.6% |
| Arts & Humanities | 1,933 | 6.4% |
| Total | 30,013 | 100.0% |
Transportation & Commute in Fayetteville
Vehicle Availability by Sex in Fayetteville
The most prevalent vehicle ownership categories in Fayetteville are males with 2 vehicles (11,959, accounting for 48.1%) and females with 2 vehicles (11,372, making up 51.9%).
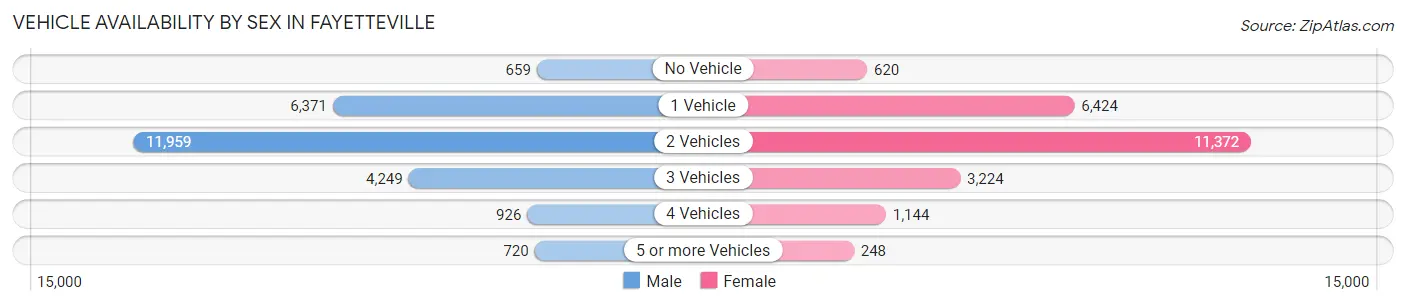
| Vehicles Available | Male | Female |
| No Vehicle | 659 (2.6%) | 620 (2.7%) |
| 1 Vehicle | 6,371 (25.6%) | 6,424 (27.9%) |
| 2 Vehicles | 11,959 (48.1%) | 11,372 (49.4%) |
| 3 Vehicles | 4,249 (17.1%) | 3,224 (14.0%) |
| 4 Vehicles | 926 (3.7%) | 1,144 (5.0%) |
| 5 or more Vehicles | 720 (2.9%) | 248 (1.1%) |
| Total | 24,884 (100.0%) | 23,032 (100.0%) |
Commute Time in Fayetteville
The most frequently occuring commute durations in Fayetteville are 10 to 14 minutes (10,433 commuters, 24.4%), 15 to 19 minutes (9,619 commuters, 22.5%), and 5 to 9 minutes (5,211 commuters, 12.2%).
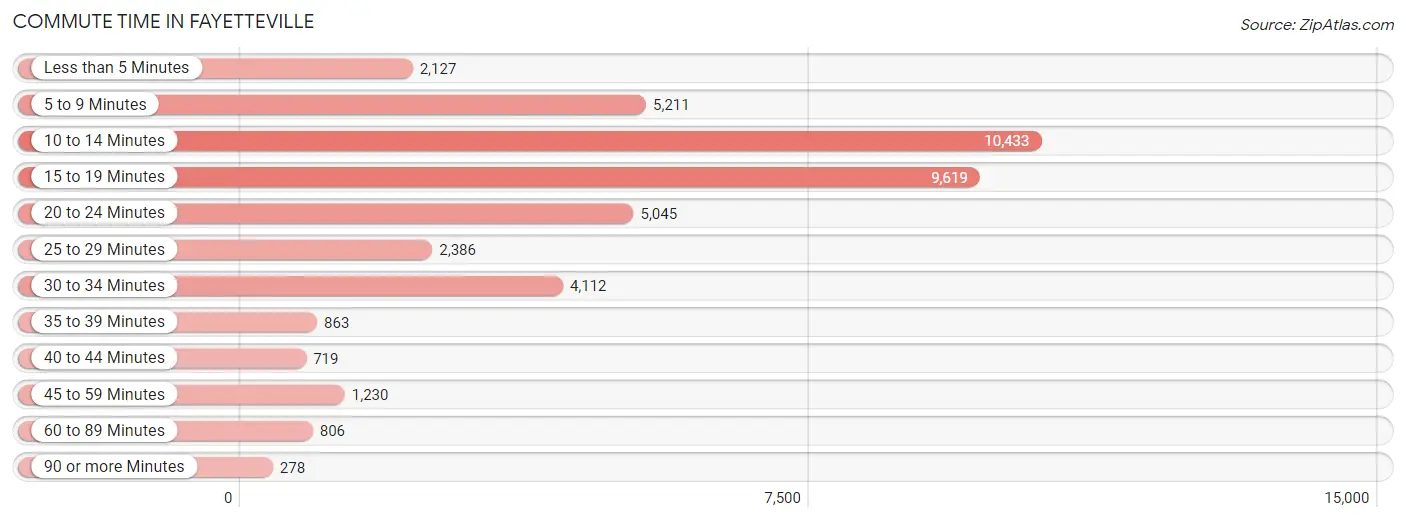
| Commute Time | # Commuters | % Commuters |
| Less than 5 Minutes | 2,127 | 5.0% |
| 5 to 9 Minutes | 5,211 | 12.2% |
| 10 to 14 Minutes | 10,433 | 24.4% |
| 15 to 19 Minutes | 9,619 | 22.5% |
| 20 to 24 Minutes | 5,045 | 11.8% |
| 25 to 29 Minutes | 2,386 | 5.6% |
| 30 to 34 Minutes | 4,112 | 9.6% |
| 35 to 39 Minutes | 863 | 2.0% |
| 40 to 44 Minutes | 719 | 1.7% |
| 45 to 59 Minutes | 1,230 | 2.9% |
| 60 to 89 Minutes | 806 | 1.9% |
| 90 or more Minutes | 278 | 0.6% |
Commute Time by Sex in Fayetteville
The most common commute times in Fayetteville are 10 to 14 minutes (4,963 commuters, 22.2%) for males and 10 to 14 minutes (5,470 commuters, 26.8%) for females.
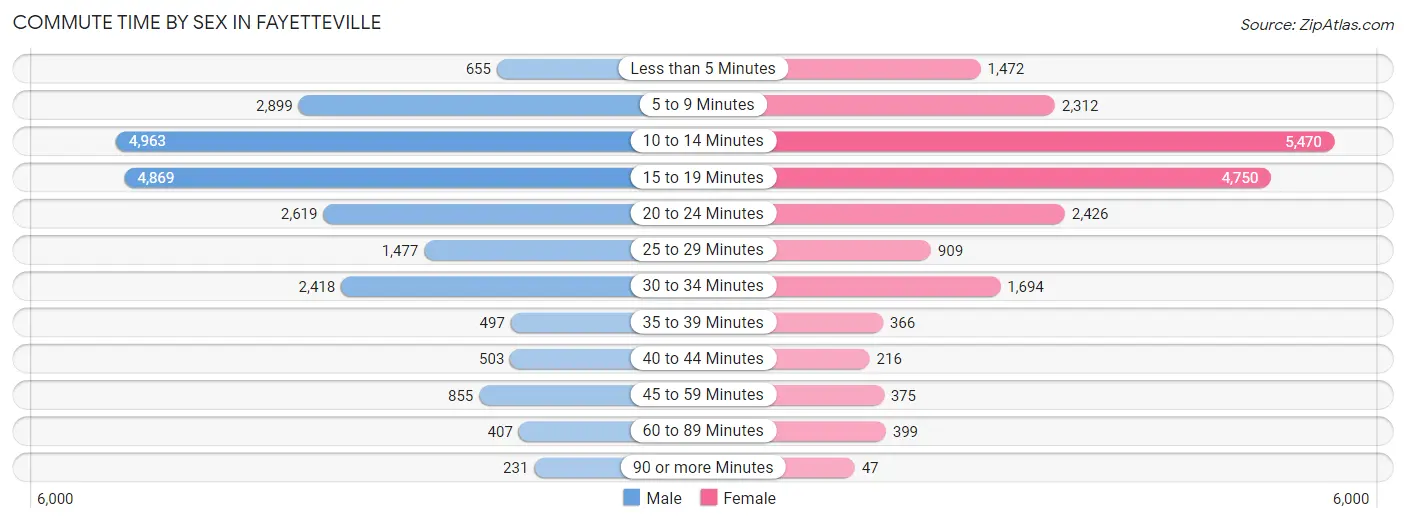
| Commute Time | Male | Female |
| Less than 5 Minutes | 655 (2.9%) | 1,472 (7.2%) |
| 5 to 9 Minutes | 2,899 (13.0%) | 2,312 (11.3%) |
| 10 to 14 Minutes | 4,963 (22.2%) | 5,470 (26.8%) |
| 15 to 19 Minutes | 4,869 (21.7%) | 4,750 (23.2%) |
| 20 to 24 Minutes | 2,619 (11.7%) | 2,426 (11.9%) |
| 25 to 29 Minutes | 1,477 (6.6%) | 909 (4.4%) |
| 30 to 34 Minutes | 2,418 (10.8%) | 1,694 (8.3%) |
| 35 to 39 Minutes | 497 (2.2%) | 366 (1.8%) |
| 40 to 44 Minutes | 503 (2.2%) | 216 (1.1%) |
| 45 to 59 Minutes | 855 (3.8%) | 375 (1.8%) |
| 60 to 89 Minutes | 407 (1.8%) | 399 (1.9%) |
| 90 or more Minutes | 231 (1.0%) | 47 (0.2%) |
Time of Departure to Work by Sex in Fayetteville
The most frequent times of departure to work in Fayetteville are 7:30 AM to 7:59 AM (3,339, 14.9%) for males and 7:30 AM to 7:59 AM (3,873, 19.0%) for females.
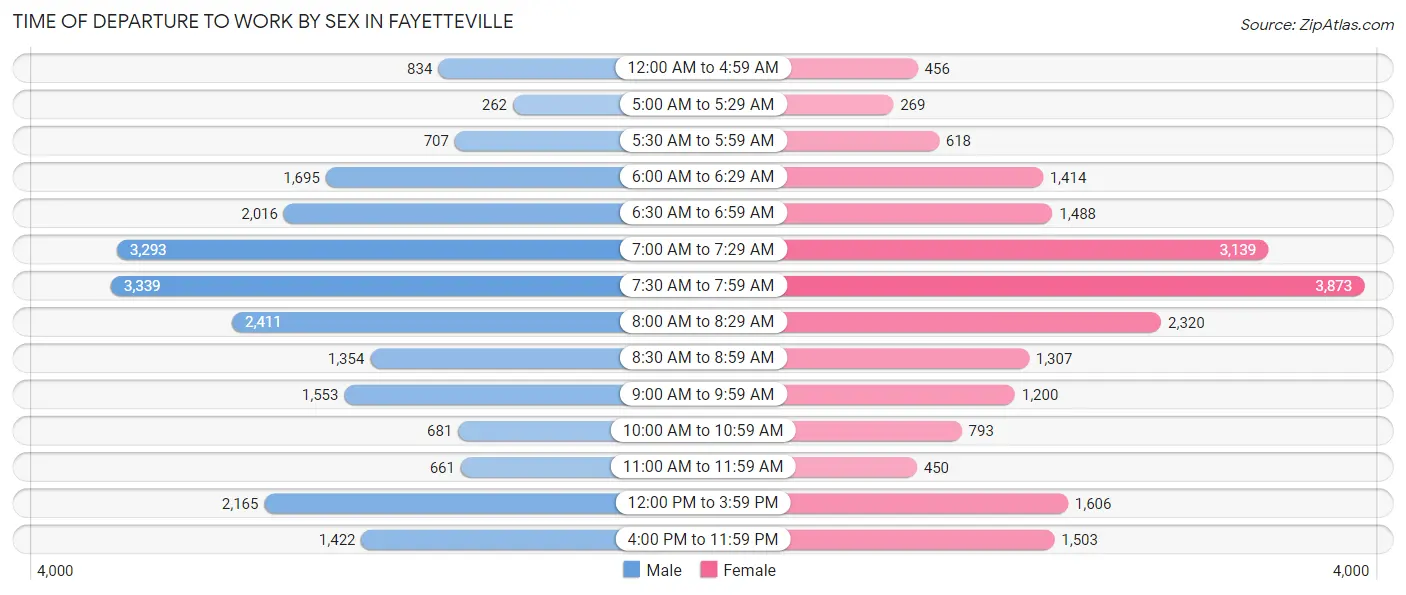
| Time of Departure | Male | Female |
| 12:00 AM to 4:59 AM | 834 (3.7%) | 456 (2.2%) |
| 5:00 AM to 5:29 AM | 262 (1.2%) | 269 (1.3%) |
| 5:30 AM to 5:59 AM | 707 (3.2%) | 618 (3.0%) |
| 6:00 AM to 6:29 AM | 1,695 (7.6%) | 1,414 (6.9%) |
| 6:30 AM to 6:59 AM | 2,016 (9.0%) | 1,488 (7.3%) |
| 7:00 AM to 7:29 AM | 3,293 (14.7%) | 3,139 (15.4%) |
| 7:30 AM to 7:59 AM | 3,339 (14.9%) | 3,873 (19.0%) |
| 8:00 AM to 8:29 AM | 2,411 (10.8%) | 2,320 (11.4%) |
| 8:30 AM to 8:59 AM | 1,354 (6.0%) | 1,307 (6.4%) |
| 9:00 AM to 9:59 AM | 1,553 (6.9%) | 1,200 (5.9%) |
| 10:00 AM to 10:59 AM | 681 (3.0%) | 793 (3.9%) |
| 11:00 AM to 11:59 AM | 661 (2.9%) | 450 (2.2%) |
| 12:00 PM to 3:59 PM | 2,165 (9.7%) | 1,606 (7.9%) |
| 4:00 PM to 11:59 PM | 1,422 (6.4%) | 1,503 (7.3%) |
| Total | 22,393 (100.0%) | 20,436 (100.0%) |
Housing Occupancy in Fayetteville
Occupancy by Ownership in Fayetteville
Of the total 39,763 dwellings in Fayetteville, owner-occupied units account for 15,984 (40.2%), while renter-occupied units make up 23,779 (59.8%).
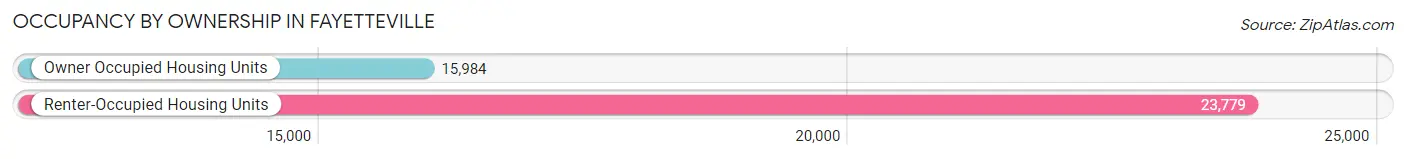
| Occupancy | # Housing Units | % Housing Units |
| Owner Occupied Housing Units | 15,984 | 40.2% |
| Renter-Occupied Housing Units | 23,779 | 59.8% |
| Total Occupied Housing Units | 39,763 | 100.0% |
Occupancy by Household Size in Fayetteville
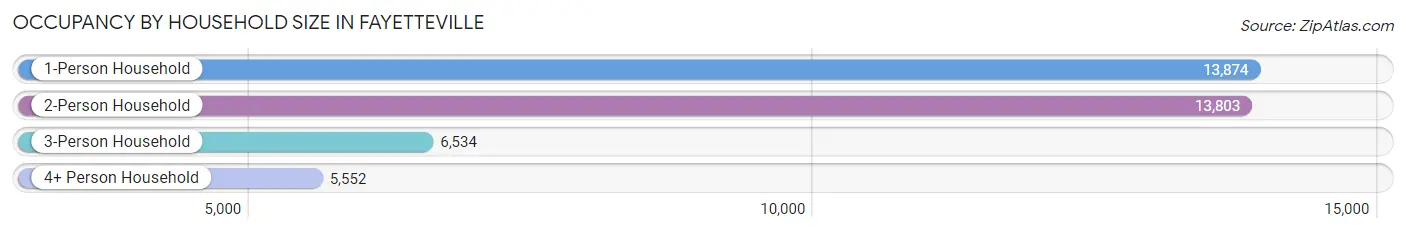
| Household Size | # Housing Units | % Housing Units |
| 1-Person Household | 13,874 | 34.9% |
| 2-Person Household | 13,803 | 34.7% |
| 3-Person Household | 6,534 | 16.4% |
| 4+ Person Household | 5,552 | 14.0% |
| Total Housing Units | 39,763 | 100.0% |
Occupancy by Ownership by Household Size in Fayetteville
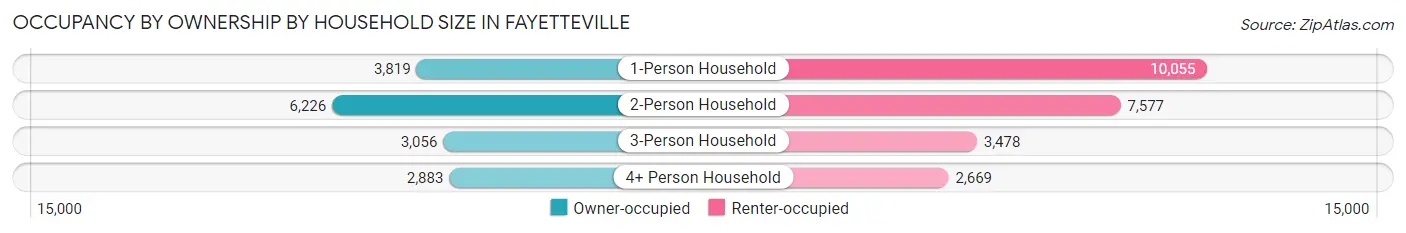
| Household Size | Owner-occupied | Renter-occupied |
| 1-Person Household | 3,819 (27.5%) | 10,055 (72.5%) |
| 2-Person Household | 6,226 (45.1%) | 7,577 (54.9%) |
| 3-Person Household | 3,056 (46.8%) | 3,478 (53.2%) |
| 4+ Person Household | 2,883 (51.9%) | 2,669 (48.1%) |
| Total Housing Units | 15,984 (40.2%) | 23,779 (59.8%) |
Occupancy by Educational Attainment in Fayetteville
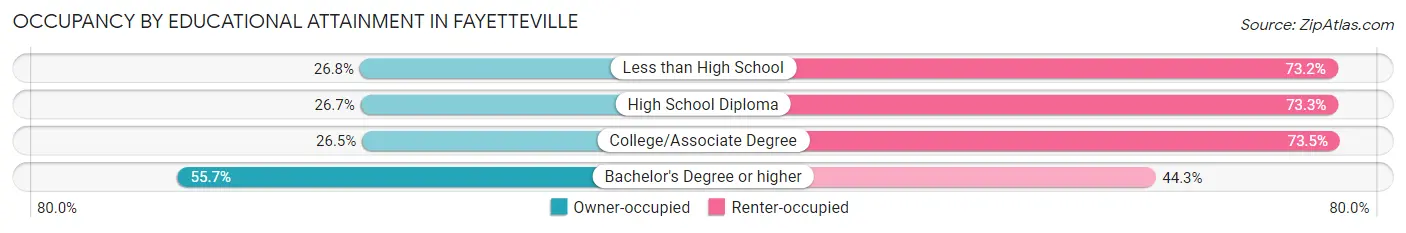
| Household Size | Owner-occupied | Renter-occupied |
| Less than High School | 443 (26.8%) | 1,209 (73.2%) |
| High School Diploma | 1,955 (26.7%) | 5,361 (73.3%) |
| College/Associate Degree | 3,233 (26.5%) | 8,981 (73.5%) |
| Bachelor's Degree or higher | 10,353 (55.7%) | 8,228 (44.3%) |
Occupancy by Age of Householder in Fayetteville
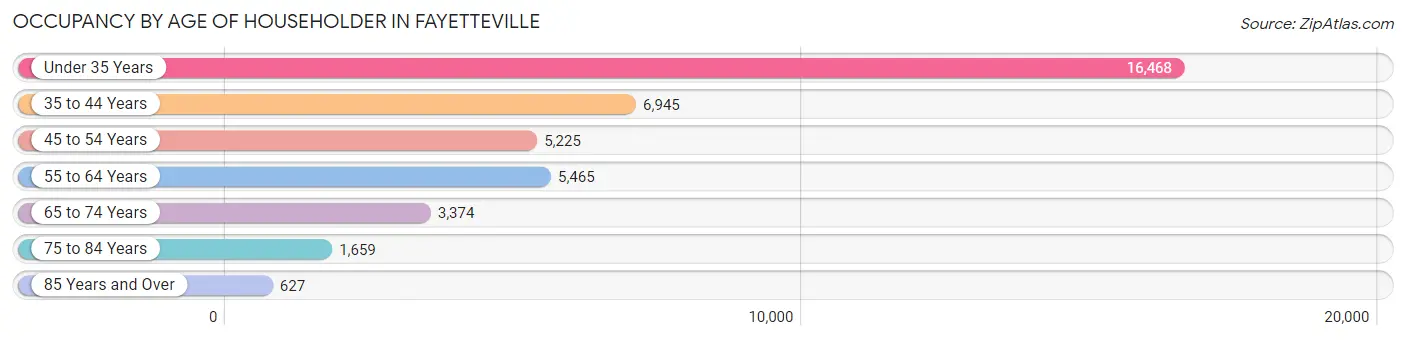
| Age Bracket | # Households | % Households |
| Under 35 Years | 16,468 | 41.4% |
| 35 to 44 Years | 6,945 | 17.5% |
| 45 to 54 Years | 5,225 | 13.1% |
| 55 to 64 Years | 5,465 | 13.7% |
| 65 to 74 Years | 3,374 | 8.5% |
| 75 to 84 Years | 1,659 | 4.2% |
| 85 Years and Over | 627 | 1.6% |
| Total | 39,763 | 100.0% |
Housing Finances in Fayetteville
Median Income by Occupancy in Fayetteville
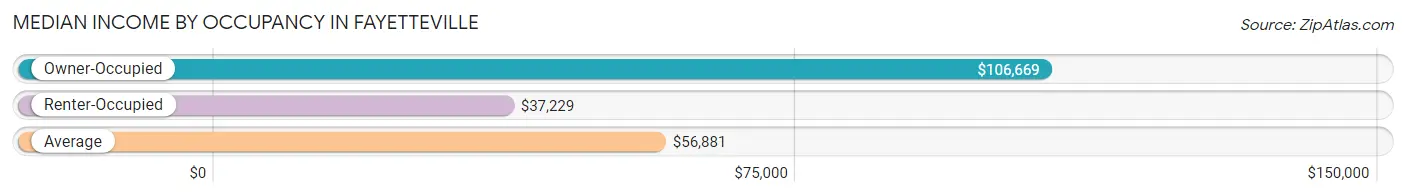
| Occupancy Type | # Households | Median Income |
| Owner-Occupied | 15,984 (40.2%) | $106,669 |
| Renter-Occupied | 23,779 (59.8%) | $37,229 |
| Average | 39,763 (100.0%) | $56,881 |
Occupancy by Householder Income Bracket in Fayetteville
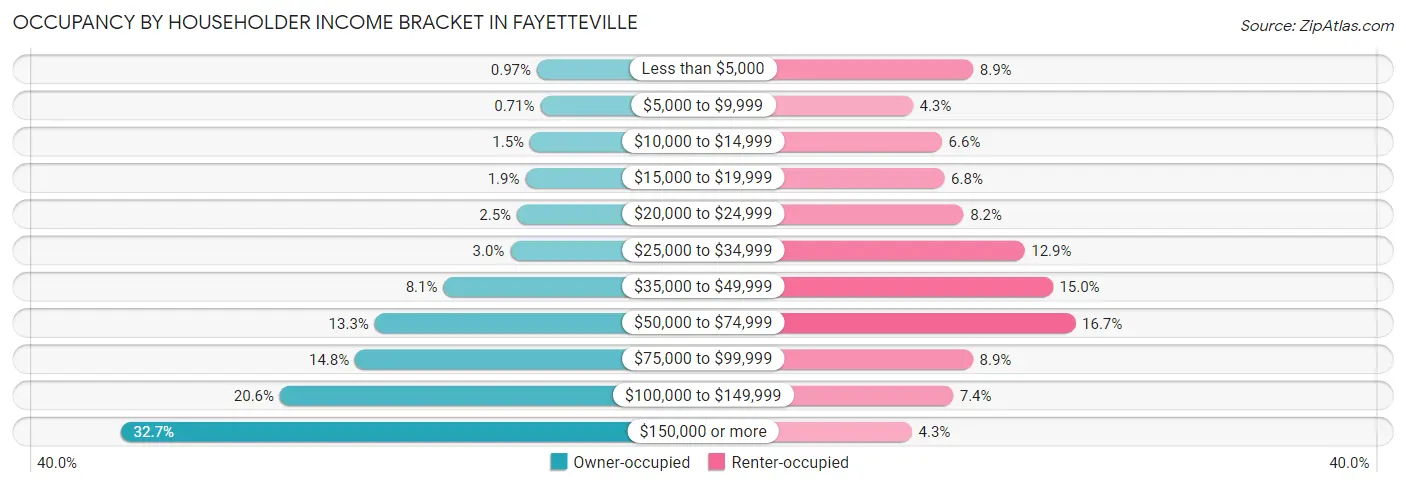
| Income Bracket | Owner-occupied | Renter-occupied |
| Less than $5,000 | 155 (1.0%) | 2,127 (8.9%) |
| $5,000 to $9,999 | 114 (0.7%) | 1,033 (4.3%) |
| $10,000 to $14,999 | 240 (1.5%) | 1,559 (6.6%) |
| $15,000 to $19,999 | 296 (1.8%) | 1,605 (6.8%) |
| $20,000 to $24,999 | 398 (2.5%) | 1,953 (8.2%) |
| $25,000 to $34,999 | 479 (3.0%) | 3,057 (12.9%) |
| $35,000 to $49,999 | 1,295 (8.1%) | 3,567 (15.0%) |
| $50,000 to $74,999 | 2,131 (13.3%) | 3,979 (16.7%) |
| $75,000 to $99,999 | 2,369 (14.8%) | 2,120 (8.9%) |
| $100,000 to $149,999 | 3,284 (20.5%) | 1,763 (7.4%) |
| $150,000 or more | 5,223 (32.7%) | 1,016 (4.3%) |
| Total | 15,984 (100.0%) | 23,779 (100.0%) |
Monthly Housing Cost Tiers in Fayetteville
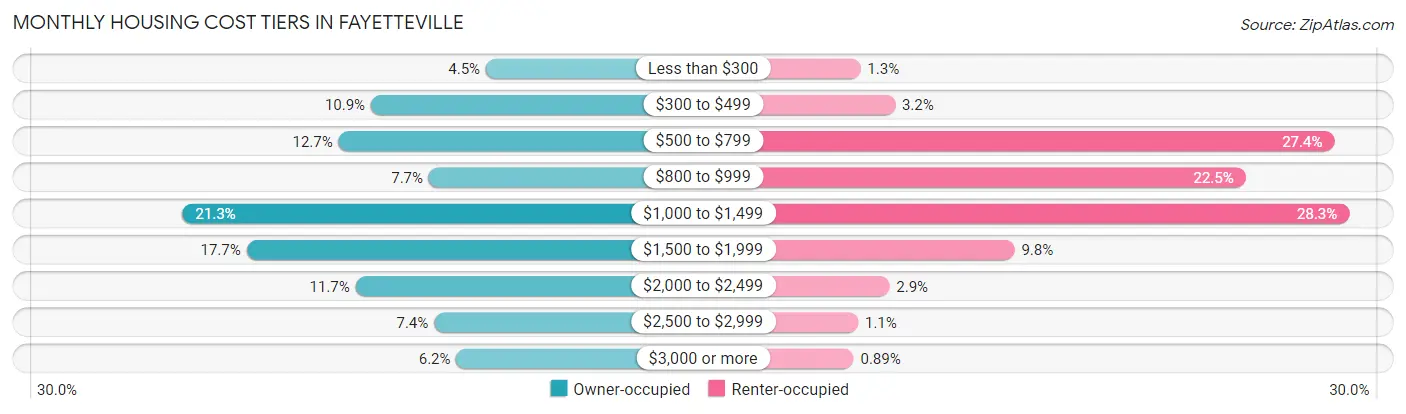
| Monthly Cost | Owner-occupied | Renter-occupied |
| Less than $300 | 722 (4.5%) | 302 (1.3%) |
| $300 to $499 | 1,738 (10.9%) | 757 (3.2%) |
| $500 to $799 | 2,024 (12.7%) | 6,525 (27.4%) |
| $800 to $999 | 1,226 (7.7%) | 5,360 (22.5%) |
| $1,000 to $1,499 | 3,401 (21.3%) | 6,720 (28.3%) |
| $1,500 to $1,999 | 2,836 (17.7%) | 2,326 (9.8%) |
| $2,000 to $2,499 | 1,874 (11.7%) | 683 (2.9%) |
| $2,500 to $2,999 | 1,180 (7.4%) | 270 (1.1%) |
| $3,000 or more | 983 (6.1%) | 212 (0.9%) |
| Total | 15,984 (100.0%) | 23,779 (100.0%) |
Physical Housing Characteristics in Fayetteville
Housing Structures in Fayetteville
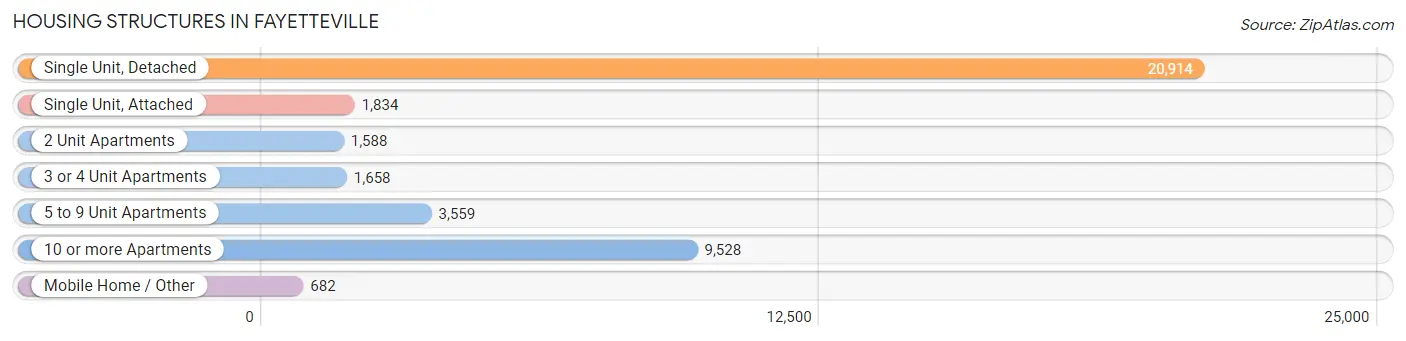
| Structure Type | # Housing Units | % Housing Units |
| Single Unit, Detached | 20,914 | 52.6% |
| Single Unit, Attached | 1,834 | 4.6% |
| 2 Unit Apartments | 1,588 | 4.0% |
| 3 or 4 Unit Apartments | 1,658 | 4.2% |
| 5 to 9 Unit Apartments | 3,559 | 8.9% |
| 10 or more Apartments | 9,528 | 24.0% |
| Mobile Home / Other | 682 | 1.7% |
| Total | 39,763 | 100.0% |
Housing Structures by Occupancy in Fayetteville
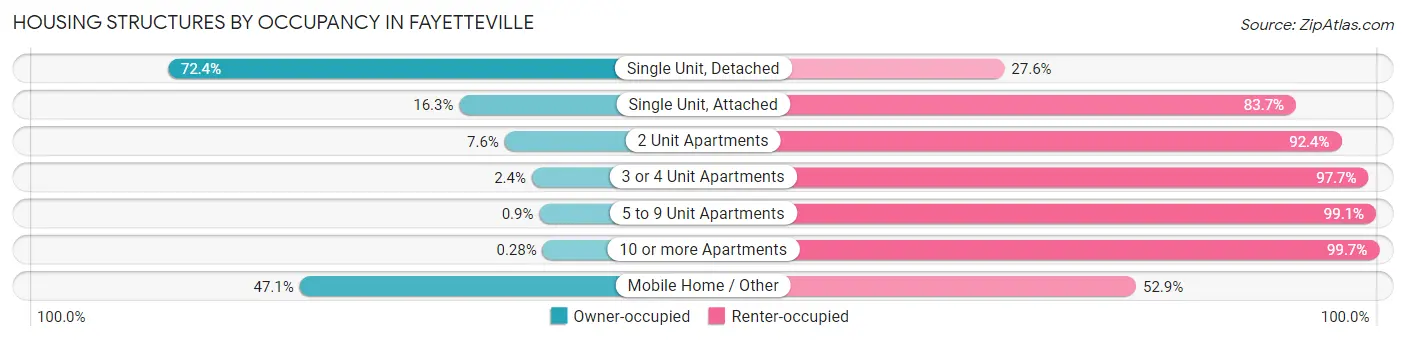
| Structure Type | Owner-occupied | Renter-occupied |
| Single Unit, Detached | 15,146 (72.4%) | 5,768 (27.6%) |
| Single Unit, Attached | 299 (16.3%) | 1,535 (83.7%) |
| 2 Unit Apartments | 120 (7.6%) | 1,468 (92.4%) |
| 3 or 4 Unit Apartments | 39 (2.4%) | 1,619 (97.7%) |
| 5 to 9 Unit Apartments | 32 (0.9%) | 3,527 (99.1%) |
| 10 or more Apartments | 27 (0.3%) | 9,501 (99.7%) |
| Mobile Home / Other | 321 (47.1%) | 361 (52.9%) |
| Total | 15,984 (40.2%) | 23,779 (59.8%) |
Housing Structures by Number of Rooms in Fayetteville
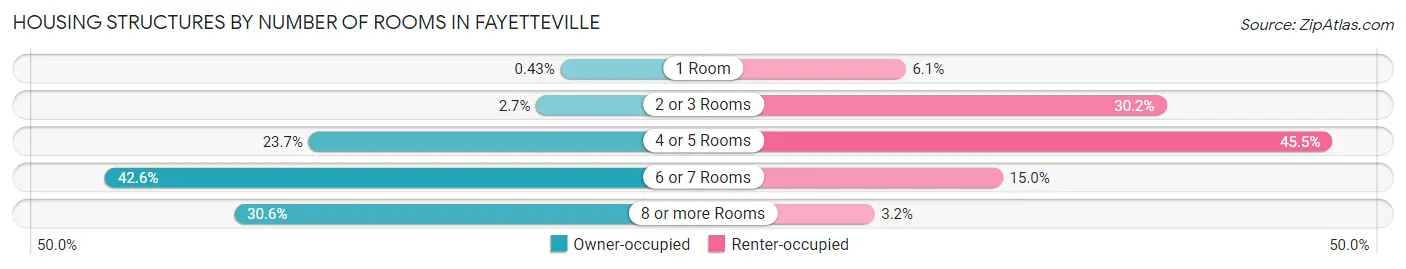
| Number of Rooms | Owner-occupied | Renter-occupied |
| 1 Room | 69 (0.4%) | 1,442 (6.1%) |
| 2 or 3 Rooms | 426 (2.7%) | 7,177 (30.2%) |
| 4 or 5 Rooms | 3,791 (23.7%) | 10,827 (45.5%) |
| 6 or 7 Rooms | 6,803 (42.6%) | 3,576 (15.0%) |
| 8 or more Rooms | 4,895 (30.6%) | 757 (3.2%) |
| Total | 15,984 (100.0%) | 23,779 (100.0%) |
Housing Structure by Heating Type in Fayetteville
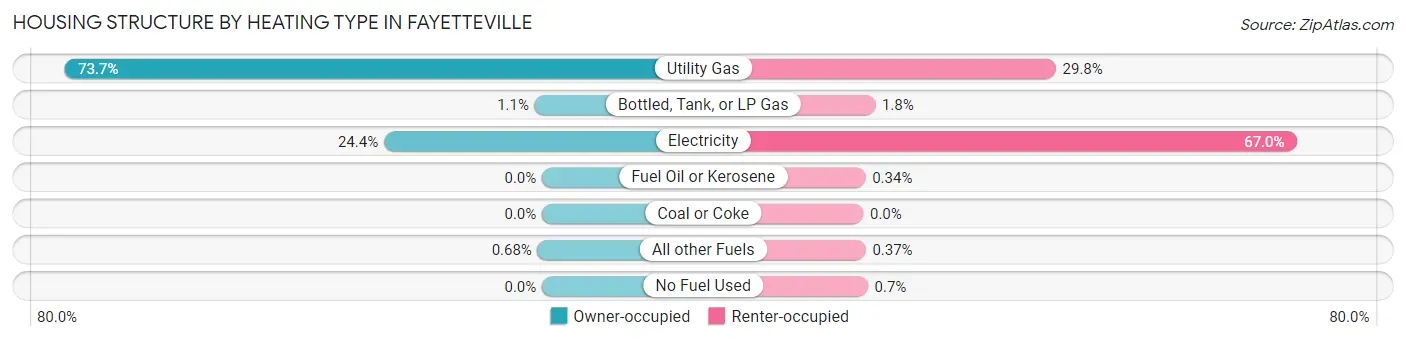
| Heating Type | Owner-occupied | Renter-occupied |
| Utility Gas | 11,787 (73.7%) | 7,080 (29.8%) |
| Bottled, Tank, or LP Gas | 181 (1.1%) | 438 (1.8%) |
| Electricity | 3,907 (24.4%) | 15,924 (67.0%) |
| Fuel Oil or Kerosene | 0 (0.0%) | 81 (0.3%) |
| Coal or Coke | 0 (0.0%) | 0 (0.0%) |
| All other Fuels | 109 (0.7%) | 89 (0.4%) |
| No Fuel Used | 0 (0.0%) | 167 (0.7%) |
| Total | 15,984 (100.0%) | 23,779 (100.0%) |
Household Vehicle Usage in Fayetteville
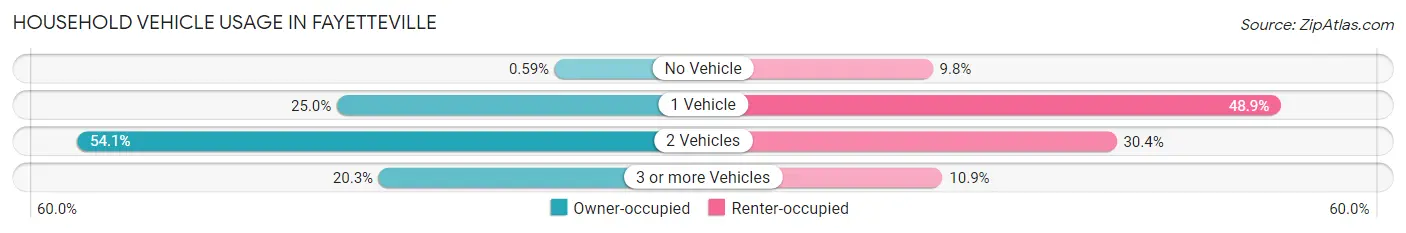
| Vehicles per Household | Owner-occupied | Renter-occupied |
| No Vehicle | 95 (0.6%) | 2,334 (9.8%) |
| 1 Vehicle | 3,994 (25.0%) | 11,615 (48.8%) |
| 2 Vehicles | 8,649 (54.1%) | 7,233 (30.4%) |
| 3 or more Vehicles | 3,246 (20.3%) | 2,597 (10.9%) |
| Total | 15,984 (100.0%) | 23,779 (100.0%) |
Real Estate & Mortgages in Fayetteville
Real Estate and Mortgage Overview in Fayetteville
| Characteristic | Without Mortgage | With Mortgage |
| Housing Units | 4,799 | 11,185 |
| Median Property Value | $268,500 | $300,000 |
| Median Household Income | $72,931 | $4,460 |
| Monthly Housing Costs | $502 | $970 |
| Real Estate Taxes | $1,751 | $132 |
Property Value by Mortgage Status in Fayetteville
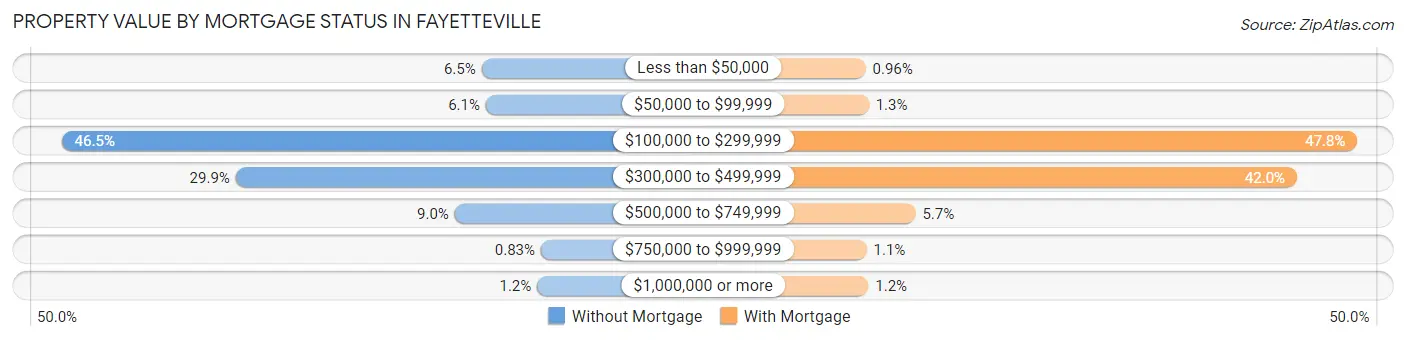
| Property Value | Without Mortgage | With Mortgage |
| Less than $50,000 | 311 (6.5%) | 107 (1.0%) |
| $50,000 to $99,999 | 292 (6.1%) | 140 (1.3%) |
| $100,000 to $299,999 | 2,230 (46.5%) | 5,344 (47.8%) |
| $300,000 to $499,999 | 1,435 (29.9%) | 4,701 (42.0%) |
| $500,000 to $749,999 | 434 (9.0%) | 639 (5.7%) |
| $750,000 to $999,999 | 40 (0.8%) | 118 (1.1%) |
| $1,000,000 or more | 57 (1.2%) | 136 (1.2%) |
| Total | 4,799 (100.0%) | 11,185 (100.0%) |
Household Income by Mortgage Status in Fayetteville
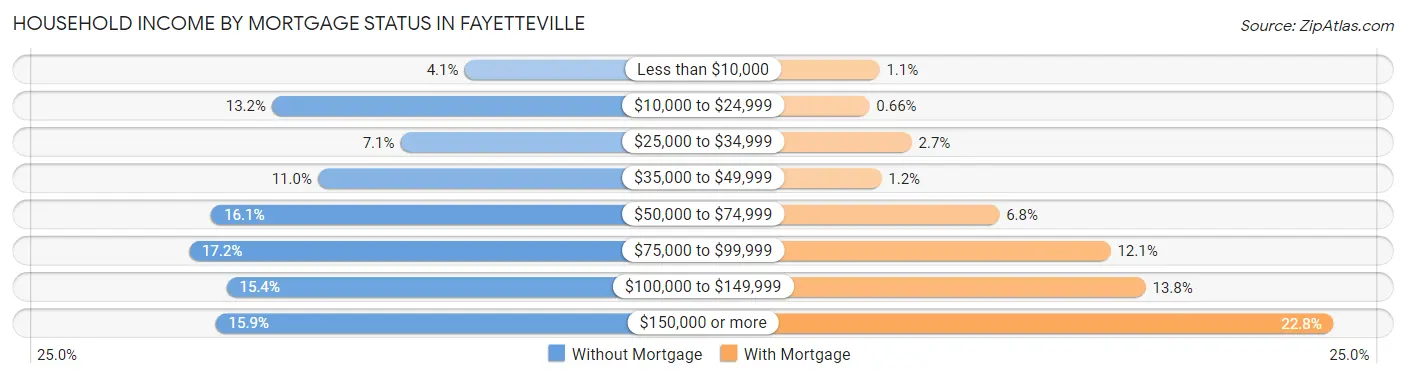
| Household Income | Without Mortgage | With Mortgage |
| Less than $10,000 | 195 (4.1%) | 128 (1.1%) |
| $10,000 to $24,999 | 635 (13.2%) | 74 (0.7%) |
| $25,000 to $34,999 | 341 (7.1%) | 299 (2.7%) |
| $35,000 to $49,999 | 530 (11.0%) | 138 (1.2%) |
| $50,000 to $74,999 | 773 (16.1%) | 765 (6.8%) |
| $75,000 to $99,999 | 824 (17.2%) | 1,358 (12.1%) |
| $100,000 to $149,999 | 738 (15.4%) | 1,545 (13.8%) |
| $150,000 or more | 763 (15.9%) | 2,546 (22.8%) |
| Total | 4,799 (100.0%) | 11,185 (100.0%) |
Property Value to Household Income Ratio in Fayetteville
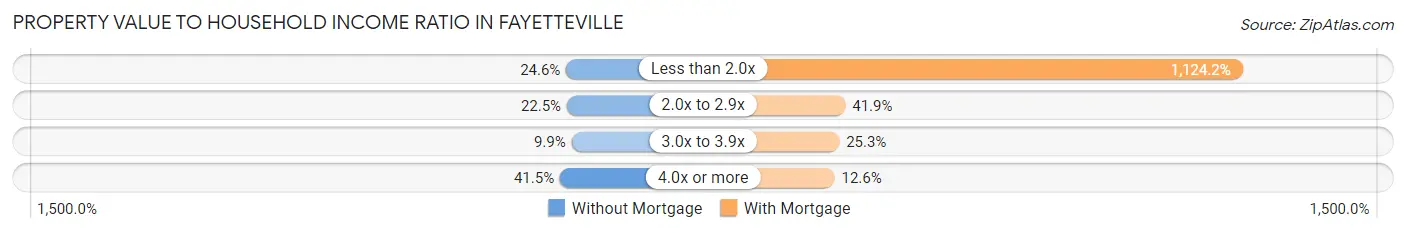
| Value-to-Income Ratio | Without Mortgage | With Mortgage |
| Less than 2.0x | 1,179 (24.6%) | 125,736 (1,124.2%) |
| 2.0x to 2.9x | 1,081 (22.5%) | 4,685 (41.9%) |
| 3.0x to 3.9x | 476 (9.9%) | 2,826 (25.3%) |
| 4.0x or more | 1,992 (41.5%) | 1,414 (12.6%) |
| Total | 4,799 (100.0%) | 11,185 (100.0%) |
Real Estate Taxes by Mortgage Status in Fayetteville
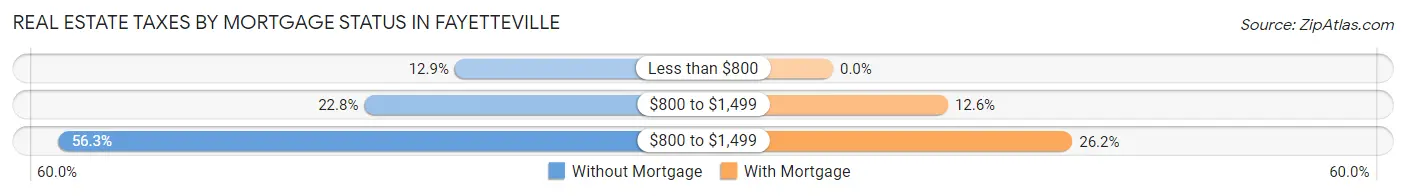
| Property Taxes | Without Mortgage | With Mortgage |
| Less than $800 | 617 (12.9%) | 0 (0.0%) |
| $800 to $1,499 | 1,093 (22.8%) | 1,408 (12.6%) |
| $800 to $1,499 | 2,700 (56.3%) | 2,933 (26.2%) |
| Total | 4,799 (100.0%) | 11,185 (100.0%) |
Health & Disability in Fayetteville
Health Insurance Coverage by Age in Fayetteville
| Age Bracket | With Coverage | Without Coverage |
| Under 6 Years | 5,786 (97.9%) | 125 (2.1%) |
| 6 to 18 Years | 12,335 (92.7%) | 966 (7.3%) |
| 19 to 25 Years | 20,854 (90.3%) | 2,243 (9.7%) |
| 26 to 34 Years | 13,516 (89.2%) | 1,628 (10.7%) |
| 35 to 44 Years | 10,284 (89.0%) | 1,272 (11.0%) |
| 45 to 54 Years | 7,126 (89.8%) | 805 (10.2%) |
| 55 to 64 Years | 7,928 (94.8%) | 437 (5.2%) |
| 65 to 74 Years | 5,223 (100.0%) | 0 (0.0%) |
| 75 Years and older | 3,327 (100.0%) | 0 (0.0%) |
| Total | 86,379 (92.0%) | 7,476 (8.0%) |
Health Insurance Coverage by Citizenship Status in Fayetteville
| Citizenship Status | With Coverage | Without Coverage |
| Native Born | 5,786 (97.9%) | 125 (2.1%) |
| Foreign Born, Citizen | 12,335 (92.7%) | 966 (7.3%) |
| Foreign Born, not a Citizen | 20,854 (90.3%) | 2,243 (9.7%) |
Health Insurance Coverage by Household Income in Fayetteville
| Household Income | With Coverage | Without Coverage |
| Under $25,000 | 14,970 (89.3%) | 1,793 (10.7%) |
| $25,000 to $49,999 | 14,581 (85.4%) | 2,489 (14.6%) |
| $50,000 to $74,999 | 11,715 (89.3%) | 1,399 (10.7%) |
| $75,000 to $99,999 | 9,737 (89.7%) | 1,122 (10.3%) |
| $100,000 and over | 29,192 (97.8%) | 665 (2.2%) |
Public vs Private Health Insurance Coverage by Age in Fayetteville
| Age Bracket | Public Insurance | Private Insurance |
| Under 6 | 2,710 (45.9%) | 3,327 (56.3%) |
| 6 to 18 Years | 3,982 (29.9%) | 8,769 (65.9%) |
| 19 to 25 Years | 1,598 (6.9%) | 19,644 (85.1%) |
| 25 to 34 Years | 2,667 (17.6%) | 11,527 (76.1%) |
| 35 to 44 Years | 1,810 (15.7%) | 8,765 (75.8%) |
| 45 to 54 Years | 1,543 (19.5%) | 6,025 (76.0%) |
| 55 to 64 Years | 2,089 (25.0%) | 6,403 (76.5%) |
| 65 to 74 Years | 4,999 (95.7%) | 3,240 (62.0%) |
| 75 Years and over | 3,182 (95.6%) | 2,479 (74.5%) |
| Total | 24,580 (26.2%) | 70,179 (74.8%) |
Disability Status by Sex by Age in Fayetteville
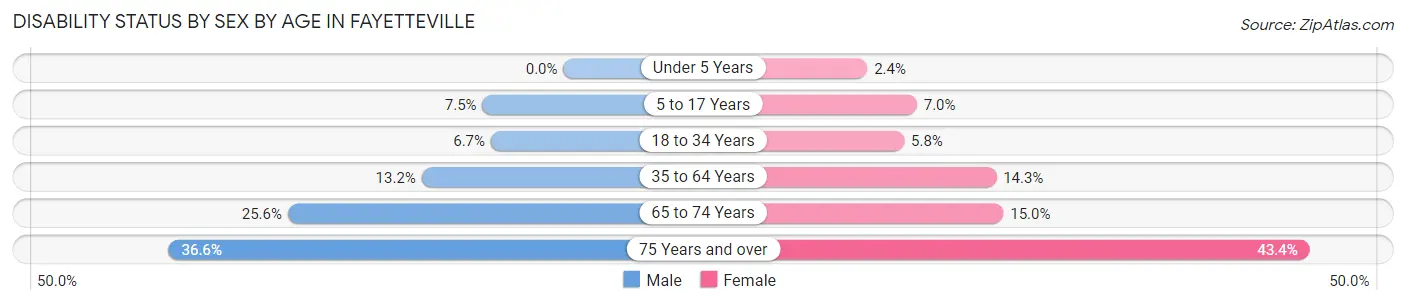
| Age Bracket | Male | Female |
| Under 5 Years | 0 (0.0%) | 57 (2.4%) |
| 5 to 17 Years | 470 (7.5%) | 366 (7.0%) |
| 18 to 34 Years | 1,377 (6.7%) | 1,179 (5.8%) |
| 35 to 64 Years | 1,834 (13.2%) | 1,992 (14.3%) |
| 65 to 74 Years | 568 (25.6%) | 450 (15.0%) |
| 75 Years and over | 482 (36.6%) | 873 (43.4%) |
Disability Class by Sex by Age in Fayetteville
Disability Class: Hearing Difficulty
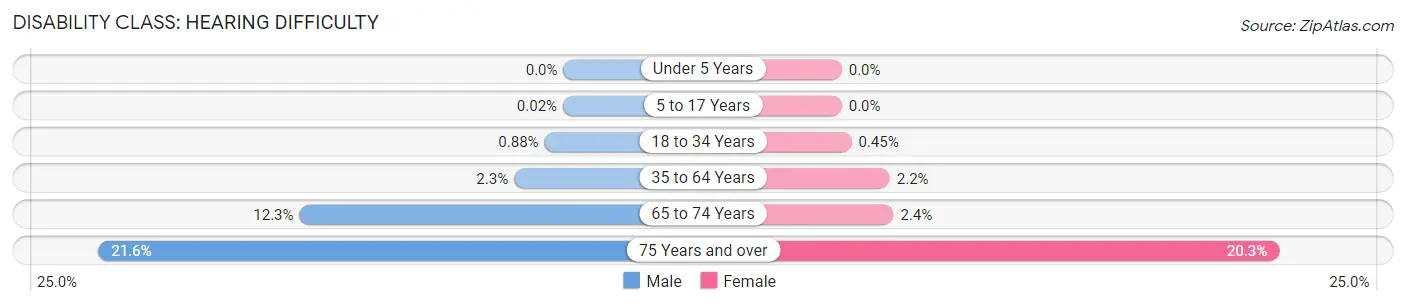
| Age Bracket | Male | Female |
| Under 5 Years | 0 (0.0%) | 0 (0.0%) |
| 5 to 17 Years | 1 (0.0%) | 0 (0.0%) |
| 18 to 34 Years | 181 (0.9%) | 92 (0.4%) |
| 35 to 64 Years | 320 (2.3%) | 310 (2.2%) |
| 65 to 74 Years | 272 (12.2%) | 72 (2.4%) |
| 75 Years and over | 284 (21.6%) | 408 (20.3%) |
Disability Class: Vision Difficulty
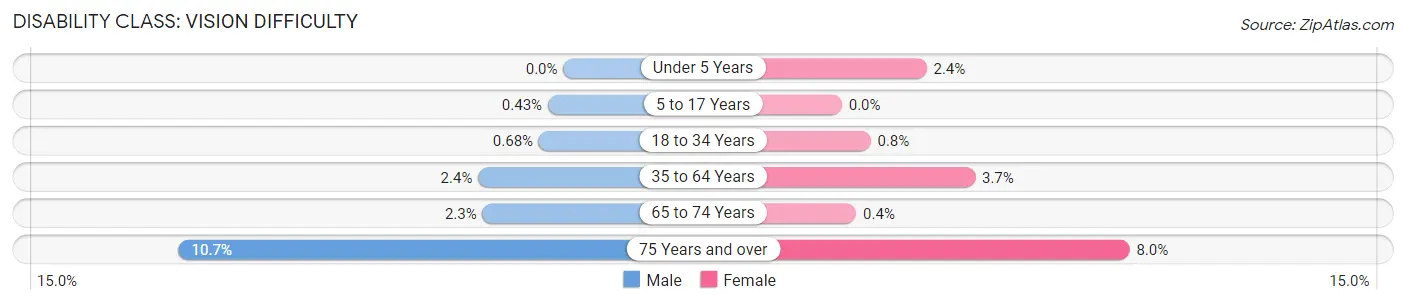
| Age Bracket | Male | Female |
| Under 5 Years | 0 (0.0%) | 57 (2.4%) |
| 5 to 17 Years | 27 (0.4%) | 0 (0.0%) |
| 18 to 34 Years | 139 (0.7%) | 163 (0.8%) |
| 35 to 64 Years | 331 (2.4%) | 516 (3.7%) |
| 65 to 74 Years | 50 (2.2%) | 12 (0.4%) |
| 75 Years and over | 141 (10.7%) | 161 (8.0%) |
Disability Class: Cognitive Difficulty
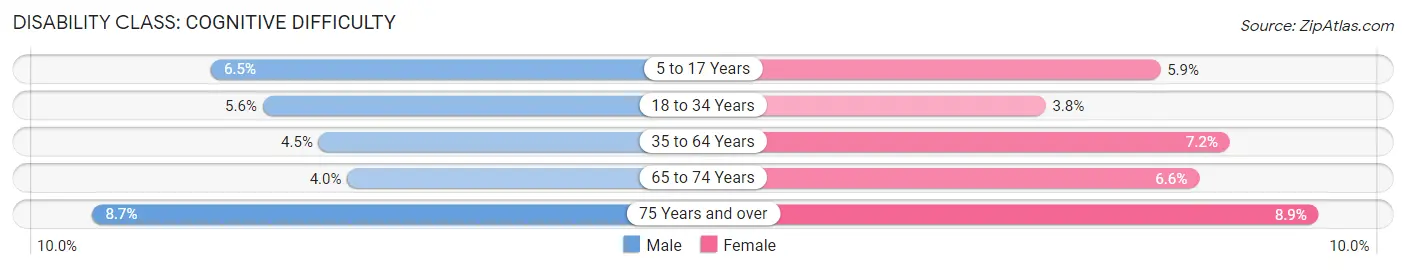
| Age Bracket | Male | Female |
| 5 to 17 Years | 409 (6.5%) | 311 (5.9%) |
| 18 to 34 Years | 1,142 (5.6%) | 771 (3.8%) |
| 35 to 64 Years | 634 (4.5%) | 1,001 (7.2%) |
| 65 to 74 Years | 89 (4.0%) | 199 (6.6%) |
| 75 Years and over | 115 (8.7%) | 178 (8.8%) |
Disability Class: Ambulatory Difficulty
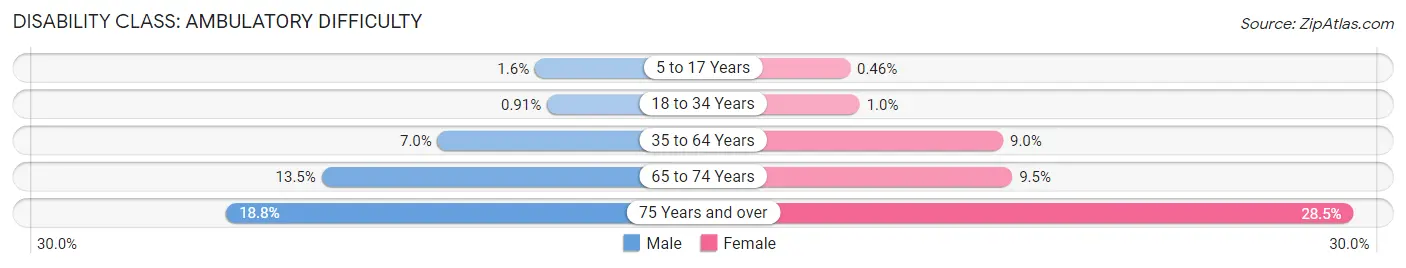
| Age Bracket | Male | Female |
| 5 to 17 Years | 99 (1.6%) | 24 (0.5%) |
| 18 to 34 Years | 187 (0.9%) | 204 (1.0%) |
| 35 to 64 Years | 976 (7.0%) | 1,249 (9.0%) |
| 65 to 74 Years | 299 (13.5%) | 285 (9.5%) |
| 75 Years and over | 247 (18.8%) | 573 (28.5%) |
Disability Class: Self-Care Difficulty
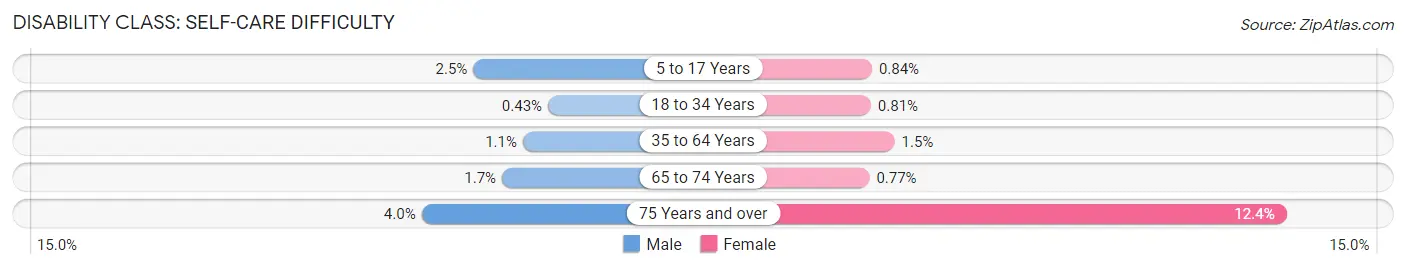
| Age Bracket | Male | Female |
| 5 to 17 Years | 157 (2.5%) | 44 (0.8%) |
| 18 to 34 Years | 87 (0.4%) | 166 (0.8%) |
| 35 to 64 Years | 157 (1.1%) | 204 (1.5%) |
| 65 to 74 Years | 38 (1.7%) | 23 (0.8%) |
| 75 Years and over | 52 (4.0%) | 249 (12.4%) |
Technology Access in Fayetteville
Computing Device Access in Fayetteville
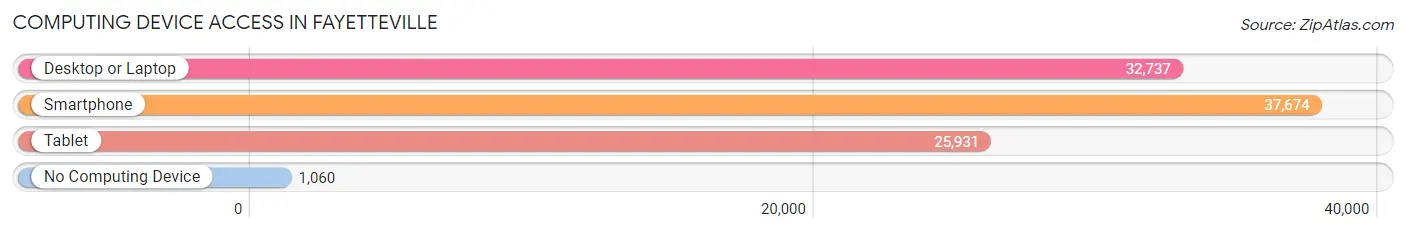
| Device Type | # Households | % Households |
| Desktop or Laptop | 32,737 | 82.3% |
| Smartphone | 37,674 | 94.8% |
| Tablet | 25,931 | 65.2% |
| No Computing Device | 1,060 | 2.7% |
| Total | 39,763 | 100.0% |
Internet Access in Fayetteville
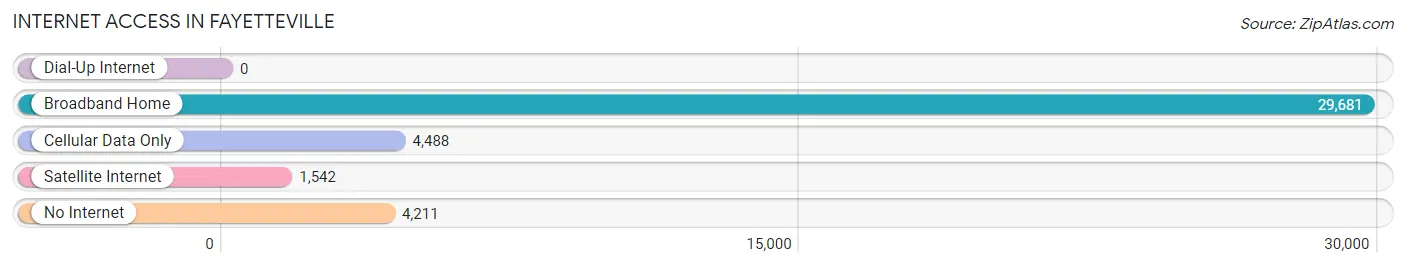
| Internet Type | # Households | % Households |
| Dial-Up Internet | 0 | 0.0% |
| Broadband Home | 29,681 | 74.6% |
| Cellular Data Only | 4,488 | 11.3% |
| Satellite Internet | 1,542 | 3.9% |
| No Internet | 4,211 | 10.6% |
| Total | 39,763 | 100.0% |
Fayetteville Summary
Fayetteville, Arkansas is a city located in the northwest corner of the state, in Washington County. It is the third-largest city in the state, with a population of over 80,000 people. Fayetteville is home to the University of Arkansas, the state’s flagship university, and is a major cultural and economic hub for the region.
History
Fayetteville was founded in 1828 by William Walker, a settler from Tennessee. The city was named after the Marquis de Lafayette, a French military leader who fought in the American Revolutionary War. The city was incorporated in 1836 and quickly grew as a center of commerce and industry. The city was a major stop on the Butterfield Overland Mail route, and the first telegraph line in Arkansas was established in Fayetteville in 1851.
During the Civil War, Fayetteville was the site of several battles, including the Battle of Fayetteville in 1863. After the war, the city experienced a period of growth and prosperity, with the establishment of the University of Arkansas in 1871. The city continued to grow throughout the 20th century, and today is a major center of education, culture, and industry in the region.
Geography
Fayetteville is located in the Ozark Mountains region of Arkansas, in the northwest corner of the state. The city is situated in the Boston Mountains, a subrange of the Ozarks, and is surrounded by rolling hills and forests. The city is located at the intersection of Interstate 49 and U.S. Route 71, and is about an hour’s drive from the state capital of Little Rock.
The city has a total area of 64.3 square miles, of which 62.2 square miles is land and 2.1 square miles is water. The city is located at an elevation of 1,200 feet above sea level. The climate in Fayetteville is humid subtropical, with hot, humid summers and mild winters.
Economy
Fayetteville is a major economic center in the region, with a diverse economy that includes manufacturing, retail, healthcare, education, and tourism. The city is home to several major employers, including the University of Arkansas, Tyson Foods, Walmart, and J.B. Hunt. The city also has a thriving arts and culture scene, with several museums, galleries, and performing arts venues.
The city’s economy is also supported by a strong tourism industry, with visitors drawn to the city’s natural beauty, historic sites, and cultural attractions. The city is also home to several major events, including the Bikes, Blues & BBQ motorcycle rally, the Fayetteville Roots Festival, and the Fayetteville Film Festival.
Demographics
As of the 2010 census, Fayetteville had a population of 76,899 people. The racial makeup of the city was 75.3% White, 11.3% African American, 0.7% Native American, 5.2% Asian, 0.2% Pacific Islander, and 4.2% from other races. Hispanic or Latino of any race were 8.3% of the population.
The median household income in Fayetteville was $41,837, and the median family income was $50,902. The per capita income for the city was $22,845. About 17.3% of the population was below the poverty line.
Fayetteville is a diverse and vibrant city, with a rich history and a strong economy. The city is home to a major university, a thriving arts and culture scene, and a variety of attractions that draw visitors from around the region. Fayetteville is a great place to live, work, and play, and is sure to continue to grow and thrive in the years to come.
Common Questions
What is Per Capita Income in Fayetteville?
Per Capita income in Fayetteville is $35,997.
What is the Median Family Income in Fayetteville?
Median Family Income in Fayetteville is $85,775.
What is the Median Household income in Fayetteville?
Median Household Income in Fayetteville is $56,881.
What is Income or Wage Gap in Fayetteville?
Income or Wage Gap in Fayetteville is 25.5%.
Women in Fayetteville earn 74.5 cents for every dollar earned by a man.
What is Family Income Deficit in Fayetteville?
Family Income Deficit in Fayetteville is $10,805.
Families that are below poverty line in Fayetteville earn $10,805 less on average than the poverty threshold level.
What is Inequality or Gini Index in Fayetteville?
Inequality or Gini Index in Fayetteville is 0.50.
What is the Total Population of Fayetteville?
Total Population of Fayetteville is 95,022.
What is the Total Male Population of Fayetteville?
Total Male Population of Fayetteville is 47,494.
What is the Total Female Population of Fayetteville?
Total Female Population of Fayetteville is 47,528.
What is the Ratio of Males per 100 Females in Fayetteville?
There are 99.93 Males per 100 Females in Fayetteville.
What is the Ratio of Females per 100 Males in Fayetteville?
There are 100.07 Females per 100 Males in Fayetteville.
What is the Median Population Age in Fayetteville?
Median Population Age in Fayetteville is 28.5 Years.
What is the Average Family Size in Fayetteville
Average Family Size in Fayetteville is 2.9 People.
What is the Average Household Size in Fayetteville
Average Household Size in Fayetteville is 2.2 People.
How Large is the Labor Force in Fayetteville?
There are 52,459 People in the Labor Forcein in Fayetteville.
What is the Percentage of People in the Labor Force in Fayetteville?
65.7% of People are in the Labor Force in Fayetteville.
What is the Unemployment Rate in Fayetteville?
Unemployment Rate in Fayetteville is 5.3%.