Jacksonville, AR Map & Demographics
Jacksonville Map
Jacksonville Overview
$28,440
PER CAPITA INCOME
$74,934
AVG FAMILY INCOME
$47,121
AVG HOUSEHOLD INCOME
7.7%
WAGE / INCOME GAP [ % ]
92.3¢/ $1
WAGE / INCOME GAP [ $ ]
$10,434
FAMILY INCOME DEFICIT
0.47
INEQUALITY / GINI INDEX
29,332
TOTAL POPULATION
14,041
MALE POPULATION
15,291
FEMALE POPULATION
91.83
MALES / 100 FEMALES
108.90
FEMALES / 100 MALES
33.2
MEDIAN AGE
3.2
AVG FAMILY SIZE
2.4
AVG HOUSEHOLD SIZE
14,722
LABOR FORCE [ PEOPLE ]
63.8%
PERCENT IN LABOR FORCE
8.9%
UNEMPLOYMENT RATE
Jacksonville Zip Codes
Jacksonville Area Codes
Income in Jacksonville
Income Overview in Jacksonville
Per Capita Income in Jacksonville is $28,440, while median incomes of families and households are $74,934 and $47,121 respectively.
| Characteristic | Number | Measure |
| Per Capita Income | 29,332 | $28,440 |
| Median Family Income | 6,935 | $74,934 |
| Mean Family Income | 6,935 | $84,634 |
| Median Household Income | 11,660 | $47,121 |
| Mean Household Income | 11,660 | $66,454 |
| Income Deficit | 6,935 | $10,434 |
| Wage / Income Gap (%) | 29,332 | 7.65% |
| Wage / Income Gap ($) | 29,332 | 92.35¢ per $1 |
| Gini / Inequality Index | 29,332 | 0.47 |
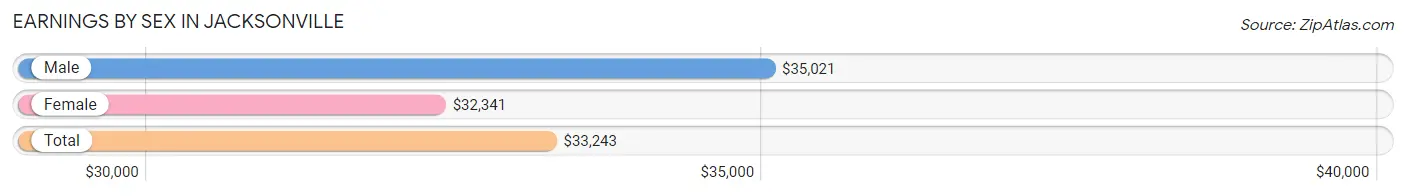
Earnings by Sex in Jacksonville
Average Earnings in Jacksonville are $33,243, $35,021 for men and $32,341 for women, a difference of 7.6%.
| Sex | Number | Average Earnings |
| Male | 7,440 (49.7%) | $35,021 |
| Female | 7,536 (50.3%) | $32,341 |
| Total | 14,976 (100.0%) | $33,243 |
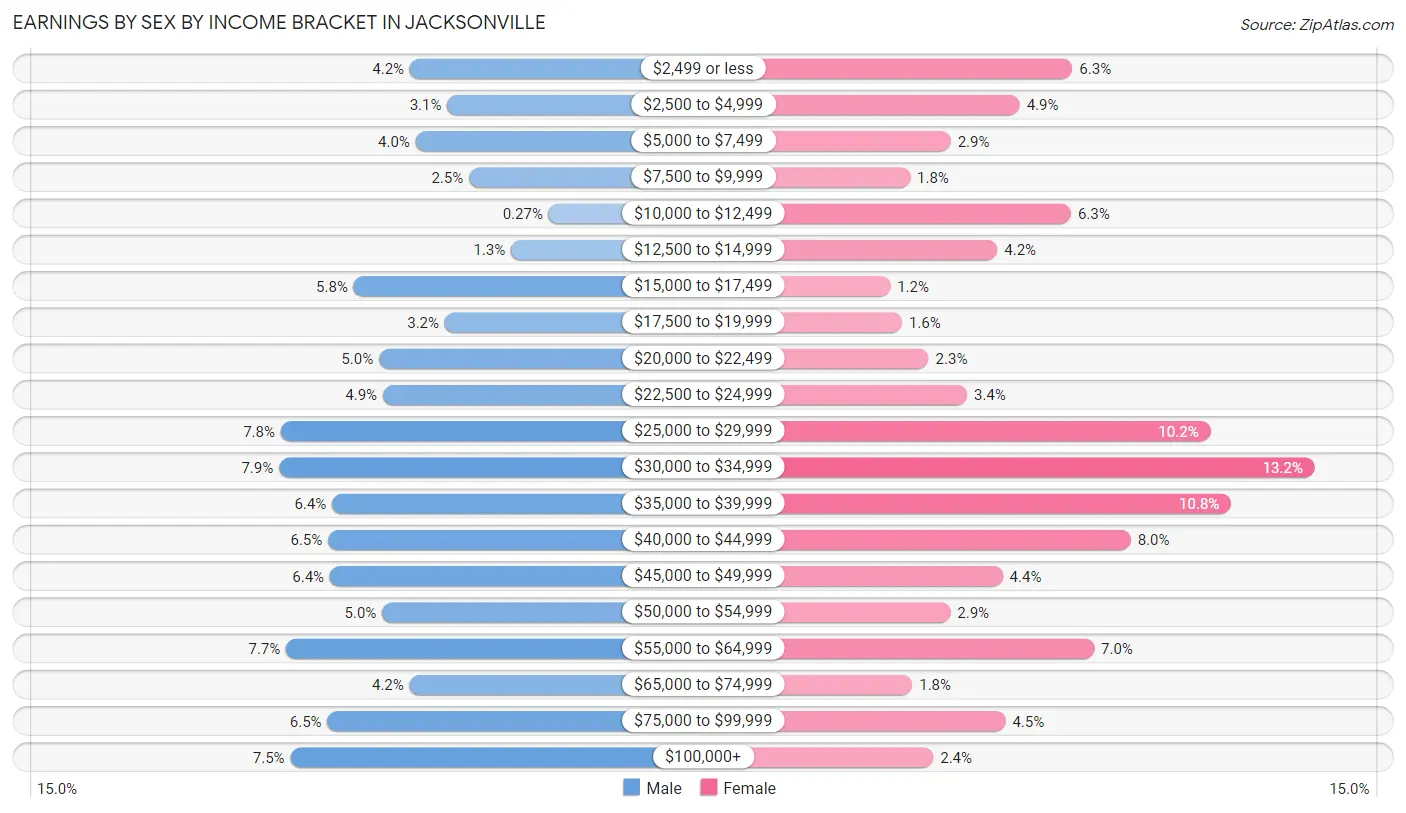
Earnings by Sex by Income Bracket in Jacksonville
The most common earnings brackets in Jacksonville are $30,000 to $34,999 for men (584 | 7.9%) and $30,000 to $34,999 for women (991 | 13.2%).
| Income | Male | Female |
| $2,499 or less | 310 (4.2%) | 478 (6.3%) |
| $2,500 to $4,999 | 232 (3.1%) | 366 (4.9%) |
| $5,000 to $7,499 | 298 (4.0%) | 220 (2.9%) |
| $7,500 to $9,999 | 187 (2.5%) | 134 (1.8%) |
| $10,000 to $12,499 | 20 (0.3%) | 475 (6.3%) |
| $12,500 to $14,999 | 99 (1.3%) | 319 (4.2%) |
| $15,000 to $17,499 | 428 (5.8%) | 92 (1.2%) |
| $17,500 to $19,999 | 237 (3.2%) | 117 (1.5%) |
| $20,000 to $22,499 | 375 (5.0%) | 173 (2.3%) |
| $22,500 to $24,999 | 367 (4.9%) | 255 (3.4%) |
| $25,000 to $29,999 | 580 (7.8%) | 770 (10.2%) |
| $30,000 to $34,999 | 584 (7.9%) | 991 (13.2%) |
| $35,000 to $39,999 | 473 (6.4%) | 814 (10.8%) |
| $40,000 to $44,999 | 481 (6.5%) | 601 (8.0%) |
| $45,000 to $49,999 | 478 (6.4%) | 330 (4.4%) |
| $50,000 to $54,999 | 368 (5.0%) | 219 (2.9%) |
| $55,000 to $64,999 | 569 (7.6%) | 524 (7.0%) |
| $65,000 to $74,999 | 311 (4.2%) | 139 (1.8%) |
| $75,000 to $99,999 | 483 (6.5%) | 336 (4.5%) |
| $100,000+ | 560 (7.5%) | 183 (2.4%) |
| Total | 7,440 (100.0%) | 7,536 (100.0%) |
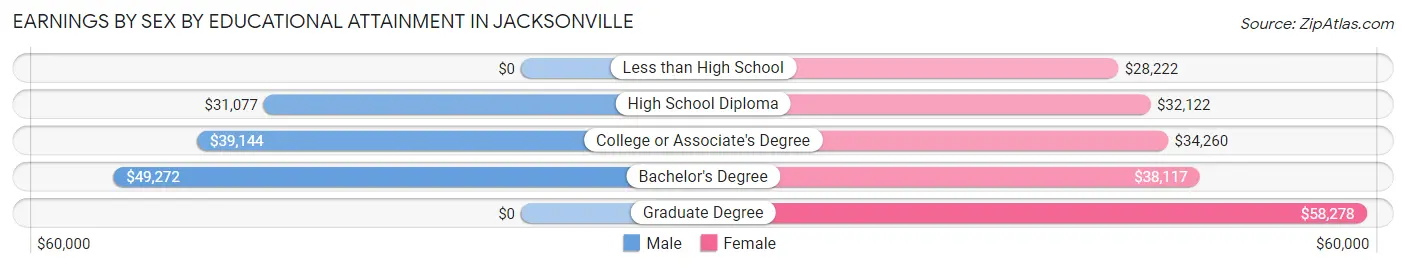
Earnings by Sex by Educational Attainment in Jacksonville
Average earnings in Jacksonville are $39,014 for men and $34,683 for women, a difference of 11.1%. Men with an educational attainment of bachelor's degree enjoy the highest average annual earnings of $49,272, while those with high school diploma education earn the least with $31,077. Women with an educational attainment of graduate degree earn the most with the average annual earnings of $58,278, while those with less than high school education have the smallest earnings of $28,222.
| Educational Attainment | Male Income | Female Income |
| Less than High School | - | - |
| High School Diploma | $31,077 | $32,122 |
| College or Associate's Degree | $39,144 | $34,260 |
| Bachelor's Degree | $49,272 | $38,117 |
| Graduate Degree | - | - |
| Total | $39,014 | $34,683 |
Family Income in Jacksonville
Family Income Brackets in Jacksonville
According to the Jacksonville family income data, there are 1,477 families falling into the $75,000 to $99,999 income range, which is the most common income bracket and makes up 21.3% of all families. Conversely, the $10,000 to $14,999 income bracket is the least frequent group with only 277 families (4.0%) belonging to this category.
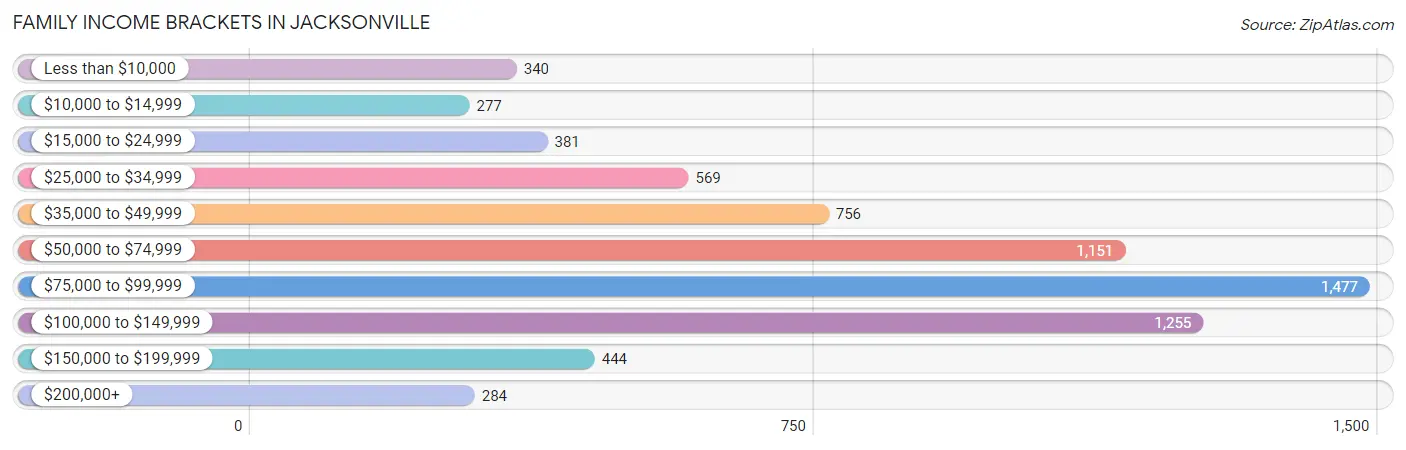
| Income Bracket | # Families | % Families |
| Less than $10,000 | 340 | 4.9% |
| $10,000 to $14,999 | 277 | 4.0% |
| $15,000 to $24,999 | 381 | 5.5% |
| $25,000 to $34,999 | 569 | 8.2% |
| $35,000 to $49,999 | 756 | 10.9% |
| $50,000 to $74,999 | 1,151 | 16.6% |
| $75,000 to $99,999 | 1,477 | 21.3% |
| $100,000 to $149,999 | 1,255 | 18.1% |
| $150,000 to $199,999 | 444 | 6.4% |
| $200,000+ | 284 | 4.1% |
Family Income by Famaliy Size in Jacksonville
4-person families (1,058 | 15.3%) account for the highest median family income in Jacksonville with $89,722 per family, while 2-person families (3,259 | 47.0%) have the highest median income of $34,694 per family member.
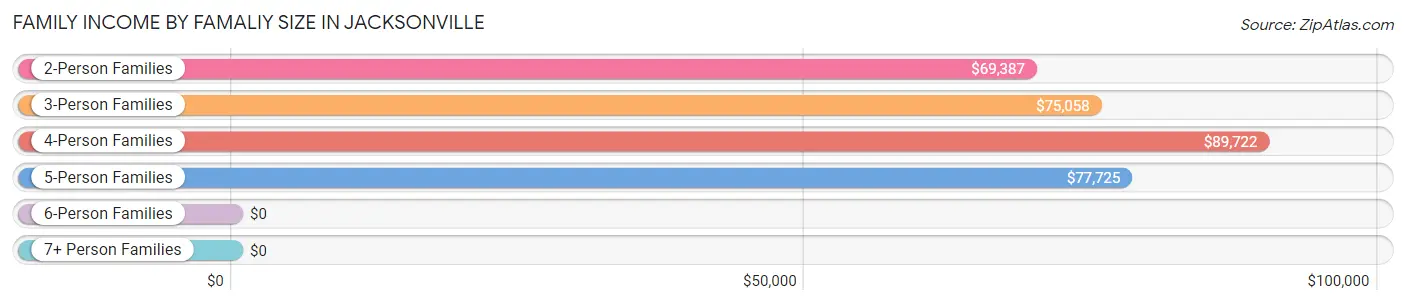
| Income Bracket | # Families | Median Income |
| 2-Person Families | 3,259 (47.0%) | $69,387 |
| 3-Person Families | 1,804 (26.0%) | $75,058 |
| 4-Person Families | 1,058 (15.3%) | $89,722 |
| 5-Person Families | 544 (7.8%) | $77,725 |
| 6-Person Families | 215 (3.1%) | $0 |
| 7+ Person Families | 55 (0.8%) | $0 |
| Total | 6,935 (100.0%) | $74,934 |
Family Income by Number of Earners in Jacksonville
The median family income in Jacksonville is $74,934, with families comprising 3+ earners (598) having the highest median family income of $152,933, while families with no earners (1,047) have the lowest median family income of $44,728, accounting for 8.6% and 15.1% of families, respectively.
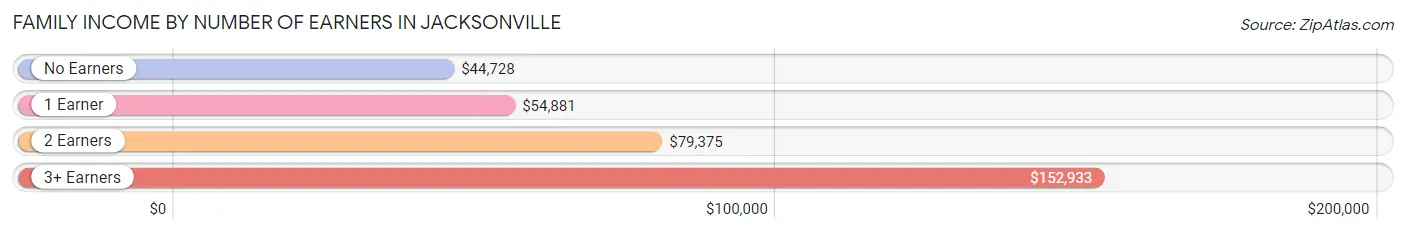
| Number of Earners | # Families | Median Income |
| No Earners | 1,047 (15.1%) | $44,728 |
| 1 Earner | 2,710 (39.1%) | $54,881 |
| 2 Earners | 2,580 (37.2%) | $79,375 |
| 3+ Earners | 598 (8.6%) | $152,933 |
| Total | 6,935 (100.0%) | $74,934 |
Household Income in Jacksonville
Household Income Brackets in Jacksonville
With 1,714 households falling in the category, the $75,000 to $99,999 income range is the most frequent in Jacksonville, accounting for 14.7% of all households. In contrast, only 361 households (3.1%) fall into the $200,000+ income bracket, making it the least populous group.
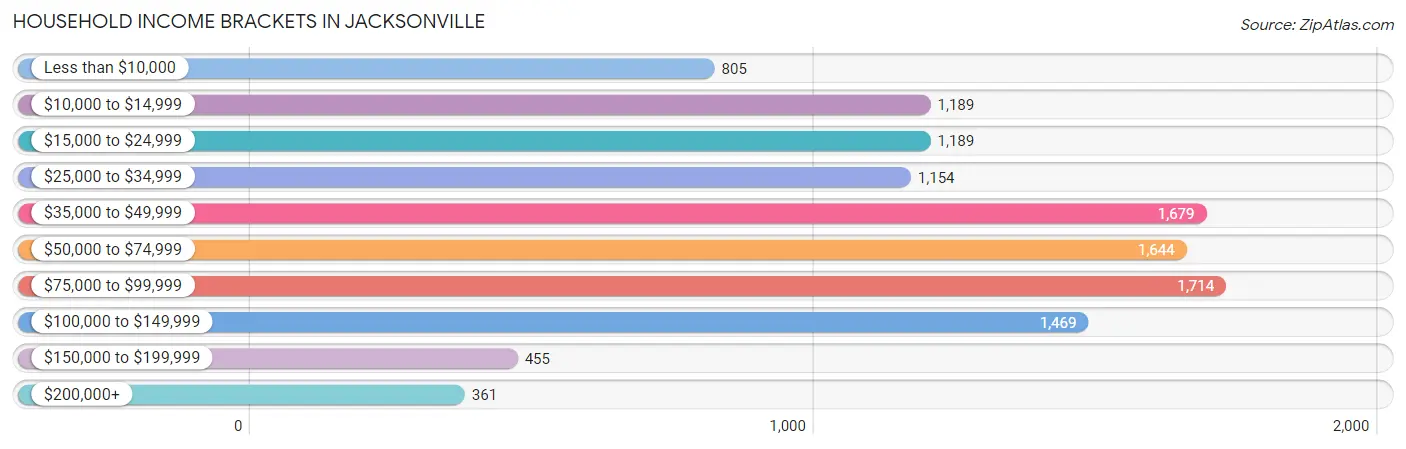
| Income Bracket | # Households | % Households |
| Less than $10,000 | 805 | 6.9% |
| $10,000 to $14,999 | 1,189 | 10.2% |
| $15,000 to $24,999 | 1,189 | 10.2% |
| $25,000 to $34,999 | 1,154 | 9.9% |
| $35,000 to $49,999 | 1,679 | 14.4% |
| $50,000 to $74,999 | 1,644 | 14.1% |
| $75,000 to $99,999 | 1,714 | 14.7% |
| $100,000 to $149,999 | 1,469 | 12.6% |
| $150,000 to $199,999 | 455 | 3.9% |
| $200,000+ | 361 | 3.1% |
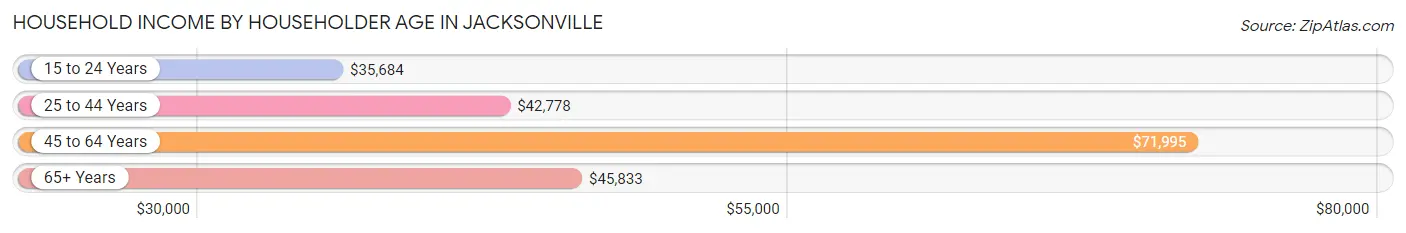
Household Income by Householder Age in Jacksonville
The median household income in Jacksonville is $47,121, with the highest median household income of $71,995 found in the 45 to 64 years age bracket for the primary householder. A total of 3,521 households (30.2%) fall into this category. Meanwhile, the 15 to 24 years age bracket for the primary householder has the lowest median household income of $35,684, with 1,045 households (9.0%) in this group.
| Income Bracket | # Households | Median Income |
| 15 to 24 Years | 1,045 (9.0%) | $35,684 |
| 25 to 44 Years | 4,774 (40.9%) | $42,778 |
| 45 to 64 Years | 3,521 (30.2%) | $71,995 |
| 65+ Years | 2,320 (19.9%) | $45,833 |
| Total | 11,660 (100.0%) | $47,121 |
Poverty in Jacksonville
Income Below Poverty by Sex and Age in Jacksonville
With 16.6% poverty level for males and 27.6% for females among the residents of Jacksonville, 15 year old males and 12 to 14 year old females are the most vulnerable to poverty, with 53 males (55.8%) and 343 females (52.2%) in their respective age groups living below the poverty level.
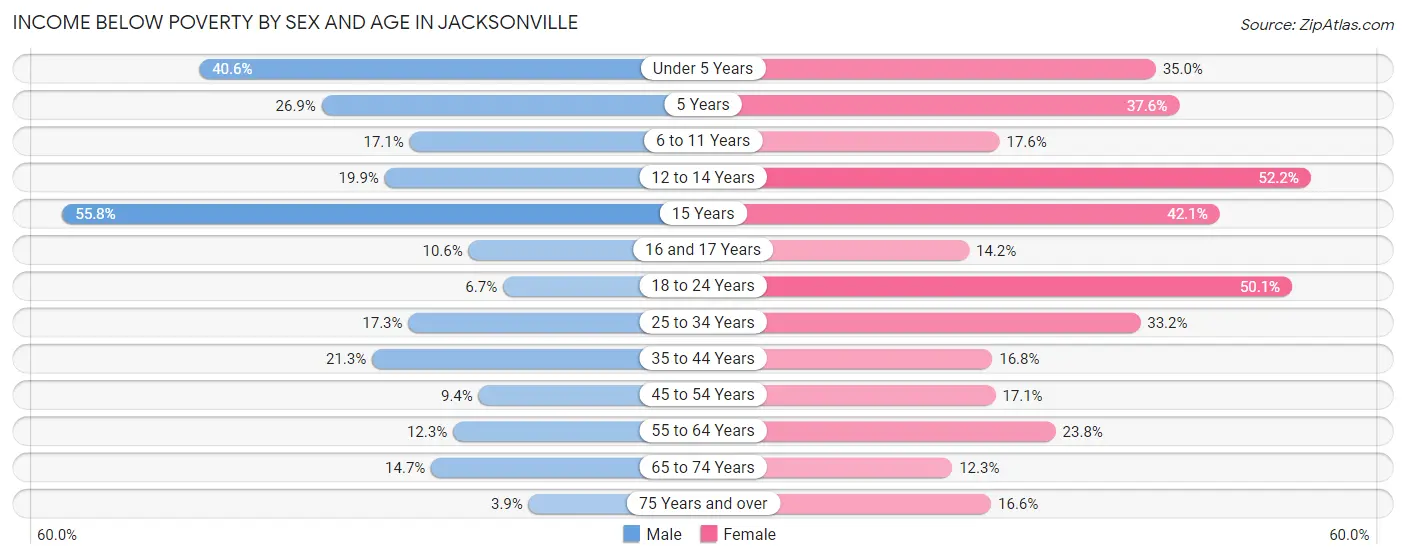
| Age Bracket | Male | Female |
| Under 5 Years | 399 (40.6%) | 294 (35.0%) |
| 5 Years | 84 (26.9%) | 98 (37.6%) |
| 6 to 11 Years | 234 (17.1%) | 133 (17.6%) |
| 12 to 14 Years | 80 (19.9%) | 343 (52.2%) |
| 15 Years | 53 (55.8%) | 183 (42.1%) |
| 16 and 17 Years | 32 (10.6%) | 68 (14.2%) |
| 18 to 24 Years | 107 (6.7%) | 790 (50.1%) |
| 25 to 34 Years | 336 (17.3%) | 982 (33.2%) |
| 35 to 44 Years | 384 (21.3%) | 347 (16.8%) |
| 45 to 54 Years | 102 (9.4%) | 245 (17.1%) |
| 55 to 64 Years | 246 (12.3%) | 383 (23.8%) |
| 65 to 74 Years | 136 (14.7%) | 134 (12.3%) |
| 75 Years and over | 21 (3.9%) | 151 (16.6%) |
| Total | 2,214 (16.6%) | 4,151 (27.6%) |
Income Above Poverty by Sex and Age in Jacksonville
According to the poverty statistics in Jacksonville, males aged 75 years and over and females aged 65 to 74 years are the age groups that are most secure financially, with 96.1% of males and 87.7% of females in these age groups living above the poverty line.
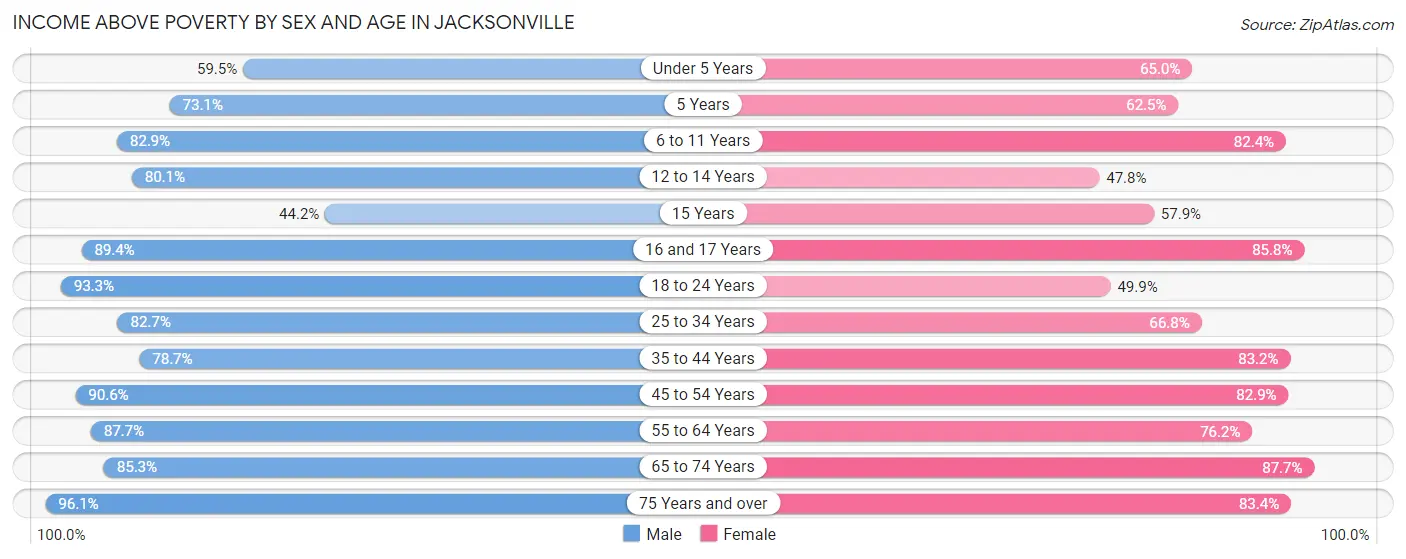
| Age Bracket | Male | Female |
| Under 5 Years | 585 (59.5%) | 547 (65.0%) |
| 5 Years | 228 (73.1%) | 163 (62.5%) |
| 6 to 11 Years | 1,132 (82.9%) | 624 (82.4%) |
| 12 to 14 Years | 322 (80.1%) | 314 (47.8%) |
| 15 Years | 42 (44.2%) | 252 (57.9%) |
| 16 and 17 Years | 271 (89.4%) | 412 (85.8%) |
| 18 to 24 Years | 1,486 (93.3%) | 786 (49.9%) |
| 25 to 34 Years | 1,611 (82.7%) | 1,972 (66.8%) |
| 35 to 44 Years | 1,418 (78.7%) | 1,723 (83.2%) |
| 45 to 54 Years | 978 (90.6%) | 1,187 (82.9%) |
| 55 to 64 Years | 1,755 (87.7%) | 1,225 (76.2%) |
| 65 to 74 Years | 788 (85.3%) | 955 (87.7%) |
| 75 Years and over | 522 (96.1%) | 757 (83.4%) |
| Total | 11,138 (83.4%) | 10,917 (72.5%) |
Income Below Poverty Among Married-Couple Families in Jacksonville
The poverty statistics for married-couple families in Jacksonville show that 5.2% or 245 of the total 4,747 families live below the poverty line. Families with 5 or more children have the highest poverty rate of 23.5%, comprising of 4 families. On the other hand, families with no children have the lowest poverty rate of 2.7%, which includes 75 families.
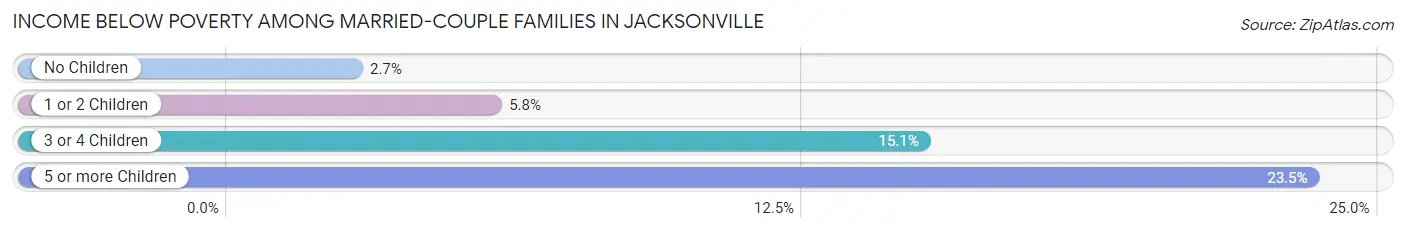
| Children | Above Poverty | Below Poverty |
| No Children | 2,683 (97.3%) | 75 (2.7%) |
| 1 or 2 Children | 1,327 (94.3%) | 81 (5.8%) |
| 3 or 4 Children | 479 (84.9%) | 85 (15.1%) |
| 5 or more Children | 13 (76.5%) | 4 (23.5%) |
| Total | 4,502 (94.8%) | 245 (5.2%) |
Income Below Poverty Among Single-Parent Households in Jacksonville
According to the poverty data in Jacksonville, 17.0% or 75 single-father households and 40.3% or 703 single-mother households are living below the poverty line. Among single-father households, those with 5 or more children have the highest poverty rate, with 34 households (100.0%) experiencing poverty. Likewise, among single-mother households, those with 3 or 4 children have the highest poverty rate, with 153 households (69.6%) falling below the poverty line.
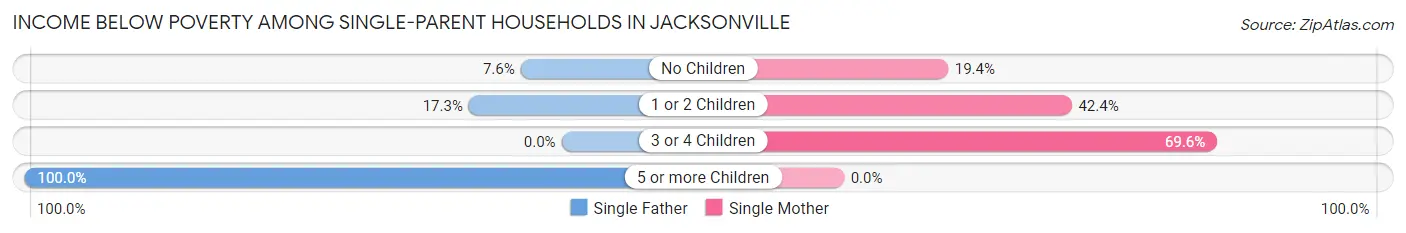
| Children | Single Father | Single Mother |
| No Children | 17 (7.6%) | 82 (19.4%) |
| 1 or 2 Children | 24 (17.3%) | 468 (42.4%) |
| 3 or 4 Children | 0 (0.0%) | 153 (69.6%) |
| 5 or more Children | 34 (100.0%) | 0 (0.0%) |
| Total | 75 (17.0%) | 703 (40.3%) |
Income Below Poverty Among Married-Couple vs Single-Parent Households in Jacksonville
The poverty data for Jacksonville shows that 245 of the married-couple family households (5.2%) and 778 of the single-parent households (35.6%) are living below the poverty level. Within the married-couple family households, those with 5 or more children have the highest poverty rate, with 4 households (23.5%) falling below the poverty line. Among the single-parent households, those with 5 or more children have the highest poverty rate, with 34 household (100.0%) living below poverty.
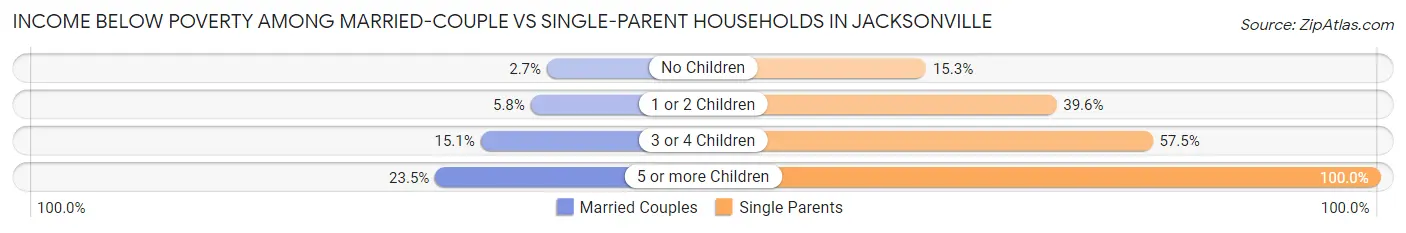
| Children | Married-Couple Families | Single-Parent Households |
| No Children | 75 (2.7%) | 99 (15.3%) |
| 1 or 2 Children | 81 (5.8%) | 492 (39.6%) |
| 3 or 4 Children | 85 (15.1%) | 153 (57.5%) |
| 5 or more Children | 4 (23.5%) | 34 (100.0%) |
| Total | 245 (5.2%) | 778 (35.6%) |
Race in Jacksonville
The most populous races in Jacksonville are Black / African American (13,314 | 45.4%), White / Caucasian (12,584 | 42.9%), and Hispanic or Latino (2,100 | 7.2%).
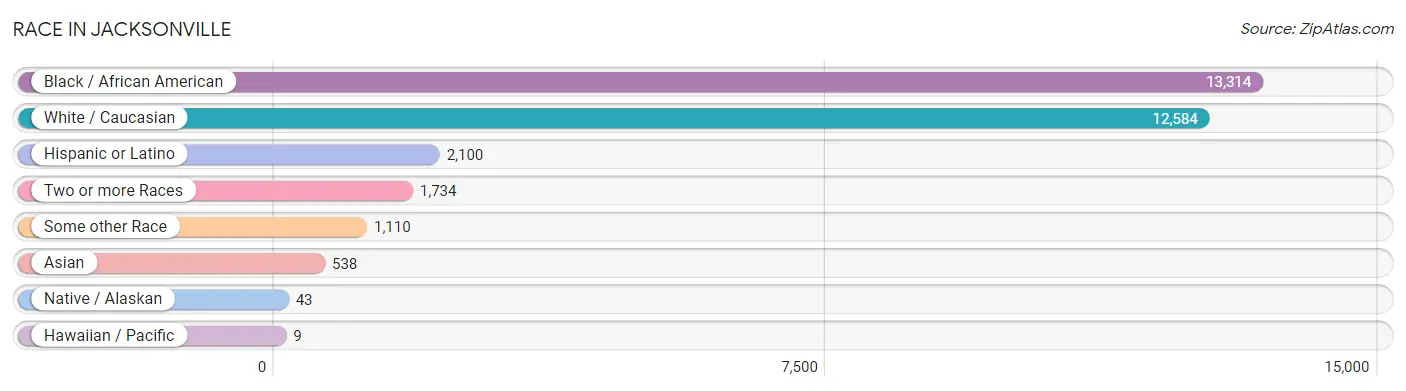
| Race | # Population | % Population |
| Asian | 538 | 1.8% |
| Black / African American | 13,314 | 45.4% |
| Hawaiian / Pacific | 9 | 0.0% |
| Hispanic or Latino | 2,100 | 7.2% |
| Native / Alaskan | 43 | 0.2% |
| White / Caucasian | 12,584 | 42.9% |
| Two or more Races | 1,734 | 5.9% |
| Some other Race | 1,110 | 3.8% |
| Total | 29,332 | 100.0% |
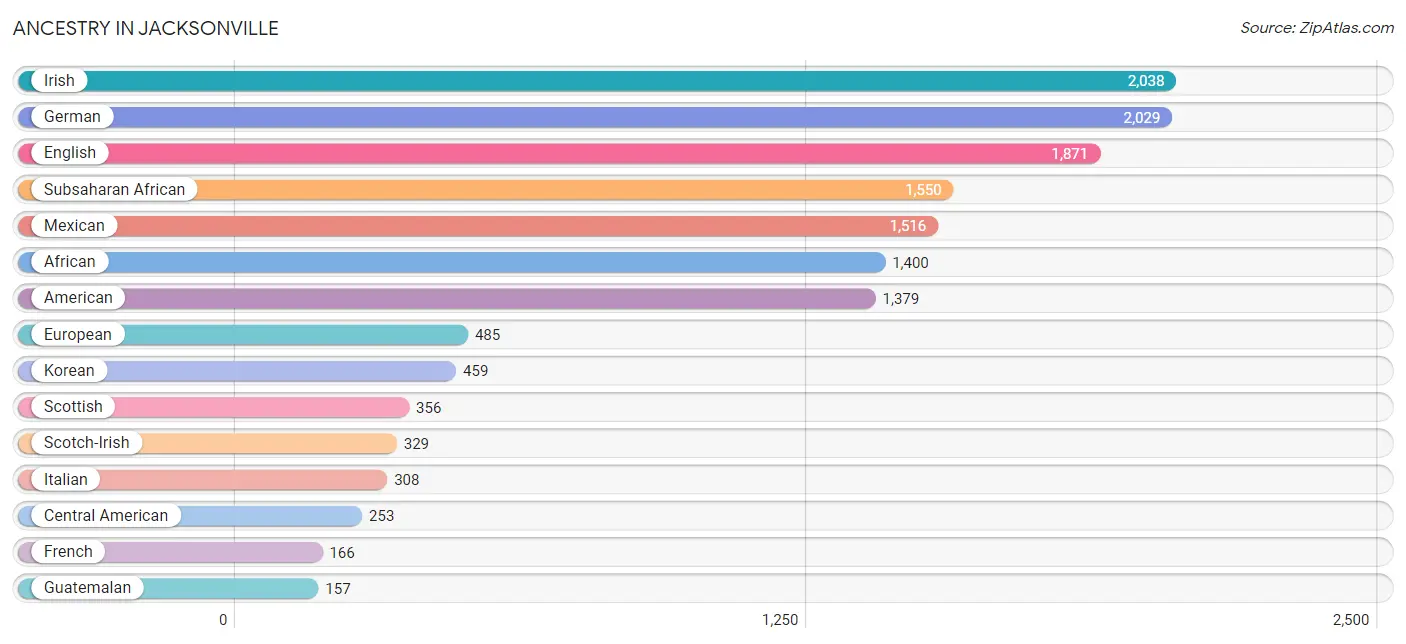
Ancestry in Jacksonville
The most populous ancestries reported in Jacksonville are Irish (2,038 | 7.0%), German (2,029 | 6.9%), English (1,871 | 6.4%), Subsaharan African (1,550 | 5.3%), and Mexican (1,516 | 5.2%), together accounting for 30.7% of all Jacksonville residents.
| Ancestry | # Population | % Population |
| African | 1,400 | 4.8% |
| American | 1,379 | 4.7% |
| Arab | 18 | 0.1% |
| Bhutanese | 57 | 0.2% |
| Blackfeet | 5 | 0.0% |
| Brazilian | 49 | 0.2% |
| British | 69 | 0.2% |
| Burmese | 29 | 0.1% |
| Cajun | 7 | 0.0% |
| Central American | 253 | 0.9% |
| Cherokee | 67 | 0.2% |
| Choctaw | 12 | 0.0% |
| Colombian | 25 | 0.1% |
| Cuban | 45 | 0.2% |
| Czech | 50 | 0.2% |
| Dutch | 60 | 0.2% |
| English | 1,871 | 6.4% |
| European | 485 | 1.7% |
| Finnish | 24 | 0.1% |
| French | 166 | 0.6% |
| French Canadian | 19 | 0.1% |
| German | 2,029 | 6.9% |
| Greek | 134 | 0.5% |
| Guatemalan | 157 | 0.5% |
| Haitian | 25 | 0.1% |
| Honduran | 45 | 0.2% |
| Hungarian | 34 | 0.1% |
| Indian (Asian) | 85 | 0.3% |
| Irish | 2,038 | 7.0% |
| Iroquois | 12 | 0.0% |
| Italian | 308 | 1.1% |
| Jamaican | 117 | 0.4% |
| Korean | 459 | 1.6% |
| Lithuanian | 10 | 0.0% |
| Mexican | 1,516 | 5.2% |
| Native Hawaiian | 9 | 0.0% |
| Navajo | 19 | 0.1% |
| Nigerian | 36 | 0.1% |
| Northern European | 10 | 0.0% |
| Norwegian | 102 | 0.4% |
| Pakistani | 35 | 0.1% |
| Panamanian | 36 | 0.1% |
| Polish | 67 | 0.2% |
| Portuguese | 9 | 0.0% |
| Pueblo | 6 | 0.0% |
| Puerto Rican | 110 | 0.4% |
| Salvadoran | 15 | 0.1% |
| Scandinavian | 48 | 0.2% |
| Scotch-Irish | 329 | 1.1% |
| Scottish | 356 | 1.2% |
| Slovak | 11 | 0.0% |
| South American | 33 | 0.1% |
| Spaniard | 56 | 0.2% |
| Subsaharan African | 1,550 | 5.3% |
| Swedish | 102 | 0.4% |
| Swiss | 5 | 0.0% |
| Trinidadian and Tobagonian | 8 | 0.0% |
| Ukrainian | 7 | 0.0% |
| Venezuelan | 8 | 0.0% |
| Welsh | 14 | 0.1% |
| West Indian | 117 | 0.4% | View All 61 Rows |
Immigrants in Jacksonville
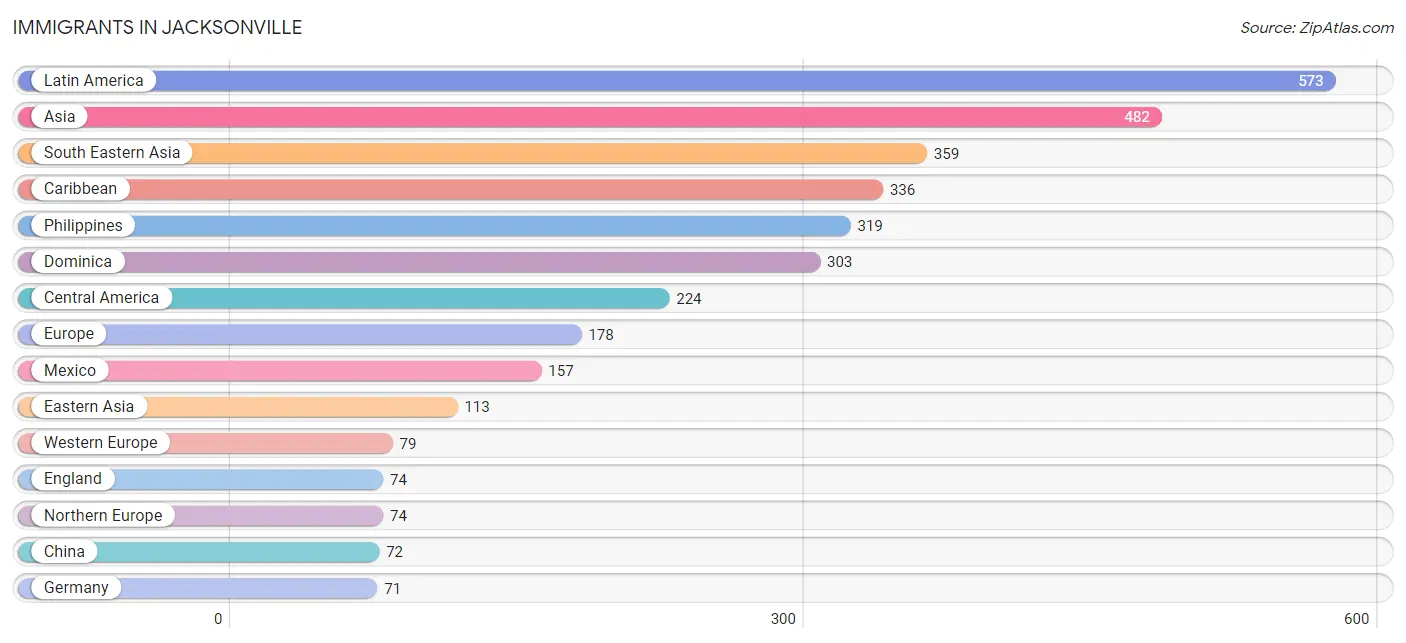
The most numerous immigrant groups reported in Jacksonville came from Latin America (573 | 1.9%), Asia (482 | 1.6%), South Eastern Asia (359 | 1.2%), Caribbean (336 | 1.1%), and Philippines (319 | 1.1%), together accounting for 7.1% of all Jacksonville residents.
| Immigration Origin | # Population | % Population |
| Asia | 482 | 1.6% |
| Brazil | 9 | 0.0% |
| Caribbean | 336 | 1.1% |
| Central America | 224 | 0.8% |
| China | 72 | 0.3% |
| Cuba | 6 | 0.0% |
| Dominica | 303 | 1.0% |
| Eastern Asia | 113 | 0.4% |
| Eastern Europe | 11 | 0.0% |
| El Salvador | 15 | 0.1% |
| England | 74 | 0.3% |
| Europe | 178 | 0.6% |
| France | 8 | 0.0% |
| Germany | 71 | 0.2% |
| Guatemala | 18 | 0.1% |
| Guyana | 4 | 0.0% |
| Haiti | 6 | 0.0% |
| Honduras | 34 | 0.1% |
| Jamaica | 21 | 0.1% |
| Japan | 17 | 0.1% |
| Korea | 24 | 0.1% |
| Latin America | 573 | 1.9% |
| Mexico | 157 | 0.5% |
| Nepal | 10 | 0.0% |
| Northern Europe | 74 | 0.3% |
| Philippines | 319 | 1.1% |
| Poland | 11 | 0.0% |
| South America | 13 | 0.0% |
| South Central Asia | 10 | 0.0% |
| South Eastern Asia | 359 | 1.2% |
| Taiwan | 20 | 0.1% |
| Thailand | 40 | 0.1% |
| Western Europe | 79 | 0.3% | View All 33 Rows |
Sex and Age in Jacksonville
Sex and Age in Jacksonville
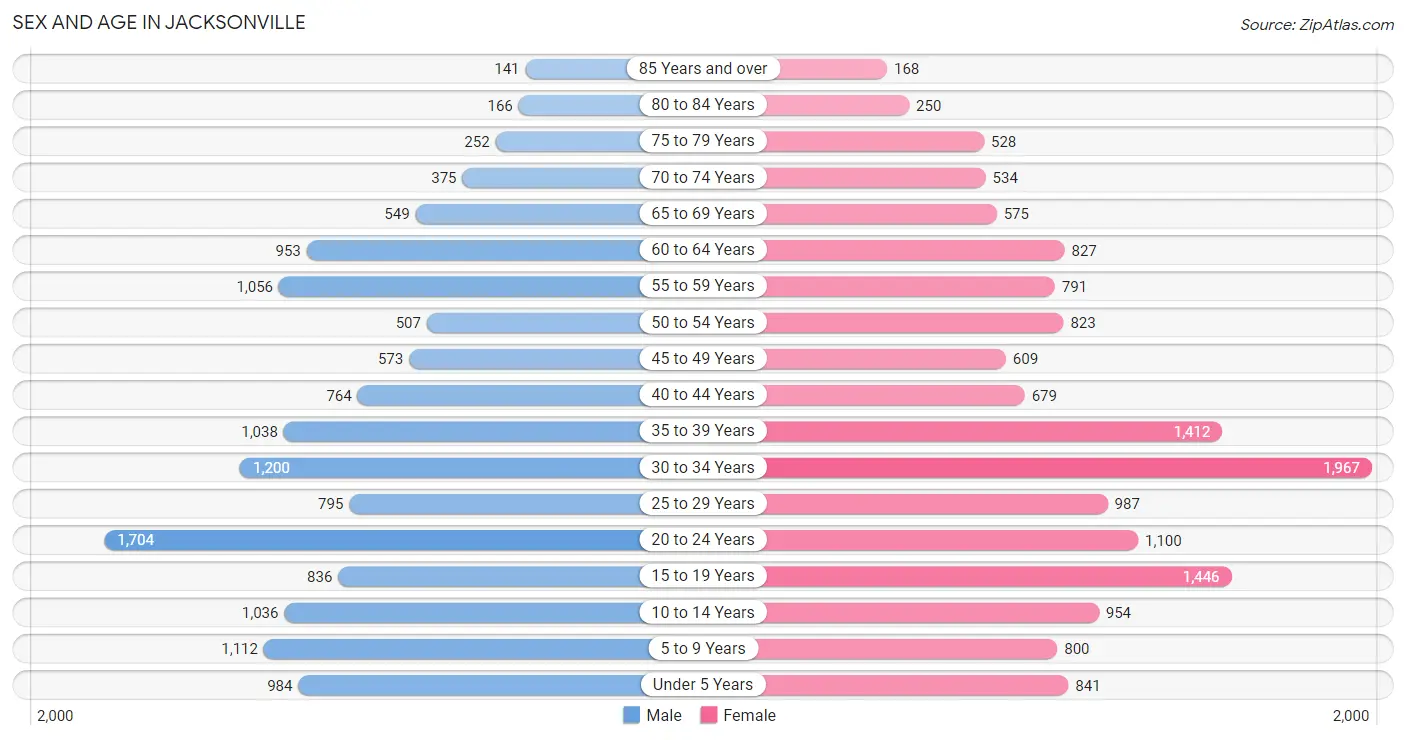
The most populous age groups in Jacksonville are 20 to 24 Years (1,704 | 12.1%) for men and 30 to 34 Years (1,967 | 12.9%) for women.
| Age Bracket | Male | Female |
| Under 5 Years | 984 (7.0%) | 841 (5.5%) |
| 5 to 9 Years | 1,112 (7.9%) | 800 (5.2%) |
| 10 to 14 Years | 1,036 (7.4%) | 954 (6.2%) |
| 15 to 19 Years | 836 (5.9%) | 1,446 (9.5%) |
| 20 to 24 Years | 1,704 (12.1%) | 1,100 (7.2%) |
| 25 to 29 Years | 795 (5.7%) | 987 (6.5%) |
| 30 to 34 Years | 1,200 (8.6%) | 1,967 (12.9%) |
| 35 to 39 Years | 1,038 (7.4%) | 1,412 (9.2%) |
| 40 to 44 Years | 764 (5.4%) | 679 (4.4%) |
| 45 to 49 Years | 573 (4.1%) | 609 (4.0%) |
| 50 to 54 Years | 507 (3.6%) | 823 (5.4%) |
| 55 to 59 Years | 1,056 (7.5%) | 791 (5.2%) |
| 60 to 64 Years | 953 (6.8%) | 827 (5.4%) |
| 65 to 69 Years | 549 (3.9%) | 575 (3.8%) |
| 70 to 74 Years | 375 (2.7%) | 534 (3.5%) |
| 75 to 79 Years | 252 (1.8%) | 528 (3.5%) |
| 80 to 84 Years | 166 (1.2%) | 250 (1.6%) |
| 85 Years and over | 141 (1.0%) | 168 (1.1%) |
| Total | 14,041 (100.0%) | 15,291 (100.0%) |
Families and Households in Jacksonville
Median Family Size in Jacksonville
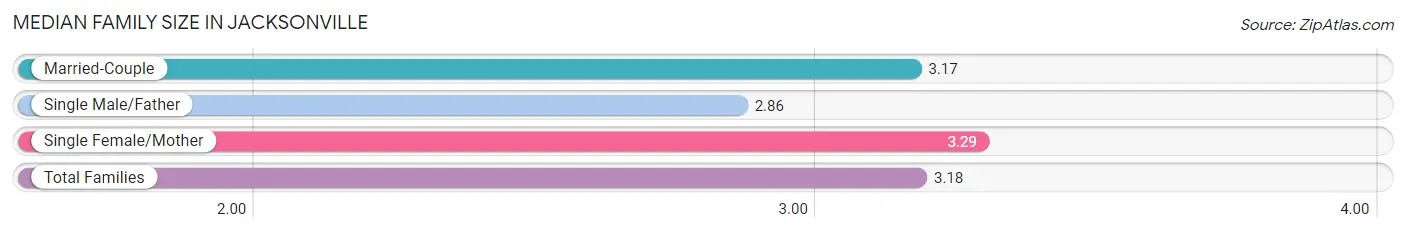
The median family size in Jacksonville is 3.18 persons per family, with single female/mother families (1,746 | 25.2%) accounting for the largest median family size of 3.29 persons per family. On the other hand, single male/father families (442 | 6.4%) represent the smallest median family size with 2.86 persons per family.
| Family Type | # Families | Family Size |
| Married-Couple | 4,747 (68.4%) | 3.17 |
| Single Male/Father | 442 (6.4%) | 2.86 |
| Single Female/Mother | 1,746 (25.2%) | 3.29 |
| Total Families | 6,935 (100.0%) | 3.18 |
Median Household Size in Jacksonville
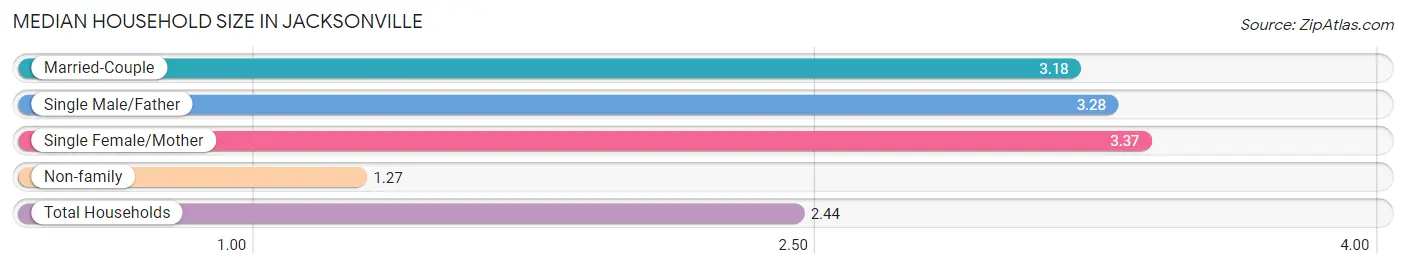
The median household size in Jacksonville is 2.44 persons per household, with single female/mother households (1,746 | 15.0%) accounting for the largest median household size of 3.37 persons per household. non-family households (4,725 | 40.5%) represent the smallest median household size with 1.27 persons per household.
| Household Type | # Households | Household Size |
| Married-Couple | 4,747 (40.7%) | 3.18 |
| Single Male/Father | 442 (3.8%) | 3.28 |
| Single Female/Mother | 1,746 (15.0%) | 3.37 |
| Non-family | 4,725 (40.5%) | 1.27 |
| Total Households | 11,660 (100.0%) | 2.44 |
Household Size by Marriage Status in Jacksonville
Out of a total of 11,660 households in Jacksonville, 6,935 (59.5%) are family households, while 4,725 (40.5%) are nonfamily households. The most numerous type of family households are 2-person households, comprising 3,075, and the most common type of nonfamily households are 1-person households, comprising 3,789.
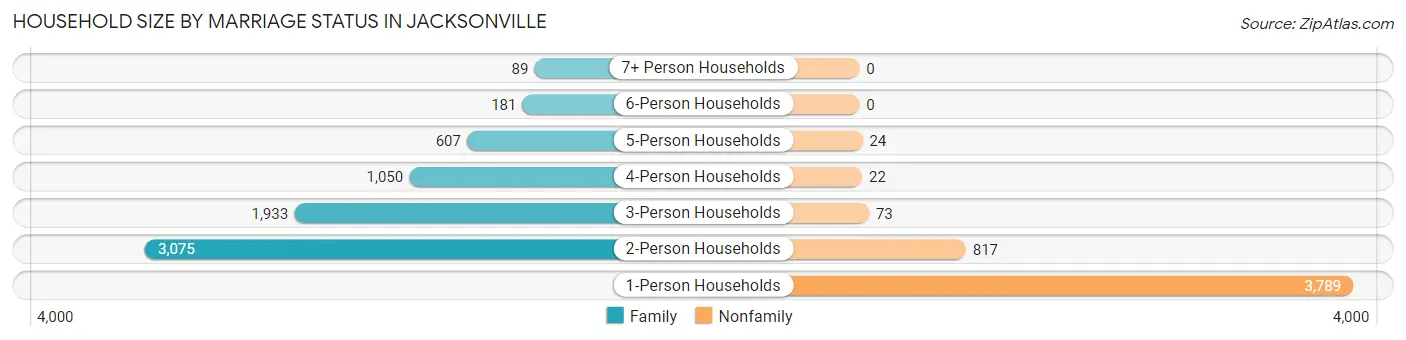
| Household Size | Family Households | Nonfamily Households |
| 1-Person Households | - | 3,789 (32.5%) |
| 2-Person Households | 3,075 (26.4%) | 817 (7.0%) |
| 3-Person Households | 1,933 (16.6%) | 73 (0.6%) |
| 4-Person Households | 1,050 (9.0%) | 22 (0.2%) |
| 5-Person Households | 607 (5.2%) | 24 (0.2%) |
| 6-Person Households | 181 (1.5%) | 0 (0.0%) |
| 7+ Person Households | 89 (0.8%) | 0 (0.0%) |
| Total | 6,935 (59.5%) | 4,725 (40.5%) |
Female Fertility in Jacksonville
Fertility by Age in Jacksonville
Average fertility rate in Jacksonville is 61.0 births per 1,000 women. Women in the age bracket of 20 to 34 years have the highest fertility rate with 107.0 births per 1,000 women. Women in the age bracket of 20 to 34 years acount for 84.8% of all women with births.
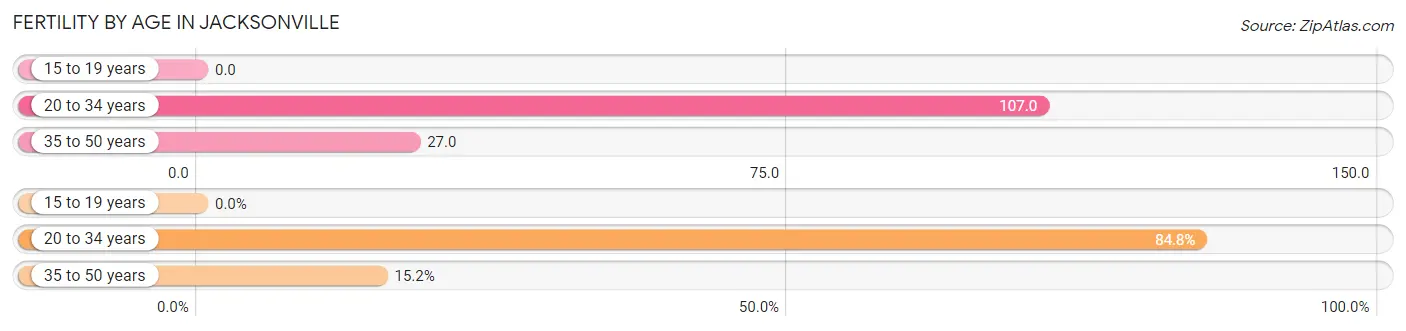
| Age Bracket | Women with Births | Births / 1,000 Women |
| 15 to 19 years | 0 (0.0%) | 0.0 |
| 20 to 34 years | 434 (84.8%) | 107.0 |
| 35 to 50 years | 78 (15.2%) | 27.0 |
| Total | 512 (100.0%) | 61.0 |
Fertility by Age by Marriage Status in Jacksonville
36.3% of women with births (512) in Jacksonville are married. The highest percentage of unmarried women with births falls into 35 to 50 years age bracket with 83.3% of them unmarried at the time of birth, while the lowest percentage of unmarried women with births belong to 20 to 34 years age bracket with 60.1% of them unmarried.
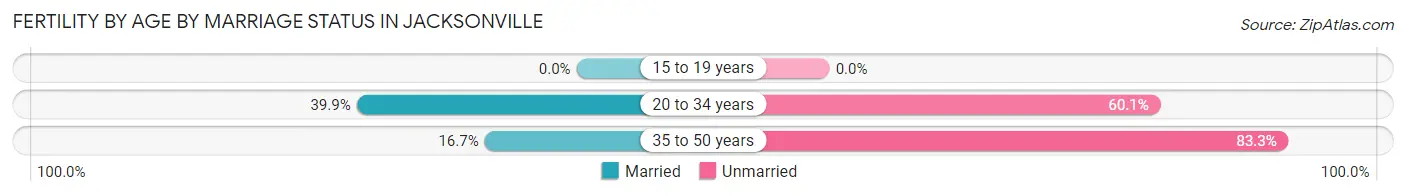
| Age Bracket | Married | Unmarried |
| 15 to 19 years | 0 (0.0%) | 0 (0.0%) |
| 20 to 34 years | 173 (39.9%) | 261 (60.1%) |
| 35 to 50 years | 13 (16.7%) | 65 (83.3%) |
| Total | 186 (36.3%) | 326 (63.7%) |
Fertility by Education in Jacksonville
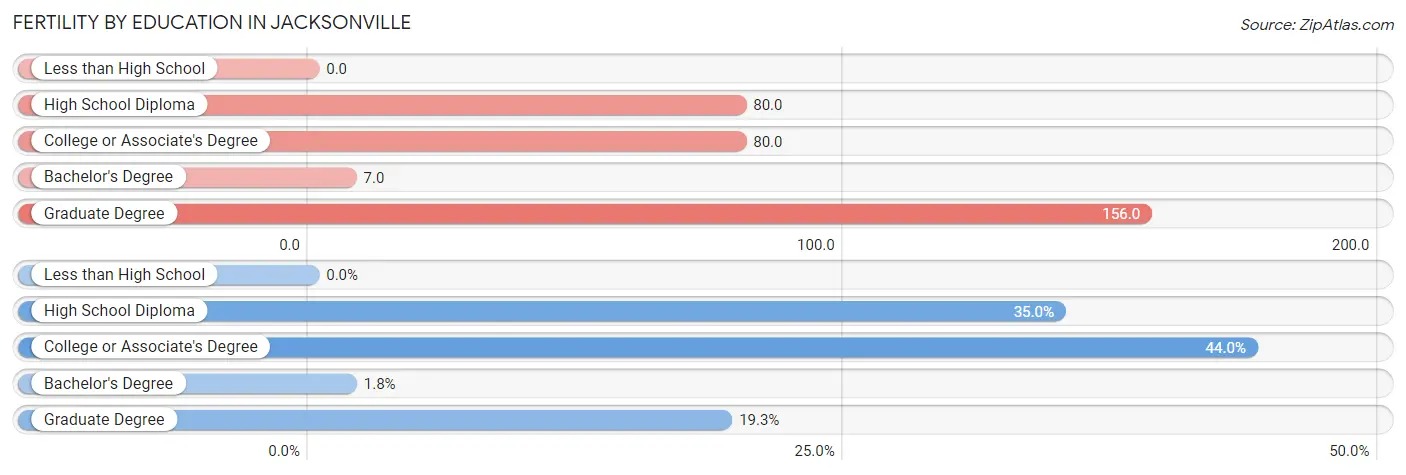
| Educational Attainment | Women with Births | Births / 1,000 Women |
| Less than High School | 0 (0.0%) | 0.0 |
| High School Diploma | 179 (35.0%) | 80.0 |
| College or Associate's Degree | 225 (44.0%) | 80.0 |
| Bachelor's Degree | 9 (1.8%) | 7.0 |
| Graduate Degree | 99 (19.3%) | 156.0 |
| Total | 512 (100.0%) | 61.0 |
Fertility by Education by Marriage Status in Jacksonville
63.7% of women with births in Jacksonville are unmarried. Women with the educational attainment of bachelor's degree are most likely to be married with 100.0% of them married at childbirth, while women with the educational attainment of high school diploma are least likely to be married with 92.7% of them unmarried at childbirth.
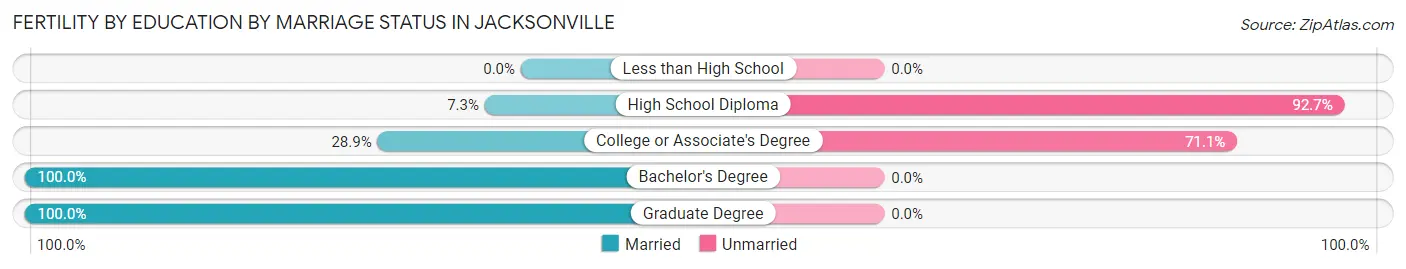
| Educational Attainment | Married | Unmarried |
| Less than High School | 0 (0.0%) | 0 (0.0%) |
| High School Diploma | 13 (7.3%) | 166 (92.7%) |
| College or Associate's Degree | 65 (28.9%) | 160 (71.1%) |
| Bachelor's Degree | 9 (100.0%) | 0 (0.0%) |
| Graduate Degree | 99 (100.0%) | 0 (0.0%) |
| Total | 186 (36.3%) | 326 (63.7%) |
Employment Characteristics in Jacksonville
Employment by Class of Employer in Jacksonville
Among the 13,265 employed individuals in Jacksonville, private company employees (7,830 | 59.0%), federal government employees (2,369 | 17.9%), and not-for-profit organizations (950 | 7.2%) make up the most common classes of employment.
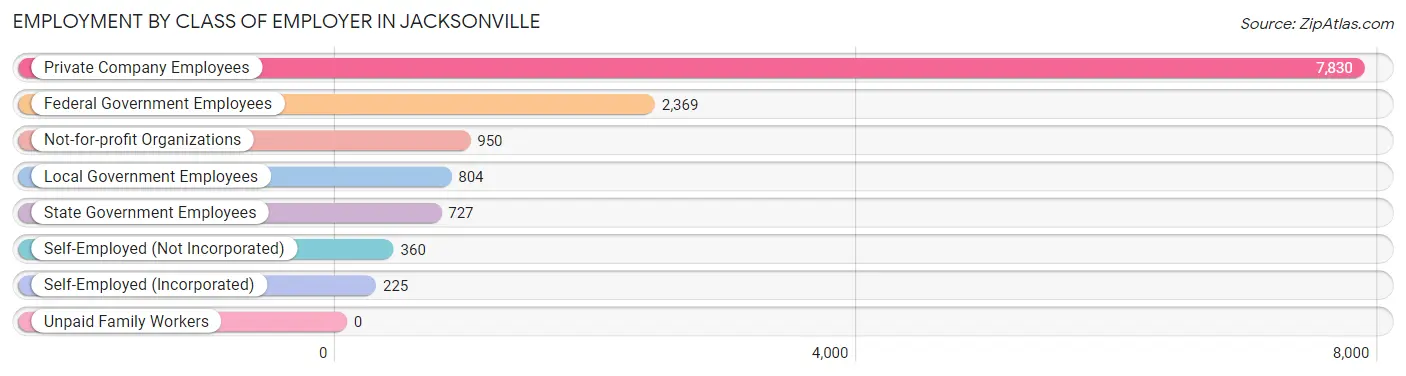
| Employer Class | # Employees | % Employees |
| Private Company Employees | 7,830 | 59.0% |
| Self-Employed (Incorporated) | 225 | 1.7% |
| Self-Employed (Not Incorporated) | 360 | 2.7% |
| Not-for-profit Organizations | 950 | 7.2% |
| Local Government Employees | 804 | 6.1% |
| State Government Employees | 727 | 5.5% |
| Federal Government Employees | 2,369 | 17.9% |
| Unpaid Family Workers | 0 | 0.0% |
| Total | 13,265 | 100.0% |
Employment Status by Age in Jacksonville
According to the labor force statistics for Jacksonville, out of the total population over 16 years of age (23,075), 63.8% or 14,722 individuals are in the labor force, with 8.9% or 1,310 of them unemployed. The age group with the highest labor force participation rate is 30 to 34 years, with 88.3% or 2,796 individuals in the labor force. Within the labor force, the 25 to 29 years age range has the highest percentage of unemployed individuals, with 25.5% or 363 of them being unemployed.
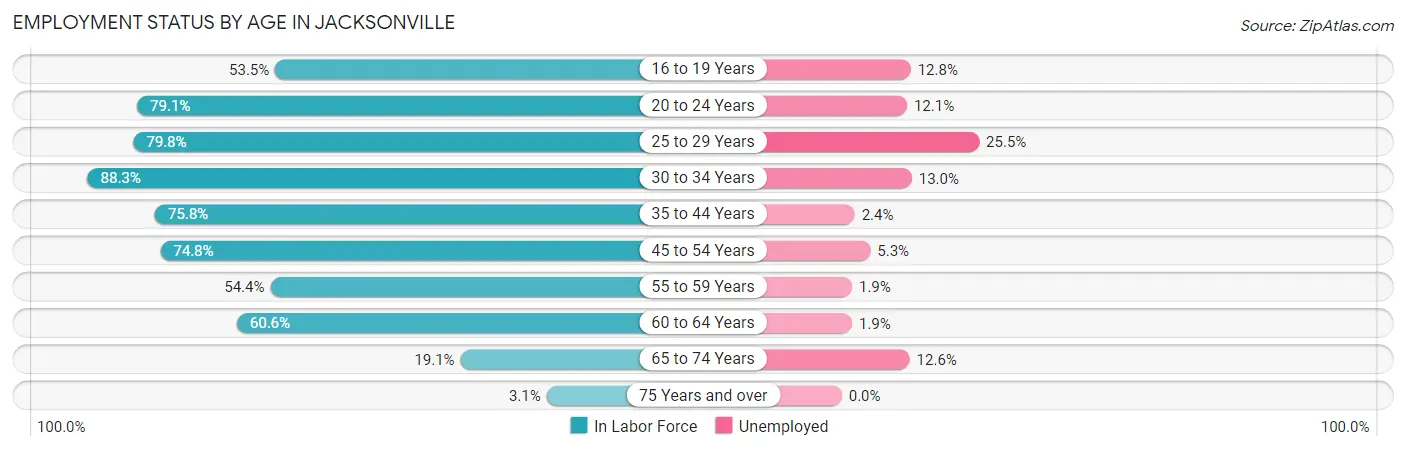
| Age Bracket | In Labor Force | Unemployed |
| 16 to 19 Years | 937 (53.5%) | 120 (12.8%) |
| 20 to 24 Years | 2,218 (79.1%) | 268 (12.1%) |
| 25 to 29 Years | 1,422 (79.8%) | 363 (25.5%) |
| 30 to 34 Years | 2,796 (88.3%) | 363 (13.0%) |
| 35 to 44 Years | 2,951 (75.8%) | 71 (2.4%) |
| 45 to 54 Years | 1,879 (74.8%) | 100 (5.3%) |
| 55 to 59 Years | 1,005 (54.4%) | 19 (1.9%) |
| 60 to 64 Years | 1,079 (60.6%) | 21 (1.9%) |
| 65 to 74 Years | 388 (19.1%) | 49 (12.6%) |
| 75 Years and over | 47 (3.1%) | 0 (0.0%) |
| Total | 14,722 (63.8%) | 1,310 (8.9%) |
Employment Status by Educational Attainment in Jacksonville
According to labor force statistics for Jacksonville, 74.3% of individuals (11,131) out of the total population between 25 and 64 years of age (14,981) are in the labor force, with 8.1% or 902 of them being unemployed. The group with the highest labor force participation rate are those with the educational attainment of bachelor's degree or higher, with 84.9% or 3,171 individuals in the labor force. Within the labor force, individuals with high school diploma education have the highest percentage of unemployment, with 13.5% or 442 of them being unemployed.
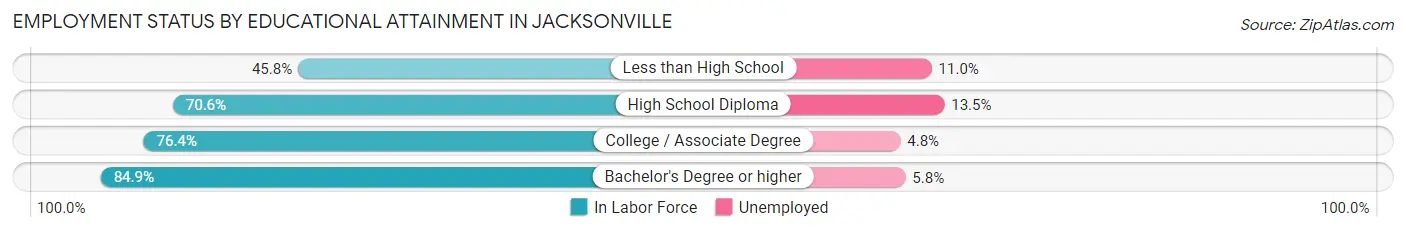
| Educational Attainment | In Labor Force | Unemployed |
| Less than High School | 545 (45.8%) | 131 (11.0%) |
| High School Diploma | 3,271 (70.6%) | 625 (13.5%) |
| College / Associate Degree | 4,143 (76.4%) | 260 (4.8%) |
| Bachelor's Degree or higher | 3,171 (84.9%) | 217 (5.8%) |
| Total | 11,131 (74.3%) | 1,213 (8.1%) |
Employment Occupations by Sex in Jacksonville
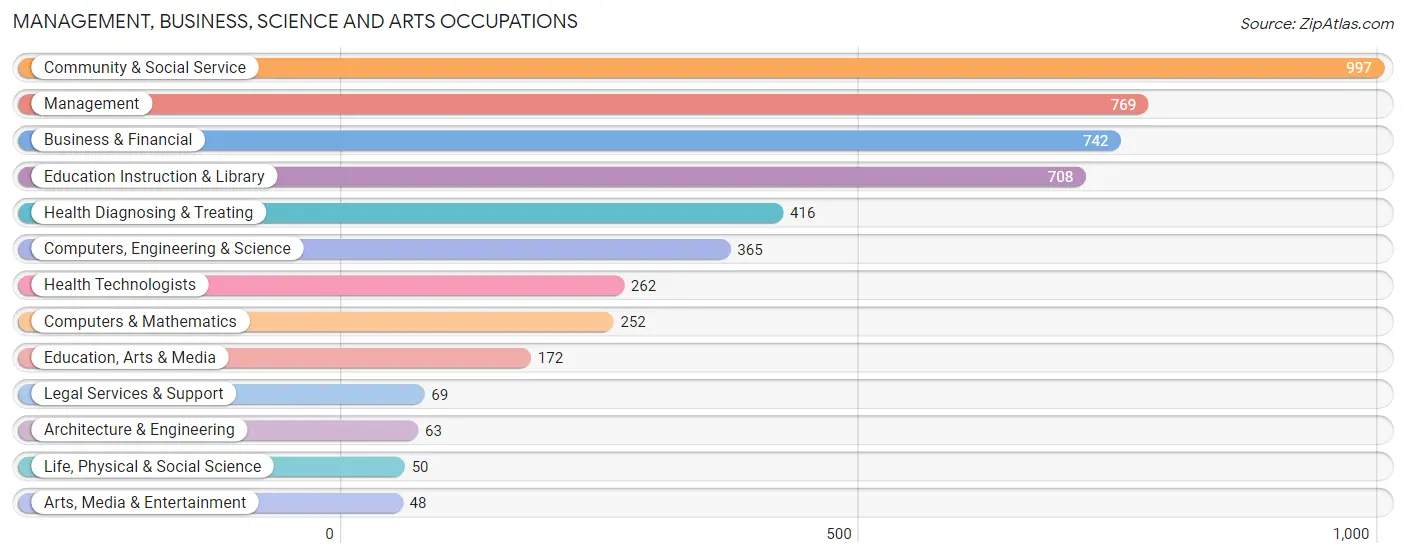
Management, Business, Science and Arts Occupations
The most common Management, Business, Science and Arts occupations in Jacksonville are Community & Social Service (997 | 8.2%), Management (769 | 6.3%), Business & Financial (742 | 6.1%), Education Instruction & Library (708 | 5.8%), and Health Diagnosing & Treating (416 | 3.4%).
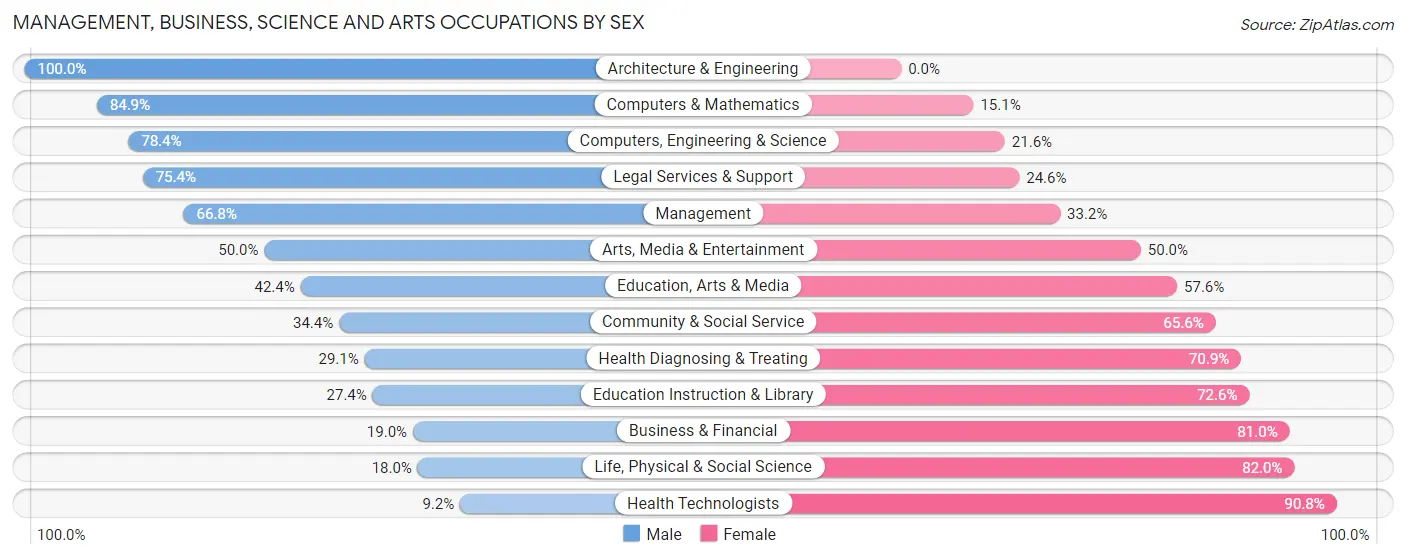
Management, Business, Science and Arts Occupations by Sex
Within the Management, Business, Science and Arts occupations in Jacksonville, the most male-oriented occupations are Architecture & Engineering (100.0%), Computers & Mathematics (84.9%), and Computers, Engineering & Science (78.4%), while the most female-oriented occupations are Health Technologists (90.8%), Life, Physical & Social Science (82.0%), and Business & Financial (81.0%).
| Occupation | Male | Female |
| Management | 514 (66.8%) | 255 (33.2%) |
| Business & Financial | 141 (19.0%) | 601 (81.0%) |
| Computers, Engineering & Science | 286 (78.4%) | 79 (21.6%) |
| Computers & Mathematics | 214 (84.9%) | 38 (15.1%) |
| Architecture & Engineering | 63 (100.0%) | 0 (0.0%) |
| Life, Physical & Social Science | 9 (18.0%) | 41 (82.0%) |
| Community & Social Service | 343 (34.4%) | 654 (65.6%) |
| Education, Arts & Media | 73 (42.4%) | 99 (57.6%) |
| Legal Services & Support | 52 (75.4%) | 17 (24.6%) |
| Education Instruction & Library | 194 (27.4%) | 514 (72.6%) |
| Arts, Media & Entertainment | 24 (50.0%) | 24 (50.0%) |
| Health Diagnosing & Treating | 121 (29.1%) | 295 (70.9%) |
| Health Technologists | 24 (9.2%) | 238 (90.8%) |
| Total (Category) | 1,405 (42.7%) | 1,884 (57.3%) |
| Total (Overall) | 5,762 (47.5%) | 6,365 (52.5%) |
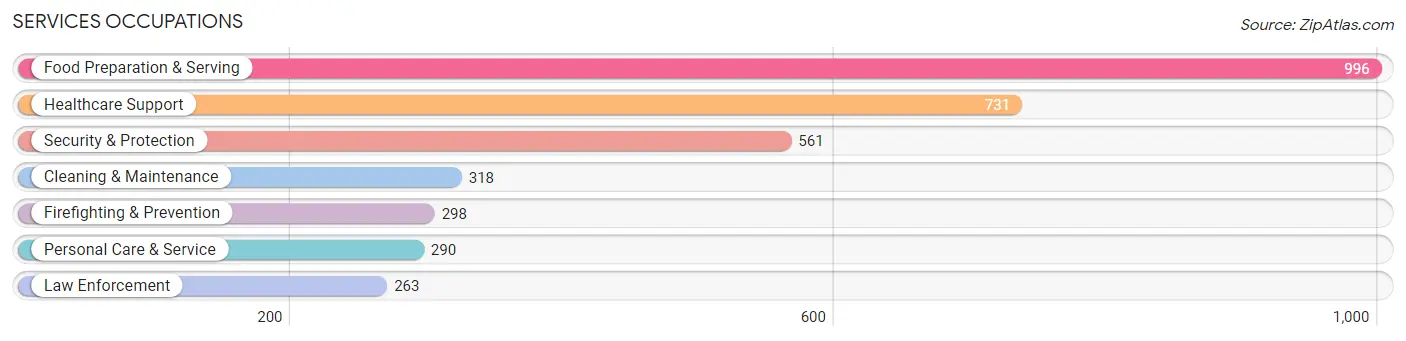
Services Occupations
The most common Services occupations in Jacksonville are Food Preparation & Serving (996 | 8.2%), Healthcare Support (731 | 6.0%), Security & Protection (561 | 4.6%), Cleaning & Maintenance (318 | 2.6%), and Firefighting & Prevention (298 | 2.5%).
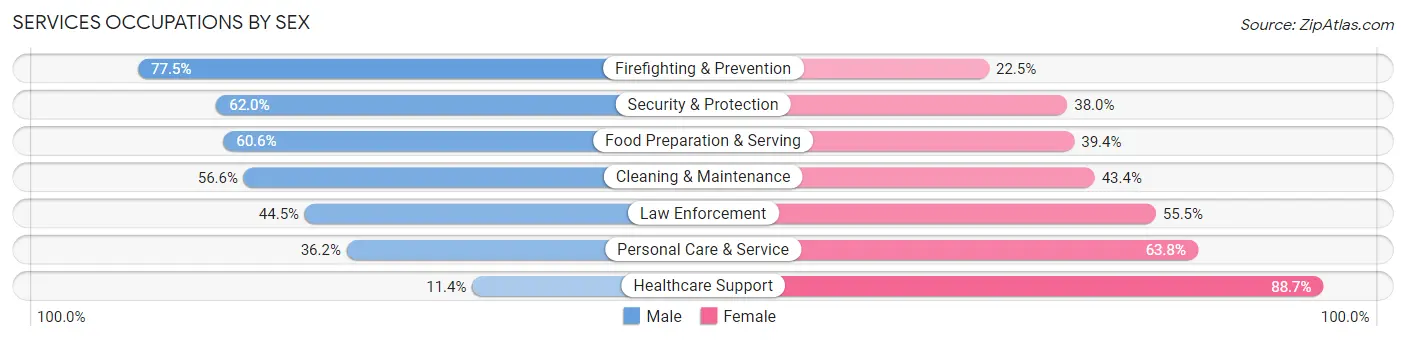
Services Occupations by Sex
Within the Services occupations in Jacksonville, the most male-oriented occupations are Firefighting & Prevention (77.5%), Security & Protection (62.0%), and Food Preparation & Serving (60.6%), while the most female-oriented occupations are Healthcare Support (88.6%), Personal Care & Service (63.8%), and Law Enforcement (55.5%).
| Occupation | Male | Female |
| Healthcare Support | 83 (11.4%) | 648 (88.6%) |
| Security & Protection | 348 (62.0%) | 213 (38.0%) |
| Firefighting & Prevention | 231 (77.5%) | 67 (22.5%) |
| Law Enforcement | 117 (44.5%) | 146 (55.5%) |
| Food Preparation & Serving | 604 (60.6%) | 392 (39.4%) |
| Cleaning & Maintenance | 180 (56.6%) | 138 (43.4%) |
| Personal Care & Service | 105 (36.2%) | 185 (63.8%) |
| Total (Category) | 1,320 (45.6%) | 1,576 (54.4%) |
| Total (Overall) | 5,762 (47.5%) | 6,365 (52.5%) |
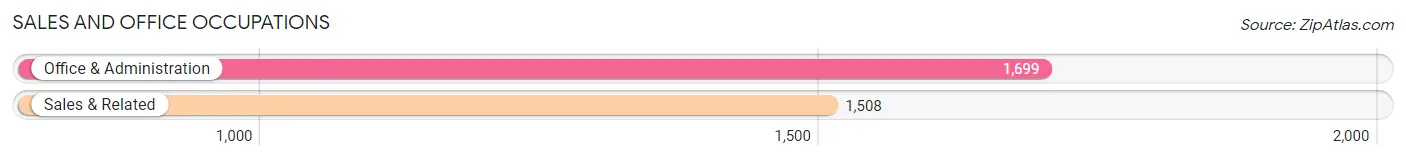
Sales and Office Occupations
The most common Sales and Office occupations in Jacksonville are Office & Administration (1,699 | 14.0%), and Sales & Related (1,508 | 12.4%).
Sales and Office Occupations by Sex
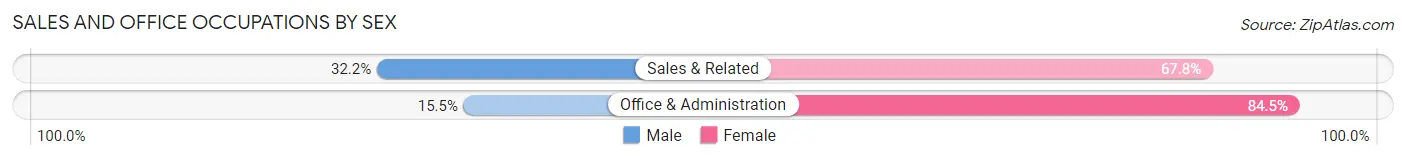
| Occupation | Male | Female |
| Sales & Related | 486 (32.2%) | 1,022 (67.8%) |
| Office & Administration | 264 (15.5%) | 1,435 (84.5%) |
| Total (Category) | 750 (23.4%) | 2,457 (76.6%) |
| Total (Overall) | 5,762 (47.5%) | 6,365 (52.5%) |
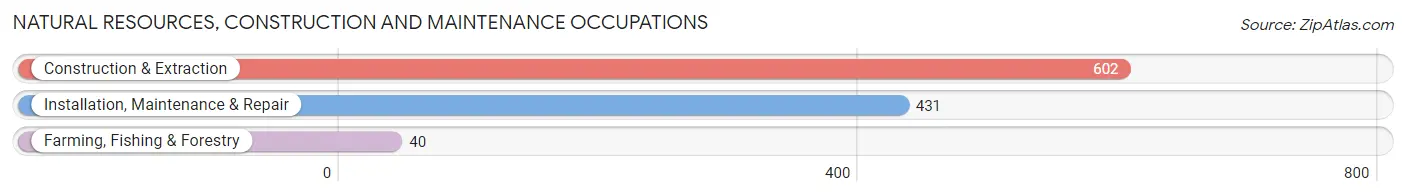
Natural Resources, Construction and Maintenance Occupations
The most common Natural Resources, Construction and Maintenance occupations in Jacksonville are Construction & Extraction (602 | 5.0%), Installation, Maintenance & Repair (431 | 3.5%), and Farming, Fishing & Forestry (40 | 0.3%).
Natural Resources, Construction and Maintenance Occupations by Sex
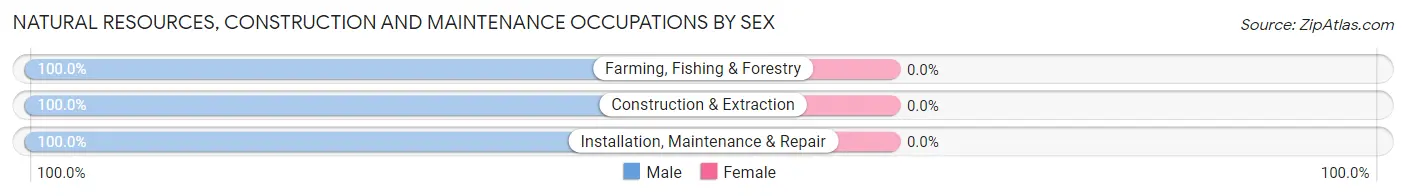
| Occupation | Male | Female |
| Farming, Fishing & Forestry | 40 (100.0%) | 0 (0.0%) |
| Construction & Extraction | 602 (100.0%) | 0 (0.0%) |
| Installation, Maintenance & Repair | 431 (100.0%) | 0 (0.0%) |
| Total (Category) | 1,073 (100.0%) | 0 (0.0%) |
| Total (Overall) | 5,762 (47.5%) | 6,365 (52.5%) |
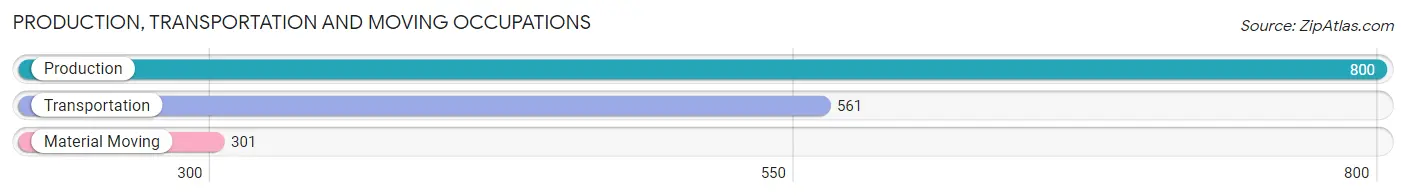
Production, Transportation and Moving Occupations
The most common Production, Transportation and Moving occupations in Jacksonville are Production (800 | 6.6%), Transportation (561 | 4.6%), and Material Moving (301 | 2.5%).
Production, Transportation and Moving Occupations by Sex
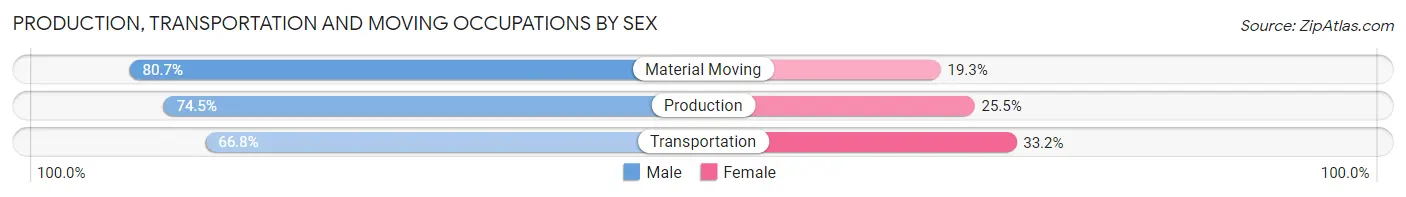
| Occupation | Male | Female |
| Production | 596 (74.5%) | 204 (25.5%) |
| Transportation | 375 (66.8%) | 186 (33.2%) |
| Material Moving | 243 (80.7%) | 58 (19.3%) |
| Total (Category) | 1,214 (73.0%) | 448 (27.0%) |
| Total (Overall) | 5,762 (47.5%) | 6,365 (52.5%) |
Employment Industries by Sex in Jacksonville
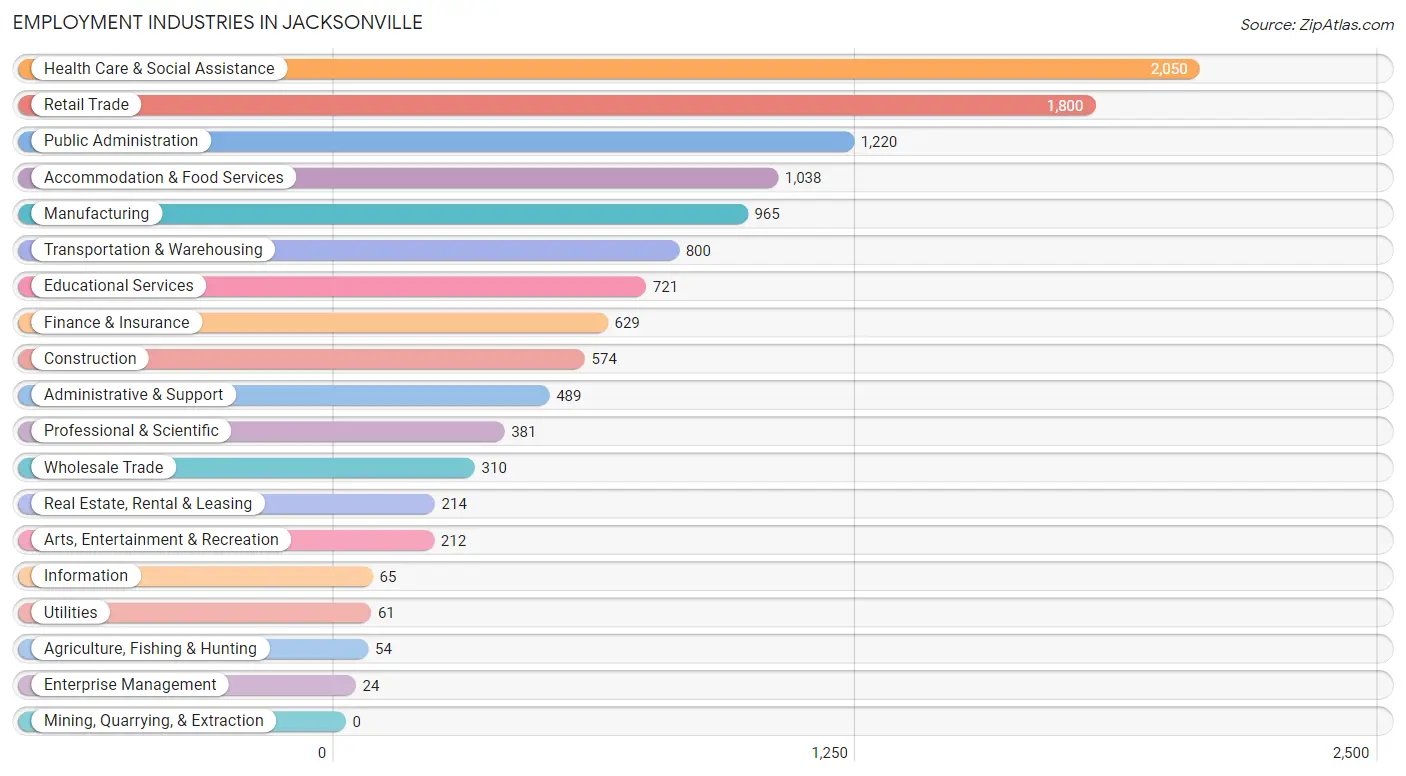
Employment Industries in Jacksonville
The major employment industries in Jacksonville include Health Care & Social Assistance (2,050 | 16.9%), Retail Trade (1,800 | 14.8%), Public Administration (1,220 | 10.1%), Accommodation & Food Services (1,038 | 8.6%), and Manufacturing (965 | 8.0%).
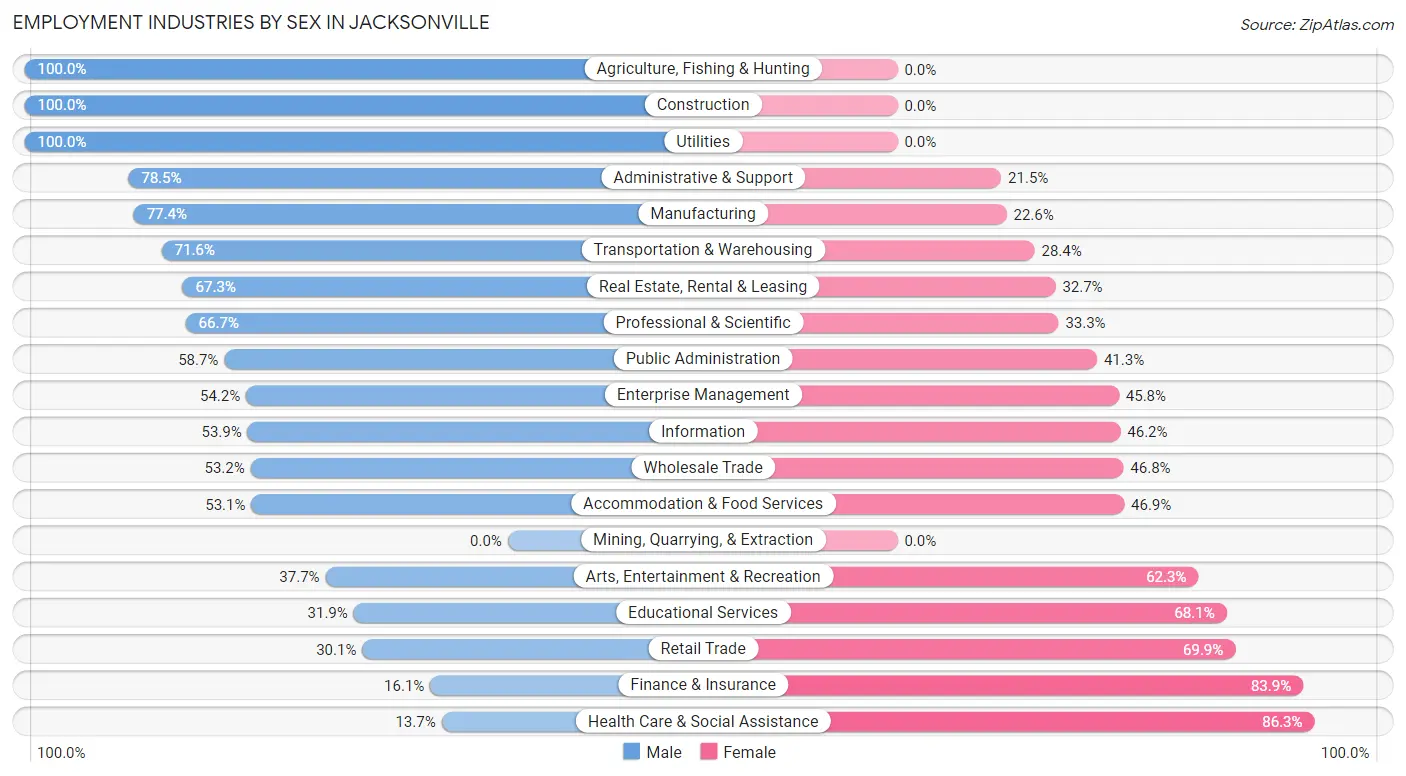
Employment Industries by Sex in Jacksonville
The Jacksonville industries that see more men than women are Agriculture, Fishing & Hunting (100.0%), Construction (100.0%), and Utilities (100.0%), whereas the industries that tend to have a higher number of women are Health Care & Social Assistance (86.3%), Finance & Insurance (83.9%), and Retail Trade (69.9%).
| Industry | Male | Female |
| Agriculture, Fishing & Hunting | 54 (100.0%) | 0 (0.0%) |
| Mining, Quarrying, & Extraction | 0 (0.0%) | 0 (0.0%) |
| Construction | 574 (100.0%) | 0 (0.0%) |
| Manufacturing | 747 (77.4%) | 218 (22.6%) |
| Wholesale Trade | 165 (53.2%) | 145 (46.8%) |
| Retail Trade | 542 (30.1%) | 1,258 (69.9%) |
| Transportation & Warehousing | 573 (71.6%) | 227 (28.4%) |
| Utilities | 61 (100.0%) | 0 (0.0%) |
| Information | 35 (53.8%) | 30 (46.2%) |
| Finance & Insurance | 101 (16.1%) | 528 (83.9%) |
| Real Estate, Rental & Leasing | 144 (67.3%) | 70 (32.7%) |
| Professional & Scientific | 254 (66.7%) | 127 (33.3%) |
| Enterprise Management | 13 (54.2%) | 11 (45.8%) |
| Administrative & Support | 384 (78.5%) | 105 (21.5%) |
| Educational Services | 230 (31.9%) | 491 (68.1%) |
| Health Care & Social Assistance | 281 (13.7%) | 1,769 (86.3%) |
| Arts, Entertainment & Recreation | 80 (37.7%) | 132 (62.3%) |
| Accommodation & Food Services | 551 (53.1%) | 487 (46.9%) |
| Public Administration | 716 (58.7%) | 504 (41.3%) |
| Total | 5,762 (47.5%) | 6,365 (52.5%) |
Education in Jacksonville
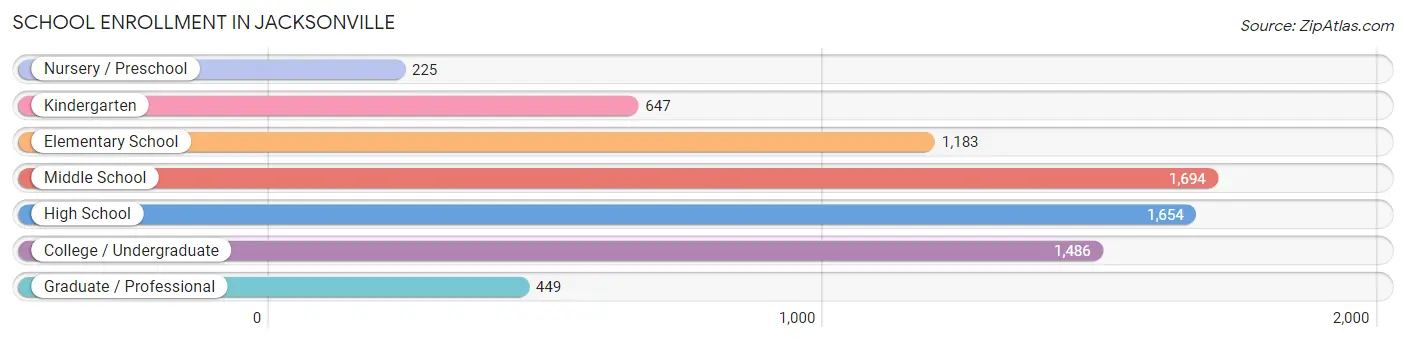
School Enrollment in Jacksonville
The most common levels of schooling among the 7,338 students in Jacksonville are middle school (1,694 | 23.1%), high school (1,654 | 22.5%), and college / undergraduate (1,486 | 20.3%).
| School Level | # Students | % Students |
| Nursery / Preschool | 225 | 3.1% |
| Kindergarten | 647 | 8.8% |
| Elementary School | 1,183 | 16.1% |
| Middle School | 1,694 | 23.1% |
| High School | 1,654 | 22.5% |
| College / Undergraduate | 1,486 | 20.3% |
| Graduate / Professional | 449 | 6.1% |
| Total | 7,338 | 100.0% |
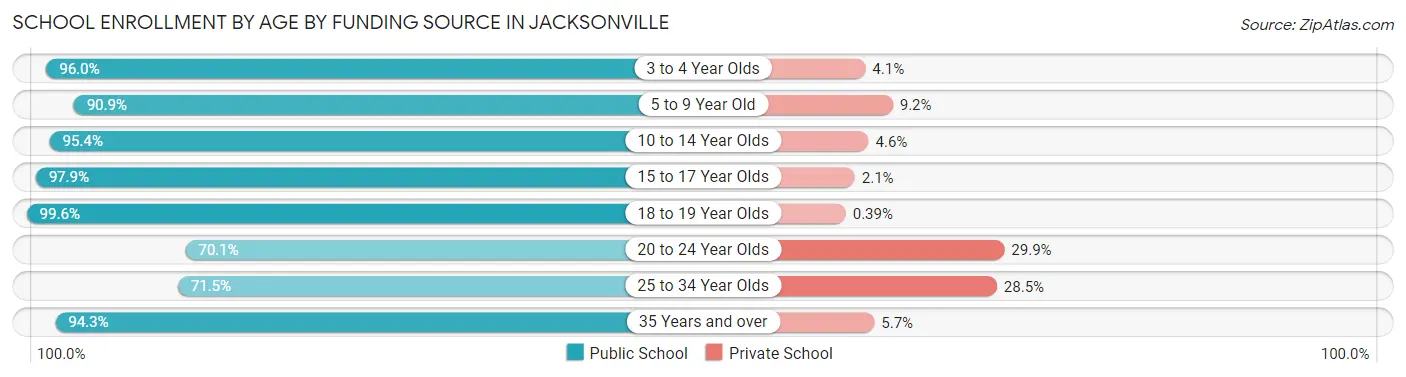
School Enrollment by Age by Funding Source in Jacksonville
Out of a total of 7,338 students who are enrolled in schools in Jacksonville, 624 (8.5%) attend a private institution, while the remaining 6,714 (91.5%) are enrolled in public schools. The age group of 20 to 24 year olds has the highest likelihood of being enrolled in private schools, with 162 (29.9% in the age bracket) enrolled. Conversely, the age group of 18 to 19 year olds has the lowest likelihood of being enrolled in a private school, with 509 (99.6% in the age bracket) attending a public institution.
| Age Bracket | Public School | Private School |
| 3 to 4 Year Olds | 308 (96.0%) | 13 (4.1%) |
| 5 to 9 Year Old | 1,479 (90.8%) | 149 (9.1%) |
| 10 to 14 Year Olds | 1,828 (95.4%) | 89 (4.6%) |
| 15 to 17 Year Olds | 1,222 (97.9%) | 26 (2.1%) |
| 18 to 19 Year Olds | 509 (99.6%) | 2 (0.4%) |
| 20 to 24 Year Olds | 379 (70.1%) | 162 (29.9%) |
| 25 to 34 Year Olds | 363 (71.5%) | 145 (28.5%) |
| 35 Years and over | 626 (94.3%) | 38 (5.7%) |
| Total | 6,714 (91.5%) | 624 (8.5%) |
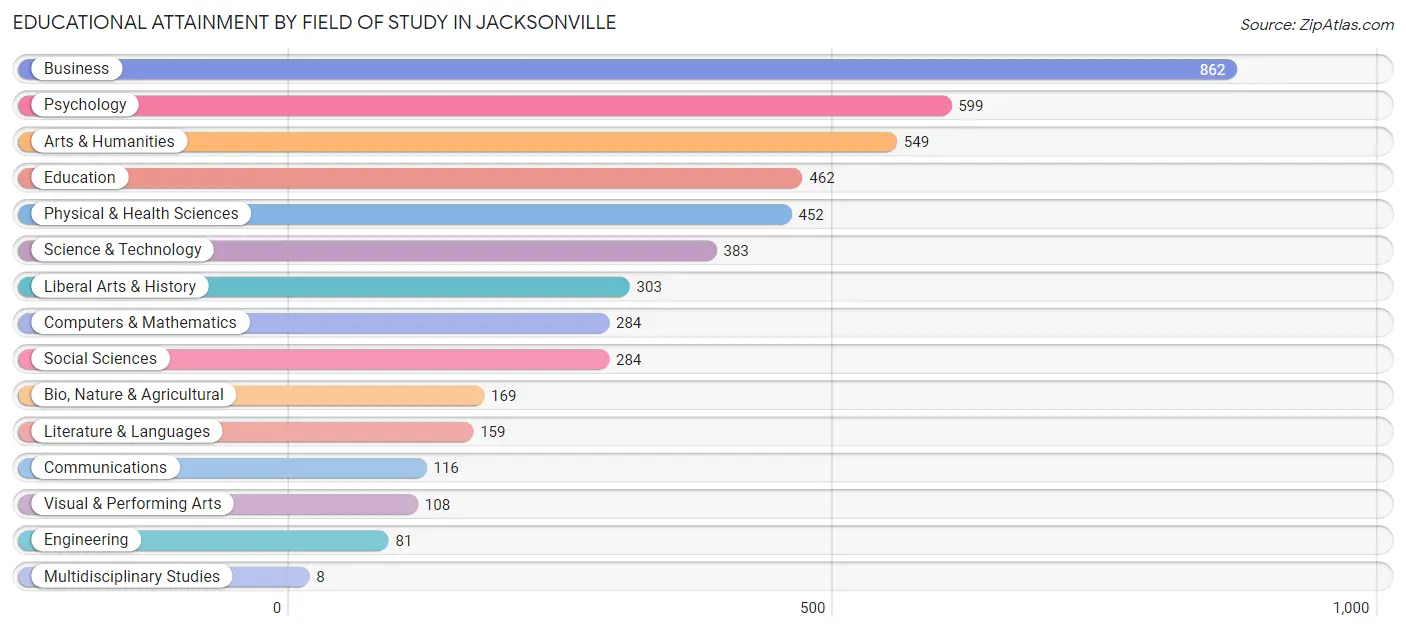
Educational Attainment by Field of Study in Jacksonville
Business (862 | 17.9%), psychology (599 | 12.4%), arts & humanities (549 | 11.4%), education (462 | 9.6%), and physical & health sciences (452 | 9.4%) are the most common fields of study among 4,819 individuals in Jacksonville who have obtained a bachelor's degree or higher.
| Field of Study | # Graduates | % Graduates |
| Computers & Mathematics | 284 | 5.9% |
| Bio, Nature & Agricultural | 169 | 3.5% |
| Physical & Health Sciences | 452 | 9.4% |
| Psychology | 599 | 12.4% |
| Social Sciences | 284 | 5.9% |
| Engineering | 81 | 1.7% |
| Multidisciplinary Studies | 8 | 0.2% |
| Science & Technology | 383 | 8.0% |
| Business | 862 | 17.9% |
| Education | 462 | 9.6% |
| Literature & Languages | 159 | 3.3% |
| Liberal Arts & History | 303 | 6.3% |
| Visual & Performing Arts | 108 | 2.2% |
| Communications | 116 | 2.4% |
| Arts & Humanities | 549 | 11.4% |
| Total | 4,819 | 100.0% |
Transportation & Commute in Jacksonville
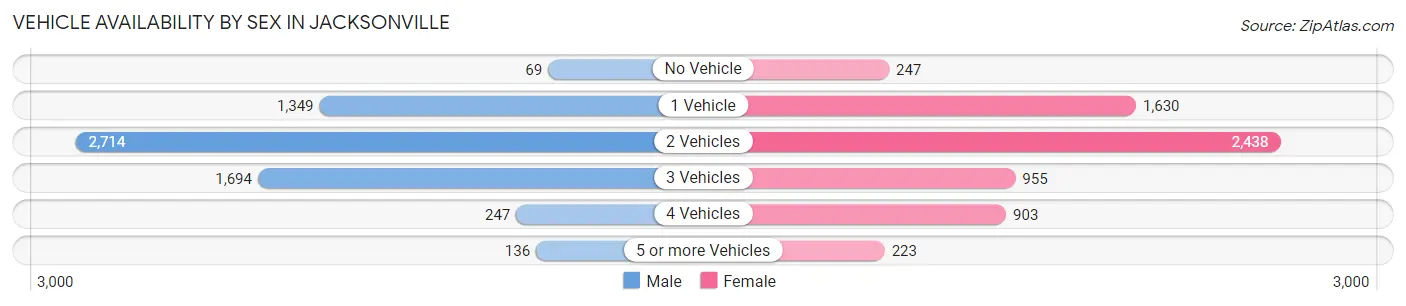
Vehicle Availability by Sex in Jacksonville
The most prevalent vehicle ownership categories in Jacksonville are males with 2 vehicles (2,714, accounting for 43.7%) and females with 2 vehicles (2,438, making up 42.4%).
| Vehicles Available | Male | Female |
| No Vehicle | 69 (1.1%) | 247 (3.9%) |
| 1 Vehicle | 1,349 (21.7%) | 1,630 (25.5%) |
| 2 Vehicles | 2,714 (43.7%) | 2,438 (38.1%) |
| 3 Vehicles | 1,694 (27.3%) | 955 (14.9%) |
| 4 Vehicles | 247 (4.0%) | 903 (14.1%) |
| 5 or more Vehicles | 136 (2.2%) | 223 (3.5%) |
| Total | 6,209 (100.0%) | 6,396 (100.0%) |
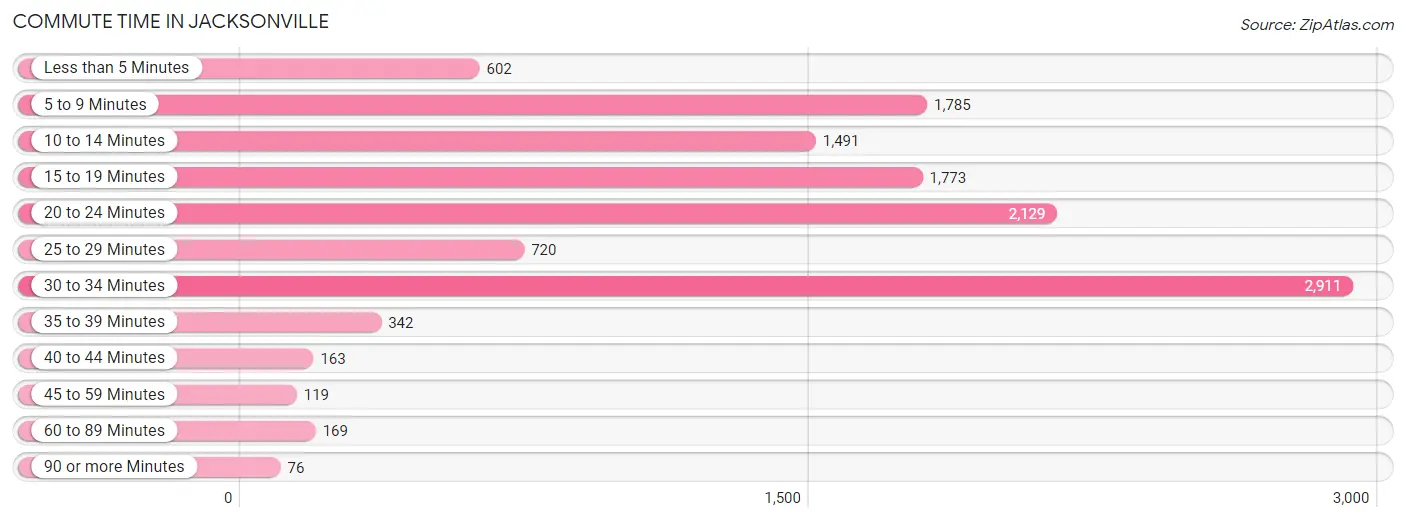
Commute Time in Jacksonville
The most frequently occuring commute durations in Jacksonville are 30 to 34 minutes (2,911 commuters, 23.7%), 20 to 24 minutes (2,129 commuters, 17.3%), and 5 to 9 minutes (1,785 commuters, 14.5%).
| Commute Time | # Commuters | % Commuters |
| Less than 5 Minutes | 602 | 4.9% |
| 5 to 9 Minutes | 1,785 | 14.5% |
| 10 to 14 Minutes | 1,491 | 12.1% |
| 15 to 19 Minutes | 1,773 | 14.4% |
| 20 to 24 Minutes | 2,129 | 17.3% |
| 25 to 29 Minutes | 720 | 5.9% |
| 30 to 34 Minutes | 2,911 | 23.7% |
| 35 to 39 Minutes | 342 | 2.8% |
| 40 to 44 Minutes | 163 | 1.3% |
| 45 to 59 Minutes | 119 | 1.0% |
| 60 to 89 Minutes | 169 | 1.4% |
| 90 or more Minutes | 76 | 0.6% |
Commute Time by Sex in Jacksonville
The most common commute times in Jacksonville are 30 to 34 minutes (1,582 commuters, 24.0%) for males and 30 to 34 minutes (1,329 commuters, 23.3%) for females.
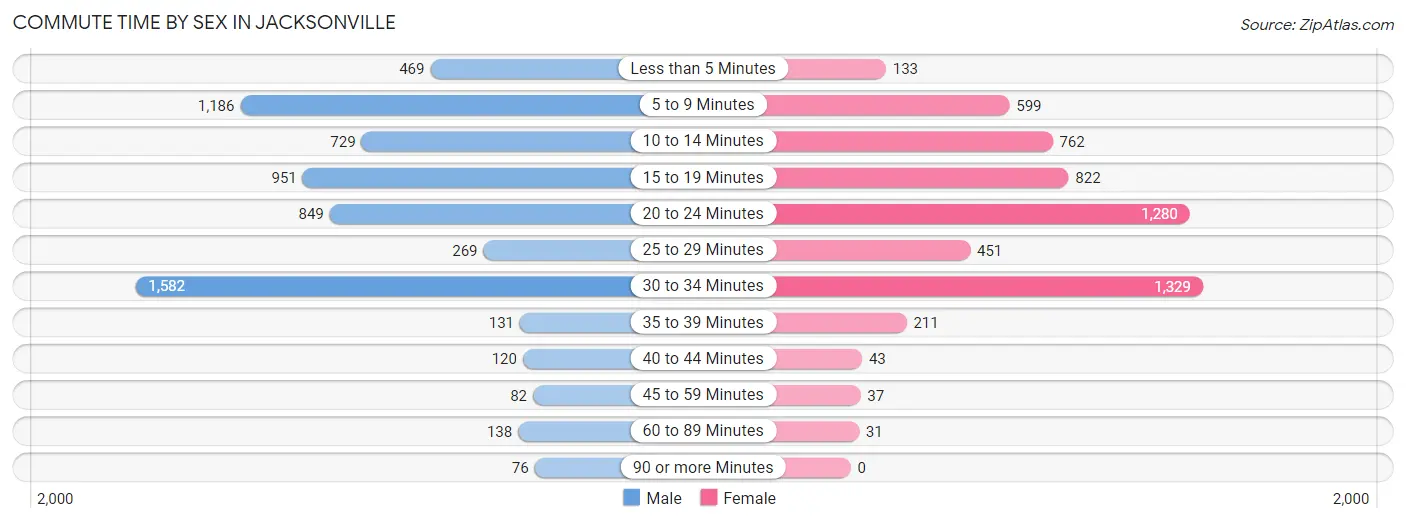
| Commute Time | Male | Female |
| Less than 5 Minutes | 469 (7.1%) | 133 (2.3%) |
| 5 to 9 Minutes | 1,186 (18.0%) | 599 (10.5%) |
| 10 to 14 Minutes | 729 (11.1%) | 762 (13.4%) |
| 15 to 19 Minutes | 951 (14.4%) | 822 (14.4%) |
| 20 to 24 Minutes | 849 (12.9%) | 1,280 (22.5%) |
| 25 to 29 Minutes | 269 (4.1%) | 451 (7.9%) |
| 30 to 34 Minutes | 1,582 (24.0%) | 1,329 (23.3%) |
| 35 to 39 Minutes | 131 (2.0%) | 211 (3.7%) |
| 40 to 44 Minutes | 120 (1.8%) | 43 (0.7%) |
| 45 to 59 Minutes | 82 (1.3%) | 37 (0.6%) |
| 60 to 89 Minutes | 138 (2.1%) | 31 (0.5%) |
| 90 or more Minutes | 76 (1.1%) | 0 (0.0%) |
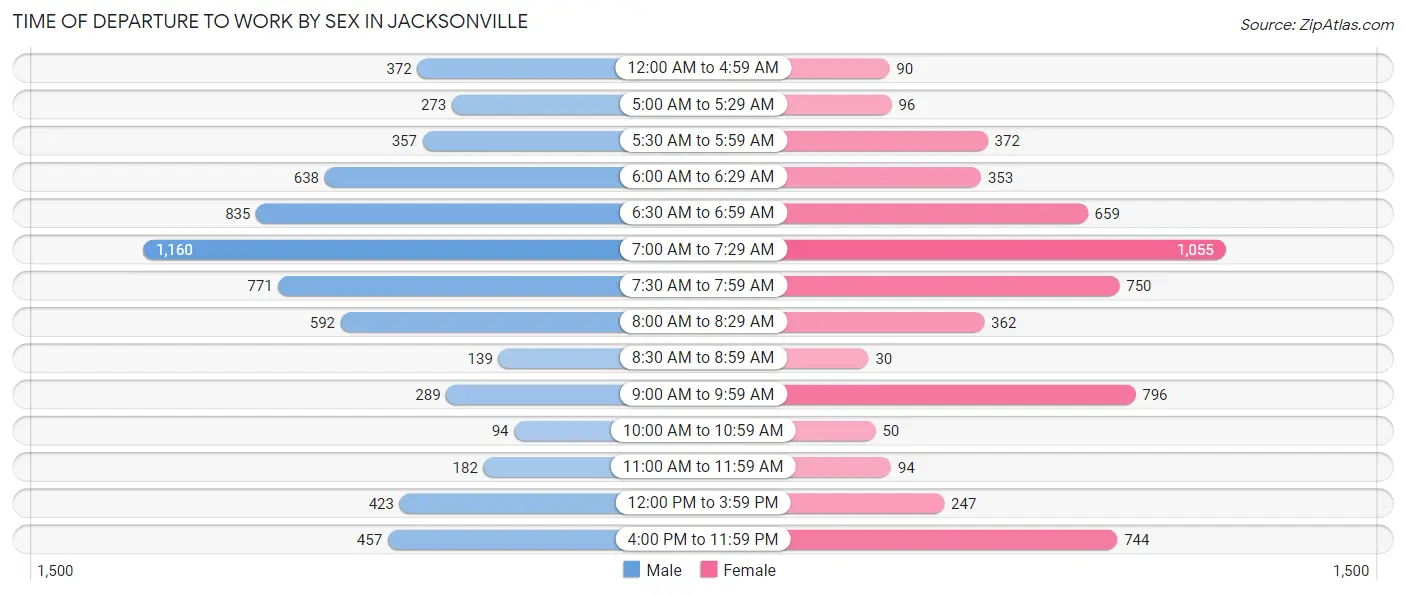
Time of Departure to Work by Sex in Jacksonville
The most frequent times of departure to work in Jacksonville are 7:00 AM to 7:29 AM (1,160, 17.6%) for males and 7:00 AM to 7:29 AM (1,055, 18.5%) for females.
| Time of Departure | Male | Female |
| 12:00 AM to 4:59 AM | 372 (5.7%) | 90 (1.6%) |
| 5:00 AM to 5:29 AM | 273 (4.2%) | 96 (1.7%) |
| 5:30 AM to 5:59 AM | 357 (5.4%) | 372 (6.5%) |
| 6:00 AM to 6:29 AM | 638 (9.7%) | 353 (6.2%) |
| 6:30 AM to 6:59 AM | 835 (12.7%) | 659 (11.6%) |
| 7:00 AM to 7:29 AM | 1,160 (17.6%) | 1,055 (18.5%) |
| 7:30 AM to 7:59 AM | 771 (11.7%) | 750 (13.2%) |
| 8:00 AM to 8:29 AM | 592 (9.0%) | 362 (6.4%) |
| 8:30 AM to 8:59 AM | 139 (2.1%) | 30 (0.5%) |
| 9:00 AM to 9:59 AM | 289 (4.4%) | 796 (14.0%) |
| 10:00 AM to 10:59 AM | 94 (1.4%) | 50 (0.9%) |
| 11:00 AM to 11:59 AM | 182 (2.8%) | 94 (1.7%) |
| 12:00 PM to 3:59 PM | 423 (6.4%) | 247 (4.3%) |
| 4:00 PM to 11:59 PM | 457 (6.9%) | 744 (13.1%) |
| Total | 6,582 (100.0%) | 5,698 (100.0%) |
Housing Occupancy in Jacksonville
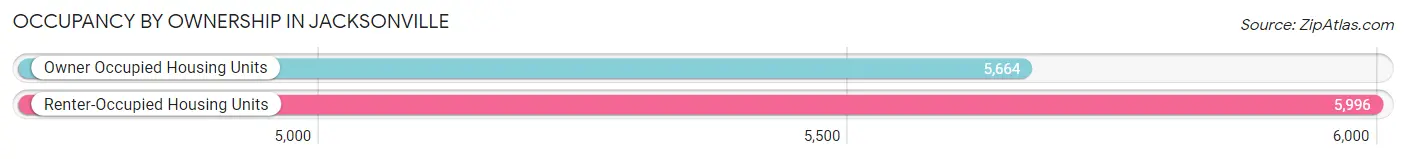
Occupancy by Ownership in Jacksonville
Of the total 11,660 dwellings in Jacksonville, owner-occupied units account for 5,664 (48.6%), while renter-occupied units make up 5,996 (51.4%).
| Occupancy | # Housing Units | % Housing Units |
| Owner Occupied Housing Units | 5,664 | 48.6% |
| Renter-Occupied Housing Units | 5,996 | 51.4% |
| Total Occupied Housing Units | 11,660 | 100.0% |
Occupancy by Household Size in Jacksonville
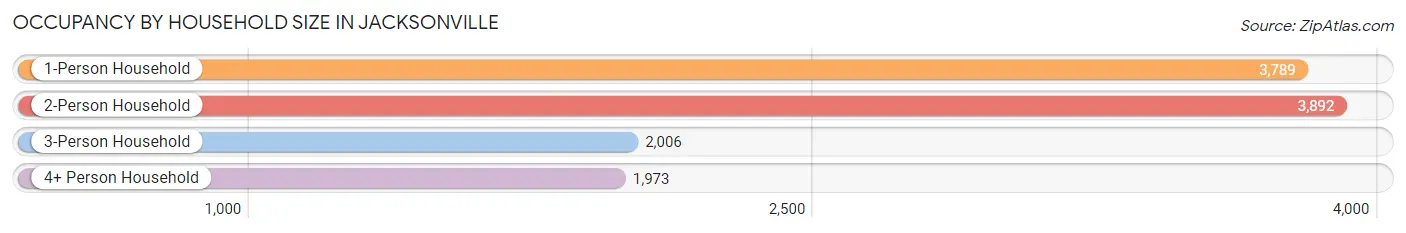
| Household Size | # Housing Units | % Housing Units |
| 1-Person Household | 3,789 | 32.5% |
| 2-Person Household | 3,892 | 33.4% |
| 3-Person Household | 2,006 | 17.2% |
| 4+ Person Household | 1,973 | 16.9% |
| Total Housing Units | 11,660 | 100.0% |
Occupancy by Ownership by Household Size in Jacksonville
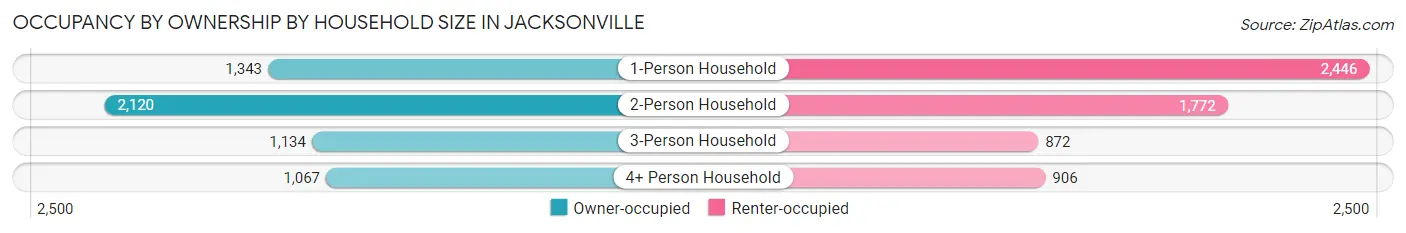
| Household Size | Owner-occupied | Renter-occupied |
| 1-Person Household | 1,343 (35.4%) | 2,446 (64.6%) |
| 2-Person Household | 2,120 (54.5%) | 1,772 (45.5%) |
| 3-Person Household | 1,134 (56.5%) | 872 (43.5%) |
| 4+ Person Household | 1,067 (54.1%) | 906 (45.9%) |
| Total Housing Units | 5,664 (48.6%) | 5,996 (51.4%) |
Occupancy by Educational Attainment in Jacksonville
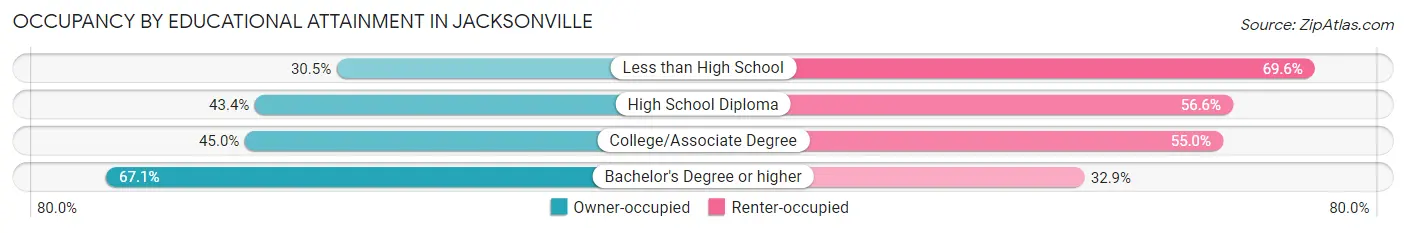
| Household Size | Owner-occupied | Renter-occupied |
| Less than High School | 271 (30.4%) | 619 (69.6%) |
| High School Diploma | 1,515 (43.4%) | 1,973 (56.6%) |
| College/Associate Degree | 2,054 (45.0%) | 2,508 (55.0%) |
| Bachelor's Degree or higher | 1,824 (67.1%) | 896 (32.9%) |
Occupancy by Age of Householder in Jacksonville
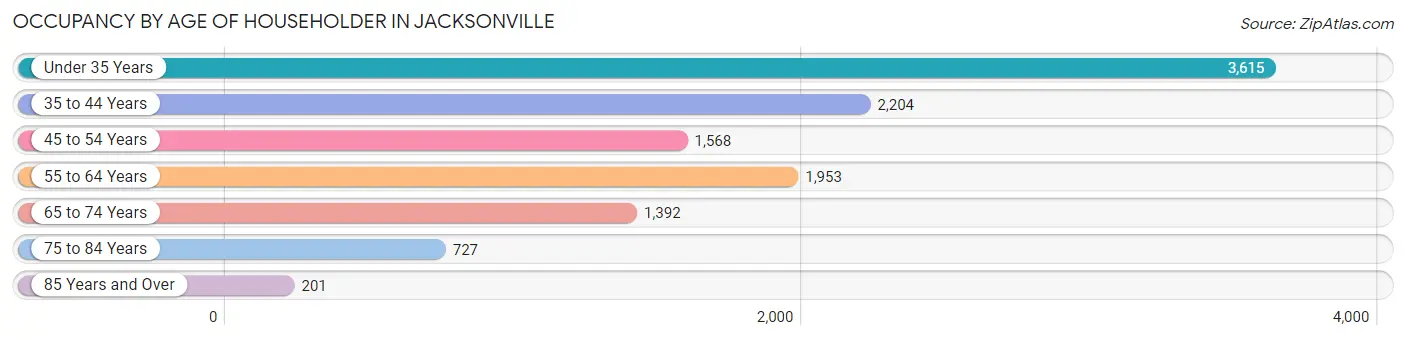
| Age Bracket | # Households | % Households |
| Under 35 Years | 3,615 | 31.0% |
| 35 to 44 Years | 2,204 | 18.9% |
| 45 to 54 Years | 1,568 | 13.5% |
| 55 to 64 Years | 1,953 | 16.8% |
| 65 to 74 Years | 1,392 | 11.9% |
| 75 to 84 Years | 727 | 6.2% |
| 85 Years and Over | 201 | 1.7% |
| Total | 11,660 | 100.0% |
Housing Finances in Jacksonville
Median Income by Occupancy in Jacksonville
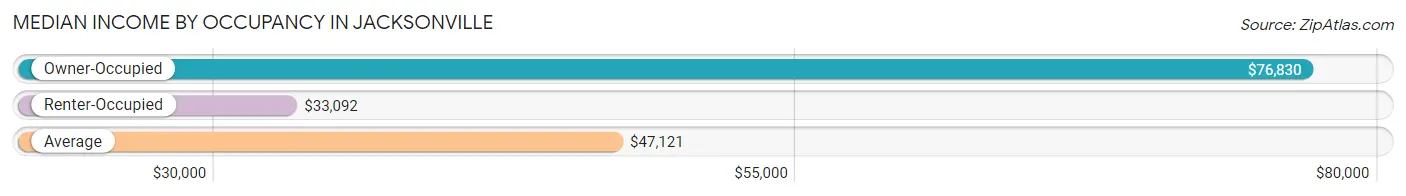
| Occupancy Type | # Households | Median Income |
| Owner-Occupied | 5,664 (48.6%) | $76,830 |
| Renter-Occupied | 5,996 (51.4%) | $33,092 |
| Average | 11,660 (100.0%) | $47,121 |
Occupancy by Householder Income Bracket in Jacksonville
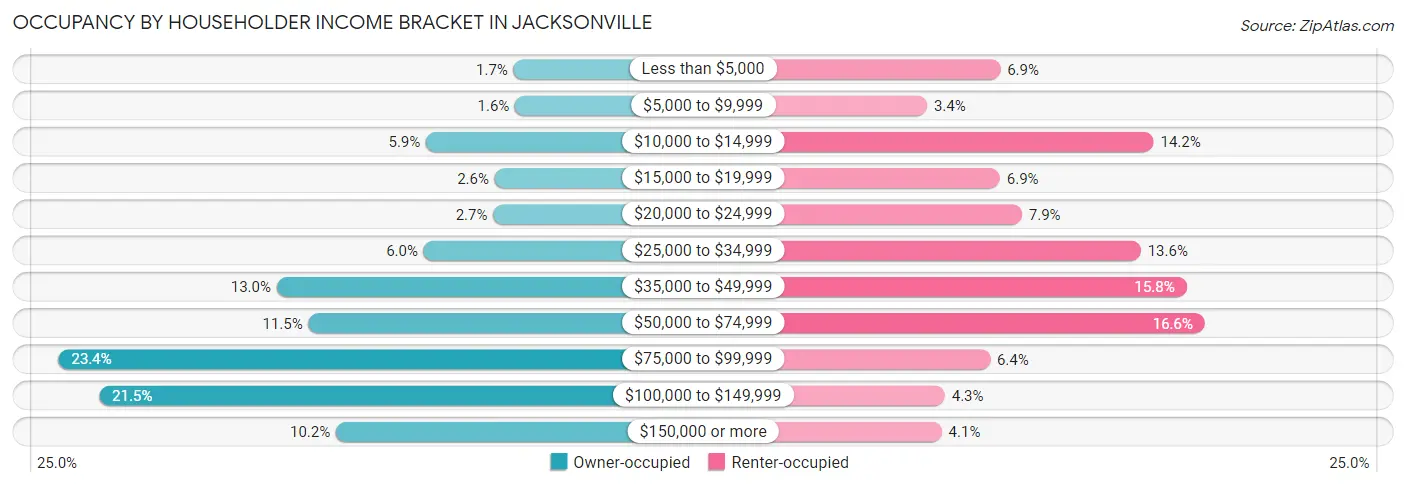
| Income Bracket | Owner-occupied | Renter-occupied |
| Less than $5,000 | 97 (1.7%) | 413 (6.9%) |
| $5,000 to $9,999 | 93 (1.6%) | 204 (3.4%) |
| $10,000 to $14,999 | 333 (5.9%) | 851 (14.2%) |
| $15,000 to $19,999 | 148 (2.6%) | 412 (6.9%) |
| $20,000 to $24,999 | 152 (2.7%) | 475 (7.9%) |
| $25,000 to $34,999 | 339 (6.0%) | 814 (13.6%) |
| $35,000 to $49,999 | 736 (13.0%) | 945 (15.8%) |
| $50,000 to $74,999 | 650 (11.5%) | 997 (16.6%) |
| $75,000 to $99,999 | 1,325 (23.4%) | 384 (6.4%) |
| $100,000 to $149,999 | 1,215 (21.4%) | 255 (4.3%) |
| $150,000 or more | 576 (10.2%) | 246 (4.1%) |
| Total | 5,664 (100.0%) | 5,996 (100.0%) |
Monthly Housing Cost Tiers in Jacksonville
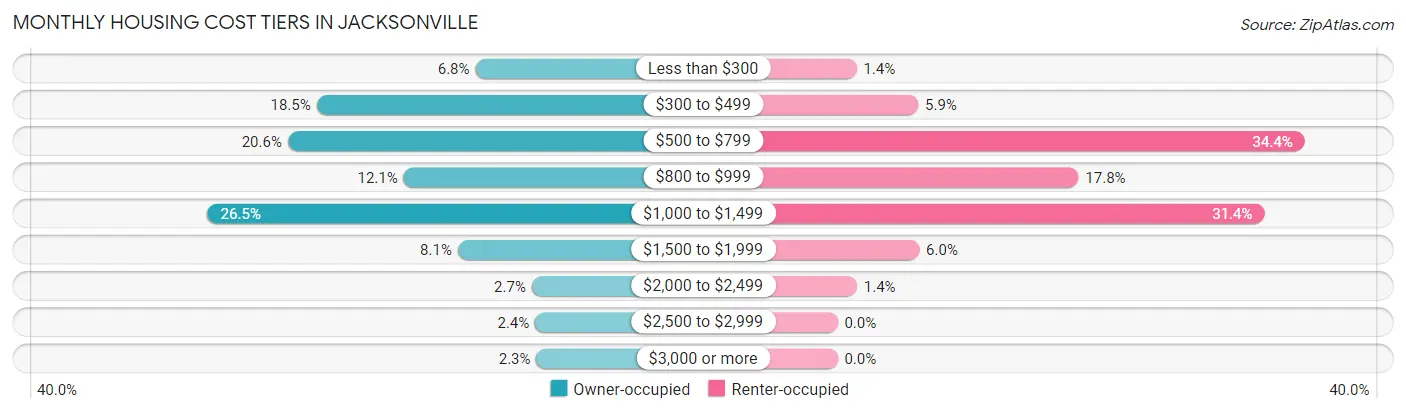
| Monthly Cost | Owner-occupied | Renter-occupied |
| Less than $300 | 385 (6.8%) | 84 (1.4%) |
| $300 to $499 | 1,048 (18.5%) | 356 (5.9%) |
| $500 to $799 | 1,168 (20.6%) | 2,063 (34.4%) |
| $800 to $999 | 685 (12.1%) | 1,064 (17.7%) |
| $1,000 to $1,499 | 1,502 (26.5%) | 1,885 (31.4%) |
| $1,500 to $1,999 | 459 (8.1%) | 361 (6.0%) |
| $2,000 to $2,499 | 150 (2.6%) | 86 (1.4%) |
| $2,500 to $2,999 | 136 (2.4%) | 0 (0.0%) |
| $3,000 or more | 131 (2.3%) | 0 (0.0%) |
| Total | 5,664 (100.0%) | 5,996 (100.0%) |
Physical Housing Characteristics in Jacksonville
Housing Structures in Jacksonville
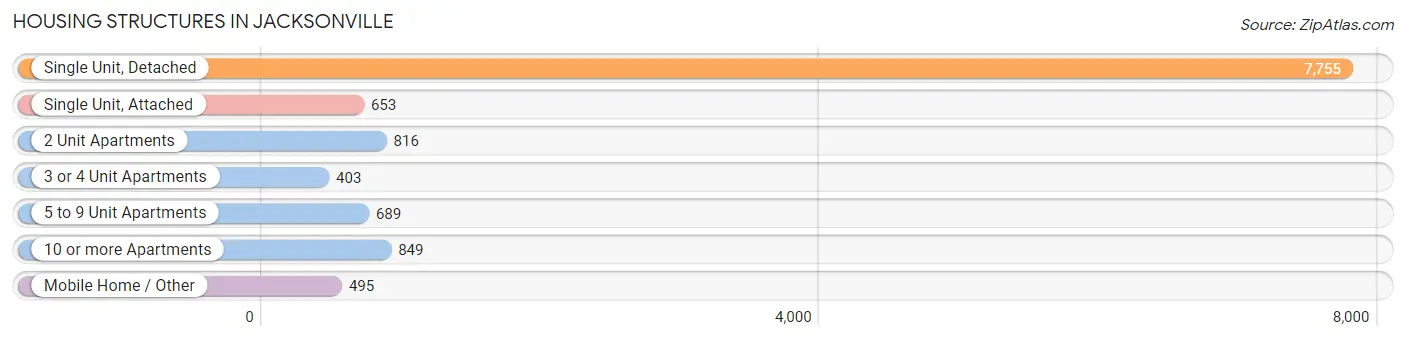
| Structure Type | # Housing Units | % Housing Units |
| Single Unit, Detached | 7,755 | 66.5% |
| Single Unit, Attached | 653 | 5.6% |
| 2 Unit Apartments | 816 | 7.0% |
| 3 or 4 Unit Apartments | 403 | 3.5% |
| 5 to 9 Unit Apartments | 689 | 5.9% |
| 10 or more Apartments | 849 | 7.3% |
| Mobile Home / Other | 495 | 4.3% |
| Total | 11,660 | 100.0% |
Housing Structures by Occupancy in Jacksonville
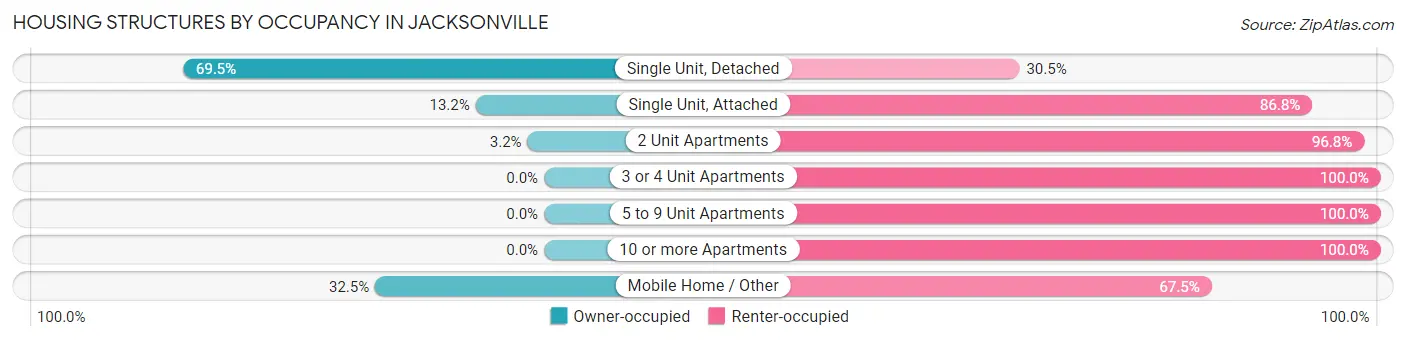
| Structure Type | Owner-occupied | Renter-occupied |
| Single Unit, Detached | 5,391 (69.5%) | 2,364 (30.5%) |
| Single Unit, Attached | 86 (13.2%) | 567 (86.8%) |
| 2 Unit Apartments | 26 (3.2%) | 790 (96.8%) |
| 3 or 4 Unit Apartments | 0 (0.0%) | 403 (100.0%) |
| 5 to 9 Unit Apartments | 0 (0.0%) | 689 (100.0%) |
| 10 or more Apartments | 0 (0.0%) | 849 (100.0%) |
| Mobile Home / Other | 161 (32.5%) | 334 (67.5%) |
| Total | 5,664 (48.6%) | 5,996 (51.4%) |
Housing Structures by Number of Rooms in Jacksonville
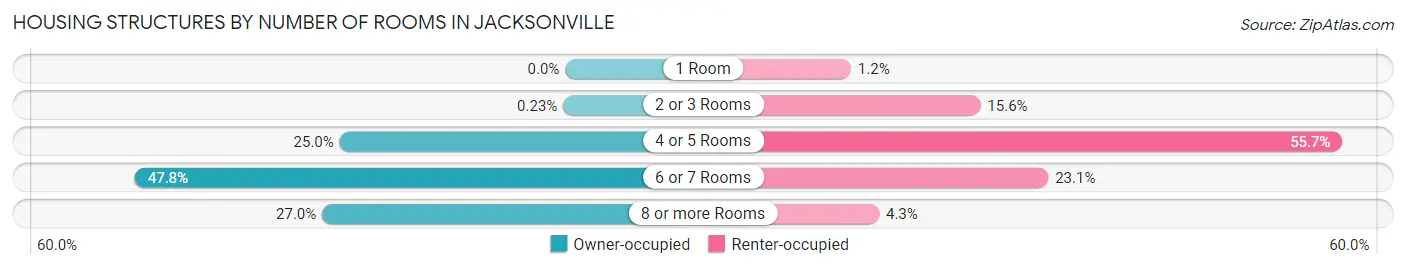
| Number of Rooms | Owner-occupied | Renter-occupied |
| 1 Room | 0 (0.0%) | 73 (1.2%) |
| 2 or 3 Rooms | 13 (0.2%) | 935 (15.6%) |
| 4 or 5 Rooms | 1,418 (25.0%) | 3,342 (55.7%) |
| 6 or 7 Rooms | 2,705 (47.8%) | 1,386 (23.1%) |
| 8 or more Rooms | 1,528 (27.0%) | 260 (4.3%) |
| Total | 5,664 (100.0%) | 5,996 (100.0%) |
Housing Structure by Heating Type in Jacksonville
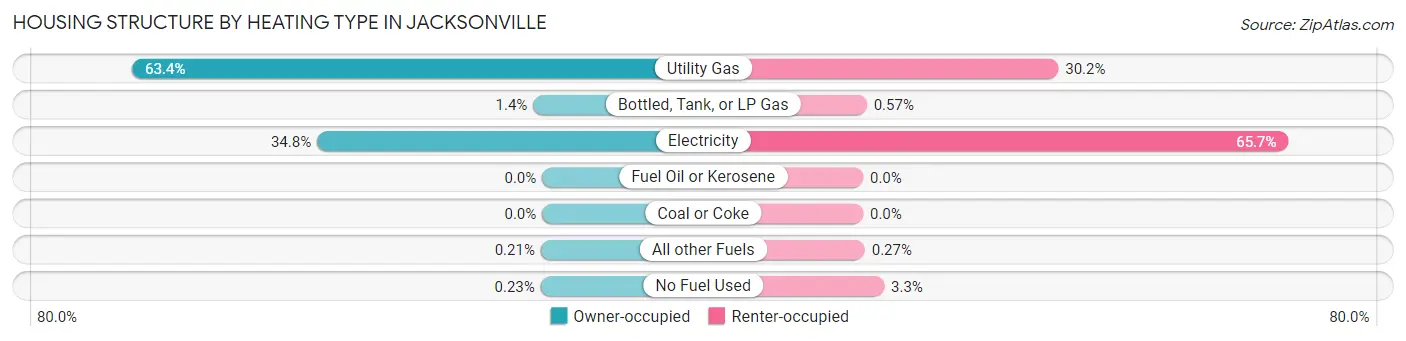
| Heating Type | Owner-occupied | Renter-occupied |
| Utility Gas | 3,590 (63.4%) | 1,810 (30.2%) |
| Bottled, Tank, or LP Gas | 78 (1.4%) | 34 (0.6%) |
| Electricity | 1,971 (34.8%) | 3,941 (65.7%) |
| Fuel Oil or Kerosene | 0 (0.0%) | 0 (0.0%) |
| Coal or Coke | 0 (0.0%) | 0 (0.0%) |
| All other Fuels | 12 (0.2%) | 16 (0.3%) |
| No Fuel Used | 13 (0.2%) | 195 (3.3%) |
| Total | 5,664 (100.0%) | 5,996 (100.0%) |
Household Vehicle Usage in Jacksonville
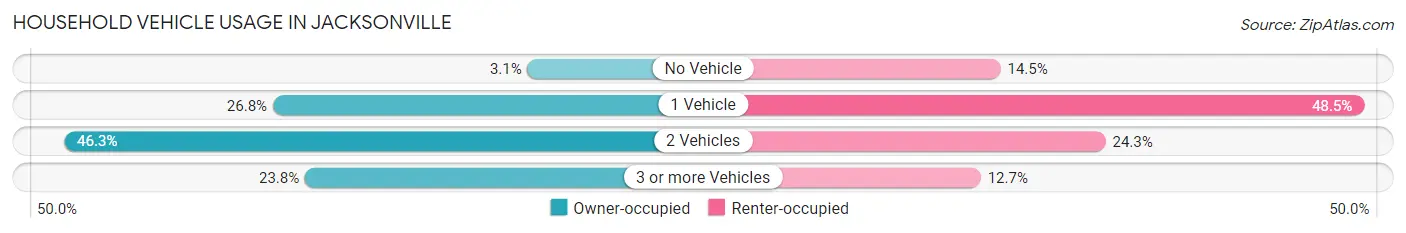
| Vehicles per Household | Owner-occupied | Renter-occupied |
| No Vehicle | 173 (3.0%) | 871 (14.5%) |
| 1 Vehicle | 1,519 (26.8%) | 2,906 (48.5%) |
| 2 Vehicles | 2,623 (46.3%) | 1,459 (24.3%) |
| 3 or more Vehicles | 1,349 (23.8%) | 760 (12.7%) |
| Total | 5,664 (100.0%) | 5,996 (100.0%) |
Real Estate & Mortgages in Jacksonville
Real Estate and Mortgage Overview in Jacksonville
| Characteristic | Without Mortgage | With Mortgage |
| Housing Units | 2,111 | 3,553 |
| Median Property Value | $121,500 | $156,800 |
| Median Household Income | $57,121 | $379 |
| Monthly Housing Costs | $422 | $131 |
| Real Estate Taxes | $751 | $266 |
Property Value by Mortgage Status in Jacksonville
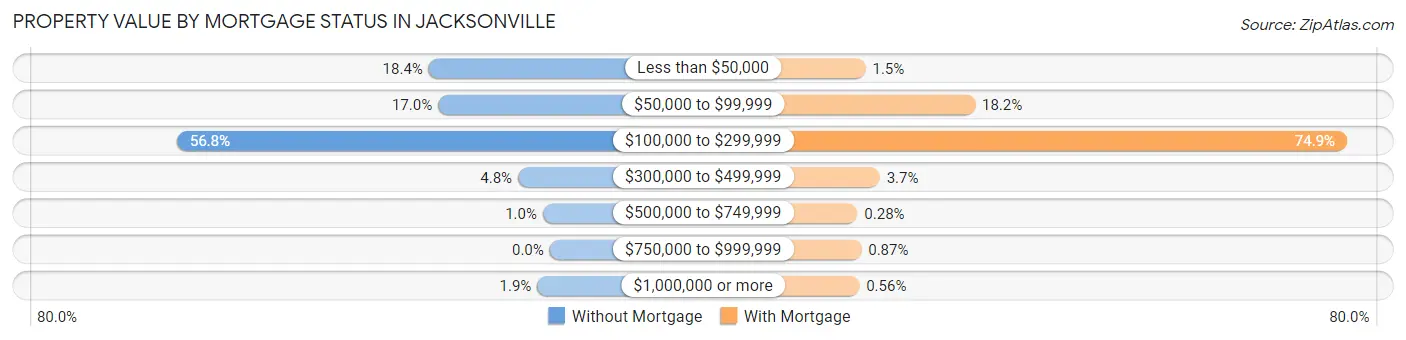
| Property Value | Without Mortgage | With Mortgage |
| Less than $50,000 | 389 (18.4%) | 54 (1.5%) |
| $50,000 to $99,999 | 359 (17.0%) | 647 (18.2%) |
| $100,000 to $299,999 | 1,199 (56.8%) | 2,660 (74.9%) |
| $300,000 to $499,999 | 102 (4.8%) | 131 (3.7%) |
| $500,000 to $749,999 | 22 (1.0%) | 10 (0.3%) |
| $750,000 to $999,999 | 0 (0.0%) | 31 (0.9%) |
| $1,000,000 or more | 40 (1.9%) | 20 (0.6%) |
| Total | 2,111 (100.0%) | 3,553 (100.0%) |
Household Income by Mortgage Status in Jacksonville
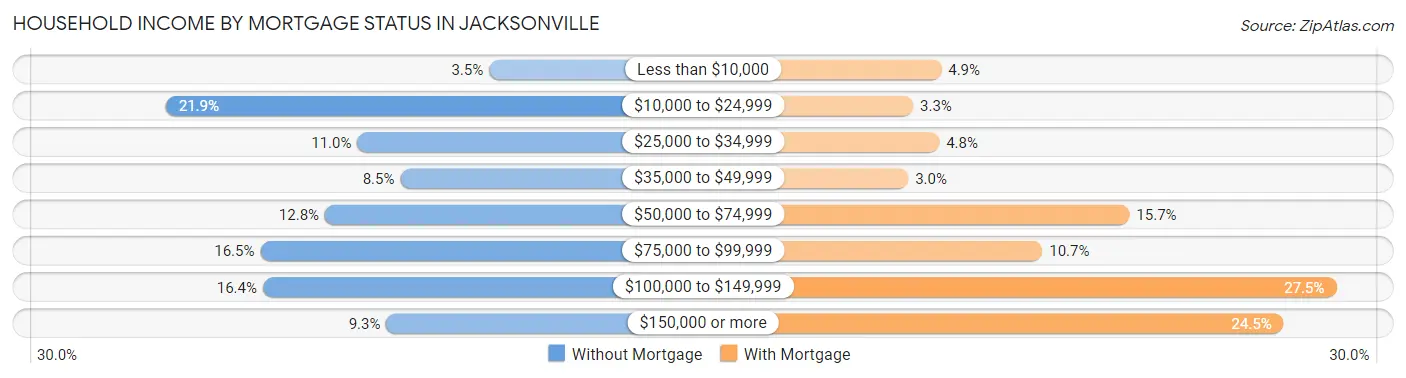
| Household Income | Without Mortgage | With Mortgage |
| Less than $10,000 | 73 (3.5%) | 174 (4.9%) |
| $10,000 to $24,999 | 463 (21.9%) | 117 (3.3%) |
| $25,000 to $34,999 | 232 (11.0%) | 170 (4.8%) |
| $35,000 to $49,999 | 180 (8.5%) | 107 (3.0%) |
| $50,000 to $74,999 | 271 (12.8%) | 556 (15.7%) |
| $75,000 to $99,999 | 349 (16.5%) | 379 (10.7%) |
| $100,000 to $149,999 | 346 (16.4%) | 976 (27.5%) |
| $150,000 or more | 197 (9.3%) | 869 (24.5%) |
| Total | 2,111 (100.0%) | 3,553 (100.0%) |
Property Value to Household Income Ratio in Jacksonville
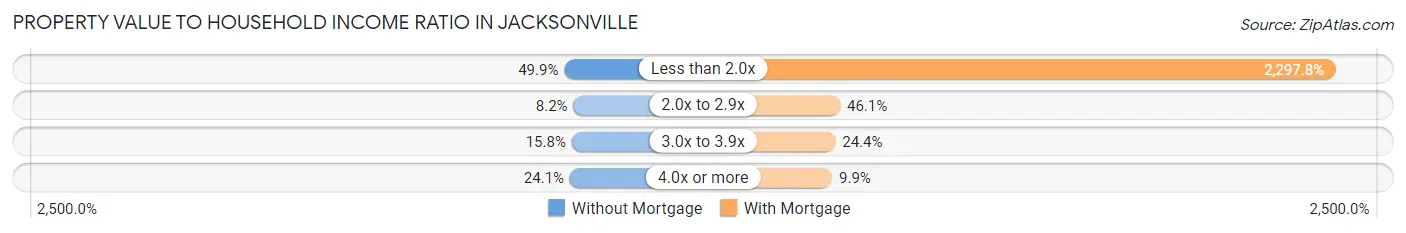
| Value-to-Income Ratio | Without Mortgage | With Mortgage |
| Less than 2.0x | 1,054 (49.9%) | 81,639 (2,297.7%) |
| 2.0x to 2.9x | 172 (8.2%) | 1,638 (46.1%) |
| 3.0x to 3.9x | 334 (15.8%) | 867 (24.4%) |
| 4.0x or more | 508 (24.1%) | 353 (9.9%) |
| Total | 2,111 (100.0%) | 3,553 (100.0%) |
Real Estate Taxes by Mortgage Status in Jacksonville
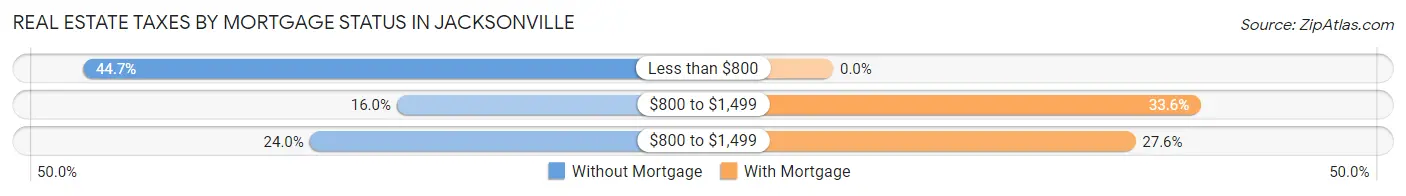
| Property Taxes | Without Mortgage | With Mortgage |
| Less than $800 | 943 (44.7%) | 0 (0.0%) |
| $800 to $1,499 | 338 (16.0%) | 1,194 (33.6%) |
| $800 to $1,499 | 506 (24.0%) | 981 (27.6%) |
| Total | 2,111 (100.0%) | 3,553 (100.0%) |
Health & Disability in Jacksonville
Health Insurance Coverage by Age in Jacksonville
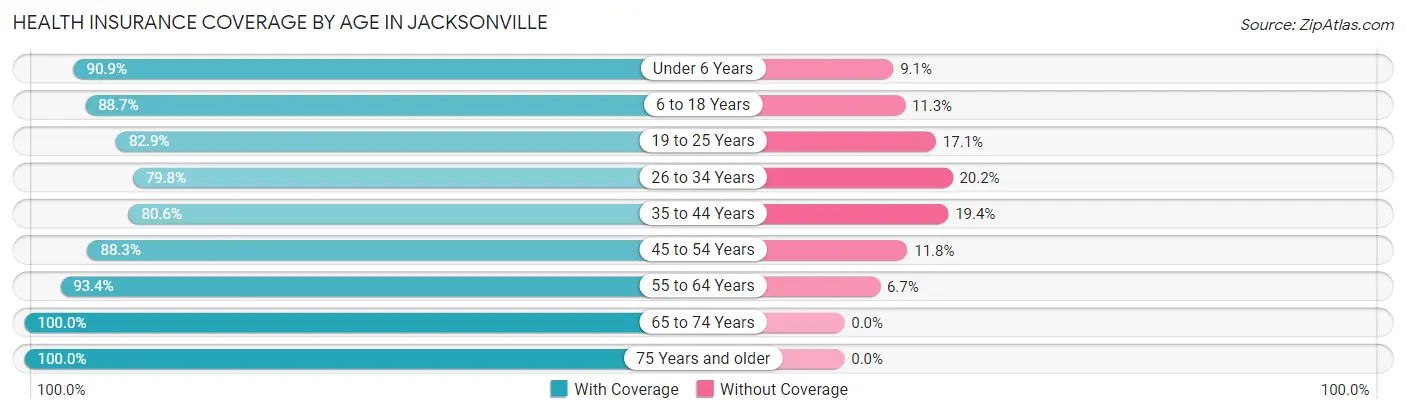
| Age Bracket | With Coverage | Without Coverage |
| Under 6 Years | 2,179 (90.9%) | 219 (9.1%) |
| 6 to 18 Years | 4,470 (88.7%) | 570 (11.3%) |
| 19 to 25 Years | 2,365 (82.9%) | 487 (17.1%) |
| 26 to 34 Years | 3,356 (79.8%) | 848 (20.2%) |
| 35 to 44 Years | 2,975 (80.6%) | 715 (19.4%) |
| 45 to 54 Years | 2,194 (88.2%) | 292 (11.7%) |
| 55 to 64 Years | 3,369 (93.3%) | 240 (6.7%) |
| 65 to 74 Years | 2,013 (100.0%) | 0 (0.0%) |
| 75 Years and older | 1,451 (100.0%) | 0 (0.0%) |
| Total | 24,372 (87.8%) | 3,371 (12.1%) |
Health Insurance Coverage by Citizenship Status in Jacksonville
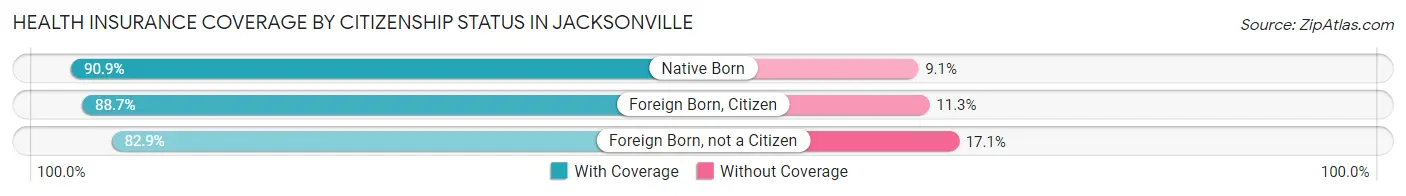
| Citizenship Status | With Coverage | Without Coverage |
| Native Born | 2,179 (90.9%) | 219 (9.1%) |
| Foreign Born, Citizen | 4,470 (88.7%) | 570 (11.3%) |
| Foreign Born, not a Citizen | 2,365 (82.9%) | 487 (17.1%) |
Health Insurance Coverage by Household Income in Jacksonville
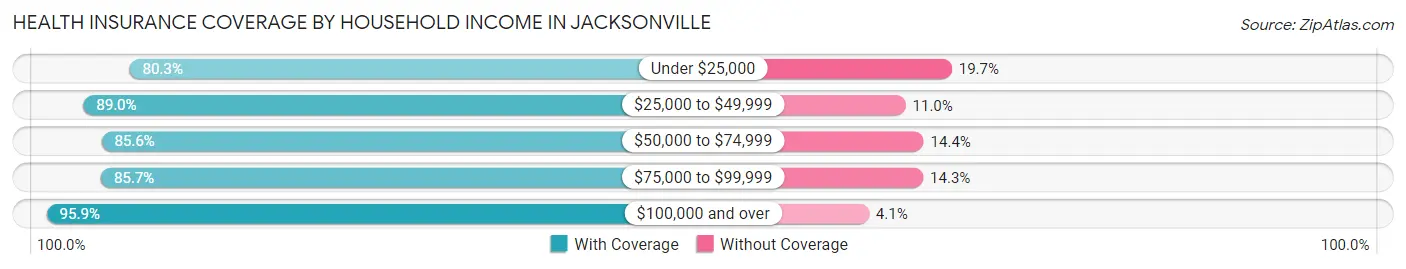
| Household Income | With Coverage | Without Coverage |
| Under $25,000 | 4,542 (80.3%) | 1,112 (19.7%) |
| $25,000 to $49,999 | 4,960 (89.0%) | 614 (11.0%) |
| $50,000 to $74,999 | 3,840 (85.6%) | 646 (14.4%) |
| $75,000 to $99,999 | 4,226 (85.7%) | 706 (14.3%) |
| $100,000 and over | 6,713 (95.9%) | 290 (4.1%) |
Public vs Private Health Insurance Coverage by Age in Jacksonville
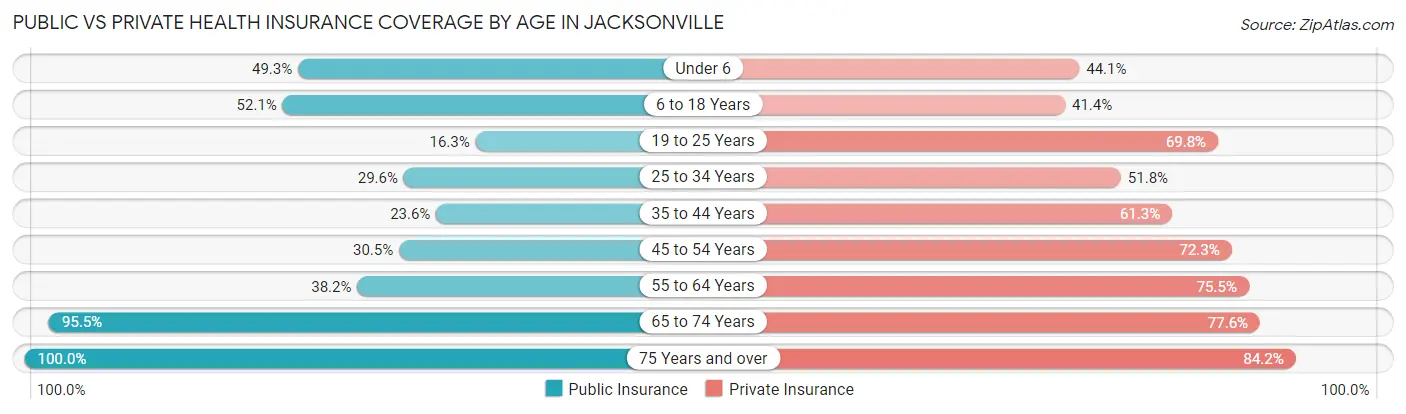
| Age Bracket | Public Insurance | Private Insurance |
| Under 6 | 1,181 (49.2%) | 1,057 (44.1%) |
| 6 to 18 Years | 2,626 (52.1%) | 2,088 (41.4%) |
| 19 to 25 Years | 465 (16.3%) | 1,991 (69.8%) |
| 25 to 34 Years | 1,245 (29.6%) | 2,178 (51.8%) |
| 35 to 44 Years | 871 (23.6%) | 2,262 (61.3%) |
| 45 to 54 Years | 758 (30.5%) | 1,798 (72.3%) |
| 55 to 64 Years | 1,380 (38.2%) | 2,726 (75.5%) |
| 65 to 74 Years | 1,922 (95.5%) | 1,562 (77.6%) |
| 75 Years and over | 1,451 (100.0%) | 1,222 (84.2%) |
| Total | 11,899 (42.9%) | 16,884 (60.9%) |
Disability Status by Sex by Age in Jacksonville
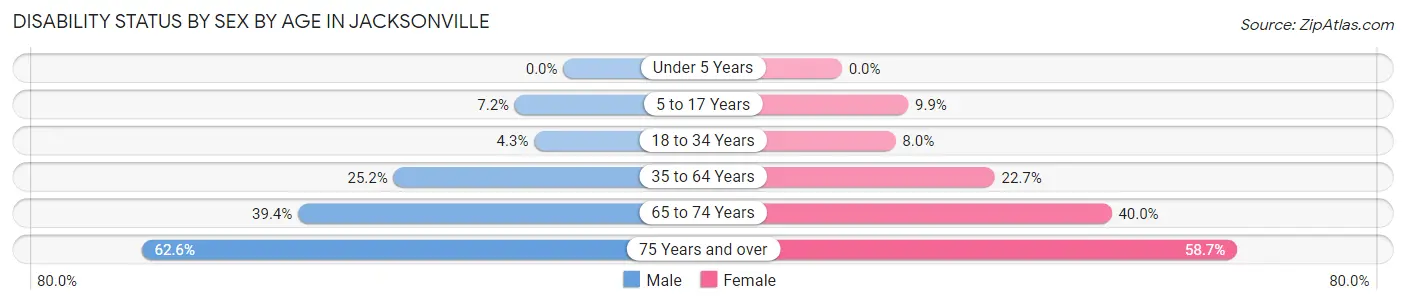
| Age Bracket | Male | Female |
| Under 5 Years | 0 (0.0%) | 0 (0.0%) |
| 5 to 17 Years | 183 (7.2%) | 263 (9.9%) |
| 18 to 34 Years | 132 (4.3%) | 350 (8.0%) |
| 35 to 64 Years | 1,186 (25.2%) | 1,153 (22.7%) |
| 65 to 74 Years | 364 (39.4%) | 436 (40.0%) |
| 75 Years and over | 340 (62.6%) | 533 (58.7%) |
Disability Class by Sex by Age in Jacksonville
Disability Class: Hearing Difficulty
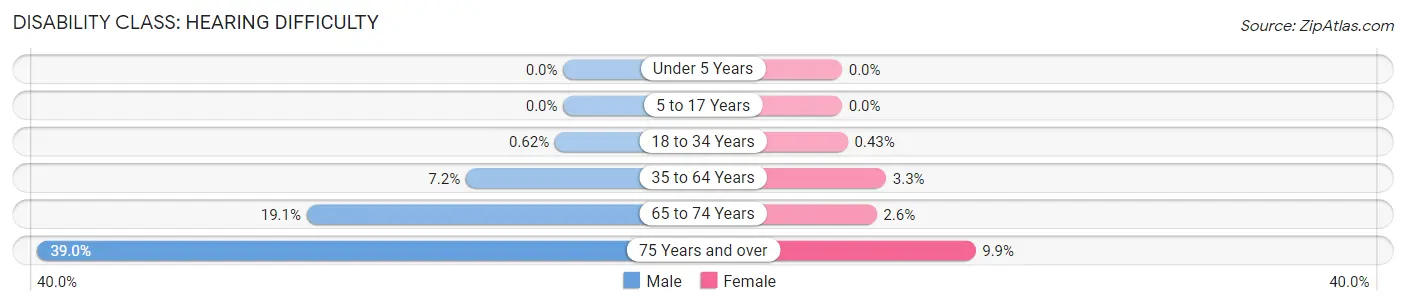
| Age Bracket | Male | Female |
| Under 5 Years | 0 (0.0%) | 0 (0.0%) |
| 5 to 17 Years | 0 (0.0%) | 0 (0.0%) |
| 18 to 34 Years | 19 (0.6%) | 19 (0.4%) |
| 35 to 64 Years | 340 (7.2%) | 166 (3.3%) |
| 65 to 74 Years | 176 (19.1%) | 28 (2.6%) |
| 75 Years and over | 212 (39.0%) | 90 (9.9%) |
Disability Class: Vision Difficulty
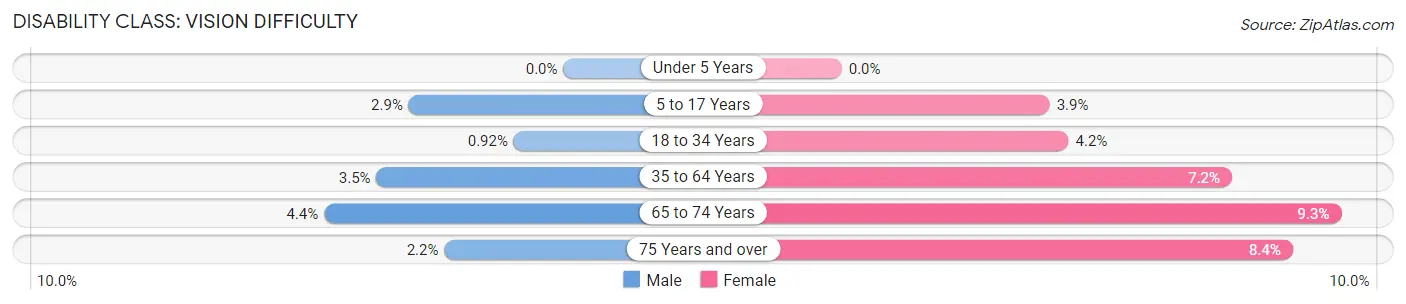
| Age Bracket | Male | Female |
| Under 5 Years | 0 (0.0%) | 0 (0.0%) |
| 5 to 17 Years | 73 (2.9%) | 103 (3.9%) |
| 18 to 34 Years | 28 (0.9%) | 185 (4.2%) |
| 35 to 64 Years | 163 (3.5%) | 368 (7.2%) |
| 65 to 74 Years | 41 (4.4%) | 101 (9.3%) |
| 75 Years and over | 12 (2.2%) | 76 (8.4%) |
Disability Class: Cognitive Difficulty
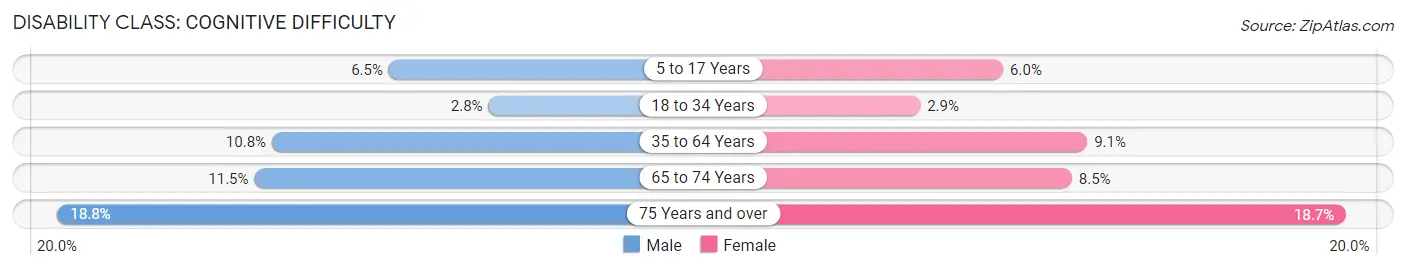
| Age Bracket | Male | Female |
| 5 to 17 Years | 165 (6.5%) | 160 (6.0%) |
| 18 to 34 Years | 85 (2.8%) | 128 (2.9%) |
| 35 to 64 Years | 509 (10.8%) | 463 (9.1%) |
| 65 to 74 Years | 106 (11.5%) | 93 (8.5%) |
| 75 Years and over | 102 (18.8%) | 170 (18.7%) |
Disability Class: Ambulatory Difficulty
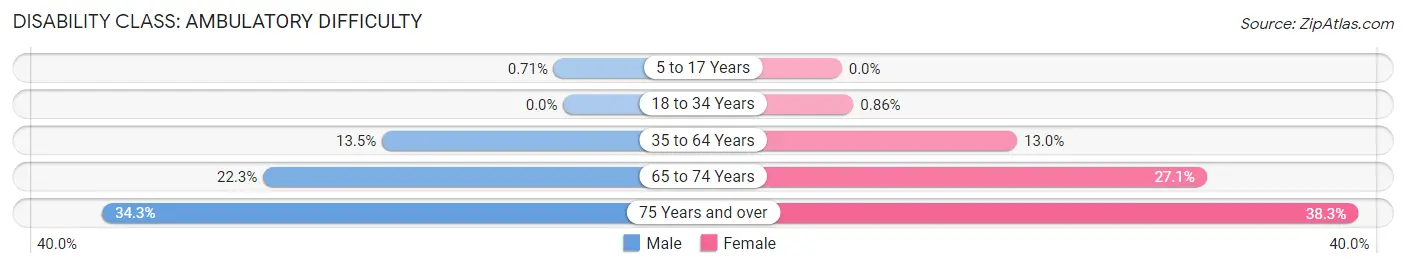
| Age Bracket | Male | Female |
| 5 to 17 Years | 18 (0.7%) | 0 (0.0%) |
| 18 to 34 Years | 0 (0.0%) | 38 (0.9%) |
| 35 to 64 Years | 633 (13.5%) | 661 (13.0%) |
| 65 to 74 Years | 206 (22.3%) | 295 (27.1%) |
| 75 Years and over | 186 (34.3%) | 348 (38.3%) |
Disability Class: Self-Care Difficulty
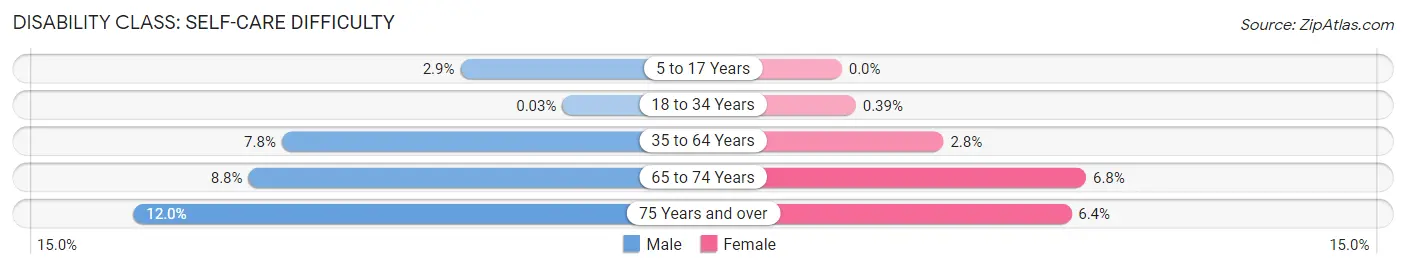
| Age Bracket | Male | Female |
| 5 to 17 Years | 73 (2.9%) | 0 (0.0%) |
| 18 to 34 Years | 1 (0.0%) | 17 (0.4%) |
| 35 to 64 Years | 369 (7.8%) | 144 (2.8%) |
| 65 to 74 Years | 81 (8.8%) | 74 (6.8%) |
| 75 Years and over | 65 (12.0%) | 58 (6.4%) |
Technology Access in Jacksonville
Computing Device Access in Jacksonville
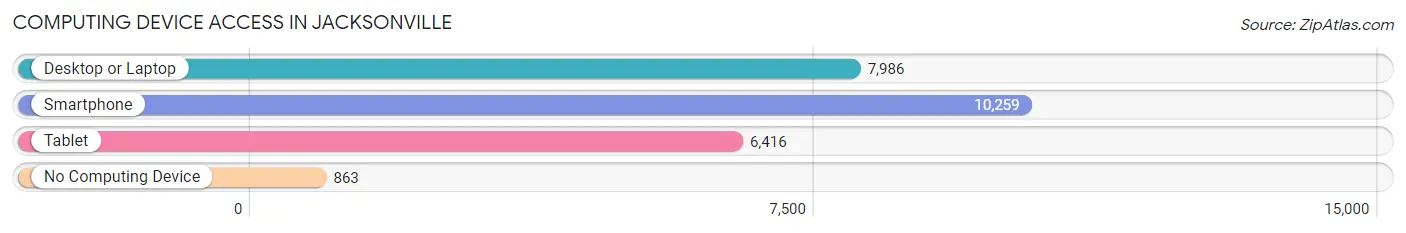
| Device Type | # Households | % Households |
| Desktop or Laptop | 7,986 | 68.5% |
| Smartphone | 10,259 | 88.0% |
| Tablet | 6,416 | 55.0% |
| No Computing Device | 863 | 7.4% |
| Total | 11,660 | 100.0% |
Internet Access in Jacksonville
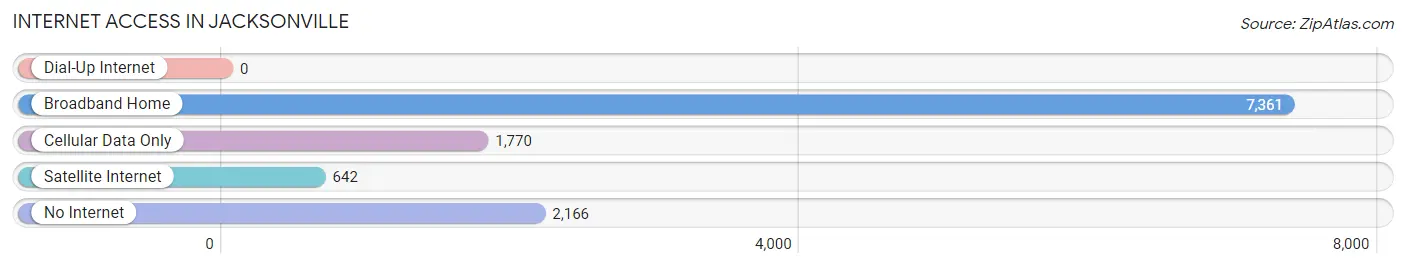
| Internet Type | # Households | % Households |
| Dial-Up Internet | 0 | 0.0% |
| Broadband Home | 7,361 | 63.1% |
| Cellular Data Only | 1,770 | 15.2% |
| Satellite Internet | 642 | 5.5% |
| No Internet | 2,166 | 18.6% |
| Total | 11,660 | 100.0% |
Jacksonville Summary
Jacksonville, Arkansas is a city located in Pulaski County, Arkansas. It is a suburb of Little Rock, the state capital, and is located approximately 10 miles northeast of the city. The population of Jacksonville was 28,364 at the 2010 census, making it the 11th largest city in Arkansas.
History
The area that is now Jacksonville was first settled in the early 1800s by settlers from the nearby town of Little Rock. The town was originally known as "Little Rock Station" and was a stop on the Little Rock-Memphis Railroad. In 1879, the town was renamed Jacksonville after the president of the railroad, Jackson Smith.
In the late 19th century, Jacksonville was a thriving agricultural community, with cotton, corn, and other crops being grown in the area. The town also had a number of businesses, including a cotton gin, a grist mill, and a sawmill.
In the early 20th century, Jacksonville began to experience rapid growth due to the construction of Camp Robinson, a military base located just outside of town. The base was home to the Arkansas National Guard and was used as a training facility for World War I and World War II. The base also provided jobs for many of the town's residents.
Geography
Jacksonville is located in Pulaski County, Arkansas, approximately 10 miles northeast of Little Rock. The city has a total area of 16.3 square miles, of which 16.2 square miles is land and 0.1 square miles is water. The city is located in the Arkansas River Valley and is surrounded by rolling hills and forests.
Economy
Jacksonville is home to a number of businesses and industries, including manufacturing, retail, and healthcare. The city is also home to a number of military installations, including Camp Robinson and Little Rock Air Force Base.
The city's largest employer is the Little Rock Air Force Base, which employs over 10,000 people. Other major employers in the city include the University of Arkansas for Medical Sciences, the Arkansas Department of Human Services, and the Arkansas Department of Corrections.
Demographics
As of the 2010 census, the population of Jacksonville was 28,364. The racial makeup of the city was 68.3% White, 25.2% African American, 0.5% Native American, 1.7% Asian, 0.1% Pacific Islander, 1.7% from other races, and 2.5% from two or more races. Hispanic or Latino of any race were 4.3% of the population.
The median income for a household in the city was $41,945, and the median income for a family was $50,945. The per capita income for the city was $20,945. About 11.3% of families and 14.2% of the population were below the poverty line, including 19.2% of those under age 18 and 8.2% of those age 65 or over.
Common Questions
What is Per Capita Income in Jacksonville?
Per Capita income in Jacksonville is $28,440.
What is the Median Family Income in Jacksonville?
Median Family Income in Jacksonville is $74,934.
What is the Median Household income in Jacksonville?
Median Household Income in Jacksonville is $47,121.
What is Income or Wage Gap in Jacksonville?
Income or Wage Gap in Jacksonville is 7.7%.
Women in Jacksonville earn 92.3 cents for every dollar earned by a man.
What is Family Income Deficit in Jacksonville?
Family Income Deficit in Jacksonville is $10,434.
Families that are below poverty line in Jacksonville earn $10,434 less on average than the poverty threshold level.
What is Inequality or Gini Index in Jacksonville?
Inequality or Gini Index in Jacksonville is 0.47.
What is the Total Population of Jacksonville?
Total Population of Jacksonville is 29,332.
What is the Total Male Population of Jacksonville?
Total Male Population of Jacksonville is 14,041.
What is the Total Female Population of Jacksonville?
Total Female Population of Jacksonville is 15,291.
What is the Ratio of Males per 100 Females in Jacksonville?
There are 91.83 Males per 100 Females in Jacksonville.
What is the Ratio of Females per 100 Males in Jacksonville?
There are 108.90 Females per 100 Males in Jacksonville.
What is the Median Population Age in Jacksonville?
Median Population Age in Jacksonville is 33.2 Years.
What is the Average Family Size in Jacksonville
Average Family Size in Jacksonville is 3.2 People.
What is the Average Household Size in Jacksonville
Average Household Size in Jacksonville is 2.4 People.
How Large is the Labor Force in Jacksonville?
There are 14,722 People in the Labor Forcein in Jacksonville.
What is the Percentage of People in the Labor Force in Jacksonville?
63.8% of People are in the Labor Force in Jacksonville.
What is the Unemployment Rate in Jacksonville?
Unemployment Rate in Jacksonville is 8.9%.