Benton, AR Map & Demographics
Benton Map
Benton Overview
$34,257
PER CAPITA INCOME
$81,527
AVG FAMILY INCOME
$66,868
AVG HOUSEHOLD INCOME
28.0%
WAGE / INCOME GAP [ % ]
72.0¢/ $1
WAGE / INCOME GAP [ $ ]
$10,662
FAMILY INCOME DEFICIT
0.40
INEQUALITY / GINI INDEX
35,318
TOTAL POPULATION
17,257
MALE POPULATION
18,061
FEMALE POPULATION
95.55
MALES / 100 FEMALES
104.66
FEMALES / 100 MALES
37.2
MEDIAN AGE
3.0
AVG FAMILY SIZE
2.4
AVG HOUSEHOLD SIZE
18,260
LABOR FORCE [ PEOPLE ]
66.6%
PERCENT IN LABOR FORCE
3.8%
UNEMPLOYMENT RATE
Benton Area Codes
Income in Benton
Income Overview in Benton
Per Capita Income in Benton is $34,257, while median incomes of families and households are $81,527 and $66,868 respectively.
| Characteristic | Number | Measure |
| Per Capita Income | 35,318 | $34,257 |
| Median Family Income | 9,484 | $81,527 |
| Mean Family Income | 9,484 | $96,436 |
| Median Household Income | 14,350 | $66,868 |
| Mean Household Income | 14,350 | $83,015 |
| Income Deficit | 9,484 | $10,662 |
| Wage / Income Gap (%) | 35,318 | 27.96% |
| Wage / Income Gap ($) | 35,318 | 72.04¢ per $1 |
| Gini / Inequality Index | 35,318 | 0.40 |
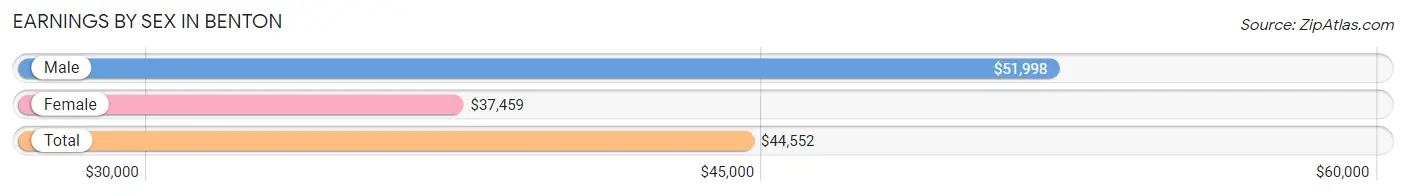
Earnings by Sex in Benton
Average Earnings in Benton are $44,552, $51,998 for men and $37,459 for women, a difference of 28.0%.
| Sex | Number | Average Earnings |
| Male | 9,720 (51.4%) | $51,998 |
| Female | 9,199 (48.6%) | $37,459 |
| Total | 18,919 (100.0%) | $44,552 |
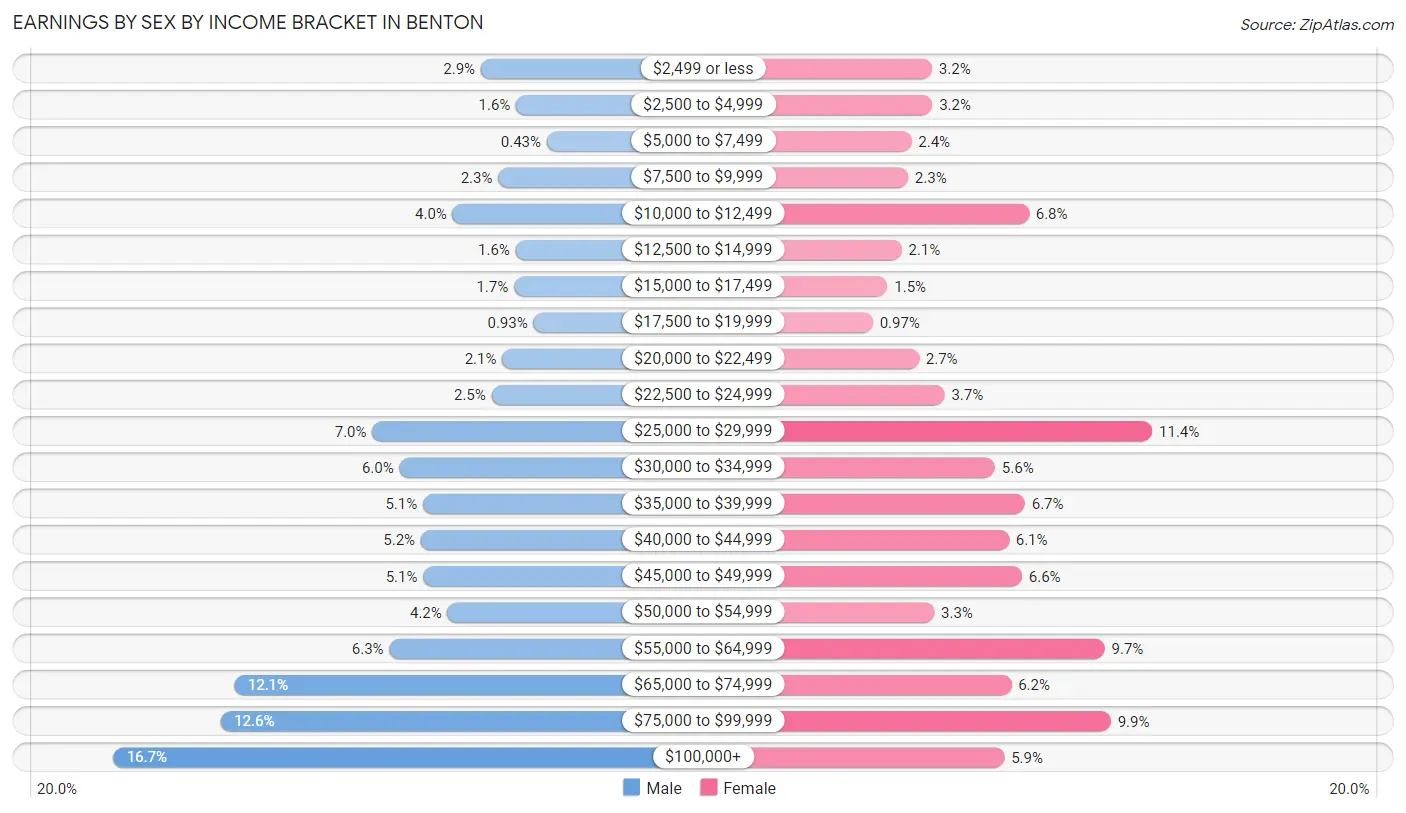
Earnings by Sex by Income Bracket in Benton
The most common earnings brackets in Benton are $100,000+ for men (1,619 | 16.7%) and $25,000 to $29,999 for women (1,052 | 11.4%).
| Income | Male | Female |
| $2,499 or less | 282 (2.9%) | 293 (3.2%) |
| $2,500 to $4,999 | 154 (1.6%) | 294 (3.2%) |
| $5,000 to $7,499 | 42 (0.4%) | 223 (2.4%) |
| $7,500 to $9,999 | 219 (2.2%) | 211 (2.3%) |
| $10,000 to $12,499 | 385 (4.0%) | 627 (6.8%) |
| $12,500 to $14,999 | 156 (1.6%) | 189 (2.1%) |
| $15,000 to $17,499 | 161 (1.7%) | 140 (1.5%) |
| $17,500 to $19,999 | 90 (0.9%) | 89 (1.0%) |
| $20,000 to $22,499 | 204 (2.1%) | 248 (2.7%) |
| $22,500 to $24,999 | 243 (2.5%) | 337 (3.7%) |
| $25,000 to $29,999 | 677 (7.0%) | 1,052 (11.4%) |
| $30,000 to $34,999 | 578 (5.9%) | 511 (5.6%) |
| $35,000 to $39,999 | 493 (5.1%) | 614 (6.7%) |
| $40,000 to $44,999 | 501 (5.1%) | 558 (6.1%) |
| $45,000 to $49,999 | 492 (5.1%) | 603 (6.6%) |
| $50,000 to $54,999 | 403 (4.2%) | 301 (3.3%) |
| $55,000 to $64,999 | 615 (6.3%) | 889 (9.7%) |
| $65,000 to $74,999 | 1,178 (12.1%) | 567 (6.2%) |
| $75,000 to $99,999 | 1,228 (12.6%) | 910 (9.9%) |
| $100,000+ | 1,619 (16.7%) | 543 (5.9%) |
| Total | 9,720 (100.0%) | 9,199 (100.0%) |
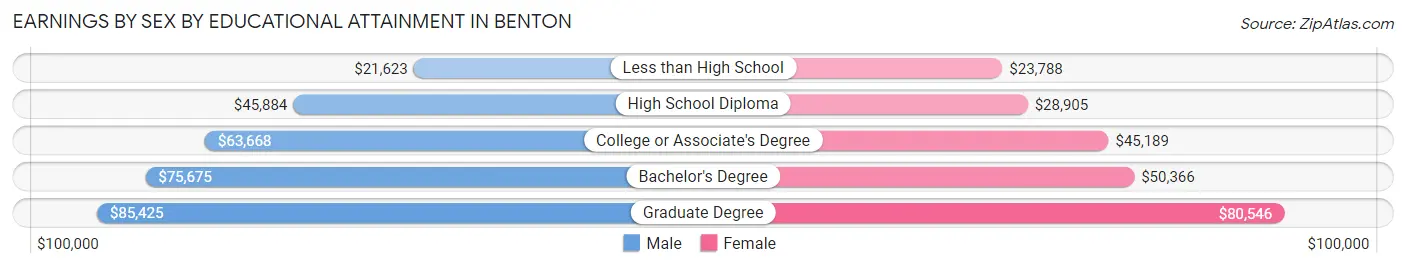
Earnings by Sex by Educational Attainment in Benton
Average earnings in Benton are $59,420 for men and $45,100 for women, a difference of 24.1%. Men with an educational attainment of graduate degree enjoy the highest average annual earnings of $85,425, while those with less than high school education earn the least with $21,623. Women with an educational attainment of graduate degree earn the most with the average annual earnings of $80,546, while those with less than high school education have the smallest earnings of $23,788.
| Educational Attainment | Male Income | Female Income |
| Less than High School | $21,623 | $23,788 |
| High School Diploma | $45,884 | $28,905 |
| College or Associate's Degree | $63,668 | $45,189 |
| Bachelor's Degree | $75,675 | $50,366 |
| Graduate Degree | $85,425 | $80,546 |
| Total | $59,420 | $45,100 |
Family Income in Benton
Family Income Brackets in Benton
According to the Benton family income data, there are 1,897 families falling into the $100,000 to $149,999 income range, which is the most common income bracket and makes up 20.0% of all families. Conversely, the $10,000 to $14,999 income bracket is the least frequent group with only 161 families (1.7%) belonging to this category.
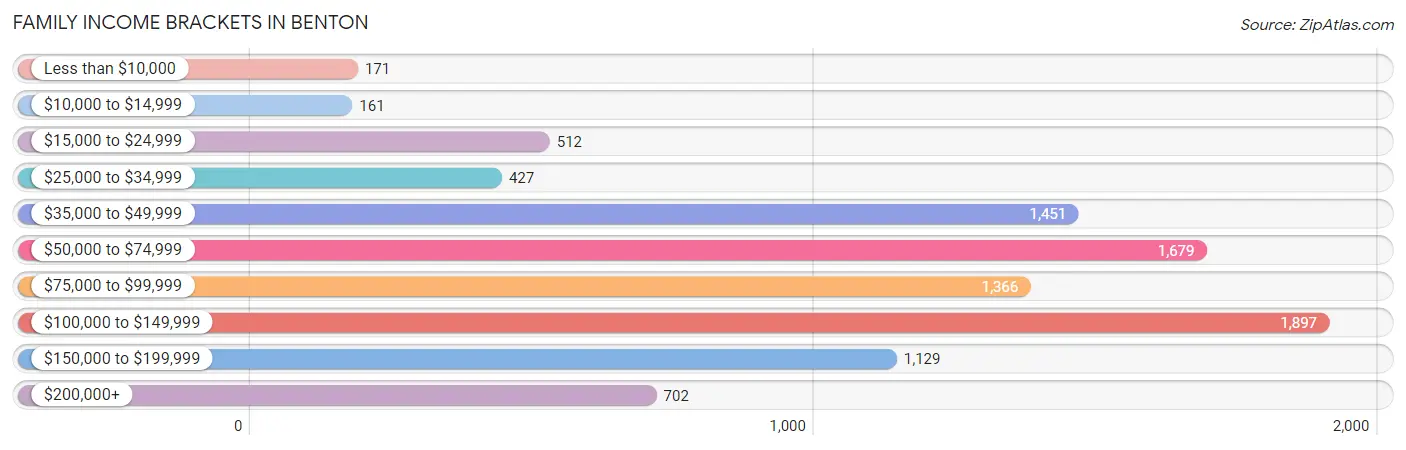
| Income Bracket | # Families | % Families |
| Less than $10,000 | 171 | 1.8% |
| $10,000 to $14,999 | 161 | 1.7% |
| $15,000 to $24,999 | 512 | 5.4% |
| $25,000 to $34,999 | 427 | 4.5% |
| $35,000 to $49,999 | 1,451 | 15.3% |
| $50,000 to $74,999 | 1,679 | 17.7% |
| $75,000 to $99,999 | 1,366 | 14.4% |
| $100,000 to $149,999 | 1,897 | 20.0% |
| $150,000 to $199,999 | 1,129 | 11.9% |
| $200,000+ | 702 | 7.4% |
Family Income by Famaliy Size in Benton
4-person families (1,245 | 13.1%) account for the highest median family income in Benton with $117,803 per family, while 2-person families (4,845 | 51.1%) have the highest median income of $34,206 per family member.
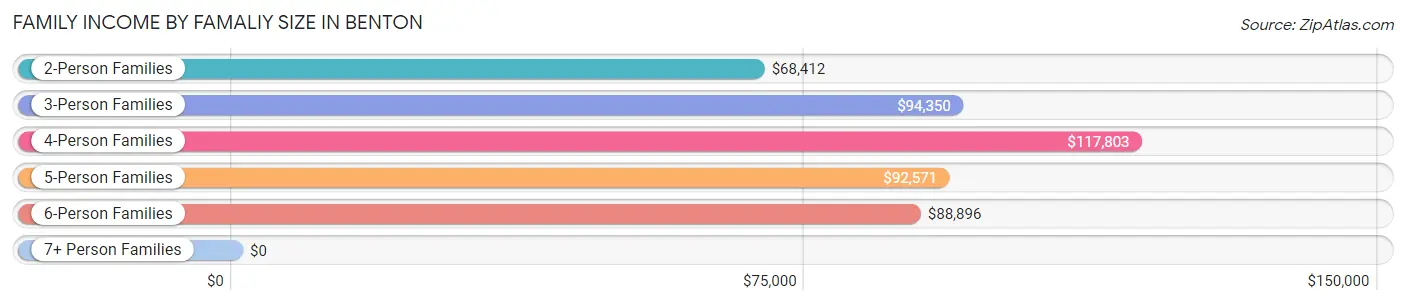
| Income Bracket | # Families | Median Income |
| 2-Person Families | 4,845 (51.1%) | $68,412 |
| 3-Person Families | 2,117 (22.3%) | $94,350 |
| 4-Person Families | 1,245 (13.1%) | $117,803 |
| 5-Person Families | 926 (9.8%) | $92,571 |
| 6-Person Families | 215 (2.3%) | $88,896 |
| 7+ Person Families | 136 (1.4%) | $0 |
| Total | 9,484 (100.0%) | $81,527 |
Family Income by Number of Earners in Benton
The median family income in Benton is $81,527, with families comprising 2 earners (4,031) having the highest median family income of $117,988, while families with no earners (1,142) have the lowest median family income of $45,313, accounting for 42.5% and 12.0% of families, respectively.
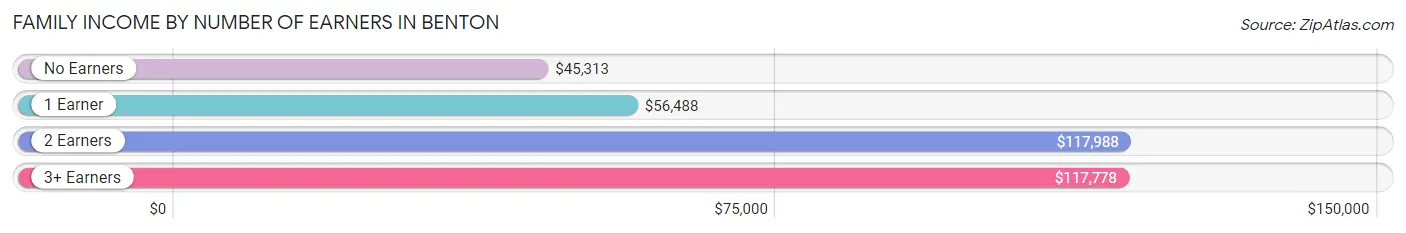
| Number of Earners | # Families | Median Income |
| No Earners | 1,142 (12.0%) | $45,313 |
| 1 Earner | 3,539 (37.3%) | $56,488 |
| 2 Earners | 4,031 (42.5%) | $117,988 |
| 3+ Earners | 772 (8.1%) | $117,778 |
| Total | 9,484 (100.0%) | $81,527 |
Household Income in Benton
Household Income Brackets in Benton
With 2,956 households falling in the category, the $50,000 to $74,999 income range is the most frequent in Benton, accounting for 20.6% of all households. In contrast, only 430 households (3.0%) fall into the $10,000 to $14,999 income bracket, making it the least populous group.
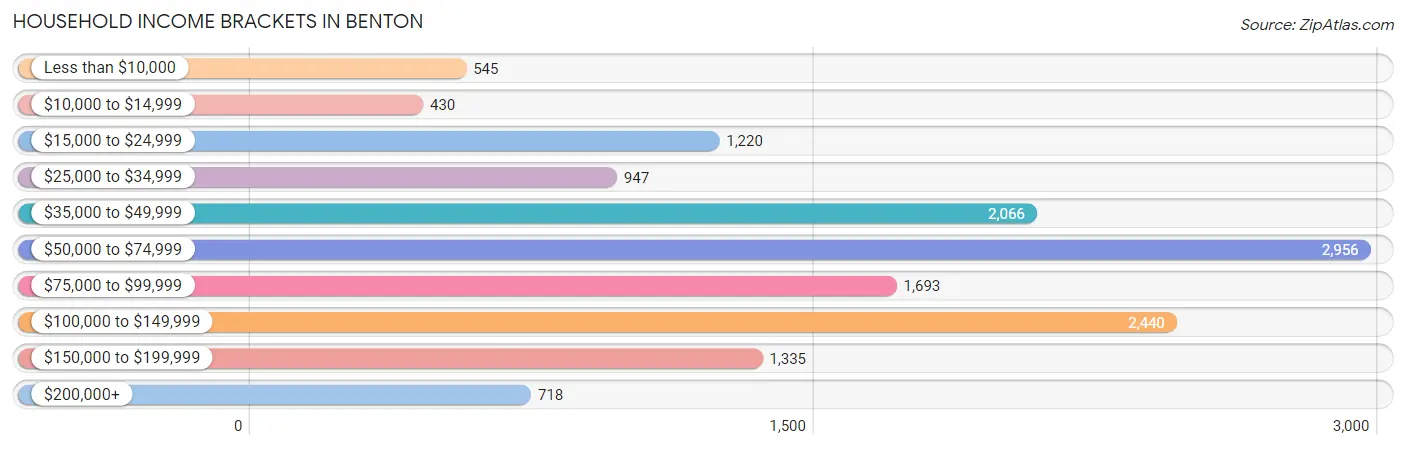
| Income Bracket | # Households | % Households |
| Less than $10,000 | 545 | 3.8% |
| $10,000 to $14,999 | 430 | 3.0% |
| $15,000 to $24,999 | 1,220 | 8.5% |
| $25,000 to $34,999 | 947 | 6.6% |
| $35,000 to $49,999 | 2,066 | 14.4% |
| $50,000 to $74,999 | 2,956 | 20.6% |
| $75,000 to $99,999 | 1,693 | 11.8% |
| $100,000 to $149,999 | 2,440 | 17.0% |
| $150,000 to $199,999 | 1,335 | 9.3% |
| $200,000+ | 718 | 5.0% |
Household Income by Householder Age in Benton
The median household income in Benton is $66,868, with the highest median household income of $80,777 found in the 25 to 44 years age bracket for the primary householder. A total of 5,179 households (36.1%) fall into this category. Meanwhile, the 15 to 24 years age bracket for the primary householder has the lowest median household income of $39,075, with 723 households (5.0%) in this group.
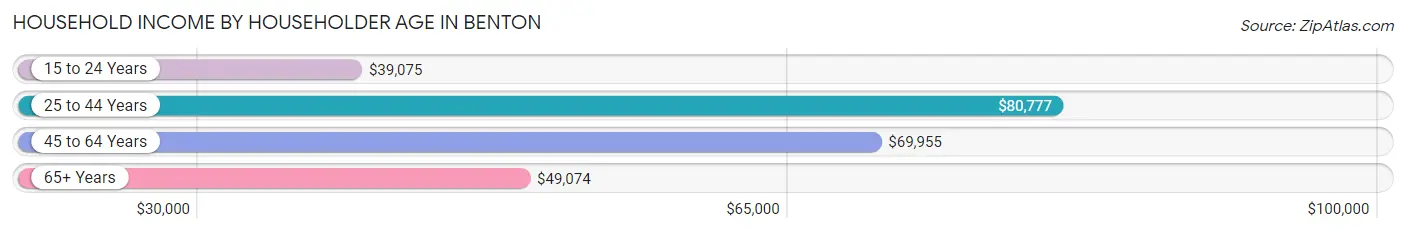
| Income Bracket | # Households | Median Income |
| 15 to 24 Years | 723 (5.0%) | $39,075 |
| 25 to 44 Years | 5,179 (36.1%) | $80,777 |
| 45 to 64 Years | 5,007 (34.9%) | $69,955 |
| 65+ Years | 3,441 (24.0%) | $49,074 |
| Total | 14,350 (100.0%) | $66,868 |
Poverty in Benton
Income Below Poverty by Sex and Age in Benton
With 10.5% poverty level for males and 10.8% for females among the residents of Benton, 6 to 11 year old males and under 5 year old females are the most vulnerable to poverty, with 424 males (28.3%) and 327 females (30.5%) in their respective age groups living below the poverty level.
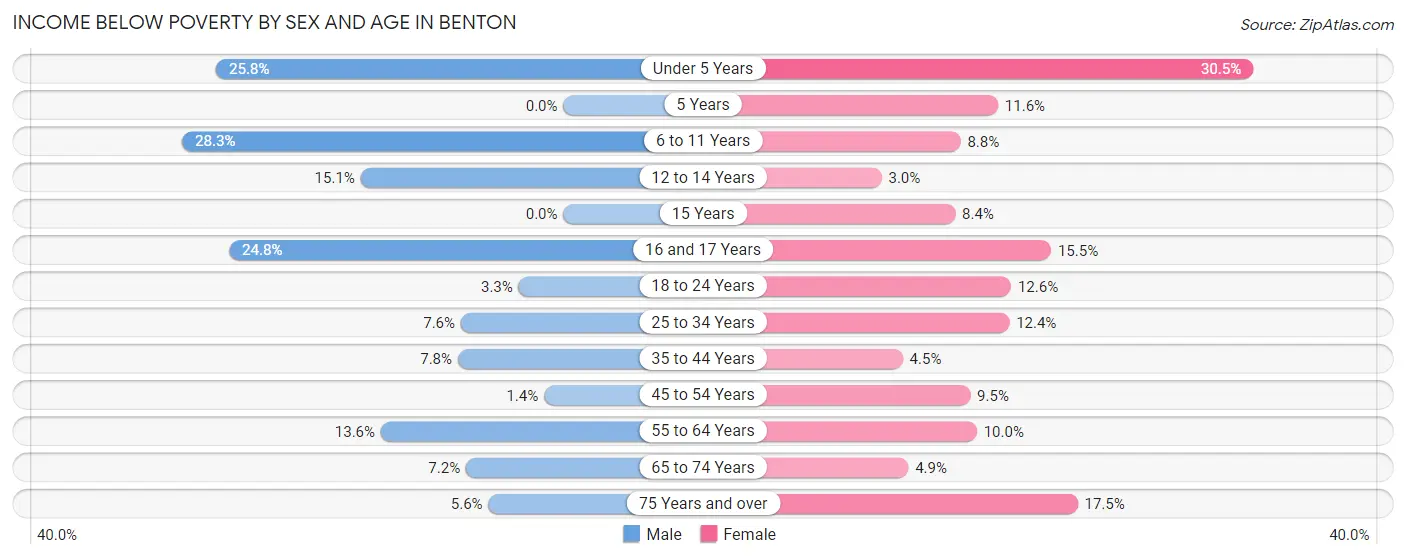
| Age Bracket | Male | Female |
| Under 5 Years | 248 (25.8%) | 327 (30.5%) |
| 5 Years | 0 (0.0%) | 43 (11.6%) |
| 6 to 11 Years | 424 (28.3%) | 116 (8.8%) |
| 12 to 14 Years | 183 (15.0%) | 15 (2.9%) |
| 15 Years | 0 (0.0%) | 44 (8.4%) |
| 16 and 17 Years | 96 (24.8%) | 66 (15.5%) |
| 18 to 24 Years | 49 (3.3%) | 236 (12.6%) |
| 25 to 34 Years | 189 (7.6%) | 263 (12.4%) |
| 35 to 44 Years | 163 (7.8%) | 119 (4.5%) |
| 45 to 54 Years | 35 (1.4%) | 235 (9.5%) |
| 55 to 64 Years | 228 (13.6%) | 163 (10.0%) |
| 65 to 74 Years | 119 (7.2%) | 86 (4.9%) |
| 75 Years and over | 38 (5.6%) | 220 (17.5%) |
| Total | 1,772 (10.5%) | 1,933 (10.8%) |
Income Above Poverty by Sex and Age in Benton
According to the poverty statistics in Benton, males aged 5 years and females aged 12 to 14 years are the age groups that are most secure financially, with 100.0% of males and 97.1% of females in these age groups living above the poverty line.
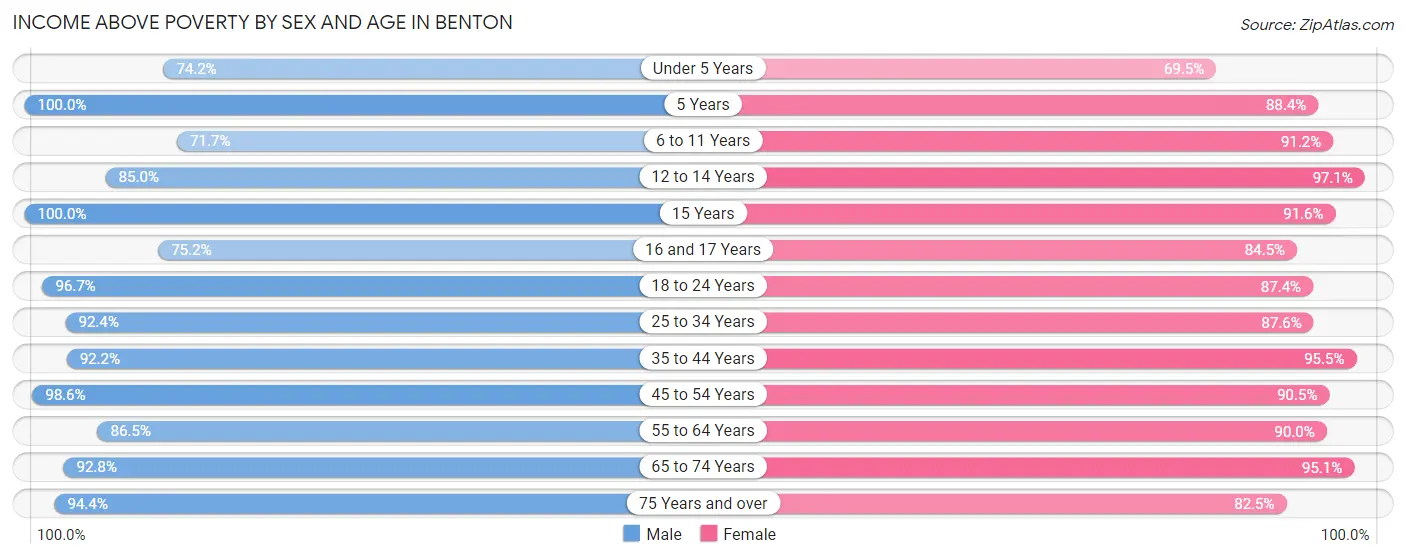
| Age Bracket | Male | Female |
| Under 5 Years | 714 (74.2%) | 744 (69.5%) |
| 5 Years | 88 (100.0%) | 328 (88.4%) |
| 6 to 11 Years | 1,074 (71.7%) | 1,200 (91.2%) |
| 12 to 14 Years | 1,033 (85.0%) | 494 (97.1%) |
| 15 Years | 278 (100.0%) | 479 (91.6%) |
| 16 and 17 Years | 291 (75.2%) | 359 (84.5%) |
| 18 to 24 Years | 1,428 (96.7%) | 1,643 (87.4%) |
| 25 to 34 Years | 2,294 (92.4%) | 1,853 (87.6%) |
| 35 to 44 Years | 1,920 (92.2%) | 2,512 (95.5%) |
| 45 to 54 Years | 2,418 (98.6%) | 2,232 (90.5%) |
| 55 to 64 Years | 1,455 (86.5%) | 1,463 (90.0%) |
| 65 to 74 Years | 1,528 (92.8%) | 1,660 (95.1%) |
| 75 Years and over | 646 (94.4%) | 1,037 (82.5%) |
| Total | 15,167 (89.5%) | 16,004 (89.2%) |
Income Below Poverty Among Married-Couple Families in Benton
The poverty statistics for married-couple families in Benton show that 3.1% or 214 of the total 6,874 families live below the poverty line. Families with 1 or 2 children have the highest poverty rate of 5.0%, comprising of 120 families. On the other hand, families with 5 or more children have the lowest poverty rate of 0.0%, which includes 0 families.
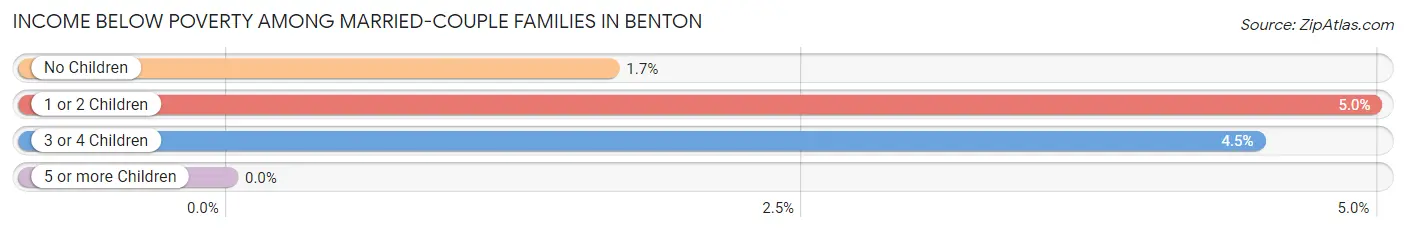
| Children | Above Poverty | Below Poverty |
| No Children | 3,663 (98.3%) | 62 (1.7%) |
| 1 or 2 Children | 2,292 (95.0%) | 120 (5.0%) |
| 3 or 4 Children | 684 (95.5%) | 32 (4.5%) |
| 5 or more Children | 21 (100.0%) | 0 (0.0%) |
| Total | 6,660 (96.9%) | 214 (3.1%) |
Income Below Poverty Among Single-Parent Households in Benton
According to the poverty data in Benton, 29.6% or 160 single-father households and 14.4% or 298 single-mother households are living below the poverty line. Among single-father households, those with 3 or 4 children have the highest poverty rate, with 64 households (100.0%) experiencing poverty. Likewise, among single-mother households, those with 3 or 4 children have the highest poverty rate, with 60 households (52.6%) falling below the poverty line.
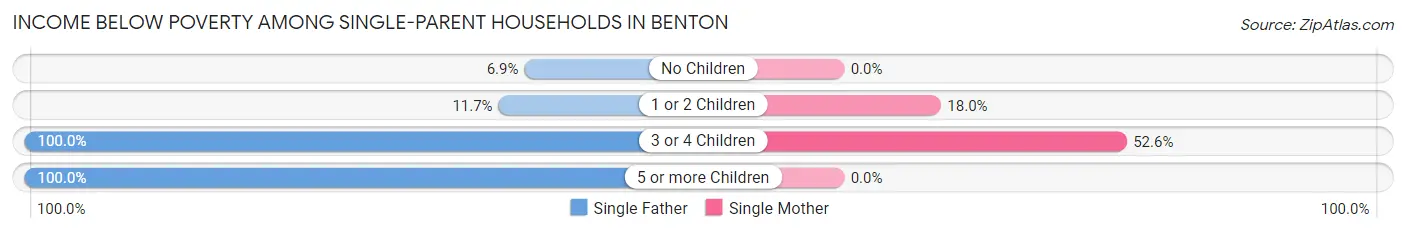
| Children | Single Father | Single Mother |
| No Children | 11 (6.9%) | 0 (0.0%) |
| 1 or 2 Children | 31 (11.7%) | 238 (18.0%) |
| 3 or 4 Children | 64 (100.0%) | 60 (52.6%) |
| 5 or more Children | 54 (100.0%) | 0 (0.0%) |
| Total | 160 (29.6%) | 298 (14.4%) |
Income Below Poverty Among Married-Couple vs Single-Parent Households in Benton
The poverty data for Benton shows that 214 of the married-couple family households (3.1%) and 458 of the single-parent households (17.5%) are living below the poverty level. Within the married-couple family households, those with 1 or 2 children have the highest poverty rate, with 120 households (5.0%) falling below the poverty line. Among the single-parent households, those with 5 or more children have the highest poverty rate, with 54 household (91.5%) living below poverty.
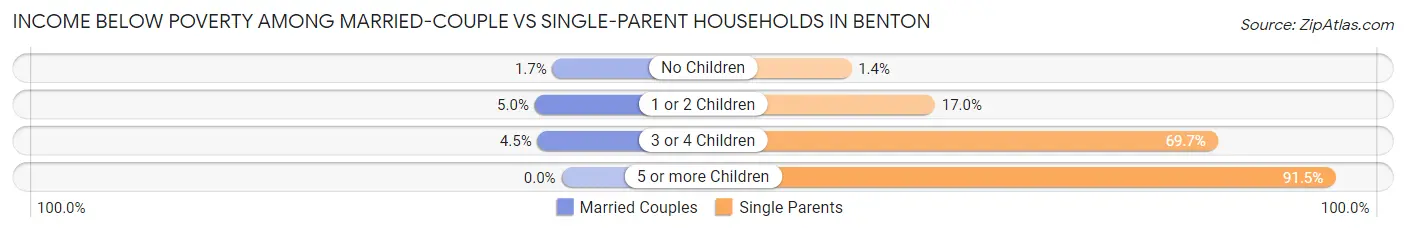
| Children | Married-Couple Families | Single-Parent Households |
| No Children | 62 (1.7%) | 11 (1.4%) |
| 1 or 2 Children | 120 (5.0%) | 269 (17.0%) |
| 3 or 4 Children | 32 (4.5%) | 124 (69.7%) |
| 5 or more Children | 0 (0.0%) | 54 (91.5%) |
| Total | 214 (3.1%) | 458 (17.5%) |
Race in Benton
The most populous races in Benton are White / Caucasian (29,575 | 83.7%), Black / African American (3,305 | 9.4%), and Hispanic or Latino (1,591 | 4.5%).
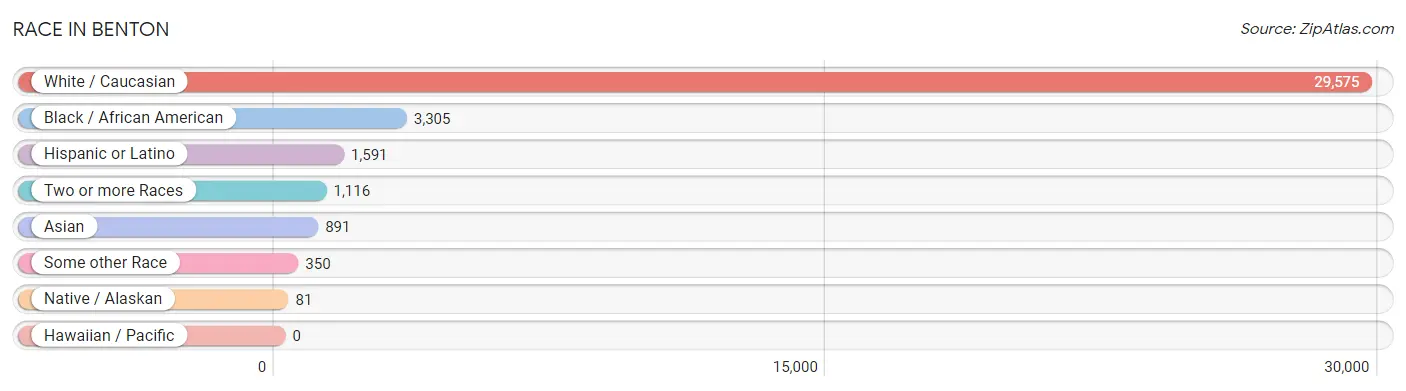
| Race | # Population | % Population |
| Asian | 891 | 2.5% |
| Black / African American | 3,305 | 9.4% |
| Hawaiian / Pacific | 0 | 0.0% |
| Hispanic or Latino | 1,591 | 4.5% |
| Native / Alaskan | 81 | 0.2% |
| White / Caucasian | 29,575 | 83.7% |
| Two or more Races | 1,116 | 3.2% |
| Some other Race | 350 | 1.0% |
| Total | 35,318 | 100.0% |
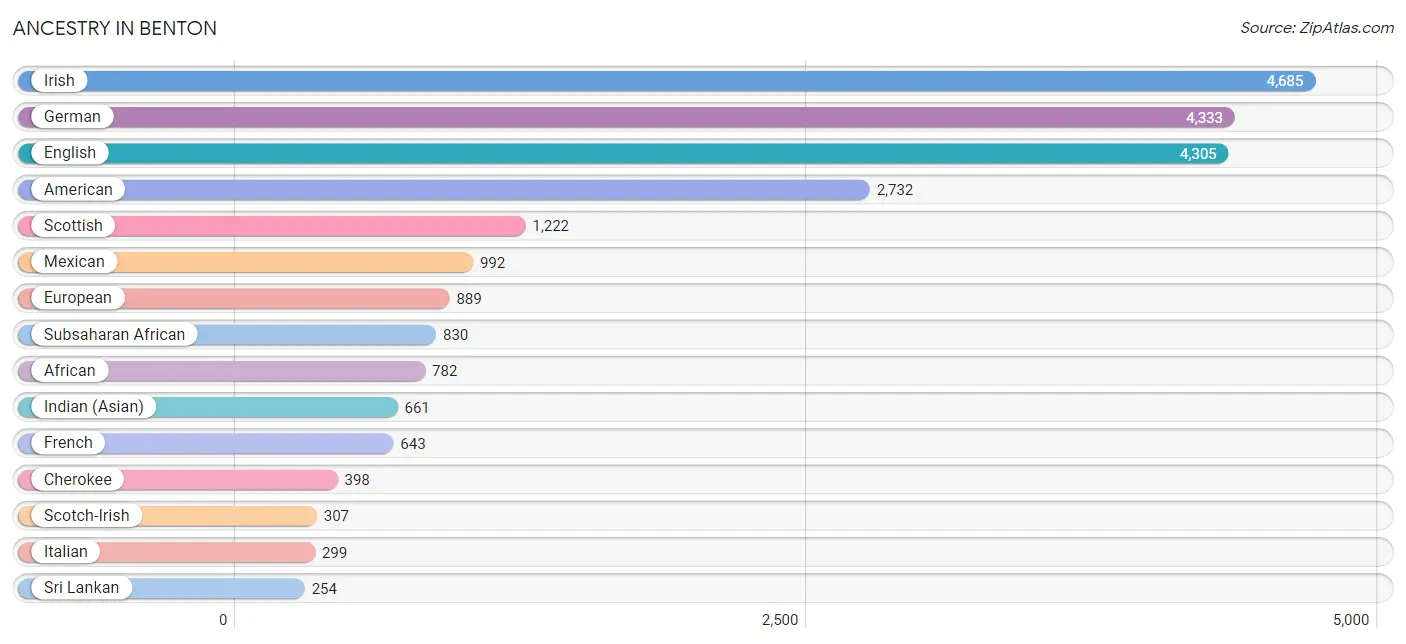
Ancestry in Benton
The most populous ancestries reported in Benton are Irish (4,685 | 13.3%), German (4,333 | 12.3%), English (4,305 | 12.2%), American (2,732 | 7.7%), and Scottish (1,222 | 3.5%), together accounting for 48.9% of all Benton residents.
| Ancestry | # Population | % Population |
| African | 782 | 2.2% |
| Albanian | 38 | 0.1% |
| American | 2,732 | 7.7% |
| Apache | 11 | 0.0% |
| Arab | 15 | 0.0% |
| Armenian | 53 | 0.2% |
| Assyrian / Chaldean / Syriac | 12 | 0.0% |
| Austrian | 53 | 0.2% |
| British | 170 | 0.5% |
| Burmese | 85 | 0.2% |
| Canadian | 16 | 0.1% |
| Central American | 138 | 0.4% |
| Cherokee | 398 | 1.1% |
| Chickasaw | 7 | 0.0% |
| Chippewa | 10 | 0.0% |
| Choctaw | 21 | 0.1% |
| Costa Rican | 108 | 0.3% |
| Czech | 6 | 0.0% |
| Danish | 87 | 0.3% |
| Dutch | 138 | 0.4% |
| Eastern European | 47 | 0.1% |
| English | 4,305 | 12.2% |
| European | 889 | 2.5% |
| Finnish | 13 | 0.0% |
| French | 643 | 1.8% |
| French Canadian | 8 | 0.0% |
| German | 4,333 | 12.3% |
| Greek | 48 | 0.1% |
| Haitian | 5 | 0.0% |
| Hungarian | 35 | 0.1% |
| Indian (Asian) | 661 | 1.9% |
| Iraqi | 9 | 0.0% |
| Irish | 4,685 | 13.3% |
| Italian | 299 | 0.9% |
| Korean | 19 | 0.1% |
| Malaysian | 50 | 0.1% |
| Mexican | 992 | 2.8% |
| Native Hawaiian | 19 | 0.1% |
| Northern European | 13 | 0.0% |
| Norwegian | 9 | 0.0% |
| Peruvian | 36 | 0.1% |
| Polish | 218 | 0.6% |
| Puerto Rican | 176 | 0.5% |
| Salvadoran | 30 | 0.1% |
| Scandinavian | 53 | 0.2% |
| Scotch-Irish | 307 | 0.9% |
| Scottish | 1,222 | 3.5% |
| Serbian | 10 | 0.0% |
| Sioux | 4 | 0.0% |
| Slovak | 17 | 0.1% |
| South American | 36 | 0.1% |
| South American Indian | 36 | 0.1% |
| Sri Lankan | 254 | 0.7% |
| Subsaharan African | 830 | 2.4% |
| Swedish | 113 | 0.3% |
| Swiss | 88 | 0.3% |
| Thai | 34 | 0.1% |
| Welsh | 228 | 0.6% | View All 58 Rows |
Immigrants in Benton
The most numerous immigrant groups reported in Benton came from Asia (585 | 1.7%), Latin America (372 | 1.1%), Central America (365 | 1.0%), Mexico (345 | 1.0%), and Eastern Asia (342 | 1.0%), together accounting for 5.7% of all Benton residents.
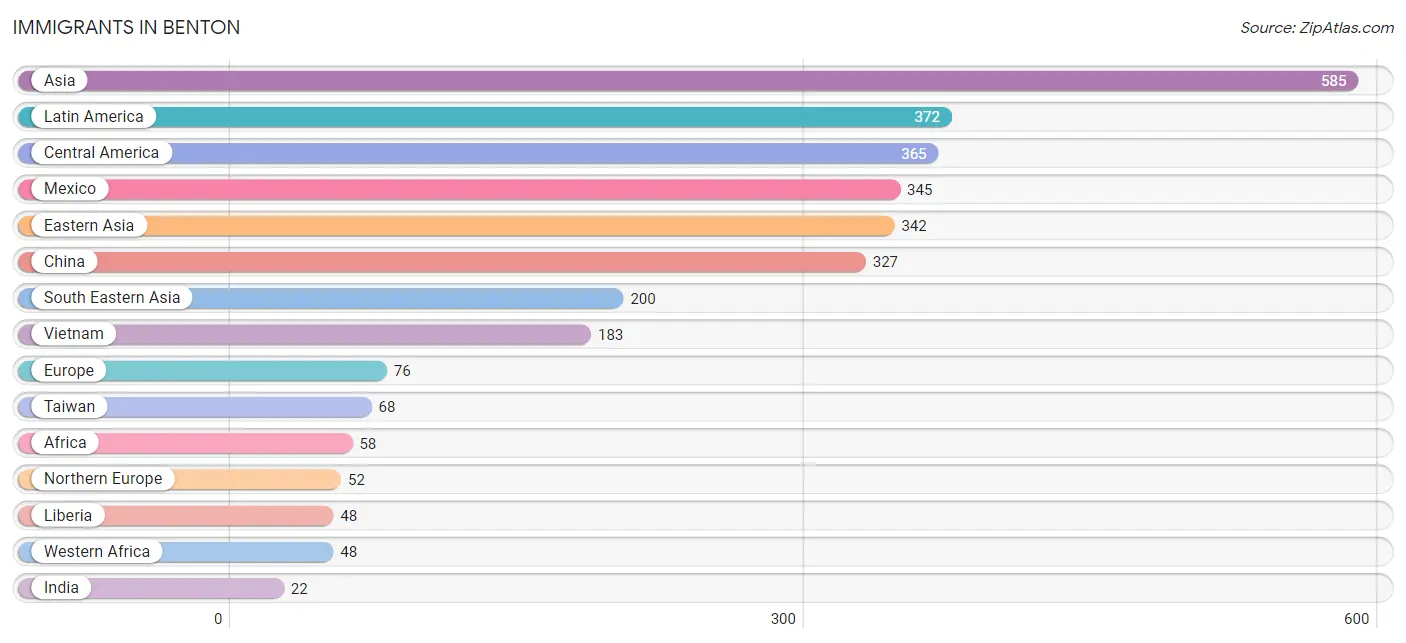
| Immigration Origin | # Population | % Population |
| Africa | 58 | 0.2% |
| Albania | 14 | 0.0% |
| Asia | 585 | 1.7% |
| Canada | 16 | 0.1% |
| Central America | 365 | 1.0% |
| China | 327 | 0.9% |
| Eastern Asia | 342 | 1.0% |
| Eastern Europe | 14 | 0.0% |
| Egypt | 10 | 0.0% |
| El Salvador | 20 | 0.1% |
| England | 10 | 0.0% |
| Europe | 76 | 0.2% |
| Germany | 10 | 0.0% |
| India | 22 | 0.1% |
| Iraq | 9 | 0.0% |
| Korea | 15 | 0.0% |
| Laos | 17 | 0.1% |
| Latin America | 372 | 1.1% |
| Lebanon | 12 | 0.0% |
| Liberia | 48 | 0.1% |
| Mexico | 345 | 1.0% |
| Northern Africa | 10 | 0.0% |
| Northern Europe | 52 | 0.2% |
| Peru | 7 | 0.0% |
| South America | 7 | 0.0% |
| South Central Asia | 22 | 0.1% |
| South Eastern Asia | 200 | 0.6% |
| Taiwan | 68 | 0.2% |
| Vietnam | 183 | 0.5% |
| Western Africa | 48 | 0.1% |
| Western Asia | 21 | 0.1% |
| Western Europe | 10 | 0.0% | View All 32 Rows |
Sex and Age in Benton
Sex and Age in Benton
The most populous age groups in Benton are 10 to 14 Years (1,663 | 9.6%) for men and 40 to 44 Years (1,507 | 8.3%) for women.
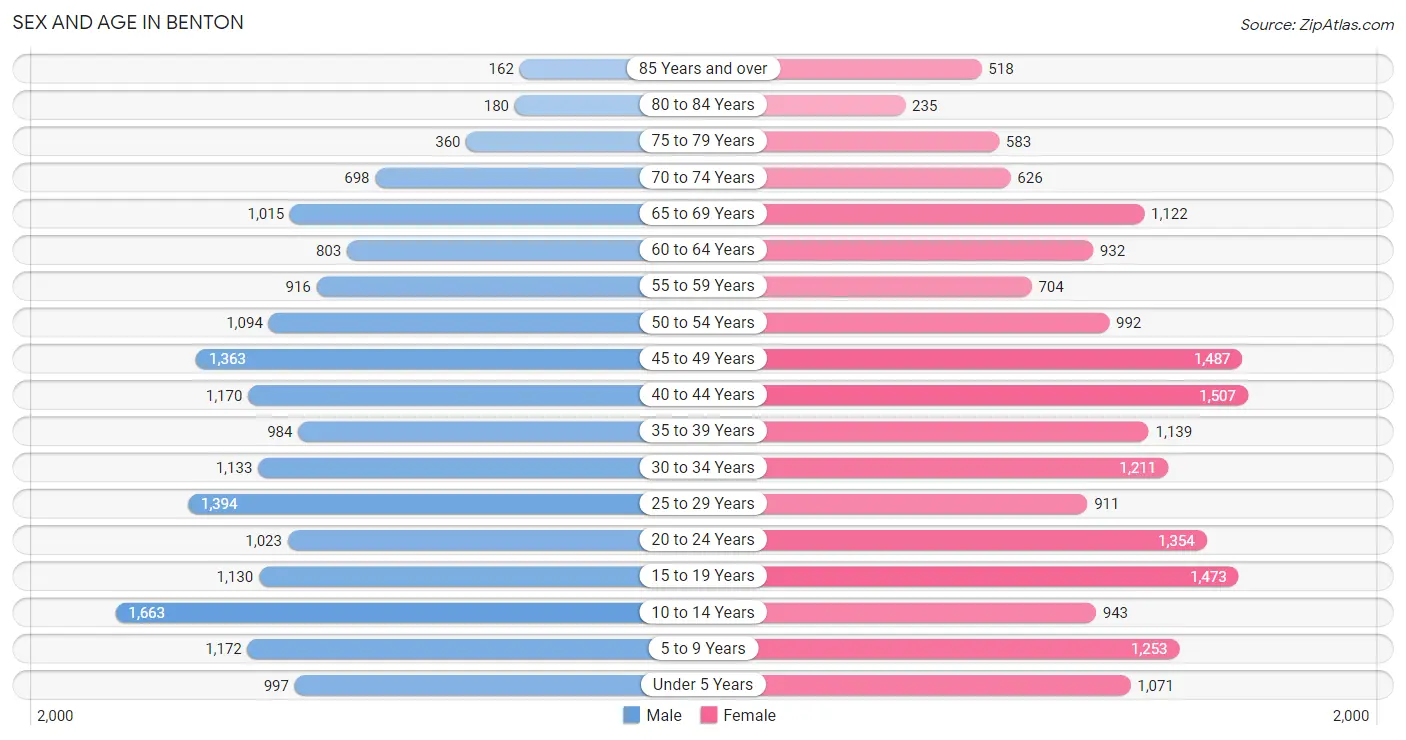
| Age Bracket | Male | Female |
| Under 5 Years | 997 (5.8%) | 1,071 (5.9%) |
| 5 to 9 Years | 1,172 (6.8%) | 1,253 (6.9%) |
| 10 to 14 Years | 1,663 (9.6%) | 943 (5.2%) |
| 15 to 19 Years | 1,130 (6.6%) | 1,473 (8.2%) |
| 20 to 24 Years | 1,023 (5.9%) | 1,354 (7.5%) |
| 25 to 29 Years | 1,394 (8.1%) | 911 (5.0%) |
| 30 to 34 Years | 1,133 (6.6%) | 1,211 (6.7%) |
| 35 to 39 Years | 984 (5.7%) | 1,139 (6.3%) |
| 40 to 44 Years | 1,170 (6.8%) | 1,507 (8.3%) |
| 45 to 49 Years | 1,363 (7.9%) | 1,487 (8.2%) |
| 50 to 54 Years | 1,094 (6.3%) | 992 (5.5%) |
| 55 to 59 Years | 916 (5.3%) | 704 (3.9%) |
| 60 to 64 Years | 803 (4.6%) | 932 (5.2%) |
| 65 to 69 Years | 1,015 (5.9%) | 1,122 (6.2%) |
| 70 to 74 Years | 698 (4.0%) | 626 (3.5%) |
| 75 to 79 Years | 360 (2.1%) | 583 (3.2%) |
| 80 to 84 Years | 180 (1.0%) | 235 (1.3%) |
| 85 Years and over | 162 (0.9%) | 518 (2.9%) |
| Total | 17,257 (100.0%) | 18,061 (100.0%) |
Families and Households in Benton
Median Family Size in Benton
The median family size in Benton is 3.02 persons per family, with single male/father families (541 | 5.7%) accounting for the largest median family size of 3.29 persons per family. On the other hand, single female/mother families (2,069 | 21.8%) represent the smallest median family size with 2.68 persons per family.
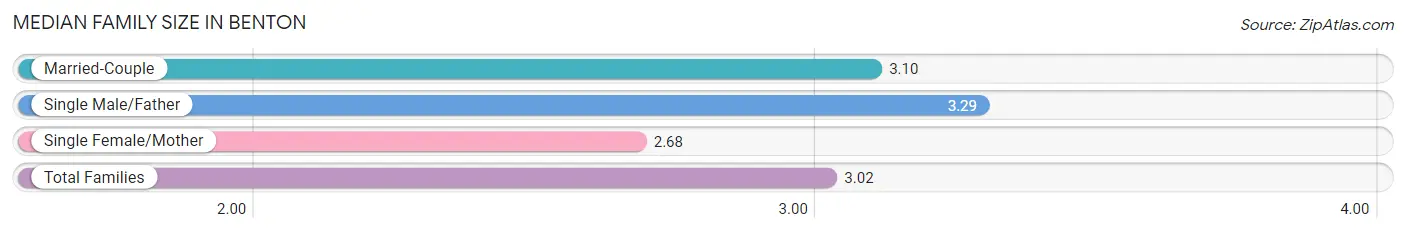
| Family Type | # Families | Family Size |
| Married-Couple | 6,874 (72.5%) | 3.10 |
| Single Male/Father | 541 (5.7%) | 3.29 |
| Single Female/Mother | 2,069 (21.8%) | 2.68 |
| Total Families | 9,484 (100.0%) | 3.02 |
Median Household Size in Benton
The median household size in Benton is 2.43 persons per household, with single male/father households (541 | 3.8%) accounting for the largest median household size of 3.73 persons per household. non-family households (4,866 | 33.9%) represent the smallest median household size with 1.19 persons per household.
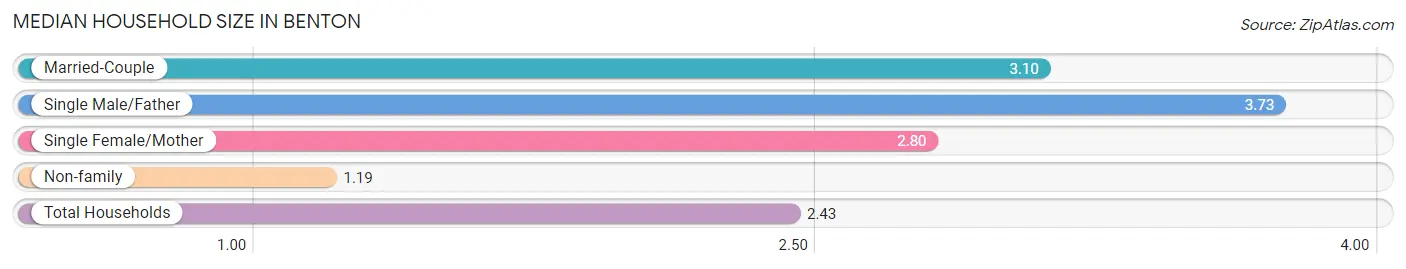
| Household Type | # Households | Household Size |
| Married-Couple | 6,874 (47.9%) | 3.10 |
| Single Male/Father | 541 (3.8%) | 3.73 |
| Single Female/Mother | 2,069 (14.4%) | 2.80 |
| Non-family | 4,866 (33.9%) | 1.19 |
| Total Households | 14,350 (100.0%) | 2.43 |
Household Size by Marriage Status in Benton
Out of a total of 14,350 households in Benton, 9,484 (66.1%) are family households, while 4,866 (33.9%) are nonfamily households. The most numerous type of family households are 2-person households, comprising 4,588, and the most common type of nonfamily households are 1-person households, comprising 3,942.
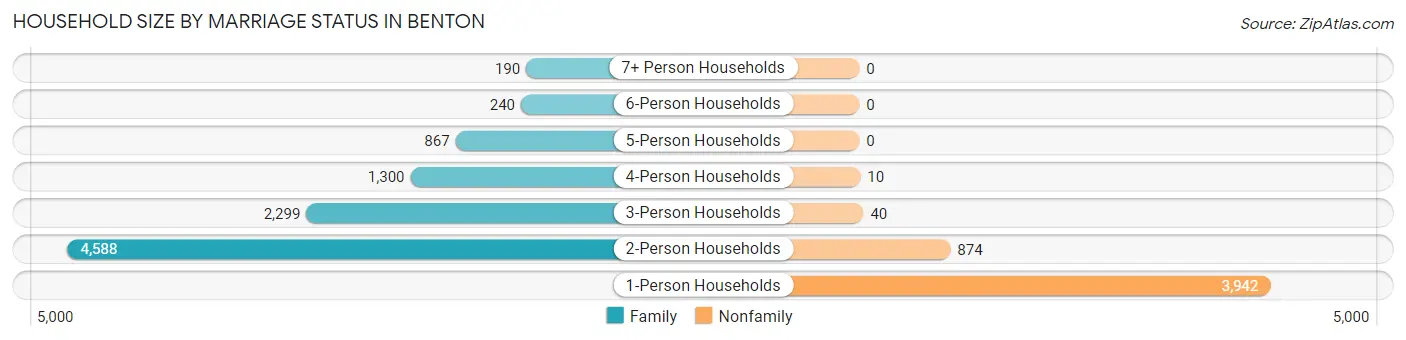
| Household Size | Family Households | Nonfamily Households |
| 1-Person Households | - | 3,942 (27.5%) |
| 2-Person Households | 4,588 (32.0%) | 874 (6.1%) |
| 3-Person Households | 2,299 (16.0%) | 40 (0.3%) |
| 4-Person Households | 1,300 (9.1%) | 10 (0.1%) |
| 5-Person Households | 867 (6.0%) | 0 (0.0%) |
| 6-Person Households | 240 (1.7%) | 0 (0.0%) |
| 7+ Person Households | 190 (1.3%) | 0 (0.0%) |
| Total | 9,484 (66.1%) | 4,866 (33.9%) |
Female Fertility in Benton
Fertility by Age in Benton
Average fertility rate in Benton is 32.0 births per 1,000 women. Women in the age bracket of 20 to 34 years have the highest fertility rate with 73.0 births per 1,000 women. Women in the age bracket of 20 to 34 years acount for 84.6% of all women with births.
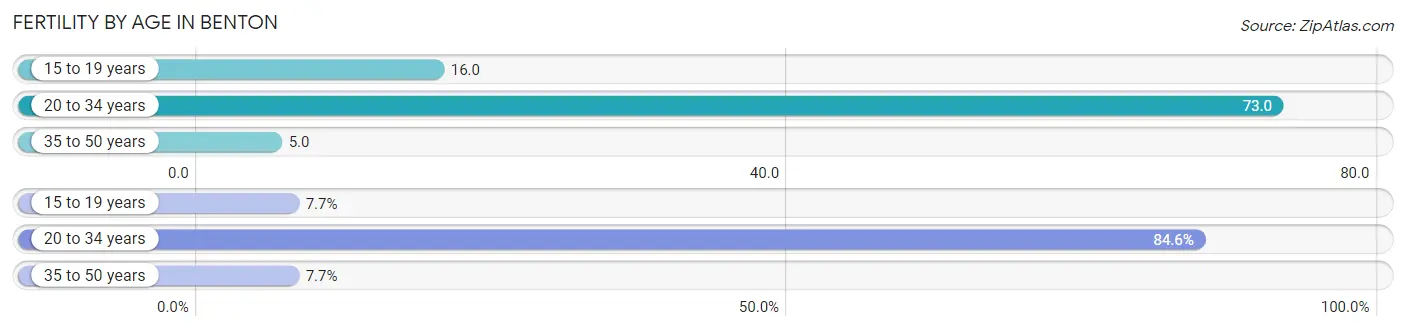
| Age Bracket | Women with Births | Births / 1,000 Women |
| 15 to 19 years | 23 (7.7%) | 16.0 |
| 20 to 34 years | 253 (84.6%) | 73.0 |
| 35 to 50 years | 23 (7.7%) | 5.0 |
| Total | 299 (100.0%) | 32.0 |
Fertility by Age by Marriage Status in Benton
72.9% of women with births (299) in Benton are married. The highest percentage of unmarried women with births falls into 15 to 19 years age bracket with 100.0% of them unmarried at the time of birth, while the lowest percentage of unmarried women with births belong to 35 to 50 years age bracket with 0.0% of them unmarried.
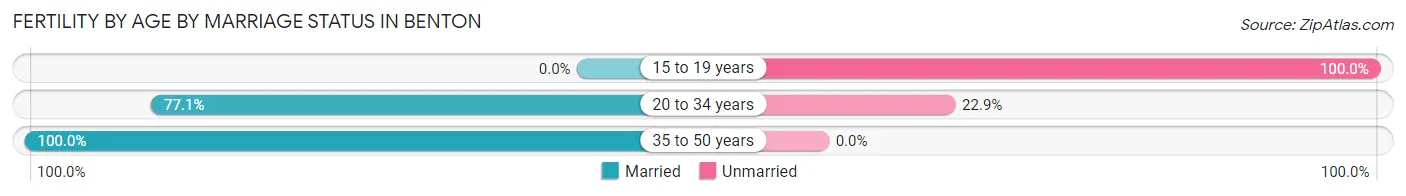
| Age Bracket | Married | Unmarried |
| 15 to 19 years | 0 (0.0%) | 23 (100.0%) |
| 20 to 34 years | 195 (77.1%) | 58 (22.9%) |
| 35 to 50 years | 23 (100.0%) | 0 (0.0%) |
| Total | 218 (72.9%) | 81 (27.1%) |
Fertility by Education in Benton
Average fertility rate in Benton is 32.0 births per 1,000 women. Women with the education attainment of college or associate's degree have the highest fertility rate of 59.0 births per 1,000 women, while women with the education attainment of graduate degree have the lowest fertility at 6.0 births per 1,000 women. Women with the education attainment of college or associate's degree represent 63.5% of all women with births.
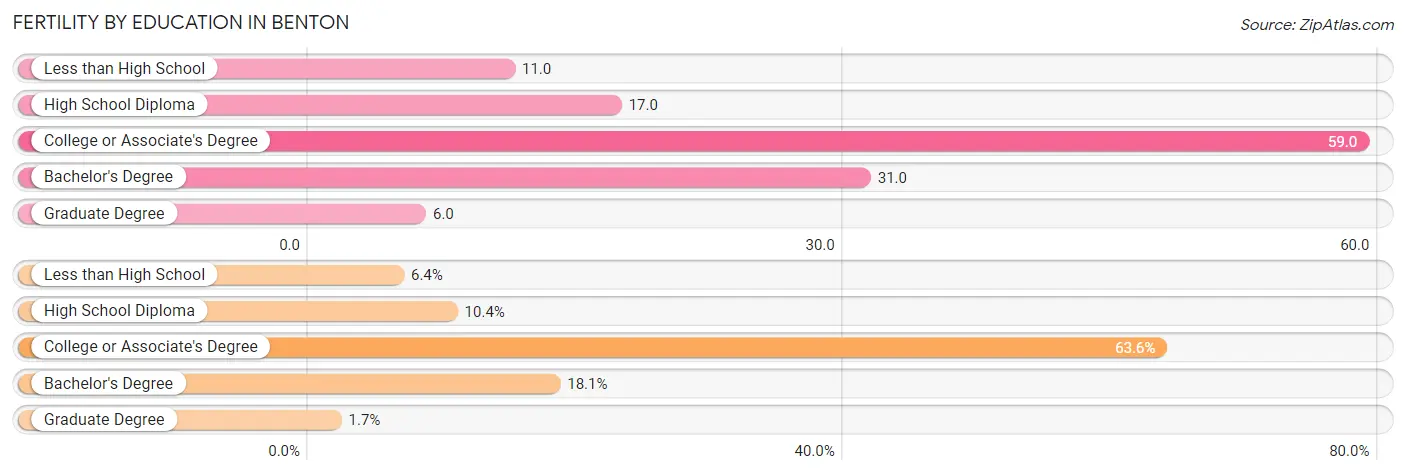
| Educational Attainment | Women with Births | Births / 1,000 Women |
| Less than High School | 19 (6.4%) | 11.0 |
| High School Diploma | 31 (10.4%) | 17.0 |
| College or Associate's Degree | 190 (63.5%) | 59.0 |
| Bachelor's Degree | 54 (18.1%) | 31.0 |
| Graduate Degree | 5 (1.7%) | 6.0 |
| Total | 299 (100.0%) | 32.0 |
Fertility by Education by Marriage Status in Benton
27.1% of women with births in Benton are unmarried. Women with the educational attainment of less than high school are most likely to be married with 100.0% of them married at childbirth, while women with the educational attainment of high school diploma are least likely to be married with 74.2% of them unmarried at childbirth.
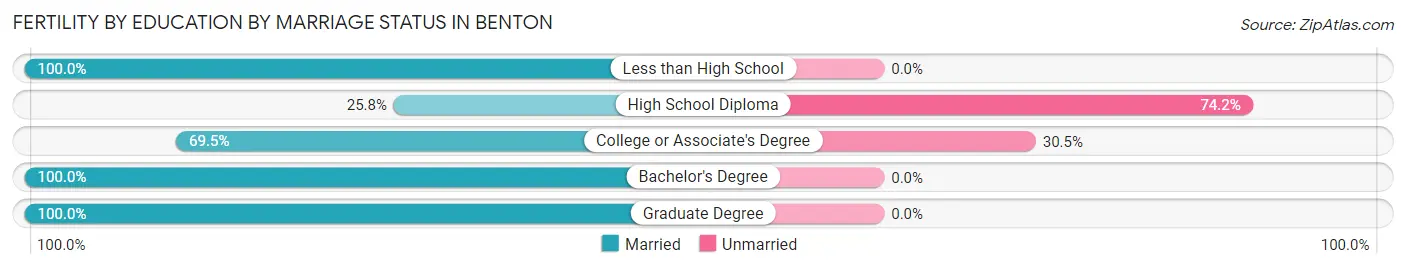
| Educational Attainment | Married | Unmarried |
| Less than High School | 19 (100.0%) | 0 (0.0%) |
| High School Diploma | 8 (25.8%) | 23 (74.2%) |
| College or Associate's Degree | 132 (69.5%) | 58 (30.5%) |
| Bachelor's Degree | 54 (100.0%) | 0 (0.0%) |
| Graduate Degree | 5 (100.0%) | 0 (0.0%) |
| Total | 218 (72.9%) | 81 (27.1%) |
Employment Characteristics in Benton
Employment by Class of Employer in Benton
Among the 17,388 employed individuals in Benton, private company employees (11,443 | 65.8%), not-for-profit organizations (1,400 | 8.1%), and state government employees (1,366 | 7.9%) make up the most common classes of employment.
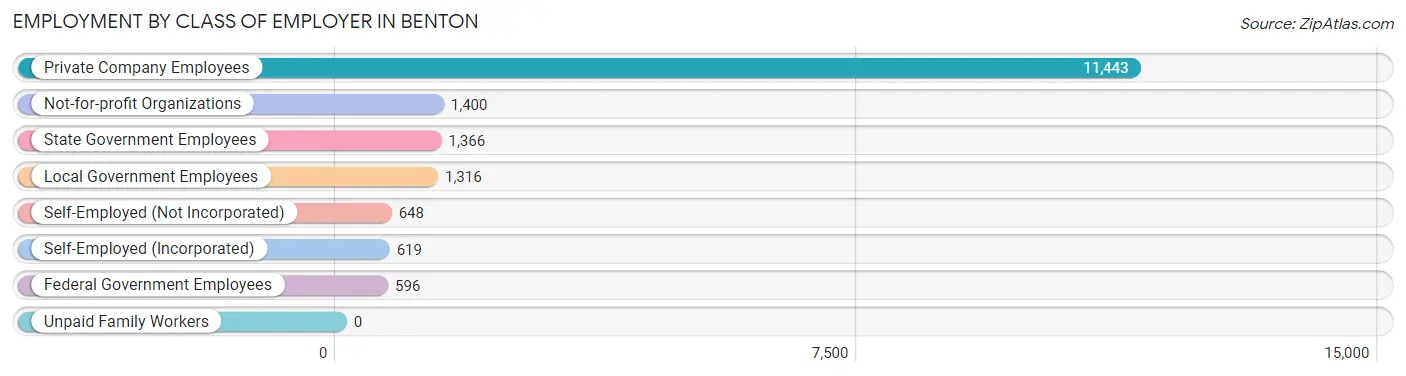
| Employer Class | # Employees | % Employees |
| Private Company Employees | 11,443 | 65.8% |
| Self-Employed (Incorporated) | 619 | 3.6% |
| Self-Employed (Not Incorporated) | 648 | 3.7% |
| Not-for-profit Organizations | 1,400 | 8.1% |
| Local Government Employees | 1,316 | 7.6% |
| State Government Employees | 1,366 | 7.9% |
| Federal Government Employees | 596 | 3.4% |
| Unpaid Family Workers | 0 | 0.0% |
| Total | 17,388 | 100.0% |
Employment Status by Age in Benton
According to the labor force statistics for Benton, out of the total population over 16 years of age (27,418), 66.6% or 18,260 individuals are in the labor force, with 3.8% or 694 of them unemployed. The age group with the highest labor force participation rate is 35 to 44 years, with 87.2% or 4,186 individuals in the labor force. Within the labor force, the 16 to 19 years age range has the highest percentage of unemployed individuals, with 9.5% or 70 of them being unemployed.
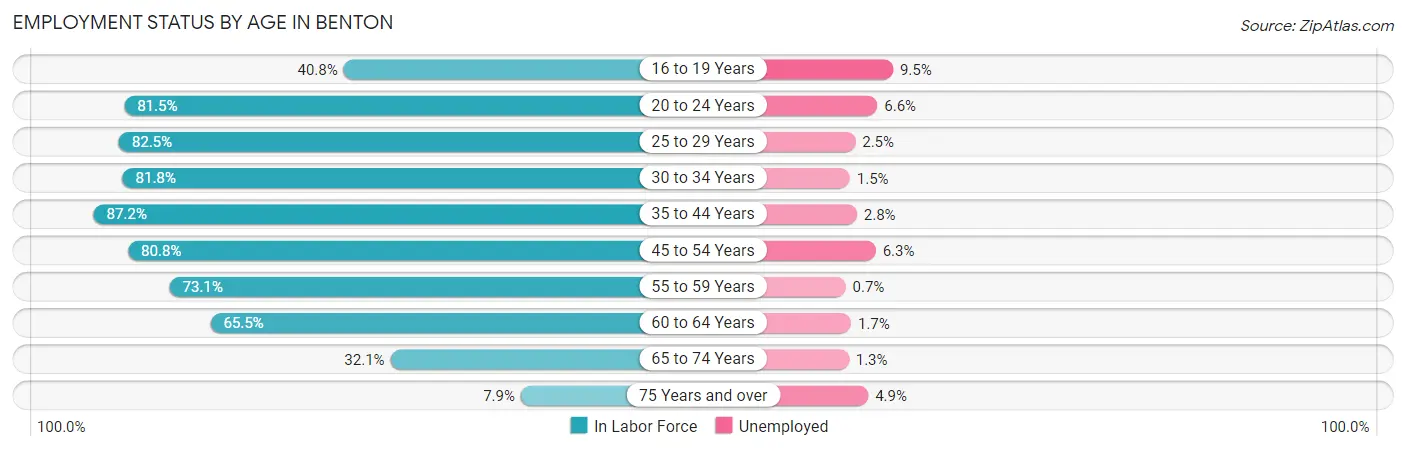
| Age Bracket | In Labor Force | Unemployed |
| 16 to 19 Years | 735 (40.8%) | 70 (9.5%) |
| 20 to 24 Years | 1,937 (81.5%) | 128 (6.6%) |
| 25 to 29 Years | 1,902 (82.5%) | 48 (2.5%) |
| 30 to 34 Years | 1,917 (81.8%) | 29 (1.5%) |
| 35 to 44 Years | 4,186 (87.2%) | 117 (2.8%) |
| 45 to 54 Years | 3,988 (80.8%) | 251 (6.3%) |
| 55 to 59 Years | 1,184 (73.1%) | 8 (0.7%) |
| 60 to 64 Years | 1,136 (65.5%) | 19 (1.7%) |
| 65 to 74 Years | 1,111 (32.1%) | 14 (1.3%) |
| 75 Years and over | 161 (7.9%) | 8 (4.9%) |
| Total | 18,260 (66.6%) | 694 (3.8%) |
Employment Status by Educational Attainment in Benton
According to labor force statistics for Benton, 80.7% of individuals (14,316) out of the total population between 25 and 64 years of age (17,740) are in the labor force, with 3.3% or 472 of them being unemployed. The group with the highest labor force participation rate are those with the educational attainment of bachelor's degree or higher, with 92.0% or 4,769 individuals in the labor force. Within the labor force, individuals with less than high school education have the highest percentage of unemployment, with 17.3% or 169 of them being unemployed.
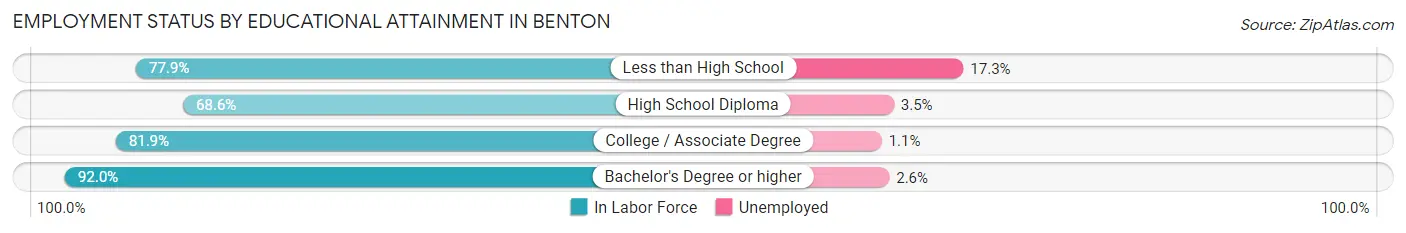
| Educational Attainment | In Labor Force | Unemployed |
| Less than High School | 975 (77.9%) | 217 (17.3%) |
| High School Diploma | 3,515 (68.6%) | 179 (3.5%) |
| College / Associate Degree | 5,061 (81.9%) | 68 (1.1%) |
| Bachelor's Degree or higher | 4,769 (92.0%) | 135 (2.6%) |
| Total | 14,316 (80.7%) | 585 (3.3%) |
Employment Occupations by Sex in Benton
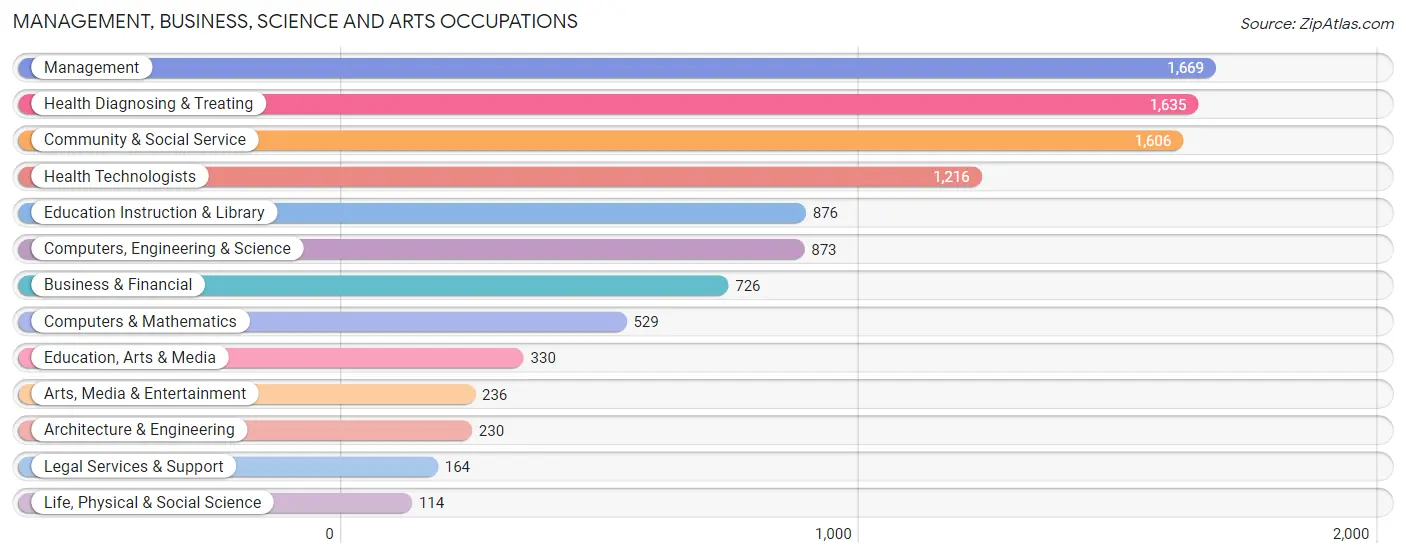
Management, Business, Science and Arts Occupations
The most common Management, Business, Science and Arts occupations in Benton are Management (1,669 | 9.5%), Health Diagnosing & Treating (1,635 | 9.3%), Community & Social Service (1,606 | 9.1%), Health Technologists (1,216 | 6.9%), and Education Instruction & Library (876 | 5.0%).
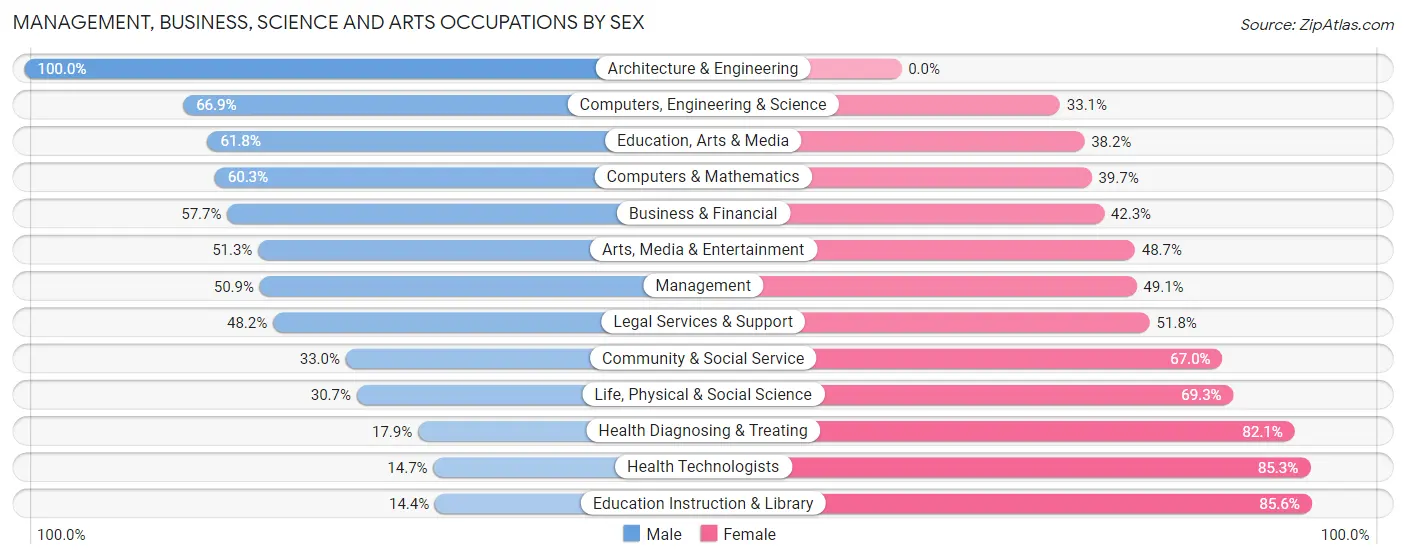
Management, Business, Science and Arts Occupations by Sex
Within the Management, Business, Science and Arts occupations in Benton, the most male-oriented occupations are Architecture & Engineering (100.0%), Computers, Engineering & Science (66.9%), and Education, Arts & Media (61.8%), while the most female-oriented occupations are Education Instruction & Library (85.6%), Health Technologists (85.3%), and Health Diagnosing & Treating (82.1%).
| Occupation | Male | Female |
| Management | 850 (50.9%) | 819 (49.1%) |
| Business & Financial | 419 (57.7%) | 307 (42.3%) |
| Computers, Engineering & Science | 584 (66.9%) | 289 (33.1%) |
| Computers & Mathematics | 319 (60.3%) | 210 (39.7%) |
| Architecture & Engineering | 230 (100.0%) | 0 (0.0%) |
| Life, Physical & Social Science | 35 (30.7%) | 79 (69.3%) |
| Community & Social Service | 530 (33.0%) | 1,076 (67.0%) |
| Education, Arts & Media | 204 (61.8%) | 126 (38.2%) |
| Legal Services & Support | 79 (48.2%) | 85 (51.8%) |
| Education Instruction & Library | 126 (14.4%) | 750 (85.6%) |
| Arts, Media & Entertainment | 121 (51.3%) | 115 (48.7%) |
| Health Diagnosing & Treating | 293 (17.9%) | 1,342 (82.1%) |
| Health Technologists | 179 (14.7%) | 1,037 (85.3%) |
| Total (Category) | 2,676 (41.1%) | 3,833 (58.9%) |
| Total (Overall) | 8,903 (50.7%) | 8,654 (49.3%) |
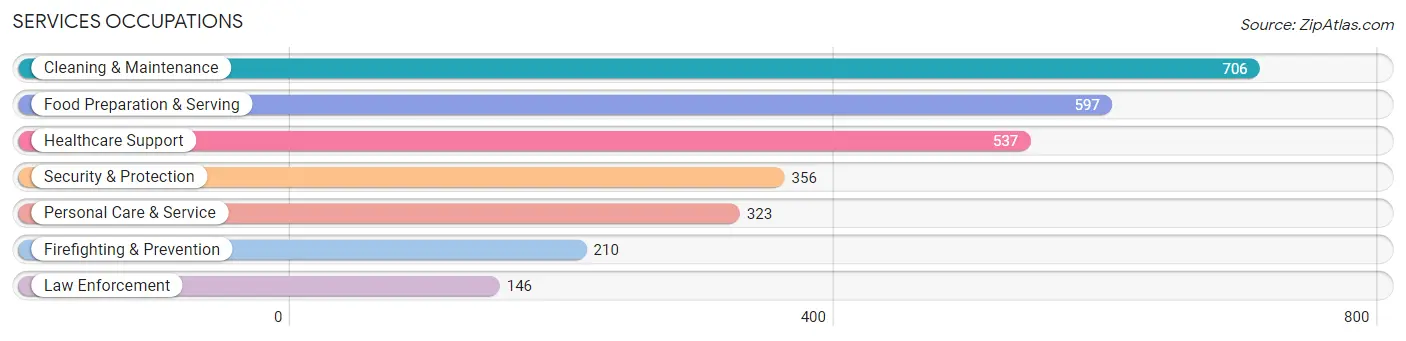
Services Occupations
The most common Services occupations in Benton are Cleaning & Maintenance (706 | 4.0%), Food Preparation & Serving (597 | 3.4%), Healthcare Support (537 | 3.1%), Security & Protection (356 | 2.0%), and Personal Care & Service (323 | 1.8%).
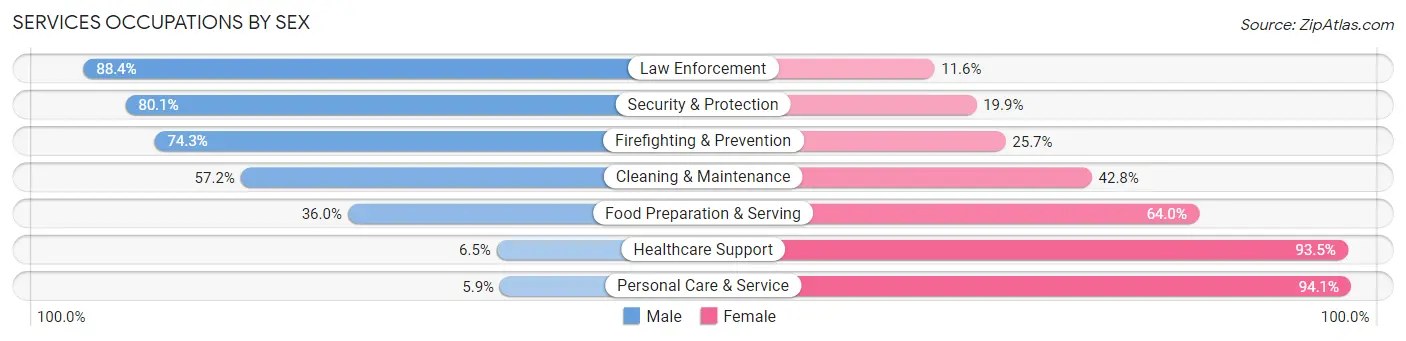
Services Occupations by Sex
Within the Services occupations in Benton, the most male-oriented occupations are Law Enforcement (88.4%), Security & Protection (80.1%), and Firefighting & Prevention (74.3%), while the most female-oriented occupations are Personal Care & Service (94.1%), Healthcare Support (93.5%), and Food Preparation & Serving (64.0%).
| Occupation | Male | Female |
| Healthcare Support | 35 (6.5%) | 502 (93.5%) |
| Security & Protection | 285 (80.1%) | 71 (19.9%) |
| Firefighting & Prevention | 156 (74.3%) | 54 (25.7%) |
| Law Enforcement | 129 (88.4%) | 17 (11.6%) |
| Food Preparation & Serving | 215 (36.0%) | 382 (64.0%) |
| Cleaning & Maintenance | 404 (57.2%) | 302 (42.8%) |
| Personal Care & Service | 19 (5.9%) | 304 (94.1%) |
| Total (Category) | 958 (38.0%) | 1,561 (62.0%) |
| Total (Overall) | 8,903 (50.7%) | 8,654 (49.3%) |
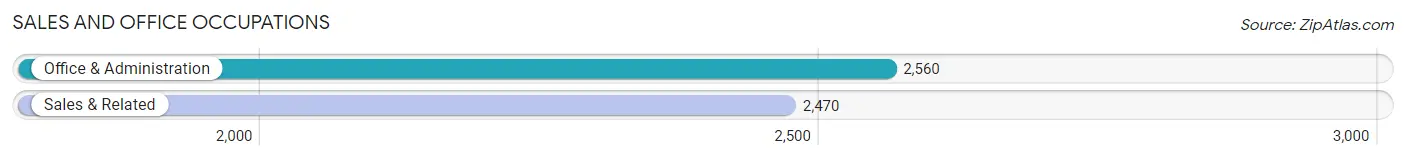
Sales and Office Occupations
The most common Sales and Office occupations in Benton are Office & Administration (2,560 | 14.6%), and Sales & Related (2,470 | 14.1%).
Sales and Office Occupations by Sex
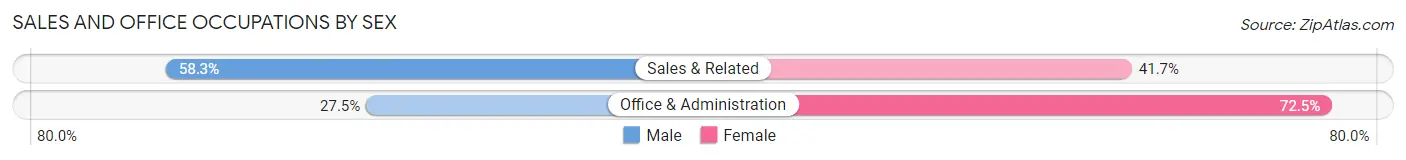
| Occupation | Male | Female |
| Sales & Related | 1,439 (58.3%) | 1,031 (41.7%) |
| Office & Administration | 703 (27.5%) | 1,857 (72.5%) |
| Total (Category) | 2,142 (42.6%) | 2,888 (57.4%) |
| Total (Overall) | 8,903 (50.7%) | 8,654 (49.3%) |
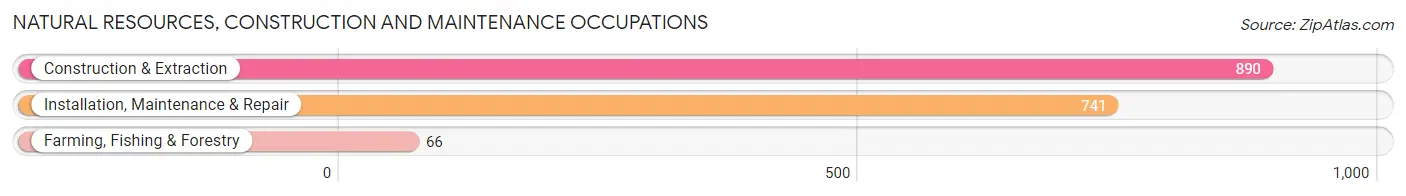
Natural Resources, Construction and Maintenance Occupations
The most common Natural Resources, Construction and Maintenance occupations in Benton are Construction & Extraction (890 | 5.1%), Installation, Maintenance & Repair (741 | 4.2%), and Farming, Fishing & Forestry (66 | 0.4%).
Natural Resources, Construction and Maintenance Occupations by Sex
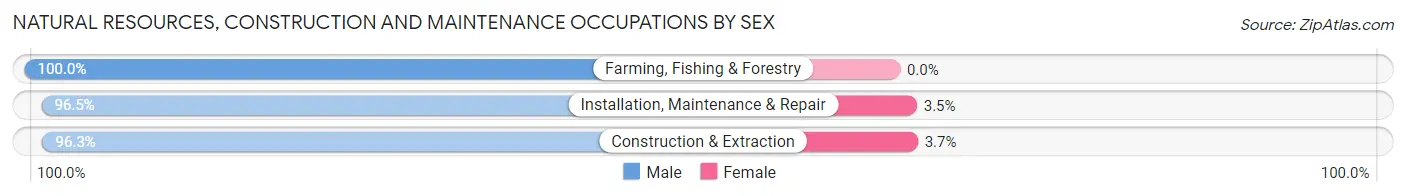
| Occupation | Male | Female |
| Farming, Fishing & Forestry | 66 (100.0%) | 0 (0.0%) |
| Construction & Extraction | 857 (96.3%) | 33 (3.7%) |
| Installation, Maintenance & Repair | 715 (96.5%) | 26 (3.5%) |
| Total (Category) | 1,638 (96.5%) | 59 (3.5%) |
| Total (Overall) | 8,903 (50.7%) | 8,654 (49.3%) |
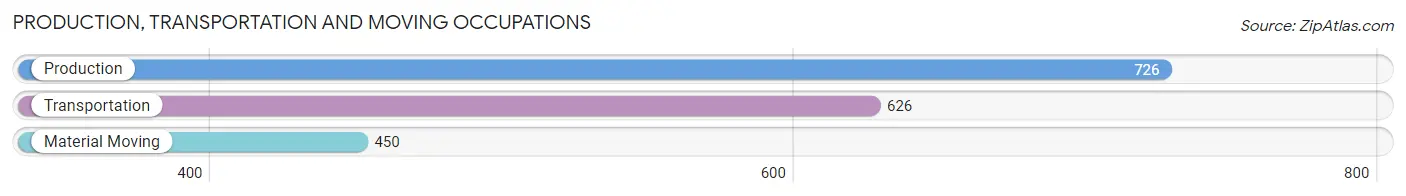
Production, Transportation and Moving Occupations
The most common Production, Transportation and Moving occupations in Benton are Production (726 | 4.1%), Transportation (626 | 3.6%), and Material Moving (450 | 2.6%).
Production, Transportation and Moving Occupations by Sex
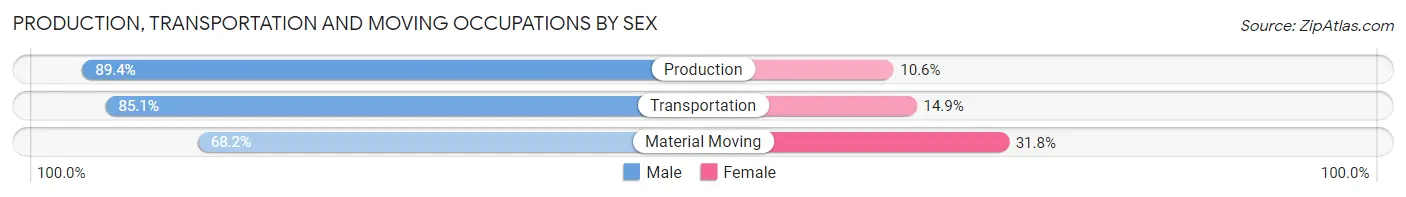
| Occupation | Male | Female |
| Production | 649 (89.4%) | 77 (10.6%) |
| Transportation | 533 (85.1%) | 93 (14.9%) |
| Material Moving | 307 (68.2%) | 143 (31.8%) |
| Total (Category) | 1,489 (82.6%) | 313 (17.4%) |
| Total (Overall) | 8,903 (50.7%) | 8,654 (49.3%) |
Employment Industries by Sex in Benton
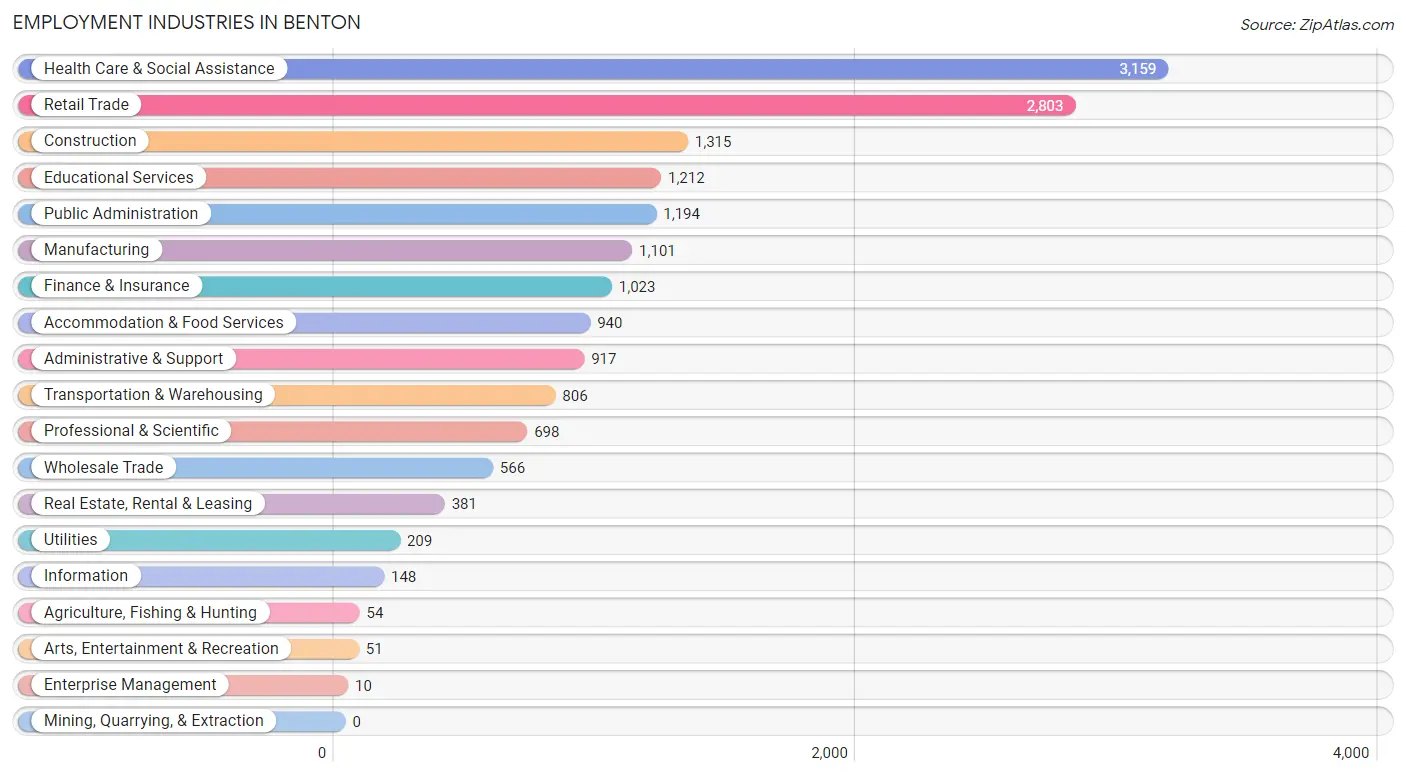
Employment Industries in Benton
The major employment industries in Benton include Health Care & Social Assistance (3,159 | 18.0%), Retail Trade (2,803 | 16.0%), Construction (1,315 | 7.5%), Educational Services (1,212 | 6.9%), and Public Administration (1,194 | 6.8%).
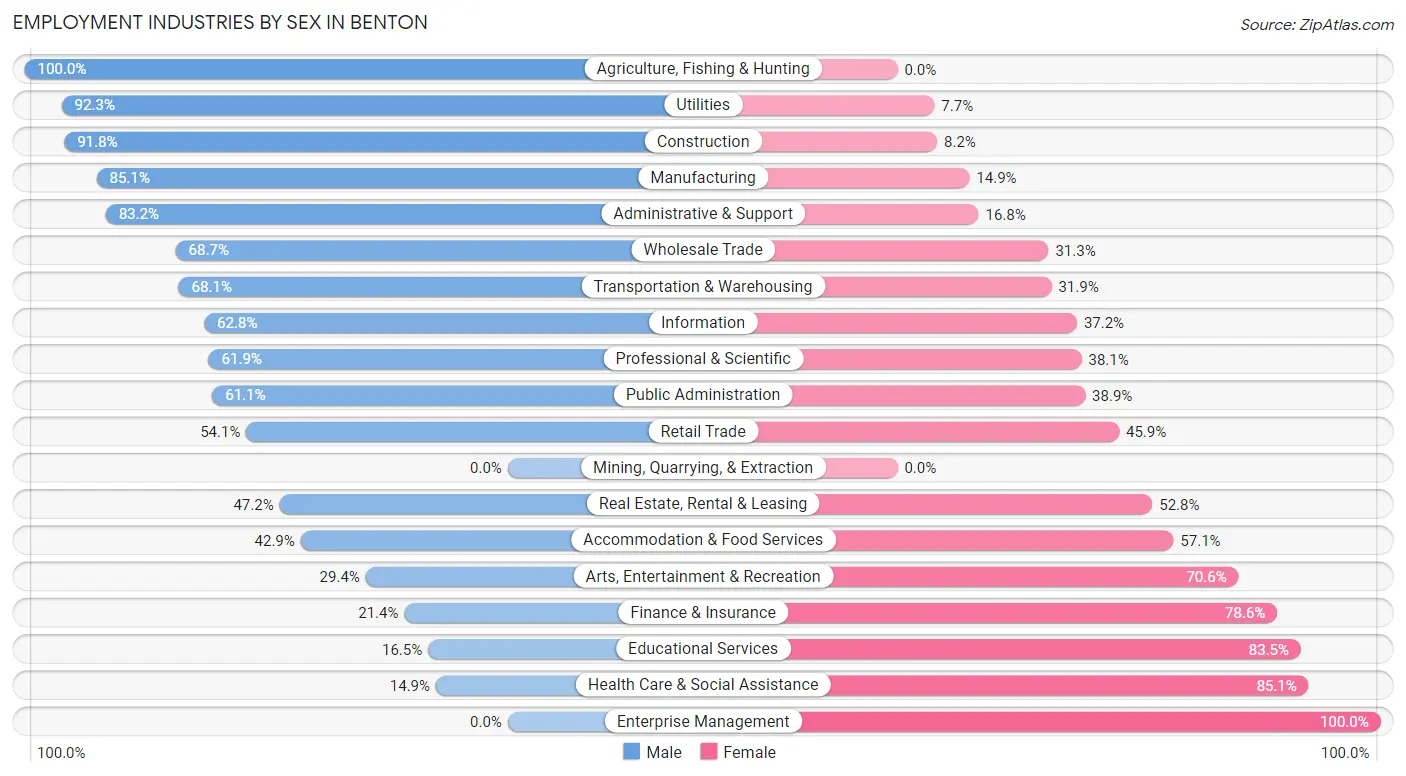
Employment Industries by Sex in Benton
The Benton industries that see more men than women are Agriculture, Fishing & Hunting (100.0%), Utilities (92.3%), and Construction (91.8%), whereas the industries that tend to have a higher number of women are Enterprise Management (100.0%), Health Care & Social Assistance (85.1%), and Educational Services (83.5%).
| Industry | Male | Female |
| Agriculture, Fishing & Hunting | 54 (100.0%) | 0 (0.0%) |
| Mining, Quarrying, & Extraction | 0 (0.0%) | 0 (0.0%) |
| Construction | 1,207 (91.8%) | 108 (8.2%) |
| Manufacturing | 937 (85.1%) | 164 (14.9%) |
| Wholesale Trade | 389 (68.7%) | 177 (31.3%) |
| Retail Trade | 1,517 (54.1%) | 1,286 (45.9%) |
| Transportation & Warehousing | 549 (68.1%) | 257 (31.9%) |
| Utilities | 193 (92.3%) | 16 (7.7%) |
| Information | 93 (62.8%) | 55 (37.2%) |
| Finance & Insurance | 219 (21.4%) | 804 (78.6%) |
| Real Estate, Rental & Leasing | 180 (47.2%) | 201 (52.8%) |
| Professional & Scientific | 432 (61.9%) | 266 (38.1%) |
| Enterprise Management | 0 (0.0%) | 10 (100.0%) |
| Administrative & Support | 763 (83.2%) | 154 (16.8%) |
| Educational Services | 200 (16.5%) | 1,012 (83.5%) |
| Health Care & Social Assistance | 470 (14.9%) | 2,689 (85.1%) |
| Arts, Entertainment & Recreation | 15 (29.4%) | 36 (70.6%) |
| Accommodation & Food Services | 403 (42.9%) | 537 (57.1%) |
| Public Administration | 730 (61.1%) | 464 (38.9%) |
| Total | 8,903 (50.7%) | 8,654 (49.3%) |
Education in Benton
School Enrollment in Benton
The most common levels of schooling among the 8,415 students in Benton are high school (2,205 | 26.2%), middle school (2,167 | 25.8%), and elementary school (1,704 | 20.3%).
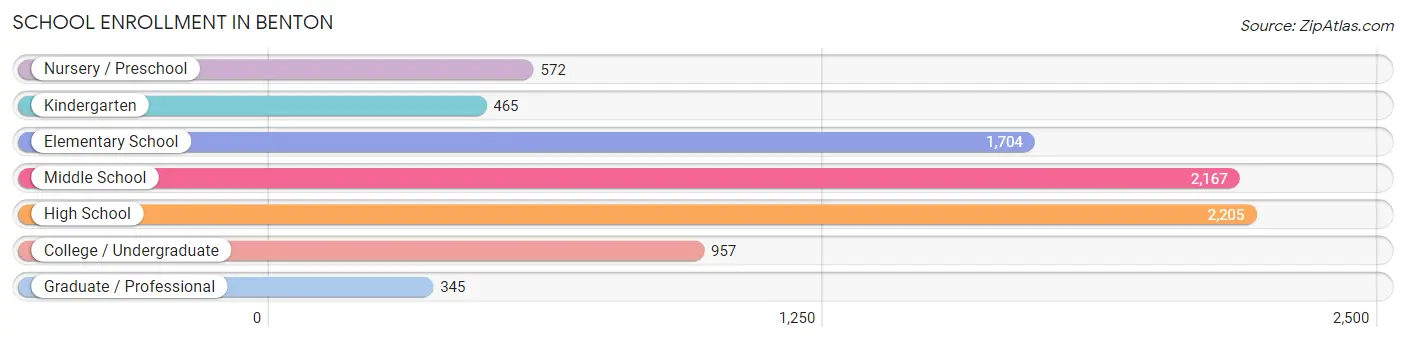
| School Level | # Students | % Students |
| Nursery / Preschool | 572 | 6.8% |
| Kindergarten | 465 | 5.5% |
| Elementary School | 1,704 | 20.3% |
| Middle School | 2,167 | 25.8% |
| High School | 2,205 | 26.2% |
| College / Undergraduate | 957 | 11.4% |
| Graduate / Professional | 345 | 4.1% |
| Total | 8,415 | 100.0% |
School Enrollment by Age by Funding Source in Benton
Out of a total of 8,415 students who are enrolled in schools in Benton, 623 (7.4%) attend a private institution, while the remaining 7,792 (92.6%) are enrolled in public schools. The age group of 3 to 4 year olds has the highest likelihood of being enrolled in private schools, with 104 (34.7% in the age bracket) enrolled. Conversely, the age group of 15 to 17 year olds has the lowest likelihood of being enrolled in a private school, with 1,603 (99.6% in the age bracket) attending a public institution.
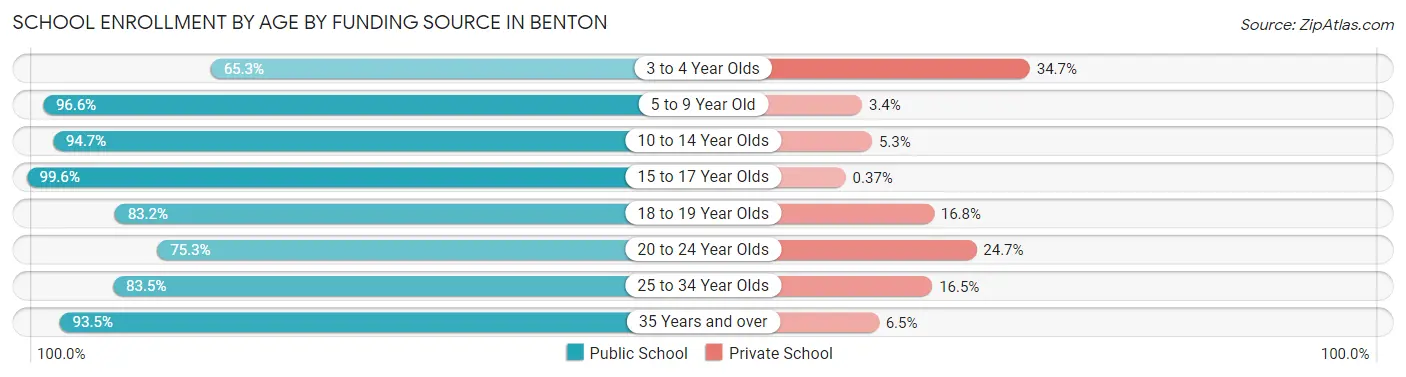
| Age Bracket | Public School | Private School |
| 3 to 4 Year Olds | 196 (65.3%) | 104 (34.7%) |
| 5 to 9 Year Old | 2,205 (96.6%) | 78 (3.4%) |
| 10 to 14 Year Olds | 2,338 (94.7%) | 130 (5.3%) |
| 15 to 17 Year Olds | 1,603 (99.6%) | 6 (0.4%) |
| 18 to 19 Year Olds | 446 (83.2%) | 90 (16.8%) |
| 20 to 24 Year Olds | 454 (75.3%) | 149 (24.7%) |
| 25 to 34 Year Olds | 233 (83.5%) | 46 (16.5%) |
| 35 Years and over | 315 (93.5%) | 22 (6.5%) |
| Total | 7,792 (92.6%) | 623 (7.4%) |
Educational Attainment by Field of Study in Benton
Business (1,830 | 27.2%), science & technology (1,251 | 18.6%), education (1,003 | 14.9%), arts & humanities (519 | 7.7%), and bio, nature & agricultural (420 | 6.2%) are the most common fields of study among 6,723 individuals in Benton who have obtained a bachelor's degree or higher.
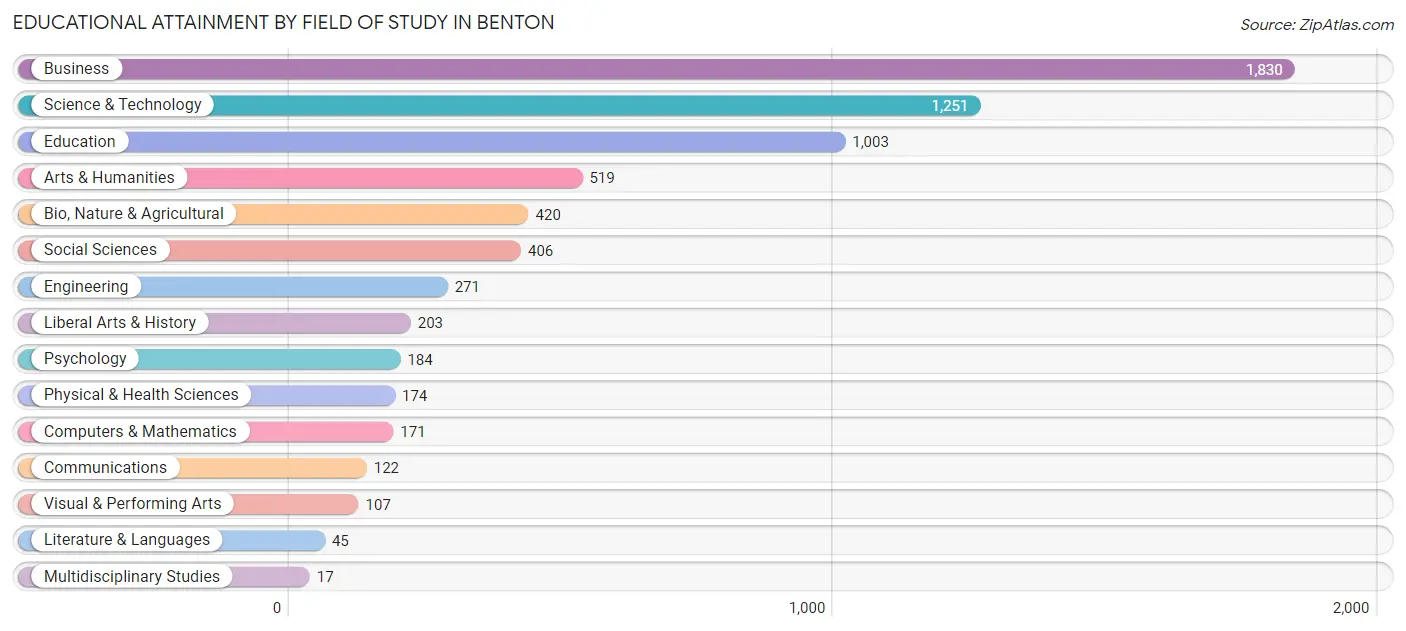
| Field of Study | # Graduates | % Graduates |
| Computers & Mathematics | 171 | 2.5% |
| Bio, Nature & Agricultural | 420 | 6.2% |
| Physical & Health Sciences | 174 | 2.6% |
| Psychology | 184 | 2.7% |
| Social Sciences | 406 | 6.0% |
| Engineering | 271 | 4.0% |
| Multidisciplinary Studies | 17 | 0.3% |
| Science & Technology | 1,251 | 18.6% |
| Business | 1,830 | 27.2% |
| Education | 1,003 | 14.9% |
| Literature & Languages | 45 | 0.7% |
| Liberal Arts & History | 203 | 3.0% |
| Visual & Performing Arts | 107 | 1.6% |
| Communications | 122 | 1.8% |
| Arts & Humanities | 519 | 7.7% |
| Total | 6,723 | 100.0% |
Transportation & Commute in Benton
Vehicle Availability by Sex in Benton
The most prevalent vehicle ownership categories in Benton are males with 2 vehicles (4,609, accounting for 52.1%) and females with 2 vehicles (3,902, making up 54.0%).
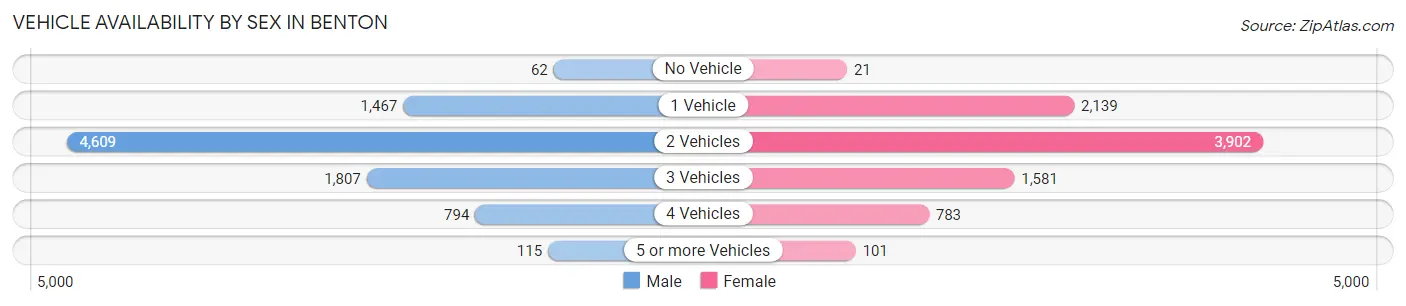
| Vehicles Available | Male | Female |
| No Vehicle | 62 (0.7%) | 21 (0.3%) |
| 1 Vehicle | 1,467 (16.6%) | 2,139 (25.1%) |
| 2 Vehicles | 4,609 (52.1%) | 3,902 (45.8%) |
| 3 Vehicles | 1,807 (20.4%) | 1,581 (18.5%) |
| 4 Vehicles | 794 (9.0%) | 783 (9.2%) |
| 5 or more Vehicles | 115 (1.3%) | 101 (1.2%) |
| Total | 8,854 (100.0%) | 8,527 (100.0%) |
Commute Time in Benton
The most frequently occuring commute durations in Benton are 30 to 34 minutes (3,393 commuters, 20.7%), 5 to 9 minutes (2,694 commuters, 16.4%), and 10 to 14 minutes (2,438 commuters, 14.9%).
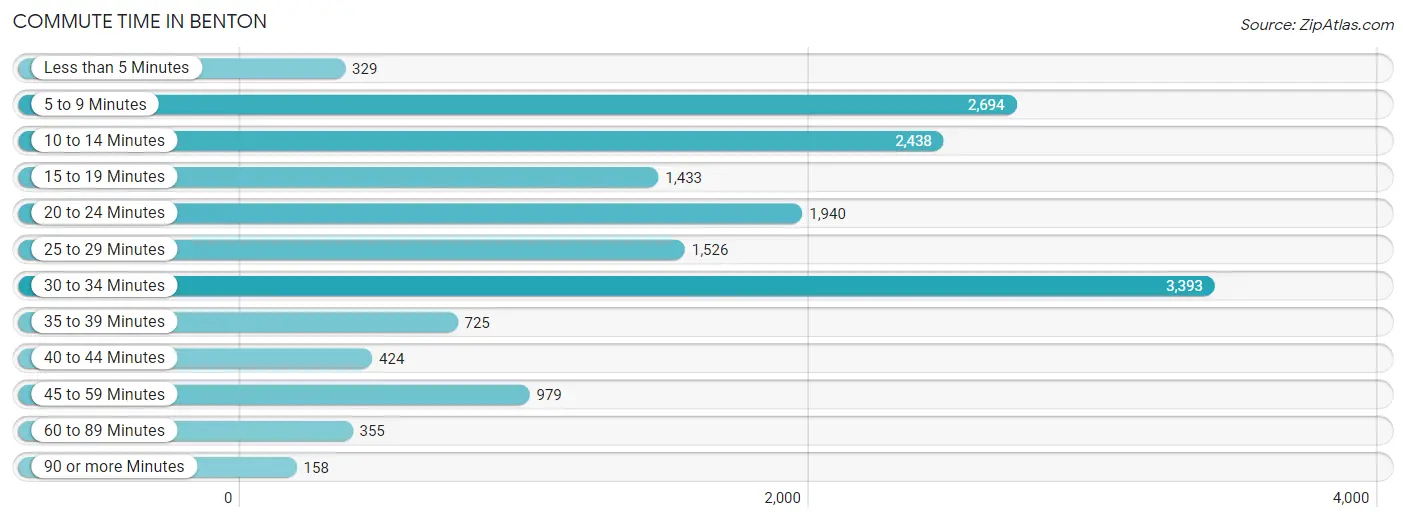
| Commute Time | # Commuters | % Commuters |
| Less than 5 Minutes | 329 | 2.0% |
| 5 to 9 Minutes | 2,694 | 16.4% |
| 10 to 14 Minutes | 2,438 | 14.9% |
| 15 to 19 Minutes | 1,433 | 8.7% |
| 20 to 24 Minutes | 1,940 | 11.8% |
| 25 to 29 Minutes | 1,526 | 9.3% |
| 30 to 34 Minutes | 3,393 | 20.7% |
| 35 to 39 Minutes | 725 | 4.4% |
| 40 to 44 Minutes | 424 | 2.6% |
| 45 to 59 Minutes | 979 | 6.0% |
| 60 to 89 Minutes | 355 | 2.2% |
| 90 or more Minutes | 158 | 1.0% |
Commute Time by Sex in Benton
The most common commute times in Benton are 30 to 34 minutes (1,868 commuters, 22.5%) for males and 5 to 9 minutes (1,536 commuters, 19.0%) for females.
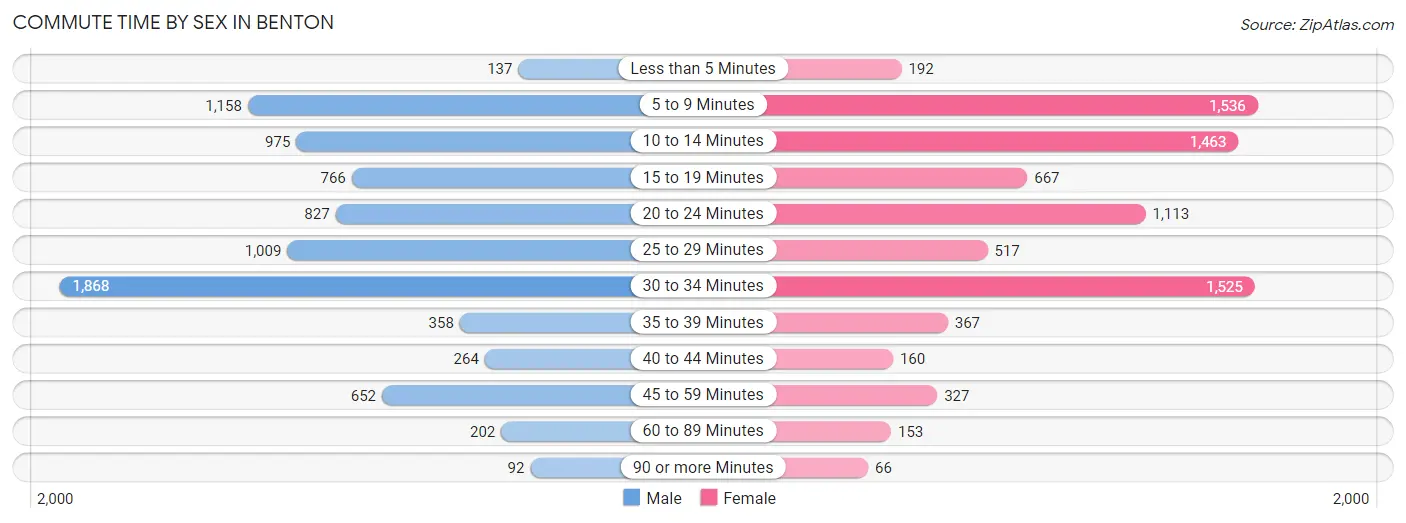
| Commute Time | Male | Female |
| Less than 5 Minutes | 137 (1.7%) | 192 (2.4%) |
| 5 to 9 Minutes | 1,158 (13.9%) | 1,536 (19.0%) |
| 10 to 14 Minutes | 975 (11.7%) | 1,463 (18.1%) |
| 15 to 19 Minutes | 766 (9.2%) | 667 (8.3%) |
| 20 to 24 Minutes | 827 (10.0%) | 1,113 (13.8%) |
| 25 to 29 Minutes | 1,009 (12.1%) | 517 (6.4%) |
| 30 to 34 Minutes | 1,868 (22.5%) | 1,525 (18.9%) |
| 35 to 39 Minutes | 358 (4.3%) | 367 (4.5%) |
| 40 to 44 Minutes | 264 (3.2%) | 160 (2.0%) |
| 45 to 59 Minutes | 652 (7.9%) | 327 (4.0%) |
| 60 to 89 Minutes | 202 (2.4%) | 153 (1.9%) |
| 90 or more Minutes | 92 (1.1%) | 66 (0.8%) |
Time of Departure to Work by Sex in Benton
The most frequent times of departure to work in Benton are 6:30 AM to 6:59 AM (1,546, 18.6%) for males and 7:00 AM to 7:29 AM (1,867, 23.1%) for females.
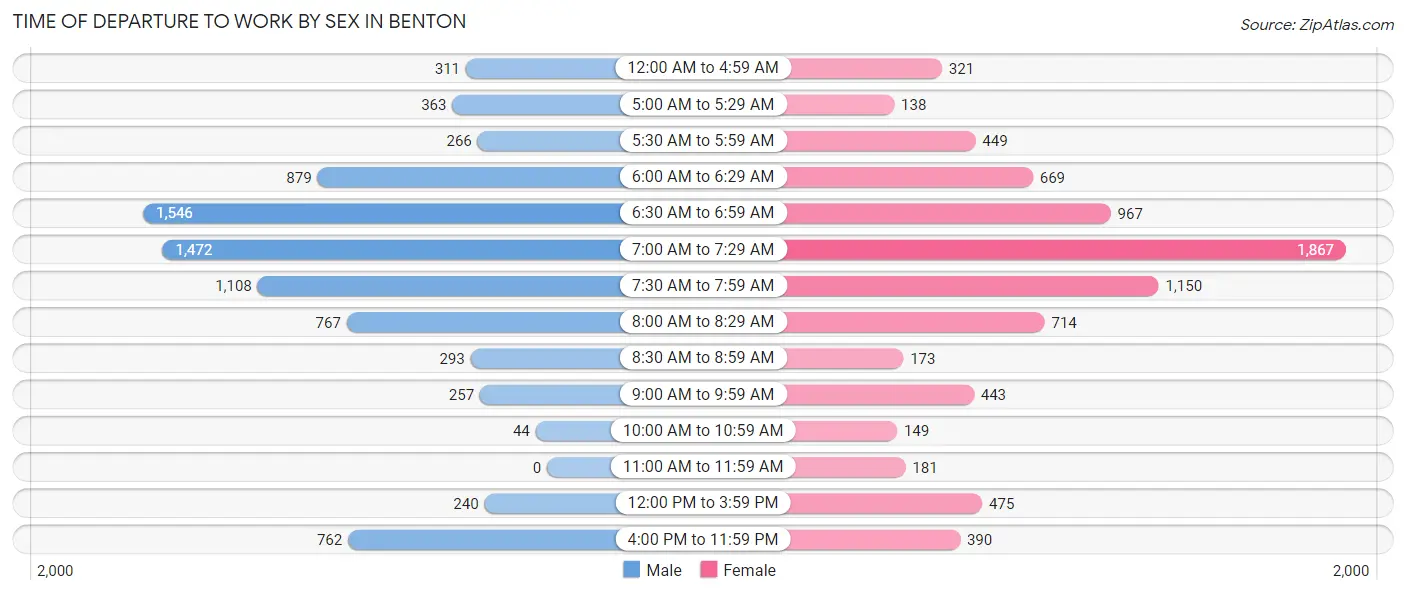
| Time of Departure | Male | Female |
| 12:00 AM to 4:59 AM | 311 (3.7%) | 321 (4.0%) |
| 5:00 AM to 5:29 AM | 363 (4.4%) | 138 (1.7%) |
| 5:30 AM to 5:59 AM | 266 (3.2%) | 449 (5.6%) |
| 6:00 AM to 6:29 AM | 879 (10.6%) | 669 (8.3%) |
| 6:30 AM to 6:59 AM | 1,546 (18.6%) | 967 (12.0%) |
| 7:00 AM to 7:29 AM | 1,472 (17.7%) | 1,867 (23.1%) |
| 7:30 AM to 7:59 AM | 1,108 (13.3%) | 1,150 (14.2%) |
| 8:00 AM to 8:29 AM | 767 (9.2%) | 714 (8.8%) |
| 8:30 AM to 8:59 AM | 293 (3.5%) | 173 (2.1%) |
| 9:00 AM to 9:59 AM | 257 (3.1%) | 443 (5.5%) |
| 10:00 AM to 10:59 AM | 44 (0.5%) | 149 (1.8%) |
| 11:00 AM to 11:59 AM | 0 (0.0%) | 181 (2.2%) |
| 12:00 PM to 3:59 PM | 240 (2.9%) | 475 (5.9%) |
| 4:00 PM to 11:59 PM | 762 (9.2%) | 390 (4.8%) |
| Total | 8,308 (100.0%) | 8,086 (100.0%) |
Housing Occupancy in Benton
Occupancy by Ownership in Benton
Of the total 14,350 dwellings in Benton, owner-occupied units account for 9,452 (65.9%), while renter-occupied units make up 4,898 (34.1%).
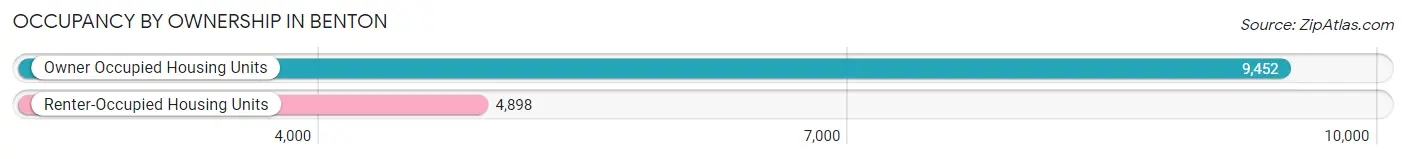
| Occupancy | # Housing Units | % Housing Units |
| Owner Occupied Housing Units | 9,452 | 65.9% |
| Renter-Occupied Housing Units | 4,898 | 34.1% |
| Total Occupied Housing Units | 14,350 | 100.0% |
Occupancy by Household Size in Benton
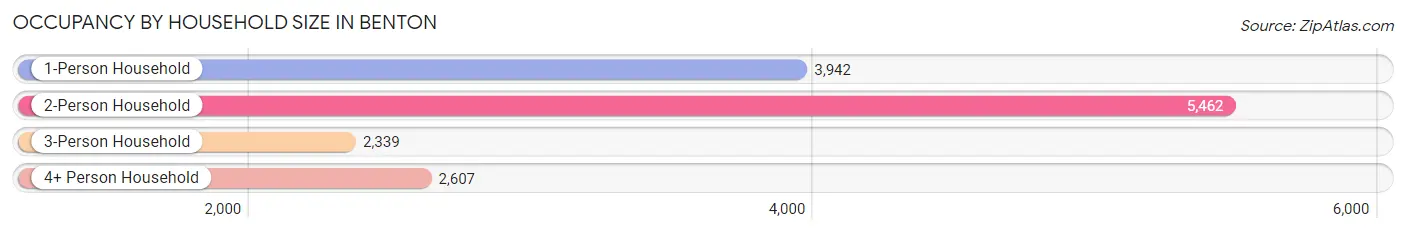
| Household Size | # Housing Units | % Housing Units |
| 1-Person Household | 3,942 | 27.5% |
| 2-Person Household | 5,462 | 38.1% |
| 3-Person Household | 2,339 | 16.3% |
| 4+ Person Household | 2,607 | 18.2% |
| Total Housing Units | 14,350 | 100.0% |
Occupancy by Ownership by Household Size in Benton
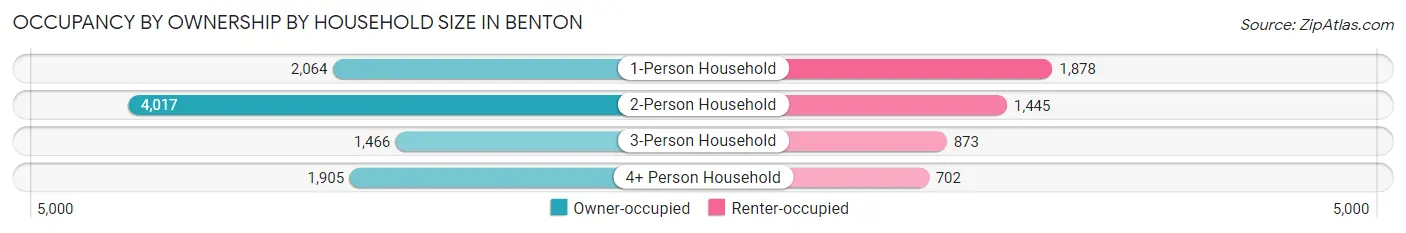
| Household Size | Owner-occupied | Renter-occupied |
| 1-Person Household | 2,064 (52.4%) | 1,878 (47.6%) |
| 2-Person Household | 4,017 (73.5%) | 1,445 (26.5%) |
| 3-Person Household | 1,466 (62.7%) | 873 (37.3%) |
| 4+ Person Household | 1,905 (73.1%) | 702 (26.9%) |
| Total Housing Units | 9,452 (65.9%) | 4,898 (34.1%) |
Occupancy by Educational Attainment in Benton
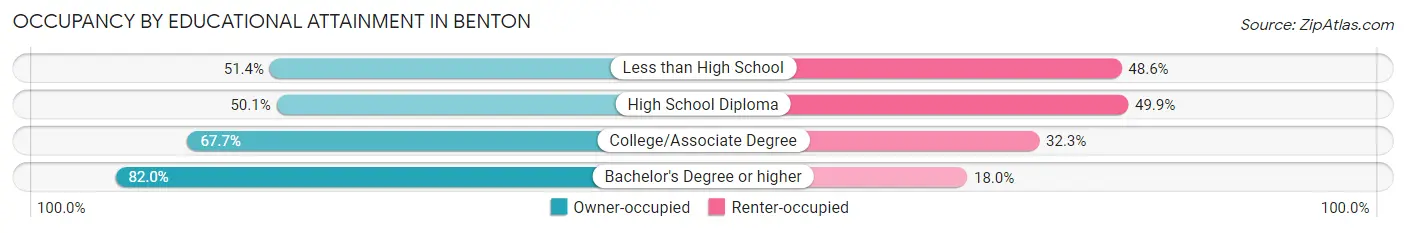
| Household Size | Owner-occupied | Renter-occupied |
| Less than High School | 464 (51.4%) | 439 (48.6%) |
| High School Diploma | 1,938 (50.1%) | 1,933 (49.9%) |
| College/Associate Degree | 3,793 (67.7%) | 1,810 (32.3%) |
| Bachelor's Degree or higher | 3,257 (82.0%) | 716 (18.0%) |
Occupancy by Age of Householder in Benton
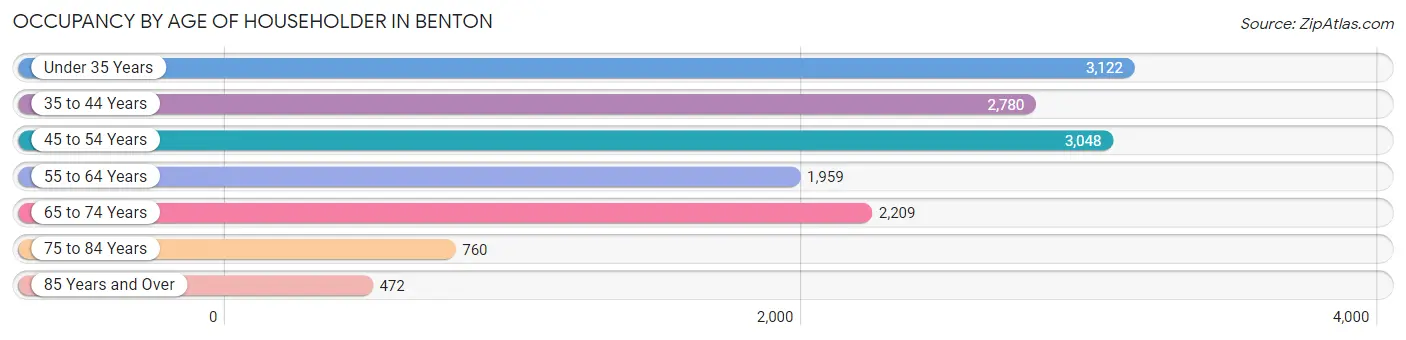
| Age Bracket | # Households | % Households |
| Under 35 Years | 3,122 | 21.8% |
| 35 to 44 Years | 2,780 | 19.4% |
| 45 to 54 Years | 3,048 | 21.2% |
| 55 to 64 Years | 1,959 | 13.7% |
| 65 to 74 Years | 2,209 | 15.4% |
| 75 to 84 Years | 760 | 5.3% |
| 85 Years and Over | 472 | 3.3% |
| Total | 14,350 | 100.0% |
Housing Finances in Benton
Median Income by Occupancy in Benton
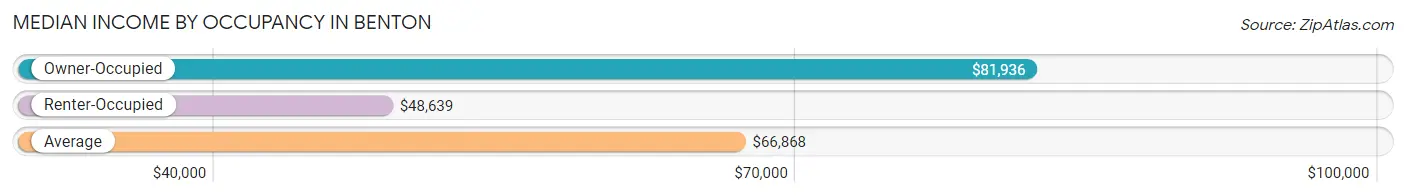
| Occupancy Type | # Households | Median Income |
| Owner-Occupied | 9,452 (65.9%) | $81,936 |
| Renter-Occupied | 4,898 (34.1%) | $48,639 |
| Average | 14,350 (100.0%) | $66,868 |
Occupancy by Householder Income Bracket in Benton
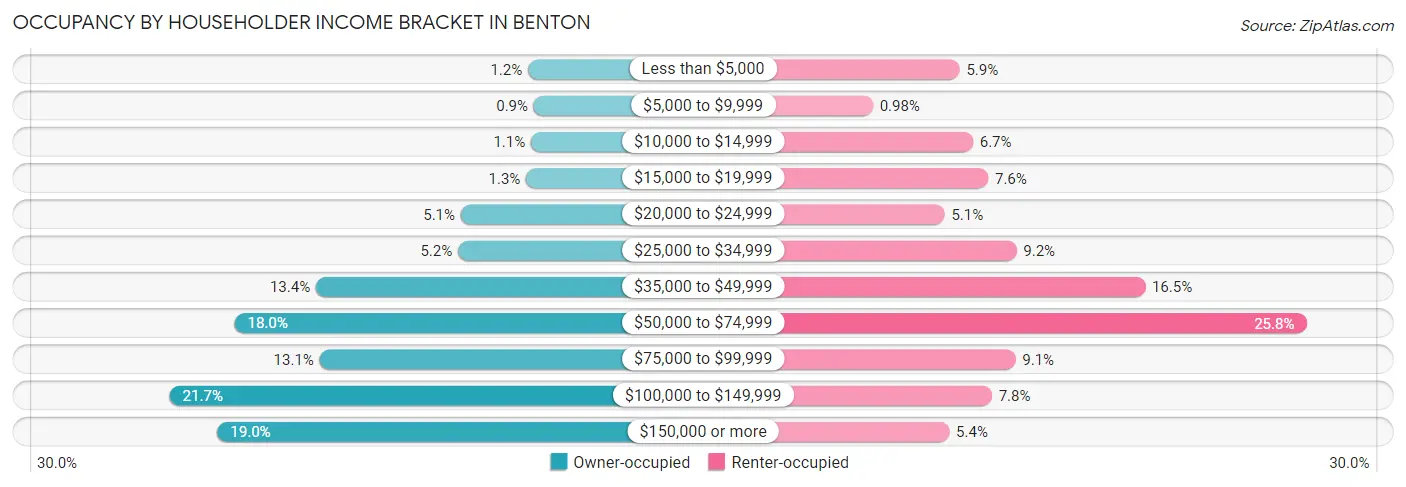
| Income Bracket | Owner-occupied | Renter-occupied |
| Less than $5,000 | 116 (1.2%) | 291 (5.9%) |
| $5,000 to $9,999 | 85 (0.9%) | 48 (1.0%) |
| $10,000 to $14,999 | 100 (1.1%) | 328 (6.7%) |
| $15,000 to $19,999 | 127 (1.3%) | 371 (7.6%) |
| $20,000 to $24,999 | 479 (5.1%) | 249 (5.1%) |
| $25,000 to $34,999 | 494 (5.2%) | 450 (9.2%) |
| $35,000 to $49,999 | 1,262 (13.4%) | 810 (16.5%) |
| $50,000 to $74,999 | 1,701 (18.0%) | 1,261 (25.8%) |
| $75,000 to $99,999 | 1,242 (13.1%) | 447 (9.1%) |
| $100,000 to $149,999 | 2,052 (21.7%) | 381 (7.8%) |
| $150,000 or more | 1,794 (19.0%) | 262 (5.3%) |
| Total | 9,452 (100.0%) | 4,898 (100.0%) |
Monthly Housing Cost Tiers in Benton
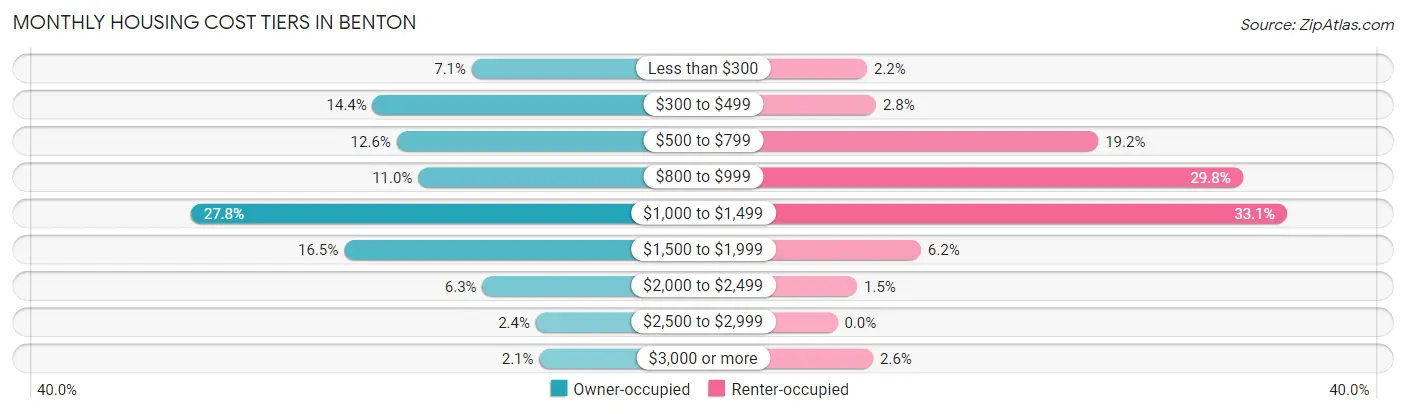
| Monthly Cost | Owner-occupied | Renter-occupied |
| Less than $300 | 667 (7.1%) | 107 (2.2%) |
| $300 to $499 | 1,358 (14.4%) | 139 (2.8%) |
| $500 to $799 | 1,191 (12.6%) | 941 (19.2%) |
| $800 to $999 | 1,041 (11.0%) | 1,461 (29.8%) |
| $1,000 to $1,499 | 2,624 (27.8%) | 1,620 (33.1%) |
| $1,500 to $1,999 | 1,557 (16.5%) | 301 (6.1%) |
| $2,000 to $2,499 | 594 (6.3%) | 71 (1.5%) |
| $2,500 to $2,999 | 222 (2.4%) | 0 (0.0%) |
| $3,000 or more | 198 (2.1%) | 129 (2.6%) |
| Total | 9,452 (100.0%) | 4,898 (100.0%) |
Physical Housing Characteristics in Benton
Housing Structures in Benton
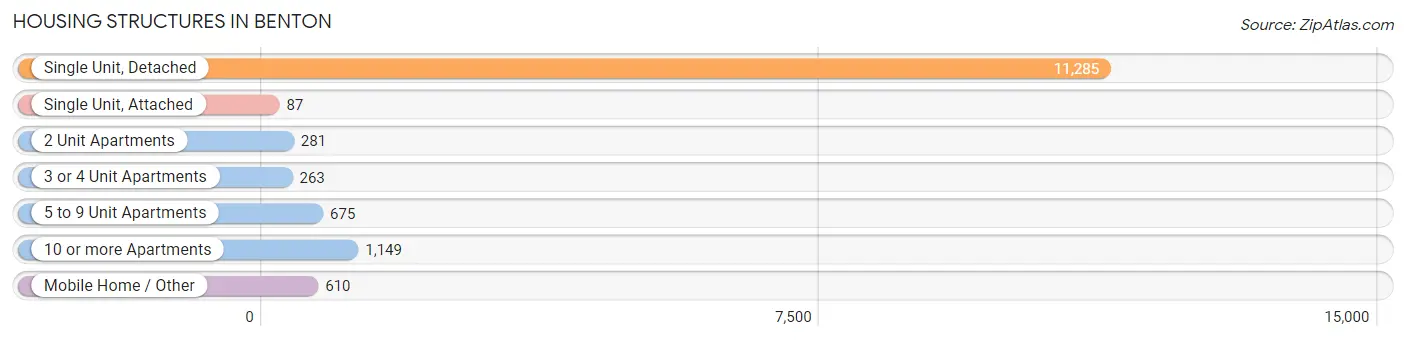
| Structure Type | # Housing Units | % Housing Units |
| Single Unit, Detached | 11,285 | 78.6% |
| Single Unit, Attached | 87 | 0.6% |
| 2 Unit Apartments | 281 | 2.0% |
| 3 or 4 Unit Apartments | 263 | 1.8% |
| 5 to 9 Unit Apartments | 675 | 4.7% |
| 10 or more Apartments | 1,149 | 8.0% |
| Mobile Home / Other | 610 | 4.3% |
| Total | 14,350 | 100.0% |
Housing Structures by Occupancy in Benton
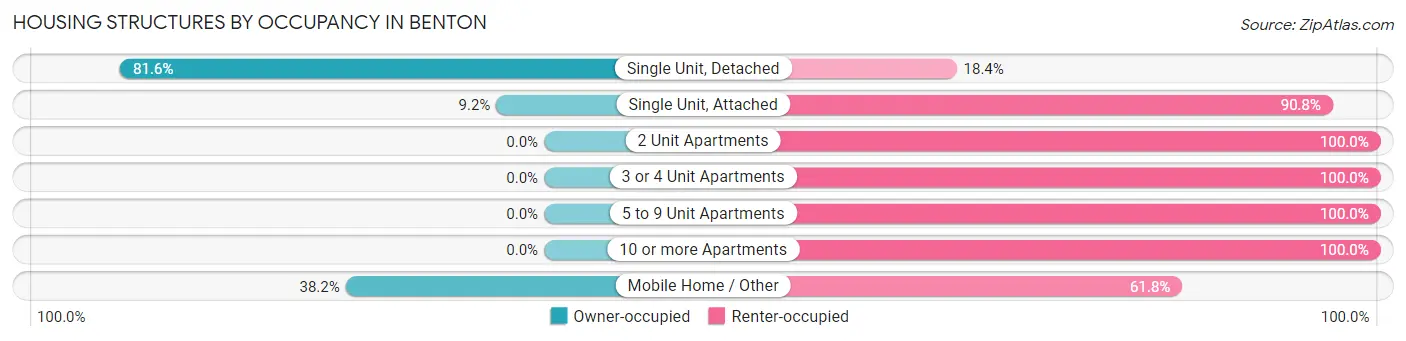
| Structure Type | Owner-occupied | Renter-occupied |
| Single Unit, Detached | 9,211 (81.6%) | 2,074 (18.4%) |
| Single Unit, Attached | 8 (9.2%) | 79 (90.8%) |
| 2 Unit Apartments | 0 (0.0%) | 281 (100.0%) |
| 3 or 4 Unit Apartments | 0 (0.0%) | 263 (100.0%) |
| 5 to 9 Unit Apartments | 0 (0.0%) | 675 (100.0%) |
| 10 or more Apartments | 0 (0.0%) | 1,149 (100.0%) |
| Mobile Home / Other | 233 (38.2%) | 377 (61.8%) |
| Total | 9,452 (65.9%) | 4,898 (34.1%) |
Housing Structures by Number of Rooms in Benton
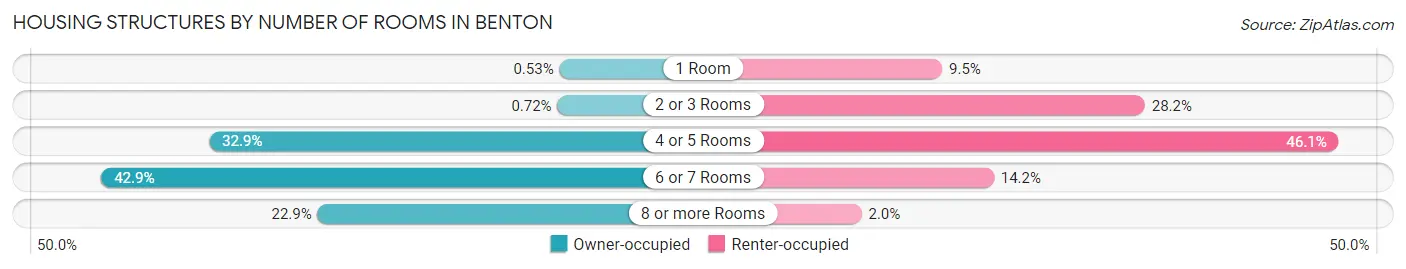
| Number of Rooms | Owner-occupied | Renter-occupied |
| 1 Room | 50 (0.5%) | 463 (9.5%) |
| 2 or 3 Rooms | 68 (0.7%) | 1,381 (28.2%) |
| 4 or 5 Rooms | 3,113 (32.9%) | 2,259 (46.1%) |
| 6 or 7 Rooms | 4,056 (42.9%) | 697 (14.2%) |
| 8 or more Rooms | 2,165 (22.9%) | 98 (2.0%) |
| Total | 9,452 (100.0%) | 4,898 (100.0%) |
Housing Structure by Heating Type in Benton
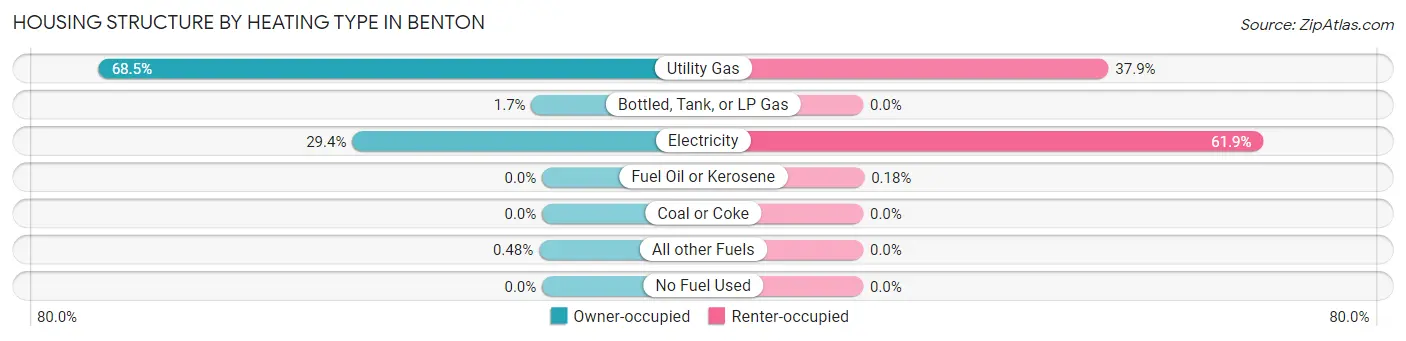
| Heating Type | Owner-occupied | Renter-occupied |
| Utility Gas | 6,477 (68.5%) | 1,858 (37.9%) |
| Bottled, Tank, or LP Gas | 156 (1.7%) | 0 (0.0%) |
| Electricity | 2,774 (29.3%) | 3,031 (61.9%) |
| Fuel Oil or Kerosene | 0 (0.0%) | 9 (0.2%) |
| Coal or Coke | 0 (0.0%) | 0 (0.0%) |
| All other Fuels | 45 (0.5%) | 0 (0.0%) |
| No Fuel Used | 0 (0.0%) | 0 (0.0%) |
| Total | 9,452 (100.0%) | 4,898 (100.0%) |
Household Vehicle Usage in Benton
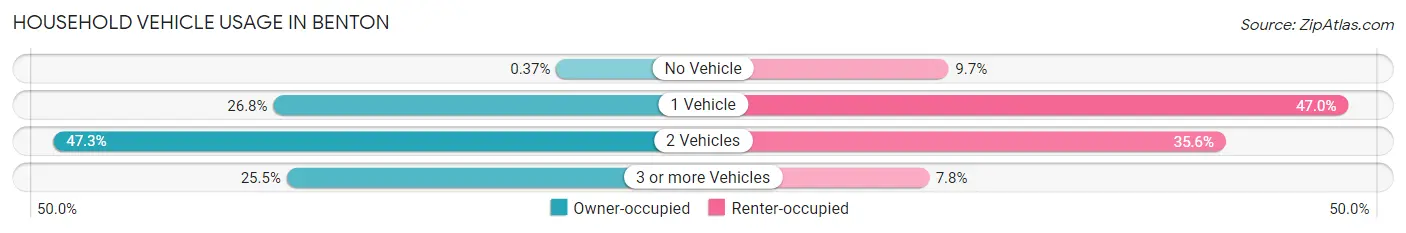
| Vehicles per Household | Owner-occupied | Renter-occupied |
| No Vehicle | 35 (0.4%) | 473 (9.7%) |
| 1 Vehicle | 2,531 (26.8%) | 2,301 (47.0%) |
| 2 Vehicles | 4,473 (47.3%) | 1,741 (35.5%) |
| 3 or more Vehicles | 2,413 (25.5%) | 383 (7.8%) |
| Total | 9,452 (100.0%) | 4,898 (100.0%) |
Real Estate & Mortgages in Benton
Real Estate and Mortgage Overview in Benton
| Characteristic | Without Mortgage | With Mortgage |
| Housing Units | 2,886 | 6,566 |
| Median Property Value | $155,300 | $195,900 |
| Median Household Income | $63,841 | $1,440 |
| Monthly Housing Costs | $430 | $198 |
| Real Estate Taxes | $1,006 | $226 |
Property Value by Mortgage Status in Benton
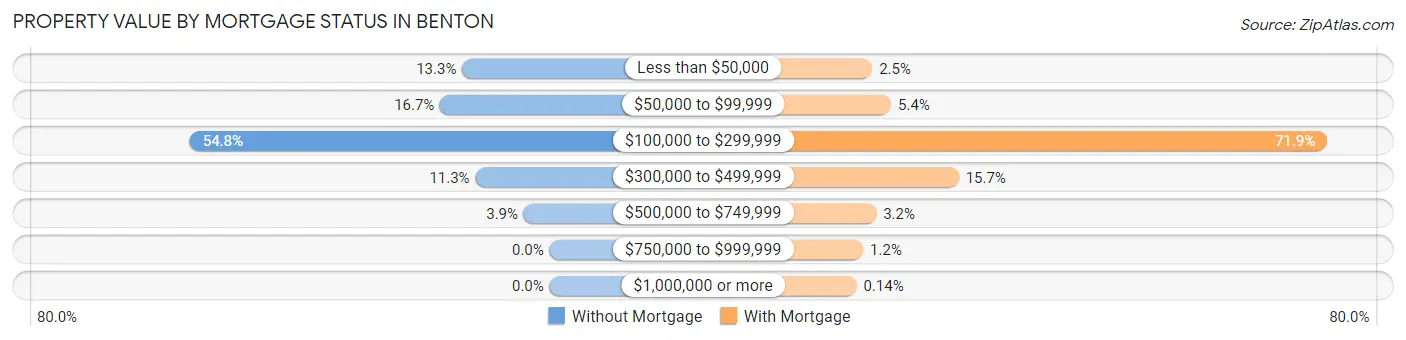
| Property Value | Without Mortgage | With Mortgage |
| Less than $50,000 | 384 (13.3%) | 167 (2.5%) |
| $50,000 to $99,999 | 481 (16.7%) | 356 (5.4%) |
| $100,000 to $299,999 | 1,582 (54.8%) | 4,719 (71.9%) |
| $300,000 to $499,999 | 326 (11.3%) | 1,032 (15.7%) |
| $500,000 to $749,999 | 113 (3.9%) | 207 (3.2%) |
| $750,000 to $999,999 | 0 (0.0%) | 76 (1.2%) |
| $1,000,000 or more | 0 (0.0%) | 9 (0.1%) |
| Total | 2,886 (100.0%) | 6,566 (100.0%) |
Household Income by Mortgage Status in Benton
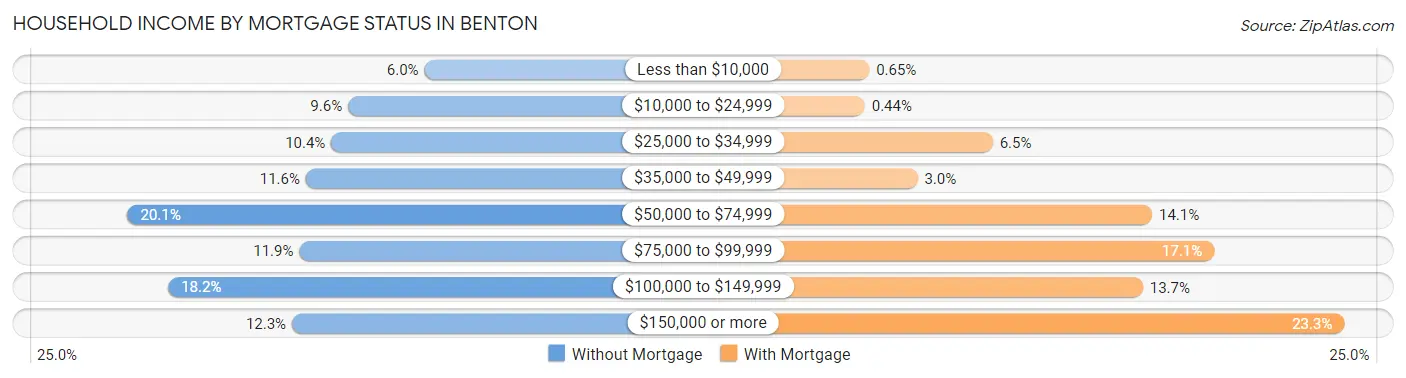
| Household Income | Without Mortgage | With Mortgage |
| Less than $10,000 | 172 (6.0%) | 43 (0.6%) |
| $10,000 to $24,999 | 277 (9.6%) | 29 (0.4%) |
| $25,000 to $34,999 | 300 (10.4%) | 429 (6.5%) |
| $35,000 to $49,999 | 335 (11.6%) | 194 (2.9%) |
| $50,000 to $74,999 | 580 (20.1%) | 927 (14.1%) |
| $75,000 to $99,999 | 344 (11.9%) | 1,121 (17.1%) |
| $100,000 to $149,999 | 524 (18.2%) | 898 (13.7%) |
| $150,000 or more | 354 (12.3%) | 1,528 (23.3%) |
| Total | 2,886 (100.0%) | 6,566 (100.0%) |
Property Value to Household Income Ratio in Benton
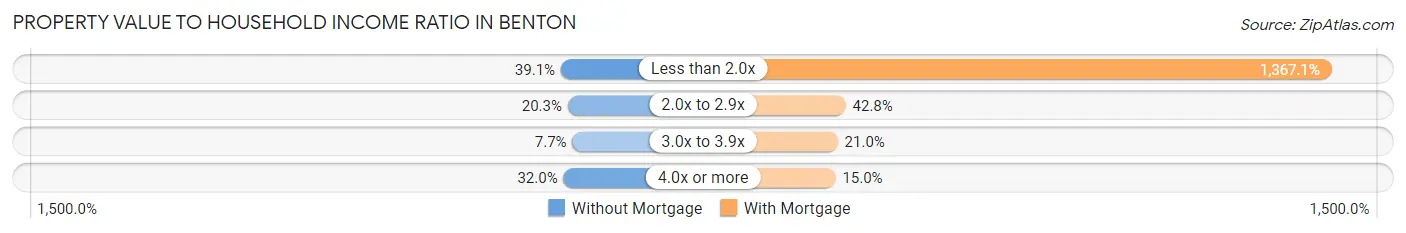
| Value-to-Income Ratio | Without Mortgage | With Mortgage |
| Less than 2.0x | 1,127 (39.1%) | 89,766 (1,367.1%) |
| 2.0x to 2.9x | 585 (20.3%) | 2,809 (42.8%) |
| 3.0x to 3.9x | 222 (7.7%) | 1,380 (21.0%) |
| 4.0x or more | 923 (32.0%) | 986 (15.0%) |
| Total | 2,886 (100.0%) | 6,566 (100.0%) |
Real Estate Taxes by Mortgage Status in Benton
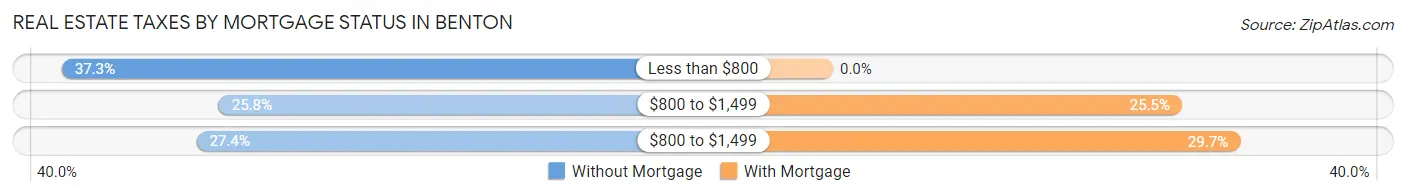
| Property Taxes | Without Mortgage | With Mortgage |
| Less than $800 | 1,076 (37.3%) | 0 (0.0%) |
| $800 to $1,499 | 745 (25.8%) | 1,673 (25.5%) |
| $800 to $1,499 | 792 (27.4%) | 1,953 (29.7%) |
| Total | 2,886 (100.0%) | 6,566 (100.0%) |
Health & Disability in Benton
Health Insurance Coverage by Age in Benton
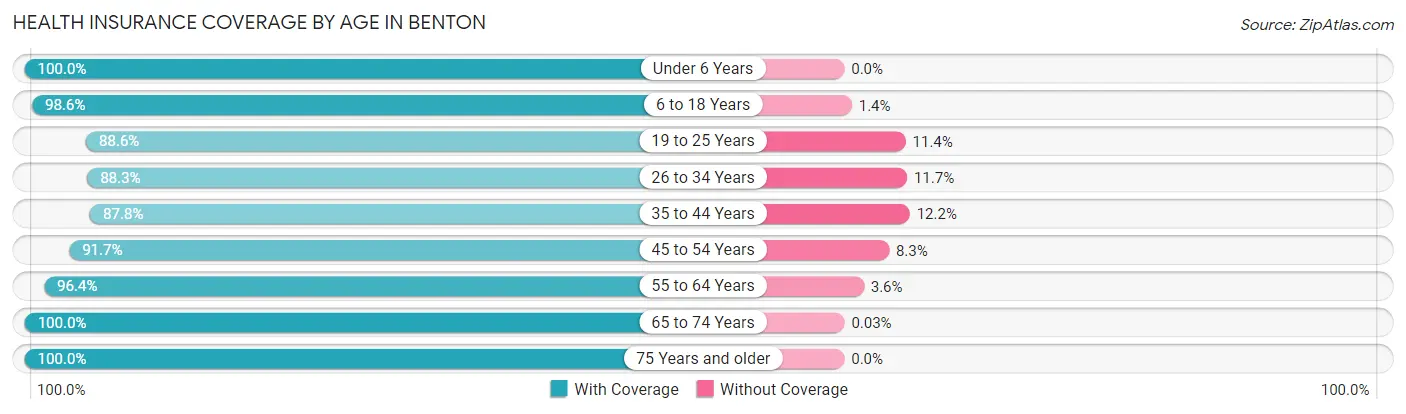
| Age Bracket | With Coverage | Without Coverage |
| Under 6 Years | 2,527 (100.0%) | 0 (0.0%) |
| 6 to 18 Years | 6,769 (98.6%) | 96 (1.4%) |
| 19 to 25 Years | 2,640 (88.6%) | 341 (11.4%) |
| 26 to 34 Years | 3,778 (88.3%) | 500 (11.7%) |
| 35 to 44 Years | 4,139 (87.8%) | 575 (12.2%) |
| 45 to 54 Years | 4,510 (91.7%) | 410 (8.3%) |
| 55 to 64 Years | 3,189 (96.4%) | 120 (3.6%) |
| 65 to 74 Years | 3,392 (100.0%) | 1 (0.0%) |
| 75 Years and older | 1,941 (100.0%) | 0 (0.0%) |
| Total | 32,885 (94.2%) | 2,043 (5.9%) |
Health Insurance Coverage by Citizenship Status in Benton
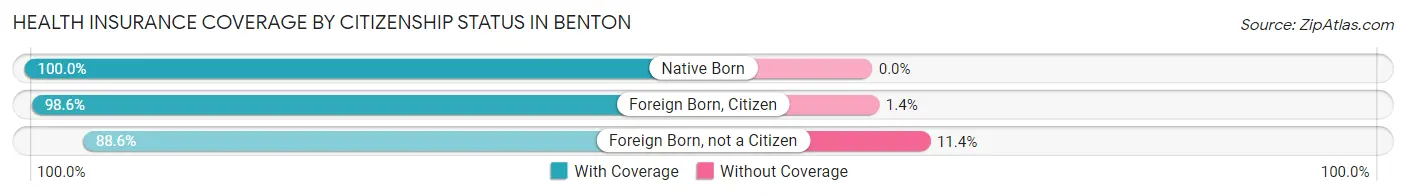
| Citizenship Status | With Coverage | Without Coverage |
| Native Born | 2,527 (100.0%) | 0 (0.0%) |
| Foreign Born, Citizen | 6,769 (98.6%) | 96 (1.4%) |
| Foreign Born, not a Citizen | 2,640 (88.6%) | 341 (11.4%) |
Health Insurance Coverage by Household Income in Benton
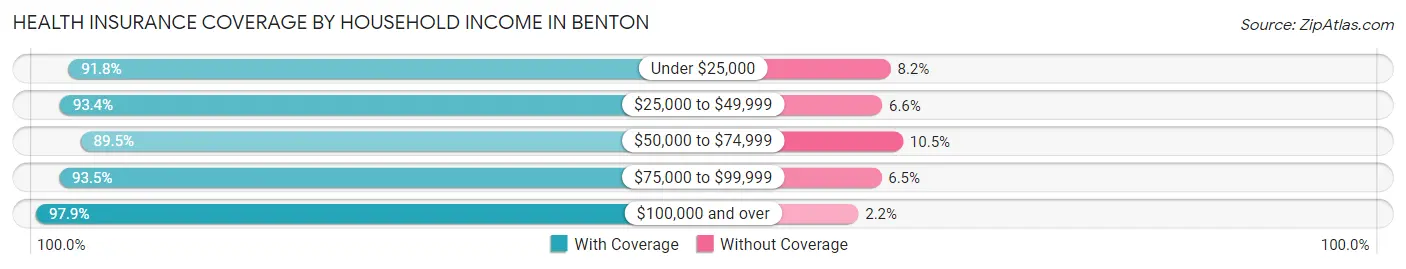
| Household Income | With Coverage | Without Coverage |
| Under $25,000 | 3,262 (91.8%) | 291 (8.2%) |
| $25,000 to $49,999 | 5,927 (93.4%) | 419 (6.6%) |
| $50,000 to $74,999 | 6,098 (89.5%) | 716 (10.5%) |
| $75,000 to $99,999 | 4,738 (93.5%) | 327 (6.5%) |
| $100,000 and over | 12,829 (97.9%) | 282 (2.1%) |
Public vs Private Health Insurance Coverage by Age in Benton
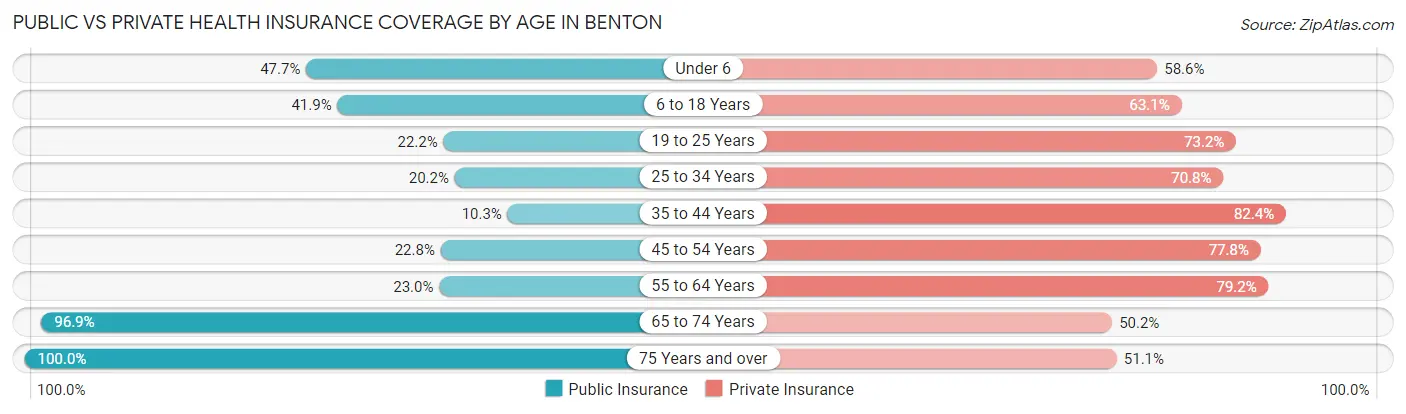
| Age Bracket | Public Insurance | Private Insurance |
| Under 6 | 1,206 (47.7%) | 1,480 (58.6%) |
| 6 to 18 Years | 2,878 (41.9%) | 4,329 (63.1%) |
| 19 to 25 Years | 663 (22.2%) | 2,182 (73.2%) |
| 25 to 34 Years | 862 (20.2%) | 3,029 (70.8%) |
| 35 to 44 Years | 487 (10.3%) | 3,886 (82.4%) |
| 45 to 54 Years | 1,120 (22.8%) | 3,826 (77.8%) |
| 55 to 64 Years | 762 (23.0%) | 2,621 (79.2%) |
| 65 to 74 Years | 3,287 (96.9%) | 1,703 (50.2%) |
| 75 Years and over | 1,941 (100.0%) | 991 (51.1%) |
| Total | 13,206 (37.8%) | 24,047 (68.9%) |
Disability Status by Sex by Age in Benton
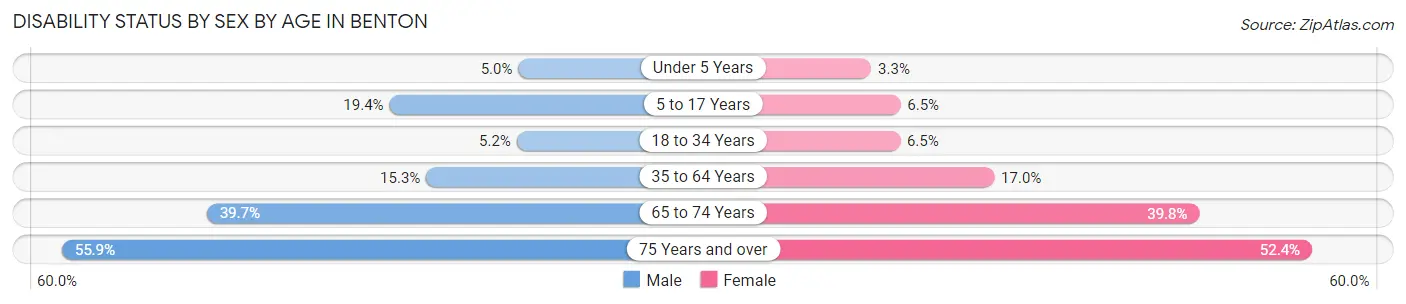
| Age Bracket | Male | Female |
| Under 5 Years | 50 (5.0%) | 35 (3.3%) |
| 5 to 17 Years | 678 (19.4%) | 205 (6.5%) |
| 18 to 34 Years | 205 (5.2%) | 259 (6.5%) |
| 35 to 64 Years | 950 (15.3%) | 1,141 (17.0%) |
| 65 to 74 Years | 654 (39.7%) | 695 (39.8%) |
| 75 Years and over | 382 (55.8%) | 658 (52.3%) |
Disability Class by Sex by Age in Benton
Disability Class: Hearing Difficulty
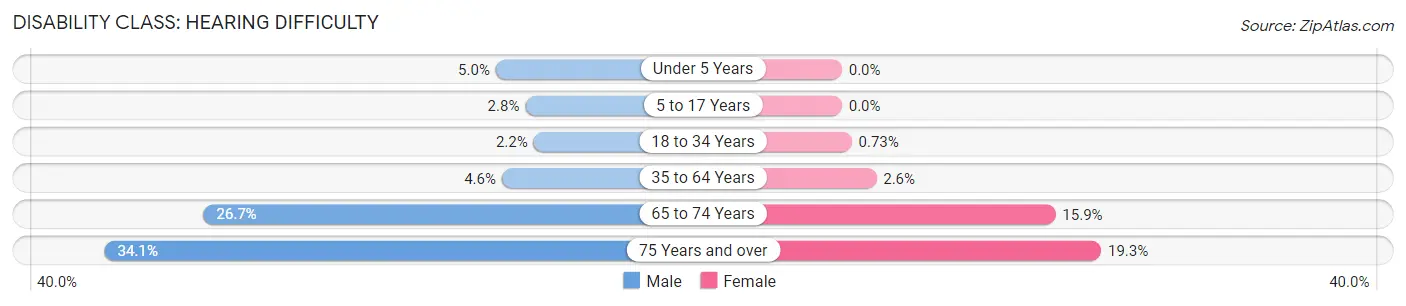
| Age Bracket | Male | Female |
| Under 5 Years | 50 (5.0%) | 0 (0.0%) |
| 5 to 17 Years | 99 (2.8%) | 0 (0.0%) |
| 18 to 34 Years | 87 (2.2%) | 29 (0.7%) |
| 35 to 64 Years | 284 (4.6%) | 172 (2.6%) |
| 65 to 74 Years | 440 (26.7%) | 277 (15.9%) |
| 75 Years and over | 233 (34.1%) | 242 (19.3%) |
Disability Class: Vision Difficulty
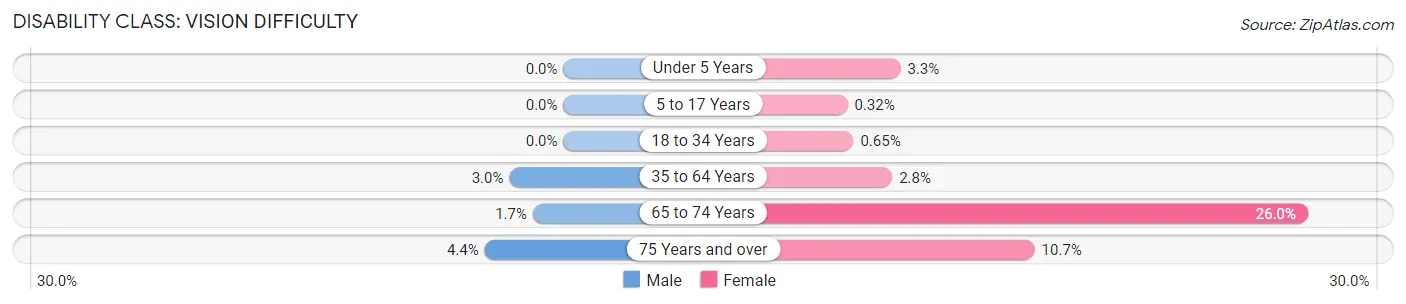
| Age Bracket | Male | Female |
| Under 5 Years | 0 (0.0%) | 35 (3.3%) |
| 5 to 17 Years | 0 (0.0%) | 10 (0.3%) |
| 18 to 34 Years | 0 (0.0%) | 26 (0.6%) |
| 35 to 64 Years | 187 (3.0%) | 189 (2.8%) |
| 65 to 74 Years | 28 (1.7%) | 453 (26.0%) |
| 75 Years and over | 30 (4.4%) | 135 (10.7%) |
Disability Class: Cognitive Difficulty
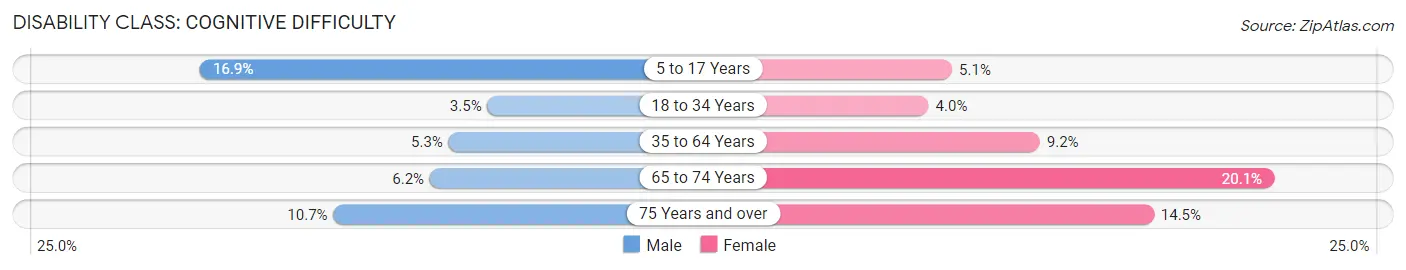
| Age Bracket | Male | Female |
| 5 to 17 Years | 590 (16.9%) | 161 (5.1%) |
| 18 to 34 Years | 139 (3.5%) | 161 (4.0%) |
| 35 to 64 Years | 331 (5.3%) | 618 (9.2%) |
| 65 to 74 Years | 102 (6.2%) | 350 (20.1%) |
| 75 Years and over | 73 (10.7%) | 182 (14.5%) |
Disability Class: Ambulatory Difficulty
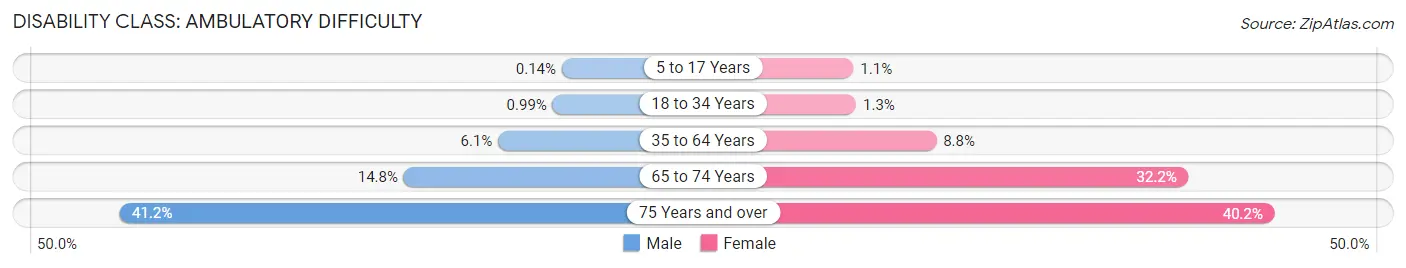
| Age Bracket | Male | Female |
| 5 to 17 Years | 5 (0.1%) | 34 (1.1%) |
| 18 to 34 Years | 39 (1.0%) | 53 (1.3%) |
| 35 to 64 Years | 376 (6.0%) | 589 (8.8%) |
| 65 to 74 Years | 244 (14.8%) | 562 (32.2%) |
| 75 Years and over | 282 (41.2%) | 505 (40.2%) |
Disability Class: Self-Care Difficulty
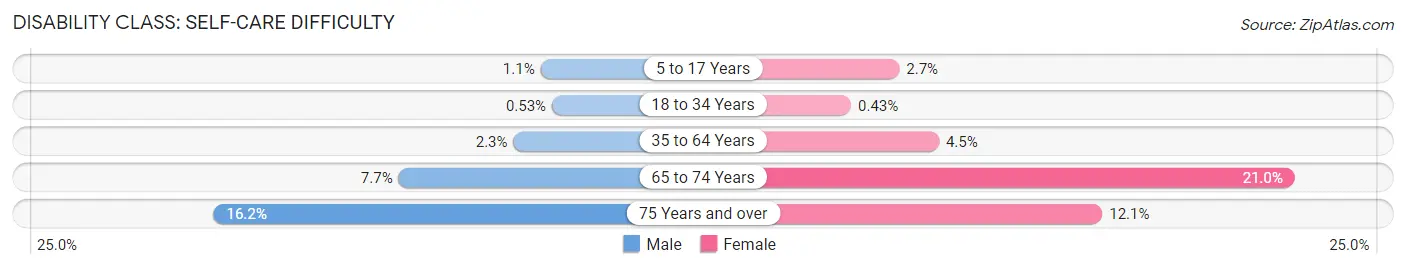
| Age Bracket | Male | Female |
| 5 to 17 Years | 37 (1.1%) | 84 (2.7%) |
| 18 to 34 Years | 21 (0.5%) | 17 (0.4%) |
| 35 to 64 Years | 144 (2.3%) | 303 (4.5%) |
| 65 to 74 Years | 126 (7.6%) | 367 (21.0%) |
| 75 Years and over | 111 (16.2%) | 152 (12.1%) |
Technology Access in Benton
Computing Device Access in Benton
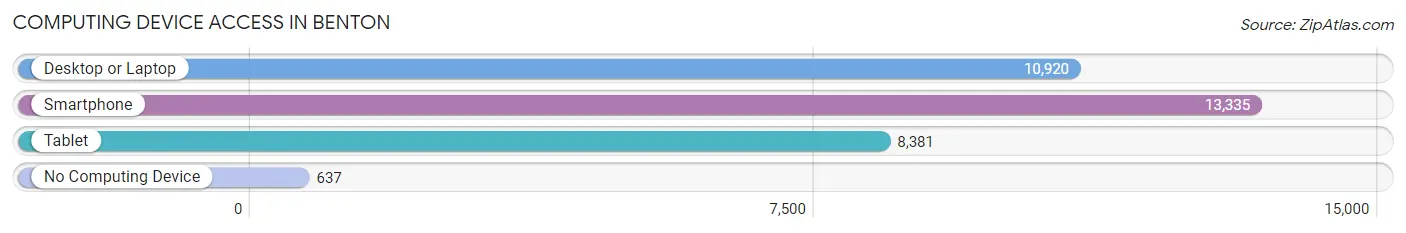
| Device Type | # Households | % Households |
| Desktop or Laptop | 10,920 | 76.1% |
| Smartphone | 13,335 | 92.9% |
| Tablet | 8,381 | 58.4% |
| No Computing Device | 637 | 4.4% |
| Total | 14,350 | 100.0% |
Internet Access in Benton
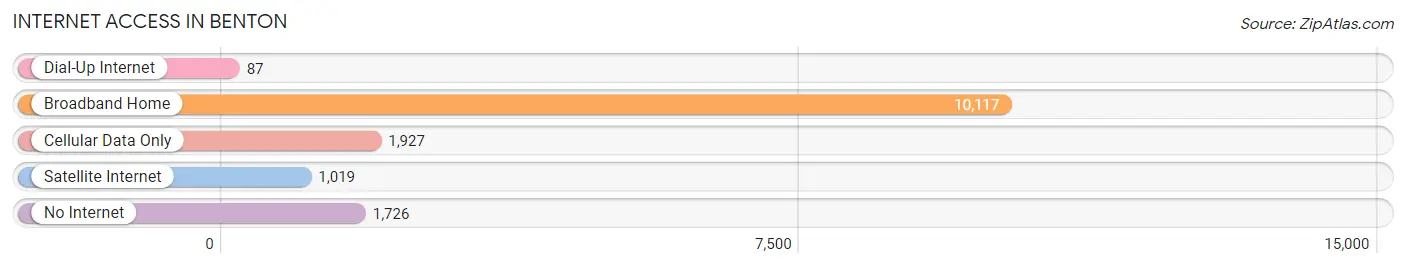
| Internet Type | # Households | % Households |
| Dial-Up Internet | 87 | 0.6% |
| Broadband Home | 10,117 | 70.5% |
| Cellular Data Only | 1,927 | 13.4% |
| Satellite Internet | 1,019 | 7.1% |
| No Internet | 1,726 | 12.0% |
| Total | 14,350 | 100.0% |
Benton Summary
Benton, Arkansas is a city located in Saline County, Arkansas. It is the county seat of Saline County and is part of the Little Rock-North Little Rock-Conway Metropolitan Statistical Area. The city was founded in 1837 and is named after Thomas Hart Benton, a U.S. Senator from Missouri. As of the 2010 census, the population of Benton was 30,681, making it the 14th largest city in Arkansas.
Geography
Benton is located in the center of Saline County at 34°36'25" North, 92°33'25" West (34.6069, -92.5569). It is bordered to the north by the city of Bryant and to the south by the city of Haskell. The city is situated on the Saline River, which flows through the city from the northwest to the southeast. The city is located in the Arkansas River Valley, which is part of the larger Arkansas Delta region.
The city has a total area of 24.2 square miles, of which 24.1 square miles is land and 0.1 square miles is water.
Demographics
As of the 2010 census, there were 30,681 people, 11,890 households, and 8,093 families residing in the city. The population density was 1,269.2 people per square mile. There were 12,890 housing units at an average density of 533.2 per square mile. The racial makeup of the city was 87.2% White, 8.3% Black or African American, 0.5% Native American, 0.9% Asian, 0.1% Pacific Islander, 1.3% from other races, and 1.7% from two or more races. Hispanic or Latino of any race were 3.3% of the population.
There were 11,890 households, out of which 33.2% had children under the age of 18 living with them, 51.2% were married couples living together, 13.3% had a female householder with no husband present, and 31.2% were non-families. 26.2% of all households were made up of individuals, and 9.7% had someone living alone who was 65 years of age or older. The average household size was 2.51 and the average family size was 3.04.
The median age in the city was 36.7 years. 25.2% of residents were under the age of 18; 8.7% were between the ages of 18 and 24; 25.9% were from 25 to 44; 25.7% were from 45 to 64; and 14.5% were 65 years of age or older. The gender makeup of the city was 48.2% male and 51.8% female.
Economy
Benton is home to several major employers, including the Saline Memorial Hospital, the Benton School District, the Saline County Courthouse, and the Benton Utilities Department. The city is also home to several retail stores, restaurants, and other businesses.
The city's economy is largely based on the service sector, with the largest employers being in the healthcare, education, and government sectors. The city also has a large manufacturing sector, with several companies producing automotive parts, furniture, and other products.
The median household income in Benton was $45,845 in 2019, and the median family income was $54,845. The per capita income in the city was $24,845. About 11.2% of families and 14.2% of the population were below the poverty line, including 19.2% of those under age 18 and 8.2% of those age 65 or over.
Conclusion
Benton, Arkansas is a city located in Saline County, Arkansas. It is the county seat of Saline County and is part of the Little Rock-North Little Rock-Conway Metropolitan Statistical Area. The city was founded in 1837 and is named after Thomas Hart Benton, a U.S. Senator from Missouri. As of the 2010 census, the population of Benton was 30,681, making it the 14th largest city in Arkansas. The city is situated on the Saline River and is located in the Arkansas River Valley, which is part of the larger Arkansas Delta region. The city has a diverse economy, with the largest employers being in the healthcare, education, and government sectors. The median household income in Benton was $45,845 in 2019, and the median family income was $54,845. The per capita income in the city was $24,845.
Common Questions
What is Per Capita Income in Benton?
Per Capita income in Benton is $34,257.
What is the Median Family Income in Benton?
Median Family Income in Benton is $81,527.
What is the Median Household income in Benton?
Median Household Income in Benton is $66,868.
What is Income or Wage Gap in Benton?
Income or Wage Gap in Benton is 28.0%.
Women in Benton earn 72.0 cents for every dollar earned by a man.
What is Family Income Deficit in Benton?
Family Income Deficit in Benton is $10,662.
Families that are below poverty line in Benton earn $10,662 less on average than the poverty threshold level.
What is Inequality or Gini Index in Benton?
Inequality or Gini Index in Benton is 0.40.
What is the Total Population of Benton?
Total Population of Benton is 35,318.
What is the Total Male Population of Benton?
Total Male Population of Benton is 17,257.
What is the Total Female Population of Benton?
Total Female Population of Benton is 18,061.
What is the Ratio of Males per 100 Females in Benton?
There are 95.55 Males per 100 Females in Benton.
What is the Ratio of Females per 100 Males in Benton?
There are 104.66 Females per 100 Males in Benton.
What is the Median Population Age in Benton?
Median Population Age in Benton is 37.2 Years.
What is the Average Family Size in Benton
Average Family Size in Benton is 3.0 People.
What is the Average Household Size in Benton
Average Household Size in Benton is 2.4 People.
How Large is the Labor Force in Benton?
There are 18,260 People in the Labor Forcein in Benton.
What is the Percentage of People in the Labor Force in Benton?
66.6% of People are in the Labor Force in Benton.
What is the Unemployment Rate in Benton?
Unemployment Rate in Benton is 3.8%.