Lonoke County, AR Map & Demographics
Lonoke County Map
Lonoke County Overview
$32,720
PER CAPITA INCOME
$83,730
AVG FAMILY INCOME
$68,078
AVG HOUSEHOLD INCOME
28.1%
WAGE / INCOME GAP [ % ]
71.9¢/ $1
WAGE / INCOME GAP [ $ ]
$11,730
FAMILY INCOME DEFICIT
0.42
INEQUALITY / GINI INDEX
74,292
TOTAL POPULATION
36,875
MALE POPULATION
37,417
FEMALE POPULATION
98.55
MALES / 100 FEMALES
101.47
FEMALES / 100 MALES
37.0
MEDIAN AGE
3.1
AVG FAMILY SIZE
2.7
AVG HOUSEHOLD SIZE
36,288
LABOR FORCE [ PEOPLE ]
62.5%
PERCENT IN LABOR FORCE
4.5%
UNEMPLOYMENT RATE
Income in Lonoke County
Income Overview in Lonoke County
Per Capita Income in Lonoke County is $32,720, while median incomes of families and households are $83,730 and $68,078 respectively.
| Characteristic | Number | Measure |
| Per Capita Income | 74,292 | $32,720 |
| Median Family Income | 19,647 | $83,730 |
| Mean Family Income | 19,647 | $99,376 |
| Median Household Income | 27,582 | $68,078 |
| Mean Household Income | 27,582 | $85,865 |
| Income Deficit | 19,647 | $11,730 |
| Wage / Income Gap (%) | 74,292 | 28.12% |
| Wage / Income Gap ($) | 74,292 | 71.88¢ per $1 |
| Gini / Inequality Index | 74,292 | 0.42 |
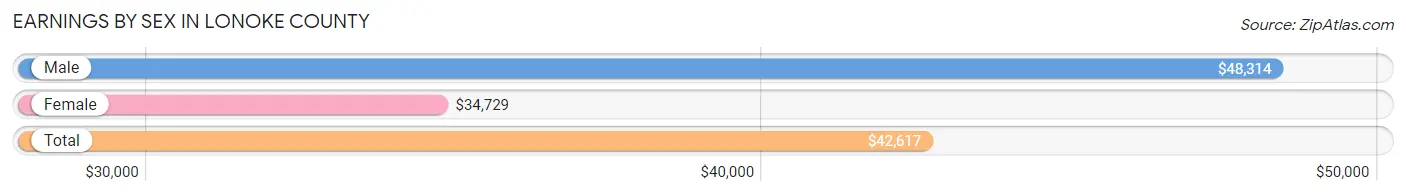
Earnings by Sex in Lonoke County
Average Earnings in Lonoke County are $42,617, $48,314 for men and $34,729 for women, a difference of 28.1%.
| Sex | Number | Average Earnings |
| Male | 19,433 (51.6%) | $48,314 |
| Female | 18,251 (48.4%) | $34,729 |
| Total | 37,684 (100.0%) | $42,617 |
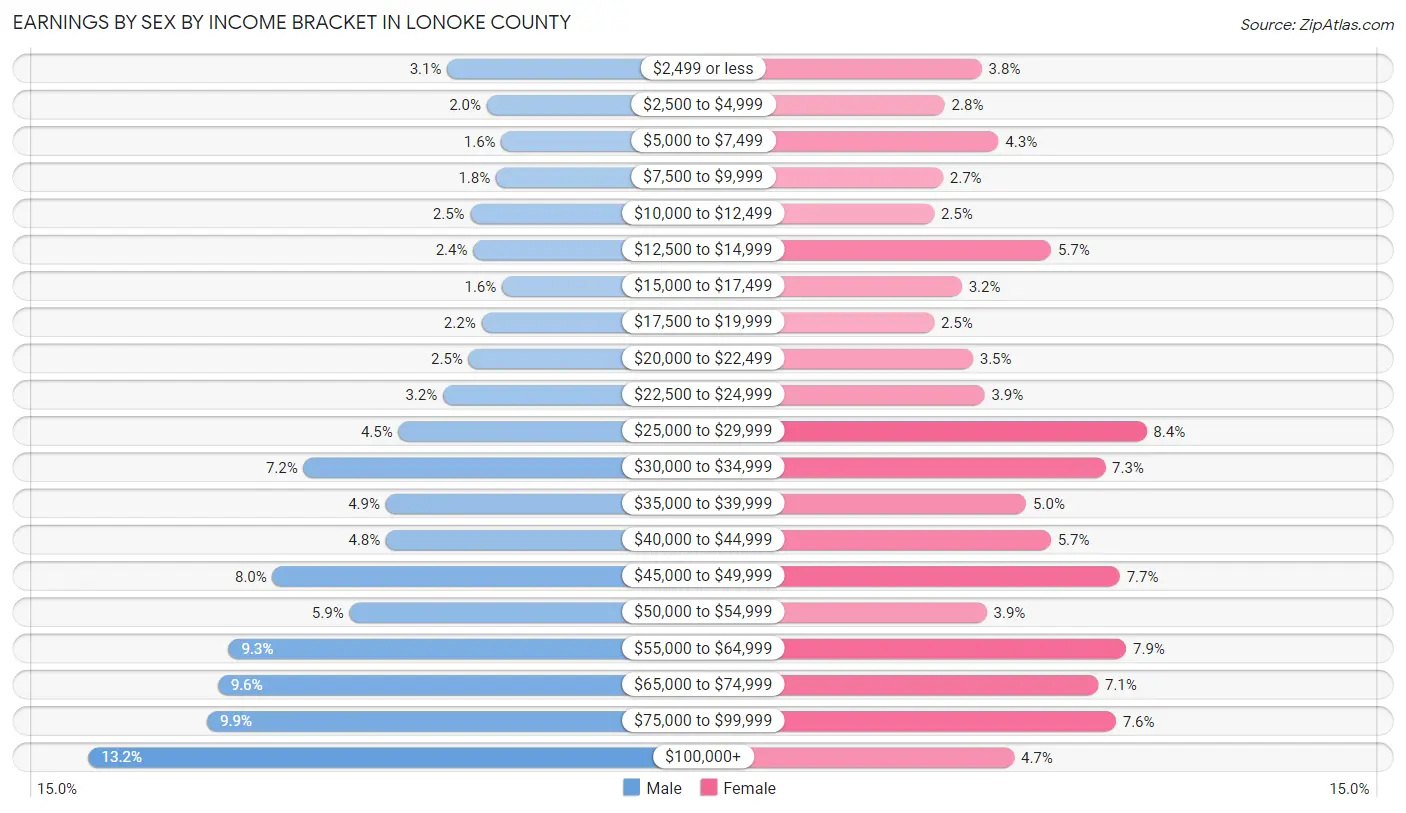
Earnings by Sex by Income Bracket in Lonoke County
The most common earnings brackets in Lonoke County are $100,000+ for men (2,566 | 13.2%) and $25,000 to $29,999 for women (1,537 | 8.4%).
| Income | Male | Female |
| $2,499 or less | 607 (3.1%) | 691 (3.8%) |
| $2,500 to $4,999 | 391 (2.0%) | 502 (2.8%) |
| $5,000 to $7,499 | 311 (1.6%) | 778 (4.3%) |
| $7,500 to $9,999 | 340 (1.8%) | 492 (2.7%) |
| $10,000 to $12,499 | 480 (2.5%) | 447 (2.5%) |
| $12,500 to $14,999 | 465 (2.4%) | 1,047 (5.7%) |
| $15,000 to $17,499 | 307 (1.6%) | 589 (3.2%) |
| $17,500 to $19,999 | 419 (2.2%) | 447 (2.5%) |
| $20,000 to $22,499 | 489 (2.5%) | 646 (3.5%) |
| $22,500 to $24,999 | 630 (3.2%) | 707 (3.9%) |
| $25,000 to $29,999 | 873 (4.5%) | 1,537 (8.4%) |
| $30,000 to $34,999 | 1,391 (7.2%) | 1,325 (7.3%) |
| $35,000 to $39,999 | 943 (4.9%) | 920 (5.0%) |
| $40,000 to $44,999 | 940 (4.8%) | 1,046 (5.7%) |
| $45,000 to $49,999 | 1,560 (8.0%) | 1,400 (7.7%) |
| $50,000 to $54,999 | 1,141 (5.9%) | 718 (3.9%) |
| $55,000 to $64,999 | 1,802 (9.3%) | 1,433 (7.9%) |
| $65,000 to $74,999 | 1,860 (9.6%) | 1,288 (7.1%) |
| $75,000 to $99,999 | 1,918 (9.9%) | 1,380 (7.6%) |
| $100,000+ | 2,566 (13.2%) | 858 (4.7%) |
| Total | 19,433 (100.0%) | 18,251 (100.0%) |
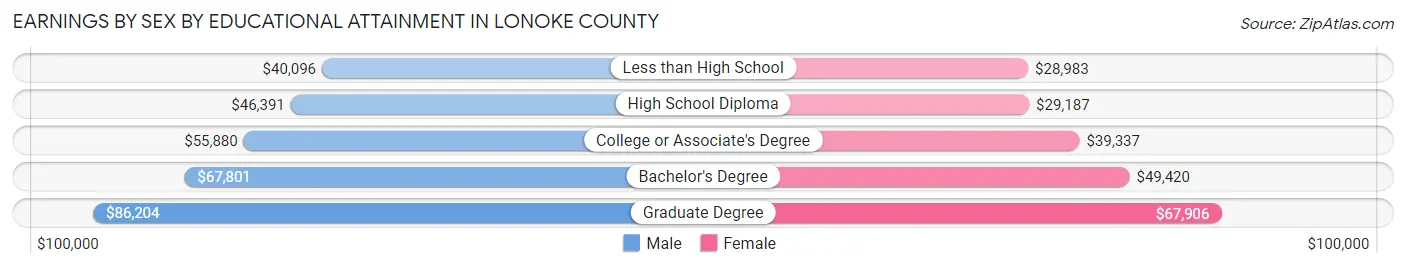
Earnings by Sex by Educational Attainment in Lonoke County
Average earnings in Lonoke County are $52,863 for men and $40,449 for women, a difference of 23.5%. Men with an educational attainment of graduate degree enjoy the highest average annual earnings of $86,204, while those with less than high school education earn the least with $40,096. Women with an educational attainment of graduate degree earn the most with the average annual earnings of $67,906, while those with less than high school education have the smallest earnings of $28,983.
| Educational Attainment | Male Income | Female Income |
| Less than High School | $40,096 | $28,983 |
| High School Diploma | $46,391 | $29,187 |
| College or Associate's Degree | $55,880 | $39,337 |
| Bachelor's Degree | $67,801 | $49,420 |
| Graduate Degree | $86,204 | $67,906 |
| Total | $52,863 | $40,449 |
Family Income in Lonoke County
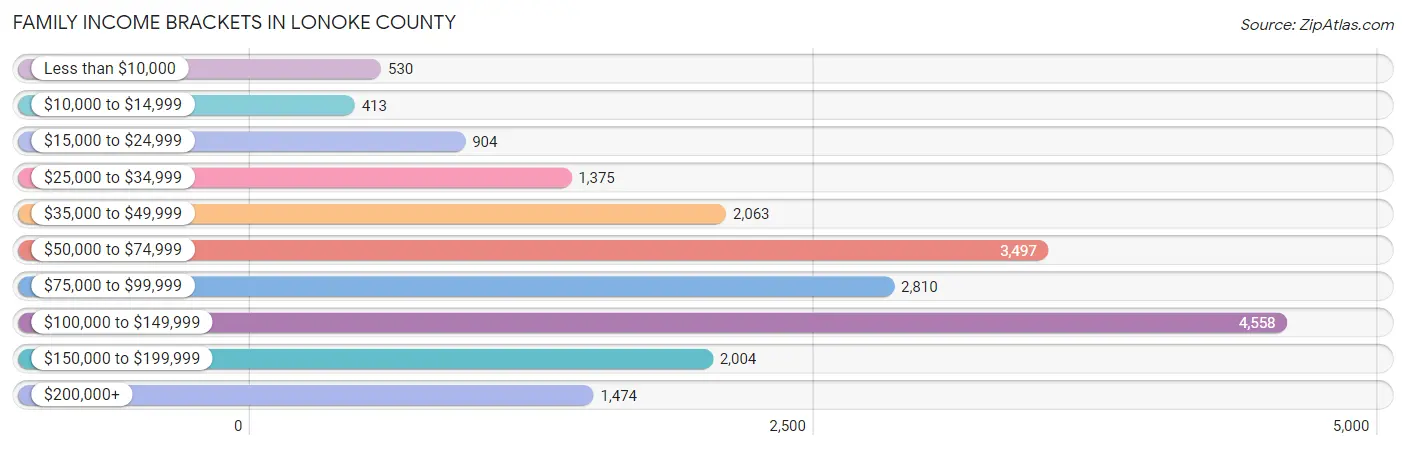
Family Income Brackets in Lonoke County
According to the Lonoke County family income data, there are 4,558 families falling into the $100,000 to $149,999 income range, which is the most common income bracket and makes up 23.2% of all families. Conversely, the $10,000 to $14,999 income bracket is the least frequent group with only 413 families (2.1%) belonging to this category.
| Income Bracket | # Families | % Families |
| Less than $10,000 | 530 | 2.7% |
| $10,000 to $14,999 | 413 | 2.1% |
| $15,000 to $24,999 | 904 | 4.6% |
| $25,000 to $34,999 | 1,375 | 7.0% |
| $35,000 to $49,999 | 2,063 | 10.5% |
| $50,000 to $74,999 | 3,497 | 17.8% |
| $75,000 to $99,999 | 2,810 | 14.3% |
| $100,000 to $149,999 | 4,558 | 23.2% |
| $150,000 to $199,999 | 2,004 | 10.2% |
| $200,000+ | 1,474 | 7.5% |
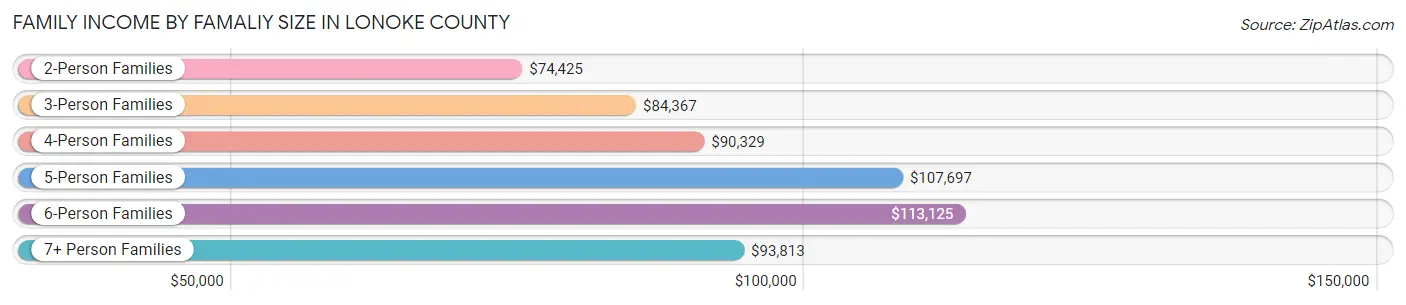
Family Income by Famaliy Size in Lonoke County
6-person families (484 | 2.5%) account for the highest median family income in Lonoke County with $113,125 per family, while 2-person families (8,694 | 44.3%) have the highest median income of $37,212 per family member.
| Income Bracket | # Families | Median Income |
| 2-Person Families | 8,694 (44.3%) | $74,425 |
| 3-Person Families | 4,394 (22.4%) | $84,367 |
| 4-Person Families | 4,169 (21.2%) | $90,329 |
| 5-Person Families | 1,607 (8.2%) | $107,697 |
| 6-Person Families | 484 (2.5%) | $113,125 |
| 7+ Person Families | 299 (1.5%) | $93,813 |
| Total | 19,647 (100.0%) | $83,730 |
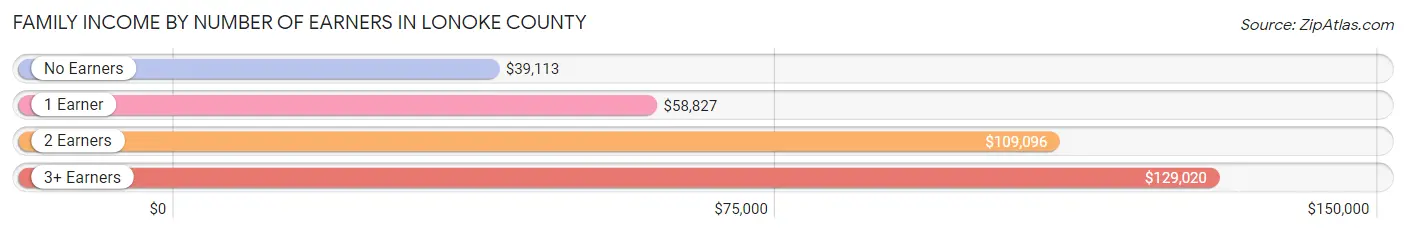
Family Income by Number of Earners in Lonoke County
The median family income in Lonoke County is $83,730, with families comprising 3+ earners (1,858) having the highest median family income of $129,020, while families with no earners (2,880) have the lowest median family income of $39,113, accounting for 9.5% and 14.7% of families, respectively.
| Number of Earners | # Families | Median Income |
| No Earners | 2,880 (14.7%) | $39,113 |
| 1 Earner | 6,071 (30.9%) | $58,827 |
| 2 Earners | 8,838 (45.0%) | $109,096 |
| 3+ Earners | 1,858 (9.5%) | $129,020 |
| Total | 19,647 (100.0%) | $83,730 |
Household Income in Lonoke County
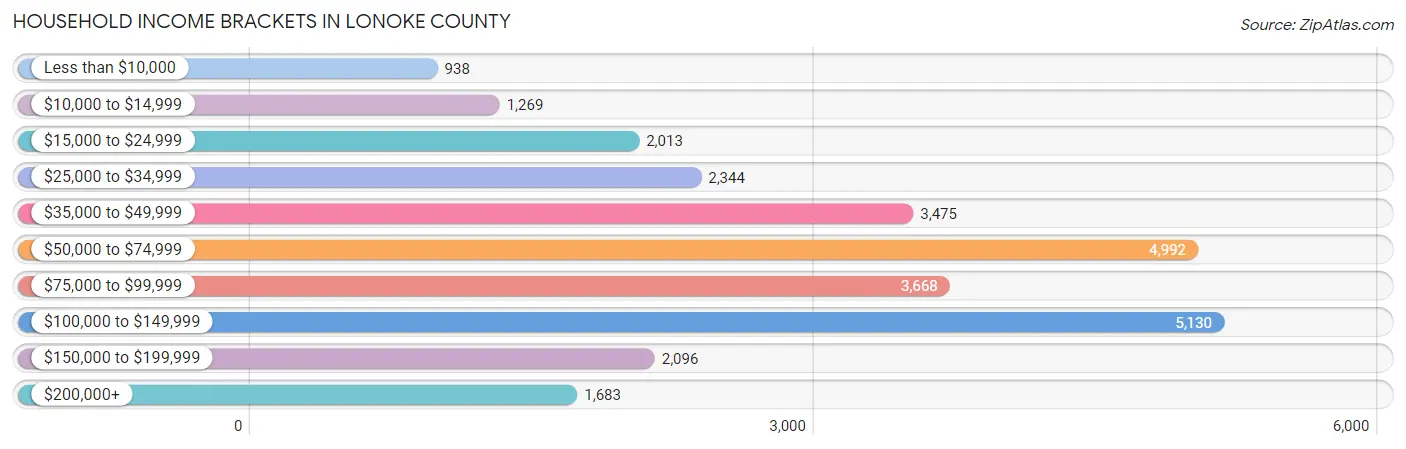
Household Income Brackets in Lonoke County
With 5,130 households falling in the category, the $100,000 to $149,999 income range is the most frequent in Lonoke County, accounting for 18.6% of all households. In contrast, only 938 households (3.4%) fall into the less than $10,000 income bracket, making it the least populous group.
| Income Bracket | # Households | % Households |
| Less than $10,000 | 938 | 3.4% |
| $10,000 to $14,999 | 1,269 | 4.6% |
| $15,000 to $24,999 | 2,013 | 7.3% |
| $25,000 to $34,999 | 2,344 | 8.5% |
| $35,000 to $49,999 | 3,475 | 12.6% |
| $50,000 to $74,999 | 4,992 | 18.1% |
| $75,000 to $99,999 | 3,668 | 13.3% |
| $100,000 to $149,999 | 5,130 | 18.6% |
| $150,000 to $199,999 | 2,096 | 7.6% |
| $200,000+ | 1,683 | 6.1% |
Household Income by Householder Age in Lonoke County
The median household income in Lonoke County is $68,078, with the highest median household income of $83,830 found in the 45 to 64 years age bracket for the primary householder. A total of 10,156 households (36.8%) fall into this category. Meanwhile, the 15 to 24 years age bracket for the primary householder has the lowest median household income of $34,417, with 991 households (3.6%) in this group.
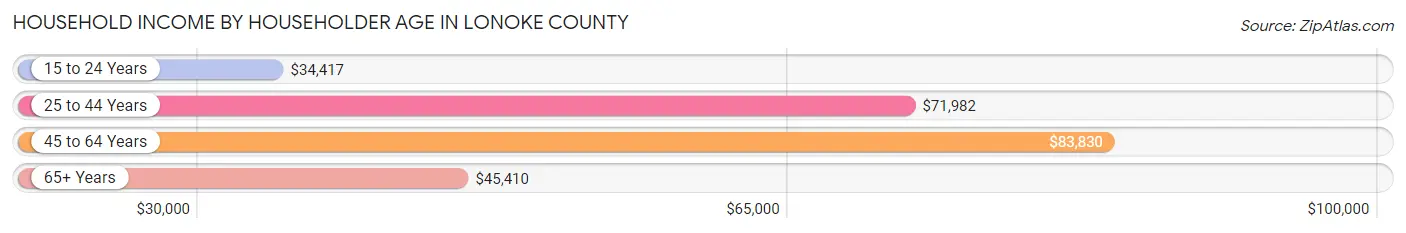
| Income Bracket | # Households | Median Income |
| 15 to 24 Years | 991 (3.6%) | $34,417 |
| 25 to 44 Years | 10,079 (36.5%) | $71,982 |
| 45 to 64 Years | 10,156 (36.8%) | $83,830 |
| 65+ Years | 6,356 (23.0%) | $45,410 |
| Total | 27,582 (100.0%) | $68,078 |
Poverty in Lonoke County
Income Below Poverty by Sex and Age in Lonoke County
With 10.8% poverty level for males and 12.9% for females among the residents of Lonoke County, 5 year old males and under 5 year old females are the most vulnerable to poverty, with 158 males (27.1%) and 416 females (19.4%) in their respective age groups living below the poverty level.
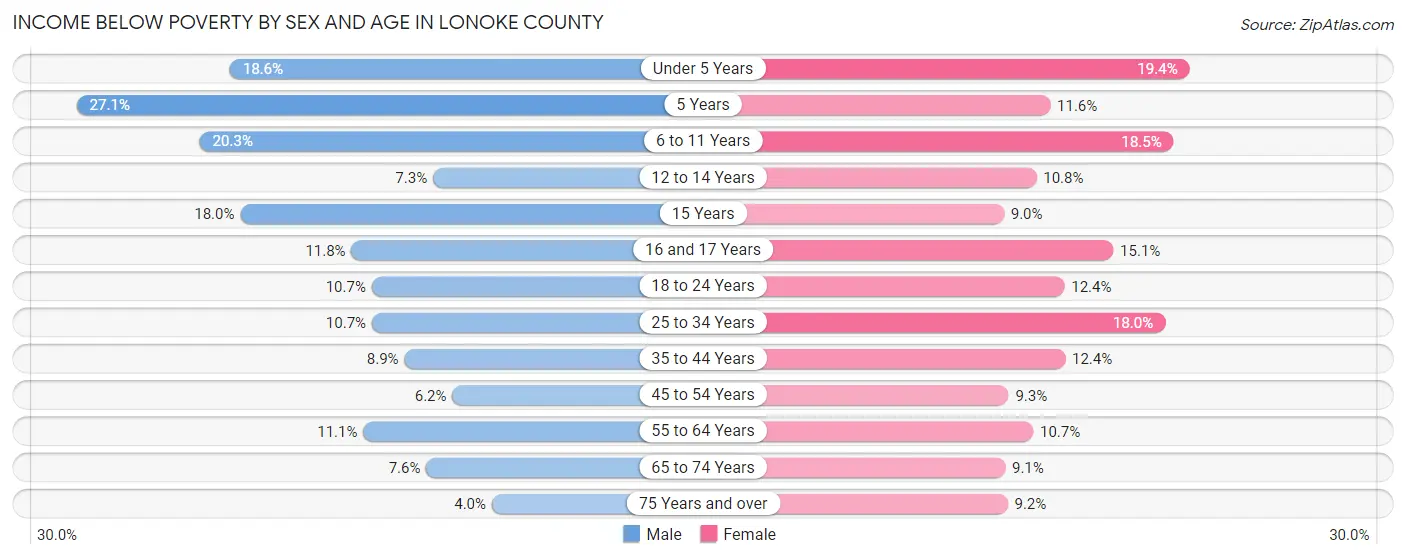
| Age Bracket | Male | Female |
| Under 5 Years | 419 (18.6%) | 416 (19.4%) |
| 5 Years | 158 (27.1%) | 69 (11.6%) |
| 6 to 11 Years | 583 (20.3%) | 508 (18.5%) |
| 12 to 14 Years | 150 (7.3%) | 169 (10.8%) |
| 15 Years | 95 (18.0%) | 44 (9.0%) |
| 16 and 17 Years | 143 (11.8%) | 173 (15.1%) |
| 18 to 24 Years | 319 (10.7%) | 365 (12.4%) |
| 25 to 34 Years | 551 (10.7%) | 909 (18.0%) |
| 35 to 44 Years | 449 (8.8%) | 654 (12.4%) |
| 45 to 54 Years | 297 (6.2%) | 435 (9.3%) |
| 55 to 64 Years | 480 (11.1%) | 500 (10.6%) |
| 65 to 74 Years | 228 (7.6%) | 295 (9.1%) |
| 75 Years and over | 65 (4.0%) | 206 (9.2%) |
| Total | 3,937 (10.8%) | 4,743 (12.9%) |
Income Above Poverty by Sex and Age in Lonoke County
According to the poverty statistics in Lonoke County, males aged 75 years and over and females aged 15 years are the age groups that are most secure financially, with 96.0% of males and 91.0% of females in these age groups living above the poverty line.
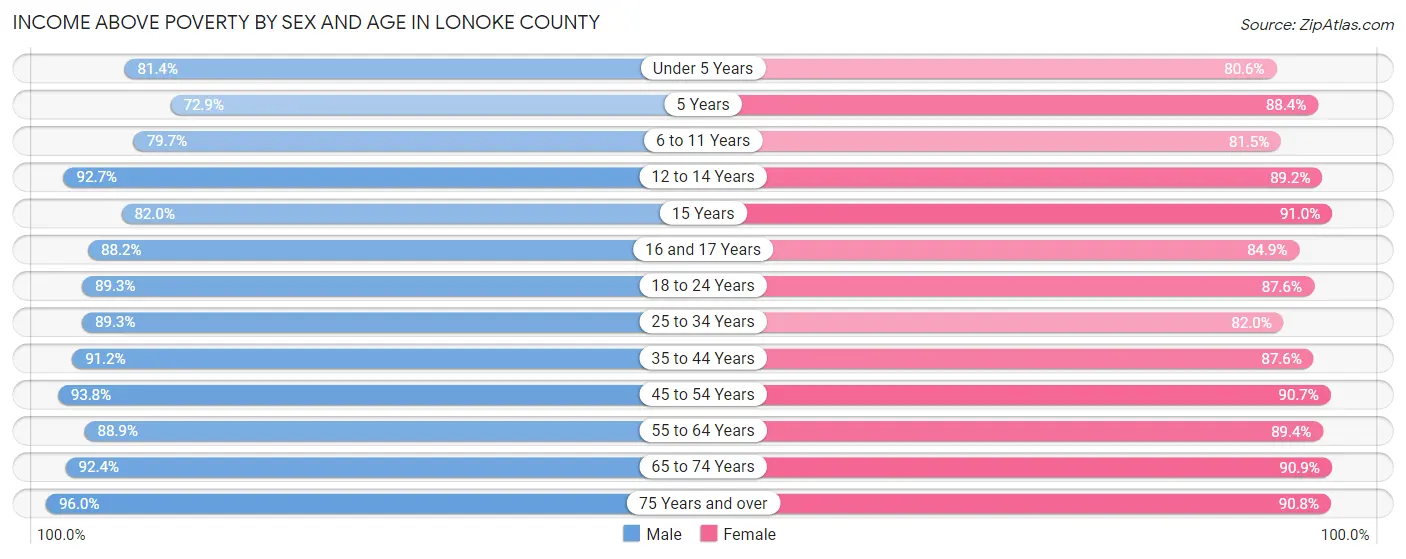
| Age Bracket | Male | Female |
| Under 5 Years | 1,837 (81.4%) | 1,733 (80.6%) |
| 5 Years | 425 (72.9%) | 526 (88.4%) |
| 6 to 11 Years | 2,295 (79.7%) | 2,242 (81.5%) |
| 12 to 14 Years | 1,917 (92.7%) | 1,391 (89.2%) |
| 15 Years | 433 (82.0%) | 444 (91.0%) |
| 16 and 17 Years | 1,069 (88.2%) | 972 (84.9%) |
| 18 to 24 Years | 2,671 (89.3%) | 2,582 (87.6%) |
| 25 to 34 Years | 4,617 (89.3%) | 4,142 (82.0%) |
| 35 to 44 Years | 4,625 (91.1%) | 4,607 (87.6%) |
| 45 to 54 Years | 4,511 (93.8%) | 4,254 (90.7%) |
| 55 to 64 Years | 3,829 (88.9%) | 4,193 (89.3%) |
| 65 to 74 Years | 2,760 (92.4%) | 2,952 (90.9%) |
| 75 Years and over | 1,567 (96.0%) | 2,026 (90.8%) |
| Total | 32,556 (89.2%) | 32,064 (87.1%) |
Income Below Poverty Among Married-Couple Families in Lonoke County
The poverty statistics for married-couple families in Lonoke County show that 3.9% or 583 of the total 14,981 families live below the poverty line. Families with 5 or more children have the highest poverty rate of 15.7%, comprising of 16 families. On the other hand, families with no children have the lowest poverty rate of 2.2%, which includes 177 families.
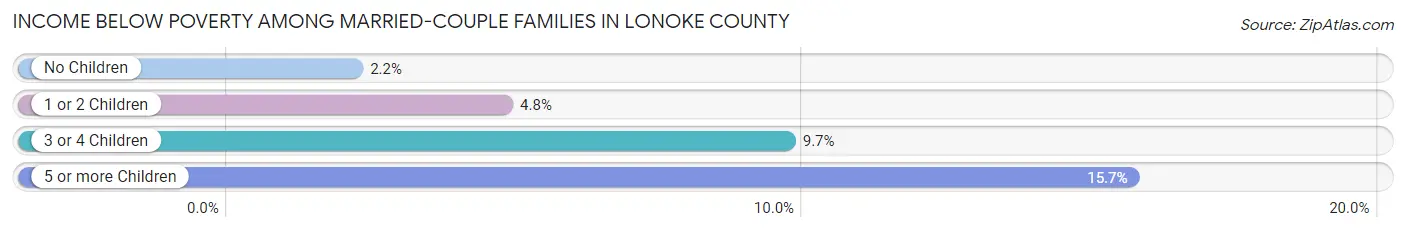
| Children | Above Poverty | Below Poverty |
| No Children | 7,929 (97.8%) | 177 (2.2%) |
| 1 or 2 Children | 5,183 (95.2%) | 261 (4.8%) |
| 3 or 4 Children | 1,200 (90.3%) | 129 (9.7%) |
| 5 or more Children | 86 (84.3%) | 16 (15.7%) |
| Total | 14,398 (96.1%) | 583 (3.9%) |
Income Below Poverty Among Single-Parent Households in Lonoke County
According to the poverty data in Lonoke County, 15.2% or 206 single-father households and 26.5% or 877 single-mother households are living below the poverty line. Among single-father households, those with 1 or 2 children have the highest poverty rate, with 162 households (28.0%) experiencing poverty. Likewise, among single-mother households, those with 5 or more children have the highest poverty rate, with 15 households (100.0%) falling below the poverty line.
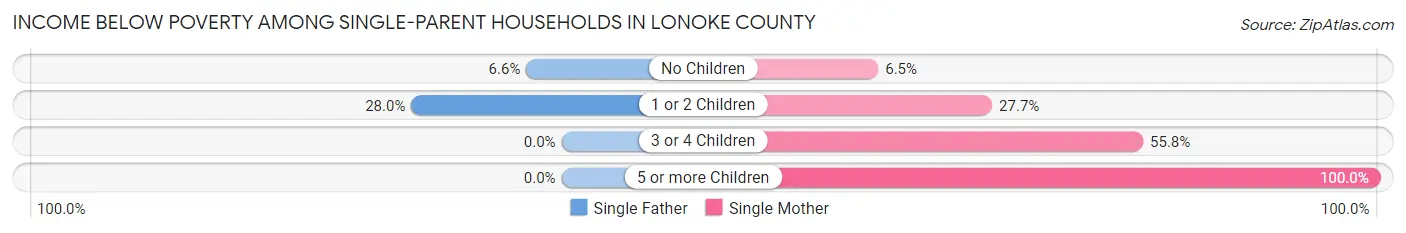
| Children | Single Father | Single Mother |
| No Children | 44 (6.6%) | 55 (6.5%) |
| 1 or 2 Children | 162 (28.0%) | 546 (27.7%) |
| 3 or 4 Children | 0 (0.0%) | 261 (55.8%) |
| 5 or more Children | 0 (0.0%) | 15 (100.0%) |
| Total | 206 (15.2%) | 877 (26.5%) |
Income Below Poverty Among Married-Couple vs Single-Parent Households in Lonoke County
The poverty data for Lonoke County shows that 583 of the married-couple family households (3.9%) and 1,083 of the single-parent households (23.2%) are living below the poverty level. Within the married-couple family households, those with 5 or more children have the highest poverty rate, with 16 households (15.7%) falling below the poverty line. Among the single-parent households, those with 5 or more children have the highest poverty rate, with 15 household (100.0%) living below poverty.
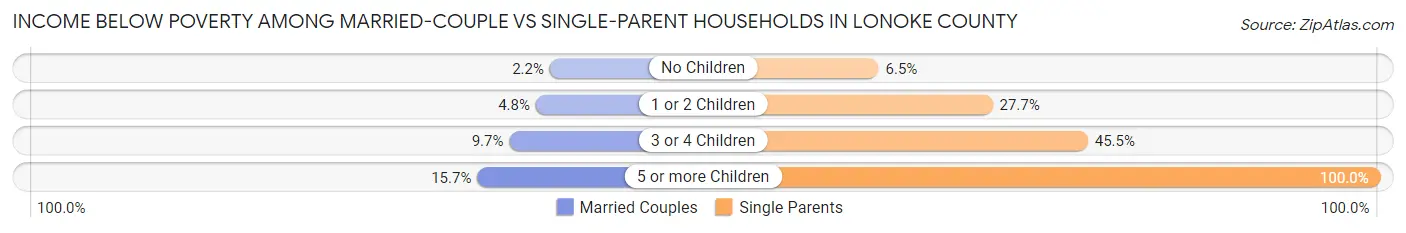
| Children | Married-Couple Families | Single-Parent Households |
| No Children | 177 (2.2%) | 99 (6.5%) |
| 1 or 2 Children | 261 (4.8%) | 708 (27.7%) |
| 3 or 4 Children | 129 (9.7%) | 261 (45.5%) |
| 5 or more Children | 16 (15.7%) | 15 (100.0%) |
| Total | 583 (3.9%) | 1,083 (23.2%) |
Race in Lonoke County
The most populous races in Lonoke County are White / Caucasian (64,497 | 86.8%), Black / African American (4,108 | 5.5%), and Two or more Races (3,747 | 5.0%).
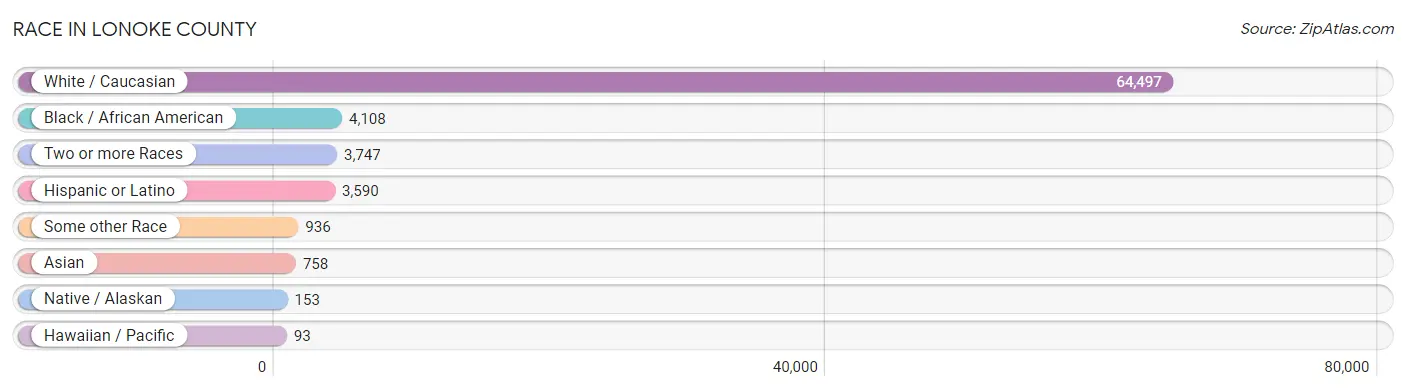
| Race | # Population | % Population |
| Asian | 758 | 1.0% |
| Black / African American | 4,108 | 5.5% |
| Hawaiian / Pacific | 93 | 0.1% |
| Hispanic or Latino | 3,590 | 4.8% |
| Native / Alaskan | 153 | 0.2% |
| White / Caucasian | 64,497 | 86.8% |
| Two or more Races | 3,747 | 5.0% |
| Some other Race | 936 | 1.3% |
| Total | 74,292 | 100.0% |
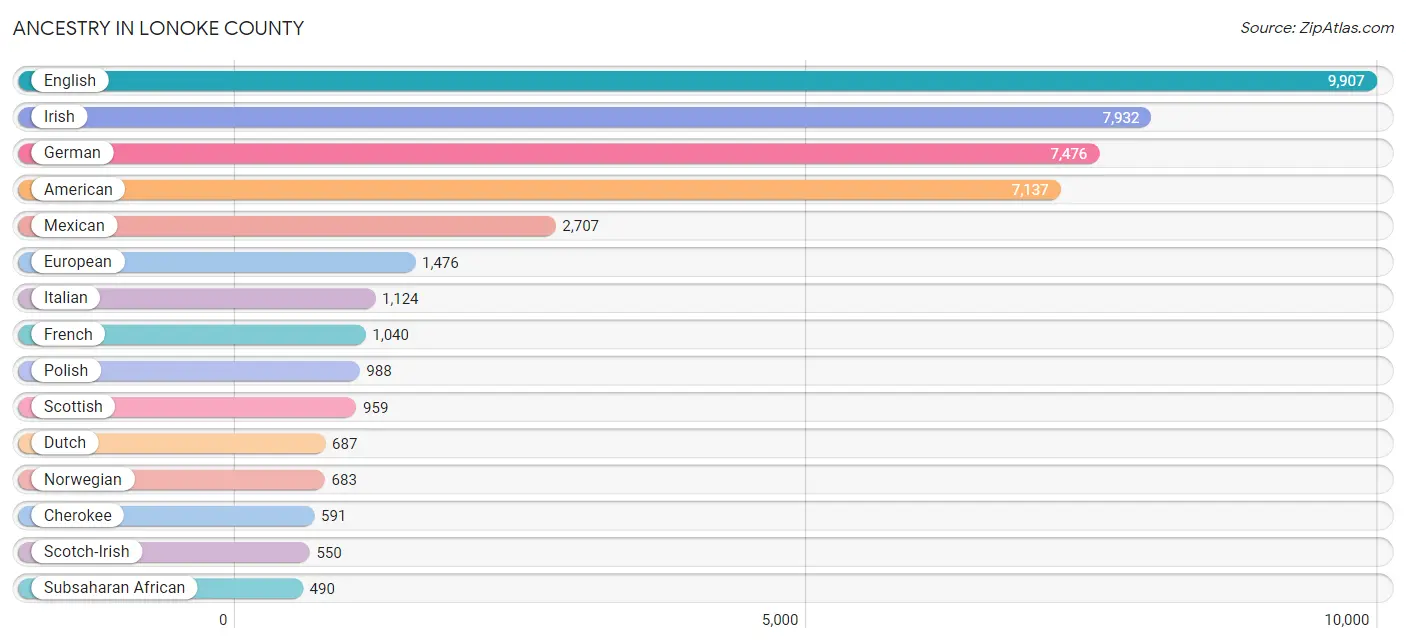
Ancestry in Lonoke County
The most populous ancestries reported in Lonoke County are English (9,907 | 13.3%), Irish (7,932 | 10.7%), German (7,476 | 10.1%), American (7,137 | 9.6%), and Mexican (2,707 | 3.6%), together accounting for 47.3% of all Lonoke County residents.
| Ancestry | # Population | % Population |
| African | 396 | 0.5% |
| American | 7,137 | 9.6% |
| Arab | 158 | 0.2% |
| Australian | 19 | 0.0% |
| Austrian | 146 | 0.2% |
| Bhutanese | 218 | 0.3% |
| Blackfeet | 91 | 0.1% |
| British | 478 | 0.6% |
| Bulgarian | 24 | 0.0% |
| Burmese | 203 | 0.3% |
| Cajun | 28 | 0.0% |
| Canadian | 44 | 0.1% |
| Central American | 258 | 0.4% |
| Central American Indian | 77 | 0.1% |
| Cherokee | 591 | 0.8% |
| Chickasaw | 3 | 0.0% |
| Choctaw | 71 | 0.1% |
| Colombian | 45 | 0.1% |
| Cree | 55 | 0.1% |
| Creek | 10 | 0.0% |
| Croatian | 14 | 0.0% |
| Cuban | 17 | 0.0% |
| Czech | 92 | 0.1% |
| Czechoslovakian | 72 | 0.1% |
| Danish | 51 | 0.1% |
| Dutch | 687 | 0.9% |
| Dutch West Indian | 16 | 0.0% |
| Eastern European | 81 | 0.1% |
| English | 9,907 | 13.3% |
| European | 1,476 | 2.0% |
| Filipino | 14 | 0.0% |
| Finnish | 64 | 0.1% |
| French | 1,040 | 1.4% |
| French Canadian | 289 | 0.4% |
| German | 7,476 | 10.1% |
| Ghanaian | 108 | 0.2% |
| Greek | 32 | 0.0% |
| Guamanian / Chamorro | 41 | 0.1% |
| Guatemalan | 74 | 0.1% |
| Honduran | 144 | 0.2% |
| Hungarian | 81 | 0.1% |
| Indian (Asian) | 85 | 0.1% |
| Iranian | 3 | 0.0% |
| Irish | 7,932 | 10.7% |
| Iroquois | 13 | 0.0% |
| Israeli | 26 | 0.0% |
| Italian | 1,124 | 1.5% |
| Japanese | 19 | 0.0% |
| Korean | 384 | 0.5% |
| Latvian | 14 | 0.0% |
| Lebanese | 158 | 0.2% |
| Liberian | 82 | 0.1% |
| Lithuanian | 8 | 0.0% |
| Malaysian | 53 | 0.1% |
| Menominee | 12 | 0.0% |
| Mexican | 2,707 | 3.6% |
| Mexican American Indian | 24 | 0.0% |
| Native Hawaiian | 58 | 0.1% |
| Nicaraguan | 11 | 0.0% |
| Northern European | 8 | 0.0% |
| Norwegian | 683 | 0.9% |
| Pakistani | 13 | 0.0% |
| Polish | 988 | 1.3% |
| Portuguese | 252 | 0.3% |
| Puerto Rican | 223 | 0.3% |
| Romanian | 24 | 0.0% |
| Russian | 229 | 0.3% |
| Salvadoran | 29 | 0.0% |
| Samoan | 104 | 0.1% |
| Scandinavian | 228 | 0.3% |
| Scotch-Irish | 550 | 0.7% |
| Scottish | 959 | 1.3% |
| Slavic | 11 | 0.0% |
| Slovak | 8 | 0.0% |
| South African | 12 | 0.0% |
| South American | 73 | 0.1% |
| Spaniard | 70 | 0.1% |
| Spanish | 58 | 0.1% |
| Sri Lankan | 115 | 0.2% |
| Subsaharan African | 490 | 0.7% |
| Swedish | 344 | 0.5% |
| Swiss | 82 | 0.1% |
| Venezuelan | 28 | 0.0% |
| Welsh | 199 | 0.3% |
| Yugoslavian | 17 | 0.0% | View All 85 Rows |
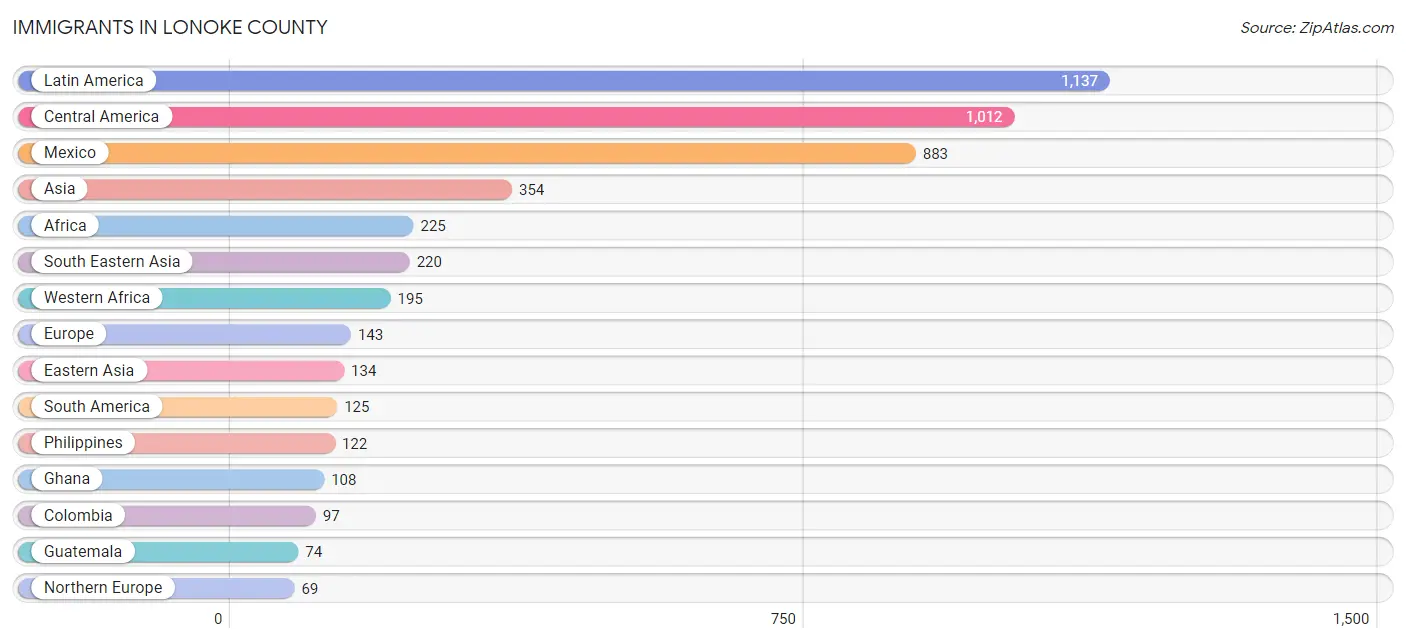
Immigrants in Lonoke County
The most numerous immigrant groups reported in Lonoke County came from Latin America (1,137 | 1.5%), Central America (1,012 | 1.4%), Mexico (883 | 1.2%), Asia (354 | 0.5%), and Africa (225 | 0.3%), together accounting for 4.9% of all Lonoke County residents.
| Immigration Origin | # Population | % Population |
| Africa | 225 | 0.3% |
| Asia | 354 | 0.5% |
| Canada | 60 | 0.1% |
| Central America | 1,012 | 1.4% |
| China | 57 | 0.1% |
| Colombia | 97 | 0.1% |
| Czechoslovakia | 5 | 0.0% |
| Eastern Africa | 16 | 0.0% |
| Eastern Asia | 134 | 0.2% |
| Eastern Europe | 13 | 0.0% |
| El Salvador | 23 | 0.0% |
| Europe | 143 | 0.2% |
| France | 7 | 0.0% |
| Germany | 42 | 0.1% |
| Ghana | 108 | 0.2% |
| Guatemala | 74 | 0.1% |
| Honduras | 9 | 0.0% |
| Hungary | 8 | 0.0% |
| Japan | 16 | 0.0% |
| Korea | 61 | 0.1% |
| Laos | 25 | 0.0% |
| Latin America | 1,137 | 1.5% |
| Liberia | 61 | 0.1% |
| Mexico | 883 | 1.2% |
| Northern Europe | 69 | 0.1% |
| Oceania | 54 | 0.1% |
| Panama | 23 | 0.0% |
| Philippines | 122 | 0.2% |
| Scotland | 16 | 0.0% |
| South America | 125 | 0.2% |
| South Eastern Asia | 220 | 0.3% |
| Southern Europe | 12 | 0.0% |
| Spain | 12 | 0.0% |
| Taiwan | 25 | 0.0% |
| Thailand | 6 | 0.0% |
| Venezuela | 28 | 0.0% |
| Vietnam | 67 | 0.1% |
| Western Africa | 195 | 0.3% |
| Western Europe | 49 | 0.1% |
| Zimbabwe | 16 | 0.0% | View All 40 Rows |
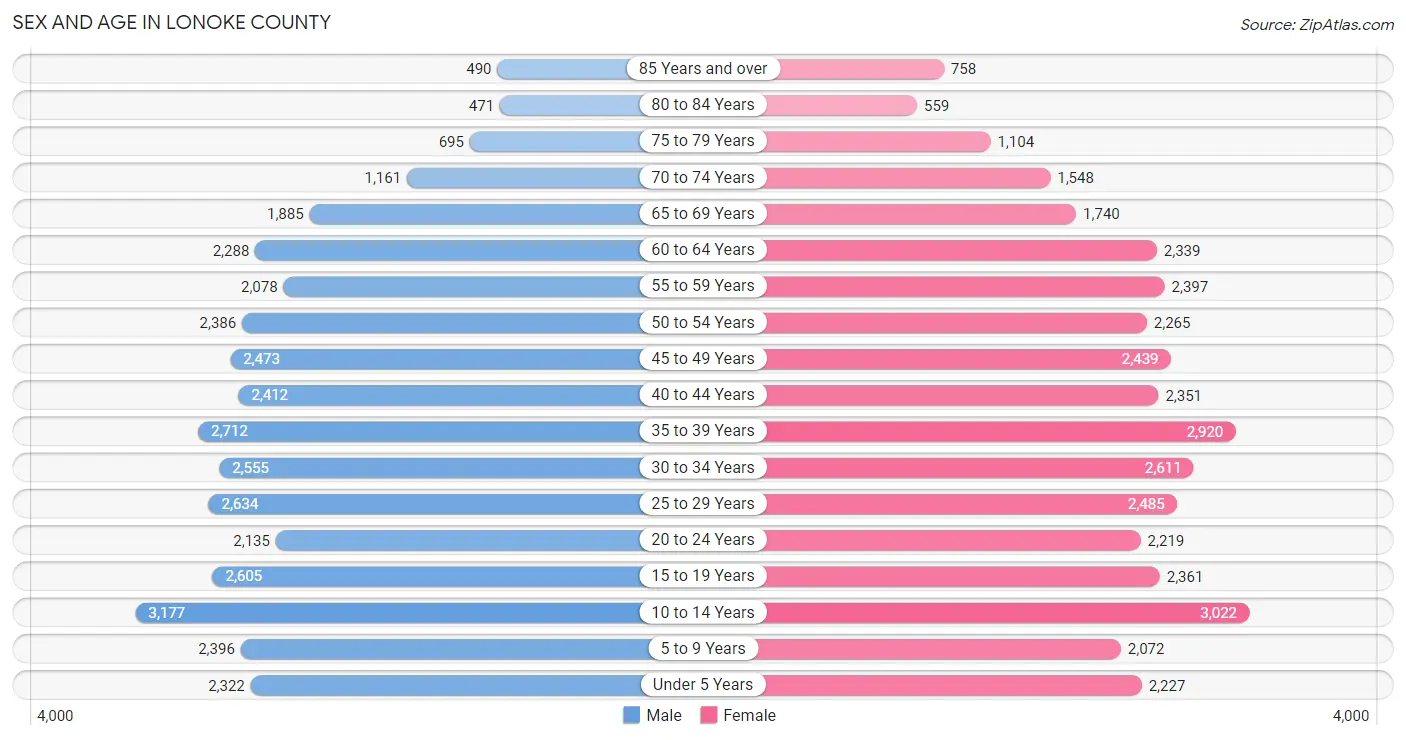
Sex and Age in Lonoke County
Sex and Age in Lonoke County
The most populous age groups in Lonoke County are 10 to 14 Years (3,177 | 8.6%) for men and 10 to 14 Years (3,022 | 8.1%) for women.
| Age Bracket | Male | Female |
| Under 5 Years | 2,322 (6.3%) | 2,227 (5.9%) |
| 5 to 9 Years | 2,396 (6.5%) | 2,072 (5.5%) |
| 10 to 14 Years | 3,177 (8.6%) | 3,022 (8.1%) |
| 15 to 19 Years | 2,605 (7.1%) | 2,361 (6.3%) |
| 20 to 24 Years | 2,135 (5.8%) | 2,219 (5.9%) |
| 25 to 29 Years | 2,634 (7.1%) | 2,485 (6.6%) |
| 30 to 34 Years | 2,555 (6.9%) | 2,611 (7.0%) |
| 35 to 39 Years | 2,712 (7.3%) | 2,920 (7.8%) |
| 40 to 44 Years | 2,412 (6.5%) | 2,351 (6.3%) |
| 45 to 49 Years | 2,473 (6.7%) | 2,439 (6.5%) |
| 50 to 54 Years | 2,386 (6.5%) | 2,265 (6.0%) |
| 55 to 59 Years | 2,078 (5.6%) | 2,397 (6.4%) |
| 60 to 64 Years | 2,288 (6.2%) | 2,339 (6.2%) |
| 65 to 69 Years | 1,885 (5.1%) | 1,740 (4.6%) |
| 70 to 74 Years | 1,161 (3.2%) | 1,548 (4.1%) |
| 75 to 79 Years | 695 (1.9%) | 1,104 (2.9%) |
| 80 to 84 Years | 471 (1.3%) | 559 (1.5%) |
| 85 Years and over | 490 (1.3%) | 758 (2.0%) |
| Total | 36,875 (100.0%) | 37,417 (100.0%) |
Families and Households in Lonoke County
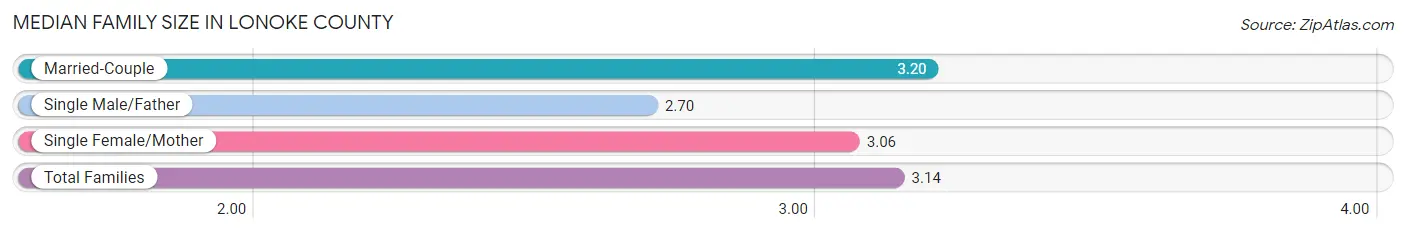
Median Family Size in Lonoke County
The median family size in Lonoke County is 3.14 persons per family, with married-couple families (14,981 | 76.2%) accounting for the largest median family size of 3.2 persons per family. On the other hand, single male/father families (1,356 | 6.9%) represent the smallest median family size with 2.70 persons per family.
| Family Type | # Families | Family Size |
| Married-Couple | 14,981 (76.2%) | 3.20 |
| Single Male/Father | 1,356 (6.9%) | 2.70 |
| Single Female/Mother | 3,310 (16.9%) | 3.06 |
| Total Families | 19,647 (100.0%) | 3.14 |
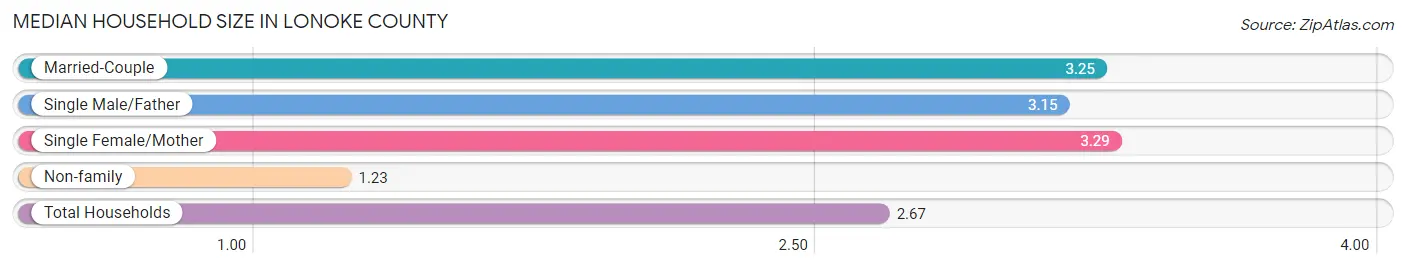
Median Household Size in Lonoke County
The median household size in Lonoke County is 2.67 persons per household, with single female/mother households (3,310 | 12.0%) accounting for the largest median household size of 3.29 persons per household. non-family households (7,935 | 28.8%) represent the smallest median household size with 1.23 persons per household.
| Household Type | # Households | Household Size |
| Married-Couple | 14,981 (54.3%) | 3.25 |
| Single Male/Father | 1,356 (4.9%) | 3.15 |
| Single Female/Mother | 3,310 (12.0%) | 3.29 |
| Non-family | 7,935 (28.8%) | 1.23 |
| Total Households | 27,582 (100.0%) | 2.67 |
Household Size by Marriage Status in Lonoke County
Out of a total of 27,582 households in Lonoke County, 19,647 (71.2%) are family households, while 7,935 (28.8%) are nonfamily households. The most numerous type of family households are 2-person households, comprising 8,102, and the most common type of nonfamily households are 1-person households, comprising 6,576.
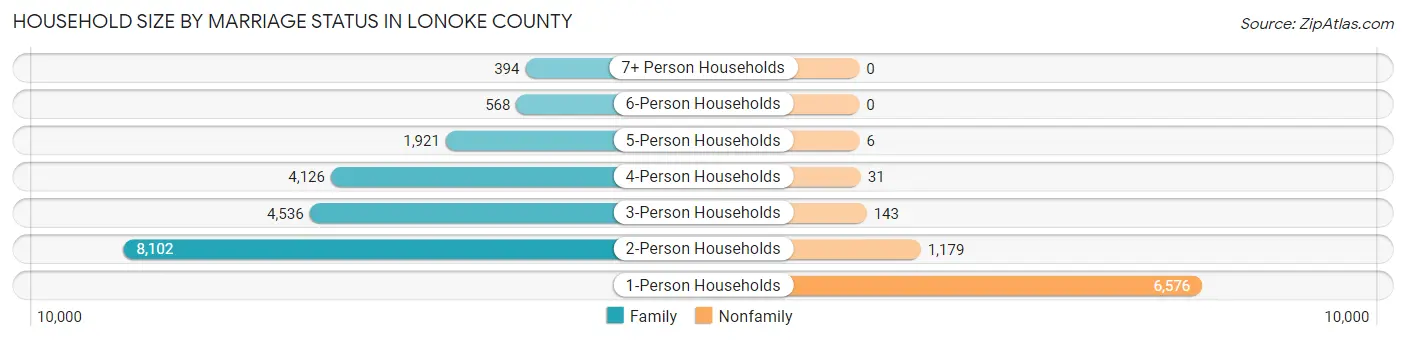
| Household Size | Family Households | Nonfamily Households |
| 1-Person Households | - | 6,576 (23.8%) |
| 2-Person Households | 8,102 (29.4%) | 1,179 (4.3%) |
| 3-Person Households | 4,536 (16.5%) | 143 (0.5%) |
| 4-Person Households | 4,126 (15.0%) | 31 (0.1%) |
| 5-Person Households | 1,921 (7.0%) | 6 (0.0%) |
| 6-Person Households | 568 (2.1%) | 0 (0.0%) |
| 7+ Person Households | 394 (1.4%) | 0 (0.0%) |
| Total | 19,647 (71.2%) | 7,935 (28.8%) |
Female Fertility in Lonoke County
Fertility by Age in Lonoke County
Average fertility rate in Lonoke County is 54.0 births per 1,000 women. Women in the age bracket of 20 to 34 years have the highest fertility rate with 94.0 births per 1,000 women. Women in the age bracket of 20 to 34 years acount for 71.6% of all women with births.
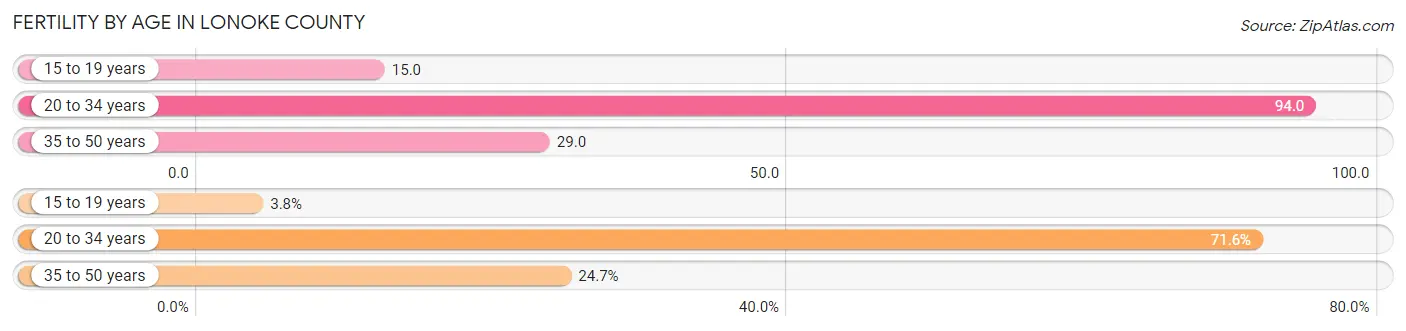
| Age Bracket | Women with Births | Births / 1,000 Women |
| 15 to 19 years | 36 (3.7%) | 15.0 |
| 20 to 34 years | 688 (71.6%) | 94.0 |
| 35 to 50 years | 237 (24.7%) | 29.0 |
| Total | 961 (100.0%) | 54.0 |
Fertility by Age by Marriage Status in Lonoke County
74.4% of women with births (961) in Lonoke County are married. The highest percentage of unmarried women with births falls into 15 to 19 years age bracket with 100.0% of them unmarried at the time of birth, while the lowest percentage of unmarried women with births belong to 35 to 50 years age bracket with 5.1% of them unmarried.
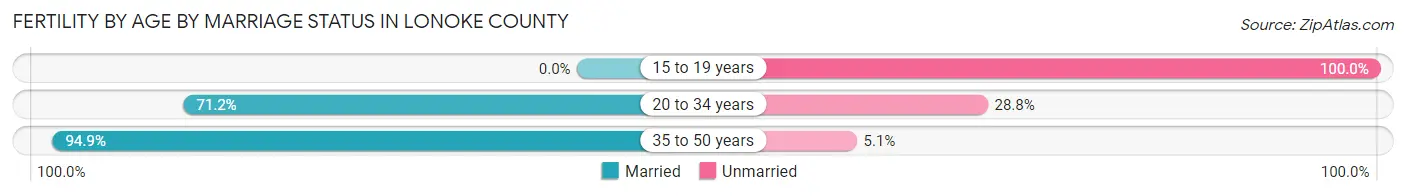
| Age Bracket | Married | Unmarried |
| 15 to 19 years | 0 (0.0%) | 36 (100.0%) |
| 20 to 34 years | 490 (71.2%) | 198 (28.8%) |
| 35 to 50 years | 225 (94.9%) | 12 (5.1%) |
| Total | 715 (74.4%) | 246 (25.6%) |
Fertility by Education in Lonoke County
Average fertility rate in Lonoke County is 54.0 births per 1,000 women. Women with the education attainment of graduate degree have the highest fertility rate of 66.0 births per 1,000 women, while women with the education attainment of less than high school have the lowest fertility at 31.0 births per 1,000 women. Women with the education attainment of college or associate's degree represent 38.9% of all women with births.
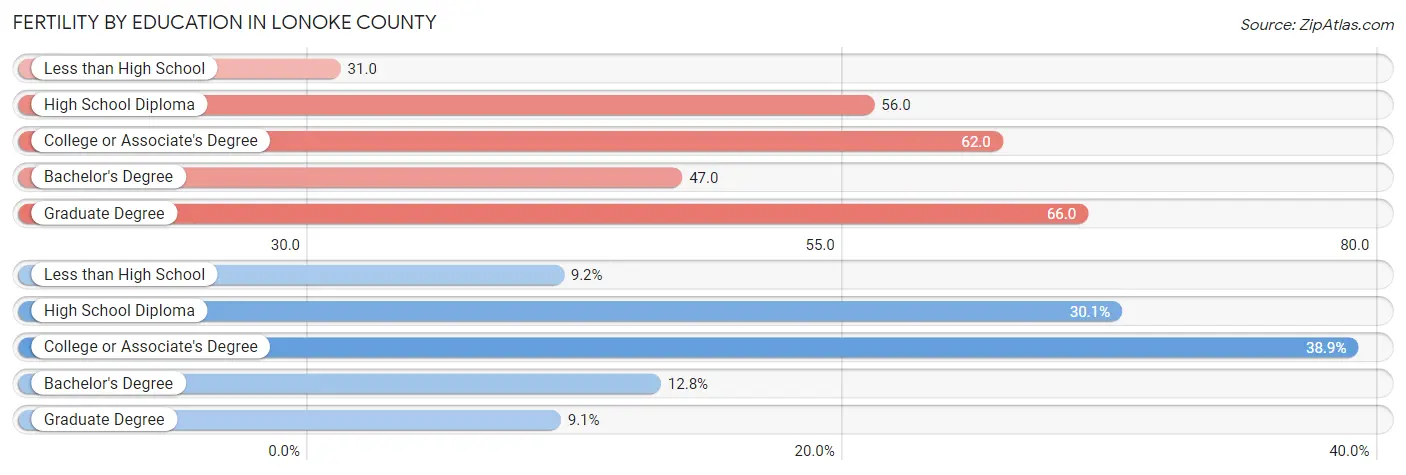
| Educational Attainment | Women with Births | Births / 1,000 Women |
| Less than High School | 88 (9.2%) | 31.0 |
| High School Diploma | 289 (30.1%) | 56.0 |
| College or Associate's Degree | 374 (38.9%) | 62.0 |
| Bachelor's Degree | 123 (12.8%) | 47.0 |
| Graduate Degree | 87 (9.0%) | 66.0 |
| Total | 961 (100.0%) | 54.0 |
Fertility by Education by Marriage Status in Lonoke County
25.6% of women with births in Lonoke County are unmarried. Women with the educational attainment of bachelor's degree are most likely to be married with 100.0% of them married at childbirth, while women with the educational attainment of less than high school are least likely to be married with 64.8% of them unmarried at childbirth.
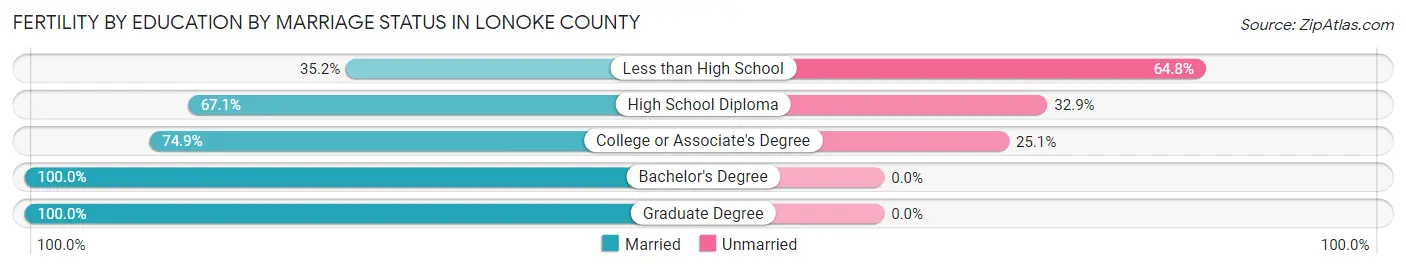
| Educational Attainment | Married | Unmarried |
| Less than High School | 31 (35.2%) | 57 (64.8%) |
| High School Diploma | 194 (67.1%) | 95 (32.9%) |
| College or Associate's Degree | 280 (74.9%) | 94 (25.1%) |
| Bachelor's Degree | 123 (100.0%) | 0 (0.0%) |
| Graduate Degree | 87 (100.0%) | 0 (0.0%) |
| Total | 715 (74.4%) | 246 (25.6%) |
Employment Characteristics in Lonoke County
Employment by Class of Employer in Lonoke County
Among the 34,314 employed individuals in Lonoke County, private company employees (21,993 | 64.1%), federal government employees (2,919 | 8.5%), and local government employees (2,193 | 6.4%) make up the most common classes of employment.
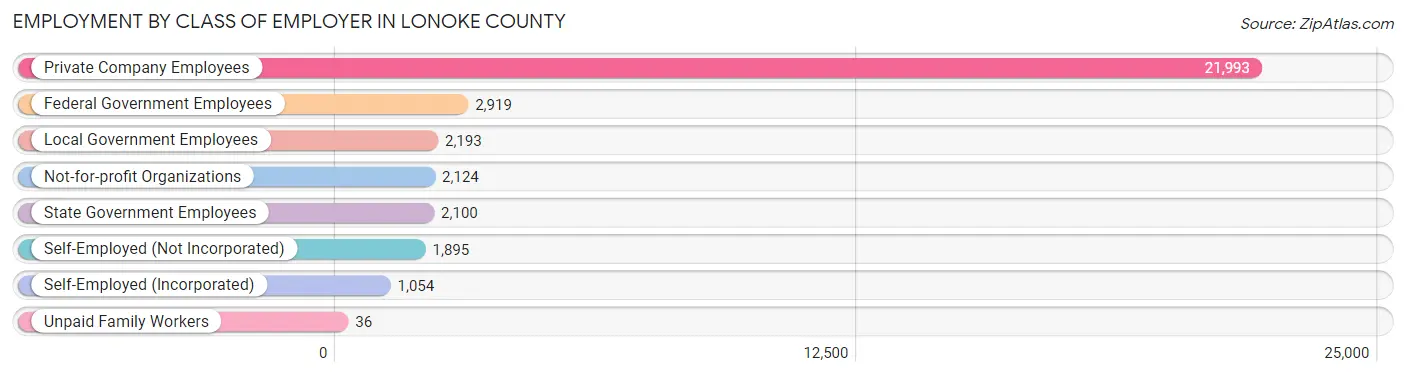
| Employer Class | # Employees | % Employees |
| Private Company Employees | 21,993 | 64.1% |
| Self-Employed (Incorporated) | 1,054 | 3.1% |
| Self-Employed (Not Incorporated) | 1,895 | 5.5% |
| Not-for-profit Organizations | 2,124 | 6.2% |
| Local Government Employees | 2,193 | 6.4% |
| State Government Employees | 2,100 | 6.1% |
| Federal Government Employees | 2,919 | 8.5% |
| Unpaid Family Workers | 36 | 0.1% |
| Total | 34,314 | 100.0% |
Employment Status by Age in Lonoke County
According to the labor force statistics for Lonoke County, out of the total population over 16 years of age (58,060), 62.5% or 36,288 individuals are in the labor force, with 4.5% or 1,633 of them unemployed. The age group with the highest labor force participation rate is 45 to 54 years, with 82.4% or 7,880 individuals in the labor force. Within the labor force, the 30 to 34 years age range has the highest percentage of unemployed individuals, with 9.9% or 418 of them being unemployed.
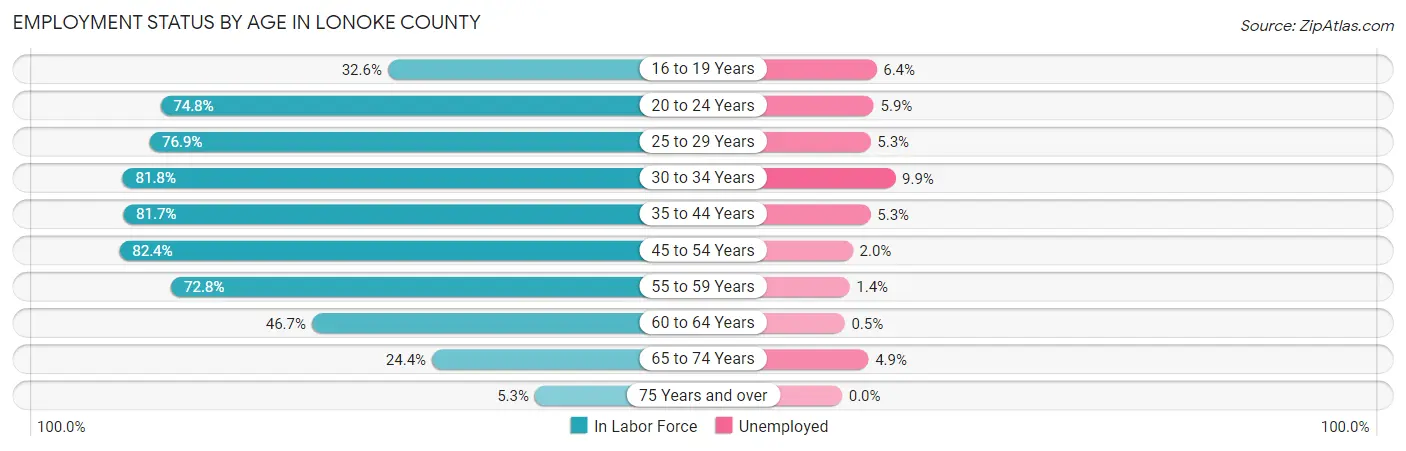
| Age Bracket | In Labor Force | Unemployed |
| 16 to 19 Years | 1,288 (32.6%) | 82 (6.4%) |
| 20 to 24 Years | 3,257 (74.8%) | 192 (5.9%) |
| 25 to 29 Years | 3,937 (76.9%) | 209 (5.3%) |
| 30 to 34 Years | 4,226 (81.8%) | 418 (9.9%) |
| 35 to 44 Years | 8,493 (81.7%) | 450 (5.3%) |
| 45 to 54 Years | 7,880 (82.4%) | 158 (2.0%) |
| 55 to 59 Years | 3,258 (72.8%) | 46 (1.4%) |
| 60 to 64 Years | 2,161 (46.7%) | 11 (0.5%) |
| 65 to 74 Years | 1,545 (24.4%) | 76 (4.9%) |
| 75 Years and over | 216 (5.3%) | 0 (0.0%) |
| Total | 36,288 (62.5%) | 1,633 (4.5%) |
Employment Status by Educational Attainment in Lonoke County
According to labor force statistics for Lonoke County, 76.1% of individuals (29,942) out of the total population between 25 and 64 years of age (39,345) are in the labor force, with 4.3% or 1,288 of them being unemployed. The group with the highest labor force participation rate are those with the educational attainment of bachelor's degree or higher, with 89.5% or 7,506 individuals in the labor force. Within the labor force, individuals with less than high school education have the highest percentage of unemployment, with 16.5% or 306 of them being unemployed.
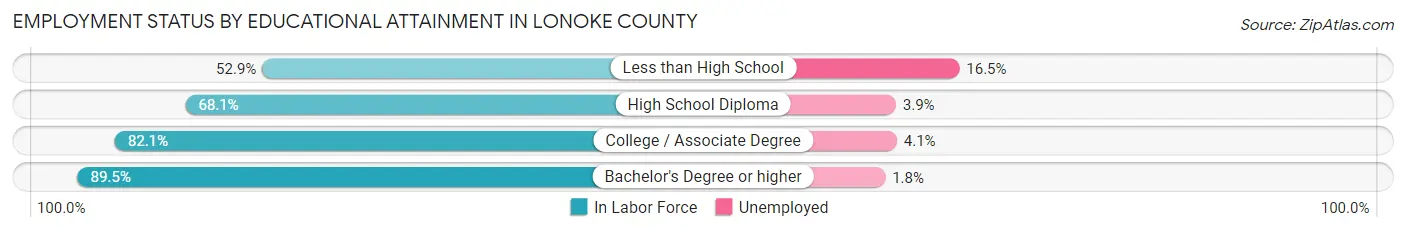
| Educational Attainment | In Labor Force | Unemployed |
| Less than High School | 1,853 (52.9%) | 578 (16.5%) |
| High School Diploma | 9,507 (68.1%) | 544 (3.9%) |
| College / Associate Degree | 11,079 (82.1%) | 553 (4.1%) |
| Bachelor's Degree or higher | 7,506 (89.5%) | 151 (1.8%) |
| Total | 29,942 (76.1%) | 1,692 (4.3%) |
Employment Occupations by Sex in Lonoke County
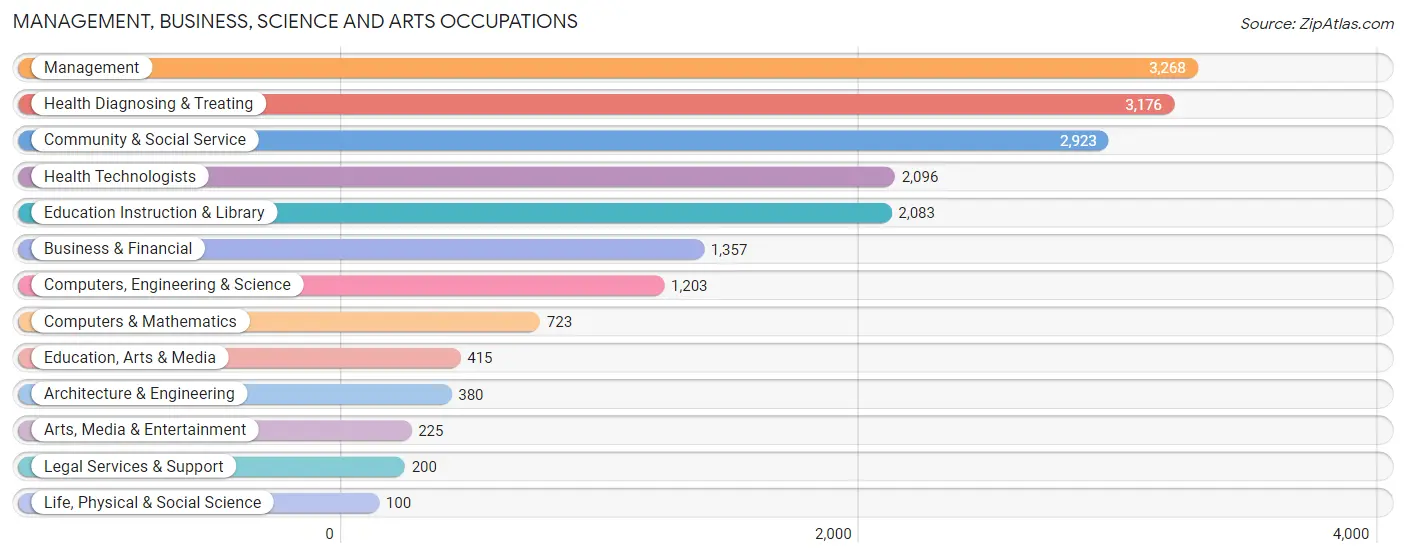
Management, Business, Science and Arts Occupations
The most common Management, Business, Science and Arts occupations in Lonoke County are Management (3,268 | 9.8%), Health Diagnosing & Treating (3,176 | 9.5%), Community & Social Service (2,923 | 8.7%), Health Technologists (2,096 | 6.3%), and Education Instruction & Library (2,083 | 6.2%).
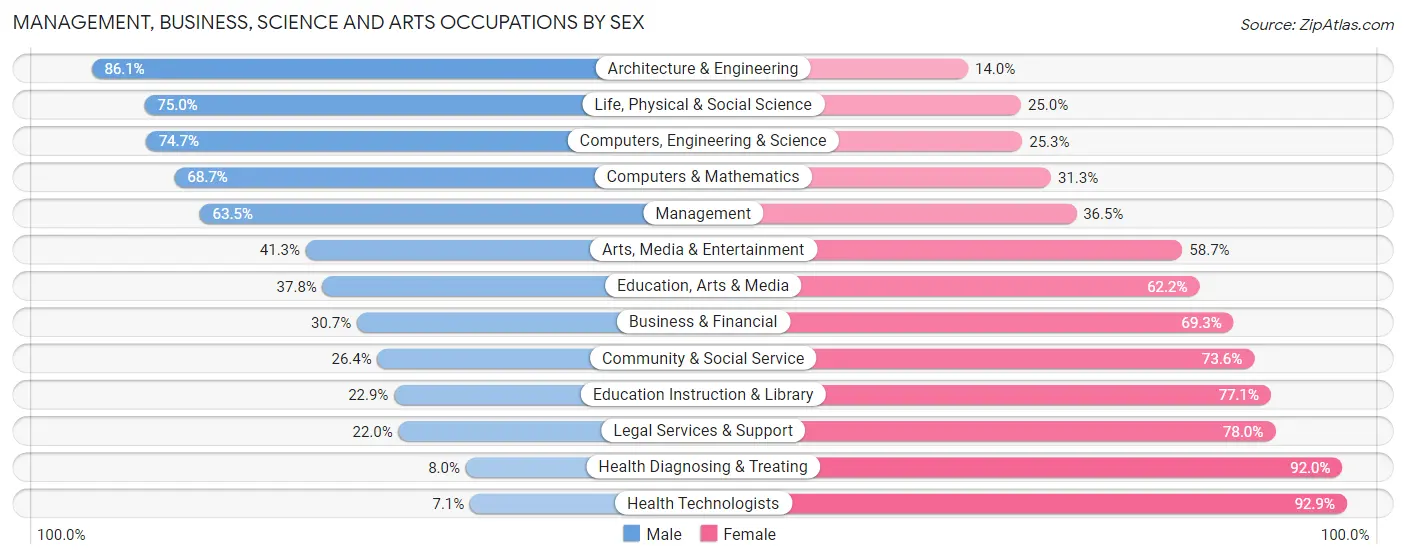
Management, Business, Science and Arts Occupations by Sex
Within the Management, Business, Science and Arts occupations in Lonoke County, the most male-oriented occupations are Architecture & Engineering (86.1%), Life, Physical & Social Science (75.0%), and Computers, Engineering & Science (74.7%), while the most female-oriented occupations are Health Technologists (92.9%), Health Diagnosing & Treating (92.0%), and Legal Services & Support (78.0%).
| Occupation | Male | Female |
| Management | 2,075 (63.5%) | 1,193 (36.5%) |
| Business & Financial | 416 (30.7%) | 941 (69.3%) |
| Computers, Engineering & Science | 899 (74.7%) | 304 (25.3%) |
| Computers & Mathematics | 497 (68.7%) | 226 (31.3%) |
| Architecture & Engineering | 327 (86.1%) | 53 (14.0%) |
| Life, Physical & Social Science | 75 (75.0%) | 25 (25.0%) |
| Community & Social Service | 771 (26.4%) | 2,152 (73.6%) |
| Education, Arts & Media | 157 (37.8%) | 258 (62.2%) |
| Legal Services & Support | 44 (22.0%) | 156 (78.0%) |
| Education Instruction & Library | 477 (22.9%) | 1,606 (77.1%) |
| Arts, Media & Entertainment | 93 (41.3%) | 132 (58.7%) |
| Health Diagnosing & Treating | 253 (8.0%) | 2,923 (92.0%) |
| Health Technologists | 148 (7.1%) | 1,948 (92.9%) |
| Total (Category) | 4,414 (37.0%) | 7,513 (63.0%) |
| Total (Overall) | 16,763 (50.2%) | 16,651 (49.8%) |
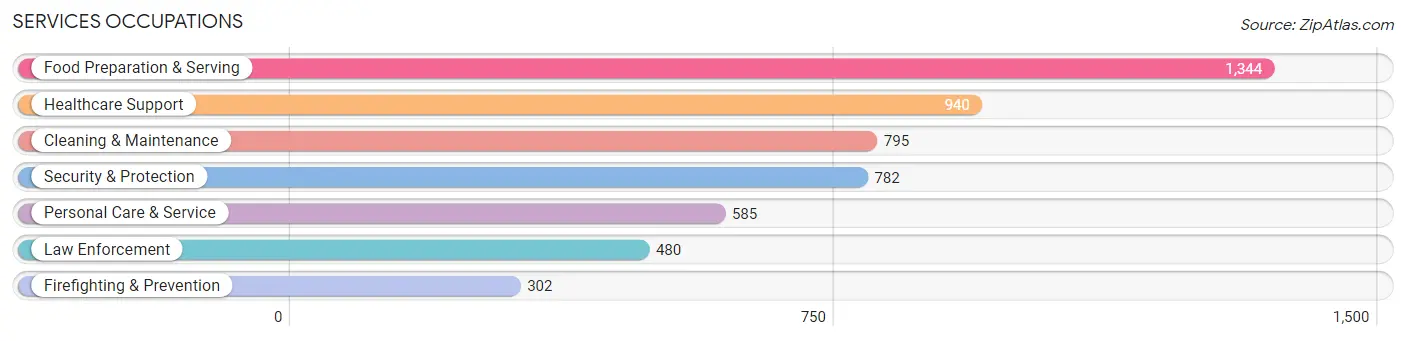
Services Occupations
The most common Services occupations in Lonoke County are Food Preparation & Serving (1,344 | 4.0%), Healthcare Support (940 | 2.8%), Cleaning & Maintenance (795 | 2.4%), Security & Protection (782 | 2.3%), and Personal Care & Service (585 | 1.8%).
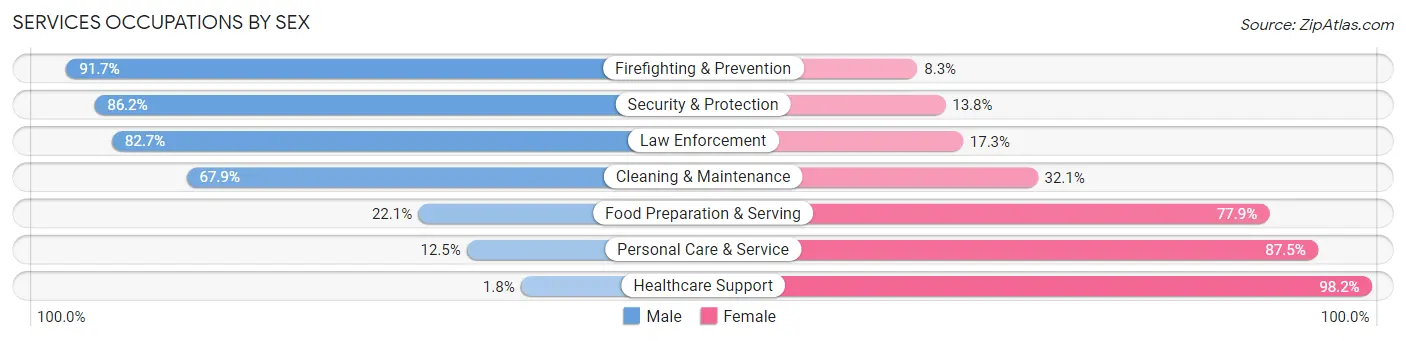
Services Occupations by Sex
Within the Services occupations in Lonoke County, the most male-oriented occupations are Firefighting & Prevention (91.7%), Security & Protection (86.2%), and Law Enforcement (82.7%), while the most female-oriented occupations are Healthcare Support (98.2%), Personal Care & Service (87.5%), and Food Preparation & Serving (77.9%).
| Occupation | Male | Female |
| Healthcare Support | 17 (1.8%) | 923 (98.2%) |
| Security & Protection | 674 (86.2%) | 108 (13.8%) |
| Firefighting & Prevention | 277 (91.7%) | 25 (8.3%) |
| Law Enforcement | 397 (82.7%) | 83 (17.3%) |
| Food Preparation & Serving | 297 (22.1%) | 1,047 (77.9%) |
| Cleaning & Maintenance | 540 (67.9%) | 255 (32.1%) |
| Personal Care & Service | 73 (12.5%) | 512 (87.5%) |
| Total (Category) | 1,601 (36.0%) | 2,845 (64.0%) |
| Total (Overall) | 16,763 (50.2%) | 16,651 (49.8%) |
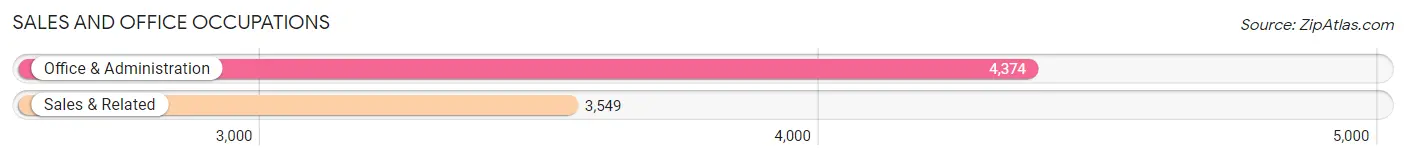
Sales and Office Occupations
The most common Sales and Office occupations in Lonoke County are Office & Administration (4,374 | 13.1%), and Sales & Related (3,549 | 10.6%).
Sales and Office Occupations by Sex
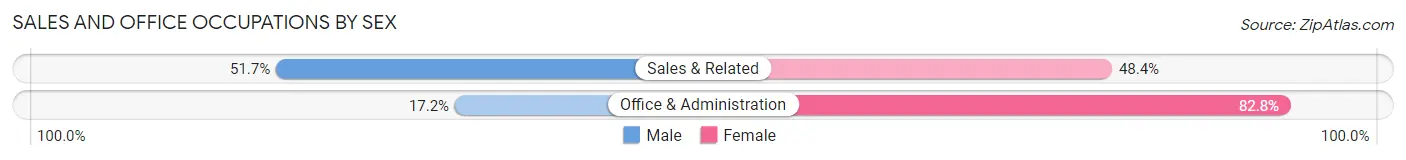
| Occupation | Male | Female |
| Sales & Related | 1,833 (51.6%) | 1,716 (48.3%) |
| Office & Administration | 754 (17.2%) | 3,620 (82.8%) |
| Total (Category) | 2,587 (32.7%) | 5,336 (67.3%) |
| Total (Overall) | 16,763 (50.2%) | 16,651 (49.8%) |
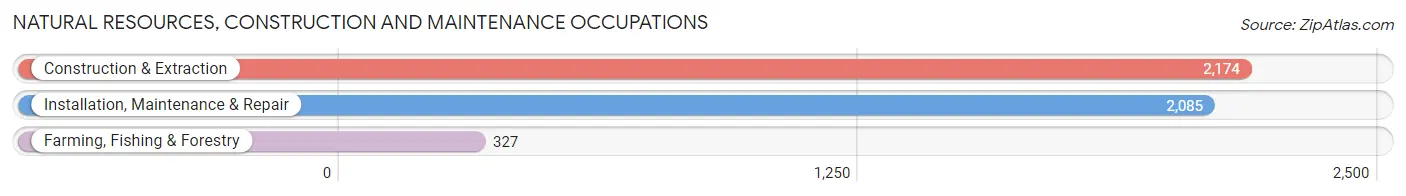
Natural Resources, Construction and Maintenance Occupations
The most common Natural Resources, Construction and Maintenance occupations in Lonoke County are Construction & Extraction (2,174 | 6.5%), Installation, Maintenance & Repair (2,085 | 6.2%), and Farming, Fishing & Forestry (327 | 1.0%).
Natural Resources, Construction and Maintenance Occupations by Sex
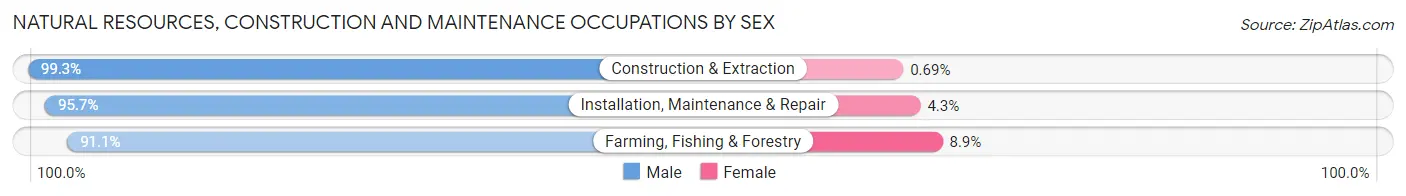
| Occupation | Male | Female |
| Farming, Fishing & Forestry | 298 (91.1%) | 29 (8.9%) |
| Construction & Extraction | 2,159 (99.3%) | 15 (0.7%) |
| Installation, Maintenance & Repair | 1,996 (95.7%) | 89 (4.3%) |
| Total (Category) | 4,453 (97.1%) | 133 (2.9%) |
| Total (Overall) | 16,763 (50.2%) | 16,651 (49.8%) |
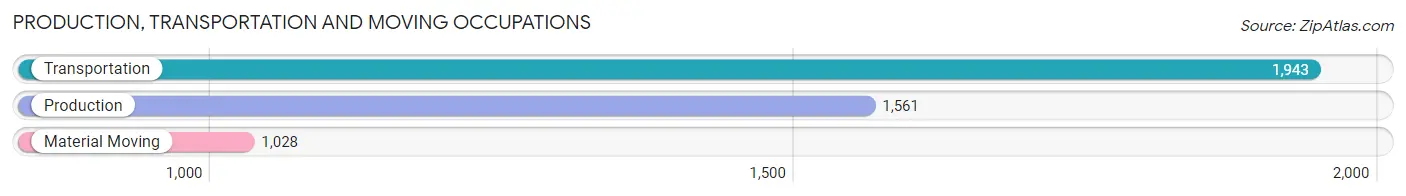
Production, Transportation and Moving Occupations
The most common Production, Transportation and Moving occupations in Lonoke County are Transportation (1,943 | 5.8%), Production (1,561 | 4.7%), and Material Moving (1,028 | 3.1%).
Production, Transportation and Moving Occupations by Sex
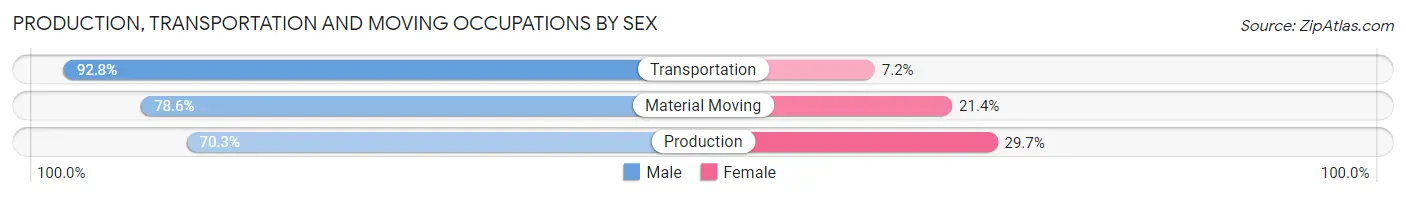
| Occupation | Male | Female |
| Production | 1,097 (70.3%) | 464 (29.7%) |
| Transportation | 1,803 (92.8%) | 140 (7.2%) |
| Material Moving | 808 (78.6%) | 220 (21.4%) |
| Total (Category) | 3,708 (81.8%) | 824 (18.2%) |
| Total (Overall) | 16,763 (50.2%) | 16,651 (49.8%) |
Employment Industries by Sex in Lonoke County
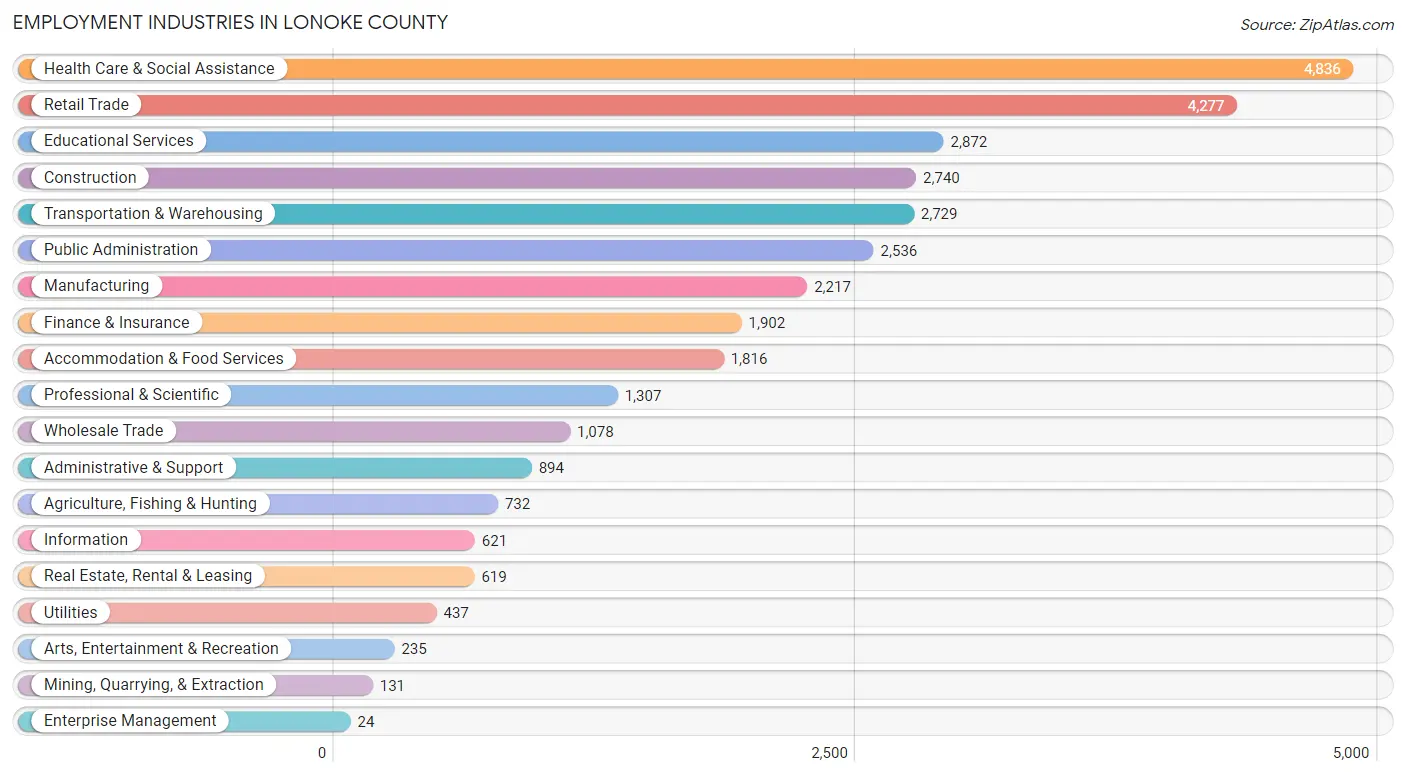
Employment Industries in Lonoke County
The major employment industries in Lonoke County include Health Care & Social Assistance (4,836 | 14.5%), Retail Trade (4,277 | 12.8%), Educational Services (2,872 | 8.6%), Construction (2,740 | 8.2%), and Transportation & Warehousing (2,729 | 8.2%).
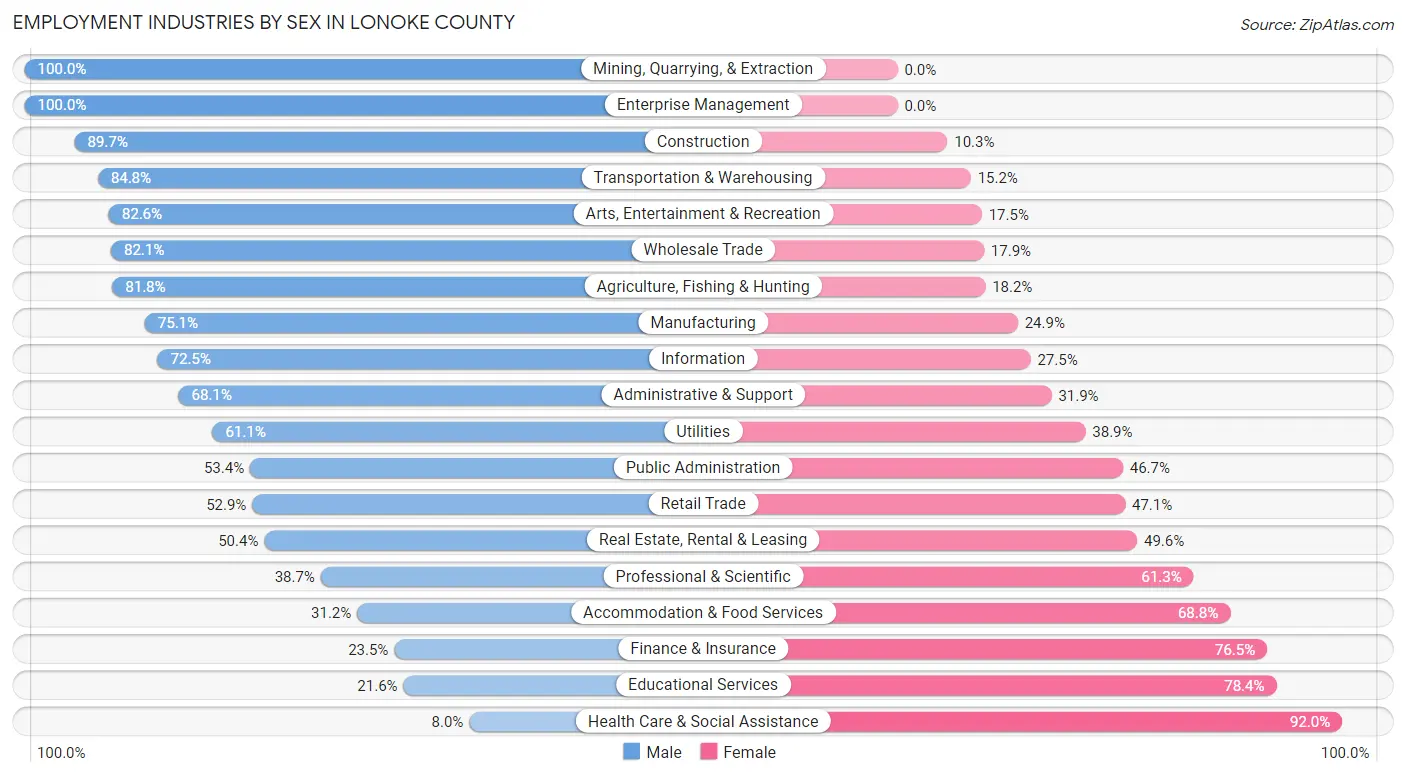
Employment Industries by Sex in Lonoke County
The Lonoke County industries that see more men than women are Mining, Quarrying, & Extraction (100.0%), Enterprise Management (100.0%), and Construction (89.7%), whereas the industries that tend to have a higher number of women are Health Care & Social Assistance (92.0%), Educational Services (78.4%), and Finance & Insurance (76.5%).
| Industry | Male | Female |
| Agriculture, Fishing & Hunting | 599 (81.8%) | 133 (18.2%) |
| Mining, Quarrying, & Extraction | 131 (100.0%) | 0 (0.0%) |
| Construction | 2,457 (89.7%) | 283 (10.3%) |
| Manufacturing | 1,665 (75.1%) | 552 (24.9%) |
| Wholesale Trade | 885 (82.1%) | 193 (17.9%) |
| Retail Trade | 2,262 (52.9%) | 2,015 (47.1%) |
| Transportation & Warehousing | 2,315 (84.8%) | 414 (15.2%) |
| Utilities | 267 (61.1%) | 170 (38.9%) |
| Information | 450 (72.5%) | 171 (27.5%) |
| Finance & Insurance | 447 (23.5%) | 1,455 (76.5%) |
| Real Estate, Rental & Leasing | 312 (50.4%) | 307 (49.6%) |
| Professional & Scientific | 506 (38.7%) | 801 (61.3%) |
| Enterprise Management | 24 (100.0%) | 0 (0.0%) |
| Administrative & Support | 609 (68.1%) | 285 (31.9%) |
| Educational Services | 620 (21.6%) | 2,252 (78.4%) |
| Health Care & Social Assistance | 386 (8.0%) | 4,450 (92.0%) |
| Arts, Entertainment & Recreation | 194 (82.6%) | 41 (17.4%) |
| Accommodation & Food Services | 566 (31.2%) | 1,250 (68.8%) |
| Public Administration | 1,353 (53.3%) | 1,183 (46.7%) |
| Total | 16,763 (50.2%) | 16,651 (49.8%) |
Education in Lonoke County
School Enrollment in Lonoke County
The most common levels of schooling among the 17,344 students in Lonoke County are middle school (4,499 | 25.9%), high school (4,454 | 25.7%), and elementary school (3,575 | 20.6%).
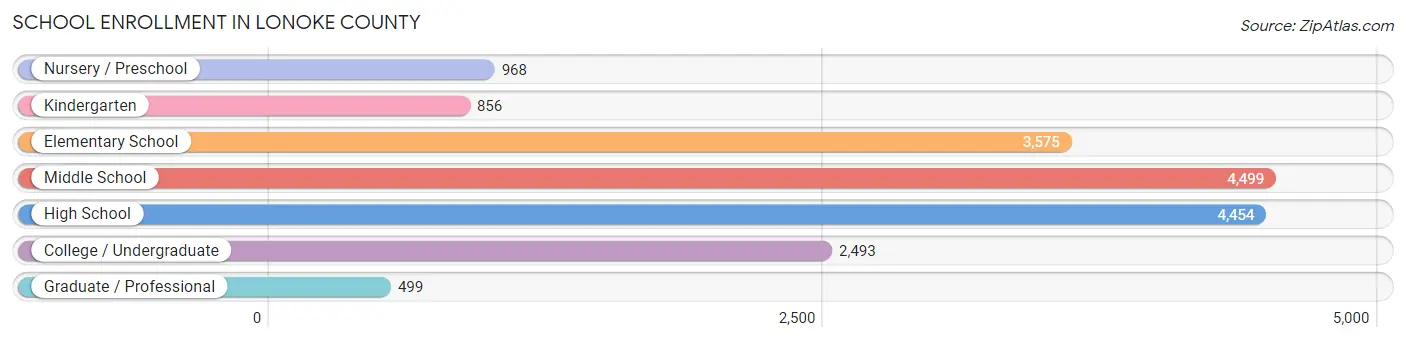
| School Level | # Students | % Students |
| Nursery / Preschool | 968 | 5.6% |
| Kindergarten | 856 | 4.9% |
| Elementary School | 3,575 | 20.6% |
| Middle School | 4,499 | 25.9% |
| High School | 4,454 | 25.7% |
| College / Undergraduate | 2,493 | 14.4% |
| Graduate / Professional | 499 | 2.9% |
| Total | 17,344 | 100.0% |
School Enrollment by Age by Funding Source in Lonoke County
Out of a total of 17,344 students who are enrolled in schools in Lonoke County, 1,734 (10.0%) attend a private institution, while the remaining 15,610 (90.0%) are enrolled in public schools. The age group of 3 to 4 year olds has the highest likelihood of being enrolled in private schools, with 156 (26.6% in the age bracket) enrolled. Conversely, the age group of 15 to 17 year olds has the lowest likelihood of being enrolled in a private school, with 3,180 (97.5% in the age bracket) attending a public institution.
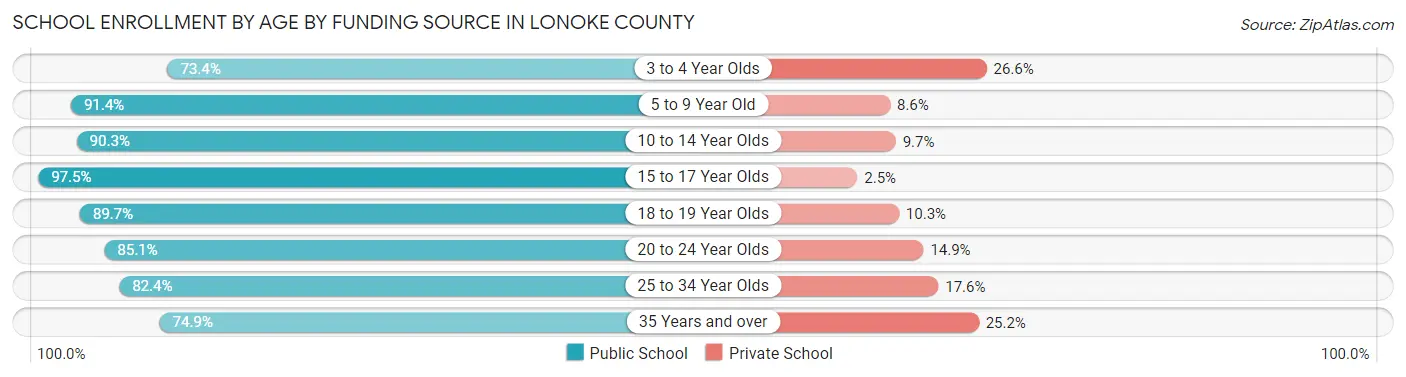
| Age Bracket | Public School | Private School |
| 3 to 4 Year Olds | 430 (73.4%) | 156 (26.6%) |
| 5 to 9 Year Old | 3,618 (91.4%) | 342 (8.6%) |
| 10 to 14 Year Olds | 5,464 (90.3%) | 587 (9.7%) |
| 15 to 17 Year Olds | 3,180 (97.5%) | 83 (2.5%) |
| 18 to 19 Year Olds | 837 (89.7%) | 96 (10.3%) |
| 20 to 24 Year Olds | 825 (85.1%) | 144 (14.9%) |
| 25 to 34 Year Olds | 743 (82.4%) | 159 (17.6%) |
| 35 Years and over | 509 (74.9%) | 171 (25.2%) |
| Total | 15,610 (90.0%) | 1,734 (10.0%) |
Educational Attainment by Field of Study in Lonoke County
Business (1,965 | 18.4%), science & technology (1,851 | 17.3%), education (1,786 | 16.7%), arts & humanities (934 | 8.7%), and bio, nature & agricultural (911 | 8.5%) are the most common fields of study among 10,669 individuals in Lonoke County who have obtained a bachelor's degree or higher.
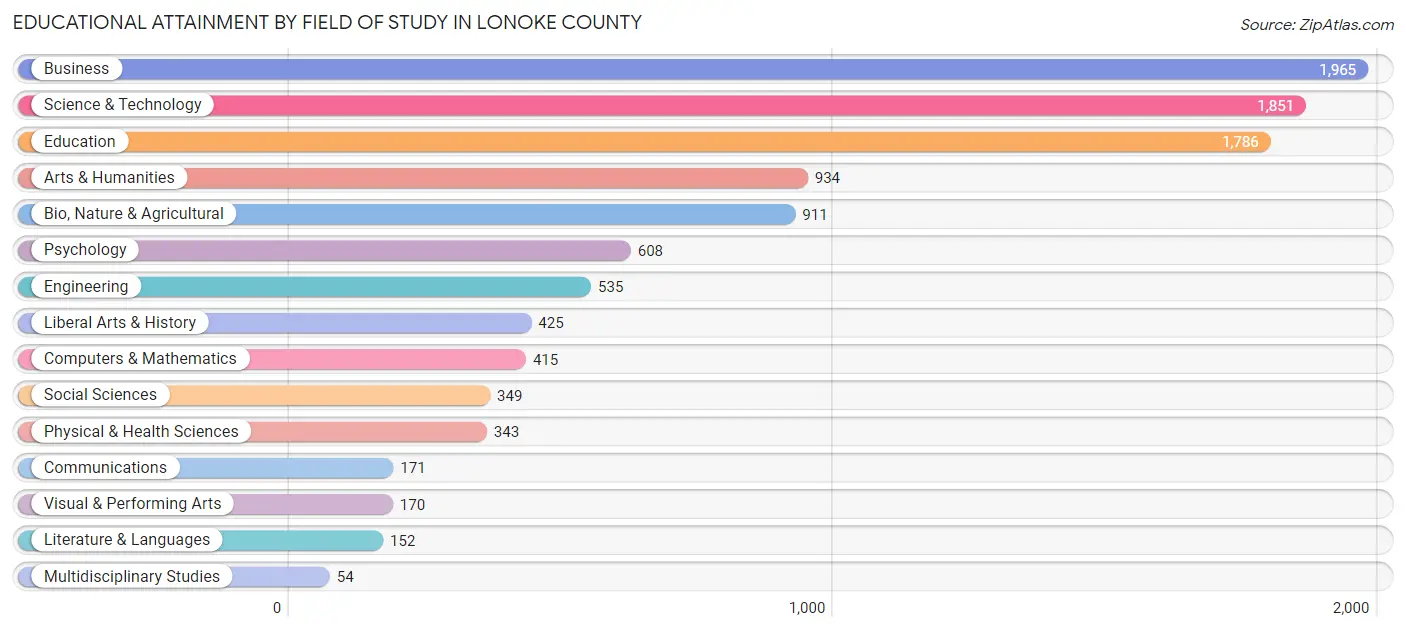
| Field of Study | # Graduates | % Graduates |
| Computers & Mathematics | 415 | 3.9% |
| Bio, Nature & Agricultural | 911 | 8.5% |
| Physical & Health Sciences | 343 | 3.2% |
| Psychology | 608 | 5.7% |
| Social Sciences | 349 | 3.3% |
| Engineering | 535 | 5.0% |
| Multidisciplinary Studies | 54 | 0.5% |
| Science & Technology | 1,851 | 17.3% |
| Business | 1,965 | 18.4% |
| Education | 1,786 | 16.7% |
| Literature & Languages | 152 | 1.4% |
| Liberal Arts & History | 425 | 4.0% |
| Visual & Performing Arts | 170 | 1.6% |
| Communications | 171 | 1.6% |
| Arts & Humanities | 934 | 8.7% |
| Total | 10,669 | 100.0% |
Transportation & Commute in Lonoke County
Vehicle Availability by Sex in Lonoke County
The most prevalent vehicle ownership categories in Lonoke County are males with 2 vehicles (7,484, accounting for 42.2%) and females with 2 vehicles (7,006, making up 45.2%).
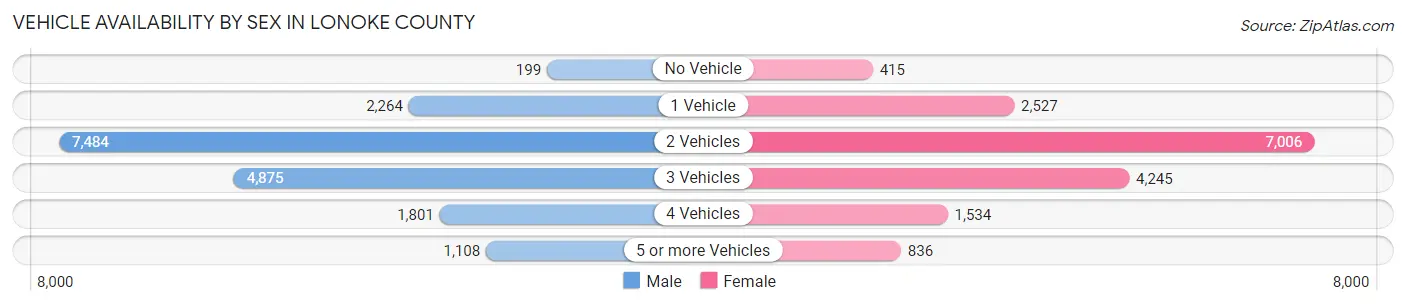
| Vehicles Available | Male | Female |
| No Vehicle | 199 (1.1%) | 415 (2.5%) |
| 1 Vehicle | 2,264 (12.8%) | 2,527 (15.3%) |
| 2 Vehicles | 7,484 (42.2%) | 7,006 (42.3%) |
| 3 Vehicles | 4,875 (27.5%) | 4,245 (25.6%) |
| 4 Vehicles | 1,801 (10.2%) | 1,534 (9.3%) |
| 5 or more Vehicles | 1,108 (6.2%) | 836 (5.1%) |
| Total | 17,731 (100.0%) | 16,563 (100.0%) |
Commute Time in Lonoke County
The most frequently occuring commute durations in Lonoke County are 30 to 34 minutes (5,736 commuters, 17.7%), 20 to 24 minutes (4,202 commuters, 12.9%), and 45 to 59 minutes (4,182 commuters, 12.9%).
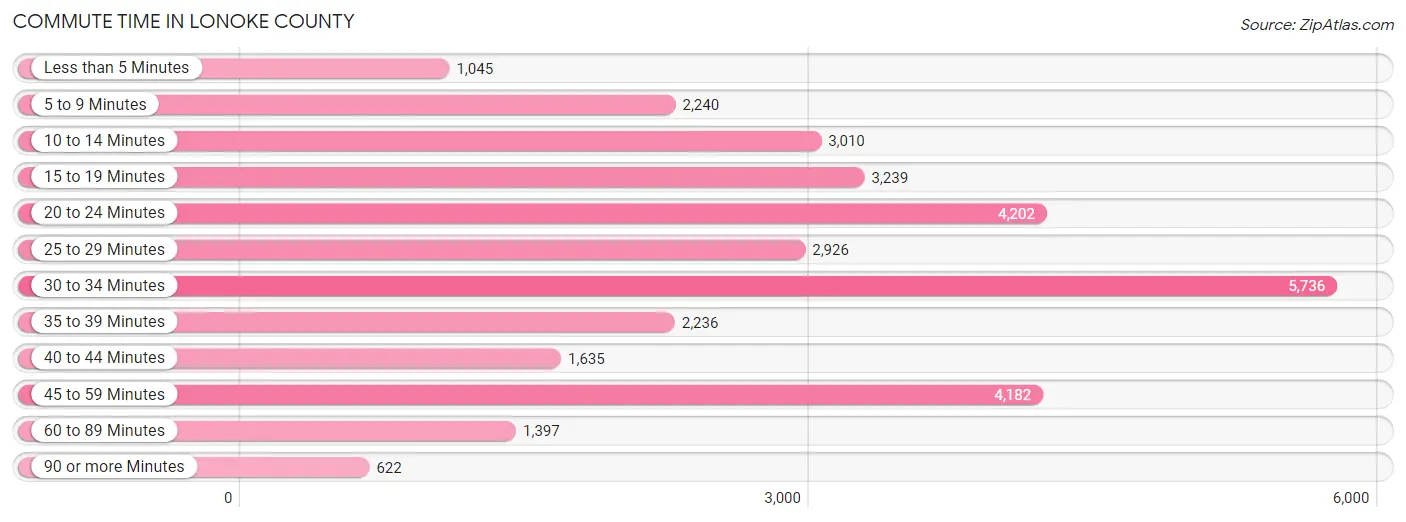
| Commute Time | # Commuters | % Commuters |
| Less than 5 Minutes | 1,045 | 3.2% |
| 5 to 9 Minutes | 2,240 | 6.9% |
| 10 to 14 Minutes | 3,010 | 9.3% |
| 15 to 19 Minutes | 3,239 | 10.0% |
| 20 to 24 Minutes | 4,202 | 12.9% |
| 25 to 29 Minutes | 2,926 | 9.0% |
| 30 to 34 Minutes | 5,736 | 17.7% |
| 35 to 39 Minutes | 2,236 | 6.9% |
| 40 to 44 Minutes | 1,635 | 5.0% |
| 45 to 59 Minutes | 4,182 | 12.9% |
| 60 to 89 Minutes | 1,397 | 4.3% |
| 90 or more Minutes | 622 | 1.9% |
Commute Time by Sex in Lonoke County
The most common commute times in Lonoke County are 30 to 34 minutes (3,338 commuters, 19.8%) for males and 30 to 34 minutes (2,398 commuters, 15.4%) for females.
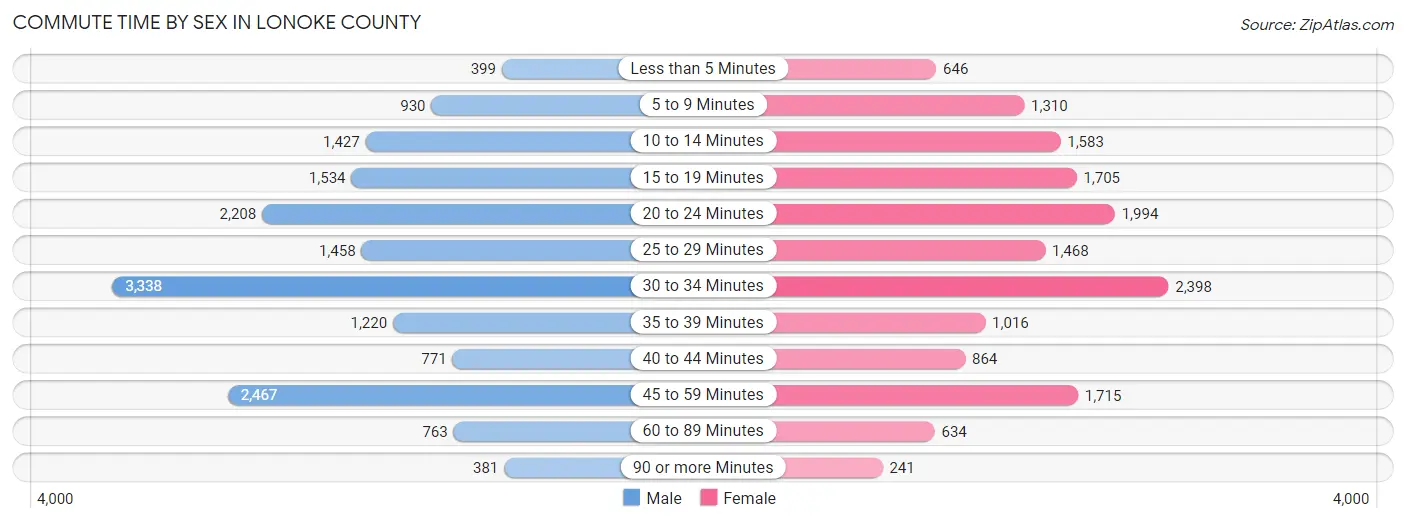
| Commute Time | Male | Female |
| Less than 5 Minutes | 399 (2.4%) | 646 (4.2%) |
| 5 to 9 Minutes | 930 (5.5%) | 1,310 (8.4%) |
| 10 to 14 Minutes | 1,427 (8.5%) | 1,583 (10.2%) |
| 15 to 19 Minutes | 1,534 (9.1%) | 1,705 (11.0%) |
| 20 to 24 Minutes | 2,208 (13.1%) | 1,994 (12.8%) |
| 25 to 29 Minutes | 1,458 (8.6%) | 1,468 (9.4%) |
| 30 to 34 Minutes | 3,338 (19.8%) | 2,398 (15.4%) |
| 35 to 39 Minutes | 1,220 (7.2%) | 1,016 (6.5%) |
| 40 to 44 Minutes | 771 (4.6%) | 864 (5.6%) |
| 45 to 59 Minutes | 2,467 (14.6%) | 1,715 (11.0%) |
| 60 to 89 Minutes | 763 (4.5%) | 634 (4.1%) |
| 90 or more Minutes | 381 (2.2%) | 241 (1.5%) |
Time of Departure to Work by Sex in Lonoke County
The most frequent times of departure to work in Lonoke County are 6:00 AM to 6:29 AM (3,075, 18.2%) for males and 7:30 AM to 7:59 AM (2,611, 16.8%) for females.
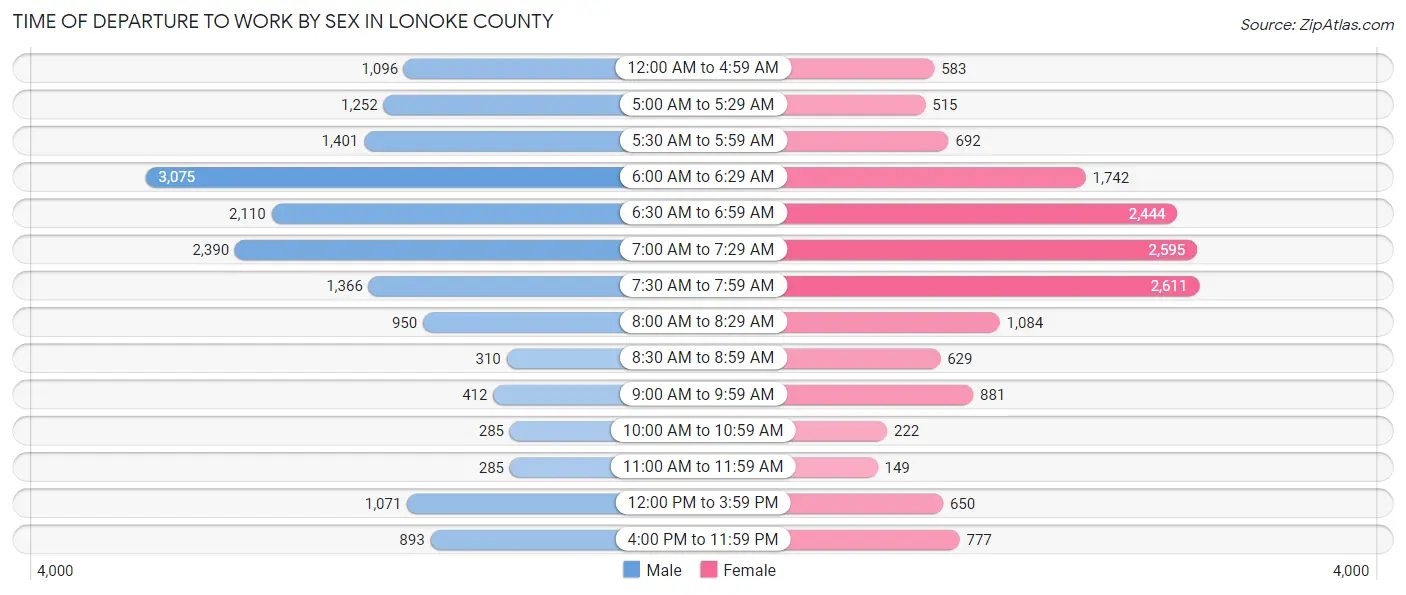
| Time of Departure | Male | Female |
| 12:00 AM to 4:59 AM | 1,096 (6.5%) | 583 (3.7%) |
| 5:00 AM to 5:29 AM | 1,252 (7.4%) | 515 (3.3%) |
| 5:30 AM to 5:59 AM | 1,401 (8.3%) | 692 (4.4%) |
| 6:00 AM to 6:29 AM | 3,075 (18.2%) | 1,742 (11.2%) |
| 6:30 AM to 6:59 AM | 2,110 (12.5%) | 2,444 (15.7%) |
| 7:00 AM to 7:29 AM | 2,390 (14.1%) | 2,595 (16.7%) |
| 7:30 AM to 7:59 AM | 1,366 (8.1%) | 2,611 (16.8%) |
| 8:00 AM to 8:29 AM | 950 (5.6%) | 1,084 (7.0%) |
| 8:30 AM to 8:59 AM | 310 (1.8%) | 629 (4.0%) |
| 9:00 AM to 9:59 AM | 412 (2.4%) | 881 (5.7%) |
| 10:00 AM to 10:59 AM | 285 (1.7%) | 222 (1.4%) |
| 11:00 AM to 11:59 AM | 285 (1.7%) | 149 (1.0%) |
| 12:00 PM to 3:59 PM | 1,071 (6.3%) | 650 (4.2%) |
| 4:00 PM to 11:59 PM | 893 (5.3%) | 777 (5.0%) |
| Total | 16,896 (100.0%) | 15,574 (100.0%) |
Housing Occupancy in Lonoke County
Occupancy by Ownership in Lonoke County
Of the total 27,582 dwellings in Lonoke County, owner-occupied units account for 19,977 (72.4%), while renter-occupied units make up 7,605 (27.6%).
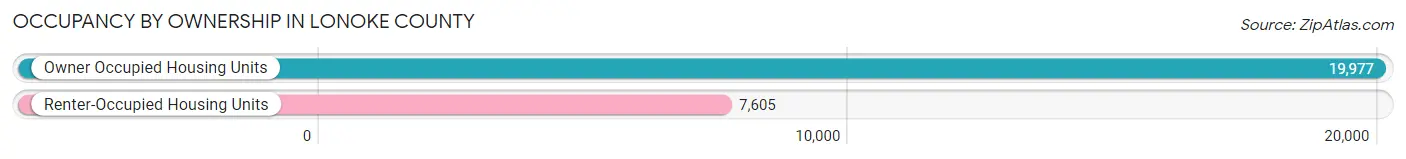
| Occupancy | # Housing Units | % Housing Units |
| Owner Occupied Housing Units | 19,977 | 72.4% |
| Renter-Occupied Housing Units | 7,605 | 27.6% |
| Total Occupied Housing Units | 27,582 | 100.0% |
Occupancy by Household Size in Lonoke County
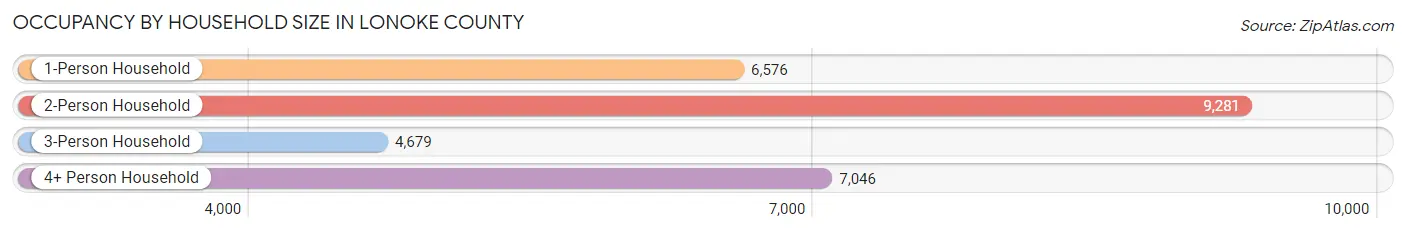
| Household Size | # Housing Units | % Housing Units |
| 1-Person Household | 6,576 | 23.8% |
| 2-Person Household | 9,281 | 33.7% |
| 3-Person Household | 4,679 | 17.0% |
| 4+ Person Household | 7,046 | 25.6% |
| Total Housing Units | 27,582 | 100.0% |
Occupancy by Ownership by Household Size in Lonoke County
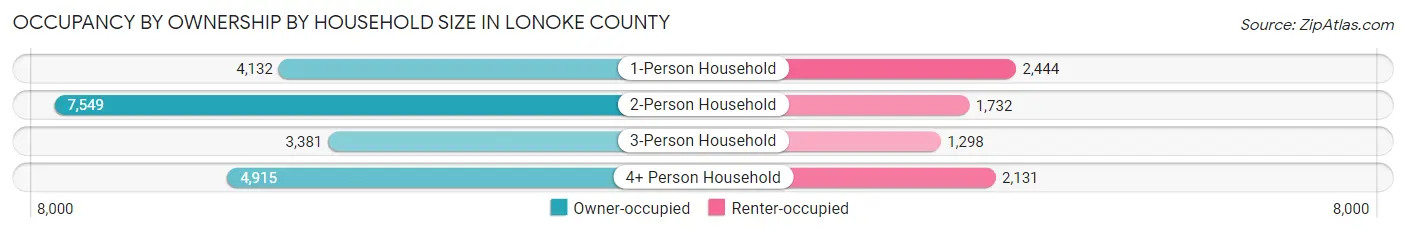
| Household Size | Owner-occupied | Renter-occupied |
| 1-Person Household | 4,132 (62.8%) | 2,444 (37.2%) |
| 2-Person Household | 7,549 (81.3%) | 1,732 (18.7%) |
| 3-Person Household | 3,381 (72.3%) | 1,298 (27.7%) |
| 4+ Person Household | 4,915 (69.8%) | 2,131 (30.2%) |
| Total Housing Units | 19,977 (72.4%) | 7,605 (27.6%) |
Occupancy by Educational Attainment in Lonoke County
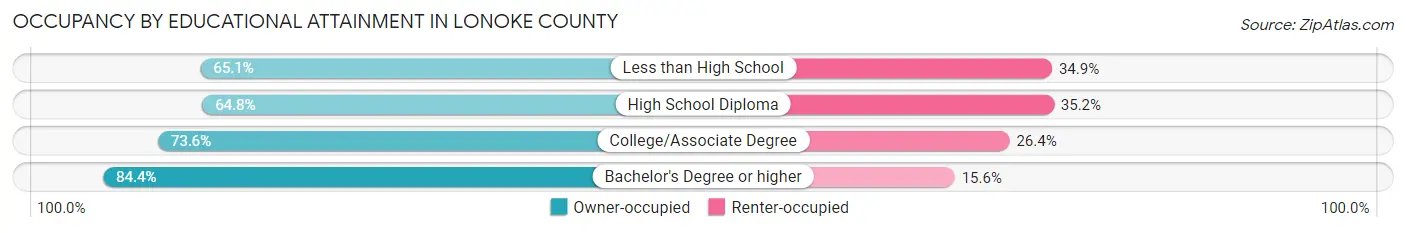
| Household Size | Owner-occupied | Renter-occupied |
| Less than High School | 1,465 (65.1%) | 784 (34.9%) |
| High School Diploma | 6,013 (64.8%) | 3,270 (35.2%) |
| College/Associate Degree | 7,119 (73.6%) | 2,558 (26.4%) |
| Bachelor's Degree or higher | 5,380 (84.4%) | 993 (15.6%) |
Occupancy by Age of Householder in Lonoke County
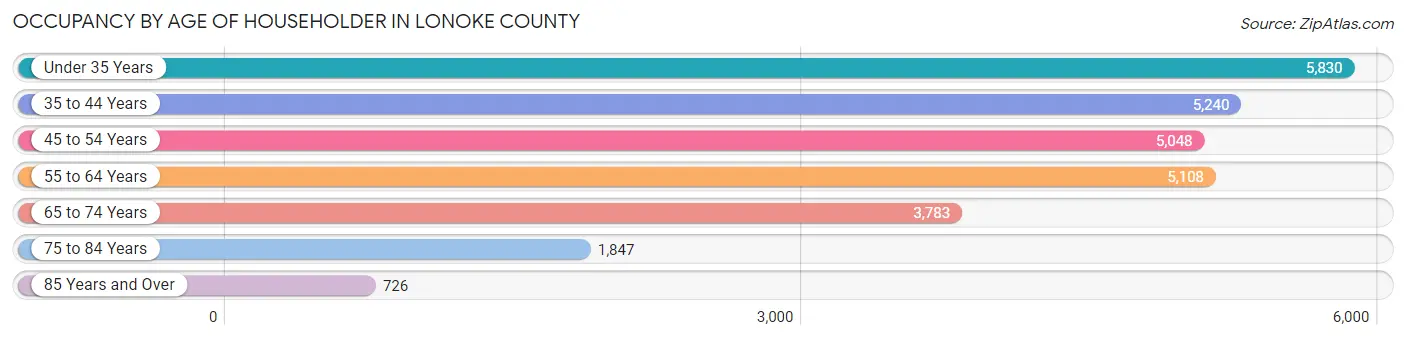
| Age Bracket | # Households | % Households |
| Under 35 Years | 5,830 | 21.1% |
| 35 to 44 Years | 5,240 | 19.0% |
| 45 to 54 Years | 5,048 | 18.3% |
| 55 to 64 Years | 5,108 | 18.5% |
| 65 to 74 Years | 3,783 | 13.7% |
| 75 to 84 Years | 1,847 | 6.7% |
| 85 Years and Over | 726 | 2.6% |
| Total | 27,582 | 100.0% |
Housing Finances in Lonoke County
Median Income by Occupancy in Lonoke County
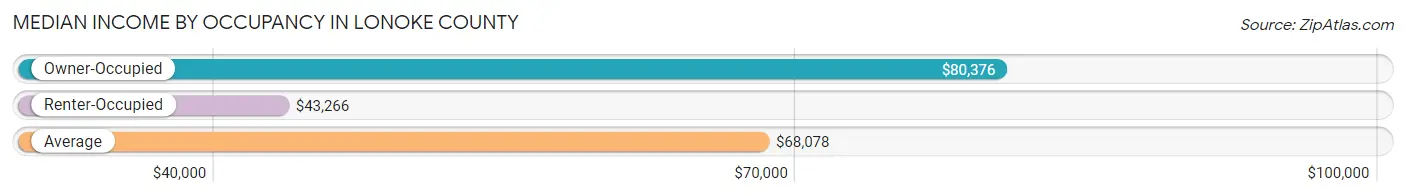
| Occupancy Type | # Households | Median Income |
| Owner-Occupied | 19,977 (72.4%) | $80,376 |
| Renter-Occupied | 7,605 (27.6%) | $43,266 |
| Average | 27,582 (100.0%) | $68,078 |
Occupancy by Householder Income Bracket in Lonoke County
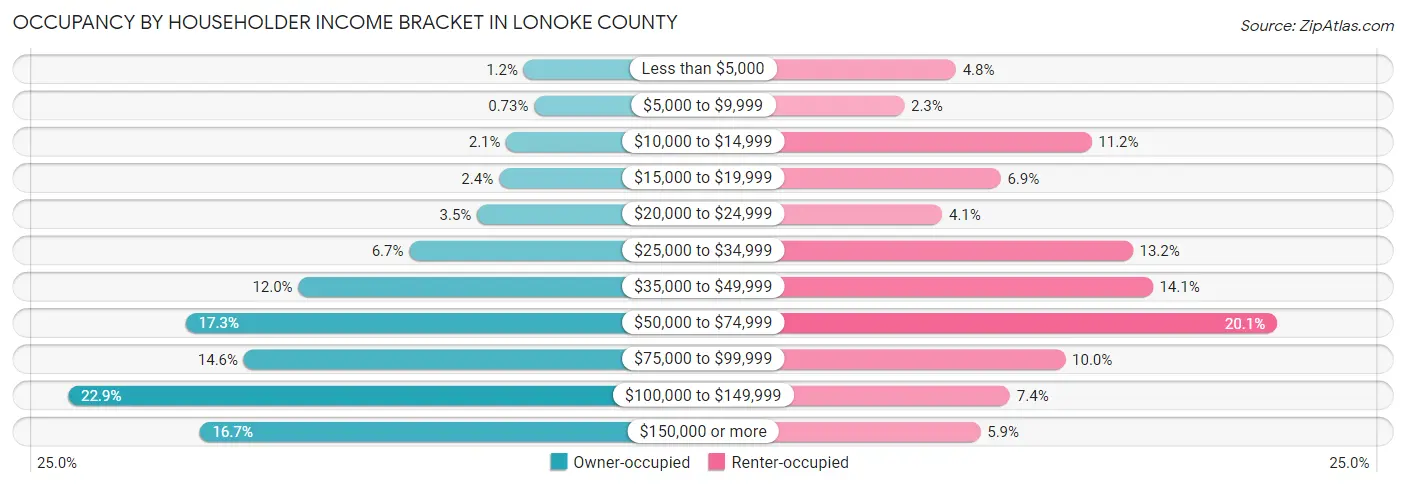
| Income Bracket | Owner-occupied | Renter-occupied |
| Less than $5,000 | 246 (1.2%) | 363 (4.8%) |
| $5,000 to $9,999 | 146 (0.7%) | 176 (2.3%) |
| $10,000 to $14,999 | 411 (2.1%) | 854 (11.2%) |
| $15,000 to $19,999 | 481 (2.4%) | 525 (6.9%) |
| $20,000 to $24,999 | 689 (3.5%) | 313 (4.1%) |
| $25,000 to $34,999 | 1,334 (6.7%) | 1,003 (13.2%) |
| $35,000 to $49,999 | 2,390 (12.0%) | 1,075 (14.1%) |
| $50,000 to $74,999 | 3,462 (17.3%) | 1,526 (20.1%) |
| $75,000 to $99,999 | 2,908 (14.6%) | 759 (10.0%) |
| $100,000 to $149,999 | 4,580 (22.9%) | 559 (7.3%) |
| $150,000 or more | 3,330 (16.7%) | 452 (5.9%) |
| Total | 19,977 (100.0%) | 7,605 (100.0%) |
Monthly Housing Cost Tiers in Lonoke County
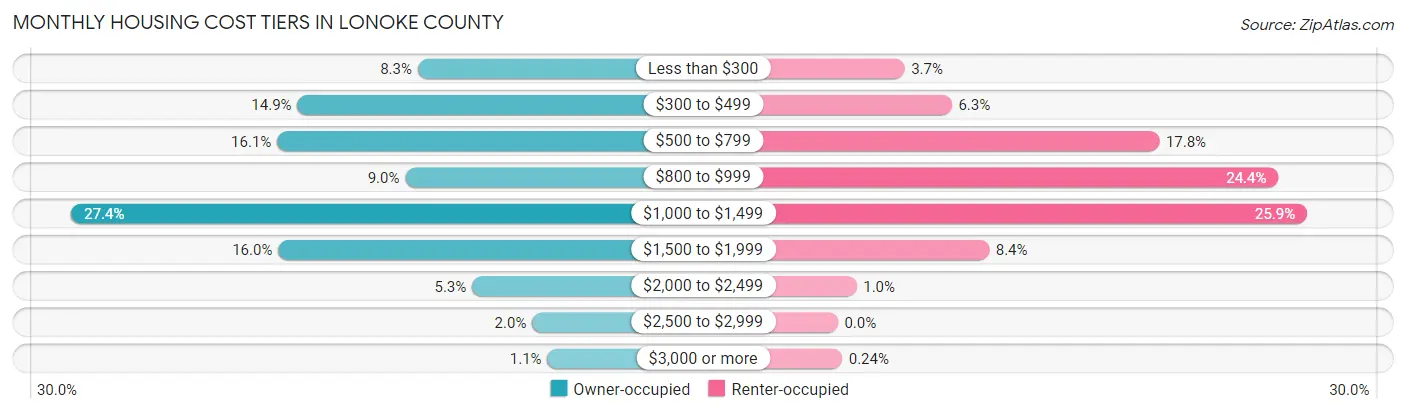
| Monthly Cost | Owner-occupied | Renter-occupied |
| Less than $300 | 1,654 (8.3%) | 281 (3.7%) |
| $300 to $499 | 2,982 (14.9%) | 479 (6.3%) |
| $500 to $799 | 3,206 (16.1%) | 1,351 (17.8%) |
| $800 to $999 | 1,792 (9.0%) | 1,852 (24.3%) |
| $1,000 to $1,499 | 5,480 (27.4%) | 1,973 (25.9%) |
| $1,500 to $1,999 | 3,194 (16.0%) | 636 (8.4%) |
| $2,000 to $2,499 | 1,054 (5.3%) | 79 (1.0%) |
| $2,500 to $2,999 | 392 (2.0%) | 0 (0.0%) |
| $3,000 or more | 223 (1.1%) | 18 (0.2%) |
| Total | 19,977 (100.0%) | 7,605 (100.0%) |
Physical Housing Characteristics in Lonoke County
Housing Structures in Lonoke County
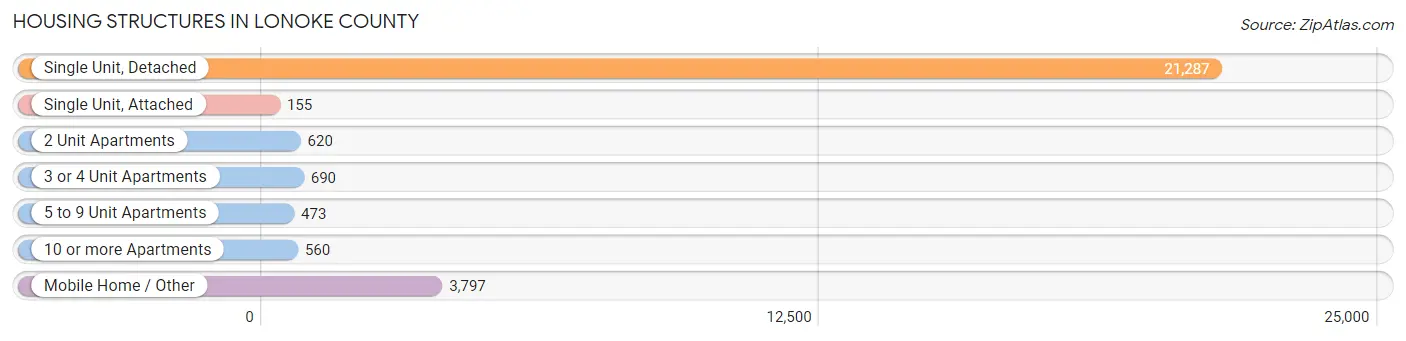
| Structure Type | # Housing Units | % Housing Units |
| Single Unit, Detached | 21,287 | 77.2% |
| Single Unit, Attached | 155 | 0.6% |
| 2 Unit Apartments | 620 | 2.2% |
| 3 or 4 Unit Apartments | 690 | 2.5% |
| 5 to 9 Unit Apartments | 473 | 1.7% |
| 10 or more Apartments | 560 | 2.0% |
| Mobile Home / Other | 3,797 | 13.8% |
| Total | 27,582 | 100.0% |
Housing Structures by Occupancy in Lonoke County
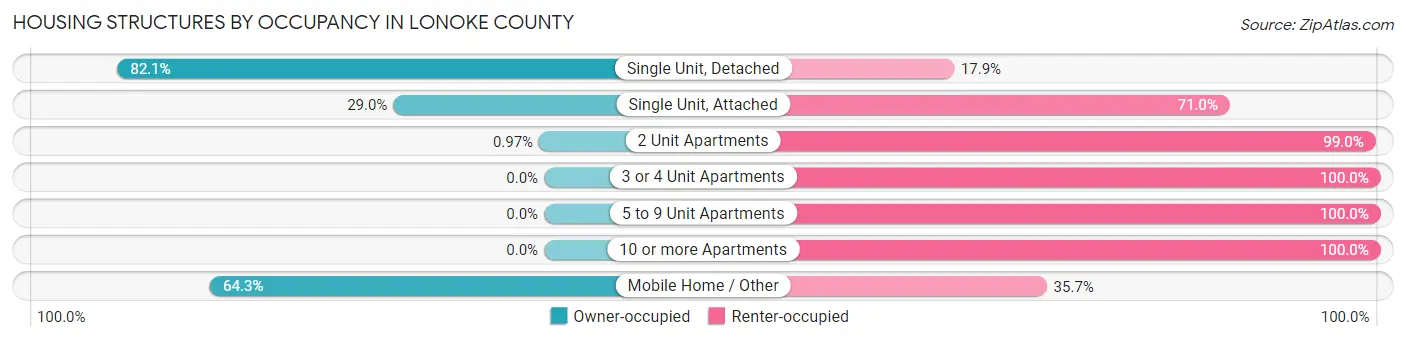
| Structure Type | Owner-occupied | Renter-occupied |
| Single Unit, Detached | 17,485 (82.1%) | 3,802 (17.9%) |
| Single Unit, Attached | 45 (29.0%) | 110 (71.0%) |
| 2 Unit Apartments | 6 (1.0%) | 614 (99.0%) |
| 3 or 4 Unit Apartments | 0 (0.0%) | 690 (100.0%) |
| 5 to 9 Unit Apartments | 0 (0.0%) | 473 (100.0%) |
| 10 or more Apartments | 0 (0.0%) | 560 (100.0%) |
| Mobile Home / Other | 2,441 (64.3%) | 1,356 (35.7%) |
| Total | 19,977 (72.4%) | 7,605 (27.6%) |
Housing Structures by Number of Rooms in Lonoke County
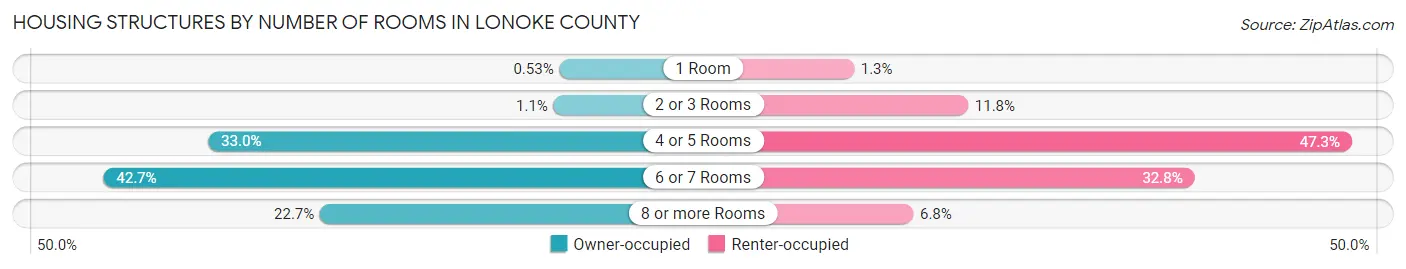
| Number of Rooms | Owner-occupied | Renter-occupied |
| 1 Room | 106 (0.5%) | 97 (1.3%) |
| 2 or 3 Rooms | 214 (1.1%) | 900 (11.8%) |
| 4 or 5 Rooms | 6,597 (33.0%) | 3,600 (47.3%) |
| 6 or 7 Rooms | 8,532 (42.7%) | 2,494 (32.8%) |
| 8 or more Rooms | 4,528 (22.7%) | 514 (6.8%) |
| Total | 19,977 (100.0%) | 7,605 (100.0%) |
Housing Structure by Heating Type in Lonoke County
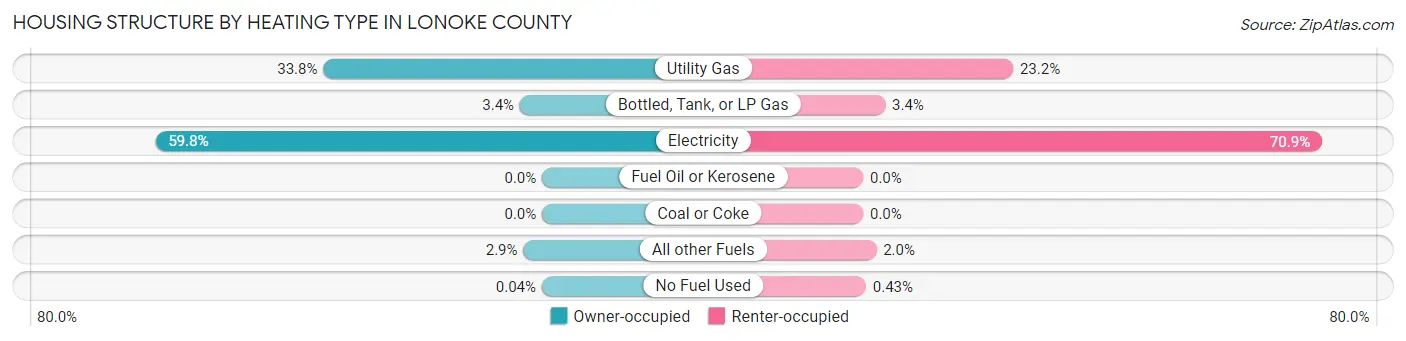
| Heating Type | Owner-occupied | Renter-occupied |
| Utility Gas | 6,757 (33.8%) | 1,763 (23.2%) |
| Bottled, Tank, or LP Gas | 685 (3.4%) | 259 (3.4%) |
| Electricity | 11,947 (59.8%) | 5,395 (70.9%) |
| Fuel Oil or Kerosene | 0 (0.0%) | 0 (0.0%) |
| Coal or Coke | 0 (0.0%) | 0 (0.0%) |
| All other Fuels | 580 (2.9%) | 155 (2.0%) |
| No Fuel Used | 8 (0.0%) | 33 (0.4%) |
| Total | 19,977 (100.0%) | 7,605 (100.0%) |
Household Vehicle Usage in Lonoke County
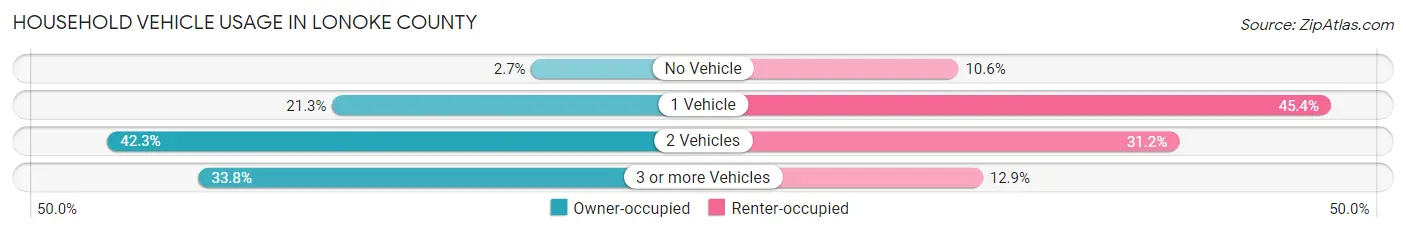
| Vehicles per Household | Owner-occupied | Renter-occupied |
| No Vehicle | 538 (2.7%) | 806 (10.6%) |
| 1 Vehicle | 4,249 (21.3%) | 3,449 (45.4%) |
| 2 Vehicles | 8,445 (42.3%) | 2,371 (31.2%) |
| 3 or more Vehicles | 6,745 (33.8%) | 979 (12.9%) |
| Total | 19,977 (100.0%) | 7,605 (100.0%) |
Real Estate & Mortgages in Lonoke County
Real Estate and Mortgage Overview in Lonoke County
| Characteristic | Without Mortgage | With Mortgage |
| Housing Units | 7,186 | 12,791 |
| Median Property Value | $136,000 | $183,200 |
| Median Household Income | $54,962 | $2,448 |
| Monthly Housing Costs | $419 | $223 |
| Real Estate Taxes | $890 | $858 |
Property Value by Mortgage Status in Lonoke County
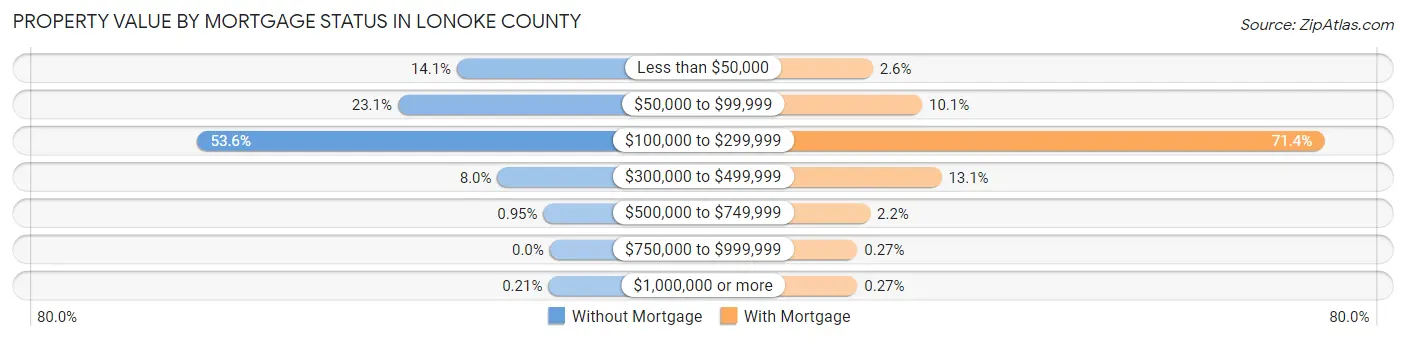
| Property Value | Without Mortgage | With Mortgage |
| Less than $50,000 | 1,015 (14.1%) | 337 (2.6%) |
| $50,000 to $99,999 | 1,662 (23.1%) | 1,296 (10.1%) |
| $100,000 to $299,999 | 3,854 (53.6%) | 9,130 (71.4%) |
| $300,000 to $499,999 | 572 (8.0%) | 1,674 (13.1%) |
| $500,000 to $749,999 | 68 (0.9%) | 284 (2.2%) |
| $750,000 to $999,999 | 0 (0.0%) | 35 (0.3%) |
| $1,000,000 or more | 15 (0.2%) | 35 (0.3%) |
| Total | 7,186 (100.0%) | 12,791 (100.0%) |
Household Income by Mortgage Status in Lonoke County
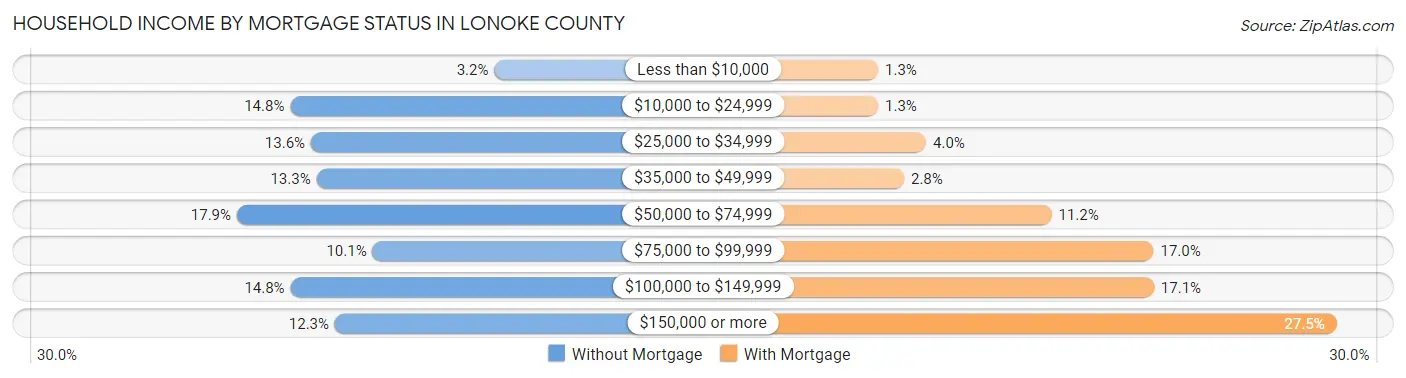
| Household Income | Without Mortgage | With Mortgage |
| Less than $10,000 | 227 (3.2%) | 165 (1.3%) |
| $10,000 to $24,999 | 1,065 (14.8%) | 165 (1.3%) |
| $25,000 to $34,999 | 980 (13.6%) | 516 (4.0%) |
| $35,000 to $49,999 | 957 (13.3%) | 354 (2.8%) |
| $50,000 to $74,999 | 1,284 (17.9%) | 1,433 (11.2%) |
| $75,000 to $99,999 | 727 (10.1%) | 2,178 (17.0%) |
| $100,000 to $149,999 | 1,064 (14.8%) | 2,181 (17.1%) |
| $150,000 or more | 882 (12.3%) | 3,516 (27.5%) |
| Total | 7,186 (100.0%) | 12,791 (100.0%) |
Property Value to Household Income Ratio in Lonoke County
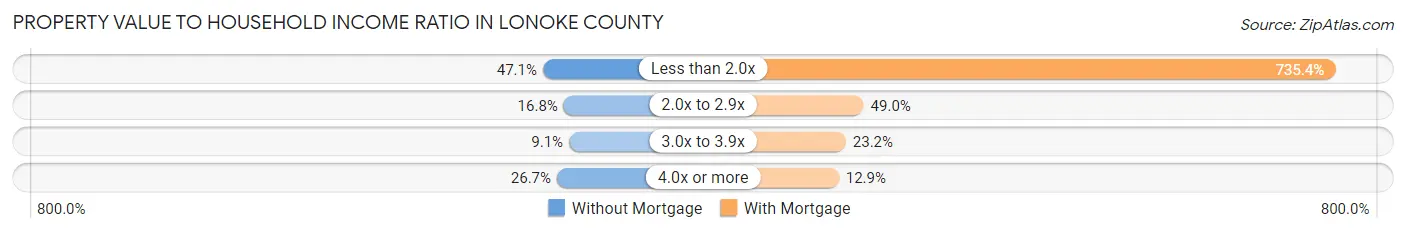
| Value-to-Income Ratio | Without Mortgage | With Mortgage |
| Less than 2.0x | 3,381 (47.0%) | 94,069 (735.4%) |
| 2.0x to 2.9x | 1,209 (16.8%) | 6,272 (49.0%) |
| 3.0x to 3.9x | 654 (9.1%) | 2,962 (23.2%) |
| 4.0x or more | 1,917 (26.7%) | 1,646 (12.9%) |
| Total | 7,186 (100.0%) | 12,791 (100.0%) |
Real Estate Taxes by Mortgage Status in Lonoke County
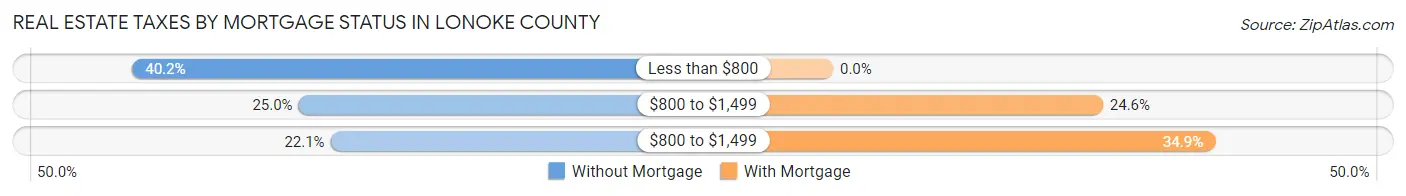
| Property Taxes | Without Mortgage | With Mortgage |
| Less than $800 | 2,886 (40.2%) | 0 (0.0%) |
| $800 to $1,499 | 1,796 (25.0%) | 3,152 (24.6%) |
| $800 to $1,499 | 1,586 (22.1%) | 4,461 (34.9%) |
| Total | 7,186 (100.0%) | 12,791 (100.0%) |
Health & Disability in Lonoke County
Health Insurance Coverage by Age in Lonoke County
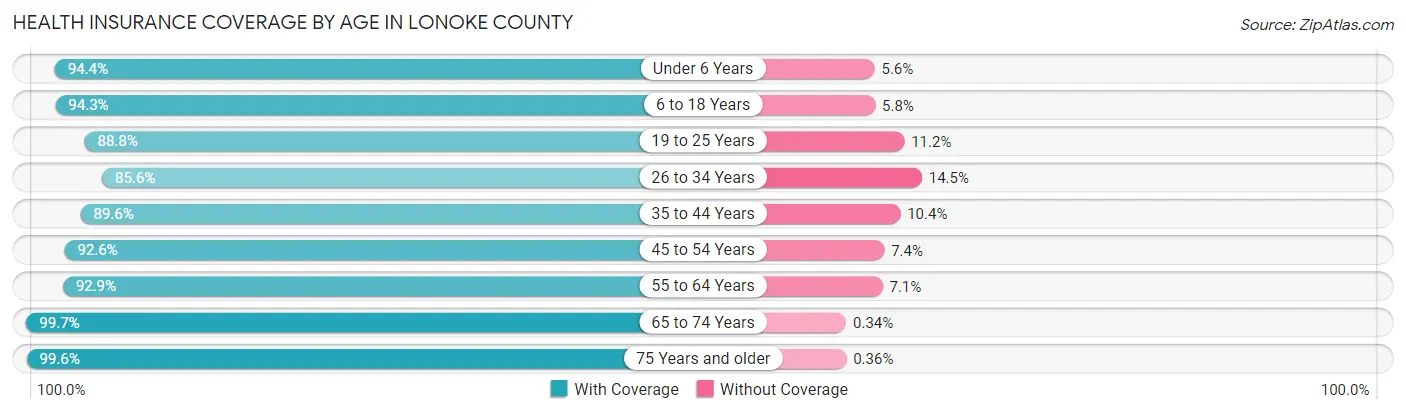
| Age Bracket | With Coverage | Without Coverage |
| Under 6 Years | 5,459 (94.4%) | 326 (5.6%) |
| 6 to 18 Years | 12,809 (94.3%) | 782 (5.8%) |
| 19 to 25 Years | 5,246 (88.8%) | 660 (11.2%) |
| 26 to 34 Years | 7,577 (85.6%) | 1,280 (14.4%) |
| 35 to 44 Years | 8,765 (89.6%) | 1,021 (10.4%) |
| 45 to 54 Years | 8,741 (92.6%) | 703 (7.4%) |
| 55 to 64 Years | 8,297 (92.9%) | 636 (7.1%) |
| 65 to 74 Years | 6,214 (99.7%) | 21 (0.3%) |
| 75 Years and older | 3,850 (99.6%) | 14 (0.4%) |
| Total | 66,958 (92.5%) | 5,443 (7.5%) |
Health Insurance Coverage by Citizenship Status in Lonoke County
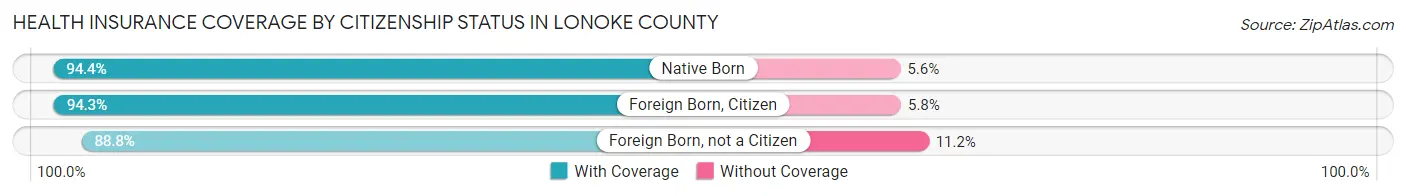
| Citizenship Status | With Coverage | Without Coverage |
| Native Born | 5,459 (94.4%) | 326 (5.6%) |
| Foreign Born, Citizen | 12,809 (94.3%) | 782 (5.8%) |
| Foreign Born, not a Citizen | 5,246 (88.8%) | 660 (11.2%) |
Health Insurance Coverage by Household Income in Lonoke County
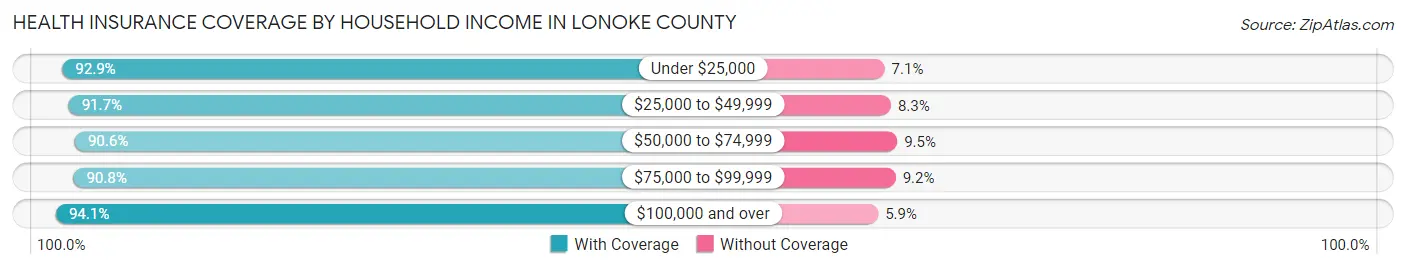
| Household Income | With Coverage | Without Coverage |
| Under $25,000 | 7,301 (92.9%) | 557 (7.1%) |
| $25,000 to $49,999 | 11,937 (91.7%) | 1,076 (8.3%) |
| $50,000 to $74,999 | 11,674 (90.5%) | 1,219 (9.5%) |
| $75,000 to $99,999 | 8,831 (90.8%) | 892 (9.2%) |
| $100,000 and over | 27,120 (94.1%) | 1,697 (5.9%) |
Public vs Private Health Insurance Coverage by Age in Lonoke County
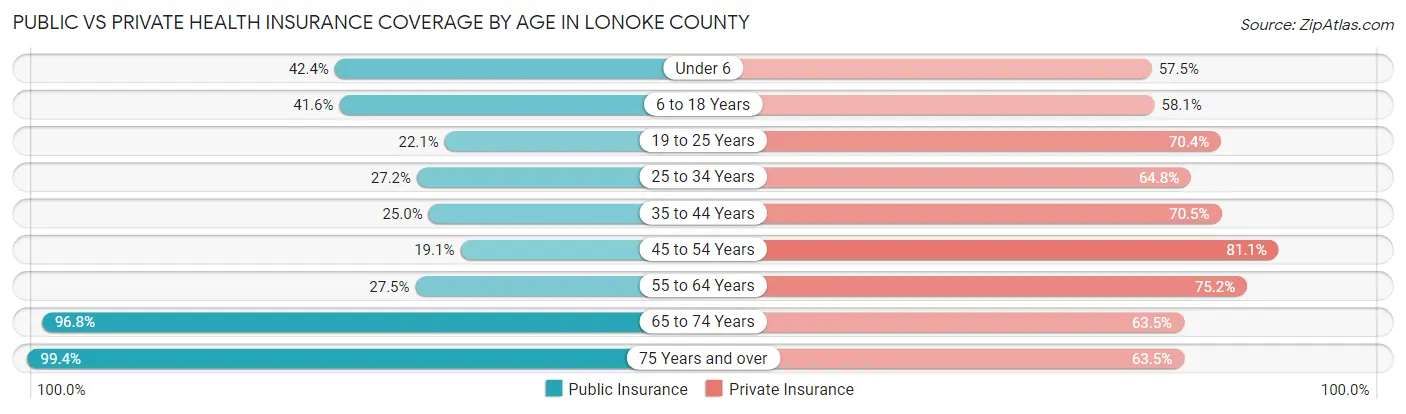
| Age Bracket | Public Insurance | Private Insurance |
| Under 6 | 2,455 (42.4%) | 3,328 (57.5%) |
| 6 to 18 Years | 5,653 (41.6%) | 7,890 (58.1%) |
| 19 to 25 Years | 1,302 (22.1%) | 4,158 (70.4%) |
| 25 to 34 Years | 2,408 (27.2%) | 5,740 (64.8%) |
| 35 to 44 Years | 2,448 (25.0%) | 6,894 (70.5%) |
| 45 to 54 Years | 1,808 (19.1%) | 7,656 (81.1%) |
| 55 to 64 Years | 2,454 (27.5%) | 6,719 (75.2%) |
| 65 to 74 Years | 6,036 (96.8%) | 3,959 (63.5%) |
| 75 Years and over | 3,842 (99.4%) | 2,454 (63.5%) |
| Total | 28,406 (39.2%) | 48,798 (67.4%) |
Disability Status by Sex by Age in Lonoke County
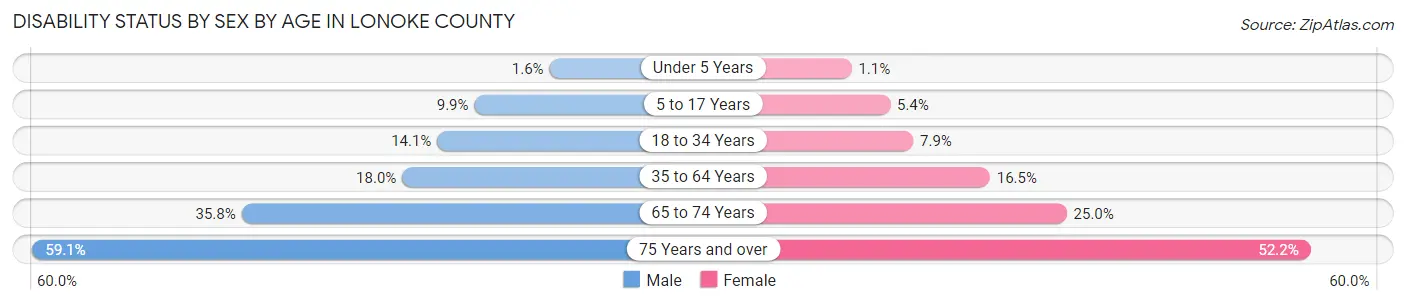
| Age Bracket | Male | Female |
| Under 5 Years | 36 (1.5%) | 24 (1.1%) |
| 5 to 17 Years | 725 (9.9%) | 361 (5.4%) |
| 18 to 34 Years | 1,076 (14.1%) | 627 (7.9%) |
| 35 to 64 Years | 2,445 (17.9%) | 2,397 (16.5%) |
| 65 to 74 Years | 1,071 (35.8%) | 813 (25.0%) |
| 75 Years and over | 965 (59.1%) | 1,165 (52.2%) |
Disability Class by Sex by Age in Lonoke County
Disability Class: Hearing Difficulty
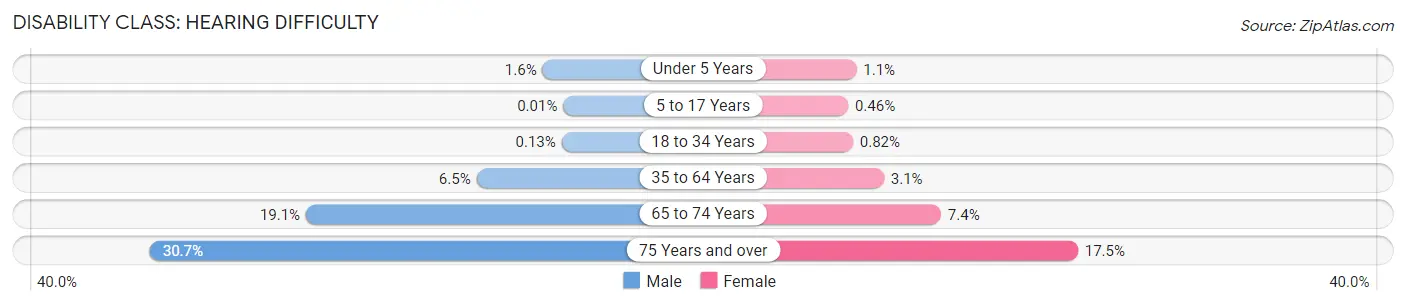
| Age Bracket | Male | Female |
| Under 5 Years | 36 (1.5%) | 24 (1.1%) |
| 5 to 17 Years | 1 (0.0%) | 31 (0.5%) |
| 18 to 34 Years | 10 (0.1%) | 65 (0.8%) |
| 35 to 64 Years | 879 (6.5%) | 454 (3.1%) |
| 65 to 74 Years | 571 (19.1%) | 239 (7.4%) |
| 75 Years and over | 501 (30.7%) | 391 (17.5%) |
Disability Class: Vision Difficulty
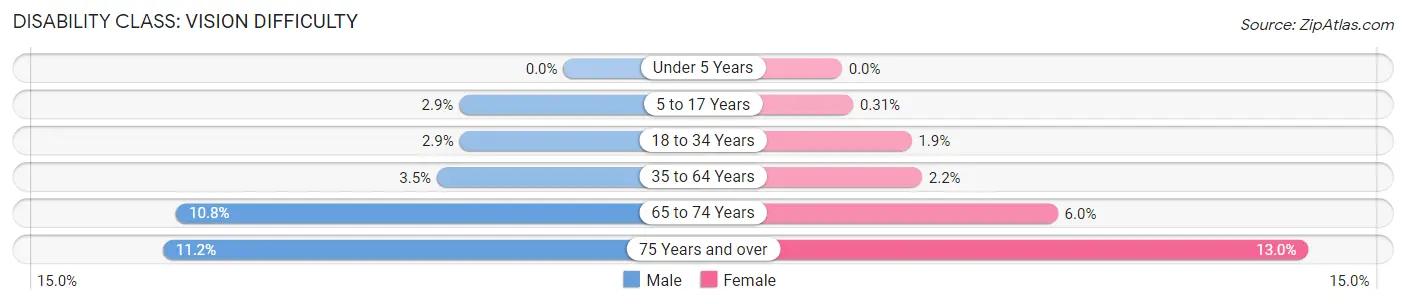
| Age Bracket | Male | Female |
| Under 5 Years | 0 (0.0%) | 0 (0.0%) |
| 5 to 17 Years | 212 (2.9%) | 21 (0.3%) |
| 18 to 34 Years | 221 (2.9%) | 153 (1.9%) |
| 35 to 64 Years | 480 (3.5%) | 324 (2.2%) |
| 65 to 74 Years | 322 (10.8%) | 195 (6.0%) |
| 75 Years and over | 182 (11.2%) | 290 (13.0%) |
Disability Class: Cognitive Difficulty
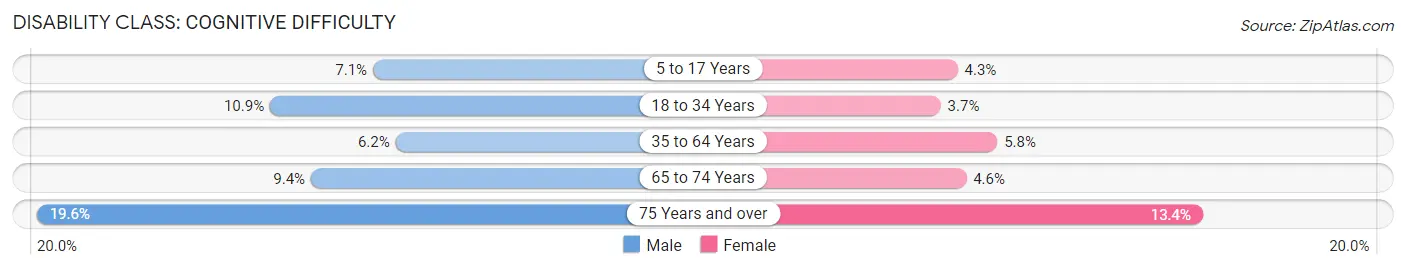
| Age Bracket | Male | Female |
| 5 to 17 Years | 517 (7.1%) | 289 (4.3%) |
| 18 to 34 Years | 834 (10.9%) | 290 (3.7%) |
| 35 to 64 Years | 848 (6.2%) | 839 (5.8%) |
| 65 to 74 Years | 280 (9.4%) | 150 (4.6%) |
| 75 Years and over | 319 (19.6%) | 299 (13.4%) |
Disability Class: Ambulatory Difficulty
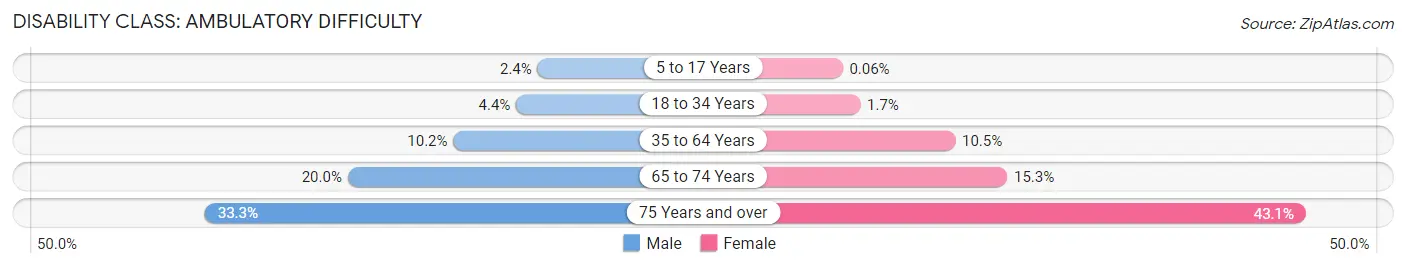
| Age Bracket | Male | Female |
| 5 to 17 Years | 175 (2.4%) | 4 (0.1%) |
| 18 to 34 Years | 335 (4.4%) | 134 (1.7%) |
| 35 to 64 Years | 1,390 (10.2%) | 1,528 (10.5%) |
| 65 to 74 Years | 598 (20.0%) | 498 (15.3%) |
| 75 Years and over | 543 (33.3%) | 961 (43.1%) |
Disability Class: Self-Care Difficulty
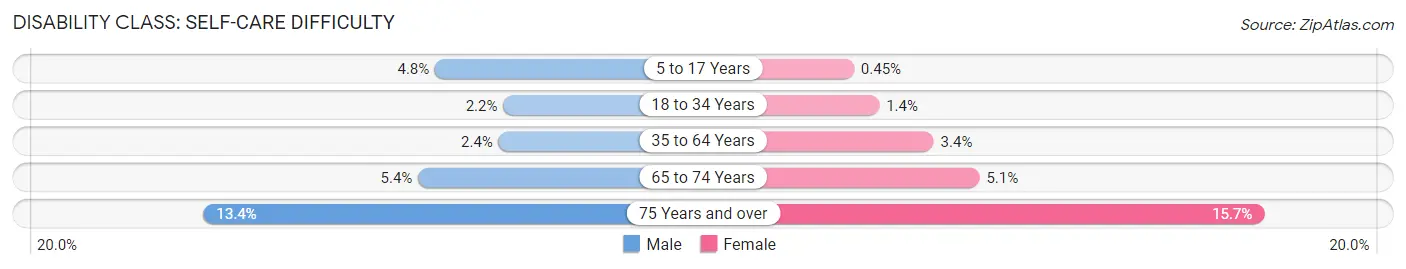
| Age Bracket | Male | Female |
| 5 to 17 Years | 348 (4.8%) | 30 (0.4%) |
| 18 to 34 Years | 171 (2.2%) | 110 (1.4%) |
| 35 to 64 Years | 327 (2.4%) | 496 (3.4%) |
| 65 to 74 Years | 161 (5.4%) | 166 (5.1%) |
| 75 Years and over | 218 (13.4%) | 350 (15.7%) |
Technology Access in Lonoke County
Computing Device Access in Lonoke County
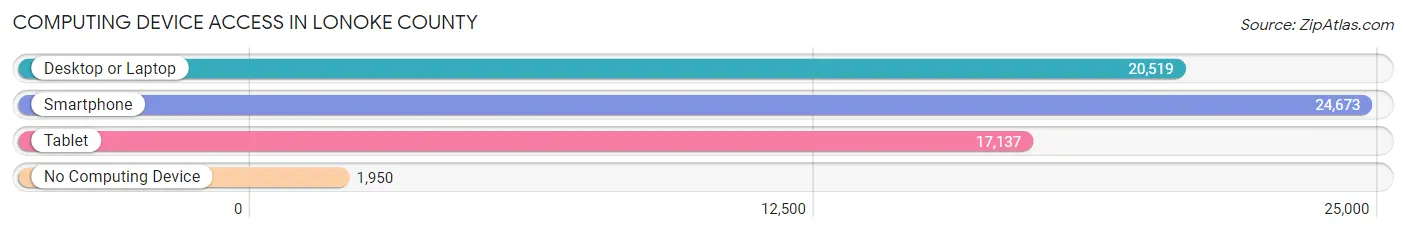
| Device Type | # Households | % Households |
| Desktop or Laptop | 20,519 | 74.4% |
| Smartphone | 24,673 | 89.4% |
| Tablet | 17,137 | 62.1% |
| No Computing Device | 1,950 | 7.1% |
| Total | 27,582 | 100.0% |
Internet Access in Lonoke County
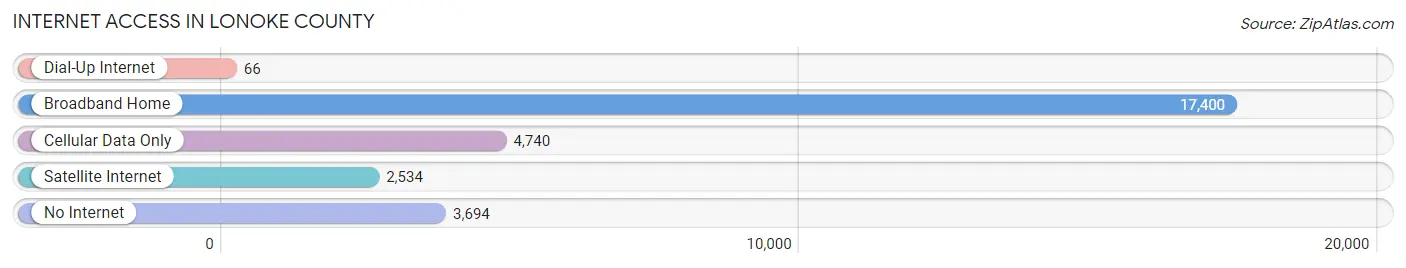
| Internet Type | # Households | % Households |
| Dial-Up Internet | 66 | 0.2% |
| Broadband Home | 17,400 | 63.1% |
| Cellular Data Only | 4,740 | 17.2% |
| Satellite Internet | 2,534 | 9.2% |
| No Internet | 3,694 | 13.4% |
| Total | 27,582 | 100.0% |
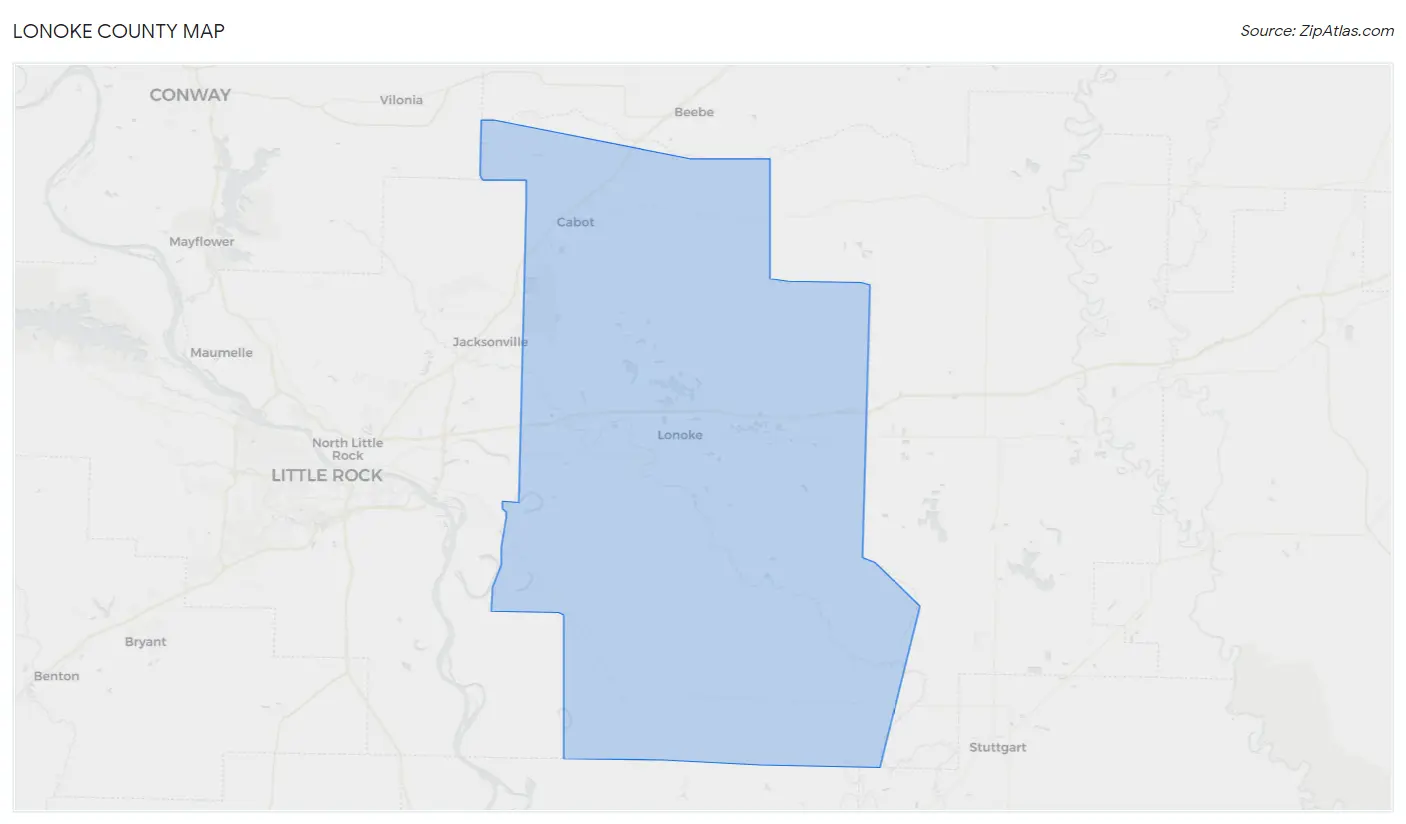
Lonoke County Summary
Lonoke County is located in the central part of Arkansas, and is part of the Little Rock-North Little Rock-Conway Metropolitan Statistical Area. The county is bordered by Pulaski County to the north, Prairie County to the east, Monroe County to the south, and Faulkner County to the west. The county seat is Lonoke, and the largest city is Cabot. As of the 2010 census, the population of Lonoke County was 68,356.
Geography
Lonoke County covers an area of 745 square miles, making it the 33rd largest county in Arkansas. The county is located in the Arkansas Delta region, and is mostly flat with some rolling hills. The terrain is mostly covered in farmland, with some wooded areas. The county is drained by the Cache River, which flows through the county from north to south. The county is also home to several lakes, including Lake Hogue, Lake Austell, and Lake Pickthorne.
Climate
Lonoke County has a humid subtropical climate, with hot, humid summers and mild winters. The average annual temperature is 64°F, and the average annual precipitation is 48 inches.
Demographics
As of the 2010 census, there were 68,356 people, 24,945 households, and 18,845 families living in the county. The population density was 92 people per square mile. The racial makeup of the county was 81.3% White, 14.2% Black or African American, 0.6% Native American, 0.7% Asian, 0.1% Pacific Islander, 1.3% from other races, and 1.9% from two or more races. Hispanic or Latino of any race were 3.2% of the population.
The median income for a household in the county was $45,837, and the median income for a family was $53,845. The per capita income for the county was $20,945. About 11.2% of families and 14.3% of the population were below the poverty line, including 19.2% of those under age 18 and 11.2% of those age 65 or over.
Economy
Lonoke County is home to a diverse economy, with a mix of agriculture, manufacturing, and services. The county is home to several large employers, including Tyson Foods, Walmart, and the University of Arkansas for Medical Sciences. Agriculture is a major part of the economy, with the county producing soybeans, corn, cotton, and rice. Manufacturing is also a major part of the economy, with companies such as Lonoke Manufacturing, Lonoke Plastics, and Lonoke Steel producing a variety of products. The county is also home to several service-based businesses, including healthcare, retail, and hospitality.
History
Lonoke County was formed in 1873 from parts of Pulaski, Prairie, and Monroe counties. The county was named for the Lonoke River, which flows through the county. The county seat was originally located in Austin, but was moved to Lonoke in 1875. The county was largely agricultural in the early years, with cotton being the main crop. The county was also home to several sawmills and gristmills.
In the early 20th century, the county began to diversify its economy, with the establishment of several manufacturing companies. The county also saw an influx of new residents, with the population increasing from 8,000 in 1900 to over 20,000 by 1930. The county continued to grow throughout the 20th century, and by the 2010 census, the population had reached 68,356.
Common Questions
What is Per Capita Income in Lonoke County?
Per Capita income in Lonoke County is $32,720.
What is the Median Family Income in Lonoke County?
Median Family Income in Lonoke County is $83,730.
What is the Median Household income in Lonoke County?
Median Household Income in Lonoke County is $68,078.
What is Income or Wage Gap in Lonoke County?
Income or Wage Gap in Lonoke County is 28.1%.
Women in Lonoke County earn 71.9 cents for every dollar earned by a man.
What is Family Income Deficit in Lonoke County?
Family Income Deficit in Lonoke County is $11,730.
Families that are below poverty line in Lonoke County earn $11,730 less on average than the poverty threshold level.
What is Inequality or Gini Index in Lonoke County?
Inequality or Gini Index in Lonoke County is 0.42.
What is the Total Population of Lonoke County?
Total Population of Lonoke County is 74,292.
What is the Total Male Population of Lonoke County?
Total Male Population of Lonoke County is 36,875.
What is the Total Female Population of Lonoke County?
Total Female Population of Lonoke County is 37,417.
What is the Ratio of Males per 100 Females in Lonoke County?
There are 98.55 Males per 100 Females in Lonoke County.
What is the Ratio of Females per 100 Males in Lonoke County?
There are 101.47 Females per 100 Males in Lonoke County.
What is the Median Population Age in Lonoke County?
Median Population Age in Lonoke County is 37.0 Years.
What is the Average Family Size in Lonoke County
Average Family Size in Lonoke County is 3.1 People.
What is the Average Household Size in Lonoke County
Average Household Size in Lonoke County is 2.7 People.
How Large is the Labor Force in Lonoke County?
There are 36,288 People in the Labor Forcein in Lonoke County.
What is the Percentage of People in the Labor Force in Lonoke County?
62.5% of People are in the Labor Force in Lonoke County.
What is the Unemployment Rate in Lonoke County?
Unemployment Rate in Lonoke County is 4.5%.