Baxter County, AR Map & Demographics
Baxter County Map
Baxter County Overview
$30,264
PER CAPITA INCOME
$59,981
AVG FAMILY INCOME
$47,403
AVG HOUSEHOLD INCOME
18.5%
WAGE / INCOME GAP [ % ]
81.5¢/ $1
WAGE / INCOME GAP [ $ ]
$7,788
FAMILY INCOME DEFICIT
0.46
INEQUALITY / GINI INDEX
41,801
TOTAL POPULATION
20,433
MALE POPULATION
21,368
FEMALE POPULATION
95.62
MALES / 100 FEMALES
104.58
FEMALES / 100 MALES
52.1
MEDIAN AGE
2.7
AVG FAMILY SIZE
2.2
AVG HOUSEHOLD SIZE
16,212
LABOR FORCE [ PEOPLE ]
45.8%
PERCENT IN LABOR FORCE
5.1%
UNEMPLOYMENT RATE
Baxter County Area Codes
Income in Baxter County
Income Overview in Baxter County
Per Capita Income in Baxter County is $30,264, while median incomes of families and households are $59,981 and $47,403 respectively.
| Characteristic | Number | Measure |
| Per Capita Income | 41,801 | $30,264 |
| Median Family Income | 11,618 | $59,981 |
| Mean Family Income | 11,618 | $80,462 |
| Median Household Income | 19,021 | $47,403 |
| Mean Household Income | 19,021 | $66,193 |
| Income Deficit | 11,618 | $7,788 |
| Wage / Income Gap (%) | 41,801 | 18.51% |
| Wage / Income Gap ($) | 41,801 | 81.49¢ per $1 |
| Gini / Inequality Index | 41,801 | 0.46 |
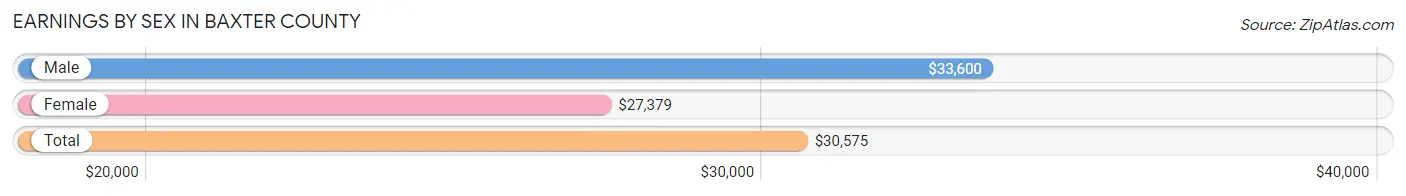
Earnings by Sex in Baxter County
Average Earnings in Baxter County are $30,575, $33,600 for men and $27,379 for women, a difference of 18.5%.
| Sex | Number | Average Earnings |
| Male | 8,643 (51.7%) | $33,600 |
| Female | 8,086 (48.3%) | $27,379 |
| Total | 16,729 (100.0%) | $30,575 |
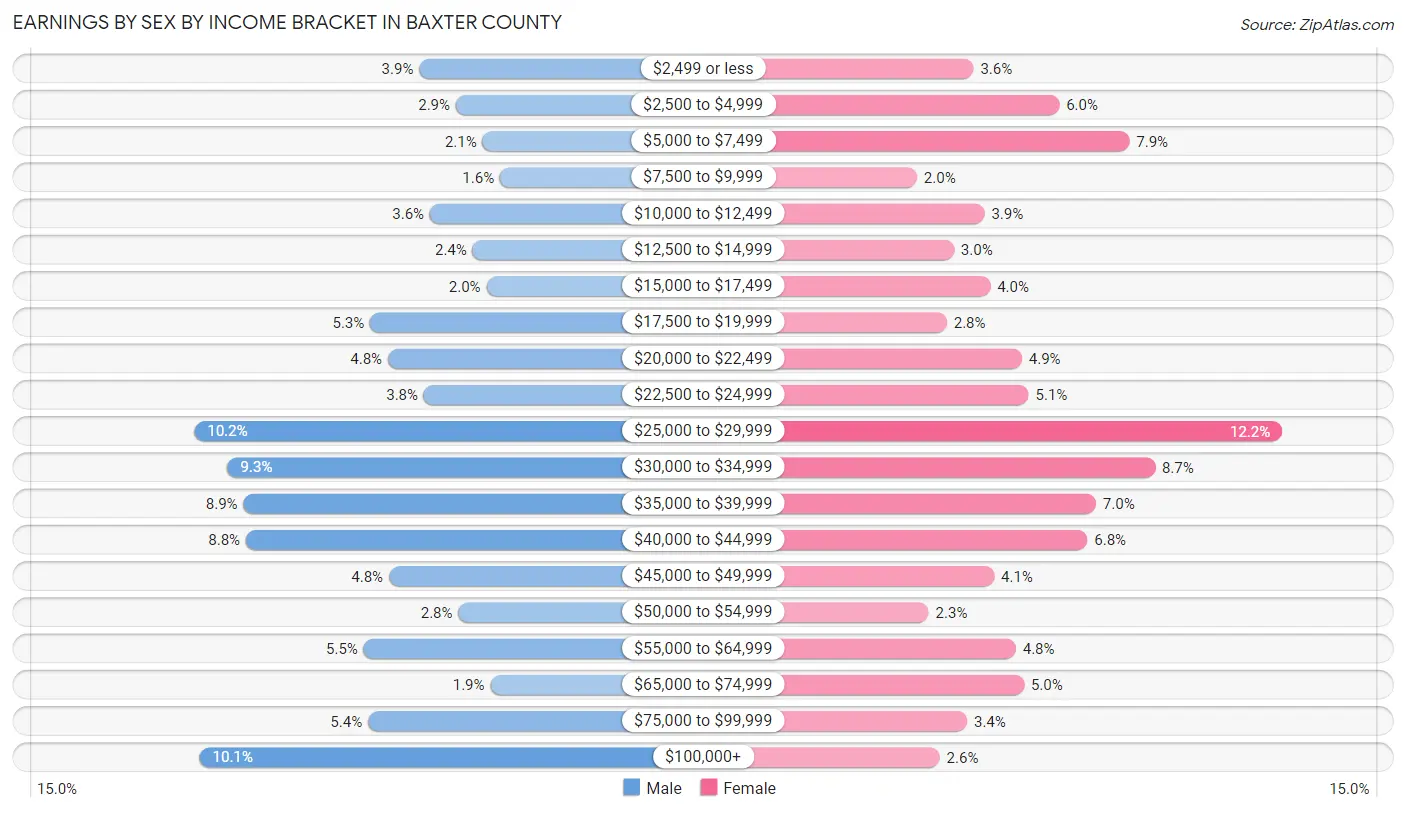
Earnings by Sex by Income Bracket in Baxter County
The most common earnings brackets in Baxter County are $25,000 to $29,999 for men (884 | 10.2%) and $25,000 to $29,999 for women (989 | 12.2%).
| Income | Male | Female |
| $2,499 or less | 338 (3.9%) | 288 (3.6%) |
| $2,500 to $4,999 | 249 (2.9%) | 483 (6.0%) |
| $5,000 to $7,499 | 184 (2.1%) | 642 (7.9%) |
| $7,500 to $9,999 | 142 (1.6%) | 159 (2.0%) |
| $10,000 to $12,499 | 312 (3.6%) | 313 (3.9%) |
| $12,500 to $14,999 | 208 (2.4%) | 243 (3.0%) |
| $15,000 to $17,499 | 175 (2.0%) | 326 (4.0%) |
| $17,500 to $19,999 | 457 (5.3%) | 227 (2.8%) |
| $20,000 to $22,499 | 414 (4.8%) | 398 (4.9%) |
| $22,500 to $24,999 | 327 (3.8%) | 413 (5.1%) |
| $25,000 to $29,999 | 884 (10.2%) | 989 (12.2%) |
| $30,000 to $34,999 | 804 (9.3%) | 700 (8.7%) |
| $35,000 to $39,999 | 765 (8.8%) | 566 (7.0%) |
| $40,000 to $44,999 | 759 (8.8%) | 547 (6.8%) |
| $45,000 to $49,999 | 411 (4.8%) | 335 (4.1%) |
| $50,000 to $54,999 | 243 (2.8%) | 186 (2.3%) |
| $55,000 to $64,999 | 473 (5.5%) | 384 (4.8%) |
| $65,000 to $74,999 | 165 (1.9%) | 403 (5.0%) |
| $75,000 to $99,999 | 462 (5.3%) | 273 (3.4%) |
| $100,000+ | 871 (10.1%) | 211 (2.6%) |
| Total | 8,643 (100.0%) | 8,086 (100.0%) |
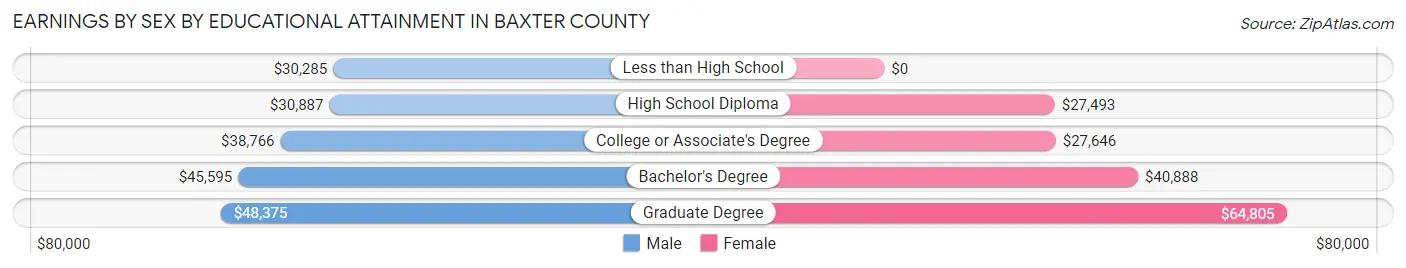
Earnings by Sex by Educational Attainment in Baxter County
Average earnings in Baxter County are $36,581 for men and $29,415 for women, a difference of 19.6%. Men with an educational attainment of graduate degree enjoy the highest average annual earnings of $48,375, while those with less than high school education earn the least with $30,285. Women with an educational attainment of graduate degree earn the most with the average annual earnings of $64,805, while those with high school diploma education have the smallest earnings of $27,493.
| Educational Attainment | Male Income | Female Income |
| Less than High School | $30,285 | $0 |
| High School Diploma | $30,887 | $27,493 |
| College or Associate's Degree | $38,766 | $27,646 |
| Bachelor's Degree | $45,595 | $40,888 |
| Graduate Degree | $48,375 | $64,805 |
| Total | $36,581 | $29,415 |
Family Income in Baxter County
Family Income Brackets in Baxter County
According to the Baxter County family income data, there are 2,719 families falling into the $50,000 to $74,999 income range, which is the most common income bracket and makes up 23.4% of all families. Conversely, the $10,000 to $14,999 income bracket is the least frequent group with only 105 families (0.9%) belonging to this category.
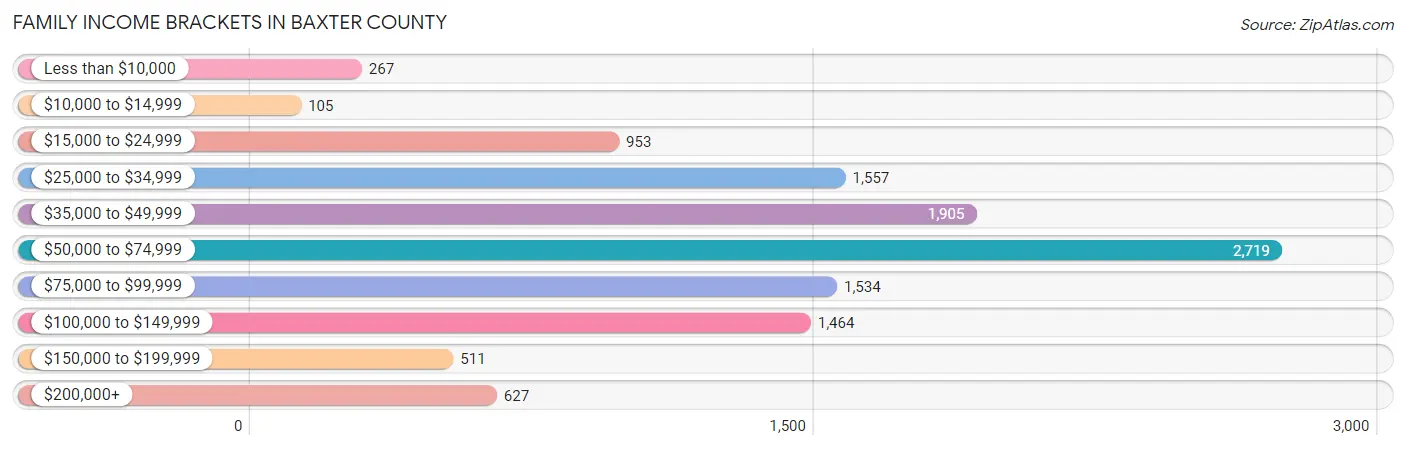
| Income Bracket | # Families | % Families |
| Less than $10,000 | 267 | 2.3% |
| $10,000 to $14,999 | 105 | 0.9% |
| $15,000 to $24,999 | 953 | 8.2% |
| $25,000 to $34,999 | 1,557 | 13.4% |
| $35,000 to $49,999 | 1,905 | 16.4% |
| $50,000 to $74,999 | 2,719 | 23.4% |
| $75,000 to $99,999 | 1,534 | 13.2% |
| $100,000 to $149,999 | 1,464 | 12.6% |
| $150,000 to $199,999 | 511 | 4.4% |
| $200,000+ | 627 | 5.4% |
Family Income by Famaliy Size in Baxter County
5-person families (627 | 5.4%) account for the highest median family income in Baxter County with $102,031 per family, while 2-person families (7,549 | 65.0%) have the highest median income of $27,664 per family member.
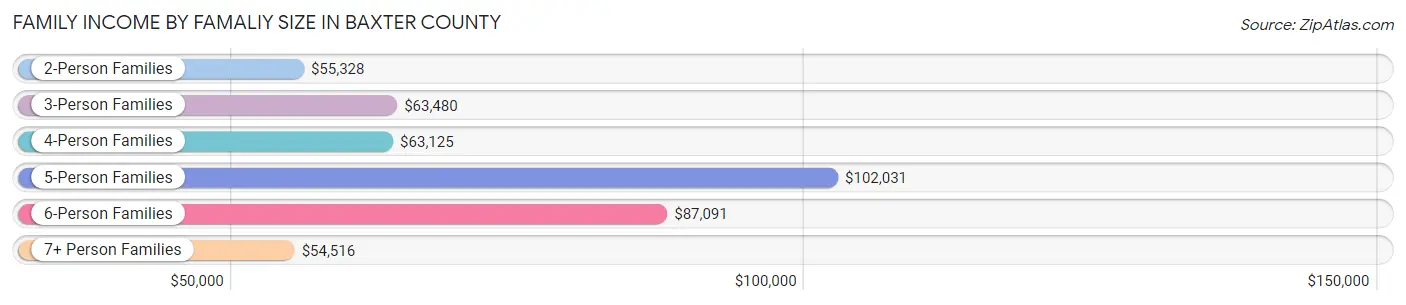
| Income Bracket | # Families | Median Income |
| 2-Person Families | 7,549 (65.0%) | $55,328 |
| 3-Person Families | 1,900 (16.4%) | $63,480 |
| 4-Person Families | 1,239 (10.7%) | $63,125 |
| 5-Person Families | 627 (5.4%) | $102,031 |
| 6-Person Families | 137 (1.2%) | $87,091 |
| 7+ Person Families | 166 (1.4%) | $54,516 |
| Total | 11,618 (100.0%) | $59,981 |
Family Income by Number of Earners in Baxter County
The median family income in Baxter County is $59,981, with families comprising 3+ earners (748) having the highest median family income of $97,946, while families with 1 earner (3,434) have the lowest median family income of $48,063, accounting for 6.4% and 29.6% of families, respectively.
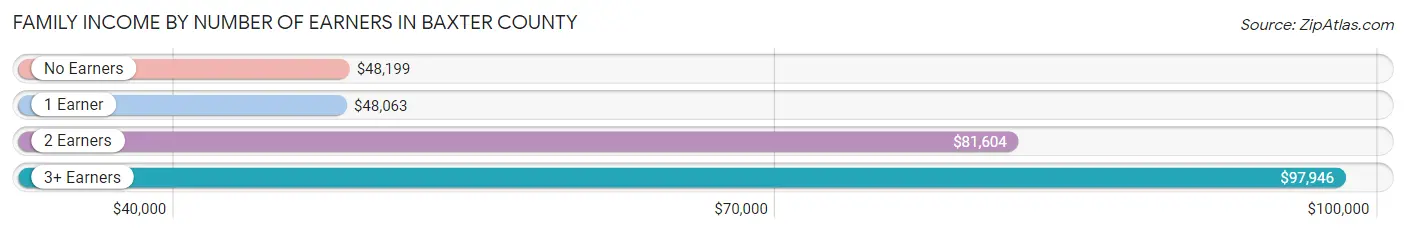
| Number of Earners | # Families | Median Income |
| No Earners | 4,114 (35.4%) | $48,199 |
| 1 Earner | 3,434 (29.6%) | $48,063 |
| 2 Earners | 3,322 (28.6%) | $81,604 |
| 3+ Earners | 748 (6.4%) | $97,946 |
| Total | 11,618 (100.0%) | $59,981 |
Household Income in Baxter County
Household Income Brackets in Baxter County
With 3,842 households falling in the category, the $50,000 to $74,999 income range is the most frequent in Baxter County, accounting for 20.2% of all households. In contrast, only 609 households (3.2%) fall into the $150,000 to $199,999 income bracket, making it the least populous group.
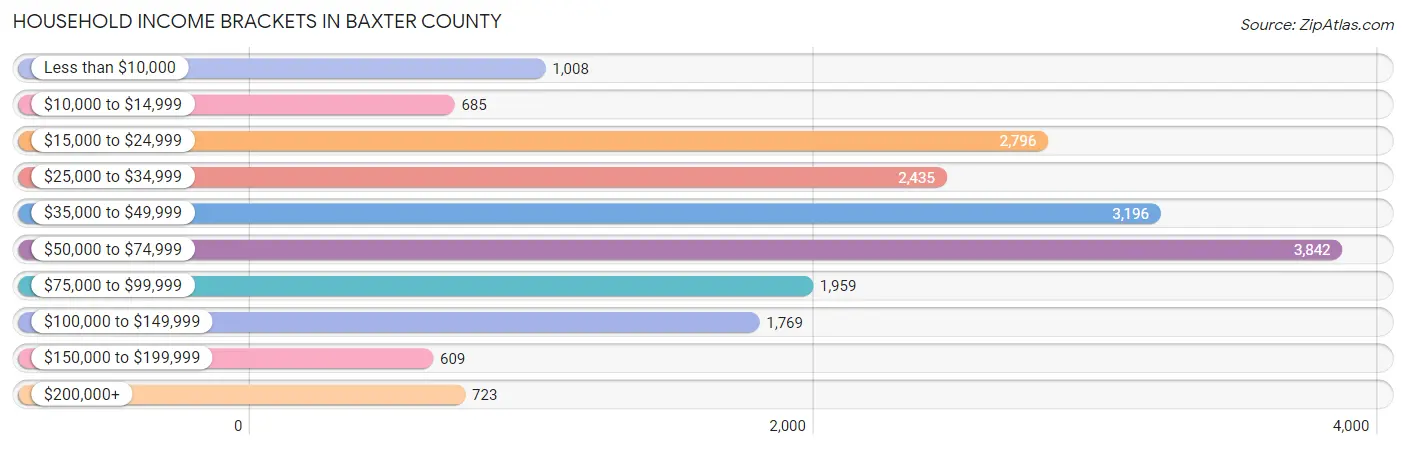
| Income Bracket | # Households | % Households |
| Less than $10,000 | 1,008 | 5.3% |
| $10,000 to $14,999 | 685 | 3.6% |
| $15,000 to $24,999 | 2,796 | 14.7% |
| $25,000 to $34,999 | 2,435 | 12.8% |
| $35,000 to $49,999 | 3,196 | 16.8% |
| $50,000 to $74,999 | 3,842 | 20.2% |
| $75,000 to $99,999 | 1,959 | 10.3% |
| $100,000 to $149,999 | 1,769 | 9.3% |
| $150,000 to $199,999 | 609 | 3.2% |
| $200,000+ | 723 | 3.8% |
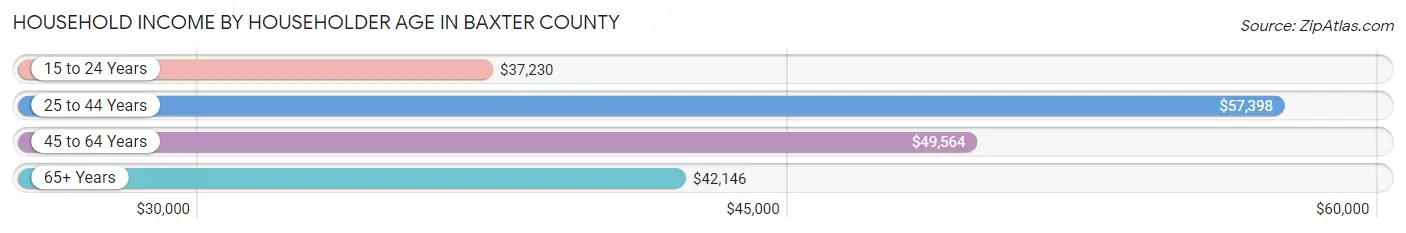
Household Income by Householder Age in Baxter County
The median household income in Baxter County is $47,403, with the highest median household income of $57,398 found in the 25 to 44 years age bracket for the primary householder. A total of 3,841 households (20.2%) fall into this category. Meanwhile, the 15 to 24 years age bracket for the primary householder has the lowest median household income of $37,230, with 615 households (3.2%) in this group.
| Income Bracket | # Households | Median Income |
| 15 to 24 Years | 615 (3.2%) | $37,230 |
| 25 to 44 Years | 3,841 (20.2%) | $57,398 |
| 45 to 64 Years | 6,145 (32.3%) | $49,564 |
| 65+ Years | 8,420 (44.3%) | $42,146 |
| Total | 19,021 (100.0%) | $47,403 |
Poverty in Baxter County
Income Below Poverty by Sex and Age in Baxter County
With 11.8% poverty level for males and 15.2% for females among the residents of Baxter County, 12 to 14 year old males and 16 and 17 year old females are the most vulnerable to poverty, with 187 males (23.8%) and 169 females (31.5%) in their respective age groups living below the poverty level.
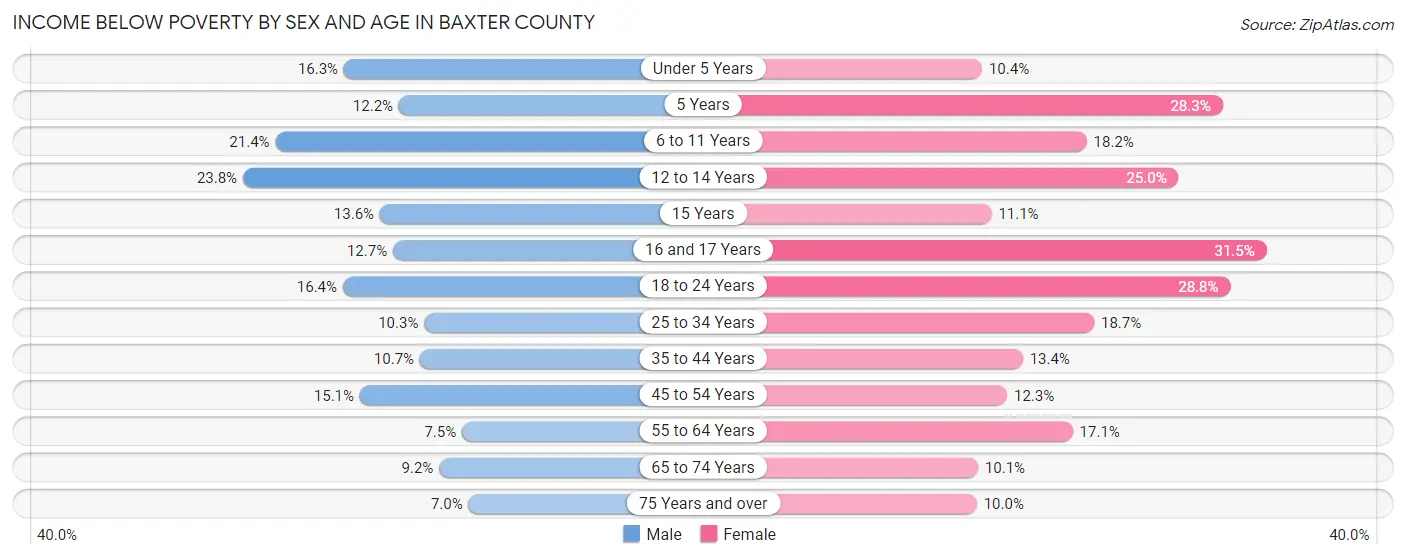
| Age Bracket | Male | Female |
| Under 5 Years | 143 (16.3%) | 86 (10.4%) |
| 5 Years | 26 (12.2%) | 39 (28.3%) |
| 6 to 11 Years | 254 (21.4%) | 188 (18.2%) |
| 12 to 14 Years | 187 (23.8%) | 177 (25.0%) |
| 15 Years | 47 (13.6%) | 17 (11.1%) |
| 16 and 17 Years | 52 (12.7%) | 169 (31.5%) |
| 18 to 24 Years | 209 (16.4%) | 342 (28.8%) |
| 25 to 34 Years | 202 (10.3%) | 351 (18.7%) |
| 35 to 44 Years | 215 (10.6%) | 285 (13.4%) |
| 45 to 54 Years | 343 (15.1%) | 285 (12.3%) |
| 55 to 64 Years | 222 (7.5%) | 576 (17.1%) |
| 65 to 74 Years | 290 (9.2%) | 357 (10.1%) |
| 75 Years and over | 197 (7.0%) | 328 (10.0%) |
| Total | 2,387 (11.8%) | 3,200 (15.2%) |
Income Above Poverty by Sex and Age in Baxter County
According to the poverty statistics in Baxter County, males aged 75 years and over and females aged 75 years and over are the age groups that are most secure financially, with 93.0% of males and 90.0% of females in these age groups living above the poverty line.
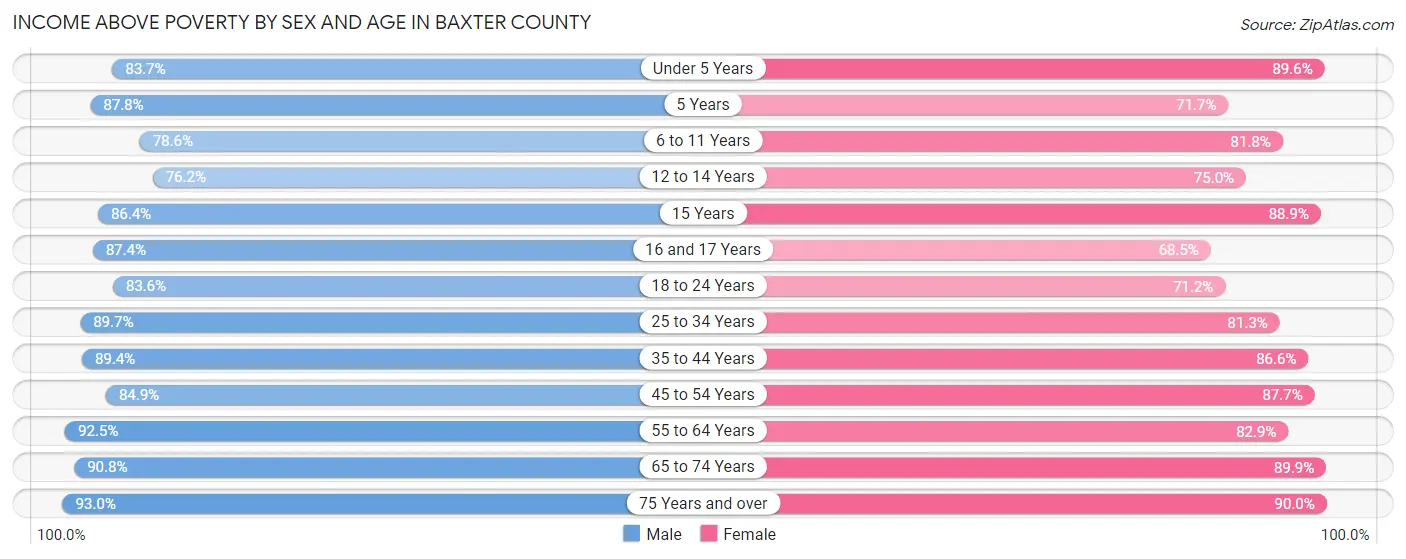
| Age Bracket | Male | Female |
| Under 5 Years | 735 (83.7%) | 740 (89.6%) |
| 5 Years | 187 (87.8%) | 99 (71.7%) |
| 6 to 11 Years | 934 (78.6%) | 846 (81.8%) |
| 12 to 14 Years | 599 (76.2%) | 531 (75.0%) |
| 15 Years | 298 (86.4%) | 136 (88.9%) |
| 16 and 17 Years | 359 (87.4%) | 367 (68.5%) |
| 18 to 24 Years | 1,068 (83.6%) | 844 (71.2%) |
| 25 to 34 Years | 1,754 (89.7%) | 1,523 (81.3%) |
| 35 to 44 Years | 1,804 (89.3%) | 1,837 (86.6%) |
| 45 to 54 Years | 1,927 (84.9%) | 2,038 (87.7%) |
| 55 to 64 Years | 2,730 (92.5%) | 2,784 (82.9%) |
| 65 to 74 Years | 2,854 (90.8%) | 3,175 (89.9%) |
| 75 Years and over | 2,602 (93.0%) | 2,945 (90.0%) |
| Total | 17,851 (88.2%) | 17,865 (84.8%) |
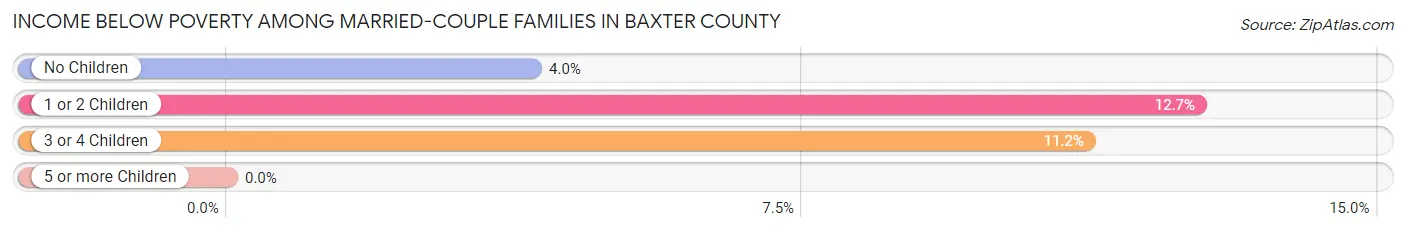
Income Below Poverty Among Married-Couple Families in Baxter County
The poverty statistics for married-couple families in Baxter County show that 6.3% or 593 of the total 9,420 families live below the poverty line. Families with 1 or 2 children have the highest poverty rate of 12.7%, comprising of 269 families. On the other hand, families with 5 or more children have the lowest poverty rate of 0.0%, which includes 0 families.
| Children | Above Poverty | Below Poverty |
| No Children | 6,439 (96.0%) | 266 (4.0%) |
| 1 or 2 Children | 1,857 (87.4%) | 269 (12.7%) |
| 3 or 4 Children | 460 (88.8%) | 58 (11.2%) |
| 5 or more Children | 71 (100.0%) | 0 (0.0%) |
| Total | 8,827 (93.7%) | 593 (6.3%) |
Income Below Poverty Among Single-Parent Households in Baxter County
According to the poverty data in Baxter County, 5.5% or 41 single-father households and 21.0% or 306 single-mother households are living below the poverty line. Among single-father households, those with 1 or 2 children have the highest poverty rate, with 17 households (6.9%) experiencing poverty. Likewise, among single-mother households, those with 5 or more children have the highest poverty rate, with 2 households (100.0%) falling below the poverty line.
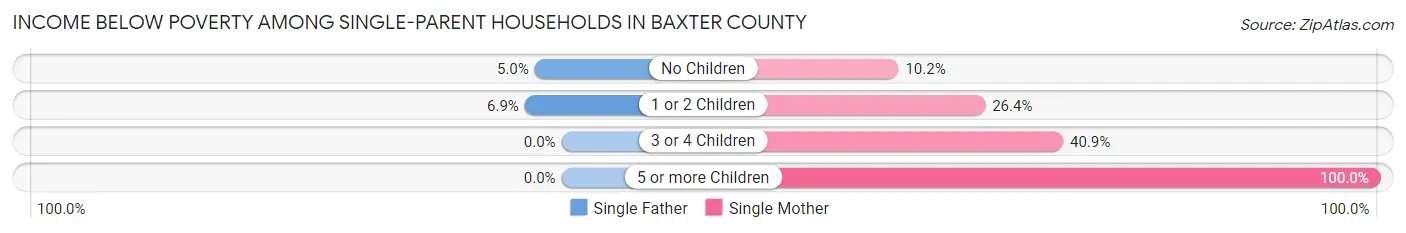
| Children | Single Father | Single Mother |
| No Children | 24 (5.0%) | 59 (10.2%) |
| 1 or 2 Children | 17 (6.9%) | 207 (26.4%) |
| 3 or 4 Children | 0 (0.0%) | 38 (40.9%) |
| 5 or more Children | 0 (0.0%) | 2 (100.0%) |
| Total | 41 (5.5%) | 306 (21.0%) |
Income Below Poverty Among Married-Couple vs Single-Parent Households in Baxter County
The poverty data for Baxter County shows that 593 of the married-couple family households (6.3%) and 347 of the single-parent households (15.8%) are living below the poverty level. Within the married-couple family households, those with 1 or 2 children have the highest poverty rate, with 269 households (12.7%) falling below the poverty line. Among the single-parent households, those with 5 or more children have the highest poverty rate, with 2 household (100.0%) living below poverty.
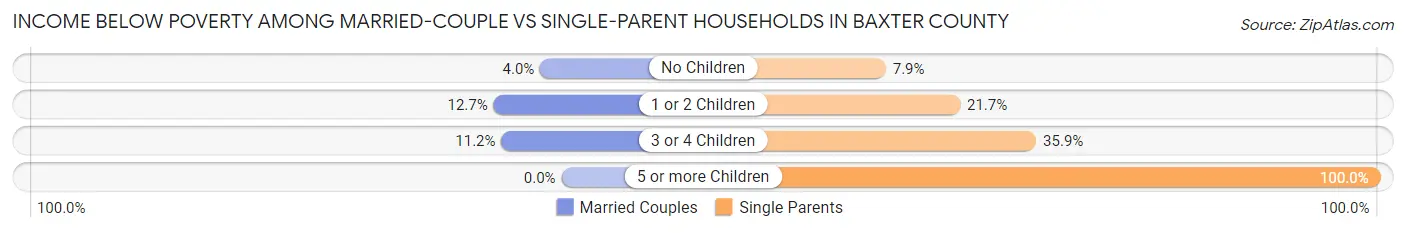
| Children | Married-Couple Families | Single-Parent Households |
| No Children | 266 (4.0%) | 83 (7.9%) |
| 1 or 2 Children | 269 (12.7%) | 224 (21.7%) |
| 3 or 4 Children | 58 (11.2%) | 38 (35.8%) |
| 5 or more Children | 0 (0.0%) | 2 (100.0%) |
| Total | 593 (6.3%) | 347 (15.8%) |
Race in Baxter County
The most populous races in Baxter County are White / Caucasian (39,074 | 93.5%), Two or more Races (2,007 | 4.8%), and Hispanic or Latino (1,118 | 2.7%).
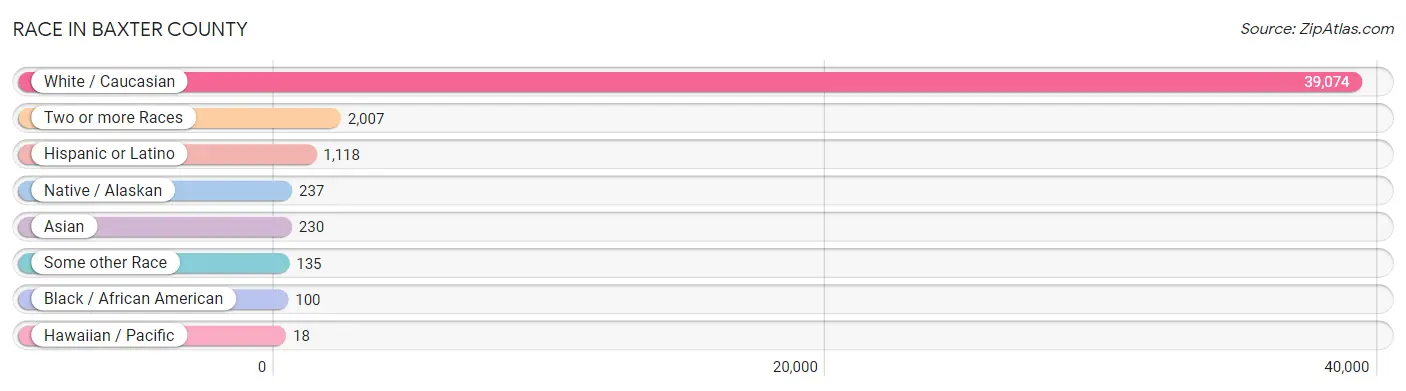
| Race | # Population | % Population |
| Asian | 230 | 0.5% |
| Black / African American | 100 | 0.2% |
| Hawaiian / Pacific | 18 | 0.0% |
| Hispanic or Latino | 1,118 | 2.7% |
| Native / Alaskan | 237 | 0.6% |
| White / Caucasian | 39,074 | 93.5% |
| Two or more Races | 2,007 | 4.8% |
| Some other Race | 135 | 0.3% |
| Total | 41,801 | 100.0% |
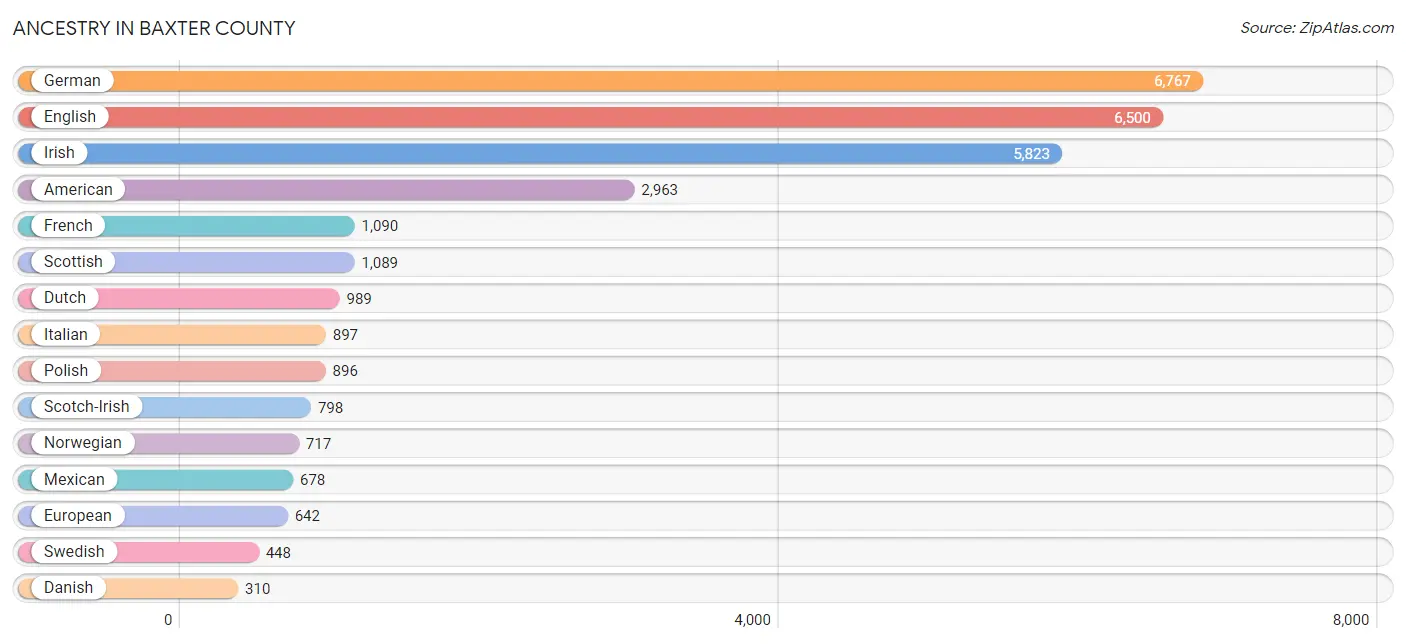
Ancestry in Baxter County
The most populous ancestries reported in Baxter County are German (6,767 | 16.2%), English (6,500 | 15.5%), Irish (5,823 | 13.9%), American (2,963 | 7.1%), and French (1,090 | 2.6%), together accounting for 55.4% of all Baxter County residents.
| Ancestry | # Population | % Population |
| American | 2,963 | 7.1% |
| Apache | 7 | 0.0% |
| Arab | 17 | 0.0% |
| Armenian | 56 | 0.1% |
| Austrian | 43 | 0.1% |
| Belgian | 87 | 0.2% |
| Bhutanese | 5 | 0.0% |
| Blackfeet | 11 | 0.0% |
| Brazilian | 51 | 0.1% |
| British | 202 | 0.5% |
| Burmese | 118 | 0.3% |
| Cajun | 2 | 0.0% |
| Canadian | 14 | 0.0% |
| Central American | 123 | 0.3% |
| Cherokee | 262 | 0.6% |
| Chickasaw | 32 | 0.1% |
| Choctaw | 60 | 0.1% |
| Comanche | 38 | 0.1% |
| Costa Rican | 38 | 0.1% |
| Croatian | 91 | 0.2% |
| Cuban | 45 | 0.1% |
| Czech | 254 | 0.6% |
| Czechoslovakian | 79 | 0.2% |
| Danish | 310 | 0.7% |
| Delaware | 10 | 0.0% |
| Dutch | 989 | 2.4% |
| Dutch West Indian | 17 | 0.0% |
| Eastern European | 21 | 0.1% |
| English | 6,500 | 15.5% |
| European | 642 | 1.5% |
| Fijian | 4 | 0.0% |
| Finnish | 40 | 0.1% |
| French | 1,090 | 2.6% |
| French Canadian | 120 | 0.3% |
| German | 6,767 | 16.2% |
| German Russian | 25 | 0.1% |
| Greek | 24 | 0.1% |
| Hungarian | 128 | 0.3% |
| Indian (Asian) | 29 | 0.1% |
| Irish | 5,823 | 13.9% |
| Iroquois | 6 | 0.0% |
| Italian | 897 | 2.1% |
| Korean | 33 | 0.1% |
| Lithuanian | 66 | 0.2% |
| Lumbee | 3 | 0.0% |
| Malaysian | 53 | 0.1% |
| Maltese | 28 | 0.1% |
| Mexican | 678 | 1.6% |
| Mexican American Indian | 63 | 0.2% |
| Navajo | 20 | 0.1% |
| Nicaraguan | 6 | 0.0% |
| Northern European | 45 | 0.1% |
| Norwegian | 717 | 1.7% |
| Pakistani | 3 | 0.0% |
| Panamanian | 38 | 0.1% |
| Pennsylvania German | 2 | 0.0% |
| Polish | 896 | 2.1% |
| Portuguese | 141 | 0.3% |
| Puerto Rican | 180 | 0.4% |
| Romanian | 11 | 0.0% |
| Russian | 63 | 0.2% |
| Salvadoran | 41 | 0.1% |
| Samoan | 85 | 0.2% |
| Scandinavian | 80 | 0.2% |
| Scotch-Irish | 798 | 1.9% |
| Scottish | 1,089 | 2.6% |
| Shoshone | 11 | 0.0% |
| Sioux | 16 | 0.0% |
| Slavic | 3 | 0.0% |
| Slovak | 29 | 0.1% |
| Slovene | 13 | 0.0% |
| Spaniard | 15 | 0.0% |
| Spanish | 76 | 0.2% |
| Sri Lankan | 5 | 0.0% |
| Subsaharan African | 3 | 0.0% |
| Swedish | 448 | 1.1% |
| Swiss | 64 | 0.2% |
| Thai | 19 | 0.1% |
| Ukrainian | 13 | 0.0% |
| Welsh | 212 | 0.5% | View All 80 Rows |
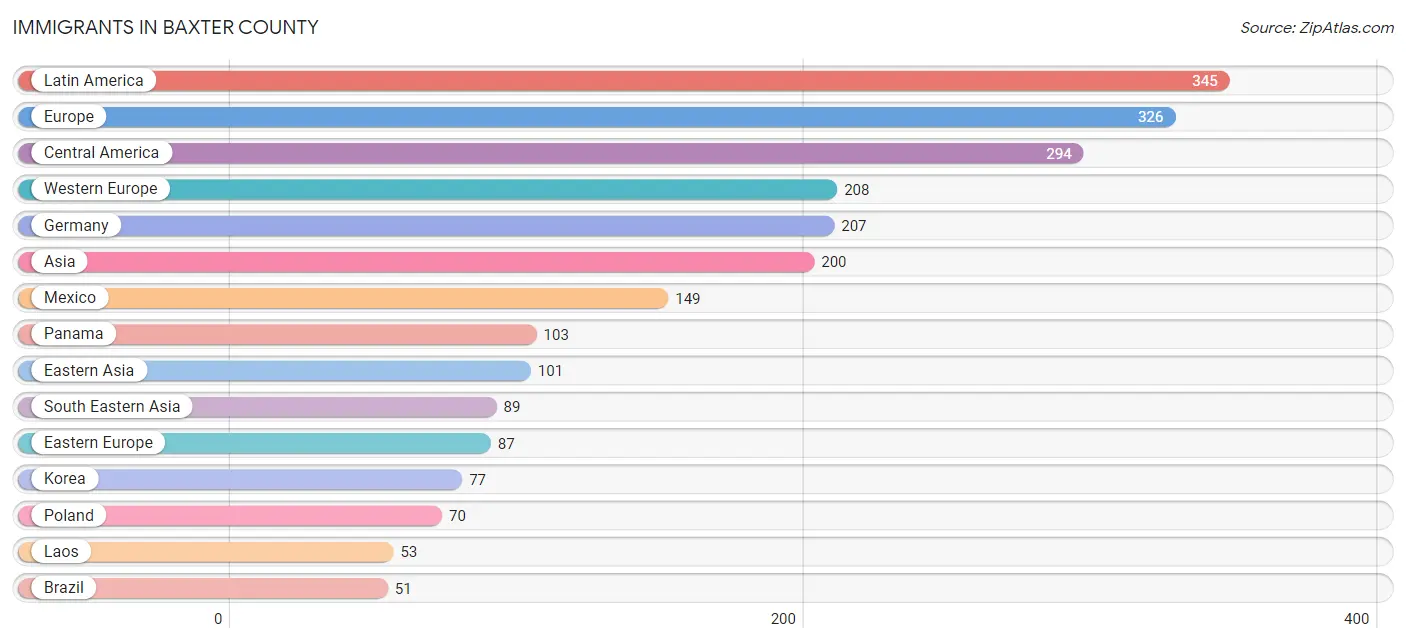
Immigrants in Baxter County
The most numerous immigrant groups reported in Baxter County came from Latin America (345 | 0.8%), Europe (326 | 0.8%), Central America (294 | 0.7%), Western Europe (208 | 0.5%), and Germany (207 | 0.5%), together accounting for 3.3% of all Baxter County residents.
| Immigration Origin | # Population | % Population |
| Asia | 200 | 0.5% |
| Austria | 1 | 0.0% |
| Brazil | 51 | 0.1% |
| Canada | 33 | 0.1% |
| Central America | 294 | 0.7% |
| China | 24 | 0.1% |
| Costa Rica | 38 | 0.1% |
| Czechoslovakia | 9 | 0.0% |
| Eastern Asia | 101 | 0.2% |
| Eastern Europe | 87 | 0.2% |
| El Salvador | 4 | 0.0% |
| England | 5 | 0.0% |
| Europe | 326 | 0.8% |
| Germany | 207 | 0.5% |
| Hungary | 2 | 0.0% |
| India | 10 | 0.0% |
| Korea | 77 | 0.2% |
| Laos | 53 | 0.1% |
| Latin America | 345 | 0.8% |
| Mexico | 149 | 0.4% |
| Northern Europe | 31 | 0.1% |
| Oceania | 4 | 0.0% |
| Panama | 103 | 0.3% |
| Philippines | 28 | 0.1% |
| Poland | 70 | 0.2% |
| Russia | 6 | 0.0% |
| Scotland | 19 | 0.1% |
| South America | 51 | 0.1% |
| South Central Asia | 10 | 0.0% |
| South Eastern Asia | 89 | 0.2% |
| Thailand | 3 | 0.0% |
| Vietnam | 5 | 0.0% |
| Western Europe | 208 | 0.5% | View All 33 Rows |
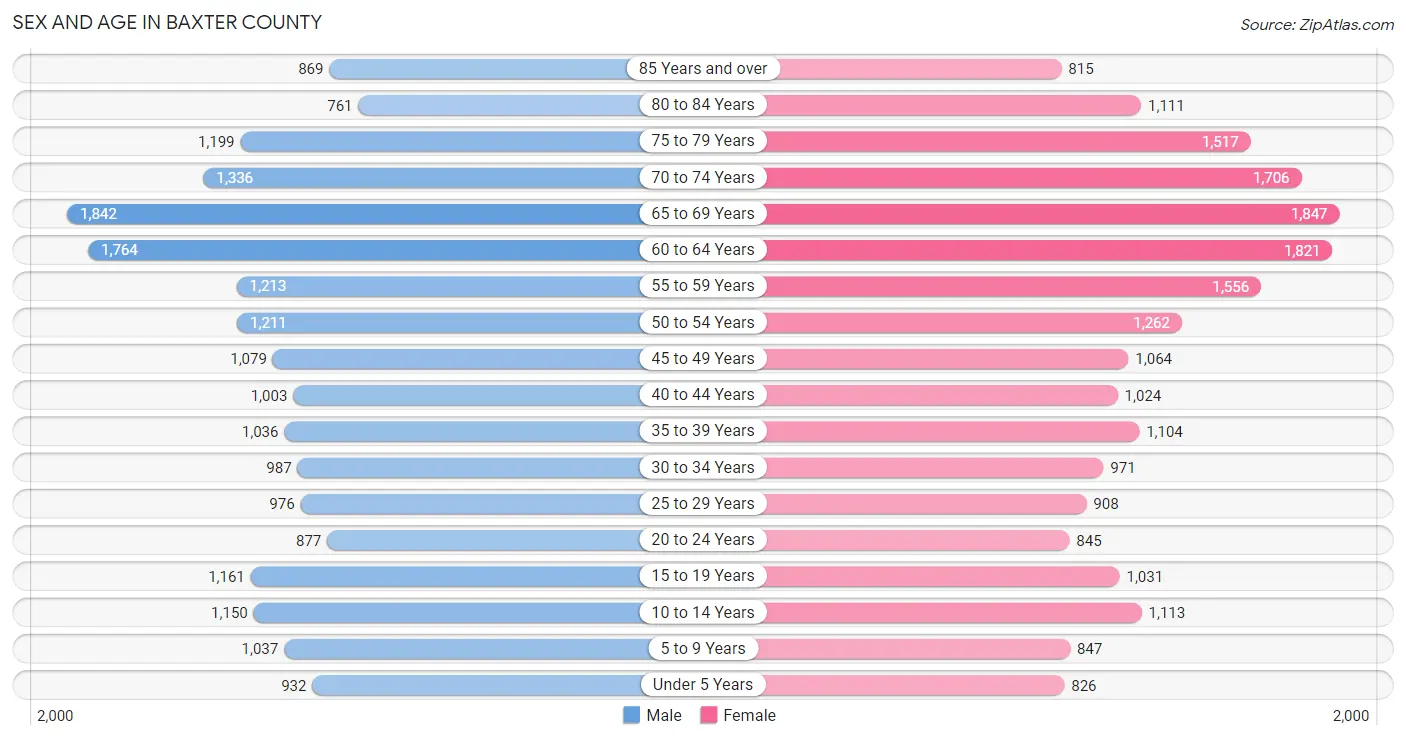
Sex and Age in Baxter County
Sex and Age in Baxter County
The most populous age groups in Baxter County are 65 to 69 Years (1,842 | 9.0%) for men and 65 to 69 Years (1,847 | 8.6%) for women.
| Age Bracket | Male | Female |
| Under 5 Years | 932 (4.6%) | 826 (3.9%) |
| 5 to 9 Years | 1,037 (5.1%) | 847 (4.0%) |
| 10 to 14 Years | 1,150 (5.6%) | 1,113 (5.2%) |
| 15 to 19 Years | 1,161 (5.7%) | 1,031 (4.8%) |
| 20 to 24 Years | 877 (4.3%) | 845 (4.0%) |
| 25 to 29 Years | 976 (4.8%) | 908 (4.3%) |
| 30 to 34 Years | 987 (4.8%) | 971 (4.5%) |
| 35 to 39 Years | 1,036 (5.1%) | 1,104 (5.2%) |
| 40 to 44 Years | 1,003 (4.9%) | 1,024 (4.8%) |
| 45 to 49 Years | 1,079 (5.3%) | 1,064 (5.0%) |
| 50 to 54 Years | 1,211 (5.9%) | 1,262 (5.9%) |
| 55 to 59 Years | 1,213 (5.9%) | 1,556 (7.3%) |
| 60 to 64 Years | 1,764 (8.6%) | 1,821 (8.5%) |
| 65 to 69 Years | 1,842 (9.0%) | 1,847 (8.6%) |
| 70 to 74 Years | 1,336 (6.5%) | 1,706 (8.0%) |
| 75 to 79 Years | 1,199 (5.9%) | 1,517 (7.1%) |
| 80 to 84 Years | 761 (3.7%) | 1,111 (5.2%) |
| 85 Years and over | 869 (4.3%) | 815 (3.8%) |
| Total | 20,433 (100.0%) | 21,368 (100.0%) |
Families and Households in Baxter County
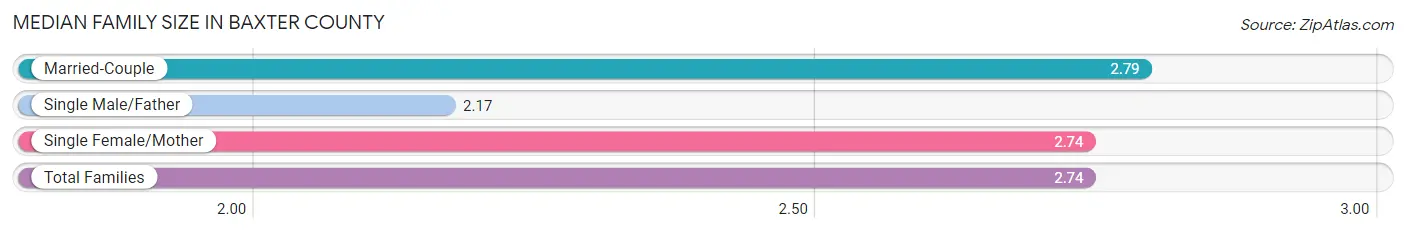
Median Family Size in Baxter County
The median family size in Baxter County is 2.74 persons per family, with married-couple families (9,420 | 81.1%) accounting for the largest median family size of 2.79 persons per family. On the other hand, single male/father families (740 | 6.4%) represent the smallest median family size with 2.17 persons per family.
| Family Type | # Families | Family Size |
| Married-Couple | 9,420 (81.1%) | 2.79 |
| Single Male/Father | 740 (6.4%) | 2.17 |
| Single Female/Mother | 1,458 (12.6%) | 2.74 |
| Total Families | 11,618 (100.0%) | 2.74 |
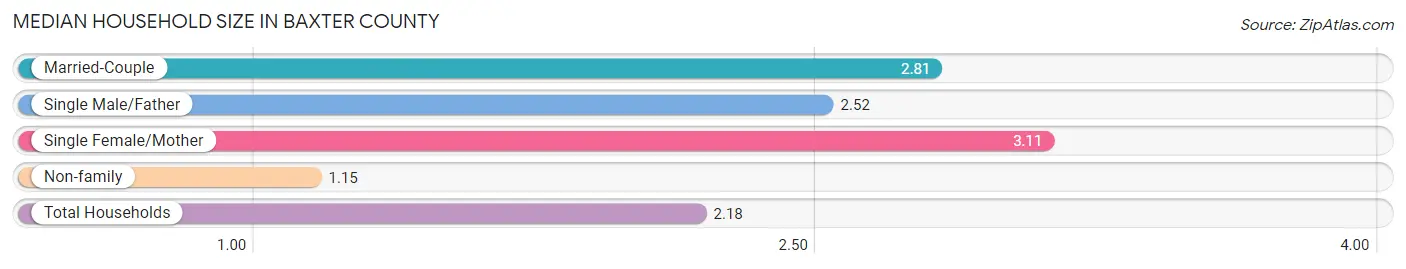
Median Household Size in Baxter County
The median household size in Baxter County is 2.18 persons per household, with single female/mother households (1,458 | 7.7%) accounting for the largest median household size of 3.11 persons per household. non-family households (7,403 | 38.9%) represent the smallest median household size with 1.15 persons per household.
| Household Type | # Households | Household Size |
| Married-Couple | 9,420 (49.5%) | 2.81 |
| Single Male/Father | 740 (3.9%) | 2.52 |
| Single Female/Mother | 1,458 (7.7%) | 3.11 |
| Non-family | 7,403 (38.9%) | 1.15 |
| Total Households | 19,021 (100.0%) | 2.18 |
Household Size by Marriage Status in Baxter County
Out of a total of 19,021 households in Baxter County, 11,618 (61.1%) are family households, while 7,403 (38.9%) are nonfamily households. The most numerous type of family households are 2-person households, comprising 6,994, and the most common type of nonfamily households are 1-person households, comprising 6,327.
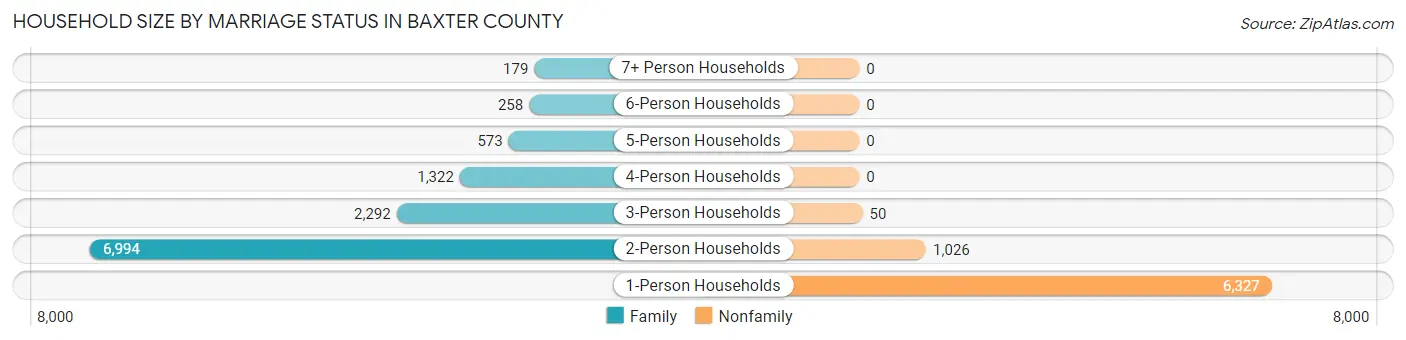
| Household Size | Family Households | Nonfamily Households |
| 1-Person Households | - | 6,327 (33.3%) |
| 2-Person Households | 6,994 (36.8%) | 1,026 (5.4%) |
| 3-Person Households | 2,292 (12.0%) | 50 (0.3%) |
| 4-Person Households | 1,322 (7.0%) | 0 (0.0%) |
| 5-Person Households | 573 (3.0%) | 0 (0.0%) |
| 6-Person Households | 258 (1.4%) | 0 (0.0%) |
| 7+ Person Households | 179 (0.9%) | 0 (0.0%) |
| Total | 11,618 (61.1%) | 7,403 (38.9%) |
Female Fertility in Baxter County
Fertility by Age in Baxter County
Average fertility rate in Baxter County is 48.0 births per 1,000 women. Women in the age bracket of 20 to 34 years have the highest fertility rate with 108.0 births per 1,000 women. Women in the age bracket of 20 to 34 years acount for 85.0% of all women with births.
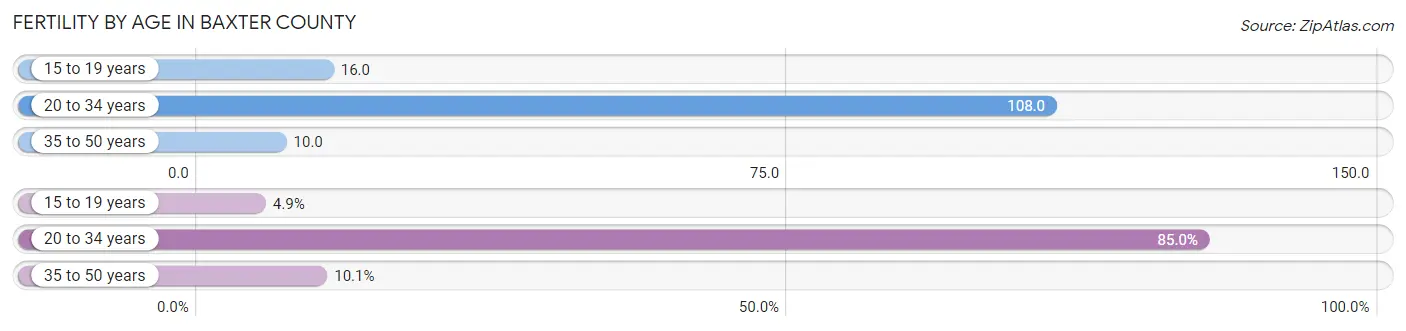
| Age Bracket | Women with Births | Births / 1,000 Women |
| 15 to 19 years | 17 (4.9%) | 16.0 |
| 20 to 34 years | 294 (85.0%) | 108.0 |
| 35 to 50 years | 35 (10.1%) | 10.0 |
| Total | 346 (100.0%) | 48.0 |
Fertility by Age by Marriage Status in Baxter County
67.3% of women with births (346) in Baxter County are married. The highest percentage of unmarried women with births falls into 15 to 19 years age bracket with 100.0% of them unmarried at the time of birth, while the lowest percentage of unmarried women with births belong to 20 to 34 years age bracket with 28.9% of them unmarried.
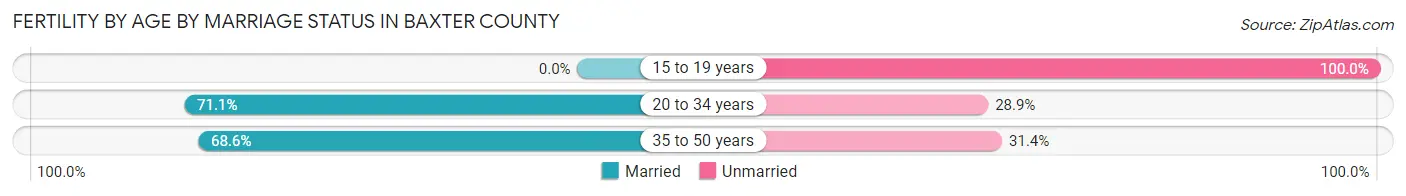
| Age Bracket | Married | Unmarried |
| 15 to 19 years | 0 (0.0%) | 17 (100.0%) |
| 20 to 34 years | 209 (71.1%) | 85 (28.9%) |
| 35 to 50 years | 24 (68.6%) | 11 (31.4%) |
| Total | 233 (67.3%) | 113 (32.7%) |
Fertility by Education in Baxter County
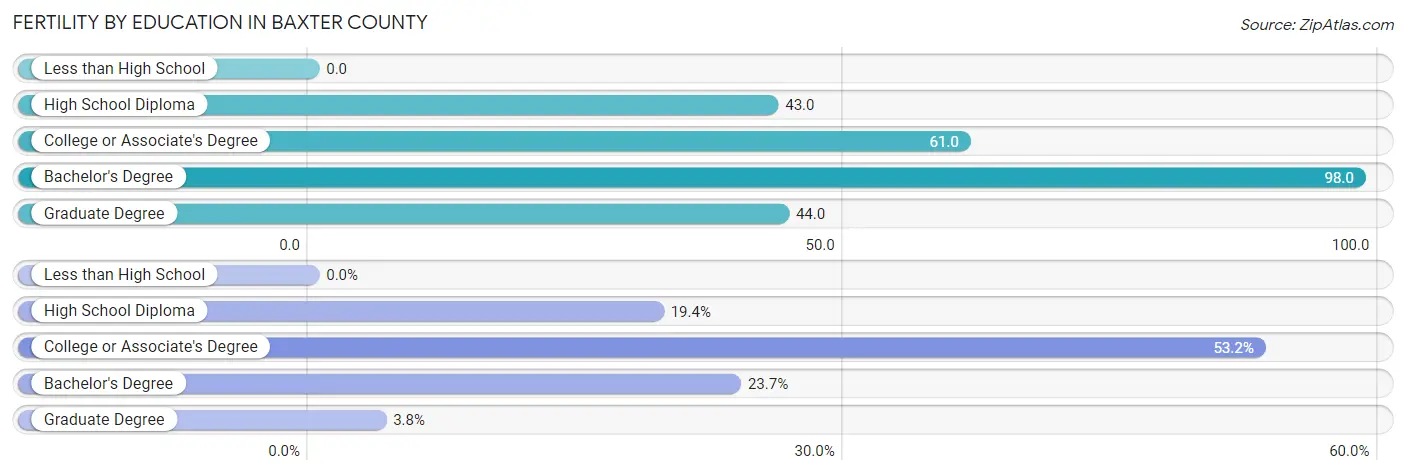
| Educational Attainment | Women with Births | Births / 1,000 Women |
| Less than High School | 0 (0.0%) | 0.0 |
| High School Diploma | 67 (19.4%) | 43.0 |
| College or Associate's Degree | 184 (53.2%) | 61.0 |
| Bachelor's Degree | 82 (23.7%) | 98.0 |
| Graduate Degree | 13 (3.8%) | 44.0 |
| Total | 346 (100.0%) | 48.0 |
Fertility by Education by Marriage Status in Baxter County
32.7% of women with births in Baxter County are unmarried. Women with the educational attainment of bachelor's degree are most likely to be married with 100.0% of them married at childbirth, while women with the educational attainment of high school diploma are least likely to be married with 55.2% of them unmarried at childbirth.
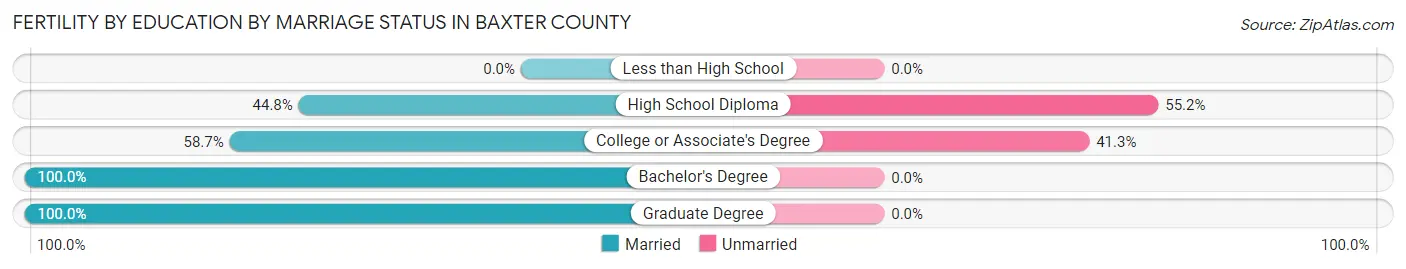
| Educational Attainment | Married | Unmarried |
| Less than High School | 0 (0.0%) | 0 (0.0%) |
| High School Diploma | 30 (44.8%) | 37 (55.2%) |
| College or Associate's Degree | 108 (58.7%) | 76 (41.3%) |
| Bachelor's Degree | 82 (100.0%) | 0 (0.0%) |
| Graduate Degree | 13 (100.0%) | 0 (0.0%) |
| Total | 233 (67.3%) | 113 (32.7%) |
Employment Characteristics in Baxter County
Employment by Class of Employer in Baxter County
Among the 15,129 employed individuals in Baxter County, private company employees (9,995 | 66.1%), not-for-profit organizations (1,288 | 8.5%), and self-employed (not incorporated) (1,133 | 7.5%) make up the most common classes of employment.
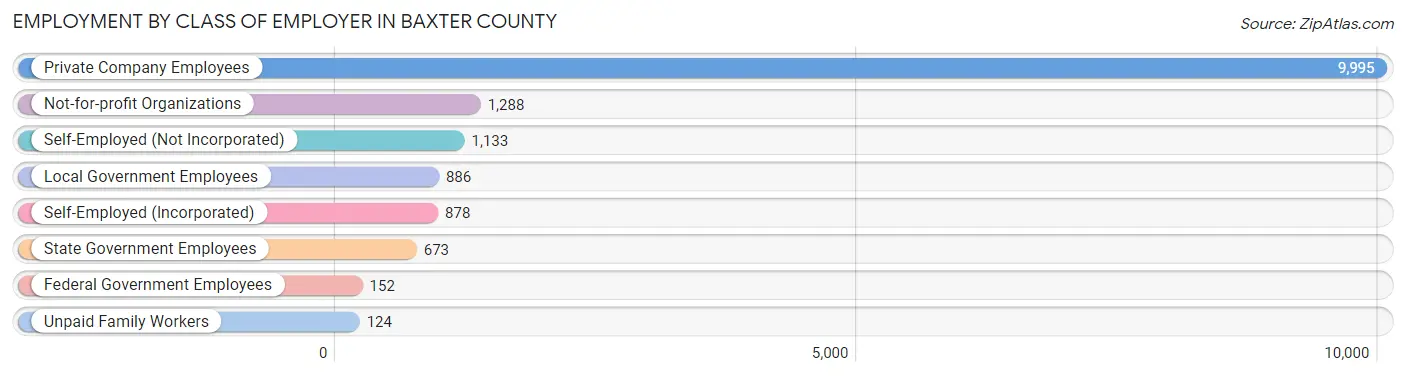
| Employer Class | # Employees | % Employees |
| Private Company Employees | 9,995 | 66.1% |
| Self-Employed (Incorporated) | 878 | 5.8% |
| Self-Employed (Not Incorporated) | 1,133 | 7.5% |
| Not-for-profit Organizations | 1,288 | 8.5% |
| Local Government Employees | 886 | 5.9% |
| State Government Employees | 673 | 4.4% |
| Federal Government Employees | 152 | 1.0% |
| Unpaid Family Workers | 124 | 0.8% |
| Total | 15,129 | 100.0% |
Employment Status by Age in Baxter County
According to the labor force statistics for Baxter County, out of the total population over 16 years of age (35,398), 45.8% or 16,212 individuals are in the labor force, with 5.1% or 827 of them unemployed. The age group with the highest labor force participation rate is 30 to 34 years, with 82.8% or 1,621 individuals in the labor force. Within the labor force, the 16 to 19 years age range has the highest percentage of unemployed individuals, with 12.5% or 75 of them being unemployed.
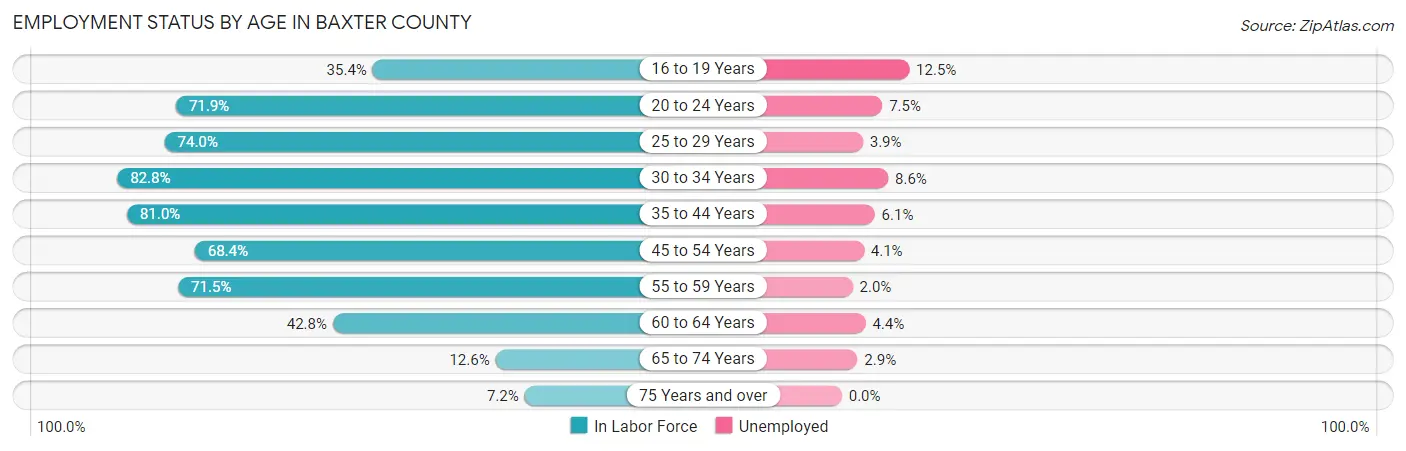
| Age Bracket | In Labor Force | Unemployed |
| 16 to 19 Years | 600 (35.4%) | 75 (12.5%) |
| 20 to 24 Years | 1,238 (71.9%) | 93 (7.5%) |
| 25 to 29 Years | 1,394 (74.0%) | 54 (3.9%) |
| 30 to 34 Years | 1,621 (82.8%) | 139 (8.6%) |
| 35 to 44 Years | 3,375 (81.0%) | 206 (6.1%) |
| 45 to 54 Years | 3,157 (68.4%) | 129 (4.1%) |
| 55 to 59 Years | 1,980 (71.5%) | 40 (2.0%) |
| 60 to 64 Years | 1,534 (42.8%) | 67 (4.4%) |
| 65 to 74 Years | 848 (12.6%) | 25 (2.9%) |
| 75 Years and over | 452 (7.2%) | 0 (0.0%) |
| Total | 16,212 (45.8%) | 827 (5.1%) |
Employment Status by Educational Attainment in Baxter County
According to labor force statistics for Baxter County, 68.8% of individuals (13,058) out of the total population between 25 and 64 years of age (18,979) are in the labor force, with 4.9% or 640 of them being unemployed. The group with the highest labor force participation rate are those with the educational attainment of bachelor's degree or higher, with 82.8% or 3,011 individuals in the labor force. Within the labor force, individuals with less than high school education have the highest percentage of unemployment, with 13.3% or 167 of them being unemployed.
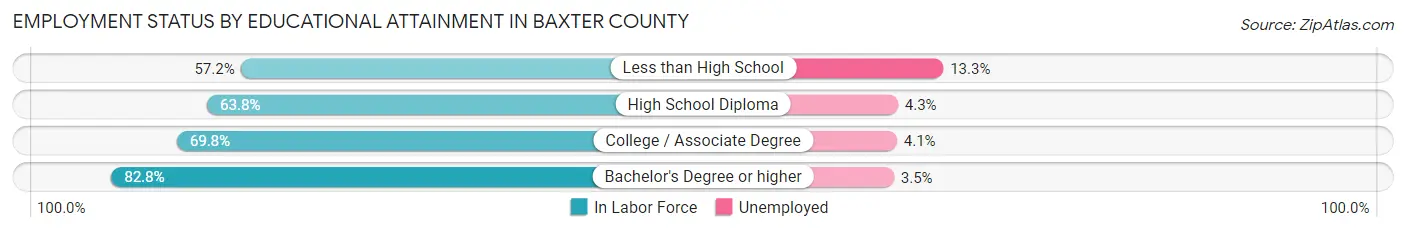
| Educational Attainment | In Labor Force | Unemployed |
| Less than High School | 1,252 (57.2%) | 291 (13.3%) |
| High School Diploma | 4,068 (63.8%) | 274 (4.3%) |
| College / Associate Degree | 4,730 (69.8%) | 278 (4.1%) |
| Bachelor's Degree or higher | 3,011 (82.8%) | 127 (3.5%) |
| Total | 13,058 (68.8%) | 930 (4.9%) |
Employment Occupations by Sex in Baxter County
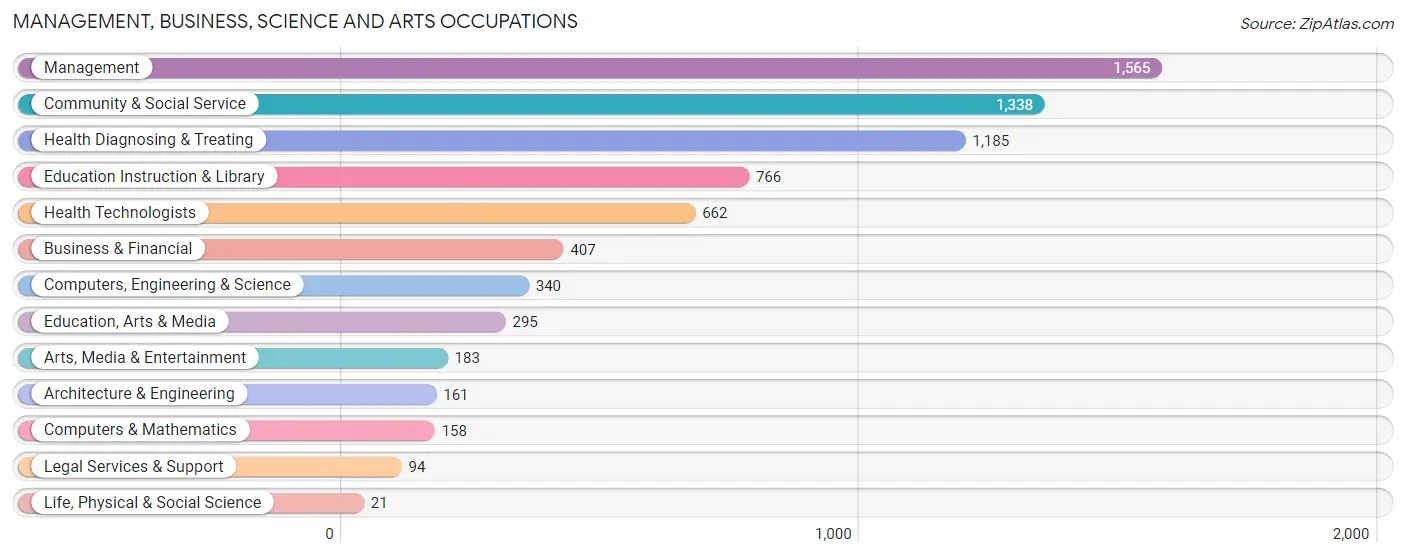
Management, Business, Science and Arts Occupations
The most common Management, Business, Science and Arts occupations in Baxter County are Management (1,565 | 10.2%), Community & Social Service (1,338 | 8.7%), Health Diagnosing & Treating (1,185 | 7.7%), Education Instruction & Library (766 | 5.0%), and Health Technologists (662 | 4.3%).
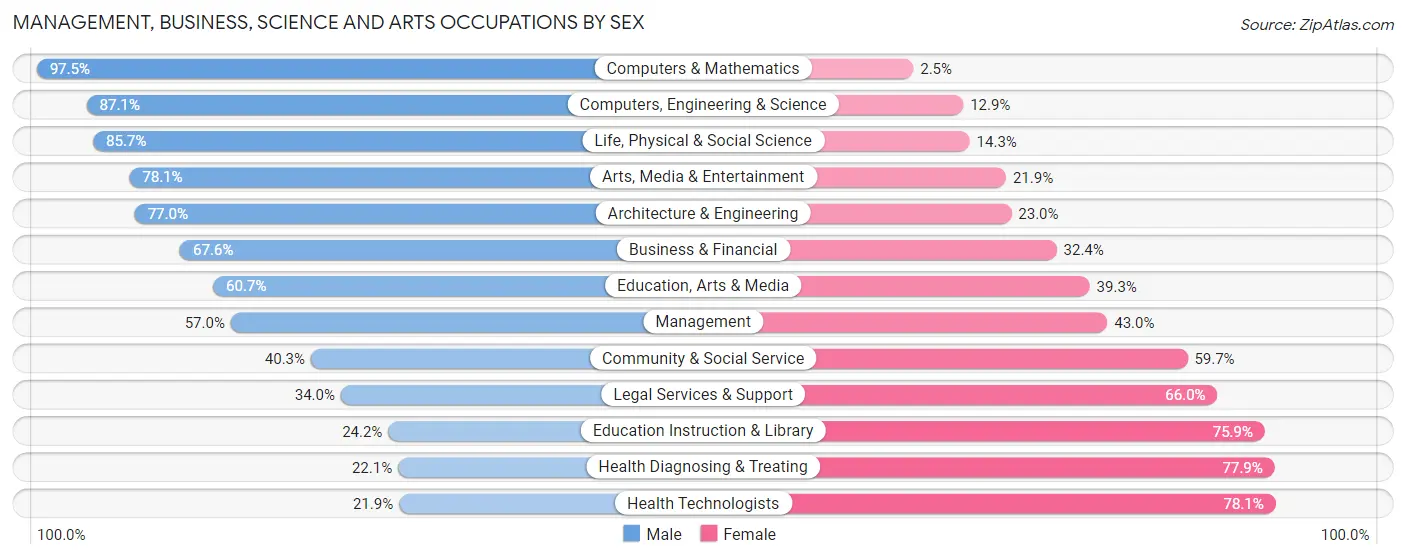
Management, Business, Science and Arts Occupations by Sex
Within the Management, Business, Science and Arts occupations in Baxter County, the most male-oriented occupations are Computers & Mathematics (97.5%), Computers, Engineering & Science (87.1%), and Life, Physical & Social Science (85.7%), while the most female-oriented occupations are Health Technologists (78.1%), Health Diagnosing & Treating (77.9%), and Education Instruction & Library (75.8%).
| Occupation | Male | Female |
| Management | 892 (57.0%) | 673 (43.0%) |
| Business & Financial | 275 (67.6%) | 132 (32.4%) |
| Computers, Engineering & Science | 296 (87.1%) | 44 (12.9%) |
| Computers & Mathematics | 154 (97.5%) | 4 (2.5%) |
| Architecture & Engineering | 124 (77.0%) | 37 (23.0%) |
| Life, Physical & Social Science | 18 (85.7%) | 3 (14.3%) |
| Community & Social Service | 539 (40.3%) | 799 (59.7%) |
| Education, Arts & Media | 179 (60.7%) | 116 (39.3%) |
| Legal Services & Support | 32 (34.0%) | 62 (66.0%) |
| Education Instruction & Library | 185 (24.1%) | 581 (75.8%) |
| Arts, Media & Entertainment | 143 (78.1%) | 40 (21.9%) |
| Health Diagnosing & Treating | 262 (22.1%) | 923 (77.9%) |
| Health Technologists | 145 (21.9%) | 517 (78.1%) |
| Total (Category) | 2,264 (46.8%) | 2,571 (53.2%) |
| Total (Overall) | 7,964 (51.8%) | 7,407 (48.2%) |
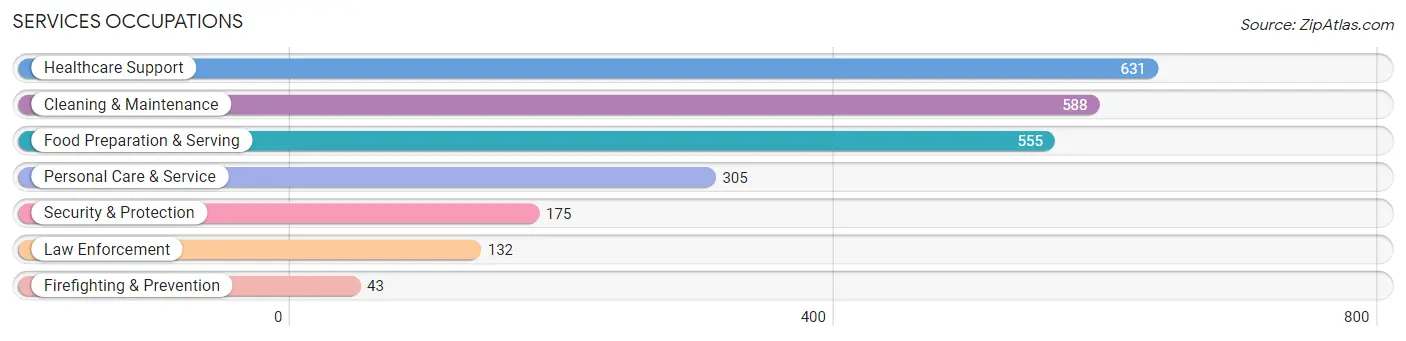
Services Occupations
The most common Services occupations in Baxter County are Healthcare Support (631 | 4.1%), Cleaning & Maintenance (588 | 3.8%), Food Preparation & Serving (555 | 3.6%), Personal Care & Service (305 | 2.0%), and Security & Protection (175 | 1.1%).
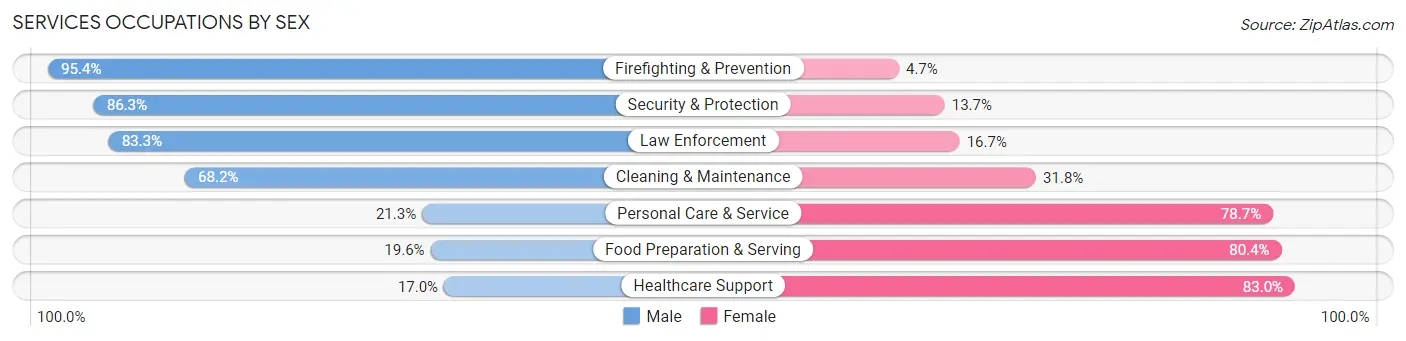
Services Occupations by Sex
Within the Services occupations in Baxter County, the most male-oriented occupations are Firefighting & Prevention (95.4%), Security & Protection (86.3%), and Law Enforcement (83.3%), while the most female-oriented occupations are Healthcare Support (83.0%), Food Preparation & Serving (80.4%), and Personal Care & Service (78.7%).
| Occupation | Male | Female |
| Healthcare Support | 107 (17.0%) | 524 (83.0%) |
| Security & Protection | 151 (86.3%) | 24 (13.7%) |
| Firefighting & Prevention | 41 (95.4%) | 2 (4.6%) |
| Law Enforcement | 110 (83.3%) | 22 (16.7%) |
| Food Preparation & Serving | 109 (19.6%) | 446 (80.4%) |
| Cleaning & Maintenance | 401 (68.2%) | 187 (31.8%) |
| Personal Care & Service | 65 (21.3%) | 240 (78.7%) |
| Total (Category) | 833 (37.0%) | 1,421 (63.0%) |
| Total (Overall) | 7,964 (51.8%) | 7,407 (48.2%) |
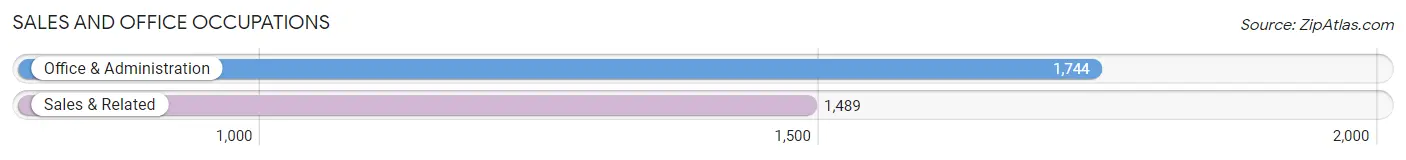
Sales and Office Occupations
The most common Sales and Office occupations in Baxter County are Office & Administration (1,744 | 11.4%), and Sales & Related (1,489 | 9.7%).
Sales and Office Occupations by Sex
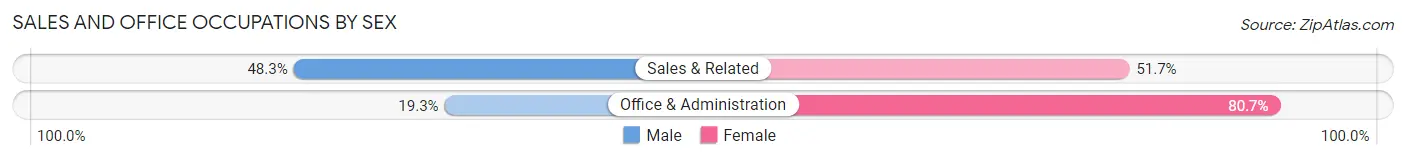
| Occupation | Male | Female |
| Sales & Related | 719 (48.3%) | 770 (51.7%) |
| Office & Administration | 336 (19.3%) | 1,408 (80.7%) |
| Total (Category) | 1,055 (32.6%) | 2,178 (67.4%) |
| Total (Overall) | 7,964 (51.8%) | 7,407 (48.2%) |
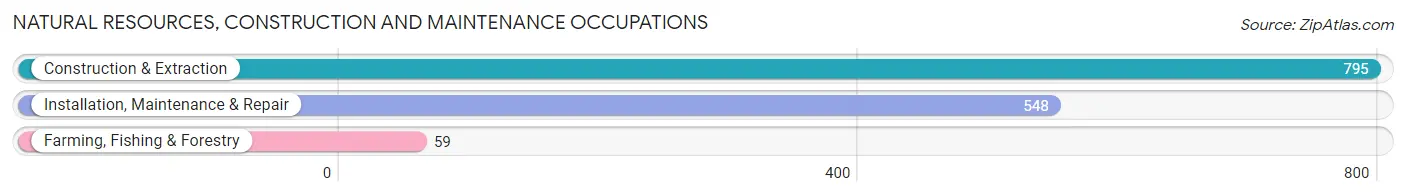
Natural Resources, Construction and Maintenance Occupations
The most common Natural Resources, Construction and Maintenance occupations in Baxter County are Construction & Extraction (795 | 5.2%), Installation, Maintenance & Repair (548 | 3.6%), and Farming, Fishing & Forestry (59 | 0.4%).
Natural Resources, Construction and Maintenance Occupations by Sex
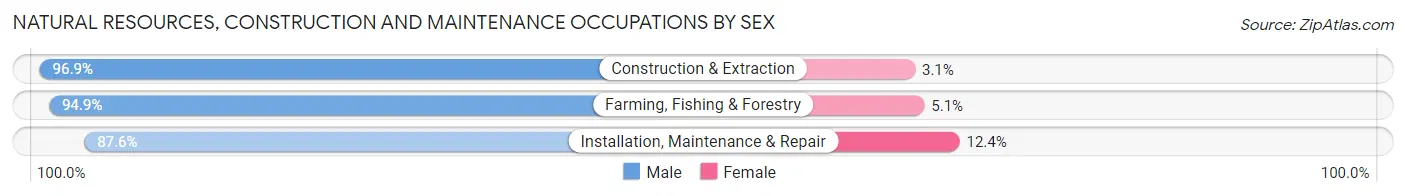
| Occupation | Male | Female |
| Farming, Fishing & Forestry | 56 (94.9%) | 3 (5.1%) |
| Construction & Extraction | 770 (96.9%) | 25 (3.1%) |
| Installation, Maintenance & Repair | 480 (87.6%) | 68 (12.4%) |
| Total (Category) | 1,306 (93.1%) | 96 (6.9%) |
| Total (Overall) | 7,964 (51.8%) | 7,407 (48.2%) |
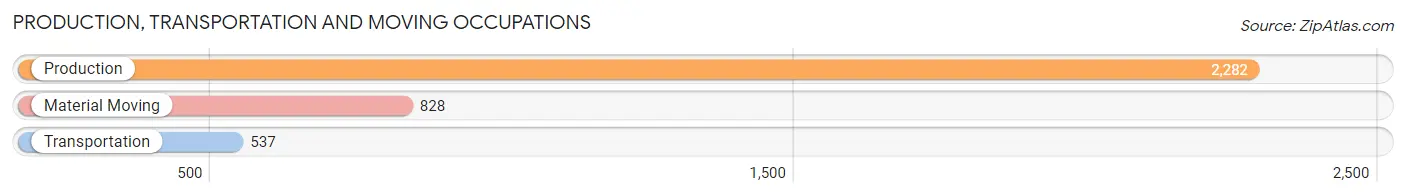
Production, Transportation and Moving Occupations
The most common Production, Transportation and Moving occupations in Baxter County are Production (2,282 | 14.8%), Material Moving (828 | 5.4%), and Transportation (537 | 3.5%).
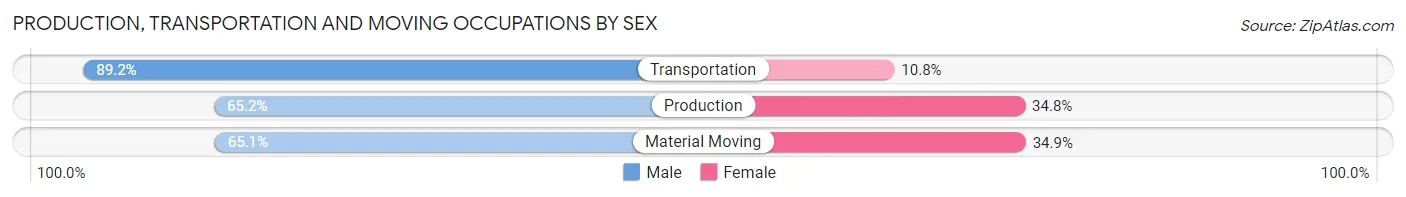
Production, Transportation and Moving Occupations by Sex
| Occupation | Male | Female |
| Production | 1,488 (65.2%) | 794 (34.8%) |
| Transportation | 479 (89.2%) | 58 (10.8%) |
| Material Moving | 539 (65.1%) | 289 (34.9%) |
| Total (Category) | 2,506 (68.7%) | 1,141 (31.3%) |
| Total (Overall) | 7,964 (51.8%) | 7,407 (48.2%) |
Employment Industries by Sex in Baxter County
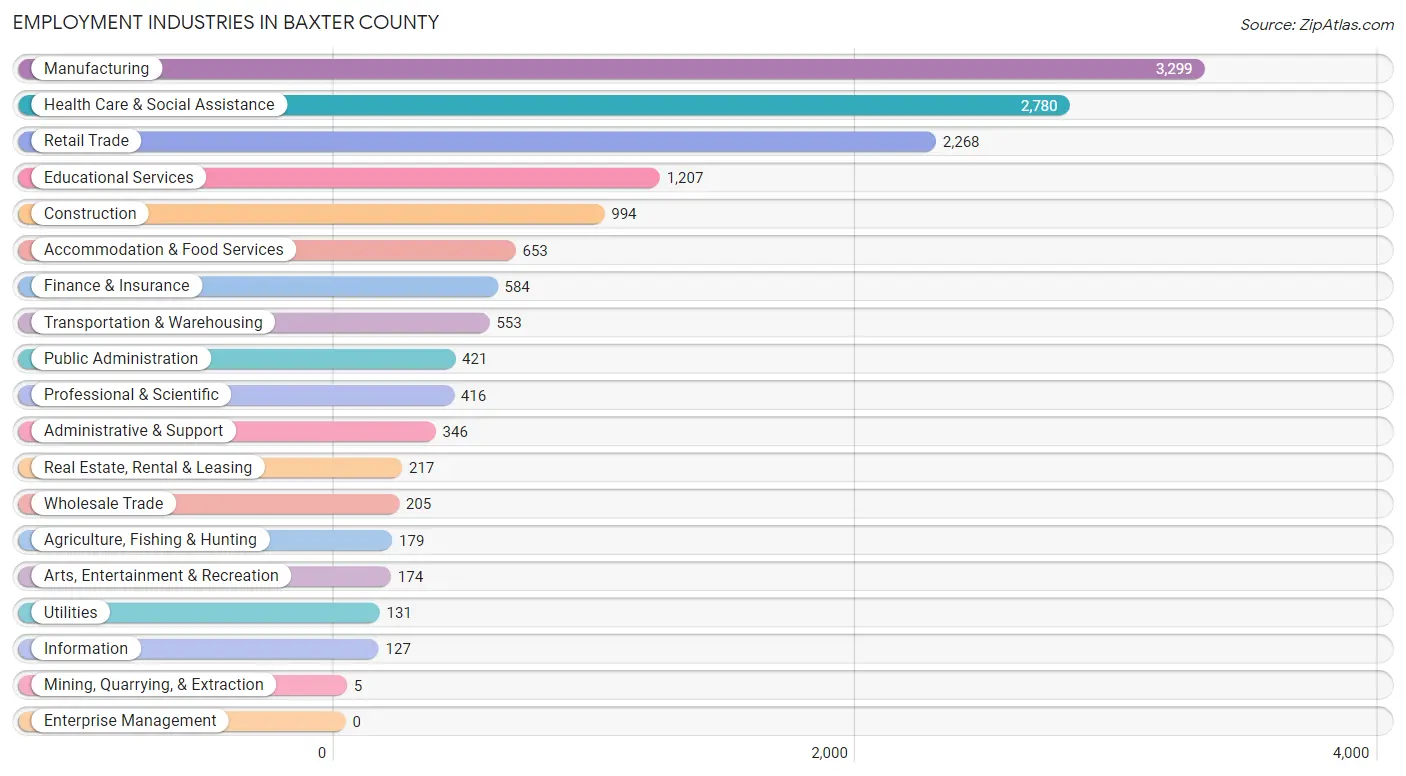
Employment Industries in Baxter County
The major employment industries in Baxter County include Manufacturing (3,299 | 21.5%), Health Care & Social Assistance (2,780 | 18.1%), Retail Trade (2,268 | 14.8%), Educational Services (1,207 | 7.9%), and Construction (994 | 6.5%).
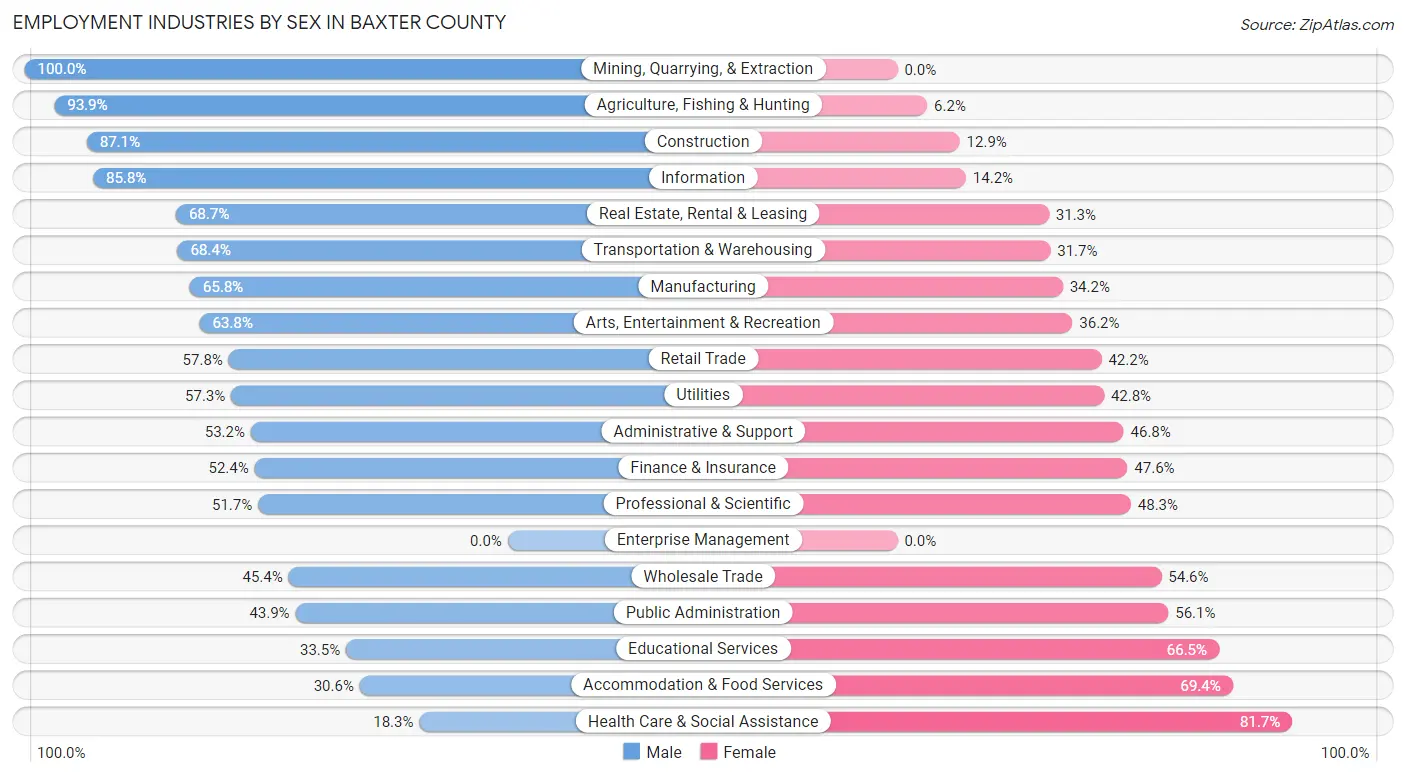
Employment Industries by Sex in Baxter County
The Baxter County industries that see more men than women are Mining, Quarrying, & Extraction (100.0%), Agriculture, Fishing & Hunting (93.9%), and Construction (87.1%), whereas the industries that tend to have a higher number of women are Health Care & Social Assistance (81.7%), Accommodation & Food Services (69.4%), and Educational Services (66.5%).
| Industry | Male | Female |
| Agriculture, Fishing & Hunting | 168 (93.9%) | 11 (6.1%) |
| Mining, Quarrying, & Extraction | 5 (100.0%) | 0 (0.0%) |
| Construction | 866 (87.1%) | 128 (12.9%) |
| Manufacturing | 2,170 (65.8%) | 1,129 (34.2%) |
| Wholesale Trade | 93 (45.4%) | 112 (54.6%) |
| Retail Trade | 1,310 (57.8%) | 958 (42.2%) |
| Transportation & Warehousing | 378 (68.3%) | 175 (31.7%) |
| Utilities | 75 (57.3%) | 56 (42.7%) |
| Information | 109 (85.8%) | 18 (14.2%) |
| Finance & Insurance | 306 (52.4%) | 278 (47.6%) |
| Real Estate, Rental & Leasing | 149 (68.7%) | 68 (31.3%) |
| Professional & Scientific | 215 (51.7%) | 201 (48.3%) |
| Enterprise Management | 0 (0.0%) | 0 (0.0%) |
| Administrative & Support | 184 (53.2%) | 162 (46.8%) |
| Educational Services | 404 (33.5%) | 803 (66.5%) |
| Health Care & Social Assistance | 509 (18.3%) | 2,271 (81.7%) |
| Arts, Entertainment & Recreation | 111 (63.8%) | 63 (36.2%) |
| Accommodation & Food Services | 200 (30.6%) | 453 (69.4%) |
| Public Administration | 185 (43.9%) | 236 (56.1%) |
| Total | 7,964 (51.8%) | 7,407 (48.2%) |
Education in Baxter County
School Enrollment in Baxter County
The most common levels of schooling among the 7,184 students in Baxter County are middle school (2,044 | 28.4%), high school (1,687 | 23.5%), and elementary school (1,426 | 19.9%).
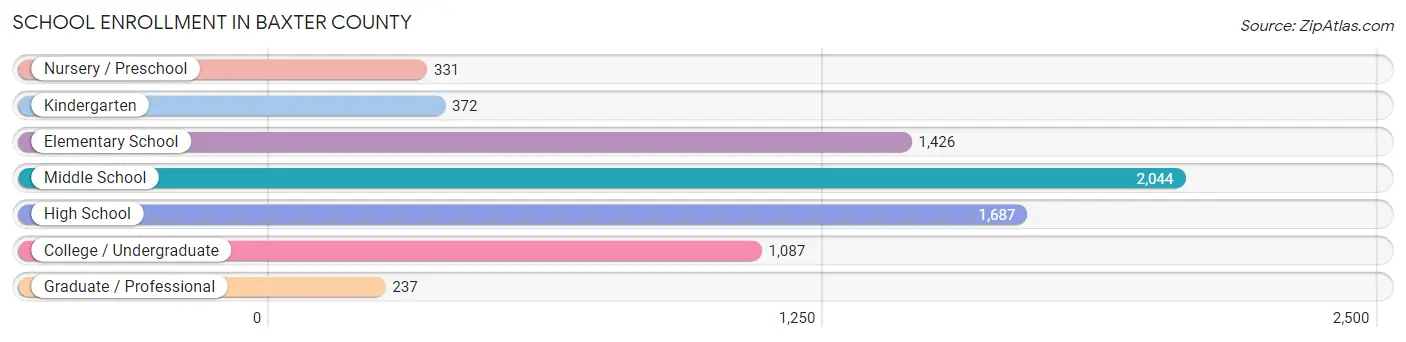
| School Level | # Students | % Students |
| Nursery / Preschool | 331 | 4.6% |
| Kindergarten | 372 | 5.2% |
| Elementary School | 1,426 | 19.9% |
| Middle School | 2,044 | 28.4% |
| High School | 1,687 | 23.5% |
| College / Undergraduate | 1,087 | 15.1% |
| Graduate / Professional | 237 | 3.3% |
| Total | 7,184 | 100.0% |
School Enrollment by Age by Funding Source in Baxter County
Out of a total of 7,184 students who are enrolled in schools in Baxter County, 661 (9.2%) attend a private institution, while the remaining 6,523 (90.8%) are enrolled in public schools. The age group of 3 to 4 year olds has the highest likelihood of being enrolled in private schools, with 82 (29.5% in the age bracket) enrolled. Conversely, the age group of 25 to 34 year olds has the lowest likelihood of being enrolled in a private school, with 298 (98.7% in the age bracket) attending a public institution.
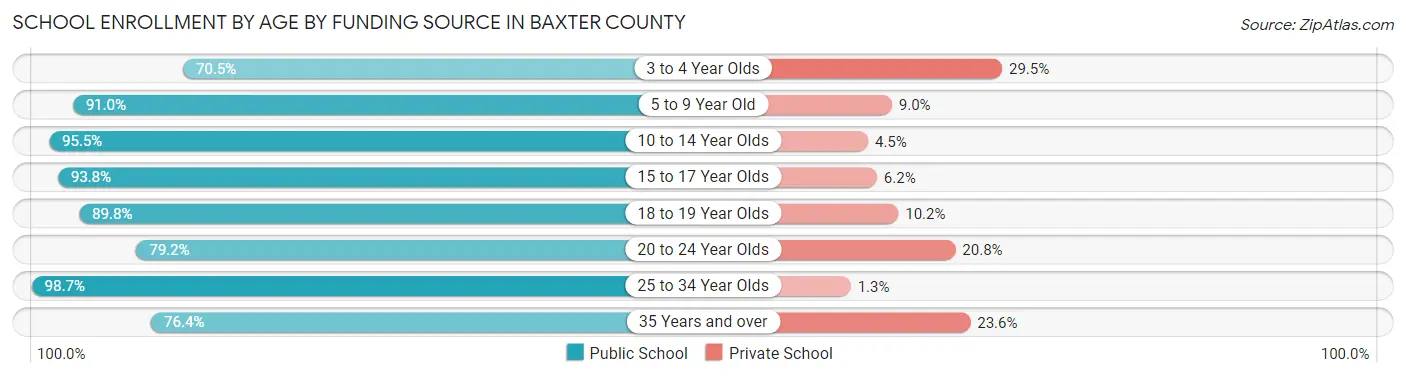
| Age Bracket | Public School | Private School |
| 3 to 4 Year Olds | 196 (70.5%) | 82 (29.5%) |
| 5 to 9 Year Old | 1,593 (91.0%) | 157 (9.0%) |
| 10 to 14 Year Olds | 2,124 (95.5%) | 101 (4.5%) |
| 15 to 17 Year Olds | 1,304 (93.8%) | 86 (6.2%) |
| 18 to 19 Year Olds | 309 (89.8%) | 35 (10.2%) |
| 20 to 24 Year Olds | 373 (79.2%) | 98 (20.8%) |
| 25 to 34 Year Olds | 298 (98.7%) | 4 (1.3%) |
| 35 Years and over | 324 (76.4%) | 100 (23.6%) |
| Total | 6,523 (90.8%) | 661 (9.2%) |
Educational Attainment by Field of Study in Baxter County
Education (1,384 | 22.6%), business (1,189 | 19.4%), science & technology (1,138 | 18.6%), engineering (353 | 5.8%), and bio, nature & agricultural (340 | 5.6%) are the most common fields of study among 6,126 individuals in Baxter County who have obtained a bachelor's degree or higher.
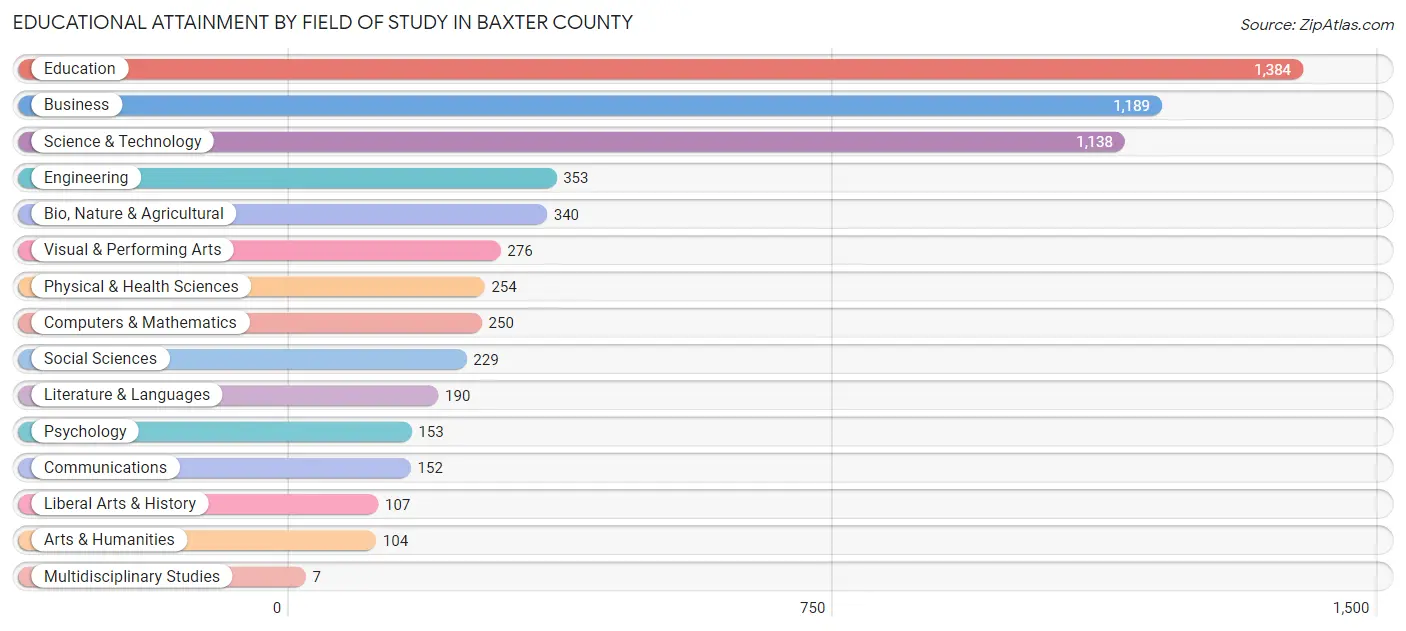
| Field of Study | # Graduates | % Graduates |
| Computers & Mathematics | 250 | 4.1% |
| Bio, Nature & Agricultural | 340 | 5.6% |
| Physical & Health Sciences | 254 | 4.2% |
| Psychology | 153 | 2.5% |
| Social Sciences | 229 | 3.7% |
| Engineering | 353 | 5.8% |
| Multidisciplinary Studies | 7 | 0.1% |
| Science & Technology | 1,138 | 18.6% |
| Business | 1,189 | 19.4% |
| Education | 1,384 | 22.6% |
| Literature & Languages | 190 | 3.1% |
| Liberal Arts & History | 107 | 1.8% |
| Visual & Performing Arts | 276 | 4.5% |
| Communications | 152 | 2.5% |
| Arts & Humanities | 104 | 1.7% |
| Total | 6,126 | 100.0% |
Transportation & Commute in Baxter County
Vehicle Availability by Sex in Baxter County
The most prevalent vehicle ownership categories in Baxter County are males with 2 vehicles (3,490, accounting for 44.7%) and females with 2 vehicles (3,006, making up 47.8%).
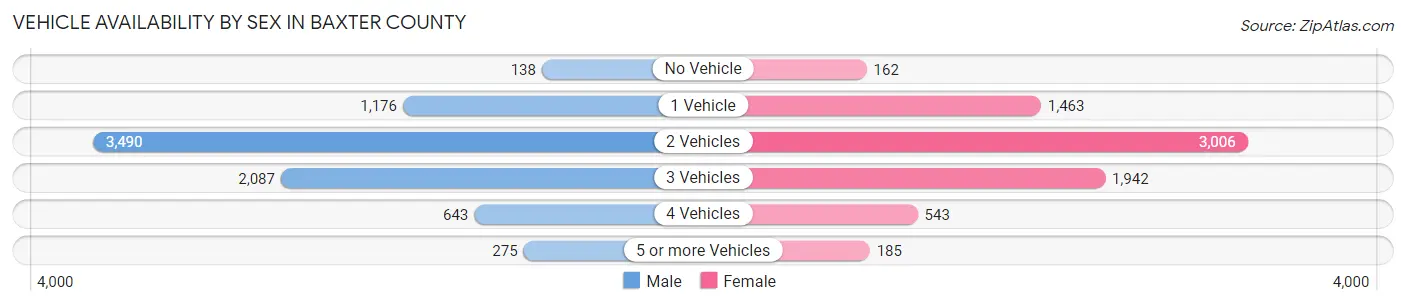
| Vehicles Available | Male | Female |
| No Vehicle | 138 (1.8%) | 162 (2.2%) |
| 1 Vehicle | 1,176 (15.1%) | 1,463 (20.0%) |
| 2 Vehicles | 3,490 (44.7%) | 3,006 (41.2%) |
| 3 Vehicles | 2,087 (26.7%) | 1,942 (26.6%) |
| 4 Vehicles | 643 (8.2%) | 543 (7.4%) |
| 5 or more Vehicles | 275 (3.5%) | 185 (2.5%) |
| Total | 7,809 (100.0%) | 7,301 (100.0%) |
Commute Time in Baxter County
The most frequently occuring commute durations in Baxter County are 15 to 19 minutes (3,085 commuters, 21.6%), 10 to 14 minutes (3,026 commuters, 21.2%), and 5 to 9 minutes (2,720 commuters, 19.1%).
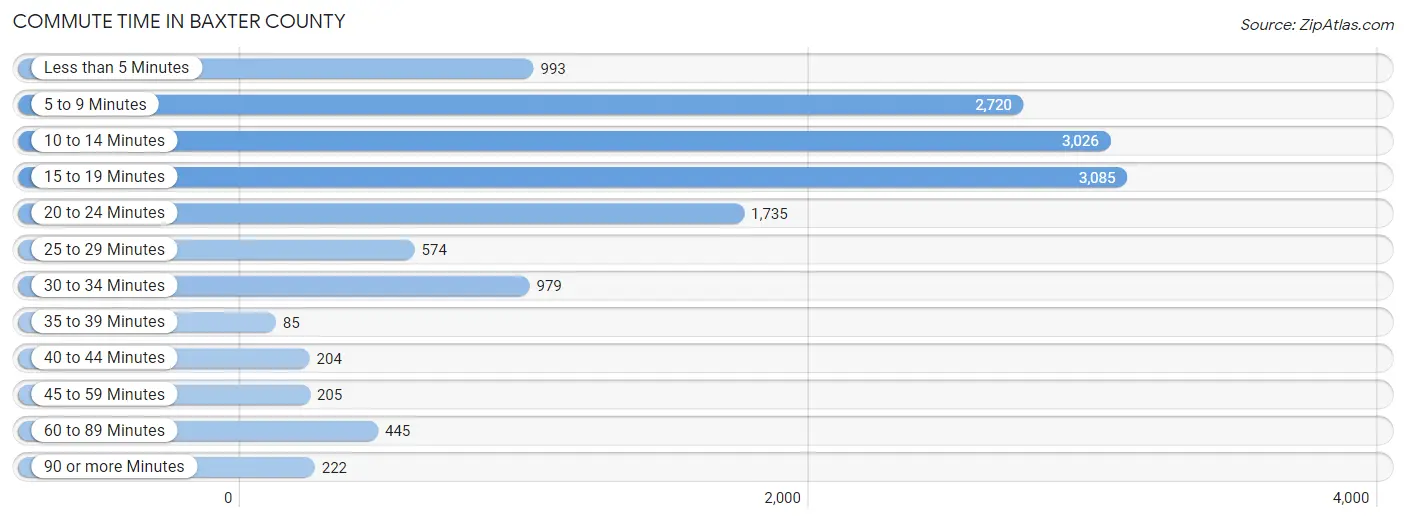
| Commute Time | # Commuters | % Commuters |
| Less than 5 Minutes | 993 | 7.0% |
| 5 to 9 Minutes | 2,720 | 19.1% |
| 10 to 14 Minutes | 3,026 | 21.2% |
| 15 to 19 Minutes | 3,085 | 21.6% |
| 20 to 24 Minutes | 1,735 | 12.2% |
| 25 to 29 Minutes | 574 | 4.0% |
| 30 to 34 Minutes | 979 | 6.9% |
| 35 to 39 Minutes | 85 | 0.6% |
| 40 to 44 Minutes | 204 | 1.4% |
| 45 to 59 Minutes | 205 | 1.4% |
| 60 to 89 Minutes | 445 | 3.1% |
| 90 or more Minutes | 222 | 1.6% |
Commute Time by Sex in Baxter County
The most common commute times in Baxter County are 15 to 19 minutes (1,651 commuters, 22.6%) for males and 10 to 14 minutes (1,624 commuters, 23.3%) for females.
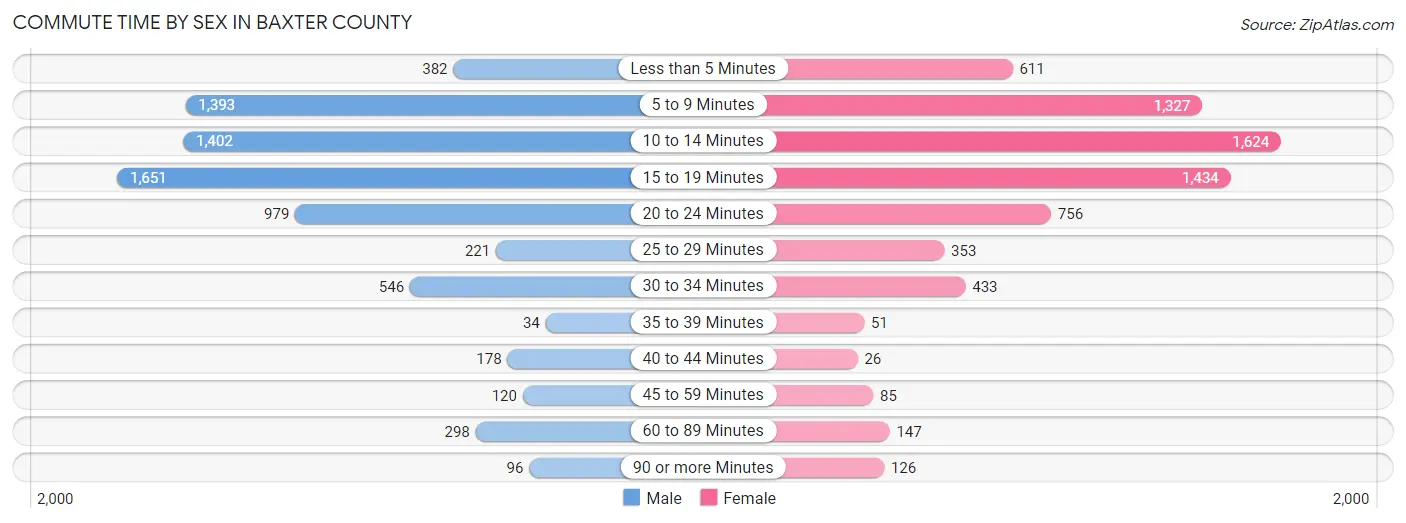
| Commute Time | Male | Female |
| Less than 5 Minutes | 382 (5.2%) | 611 (8.8%) |
| 5 to 9 Minutes | 1,393 (19.1%) | 1,327 (19.0%) |
| 10 to 14 Minutes | 1,402 (19.2%) | 1,624 (23.3%) |
| 15 to 19 Minutes | 1,651 (22.6%) | 1,434 (20.6%) |
| 20 to 24 Minutes | 979 (13.4%) | 756 (10.8%) |
| 25 to 29 Minutes | 221 (3.0%) | 353 (5.1%) |
| 30 to 34 Minutes | 546 (7.5%) | 433 (6.2%) |
| 35 to 39 Minutes | 34 (0.5%) | 51 (0.7%) |
| 40 to 44 Minutes | 178 (2.4%) | 26 (0.4%) |
| 45 to 59 Minutes | 120 (1.6%) | 85 (1.2%) |
| 60 to 89 Minutes | 298 (4.1%) | 147 (2.1%) |
| 90 or more Minutes | 96 (1.3%) | 126 (1.8%) |
Time of Departure to Work by Sex in Baxter County
The most frequent times of departure to work in Baxter County are 7:00 AM to 7:29 AM (1,067, 14.6%) for males and 7:30 AM to 7:59 AM (1,514, 21.7%) for females.
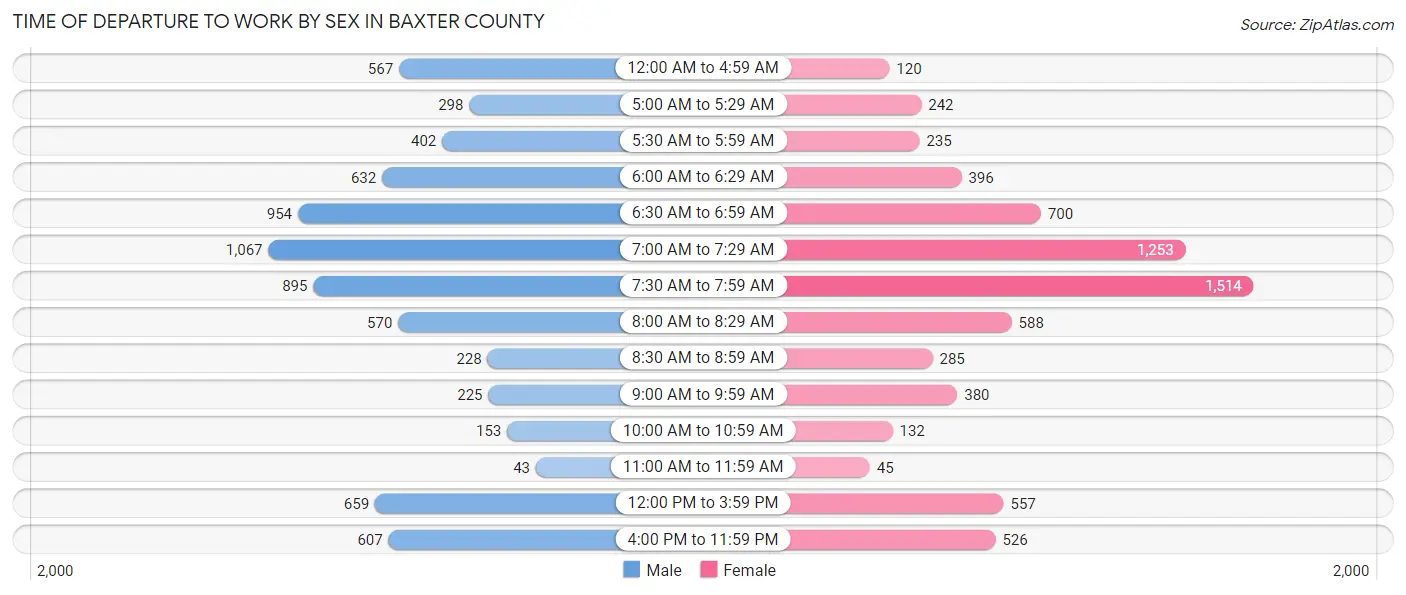
| Time of Departure | Male | Female |
| 12:00 AM to 4:59 AM | 567 (7.8%) | 120 (1.7%) |
| 5:00 AM to 5:29 AM | 298 (4.1%) | 242 (3.5%) |
| 5:30 AM to 5:59 AM | 402 (5.5%) | 235 (3.4%) |
| 6:00 AM to 6:29 AM | 632 (8.7%) | 396 (5.7%) |
| 6:30 AM to 6:59 AM | 954 (13.1%) | 700 (10.0%) |
| 7:00 AM to 7:29 AM | 1,067 (14.6%) | 1,253 (18.0%) |
| 7:30 AM to 7:59 AM | 895 (12.3%) | 1,514 (21.7%) |
| 8:00 AM to 8:29 AM | 570 (7.8%) | 588 (8.4%) |
| 8:30 AM to 8:59 AM | 228 (3.1%) | 285 (4.1%) |
| 9:00 AM to 9:59 AM | 225 (3.1%) | 380 (5.4%) |
| 10:00 AM to 10:59 AM | 153 (2.1%) | 132 (1.9%) |
| 11:00 AM to 11:59 AM | 43 (0.6%) | 45 (0.6%) |
| 12:00 PM to 3:59 PM | 659 (9.0%) | 557 (8.0%) |
| 4:00 PM to 11:59 PM | 607 (8.3%) | 526 (7.5%) |
| Total | 7,300 (100.0%) | 6,973 (100.0%) |
Housing Occupancy in Baxter County
Occupancy by Ownership in Baxter County
Of the total 19,021 dwellings in Baxter County, owner-occupied units account for 14,142 (74.4%), while renter-occupied units make up 4,879 (25.7%).
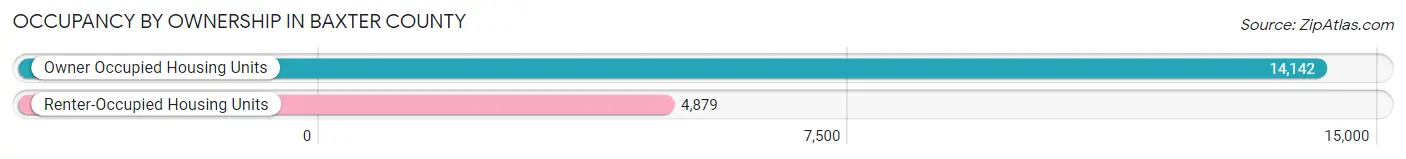
| Occupancy | # Housing Units | % Housing Units |
| Owner Occupied Housing Units | 14,142 | 74.4% |
| Renter-Occupied Housing Units | 4,879 | 25.7% |
| Total Occupied Housing Units | 19,021 | 100.0% |
Occupancy by Household Size in Baxter County
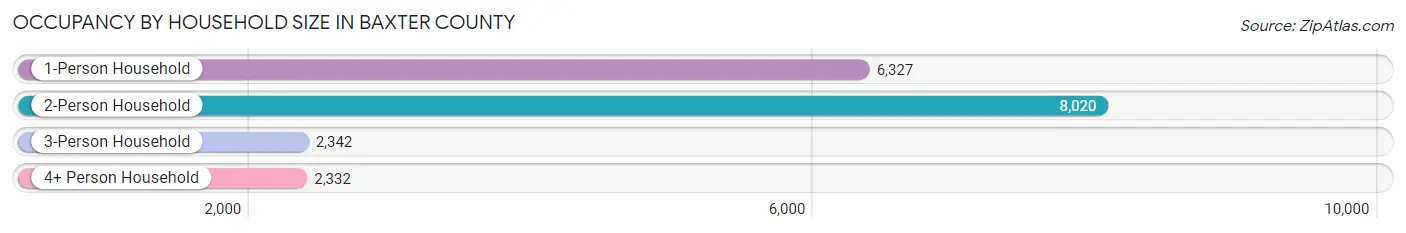
| Household Size | # Housing Units | % Housing Units |
| 1-Person Household | 6,327 | 33.3% |
| 2-Person Household | 8,020 | 42.2% |
| 3-Person Household | 2,342 | 12.3% |
| 4+ Person Household | 2,332 | 12.3% |
| Total Housing Units | 19,021 | 100.0% |
Occupancy by Ownership by Household Size in Baxter County
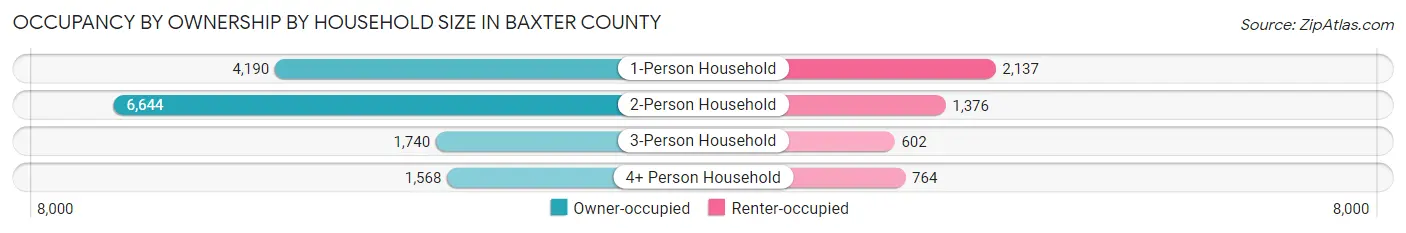
| Household Size | Owner-occupied | Renter-occupied |
| 1-Person Household | 4,190 (66.2%) | 2,137 (33.8%) |
| 2-Person Household | 6,644 (82.8%) | 1,376 (17.2%) |
| 3-Person Household | 1,740 (74.3%) | 602 (25.7%) |
| 4+ Person Household | 1,568 (67.2%) | 764 (32.8%) |
| Total Housing Units | 14,142 (74.4%) | 4,879 (25.7%) |
Occupancy by Educational Attainment in Baxter County
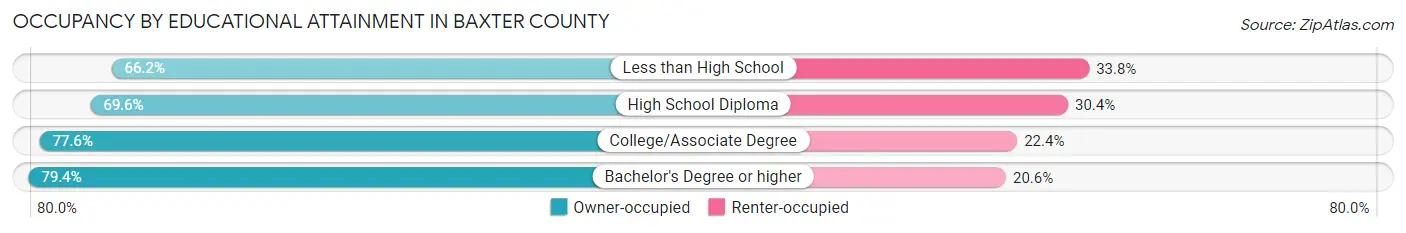
| Household Size | Owner-occupied | Renter-occupied |
| Less than High School | 1,119 (66.2%) | 571 (33.8%) |
| High School Diploma | 4,269 (69.6%) | 1,867 (30.4%) |
| College/Associate Degree | 5,910 (77.6%) | 1,703 (22.4%) |
| Bachelor's Degree or higher | 2,844 (79.4%) | 738 (20.6%) |
Occupancy by Age of Householder in Baxter County
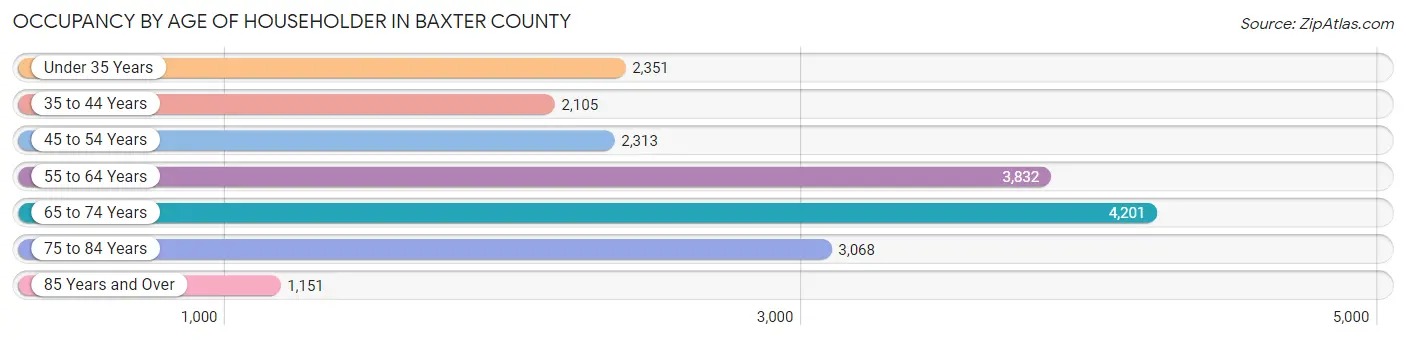
| Age Bracket | # Households | % Households |
| Under 35 Years | 2,351 | 12.4% |
| 35 to 44 Years | 2,105 | 11.1% |
| 45 to 54 Years | 2,313 | 12.2% |
| 55 to 64 Years | 3,832 | 20.2% |
| 65 to 74 Years | 4,201 | 22.1% |
| 75 to 84 Years | 3,068 | 16.1% |
| 85 Years and Over | 1,151 | 6.0% |
| Total | 19,021 | 100.0% |
Housing Finances in Baxter County
Median Income by Occupancy in Baxter County
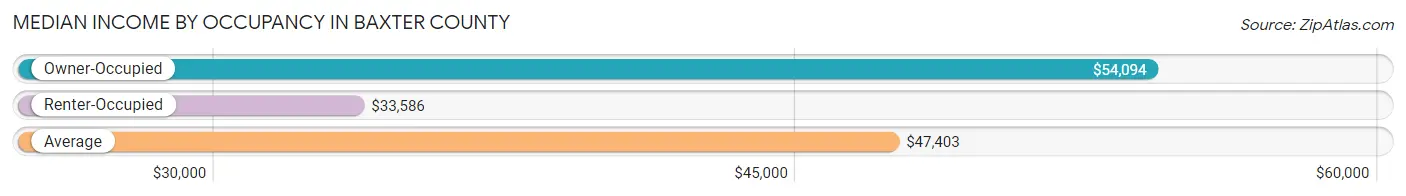
| Occupancy Type | # Households | Median Income |
| Owner-Occupied | 14,142 (74.4%) | $54,094 |
| Renter-Occupied | 4,879 (25.7%) | $33,586 |
| Average | 19,021 (100.0%) | $47,403 |
Occupancy by Householder Income Bracket in Baxter County
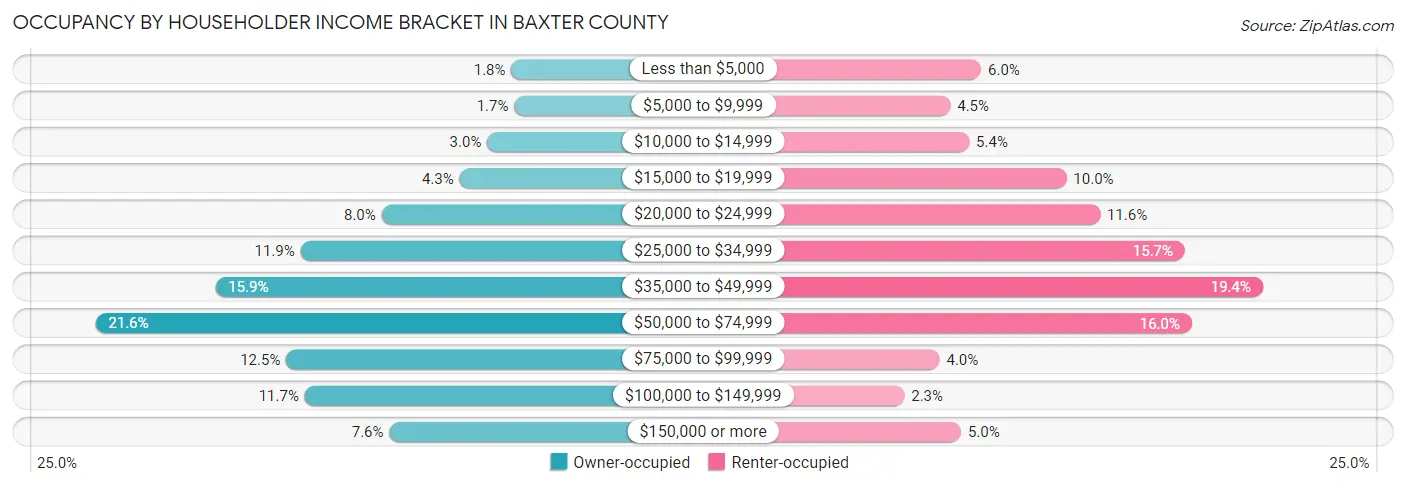
| Income Bracket | Owner-occupied | Renter-occupied |
| Less than $5,000 | 258 (1.8%) | 292 (6.0%) |
| $5,000 to $9,999 | 237 (1.7%) | 220 (4.5%) |
| $10,000 to $14,999 | 420 (3.0%) | 264 (5.4%) |
| $15,000 to $19,999 | 607 (4.3%) | 490 (10.0%) |
| $20,000 to $24,999 | 1,132 (8.0%) | 568 (11.6%) |
| $25,000 to $34,999 | 1,677 (11.9%) | 765 (15.7%) |
| $35,000 to $49,999 | 2,251 (15.9%) | 946 (19.4%) |
| $50,000 to $74,999 | 3,059 (21.6%) | 781 (16.0%) |
| $75,000 to $99,999 | 1,773 (12.5%) | 195 (4.0%) |
| $100,000 to $149,999 | 1,649 (11.7%) | 113 (2.3%) |
| $150,000 or more | 1,079 (7.6%) | 245 (5.0%) |
| Total | 14,142 (100.0%) | 4,879 (100.0%) |
Monthly Housing Cost Tiers in Baxter County
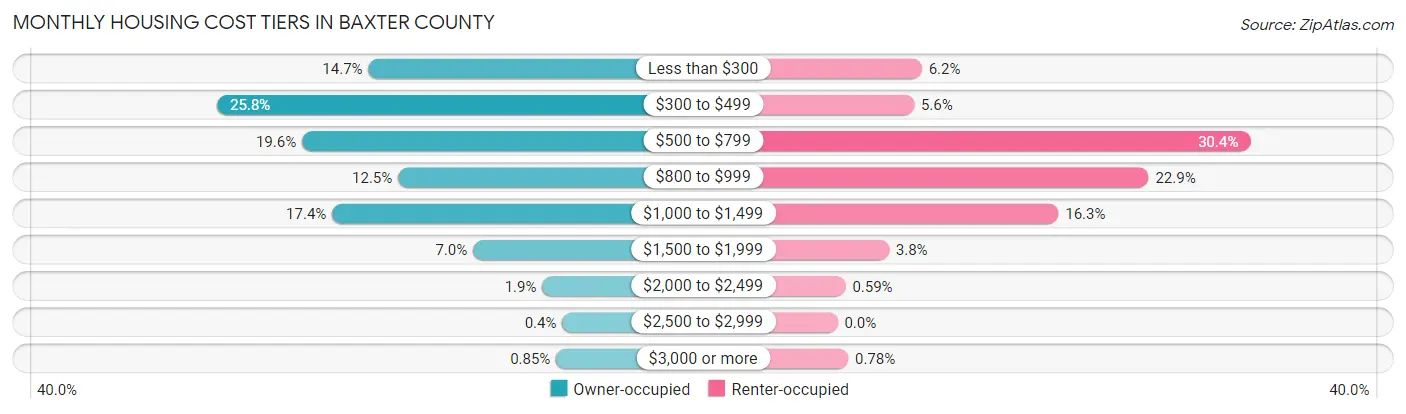
| Monthly Cost | Owner-occupied | Renter-occupied |
| Less than $300 | 2,076 (14.7%) | 303 (6.2%) |
| $300 to $499 | 3,653 (25.8%) | 275 (5.6%) |
| $500 to $799 | 2,767 (19.6%) | 1,483 (30.4%) |
| $800 to $999 | 1,766 (12.5%) | 1,118 (22.9%) |
| $1,000 to $1,499 | 2,454 (17.3%) | 794 (16.3%) |
| $1,500 to $1,999 | 985 (7.0%) | 185 (3.8%) |
| $2,000 to $2,499 | 264 (1.9%) | 29 (0.6%) |
| $2,500 to $2,999 | 57 (0.4%) | 0 (0.0%) |
| $3,000 or more | 120 (0.9%) | 38 (0.8%) |
| Total | 14,142 (100.0%) | 4,879 (100.0%) |
Physical Housing Characteristics in Baxter County
Housing Structures in Baxter County
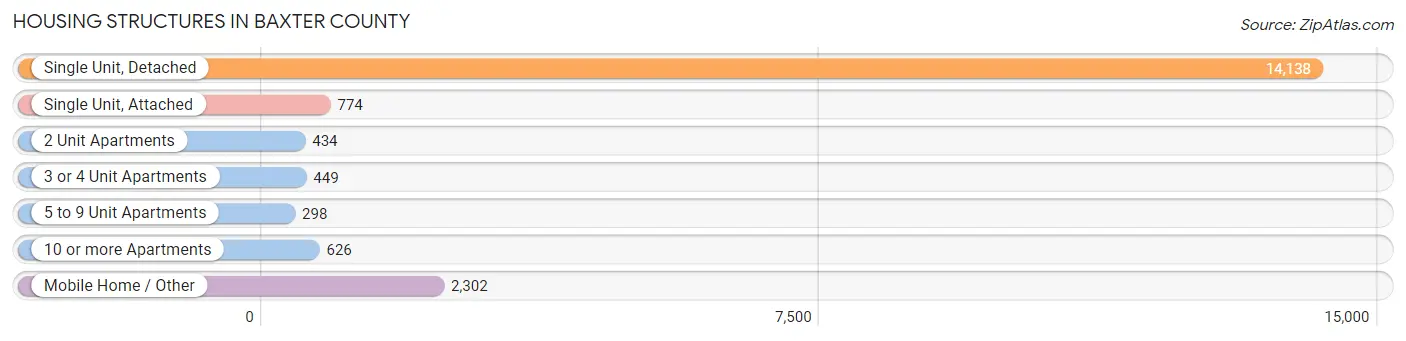
| Structure Type | # Housing Units | % Housing Units |
| Single Unit, Detached | 14,138 | 74.3% |
| Single Unit, Attached | 774 | 4.1% |
| 2 Unit Apartments | 434 | 2.3% |
| 3 or 4 Unit Apartments | 449 | 2.4% |
| 5 to 9 Unit Apartments | 298 | 1.6% |
| 10 or more Apartments | 626 | 3.3% |
| Mobile Home / Other | 2,302 | 12.1% |
| Total | 19,021 | 100.0% |
Housing Structures by Occupancy in Baxter County
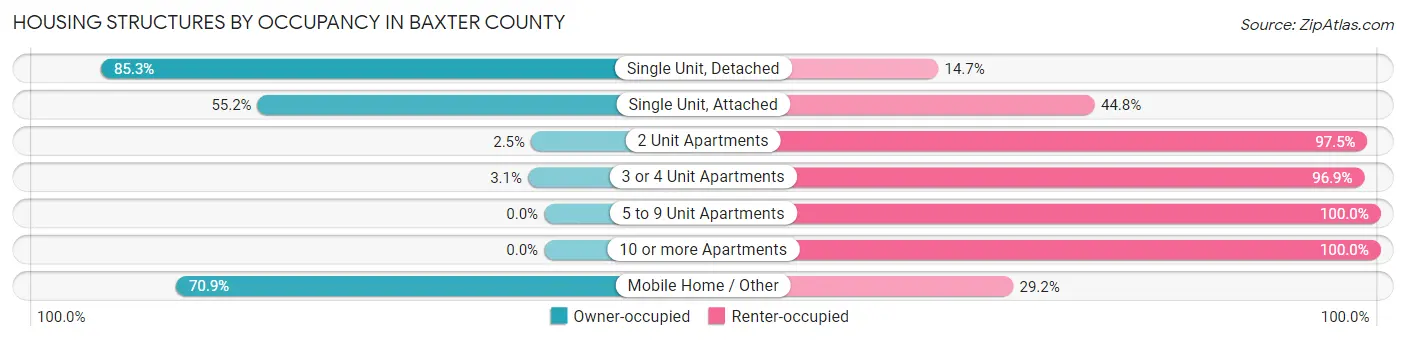
| Structure Type | Owner-occupied | Renter-occupied |
| Single Unit, Detached | 12,059 (85.3%) | 2,079 (14.7%) |
| Single Unit, Attached | 427 (55.2%) | 347 (44.8%) |
| 2 Unit Apartments | 11 (2.5%) | 423 (97.5%) |
| 3 or 4 Unit Apartments | 14 (3.1%) | 435 (96.9%) |
| 5 to 9 Unit Apartments | 0 (0.0%) | 298 (100.0%) |
| 10 or more Apartments | 0 (0.0%) | 626 (100.0%) |
| Mobile Home / Other | 1,631 (70.9%) | 671 (29.1%) |
| Total | 14,142 (74.4%) | 4,879 (25.7%) |
Housing Structures by Number of Rooms in Baxter County
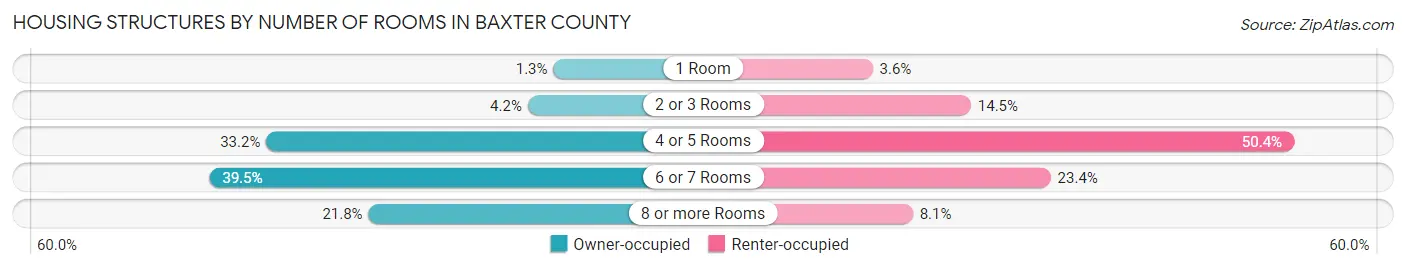
| Number of Rooms | Owner-occupied | Renter-occupied |
| 1 Room | 187 (1.3%) | 177 (3.6%) |
| 2 or 3 Rooms | 588 (4.2%) | 709 (14.5%) |
| 4 or 5 Rooms | 4,693 (33.2%) | 2,458 (50.4%) |
| 6 or 7 Rooms | 5,586 (39.5%) | 1,141 (23.4%) |
| 8 or more Rooms | 3,088 (21.8%) | 394 (8.1%) |
| Total | 14,142 (100.0%) | 4,879 (100.0%) |
Housing Structure by Heating Type in Baxter County
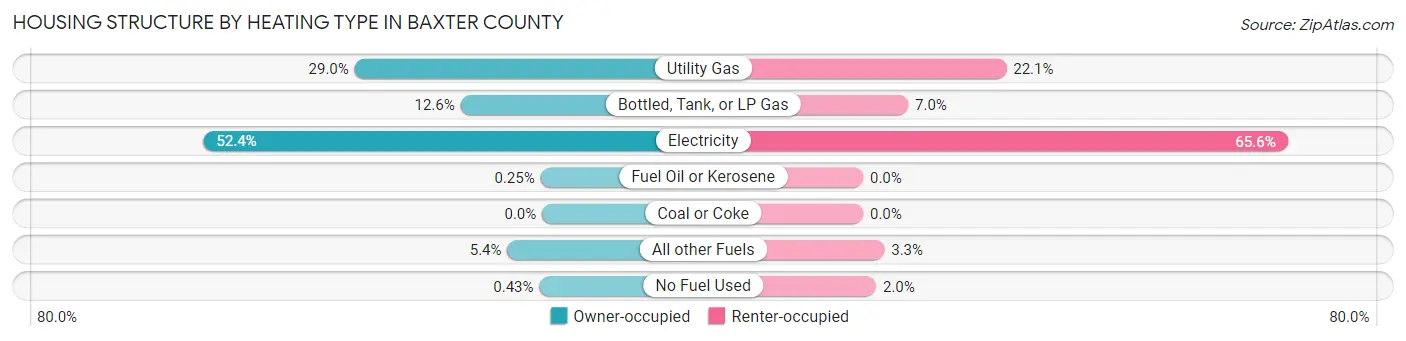
| Heating Type | Owner-occupied | Renter-occupied |
| Utility Gas | 4,099 (29.0%) | 1,080 (22.1%) |
| Bottled, Tank, or LP Gas | 1,784 (12.6%) | 340 (7.0%) |
| Electricity | 7,403 (52.3%) | 3,201 (65.6%) |
| Fuel Oil or Kerosene | 36 (0.3%) | 0 (0.0%) |
| Coal or Coke | 0 (0.0%) | 0 (0.0%) |
| All other Fuels | 759 (5.4%) | 160 (3.3%) |
| No Fuel Used | 61 (0.4%) | 98 (2.0%) |
| Total | 14,142 (100.0%) | 4,879 (100.0%) |
Household Vehicle Usage in Baxter County
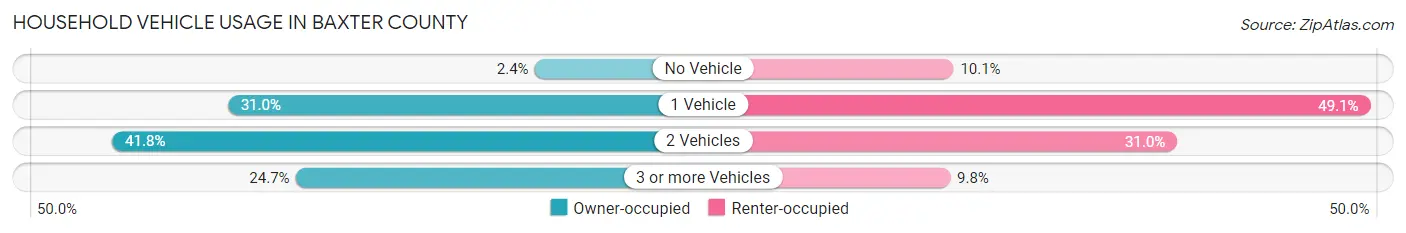
| Vehicles per Household | Owner-occupied | Renter-occupied |
| No Vehicle | 341 (2.4%) | 494 (10.1%) |
| 1 Vehicle | 4,389 (31.0%) | 2,393 (49.0%) |
| 2 Vehicles | 5,916 (41.8%) | 1,513 (31.0%) |
| 3 or more Vehicles | 3,496 (24.7%) | 479 (9.8%) |
| Total | 14,142 (100.0%) | 4,879 (100.0%) |
Real Estate & Mortgages in Baxter County
Real Estate and Mortgage Overview in Baxter County
| Characteristic | Without Mortgage | With Mortgage |
| Housing Units | 7,440 | 6,702 |
| Median Property Value | $154,700 | $156,600 |
| Median Household Income | $41,368 | $658 |
| Monthly Housing Costs | $385 | $105 |
| Real Estate Taxes | $703 | $250 |
Property Value by Mortgage Status in Baxter County
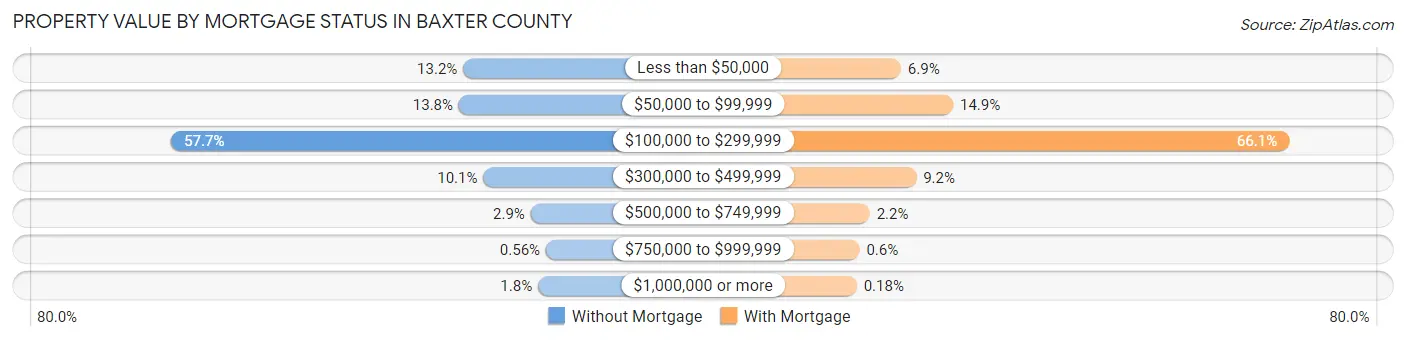
| Property Value | Without Mortgage | With Mortgage |
| Less than $50,000 | 980 (13.2%) | 463 (6.9%) |
| $50,000 to $99,999 | 1,029 (13.8%) | 996 (14.9%) |
| $100,000 to $299,999 | 4,291 (57.7%) | 4,427 (66.0%) |
| $300,000 to $499,999 | 752 (10.1%) | 619 (9.2%) |
| $500,000 to $749,999 | 214 (2.9%) | 145 (2.2%) |
| $750,000 to $999,999 | 42 (0.6%) | 40 (0.6%) |
| $1,000,000 or more | 132 (1.8%) | 12 (0.2%) |
| Total | 7,440 (100.0%) | 6,702 (100.0%) |
Household Income by Mortgage Status in Baxter County
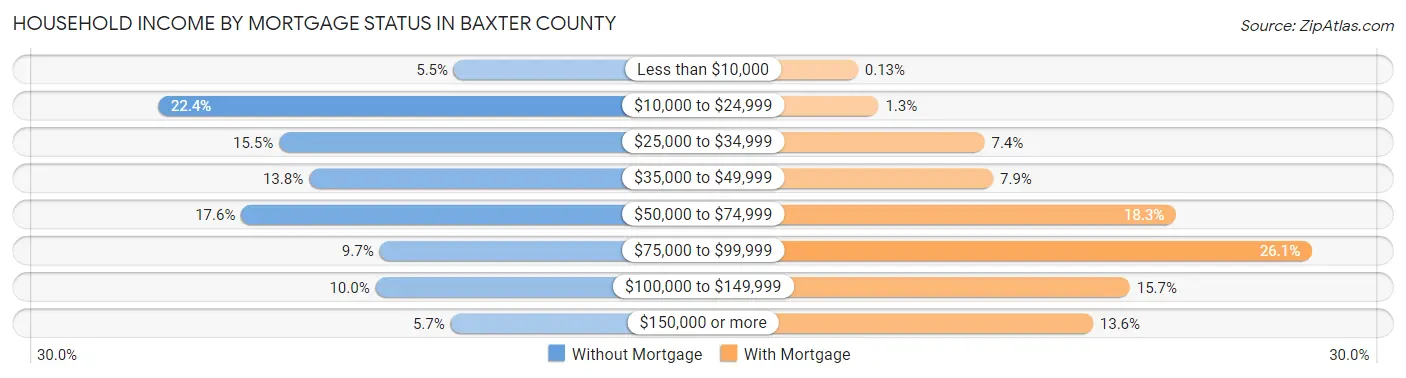
| Household Income | Without Mortgage | With Mortgage |
| Less than $10,000 | 407 (5.5%) | 9 (0.1%) |
| $10,000 to $24,999 | 1,665 (22.4%) | 88 (1.3%) |
| $25,000 to $34,999 | 1,150 (15.5%) | 494 (7.4%) |
| $35,000 to $49,999 | 1,023 (13.8%) | 527 (7.9%) |
| $50,000 to $74,999 | 1,311 (17.6%) | 1,228 (18.3%) |
| $75,000 to $99,999 | 723 (9.7%) | 1,748 (26.1%) |
| $100,000 to $149,999 | 740 (10.0%) | 1,050 (15.7%) |
| $150,000 or more | 421 (5.7%) | 909 (13.6%) |
| Total | 7,440 (100.0%) | 6,702 (100.0%) |
Property Value to Household Income Ratio in Baxter County
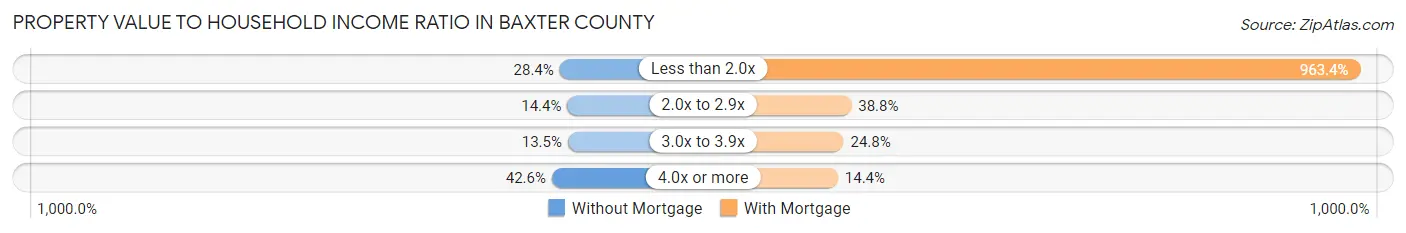
| Value-to-Income Ratio | Without Mortgage | With Mortgage |
| Less than 2.0x | 2,114 (28.4%) | 64,568 (963.4%) |
| 2.0x to 2.9x | 1,069 (14.4%) | 2,602 (38.8%) |
| 3.0x to 3.9x | 1,003 (13.5%) | 1,662 (24.8%) |
| 4.0x or more | 3,166 (42.5%) | 965 (14.4%) |
| Total | 7,440 (100.0%) | 6,702 (100.0%) |
Real Estate Taxes by Mortgage Status in Baxter County
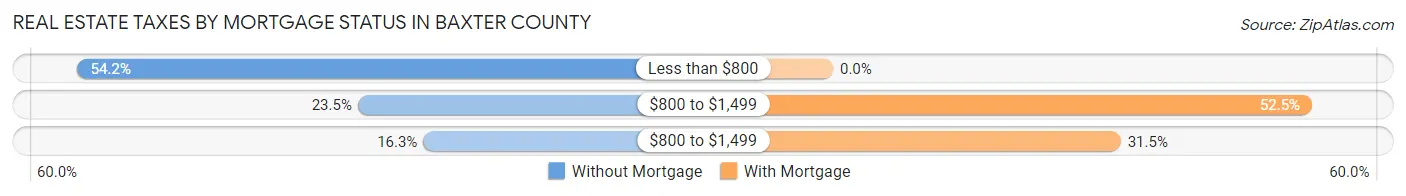
| Property Taxes | Without Mortgage | With Mortgage |
| Less than $800 | 4,032 (54.2%) | 0 (0.0%) |
| $800 to $1,499 | 1,748 (23.5%) | 3,517 (52.5%) |
| $800 to $1,499 | 1,214 (16.3%) | 2,113 (31.5%) |
| Total | 7,440 (100.0%) | 6,702 (100.0%) |
Health & Disability in Baxter County
Health Insurance Coverage by Age in Baxter County
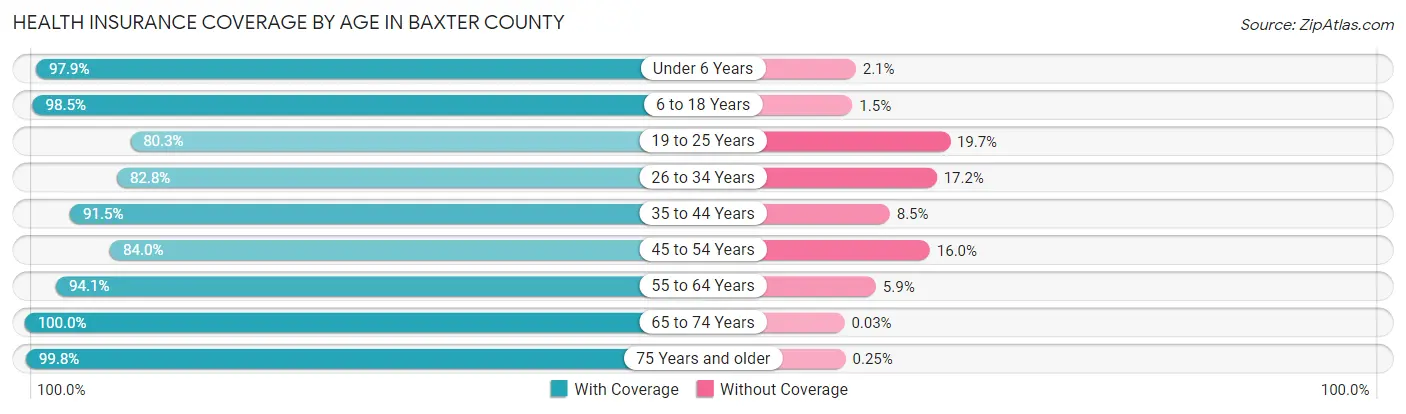
| Age Bracket | With Coverage | Without Coverage |
| Under 6 Years | 2,103 (97.9%) | 46 (2.1%) |
| 6 to 18 Years | 5,343 (98.5%) | 82 (1.5%) |
| 19 to 25 Years | 2,161 (80.3%) | 530 (19.7%) |
| 26 to 34 Years | 2,796 (82.8%) | 582 (17.2%) |
| 35 to 44 Years | 3,790 (91.5%) | 351 (8.5%) |
| 45 to 54 Years | 3,860 (84.0%) | 733 (16.0%) |
| 55 to 64 Years | 5,940 (94.1%) | 372 (5.9%) |
| 65 to 74 Years | 6,674 (100.0%) | 2 (0.0%) |
| 75 Years and older | 6,057 (99.8%) | 15 (0.3%) |
| Total | 38,724 (93.4%) | 2,713 (6.6%) |
Health Insurance Coverage by Citizenship Status in Baxter County
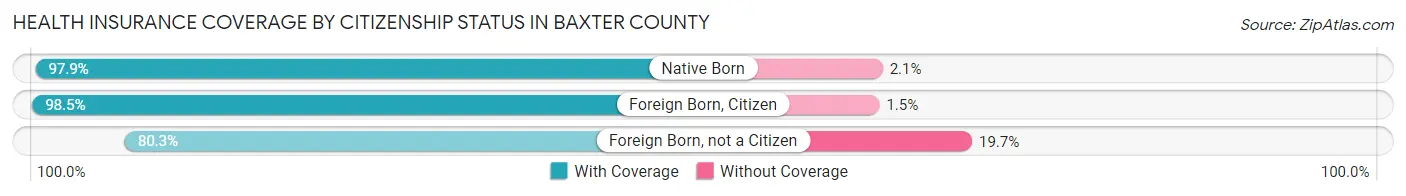
| Citizenship Status | With Coverage | Without Coverage |
| Native Born | 2,103 (97.9%) | 46 (2.1%) |
| Foreign Born, Citizen | 5,343 (98.5%) | 82 (1.5%) |
| Foreign Born, not a Citizen | 2,161 (80.3%) | 530 (19.7%) |
Health Insurance Coverage by Household Income in Baxter County
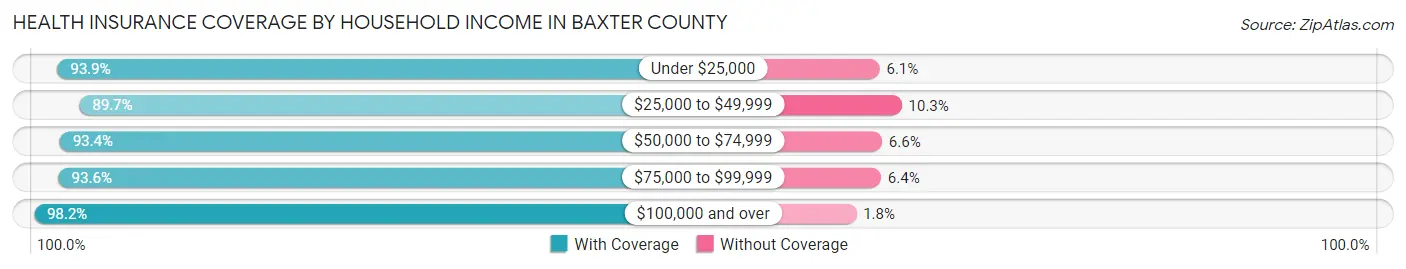
| Household Income | With Coverage | Without Coverage |
| Under $25,000 | 6,699 (93.9%) | 438 (6.1%) |
| $25,000 to $49,999 | 10,239 (89.7%) | 1,172 (10.3%) |
| $50,000 to $74,999 | 8,226 (93.4%) | 579 (6.6%) |
| $75,000 to $99,999 | 5,307 (93.6%) | 362 (6.4%) |
| $100,000 and over | 8,206 (98.2%) | 147 (1.8%) |
Public vs Private Health Insurance Coverage by Age in Baxter County
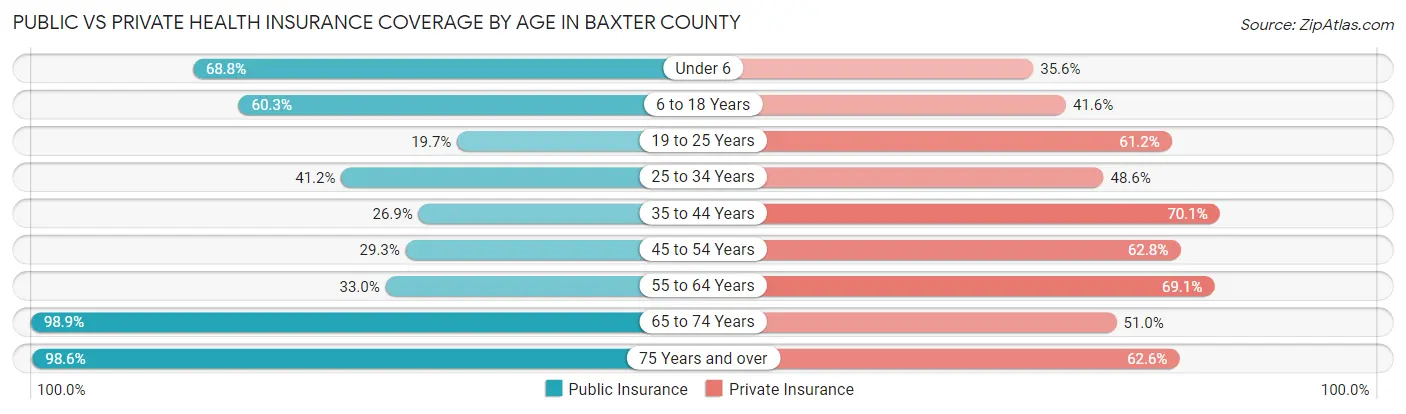
| Age Bracket | Public Insurance | Private Insurance |
| Under 6 | 1,478 (68.8%) | 764 (35.5%) |
| 6 to 18 Years | 3,270 (60.3%) | 2,258 (41.6%) |
| 19 to 25 Years | 530 (19.7%) | 1,647 (61.2%) |
| 25 to 34 Years | 1,392 (41.2%) | 1,641 (48.6%) |
| 35 to 44 Years | 1,113 (26.9%) | 2,903 (70.1%) |
| 45 to 54 Years | 1,345 (29.3%) | 2,883 (62.8%) |
| 55 to 64 Years | 2,083 (33.0%) | 4,361 (69.1%) |
| 65 to 74 Years | 6,599 (98.9%) | 3,404 (51.0%) |
| 75 Years and over | 5,985 (98.6%) | 3,802 (62.6%) |
| Total | 23,795 (57.4%) | 23,663 (57.1%) |
Disability Status by Sex by Age in Baxter County
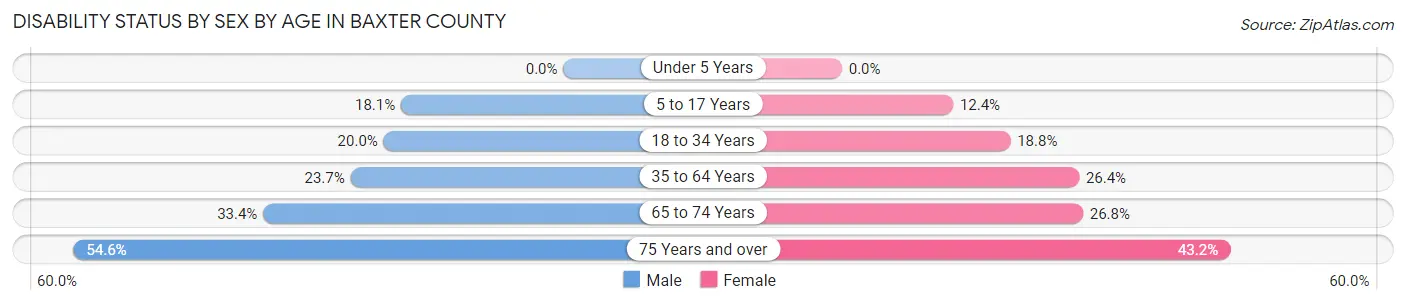
| Age Bracket | Male | Female |
| Under 5 Years | 0 (0.0%) | 0 (0.0%) |
| 5 to 17 Years | 532 (18.1%) | 328 (12.4%) |
| 18 to 34 Years | 647 (20.0%) | 574 (18.8%) |
| 35 to 64 Years | 1,716 (23.7%) | 2,061 (26.4%) |
| 65 to 74 Years | 1,051 (33.4%) | 948 (26.8%) |
| 75 Years and over | 1,527 (54.6%) | 1,415 (43.2%) |
Disability Class by Sex by Age in Baxter County
Disability Class: Hearing Difficulty
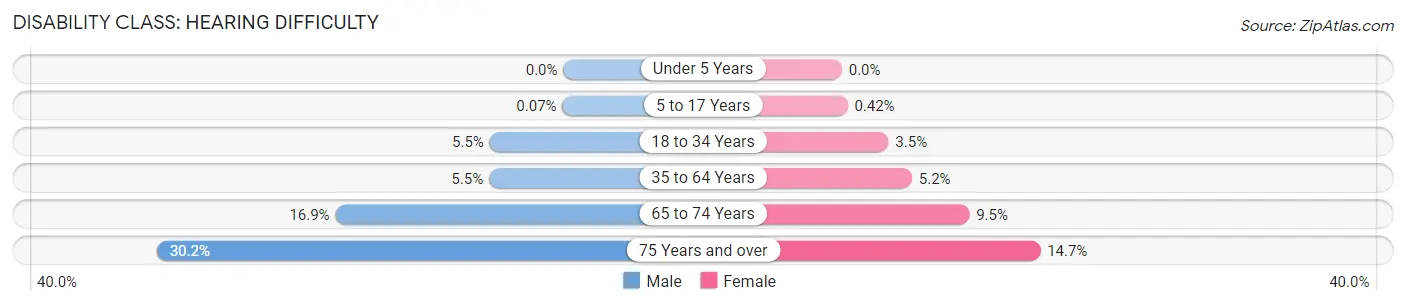
| Age Bracket | Male | Female |
| Under 5 Years | 0 (0.0%) | 0 (0.0%) |
| 5 to 17 Years | 2 (0.1%) | 11 (0.4%) |
| 18 to 34 Years | 177 (5.5%) | 106 (3.5%) |
| 35 to 64 Years | 400 (5.5%) | 406 (5.2%) |
| 65 to 74 Years | 532 (16.9%) | 334 (9.5%) |
| 75 Years and over | 845 (30.2%) | 482 (14.7%) |
Disability Class: Vision Difficulty
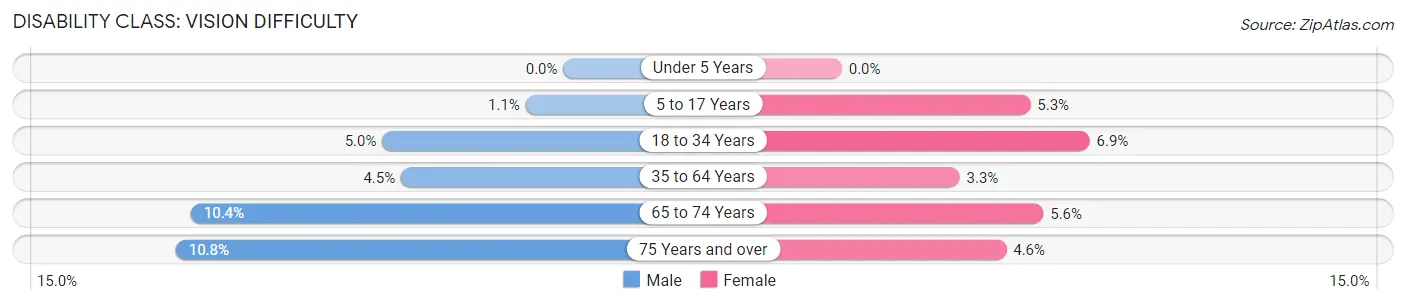
| Age Bracket | Male | Female |
| Under 5 Years | 0 (0.0%) | 0 (0.0%) |
| 5 to 17 Years | 31 (1.1%) | 139 (5.2%) |
| 18 to 34 Years | 163 (5.0%) | 211 (6.9%) |
| 35 to 64 Years | 327 (4.5%) | 256 (3.3%) |
| 65 to 74 Years | 326 (10.4%) | 198 (5.6%) |
| 75 Years and over | 302 (10.8%) | 150 (4.6%) |
Disability Class: Cognitive Difficulty
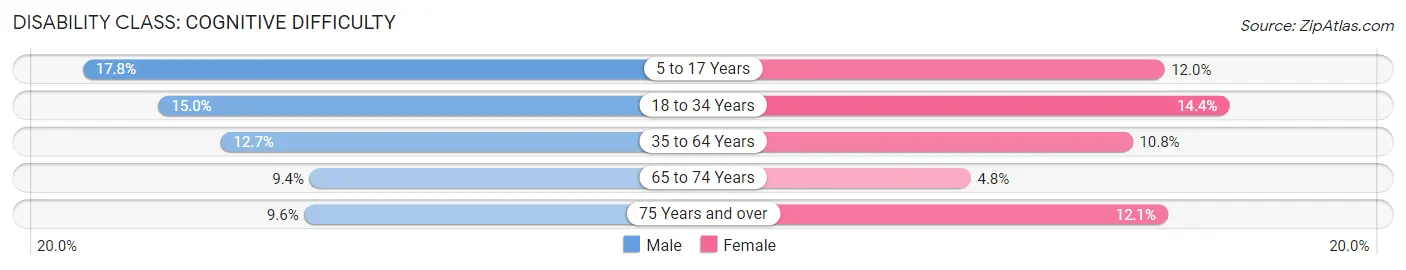
| Age Bracket | Male | Female |
| 5 to 17 Years | 525 (17.8%) | 317 (12.0%) |
| 18 to 34 Years | 486 (15.0%) | 440 (14.4%) |
| 35 to 64 Years | 921 (12.7%) | 842 (10.8%) |
| 65 to 74 Years | 296 (9.4%) | 169 (4.8%) |
| 75 Years and over | 269 (9.6%) | 396 (12.1%) |
Disability Class: Ambulatory Difficulty
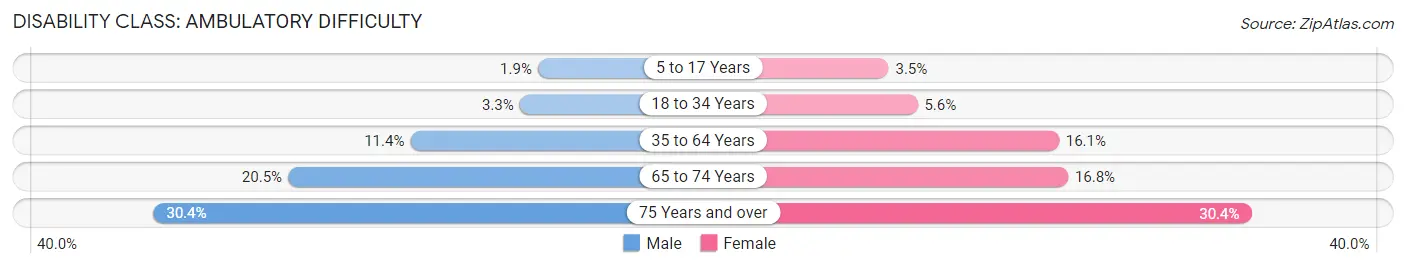
| Age Bracket | Male | Female |
| 5 to 17 Years | 56 (1.9%) | 92 (3.5%) |
| 18 to 34 Years | 105 (3.3%) | 172 (5.6%) |
| 35 to 64 Years | 823 (11.4%) | 1,257 (16.1%) |
| 65 to 74 Years | 643 (20.4%) | 593 (16.8%) |
| 75 Years and over | 852 (30.4%) | 995 (30.4%) |
Disability Class: Self-Care Difficulty
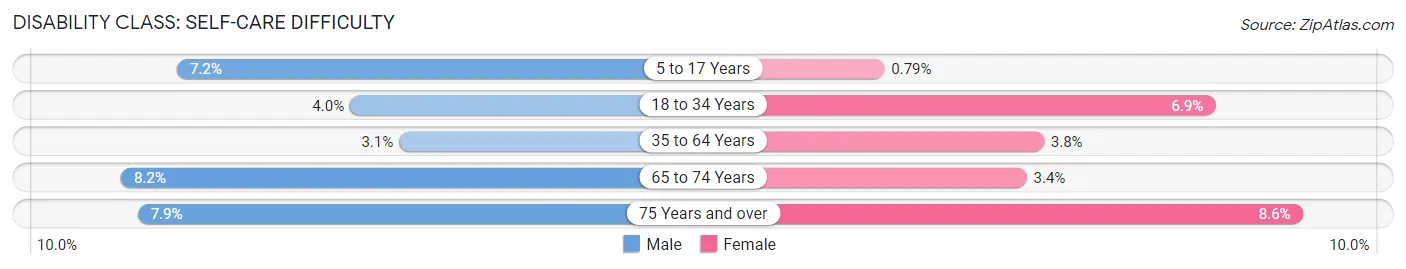
| Age Bracket | Male | Female |
| 5 to 17 Years | 211 (7.2%) | 21 (0.8%) |
| 18 to 34 Years | 128 (4.0%) | 212 (6.9%) |
| 35 to 64 Years | 221 (3.0%) | 293 (3.7%) |
| 65 to 74 Years | 258 (8.2%) | 121 (3.4%) |
| 75 Years and over | 221 (7.9%) | 280 (8.6%) |
Technology Access in Baxter County
Computing Device Access in Baxter County
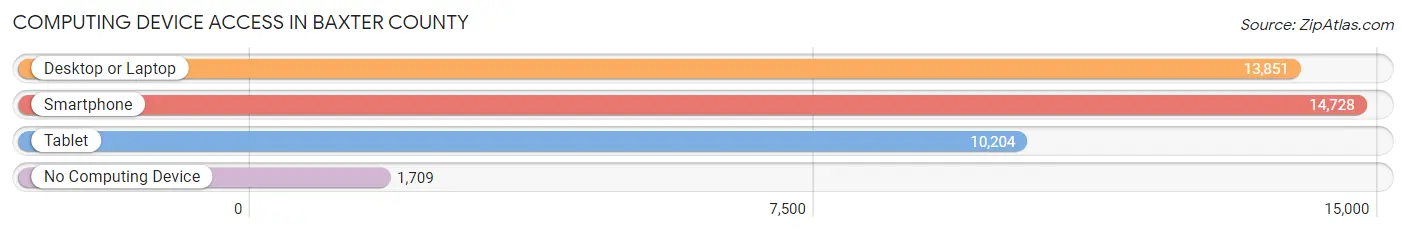
| Device Type | # Households | % Households |
| Desktop or Laptop | 13,851 | 72.8% |
| Smartphone | 14,728 | 77.4% |
| Tablet | 10,204 | 53.6% |
| No Computing Device | 1,709 | 9.0% |
| Total | 19,021 | 100.0% |
Internet Access in Baxter County
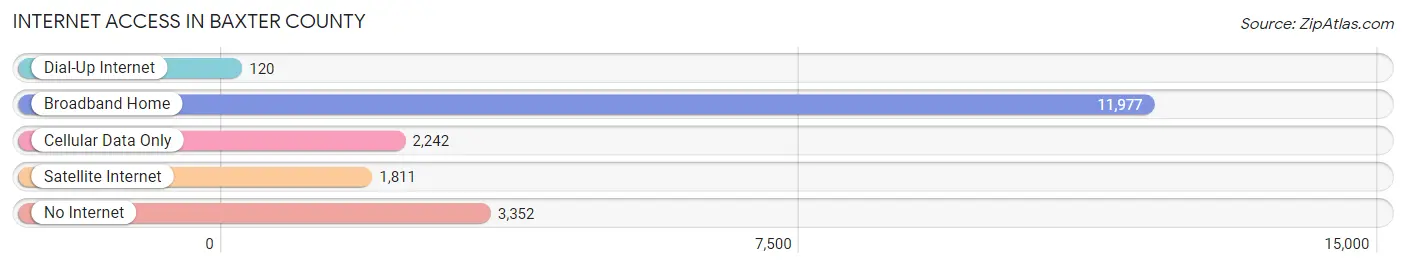
| Internet Type | # Households | % Households |
| Dial-Up Internet | 120 | 0.6% |
| Broadband Home | 11,977 | 63.0% |
| Cellular Data Only | 2,242 | 11.8% |
| Satellite Internet | 1,811 | 9.5% |
| No Internet | 3,352 | 17.6% |
| Total | 19,021 | 100.0% |
Baxter County Summary
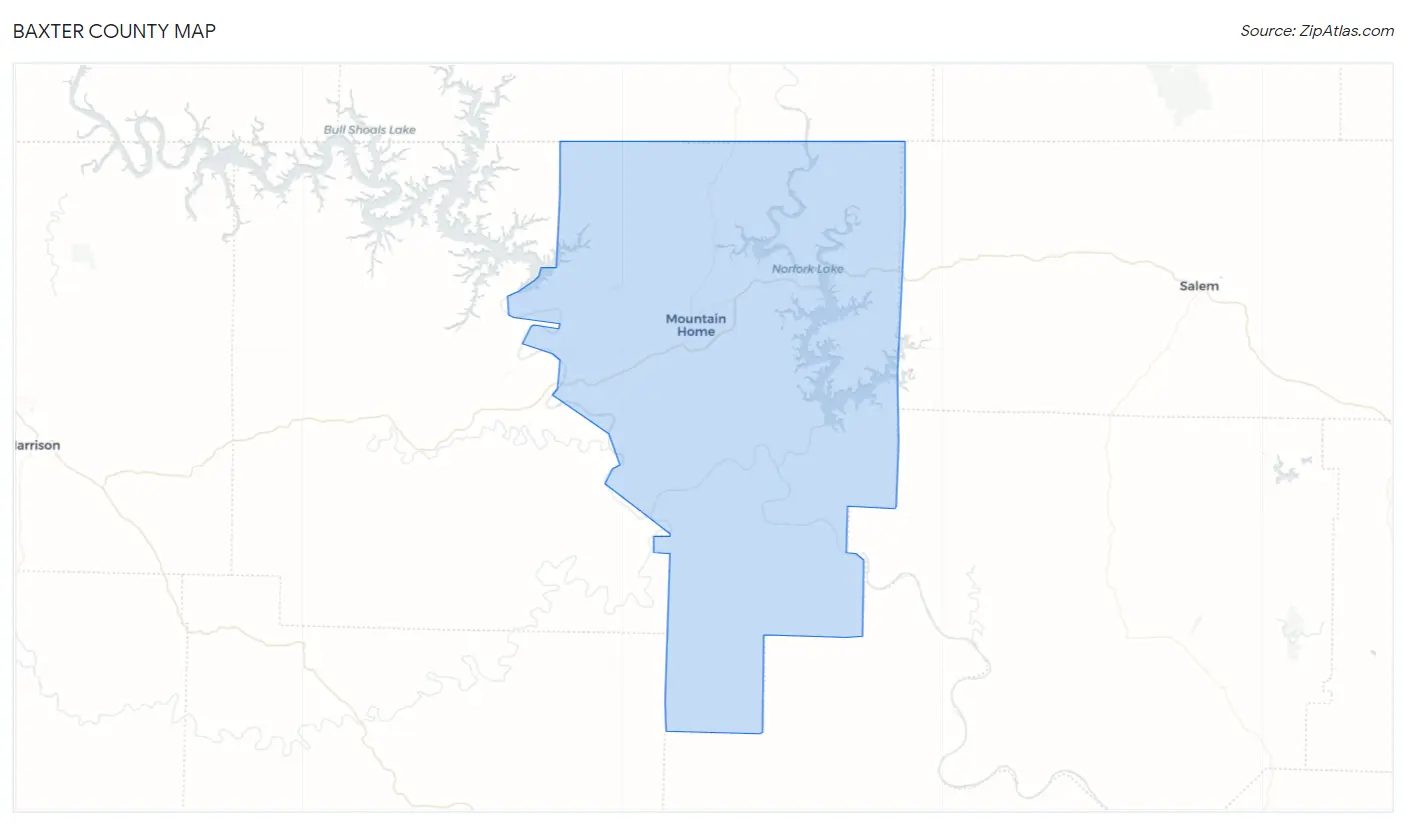
Baxter County is located in the north-central region of Arkansas, and is part of the Ozark Mountains region. It is bordered by Marion County to the north, Fulton County to the east, Izard County to the south, and Searcy County to the west. The county seat is Mountain Home, and the largest city is also Mountain Home. As of the 2010 census, the population of Baxter County was 41,513, making it the 15th most populous county in Arkansas.
Geography
Baxter County covers an area of 653 square miles, making it the 15th largest county in Arkansas. The terrain is mostly hilly and forested, with the Ozark Mountains dominating the landscape. The White River runs through the county, and there are several smaller rivers and creeks, including the Buffalo River, Crooked Creek, and the North Fork of the White River. The highest point in the county is at the summit of Round Mountain, which has an elevation of 1,890 feet.
Climate
Baxter County has a humid subtropical climate, with hot, humid summers and mild winters. The average annual temperature is around 59°F, and the average annual precipitation is around 48 inches.
Demographics
As of the 2010 census, there were 41,513 people, 17,845 households, and 11,945 families living in Baxter County. The population density was 63.7 people per square mile. The racial makeup of the county was 94.2% White, 0.7% Black or African American, 0.7% Native American, 0.6% Asian, 0.1% Pacific Islander, 1.9% from other races, and 1.8% from two or more races. 4.3% of the population were Hispanic or Latino of any race.
The median income for a household in the county was $35,945, and the median income for a family was $43,945. The per capita income for the county was $20,845. About 11.2% of families and 15.2% of the population were below the poverty line, including 19.2% of those under age 18 and 11.2% of those age 65 or over.
Economy
The economy of Baxter County is largely based on agriculture and tourism. The county is home to several large farms, and the main crops grown are soybeans, corn, cotton, and wheat. The county is also home to several large manufacturing companies, including Baxter Healthcare, which produces medical supplies and equipment. Tourism is also an important part of the economy, with the Buffalo National River and the Ozark National Forest providing recreational opportunities for visitors.
History
Baxter County was formed in 1873 from parts of Marion, Izard, and Searcy counties. It was named after Elisha Baxter, the 10th Governor of Arkansas. The county seat was originally located in Cotter, but was moved to Mountain Home in 1875.
In the early 20th century, Baxter County was a major producer of timber, and the county was home to several large sawmills. The timber industry declined in the mid-20th century, and the economy shifted to agriculture and tourism.
Today, Baxter County is a thriving community with a diverse economy and a strong sense of community. The county is home to several large employers, and the tourism industry continues to be an important part of the economy.
Common Questions
What is Per Capita Income in Baxter County?
Per Capita income in Baxter County is $30,264.
What is the Median Family Income in Baxter County?
Median Family Income in Baxter County is $59,981.
What is the Median Household income in Baxter County?
Median Household Income in Baxter County is $47,403.
What is Income or Wage Gap in Baxter County?
Income or Wage Gap in Baxter County is 18.5%.
Women in Baxter County earn 81.5 cents for every dollar earned by a man.
What is Family Income Deficit in Baxter County?
Family Income Deficit in Baxter County is $7,788.
Families that are below poverty line in Baxter County earn $7,788 less on average than the poverty threshold level.
What is Inequality or Gini Index in Baxter County?
Inequality or Gini Index in Baxter County is 0.46.
What is the Total Population of Baxter County?
Total Population of Baxter County is 41,801.
What is the Total Male Population of Baxter County?
Total Male Population of Baxter County is 20,433.
What is the Total Female Population of Baxter County?
Total Female Population of Baxter County is 21,368.
What is the Ratio of Males per 100 Females in Baxter County?
There are 95.62 Males per 100 Females in Baxter County.
What is the Ratio of Females per 100 Males in Baxter County?
There are 104.58 Females per 100 Males in Baxter County.
What is the Median Population Age in Baxter County?
Median Population Age in Baxter County is 52.1 Years.
What is the Average Family Size in Baxter County
Average Family Size in Baxter County is 2.7 People.
What is the Average Household Size in Baxter County
Average Household Size in Baxter County is 2.2 People.
How Large is the Labor Force in Baxter County?
There are 16,212 People in the Labor Forcein in Baxter County.
What is the Percentage of People in the Labor Force in Baxter County?
45.8% of People are in the Labor Force in Baxter County.
What is the Unemployment Rate in Baxter County?
Unemployment Rate in Baxter County is 5.1%.