Hot Springs, AR Map & Demographics
Hot Springs Map
Hot Springs Overview
$28,775
PER CAPITA INCOME
$63,071
AVG FAMILY INCOME
$46,537
AVG HOUSEHOLD INCOME
20.3%
WAGE / INCOME GAP [ % ]
79.7¢/ $1
WAGE / INCOME GAP [ $ ]
$10,515
FAMILY INCOME DEFICIT
0.47
INEQUALITY / GINI INDEX
38,025
TOTAL POPULATION
17,787
MALE POPULATION
20,238
FEMALE POPULATION
87.89
MALES / 100 FEMALES
113.78
FEMALES / 100 MALES
44.7
MEDIAN AGE
2.7
AVG FAMILY SIZE
2.1
AVG HOUSEHOLD SIZE
17,373
LABOR FORCE [ PEOPLE ]
54.5%
PERCENT IN LABOR FORCE
5.4%
UNEMPLOYMENT RATE
Hot Springs Area Codes
Income in Hot Springs
Income Overview in Hot Springs
Per Capita Income in Hot Springs is $28,775, while median incomes of families and households are $63,071 and $46,537 respectively.
| Characteristic | Number | Measure |
| Per Capita Income | 38,025 | $28,775 |
| Median Family Income | 10,018 | $63,071 |
| Mean Family Income | 10,018 | $78,611 |
| Median Household Income | 17,402 | $46,537 |
| Mean Household Income | 17,402 | $63,074 |
| Income Deficit | 10,018 | $10,515 |
| Wage / Income Gap (%) | 38,025 | 20.31% |
| Wage / Income Gap ($) | 38,025 | 79.69¢ per $1 |
| Gini / Inequality Index | 38,025 | 0.47 |
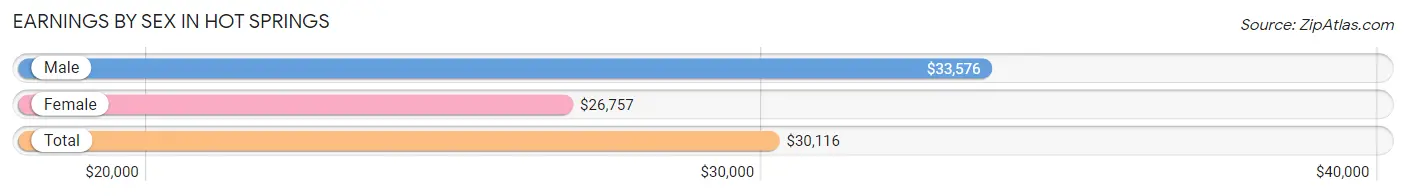
Earnings by Sex in Hot Springs
Average Earnings in Hot Springs are $30,116, $33,576 for men and $26,757 for women, a difference of 20.3%.
| Sex | Number | Average Earnings |
| Male | 9,331 (50.7%) | $33,576 |
| Female | 9,086 (49.3%) | $26,757 |
| Total | 18,417 (100.0%) | $30,116 |
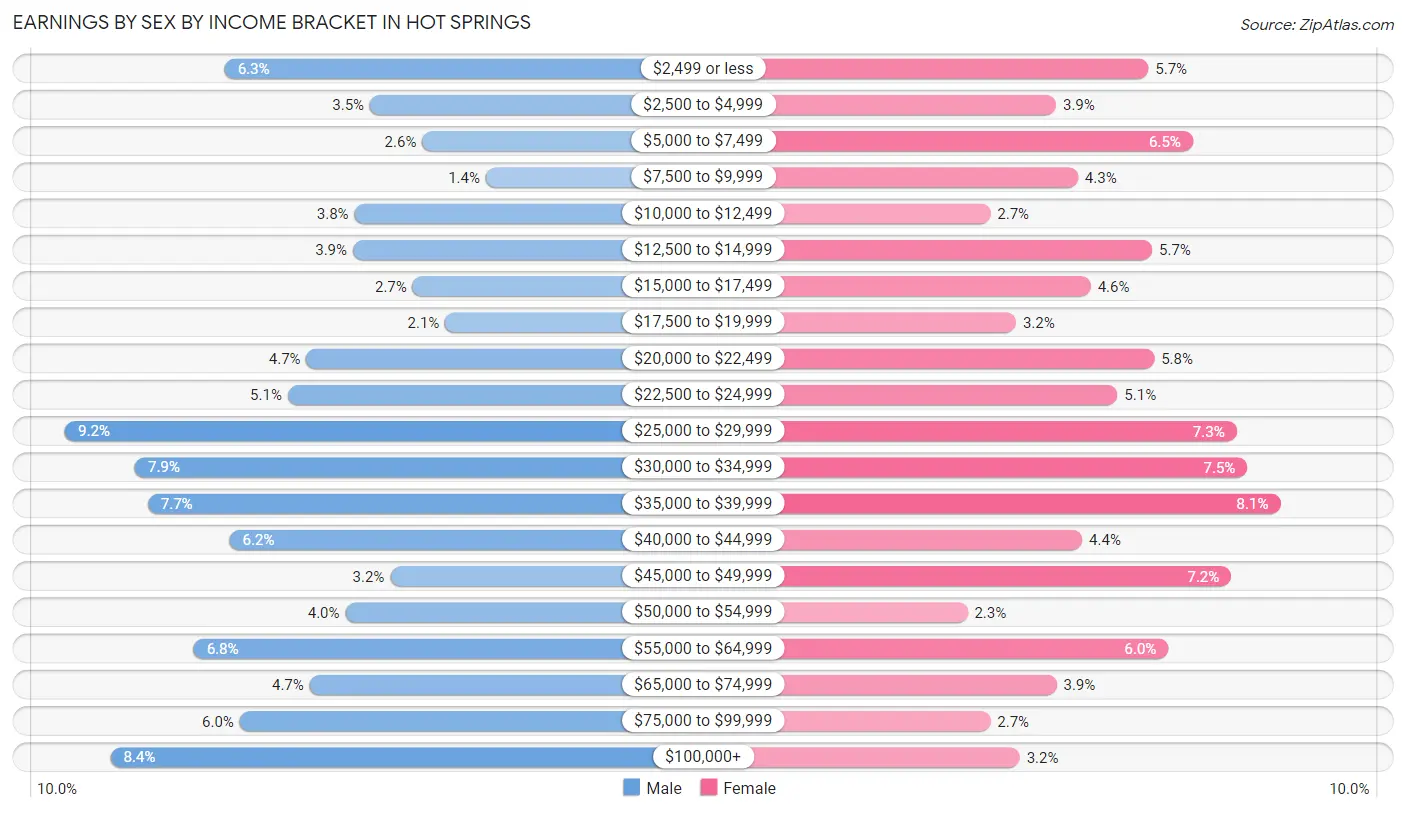
Earnings by Sex by Income Bracket in Hot Springs
The most common earnings brackets in Hot Springs are $25,000 to $29,999 for men (862 | 9.2%) and $35,000 to $39,999 for women (738 | 8.1%).
| Income | Male | Female |
| $2,499 or less | 583 (6.2%) | 513 (5.7%) |
| $2,500 to $4,999 | 329 (3.5%) | 356 (3.9%) |
| $5,000 to $7,499 | 238 (2.5%) | 589 (6.5%) |
| $7,500 to $9,999 | 127 (1.4%) | 393 (4.3%) |
| $10,000 to $12,499 | 356 (3.8%) | 244 (2.7%) |
| $12,500 to $14,999 | 359 (3.8%) | 520 (5.7%) |
| $15,000 to $17,499 | 255 (2.7%) | 415 (4.6%) |
| $17,500 to $19,999 | 198 (2.1%) | 288 (3.2%) |
| $20,000 to $22,499 | 440 (4.7%) | 523 (5.8%) |
| $22,500 to $24,999 | 473 (5.1%) | 461 (5.1%) |
| $25,000 to $29,999 | 862 (9.2%) | 663 (7.3%) |
| $30,000 to $34,999 | 740 (7.9%) | 681 (7.5%) |
| $35,000 to $39,999 | 718 (7.7%) | 738 (8.1%) |
| $40,000 to $44,999 | 575 (6.2%) | 401 (4.4%) |
| $45,000 to $49,999 | 294 (3.2%) | 654 (7.2%) |
| $50,000 to $54,999 | 372 (4.0%) | 205 (2.3%) |
| $55,000 to $64,999 | 637 (6.8%) | 547 (6.0%) |
| $65,000 to $74,999 | 435 (4.7%) | 357 (3.9%) |
| $75,000 to $99,999 | 557 (6.0%) | 244 (2.7%) |
| $100,000+ | 783 (8.4%) | 294 (3.2%) |
| Total | 9,331 (100.0%) | 9,086 (100.0%) |
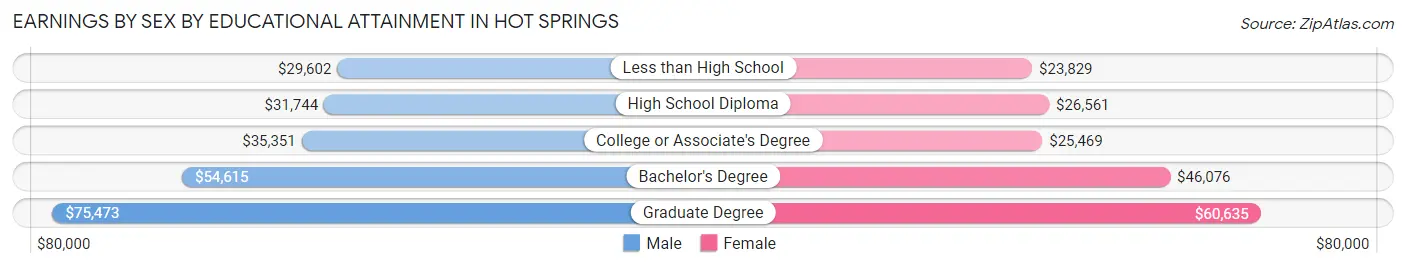
Earnings by Sex by Educational Attainment in Hot Springs
Average earnings in Hot Springs are $37,232 for men and $31,430 for women, a difference of 15.6%. Men with an educational attainment of graduate degree enjoy the highest average annual earnings of $75,473, while those with less than high school education earn the least with $29,602. Women with an educational attainment of graduate degree earn the most with the average annual earnings of $60,635, while those with less than high school education have the smallest earnings of $23,829.
| Educational Attainment | Male Income | Female Income |
| Less than High School | $29,602 | $23,829 |
| High School Diploma | $31,744 | $26,561 |
| College or Associate's Degree | $35,351 | $25,469 |
| Bachelor's Degree | $54,615 | $46,076 |
| Graduate Degree | $75,473 | $60,635 |
| Total | $37,232 | $31,430 |
Family Income in Hot Springs
Family Income Brackets in Hot Springs
According to the Hot Springs family income data, there are 2,004 families falling into the $50,000 to $74,999 income range, which is the most common income bracket and makes up 20.0% of all families. Conversely, the $200,000+ income bracket is the least frequent group with only 431 families (4.3%) belonging to this category.
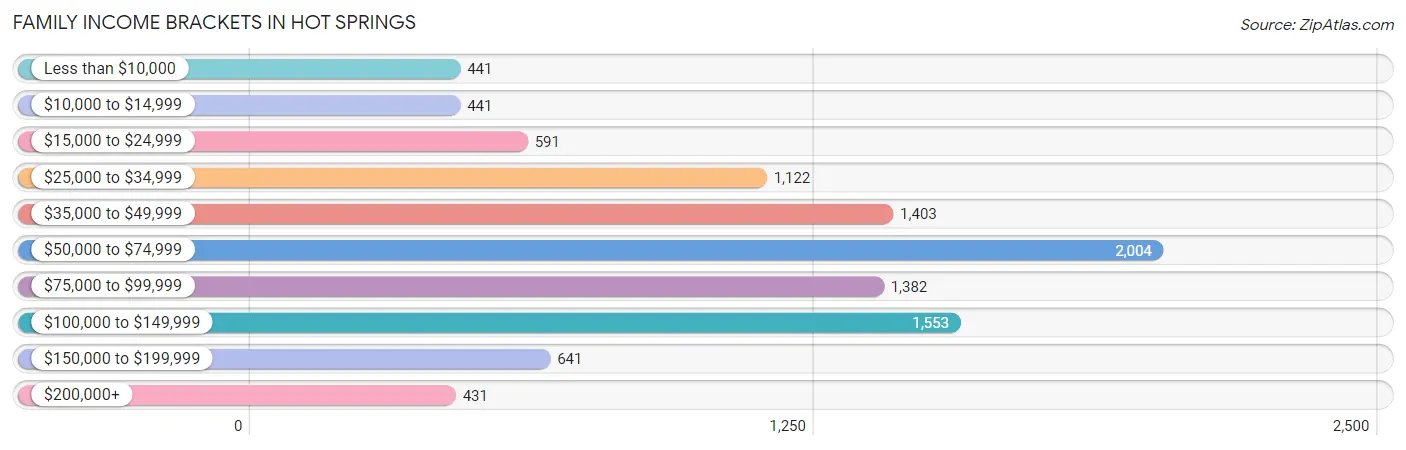
| Income Bracket | # Families | % Families |
| Less than $10,000 | 441 | 4.4% |
| $10,000 to $14,999 | 441 | 4.4% |
| $15,000 to $24,999 | 591 | 5.9% |
| $25,000 to $34,999 | 1,122 | 11.2% |
| $35,000 to $49,999 | 1,403 | 14.0% |
| $50,000 to $74,999 | 2,004 | 20.0% |
| $75,000 to $99,999 | 1,382 | 13.8% |
| $100,000 to $149,999 | 1,553 | 15.5% |
| $150,000 to $199,999 | 641 | 6.4% |
| $200,000+ | 431 | 4.3% |
Family Income by Famaliy Size in Hot Springs
5-person families (597 | 6.0%) account for the highest median family income in Hot Springs with $90,733 per family, while 2-person families (5,596 | 55.9%) have the highest median income of $30,806 per family member.
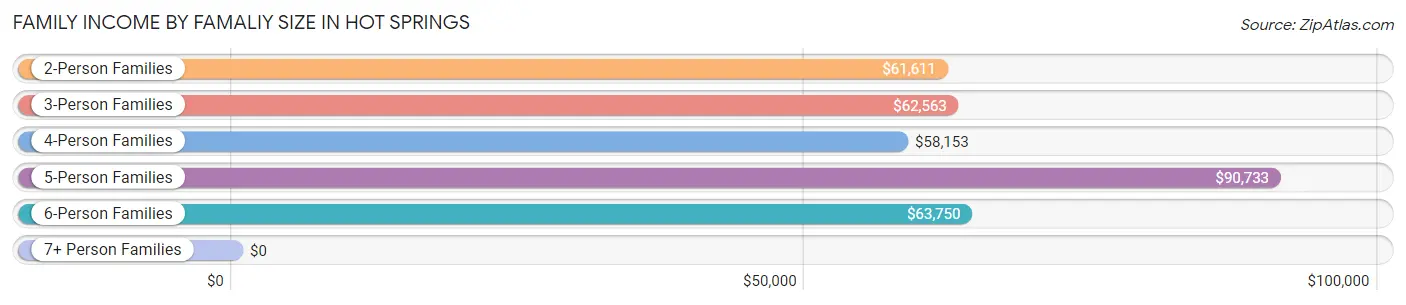
| Income Bracket | # Families | Median Income |
| 2-Person Families | 5,596 (55.9%) | $61,611 |
| 3-Person Families | 2,384 (23.8%) | $62,563 |
| 4-Person Families | 1,147 (11.5%) | $58,153 |
| 5-Person Families | 597 (6.0%) | $90,733 |
| 6-Person Families | 142 (1.4%) | $63,750 |
| 7+ Person Families | 152 (1.5%) | $0 |
| Total | 10,018 (100.0%) | $63,071 |
Family Income by Number of Earners in Hot Springs
The median family income in Hot Springs is $63,071, with families comprising 3+ earners (867) having the highest median family income of $100,262, while families with 1 earner (4,052) have the lowest median family income of $43,496, accounting for 8.6% and 40.5% of families, respectively.
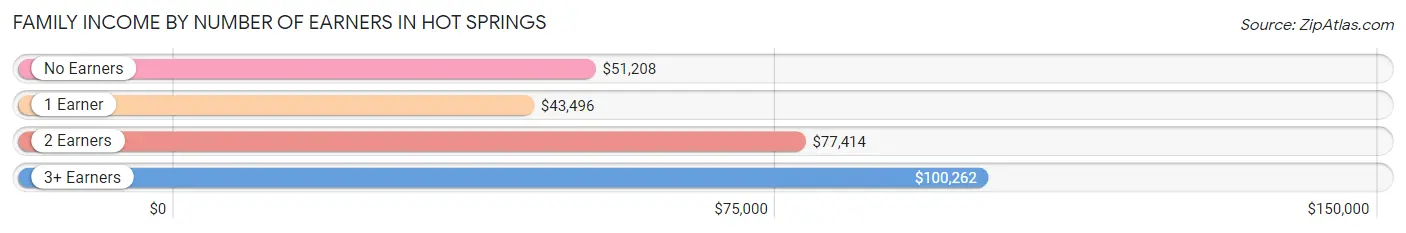
| Number of Earners | # Families | Median Income |
| No Earners | 1,987 (19.8%) | $51,208 |
| 1 Earner | 4,052 (40.5%) | $43,496 |
| 2 Earners | 3,112 (31.1%) | $77,414 |
| 3+ Earners | 867 (8.6%) | $100,262 |
| Total | 10,018 (100.0%) | $63,071 |
Household Income in Hot Springs
Household Income Brackets in Hot Springs
With 3,063 households falling in the category, the $50,000 to $74,999 income range is the most frequent in Hot Springs, accounting for 17.6% of all households. In contrast, only 539 households (3.1%) fall into the $200,000+ income bracket, making it the least populous group.
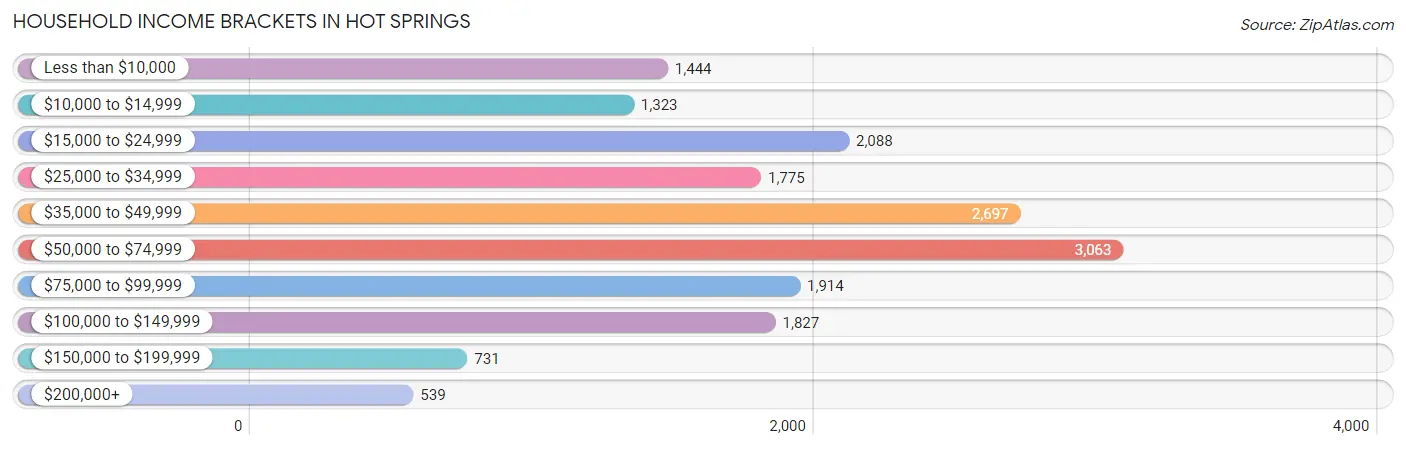
| Income Bracket | # Households | % Households |
| Less than $10,000 | 1,444 | 8.3% |
| $10,000 to $14,999 | 1,323 | 7.6% |
| $15,000 to $24,999 | 2,088 | 12.0% |
| $25,000 to $34,999 | 1,775 | 10.2% |
| $35,000 to $49,999 | 2,697 | 15.5% |
| $50,000 to $74,999 | 3,063 | 17.6% |
| $75,000 to $99,999 | 1,914 | 11.0% |
| $100,000 to $149,999 | 1,827 | 10.5% |
| $150,000 to $199,999 | 731 | 4.2% |
| $200,000+ | 539 | 3.1% |
Household Income by Householder Age in Hot Springs
The median household income in Hot Springs is $46,537, with the highest median household income of $53,889 found in the 45 to 64 years age bracket for the primary householder. A total of 5,918 households (34.0%) fall into this category. Meanwhile, the 15 to 24 years age bracket for the primary householder has the lowest median household income of $29,961, with 853 households (4.9%) in this group.
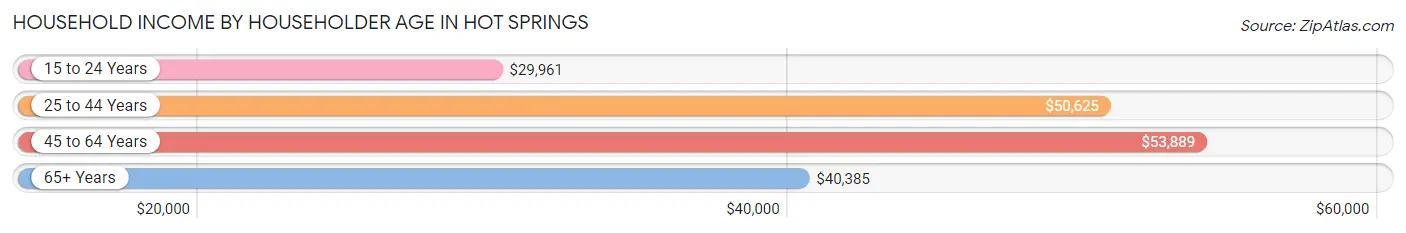
| Income Bracket | # Households | Median Income |
| 15 to 24 Years | 853 (4.9%) | $29,961 |
| 25 to 44 Years | 4,905 (28.2%) | $50,625 |
| 45 to 64 Years | 5,918 (34.0%) | $53,889 |
| 65+ Years | 5,726 (32.9%) | $40,385 |
| Total | 17,402 (100.0%) | $46,537 |
Poverty in Hot Springs
Income Below Poverty by Sex and Age in Hot Springs
With 19.0% poverty level for males and 23.1% for females among the residents of Hot Springs, 15 year old males and 18 to 24 year old females are the most vulnerable to poverty, with 105 males (56.5%) and 860 females (51.8%) in their respective age groups living below the poverty level.
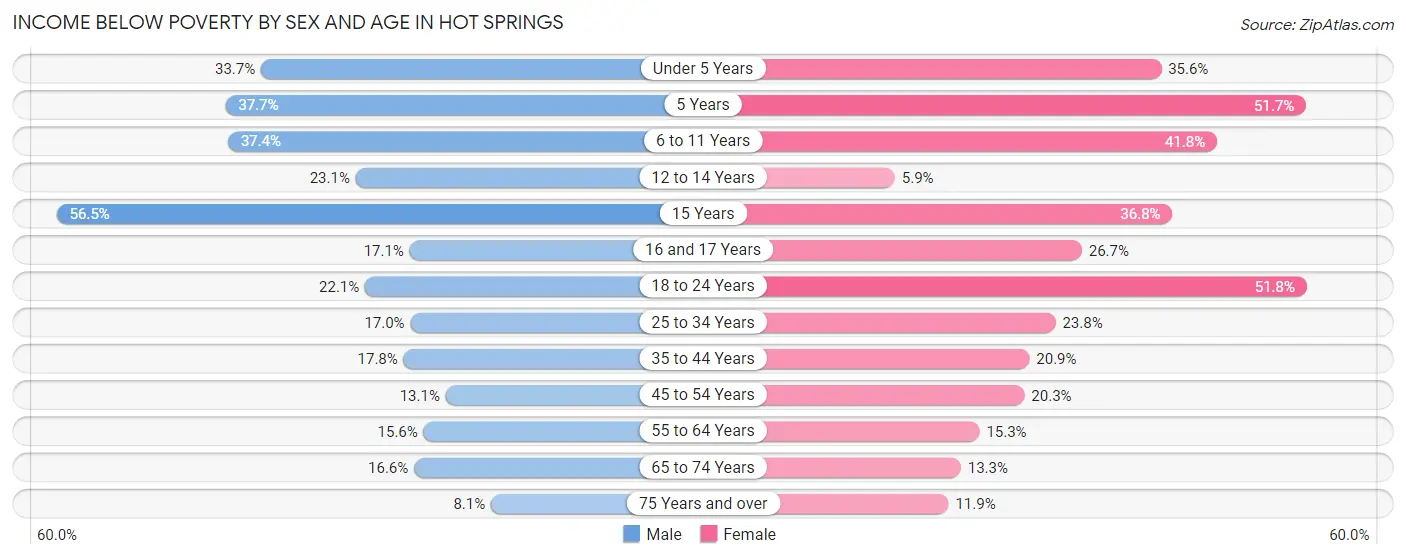
| Age Bracket | Male | Female |
| Under 5 Years | 330 (33.7%) | 434 (35.6%) |
| 5 Years | 64 (37.7%) | 136 (51.7%) |
| 6 to 11 Years | 345 (37.4%) | 422 (41.8%) |
| 12 to 14 Years | 123 (23.1%) | 29 (5.9%) |
| 15 Years | 105 (56.5%) | 74 (36.8%) |
| 16 and 17 Years | 77 (17.1%) | 58 (26.7%) |
| 18 to 24 Years | 400 (22.1%) | 860 (51.8%) |
| 25 to 34 Years | 380 (17.0%) | 568 (23.8%) |
| 35 to 44 Years | 307 (17.8%) | 435 (20.9%) |
| 45 to 54 Years | 242 (13.1%) | 479 (20.3%) |
| 55 to 64 Years | 437 (15.6%) | 451 (15.3%) |
| 65 to 74 Years | 295 (16.6%) | 328 (13.3%) |
| 75 Years and over | 126 (8.1%) | 298 (11.9%) |
| Total | 3,231 (19.0%) | 4,572 (23.1%) |
Income Above Poverty by Sex and Age in Hot Springs
According to the poverty statistics in Hot Springs, males aged 75 years and over and females aged 12 to 14 years are the age groups that are most secure financially, with 91.9% of males and 94.1% of females in these age groups living above the poverty line.
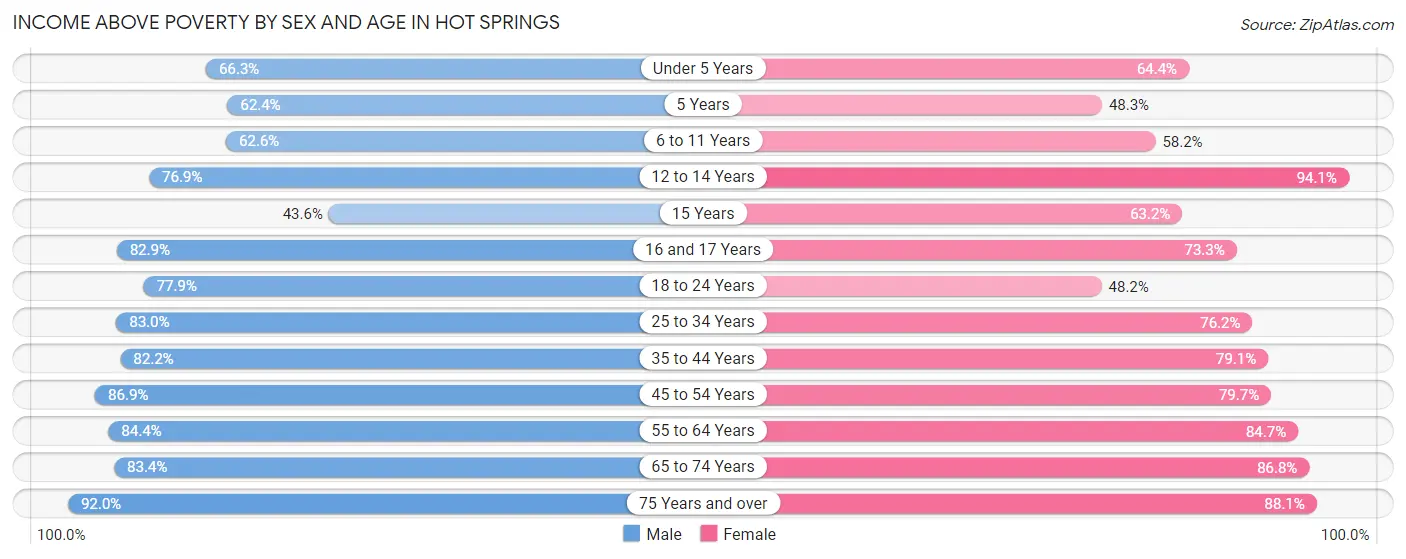
| Age Bracket | Male | Female |
| Under 5 Years | 650 (66.3%) | 786 (64.4%) |
| 5 Years | 106 (62.4%) | 127 (48.3%) |
| 6 to 11 Years | 578 (62.6%) | 588 (58.2%) |
| 12 to 14 Years | 409 (76.9%) | 462 (94.1%) |
| 15 Years | 81 (43.5%) | 127 (63.2%) |
| 16 and 17 Years | 373 (82.9%) | 159 (73.3%) |
| 18 to 24 Years | 1,412 (77.9%) | 801 (48.2%) |
| 25 to 34 Years | 1,851 (83.0%) | 1,819 (76.2%) |
| 35 to 44 Years | 1,419 (82.2%) | 1,647 (79.1%) |
| 45 to 54 Years | 1,606 (86.9%) | 1,876 (79.7%) |
| 55 to 64 Years | 2,371 (84.4%) | 2,491 (84.7%) |
| 65 to 74 Years | 1,480 (83.4%) | 2,148 (86.8%) |
| 75 Years and over | 1,439 (91.9%) | 2,210 (88.1%) |
| Total | 13,775 (81.0%) | 15,241 (76.9%) |
Income Below Poverty Among Married-Couple Families in Hot Springs
The poverty statistics for married-couple families in Hot Springs show that 4.7% or 273 of the total 5,849 families live below the poverty line. Families with 5 or more children have the highest poverty rate of 100.0%, comprising of 8 families. On the other hand, families with 1 or 2 children have the lowest poverty rate of 3.2%, which includes 49 families.
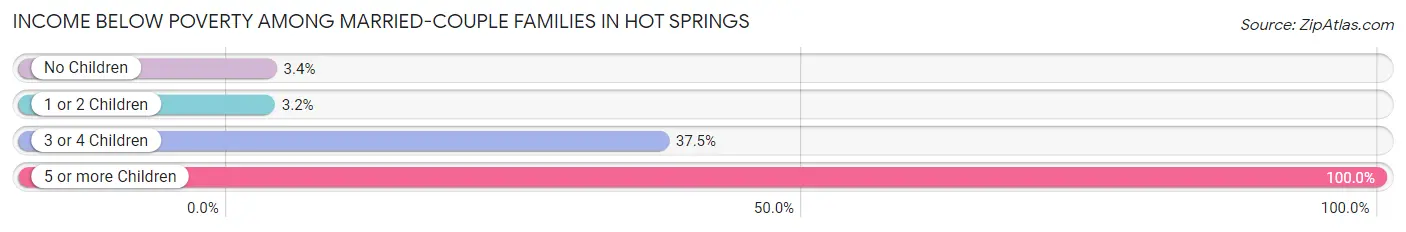
| Children | Above Poverty | Below Poverty |
| No Children | 3,964 (96.6%) | 138 (3.4%) |
| 1 or 2 Children | 1,482 (96.8%) | 49 (3.2%) |
| 3 or 4 Children | 130 (62.5%) | 78 (37.5%) |
| 5 or more Children | 0 (0.0%) | 8 (100.0%) |
| Total | 5,576 (95.3%) | 273 (4.7%) |
Income Below Poverty Among Single-Parent Households in Hot Springs
According to the poverty data in Hot Springs, 25.3% or 266 single-father households and 29.5% or 920 single-mother households are living below the poverty line. Among single-father households, those with 3 or 4 children have the highest poverty rate, with 10 households (100.0%) experiencing poverty. Likewise, among single-mother households, those with 5 or more children have the highest poverty rate, with 72 households (91.1%) falling below the poverty line.
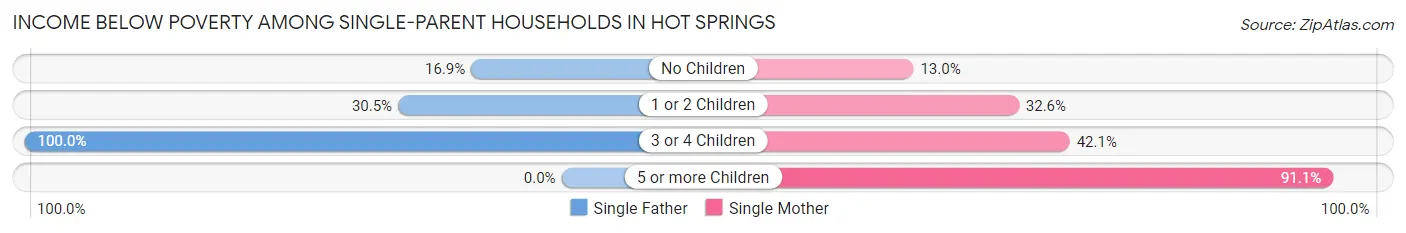
| Children | Single Father | Single Mother |
| No Children | 76 (16.9%) | 120 (13.0%) |
| 1 or 2 Children | 180 (30.5%) | 560 (32.6%) |
| 3 or 4 Children | 10 (100.0%) | 168 (42.1%) |
| 5 or more Children | 0 (0.0%) | 72 (91.1%) |
| Total | 266 (25.3%) | 920 (29.5%) |
Income Below Poverty Among Married-Couple vs Single-Parent Households in Hot Springs
The poverty data for Hot Springs shows that 273 of the married-couple family households (4.7%) and 1,186 of the single-parent households (28.4%) are living below the poverty level. Within the married-couple family households, those with 5 or more children have the highest poverty rate, with 8 households (100.0%) falling below the poverty line. Among the single-parent households, those with 5 or more children have the highest poverty rate, with 72 household (91.1%) living below poverty.
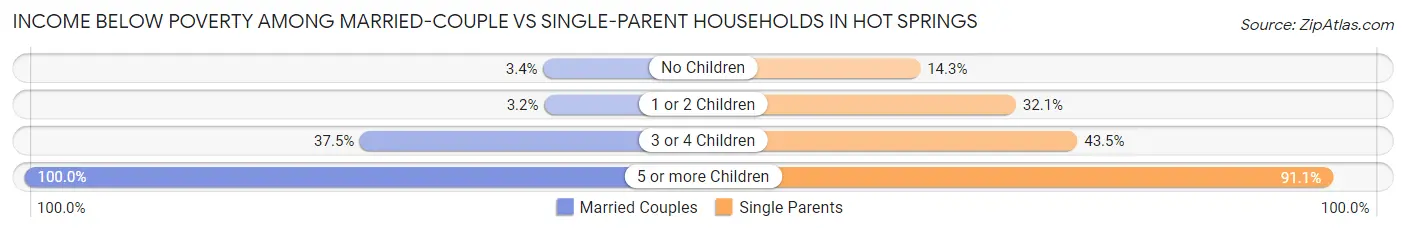
| Children | Married-Couple Families | Single-Parent Households |
| No Children | 138 (3.4%) | 196 (14.3%) |
| 1 or 2 Children | 49 (3.2%) | 740 (32.1%) |
| 3 or 4 Children | 78 (37.5%) | 178 (43.5%) |
| 5 or more Children | 8 (100.0%) | 72 (91.1%) |
| Total | 273 (4.7%) | 1,186 (28.4%) |
Race in Hot Springs
The most populous races in Hot Springs are White / Caucasian (27,706 | 72.9%), Black / African American (6,538 | 17.2%), and Hispanic or Latino (4,070 | 10.7%).
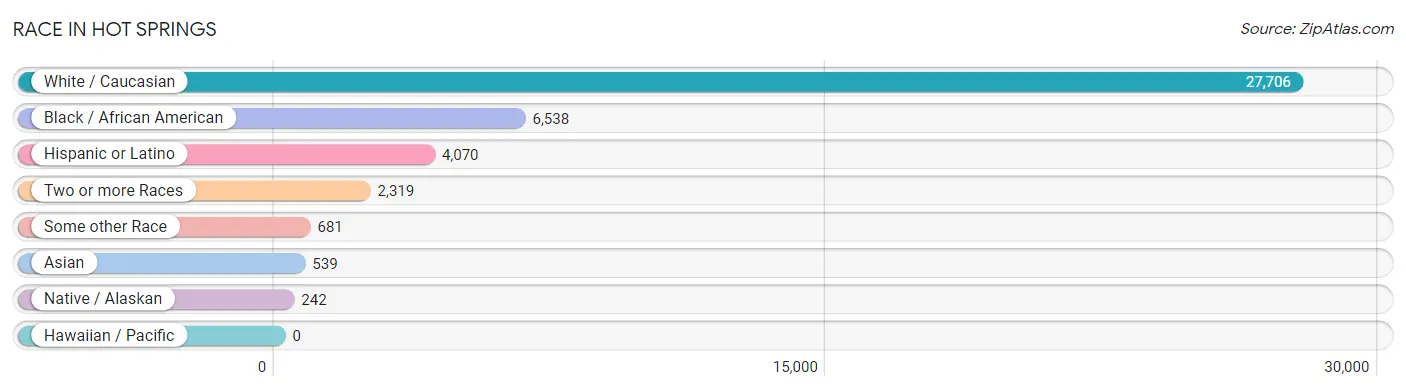
| Race | # Population | % Population |
| Asian | 539 | 1.4% |
| Black / African American | 6,538 | 17.2% |
| Hawaiian / Pacific | 0 | 0.0% |
| Hispanic or Latino | 4,070 | 10.7% |
| Native / Alaskan | 242 | 0.6% |
| White / Caucasian | 27,706 | 72.9% |
| Two or more Races | 2,319 | 6.1% |
| Some other Race | 681 | 1.8% |
| Total | 38,025 | 100.0% |
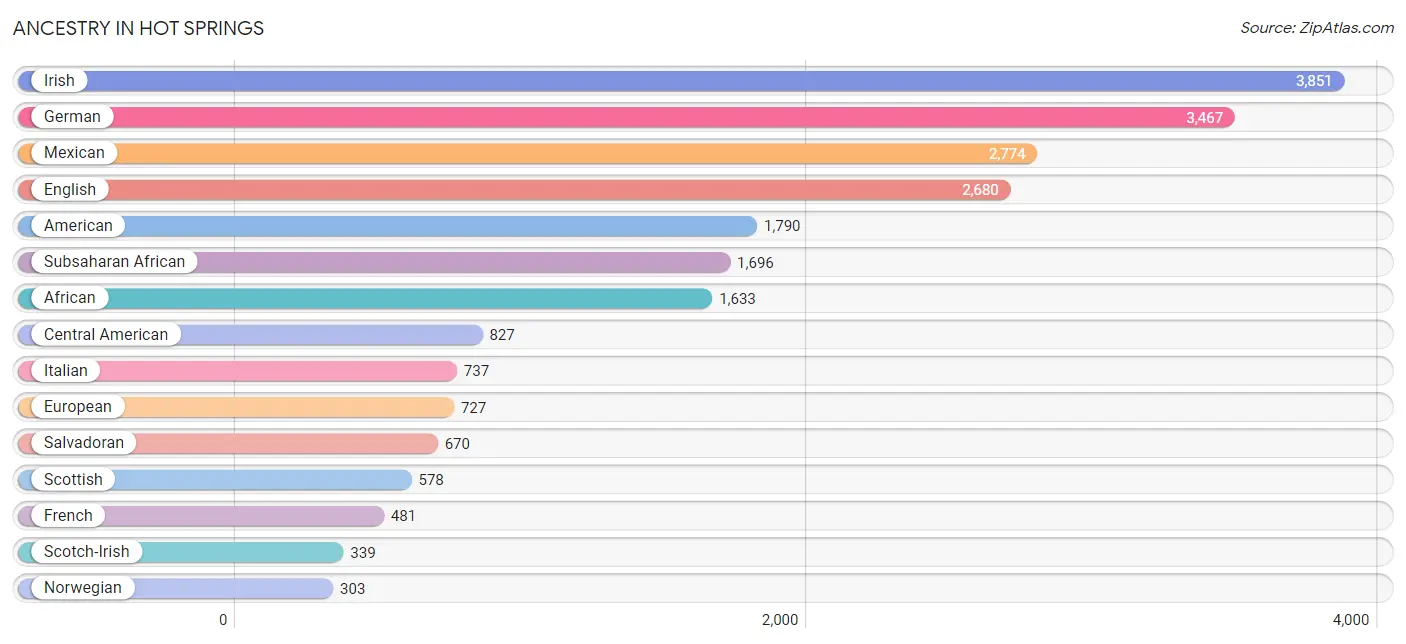
Ancestry in Hot Springs
The most populous ancestries reported in Hot Springs are Irish (3,851 | 10.1%), German (3,467 | 9.1%), Mexican (2,774 | 7.3%), English (2,680 | 7.0%), and American (1,790 | 4.7%), together accounting for 38.3% of all Hot Springs residents.
| Ancestry | # Population | % Population |
| African | 1,633 | 4.3% |
| American | 1,790 | 4.7% |
| Apache | 4 | 0.0% |
| Arab | 10 | 0.0% |
| Australian | 7 | 0.0% |
| Austrian | 16 | 0.0% |
| Bhutanese | 129 | 0.3% |
| Blackfeet | 39 | 0.1% |
| British | 123 | 0.3% |
| Burmese | 39 | 0.1% |
| Cajun | 19 | 0.1% |
| Carpatho Rusyn | 12 | 0.0% |
| Central American | 827 | 2.2% |
| Central American Indian | 15 | 0.0% |
| Cherokee | 214 | 0.6% |
| Choctaw | 58 | 0.2% |
| Colombian | 5 | 0.0% |
| Cree | 3 | 0.0% |
| Creek | 5 | 0.0% |
| Croatian | 24 | 0.1% |
| Cuban | 12 | 0.0% |
| Czech | 219 | 0.6% |
| Czechoslovakian | 19 | 0.1% |
| Danish | 86 | 0.2% |
| Dominican | 3 | 0.0% |
| Dutch | 266 | 0.7% |
| Dutch West Indian | 26 | 0.1% |
| Eastern European | 19 | 0.1% |
| English | 2,680 | 7.0% |
| European | 727 | 1.9% |
| Finnish | 53 | 0.1% |
| French | 481 | 1.3% |
| French Canadian | 58 | 0.2% |
| German | 3,467 | 9.1% |
| Greek | 17 | 0.0% |
| Guatemalan | 18 | 0.1% |
| Honduran | 130 | 0.3% |
| Hungarian | 62 | 0.2% |
| Indian (Asian) | 3 | 0.0% |
| Iranian | 21 | 0.1% |
| Irish | 3,851 | 10.1% |
| Israeli | 7 | 0.0% |
| Italian | 737 | 1.9% |
| Korean | 86 | 0.2% |
| Lithuanian | 48 | 0.1% |
| Malaysian | 10 | 0.0% |
| Mexican | 2,774 | 7.3% |
| Mexican American Indian | 20 | 0.1% |
| Native Hawaiian | 30 | 0.1% |
| Navajo | 99 | 0.3% |
| Nigerian | 63 | 0.2% |
| Northern European | 110 | 0.3% |
| Norwegian | 303 | 0.8% |
| Osage | 6 | 0.0% |
| Pakistani | 144 | 0.4% |
| Panamanian | 9 | 0.0% |
| Pennsylvania German | 72 | 0.2% |
| Polish | 260 | 0.7% |
| Portuguese | 24 | 0.1% |
| Potawatomi | 2 | 0.0% |
| Puerto Rican | 130 | 0.3% |
| Romanian | 166 | 0.4% |
| Russian | 62 | 0.2% |
| Salvadoran | 670 | 1.8% |
| Scandinavian | 111 | 0.3% |
| Scotch-Irish | 339 | 0.9% |
| Scottish | 578 | 1.5% |
| Serbian | 65 | 0.2% |
| Slovak | 19 | 0.1% |
| South American | 83 | 0.2% |
| Spaniard | 50 | 0.1% |
| Spanish | 14 | 0.0% |
| Sri Lankan | 118 | 0.3% |
| Subsaharan African | 1,696 | 4.5% |
| Swedish | 104 | 0.3% |
| Swiss | 48 | 0.1% |
| Thai | 247 | 0.6% |
| Ukrainian | 17 | 0.0% |
| Ute | 13 | 0.0% |
| Venezuelan | 78 | 0.2% |
| Welsh | 146 | 0.4% | View All 81 Rows |
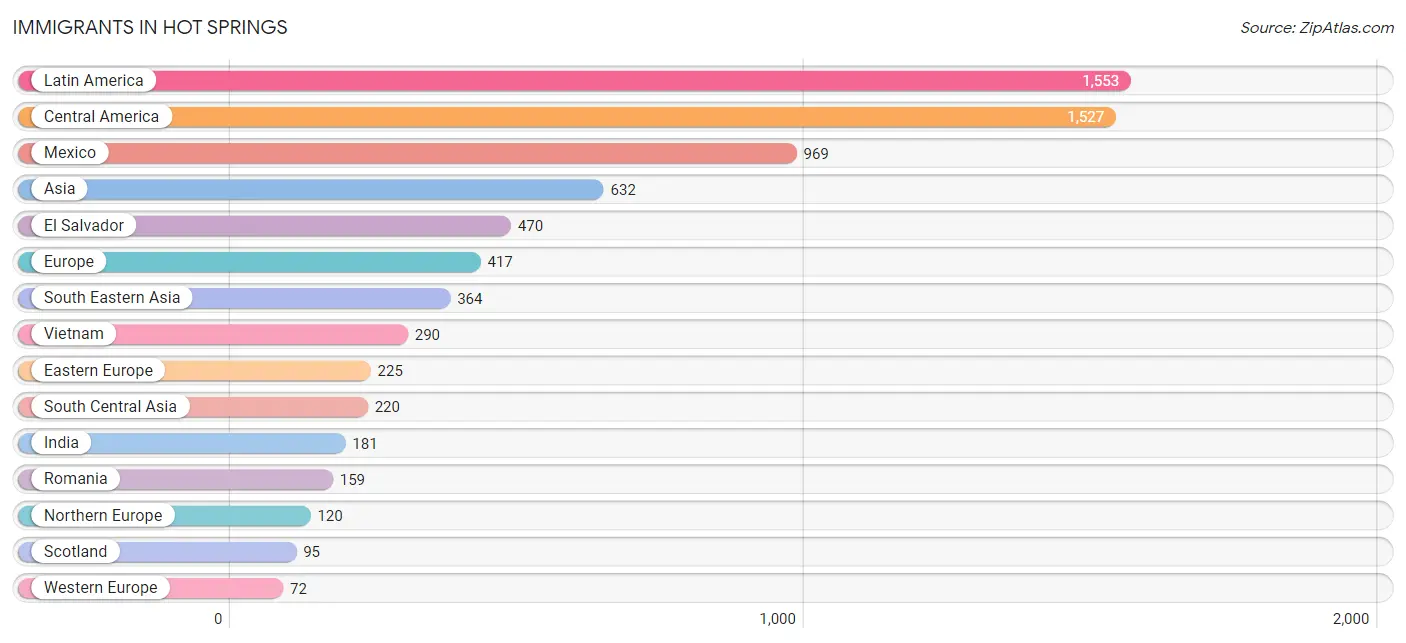
Immigrants in Hot Springs
The most numerous immigrant groups reported in Hot Springs came from Latin America (1,553 | 4.1%), Central America (1,527 | 4.0%), Mexico (969 | 2.5%), Asia (632 | 1.7%), and El Salvador (470 | 1.2%), together accounting for 13.6% of all Hot Springs residents.
| Immigration Origin | # Population | % Population |
| Asia | 632 | 1.7% |
| Belarus | 9 | 0.0% |
| Canada | 15 | 0.0% |
| Caribbean | 7 | 0.0% |
| Central America | 1,527 | 4.0% |
| China | 1 | 0.0% |
| Croatia | 9 | 0.0% |
| Cuba | 7 | 0.0% |
| Czechoslovakia | 5 | 0.0% |
| Eastern Asia | 40 | 0.1% |
| Eastern Europe | 225 | 0.6% |
| El Salvador | 470 | 1.2% |
| Europe | 417 | 1.1% |
| France | 9 | 0.0% |
| Germany | 63 | 0.2% |
| Guatemala | 25 | 0.1% |
| Honduras | 63 | 0.2% |
| India | 181 | 0.5% |
| Iran | 21 | 0.1% |
| Korea | 39 | 0.1% |
| Latin America | 1,553 | 4.1% |
| Mexico | 969 | 2.5% |
| Northern Europe | 120 | 0.3% |
| Philippines | 37 | 0.1% |
| Poland | 7 | 0.0% |
| Romania | 159 | 0.4% |
| Saudi Arabia | 8 | 0.0% |
| Scotland | 95 | 0.3% |
| Serbia | 26 | 0.1% |
| South America | 19 | 0.1% |
| South Central Asia | 220 | 0.6% |
| South Eastern Asia | 364 | 1.0% |
| Sri Lanka | 18 | 0.1% |
| Sweden | 11 | 0.0% |
| Thailand | 37 | 0.1% |
| Venezuela | 19 | 0.1% |
| Vietnam | 290 | 0.8% |
| Western Asia | 8 | 0.0% |
| Western Europe | 72 | 0.2% | View All 39 Rows |
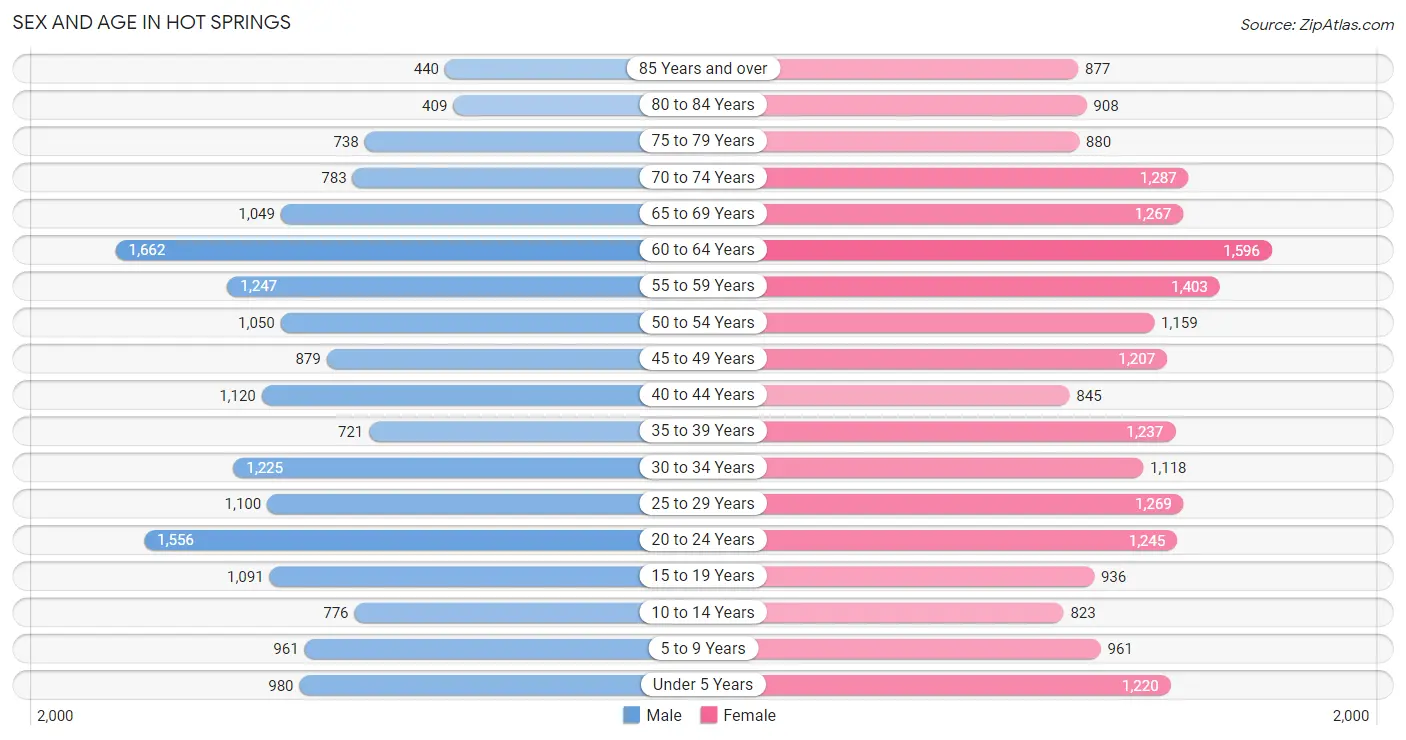
Sex and Age in Hot Springs
Sex and Age in Hot Springs
The most populous age groups in Hot Springs are 60 to 64 Years (1,662 | 9.3%) for men and 60 to 64 Years (1,596 | 7.9%) for women.
| Age Bracket | Male | Female |
| Under 5 Years | 980 (5.5%) | 1,220 (6.0%) |
| 5 to 9 Years | 961 (5.4%) | 961 (4.8%) |
| 10 to 14 Years | 776 (4.4%) | 823 (4.1%) |
| 15 to 19 Years | 1,091 (6.1%) | 936 (4.6%) |
| 20 to 24 Years | 1,556 (8.7%) | 1,245 (6.1%) |
| 25 to 29 Years | 1,100 (6.2%) | 1,269 (6.3%) |
| 30 to 34 Years | 1,225 (6.9%) | 1,118 (5.5%) |
| 35 to 39 Years | 721 (4.1%) | 1,237 (6.1%) |
| 40 to 44 Years | 1,120 (6.3%) | 845 (4.2%) |
| 45 to 49 Years | 879 (4.9%) | 1,207 (6.0%) |
| 50 to 54 Years | 1,050 (5.9%) | 1,159 (5.7%) |
| 55 to 59 Years | 1,247 (7.0%) | 1,403 (6.9%) |
| 60 to 64 Years | 1,662 (9.3%) | 1,596 (7.9%) |
| 65 to 69 Years | 1,049 (5.9%) | 1,267 (6.3%) |
| 70 to 74 Years | 783 (4.4%) | 1,287 (6.4%) |
| 75 to 79 Years | 738 (4.2%) | 880 (4.3%) |
| 80 to 84 Years | 409 (2.3%) | 908 (4.5%) |
| 85 Years and over | 440 (2.5%) | 877 (4.3%) |
| Total | 17,787 (100.0%) | 20,238 (100.0%) |
Families and Households in Hot Springs
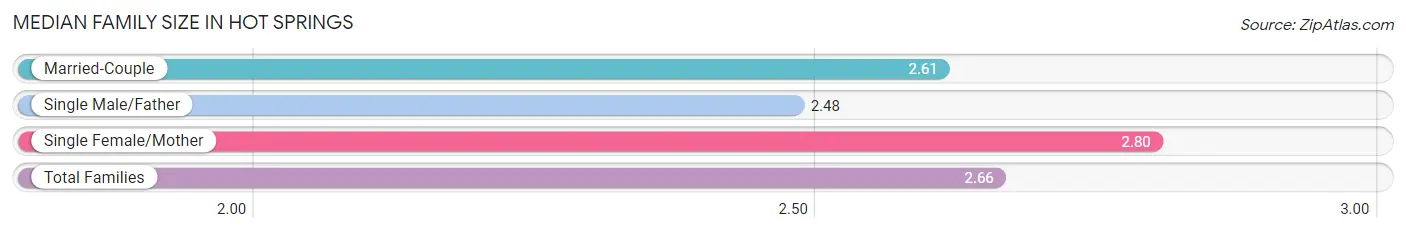
Median Family Size in Hot Springs
The median family size in Hot Springs is 2.66 persons per family, with single female/mother families (3,117 | 31.1%) accounting for the largest median family size of 2.8 persons per family. On the other hand, single male/father families (1,052 | 10.5%) represent the smallest median family size with 2.48 persons per family.
| Family Type | # Families | Family Size |
| Married-Couple | 5,849 (58.4%) | 2.61 |
| Single Male/Father | 1,052 (10.5%) | 2.48 |
| Single Female/Mother | 3,117 (31.1%) | 2.80 |
| Total Families | 10,018 (100.0%) | 2.66 |
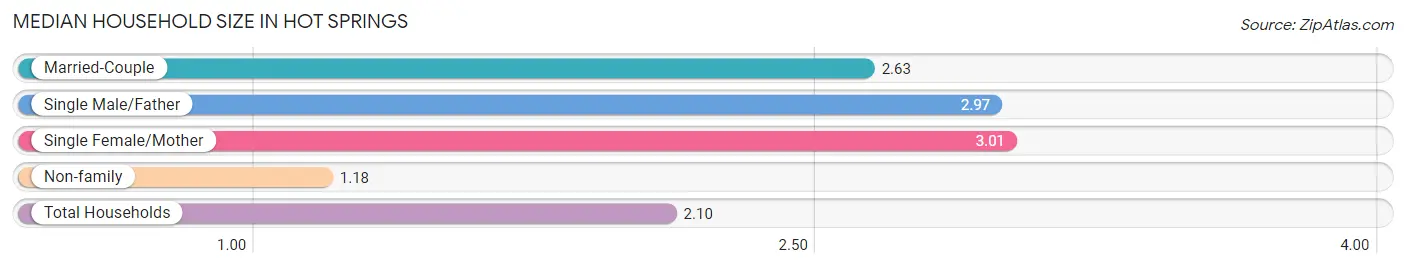
Median Household Size in Hot Springs
The median household size in Hot Springs is 2.10 persons per household, with single female/mother households (3,117 | 17.9%) accounting for the largest median household size of 3.01 persons per household. non-family households (7,384 | 42.4%) represent the smallest median household size with 1.18 persons per household.
| Household Type | # Households | Household Size |
| Married-Couple | 5,849 (33.6%) | 2.63 |
| Single Male/Father | 1,052 (6.0%) | 2.97 |
| Single Female/Mother | 3,117 (17.9%) | 3.01 |
| Non-family | 7,384 (42.4%) | 1.18 |
| Total Households | 17,402 (100.0%) | 2.10 |
Household Size by Marriage Status in Hot Springs
Out of a total of 17,402 households in Hot Springs, 10,018 (57.6%) are family households, while 7,384 (42.4%) are nonfamily households. The most numerous type of family households are 2-person households, comprising 5,026, and the most common type of nonfamily households are 1-person households, comprising 6,339.
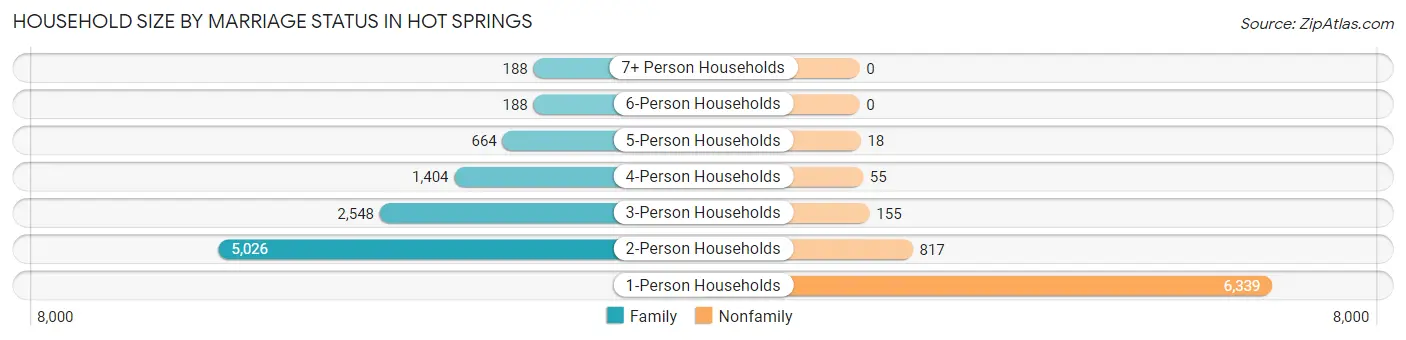
| Household Size | Family Households | Nonfamily Households |
| 1-Person Households | - | 6,339 (36.4%) |
| 2-Person Households | 5,026 (28.9%) | 817 (4.7%) |
| 3-Person Households | 2,548 (14.6%) | 155 (0.9%) |
| 4-Person Households | 1,404 (8.1%) | 55 (0.3%) |
| 5-Person Households | 664 (3.8%) | 18 (0.1%) |
| 6-Person Households | 188 (1.1%) | 0 (0.0%) |
| 7+ Person Households | 188 (1.1%) | 0 (0.0%) |
| Total | 10,018 (57.6%) | 7,384 (42.4%) |
Female Fertility in Hot Springs
Fertility by Age in Hot Springs
Average fertility rate in Hot Springs is 57.0 births per 1,000 women. Women in the age bracket of 20 to 34 years have the highest fertility rate with 113.0 births per 1,000 women. Women in the age bracket of 20 to 34 years acount for 89.0% of all women with births.
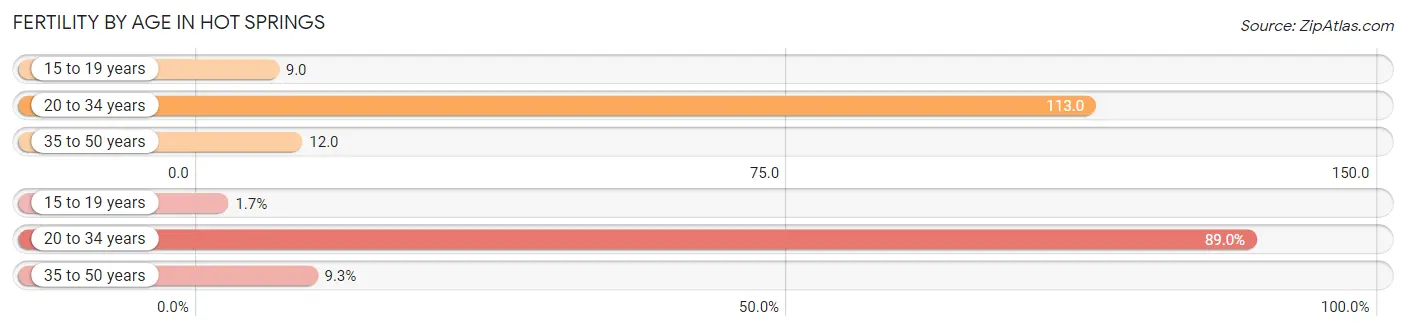
| Age Bracket | Women with Births | Births / 1,000 Women |
| 15 to 19 years | 8 (1.7%) | 9.0 |
| 20 to 34 years | 412 (89.0%) | 113.0 |
| 35 to 50 years | 43 (9.3%) | 12.0 |
| Total | 463 (100.0%) | 57.0 |
Fertility by Age by Marriage Status in Hot Springs
27.2% of women with births (463) in Hot Springs are married. The highest percentage of unmarried women with births falls into 15 to 19 years age bracket with 100.0% of them unmarried at the time of birth, while the lowest percentage of unmarried women with births belong to 35 to 50 years age bracket with 72.1% of them unmarried.
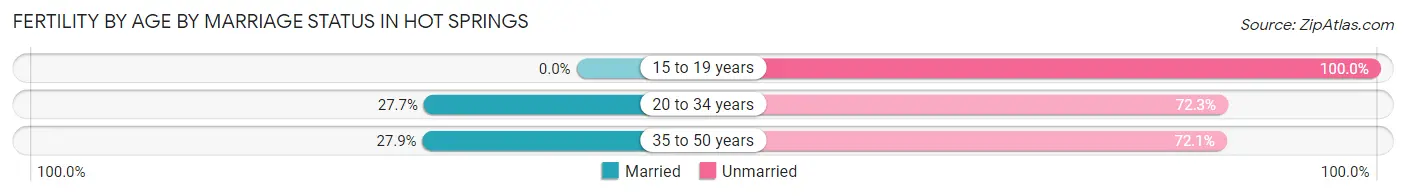
| Age Bracket | Married | Unmarried |
| 15 to 19 years | 0 (0.0%) | 8 (100.0%) |
| 20 to 34 years | 114 (27.7%) | 298 (72.3%) |
| 35 to 50 years | 12 (27.9%) | 31 (72.1%) |
| Total | 126 (27.2%) | 337 (72.8%) |
Fertility by Education in Hot Springs
Average fertility rate in Hot Springs is 57.0 births per 1,000 women. Women with the education attainment of college or associate's degree have the highest fertility rate of 83.0 births per 1,000 women, while women with the education attainment of bachelor's degree have the lowest fertility at 20.0 births per 1,000 women. Women with the education attainment of college or associate's degree represent 55.3% of all women with births.
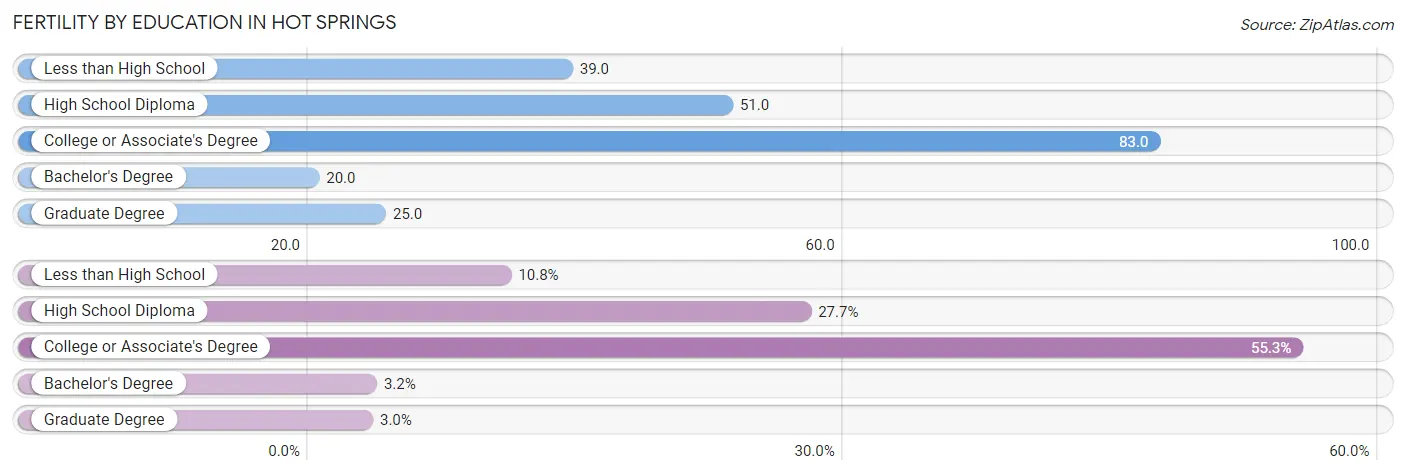
| Educational Attainment | Women with Births | Births / 1,000 Women |
| Less than High School | 50 (10.8%) | 39.0 |
| High School Diploma | 128 (27.7%) | 51.0 |
| College or Associate's Degree | 256 (55.3%) | 83.0 |
| Bachelor's Degree | 15 (3.2%) | 20.0 |
| Graduate Degree | 14 (3.0%) | 25.0 |
| Total | 463 (100.0%) | 57.0 |
Fertility by Education by Marriage Status in Hot Springs
72.8% of women with births in Hot Springs are unmarried. Women with the educational attainment of bachelor's degree are most likely to be married with 100.0% of them married at childbirth, while women with the educational attainment of high school diploma are least likely to be married with 83.6% of them unmarried at childbirth.
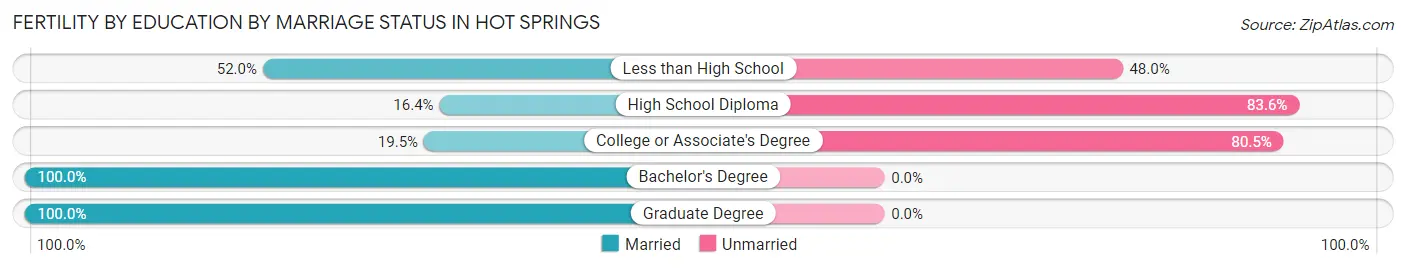
| Educational Attainment | Married | Unmarried |
| Less than High School | 26 (52.0%) | 24 (48.0%) |
| High School Diploma | 21 (16.4%) | 107 (83.6%) |
| College or Associate's Degree | 50 (19.5%) | 206 (80.5%) |
| Bachelor's Degree | 15 (100.0%) | 0 (0.0%) |
| Graduate Degree | 14 (100.0%) | 0 (0.0%) |
| Total | 126 (27.2%) | 337 (72.8%) |
Employment Characteristics in Hot Springs
Employment by Class of Employer in Hot Springs
Among the 15,752 employed individuals in Hot Springs, private company employees (10,771 | 68.4%), self-employed (incorporated) (1,162 | 7.4%), and not-for-profit organizations (1,141 | 7.2%) make up the most common classes of employment.
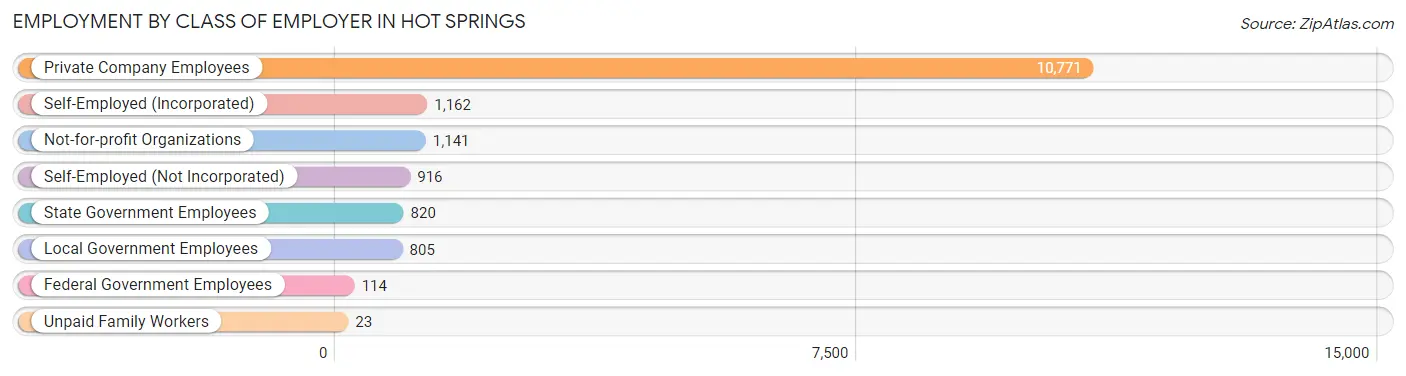
| Employer Class | # Employees | % Employees |
| Private Company Employees | 10,771 | 68.4% |
| Self-Employed (Incorporated) | 1,162 | 7.4% |
| Self-Employed (Not Incorporated) | 916 | 5.8% |
| Not-for-profit Organizations | 1,141 | 7.2% |
| Local Government Employees | 805 | 5.1% |
| State Government Employees | 820 | 5.2% |
| Federal Government Employees | 114 | 0.7% |
| Unpaid Family Workers | 23 | 0.2% |
| Total | 15,752 | 100.0% |
Employment Status by Age in Hot Springs
According to the labor force statistics for Hot Springs, out of the total population over 16 years of age (31,877), 54.5% or 17,373 individuals are in the labor force, with 5.4% or 938 of them unemployed. The age group with the highest labor force participation rate is 30 to 34 years, with 81.7% or 1,914 individuals in the labor force. Within the labor force, the 20 to 24 years age range has the highest percentage of unemployed individuals, with 13.5% or 292 of them being unemployed.
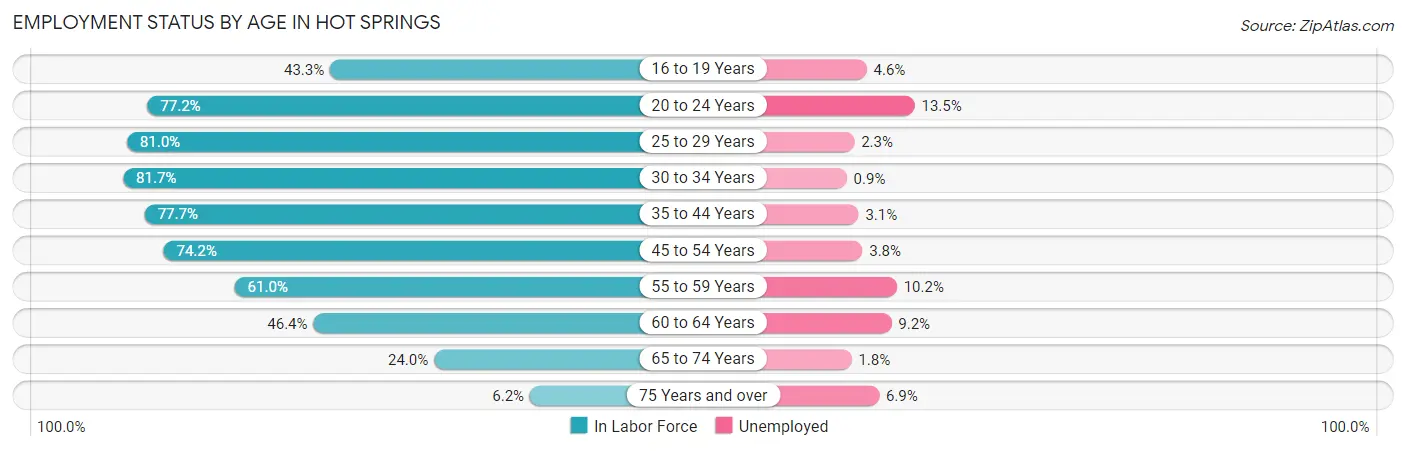
| Age Bracket | In Labor Force | Unemployed |
| 16 to 19 Years | 693 (43.3%) | 32 (4.6%) |
| 20 to 24 Years | 2,162 (77.2%) | 292 (13.5%) |
| 25 to 29 Years | 1,919 (81.0%) | 44 (2.3%) |
| 30 to 34 Years | 1,914 (81.7%) | 17 (0.9%) |
| 35 to 44 Years | 3,048 (77.7%) | 94 (3.1%) |
| 45 to 54 Years | 3,187 (74.2%) | 121 (3.8%) |
| 55 to 59 Years | 1,616 (61.0%) | 165 (10.2%) |
| 60 to 64 Years | 1,512 (46.4%) | 139 (9.2%) |
| 65 to 74 Years | 1,053 (24.0%) | 19 (1.8%) |
| 75 Years and over | 264 (6.2%) | 18 (6.9%) |
| Total | 17,373 (54.5%) | 938 (5.4%) |
Employment Status by Educational Attainment in Hot Springs
According to labor force statistics for Hot Springs, 70.1% of individuals (13,205) out of the total population between 25 and 64 years of age (18,838) are in the labor force, with 4.4% or 581 of them being unemployed. The group with the highest labor force participation rate are those with the educational attainment of bachelor's degree or higher, with 77.6% or 3,617 individuals in the labor force. Within the labor force, individuals with less than high school education have the highest percentage of unemployment, with 6.0% or 73 of them being unemployed.
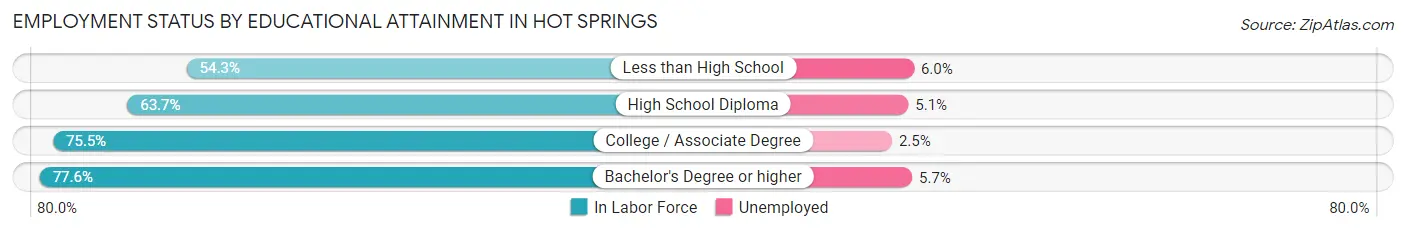
| Educational Attainment | In Labor Force | Unemployed |
| Less than High School | 1,209 (54.3%) | 134 (6.0%) |
| High School Diploma | 3,494 (63.7%) | 280 (5.1%) |
| College / Associate Degree | 4,882 (75.5%) | 162 (2.5%) |
| Bachelor's Degree or higher | 3,617 (77.6%) | 266 (5.7%) |
| Total | 13,205 (70.1%) | 829 (4.4%) |
Employment Occupations by Sex in Hot Springs
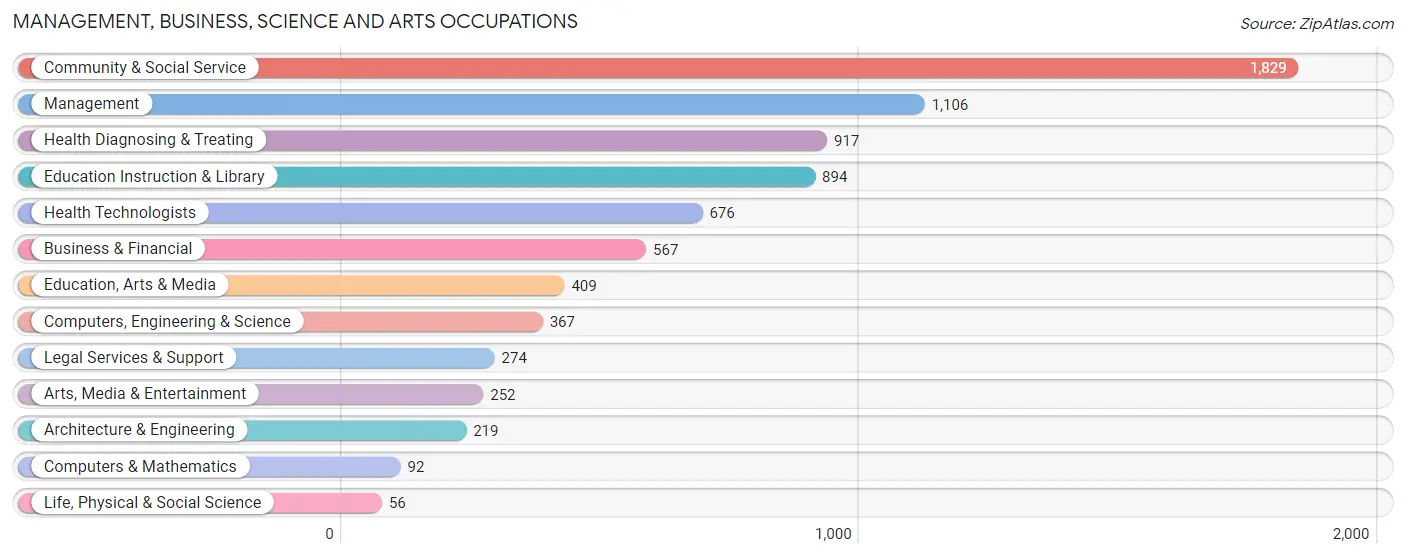
Management, Business, Science and Arts Occupations
The most common Management, Business, Science and Arts occupations in Hot Springs are Community & Social Service (1,829 | 11.1%), Management (1,106 | 6.7%), Health Diagnosing & Treating (917 | 5.6%), Education Instruction & Library (894 | 5.4%), and Health Technologists (676 | 4.1%).
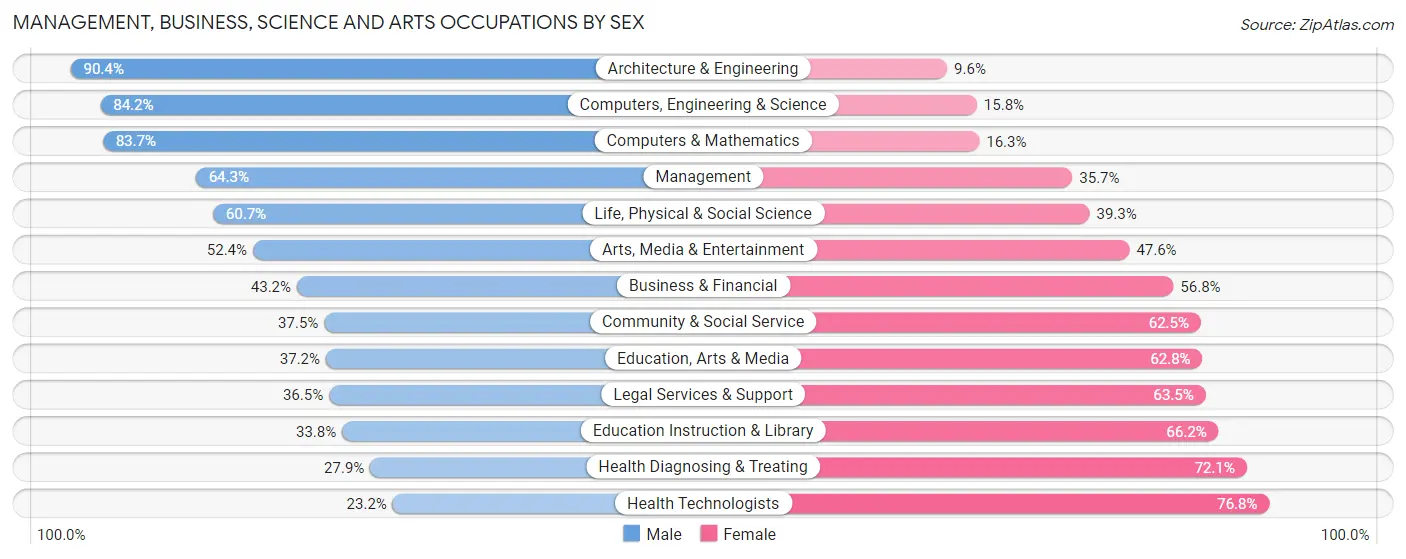
Management, Business, Science and Arts Occupations by Sex
Within the Management, Business, Science and Arts occupations in Hot Springs, the most male-oriented occupations are Architecture & Engineering (90.4%), Computers, Engineering & Science (84.2%), and Computers & Mathematics (83.7%), while the most female-oriented occupations are Health Technologists (76.8%), Health Diagnosing & Treating (72.1%), and Education Instruction & Library (66.2%).
| Occupation | Male | Female |
| Management | 711 (64.3%) | 395 (35.7%) |
| Business & Financial | 245 (43.2%) | 322 (56.8%) |
| Computers, Engineering & Science | 309 (84.2%) | 58 (15.8%) |
| Computers & Mathematics | 77 (83.7%) | 15 (16.3%) |
| Architecture & Engineering | 198 (90.4%) | 21 (9.6%) |
| Life, Physical & Social Science | 34 (60.7%) | 22 (39.3%) |
| Community & Social Service | 686 (37.5%) | 1,143 (62.5%) |
| Education, Arts & Media | 152 (37.2%) | 257 (62.8%) |
| Legal Services & Support | 100 (36.5%) | 174 (63.5%) |
| Education Instruction & Library | 302 (33.8%) | 592 (66.2%) |
| Arts, Media & Entertainment | 132 (52.4%) | 120 (47.6%) |
| Health Diagnosing & Treating | 256 (27.9%) | 661 (72.1%) |
| Health Technologists | 157 (23.2%) | 519 (76.8%) |
| Total (Category) | 2,207 (46.1%) | 2,579 (53.9%) |
| Total (Overall) | 8,096 (49.3%) | 8,332 (50.7%) |
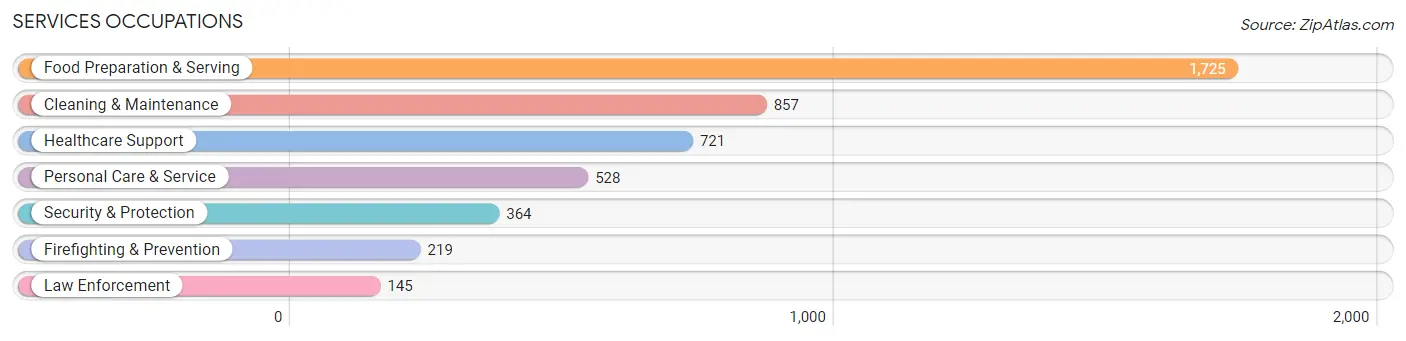
Services Occupations
The most common Services occupations in Hot Springs are Food Preparation & Serving (1,725 | 10.5%), Cleaning & Maintenance (857 | 5.2%), Healthcare Support (721 | 4.4%), Personal Care & Service (528 | 3.2%), and Security & Protection (364 | 2.2%).
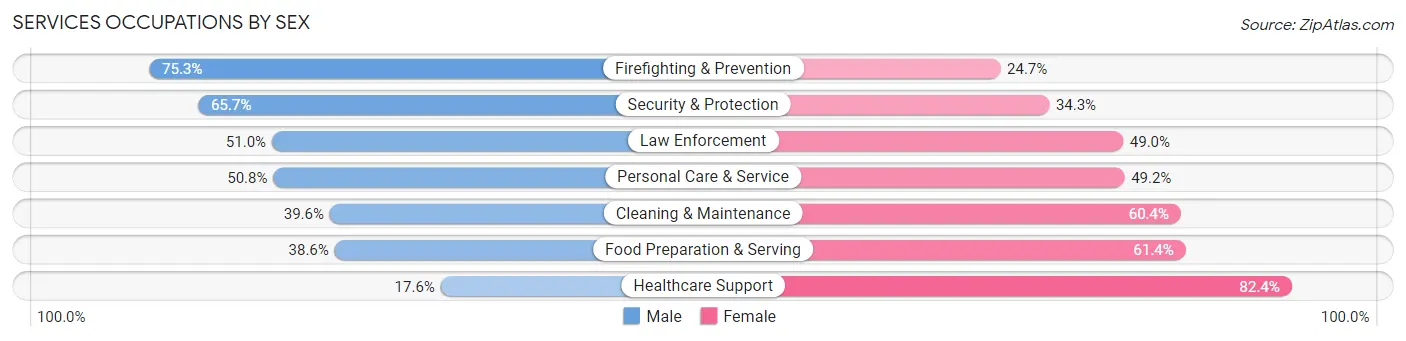
Services Occupations by Sex
Within the Services occupations in Hot Springs, the most male-oriented occupations are Firefighting & Prevention (75.3%), Security & Protection (65.7%), and Law Enforcement (51.0%), while the most female-oriented occupations are Healthcare Support (82.4%), Food Preparation & Serving (61.4%), and Cleaning & Maintenance (60.4%).
| Occupation | Male | Female |
| Healthcare Support | 127 (17.6%) | 594 (82.4%) |
| Security & Protection | 239 (65.7%) | 125 (34.3%) |
| Firefighting & Prevention | 165 (75.3%) | 54 (24.7%) |
| Law Enforcement | 74 (51.0%) | 71 (49.0%) |
| Food Preparation & Serving | 666 (38.6%) | 1,059 (61.4%) |
| Cleaning & Maintenance | 339 (39.6%) | 518 (60.4%) |
| Personal Care & Service | 268 (50.8%) | 260 (49.2%) |
| Total (Category) | 1,639 (39.1%) | 2,556 (60.9%) |
| Total (Overall) | 8,096 (49.3%) | 8,332 (50.7%) |
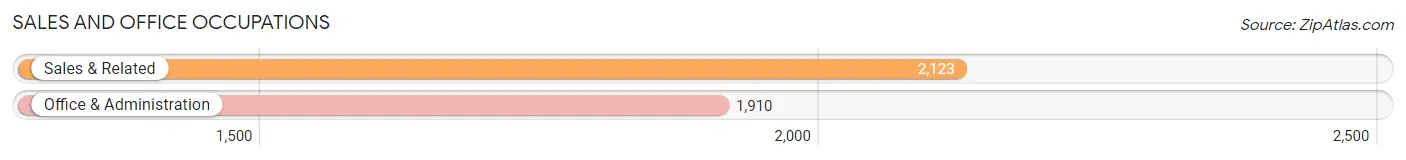
Sales and Office Occupations
The most common Sales and Office occupations in Hot Springs are Sales & Related (2,123 | 12.9%), and Office & Administration (1,910 | 11.6%).
Sales and Office Occupations by Sex
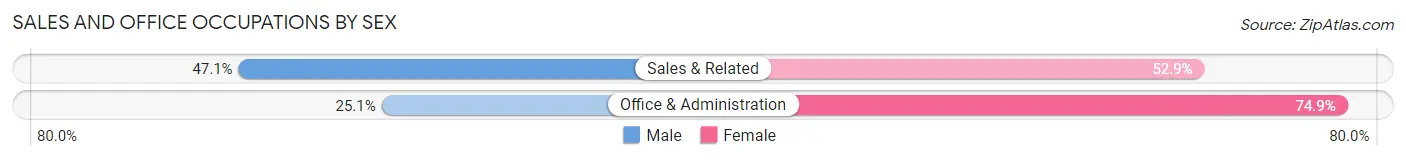
| Occupation | Male | Female |
| Sales & Related | 1,000 (47.1%) | 1,123 (52.9%) |
| Office & Administration | 479 (25.1%) | 1,431 (74.9%) |
| Total (Category) | 1,479 (36.7%) | 2,554 (63.3%) |
| Total (Overall) | 8,096 (49.3%) | 8,332 (50.7%) |
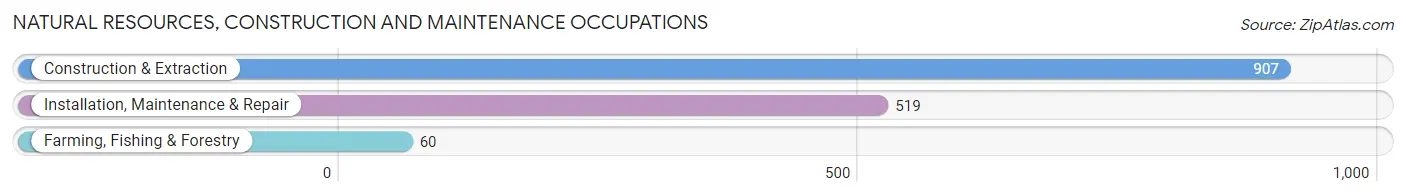
Natural Resources, Construction and Maintenance Occupations
The most common Natural Resources, Construction and Maintenance occupations in Hot Springs are Construction & Extraction (907 | 5.5%), Installation, Maintenance & Repair (519 | 3.2%), and Farming, Fishing & Forestry (60 | 0.4%).
Natural Resources, Construction and Maintenance Occupations by Sex
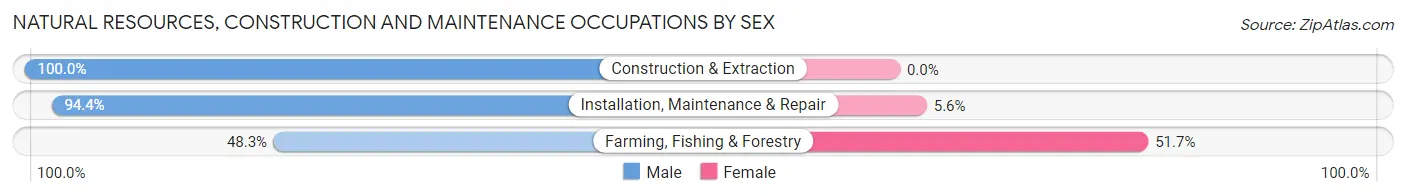
| Occupation | Male | Female |
| Farming, Fishing & Forestry | 29 (48.3%) | 31 (51.7%) |
| Construction & Extraction | 907 (100.0%) | 0 (0.0%) |
| Installation, Maintenance & Repair | 490 (94.4%) | 29 (5.6%) |
| Total (Category) | 1,426 (96.0%) | 60 (4.0%) |
| Total (Overall) | 8,096 (49.3%) | 8,332 (50.7%) |
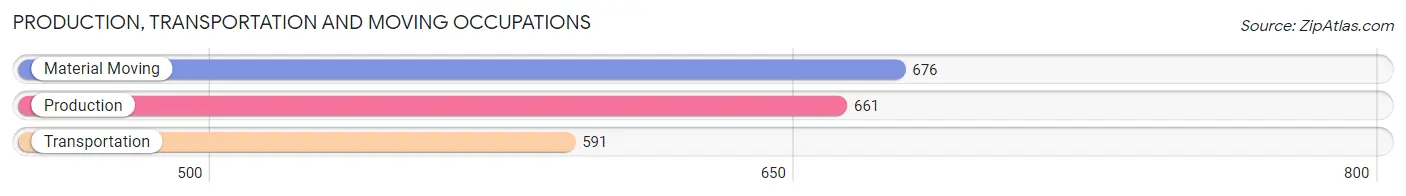
Production, Transportation and Moving Occupations
The most common Production, Transportation and Moving occupations in Hot Springs are Material Moving (676 | 4.1%), Production (661 | 4.0%), and Transportation (591 | 3.6%).
Production, Transportation and Moving Occupations by Sex
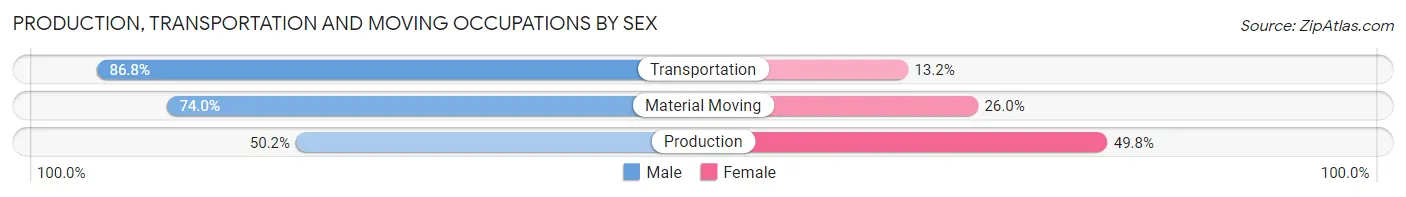
| Occupation | Male | Female |
| Production | 332 (50.2%) | 329 (49.8%) |
| Transportation | 513 (86.8%) | 78 (13.2%) |
| Material Moving | 500 (74.0%) | 176 (26.0%) |
| Total (Category) | 1,345 (69.8%) | 583 (30.2%) |
| Total (Overall) | 8,096 (49.3%) | 8,332 (50.7%) |
Employment Industries by Sex in Hot Springs
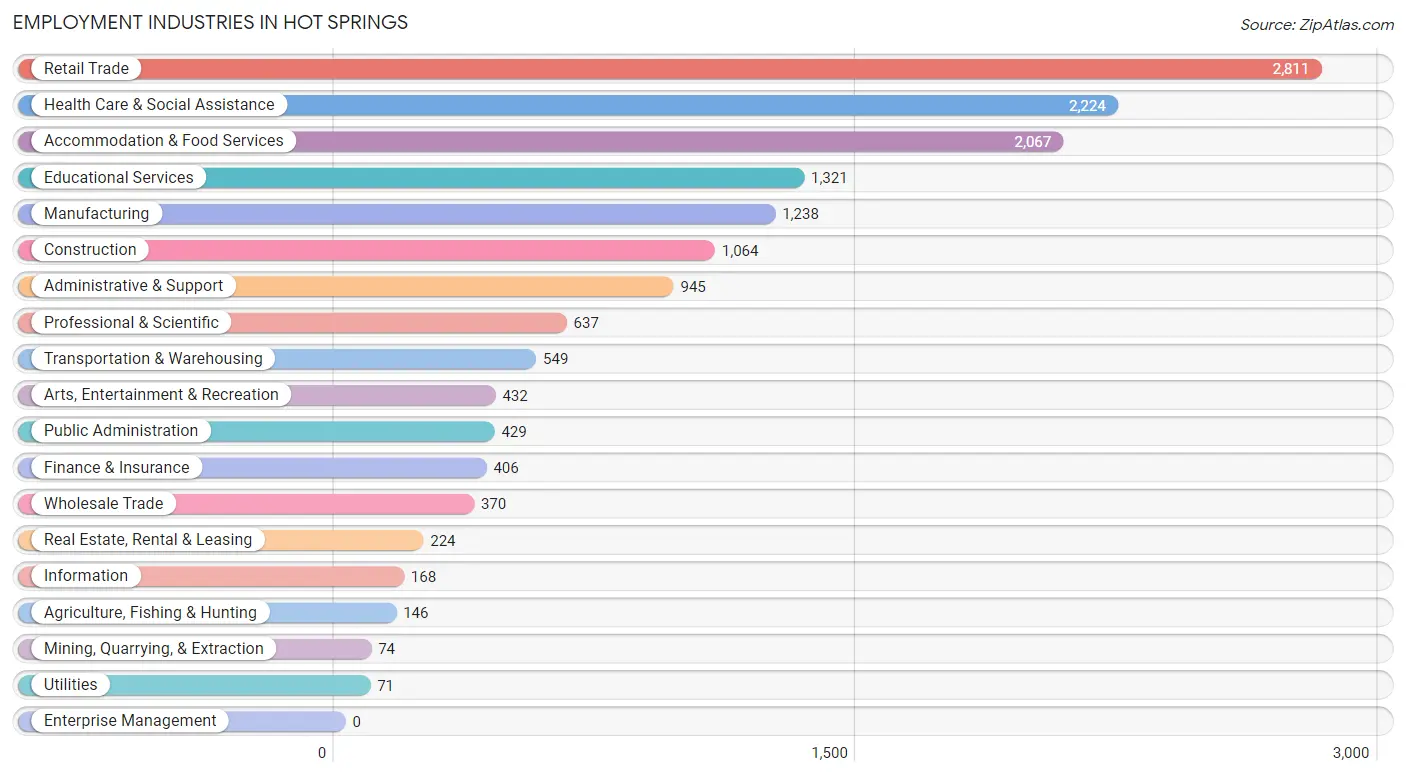
Employment Industries in Hot Springs
The major employment industries in Hot Springs include Retail Trade (2,811 | 17.1%), Health Care & Social Assistance (2,224 | 13.5%), Accommodation & Food Services (2,067 | 12.6%), Educational Services (1,321 | 8.0%), and Manufacturing (1,238 | 7.5%).
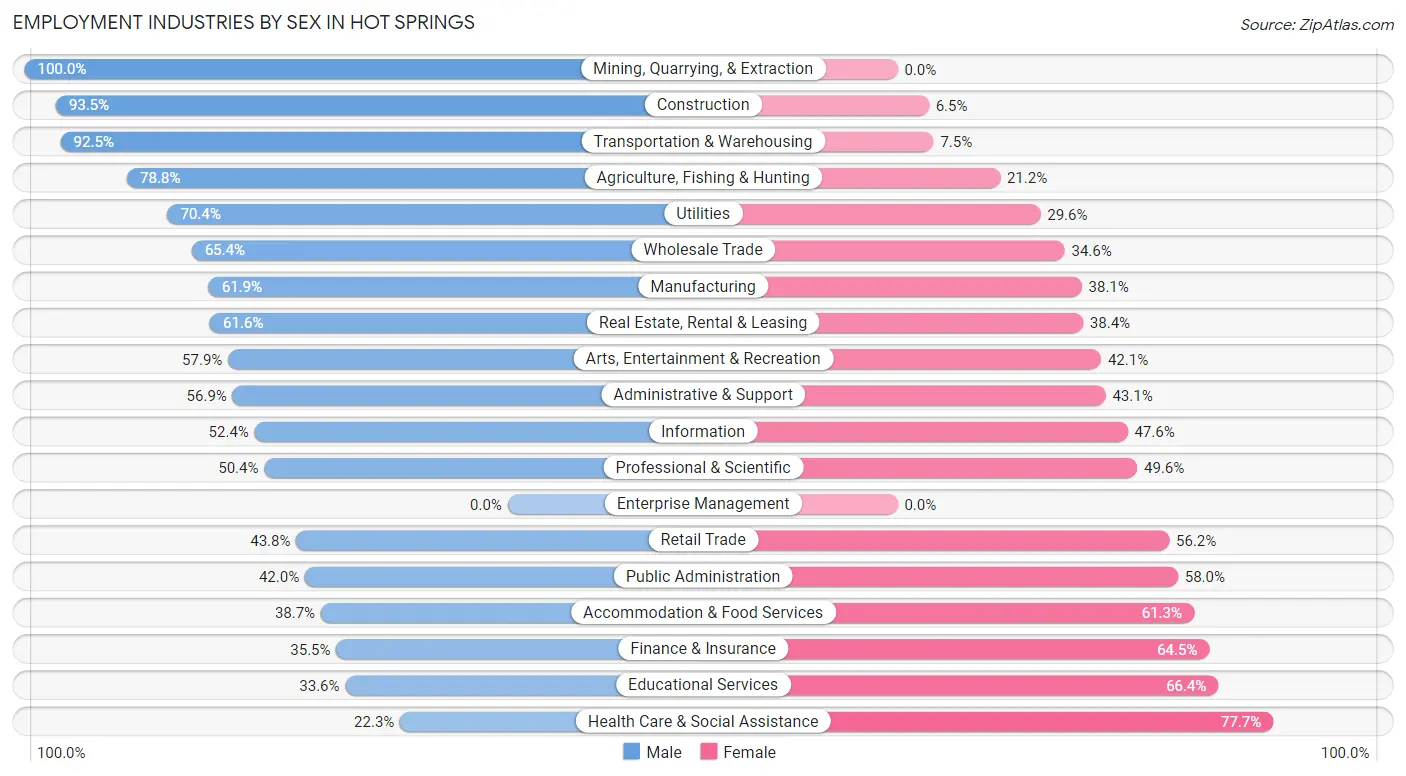
Employment Industries by Sex in Hot Springs
The Hot Springs industries that see more men than women are Mining, Quarrying, & Extraction (100.0%), Construction (93.5%), and Transportation & Warehousing (92.5%), whereas the industries that tend to have a higher number of women are Health Care & Social Assistance (77.7%), Educational Services (66.4%), and Finance & Insurance (64.5%).
| Industry | Male | Female |
| Agriculture, Fishing & Hunting | 115 (78.8%) | 31 (21.2%) |
| Mining, Quarrying, & Extraction | 74 (100.0%) | 0 (0.0%) |
| Construction | 995 (93.5%) | 69 (6.5%) |
| Manufacturing | 766 (61.9%) | 472 (38.1%) |
| Wholesale Trade | 242 (65.4%) | 128 (34.6%) |
| Retail Trade | 1,230 (43.8%) | 1,581 (56.2%) |
| Transportation & Warehousing | 508 (92.5%) | 41 (7.5%) |
| Utilities | 50 (70.4%) | 21 (29.6%) |
| Information | 88 (52.4%) | 80 (47.6%) |
| Finance & Insurance | 144 (35.5%) | 262 (64.5%) |
| Real Estate, Rental & Leasing | 138 (61.6%) | 86 (38.4%) |
| Professional & Scientific | 321 (50.4%) | 316 (49.6%) |
| Enterprise Management | 0 (0.0%) | 0 (0.0%) |
| Administrative & Support | 538 (56.9%) | 407 (43.1%) |
| Educational Services | 444 (33.6%) | 877 (66.4%) |
| Health Care & Social Assistance | 495 (22.3%) | 1,729 (77.7%) |
| Arts, Entertainment & Recreation | 250 (57.9%) | 182 (42.1%) |
| Accommodation & Food Services | 799 (38.7%) | 1,268 (61.3%) |
| Public Administration | 180 (42.0%) | 249 (58.0%) |
| Total | 8,096 (49.3%) | 8,332 (50.7%) |
Education in Hot Springs
School Enrollment in Hot Springs
The most common levels of schooling among the 6,529 students in Hot Springs are high school (1,464 | 22.4%), elementary school (1,449 | 22.2%), and middle school (1,328 | 20.3%).
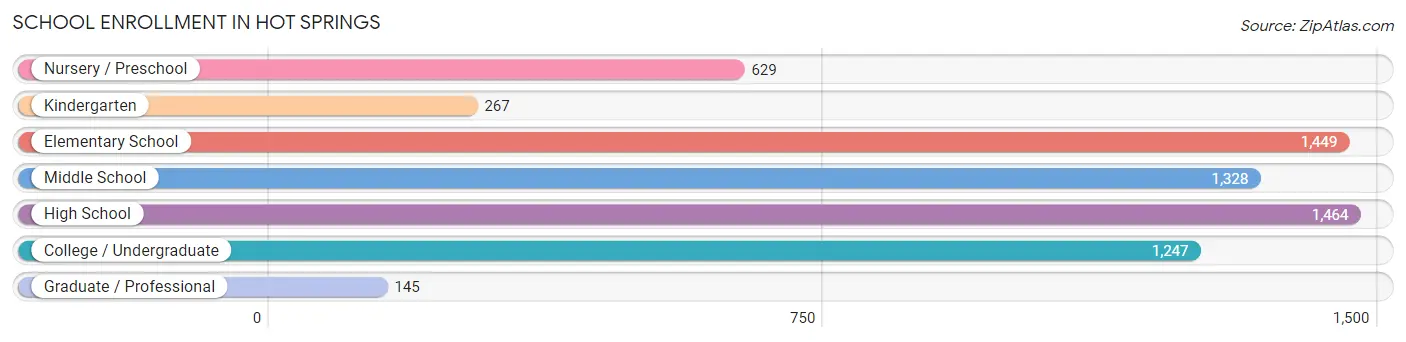
| School Level | # Students | % Students |
| Nursery / Preschool | 629 | 9.6% |
| Kindergarten | 267 | 4.1% |
| Elementary School | 1,449 | 22.2% |
| Middle School | 1,328 | 20.3% |
| High School | 1,464 | 22.4% |
| College / Undergraduate | 1,247 | 19.1% |
| Graduate / Professional | 145 | 2.2% |
| Total | 6,529 | 100.0% |
School Enrollment by Age by Funding Source in Hot Springs
Out of a total of 6,529 students who are enrolled in schools in Hot Springs, 718 (11.0%) attend a private institution, while the remaining 5,811 (89.0%) are enrolled in public schools. The age group of 18 to 19 year olds has the highest likelihood of being enrolled in private schools, with 106 (22.3% in the age bracket) enrolled. Conversely, the age group of 10 to 14 year olds has the lowest likelihood of being enrolled in a private school, with 1,517 (96.2% in the age bracket) attending a public institution.
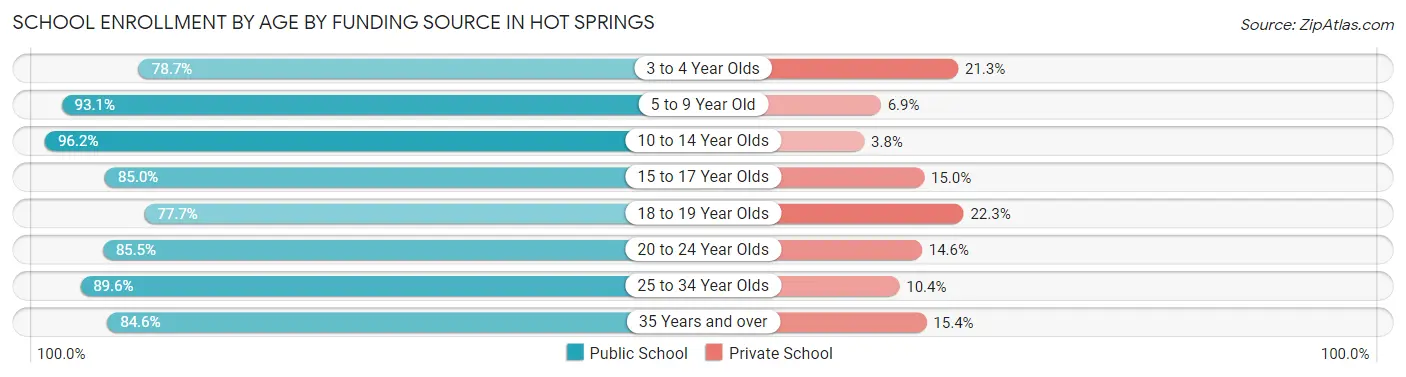
| Age Bracket | Public School | Private School |
| 3 to 4 Year Olds | 399 (78.7%) | 108 (21.3%) |
| 5 to 9 Year Old | 1,551 (93.1%) | 115 (6.9%) |
| 10 to 14 Year Olds | 1,517 (96.2%) | 60 (3.8%) |
| 15 to 17 Year Olds | 903 (85.0%) | 159 (15.0%) |
| 18 to 19 Year Olds | 369 (77.7%) | 106 (22.3%) |
| 20 to 24 Year Olds | 517 (85.5%) | 88 (14.5%) |
| 25 to 34 Year Olds | 251 (89.6%) | 29 (10.4%) |
| 35 Years and over | 302 (84.6%) | 55 (15.4%) |
| Total | 5,811 (89.0%) | 718 (11.0%) |
Educational Attainment by Field of Study in Hot Springs
Education (1,691 | 23.1%), business (1,573 | 21.5%), science & technology (701 | 9.6%), social sciences (610 | 8.3%), and psychology (343 | 4.7%) are the most common fields of study among 7,324 individuals in Hot Springs who have obtained a bachelor's degree or higher.
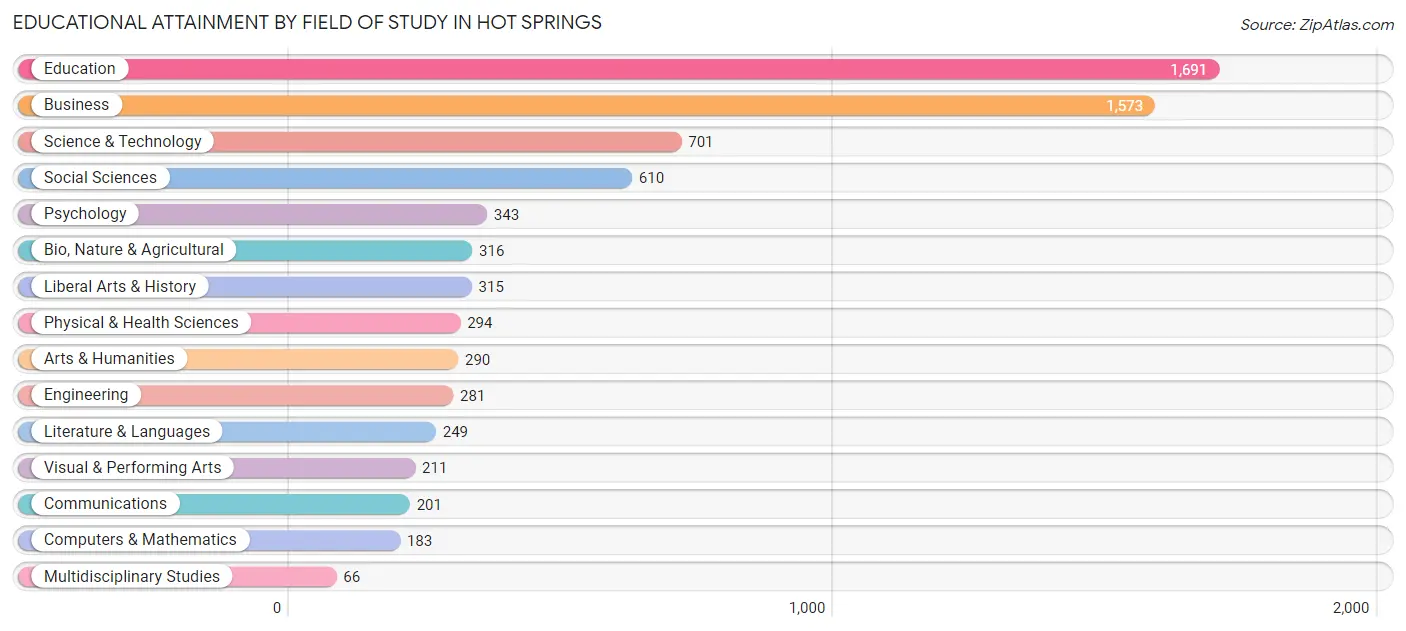
| Field of Study | # Graduates | % Graduates |
| Computers & Mathematics | 183 | 2.5% |
| Bio, Nature & Agricultural | 316 | 4.3% |
| Physical & Health Sciences | 294 | 4.0% |
| Psychology | 343 | 4.7% |
| Social Sciences | 610 | 8.3% |
| Engineering | 281 | 3.8% |
| Multidisciplinary Studies | 66 | 0.9% |
| Science & Technology | 701 | 9.6% |
| Business | 1,573 | 21.5% |
| Education | 1,691 | 23.1% |
| Literature & Languages | 249 | 3.4% |
| Liberal Arts & History | 315 | 4.3% |
| Visual & Performing Arts | 211 | 2.9% |
| Communications | 201 | 2.7% |
| Arts & Humanities | 290 | 4.0% |
| Total | 7,324 | 100.0% |
Transportation & Commute in Hot Springs
Vehicle Availability by Sex in Hot Springs
The most prevalent vehicle ownership categories in Hot Springs are males with 2 vehicles (3,019, accounting for 38.9%) and females with 2 vehicles (2,865, making up 38.5%).
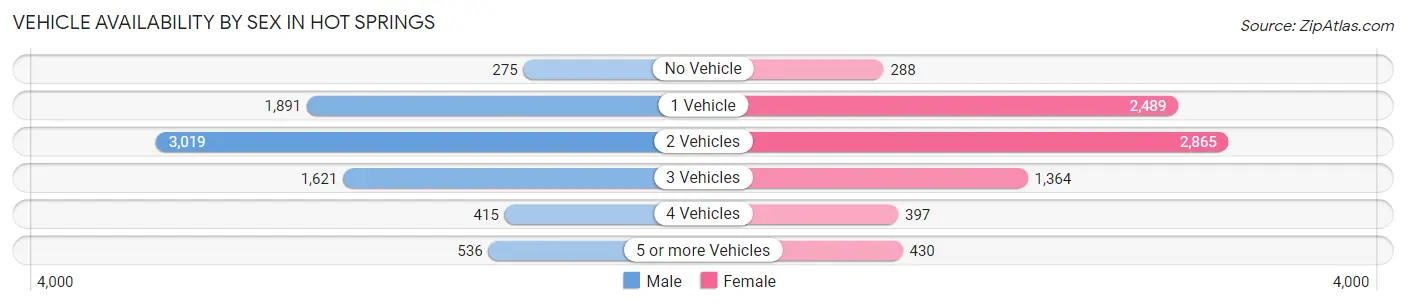
| Vehicles Available | Male | Female |
| No Vehicle | 275 (3.5%) | 288 (3.7%) |
| 1 Vehicle | 1,891 (24.4%) | 2,489 (31.8%) |
| 2 Vehicles | 3,019 (38.9%) | 2,865 (36.6%) |
| 3 Vehicles | 1,621 (20.9%) | 1,364 (17.4%) |
| 4 Vehicles | 415 (5.3%) | 397 (5.1%) |
| 5 or more Vehicles | 536 (6.9%) | 430 (5.5%) |
| Total | 7,757 (100.0%) | 7,833 (100.0%) |
Commute Time in Hot Springs
The most frequently occuring commute durations in Hot Springs are 10 to 14 minutes (3,577 commuters, 23.7%), 15 to 19 minutes (3,269 commuters, 21.7%), and 5 to 9 minutes (3,152 commuters, 20.9%).
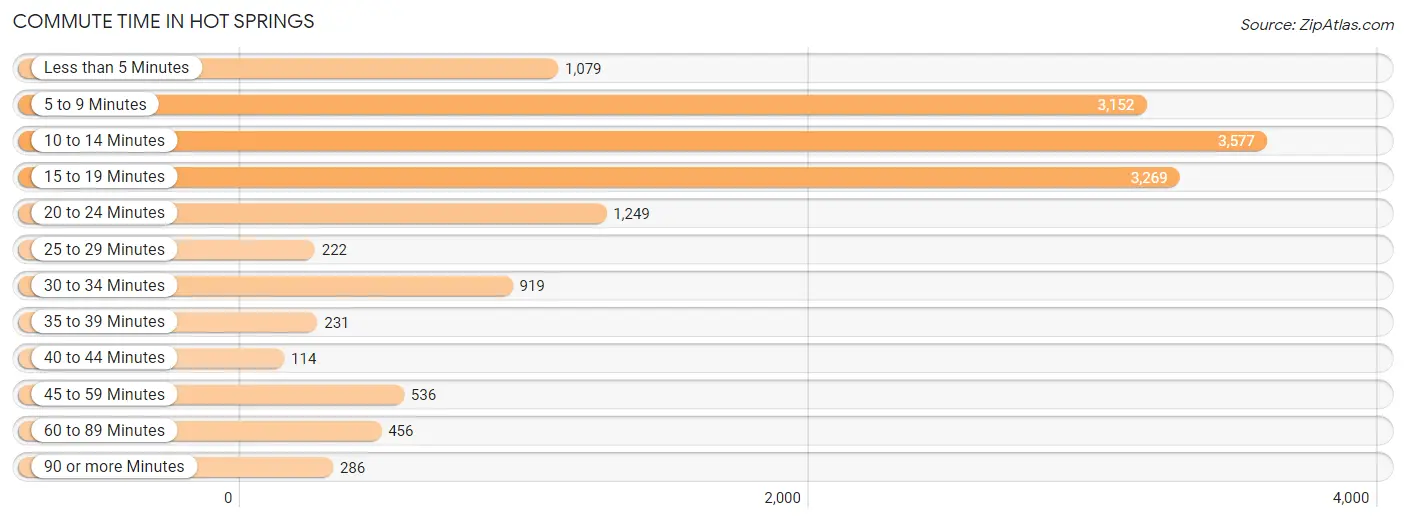
| Commute Time | # Commuters | % Commuters |
| Less than 5 Minutes | 1,079 | 7.1% |
| 5 to 9 Minutes | 3,152 | 20.9% |
| 10 to 14 Minutes | 3,577 | 23.7% |
| 15 to 19 Minutes | 3,269 | 21.7% |
| 20 to 24 Minutes | 1,249 | 8.3% |
| 25 to 29 Minutes | 222 | 1.5% |
| 30 to 34 Minutes | 919 | 6.1% |
| 35 to 39 Minutes | 231 | 1.5% |
| 40 to 44 Minutes | 114 | 0.8% |
| 45 to 59 Minutes | 536 | 3.5% |
| 60 to 89 Minutes | 456 | 3.0% |
| 90 or more Minutes | 286 | 1.9% |
Commute Time by Sex in Hot Springs
The most common commute times in Hot Springs are 10 to 14 minutes (1,688 commuters, 22.2%) for males and 10 to 14 minutes (1,889 commuters, 25.3%) for females.
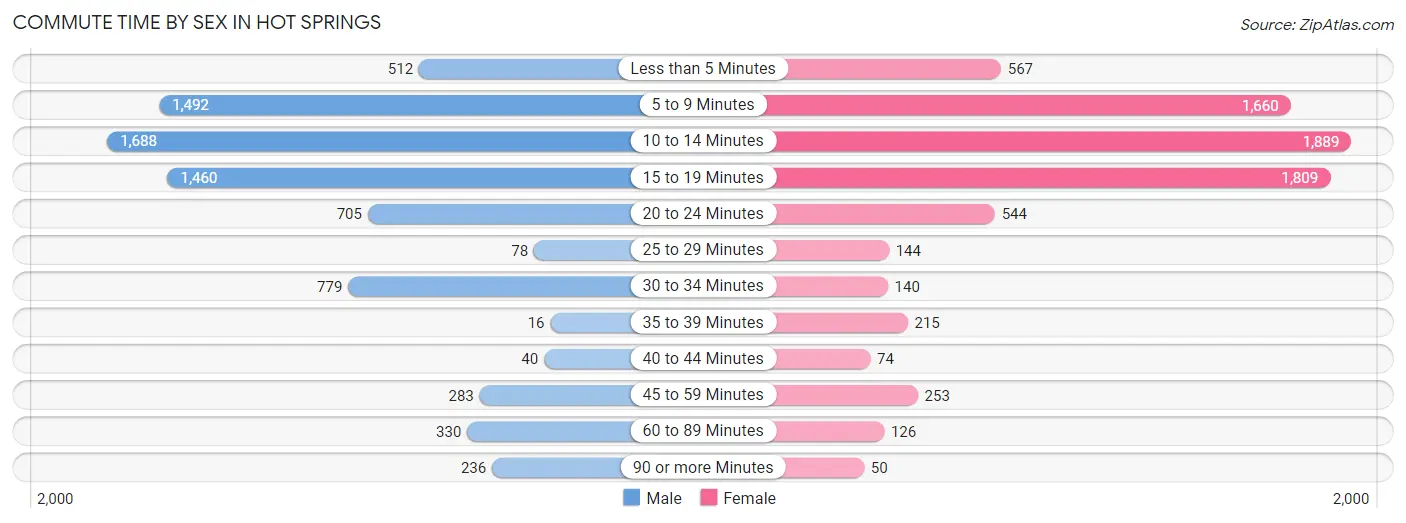
| Commute Time | Male | Female |
| Less than 5 Minutes | 512 (6.7%) | 567 (7.6%) |
| 5 to 9 Minutes | 1,492 (19.6%) | 1,660 (22.2%) |
| 10 to 14 Minutes | 1,688 (22.2%) | 1,889 (25.3%) |
| 15 to 19 Minutes | 1,460 (19.2%) | 1,809 (24.2%) |
| 20 to 24 Minutes | 705 (9.2%) | 544 (7.3%) |
| 25 to 29 Minutes | 78 (1.0%) | 144 (1.9%) |
| 30 to 34 Minutes | 779 (10.2%) | 140 (1.9%) |
| 35 to 39 Minutes | 16 (0.2%) | 215 (2.9%) |
| 40 to 44 Minutes | 40 (0.5%) | 74 (1.0%) |
| 45 to 59 Minutes | 283 (3.7%) | 253 (3.4%) |
| 60 to 89 Minutes | 330 (4.3%) | 126 (1.7%) |
| 90 or more Minutes | 236 (3.1%) | 50 (0.7%) |
Time of Departure to Work by Sex in Hot Springs
The most frequent times of departure to work in Hot Springs are 7:30 AM to 7:59 AM (1,072, 14.1%) for males and 7:30 AM to 7:59 AM (1,459, 19.5%) for females.
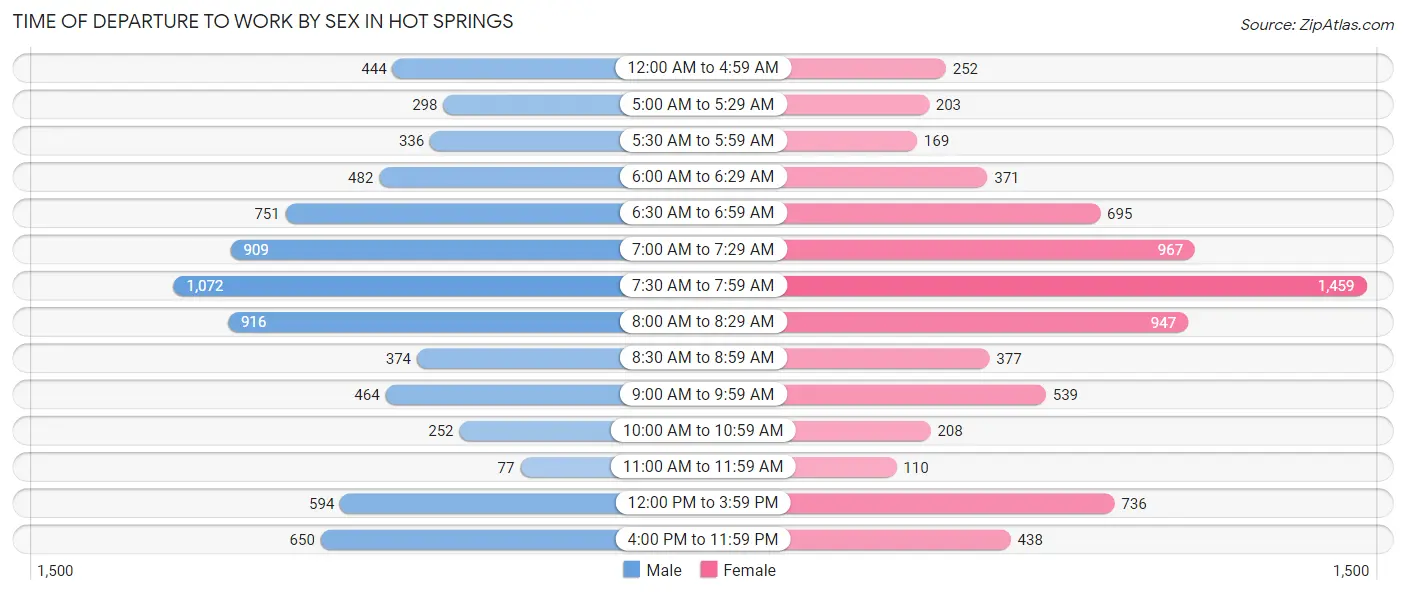
| Time of Departure | Male | Female |
| 12:00 AM to 4:59 AM | 444 (5.8%) | 252 (3.4%) |
| 5:00 AM to 5:29 AM | 298 (3.9%) | 203 (2.7%) |
| 5:30 AM to 5:59 AM | 336 (4.4%) | 169 (2.3%) |
| 6:00 AM to 6:29 AM | 482 (6.3%) | 371 (5.0%) |
| 6:30 AM to 6:59 AM | 751 (9.9%) | 695 (9.3%) |
| 7:00 AM to 7:29 AM | 909 (11.9%) | 967 (12.9%) |
| 7:30 AM to 7:59 AM | 1,072 (14.1%) | 1,459 (19.5%) |
| 8:00 AM to 8:29 AM | 916 (12.0%) | 947 (12.7%) |
| 8:30 AM to 8:59 AM | 374 (4.9%) | 377 (5.1%) |
| 9:00 AM to 9:59 AM | 464 (6.1%) | 539 (7.2%) |
| 10:00 AM to 10:59 AM | 252 (3.3%) | 208 (2.8%) |
| 11:00 AM to 11:59 AM | 77 (1.0%) | 110 (1.5%) |
| 12:00 PM to 3:59 PM | 594 (7.8%) | 736 (9.9%) |
| 4:00 PM to 11:59 PM | 650 (8.5%) | 438 (5.9%) |
| Total | 7,619 (100.0%) | 7,471 (100.0%) |
Housing Occupancy in Hot Springs
Occupancy by Ownership in Hot Springs
Of the total 17,402 dwellings in Hot Springs, owner-occupied units account for 9,681 (55.6%), while renter-occupied units make up 7,721 (44.4%).
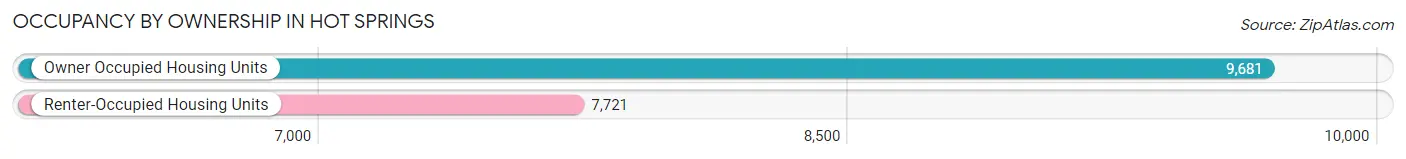
| Occupancy | # Housing Units | % Housing Units |
| Owner Occupied Housing Units | 9,681 | 55.6% |
| Renter-Occupied Housing Units | 7,721 | 44.4% |
| Total Occupied Housing Units | 17,402 | 100.0% |
Occupancy by Household Size in Hot Springs
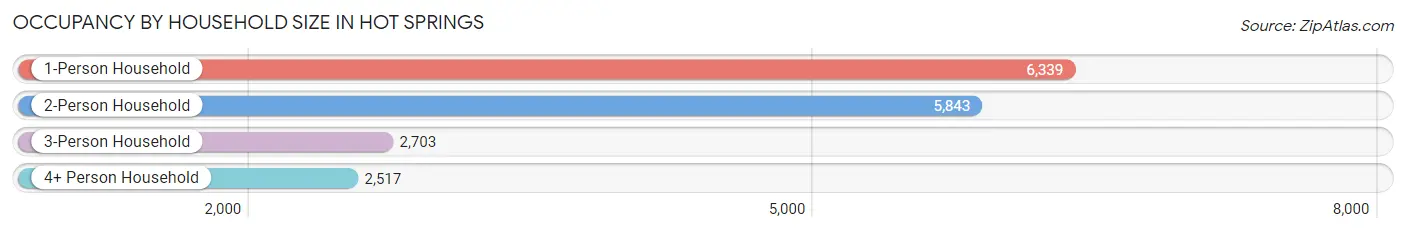
| Household Size | # Housing Units | % Housing Units |
| 1-Person Household | 6,339 | 36.4% |
| 2-Person Household | 5,843 | 33.6% |
| 3-Person Household | 2,703 | 15.5% |
| 4+ Person Household | 2,517 | 14.5% |
| Total Housing Units | 17,402 | 100.0% |
Occupancy by Ownership by Household Size in Hot Springs
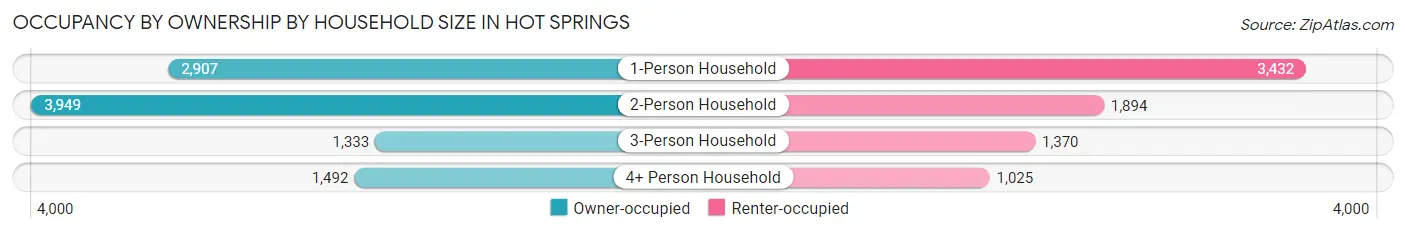
| Household Size | Owner-occupied | Renter-occupied |
| 1-Person Household | 2,907 (45.9%) | 3,432 (54.1%) |
| 2-Person Household | 3,949 (67.6%) | 1,894 (32.4%) |
| 3-Person Household | 1,333 (49.3%) | 1,370 (50.7%) |
| 4+ Person Household | 1,492 (59.3%) | 1,025 (40.7%) |
| Total Housing Units | 9,681 (55.6%) | 7,721 (44.4%) |
Occupancy by Educational Attainment in Hot Springs
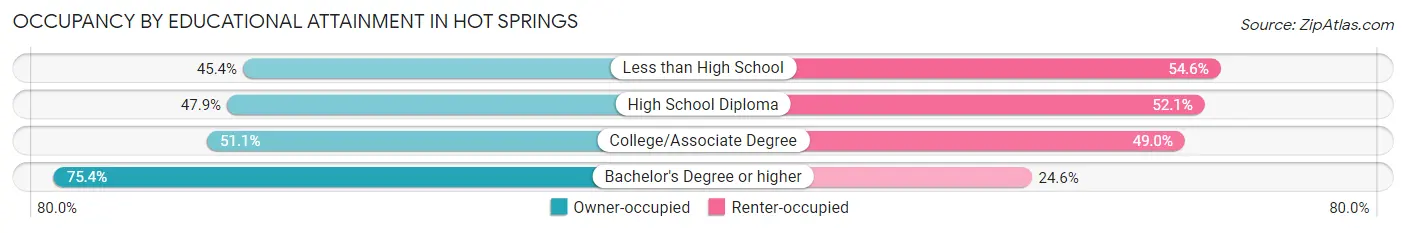
| Household Size | Owner-occupied | Renter-occupied |
| Less than High School | 898 (45.4%) | 1,081 (54.6%) |
| High School Diploma | 2,049 (47.9%) | 2,228 (52.1%) |
| College/Associate Degree | 3,498 (51.0%) | 3,354 (48.9%) |
| Bachelor's Degree or higher | 3,236 (75.4%) | 1,058 (24.6%) |
Occupancy by Age of Householder in Hot Springs
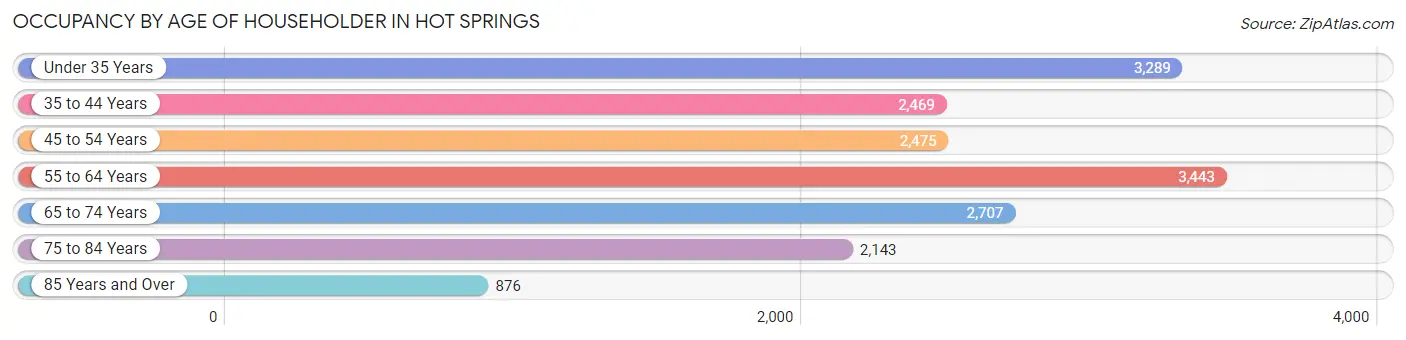
| Age Bracket | # Households | % Households |
| Under 35 Years | 3,289 | 18.9% |
| 35 to 44 Years | 2,469 | 14.2% |
| 45 to 54 Years | 2,475 | 14.2% |
| 55 to 64 Years | 3,443 | 19.8% |
| 65 to 74 Years | 2,707 | 15.6% |
| 75 to 84 Years | 2,143 | 12.3% |
| 85 Years and Over | 876 | 5.0% |
| Total | 17,402 | 100.0% |
Housing Finances in Hot Springs
Median Income by Occupancy in Hot Springs
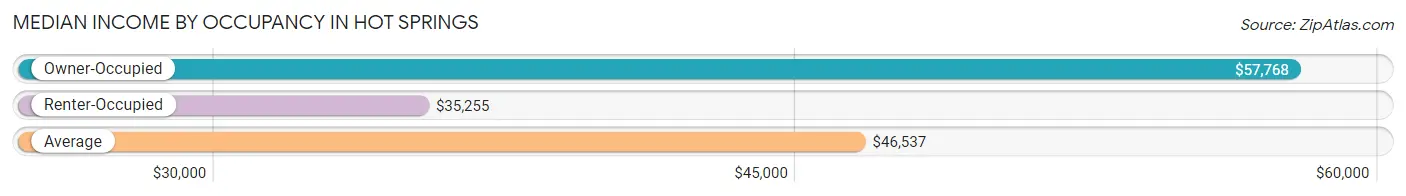
| Occupancy Type | # Households | Median Income |
| Owner-Occupied | 9,681 (55.6%) | $57,768 |
| Renter-Occupied | 7,721 (44.4%) | $35,255 |
| Average | 17,402 (100.0%) | $46,537 |
Occupancy by Householder Income Bracket in Hot Springs
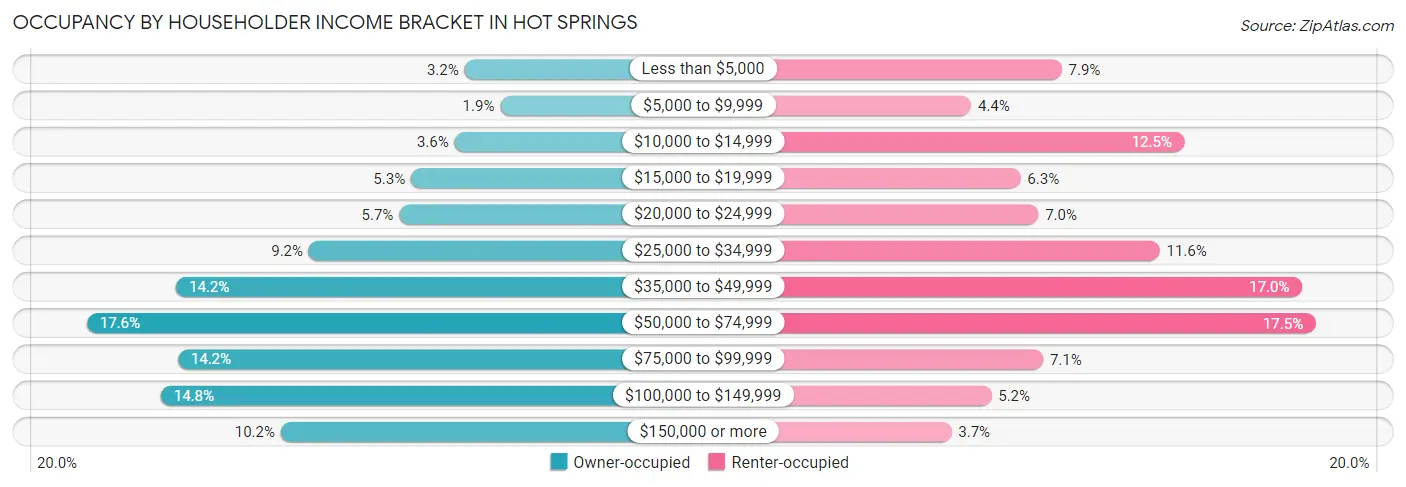
| Income Bracket | Owner-occupied | Renter-occupied |
| Less than $5,000 | 314 (3.2%) | 606 (7.9%) |
| $5,000 to $9,999 | 182 (1.9%) | 340 (4.4%) |
| $10,000 to $14,999 | 350 (3.6%) | 965 (12.5%) |
| $15,000 to $19,999 | 511 (5.3%) | 485 (6.3%) |
| $20,000 to $24,999 | 555 (5.7%) | 537 (7.0%) |
| $25,000 to $34,999 | 888 (9.2%) | 894 (11.6%) |
| $35,000 to $49,999 | 1,378 (14.2%) | 1,311 (17.0%) |
| $50,000 to $74,999 | 1,707 (17.6%) | 1,351 (17.5%) |
| $75,000 to $99,999 | 1,371 (14.2%) | 551 (7.1%) |
| $100,000 to $149,999 | 1,434 (14.8%) | 399 (5.2%) |
| $150,000 or more | 991 (10.2%) | 282 (3.6%) |
| Total | 9,681 (100.0%) | 7,721 (100.0%) |
Monthly Housing Cost Tiers in Hot Springs
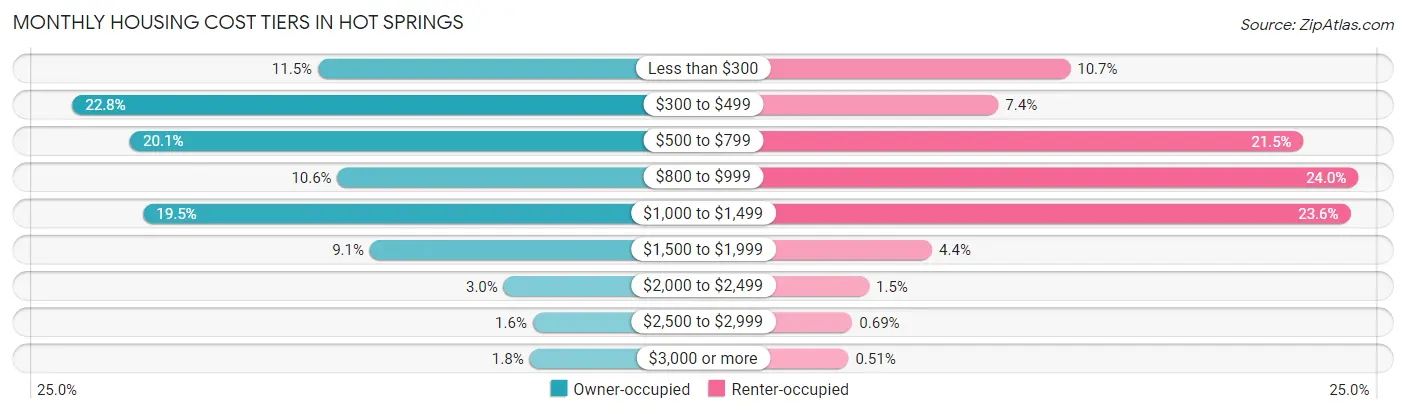
| Monthly Cost | Owner-occupied | Renter-occupied |
| Less than $300 | 1,113 (11.5%) | 828 (10.7%) |
| $300 to $499 | 2,207 (22.8%) | 572 (7.4%) |
| $500 to $799 | 1,950 (20.1%) | 1,656 (21.4%) |
| $800 to $999 | 1,026 (10.6%) | 1,851 (24.0%) |
| $1,000 to $1,499 | 1,891 (19.5%) | 1,823 (23.6%) |
| $1,500 to $1,999 | 882 (9.1%) | 337 (4.4%) |
| $2,000 to $2,499 | 286 (2.9%) | 113 (1.5%) |
| $2,500 to $2,999 | 156 (1.6%) | 53 (0.7%) |
| $3,000 or more | 170 (1.8%) | 39 (0.5%) |
| Total | 9,681 (100.0%) | 7,721 (100.0%) |
Physical Housing Characteristics in Hot Springs
Housing Structures in Hot Springs
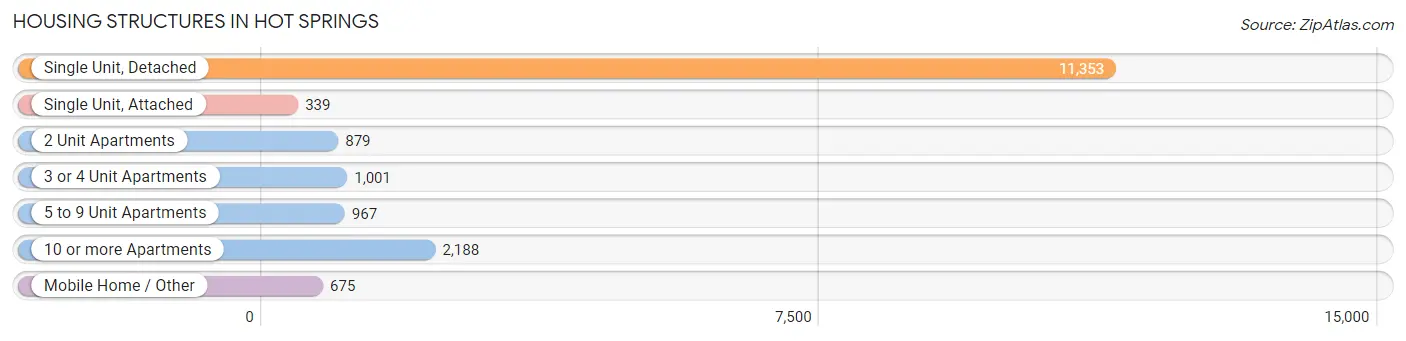
| Structure Type | # Housing Units | % Housing Units |
| Single Unit, Detached | 11,353 | 65.2% |
| Single Unit, Attached | 339 | 1.9% |
| 2 Unit Apartments | 879 | 5.1% |
| 3 or 4 Unit Apartments | 1,001 | 5.8% |
| 5 to 9 Unit Apartments | 967 | 5.6% |
| 10 or more Apartments | 2,188 | 12.6% |
| Mobile Home / Other | 675 | 3.9% |
| Total | 17,402 | 100.0% |
Housing Structures by Occupancy in Hot Springs
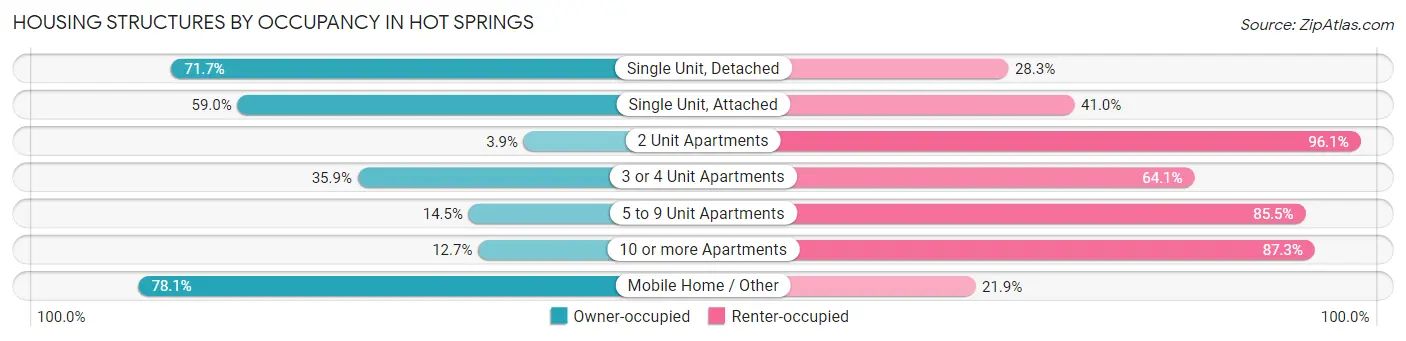
| Structure Type | Owner-occupied | Renter-occupied |
| Single Unit, Detached | 8,144 (71.7%) | 3,209 (28.3%) |
| Single Unit, Attached | 200 (59.0%) | 139 (41.0%) |
| 2 Unit Apartments | 34 (3.9%) | 845 (96.1%) |
| 3 or 4 Unit Apartments | 359 (35.9%) | 642 (64.1%) |
| 5 to 9 Unit Apartments | 140 (14.5%) | 827 (85.5%) |
| 10 or more Apartments | 277 (12.7%) | 1,911 (87.3%) |
| Mobile Home / Other | 527 (78.1%) | 148 (21.9%) |
| Total | 9,681 (55.6%) | 7,721 (44.4%) |
Housing Structures by Number of Rooms in Hot Springs
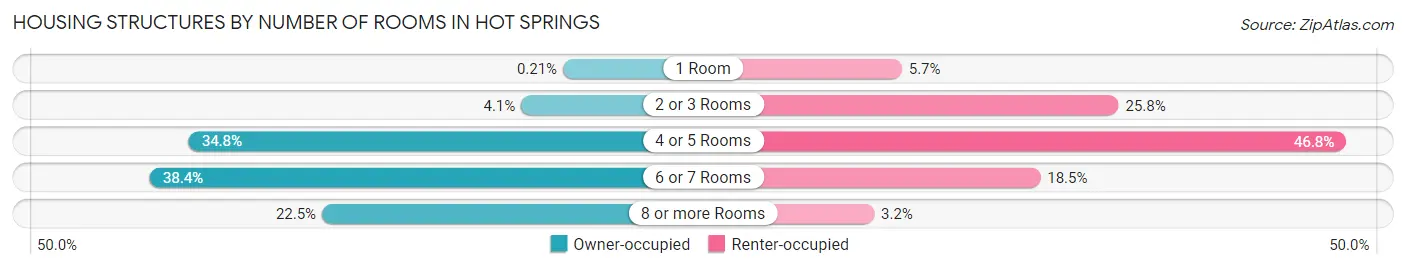
| Number of Rooms | Owner-occupied | Renter-occupied |
| 1 Room | 20 (0.2%) | 442 (5.7%) |
| 2 or 3 Rooms | 395 (4.1%) | 1,990 (25.8%) |
| 4 or 5 Rooms | 3,370 (34.8%) | 3,614 (46.8%) |
| 6 or 7 Rooms | 3,718 (38.4%) | 1,431 (18.5%) |
| 8 or more Rooms | 2,178 (22.5%) | 244 (3.2%) |
| Total | 9,681 (100.0%) | 7,721 (100.0%) |
Housing Structure by Heating Type in Hot Springs
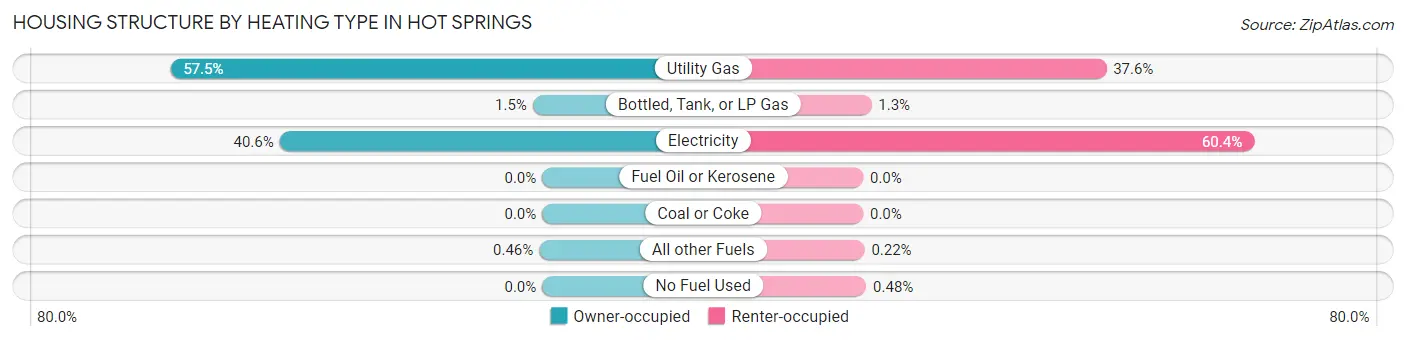
| Heating Type | Owner-occupied | Renter-occupied |
| Utility Gas | 5,566 (57.5%) | 2,902 (37.6%) |
| Bottled, Tank, or LP Gas | 140 (1.5%) | 99 (1.3%) |
| Electricity | 3,930 (40.6%) | 4,666 (60.4%) |
| Fuel Oil or Kerosene | 0 (0.0%) | 0 (0.0%) |
| Coal or Coke | 0 (0.0%) | 0 (0.0%) |
| All other Fuels | 45 (0.5%) | 17 (0.2%) |
| No Fuel Used | 0 (0.0%) | 37 (0.5%) |
| Total | 9,681 (100.0%) | 7,721 (100.0%) |
Household Vehicle Usage in Hot Springs
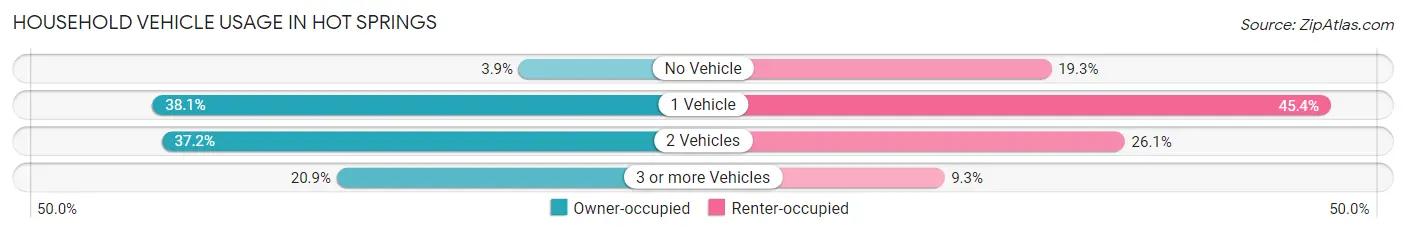
| Vehicles per Household | Owner-occupied | Renter-occupied |
| No Vehicle | 374 (3.9%) | 1,487 (19.3%) |
| 1 Vehicle | 3,686 (38.1%) | 3,502 (45.4%) |
| 2 Vehicles | 3,602 (37.2%) | 2,016 (26.1%) |
| 3 or more Vehicles | 2,019 (20.9%) | 716 (9.3%) |
| Total | 9,681 (100.0%) | 7,721 (100.0%) |
Real Estate & Mortgages in Hot Springs
Real Estate and Mortgage Overview in Hot Springs
| Characteristic | Without Mortgage | With Mortgage |
| Housing Units | 4,490 | 5,191 |
| Median Property Value | $128,200 | $159,600 |
| Median Household Income | $44,508 | $702 |
| Monthly Housing Costs | $393 | $164 |
| Real Estate Taxes | $640 | $230 |
Property Value by Mortgage Status in Hot Springs
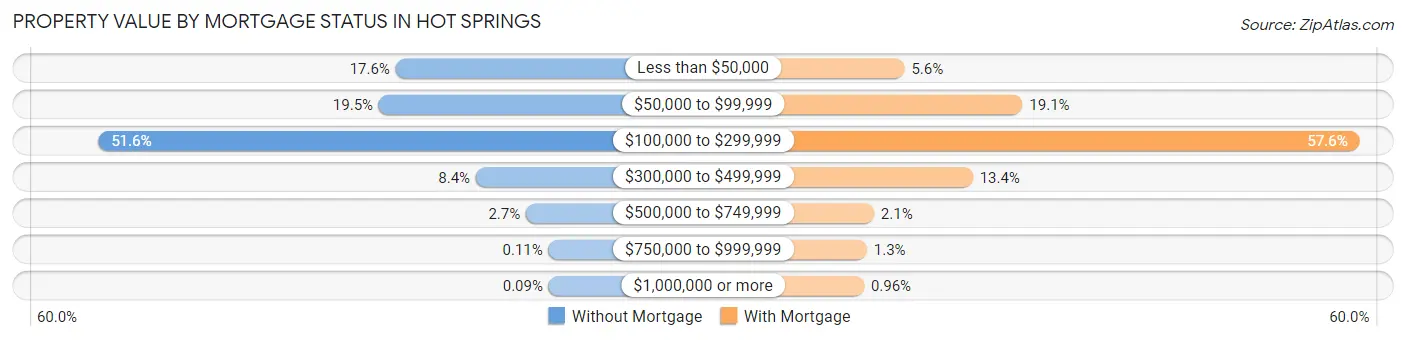
| Property Value | Without Mortgage | With Mortgage |
| Less than $50,000 | 790 (17.6%) | 290 (5.6%) |
| $50,000 to $99,999 | 876 (19.5%) | 990 (19.1%) |
| $100,000 to $299,999 | 2,316 (51.6%) | 2,990 (57.6%) |
| $300,000 to $499,999 | 378 (8.4%) | 695 (13.4%) |
| $500,000 to $749,999 | 121 (2.7%) | 109 (2.1%) |
| $750,000 to $999,999 | 5 (0.1%) | 67 (1.3%) |
| $1,000,000 or more | 4 (0.1%) | 50 (1.0%) |
| Total | 4,490 (100.0%) | 5,191 (100.0%) |
Household Income by Mortgage Status in Hot Springs
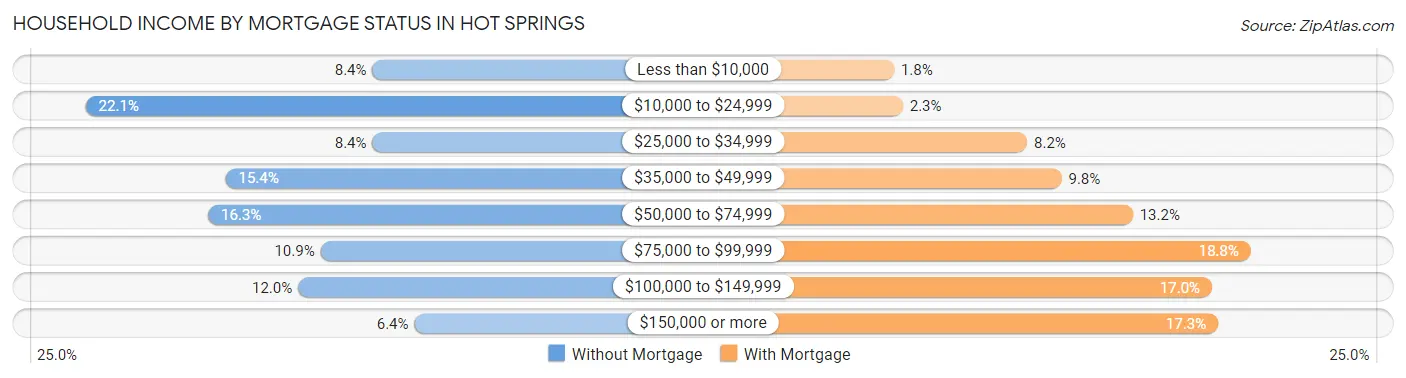
| Household Income | Without Mortgage | With Mortgage |
| Less than $10,000 | 379 (8.4%) | 95 (1.8%) |
| $10,000 to $24,999 | 992 (22.1%) | 117 (2.2%) |
| $25,000 to $34,999 | 379 (8.4%) | 424 (8.2%) |
| $35,000 to $49,999 | 693 (15.4%) | 509 (9.8%) |
| $50,000 to $74,999 | 730 (16.3%) | 685 (13.2%) |
| $75,000 to $99,999 | 490 (10.9%) | 977 (18.8%) |
| $100,000 to $149,999 | 538 (12.0%) | 881 (17.0%) |
| $150,000 or more | 289 (6.4%) | 896 (17.3%) |
| Total | 4,490 (100.0%) | 5,191 (100.0%) |
Property Value to Household Income Ratio in Hot Springs
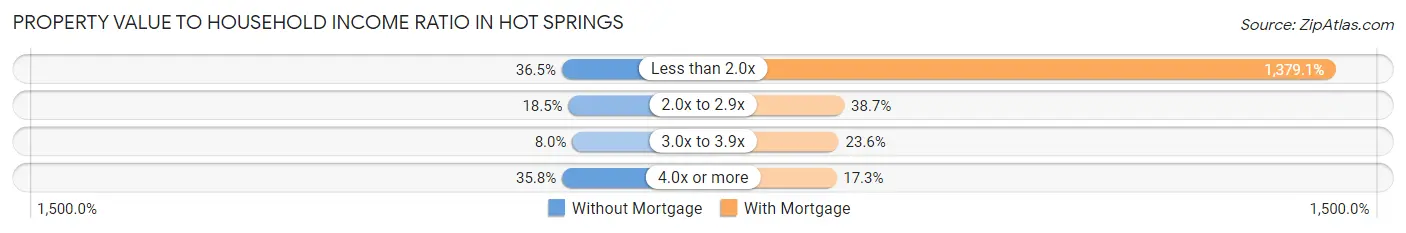
| Value-to-Income Ratio | Without Mortgage | With Mortgage |
| Less than 2.0x | 1,639 (36.5%) | 71,588 (1,379.1%) |
| 2.0x to 2.9x | 830 (18.5%) | 2,008 (38.7%) |
| 3.0x to 3.9x | 361 (8.0%) | 1,227 (23.6%) |
| 4.0x or more | 1,609 (35.8%) | 898 (17.3%) |
| Total | 4,490 (100.0%) | 5,191 (100.0%) |
Real Estate Taxes by Mortgage Status in Hot Springs
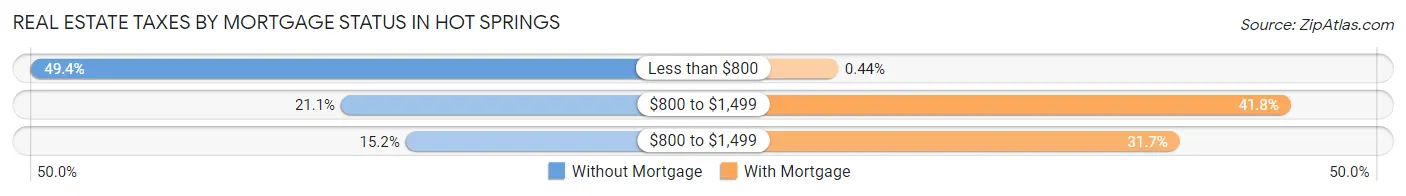
| Property Taxes | Without Mortgage | With Mortgage |
| Less than $800 | 2,217 (49.4%) | 23 (0.4%) |
| $800 to $1,499 | 948 (21.1%) | 2,170 (41.8%) |
| $800 to $1,499 | 683 (15.2%) | 1,643 (31.7%) |
| Total | 4,490 (100.0%) | 5,191 (100.0%) |
Health & Disability in Hot Springs
Health Insurance Coverage by Age in Hot Springs
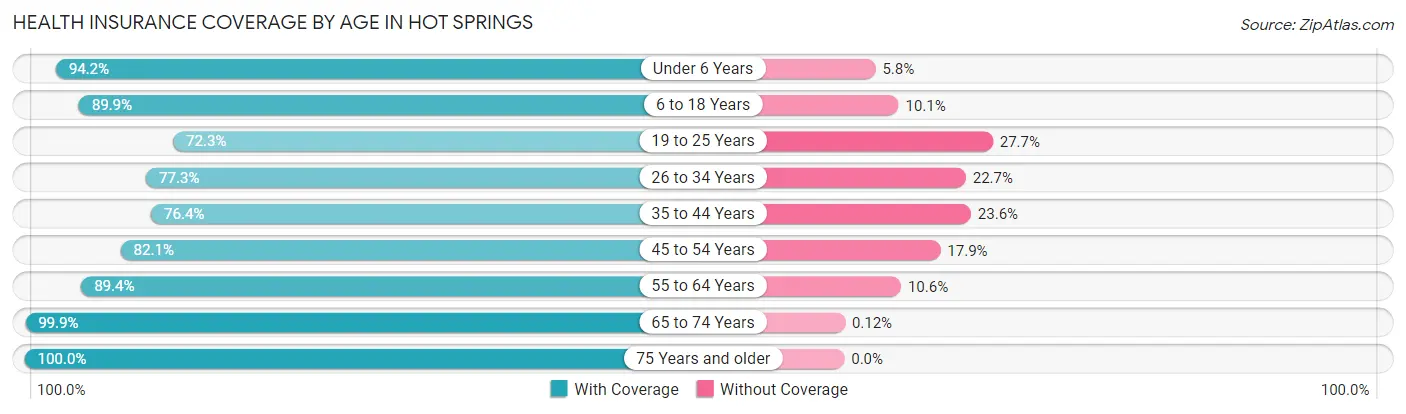
| Age Bracket | With Coverage | Without Coverage |
| Under 6 Years | 2,490 (94.2%) | 154 (5.8%) |
| 6 to 18 Years | 4,131 (89.9%) | 465 (10.1%) |
| 19 to 25 Years | 2,520 (72.3%) | 965 (27.7%) |
| 26 to 34 Years | 3,334 (77.3%) | 977 (22.7%) |
| 35 to 44 Years | 2,909 (76.4%) | 899 (23.6%) |
| 45 to 54 Years | 3,450 (82.1%) | 753 (17.9%) |
| 55 to 64 Years | 5,142 (89.4%) | 608 (10.6%) |
| 65 to 74 Years | 4,246 (99.9%) | 5 (0.1%) |
| 75 Years and older | 4,073 (100.0%) | 0 (0.0%) |
| Total | 32,295 (87.0%) | 4,826 (13.0%) |
Health Insurance Coverage by Citizenship Status in Hot Springs
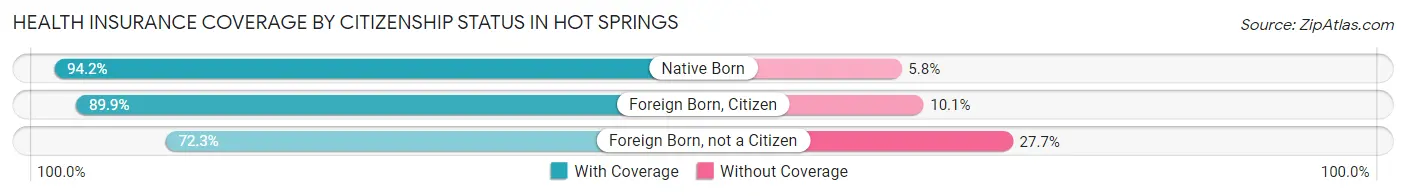
| Citizenship Status | With Coverage | Without Coverage |
| Native Born | 2,490 (94.2%) | 154 (5.8%) |
| Foreign Born, Citizen | 4,131 (89.9%) | 465 (10.1%) |
| Foreign Born, not a Citizen | 2,520 (72.3%) | 965 (27.7%) |
Health Insurance Coverage by Household Income in Hot Springs
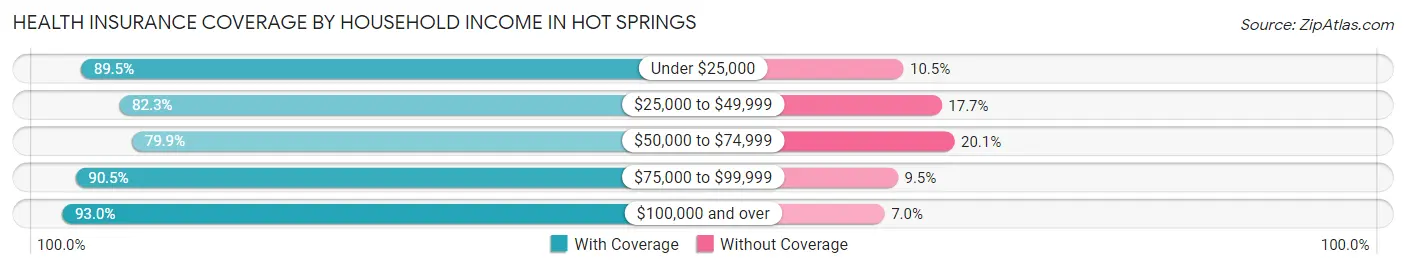
| Household Income | With Coverage | Without Coverage |
| Under $25,000 | 6,748 (89.5%) | 795 (10.5%) |
| $25,000 to $49,999 | 7,018 (82.3%) | 1,511 (17.7%) |
| $50,000 to $74,999 | 5,652 (79.9%) | 1,421 (20.1%) |
| $75,000 to $99,999 | 4,948 (90.5%) | 520 (9.5%) |
| $100,000 and over | 7,414 (93.0%) | 559 (7.0%) |
Public vs Private Health Insurance Coverage by Age in Hot Springs
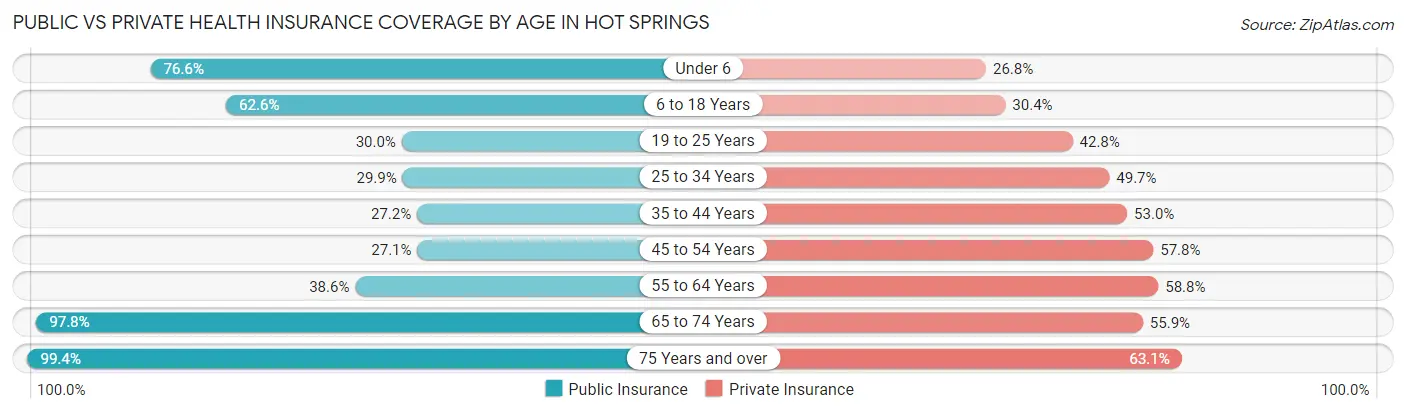
| Age Bracket | Public Insurance | Private Insurance |
| Under 6 | 2,026 (76.6%) | 708 (26.8%) |
| 6 to 18 Years | 2,877 (62.6%) | 1,396 (30.4%) |
| 19 to 25 Years | 1,046 (30.0%) | 1,493 (42.8%) |
| 25 to 34 Years | 1,287 (29.8%) | 2,141 (49.7%) |
| 35 to 44 Years | 1,034 (27.2%) | 2,017 (53.0%) |
| 45 to 54 Years | 1,139 (27.1%) | 2,430 (57.8%) |
| 55 to 64 Years | 2,221 (38.6%) | 3,378 (58.8%) |
| 65 to 74 Years | 4,158 (97.8%) | 2,376 (55.9%) |
| 75 Years and over | 4,050 (99.4%) | 2,568 (63.0%) |
| Total | 19,838 (53.4%) | 18,507 (49.9%) |
Disability Status by Sex by Age in Hot Springs
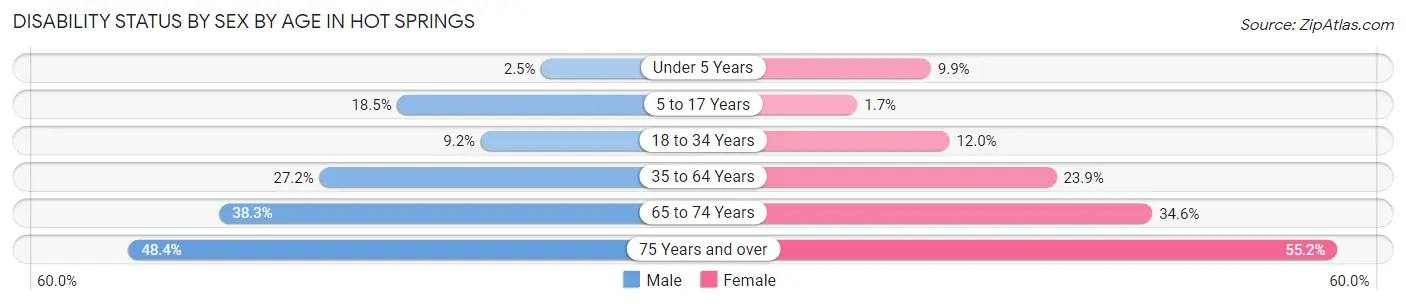
| Age Bracket | Male | Female |
| Under 5 Years | 24 (2.5%) | 121 (9.9%) |
| 5 to 17 Years | 438 (18.5%) | 38 (1.7%) |
| 18 to 34 Years | 382 (9.2%) | 492 (12.0%) |
| 35 to 64 Years | 1,733 (27.2%) | 1,764 (23.9%) |
| 65 to 74 Years | 680 (38.3%) | 856 (34.6%) |
| 75 Years and over | 758 (48.4%) | 1,384 (55.2%) |
Disability Class by Sex by Age in Hot Springs
Disability Class: Hearing Difficulty
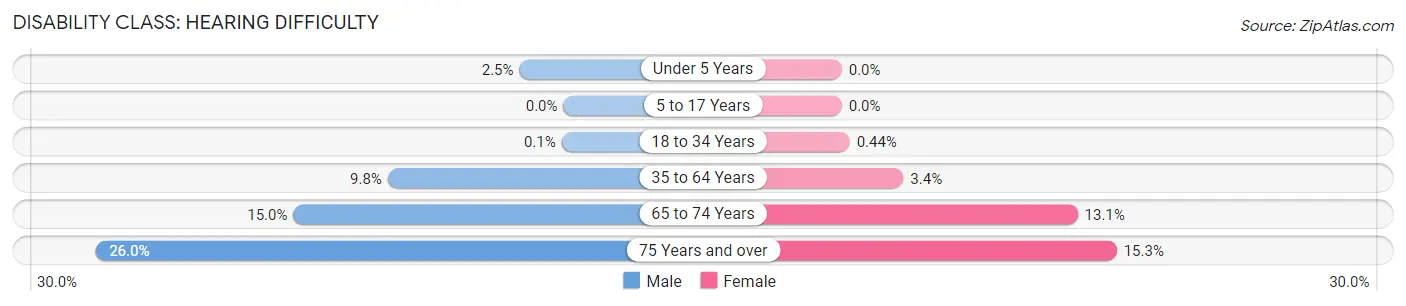
| Age Bracket | Male | Female |
| Under 5 Years | 24 (2.5%) | 0 (0.0%) |
| 5 to 17 Years | 0 (0.0%) | 0 (0.0%) |
| 18 to 34 Years | 4 (0.1%) | 18 (0.4%) |
| 35 to 64 Years | 624 (9.8%) | 253 (3.4%) |
| 65 to 74 Years | 267 (15.0%) | 325 (13.1%) |
| 75 Years and over | 407 (26.0%) | 384 (15.3%) |
Disability Class: Vision Difficulty
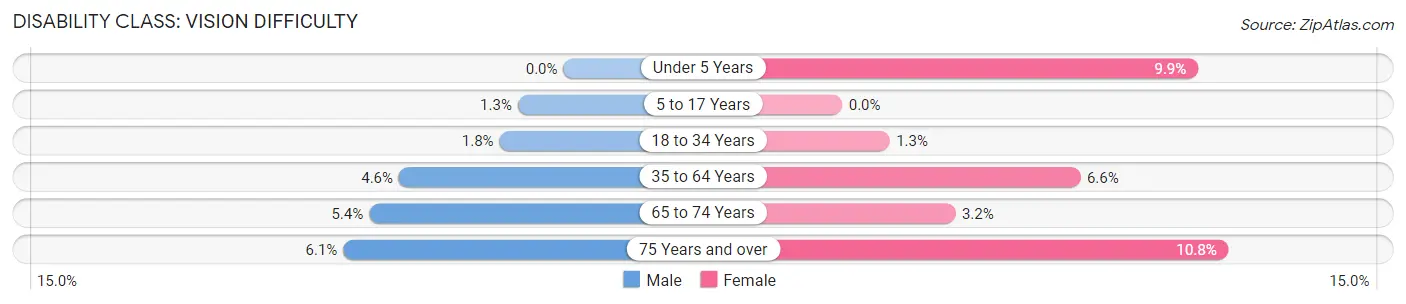
| Age Bracket | Male | Female |
| Under 5 Years | 0 (0.0%) | 121 (9.9%) |
| 5 to 17 Years | 30 (1.3%) | 0 (0.0%) |
| 18 to 34 Years | 74 (1.8%) | 54 (1.3%) |
| 35 to 64 Years | 292 (4.6%) | 489 (6.6%) |
| 65 to 74 Years | 96 (5.4%) | 78 (3.2%) |
| 75 Years and over | 96 (6.1%) | 270 (10.8%) |
Disability Class: Cognitive Difficulty
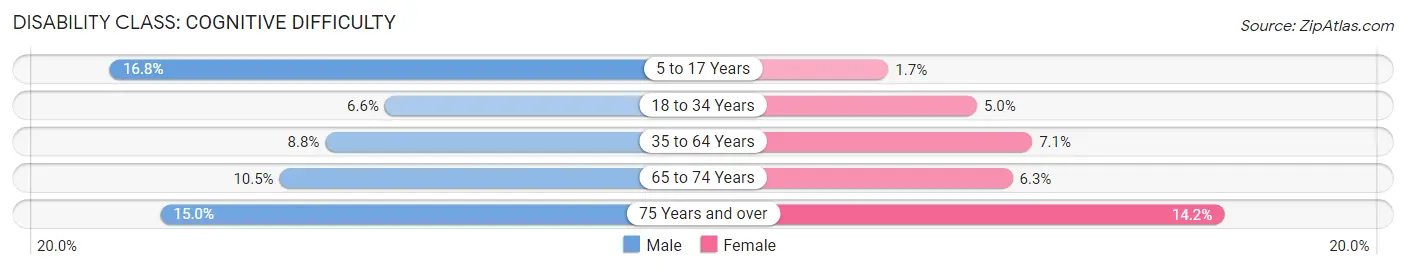
| Age Bracket | Male | Female |
| 5 to 17 Years | 399 (16.8%) | 38 (1.7%) |
| 18 to 34 Years | 276 (6.6%) | 206 (5.0%) |
| 35 to 64 Years | 564 (8.8%) | 522 (7.1%) |
| 65 to 74 Years | 187 (10.5%) | 157 (6.3%) |
| 75 Years and over | 234 (14.9%) | 356 (14.2%) |
Disability Class: Ambulatory Difficulty
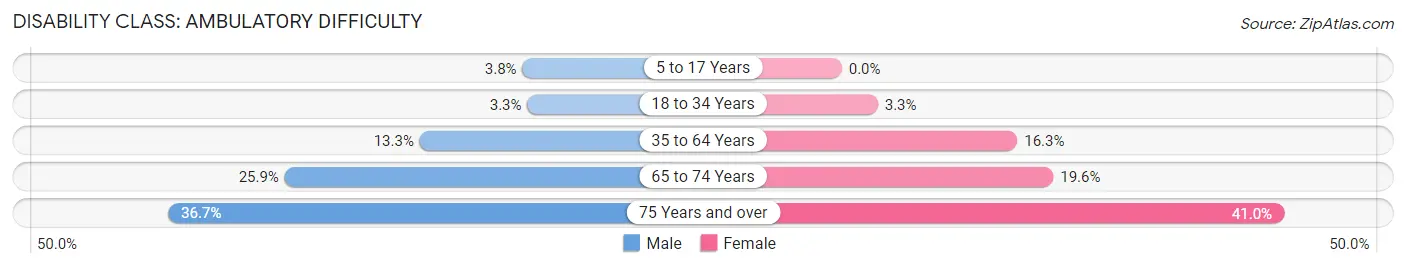
| Age Bracket | Male | Female |
| 5 to 17 Years | 90 (3.8%) | 0 (0.0%) |
| 18 to 34 Years | 139 (3.3%) | 137 (3.3%) |
| 35 to 64 Years | 851 (13.3%) | 1,202 (16.3%) |
| 65 to 74 Years | 459 (25.9%) | 486 (19.6%) |
| 75 Years and over | 574 (36.7%) | 1,029 (41.0%) |
Disability Class: Self-Care Difficulty
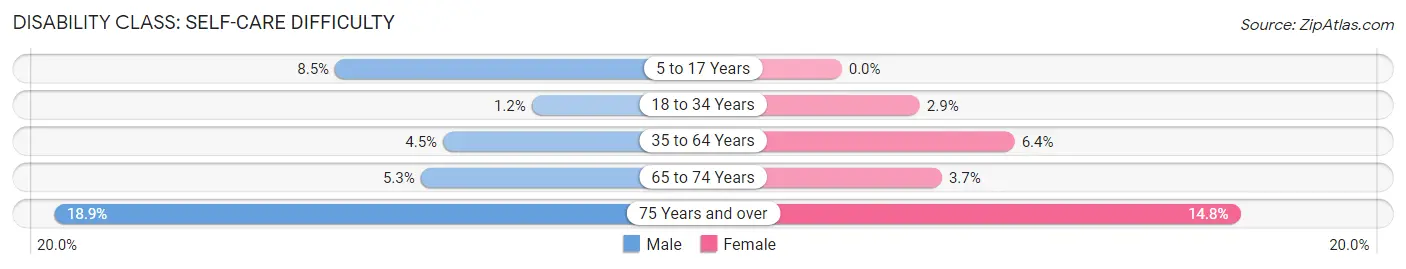
| Age Bracket | Male | Female |
| 5 to 17 Years | 201 (8.5%) | 0 (0.0%) |
| 18 to 34 Years | 49 (1.2%) | 119 (2.9%) |
| 35 to 64 Years | 285 (4.5%) | 474 (6.4%) |
| 65 to 74 Years | 94 (5.3%) | 92 (3.7%) |
| 75 Years and over | 296 (18.9%) | 371 (14.8%) |
Technology Access in Hot Springs
Computing Device Access in Hot Springs
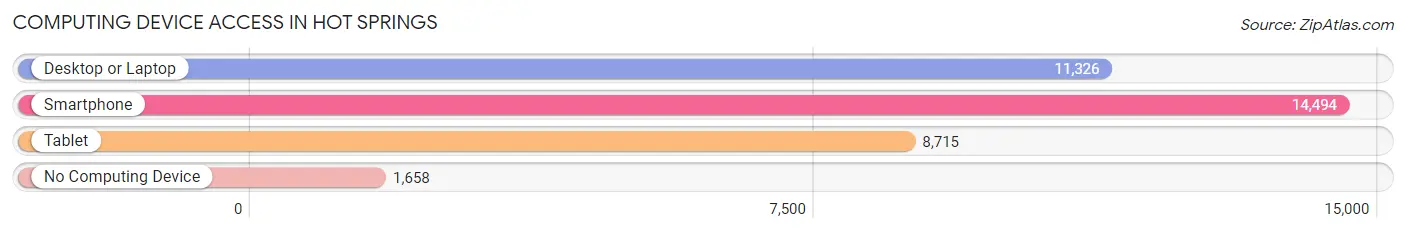
| Device Type | # Households | % Households |
| Desktop or Laptop | 11,326 | 65.1% |
| Smartphone | 14,494 | 83.3% |
| Tablet | 8,715 | 50.1% |
| No Computing Device | 1,658 | 9.5% |
| Total | 17,402 | 100.0% |
Internet Access in Hot Springs
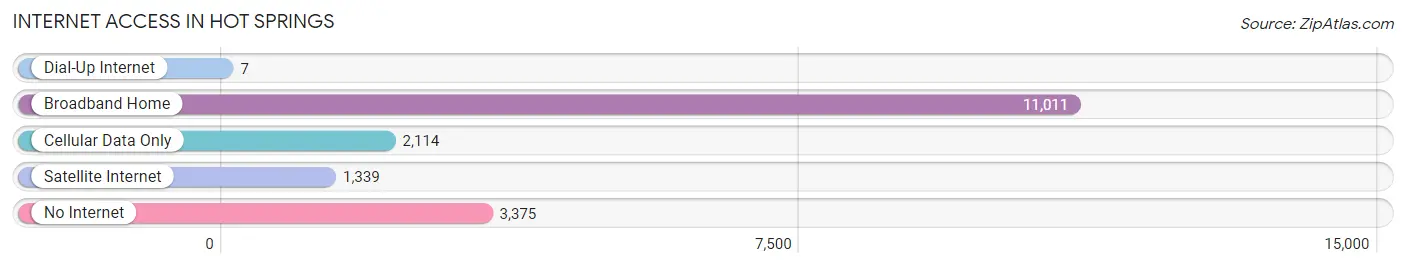
| Internet Type | # Households | % Households |
| Dial-Up Internet | 7 | 0.0% |
| Broadband Home | 11,011 | 63.3% |
| Cellular Data Only | 2,114 | 12.1% |
| Satellite Internet | 1,339 | 7.7% |
| No Internet | 3,375 | 19.4% |
| Total | 17,402 | 100.0% |
Hot Springs Summary
History
Hot Springs, Arkansas is a city located in the Ouachita Mountains of the Central Arkansas region. It is the county seat of Garland County and the tenth most populous city in the state. Hot Springs has a long and storied history, beginning with its discovery by the Native Americans of the area. The city was first settled by Europeans in 1807, and it quickly became a popular destination for travelers seeking the healing properties of the hot springs. The city was incorporated in 1876 and has since become a popular tourist destination, known for its natural beauty, historic sites, and recreational activities.
Geography
Hot Springs is located in the Ouachita Mountains of Central Arkansas, approximately 50 miles southwest of Little Rock. The city is situated on the southern shore of Lake Hamilton, a man-made lake created by the damming of the Ouachita River. The city is surrounded by the Ouachita National Forest, which provides a variety of outdoor recreational activities. Hot Springs is also home to Hot Springs National Park, the oldest national park in the United States.
The city has a humid subtropical climate, with hot, humid summers and mild winters. The average annual temperature is 63°F, with an average high of 79°F in July and an average low of 46°F in January. The average annual precipitation is 48.5 inches, with the wettest month being May.
Economy
Hot Springs has a diverse economy, with a mix of industries including tourism, healthcare, manufacturing, and retail. The city is home to several major employers, including the Hot Springs National Park, the Hot Springs Convention Center, and the Hot Springs School District.
Tourism is the largest industry in Hot Springs, with the city attracting over 4 million visitors each year. The city is home to several attractions, including the Hot Springs National Park, the Hot Springs Convention Center, and the Hot Springs Historic District. The city is also home to several casinos, including Oaklawn Racing & Gaming and the Arkansas Racing Commission.
Healthcare is another major industry in Hot Springs, with the city home to several hospitals and medical centers. The city is also home to several nursing homes and assisted living facilities.
Manufacturing is also an important part of the city’s economy, with several companies located in the area. The city is home to several food processing plants, as well as a variety of other manufacturing companies.
Retail is also an important part of the city’s economy, with several shopping centers and malls located in the area. The city is also home to several antique stores, art galleries, and specialty shops.
Demographics
As of the 2010 census, Hot Springs had a population of 35,193. The racial makeup of the city was 79.2% White, 15.3% African American, 0.5% Native American, 1.2% Asian, 0.1% Pacific Islander, 1.7% from other races, and 2.1% from two or more races. Hispanic or Latino of any race were 4.2% of the population.
The median income for a household in Hot Springs was $35,945, and the median income for a family was $44,919. The per capita income for the city was $20,945. About 14.2% of families and 17.7% of the population were below the poverty line, including 25.2% of those under age 18 and 11.2% of those age 65 or over.
Common Questions
What is Per Capita Income in Hot Springs?
Per Capita income in Hot Springs is $28,775.
What is the Median Family Income in Hot Springs?
Median Family Income in Hot Springs is $63,071.
What is the Median Household income in Hot Springs?
Median Household Income in Hot Springs is $46,537.
What is Income or Wage Gap in Hot Springs?
Income or Wage Gap in Hot Springs is 20.3%.
Women in Hot Springs earn 79.7 cents for every dollar earned by a man.
What is Family Income Deficit in Hot Springs?
Family Income Deficit in Hot Springs is $10,515.
Families that are below poverty line in Hot Springs earn $10,515 less on average than the poverty threshold level.
What is Inequality or Gini Index in Hot Springs?
Inequality or Gini Index in Hot Springs is 0.47.
What is the Total Population of Hot Springs?
Total Population of Hot Springs is 38,025.
What is the Total Male Population of Hot Springs?
Total Male Population of Hot Springs is 17,787.
What is the Total Female Population of Hot Springs?
Total Female Population of Hot Springs is 20,238.
What is the Ratio of Males per 100 Females in Hot Springs?
There are 87.89 Males per 100 Females in Hot Springs.
What is the Ratio of Females per 100 Males in Hot Springs?
There are 113.78 Females per 100 Males in Hot Springs.
What is the Median Population Age in Hot Springs?
Median Population Age in Hot Springs is 44.7 Years.
What is the Average Family Size in Hot Springs
Average Family Size in Hot Springs is 2.7 People.
What is the Average Household Size in Hot Springs
Average Household Size in Hot Springs is 2.1 People.
How Large is the Labor Force in Hot Springs?
There are 17,373 People in the Labor Forcein in Hot Springs.
What is the Percentage of People in the Labor Force in Hot Springs?
54.5% of People are in the Labor Force in Hot Springs.
What is the Unemployment Rate in Hot Springs?
Unemployment Rate in Hot Springs is 5.4%.