Paragould, AR Map & Demographics
Paragould Map
Paragould Overview
$26,245
PER CAPITA INCOME
$58,524
AVG FAMILY INCOME
$54,732
AVG HOUSEHOLD INCOME
26.7%
WAGE / INCOME GAP [ % ]
73.3¢/ $1
WAGE / INCOME GAP [ $ ]
$10,657
FAMILY INCOME DEFICIT
0.42
INEQUALITY / GINI INDEX
29,690
TOTAL POPULATION
14,578
MALE POPULATION
15,112
FEMALE POPULATION
96.47
MALES / 100 FEMALES
103.66
FEMALES / 100 MALES
35.9
MEDIAN AGE
3.1
AVG FAMILY SIZE
2.6
AVG HOUSEHOLD SIZE
13,884
LABOR FORCE [ PEOPLE ]
60.2%
PERCENT IN LABOR FORCE
8.5%
UNEMPLOYMENT RATE
Paragould Zip Codes
Paragould Area Codes
Income in Paragould
Income Overview in Paragould
Per Capita Income in Paragould is $26,245, while median incomes of families and households are $58,524 and $54,732 respectively.
| Characteristic | Number | Measure |
| Per Capita Income | 29,690 | $26,245 |
| Median Family Income | 7,572 | $58,524 |
| Mean Family Income | 7,572 | $75,071 |
| Median Household Income | 11,281 | $54,732 |
| Mean Household Income | 11,281 | $66,436 |
| Income Deficit | 7,572 | $10,657 |
| Wage / Income Gap (%) | 29,690 | 26.71% |
| Wage / Income Gap ($) | 29,690 | 73.29¢ per $1 |
| Gini / Inequality Index | 29,690 | 0.42 |
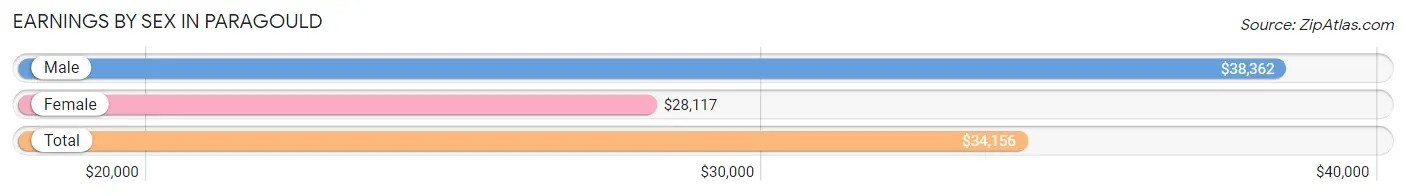
Earnings by Sex in Paragould
Average Earnings in Paragould are $34,156, $38,362 for men and $28,117 for women, a difference of 26.7%.
| Sex | Number | Average Earnings |
| Male | 7,695 (53.1%) | $38,362 |
| Female | 6,784 (46.9%) | $28,117 |
| Total | 14,479 (100.0%) | $34,156 |
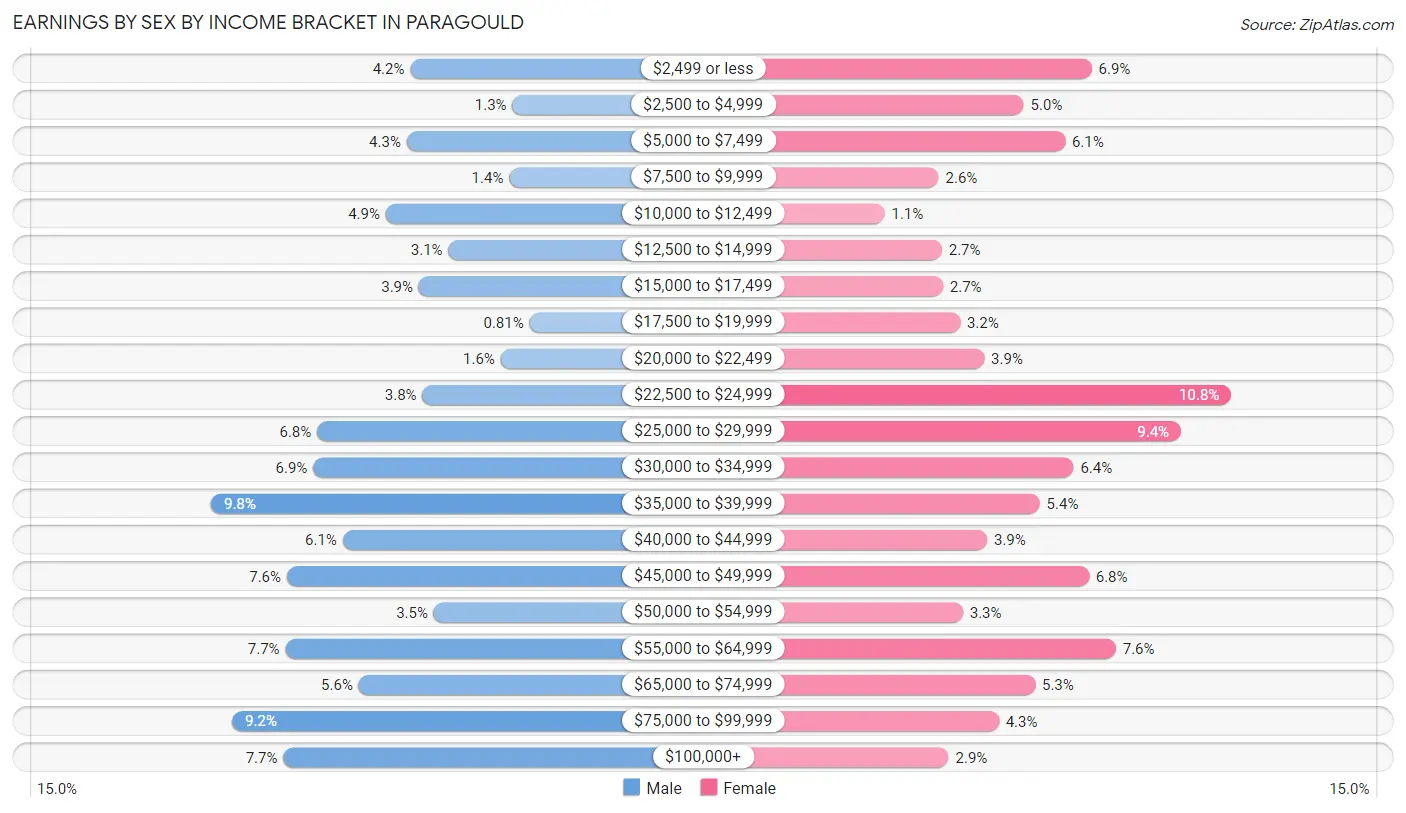
Earnings by Sex by Income Bracket in Paragould
The most common earnings brackets in Paragould are $35,000 to $39,999 for men (751 | 9.8%) and $22,500 to $24,999 for women (733 | 10.8%).
| Income | Male | Female |
| $2,499 or less | 320 (4.2%) | 467 (6.9%) |
| $2,500 to $4,999 | 99 (1.3%) | 337 (5.0%) |
| $5,000 to $7,499 | 328 (4.3%) | 416 (6.1%) |
| $7,500 to $9,999 | 106 (1.4%) | 175 (2.6%) |
| $10,000 to $12,499 | 373 (4.9%) | 72 (1.1%) |
| $12,500 to $14,999 | 238 (3.1%) | 181 (2.7%) |
| $15,000 to $17,499 | 302 (3.9%) | 183 (2.7%) |
| $17,500 to $19,999 | 62 (0.8%) | 216 (3.2%) |
| $20,000 to $22,499 | 125 (1.6%) | 262 (3.9%) |
| $22,500 to $24,999 | 294 (3.8%) | 733 (10.8%) |
| $25,000 to $29,999 | 522 (6.8%) | 637 (9.4%) |
| $30,000 to $34,999 | 530 (6.9%) | 432 (6.4%) |
| $35,000 to $39,999 | 751 (9.8%) | 368 (5.4%) |
| $40,000 to $44,999 | 466 (6.1%) | 267 (3.9%) |
| $45,000 to $49,999 | 587 (7.6%) | 461 (6.8%) |
| $50,000 to $54,999 | 269 (3.5%) | 221 (3.3%) |
| $55,000 to $64,999 | 590 (7.7%) | 513 (7.6%) |
| $65,000 to $74,999 | 432 (5.6%) | 359 (5.3%) |
| $75,000 to $99,999 | 706 (9.2%) | 290 (4.3%) |
| $100,000+ | 595 (7.7%) | 194 (2.9%) |
| Total | 7,695 (100.0%) | 6,784 (100.0%) |
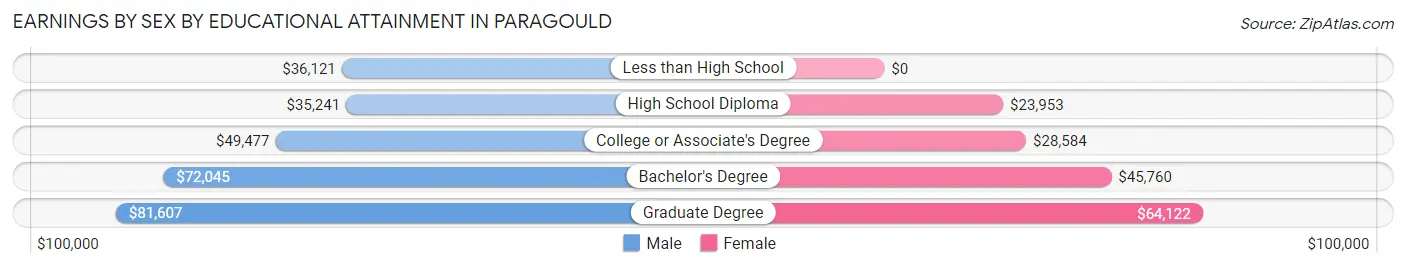
Earnings by Sex by Educational Attainment in Paragould
Average earnings in Paragould are $43,181 for men and $31,460 for women, a difference of 27.1%. Men with an educational attainment of graduate degree enjoy the highest average annual earnings of $81,607, while those with high school diploma education earn the least with $35,241. Women with an educational attainment of graduate degree earn the most with the average annual earnings of $64,122, while those with high school diploma education have the smallest earnings of $23,953.
| Educational Attainment | Male Income | Female Income |
| Less than High School | $36,121 | $0 |
| High School Diploma | $35,241 | $23,953 |
| College or Associate's Degree | $49,477 | $28,584 |
| Bachelor's Degree | $72,045 | $45,760 |
| Graduate Degree | $81,607 | $64,122 |
| Total | $43,181 | $31,460 |
Family Income in Paragould
Family Income Brackets in Paragould
According to the Paragould family income data, there are 1,567 families falling into the $35,000 to $49,999 income range, which is the most common income bracket and makes up 20.7% of all families. Conversely, the $200,000+ income bracket is the least frequent group with only 197 families (2.6%) belonging to this category.
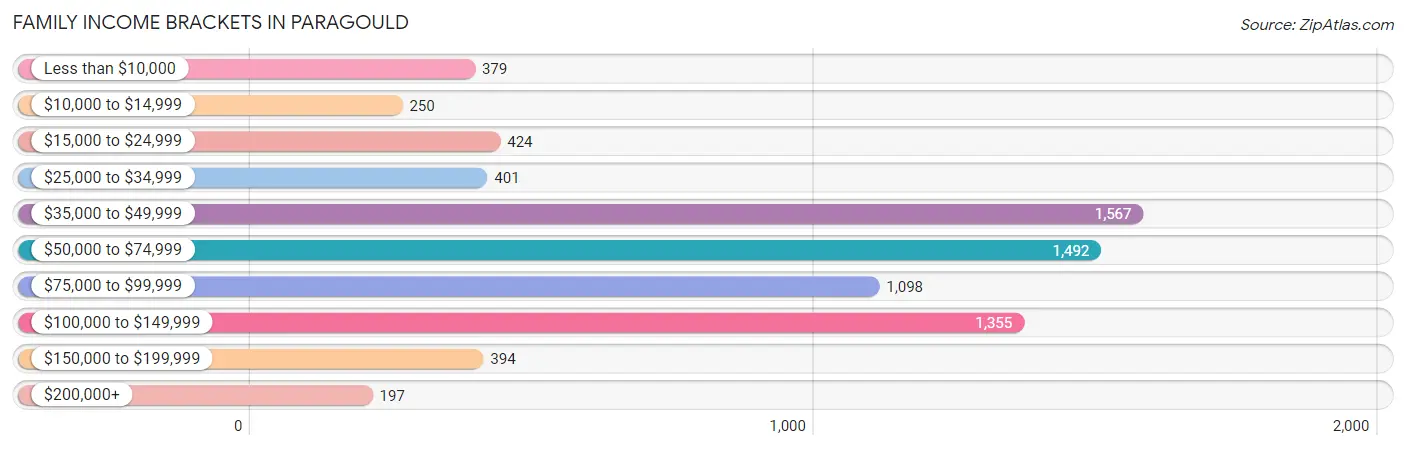
| Income Bracket | # Families | % Families |
| Less than $10,000 | 379 | 5.0% |
| $10,000 to $14,999 | 250 | 3.3% |
| $15,000 to $24,999 | 424 | 5.6% |
| $25,000 to $34,999 | 401 | 5.3% |
| $35,000 to $49,999 | 1,567 | 20.7% |
| $50,000 to $74,999 | 1,492 | 19.7% |
| $75,000 to $99,999 | 1,098 | 14.5% |
| $100,000 to $149,999 | 1,355 | 17.9% |
| $150,000 to $199,999 | 394 | 5.2% |
| $200,000+ | 197 | 2.6% |
Family Income by Famaliy Size in Paragould
7+ person families (95 | 1.3%) account for the highest median family income in Paragould with $112,228 per family, while 2-person families (3,747 | 49.5%) have the highest median income of $27,650 per family member.
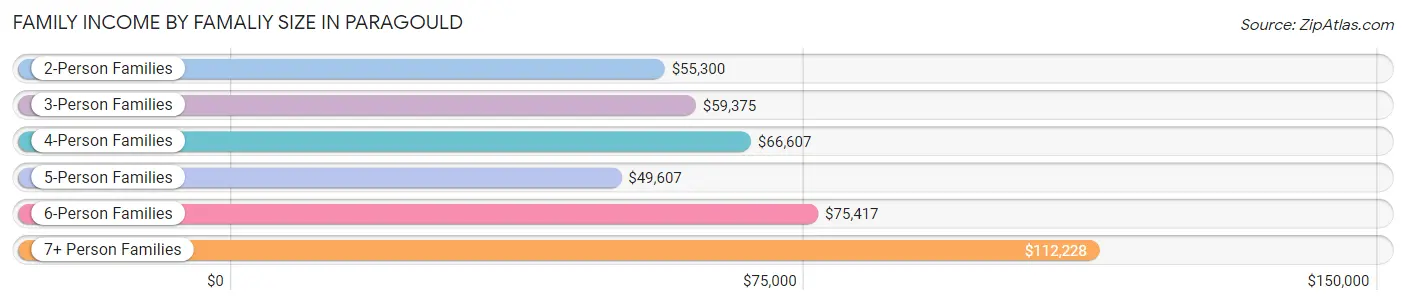
| Income Bracket | # Families | Median Income |
| 2-Person Families | 3,747 (49.5%) | $55,300 |
| 3-Person Families | 1,760 (23.2%) | $59,375 |
| 4-Person Families | 1,224 (16.2%) | $66,607 |
| 5-Person Families | 523 (6.9%) | $49,607 |
| 6-Person Families | 223 (2.9%) | $75,417 |
| 7+ Person Families | 95 (1.3%) | $112,228 |
| Total | 7,572 (100.0%) | $58,524 |
Family Income by Number of Earners in Paragould
The median family income in Paragould is $58,524, with families comprising 3+ earners (547) having the highest median family income of $120,234, while families with no earners (1,255) have the lowest median family income of $29,301, accounting for 7.2% and 16.6% of families, respectively.
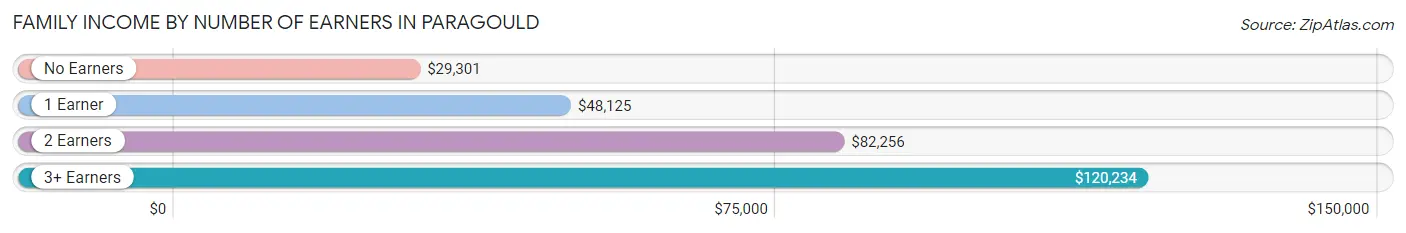
| Number of Earners | # Families | Median Income |
| No Earners | 1,255 (16.6%) | $29,301 |
| 1 Earner | 2,753 (36.4%) | $48,125 |
| 2 Earners | 3,017 (39.8%) | $82,256 |
| 3+ Earners | 547 (7.2%) | $120,234 |
| Total | 7,572 (100.0%) | $58,524 |
Household Income in Paragould
Household Income Brackets in Paragould
With 2,595 households falling in the category, the $50,000 to $74,999 income range is the most frequent in Paragould, accounting for 23.0% of all households. In contrast, only 248 households (2.2%) fall into the $200,000+ income bracket, making it the least populous group.
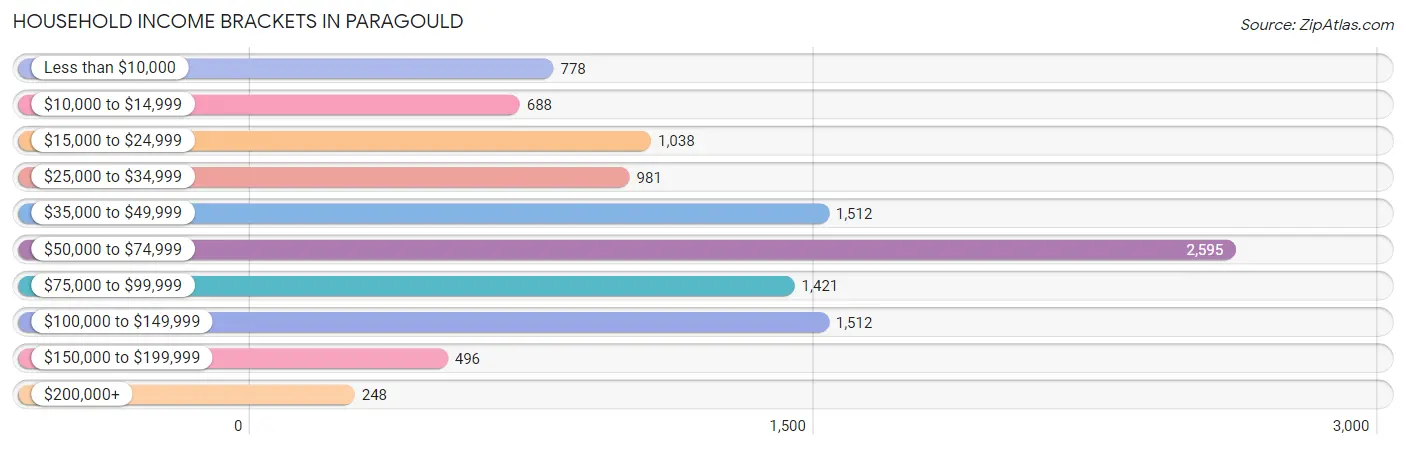
| Income Bracket | # Households | % Households |
| Less than $10,000 | 778 | 6.9% |
| $10,000 to $14,999 | 688 | 6.1% |
| $15,000 to $24,999 | 1,038 | 9.2% |
| $25,000 to $34,999 | 981 | 8.7% |
| $35,000 to $49,999 | 1,512 | 13.4% |
| $50,000 to $74,999 | 2,595 | 23.0% |
| $75,000 to $99,999 | 1,421 | 12.6% |
| $100,000 to $149,999 | 1,512 | 13.4% |
| $150,000 to $199,999 | 496 | 4.4% |
| $200,000+ | 248 | 2.2% |
Household Income by Householder Age in Paragould
The median household income in Paragould is $54,732, with the highest median household income of $63,557 found in the 45 to 64 years age bracket for the primary householder. A total of 3,750 households (33.2%) fall into this category. Meanwhile, the 65+ years age bracket for the primary householder has the lowest median household income of $38,856, with 2,686 households (23.8%) in this group.
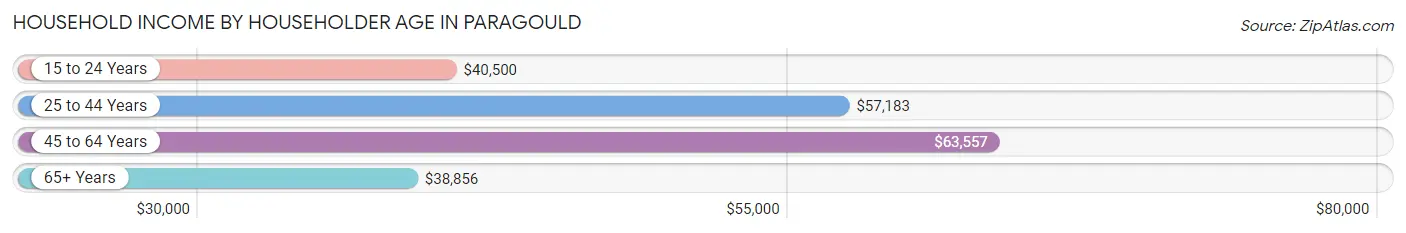
| Income Bracket | # Households | Median Income |
| 15 to 24 Years | 672 (6.0%) | $40,500 |
| 25 to 44 Years | 4,173 (37.0%) | $57,183 |
| 45 to 64 Years | 3,750 (33.2%) | $63,557 |
| 65+ Years | 2,686 (23.8%) | $38,856 |
| Total | 11,281 (100.0%) | $54,732 |
Poverty in Paragould
Income Below Poverty by Sex and Age in Paragould
With 16.1% poverty level for males and 18.7% for females among the residents of Paragould, under 5 year old males and 6 to 11 year old females are the most vulnerable to poverty, with 645 males (52.6%) and 462 females (31.5%) in their respective age groups living below the poverty level.
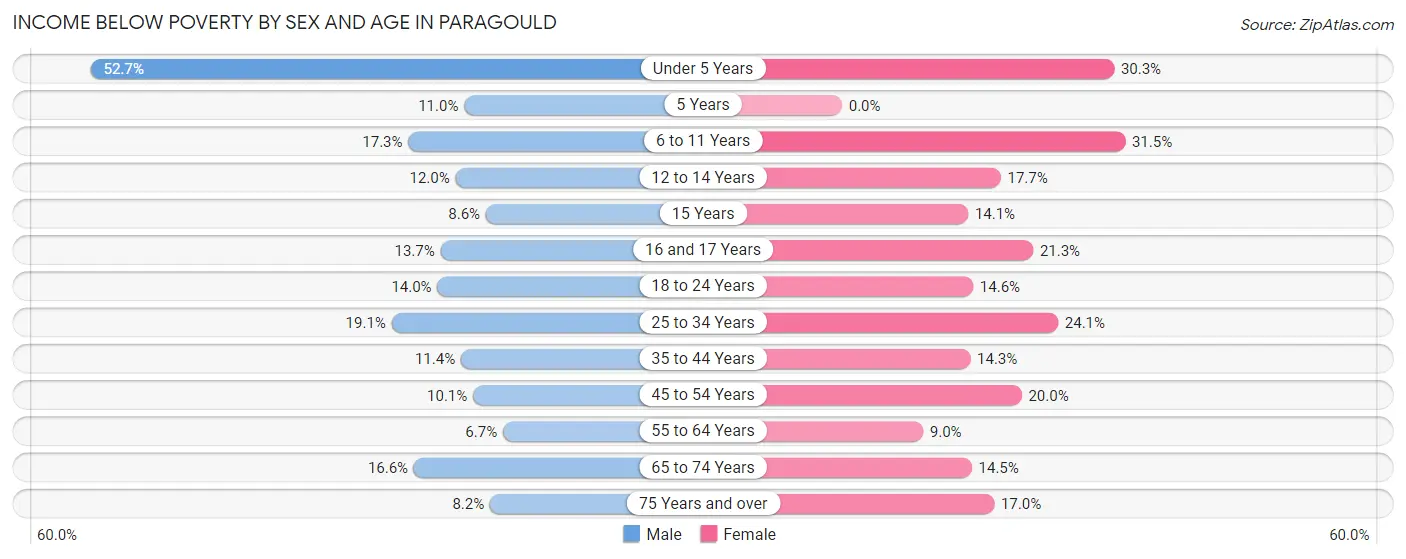
| Age Bracket | Male | Female |
| Under 5 Years | 645 (52.6%) | 244 (30.3%) |
| 5 Years | 54 (11.0%) | 0 (0.0%) |
| 6 to 11 Years | 122 (17.3%) | 462 (31.5%) |
| 12 to 14 Years | 77 (12.0%) | 87 (17.7%) |
| 15 Years | 15 (8.6%) | 26 (14.1%) |
| 16 and 17 Years | 64 (13.7%) | 96 (21.3%) |
| 18 to 24 Years | 172 (14.0%) | 171 (14.6%) |
| 25 to 34 Years | 376 (19.1%) | 530 (24.1%) |
| 35 to 44 Years | 240 (11.4%) | 295 (14.3%) |
| 45 to 54 Years | 171 (10.1%) | 293 (20.0%) |
| 55 to 64 Years | 117 (6.7%) | 170 (9.0%) |
| 65 to 74 Years | 177 (16.6%) | 202 (14.5%) |
| 75 Years and over | 52 (8.2%) | 149 (17.0%) |
| Total | 2,282 (16.1%) | 2,725 (18.7%) |
Income Above Poverty by Sex and Age in Paragould
According to the poverty statistics in Paragould, males aged 55 to 64 years and females aged 5 years are the age groups that are most secure financially, with 93.3% of males and 100.0% of females in these age groups living above the poverty line.
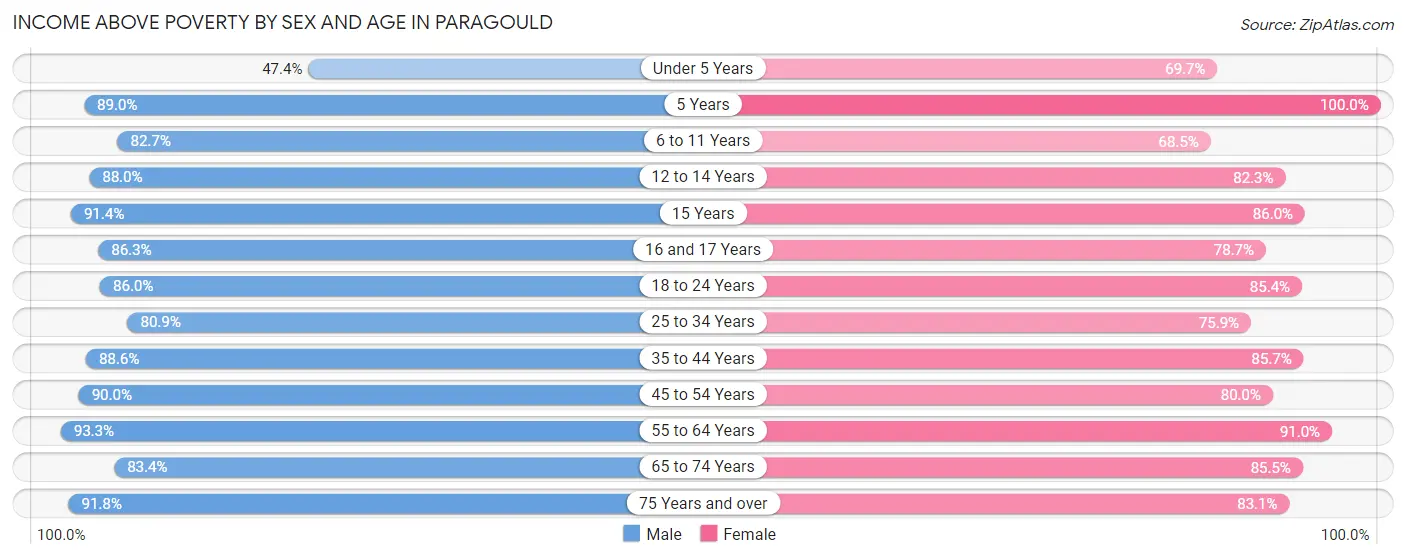
| Age Bracket | Male | Female |
| Under 5 Years | 580 (47.3%) | 561 (69.7%) |
| 5 Years | 435 (89.0%) | 109 (100.0%) |
| 6 to 11 Years | 585 (82.7%) | 1,003 (68.5%) |
| 12 to 14 Years | 564 (88.0%) | 405 (82.3%) |
| 15 Years | 159 (91.4%) | 159 (86.0%) |
| 16 and 17 Years | 404 (86.3%) | 355 (78.7%) |
| 18 to 24 Years | 1,055 (86.0%) | 1,000 (85.4%) |
| 25 to 34 Years | 1,591 (80.9%) | 1,673 (75.9%) |
| 35 to 44 Years | 1,866 (88.6%) | 1,769 (85.7%) |
| 45 to 54 Years | 1,530 (89.9%) | 1,171 (80.0%) |
| 55 to 64 Years | 1,625 (93.3%) | 1,712 (91.0%) |
| 65 to 74 Years | 887 (83.4%) | 1,195 (85.5%) |
| 75 Years and over | 585 (91.8%) | 730 (83.1%) |
| Total | 11,866 (83.9%) | 11,842 (81.3%) |
Income Below Poverty Among Married-Couple Families in Paragould
The poverty statistics for married-couple families in Paragould show that 5.4% or 267 of the total 4,971 families live below the poverty line. Families with 3 or 4 children have the highest poverty rate of 10.7%, comprising of 34 families. On the other hand, families with 5 or more children have the lowest poverty rate of 0.0%, which includes 0 families.
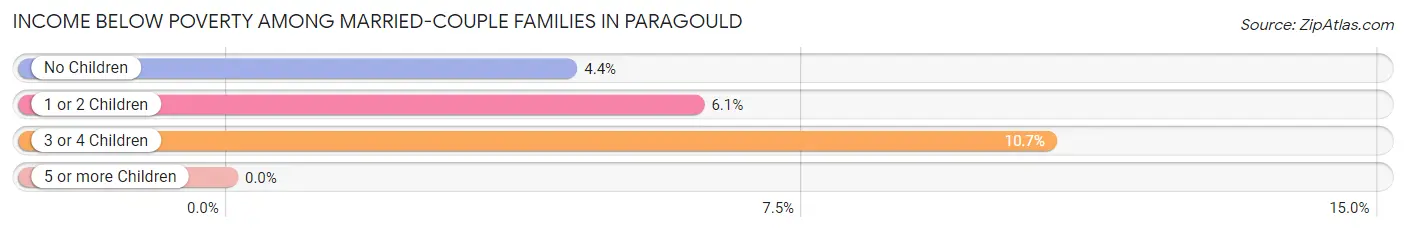
| Children | Above Poverty | Below Poverty |
| No Children | 2,720 (95.6%) | 126 (4.4%) |
| 1 or 2 Children | 1,650 (93.9%) | 107 (6.1%) |
| 3 or 4 Children | 284 (89.3%) | 34 (10.7%) |
| 5 or more Children | 50 (100.0%) | 0 (0.0%) |
| Total | 4,704 (94.6%) | 267 (5.4%) |
Income Below Poverty Among Single-Parent Households in Paragould
According to the poverty data in Paragould, 26.9% or 267 single-father households and 30.0% or 483 single-mother households are living below the poverty line. Among single-father households, those with 1 or 2 children have the highest poverty rate, with 220 households (32.8%) experiencing poverty. Likewise, among single-mother households, those with 5 or more children have the highest poverty rate, with 41 households (69.5%) falling below the poverty line.
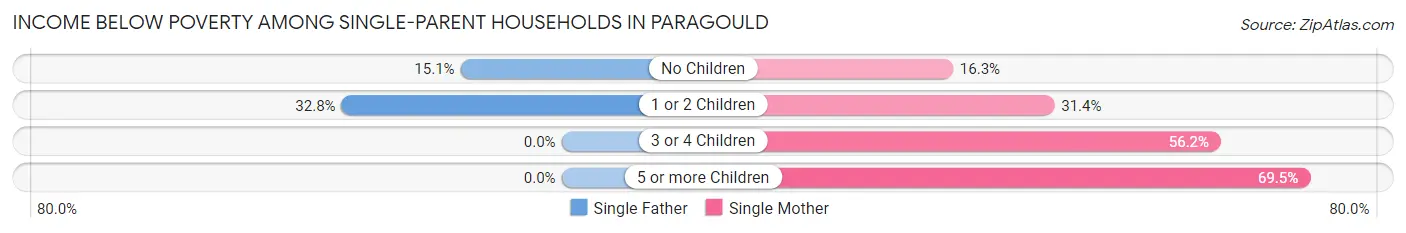
| Children | Single Father | Single Mother |
| No Children | 47 (15.1%) | 85 (16.3%) |
| 1 or 2 Children | 220 (32.8%) | 280 (31.4%) |
| 3 or 4 Children | 0 (0.0%) | 77 (56.2%) |
| 5 or more Children | 0 (0.0%) | 41 (69.5%) |
| Total | 267 (26.9%) | 483 (30.0%) |
Income Below Poverty Among Married-Couple vs Single-Parent Households in Paragould
The poverty data for Paragould shows that 267 of the married-couple family households (5.4%) and 750 of the single-parent households (28.8%) are living below the poverty level. Within the married-couple family households, those with 3 or 4 children have the highest poverty rate, with 34 households (10.7%) falling below the poverty line. Among the single-parent households, those with 5 or more children have the highest poverty rate, with 41 household (69.5%) living below poverty.
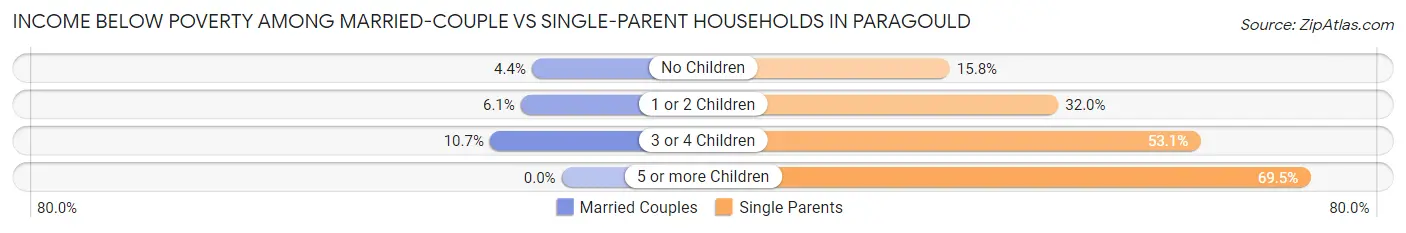
| Children | Married-Couple Families | Single-Parent Households |
| No Children | 126 (4.4%) | 132 (15.8%) |
| 1 or 2 Children | 107 (6.1%) | 500 (32.0%) |
| 3 or 4 Children | 34 (10.7%) | 77 (53.1%) |
| 5 or more Children | 0 (0.0%) | 41 (69.5%) |
| Total | 267 (5.4%) | 750 (28.8%) |
Race in Paragould
The most populous races in Paragould are White / Caucasian (26,368 | 88.8%), Two or more Races (1,478 | 5.0%), and Hispanic or Latino (1,299 | 4.4%).
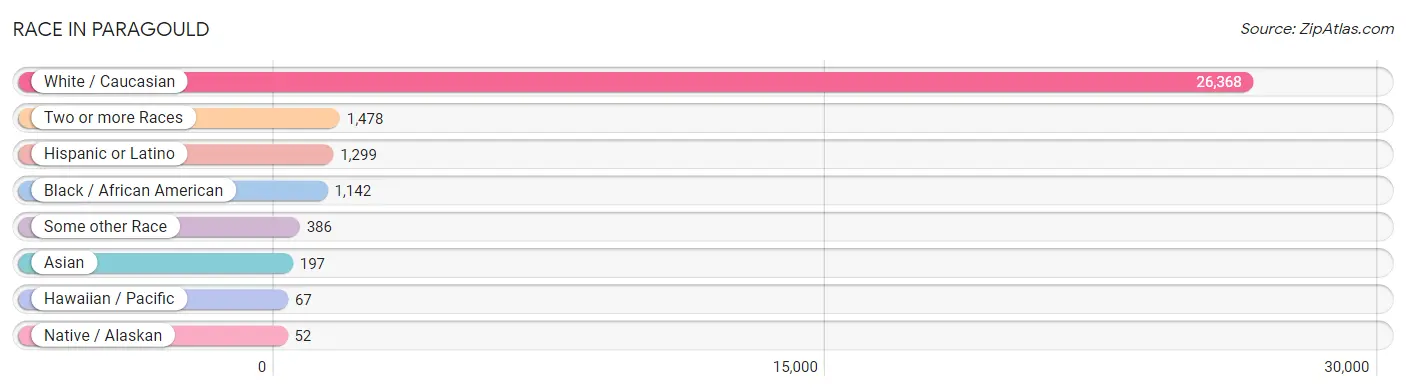
| Race | # Population | % Population |
| Asian | 197 | 0.7% |
| Black / African American | 1,142 | 3.8% |
| Hawaiian / Pacific | 67 | 0.2% |
| Hispanic or Latino | 1,299 | 4.4% |
| Native / Alaskan | 52 | 0.2% |
| White / Caucasian | 26,368 | 88.8% |
| Two or more Races | 1,478 | 5.0% |
| Some other Race | 386 | 1.3% |
| Total | 29,690 | 100.0% |
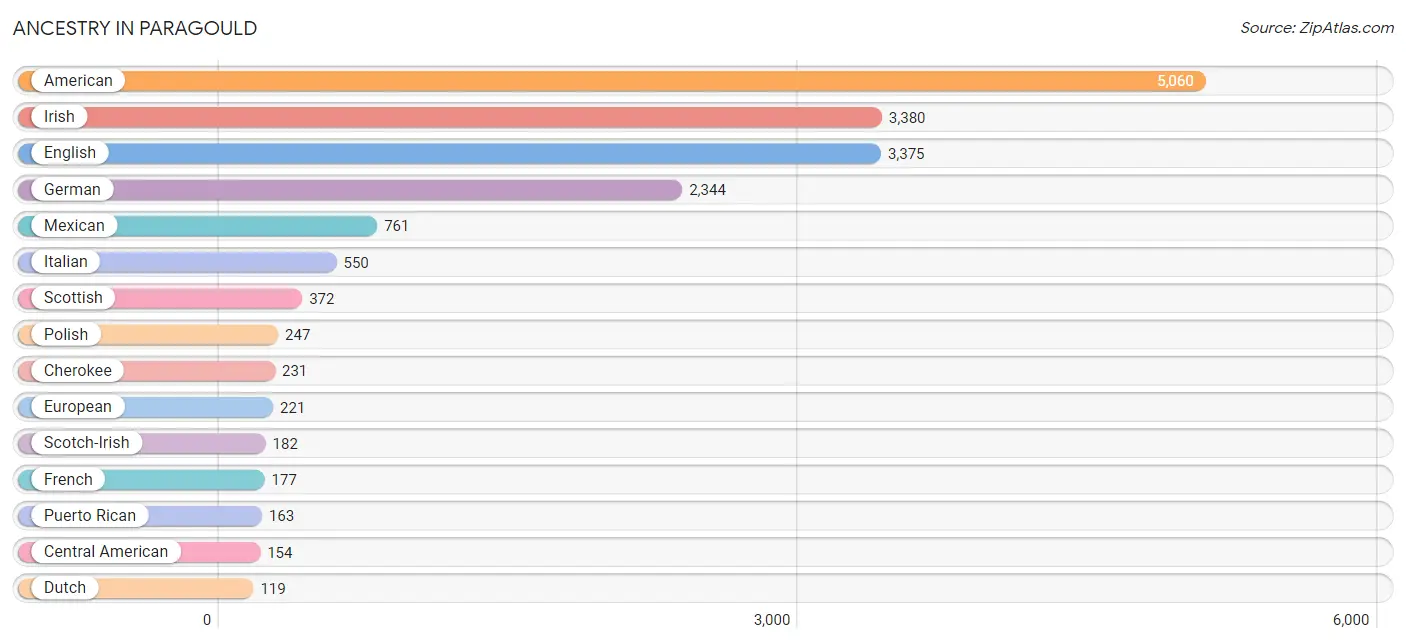
Ancestry in Paragould
The most populous ancestries reported in Paragould are American (5,060 | 17.0%), Irish (3,380 | 11.4%), English (3,375 | 11.4%), German (2,344 | 7.9%), and Mexican (761 | 2.6%), together accounting for 50.2% of all Paragould residents.
| Ancestry | # Population | % Population |
| African | 18 | 0.1% |
| Alaskan Athabascan | 3 | 0.0% |
| American | 5,060 | 17.0% |
| Apache | 16 | 0.1% |
| Australian | 26 | 0.1% |
| Blackfeet | 39 | 0.1% |
| British | 30 | 0.1% |
| Canadian | 43 | 0.1% |
| Central American | 154 | 0.5% |
| Cherokee | 231 | 0.8% |
| Choctaw | 2 | 0.0% |
| Crow | 11 | 0.0% |
| Cuban | 34 | 0.1% |
| Czech | 11 | 0.0% |
| Danish | 5 | 0.0% |
| Dutch | 119 | 0.4% |
| Dutch West Indian | 59 | 0.2% |
| Eastern European | 67 | 0.2% |
| English | 3,375 | 11.4% |
| European | 221 | 0.7% |
| French | 177 | 0.6% |
| French Canadian | 8 | 0.0% |
| German | 2,344 | 7.9% |
| Guatemalan | 118 | 0.4% |
| Haitian | 11 | 0.0% |
| Hungarian | 27 | 0.1% |
| Indian (Asian) | 85 | 0.3% |
| Irish | 3,380 | 11.4% |
| Italian | 550 | 1.8% |
| Korean | 5 | 0.0% |
| Marshallese | 67 | 0.2% |
| Mexican | 761 | 2.6% |
| Navajo | 7 | 0.0% |
| Northern European | 43 | 0.1% |
| Norwegian | 90 | 0.3% |
| Pennsylvania German | 30 | 0.1% |
| Peruvian | 24 | 0.1% |
| Polish | 247 | 0.8% |
| Puerto Rican | 163 | 0.5% |
| Russian | 65 | 0.2% |
| Salvadoran | 36 | 0.1% |
| Scandinavian | 30 | 0.1% |
| Scotch-Irish | 182 | 0.6% |
| Scottish | 372 | 1.3% |
| Sioux | 5 | 0.0% |
| South American | 24 | 0.1% |
| Spaniard | 22 | 0.1% |
| Spanish | 68 | 0.2% |
| Subsaharan African | 18 | 0.1% |
| Swedish | 69 | 0.2% |
| Swiss | 11 | 0.0% |
| Ukrainian | 42 | 0.1% |
| Welsh | 83 | 0.3% | View All 53 Rows |
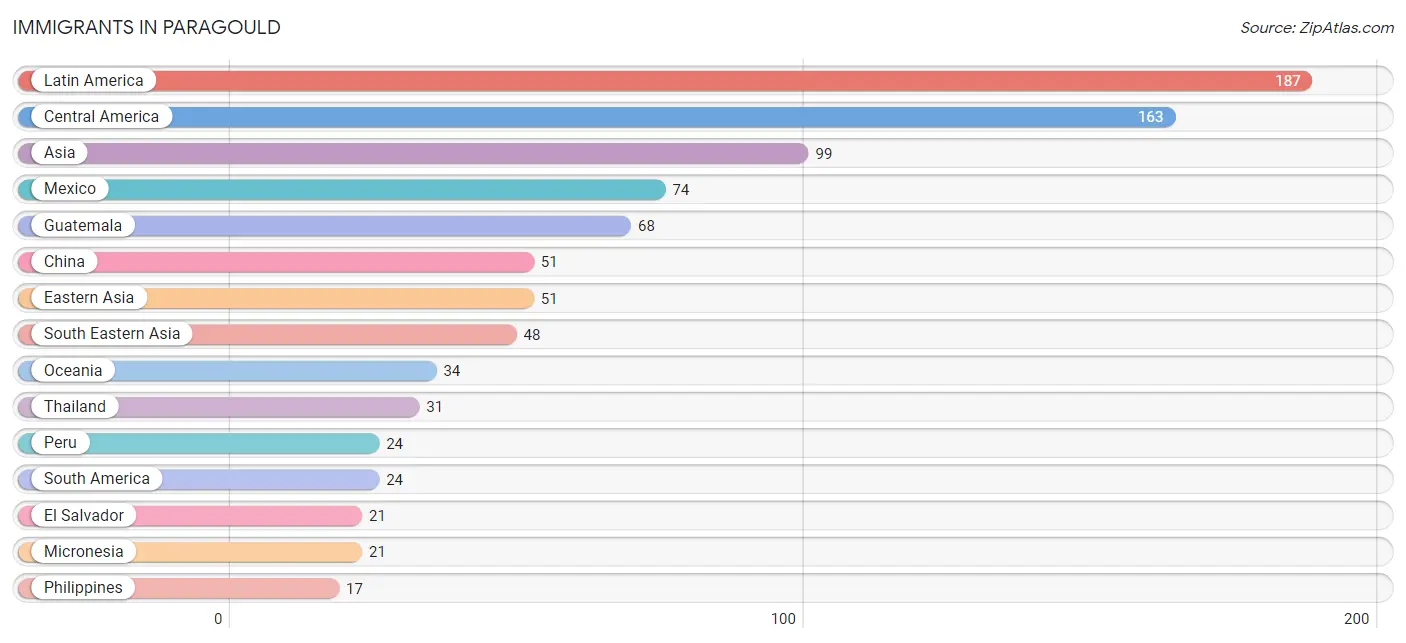
Immigrants in Paragould
The most numerous immigrant groups reported in Paragould came from Latin America (187 | 0.6%), Central America (163 | 0.5%), Asia (99 | 0.3%), Mexico (74 | 0.3%), and Guatemala (68 | 0.2%), together accounting for 2.0% of all Paragould residents.
| Immigration Origin | # Population | % Population |
| Asia | 99 | 0.3% |
| Australia | 13 | 0.0% |
| Central America | 163 | 0.5% |
| China | 51 | 0.2% |
| Eastern Asia | 51 | 0.2% |
| El Salvador | 21 | 0.1% |
| Guatemala | 68 | 0.2% |
| Latin America | 187 | 0.6% |
| Mexico | 74 | 0.3% |
| Micronesia | 21 | 0.1% |
| Oceania | 34 | 0.1% |
| Peru | 24 | 0.1% |
| Philippines | 17 | 0.1% |
| South America | 24 | 0.1% |
| South Eastern Asia | 48 | 0.2% |
| Thailand | 31 | 0.1% | View All 16 Rows |
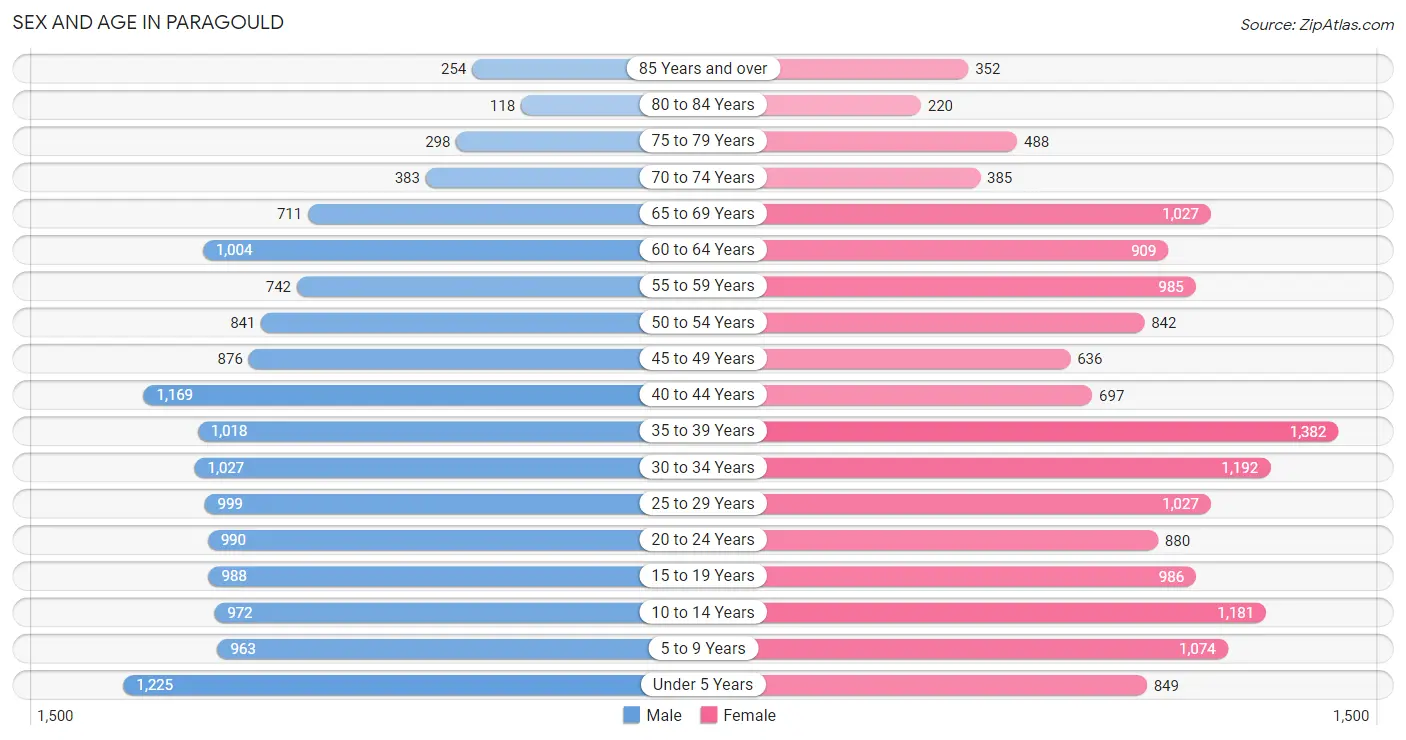
Sex and Age in Paragould
Sex and Age in Paragould
The most populous age groups in Paragould are Under 5 Years (1,225 | 8.4%) for men and 35 to 39 Years (1,382 | 9.1%) for women.
| Age Bracket | Male | Female |
| Under 5 Years | 1,225 (8.4%) | 849 (5.6%) |
| 5 to 9 Years | 963 (6.6%) | 1,074 (7.1%) |
| 10 to 14 Years | 972 (6.7%) | 1,181 (7.8%) |
| 15 to 19 Years | 988 (6.8%) | 986 (6.5%) |
| 20 to 24 Years | 990 (6.8%) | 880 (5.8%) |
| 25 to 29 Years | 999 (6.9%) | 1,027 (6.8%) |
| 30 to 34 Years | 1,027 (7.0%) | 1,192 (7.9%) |
| 35 to 39 Years | 1,018 (7.0%) | 1,382 (9.1%) |
| 40 to 44 Years | 1,169 (8.0%) | 697 (4.6%) |
| 45 to 49 Years | 876 (6.0%) | 636 (4.2%) |
| 50 to 54 Years | 841 (5.8%) | 842 (5.6%) |
| 55 to 59 Years | 742 (5.1%) | 985 (6.5%) |
| 60 to 64 Years | 1,004 (6.9%) | 909 (6.0%) |
| 65 to 69 Years | 711 (4.9%) | 1,027 (6.8%) |
| 70 to 74 Years | 383 (2.6%) | 385 (2.5%) |
| 75 to 79 Years | 298 (2.0%) | 488 (3.2%) |
| 80 to 84 Years | 118 (0.8%) | 220 (1.5%) |
| 85 Years and over | 254 (1.7%) | 352 (2.3%) |
| Total | 14,578 (100.0%) | 15,112 (100.0%) |
Families and Households in Paragould
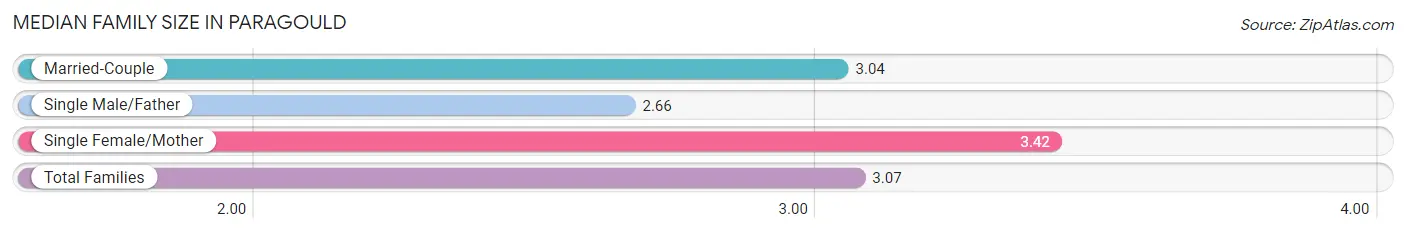
Median Family Size in Paragould
The median family size in Paragould is 3.07 persons per family, with single female/mother families (1,610 | 21.3%) accounting for the largest median family size of 3.42 persons per family. On the other hand, single male/father families (991 | 13.1%) represent the smallest median family size with 2.66 persons per family.
| Family Type | # Families | Family Size |
| Married-Couple | 4,971 (65.6%) | 3.04 |
| Single Male/Father | 991 (13.1%) | 2.66 |
| Single Female/Mother | 1,610 (21.3%) | 3.42 |
| Total Families | 7,572 (100.0%) | 3.07 |
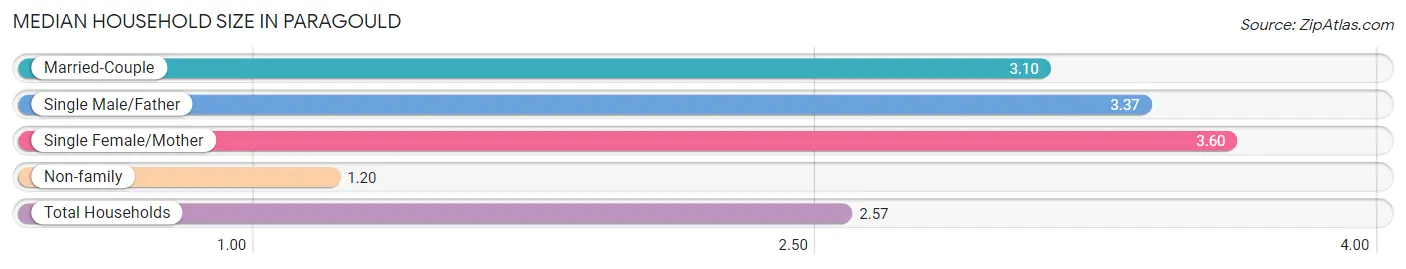
Median Household Size in Paragould
The median household size in Paragould is 2.57 persons per household, with single female/mother households (1,610 | 14.3%) accounting for the largest median household size of 3.6 persons per household. non-family households (3,709 | 32.9%) represent the smallest median household size with 1.20 persons per household.
| Household Type | # Households | Household Size |
| Married-Couple | 4,971 (44.1%) | 3.10 |
| Single Male/Father | 991 (8.8%) | 3.37 |
| Single Female/Mother | 1,610 (14.3%) | 3.60 |
| Non-family | 3,709 (32.9%) | 1.20 |
| Total Households | 11,281 (100.0%) | 2.57 |
Household Size by Marriage Status in Paragould
Out of a total of 11,281 households in Paragould, 7,572 (67.1%) are family households, while 3,709 (32.9%) are nonfamily households. The most numerous type of family households are 2-person households, comprising 3,269, and the most common type of nonfamily households are 1-person households, comprising 3,133.
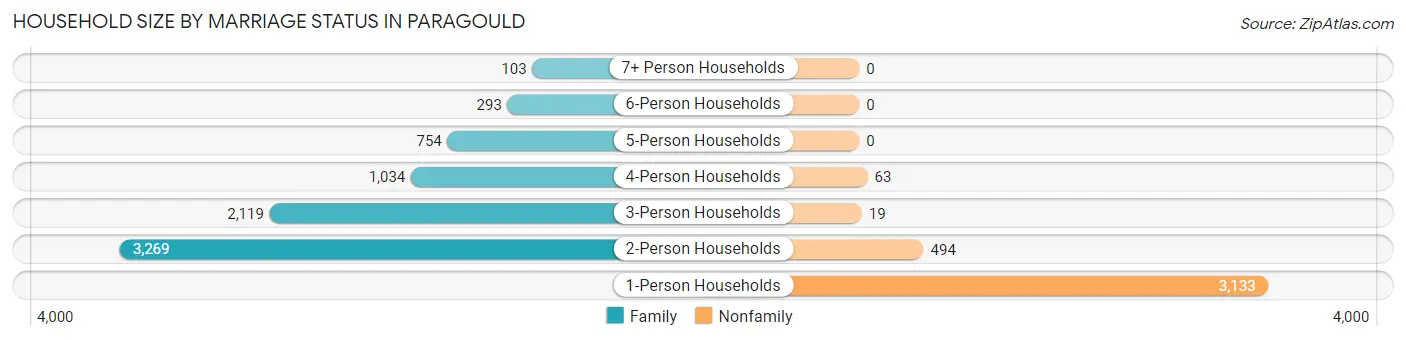
| Household Size | Family Households | Nonfamily Households |
| 1-Person Households | - | 3,133 (27.8%) |
| 2-Person Households | 3,269 (29.0%) | 494 (4.4%) |
| 3-Person Households | 2,119 (18.8%) | 19 (0.2%) |
| 4-Person Households | 1,034 (9.2%) | 63 (0.6%) |
| 5-Person Households | 754 (6.7%) | 0 (0.0%) |
| 6-Person Households | 293 (2.6%) | 0 (0.0%) |
| 7+ Person Households | 103 (0.9%) | 0 (0.0%) |
| Total | 7,572 (67.1%) | 3,709 (32.9%) |
Female Fertility in Paragould
Fertility by Age in Paragould
Average fertility rate in Paragould is 28.0 births per 1,000 women. Women in the age bracket of 20 to 34 years have the highest fertility rate with 52.0 births per 1,000 women. Women in the age bracket of 20 to 34 years acount for 81.2% of all women with births.
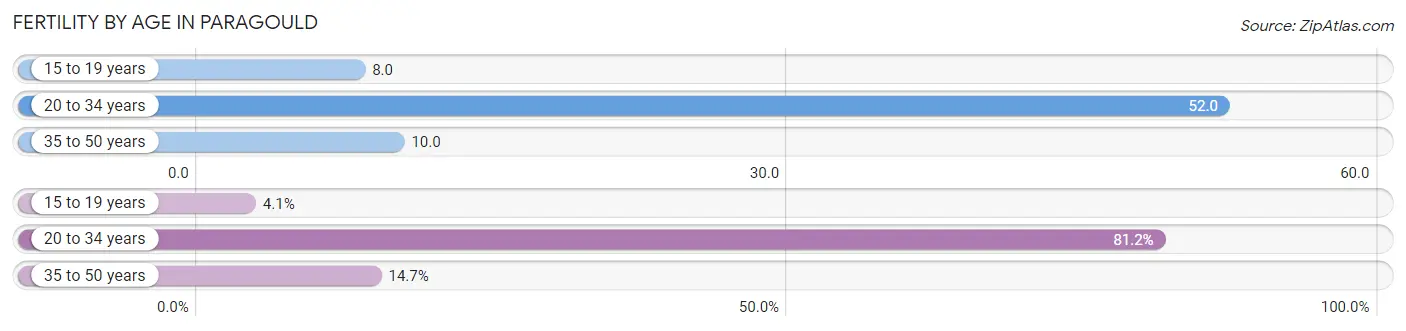
| Age Bracket | Women with Births | Births / 1,000 Women |
| 15 to 19 years | 8 (4.1%) | 8.0 |
| 20 to 34 years | 160 (81.2%) | 52.0 |
| 35 to 50 years | 29 (14.7%) | 10.0 |
| Total | 197 (100.0%) | 28.0 |
Fertility by Age by Marriage Status in Paragould
68.5% of women with births (197) in Paragould are married. The highest percentage of unmarried women with births falls into 15 to 19 years age bracket with 100.0% of them unmarried at the time of birth, while the lowest percentage of unmarried women with births belong to 35 to 50 years age bracket with 0.0% of them unmarried.
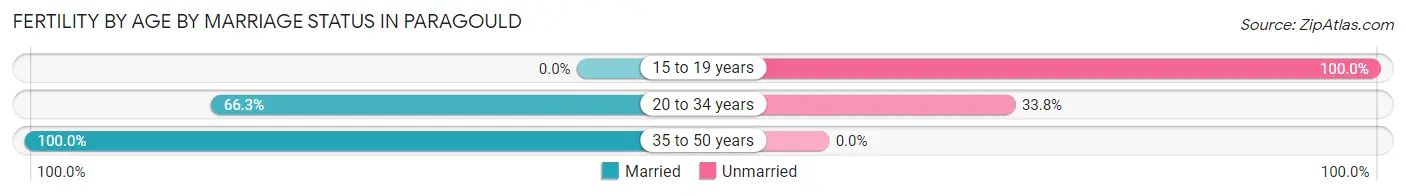
| Age Bracket | Married | Unmarried |
| 15 to 19 years | 0 (0.0%) | 8 (100.0%) |
| 20 to 34 years | 106 (66.2%) | 54 (33.8%) |
| 35 to 50 years | 29 (100.0%) | 0 (0.0%) |
| Total | 135 (68.5%) | 62 (31.5%) |
Fertility by Education in Paragould
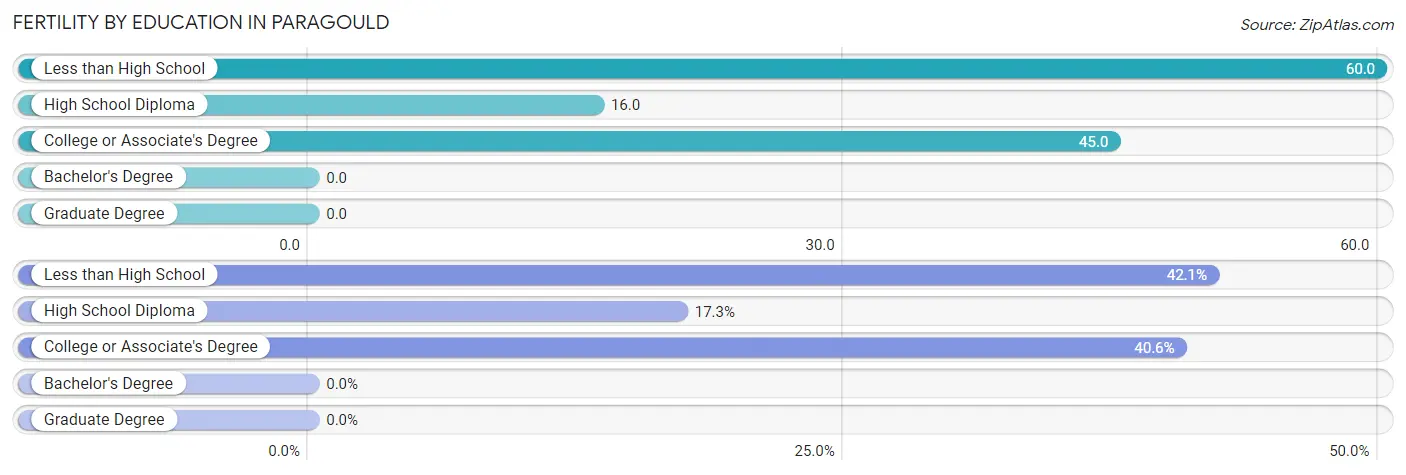
| Educational Attainment | Women with Births | Births / 1,000 Women |
| Less than High School | 83 (42.1%) | 60.0 |
| High School Diploma | 34 (17.3%) | 16.0 |
| College or Associate's Degree | 80 (40.6%) | 45.0 |
| Bachelor's Degree | 0 (0.0%) | 0.0 |
| Graduate Degree | 0 (0.0%) | 0.0 |
| Total | 197 (100.0%) | 28.0 |
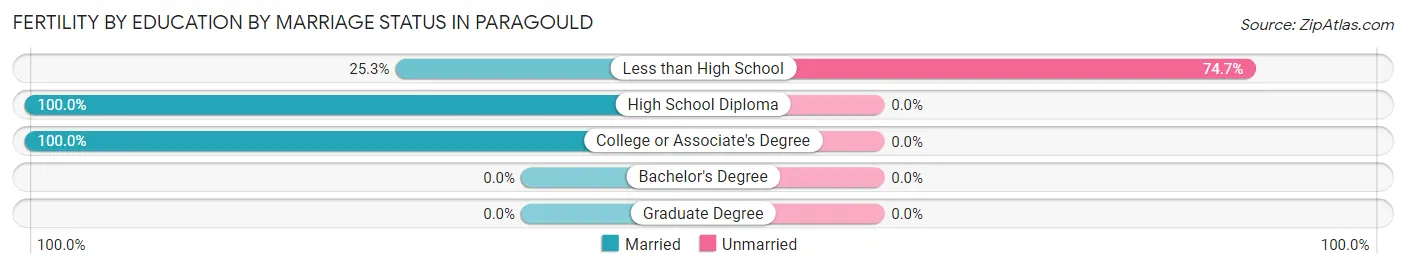
Fertility by Education by Marriage Status in Paragould
31.5% of women with births in Paragould are unmarried. Women with the educational attainment of high school diploma are most likely to be married with 100.0% of them married at childbirth, while women with the educational attainment of less than high school are least likely to be married with 74.7% of them unmarried at childbirth.
| Educational Attainment | Married | Unmarried |
| Less than High School | 21 (25.3%) | 62 (74.7%) |
| High School Diploma | 34 (100.0%) | 0 (0.0%) |
| College or Associate's Degree | 80 (100.0%) | 0 (0.0%) |
| Bachelor's Degree | 0 (0.0%) | 0 (0.0%) |
| Graduate Degree | 0 (0.0%) | 0 (0.0%) |
| Total | 135 (68.5%) | 62 (31.5%) |
Employment Characteristics in Paragould
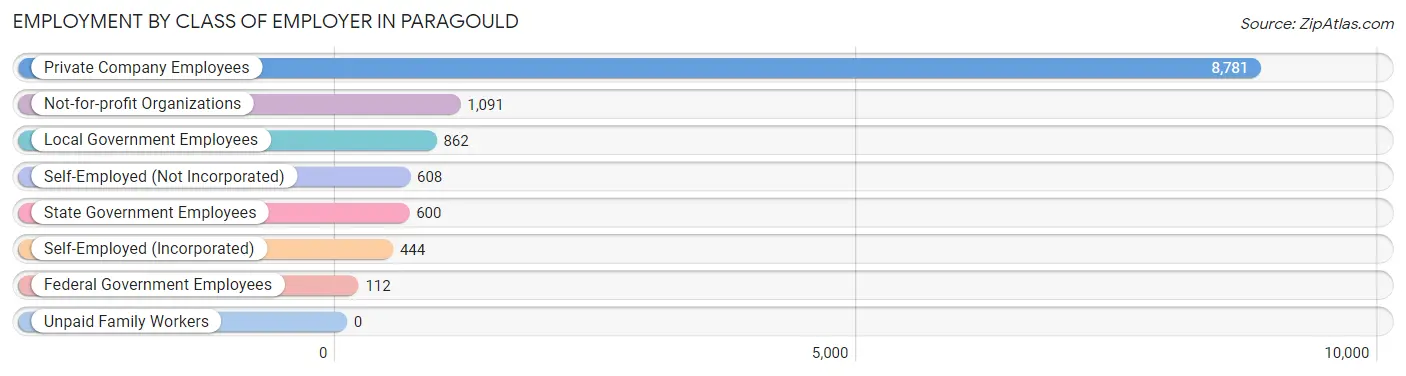
Employment by Class of Employer in Paragould
Among the 12,498 employed individuals in Paragould, private company employees (8,781 | 70.3%), not-for-profit organizations (1,091 | 8.7%), and local government employees (862 | 6.9%) make up the most common classes of employment.
| Employer Class | # Employees | % Employees |
| Private Company Employees | 8,781 | 70.3% |
| Self-Employed (Incorporated) | 444 | 3.5% |
| Self-Employed (Not Incorporated) | 608 | 4.9% |
| Not-for-profit Organizations | 1,091 | 8.7% |
| Local Government Employees | 862 | 6.9% |
| State Government Employees | 600 | 4.8% |
| Federal Government Employees | 112 | 0.9% |
| Unpaid Family Workers | 0 | 0.0% |
| Total | 12,498 | 100.0% |
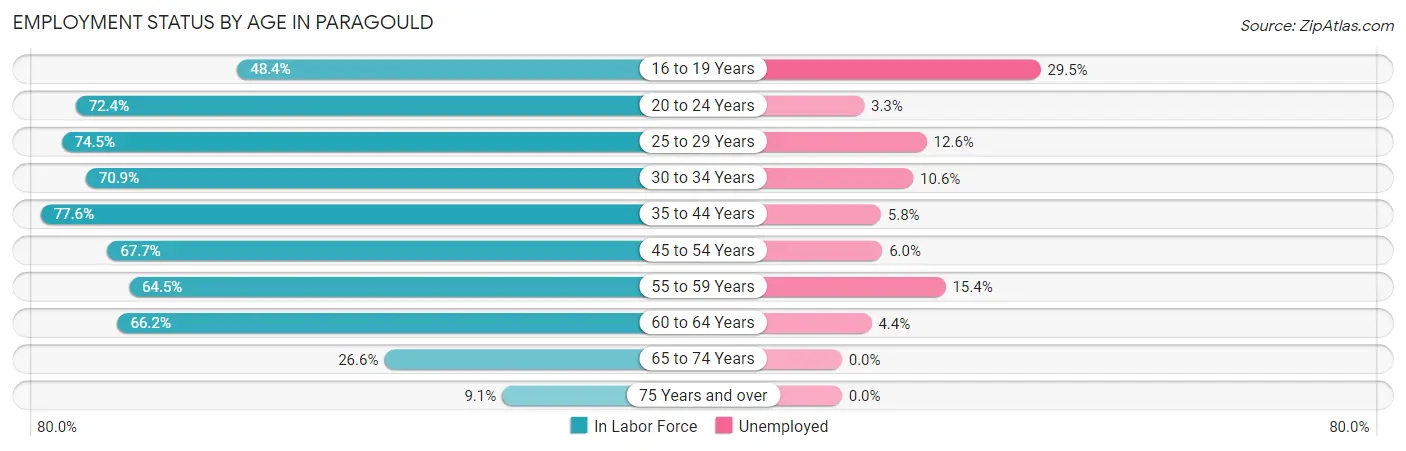
Employment Status by Age in Paragould
According to the labor force statistics for Paragould, out of the total population over 16 years of age (23,063), 60.2% or 13,884 individuals are in the labor force, with 8.5% or 1,180 of them unemployed. The age group with the highest labor force participation rate is 35 to 44 years, with 77.6% or 3,310 individuals in the labor force. Within the labor force, the 16 to 19 years age range has the highest percentage of unemployed individuals, with 29.5% or 230 of them being unemployed.
| Age Bracket | In Labor Force | Unemployed |
| 16 to 19 Years | 780 (48.4%) | 230 (29.5%) |
| 20 to 24 Years | 1,354 (72.4%) | 45 (3.3%) |
| 25 to 29 Years | 1,509 (74.5%) | 190 (12.6%) |
| 30 to 34 Years | 1,573 (70.9%) | 167 (10.6%) |
| 35 to 44 Years | 3,310 (77.6%) | 192 (5.8%) |
| 45 to 54 Years | 2,163 (67.7%) | 130 (6.0%) |
| 55 to 59 Years | 1,114 (64.5%) | 172 (15.4%) |
| 60 to 64 Years | 1,266 (66.2%) | 56 (4.4%) |
| 65 to 74 Years | 667 (26.6%) | 0 (0.0%) |
| 75 Years and over | 157 (9.1%) | 0 (0.0%) |
| Total | 13,884 (60.2%) | 1,180 (8.5%) |
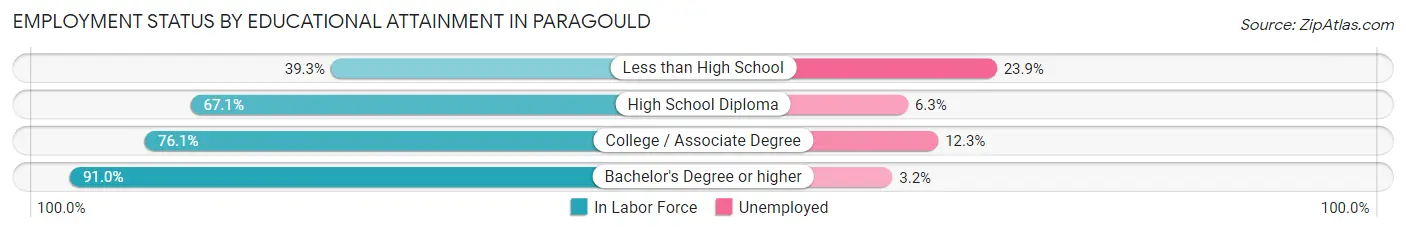
Employment Status by Educational Attainment in Paragould
According to labor force statistics for Paragould, 71.3% of individuals (10,942) out of the total population between 25 and 64 years of age (15,346) are in the labor force, with 8.3% or 908 of them being unemployed. The group with the highest labor force participation rate are those with the educational attainment of bachelor's degree or higher, with 91.0% or 2,642 individuals in the labor force. Within the labor force, individuals with less than high school education have the highest percentage of unemployment, with 23.9% or 145 of them being unemployed.
| Educational Attainment | In Labor Force | Unemployed |
| Less than High School | 607 (39.3%) | 369 (23.9%) |
| High School Diploma | 4,526 (67.1%) | 425 (6.3%) |
| College / Associate Degree | 3,160 (76.1%) | 511 (12.3%) |
| Bachelor's Degree or higher | 2,642 (91.0%) | 93 (3.2%) |
| Total | 10,942 (71.3%) | 1,274 (8.3%) |
Employment Occupations by Sex in Paragould
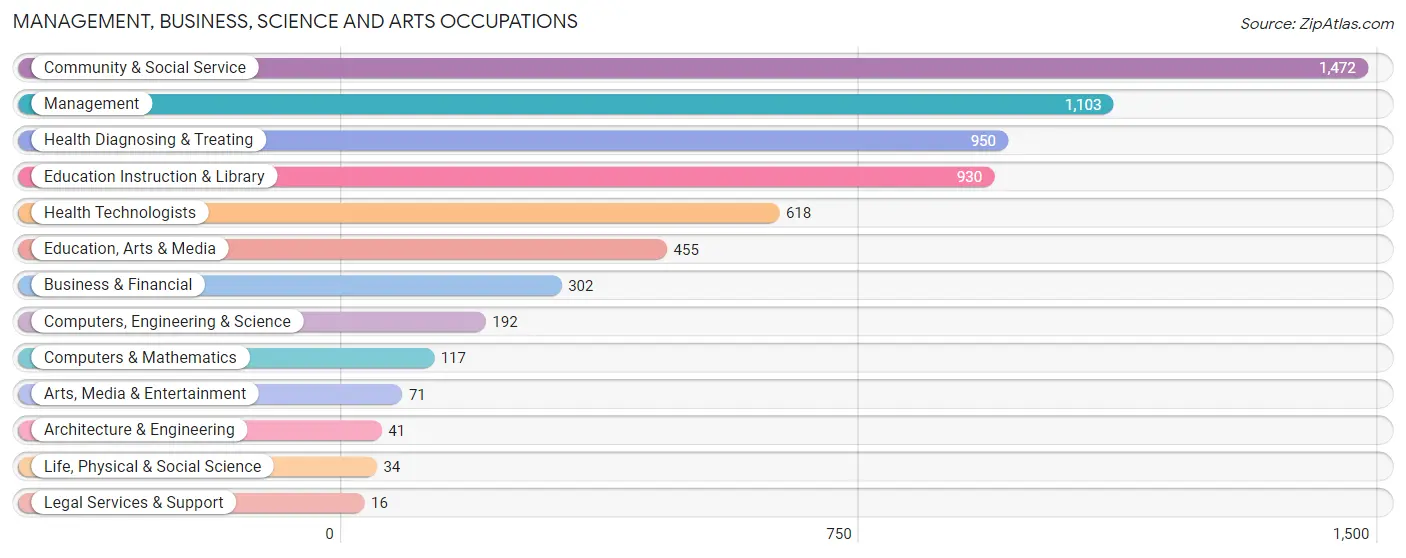
Management, Business, Science and Arts Occupations
The most common Management, Business, Science and Arts occupations in Paragould are Community & Social Service (1,472 | 11.6%), Management (1,103 | 8.7%), Health Diagnosing & Treating (950 | 7.5%), Education Instruction & Library (930 | 7.3%), and Health Technologists (618 | 4.9%).
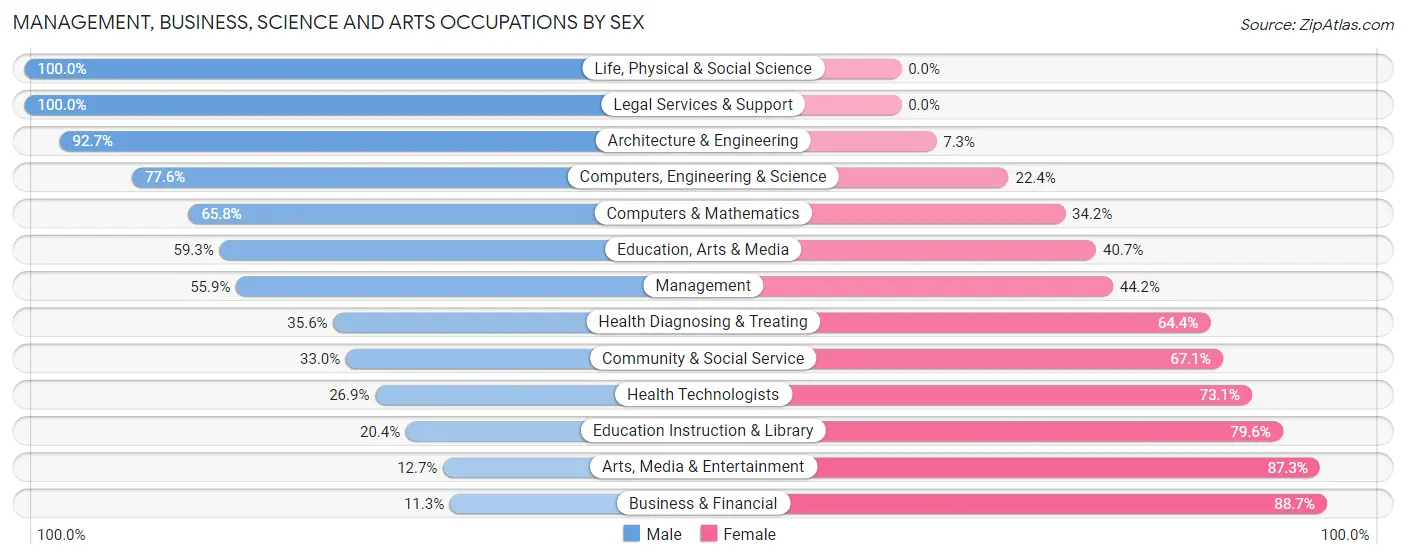
Management, Business, Science and Arts Occupations by Sex
Within the Management, Business, Science and Arts occupations in Paragould, the most male-oriented occupations are Life, Physical & Social Science (100.0%), Legal Services & Support (100.0%), and Architecture & Engineering (92.7%), while the most female-oriented occupations are Business & Financial (88.7%), Arts, Media & Entertainment (87.3%), and Education Instruction & Library (79.6%).
| Occupation | Male | Female |
| Management | 616 (55.8%) | 487 (44.2%) |
| Business & Financial | 34 (11.3%) | 268 (88.7%) |
| Computers, Engineering & Science | 149 (77.6%) | 43 (22.4%) |
| Computers & Mathematics | 77 (65.8%) | 40 (34.2%) |
| Architecture & Engineering | 38 (92.7%) | 3 (7.3%) |
| Life, Physical & Social Science | 34 (100.0%) | 0 (0.0%) |
| Community & Social Service | 485 (33.0%) | 987 (67.0%) |
| Education, Arts & Media | 270 (59.3%) | 185 (40.7%) |
| Legal Services & Support | 16 (100.0%) | 0 (0.0%) |
| Education Instruction & Library | 190 (20.4%) | 740 (79.6%) |
| Arts, Media & Entertainment | 9 (12.7%) | 62 (87.3%) |
| Health Diagnosing & Treating | 338 (35.6%) | 612 (64.4%) |
| Health Technologists | 166 (26.9%) | 452 (73.1%) |
| Total (Category) | 1,622 (40.4%) | 2,397 (59.6%) |
| Total (Overall) | 6,905 (54.3%) | 5,809 (45.7%) |
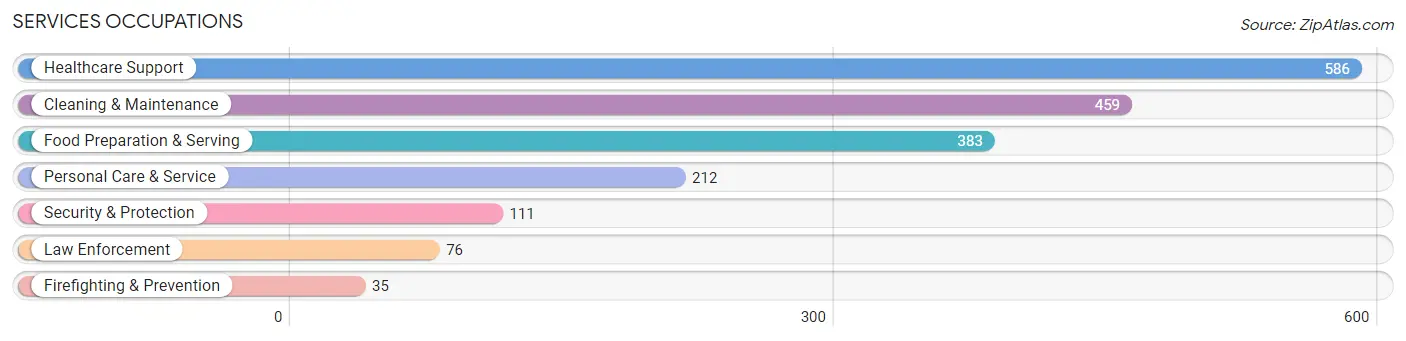
Services Occupations
The most common Services occupations in Paragould are Healthcare Support (586 | 4.6%), Cleaning & Maintenance (459 | 3.6%), Food Preparation & Serving (383 | 3.0%), Personal Care & Service (212 | 1.7%), and Security & Protection (111 | 0.9%).
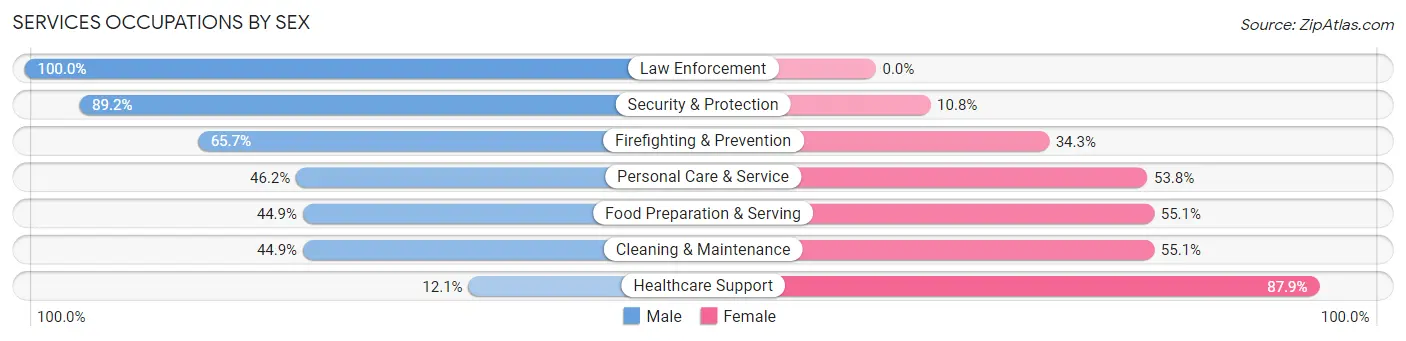
Services Occupations by Sex
Within the Services occupations in Paragould, the most male-oriented occupations are Law Enforcement (100.0%), Security & Protection (89.2%), and Firefighting & Prevention (65.7%), while the most female-oriented occupations are Healthcare Support (87.9%), Cleaning & Maintenance (55.1%), and Food Preparation & Serving (55.1%).
| Occupation | Male | Female |
| Healthcare Support | 71 (12.1%) | 515 (87.9%) |
| Security & Protection | 99 (89.2%) | 12 (10.8%) |
| Firefighting & Prevention | 23 (65.7%) | 12 (34.3%) |
| Law Enforcement | 76 (100.0%) | 0 (0.0%) |
| Food Preparation & Serving | 172 (44.9%) | 211 (55.1%) |
| Cleaning & Maintenance | 206 (44.9%) | 253 (55.1%) |
| Personal Care & Service | 98 (46.2%) | 114 (53.8%) |
| Total (Category) | 646 (36.9%) | 1,105 (63.1%) |
| Total (Overall) | 6,905 (54.3%) | 5,809 (45.7%) |
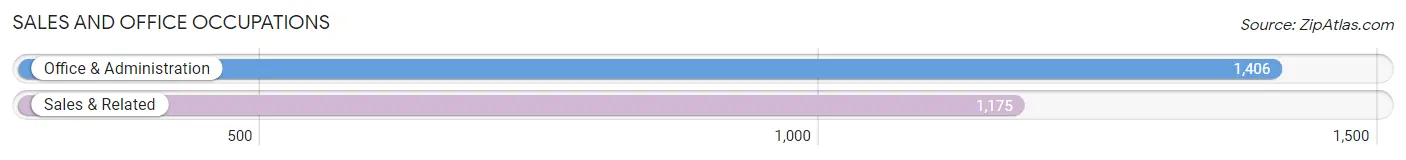
Sales and Office Occupations
The most common Sales and Office occupations in Paragould are Office & Administration (1,406 | 11.1%), and Sales & Related (1,175 | 9.2%).
Sales and Office Occupations by Sex
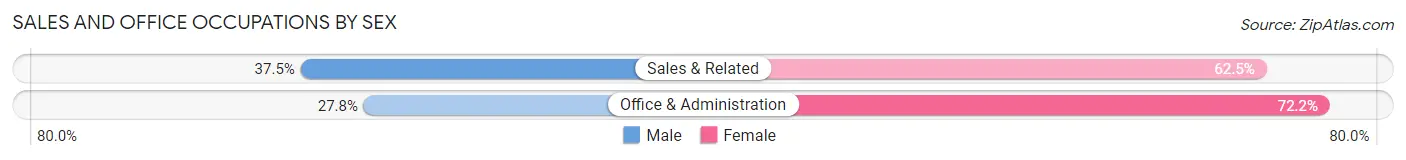
| Occupation | Male | Female |
| Sales & Related | 441 (37.5%) | 734 (62.5%) |
| Office & Administration | 391 (27.8%) | 1,015 (72.2%) |
| Total (Category) | 832 (32.2%) | 1,749 (67.8%) |
| Total (Overall) | 6,905 (54.3%) | 5,809 (45.7%) |
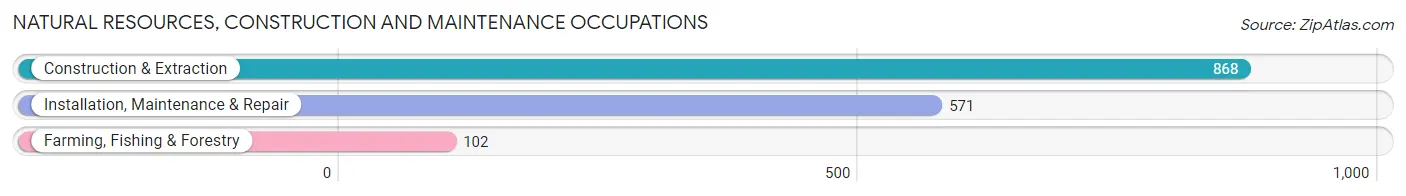
Natural Resources, Construction and Maintenance Occupations
The most common Natural Resources, Construction and Maintenance occupations in Paragould are Construction & Extraction (868 | 6.8%), Installation, Maintenance & Repair (571 | 4.5%), and Farming, Fishing & Forestry (102 | 0.8%).
Natural Resources, Construction and Maintenance Occupations by Sex
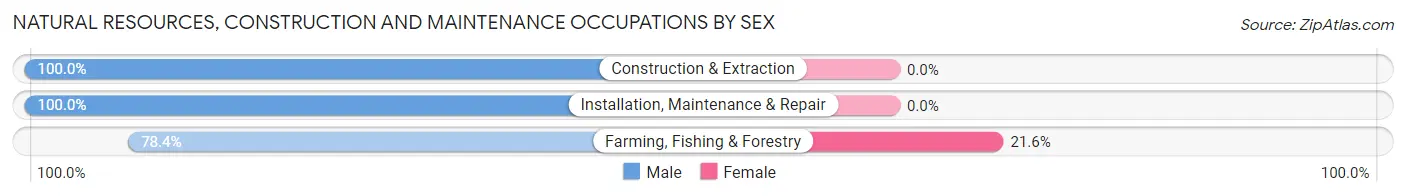
| Occupation | Male | Female |
| Farming, Fishing & Forestry | 80 (78.4%) | 22 (21.6%) |
| Construction & Extraction | 868 (100.0%) | 0 (0.0%) |
| Installation, Maintenance & Repair | 571 (100.0%) | 0 (0.0%) |
| Total (Category) | 1,519 (98.6%) | 22 (1.4%) |
| Total (Overall) | 6,905 (54.3%) | 5,809 (45.7%) |
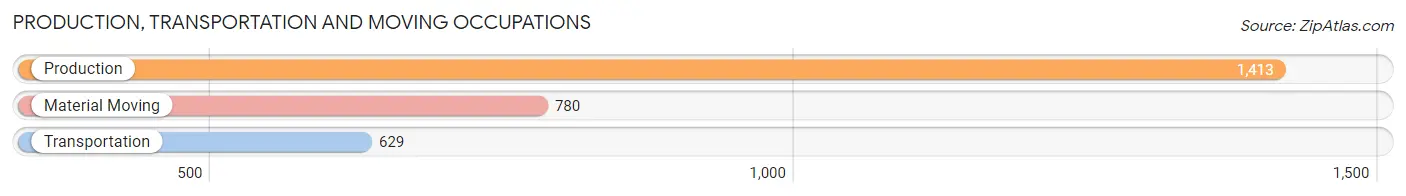
Production, Transportation and Moving Occupations
The most common Production, Transportation and Moving occupations in Paragould are Production (1,413 | 11.1%), Material Moving (780 | 6.1%), and Transportation (629 | 5.0%).
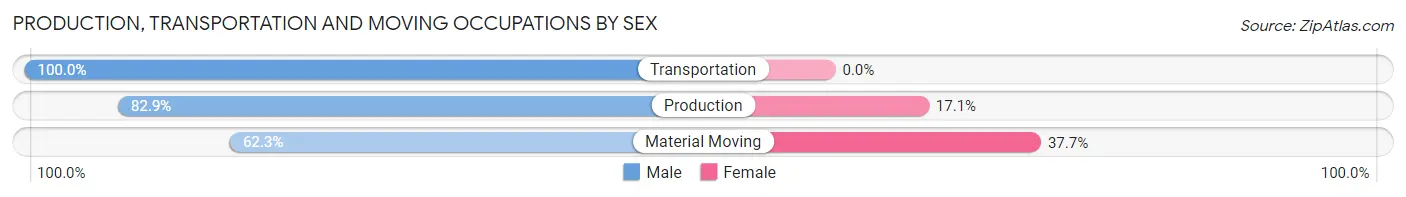
Production, Transportation and Moving Occupations by Sex
| Occupation | Male | Female |
| Production | 1,171 (82.9%) | 242 (17.1%) |
| Transportation | 629 (100.0%) | 0 (0.0%) |
| Material Moving | 486 (62.3%) | 294 (37.7%) |
| Total (Category) | 2,286 (81.0%) | 536 (19.0%) |
| Total (Overall) | 6,905 (54.3%) | 5,809 (45.7%) |
Employment Industries by Sex in Paragould
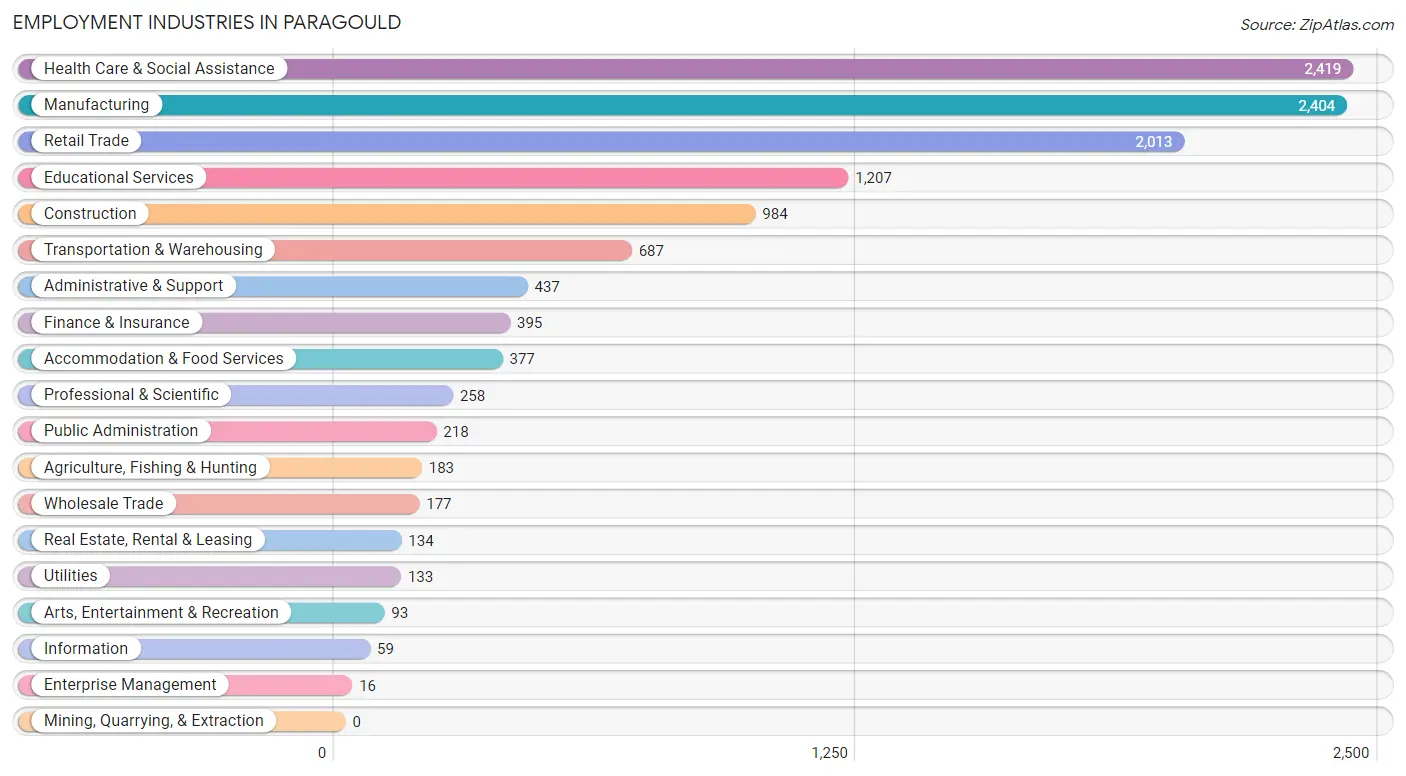
Employment Industries in Paragould
The major employment industries in Paragould include Health Care & Social Assistance (2,419 | 19.0%), Manufacturing (2,404 | 18.9%), Retail Trade (2,013 | 15.8%), Educational Services (1,207 | 9.5%), and Construction (984 | 7.7%).
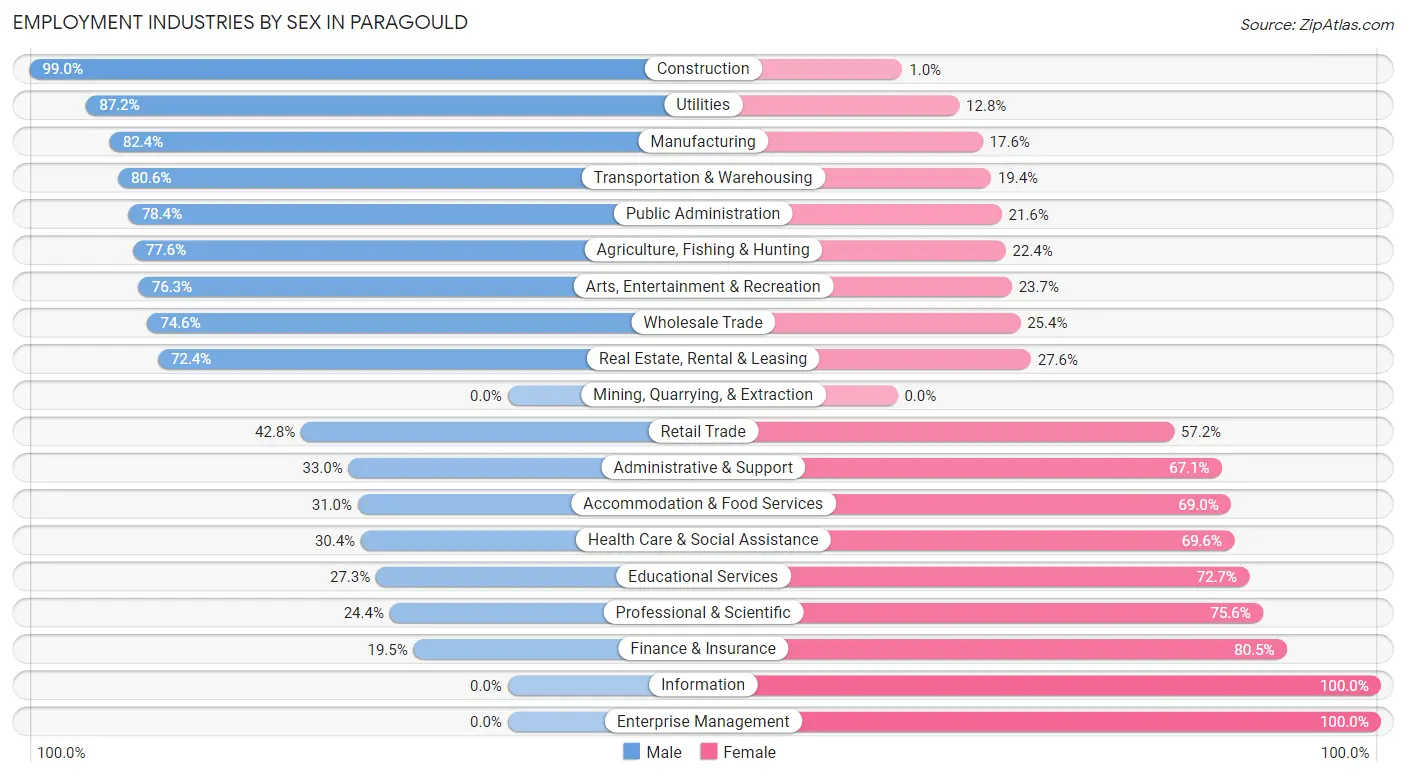
Employment Industries by Sex in Paragould
The Paragould industries that see more men than women are Construction (99.0%), Utilities (87.2%), and Manufacturing (82.4%), whereas the industries that tend to have a higher number of women are Information (100.0%), Enterprise Management (100.0%), and Finance & Insurance (80.5%).
| Industry | Male | Female |
| Agriculture, Fishing & Hunting | 142 (77.6%) | 41 (22.4%) |
| Mining, Quarrying, & Extraction | 0 (0.0%) | 0 (0.0%) |
| Construction | 974 (99.0%) | 10 (1.0%) |
| Manufacturing | 1,980 (82.4%) | 424 (17.6%) |
| Wholesale Trade | 132 (74.6%) | 45 (25.4%) |
| Retail Trade | 861 (42.8%) | 1,152 (57.2%) |
| Transportation & Warehousing | 554 (80.6%) | 133 (19.4%) |
| Utilities | 116 (87.2%) | 17 (12.8%) |
| Information | 0 (0.0%) | 59 (100.0%) |
| Finance & Insurance | 77 (19.5%) | 318 (80.5%) |
| Real Estate, Rental & Leasing | 97 (72.4%) | 37 (27.6%) |
| Professional & Scientific | 63 (24.4%) | 195 (75.6%) |
| Enterprise Management | 0 (0.0%) | 16 (100.0%) |
| Administrative & Support | 144 (33.0%) | 293 (67.0%) |
| Educational Services | 329 (27.3%) | 878 (72.7%) |
| Health Care & Social Assistance | 735 (30.4%) | 1,684 (69.6%) |
| Arts, Entertainment & Recreation | 71 (76.3%) | 22 (23.7%) |
| Accommodation & Food Services | 117 (31.0%) | 260 (69.0%) |
| Public Administration | 171 (78.4%) | 47 (21.6%) |
| Total | 6,905 (54.3%) | 5,809 (45.7%) |
Education in Paragould
School Enrollment in Paragould
The most common levels of schooling among the 7,295 students in Paragould are middle school (1,731 | 23.7%), high school (1,553 | 21.3%), and elementary school (1,480 | 20.3%).
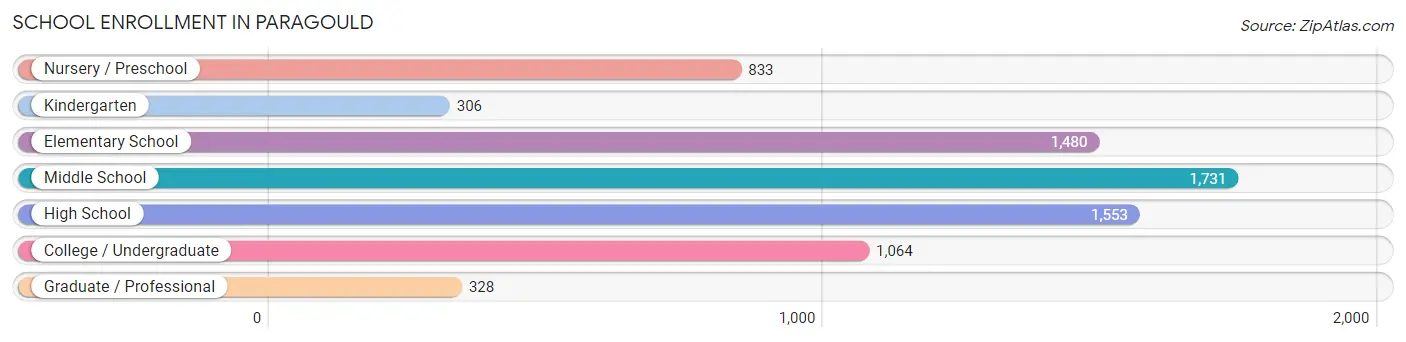
| School Level | # Students | % Students |
| Nursery / Preschool | 833 | 11.4% |
| Kindergarten | 306 | 4.2% |
| Elementary School | 1,480 | 20.3% |
| Middle School | 1,731 | 23.7% |
| High School | 1,553 | 21.3% |
| College / Undergraduate | 1,064 | 14.6% |
| Graduate / Professional | 328 | 4.5% |
| Total | 7,295 | 100.0% |
School Enrollment by Age by Funding Source in Paragould
Out of a total of 7,295 students who are enrolled in schools in Paragould, 518 (7.1%) attend a private institution, while the remaining 6,777 (92.9%) are enrolled in public schools. The age group of 35 years and over has the highest likelihood of being enrolled in private schools, with 112 (31.4% in the age bracket) enrolled. Conversely, the age group of 25 to 34 year olds has the lowest likelihood of being enrolled in a private school, with 471 (100.0% in the age bracket) attending a public institution.
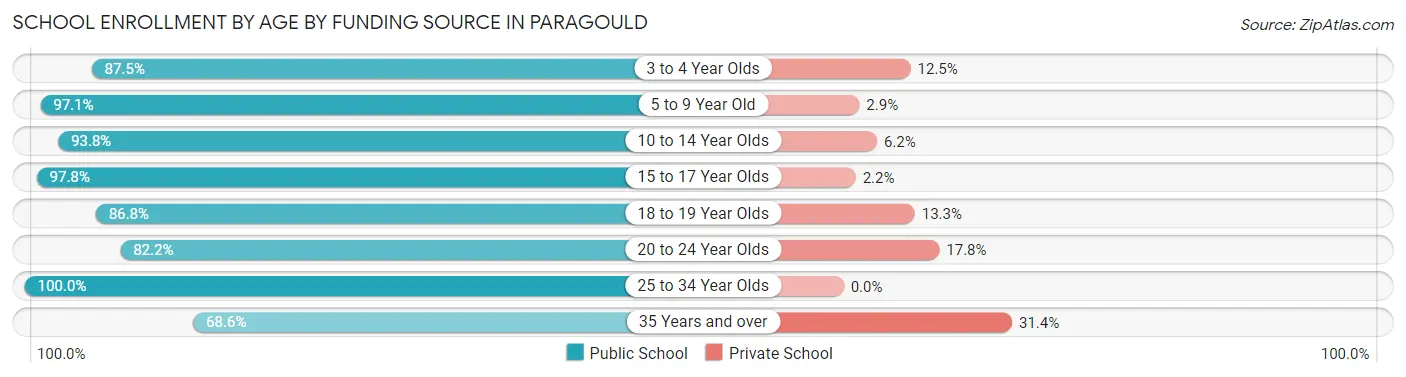
| Age Bracket | Public School | Private School |
| 3 to 4 Year Olds | 421 (87.5%) | 60 (12.5%) |
| 5 to 9 Year Old | 1,723 (97.1%) | 52 (2.9%) |
| 10 to 14 Year Olds | 1,974 (93.8%) | 131 (6.2%) |
| 15 to 17 Year Olds | 1,221 (97.8%) | 28 (2.2%) |
| 18 to 19 Year Olds | 393 (86.8%) | 60 (13.3%) |
| 20 to 24 Year Olds | 332 (82.2%) | 72 (17.8%) |
| 25 to 34 Year Olds | 471 (100.0%) | 0 (0.0%) |
| 35 Years and over | 245 (68.6%) | 112 (31.4%) |
| Total | 6,777 (92.9%) | 518 (7.1%) |
Educational Attainment by Field of Study in Paragould
Science & technology (843 | 23.1%), education (676 | 18.5%), business (505 | 13.9%), bio, nature & agricultural (277 | 7.6%), and arts & humanities (271 | 7.4%) are the most common fields of study among 3,646 individuals in Paragould who have obtained a bachelor's degree or higher.
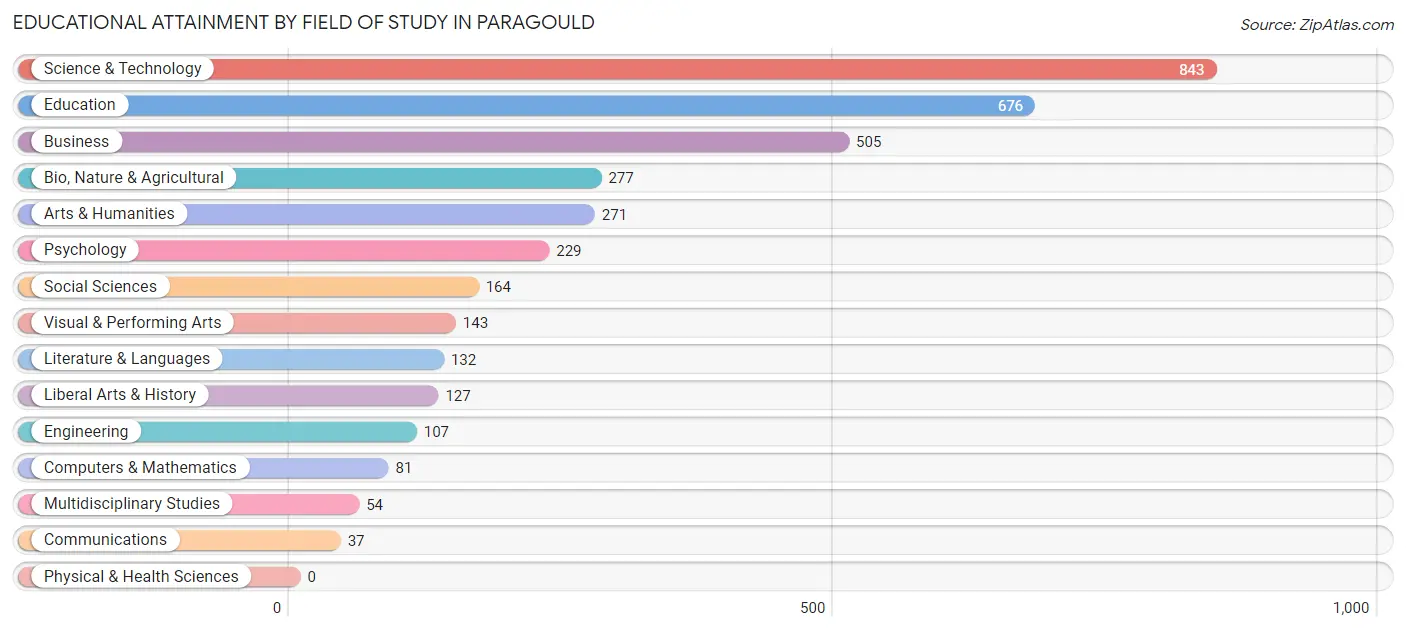
| Field of Study | # Graduates | % Graduates |
| Computers & Mathematics | 81 | 2.2% |
| Bio, Nature & Agricultural | 277 | 7.6% |
| Physical & Health Sciences | 0 | 0.0% |
| Psychology | 229 | 6.3% |
| Social Sciences | 164 | 4.5% |
| Engineering | 107 | 2.9% |
| Multidisciplinary Studies | 54 | 1.5% |
| Science & Technology | 843 | 23.1% |
| Business | 505 | 13.9% |
| Education | 676 | 18.5% |
| Literature & Languages | 132 | 3.6% |
| Liberal Arts & History | 127 | 3.5% |
| Visual & Performing Arts | 143 | 3.9% |
| Communications | 37 | 1.0% |
| Arts & Humanities | 271 | 7.4% |
| Total | 3,646 | 100.0% |
Transportation & Commute in Paragould
Vehicle Availability by Sex in Paragould
The most prevalent vehicle ownership categories in Paragould are males with 2 vehicles (3,113, accounting for 46.8%) and females with 2 vehicles (2,507, making up 53.9%).
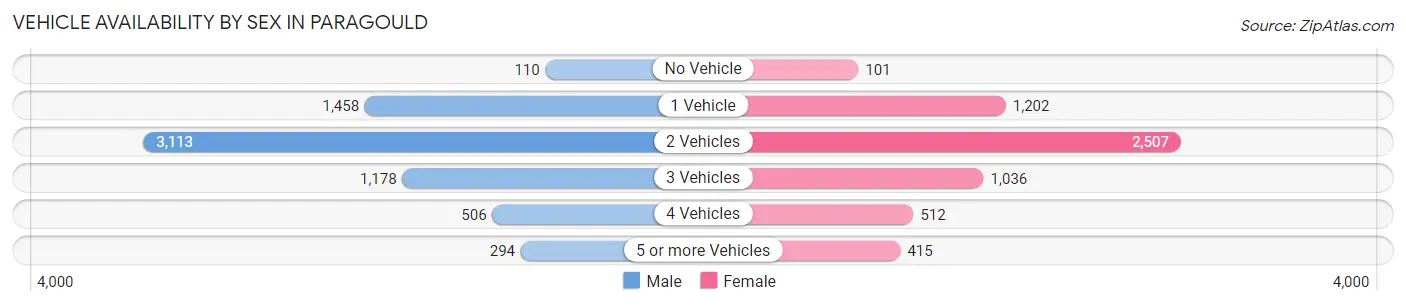
| Vehicles Available | Male | Female |
| No Vehicle | 110 (1.7%) | 101 (1.8%) |
| 1 Vehicle | 1,458 (21.9%) | 1,202 (20.8%) |
| 2 Vehicles | 3,113 (46.8%) | 2,507 (43.4%) |
| 3 Vehicles | 1,178 (17.7%) | 1,036 (17.9%) |
| 4 Vehicles | 506 (7.6%) | 512 (8.9%) |
| 5 or more Vehicles | 294 (4.4%) | 415 (7.2%) |
| Total | 6,659 (100.0%) | 5,773 (100.0%) |
Commute Time in Paragould
The most frequently occuring commute durations in Paragould are 10 to 14 minutes (3,175 commuters, 26.2%), 5 to 9 minutes (2,407 commuters, 19.8%), and 30 to 34 minutes (1,459 commuters, 12.0%).
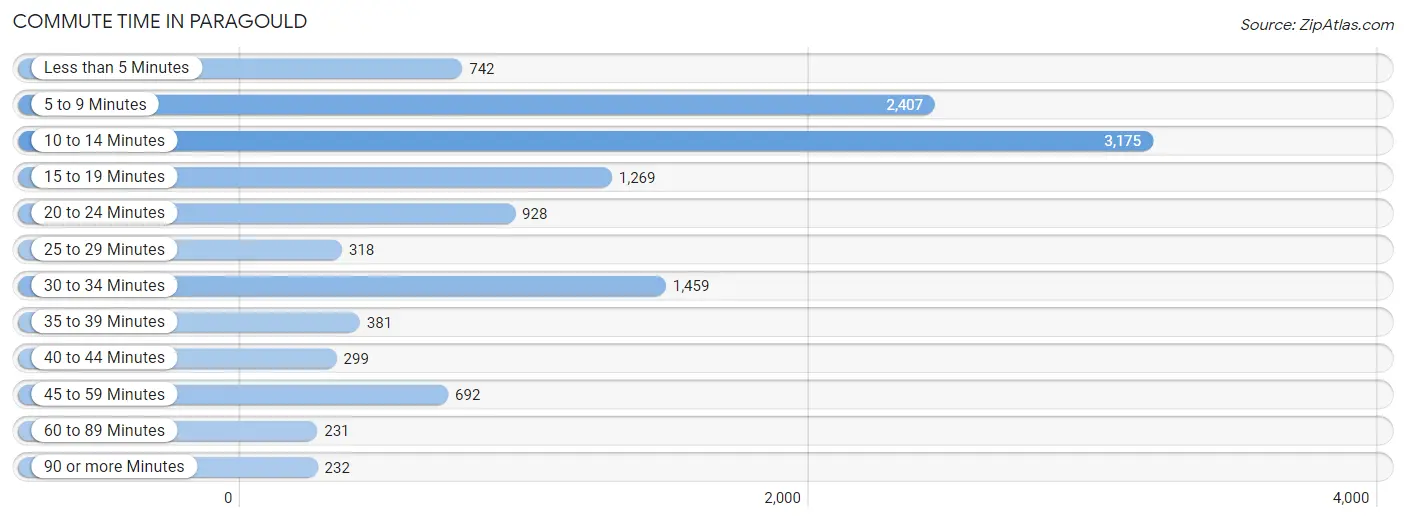
| Commute Time | # Commuters | % Commuters |
| Less than 5 Minutes | 742 | 6.1% |
| 5 to 9 Minutes | 2,407 | 19.8% |
| 10 to 14 Minutes | 3,175 | 26.2% |
| 15 to 19 Minutes | 1,269 | 10.5% |
| 20 to 24 Minutes | 928 | 7.6% |
| 25 to 29 Minutes | 318 | 2.6% |
| 30 to 34 Minutes | 1,459 | 12.0% |
| 35 to 39 Minutes | 381 | 3.1% |
| 40 to 44 Minutes | 299 | 2.5% |
| 45 to 59 Minutes | 692 | 5.7% |
| 60 to 89 Minutes | 231 | 1.9% |
| 90 or more Minutes | 232 | 1.9% |
Commute Time by Sex in Paragould
The most common commute times in Paragould are 10 to 14 minutes (1,524 commuters, 23.6%) for males and 10 to 14 minutes (1,651 commuters, 29.1%) for females.
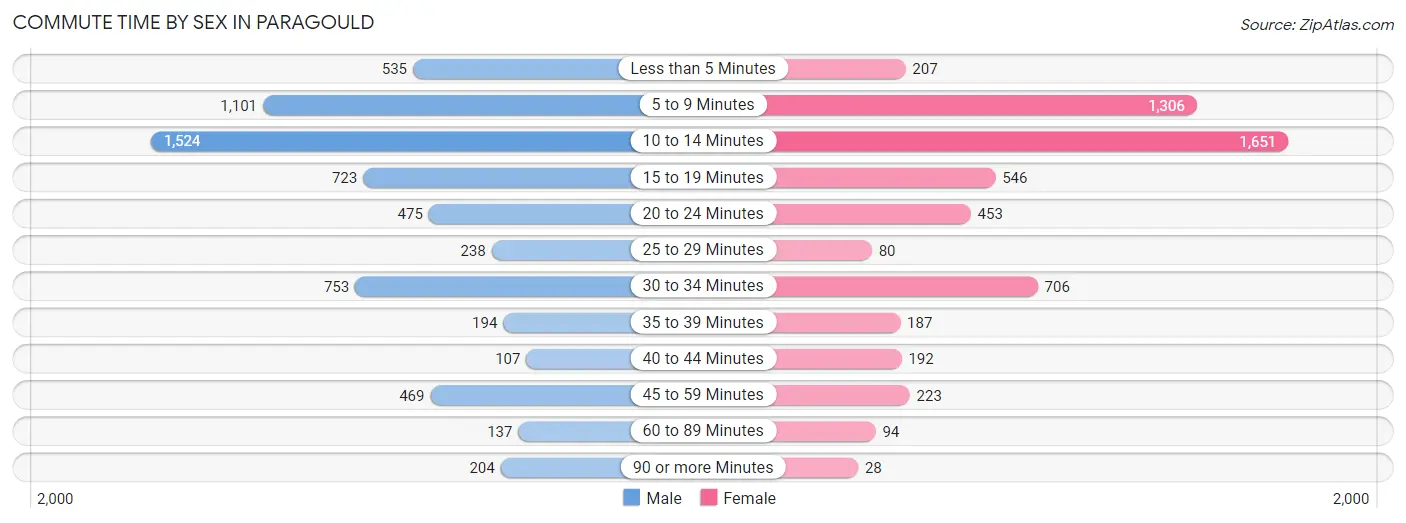
| Commute Time | Male | Female |
| Less than 5 Minutes | 535 (8.3%) | 207 (3.6%) |
| 5 to 9 Minutes | 1,101 (17.0%) | 1,306 (23.0%) |
| 10 to 14 Minutes | 1,524 (23.6%) | 1,651 (29.1%) |
| 15 to 19 Minutes | 723 (11.2%) | 546 (9.6%) |
| 20 to 24 Minutes | 475 (7.3%) | 453 (8.0%) |
| 25 to 29 Minutes | 238 (3.7%) | 80 (1.4%) |
| 30 to 34 Minutes | 753 (11.7%) | 706 (12.4%) |
| 35 to 39 Minutes | 194 (3.0%) | 187 (3.3%) |
| 40 to 44 Minutes | 107 (1.7%) | 192 (3.4%) |
| 45 to 59 Minutes | 469 (7.3%) | 223 (3.9%) |
| 60 to 89 Minutes | 137 (2.1%) | 94 (1.7%) |
| 90 or more Minutes | 204 (3.2%) | 28 (0.5%) |
Time of Departure to Work by Sex in Paragould
The most frequent times of departure to work in Paragould are 6:30 AM to 6:59 AM (839, 13.0%) for males and 7:00 AM to 7:29 AM (1,144, 20.2%) for females.
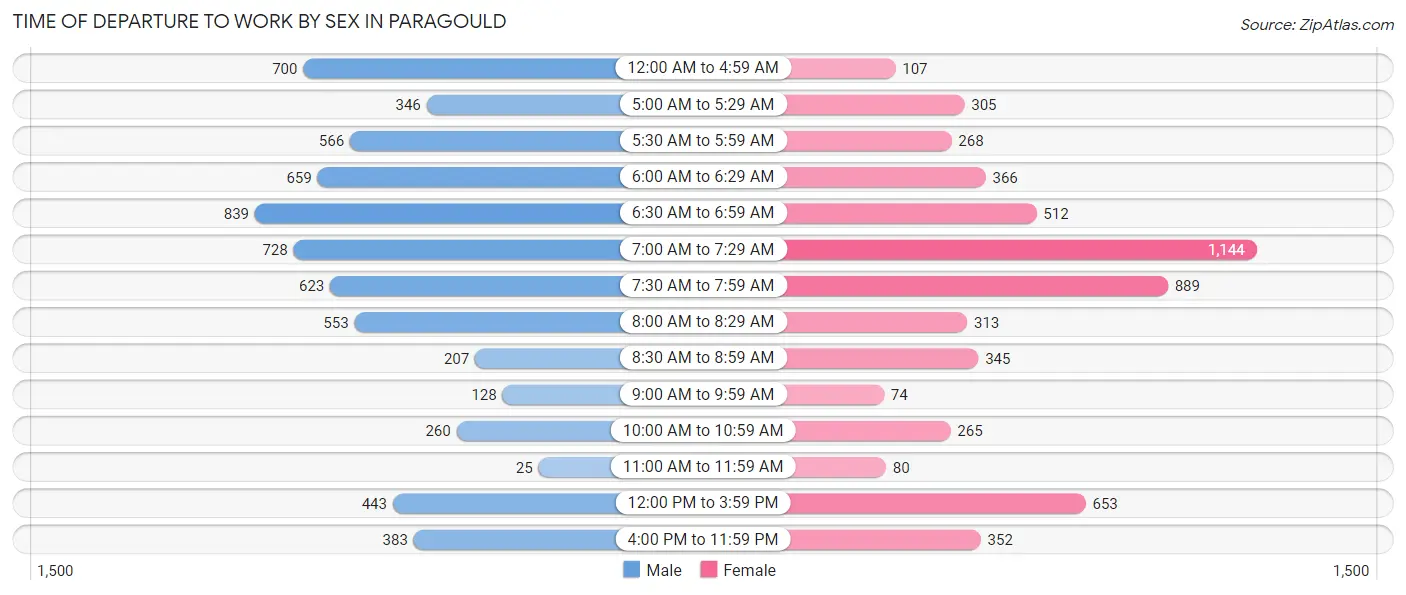
| Time of Departure | Male | Female |
| 12:00 AM to 4:59 AM | 700 (10.8%) | 107 (1.9%) |
| 5:00 AM to 5:29 AM | 346 (5.4%) | 305 (5.4%) |
| 5:30 AM to 5:59 AM | 566 (8.8%) | 268 (4.7%) |
| 6:00 AM to 6:29 AM | 659 (10.2%) | 366 (6.5%) |
| 6:30 AM to 6:59 AM | 839 (13.0%) | 512 (9.0%) |
| 7:00 AM to 7:29 AM | 728 (11.3%) | 1,144 (20.2%) |
| 7:30 AM to 7:59 AM | 623 (9.6%) | 889 (15.7%) |
| 8:00 AM to 8:29 AM | 553 (8.6%) | 313 (5.5%) |
| 8:30 AM to 8:59 AM | 207 (3.2%) | 345 (6.1%) |
| 9:00 AM to 9:59 AM | 128 (2.0%) | 74 (1.3%) |
| 10:00 AM to 10:59 AM | 260 (4.0%) | 265 (4.7%) |
| 11:00 AM to 11:59 AM | 25 (0.4%) | 80 (1.4%) |
| 12:00 PM to 3:59 PM | 443 (6.9%) | 653 (11.5%) |
| 4:00 PM to 11:59 PM | 383 (5.9%) | 352 (6.2%) |
| Total | 6,460 (100.0%) | 5,673 (100.0%) |
Housing Occupancy in Paragould
Occupancy by Ownership in Paragould
Of the total 11,281 dwellings in Paragould, owner-occupied units account for 6,298 (55.8%), while renter-occupied units make up 4,983 (44.2%).
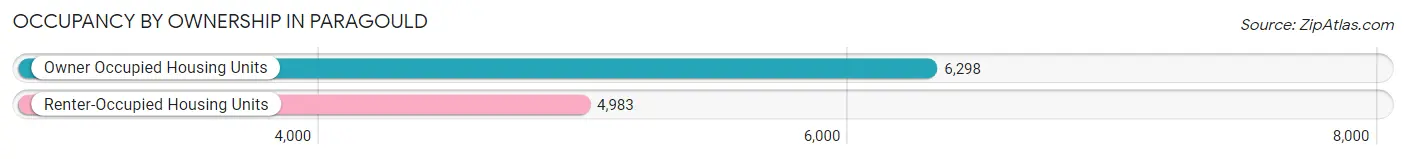
| Occupancy | # Housing Units | % Housing Units |
| Owner Occupied Housing Units | 6,298 | 55.8% |
| Renter-Occupied Housing Units | 4,983 | 44.2% |
| Total Occupied Housing Units | 11,281 | 100.0% |
Occupancy by Household Size in Paragould
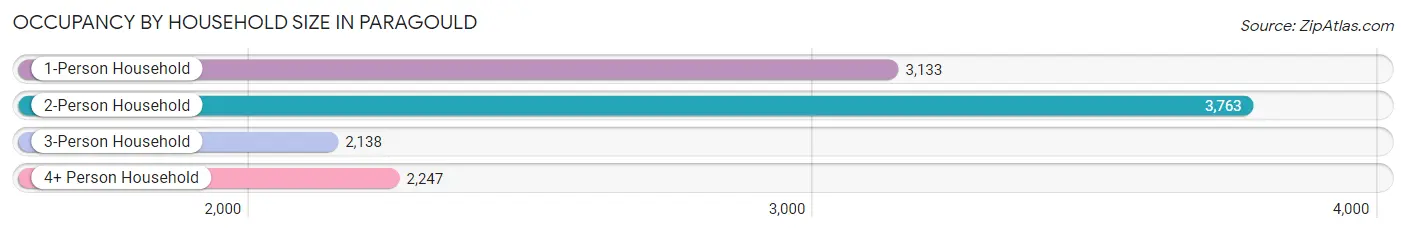
| Household Size | # Housing Units | % Housing Units |
| 1-Person Household | 3,133 | 27.8% |
| 2-Person Household | 3,763 | 33.4% |
| 3-Person Household | 2,138 | 19.0% |
| 4+ Person Household | 2,247 | 19.9% |
| Total Housing Units | 11,281 | 100.0% |
Occupancy by Ownership by Household Size in Paragould
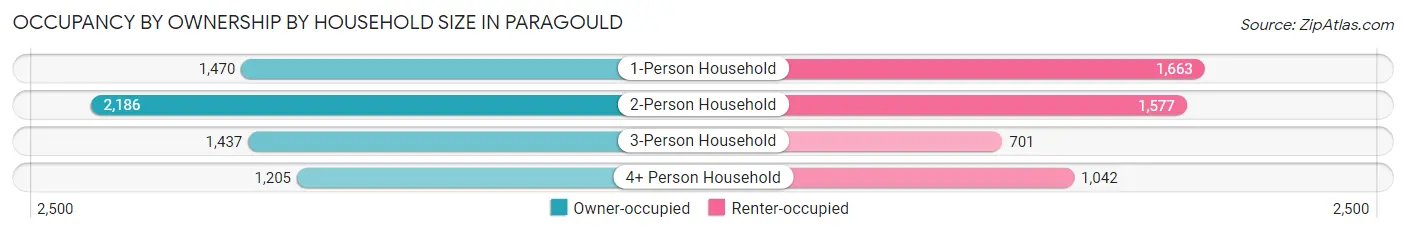
| Household Size | Owner-occupied | Renter-occupied |
| 1-Person Household | 1,470 (46.9%) | 1,663 (53.1%) |
| 2-Person Household | 2,186 (58.1%) | 1,577 (41.9%) |
| 3-Person Household | 1,437 (67.2%) | 701 (32.8%) |
| 4+ Person Household | 1,205 (53.6%) | 1,042 (46.4%) |
| Total Housing Units | 6,298 (55.8%) | 4,983 (44.2%) |
Occupancy by Educational Attainment in Paragould
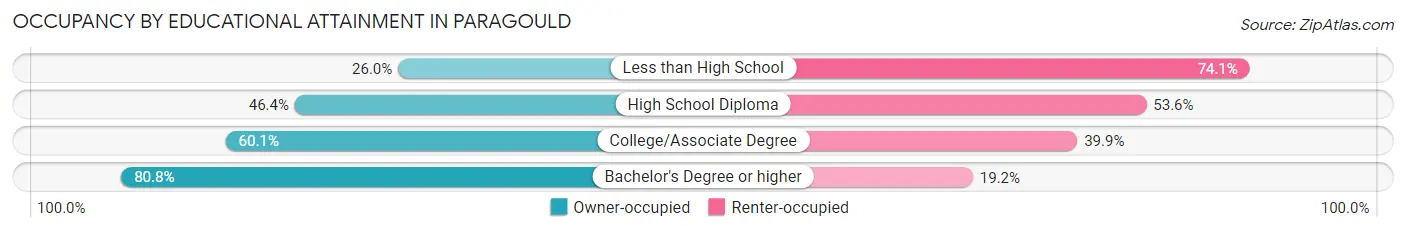
| Household Size | Owner-occupied | Renter-occupied |
| Less than High School | 274 (26.0%) | 782 (74.1%) |
| High School Diploma | 2,077 (46.4%) | 2,396 (53.6%) |
| College/Associate Degree | 2,041 (60.1%) | 1,353 (39.9%) |
| Bachelor's Degree or higher | 1,906 (80.8%) | 452 (19.2%) |
Occupancy by Age of Householder in Paragould
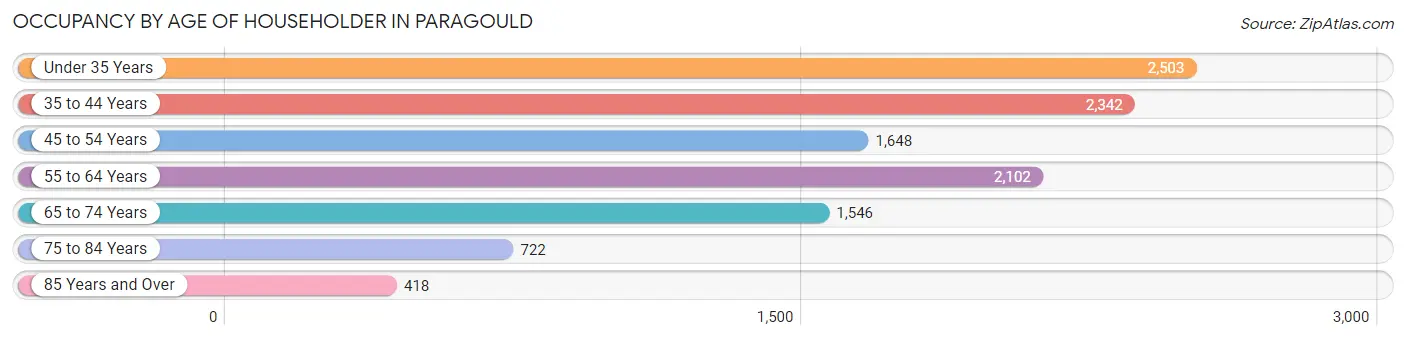
| Age Bracket | # Households | % Households |
| Under 35 Years | 2,503 | 22.2% |
| 35 to 44 Years | 2,342 | 20.8% |
| 45 to 54 Years | 1,648 | 14.6% |
| 55 to 64 Years | 2,102 | 18.6% |
| 65 to 74 Years | 1,546 | 13.7% |
| 75 to 84 Years | 722 | 6.4% |
| 85 Years and Over | 418 | 3.7% |
| Total | 11,281 | 100.0% |
Housing Finances in Paragould
Median Income by Occupancy in Paragould
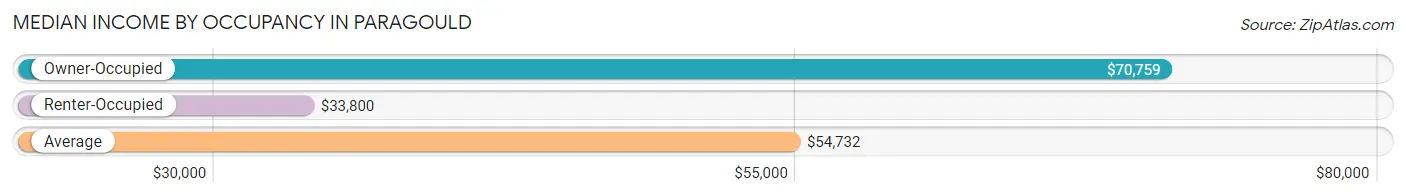
| Occupancy Type | # Households | Median Income |
| Owner-Occupied | 6,298 (55.8%) | $70,759 |
| Renter-Occupied | 4,983 (44.2%) | $33,800 |
| Average | 11,281 (100.0%) | $54,732 |
Occupancy by Householder Income Bracket in Paragould
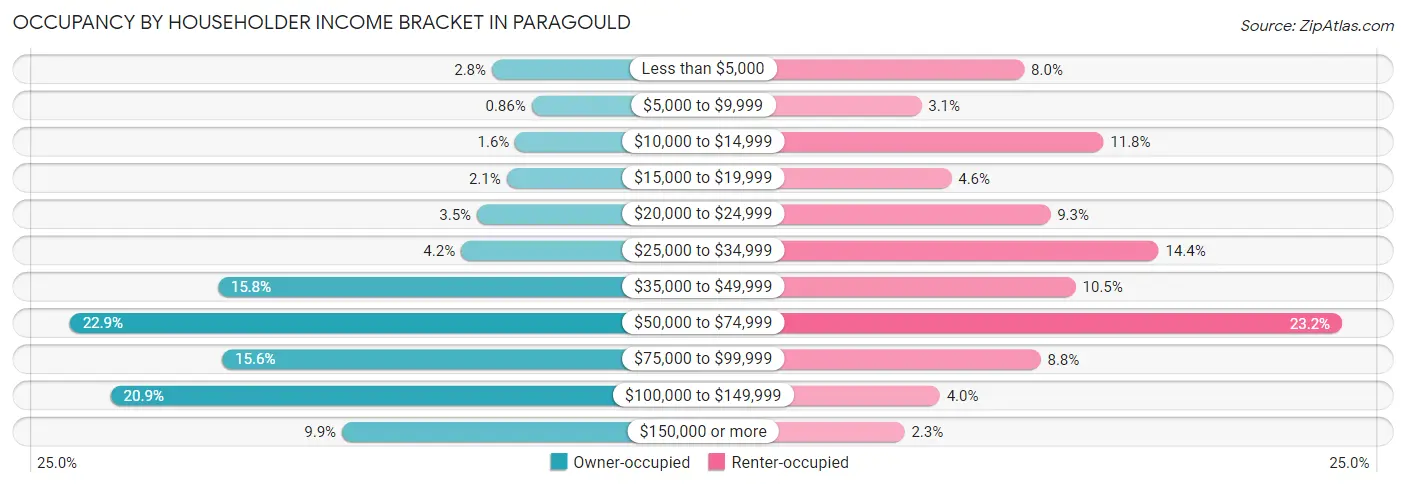
| Income Bracket | Owner-occupied | Renter-occupied |
| Less than $5,000 | 173 (2.8%) | 400 (8.0%) |
| $5,000 to $9,999 | 54 (0.9%) | 156 (3.1%) |
| $10,000 to $14,999 | 103 (1.6%) | 588 (11.8%) |
| $15,000 to $19,999 | 129 (2.1%) | 227 (4.6%) |
| $20,000 to $24,999 | 218 (3.5%) | 462 (9.3%) |
| $25,000 to $34,999 | 266 (4.2%) | 719 (14.4%) |
| $35,000 to $49,999 | 995 (15.8%) | 522 (10.5%) |
| $50,000 to $74,999 | 1,439 (22.9%) | 1,154 (23.2%) |
| $75,000 to $99,999 | 982 (15.6%) | 439 (8.8%) |
| $100,000 to $149,999 | 1,316 (20.9%) | 200 (4.0%) |
| $150,000 or more | 623 (9.9%) | 116 (2.3%) |
| Total | 6,298 (100.0%) | 4,983 (100.0%) |
Monthly Housing Cost Tiers in Paragould
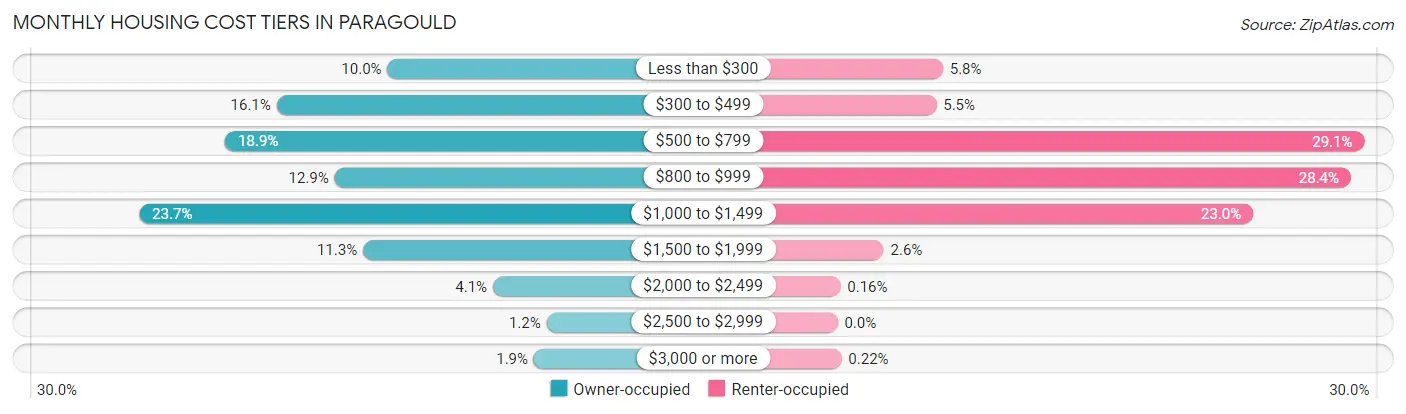
| Monthly Cost | Owner-occupied | Renter-occupied |
| Less than $300 | 627 (10.0%) | 290 (5.8%) |
| $300 to $499 | 1,013 (16.1%) | 272 (5.5%) |
| $500 to $799 | 1,192 (18.9%) | 1,450 (29.1%) |
| $800 to $999 | 811 (12.9%) | 1,413 (28.4%) |
| $1,000 to $1,499 | 1,491 (23.7%) | 1,144 (23.0%) |
| $1,500 to $1,999 | 712 (11.3%) | 127 (2.5%) |
| $2,000 to $2,499 | 260 (4.1%) | 8 (0.2%) |
| $2,500 to $2,999 | 74 (1.2%) | 0 (0.0%) |
| $3,000 or more | 118 (1.9%) | 11 (0.2%) |
| Total | 6,298 (100.0%) | 4,983 (100.0%) |
Physical Housing Characteristics in Paragould
Housing Structures in Paragould
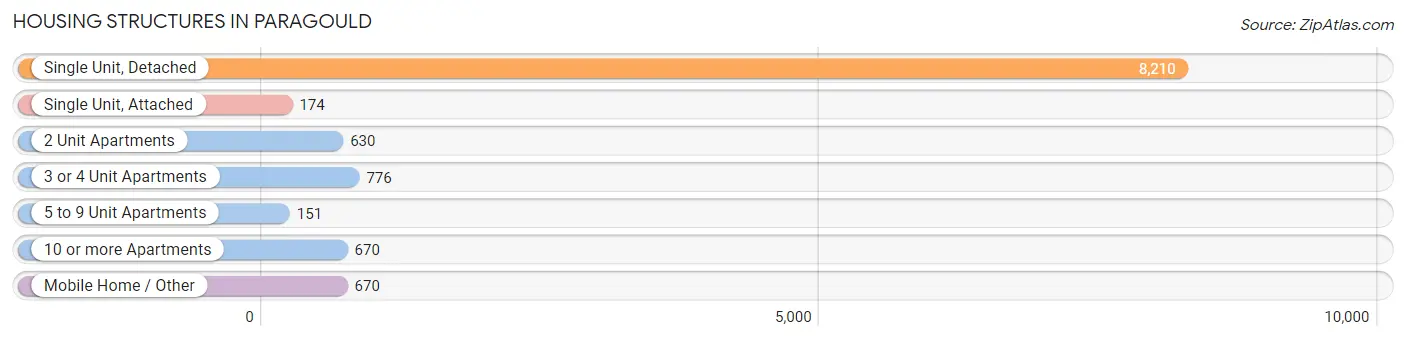
| Structure Type | # Housing Units | % Housing Units |
| Single Unit, Detached | 8,210 | 72.8% |
| Single Unit, Attached | 174 | 1.5% |
| 2 Unit Apartments | 630 | 5.6% |
| 3 or 4 Unit Apartments | 776 | 6.9% |
| 5 to 9 Unit Apartments | 151 | 1.3% |
| 10 or more Apartments | 670 | 5.9% |
| Mobile Home / Other | 670 | 5.9% |
| Total | 11,281 | 100.0% |
Housing Structures by Occupancy in Paragould
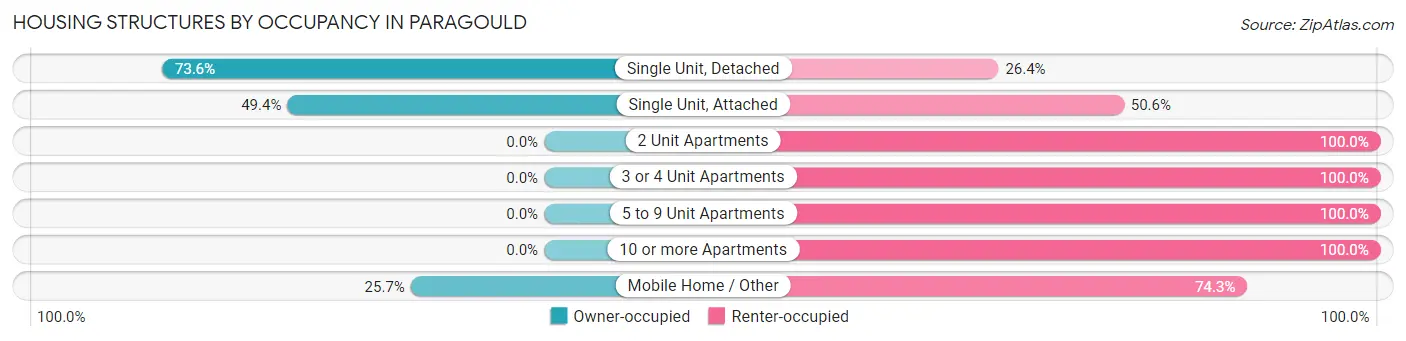
| Structure Type | Owner-occupied | Renter-occupied |
| Single Unit, Detached | 6,040 (73.6%) | 2,170 (26.4%) |
| Single Unit, Attached | 86 (49.4%) | 88 (50.6%) |
| 2 Unit Apartments | 0 (0.0%) | 630 (100.0%) |
| 3 or 4 Unit Apartments | 0 (0.0%) | 776 (100.0%) |
| 5 to 9 Unit Apartments | 0 (0.0%) | 151 (100.0%) |
| 10 or more Apartments | 0 (0.0%) | 670 (100.0%) |
| Mobile Home / Other | 172 (25.7%) | 498 (74.3%) |
| Total | 6,298 (55.8%) | 4,983 (44.2%) |
Housing Structures by Number of Rooms in Paragould
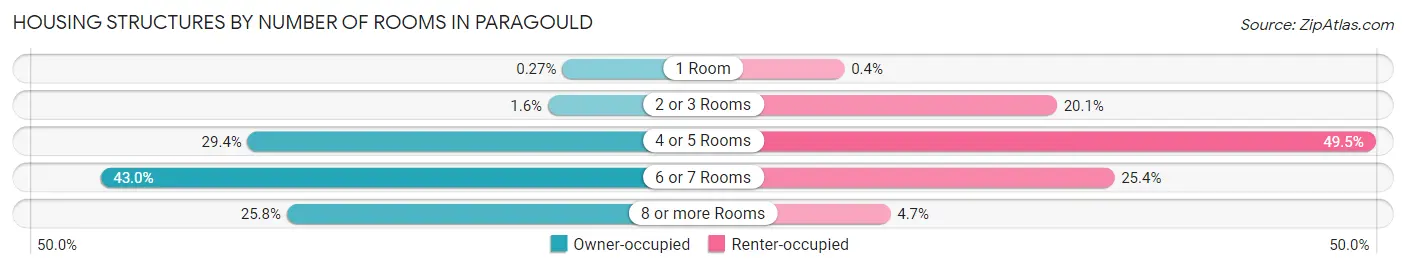
| Number of Rooms | Owner-occupied | Renter-occupied |
| 1 Room | 17 (0.3%) | 20 (0.4%) |
| 2 or 3 Rooms | 101 (1.6%) | 999 (20.1%) |
| 4 or 5 Rooms | 1,850 (29.4%) | 2,468 (49.5%) |
| 6 or 7 Rooms | 2,708 (43.0%) | 1,264 (25.4%) |
| 8 or more Rooms | 1,622 (25.8%) | 232 (4.7%) |
| Total | 6,298 (100.0%) | 4,983 (100.0%) |
Housing Structure by Heating Type in Paragould
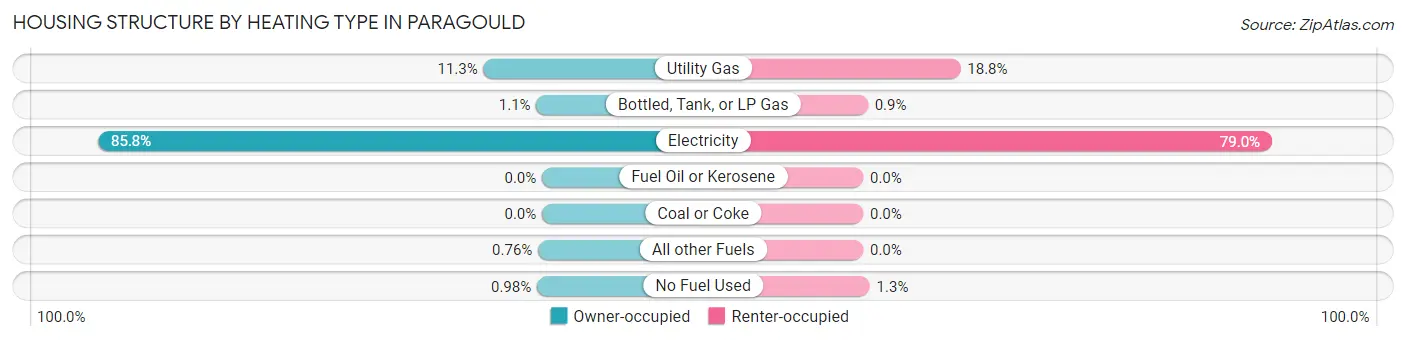
| Heating Type | Owner-occupied | Renter-occupied |
| Utility Gas | 713 (11.3%) | 937 (18.8%) |
| Bottled, Tank, or LP Gas | 69 (1.1%) | 45 (0.9%) |
| Electricity | 5,406 (85.8%) | 3,937 (79.0%) |
| Fuel Oil or Kerosene | 0 (0.0%) | 0 (0.0%) |
| Coal or Coke | 0 (0.0%) | 0 (0.0%) |
| All other Fuels | 48 (0.8%) | 0 (0.0%) |
| No Fuel Used | 62 (1.0%) | 64 (1.3%) |
| Total | 6,298 (100.0%) | 4,983 (100.0%) |
Household Vehicle Usage in Paragould
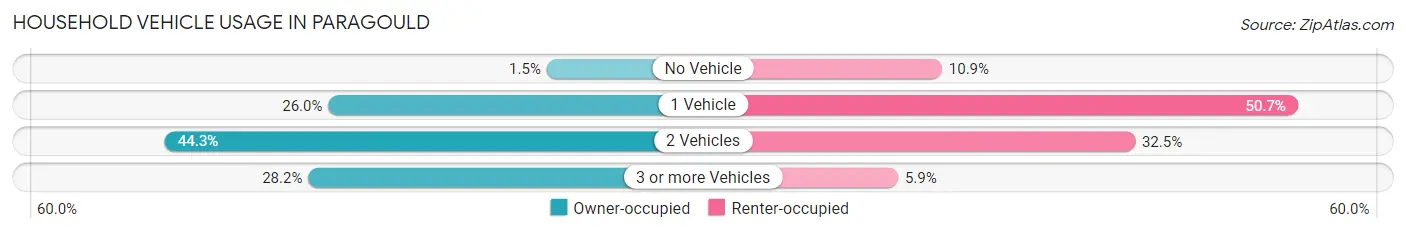
| Vehicles per Household | Owner-occupied | Renter-occupied |
| No Vehicle | 95 (1.5%) | 541 (10.9%) |
| 1 Vehicle | 1,636 (26.0%) | 2,527 (50.7%) |
| 2 Vehicles | 2,789 (44.3%) | 1,619 (32.5%) |
| 3 or more Vehicles | 1,778 (28.2%) | 296 (5.9%) |
| Total | 6,298 (100.0%) | 4,983 (100.0%) |
Real Estate & Mortgages in Paragould
Real Estate and Mortgage Overview in Paragould
| Characteristic | Without Mortgage | With Mortgage |
| Housing Units | 2,330 | 3,968 |
| Median Property Value | $155,000 | $175,500 |
| Median Household Income | $52,054 | $521 |
| Monthly Housing Costs | $377 | $107 |
| Real Estate Taxes | $761 | $335 |
Property Value by Mortgage Status in Paragould
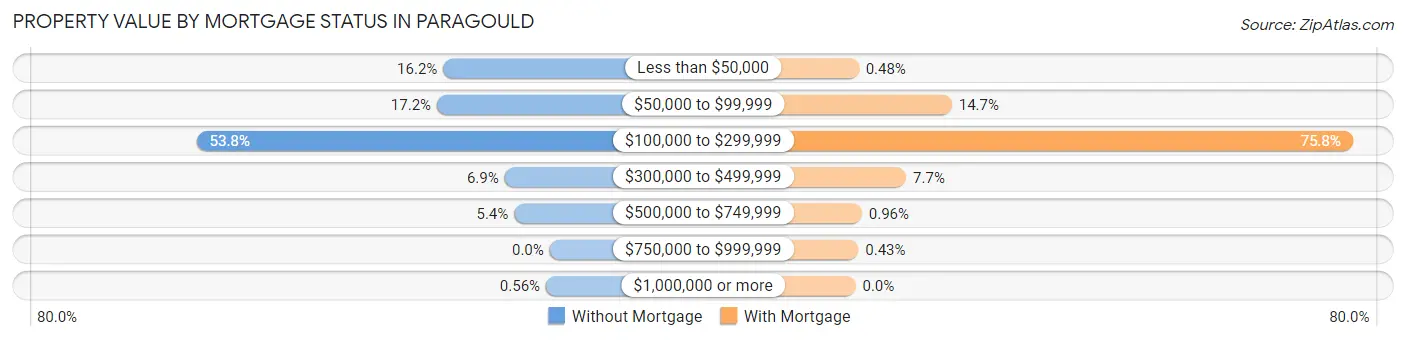
| Property Value | Without Mortgage | With Mortgage |
| Less than $50,000 | 378 (16.2%) | 19 (0.5%) |
| $50,000 to $99,999 | 400 (17.2%) | 582 (14.7%) |
| $100,000 to $299,999 | 1,253 (53.8%) | 3,006 (75.8%) |
| $300,000 to $499,999 | 160 (6.9%) | 306 (7.7%) |
| $500,000 to $749,999 | 126 (5.4%) | 38 (1.0%) |
| $750,000 to $999,999 | 0 (0.0%) | 17 (0.4%) |
| $1,000,000 or more | 13 (0.6%) | 0 (0.0%) |
| Total | 2,330 (100.0%) | 3,968 (100.0%) |
Household Income by Mortgage Status in Paragould
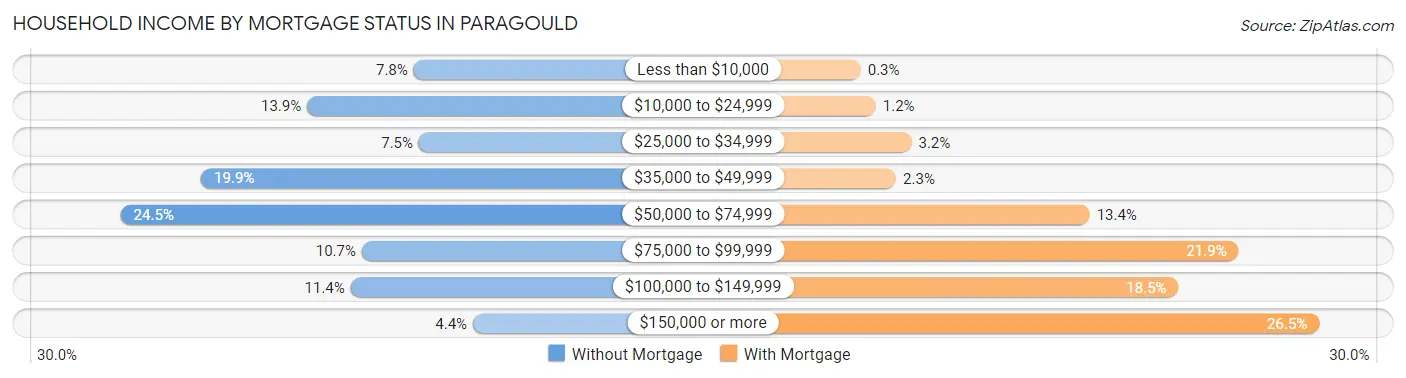
| Household Income | Without Mortgage | With Mortgage |
| Less than $10,000 | 181 (7.8%) | 12 (0.3%) |
| $10,000 to $24,999 | 323 (13.9%) | 46 (1.2%) |
| $25,000 to $34,999 | 174 (7.5%) | 127 (3.2%) |
| $35,000 to $49,999 | 464 (19.9%) | 92 (2.3%) |
| $50,000 to $74,999 | 571 (24.5%) | 531 (13.4%) |
| $75,000 to $99,999 | 250 (10.7%) | 868 (21.9%) |
| $100,000 to $149,999 | 265 (11.4%) | 732 (18.4%) |
| $150,000 or more | 102 (4.4%) | 1,051 (26.5%) |
| Total | 2,330 (100.0%) | 3,968 (100.0%) |
Property Value to Household Income Ratio in Paragould
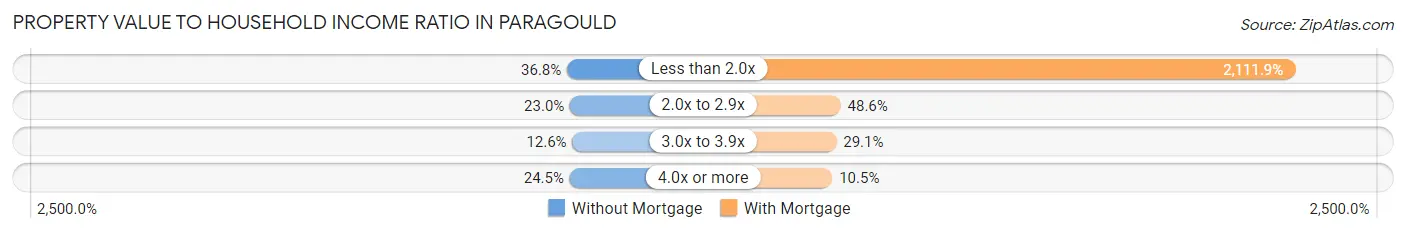
| Value-to-Income Ratio | Without Mortgage | With Mortgage |
| Less than 2.0x | 858 (36.8%) | 83,801 (2,111.9%) |
| 2.0x to 2.9x | 536 (23.0%) | 1,929 (48.6%) |
| 3.0x to 3.9x | 293 (12.6%) | 1,154 (29.1%) |
| 4.0x or more | 571 (24.5%) | 417 (10.5%) |
| Total | 2,330 (100.0%) | 3,968 (100.0%) |
Real Estate Taxes by Mortgage Status in Paragould
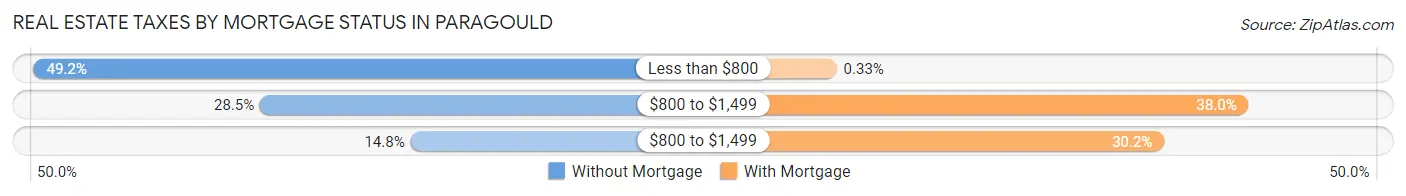
| Property Taxes | Without Mortgage | With Mortgage |
| Less than $800 | 1,146 (49.2%) | 13 (0.3%) |
| $800 to $1,499 | 664 (28.5%) | 1,506 (38.0%) |
| $800 to $1,499 | 344 (14.8%) | 1,200 (30.2%) |
| Total | 2,330 (100.0%) | 3,968 (100.0%) |
Health & Disability in Paragould
Health Insurance Coverage by Age in Paragould
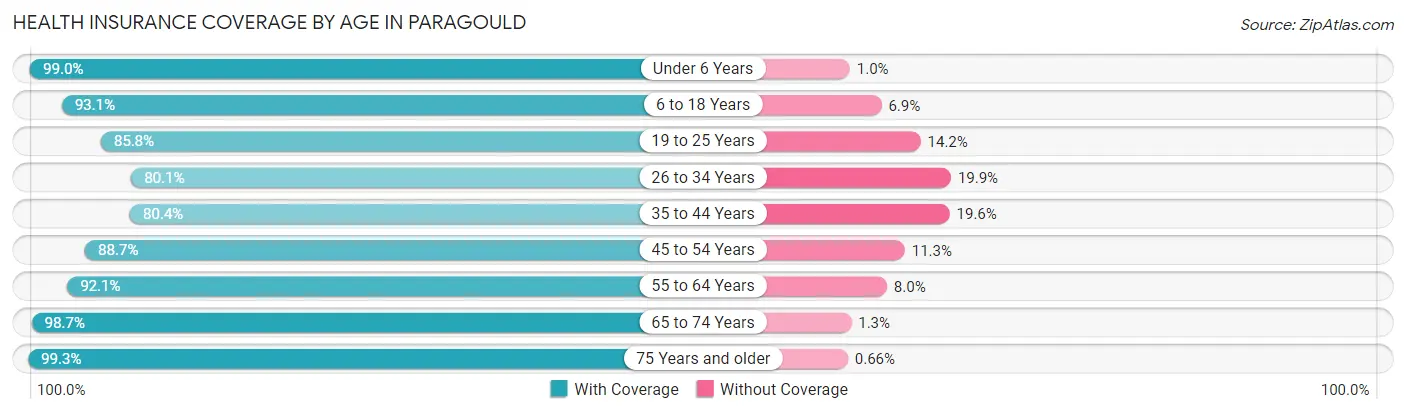
| Age Bracket | With Coverage | Without Coverage |
| Under 6 Years | 2,655 (99.0%) | 28 (1.0%) |
| 6 to 18 Years | 4,847 (93.1%) | 361 (6.9%) |
| 19 to 25 Years | 2,430 (85.8%) | 403 (14.2%) |
| 26 to 34 Years | 2,812 (80.1%) | 698 (19.9%) |
| 35 to 44 Years | 3,351 (80.4%) | 819 (19.6%) |
| 45 to 54 Years | 2,808 (88.7%) | 357 (11.3%) |
| 55 to 64 Years | 3,336 (92.0%) | 288 (8.0%) |
| 65 to 74 Years | 2,429 (98.7%) | 32 (1.3%) |
| 75 Years and older | 1,506 (99.3%) | 10 (0.7%) |
| Total | 26,174 (89.7%) | 2,996 (10.3%) |
Health Insurance Coverage by Citizenship Status in Paragould
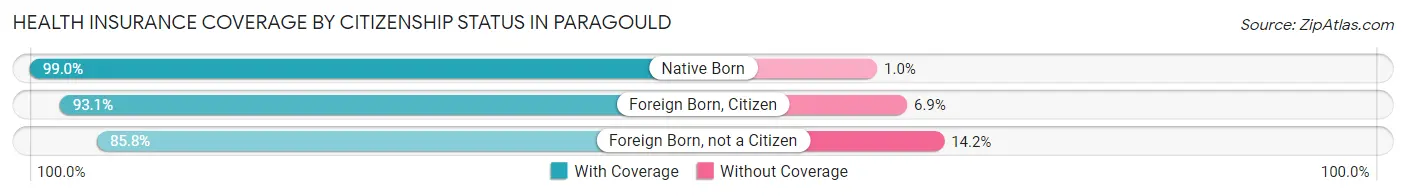
| Citizenship Status | With Coverage | Without Coverage |
| Native Born | 2,655 (99.0%) | 28 (1.0%) |
| Foreign Born, Citizen | 4,847 (93.1%) | 361 (6.9%) |
| Foreign Born, not a Citizen | 2,430 (85.8%) | 403 (14.2%) |
Health Insurance Coverage by Household Income in Paragould
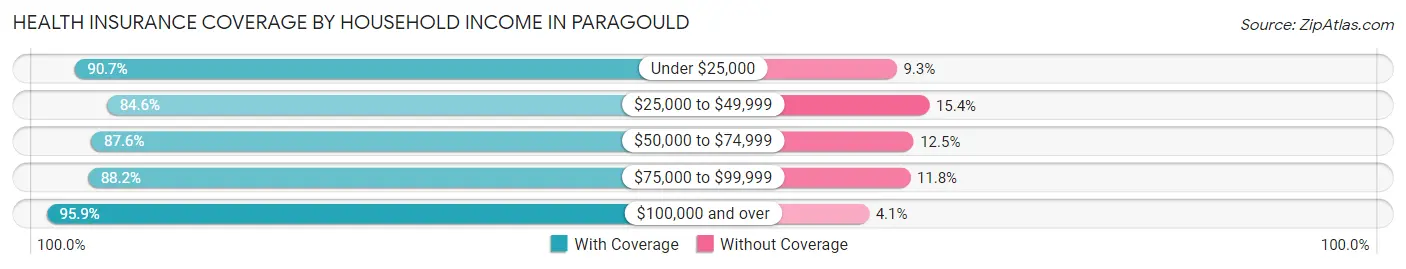
| Household Income | With Coverage | Without Coverage |
| Under $25,000 | 4,375 (90.7%) | 449 (9.3%) |
| $25,000 to $49,999 | 5,223 (84.6%) | 950 (15.4%) |
| $50,000 to $74,999 | 5,811 (87.5%) | 826 (12.4%) |
| $75,000 to $99,999 | 3,286 (88.2%) | 441 (11.8%) |
| $100,000 and over | 7,327 (95.9%) | 313 (4.1%) |
Public vs Private Health Insurance Coverage by Age in Paragould
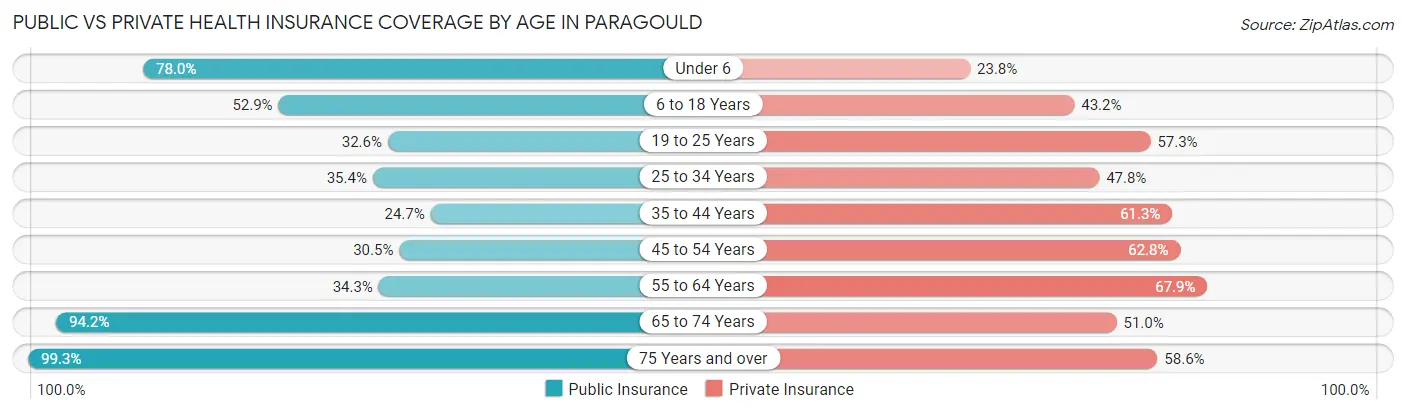
| Age Bracket | Public Insurance | Private Insurance |
| Under 6 | 2,093 (78.0%) | 639 (23.8%) |
| 6 to 18 Years | 2,754 (52.9%) | 2,248 (43.2%) |
| 19 to 25 Years | 923 (32.6%) | 1,623 (57.3%) |
| 25 to 34 Years | 1,242 (35.4%) | 1,677 (47.8%) |
| 35 to 44 Years | 1,028 (24.6%) | 2,557 (61.3%) |
| 45 to 54 Years | 964 (30.5%) | 1,989 (62.8%) |
| 55 to 64 Years | 1,242 (34.3%) | 2,459 (67.8%) |
| 65 to 74 Years | 2,317 (94.2%) | 1,255 (51.0%) |
| 75 Years and over | 1,506 (99.3%) | 888 (58.6%) |
| Total | 14,069 (48.2%) | 15,335 (52.6%) |
Disability Status by Sex by Age in Paragould
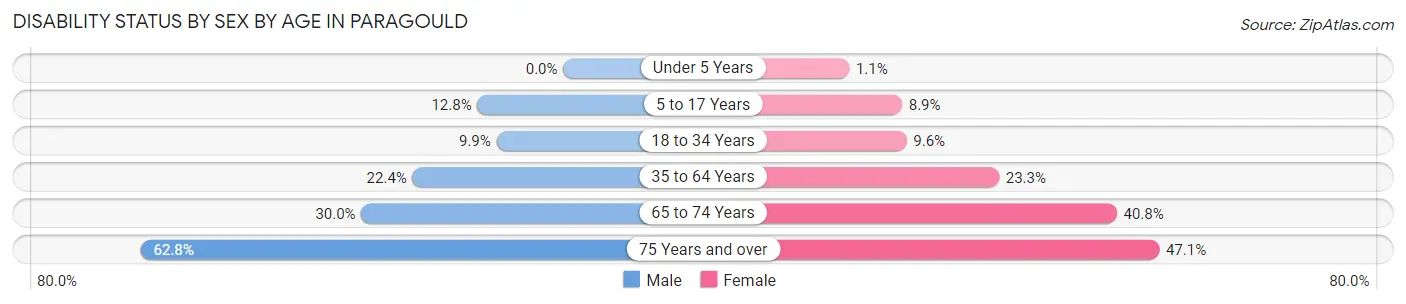
| Age Bracket | Male | Female |
| Under 5 Years | 0 (0.0%) | 9 (1.1%) |
| 5 to 17 Years | 328 (12.8%) | 257 (8.9%) |
| 18 to 34 Years | 326 (9.9%) | 327 (9.6%) |
| 35 to 64 Years | 1,242 (22.4%) | 1,261 (23.3%) |
| 65 to 74 Years | 319 (30.0%) | 570 (40.8%) |
| 75 Years and over | 400 (62.8%) | 414 (47.1%) |
Disability Class by Sex by Age in Paragould
Disability Class: Hearing Difficulty
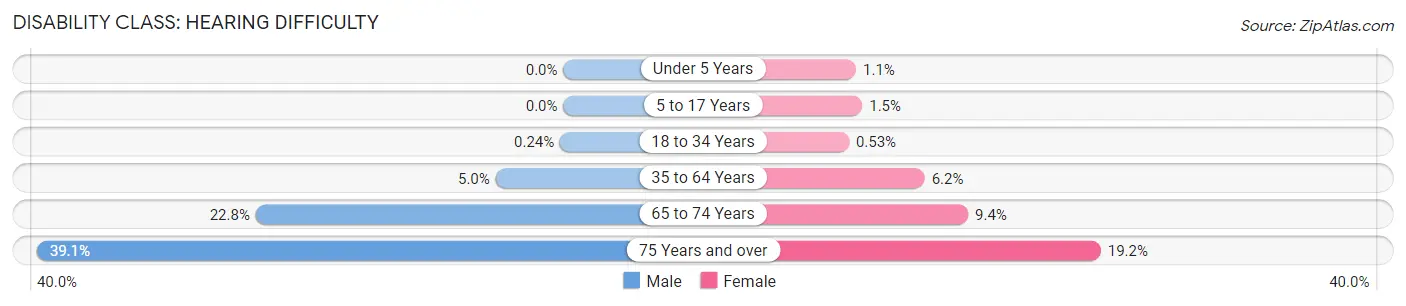
| Age Bracket | Male | Female |
| Under 5 Years | 0 (0.0%) | 9 (1.1%) |
| 5 to 17 Years | 0 (0.0%) | 44 (1.5%) |
| 18 to 34 Years | 8 (0.2%) | 18 (0.5%) |
| 35 to 64 Years | 279 (5.0%) | 333 (6.2%) |
| 65 to 74 Years | 243 (22.8%) | 131 (9.4%) |
| 75 Years and over | 249 (39.1%) | 169 (19.2%) |
Disability Class: Vision Difficulty
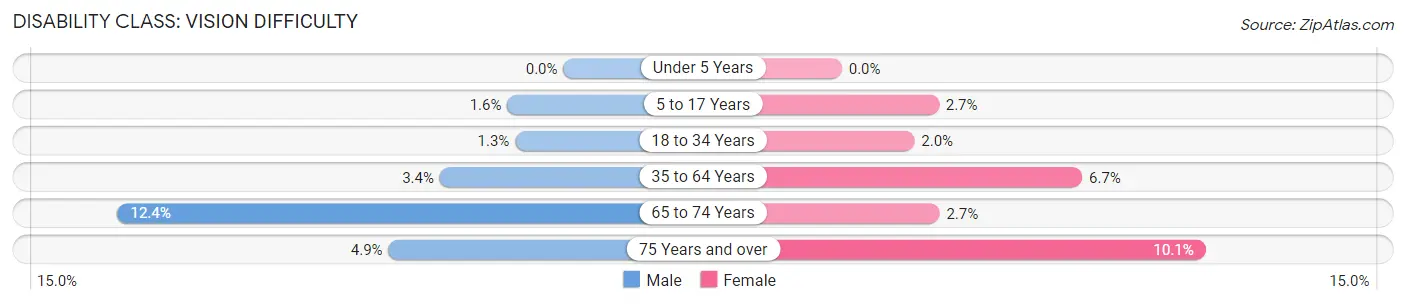
| Age Bracket | Male | Female |
| Under 5 Years | 0 (0.0%) | 0 (0.0%) |
| 5 to 17 Years | 40 (1.6%) | 78 (2.7%) |
| 18 to 34 Years | 44 (1.3%) | 69 (2.0%) |
| 35 to 64 Years | 191 (3.4%) | 362 (6.7%) |
| 65 to 74 Years | 132 (12.4%) | 38 (2.7%) |
| 75 Years and over | 31 (4.9%) | 89 (10.1%) |
Disability Class: Cognitive Difficulty
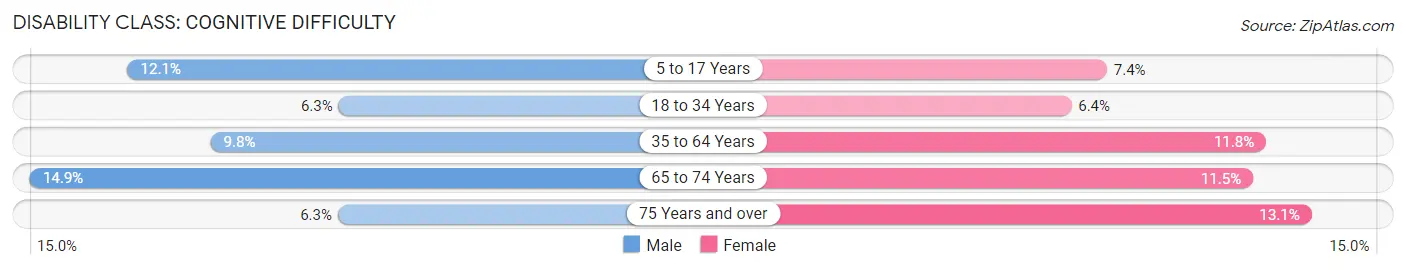
| Age Bracket | Male | Female |
| 5 to 17 Years | 312 (12.1%) | 213 (7.4%) |
| 18 to 34 Years | 206 (6.3%) | 218 (6.4%) |
| 35 to 64 Years | 545 (9.8%) | 639 (11.8%) |
| 65 to 74 Years | 158 (14.8%) | 160 (11.5%) |
| 75 Years and over | 40 (6.3%) | 115 (13.1%) |
Disability Class: Ambulatory Difficulty
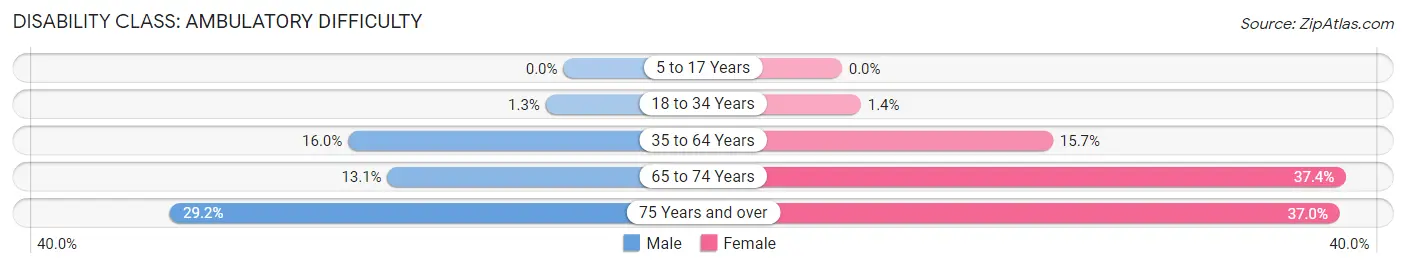
| Age Bracket | Male | Female |
| 5 to 17 Years | 0 (0.0%) | 0 (0.0%) |
| 18 to 34 Years | 43 (1.3%) | 48 (1.4%) |
| 35 to 64 Years | 887 (16.0%) | 848 (15.7%) |
| 65 to 74 Years | 139 (13.1%) | 523 (37.4%) |
| 75 Years and over | 186 (29.2%) | 325 (37.0%) |
Disability Class: Self-Care Difficulty
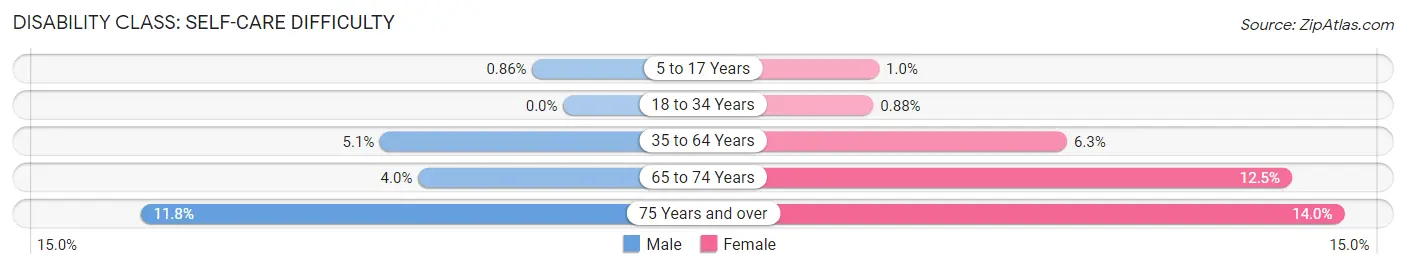
| Age Bracket | Male | Female |
| 5 to 17 Years | 22 (0.9%) | 30 (1.0%) |
| 18 to 34 Years | 0 (0.0%) | 30 (0.9%) |
| 35 to 64 Years | 283 (5.1%) | 339 (6.3%) |
| 65 to 74 Years | 43 (4.0%) | 175 (12.5%) |
| 75 Years and over | 75 (11.8%) | 123 (14.0%) |
Technology Access in Paragould
Computing Device Access in Paragould
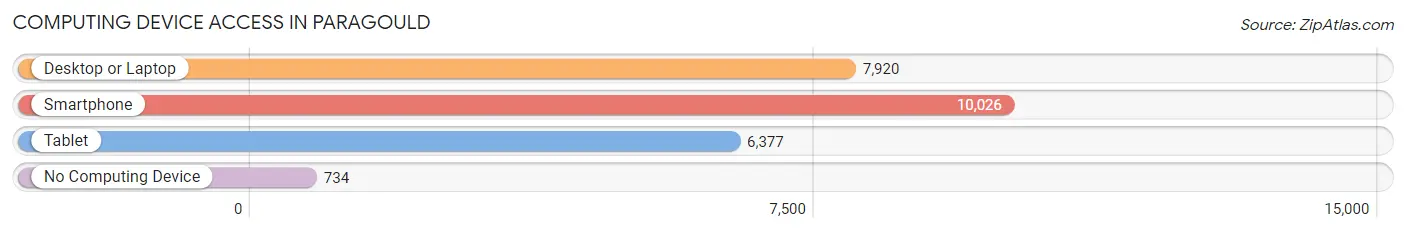
| Device Type | # Households | % Households |
| Desktop or Laptop | 7,920 | 70.2% |
| Smartphone | 10,026 | 88.9% |
| Tablet | 6,377 | 56.5% |
| No Computing Device | 734 | 6.5% |
| Total | 11,281 | 100.0% |
Internet Access in Paragould
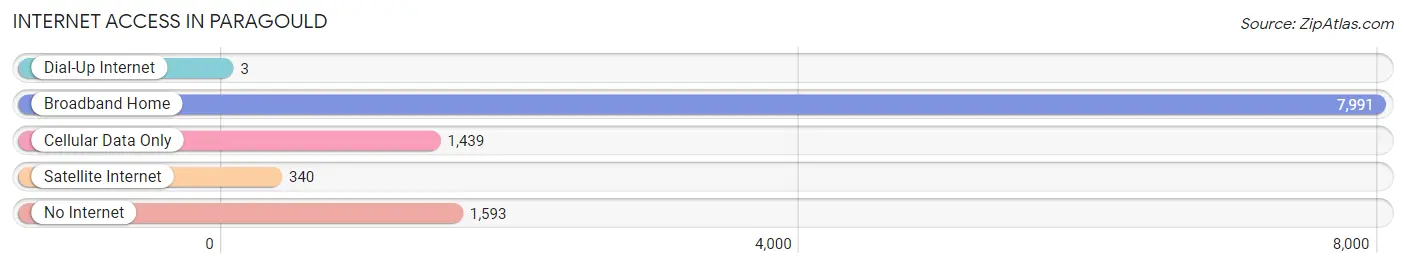
| Internet Type | # Households | % Households |
| Dial-Up Internet | 3 | 0.0% |
| Broadband Home | 7,991 | 70.8% |
| Cellular Data Only | 1,439 | 12.8% |
| Satellite Internet | 340 | 3.0% |
| No Internet | 1,593 | 14.1% |
| Total | 11,281 | 100.0% |
Paragould Summary
Paragould, Arkansas is a city located in Greene County in the northeastern part of the state. It is the county seat and the largest city in the county. The city was founded in 1883 and is named after two railroad officials, J.W. Paramore and Jay Gould. The city is located in the Crowley's Ridge region of the state and is known for its rich agricultural heritage.
Geography
Paragould is located in the northeastern part of Arkansas, in Greene County. It is situated in the Crowley's Ridge region of the state, which is characterized by rolling hills and fertile soil. The city is located at the intersection of two major highways, U.S. Route 412 and U.S. Route 49. The city is located approximately 80 miles northeast of Little Rock, the state capital.
The city has a total area of 16.2 square miles, of which 16.1 square miles is land and 0.1 square miles is water. The city is located in the St. Francis River watershed. The climate in Paragould is humid subtropical, with hot, humid summers and mild winters. The average annual temperature is 63.2°F, with an average high of 79.2°F in July and an average low of 47.2°F in January.
History
Paragould was founded in 1883 when two railroad officials, J.W. Paramore and Jay Gould, decided to build a railroad line through the area. The city was named after the two men, with the name being a combination of their last names. The city was incorporated in 1887 and quickly grew as a center of commerce and industry.
The city was a major center of cotton production in the early 20th century, and the economy was largely based on agriculture. The city was also home to several manufacturing plants, including a cotton mill, a furniture factory, and a canning factory.
In the late 20th century, the city began to diversify its economy, with the opening of several new businesses, including a shopping mall, a hospital, and a movie theater. The city also became a regional center for healthcare, education, and retail.
Economy
Paragould's economy is largely based on agriculture, manufacturing, and retail. The city is home to several large employers, including Arkansas Methodist Medical Center, Paragould Regional Medical Center, and Walmart. The city is also home to several manufacturing plants, including a cotton mill, a furniture factory, and a canning factory.
The city is also home to several retail stores, including Walmart, Target, and Lowe's. The city is also home to several restaurants, including Applebee's, Chili's, and Olive Garden.
Demographics
As of the 2010 census, Paragould had a population of 26,113. The racial makeup of the city was 79.2% White, 17.3% African American, 0.5% Native American, 0.7% Asian, 0.1% Pacific Islander, 1.2% from other races, and 1.1% from two or more races. Hispanic or Latino of any race were 3.2% of the population.
The median income for a household in the city was $32,917, and the median income for a family was $41,945. The per capita income for the city was $17,845. About 17.2% of families and 21.2% of the population were below the poverty line, including 28.3% of those under age 18 and 14.2% of those age 65 or over.
Paragould is served by the Paragould School District, which includes four elementary schools, two middle schools, and one high school. The city is also home to Crowley's Ridge College, a private, four-year liberal arts college.
Common Questions
What is Per Capita Income in Paragould?
Per Capita income in Paragould is $26,245.
What is the Median Family Income in Paragould?
Median Family Income in Paragould is $58,524.
What is the Median Household income in Paragould?
Median Household Income in Paragould is $54,732.
What is Income or Wage Gap in Paragould?
Income or Wage Gap in Paragould is 26.7%.
Women in Paragould earn 73.3 cents for every dollar earned by a man.
What is Family Income Deficit in Paragould?
Family Income Deficit in Paragould is $10,657.
Families that are below poverty line in Paragould earn $10,657 less on average than the poverty threshold level.
What is Inequality or Gini Index in Paragould?
Inequality or Gini Index in Paragould is 0.42.
What is the Total Population of Paragould?
Total Population of Paragould is 29,690.
What is the Total Male Population of Paragould?
Total Male Population of Paragould is 14,578.
What is the Total Female Population of Paragould?
Total Female Population of Paragould is 15,112.
What is the Ratio of Males per 100 Females in Paragould?
There are 96.47 Males per 100 Females in Paragould.
What is the Ratio of Females per 100 Males in Paragould?
There are 103.66 Females per 100 Males in Paragould.
What is the Median Population Age in Paragould?
Median Population Age in Paragould is 35.9 Years.
What is the Average Family Size in Paragould
Average Family Size in Paragould is 3.1 People.
What is the Average Household Size in Paragould
Average Household Size in Paragould is 2.6 People.
How Large is the Labor Force in Paragould?
There are 13,884 People in the Labor Forcein in Paragould.
What is the Percentage of People in the Labor Force in Paragould?
60.2% of People are in the Labor Force in Paragould.
What is the Unemployment Rate in Paragould?
Unemployment Rate in Paragould is 8.5%.