Pine Bluff, AR Map & Demographics
Pine Bluff Map
Pine Bluff Overview
$21,170
PER CAPITA INCOME
$51,882
AVG FAMILY INCOME
$39,411
AVG HOUSEHOLD INCOME
11.5%
WAGE / INCOME GAP [ % ]
88.5¢/ $1
WAGE / INCOME GAP [ $ ]
$10,307
FAMILY INCOME DEFICIT
0.48
INEQUALITY / GINI INDEX
41,172
TOTAL POPULATION
19,843
MALE POPULATION
21,329
FEMALE POPULATION
93.03
MALES / 100 FEMALES
107.49
FEMALES / 100 MALES
37.1
MEDIAN AGE
3.3
AVG FAMILY SIZE
2.5
AVG HOUSEHOLD SIZE
17,309
LABOR FORCE [ PEOPLE ]
52.2%
PERCENT IN LABOR FORCE
9.8%
UNEMPLOYMENT RATE
Pine Bluff Area Codes
Income in Pine Bluff
Income Overview in Pine Bluff
Per Capita Income in Pine Bluff is $21,170, while median incomes of families and households are $51,882 and $39,411 respectively.
| Characteristic | Number | Measure |
| Per Capita Income | 41,172 | $21,170 |
| Median Family Income | 8,570 | $51,882 |
| Mean Family Income | 8,570 | $64,915 |
| Median Household Income | 15,083 | $39,411 |
| Mean Household Income | 15,083 | $54,218 |
| Income Deficit | 8,570 | $10,307 |
| Wage / Income Gap (%) | 41,172 | 11.50% |
| Wage / Income Gap ($) | 41,172 | 88.50¢ per $1 |
| Gini / Inequality Index | 41,172 | 0.48 |
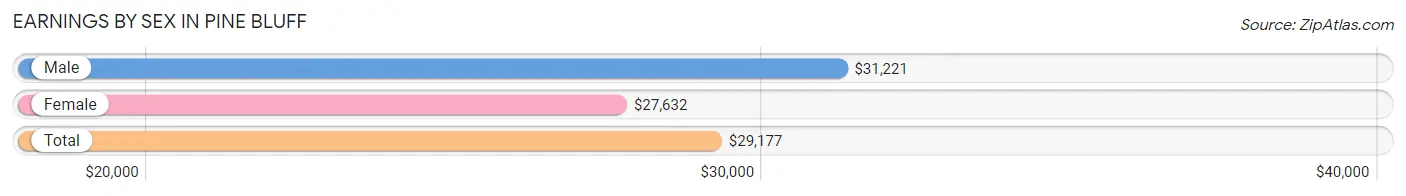
Earnings by Sex in Pine Bluff
Average Earnings in Pine Bluff are $29,177, $31,221 for men and $27,632 for women, a difference of 11.5%.
| Sex | Number | Average Earnings |
| Male | 8,049 (45.1%) | $31,221 |
| Female | 9,783 (54.9%) | $27,632 |
| Total | 17,832 (100.0%) | $29,177 |
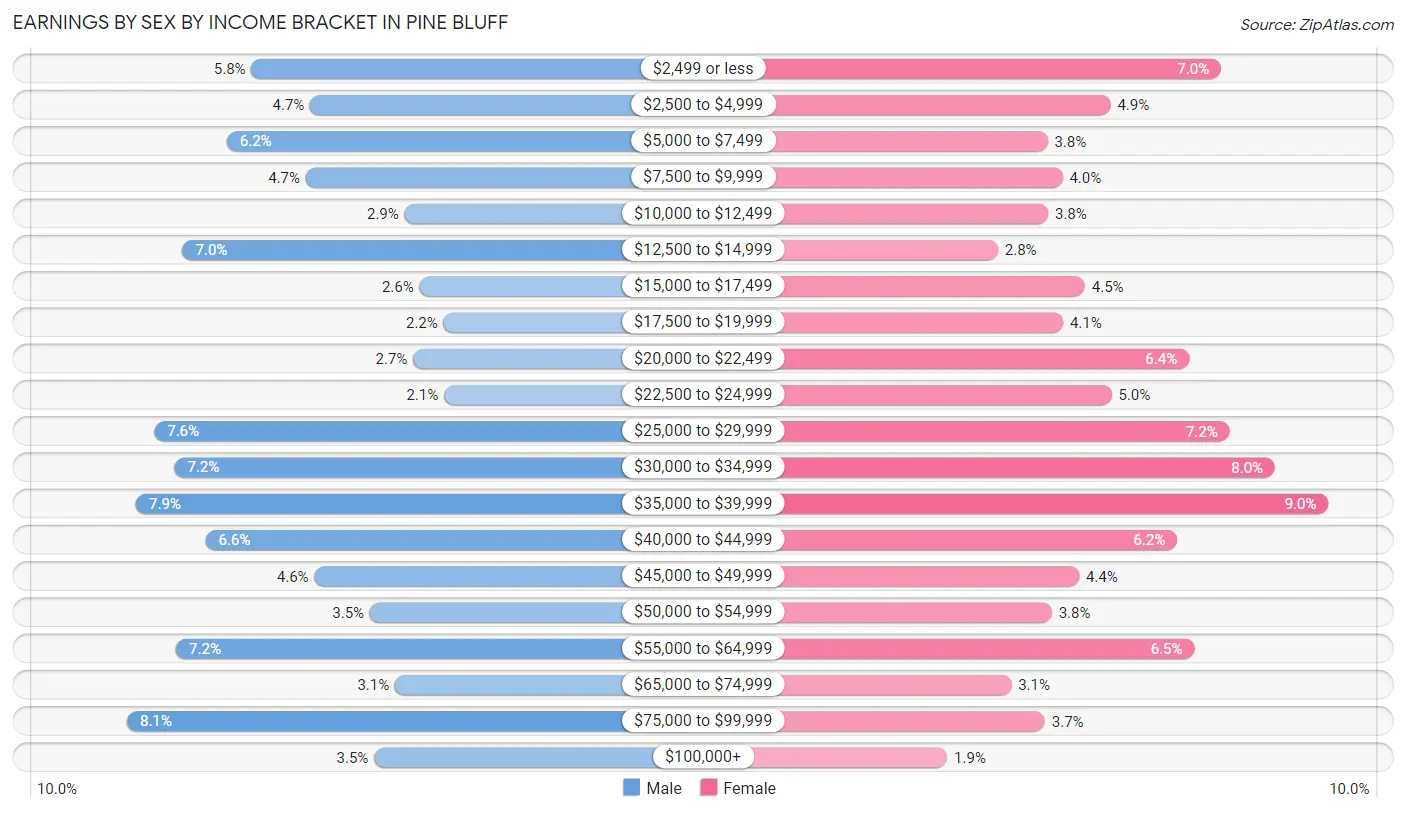
Earnings by Sex by Income Bracket in Pine Bluff
The most common earnings brackets in Pine Bluff are $75,000 to $99,999 for men (650 | 8.1%) and $35,000 to $39,999 for women (882 | 9.0%).
| Income | Male | Female |
| $2,499 or less | 463 (5.8%) | 686 (7.0%) |
| $2,500 to $4,999 | 374 (4.6%) | 483 (4.9%) |
| $5,000 to $7,499 | 500 (6.2%) | 368 (3.8%) |
| $7,500 to $9,999 | 381 (4.7%) | 395 (4.0%) |
| $10,000 to $12,499 | 232 (2.9%) | 369 (3.8%) |
| $12,500 to $14,999 | 567 (7.0%) | 277 (2.8%) |
| $15,000 to $17,499 | 209 (2.6%) | 436 (4.5%) |
| $17,500 to $19,999 | 173 (2.1%) | 396 (4.1%) |
| $20,000 to $22,499 | 219 (2.7%) | 627 (6.4%) |
| $22,500 to $24,999 | 172 (2.1%) | 485 (5.0%) |
| $25,000 to $29,999 | 609 (7.6%) | 701 (7.2%) |
| $30,000 to $34,999 | 579 (7.2%) | 785 (8.0%) |
| $35,000 to $39,999 | 637 (7.9%) | 882 (9.0%) |
| $40,000 to $44,999 | 532 (6.6%) | 606 (6.2%) |
| $45,000 to $49,999 | 368 (4.6%) | 426 (4.3%) |
| $50,000 to $54,999 | 284 (3.5%) | 376 (3.8%) |
| $55,000 to $64,999 | 576 (7.2%) | 637 (6.5%) |
| $65,000 to $74,999 | 246 (3.1%) | 301 (3.1%) |
| $75,000 to $99,999 | 650 (8.1%) | 363 (3.7%) |
| $100,000+ | 278 (3.5%) | 184 (1.9%) |
| Total | 8,049 (100.0%) | 9,783 (100.0%) |
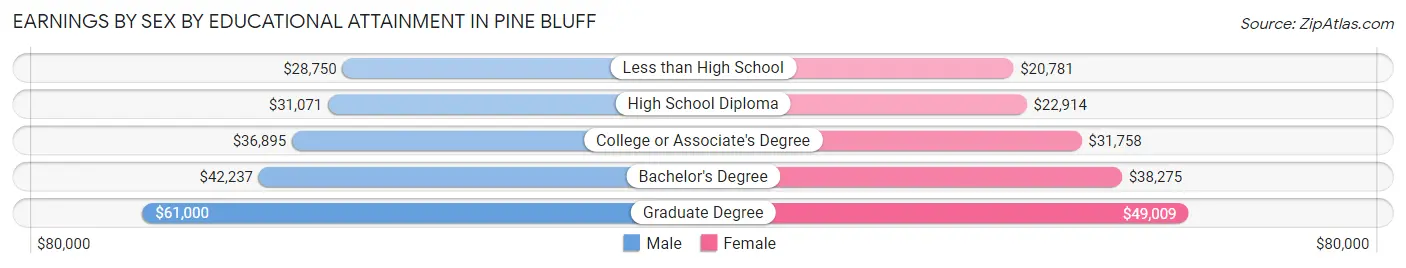
Earnings by Sex by Educational Attainment in Pine Bluff
Average earnings in Pine Bluff are $34,616 for men and $31,837 for women, a difference of 8.0%. Men with an educational attainment of graduate degree enjoy the highest average annual earnings of $61,000, while those with less than high school education earn the least with $28,750. Women with an educational attainment of graduate degree earn the most with the average annual earnings of $49,009, while those with less than high school education have the smallest earnings of $20,781.
| Educational Attainment | Male Income | Female Income |
| Less than High School | $28,750 | $20,781 |
| High School Diploma | $31,071 | $22,914 |
| College or Associate's Degree | $36,895 | $31,758 |
| Bachelor's Degree | $42,237 | $38,275 |
| Graduate Degree | $61,000 | $49,009 |
| Total | $34,616 | $31,837 |
Family Income in Pine Bluff
Family Income Brackets in Pine Bluff
According to the Pine Bluff family income data, there are 1,748 families falling into the $50,000 to $74,999 income range, which is the most common income bracket and makes up 20.4% of all families. Conversely, the $150,000 to $199,999 income bracket is the least frequent group with only 223 families (2.6%) belonging to this category.
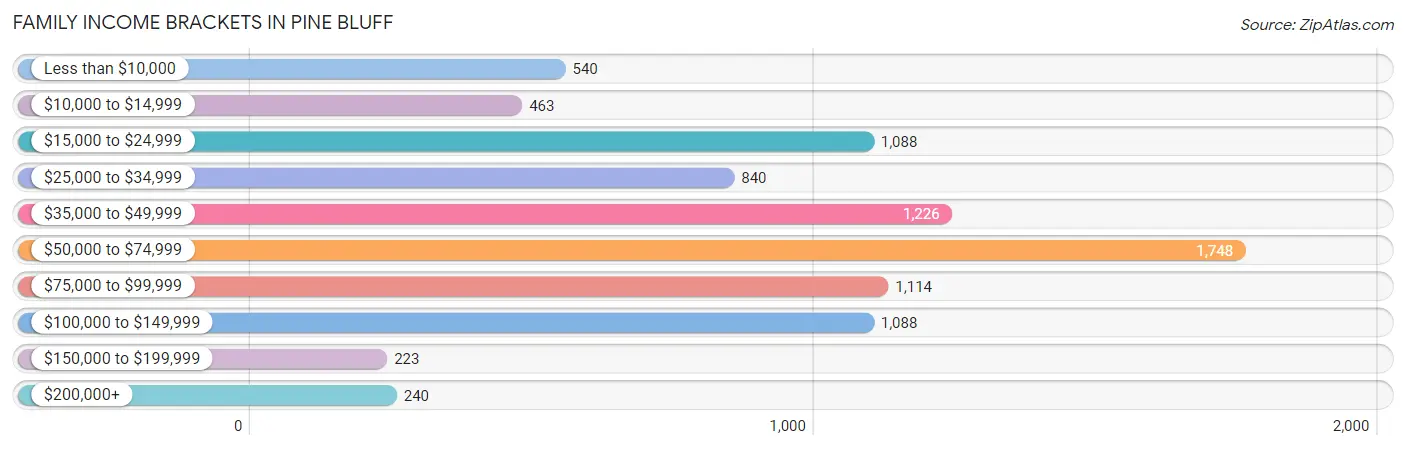
| Income Bracket | # Families | % Families |
| Less than $10,000 | 540 | 6.3% |
| $10,000 to $14,999 | 463 | 5.4% |
| $15,000 to $24,999 | 1,088 | 12.7% |
| $25,000 to $34,999 | 840 | 9.8% |
| $35,000 to $49,999 | 1,226 | 14.3% |
| $50,000 to $74,999 | 1,748 | 20.4% |
| $75,000 to $99,999 | 1,114 | 13.0% |
| $100,000 to $149,999 | 1,088 | 12.7% |
| $150,000 to $199,999 | 223 | 2.6% |
| $200,000+ | 240 | 2.8% |
Family Income by Famaliy Size in Pine Bluff
6-person families (89 | 1.0%) account for the highest median family income in Pine Bluff with $73,355 per family, while 2-person families (4,574 | 53.4%) have the highest median income of $23,376 per family member.
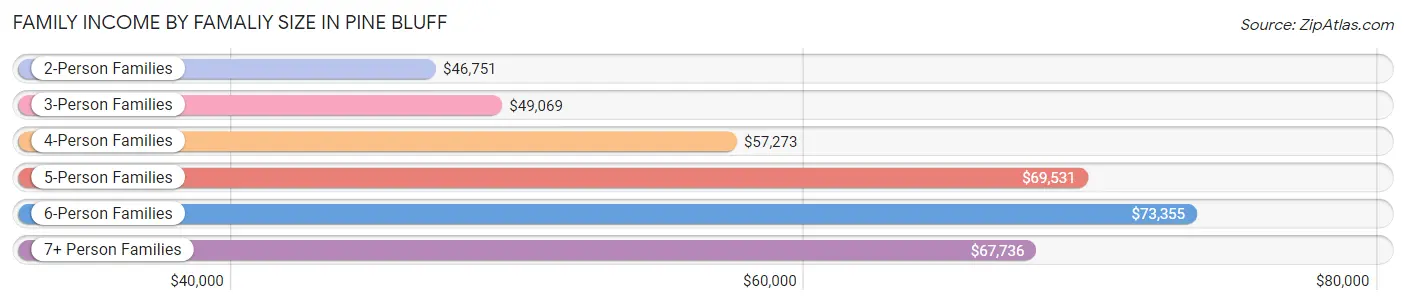
| Income Bracket | # Families | Median Income |
| 2-Person Families | 4,574 (53.4%) | $46,751 |
| 3-Person Families | 2,041 (23.8%) | $49,069 |
| 4-Person Families | 1,342 (15.7%) | $57,273 |
| 5-Person Families | 409 (4.8%) | $69,531 |
| 6-Person Families | 89 (1.0%) | $73,355 |
| 7+ Person Families | 115 (1.3%) | $67,736 |
| Total | 8,570 (100.0%) | $51,882 |
Family Income by Number of Earners in Pine Bluff
The median family income in Pine Bluff is $51,882, with families comprising 3+ earners (483) having the highest median family income of $102,106, while families with no earners (1,660) have the lowest median family income of $26,667, accounting for 5.6% and 19.4% of families, respectively.
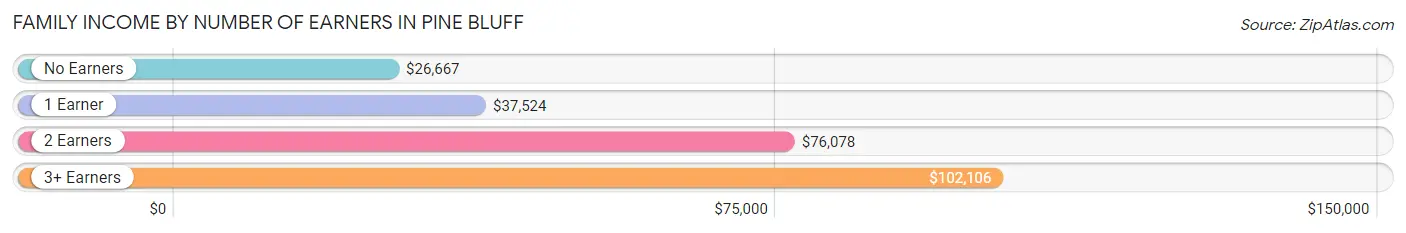
| Number of Earners | # Families | Median Income |
| No Earners | 1,660 (19.4%) | $26,667 |
| 1 Earner | 3,465 (40.4%) | $37,524 |
| 2 Earners | 2,962 (34.6%) | $76,078 |
| 3+ Earners | 483 (5.6%) | $102,106 |
| Total | 8,570 (100.0%) | $51,882 |
Household Income in Pine Bluff
Household Income Brackets in Pine Bluff
With 2,504 households falling in the category, the $50,000 to $74,999 income range is the most frequent in Pine Bluff, accounting for 16.6% of all households. In contrast, only 302 households (2.0%) fall into the $150,000 to $199,999 income bracket, making it the least populous group.
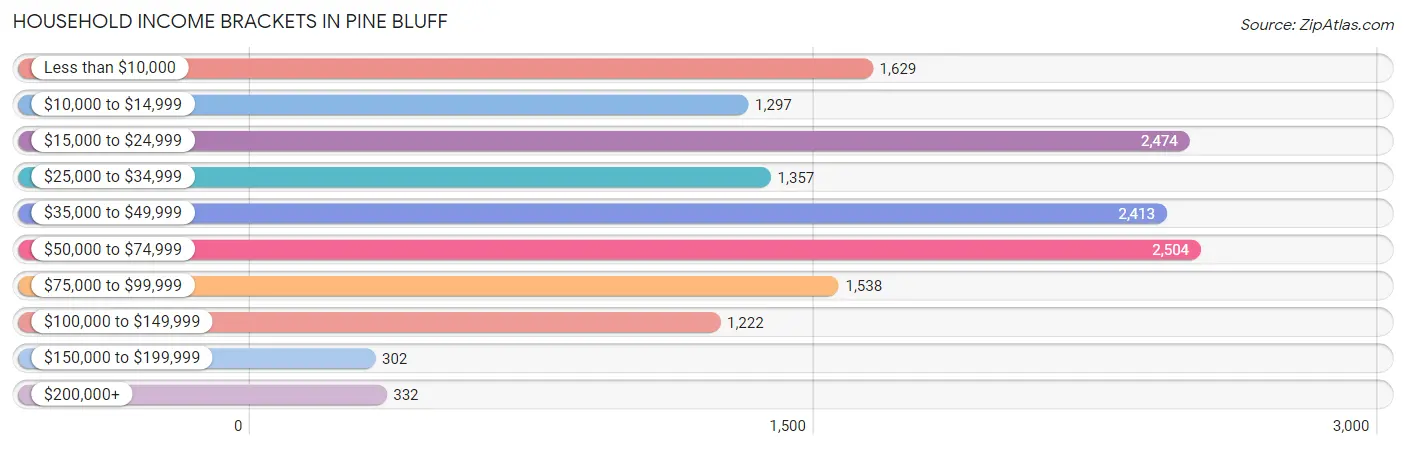
| Income Bracket | # Households | % Households |
| Less than $10,000 | 1,629 | 10.8% |
| $10,000 to $14,999 | 1,297 | 8.6% |
| $15,000 to $24,999 | 2,474 | 16.4% |
| $25,000 to $34,999 | 1,357 | 9.0% |
| $35,000 to $49,999 | 2,413 | 16.0% |
| $50,000 to $74,999 | 2,504 | 16.6% |
| $75,000 to $99,999 | 1,538 | 10.2% |
| $100,000 to $149,999 | 1,222 | 8.1% |
| $150,000 to $199,999 | 302 | 2.0% |
| $200,000+ | 332 | 2.2% |
Household Income by Householder Age in Pine Bluff
The median household income in Pine Bluff is $39,411, with the highest median household income of $44,690 found in the 45 to 64 years age bracket for the primary householder. A total of 5,622 households (37.3%) fall into this category. Meanwhile, the 65+ years age bracket for the primary householder has the lowest median household income of $34,035, with 4,269 households (28.3%) in this group.
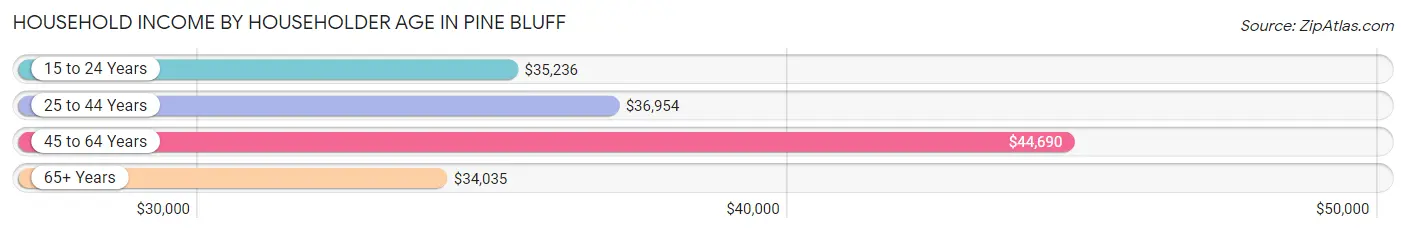
| Income Bracket | # Households | Median Income |
| 15 to 24 Years | 579 (3.8%) | $35,236 |
| 25 to 44 Years | 4,613 (30.6%) | $36,954 |
| 45 to 64 Years | 5,622 (37.3%) | $44,690 |
| 65+ Years | 4,269 (28.3%) | $34,035 |
| Total | 15,083 (100.0%) | $39,411 |
Poverty in Pine Bluff
Income Below Poverty by Sex and Age in Pine Bluff
With 23.1% poverty level for males and 26.4% for females among the residents of Pine Bluff, 6 to 11 year old males and under 5 year old females are the most vulnerable to poverty, with 662 males (44.4%) and 650 females (51.7%) in their respective age groups living below the poverty level.
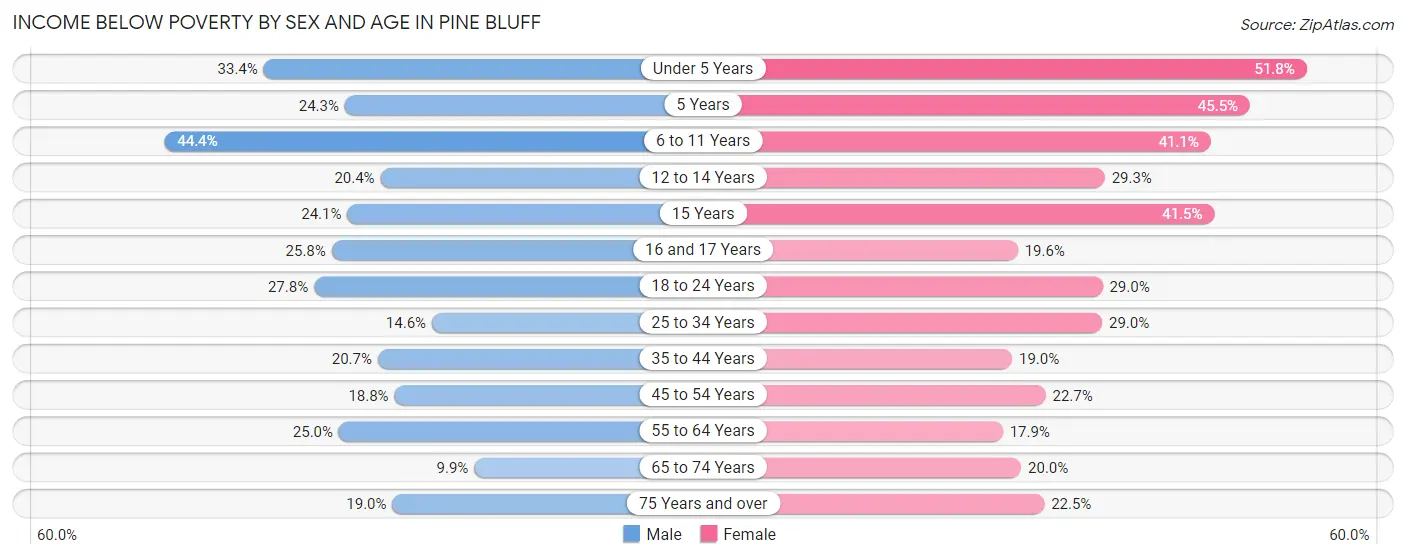
| Age Bracket | Male | Female |
| Under 5 Years | 449 (33.4%) | 650 (51.7%) |
| 5 Years | 46 (24.3%) | 65 (45.5%) |
| 6 to 11 Years | 662 (44.4%) | 663 (41.1%) |
| 12 to 14 Years | 163 (20.4%) | 188 (29.3%) |
| 15 Years | 32 (24.1%) | 73 (41.5%) |
| 16 and 17 Years | 119 (25.8%) | 115 (19.6%) |
| 18 to 24 Years | 378 (27.8%) | 546 (29.0%) |
| 25 to 34 Years | 334 (14.6%) | 726 (29.0%) |
| 35 to 44 Years | 438 (20.7%) | 449 (19.0%) |
| 45 to 54 Years | 319 (18.8%) | 539 (22.7%) |
| 55 to 64 Years | 586 (25.0%) | 513 (17.9%) |
| 65 to 74 Years | 162 (9.9%) | 424 (20.0%) |
| 75 Years and over | 158 (19.0%) | 336 (22.5%) |
| Total | 3,846 (23.1%) | 5,287 (26.4%) |
Income Above Poverty by Sex and Age in Pine Bluff
According to the poverty statistics in Pine Bluff, males aged 65 to 74 years and females aged 55 to 64 years are the age groups that are most secure financially, with 90.1% of males and 82.1% of females in these age groups living above the poverty line.
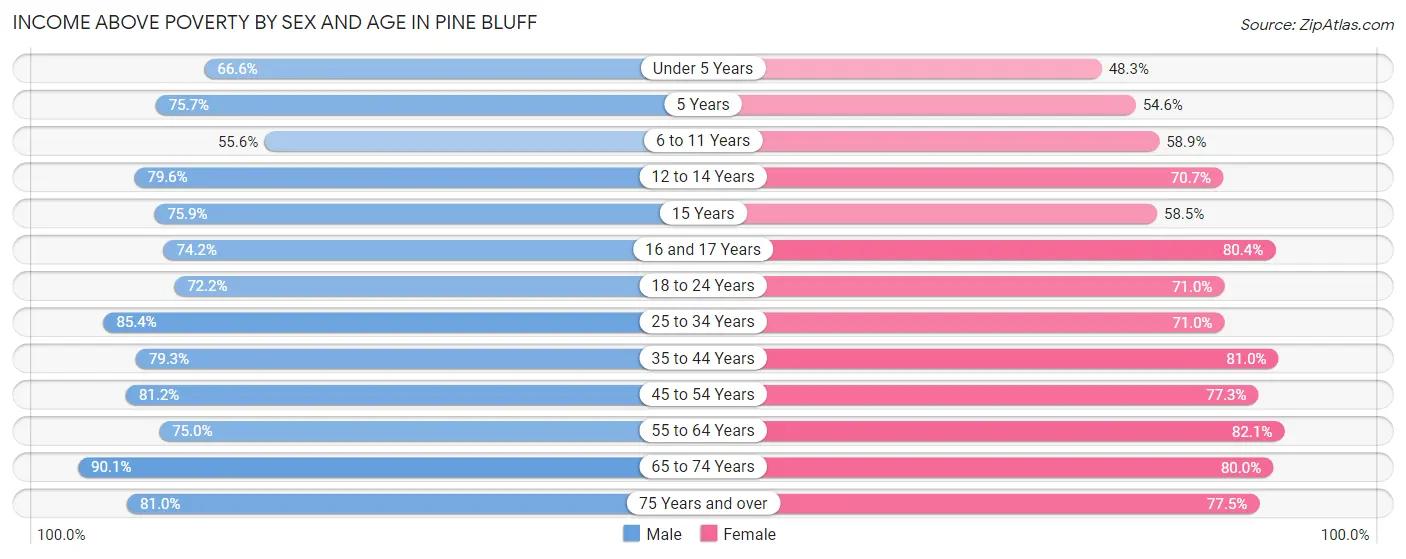
| Age Bracket | Male | Female |
| Under 5 Years | 896 (66.6%) | 606 (48.2%) |
| 5 Years | 143 (75.7%) | 78 (54.5%) |
| 6 to 11 Years | 828 (55.6%) | 951 (58.9%) |
| 12 to 14 Years | 637 (79.6%) | 454 (70.7%) |
| 15 Years | 101 (75.9%) | 103 (58.5%) |
| 16 and 17 Years | 342 (74.2%) | 472 (80.4%) |
| 18 to 24 Years | 983 (72.2%) | 1,335 (71.0%) |
| 25 to 34 Years | 1,947 (85.4%) | 1,779 (71.0%) |
| 35 to 44 Years | 1,682 (79.3%) | 1,919 (81.0%) |
| 45 to 54 Years | 1,377 (81.2%) | 1,837 (77.3%) |
| 55 to 64 Years | 1,758 (75.0%) | 2,350 (82.1%) |
| 65 to 74 Years | 1,469 (90.1%) | 1,699 (80.0%) |
| 75 Years and over | 672 (81.0%) | 1,155 (77.5%) |
| Total | 12,835 (76.9%) | 14,738 (73.6%) |
Income Below Poverty Among Married-Couple Families in Pine Bluff
The poverty statistics for married-couple families in Pine Bluff show that 11.8% or 509 of the total 4,299 families live below the poverty line. Families with 3 or 4 children have the highest poverty rate of 32.2%, comprising of 46 families. On the other hand, families with 5 or more children have the lowest poverty rate of 0.0%, which includes 0 families.
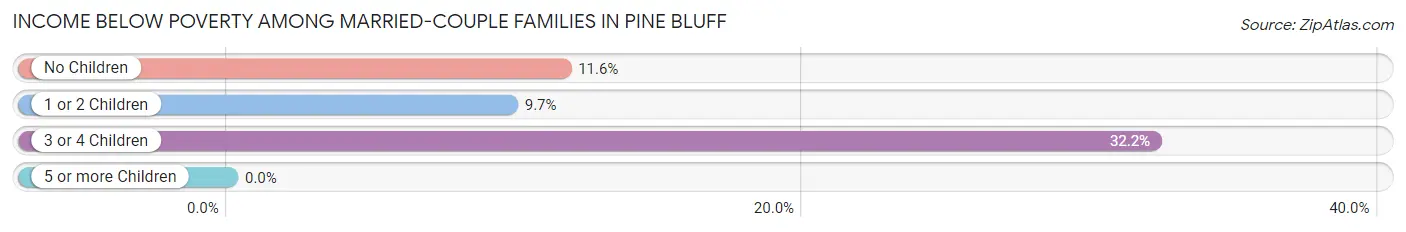
| Children | Above Poverty | Below Poverty |
| No Children | 2,796 (88.4%) | 367 (11.6%) |
| 1 or 2 Children | 890 (90.3%) | 96 (9.7%) |
| 3 or 4 Children | 97 (67.8%) | 46 (32.2%) |
| 5 or more Children | 7 (100.0%) | 0 (0.0%) |
| Total | 3,790 (88.2%) | 509 (11.8%) |
Income Below Poverty Among Single-Parent Households in Pine Bluff
According to the poverty data in Pine Bluff, 14.6% or 127 single-father households and 34.2% or 1,164 single-mother households are living below the poverty line. Among single-father households, those with 3 or 4 children have the highest poverty rate, with 31 households (34.1%) experiencing poverty. Likewise, among single-mother households, those with 3 or 4 children have the highest poverty rate, with 295 households (71.8%) falling below the poverty line.
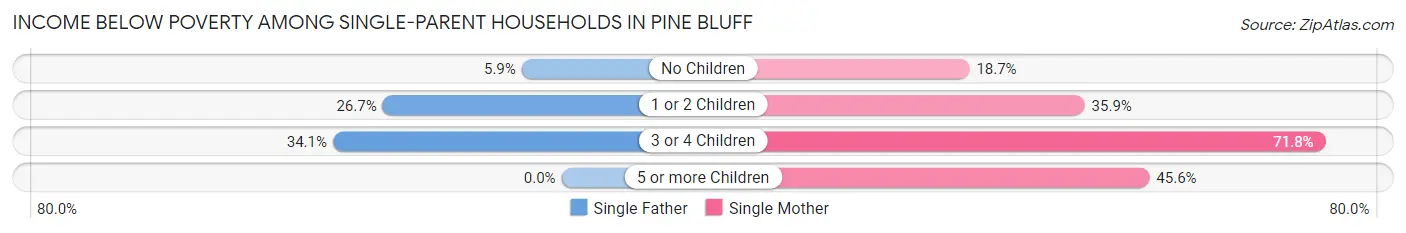
| Children | Single Father | Single Mother |
| No Children | 32 (5.9%) | 233 (18.7%) |
| 1 or 2 Children | 64 (26.7%) | 595 (35.9%) |
| 3 or 4 Children | 31 (34.1%) | 295 (71.8%) |
| 5 or more Children | 0 (0.0%) | 41 (45.6%) |
| Total | 127 (14.6%) | 1,164 (34.2%) |
Income Below Poverty Among Married-Couple vs Single-Parent Households in Pine Bluff
The poverty data for Pine Bluff shows that 509 of the married-couple family households (11.8%) and 1,291 of the single-parent households (30.2%) are living below the poverty level. Within the married-couple family households, those with 3 or 4 children have the highest poverty rate, with 46 households (32.2%) falling below the poverty line. Among the single-parent households, those with 3 or 4 children have the highest poverty rate, with 326 household (64.9%) living below poverty.
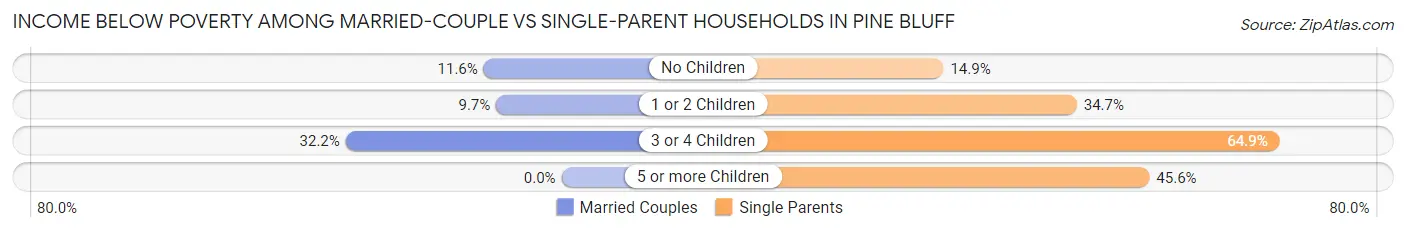
| Children | Married-Couple Families | Single-Parent Households |
| No Children | 367 (11.6%) | 265 (14.9%) |
| 1 or 2 Children | 96 (9.7%) | 659 (34.7%) |
| 3 or 4 Children | 46 (32.2%) | 326 (64.9%) |
| 5 or more Children | 0 (0.0%) | 41 (45.6%) |
| Total | 509 (11.8%) | 1,291 (30.2%) |
Race in Pine Bluff
The most populous races in Pine Bluff are Black / African American (31,859 | 77.4%), White / Caucasian (7,424 | 18.0%), and Two or more Races (1,008 | 2.5%).
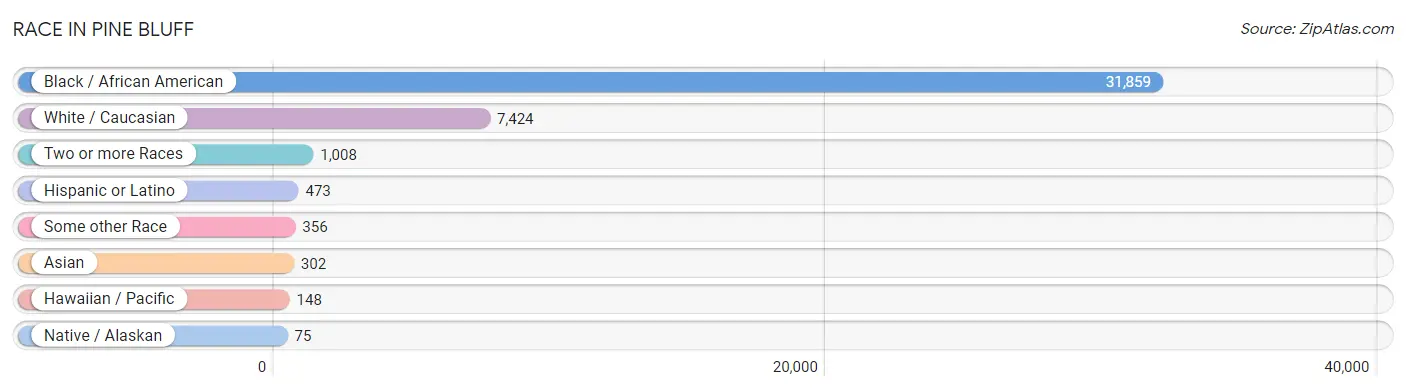
| Race | # Population | % Population |
| Asian | 302 | 0.7% |
| Black / African American | 31,859 | 77.4% |
| Hawaiian / Pacific | 148 | 0.4% |
| Hispanic or Latino | 473 | 1.1% |
| Native / Alaskan | 75 | 0.2% |
| White / Caucasian | 7,424 | 18.0% |
| Two or more Races | 1,008 | 2.5% |
| Some other Race | 356 | 0.9% |
| Total | 41,172 | 100.0% |
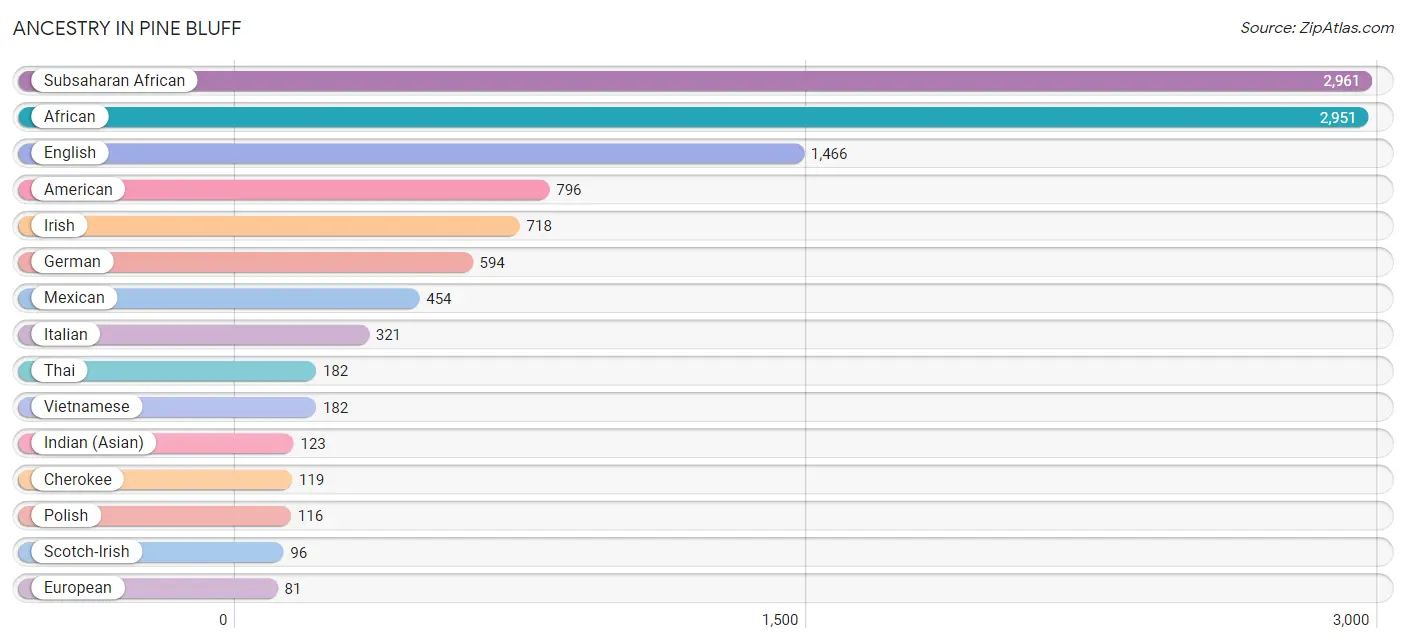
Ancestry in Pine Bluff
The most populous ancestries reported in Pine Bluff are Subsaharan African (2,961 | 7.2%), African (2,951 | 7.2%), English (1,466 | 3.6%), American (796 | 1.9%), and Irish (718 | 1.7%), together accounting for 21.6% of all Pine Bluff residents.
| Ancestry | # Population | % Population |
| African | 2,951 | 7.2% |
| American | 796 | 1.9% |
| Apache | 9 | 0.0% |
| Australian | 25 | 0.1% |
| Austrian | 19 | 0.1% |
| Blackfeet | 7 | 0.0% |
| British | 66 | 0.2% |
| Burmese | 14 | 0.0% |
| Cherokee | 119 | 0.3% |
| Chickasaw | 14 | 0.0% |
| Croatian | 8 | 0.0% |
| Cuban | 9 | 0.0% |
| Czech | 2 | 0.0% |
| Danish | 17 | 0.0% |
| Dutch | 33 | 0.1% |
| Eastern European | 22 | 0.1% |
| English | 1,466 | 3.6% |
| European | 81 | 0.2% |
| French | 16 | 0.0% |
| German | 594 | 1.4% |
| Greek | 61 | 0.2% |
| Hungarian | 17 | 0.0% |
| Indian (Asian) | 123 | 0.3% |
| Irish | 718 | 1.7% |
| Italian | 321 | 0.8% |
| Korean | 4 | 0.0% |
| Lithuanian | 14 | 0.0% |
| Malaysian | 11 | 0.0% |
| Mexican | 454 | 1.1% |
| Native Hawaiian | 36 | 0.1% |
| Navajo | 22 | 0.1% |
| Nigerian | 10 | 0.0% |
| Norwegian | 42 | 0.1% |
| Polish | 116 | 0.3% |
| Puerto Rican | 3 | 0.0% |
| Russian | 32 | 0.1% |
| Scandinavian | 22 | 0.1% |
| Scotch-Irish | 96 | 0.2% |
| Scottish | 40 | 0.1% |
| Sri Lankan | 31 | 0.1% |
| Subsaharan African | 2,961 | 7.2% |
| Swedish | 76 | 0.2% |
| Swiss | 14 | 0.0% |
| Thai | 182 | 0.4% |
| Vietnamese | 182 | 0.4% |
| Welsh | 18 | 0.0% | View All 46 Rows |
Immigrants in Pine Bluff
The most numerous immigrant groups reported in Pine Bluff came from Asia (325 | 0.8%), South Central Asia (192 | 0.5%), Central America (175 | 0.4%), Latin America (175 | 0.4%), and Mexico (175 | 0.4%), together accounting for 2.5% of all Pine Bluff residents.
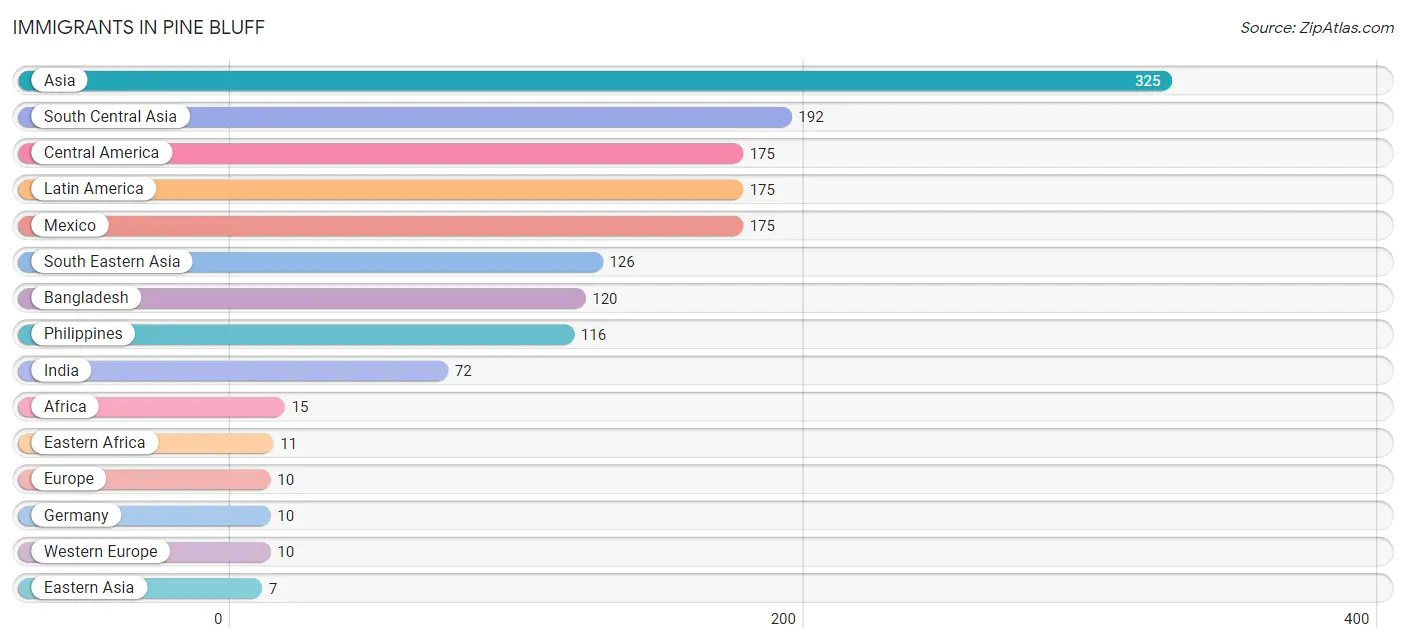
| Immigration Origin | # Population | % Population |
| Africa | 15 | 0.0% |
| Asia | 325 | 0.8% |
| Bangladesh | 120 | 0.3% |
| Central America | 175 | 0.4% |
| Eastern Africa | 11 | 0.0% |
| Eastern Asia | 7 | 0.0% |
| Egypt | 4 | 0.0% |
| Europe | 10 | 0.0% |
| Germany | 10 | 0.0% |
| India | 72 | 0.2% |
| Korea | 7 | 0.0% |
| Laos | 5 | 0.0% |
| Latin America | 175 | 0.4% |
| Mexico | 175 | 0.4% |
| Northern Africa | 4 | 0.0% |
| Philippines | 116 | 0.3% |
| South Central Asia | 192 | 0.5% |
| South Eastern Asia | 126 | 0.3% |
| Thailand | 5 | 0.0% |
| Western Europe | 10 | 0.0% | View All 20 Rows |
Sex and Age in Pine Bluff
Sex and Age in Pine Bluff
The most populous age groups in Pine Bluff are 20 to 24 Years (1,485 | 7.5%) for men and 15 to 19 Years (1,687 | 7.9%) for women.
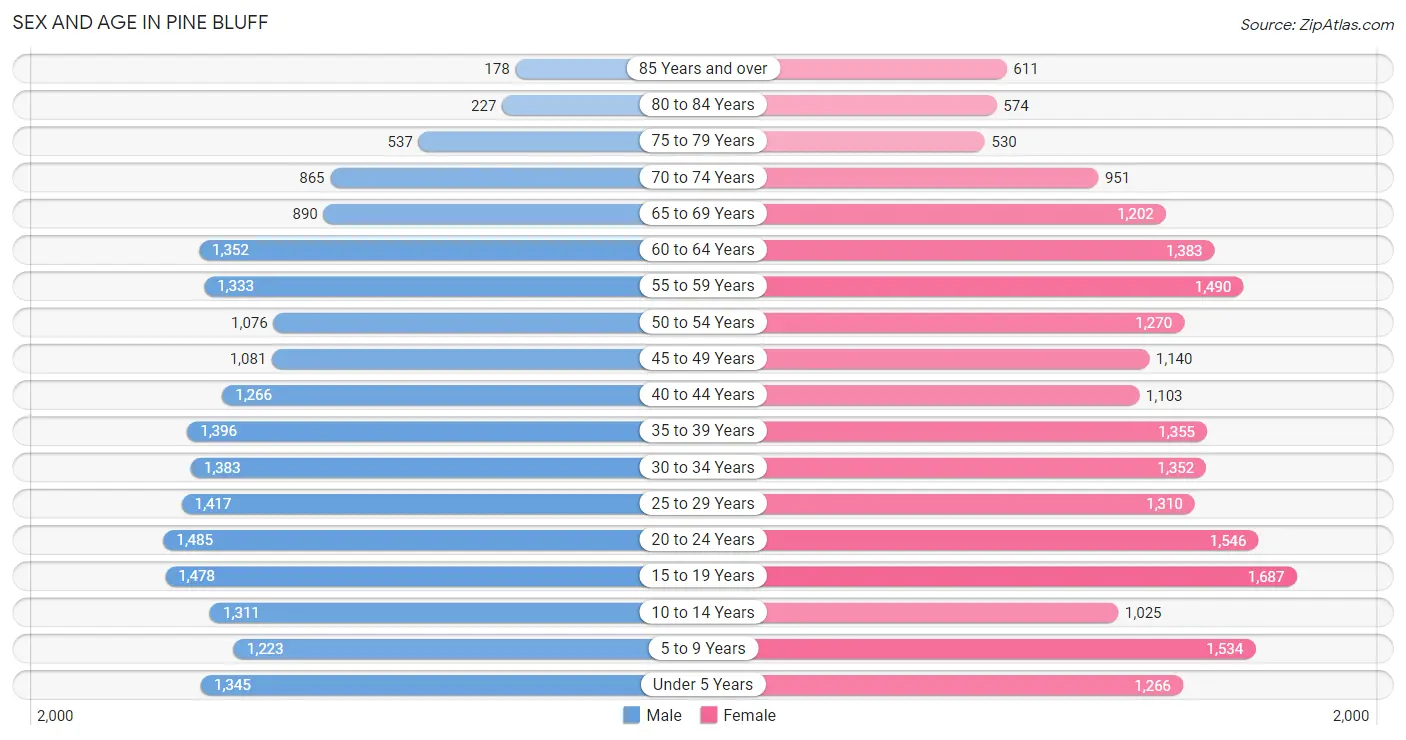
| Age Bracket | Male | Female |
| Under 5 Years | 1,345 (6.8%) | 1,266 (5.9%) |
| 5 to 9 Years | 1,223 (6.2%) | 1,534 (7.2%) |
| 10 to 14 Years | 1,311 (6.6%) | 1,025 (4.8%) |
| 15 to 19 Years | 1,478 (7.4%) | 1,687 (7.9%) |
| 20 to 24 Years | 1,485 (7.5%) | 1,546 (7.2%) |
| 25 to 29 Years | 1,417 (7.1%) | 1,310 (6.1%) |
| 30 to 34 Years | 1,383 (7.0%) | 1,352 (6.3%) |
| 35 to 39 Years | 1,396 (7.0%) | 1,355 (6.4%) |
| 40 to 44 Years | 1,266 (6.4%) | 1,103 (5.2%) |
| 45 to 49 Years | 1,081 (5.4%) | 1,140 (5.3%) |
| 50 to 54 Years | 1,076 (5.4%) | 1,270 (5.9%) |
| 55 to 59 Years | 1,333 (6.7%) | 1,490 (7.0%) |
| 60 to 64 Years | 1,352 (6.8%) | 1,383 (6.5%) |
| 65 to 69 Years | 890 (4.5%) | 1,202 (5.6%) |
| 70 to 74 Years | 865 (4.4%) | 951 (4.5%) |
| 75 to 79 Years | 537 (2.7%) | 530 (2.5%) |
| 80 to 84 Years | 227 (1.1%) | 574 (2.7%) |
| 85 Years and over | 178 (0.9%) | 611 (2.9%) |
| Total | 19,843 (100.0%) | 21,329 (100.0%) |
Families and Households in Pine Bluff
Median Family Size in Pine Bluff
The median family size in Pine Bluff is 3.31 persons per family, with single male/father families (870 | 10.2%) accounting for the largest median family size of 3.81 persons per family. On the other hand, married-couple families (4,299 | 50.2%) represent the smallest median family size with 2.99 persons per family.
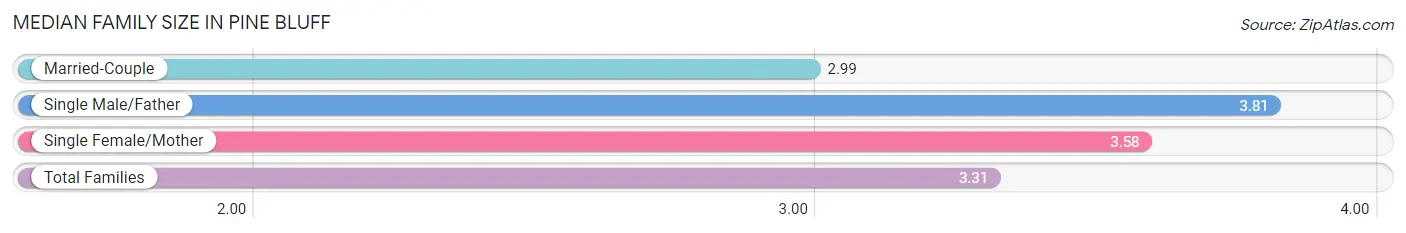
| Family Type | # Families | Family Size |
| Married-Couple | 4,299 (50.2%) | 2.99 |
| Single Male/Father | 870 (10.2%) | 3.81 |
| Single Female/Mother | 3,401 (39.7%) | 3.58 |
| Total Families | 8,570 (100.0%) | 3.31 |
Median Household Size in Pine Bluff
The median household size in Pine Bluff is 2.45 persons per household, with single male/father households (870 | 5.8%) accounting for the largest median household size of 4.26 persons per household. non-family households (6,513 | 43.2%) represent the smallest median household size with 1.15 persons per household.
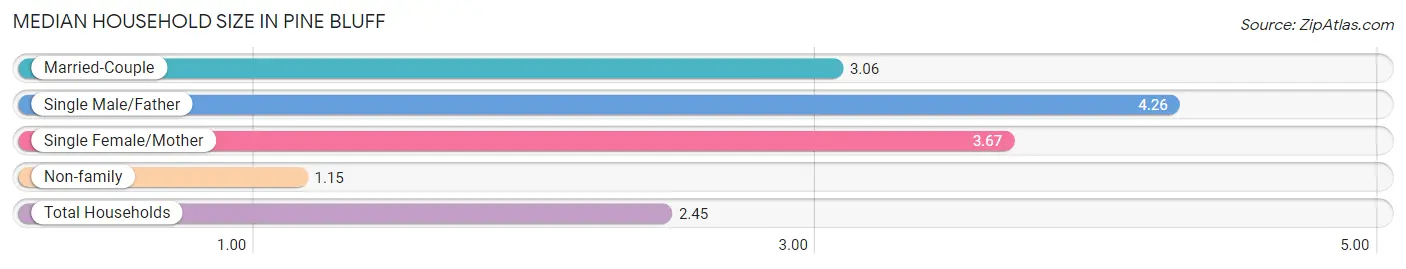
| Household Type | # Households | Household Size |
| Married-Couple | 4,299 (28.5%) | 3.06 |
| Single Male/Father | 870 (5.8%) | 4.26 |
| Single Female/Mother | 3,401 (22.6%) | 3.67 |
| Non-family | 6,513 (43.2%) | 1.15 |
| Total Households | 15,083 (100.0%) | 2.45 |
Household Size by Marriage Status in Pine Bluff
Out of a total of 15,083 households in Pine Bluff, 8,570 (56.8%) are family households, while 6,513 (43.2%) are nonfamily households. The most numerous type of family households are 2-person households, comprising 4,294, and the most common type of nonfamily households are 1-person households, comprising 5,721.
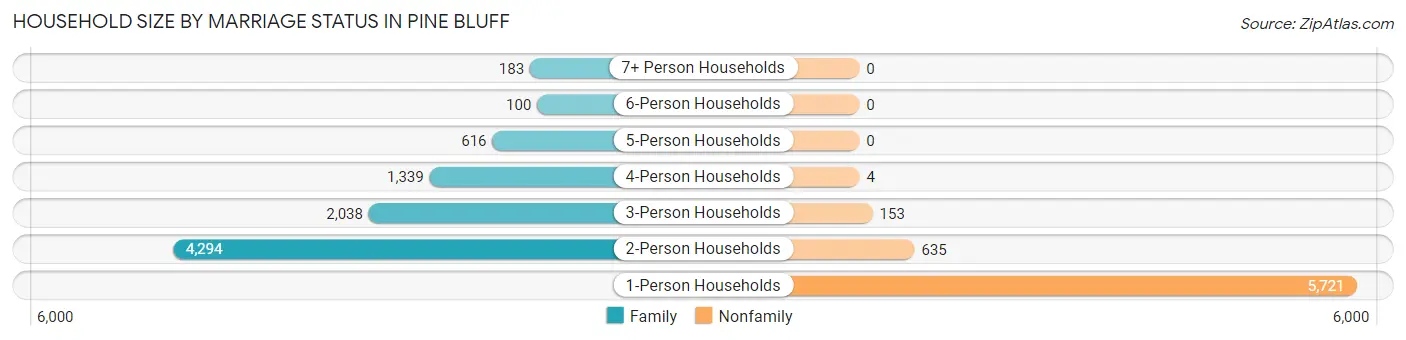
| Household Size | Family Households | Nonfamily Households |
| 1-Person Households | - | 5,721 (37.9%) |
| 2-Person Households | 4,294 (28.5%) | 635 (4.2%) |
| 3-Person Households | 2,038 (13.5%) | 153 (1.0%) |
| 4-Person Households | 1,339 (8.9%) | 4 (0.0%) |
| 5-Person Households | 616 (4.1%) | 0 (0.0%) |
| 6-Person Households | 100 (0.7%) | 0 (0.0%) |
| 7+ Person Households | 183 (1.2%) | 0 (0.0%) |
| Total | 8,570 (56.8%) | 6,513 (43.2%) |
Female Fertility in Pine Bluff
Fertility by Age in Pine Bluff
Average fertility rate in Pine Bluff is 41.0 births per 1,000 women. Women in the age bracket of 20 to 34 years have the highest fertility rate with 67.0 births per 1,000 women. Women in the age bracket of 20 to 34 years acount for 71.0% of all women with births.
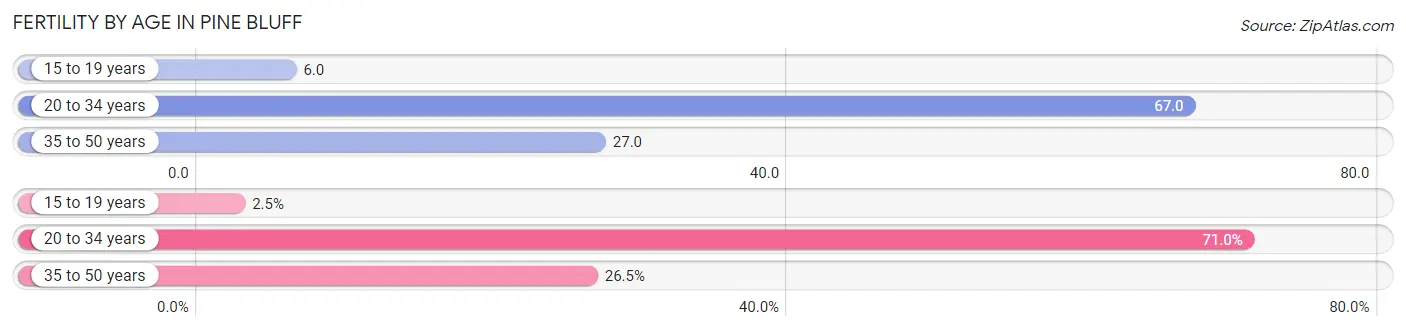
| Age Bracket | Women with Births | Births / 1,000 Women |
| 15 to 19 years | 10 (2.5%) | 6.0 |
| 20 to 34 years | 282 (71.0%) | 67.0 |
| 35 to 50 years | 105 (26.5%) | 27.0 |
| Total | 397 (100.0%) | 41.0 |
Fertility by Age by Marriage Status in Pine Bluff
24.2% of women with births (397) in Pine Bluff are married. The highest percentage of unmarried women with births falls into 15 to 19 years age bracket with 100.0% of them unmarried at the time of birth, while the lowest percentage of unmarried women with births belong to 35 to 50 years age bracket with 63.8% of them unmarried.
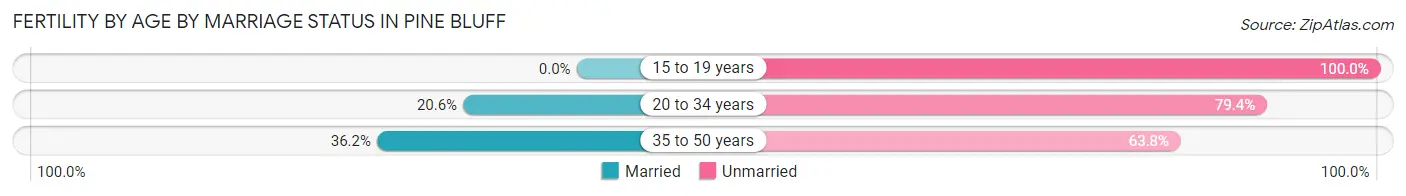
| Age Bracket | Married | Unmarried |
| 15 to 19 years | 0 (0.0%) | 10 (100.0%) |
| 20 to 34 years | 58 (20.6%) | 224 (79.4%) |
| 35 to 50 years | 38 (36.2%) | 67 (63.8%) |
| Total | 96 (24.2%) | 301 (75.8%) |
Fertility by Education in Pine Bluff
Average fertility rate in Pine Bluff is 41.0 births per 1,000 women. Women with the education attainment of college or associate's degree have the highest fertility rate of 50.0 births per 1,000 women, while women with the education attainment of bachelor's degree have the lowest fertility at 16.0 births per 1,000 women. Women with the education attainment of college or associate's degree represent 41.8% of all women with births.
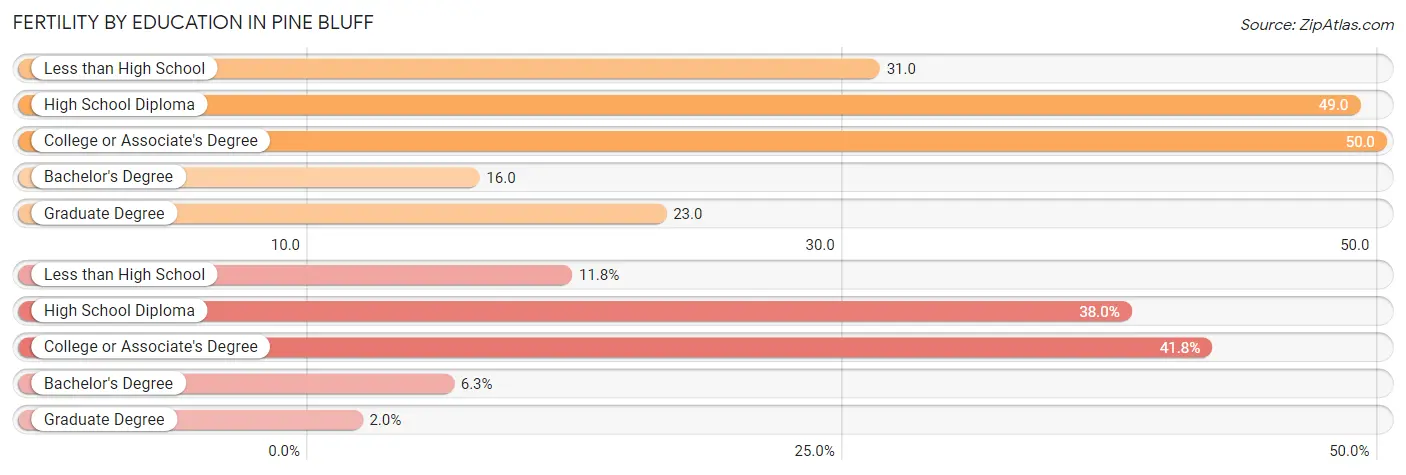
| Educational Attainment | Women with Births | Births / 1,000 Women |
| Less than High School | 47 (11.8%) | 31.0 |
| High School Diploma | 151 (38.0%) | 49.0 |
| College or Associate's Degree | 166 (41.8%) | 50.0 |
| Bachelor's Degree | 25 (6.3%) | 16.0 |
| Graduate Degree | 8 (2.0%) | 23.0 |
| Total | 397 (100.0%) | 41.0 |
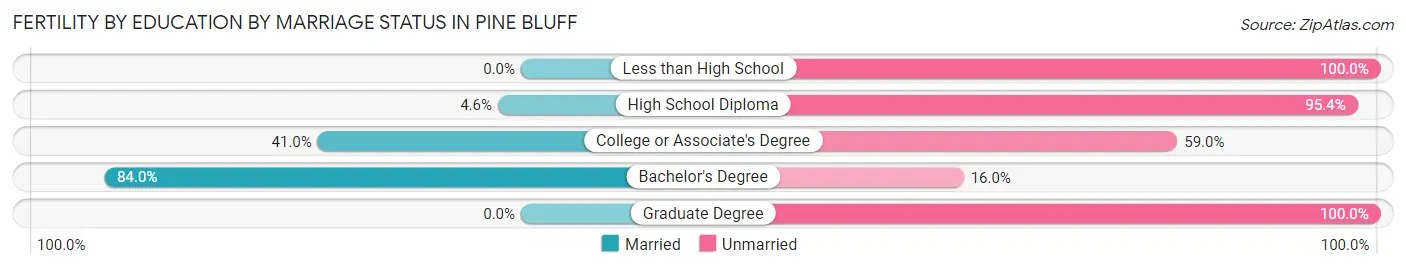
Fertility by Education by Marriage Status in Pine Bluff
75.8% of women with births in Pine Bluff are unmarried. Women with the educational attainment of bachelor's degree are most likely to be married with 84.0% of them married at childbirth, while women with the educational attainment of less than high school are least likely to be married with 100.0% of them unmarried at childbirth.
| Educational Attainment | Married | Unmarried |
| Less than High School | 0 (0.0%) | 47 (100.0%) |
| High School Diploma | 7 (4.6%) | 144 (95.4%) |
| College or Associate's Degree | 68 (41.0%) | 98 (59.0%) |
| Bachelor's Degree | 21 (84.0%) | 4 (16.0%) |
| Graduate Degree | 0 (0.0%) | 8 (100.0%) |
| Total | 96 (24.2%) | 301 (75.8%) |
Employment Characteristics in Pine Bluff
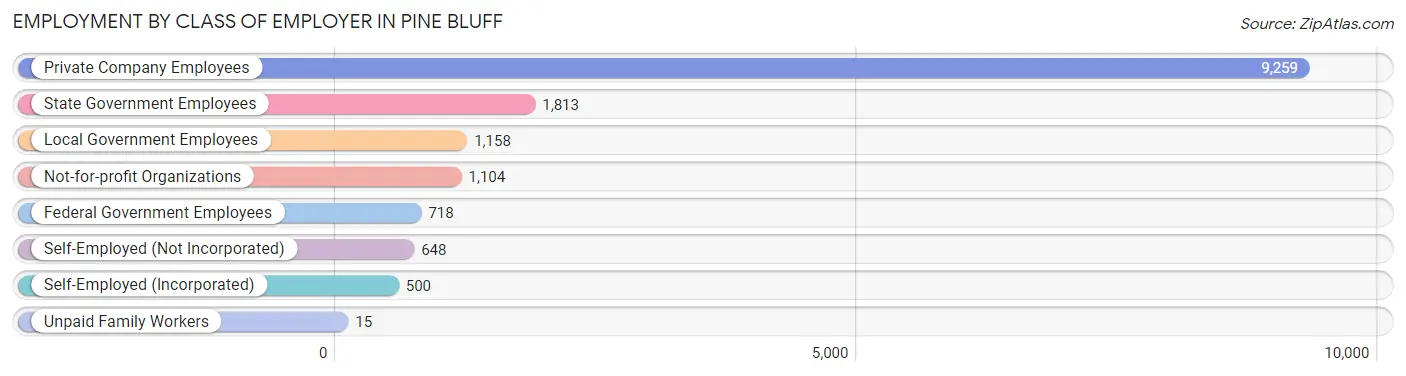
Employment by Class of Employer in Pine Bluff
Among the 15,215 employed individuals in Pine Bluff, private company employees (9,259 | 60.9%), state government employees (1,813 | 11.9%), and local government employees (1,158 | 7.6%) make up the most common classes of employment.
| Employer Class | # Employees | % Employees |
| Private Company Employees | 9,259 | 60.9% |
| Self-Employed (Incorporated) | 500 | 3.3% |
| Self-Employed (Not Incorporated) | 648 | 4.3% |
| Not-for-profit Organizations | 1,104 | 7.3% |
| Local Government Employees | 1,158 | 7.6% |
| State Government Employees | 1,813 | 11.9% |
| Federal Government Employees | 718 | 4.7% |
| Unpaid Family Workers | 15 | 0.1% |
| Total | 15,215 | 100.0% |
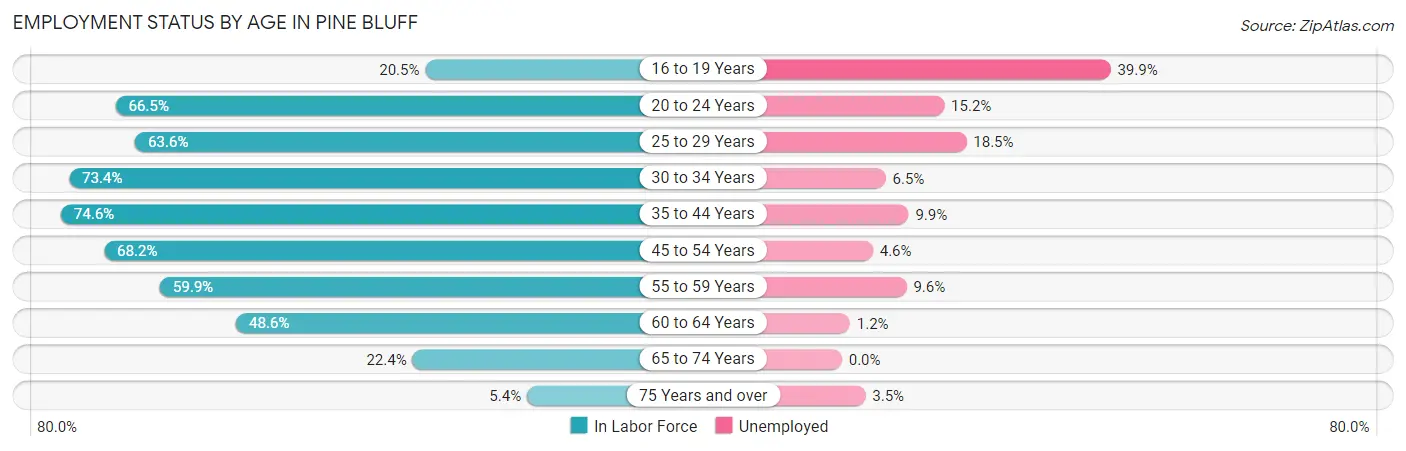
Employment Status by Age in Pine Bluff
According to the labor force statistics for Pine Bluff, out of the total population over 16 years of age (33,159), 52.2% or 17,309 individuals are in the labor force, with 9.8% or 1,696 of them unemployed. The age group with the highest labor force participation rate is 35 to 44 years, with 74.6% or 3,820 individuals in the labor force. Within the labor force, the 16 to 19 years age range has the highest percentage of unemployed individuals, with 39.9% or 233 of them being unemployed.
| Age Bracket | In Labor Force | Unemployed |
| 16 to 19 Years | 585 (20.5%) | 233 (39.9%) |
| 20 to 24 Years | 2,016 (66.5%) | 306 (15.2%) |
| 25 to 29 Years | 1,734 (63.6%) | 321 (18.5%) |
| 30 to 34 Years | 2,007 (73.4%) | 130 (6.5%) |
| 35 to 44 Years | 3,820 (74.6%) | 378 (9.9%) |
| 45 to 54 Years | 3,115 (68.2%) | 143 (4.6%) |
| 55 to 59 Years | 1,691 (59.9%) | 162 (9.6%) |
| 60 to 64 Years | 1,329 (48.6%) | 16 (1.2%) |
| 65 to 74 Years | 875 (22.4%) | 0 (0.0%) |
| 75 Years and over | 143 (5.4%) | 5 (3.5%) |
| Total | 17,309 (52.2%) | 1,696 (9.8%) |
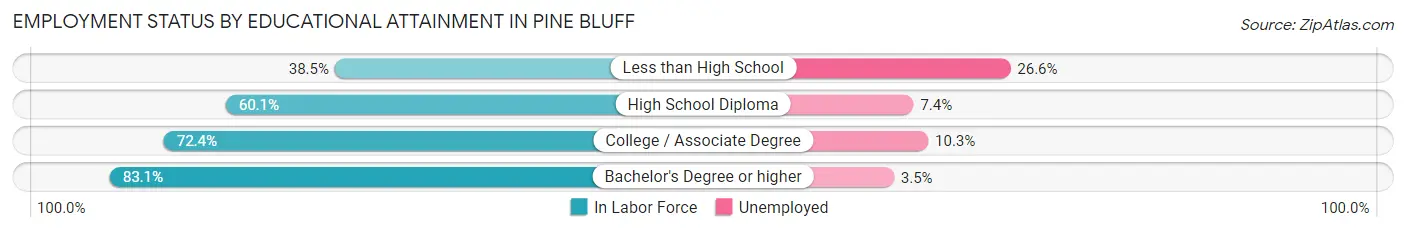
Employment Status by Educational Attainment in Pine Bluff
According to labor force statistics for Pine Bluff, 66.1% of individuals (13,687) out of the total population between 25 and 64 years of age (20,707) are in the labor force, with 8.4% or 1,150 of them being unemployed. The group with the highest labor force participation rate are those with the educational attainment of bachelor's degree or higher, with 83.1% or 3,584 individuals in the labor force. Within the labor force, individuals with less than high school education have the highest percentage of unemployment, with 26.6% or 218 of them being unemployed.
| Educational Attainment | In Labor Force | Unemployed |
| Less than High School | 818 (38.5%) | 565 (26.6%) |
| High School Diploma | 5,080 (60.1%) | 626 (7.4%) |
| College / Associate Degree | 4,212 (72.4%) | 599 (10.3%) |
| Bachelor's Degree or higher | 3,584 (83.1%) | 151 (3.5%) |
| Total | 13,687 (66.1%) | 1,739 (8.4%) |
Employment Occupations by Sex in Pine Bluff
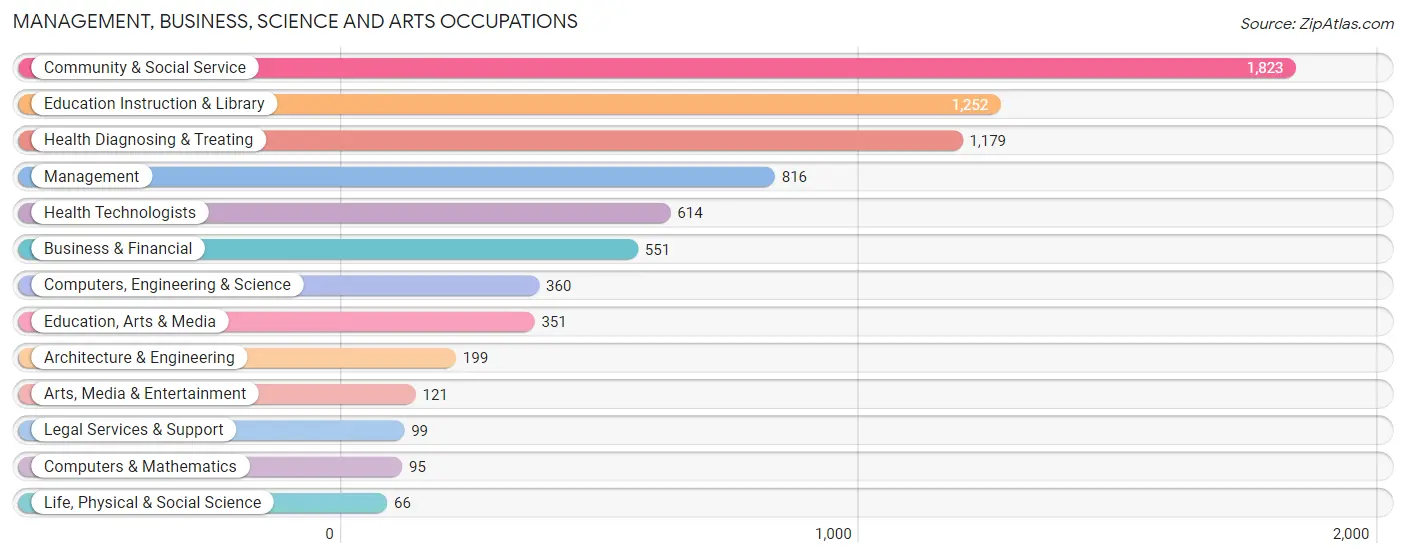
Management, Business, Science and Arts Occupations
The most common Management, Business, Science and Arts occupations in Pine Bluff are Community & Social Service (1,823 | 11.7%), Education Instruction & Library (1,252 | 8.0%), Health Diagnosing & Treating (1,179 | 7.5%), Management (816 | 5.2%), and Health Technologists (614 | 3.9%).
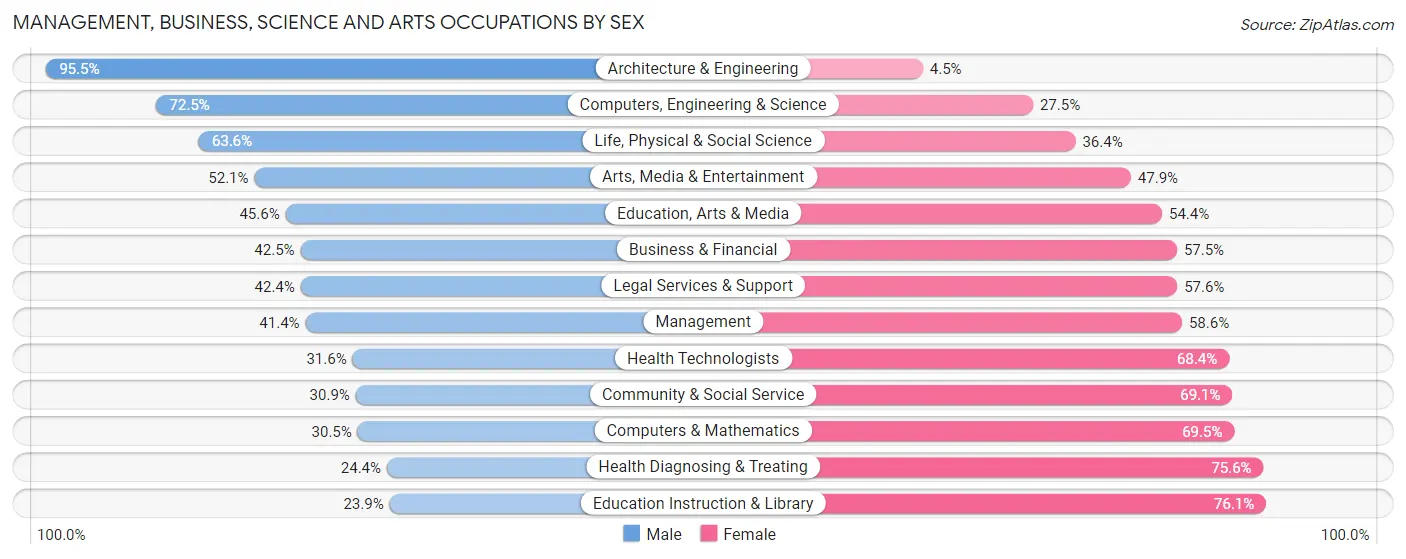
Management, Business, Science and Arts Occupations by Sex
Within the Management, Business, Science and Arts occupations in Pine Bluff, the most male-oriented occupations are Architecture & Engineering (95.5%), Computers, Engineering & Science (72.5%), and Life, Physical & Social Science (63.6%), while the most female-oriented occupations are Education Instruction & Library (76.1%), Health Diagnosing & Treating (75.6%), and Computers & Mathematics (69.5%).
| Occupation | Male | Female |
| Management | 338 (41.4%) | 478 (58.6%) |
| Business & Financial | 234 (42.5%) | 317 (57.5%) |
| Computers, Engineering & Science | 261 (72.5%) | 99 (27.5%) |
| Computers & Mathematics | 29 (30.5%) | 66 (69.5%) |
| Architecture & Engineering | 190 (95.5%) | 9 (4.5%) |
| Life, Physical & Social Science | 42 (63.6%) | 24 (36.4%) |
| Community & Social Service | 564 (30.9%) | 1,259 (69.1%) |
| Education, Arts & Media | 160 (45.6%) | 191 (54.4%) |
| Legal Services & Support | 42 (42.4%) | 57 (57.6%) |
| Education Instruction & Library | 299 (23.9%) | 953 (76.1%) |
| Arts, Media & Entertainment | 63 (52.1%) | 58 (47.9%) |
| Health Diagnosing & Treating | 288 (24.4%) | 891 (75.6%) |
| Health Technologists | 194 (31.6%) | 420 (68.4%) |
| Total (Category) | 1,685 (35.6%) | 3,044 (64.4%) |
| Total (Overall) | 6,935 (44.4%) | 8,681 (55.6%) |
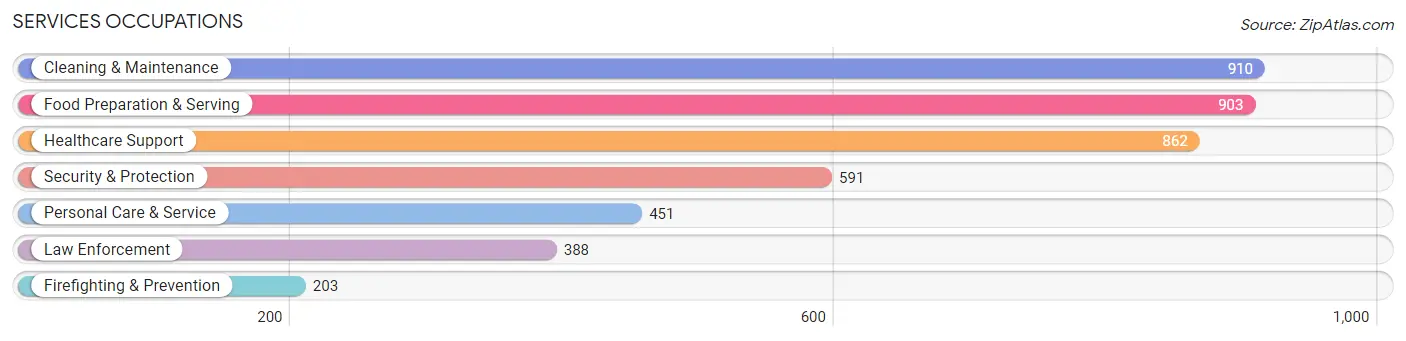
Services Occupations
The most common Services occupations in Pine Bluff are Cleaning & Maintenance (910 | 5.8%), Food Preparation & Serving (903 | 5.8%), Healthcare Support (862 | 5.5%), Security & Protection (591 | 3.8%), and Personal Care & Service (451 | 2.9%).
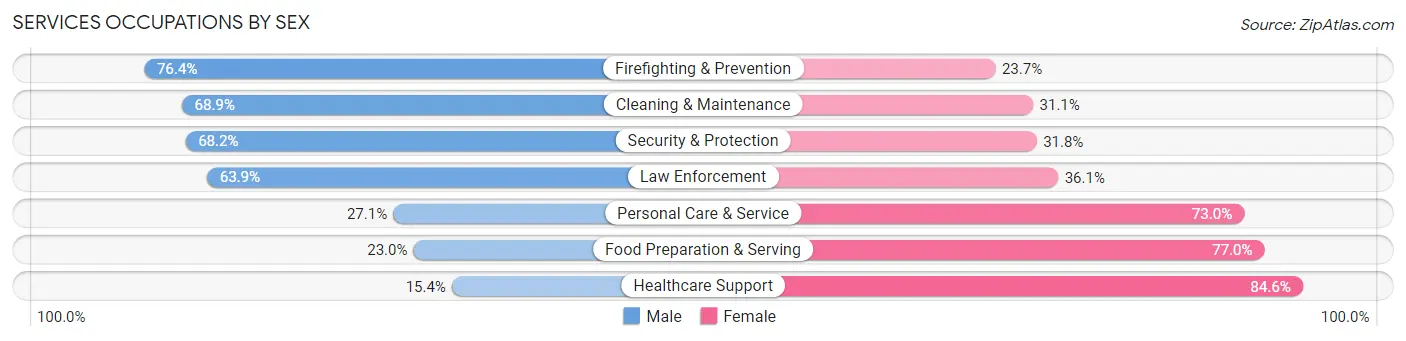
Services Occupations by Sex
Within the Services occupations in Pine Bluff, the most male-oriented occupations are Firefighting & Prevention (76.3%), Cleaning & Maintenance (68.9%), and Security & Protection (68.2%), while the most female-oriented occupations are Healthcare Support (84.6%), Food Preparation & Serving (77.0%), and Personal Care & Service (73.0%).
| Occupation | Male | Female |
| Healthcare Support | 133 (15.4%) | 729 (84.6%) |
| Security & Protection | 403 (68.2%) | 188 (31.8%) |
| Firefighting & Prevention | 155 (76.3%) | 48 (23.6%) |
| Law Enforcement | 248 (63.9%) | 140 (36.1%) |
| Food Preparation & Serving | 208 (23.0%) | 695 (77.0%) |
| Cleaning & Maintenance | 627 (68.9%) | 283 (31.1%) |
| Personal Care & Service | 122 (27.1%) | 329 (73.0%) |
| Total (Category) | 1,493 (40.2%) | 2,224 (59.8%) |
| Total (Overall) | 6,935 (44.4%) | 8,681 (55.6%) |
Sales and Office Occupations
The most common Sales and Office occupations in Pine Bluff are Office & Administration (1,392 | 8.9%), and Sales & Related (1,183 | 7.6%).

Sales and Office Occupations by Sex

| Occupation | Male | Female |
| Sales & Related | 469 (39.6%) | 714 (60.4%) |
| Office & Administration | 278 (20.0%) | 1,114 (80.0%) |
| Total (Category) | 747 (29.0%) | 1,828 (71.0%) |
| Total (Overall) | 6,935 (44.4%) | 8,681 (55.6%) |
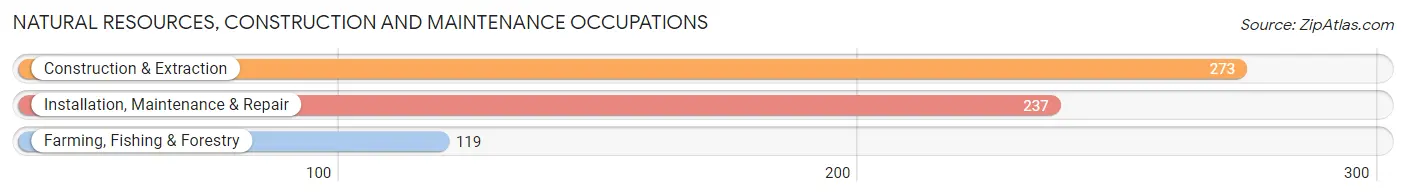
Natural Resources, Construction and Maintenance Occupations
The most common Natural Resources, Construction and Maintenance occupations in Pine Bluff are Construction & Extraction (273 | 1.8%), Installation, Maintenance & Repair (237 | 1.5%), and Farming, Fishing & Forestry (119 | 0.8%).
Natural Resources, Construction and Maintenance Occupations by Sex
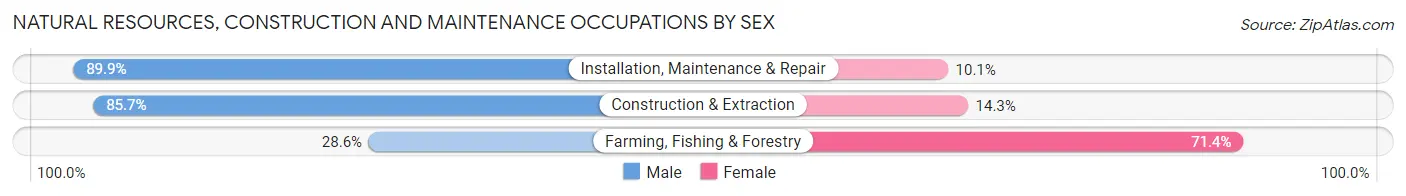
| Occupation | Male | Female |
| Farming, Fishing & Forestry | 34 (28.6%) | 85 (71.4%) |
| Construction & Extraction | 234 (85.7%) | 39 (14.3%) |
| Installation, Maintenance & Repair | 213 (89.9%) | 24 (10.1%) |
| Total (Category) | 481 (76.5%) | 148 (23.5%) |
| Total (Overall) | 6,935 (44.4%) | 8,681 (55.6%) |
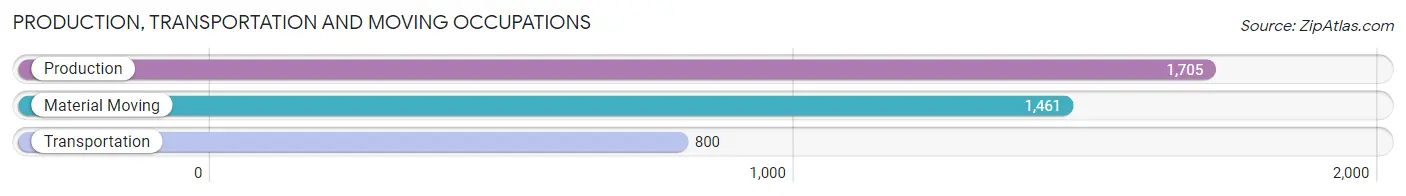
Production, Transportation and Moving Occupations
The most common Production, Transportation and Moving occupations in Pine Bluff are Production (1,705 | 10.9%), Material Moving (1,461 | 9.4%), and Transportation (800 | 5.1%).
Production, Transportation and Moving Occupations by Sex

| Occupation | Male | Female |
| Production | 843 (49.4%) | 862 (50.6%) |
| Transportation | 707 (88.4%) | 93 (11.6%) |
| Material Moving | 979 (67.0%) | 482 (33.0%) |
| Total (Category) | 2,529 (63.8%) | 1,437 (36.2%) |
| Total (Overall) | 6,935 (44.4%) | 8,681 (55.6%) |
Employment Industries by Sex in Pine Bluff
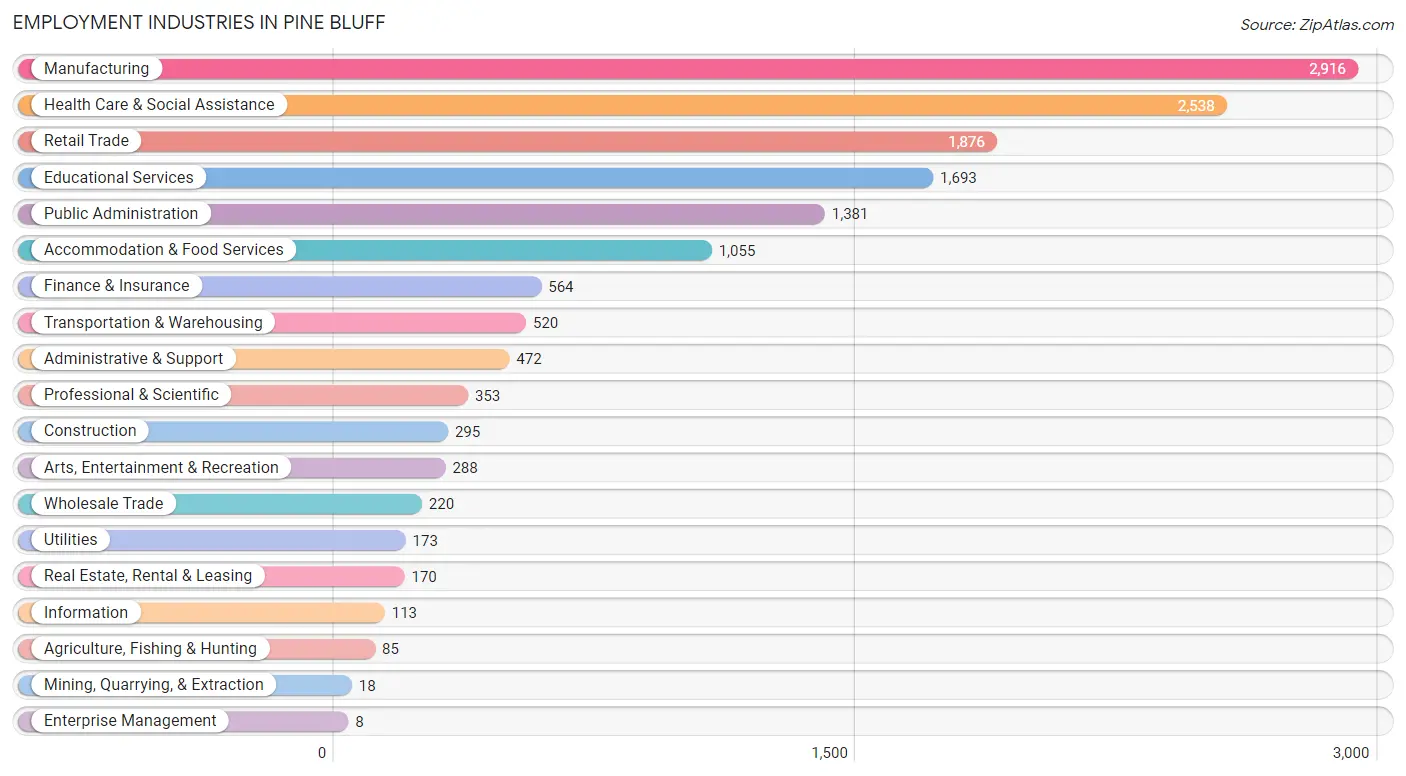
Employment Industries in Pine Bluff
The major employment industries in Pine Bluff include Manufacturing (2,916 | 18.7%), Health Care & Social Assistance (2,538 | 16.3%), Retail Trade (1,876 | 12.0%), Educational Services (1,693 | 10.8%), and Public Administration (1,381 | 8.8%).
Employment Industries by Sex in Pine Bluff
The Pine Bluff industries that see more men than women are Mining, Quarrying, & Extraction (100.0%), Construction (100.0%), and Enterprise Management (100.0%), whereas the industries that tend to have a higher number of women are Health Care & Social Assistance (80.5%), Information (77.9%), and Accommodation & Food Services (71.7%).
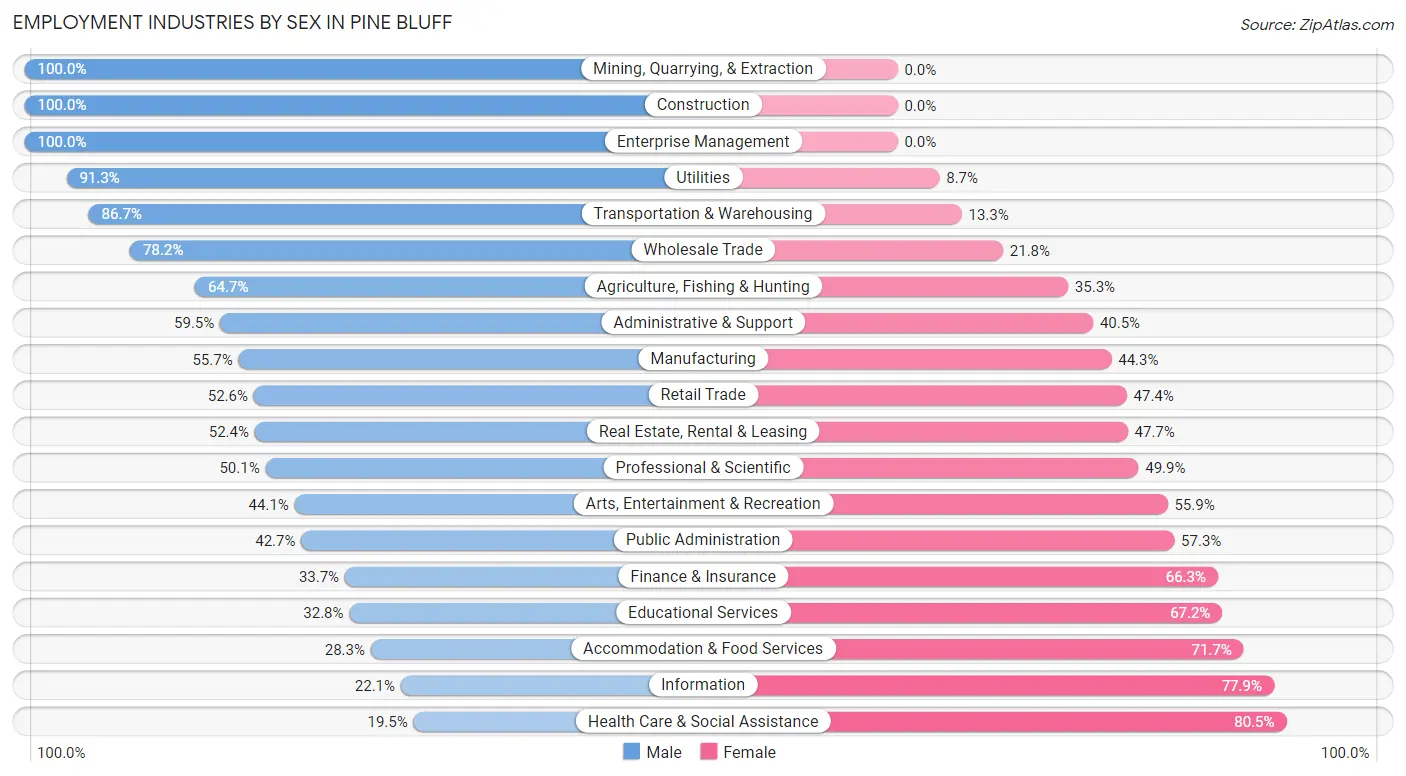
| Industry | Male | Female |
| Agriculture, Fishing & Hunting | 55 (64.7%) | 30 (35.3%) |
| Mining, Quarrying, & Extraction | 18 (100.0%) | 0 (0.0%) |
| Construction | 295 (100.0%) | 0 (0.0%) |
| Manufacturing | 1,625 (55.7%) | 1,291 (44.3%) |
| Wholesale Trade | 172 (78.2%) | 48 (21.8%) |
| Retail Trade | 986 (52.6%) | 890 (47.4%) |
| Transportation & Warehousing | 451 (86.7%) | 69 (13.3%) |
| Utilities | 158 (91.3%) | 15 (8.7%) |
| Information | 25 (22.1%) | 88 (77.9%) |
| Finance & Insurance | 190 (33.7%) | 374 (66.3%) |
| Real Estate, Rental & Leasing | 89 (52.3%) | 81 (47.6%) |
| Professional & Scientific | 177 (50.1%) | 176 (49.9%) |
| Enterprise Management | 8 (100.0%) | 0 (0.0%) |
| Administrative & Support | 281 (59.5%) | 191 (40.5%) |
| Educational Services | 555 (32.8%) | 1,138 (67.2%) |
| Health Care & Social Assistance | 495 (19.5%) | 2,043 (80.5%) |
| Arts, Entertainment & Recreation | 127 (44.1%) | 161 (55.9%) |
| Accommodation & Food Services | 299 (28.3%) | 756 (71.7%) |
| Public Administration | 590 (42.7%) | 791 (57.3%) |
| Total | 6,935 (44.4%) | 8,681 (55.6%) |
Education in Pine Bluff
School Enrollment in Pine Bluff
The most common levels of schooling among the 10,348 students in Pine Bluff are college / undergraduate (2,741 | 26.5%), elementary school (2,396 | 23.2%), and high school (1,878 | 18.1%).
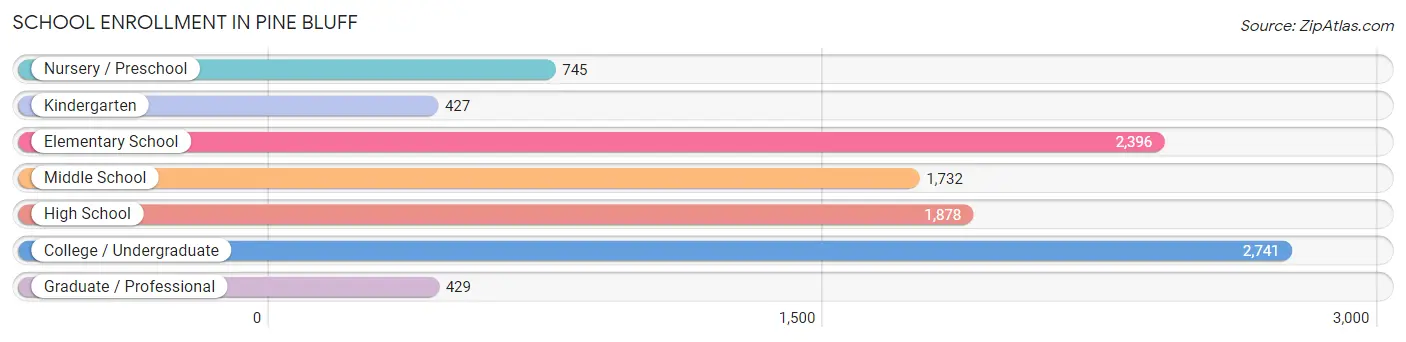
| School Level | # Students | % Students |
| Nursery / Preschool | 745 | 7.2% |
| Kindergarten | 427 | 4.1% |
| Elementary School | 2,396 | 23.2% |
| Middle School | 1,732 | 16.7% |
| High School | 1,878 | 18.1% |
| College / Undergraduate | 2,741 | 26.5% |
| Graduate / Professional | 429 | 4.2% |
| Total | 10,348 | 100.0% |
School Enrollment by Age by Funding Source in Pine Bluff
Out of a total of 10,348 students who are enrolled in schools in Pine Bluff, 1,966 (19.0%) attend a private institution, while the remaining 8,382 (81.0%) are enrolled in public schools. The age group of 20 to 24 year olds has the highest likelihood of being enrolled in private schools, with 672 (66.3% in the age bracket) enrolled. Conversely, the age group of 10 to 14 year olds has the lowest likelihood of being enrolled in a private school, with 2,204 (99.1% in the age bracket) attending a public institution.
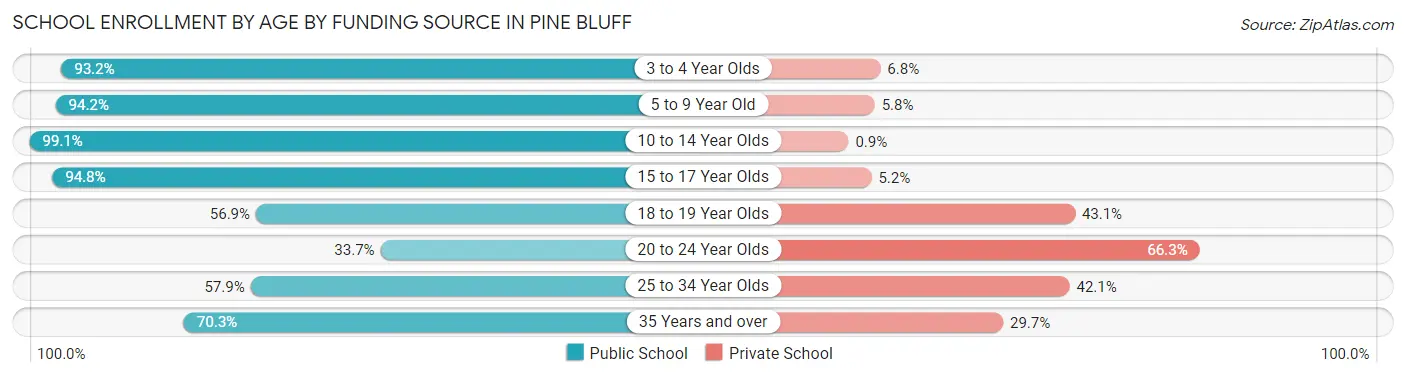
| Age Bracket | Public School | Private School |
| 3 to 4 Year Olds | 545 (93.2%) | 40 (6.8%) |
| 5 to 9 Year Old | 2,461 (94.2%) | 151 (5.8%) |
| 10 to 14 Year Olds | 2,204 (99.1%) | 20 (0.9%) |
| 15 to 17 Year Olds | 1,301 (94.8%) | 71 (5.2%) |
| 18 to 19 Year Olds | 740 (56.9%) | 560 (43.1%) |
| 20 to 24 Year Olds | 342 (33.7%) | 672 (66.3%) |
| 25 to 34 Year Olds | 391 (57.9%) | 284 (42.1%) |
| 35 Years and over | 398 (70.3%) | 168 (29.7%) |
| Total | 8,382 (81.0%) | 1,966 (19.0%) |
Educational Attainment by Field of Study in Pine Bluff
Education (1,344 | 21.0%), arts & humanities (884 | 13.8%), science & technology (842 | 13.1%), bio, nature & agricultural (775 | 12.1%), and business (747 | 11.7%) are the most common fields of study among 6,409 individuals in Pine Bluff who have obtained a bachelor's degree or higher.
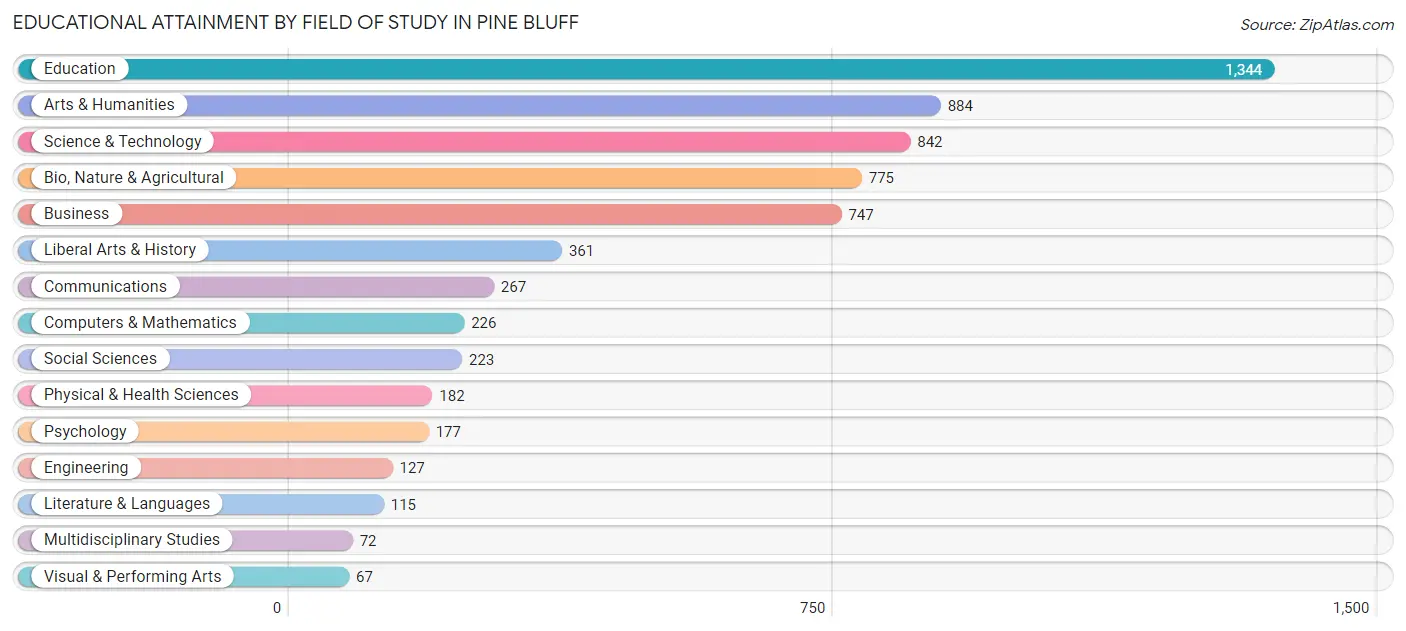
| Field of Study | # Graduates | % Graduates |
| Computers & Mathematics | 226 | 3.5% |
| Bio, Nature & Agricultural | 775 | 12.1% |
| Physical & Health Sciences | 182 | 2.8% |
| Psychology | 177 | 2.8% |
| Social Sciences | 223 | 3.5% |
| Engineering | 127 | 2.0% |
| Multidisciplinary Studies | 72 | 1.1% |
| Science & Technology | 842 | 13.1% |
| Business | 747 | 11.7% |
| Education | 1,344 | 21.0% |
| Literature & Languages | 115 | 1.8% |
| Liberal Arts & History | 361 | 5.6% |
| Visual & Performing Arts | 67 | 1.1% |
| Communications | 267 | 4.2% |
| Arts & Humanities | 884 | 13.8% |
| Total | 6,409 | 100.0% |
Transportation & Commute in Pine Bluff
Vehicle Availability by Sex in Pine Bluff
The most prevalent vehicle ownership categories in Pine Bluff are males with 2 vehicles (2,552, accounting for 38.3%) and females with 2 vehicles (2,871, making up 30.8%).
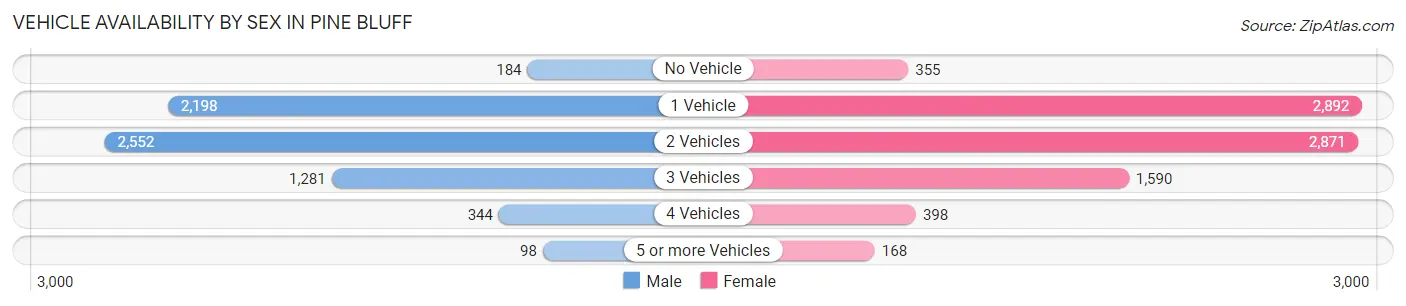
| Vehicles Available | Male | Female |
| No Vehicle | 184 (2.8%) | 355 (4.3%) |
| 1 Vehicle | 2,198 (33.0%) | 2,892 (34.9%) |
| 2 Vehicles | 2,552 (38.3%) | 2,871 (34.7%) |
| 3 Vehicles | 1,281 (19.2%) | 1,590 (19.2%) |
| 4 Vehicles | 344 (5.2%) | 398 (4.8%) |
| 5 or more Vehicles | 98 (1.5%) | 168 (2.0%) |
| Total | 6,657 (100.0%) | 8,274 (100.0%) |
Commute Time in Pine Bluff
The most frequently occuring commute durations in Pine Bluff are 15 to 19 minutes (4,700 commuters, 32.8%), 10 to 14 minutes (3,632 commuters, 25.4%), and 5 to 9 minutes (1,744 commuters, 12.2%).
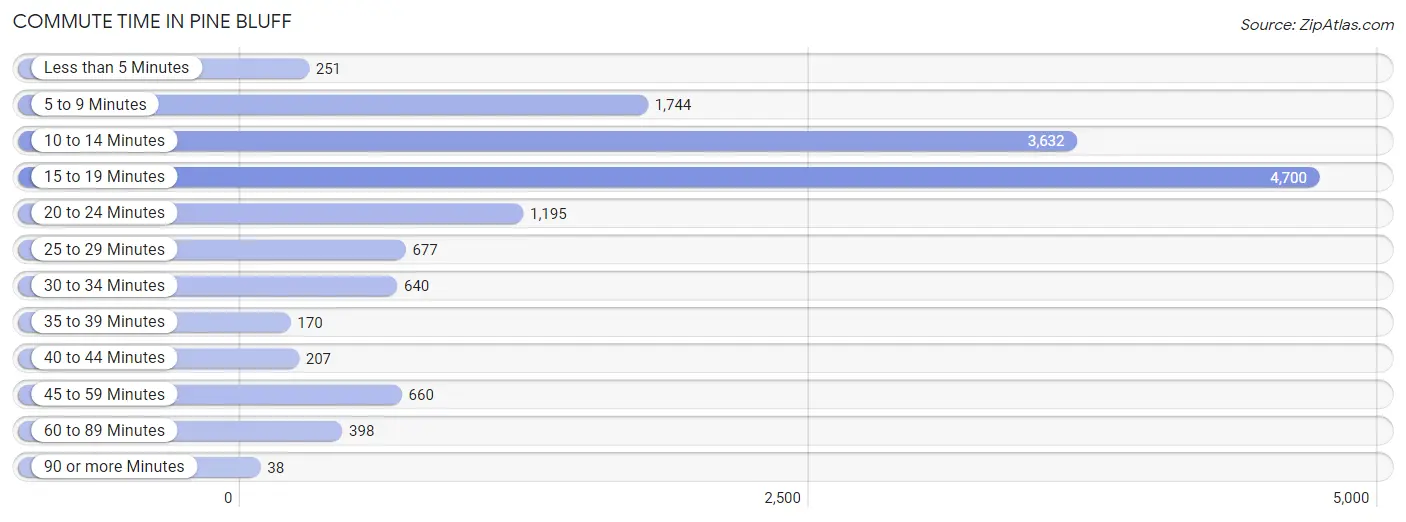
| Commute Time | # Commuters | % Commuters |
| Less than 5 Minutes | 251 | 1.8% |
| 5 to 9 Minutes | 1,744 | 12.2% |
| 10 to 14 Minutes | 3,632 | 25.4% |
| 15 to 19 Minutes | 4,700 | 32.8% |
| 20 to 24 Minutes | 1,195 | 8.4% |
| 25 to 29 Minutes | 677 | 4.7% |
| 30 to 34 Minutes | 640 | 4.5% |
| 35 to 39 Minutes | 170 | 1.2% |
| 40 to 44 Minutes | 207 | 1.5% |
| 45 to 59 Minutes | 660 | 4.6% |
| 60 to 89 Minutes | 398 | 2.8% |
| 90 or more Minutes | 38 | 0.3% |
Commute Time by Sex in Pine Bluff
The most common commute times in Pine Bluff are 15 to 19 minutes (1,927 commuters, 29.6%) for males and 15 to 19 minutes (2,773 commuters, 35.5%) for females.
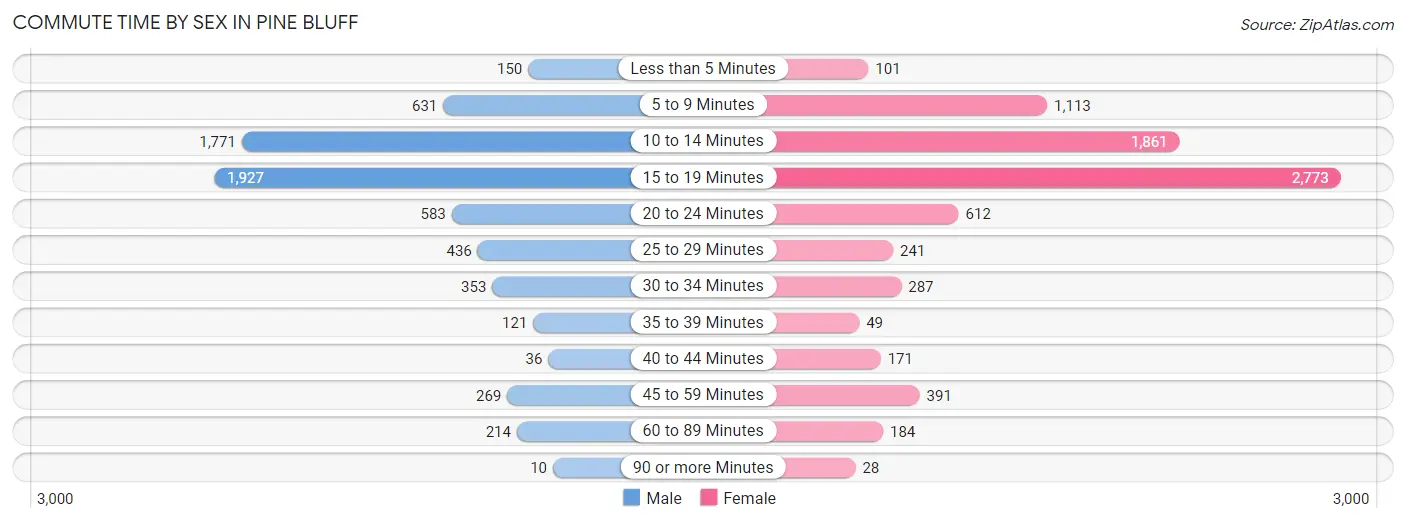
| Commute Time | Male | Female |
| Less than 5 Minutes | 150 (2.3%) | 101 (1.3%) |
| 5 to 9 Minutes | 631 (9.7%) | 1,113 (14.2%) |
| 10 to 14 Minutes | 1,771 (27.2%) | 1,861 (23.8%) |
| 15 to 19 Minutes | 1,927 (29.6%) | 2,773 (35.5%) |
| 20 to 24 Minutes | 583 (9.0%) | 612 (7.8%) |
| 25 to 29 Minutes | 436 (6.7%) | 241 (3.1%) |
| 30 to 34 Minutes | 353 (5.4%) | 287 (3.7%) |
| 35 to 39 Minutes | 121 (1.9%) | 49 (0.6%) |
| 40 to 44 Minutes | 36 (0.5%) | 171 (2.2%) |
| 45 to 59 Minutes | 269 (4.1%) | 391 (5.0%) |
| 60 to 89 Minutes | 214 (3.3%) | 184 (2.4%) |
| 90 or more Minutes | 10 (0.2%) | 28 (0.4%) |
Time of Departure to Work by Sex in Pine Bluff
The most frequent times of departure to work in Pine Bluff are 7:00 AM to 7:29 AM (908, 14.0%) for males and 7:30 AM to 7:59 AM (1,499, 19.2%) for females.
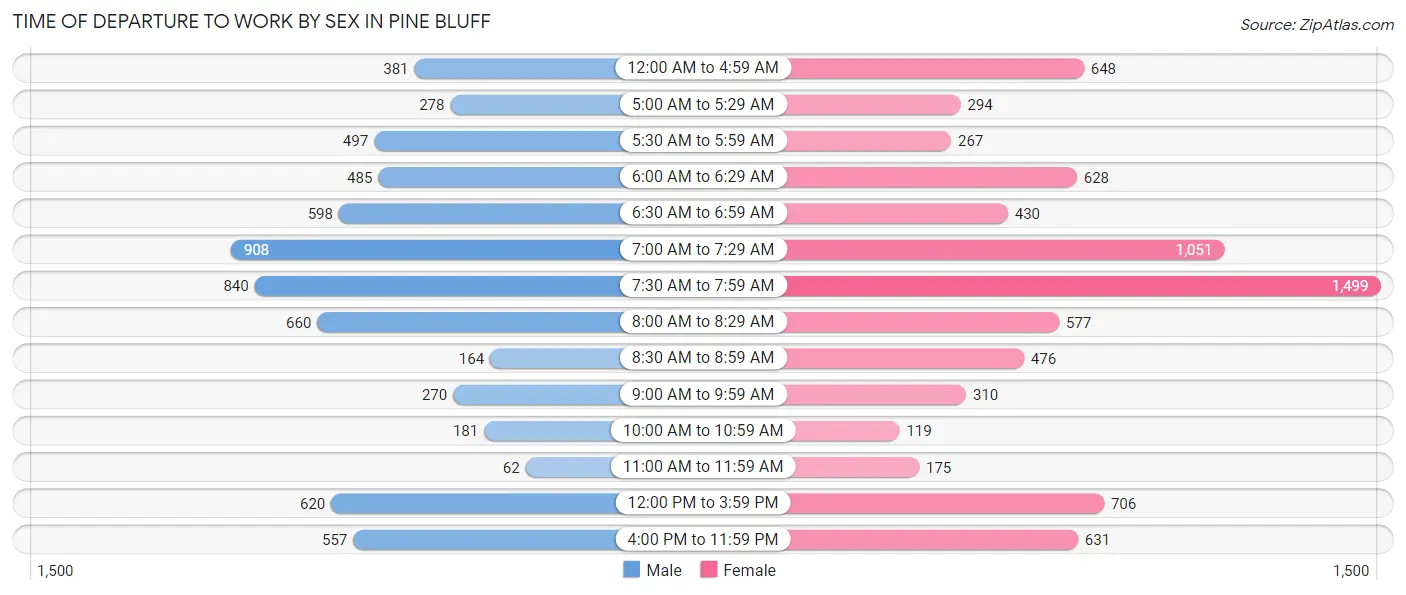
| Time of Departure | Male | Female |
| 12:00 AM to 4:59 AM | 381 (5.9%) | 648 (8.3%) |
| 5:00 AM to 5:29 AM | 278 (4.3%) | 294 (3.8%) |
| 5:30 AM to 5:59 AM | 497 (7.6%) | 267 (3.4%) |
| 6:00 AM to 6:29 AM | 485 (7.5%) | 628 (8.0%) |
| 6:30 AM to 6:59 AM | 598 (9.2%) | 430 (5.5%) |
| 7:00 AM to 7:29 AM | 908 (14.0%) | 1,051 (13.5%) |
| 7:30 AM to 7:59 AM | 840 (12.9%) | 1,499 (19.2%) |
| 8:00 AM to 8:29 AM | 660 (10.2%) | 577 (7.4%) |
| 8:30 AM to 8:59 AM | 164 (2.5%) | 476 (6.1%) |
| 9:00 AM to 9:59 AM | 270 (4.2%) | 310 (4.0%) |
| 10:00 AM to 10:59 AM | 181 (2.8%) | 119 (1.5%) |
| 11:00 AM to 11:59 AM | 62 (0.9%) | 175 (2.2%) |
| 12:00 PM to 3:59 PM | 620 (9.5%) | 706 (9.0%) |
| 4:00 PM to 11:59 PM | 557 (8.6%) | 631 (8.1%) |
| Total | 6,501 (100.0%) | 7,811 (100.0%) |
Housing Occupancy in Pine Bluff
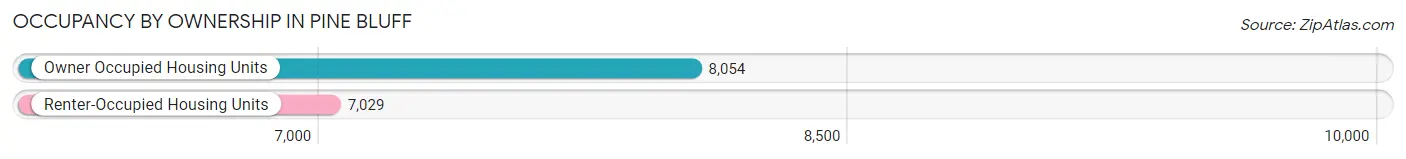
Occupancy by Ownership in Pine Bluff
Of the total 15,083 dwellings in Pine Bluff, owner-occupied units account for 8,054 (53.4%), while renter-occupied units make up 7,029 (46.6%).
| Occupancy | # Housing Units | % Housing Units |
| Owner Occupied Housing Units | 8,054 | 53.4% |
| Renter-Occupied Housing Units | 7,029 | 46.6% |
| Total Occupied Housing Units | 15,083 | 100.0% |
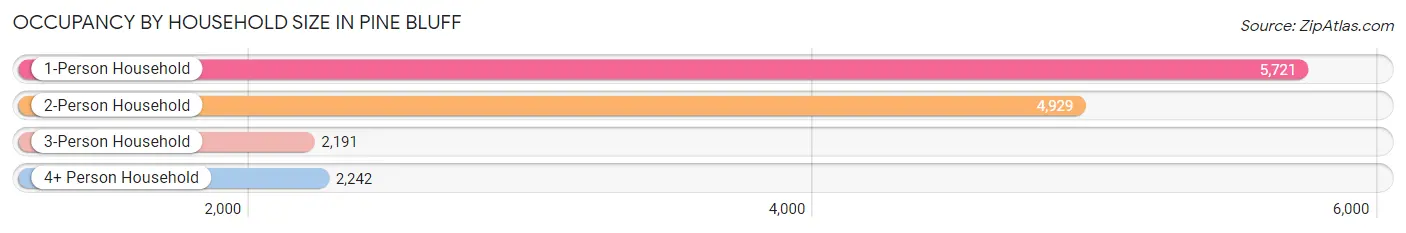
Occupancy by Household Size in Pine Bluff
| Household Size | # Housing Units | % Housing Units |
| 1-Person Household | 5,721 | 37.9% |
| 2-Person Household | 4,929 | 32.7% |
| 3-Person Household | 2,191 | 14.5% |
| 4+ Person Household | 2,242 | 14.9% |
| Total Housing Units | 15,083 | 100.0% |
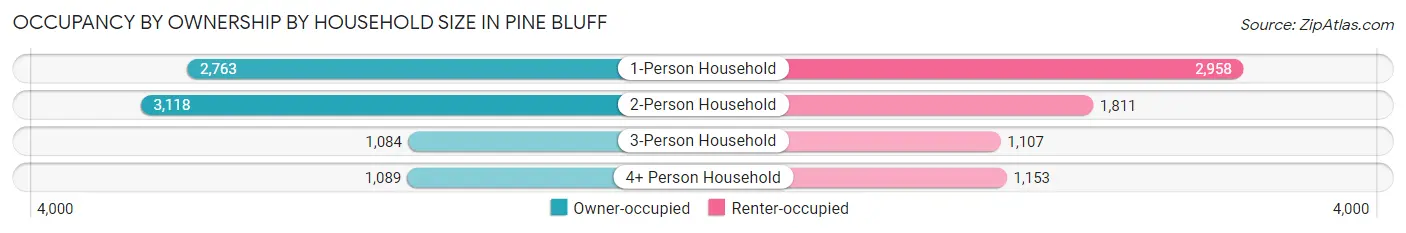
Occupancy by Ownership by Household Size in Pine Bluff
| Household Size | Owner-occupied | Renter-occupied |
| 1-Person Household | 2,763 (48.3%) | 2,958 (51.7%) |
| 2-Person Household | 3,118 (63.3%) | 1,811 (36.7%) |
| 3-Person Household | 1,084 (49.5%) | 1,107 (50.5%) |
| 4+ Person Household | 1,089 (48.6%) | 1,153 (51.4%) |
| Total Housing Units | 8,054 (53.4%) | 7,029 (46.6%) |
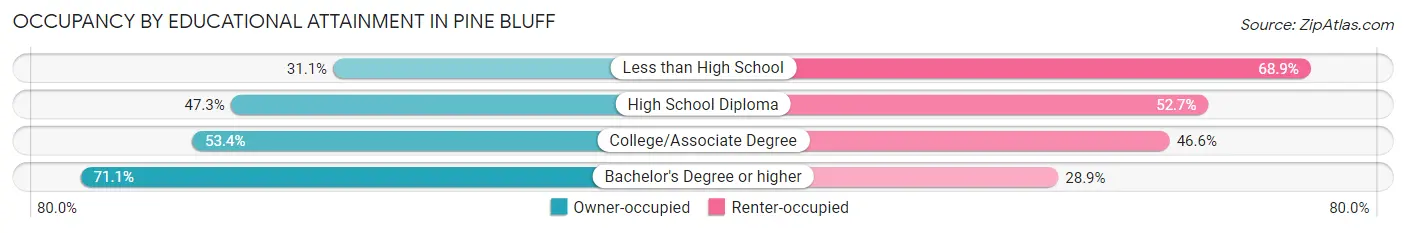
Occupancy by Educational Attainment in Pine Bluff
| Household Size | Owner-occupied | Renter-occupied |
| Less than High School | 524 (31.1%) | 1,161 (68.9%) |
| High School Diploma | 2,355 (47.3%) | 2,621 (52.7%) |
| College/Associate Degree | 2,461 (53.4%) | 2,144 (46.6%) |
| Bachelor's Degree or higher | 2,714 (71.1%) | 1,103 (28.9%) |
Occupancy by Age of Householder in Pine Bluff
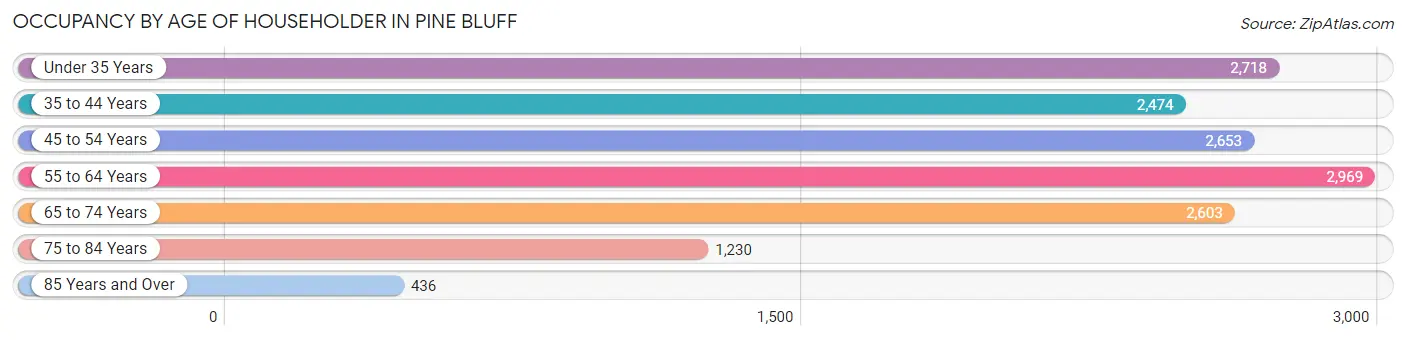
| Age Bracket | # Households | % Households |
| Under 35 Years | 2,718 | 18.0% |
| 35 to 44 Years | 2,474 | 16.4% |
| 45 to 54 Years | 2,653 | 17.6% |
| 55 to 64 Years | 2,969 | 19.7% |
| 65 to 74 Years | 2,603 | 17.3% |
| 75 to 84 Years | 1,230 | 8.2% |
| 85 Years and Over | 436 | 2.9% |
| Total | 15,083 | 100.0% |
Housing Finances in Pine Bluff
Median Income by Occupancy in Pine Bluff
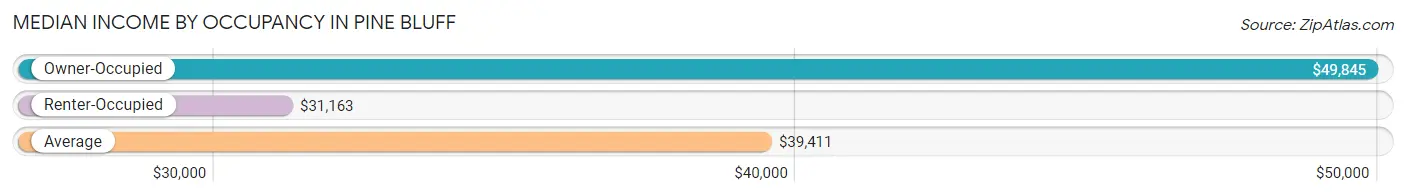
| Occupancy Type | # Households | Median Income |
| Owner-Occupied | 8,054 (53.4%) | $49,845 |
| Renter-Occupied | 7,029 (46.6%) | $31,163 |
| Average | 15,083 (100.0%) | $39,411 |
Occupancy by Householder Income Bracket in Pine Bluff
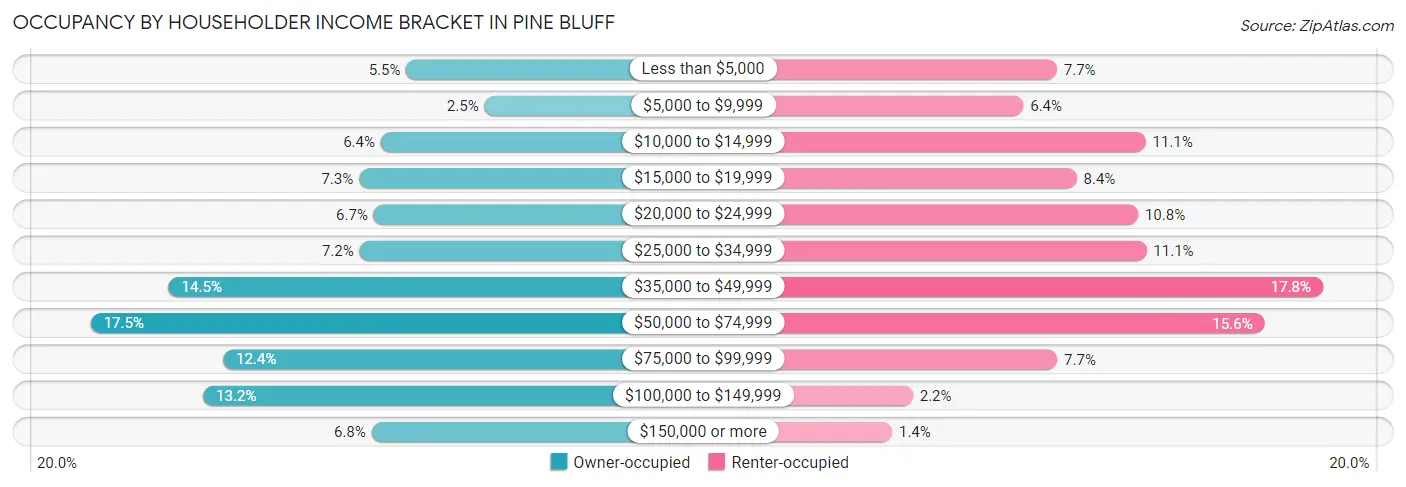
| Income Bracket | Owner-occupied | Renter-occupied |
| Less than $5,000 | 440 (5.5%) | 539 (7.7%) |
| $5,000 to $9,999 | 200 (2.5%) | 449 (6.4%) |
| $10,000 to $14,999 | 518 (6.4%) | 777 (11.1%) |
| $15,000 to $19,999 | 585 (7.3%) | 592 (8.4%) |
| $20,000 to $24,999 | 540 (6.7%) | 756 (10.8%) |
| $25,000 to $34,999 | 583 (7.2%) | 779 (11.1%) |
| $35,000 to $49,999 | 1,169 (14.5%) | 1,251 (17.8%) |
| $50,000 to $74,999 | 1,408 (17.5%) | 1,095 (15.6%) |
| $75,000 to $99,999 | 1,002 (12.4%) | 540 (7.7%) |
| $100,000 to $149,999 | 1,063 (13.2%) | 153 (2.2%) |
| $150,000 or more | 546 (6.8%) | 98 (1.4%) |
| Total | 8,054 (100.0%) | 7,029 (100.0%) |
Monthly Housing Cost Tiers in Pine Bluff
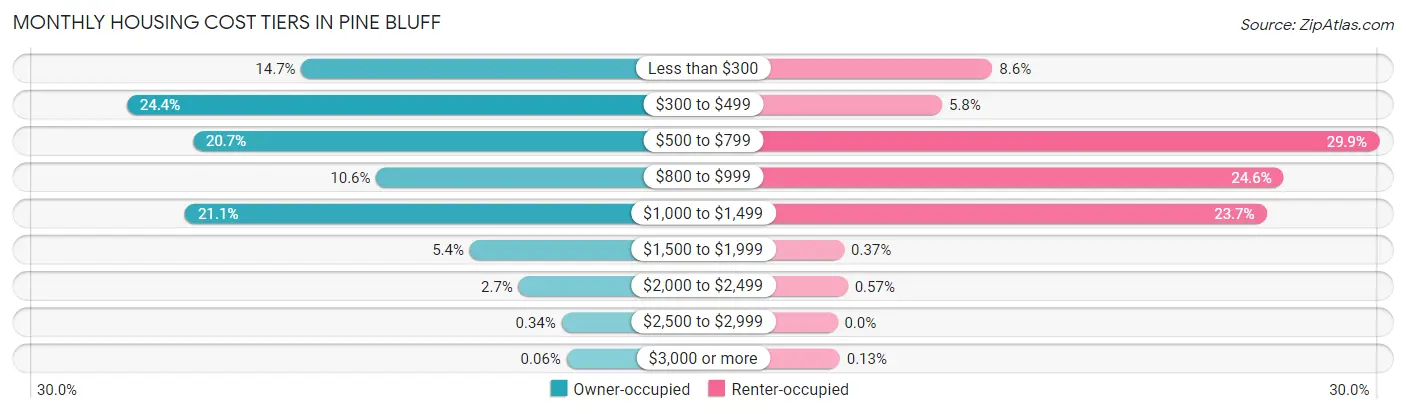
| Monthly Cost | Owner-occupied | Renter-occupied |
| Less than $300 | 1,185 (14.7%) | 602 (8.6%) |
| $300 to $499 | 1,961 (24.3%) | 406 (5.8%) |
| $500 to $799 | 1,668 (20.7%) | 2,102 (29.9%) |
| $800 to $999 | 851 (10.6%) | 1,732 (24.6%) |
| $1,000 to $1,499 | 1,703 (21.1%) | 1,665 (23.7%) |
| $1,500 to $1,999 | 436 (5.4%) | 26 (0.4%) |
| $2,000 to $2,499 | 218 (2.7%) | 40 (0.6%) |
| $2,500 to $2,999 | 27 (0.3%) | 0 (0.0%) |
| $3,000 or more | 5 (0.1%) | 9 (0.1%) |
| Total | 8,054 (100.0%) | 7,029 (100.0%) |
Physical Housing Characteristics in Pine Bluff
Housing Structures in Pine Bluff
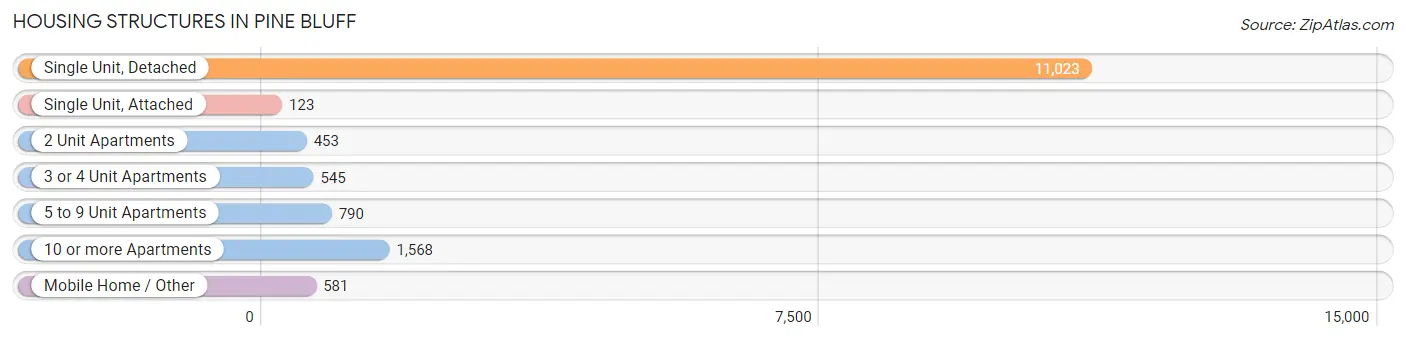
| Structure Type | # Housing Units | % Housing Units |
| Single Unit, Detached | 11,023 | 73.1% |
| Single Unit, Attached | 123 | 0.8% |
| 2 Unit Apartments | 453 | 3.0% |
| 3 or 4 Unit Apartments | 545 | 3.6% |
| 5 to 9 Unit Apartments | 790 | 5.2% |
| 10 or more Apartments | 1,568 | 10.4% |
| Mobile Home / Other | 581 | 3.8% |
| Total | 15,083 | 100.0% |
Housing Structures by Occupancy in Pine Bluff
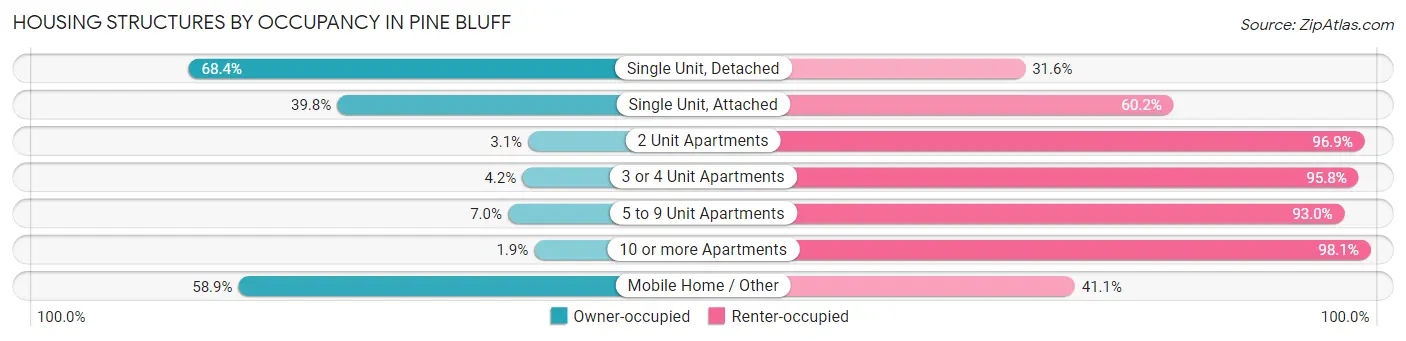
| Structure Type | Owner-occupied | Renter-occupied |
| Single Unit, Detached | 7,541 (68.4%) | 3,482 (31.6%) |
| Single Unit, Attached | 49 (39.8%) | 74 (60.2%) |
| 2 Unit Apartments | 14 (3.1%) | 439 (96.9%) |
| 3 or 4 Unit Apartments | 23 (4.2%) | 522 (95.8%) |
| 5 to 9 Unit Apartments | 55 (7.0%) | 735 (93.0%) |
| 10 or more Apartments | 30 (1.9%) | 1,538 (98.1%) |
| Mobile Home / Other | 342 (58.9%) | 239 (41.1%) |
| Total | 8,054 (53.4%) | 7,029 (46.6%) |
Housing Structures by Number of Rooms in Pine Bluff
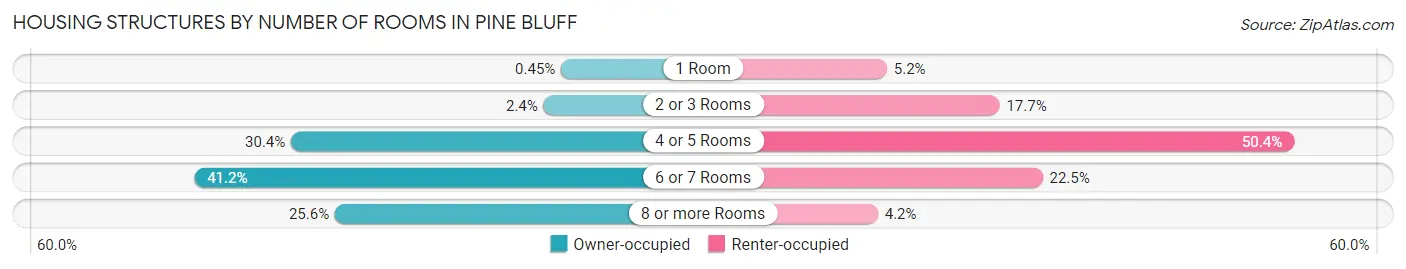
| Number of Rooms | Owner-occupied | Renter-occupied |
| 1 Room | 36 (0.4%) | 366 (5.2%) |
| 2 or 3 Rooms | 194 (2.4%) | 1,245 (17.7%) |
| 4 or 5 Rooms | 2,450 (30.4%) | 3,542 (50.4%) |
| 6 or 7 Rooms | 3,316 (41.2%) | 1,581 (22.5%) |
| 8 or more Rooms | 2,058 (25.6%) | 295 (4.2%) |
| Total | 8,054 (100.0%) | 7,029 (100.0%) |
Housing Structure by Heating Type in Pine Bluff
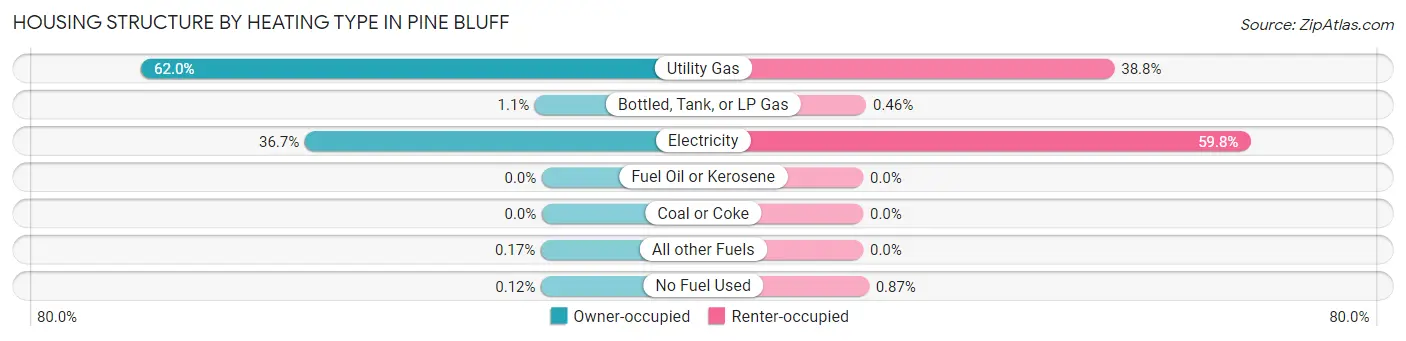
| Heating Type | Owner-occupied | Renter-occupied |
| Utility Gas | 4,992 (62.0%) | 2,730 (38.8%) |
| Bottled, Tank, or LP Gas | 86 (1.1%) | 32 (0.5%) |
| Electricity | 2,952 (36.6%) | 4,206 (59.8%) |
| Fuel Oil or Kerosene | 0 (0.0%) | 0 (0.0%) |
| Coal or Coke | 0 (0.0%) | 0 (0.0%) |
| All other Fuels | 14 (0.2%) | 0 (0.0%) |
| No Fuel Used | 10 (0.1%) | 61 (0.9%) |
| Total | 8,054 (100.0%) | 7,029 (100.0%) |
Household Vehicle Usage in Pine Bluff
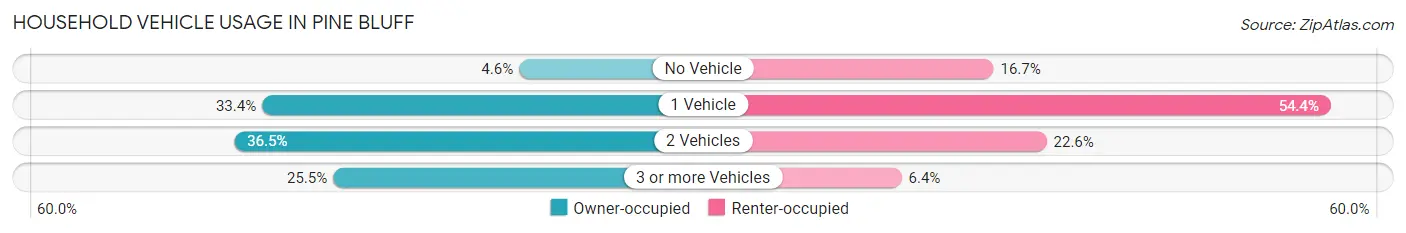
| Vehicles per Household | Owner-occupied | Renter-occupied |
| No Vehicle | 372 (4.6%) | 1,170 (16.7%) |
| 1 Vehicle | 2,691 (33.4%) | 3,825 (54.4%) |
| 2 Vehicles | 2,941 (36.5%) | 1,588 (22.6%) |
| 3 or more Vehicles | 2,050 (25.5%) | 446 (6.4%) |
| Total | 8,054 (100.0%) | 7,029 (100.0%) |
Real Estate & Mortgages in Pine Bluff
Real Estate and Mortgage Overview in Pine Bluff
| Characteristic | Without Mortgage | With Mortgage |
| Housing Units | 4,170 | 3,884 |
| Median Property Value | $76,100 | $109,700 |
| Median Household Income | $39,707 | $387 |
| Monthly Housing Costs | $387 | $0 |
| Real Estate Taxes | $462 | $223 |
Property Value by Mortgage Status in Pine Bluff
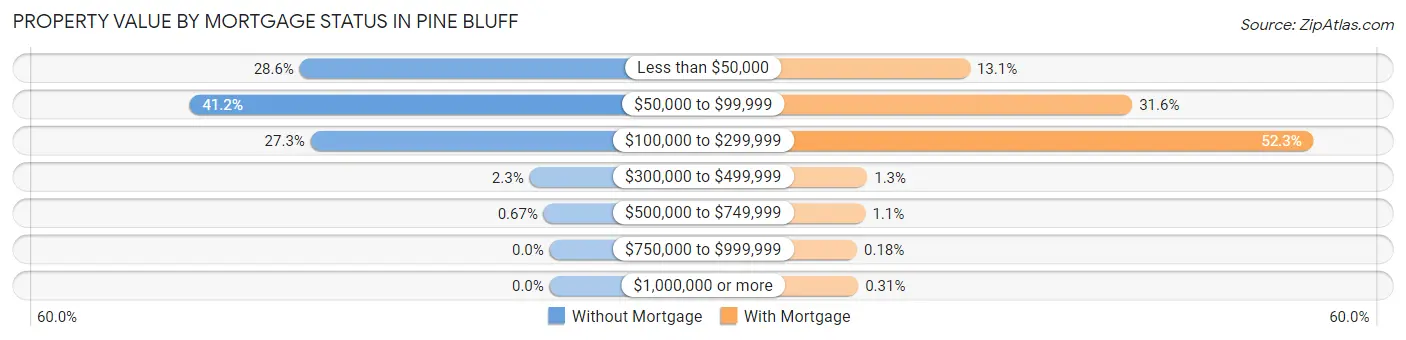
| Property Value | Without Mortgage | With Mortgage |
| Less than $50,000 | 1,191 (28.6%) | 508 (13.1%) |
| $50,000 to $99,999 | 1,716 (41.1%) | 1,228 (31.6%) |
| $100,000 to $299,999 | 1,139 (27.3%) | 2,033 (52.3%) |
| $300,000 to $499,999 | 96 (2.3%) | 52 (1.3%) |
| $500,000 to $749,999 | 28 (0.7%) | 44 (1.1%) |
| $750,000 to $999,999 | 0 (0.0%) | 7 (0.2%) |
| $1,000,000 or more | 0 (0.0%) | 12 (0.3%) |
| Total | 4,170 (100.0%) | 3,884 (100.0%) |
Household Income by Mortgage Status in Pine Bluff
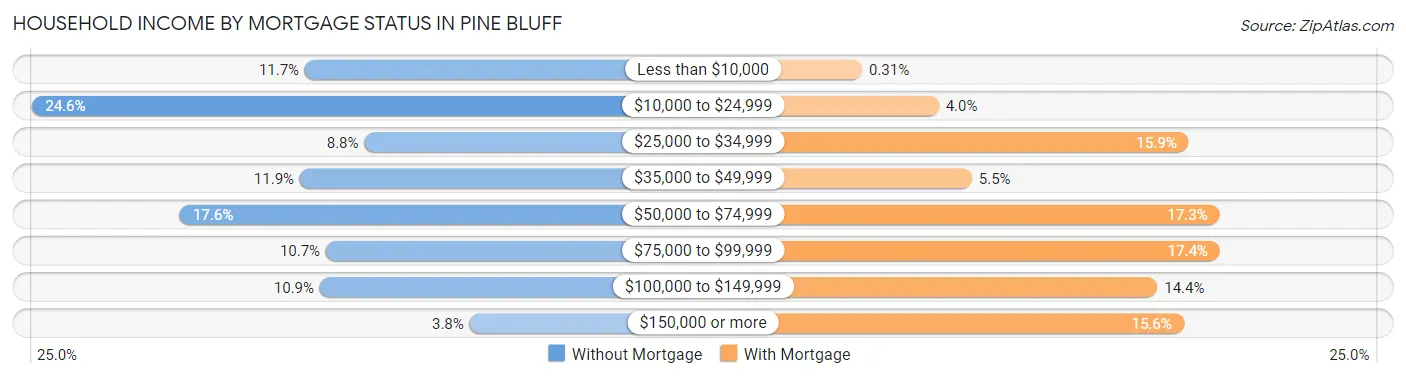
| Household Income | Without Mortgage | With Mortgage |
| Less than $10,000 | 486 (11.7%) | 12 (0.3%) |
| $10,000 to $24,999 | 1,027 (24.6%) | 154 (4.0%) |
| $25,000 to $34,999 | 368 (8.8%) | 616 (15.9%) |
| $35,000 to $49,999 | 496 (11.9%) | 215 (5.5%) |
| $50,000 to $74,999 | 734 (17.6%) | 673 (17.3%) |
| $75,000 to $99,999 | 444 (10.6%) | 674 (17.3%) |
| $100,000 to $149,999 | 456 (10.9%) | 558 (14.4%) |
| $150,000 or more | 159 (3.8%) | 607 (15.6%) |
| Total | 4,170 (100.0%) | 3,884 (100.0%) |
Property Value to Household Income Ratio in Pine Bluff
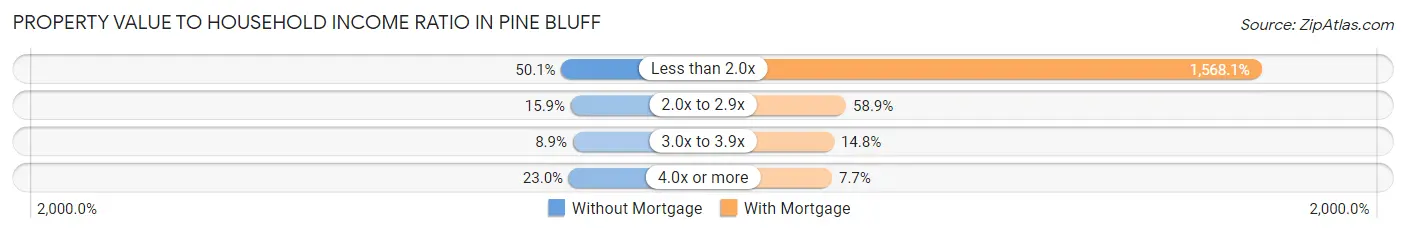
| Value-to-Income Ratio | Without Mortgage | With Mortgage |
| Less than 2.0x | 2,090 (50.1%) | 60,904 (1,568.1%) |
| 2.0x to 2.9x | 662 (15.9%) | 2,286 (58.9%) |
| 3.0x to 3.9x | 372 (8.9%) | 574 (14.8%) |
| 4.0x or more | 958 (23.0%) | 299 (7.7%) |
| Total | 4,170 (100.0%) | 3,884 (100.0%) |
Real Estate Taxes by Mortgage Status in Pine Bluff
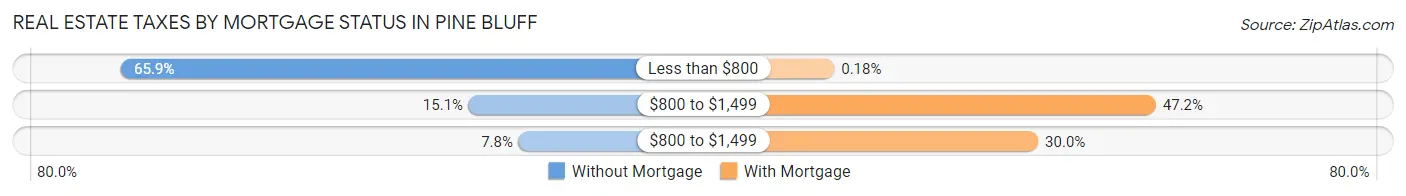
| Property Taxes | Without Mortgage | With Mortgage |
| Less than $800 | 2,748 (65.9%) | 7 (0.2%) |
| $800 to $1,499 | 629 (15.1%) | 1,832 (47.2%) |
| $800 to $1,499 | 325 (7.8%) | 1,164 (30.0%) |
| Total | 4,170 (100.0%) | 3,884 (100.0%) |
Health & Disability in Pine Bluff
Health Insurance Coverage by Age in Pine Bluff
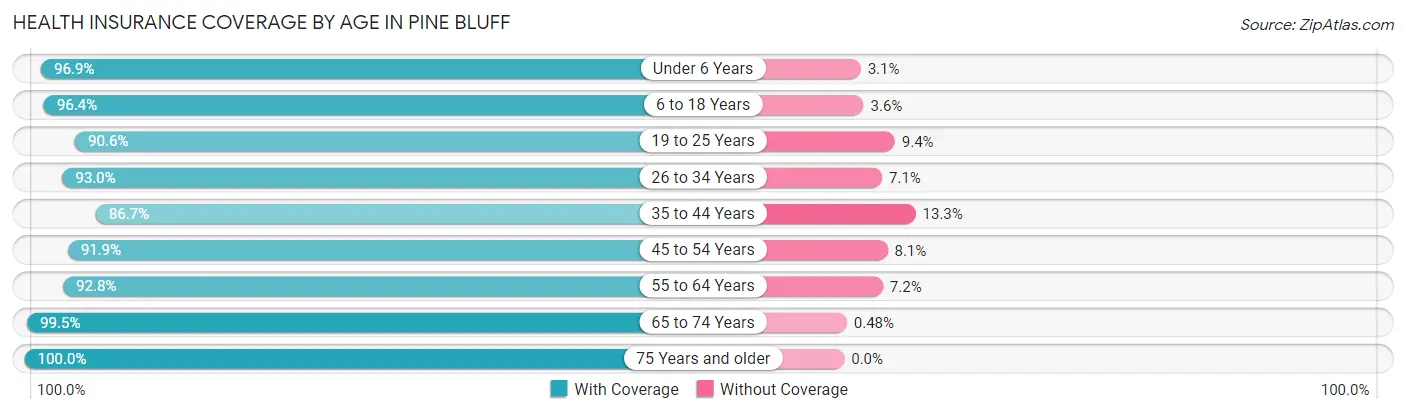
| Age Bracket | With Coverage | Without Coverage |
| Under 6 Years | 2,935 (96.9%) | 93 (3.1%) |
| 6 to 18 Years | 6,888 (96.4%) | 257 (3.6%) |
| 19 to 25 Years | 3,467 (90.6%) | 361 (9.4%) |
| 26 to 34 Years | 4,045 (92.9%) | 307 (7.0%) |
| 35 to 44 Years | 3,891 (86.7%) | 597 (13.3%) |
| 45 to 54 Years | 3,744 (91.9%) | 328 (8.1%) |
| 55 to 64 Years | 4,832 (92.8%) | 375 (7.2%) |
| 65 to 74 Years | 3,736 (99.5%) | 18 (0.5%) |
| 75 Years and older | 2,321 (100.0%) | 0 (0.0%) |
| Total | 35,859 (93.9%) | 2,336 (6.1%) |
Health Insurance Coverage by Citizenship Status in Pine Bluff

| Citizenship Status | With Coverage | Without Coverage |
| Native Born | 2,935 (96.9%) | 93 (3.1%) |
| Foreign Born, Citizen | 6,888 (96.4%) | 257 (3.6%) |
| Foreign Born, not a Citizen | 3,467 (90.6%) | 361 (9.4%) |
Health Insurance Coverage by Household Income in Pine Bluff
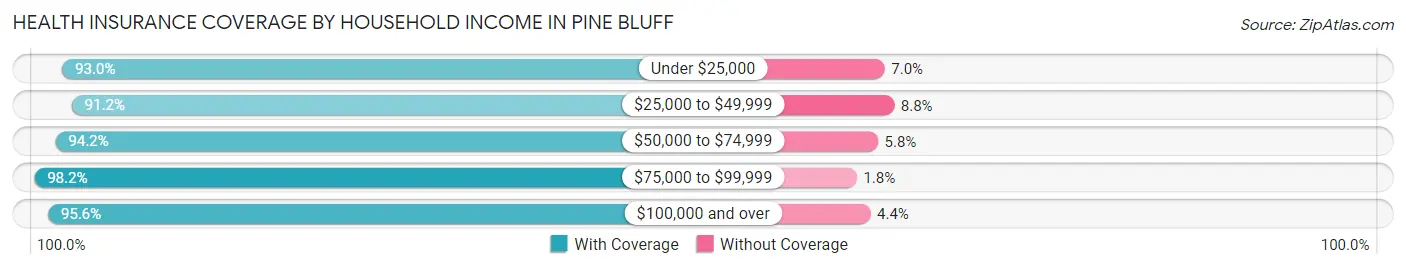
| Household Income | With Coverage | Without Coverage |
| Under $25,000 | 9,167 (93.0%) | 694 (7.0%) |
| $25,000 to $49,999 | 7,757 (91.2%) | 750 (8.8%) |
| $50,000 to $74,999 | 7,124 (94.2%) | 436 (5.8%) |
| $75,000 to $99,999 | 4,610 (98.2%) | 85 (1.8%) |
| $100,000 and over | 5,988 (95.6%) | 273 (4.4%) |
Public vs Private Health Insurance Coverage by Age in Pine Bluff
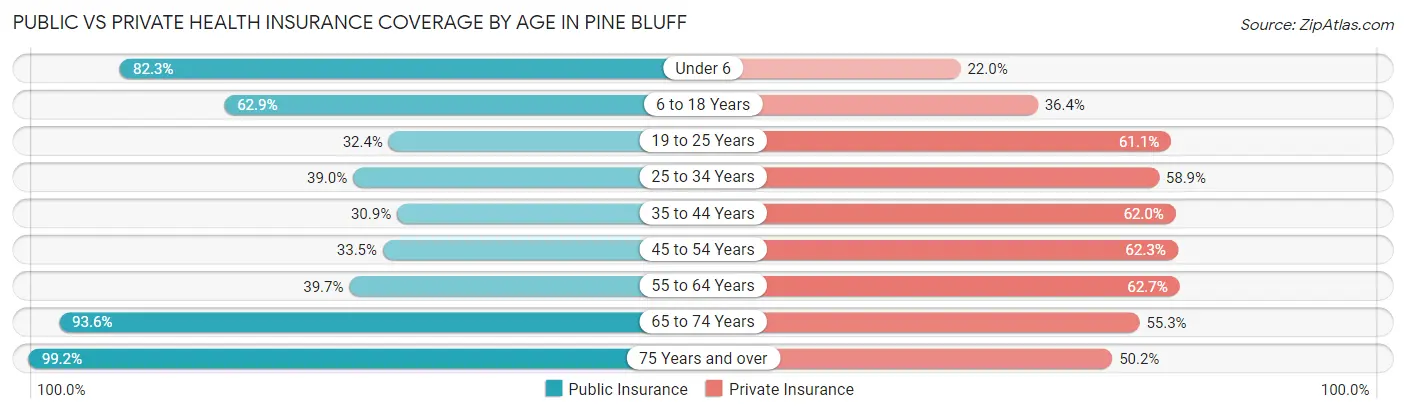
| Age Bracket | Public Insurance | Private Insurance |
| Under 6 | 2,491 (82.3%) | 667 (22.0%) |
| 6 to 18 Years | 4,497 (62.9%) | 2,598 (36.4%) |
| 19 to 25 Years | 1,241 (32.4%) | 2,340 (61.1%) |
| 25 to 34 Years | 1,699 (39.0%) | 2,561 (58.9%) |
| 35 to 44 Years | 1,386 (30.9%) | 2,781 (62.0%) |
| 45 to 54 Years | 1,364 (33.5%) | 2,538 (62.3%) |
| 55 to 64 Years | 2,069 (39.7%) | 3,264 (62.7%) |
| 65 to 74 Years | 3,513 (93.6%) | 2,074 (55.2%) |
| 75 Years and over | 2,303 (99.2%) | 1,165 (50.2%) |
| Total | 20,563 (53.8%) | 19,988 (52.3%) |
Disability Status by Sex by Age in Pine Bluff
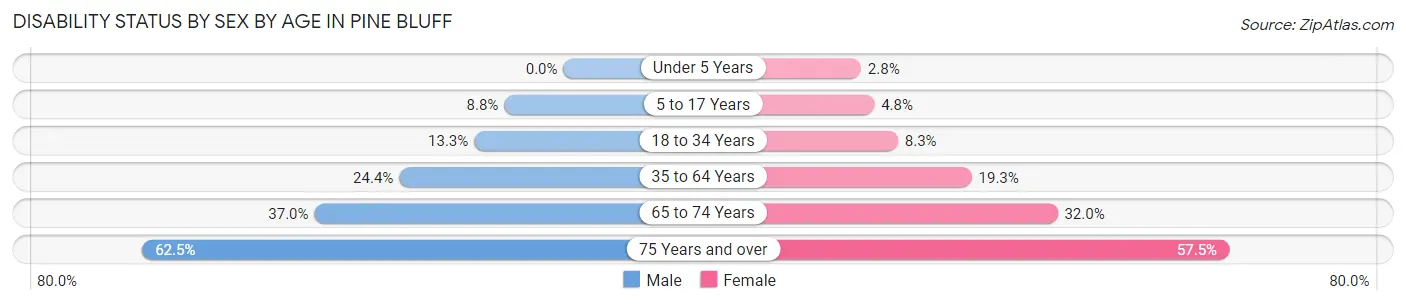
| Age Bracket | Male | Female |
| Under 5 Years | 0 (0.0%) | 36 (2.8%) |
| 5 to 17 Years | 275 (8.8%) | 160 (4.8%) |
| 18 to 34 Years | 579 (13.3%) | 410 (8.3%) |
| 35 to 64 Years | 1,502 (24.4%) | 1,467 (19.3%) |
| 65 to 74 Years | 603 (37.0%) | 680 (32.0%) |
| 75 Years and over | 519 (62.5%) | 857 (57.5%) |
Disability Class by Sex by Age in Pine Bluff
Disability Class: Hearing Difficulty
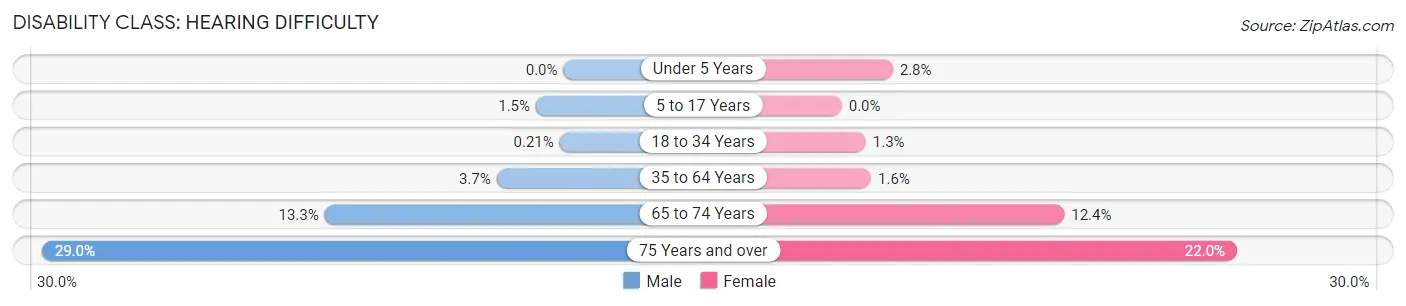
| Age Bracket | Male | Female |
| Under 5 Years | 0 (0.0%) | 36 (2.8%) |
| 5 to 17 Years | 48 (1.5%) | 0 (0.0%) |
| 18 to 34 Years | 9 (0.2%) | 66 (1.3%) |
| 35 to 64 Years | 229 (3.7%) | 124 (1.6%) |
| 65 to 74 Years | 217 (13.3%) | 263 (12.4%) |
| 75 Years and over | 241 (29.0%) | 328 (22.0%) |
Disability Class: Vision Difficulty
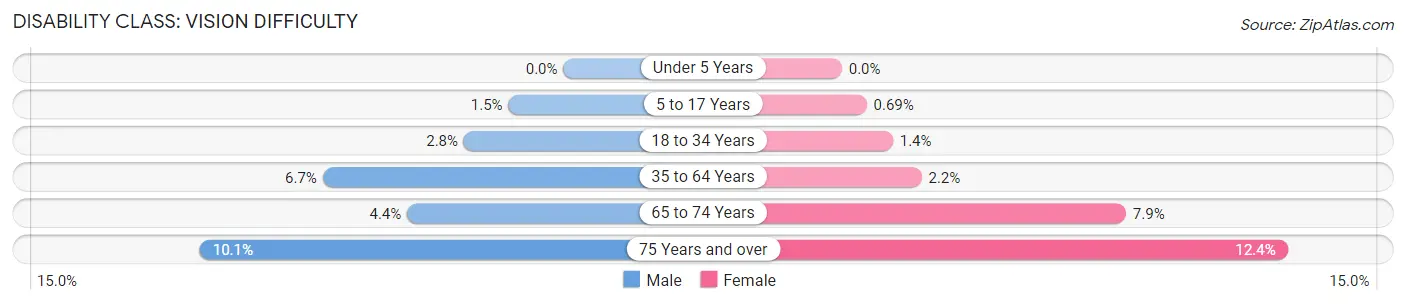
| Age Bracket | Male | Female |
| Under 5 Years | 0 (0.0%) | 0 (0.0%) |
| 5 to 17 Years | 48 (1.5%) | 23 (0.7%) |
| 18 to 34 Years | 121 (2.8%) | 70 (1.4%) |
| 35 to 64 Years | 413 (6.7%) | 169 (2.2%) |
| 65 to 74 Years | 71 (4.3%) | 168 (7.9%) |
| 75 Years and over | 84 (10.1%) | 185 (12.4%) |
Disability Class: Cognitive Difficulty
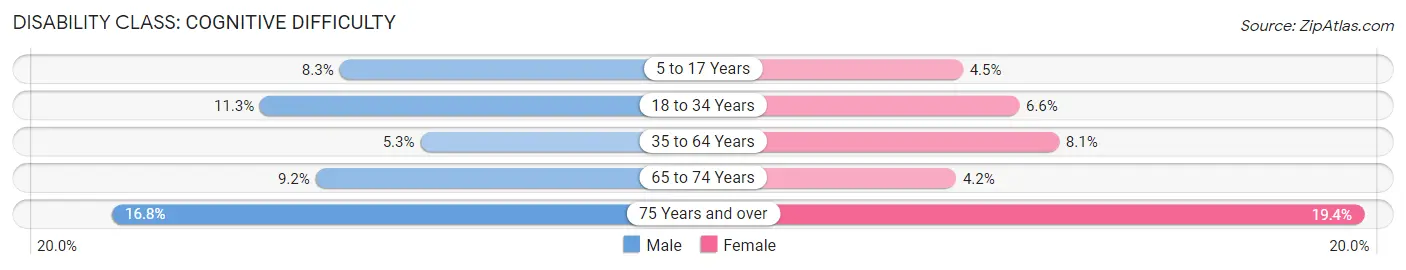
| Age Bracket | Male | Female |
| 5 to 17 Years | 260 (8.3%) | 149 (4.5%) |
| 18 to 34 Years | 492 (11.3%) | 324 (6.6%) |
| 35 to 64 Years | 327 (5.3%) | 613 (8.1%) |
| 65 to 74 Years | 150 (9.2%) | 90 (4.2%) |
| 75 Years and over | 139 (16.8%) | 289 (19.4%) |
Disability Class: Ambulatory Difficulty
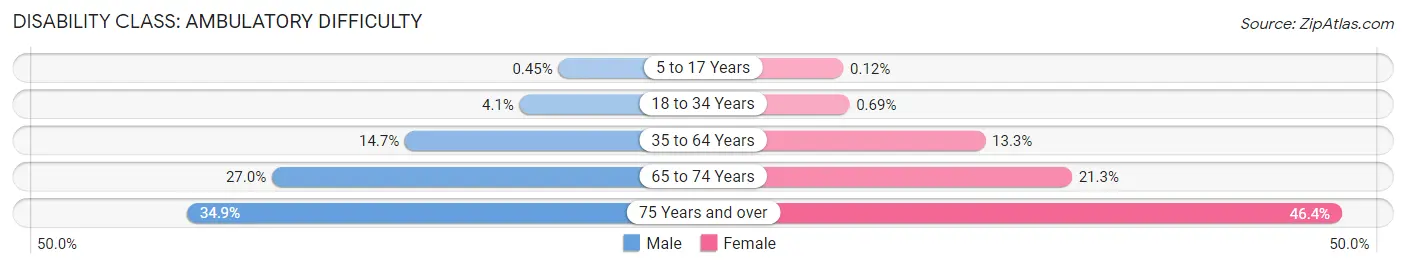
| Age Bracket | Male | Female |
| 5 to 17 Years | 14 (0.4%) | 4 (0.1%) |
| 18 to 34 Years | 177 (4.1%) | 34 (0.7%) |
| 35 to 64 Years | 905 (14.7%) | 1,012 (13.3%) |
| 65 to 74 Years | 441 (27.0%) | 453 (21.3%) |
| 75 Years and over | 290 (34.9%) | 692 (46.4%) |
Disability Class: Self-Care Difficulty
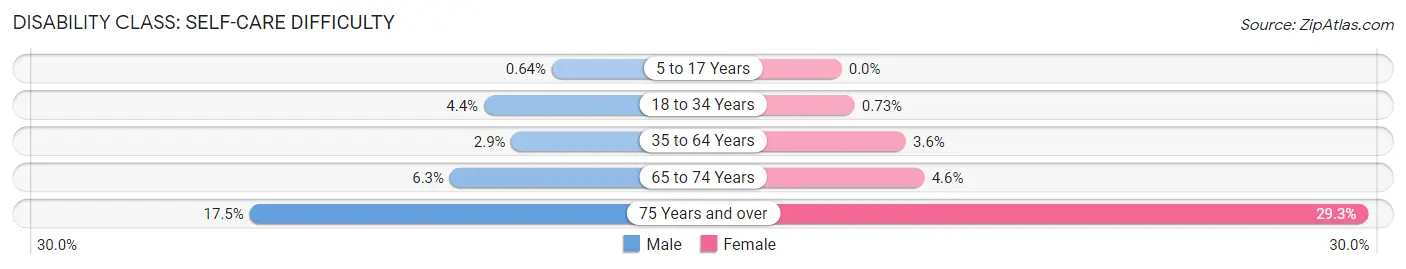
| Age Bracket | Male | Female |
| 5 to 17 Years | 20 (0.6%) | 0 (0.0%) |
| 18 to 34 Years | 193 (4.4%) | 36 (0.7%) |
| 35 to 64 Years | 178 (2.9%) | 272 (3.6%) |
| 65 to 74 Years | 103 (6.3%) | 98 (4.6%) |
| 75 Years and over | 145 (17.5%) | 437 (29.3%) |
Technology Access in Pine Bluff
Computing Device Access in Pine Bluff
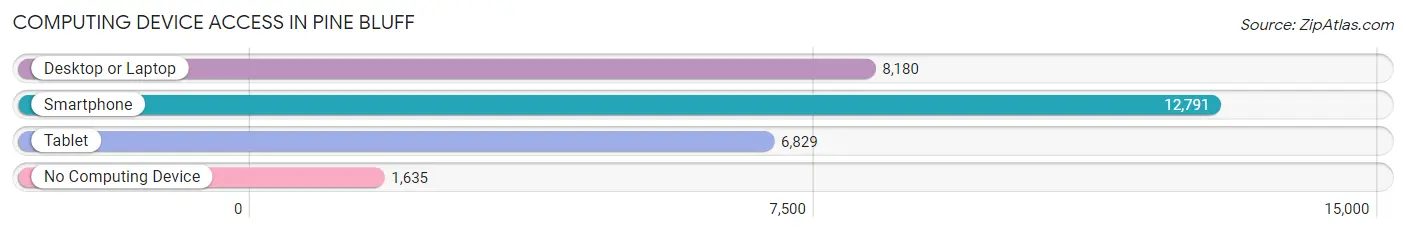
| Device Type | # Households | % Households |
| Desktop or Laptop | 8,180 | 54.2% |
| Smartphone | 12,791 | 84.8% |
| Tablet | 6,829 | 45.3% |
| No Computing Device | 1,635 | 10.8% |
| Total | 15,083 | 100.0% |
Internet Access in Pine Bluff
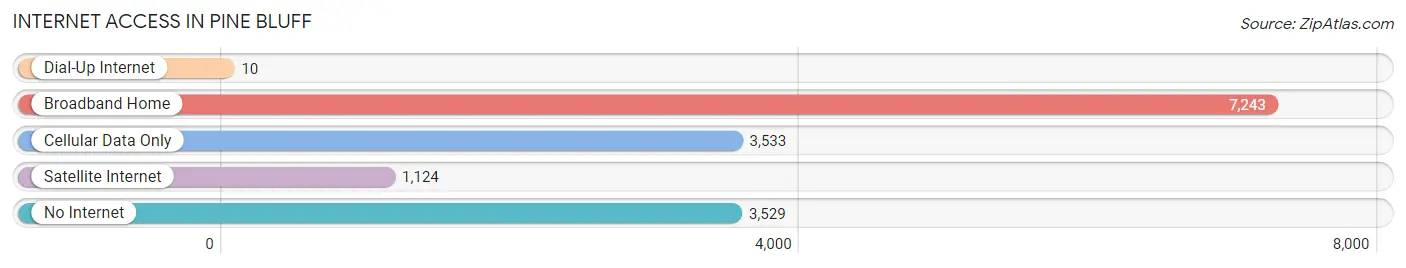
| Internet Type | # Households | % Households |
| Dial-Up Internet | 10 | 0.1% |
| Broadband Home | 7,243 | 48.0% |
| Cellular Data Only | 3,533 | 23.4% |
| Satellite Internet | 1,124 | 7.4% |
| No Internet | 3,529 | 23.4% |
| Total | 15,083 | 100.0% |
Pine Bluff Summary
Pine Bluff, Arkansas is a city located in Jefferson County in the southeastern part of the state. It is the county seat and the largest city in the county. The city is situated on the Arkansas River and is home to a population of approximately 49,083 people as of the 2010 census.
History
Pine Bluff was first settled in 1819 by a group of settlers from the Arkansas Territory. The city was named after the abundance of pine trees in the area. The city was incorporated in 1839 and was the first city in the state to be incorporated.
In the late 1800s, Pine Bluff was a major center for the cotton industry. The city was home to several cotton mills and other related businesses. The city was also home to a large African American population, many of whom were former slaves.
In the early 1900s, Pine Bluff was a major center for the timber industry. The city was home to several sawmills and other related businesses. The city was also home to a large African American population, many of whom were former slaves.
In the mid-1900s, Pine Bluff was a major center for the poultry industry. The city was home to several poultry processing plants and other related businesses. The city was also home to a large African American population, many of whom were former slaves.
Geography
Pine Bluff is located in the southeastern part of the state of Arkansas. The city is situated on the Arkansas River and is bordered by the cities of White Hall, Redfield, and Altheimer. The city has a total area of 33.3 square miles, of which 32.9 square miles is land and 0.4 square miles is water.
The city has a humid subtropical climate, with hot, humid summers and mild winters. The average annual temperature is 64.3°F, with an average high of 79.3°F and an average low of 49.3°F. The average annual precipitation is 48.3 inches.
Economy
Pine Bluff is a major center for the timber, poultry, and cotton industries. The city is home to several sawmills, poultry processing plants, and cotton mills. The city is also home to several manufacturing companies, including a paper mill, a steel mill, and a chemical plant.
The city is also home to several retail stores, restaurants, and other businesses. The city is home to the University of Arkansas at Pine Bluff, which is a public university.
Demographics
As of the 2010 census, the population of Pine Bluff was 49,083. The racial makeup of the city was 57.3% African American, 37.2% White, 0.7% Native American, 0.5% Asian, 0.1% Pacific Islander, and 4.2% from other races. The median household income was $27,945. The per capita income was $15,945.
Conclusion
Pine Bluff, Arkansas is a city located in Jefferson County in the southeastern part of the state. It is the county seat and the largest city in the county. The city is situated on the Arkansas River and is home to a population of approximately 49,083 people as of the 2010 census. The city is a major center for the timber, poultry, and cotton industries. The city is also home to several manufacturing companies, retail stores, restaurants, and other businesses. The racial makeup of the city is 57.3% African American, 37.2% White, 0.7% Native American, 0.5% Asian, 0.1% Pacific Islander, and 4.2% from other races. The median household income was $27,945 and the per capita income was $15,945.
Common Questions
What is Per Capita Income in Pine Bluff?
Per Capita income in Pine Bluff is $21,170.
What is the Median Family Income in Pine Bluff?
Median Family Income in Pine Bluff is $51,882.
What is the Median Household income in Pine Bluff?
Median Household Income in Pine Bluff is $39,411.
What is Income or Wage Gap in Pine Bluff?
Income or Wage Gap in Pine Bluff is 11.5%.
Women in Pine Bluff earn 88.5 cents for every dollar earned by a man.
What is Family Income Deficit in Pine Bluff?
Family Income Deficit in Pine Bluff is $10,307.
Families that are below poverty line in Pine Bluff earn $10,307 less on average than the poverty threshold level.
What is Inequality or Gini Index in Pine Bluff?
Inequality or Gini Index in Pine Bluff is 0.48.
What is the Total Population of Pine Bluff?
Total Population of Pine Bluff is 41,172.
What is the Total Male Population of Pine Bluff?
Total Male Population of Pine Bluff is 19,843.
What is the Total Female Population of Pine Bluff?
Total Female Population of Pine Bluff is 21,329.
What is the Ratio of Males per 100 Females in Pine Bluff?
There are 93.03 Males per 100 Females in Pine Bluff.
What is the Ratio of Females per 100 Males in Pine Bluff?
There are 107.49 Females per 100 Males in Pine Bluff.
What is the Median Population Age in Pine Bluff?
Median Population Age in Pine Bluff is 37.1 Years.
What is the Average Family Size in Pine Bluff
Average Family Size in Pine Bluff is 3.3 People.
What is the Average Household Size in Pine Bluff
Average Household Size in Pine Bluff is 2.5 People.
How Large is the Labor Force in Pine Bluff?
There are 17,309 People in the Labor Forcein in Pine Bluff.
What is the Percentage of People in the Labor Force in Pine Bluff?
52.2% of People are in the Labor Force in Pine Bluff.
What is the Unemployment Rate in Pine Bluff?
Unemployment Rate in Pine Bluff is 9.8%.