Crawford County, AR Map & Demographics
Crawford County Map
Crawford County Overview
$28,920
PER CAPITA INCOME
$66,704
AVG FAMILY INCOME
$56,702
AVG HOUSEHOLD INCOME
32.8%
WAGE / INCOME GAP [ % ]
67.2¢/ $1
WAGE / INCOME GAP [ $ ]
$11,805
FAMILY INCOME DEFICIT
0.44
INEQUALITY / GINI INDEX
60,593
TOTAL POPULATION
29,905
MALE POPULATION
30,688
FEMALE POPULATION
97.45
MALES / 100 FEMALES
102.62
FEMALES / 100 MALES
39.2
MEDIAN AGE
3.1
AVG FAMILY SIZE
2.6
AVG HOUSEHOLD SIZE
26,139
LABOR FORCE [ PEOPLE ]
55.0%
PERCENT IN LABOR FORCE
5.3%
UNEMPLOYMENT RATE
Crawford County Area Codes
Income in Crawford County
Income Overview in Crawford County
Per Capita Income in Crawford County is $28,920, while median incomes of families and households are $66,704 and $56,702 respectively.
| Characteristic | Number | Measure |
| Per Capita Income | 60,593 | $28,920 |
| Median Family Income | 16,129 | $66,704 |
| Mean Family Income | 16,129 | $82,815 |
| Median Household Income | 22,731 | $56,702 |
| Mean Household Income | 22,731 | $74,478 |
| Income Deficit | 16,129 | $11,805 |
| Wage / Income Gap (%) | 60,593 | 32.78% |
| Wage / Income Gap ($) | 60,593 | 67.22¢ per $1 |
| Gini / Inequality Index | 60,593 | 0.44 |
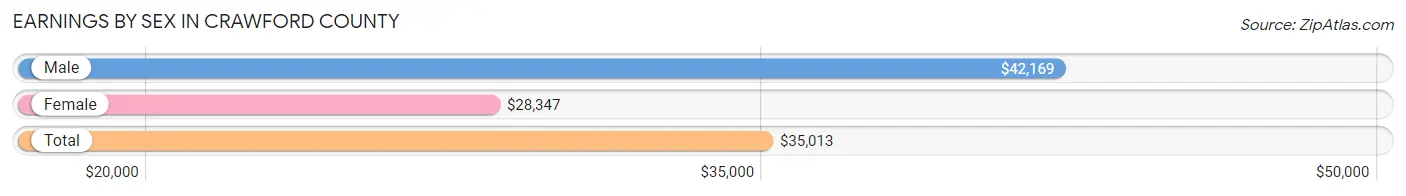
Earnings by Sex in Crawford County
Average Earnings in Crawford County are $35,013, $42,169 for men and $28,347 for women, a difference of 32.8%.
| Sex | Number | Average Earnings |
| Male | 14,956 (54.7%) | $42,169 |
| Female | 12,371 (45.3%) | $28,347 |
| Total | 27,327 (100.0%) | $35,013 |
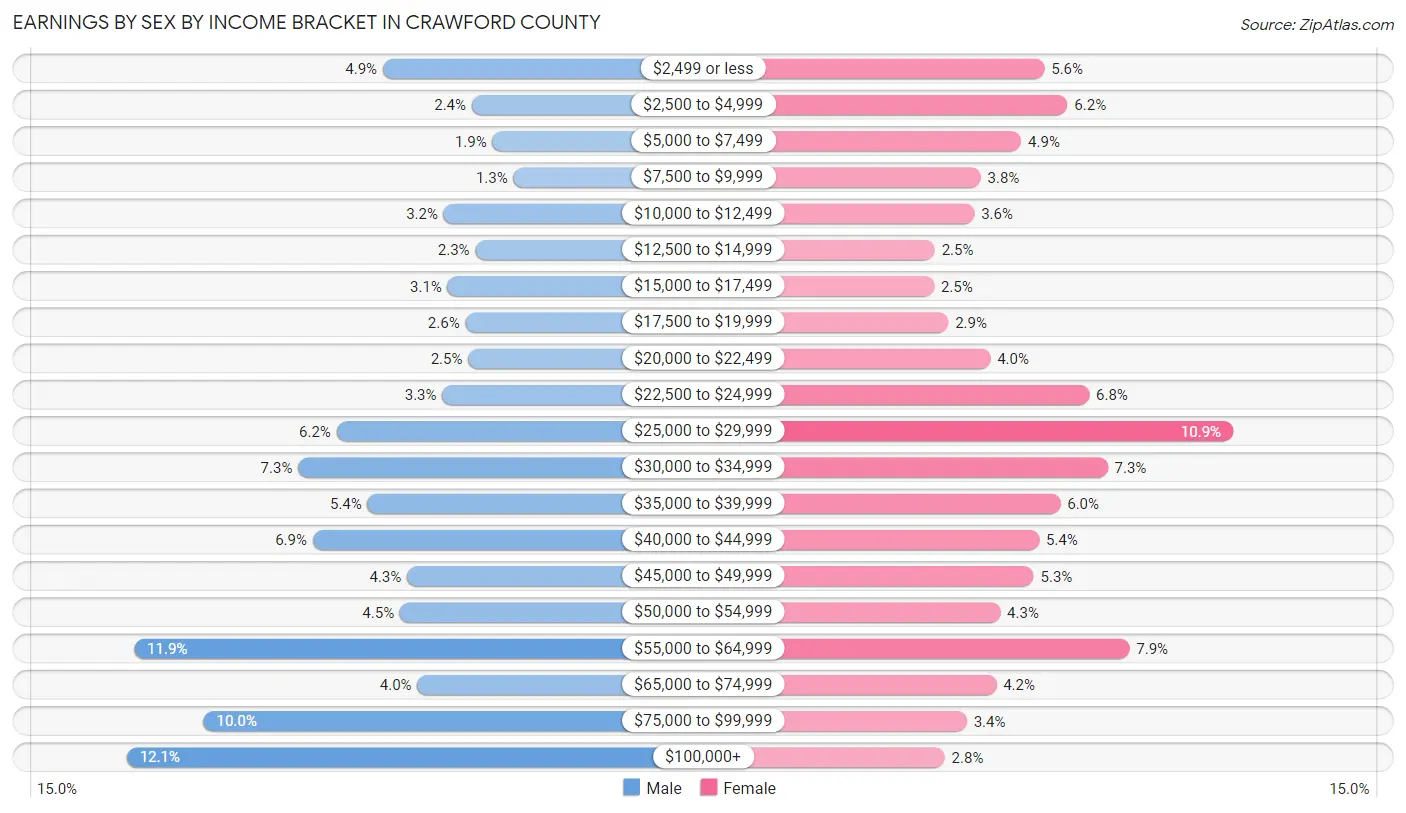
Earnings by Sex by Income Bracket in Crawford County
The most common earnings brackets in Crawford County are $100,000+ for men (1,814 | 12.1%) and $25,000 to $29,999 for women (1,342 | 10.8%).
| Income | Male | Female |
| $2,499 or less | 737 (4.9%) | 686 (5.6%) |
| $2,500 to $4,999 | 364 (2.4%) | 767 (6.2%) |
| $5,000 to $7,499 | 276 (1.8%) | 606 (4.9%) |
| $7,500 to $9,999 | 188 (1.3%) | 465 (3.8%) |
| $10,000 to $12,499 | 481 (3.2%) | 443 (3.6%) |
| $12,500 to $14,999 | 348 (2.3%) | 306 (2.5%) |
| $15,000 to $17,499 | 465 (3.1%) | 303 (2.5%) |
| $17,500 to $19,999 | 391 (2.6%) | 353 (2.9%) |
| $20,000 to $22,499 | 378 (2.5%) | 499 (4.0%) |
| $22,500 to $24,999 | 487 (3.3%) | 842 (6.8%) |
| $25,000 to $29,999 | 932 (6.2%) | 1,342 (10.8%) |
| $30,000 to $34,999 | 1,093 (7.3%) | 907 (7.3%) |
| $35,000 to $39,999 | 801 (5.4%) | 742 (6.0%) |
| $40,000 to $44,999 | 1,032 (6.9%) | 668 (5.4%) |
| $45,000 to $49,999 | 636 (4.3%) | 650 (5.2%) |
| $50,000 to $54,999 | 666 (4.4%) | 533 (4.3%) |
| $55,000 to $64,999 | 1,783 (11.9%) | 982 (7.9%) |
| $65,000 to $74,999 | 593 (4.0%) | 520 (4.2%) |
| $75,000 to $99,999 | 1,491 (10.0%) | 417 (3.4%) |
| $100,000+ | 1,814 (12.1%) | 340 (2.8%) |
| Total | 14,956 (100.0%) | 12,371 (100.0%) |
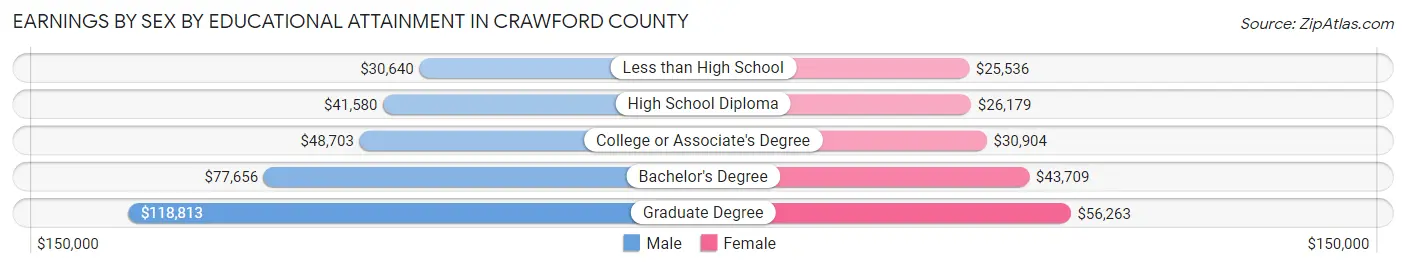
Earnings by Sex by Educational Attainment in Crawford County
Average earnings in Crawford County are $47,946 for men and $32,799 for women, a difference of 31.6%. Men with an educational attainment of graduate degree enjoy the highest average annual earnings of $118,813, while those with less than high school education earn the least with $30,640. Women with an educational attainment of graduate degree earn the most with the average annual earnings of $56,263, while those with less than high school education have the smallest earnings of $25,536.
| Educational Attainment | Male Income | Female Income |
| Less than High School | $30,640 | $25,536 |
| High School Diploma | $41,580 | $26,179 |
| College or Associate's Degree | $48,703 | $30,904 |
| Bachelor's Degree | $77,656 | $43,709 |
| Graduate Degree | $118,813 | $56,263 |
| Total | $47,946 | $32,799 |
Family Income in Crawford County
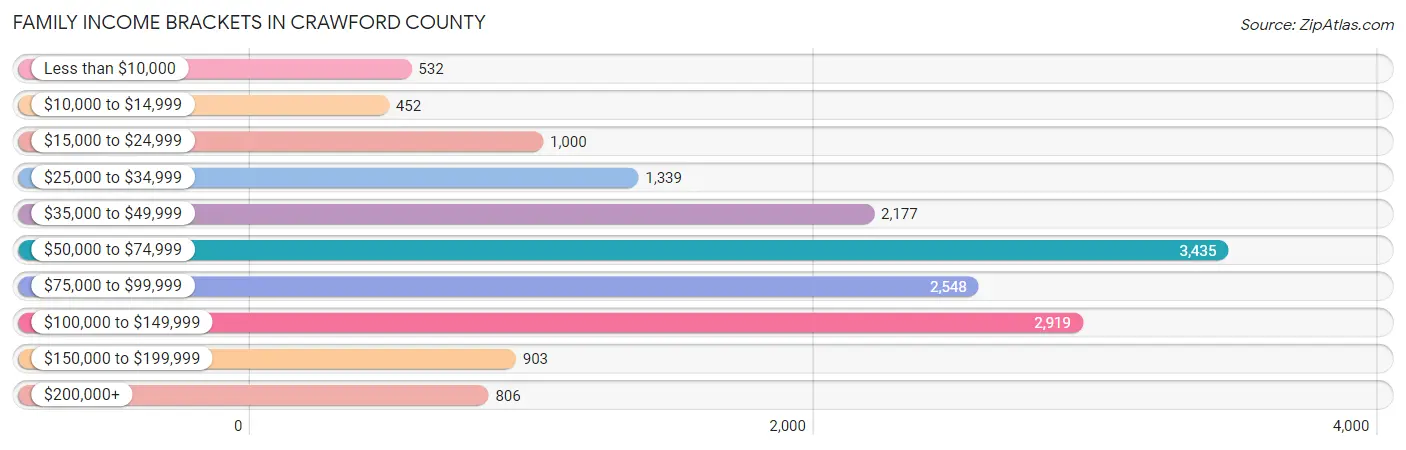
Family Income Brackets in Crawford County
According to the Crawford County family income data, there are 3,435 families falling into the $50,000 to $74,999 income range, which is the most common income bracket and makes up 21.3% of all families. Conversely, the $10,000 to $14,999 income bracket is the least frequent group with only 452 families (2.8%) belonging to this category.
| Income Bracket | # Families | % Families |
| Less than $10,000 | 532 | 3.3% |
| $10,000 to $14,999 | 452 | 2.8% |
| $15,000 to $24,999 | 1,000 | 6.2% |
| $25,000 to $34,999 | 1,339 | 8.3% |
| $35,000 to $49,999 | 2,177 | 13.5% |
| $50,000 to $74,999 | 3,435 | 21.3% |
| $75,000 to $99,999 | 2,548 | 15.8% |
| $100,000 to $149,999 | 2,919 | 18.1% |
| $150,000 to $199,999 | 903 | 5.6% |
| $200,000+ | 806 | 5.0% |
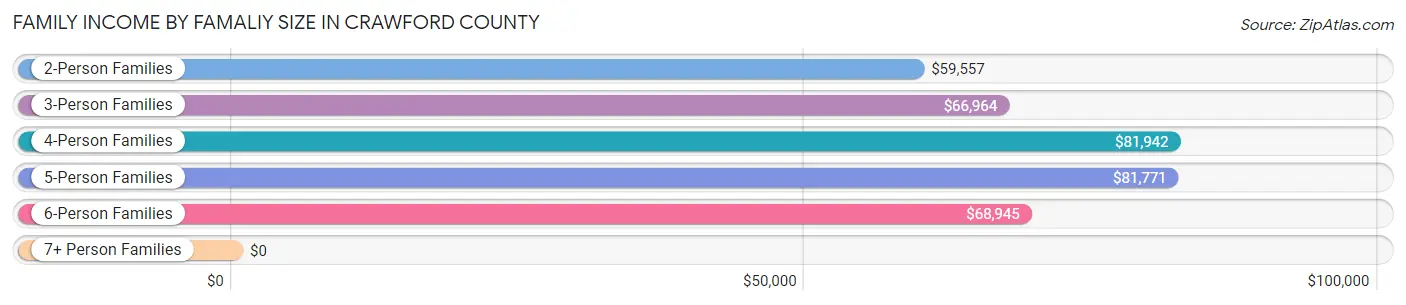
Family Income by Famaliy Size in Crawford County
4-person families (2,783 | 17.2%) account for the highest median family income in Crawford County with $81,942 per family, while 2-person families (7,853 | 48.7%) have the highest median income of $29,778 per family member.
| Income Bracket | # Families | Median Income |
| 2-Person Families | 7,853 (48.7%) | $59,557 |
| 3-Person Families | 3,225 (20.0%) | $66,964 |
| 4-Person Families | 2,783 (17.2%) | $81,942 |
| 5-Person Families | 1,251 (7.8%) | $81,771 |
| 6-Person Families | 693 (4.3%) | $68,945 |
| 7+ Person Families | 324 (2.0%) | $0 |
| Total | 16,129 (100.0%) | $66,704 |
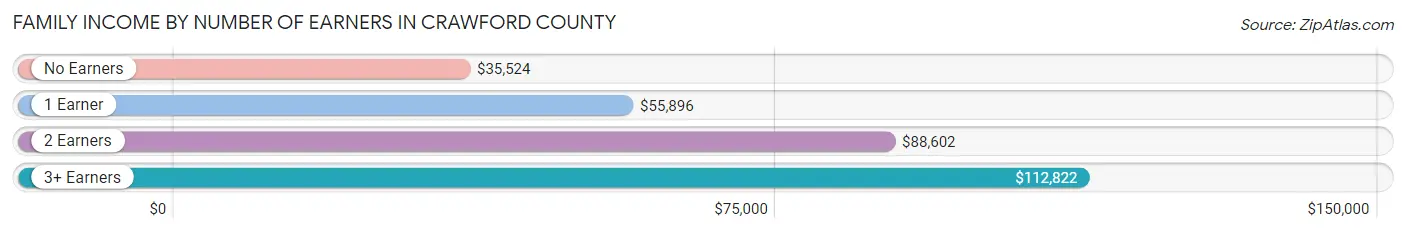
Family Income by Number of Earners in Crawford County
The median family income in Crawford County is $66,704, with families comprising 3+ earners (1,265) having the highest median family income of $112,822, while families with no earners (3,384) have the lowest median family income of $35,524, accounting for 7.8% and 21.0% of families, respectively.
| Number of Earners | # Families | Median Income |
| No Earners | 3,384 (21.0%) | $35,524 |
| 1 Earner | 5,537 (34.3%) | $55,896 |
| 2 Earners | 5,943 (36.8%) | $88,602 |
| 3+ Earners | 1,265 (7.8%) | $112,822 |
| Total | 16,129 (100.0%) | $66,704 |
Household Income in Crawford County
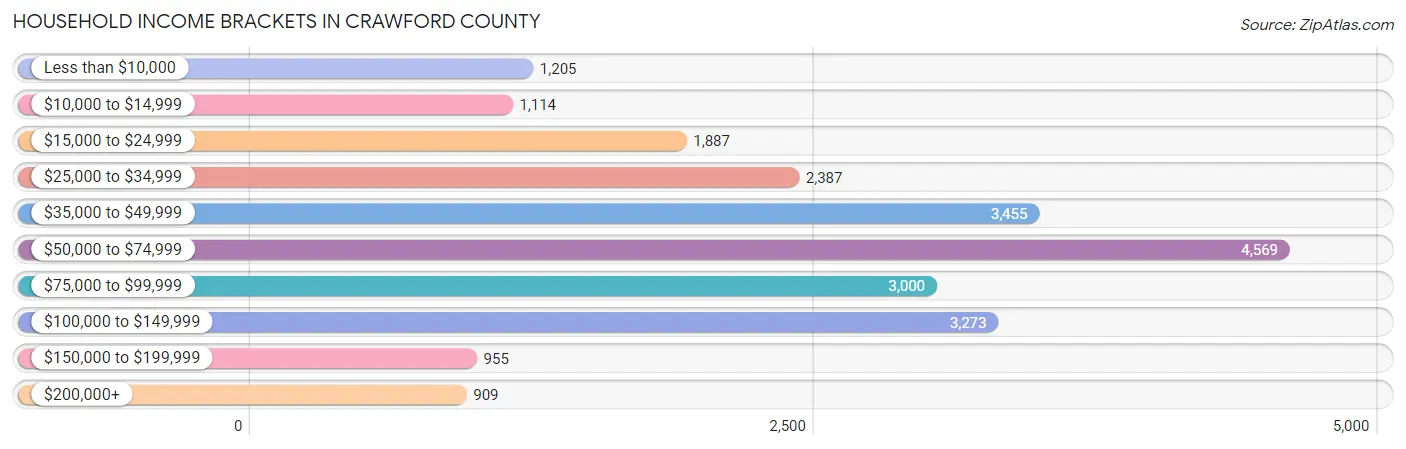
Household Income Brackets in Crawford County
With 4,569 households falling in the category, the $50,000 to $74,999 income range is the most frequent in Crawford County, accounting for 20.1% of all households. In contrast, only 909 households (4.0%) fall into the $200,000+ income bracket, making it the least populous group.
| Income Bracket | # Households | % Households |
| Less than $10,000 | 1,205 | 5.3% |
| $10,000 to $14,999 | 1,114 | 4.9% |
| $15,000 to $24,999 | 1,887 | 8.3% |
| $25,000 to $34,999 | 2,387 | 10.5% |
| $35,000 to $49,999 | 3,455 | 15.2% |
| $50,000 to $74,999 | 4,569 | 20.1% |
| $75,000 to $99,999 | 3,000 | 13.2% |
| $100,000 to $149,999 | 3,273 | 14.4% |
| $150,000 to $199,999 | 955 | 4.2% |
| $200,000+ | 909 | 4.0% |
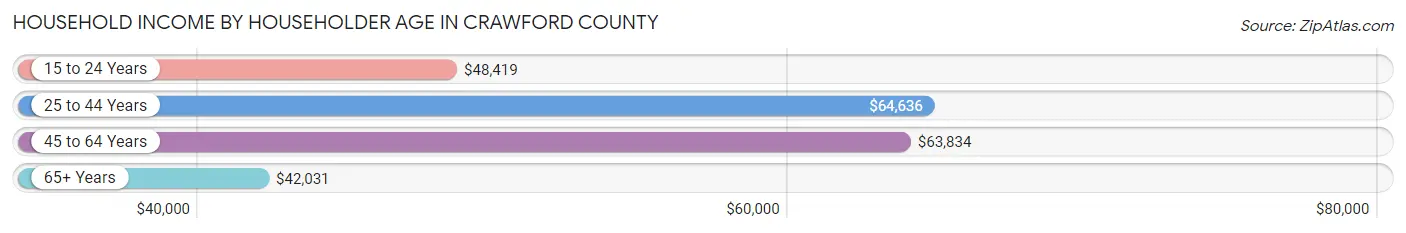
Household Income by Householder Age in Crawford County
The median household income in Crawford County is $56,702, with the highest median household income of $64,636 found in the 25 to 44 years age bracket for the primary householder. A total of 6,652 households (29.3%) fall into this category. Meanwhile, the 65+ years age bracket for the primary householder has the lowest median household income of $42,031, with 6,418 households (28.2%) in this group.
| Income Bracket | # Households | Median Income |
| 15 to 24 Years | 769 (3.4%) | $48,419 |
| 25 to 44 Years | 6,652 (29.3%) | $64,636 |
| 45 to 64 Years | 8,892 (39.1%) | $63,834 |
| 65+ Years | 6,418 (28.2%) | $42,031 |
| Total | 22,731 (100.0%) | $56,702 |
Poverty in Crawford County
Income Below Poverty by Sex and Age in Crawford County
With 15.9% poverty level for males and 19.8% for females among the residents of Crawford County, 15 year old males and 16 and 17 year old females are the most vulnerable to poverty, with 232 males (38.4%) and 296 females (35.3%) in their respective age groups living below the poverty level.
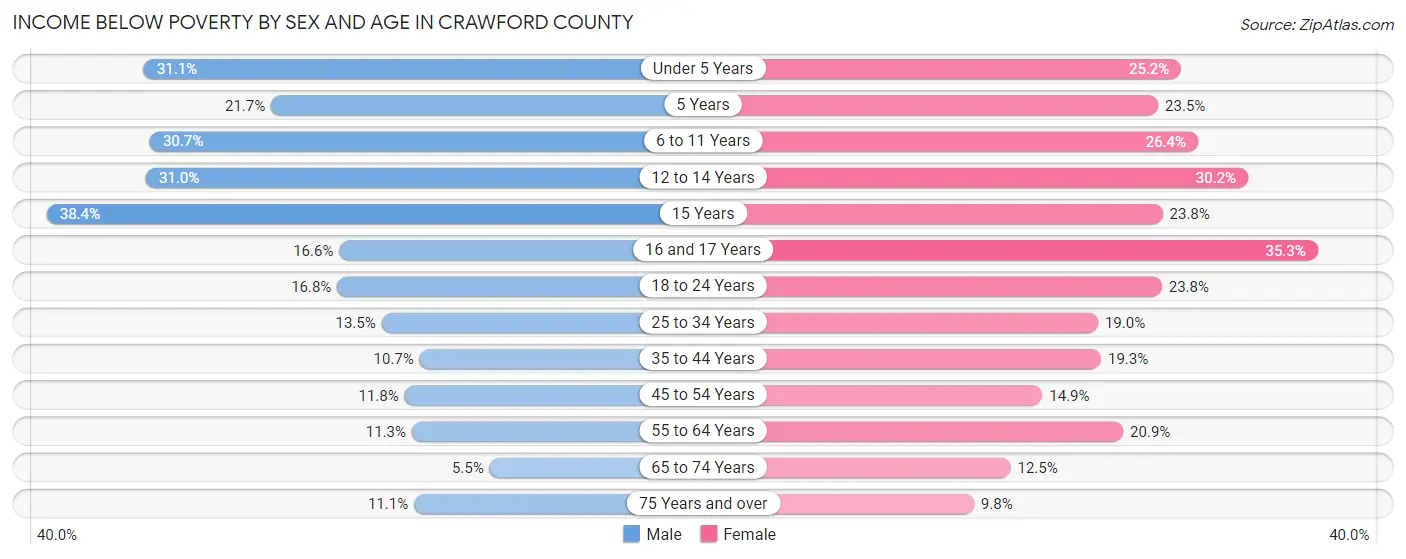
| Age Bracket | Male | Female |
| Under 5 Years | 549 (31.1%) | 435 (25.2%) |
| 5 Years | 97 (21.7%) | 66 (23.5%) |
| 6 to 11 Years | 601 (30.7%) | 642 (26.4%) |
| 12 to 14 Years | 523 (31.0%) | 351 (30.1%) |
| 15 Years | 232 (38.4%) | 136 (23.8%) |
| 16 and 17 Years | 107 (16.6%) | 296 (35.3%) |
| 18 to 24 Years | 420 (16.8%) | 577 (23.8%) |
| 25 to 34 Years | 523 (13.5%) | 711 (19.0%) |
| 35 to 44 Years | 383 (10.7%) | 712 (19.3%) |
| 45 to 54 Years | 446 (11.8%) | 559 (14.9%) |
| 55 to 64 Years | 453 (11.3%) | 832 (20.9%) |
| 65 to 74 Years | 154 (5.5%) | 396 (12.5%) |
| 75 Years and over | 198 (11.1%) | 221 (9.8%) |
| Total | 4,686 (15.9%) | 5,934 (19.8%) |
Income Above Poverty by Sex and Age in Crawford County
According to the poverty statistics in Crawford County, males aged 65 to 74 years and females aged 75 years and over are the age groups that are most secure financially, with 94.5% of males and 90.2% of females in these age groups living above the poverty line.
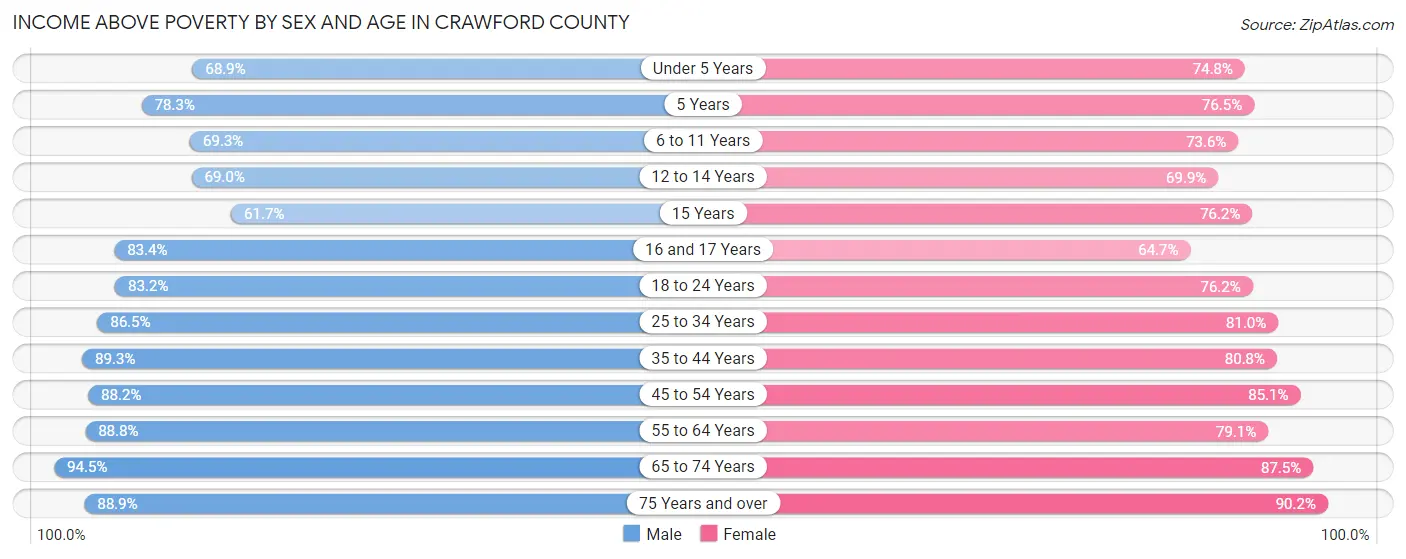
| Age Bracket | Male | Female |
| Under 5 Years | 1,214 (68.9%) | 1,292 (74.8%) |
| 5 Years | 350 (78.3%) | 215 (76.5%) |
| 6 to 11 Years | 1,357 (69.3%) | 1,787 (73.6%) |
| 12 to 14 Years | 1,165 (69.0%) | 813 (69.9%) |
| 15 Years | 373 (61.7%) | 435 (76.2%) |
| 16 and 17 Years | 536 (83.4%) | 542 (64.7%) |
| 18 to 24 Years | 2,082 (83.2%) | 1,851 (76.2%) |
| 25 to 34 Years | 3,351 (86.5%) | 3,028 (81.0%) |
| 35 to 44 Years | 3,205 (89.3%) | 2,986 (80.7%) |
| 45 to 54 Years | 3,337 (88.2%) | 3,196 (85.1%) |
| 55 to 64 Years | 3,574 (88.7%) | 3,150 (79.1%) |
| 65 to 74 Years | 2,658 (94.5%) | 2,765 (87.5%) |
| 75 Years and over | 1,588 (88.9%) | 2,031 (90.2%) |
| Total | 24,790 (84.1%) | 24,091 (80.2%) |
Income Below Poverty Among Married-Couple Families in Crawford County
The poverty statistics for married-couple families in Crawford County show that 5.7% or 679 of the total 11,874 families live below the poverty line. Families with 5 or more children have the highest poverty rate of 76.1%, comprising of 86 families. On the other hand, families with no children have the lowest poverty rate of 3.7%, which includes 273 families.
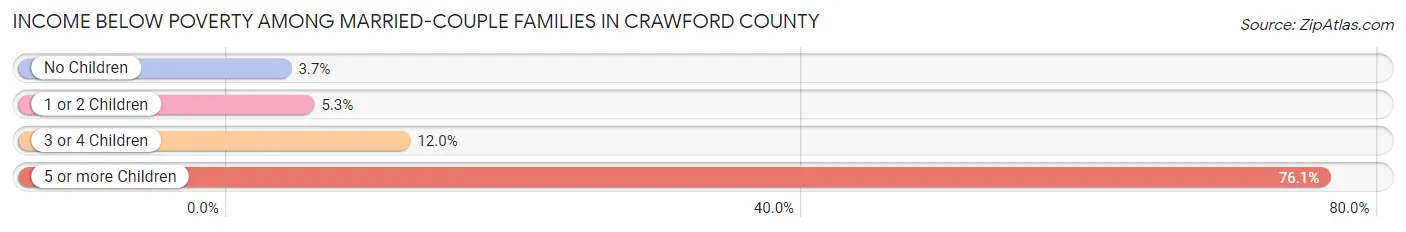
| Children | Above Poverty | Below Poverty |
| No Children | 7,057 (96.3%) | 273 (3.7%) |
| 1 or 2 Children | 3,005 (94.7%) | 169 (5.3%) |
| 3 or 4 Children | 1,106 (88.0%) | 151 (12.0%) |
| 5 or more Children | 27 (23.9%) | 86 (76.1%) |
| Total | 11,195 (94.3%) | 679 (5.7%) |
Income Below Poverty Among Single-Parent Households in Crawford County
According to the poverty data in Crawford County, 18.2% or 277 single-father households and 31.4% or 859 single-mother households are living below the poverty line. Among single-father households, those with 5 or more children have the highest poverty rate, with 78 households (100.0%) experiencing poverty. Likewise, among single-mother households, those with 3 or 4 children have the highest poverty rate, with 205 households (71.2%) falling below the poverty line.
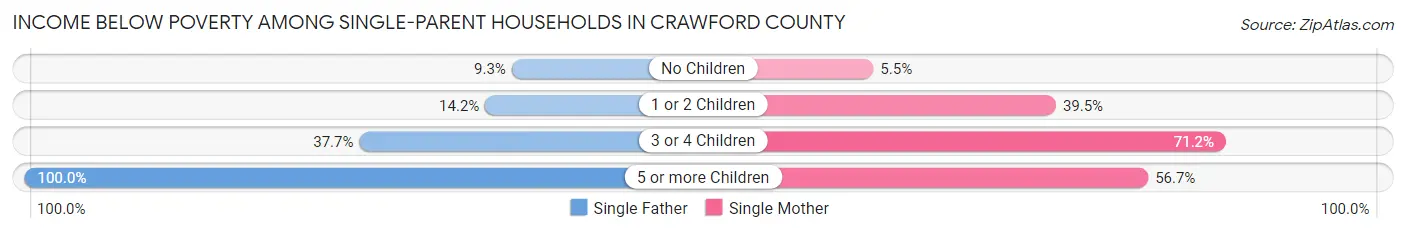
| Children | Single Father | Single Mother |
| No Children | 45 (9.3%) | 53 (5.5%) |
| 1 or 2 Children | 125 (14.2%) | 563 (39.5%) |
| 3 or 4 Children | 29 (37.7%) | 205 (71.2%) |
| 5 or more Children | 78 (100.0%) | 38 (56.7%) |
| Total | 277 (18.2%) | 859 (31.4%) |
Income Below Poverty Among Married-Couple vs Single-Parent Households in Crawford County
The poverty data for Crawford County shows that 679 of the married-couple family households (5.7%) and 1,136 of the single-parent households (26.7%) are living below the poverty level. Within the married-couple family households, those with 5 or more children have the highest poverty rate, with 86 households (76.1%) falling below the poverty line. Among the single-parent households, those with 5 or more children have the highest poverty rate, with 116 household (80.0%) living below poverty.
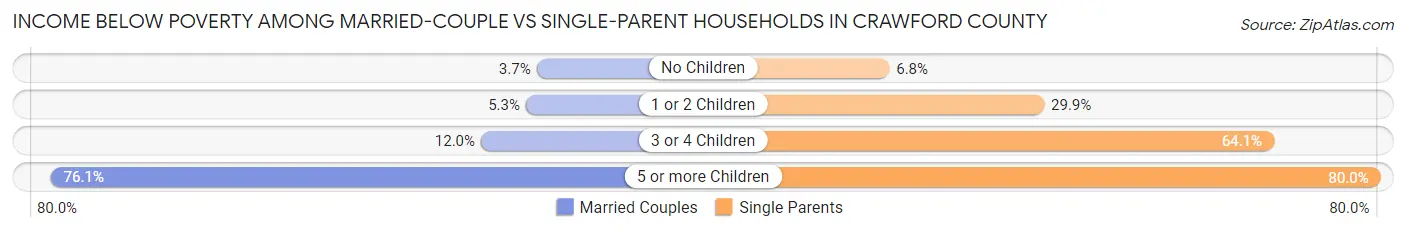
| Children | Married-Couple Families | Single-Parent Households |
| No Children | 273 (3.7%) | 98 (6.8%) |
| 1 or 2 Children | 169 (5.3%) | 688 (29.9%) |
| 3 or 4 Children | 151 (12.0%) | 234 (64.1%) |
| 5 or more Children | 86 (76.1%) | 116 (80.0%) |
| Total | 679 (5.7%) | 1,136 (26.7%) |
Race in Crawford County
The most populous races in Crawford County are White / Caucasian (51,822 | 85.5%), Two or more Races (5,216 | 8.6%), and Hispanic or Latino (5,155 | 8.5%).
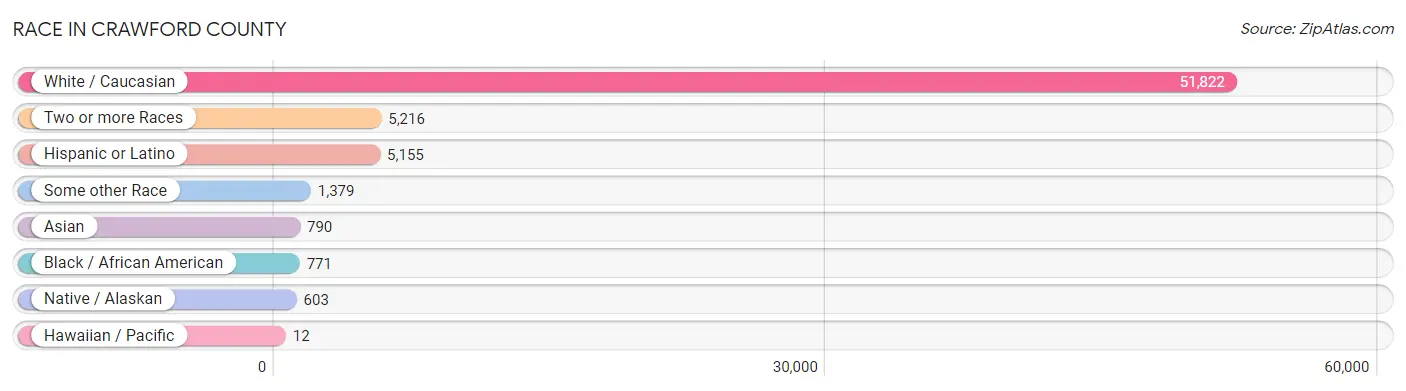
| Race | # Population | % Population |
| Asian | 790 | 1.3% |
| Black / African American | 771 | 1.3% |
| Hawaiian / Pacific | 12 | 0.0% |
| Hispanic or Latino | 5,155 | 8.5% |
| Native / Alaskan | 603 | 1.0% |
| White / Caucasian | 51,822 | 85.5% |
| Two or more Races | 5,216 | 8.6% |
| Some other Race | 1,379 | 2.3% |
| Total | 60,593 | 100.0% |
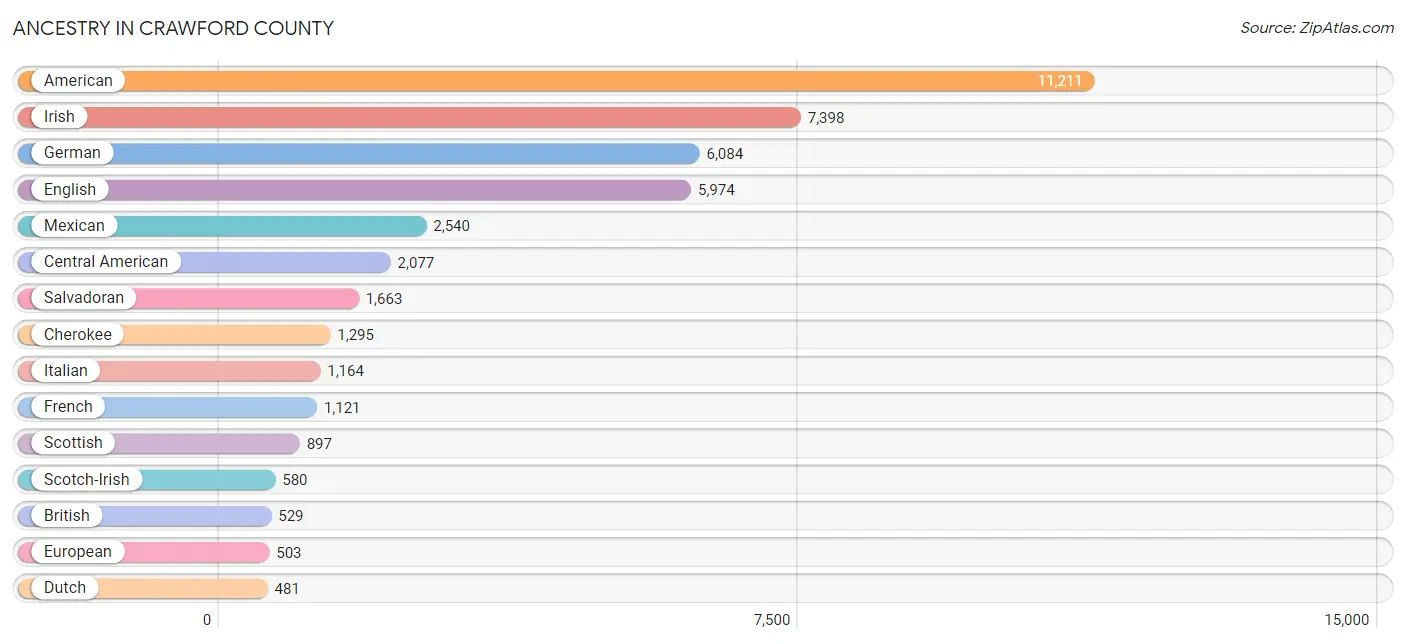
Ancestry in Crawford County
The most populous ancestries reported in Crawford County are American (11,211 | 18.5%), Irish (7,398 | 12.2%), German (6,084 | 10.0%), English (5,974 | 9.9%), and Mexican (2,540 | 4.2%), together accounting for 54.8% of all Crawford County residents.
| Ancestry | # Population | % Population |
| Albanian | 8 | 0.0% |
| American | 11,211 | 18.5% |
| Arab | 194 | 0.3% |
| Armenian | 182 | 0.3% |
| Austrian | 31 | 0.1% |
| Basque | 2 | 0.0% |
| Belgian | 25 | 0.0% |
| Blackfeet | 21 | 0.0% |
| British | 529 | 0.9% |
| Burmese | 56 | 0.1% |
| Cajun | 72 | 0.1% |
| Canadian | 148 | 0.2% |
| Central American | 2,077 | 3.4% |
| Cherokee | 1,295 | 2.1% |
| Chickasaw | 10 | 0.0% |
| Chippewa | 42 | 0.1% |
| Choctaw | 189 | 0.3% |
| Creek | 98 | 0.2% |
| Cuban | 59 | 0.1% |
| Czech | 118 | 0.2% |
| Czechoslovakian | 31 | 0.1% |
| Danish | 79 | 0.1% |
| Dutch | 481 | 0.8% |
| Dutch West Indian | 34 | 0.1% |
| Eastern European | 42 | 0.1% |
| Egyptian | 132 | 0.2% |
| English | 5,974 | 9.9% |
| European | 503 | 0.8% |
| Fijian | 8 | 0.0% |
| Finnish | 2 | 0.0% |
| French | 1,121 | 1.8% |
| French American Indian | 2 | 0.0% |
| French Canadian | 207 | 0.3% |
| German | 6,084 | 10.0% |
| Greek | 87 | 0.1% |
| Guatemalan | 328 | 0.5% |
| Haitian | 27 | 0.0% |
| Honduran | 66 | 0.1% |
| Indian (Asian) | 63 | 0.1% |
| Inupiat | 17 | 0.0% |
| Irish | 7,398 | 12.2% |
| Italian | 1,164 | 1.9% |
| Jordanian | 9 | 0.0% |
| Korean | 120 | 0.2% |
| Latvian | 7 | 0.0% |
| Lebanese | 12 | 0.0% |
| Lithuanian | 8 | 0.0% |
| Malaysian | 379 | 0.6% |
| Mexican | 2,540 | 4.2% |
| Native Hawaiian | 46 | 0.1% |
| Navajo | 41 | 0.1% |
| Nicaraguan | 20 | 0.0% |
| Nigerian | 54 | 0.1% |
| Northern European | 26 | 0.0% |
| Norwegian | 268 | 0.4% |
| Pakistani | 226 | 0.4% |
| Peruvian | 96 | 0.2% |
| Polish | 461 | 0.8% |
| Portuguese | 61 | 0.1% |
| Potawatomi | 45 | 0.1% |
| Pueblo | 1 | 0.0% |
| Puerto Rican | 115 | 0.2% |
| Russian | 91 | 0.2% |
| Salvadoran | 1,663 | 2.7% |
| Scandinavian | 215 | 0.4% |
| Scotch-Irish | 580 | 1.0% |
| Scottish | 897 | 1.5% |
| Seminole | 2 | 0.0% |
| Senegalese | 132 | 0.2% |
| Sioux | 21 | 0.0% |
| Slavic | 5 | 0.0% |
| South American | 96 | 0.2% |
| Spaniard | 65 | 0.1% |
| Spanish | 124 | 0.2% |
| Sri Lankan | 60 | 0.1% |
| Subsaharan African | 186 | 0.3% |
| Swedish | 314 | 0.5% |
| Swiss | 108 | 0.2% |
| Thai | 157 | 0.3% |
| Ukrainian | 3 | 0.0% |
| Welsh | 287 | 0.5% | View All 81 Rows |
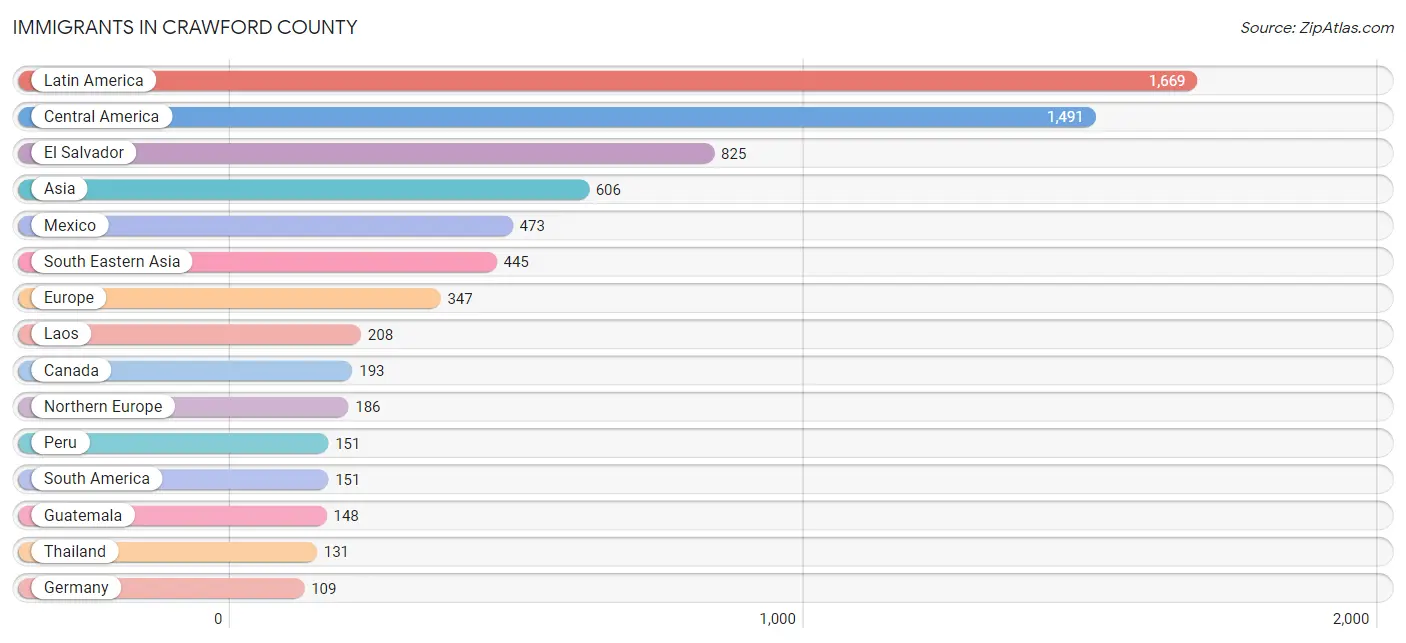
Immigrants in Crawford County
The most numerous immigrant groups reported in Crawford County came from Latin America (1,669 | 2.8%), Central America (1,491 | 2.5%), El Salvador (825 | 1.4%), Asia (606 | 1.0%), and Mexico (473 | 0.8%), together accounting for 8.3% of all Crawford County residents.
| Immigration Origin | # Population | % Population |
| Asia | 606 | 1.0% |
| Canada | 193 | 0.3% |
| Caribbean | 27 | 0.0% |
| Central America | 1,491 | 2.5% |
| China | 9 | 0.0% |
| Denmark | 77 | 0.1% |
| Eastern Asia | 51 | 0.1% |
| Eastern Europe | 50 | 0.1% |
| El Salvador | 825 | 1.4% |
| England | 66 | 0.1% |
| Europe | 347 | 0.6% |
| Germany | 109 | 0.2% |
| Guatemala | 148 | 0.2% |
| Haiti | 27 | 0.0% |
| Honduras | 36 | 0.1% |
| Jordan | 9 | 0.0% |
| Korea | 42 | 0.1% |
| Kuwait | 49 | 0.1% |
| Laos | 208 | 0.3% |
| Latin America | 1,669 | 2.8% |
| Mexico | 473 | 0.8% |
| Northern Europe | 186 | 0.3% |
| Oceania | 12 | 0.0% |
| Pakistan | 31 | 0.1% |
| Panama | 9 | 0.0% |
| Peru | 151 | 0.3% |
| Philippines | 37 | 0.1% |
| Poland | 4 | 0.0% |
| Russia | 38 | 0.1% |
| South America | 151 | 0.3% |
| South Central Asia | 52 | 0.1% |
| South Eastern Asia | 445 | 0.7% |
| Southern Europe | 2 | 0.0% |
| Spain | 2 | 0.0% |
| Sri Lanka | 21 | 0.0% |
| Taiwan | 5 | 0.0% |
| Thailand | 131 | 0.2% |
| Vietnam | 69 | 0.1% |
| Western Asia | 58 | 0.1% |
| Western Europe | 109 | 0.2% | View All 40 Rows |
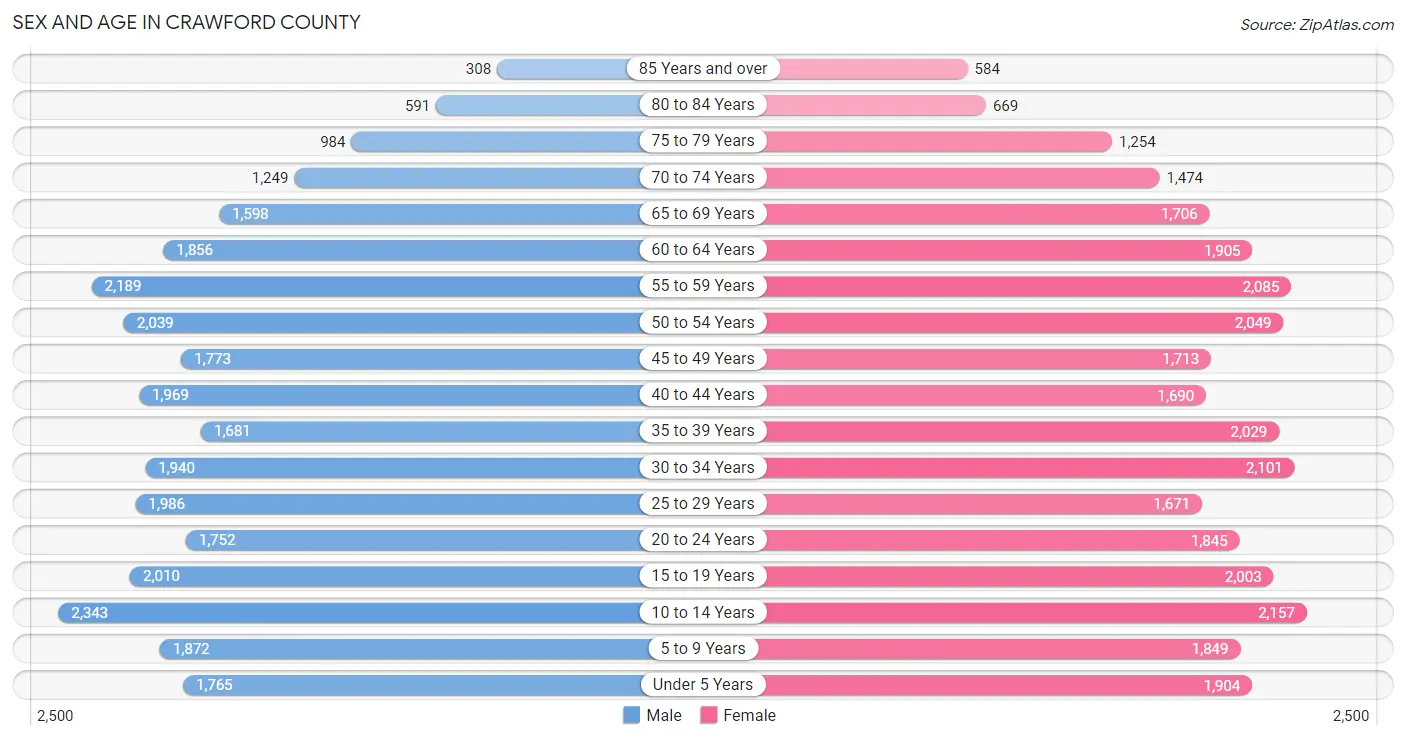
Sex and Age in Crawford County
Sex and Age in Crawford County
The most populous age groups in Crawford County are 10 to 14 Years (2,343 | 7.8%) for men and 10 to 14 Years (2,157 | 7.0%) for women.
| Age Bracket | Male | Female |
| Under 5 Years | 1,765 (5.9%) | 1,904 (6.2%) |
| 5 to 9 Years | 1,872 (6.3%) | 1,849 (6.0%) |
| 10 to 14 Years | 2,343 (7.8%) | 2,157 (7.0%) |
| 15 to 19 Years | 2,010 (6.7%) | 2,003 (6.5%) |
| 20 to 24 Years | 1,752 (5.9%) | 1,845 (6.0%) |
| 25 to 29 Years | 1,986 (6.6%) | 1,671 (5.4%) |
| 30 to 34 Years | 1,940 (6.5%) | 2,101 (6.9%) |
| 35 to 39 Years | 1,681 (5.6%) | 2,029 (6.6%) |
| 40 to 44 Years | 1,969 (6.6%) | 1,690 (5.5%) |
| 45 to 49 Years | 1,773 (5.9%) | 1,713 (5.6%) |
| 50 to 54 Years | 2,039 (6.8%) | 2,049 (6.7%) |
| 55 to 59 Years | 2,189 (7.3%) | 2,085 (6.8%) |
| 60 to 64 Years | 1,856 (6.2%) | 1,905 (6.2%) |
| 65 to 69 Years | 1,598 (5.3%) | 1,706 (5.6%) |
| 70 to 74 Years | 1,249 (4.2%) | 1,474 (4.8%) |
| 75 to 79 Years | 984 (3.3%) | 1,254 (4.1%) |
| 80 to 84 Years | 591 (2.0%) | 669 (2.2%) |
| 85 Years and over | 308 (1.0%) | 584 (1.9%) |
| Total | 29,905 (100.0%) | 30,688 (100.0%) |
Families and Households in Crawford County
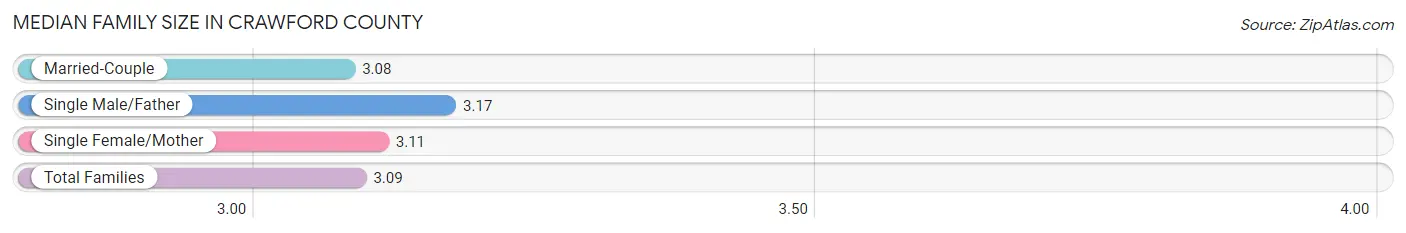
Median Family Size in Crawford County
The median family size in Crawford County is 3.09 persons per family, with single male/father families (1,519 | 9.4%) accounting for the largest median family size of 3.17 persons per family. On the other hand, married-couple families (11,874 | 73.6%) represent the smallest median family size with 3.08 persons per family.
| Family Type | # Families | Family Size |
| Married-Couple | 11,874 (73.6%) | 3.08 |
| Single Male/Father | 1,519 (9.4%) | 3.17 |
| Single Female/Mother | 2,736 (17.0%) | 3.11 |
| Total Families | 16,129 (100.0%) | 3.09 |
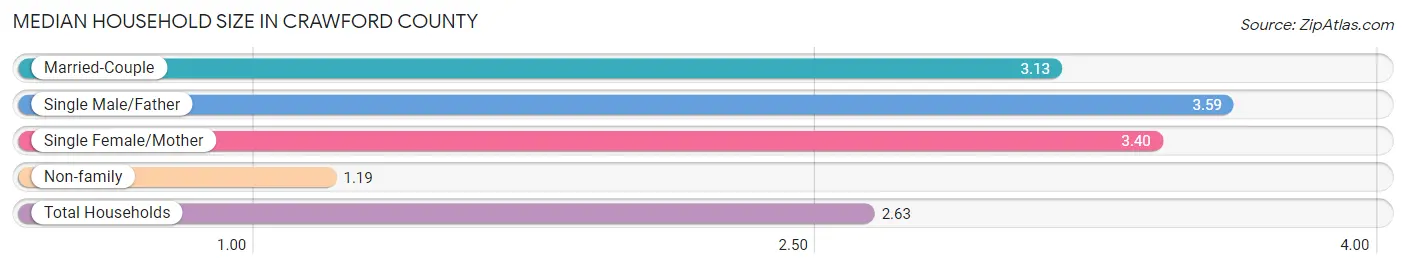
Median Household Size in Crawford County
The median household size in Crawford County is 2.63 persons per household, with single male/father households (1,519 | 6.7%) accounting for the largest median household size of 3.59 persons per household. non-family households (6,602 | 29.0%) represent the smallest median household size with 1.19 persons per household.
| Household Type | # Households | Household Size |
| Married-Couple | 11,874 (52.2%) | 3.13 |
| Single Male/Father | 1,519 (6.7%) | 3.59 |
| Single Female/Mother | 2,736 (12.0%) | 3.40 |
| Non-family | 6,602 (29.0%) | 1.19 |
| Total Households | 22,731 (100.0%) | 2.63 |
Household Size by Marriage Status in Crawford County
Out of a total of 22,731 households in Crawford County, 16,129 (71.0%) are family households, while 6,602 (29.0%) are nonfamily households. The most numerous type of family households are 2-person households, comprising 7,378, and the most common type of nonfamily households are 1-person households, comprising 5,609.
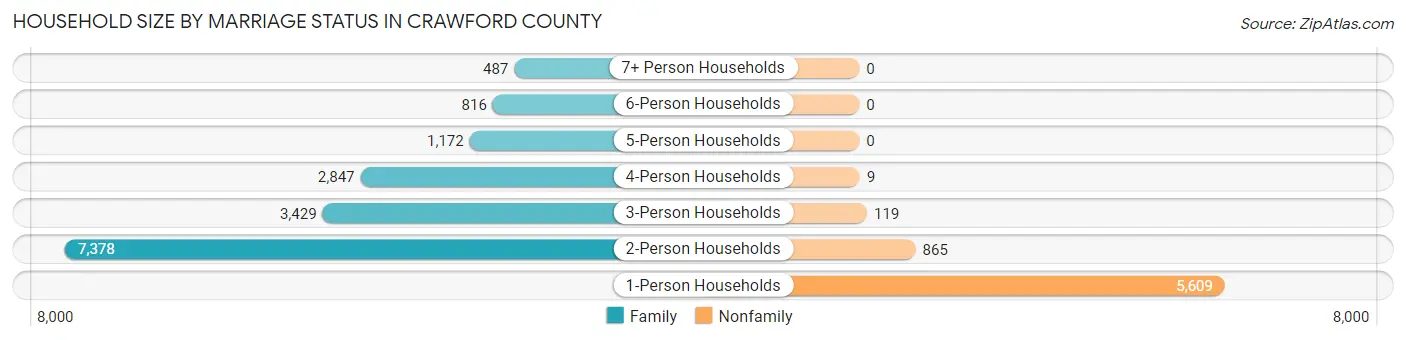
| Household Size | Family Households | Nonfamily Households |
| 1-Person Households | - | 5,609 (24.7%) |
| 2-Person Households | 7,378 (32.5%) | 865 (3.8%) |
| 3-Person Households | 3,429 (15.1%) | 119 (0.5%) |
| 4-Person Households | 2,847 (12.5%) | 9 (0.0%) |
| 5-Person Households | 1,172 (5.2%) | 0 (0.0%) |
| 6-Person Households | 816 (3.6%) | 0 (0.0%) |
| 7+ Person Households | 487 (2.1%) | 0 (0.0%) |
| Total | 16,129 (71.0%) | 6,602 (29.0%) |
Female Fertility in Crawford County
Fertility by Age in Crawford County
Average fertility rate in Crawford County is 60.0 births per 1,000 women. Women in the age bracket of 20 to 34 years have the highest fertility rate with 116.0 births per 1,000 women. Women in the age bracket of 20 to 34 years acount for 78.8% of all women with births.
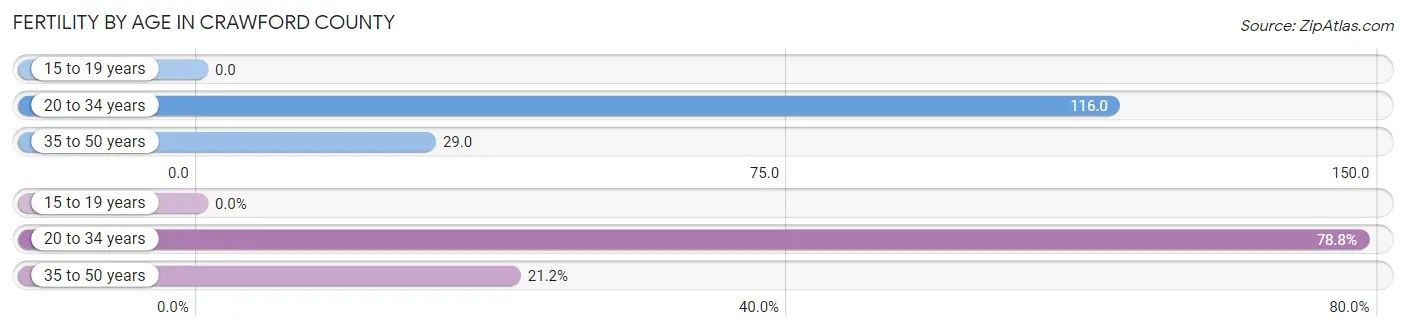
| Age Bracket | Women with Births | Births / 1,000 Women |
| 15 to 19 years | 0 (0.0%) | 0.0 |
| 20 to 34 years | 653 (78.8%) | 116.0 |
| 35 to 50 years | 176 (21.2%) | 29.0 |
| Total | 829 (100.0%) | 60.0 |
Fertility by Age by Marriage Status in Crawford County
51.7% of women with births (829) in Crawford County are married. The highest percentage of unmarried women with births falls into 20 to 34 years age bracket with 57.3% of them unmarried at the time of birth, while the lowest percentage of unmarried women with births belong to 35 to 50 years age bracket with 14.8% of them unmarried.
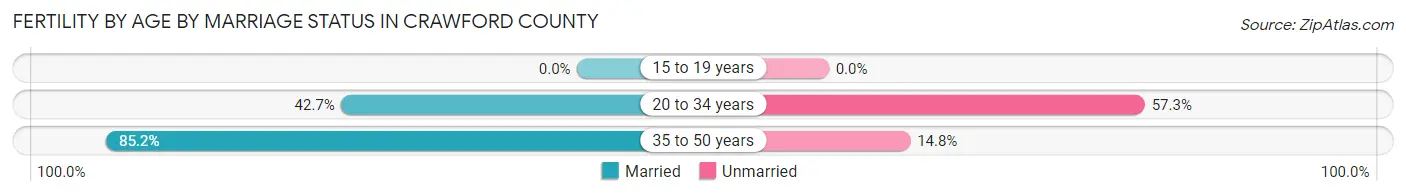
| Age Bracket | Married | Unmarried |
| 15 to 19 years | 0 (0.0%) | 0 (0.0%) |
| 20 to 34 years | 279 (42.7%) | 374 (57.3%) |
| 35 to 50 years | 150 (85.2%) | 26 (14.8%) |
| Total | 429 (51.7%) | 400 (48.2%) |
Fertility by Education in Crawford County
Average fertility rate in Crawford County is 60.0 births per 1,000 women. Women with the education attainment of high school diploma have the highest fertility rate of 92.0 births per 1,000 women, while women with the education attainment of graduate degree have the lowest fertility at 22.0 births per 1,000 women. Women with the education attainment of high school diploma represent 39.9% of all women with births.
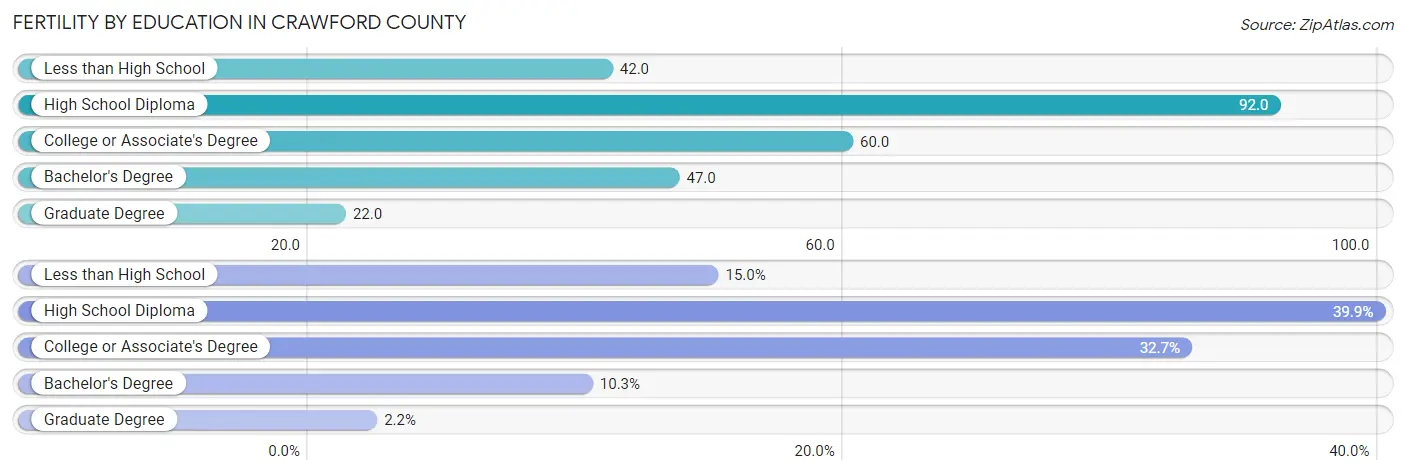
| Educational Attainment | Women with Births | Births / 1,000 Women |
| Less than High School | 124 (15.0%) | 42.0 |
| High School Diploma | 331 (39.9%) | 92.0 |
| College or Associate's Degree | 271 (32.7%) | 60.0 |
| Bachelor's Degree | 85 (10.2%) | 47.0 |
| Graduate Degree | 18 (2.2%) | 22.0 |
| Total | 829 (100.0%) | 60.0 |
Fertility by Education by Marriage Status in Crawford County
48.2% of women with births in Crawford County are unmarried. Women with the educational attainment of bachelor's degree are most likely to be married with 100.0% of them married at childbirth, while women with the educational attainment of college or associate's degree are least likely to be married with 65.3% of them unmarried at childbirth.
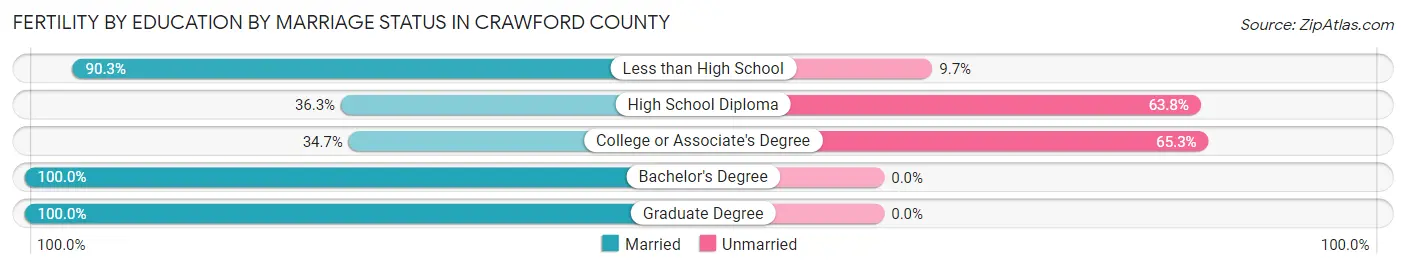
| Educational Attainment | Married | Unmarried |
| Less than High School | 112 (90.3%) | 12 (9.7%) |
| High School Diploma | 120 (36.2%) | 211 (63.7%) |
| College or Associate's Degree | 94 (34.7%) | 177 (65.3%) |
| Bachelor's Degree | 85 (100.0%) | 0 (0.0%) |
| Graduate Degree | 18 (100.0%) | 0 (0.0%) |
| Total | 429 (51.7%) | 400 (48.2%) |
Employment Characteristics in Crawford County
Employment by Class of Employer in Crawford County
Among the 24,303 employed individuals in Crawford County, private company employees (17,265 | 71.0%), not-for-profit organizations (1,526 | 6.3%), and self-employed (incorporated) (1,344 | 5.5%) make up the most common classes of employment.
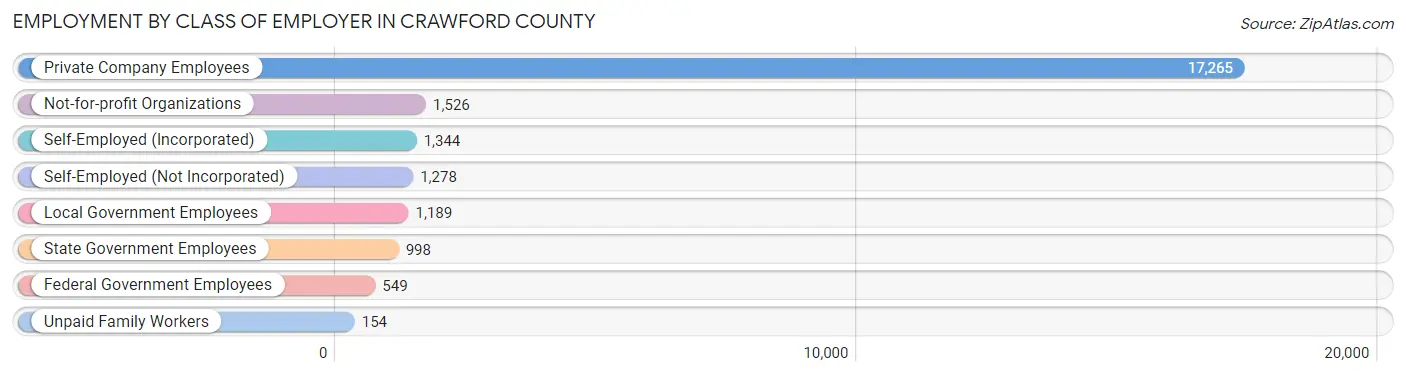
| Employer Class | # Employees | % Employees |
| Private Company Employees | 17,265 | 71.0% |
| Self-Employed (Incorporated) | 1,344 | 5.5% |
| Self-Employed (Not Incorporated) | 1,278 | 5.3% |
| Not-for-profit Organizations | 1,526 | 6.3% |
| Local Government Employees | 1,189 | 4.9% |
| State Government Employees | 998 | 4.1% |
| Federal Government Employees | 549 | 2.3% |
| Unpaid Family Workers | 154 | 0.6% |
| Total | 24,303 | 100.0% |
Employment Status by Age in Crawford County
According to the labor force statistics for Crawford County, out of the total population over 16 years of age (47,526), 55.0% or 26,139 individuals are in the labor force, with 5.3% or 1,385 of them unemployed. The age group with the highest labor force participation rate is 45 to 54 years, with 75.4% or 5,711 individuals in the labor force. Within the labor force, the 20 to 24 years age range has the highest percentage of unemployed individuals, with 11.5% or 286 of them being unemployed.
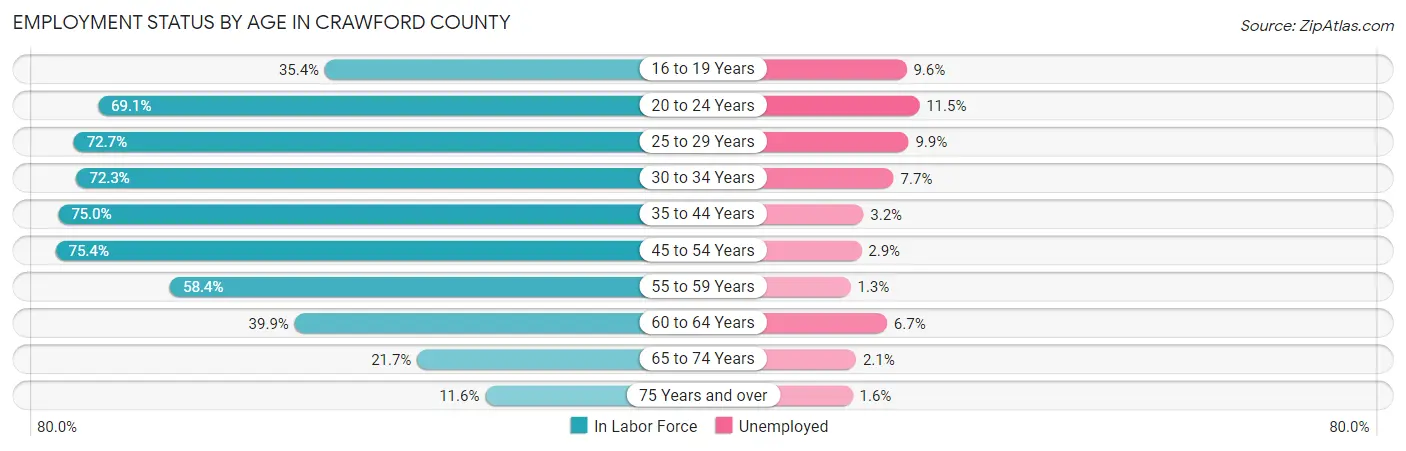
| Age Bracket | In Labor Force | Unemployed |
| 16 to 19 Years | 1,004 (35.4%) | 96 (9.6%) |
| 20 to 24 Years | 2,486 (69.1%) | 286 (11.5%) |
| 25 to 29 Years | 2,659 (72.7%) | 263 (9.9%) |
| 30 to 34 Years | 2,922 (72.3%) | 225 (7.7%) |
| 35 to 44 Years | 5,527 (75.0%) | 177 (3.2%) |
| 45 to 54 Years | 5,711 (75.4%) | 166 (2.9%) |
| 55 to 59 Years | 2,496 (58.4%) | 32 (1.3%) |
| 60 to 64 Years | 1,501 (39.9%) | 101 (6.7%) |
| 65 to 74 Years | 1,308 (21.7%) | 27 (2.1%) |
| 75 Years and over | 509 (11.6%) | 8 (1.6%) |
| Total | 26,139 (55.0%) | 1,385 (5.3%) |
Employment Status by Educational Attainment in Crawford County
According to labor force statistics for Crawford County, 67.9% of individuals (20,829) out of the total population between 25 and 64 years of age (30,676) are in the labor force, with 4.6% or 958 of them being unemployed. The group with the highest labor force participation rate are those with the educational attainment of bachelor's degree or higher, with 84.4% or 5,283 individuals in the labor force. Within the labor force, individuals with less than high school education have the highest percentage of unemployment, with 8.6% or 188 of them being unemployed.
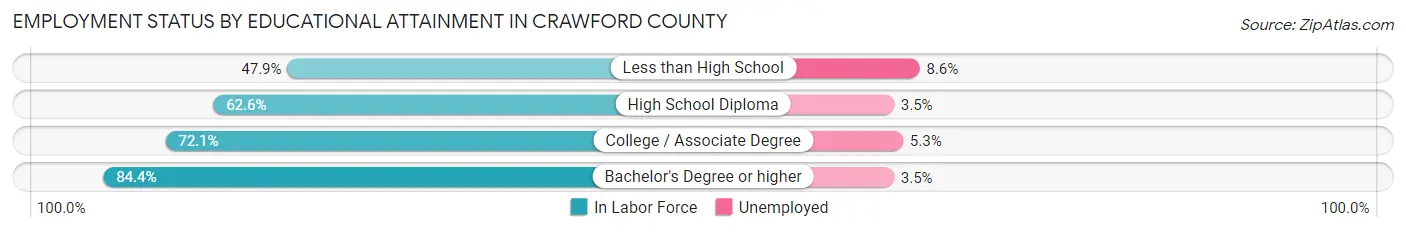
| Educational Attainment | In Labor Force | Unemployed |
| Less than High School | 2,189 (47.9%) | 393 (8.6%) |
| High School Diploma | 6,380 (62.6%) | 357 (3.5%) |
| College / Associate Degree | 6,963 (72.1%) | 512 (5.3%) |
| Bachelor's Degree or higher | 5,283 (84.4%) | 219 (3.5%) |
| Total | 20,829 (67.9%) | 1,411 (4.6%) |
Employment Occupations by Sex in Crawford County
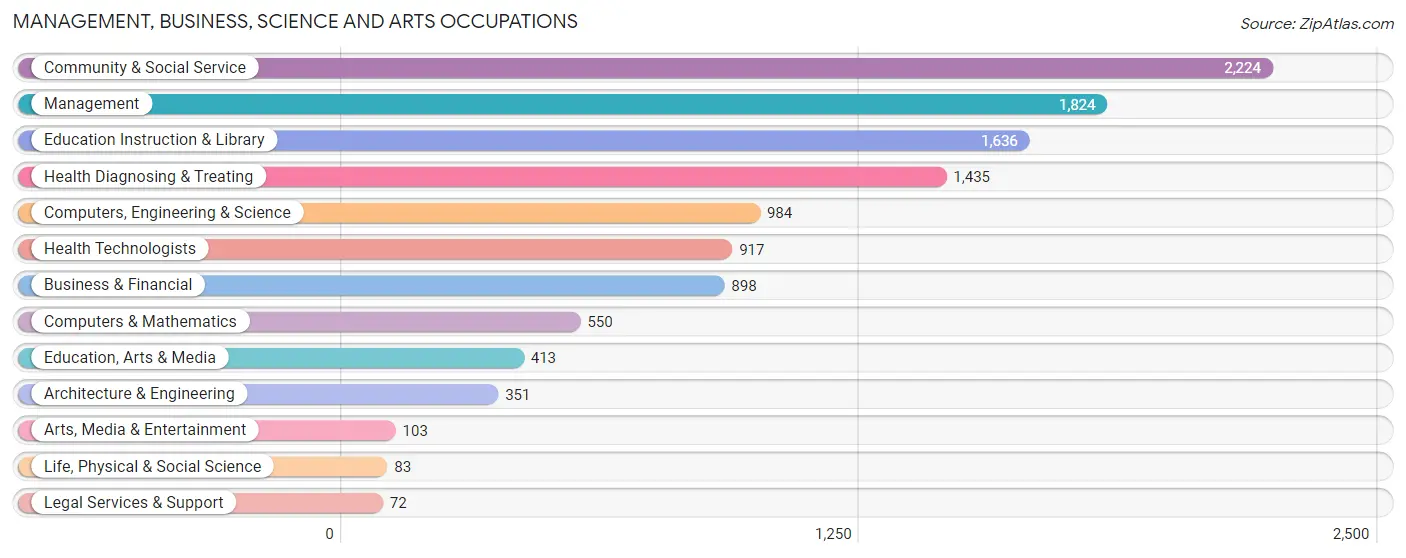
Management, Business, Science and Arts Occupations
The most common Management, Business, Science and Arts occupations in Crawford County are Community & Social Service (2,224 | 9.0%), Management (1,824 | 7.4%), Education Instruction & Library (1,636 | 6.6%), Health Diagnosing & Treating (1,435 | 5.8%), and Computers, Engineering & Science (984 | 4.0%).
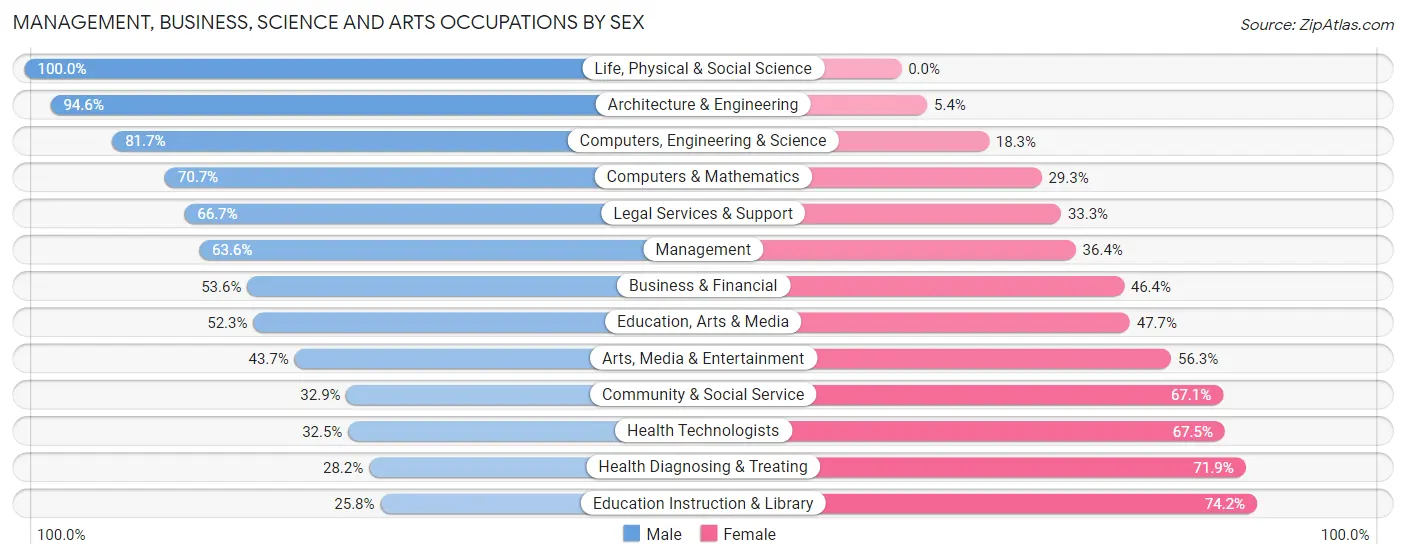
Management, Business, Science and Arts Occupations by Sex
Within the Management, Business, Science and Arts occupations in Crawford County, the most male-oriented occupations are Life, Physical & Social Science (100.0%), Architecture & Engineering (94.6%), and Computers, Engineering & Science (81.7%), while the most female-oriented occupations are Education Instruction & Library (74.2%), Health Diagnosing & Treating (71.9%), and Health Technologists (67.5%).
| Occupation | Male | Female |
| Management | 1,160 (63.6%) | 664 (36.4%) |
| Business & Financial | 481 (53.6%) | 417 (46.4%) |
| Computers, Engineering & Science | 804 (81.7%) | 180 (18.3%) |
| Computers & Mathematics | 389 (70.7%) | 161 (29.3%) |
| Architecture & Engineering | 332 (94.6%) | 19 (5.4%) |
| Life, Physical & Social Science | 83 (100.0%) | 0 (0.0%) |
| Community & Social Service | 731 (32.9%) | 1,493 (67.1%) |
| Education, Arts & Media | 216 (52.3%) | 197 (47.7%) |
| Legal Services & Support | 48 (66.7%) | 24 (33.3%) |
| Education Instruction & Library | 422 (25.8%) | 1,214 (74.2%) |
| Arts, Media & Entertainment | 45 (43.7%) | 58 (56.3%) |
| Health Diagnosing & Treating | 404 (28.1%) | 1,031 (71.9%) |
| Health Technologists | 298 (32.5%) | 619 (67.5%) |
| Total (Category) | 3,580 (48.6%) | 3,785 (51.4%) |
| Total (Overall) | 13,524 (54.9%) | 11,113 (45.1%) |
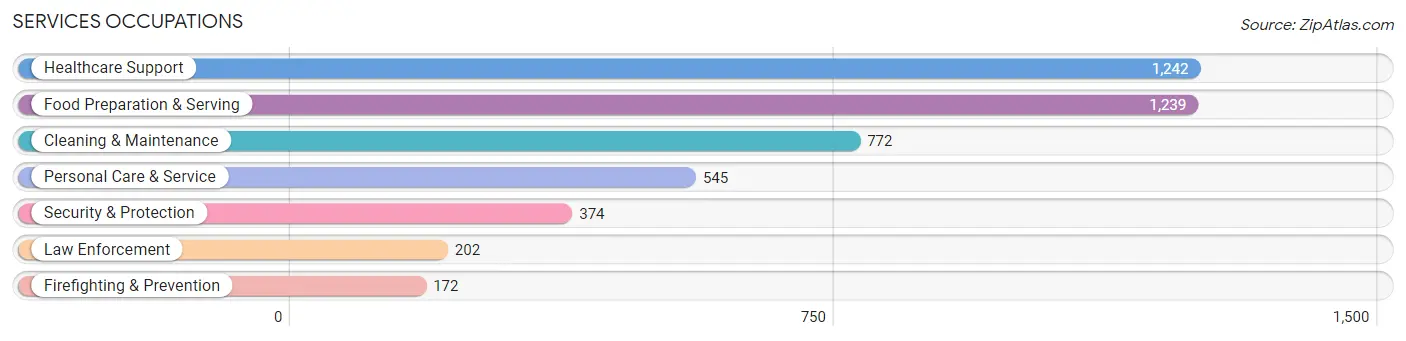
Services Occupations
The most common Services occupations in Crawford County are Healthcare Support (1,242 | 5.0%), Food Preparation & Serving (1,239 | 5.0%), Cleaning & Maintenance (772 | 3.1%), Personal Care & Service (545 | 2.2%), and Security & Protection (374 | 1.5%).
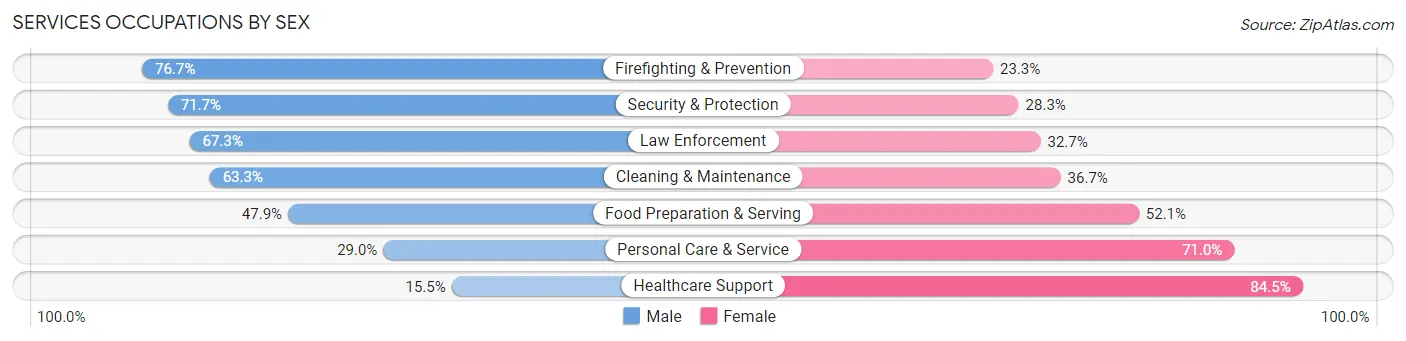
Services Occupations by Sex
Within the Services occupations in Crawford County, the most male-oriented occupations are Firefighting & Prevention (76.7%), Security & Protection (71.7%), and Law Enforcement (67.3%), while the most female-oriented occupations are Healthcare Support (84.5%), Personal Care & Service (71.0%), and Food Preparation & Serving (52.1%).
| Occupation | Male | Female |
| Healthcare Support | 192 (15.5%) | 1,050 (84.5%) |
| Security & Protection | 268 (71.7%) | 106 (28.3%) |
| Firefighting & Prevention | 132 (76.7%) | 40 (23.3%) |
| Law Enforcement | 136 (67.3%) | 66 (32.7%) |
| Food Preparation & Serving | 593 (47.9%) | 646 (52.1%) |
| Cleaning & Maintenance | 489 (63.3%) | 283 (36.7%) |
| Personal Care & Service | 158 (29.0%) | 387 (71.0%) |
| Total (Category) | 1,700 (40.7%) | 2,472 (59.3%) |
| Total (Overall) | 13,524 (54.9%) | 11,113 (45.1%) |
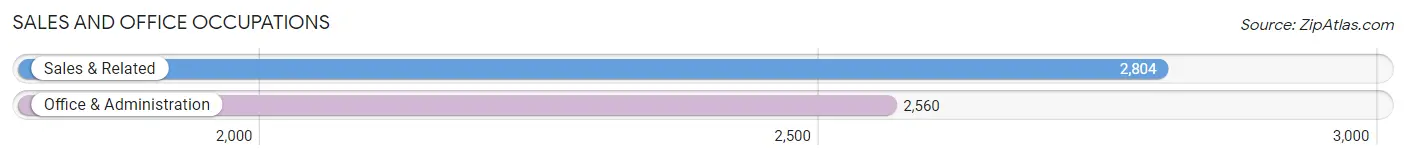
Sales and Office Occupations
The most common Sales and Office occupations in Crawford County are Sales & Related (2,804 | 11.4%), and Office & Administration (2,560 | 10.4%).
Sales and Office Occupations by Sex
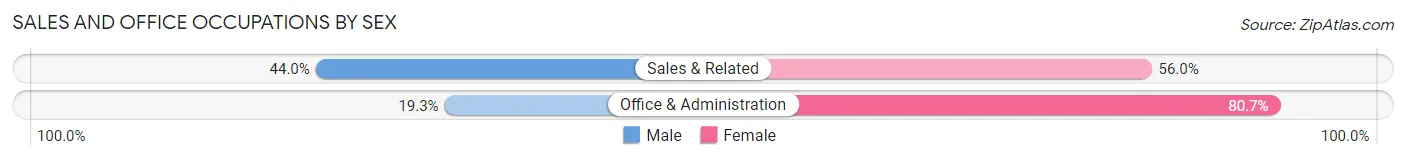
| Occupation | Male | Female |
| Sales & Related | 1,235 (44.0%) | 1,569 (56.0%) |
| Office & Administration | 493 (19.3%) | 2,067 (80.7%) |
| Total (Category) | 1,728 (32.2%) | 3,636 (67.8%) |
| Total (Overall) | 13,524 (54.9%) | 11,113 (45.1%) |
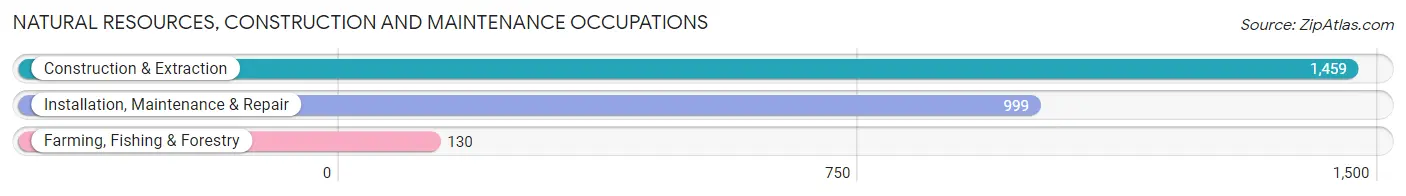
Natural Resources, Construction and Maintenance Occupations
The most common Natural Resources, Construction and Maintenance occupations in Crawford County are Construction & Extraction (1,459 | 5.9%), Installation, Maintenance & Repair (999 | 4.1%), and Farming, Fishing & Forestry (130 | 0.5%).
Natural Resources, Construction and Maintenance Occupations by Sex
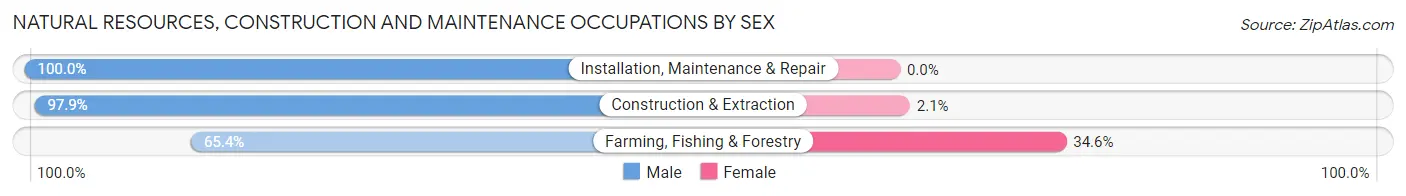
| Occupation | Male | Female |
| Farming, Fishing & Forestry | 85 (65.4%) | 45 (34.6%) |
| Construction & Extraction | 1,429 (97.9%) | 30 (2.1%) |
| Installation, Maintenance & Repair | 999 (100.0%) | 0 (0.0%) |
| Total (Category) | 2,513 (97.1%) | 75 (2.9%) |
| Total (Overall) | 13,524 (54.9%) | 11,113 (45.1%) |
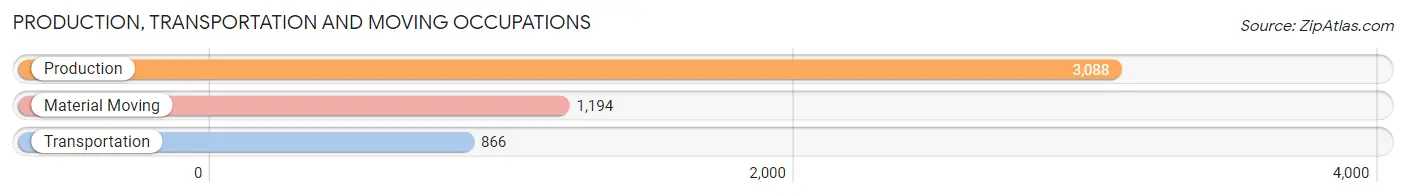
Production, Transportation and Moving Occupations
The most common Production, Transportation and Moving occupations in Crawford County are Production (3,088 | 12.5%), Material Moving (1,194 | 4.9%), and Transportation (866 | 3.5%).
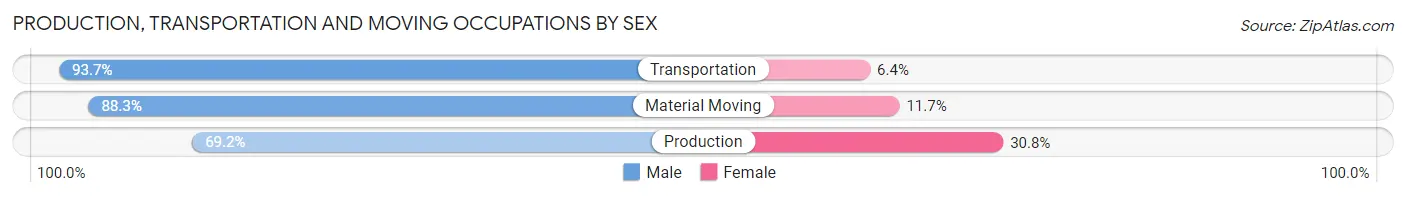
Production, Transportation and Moving Occupations by Sex
| Occupation | Male | Female |
| Production | 2,138 (69.2%) | 950 (30.8%) |
| Transportation | 811 (93.6%) | 55 (6.4%) |
| Material Moving | 1,054 (88.3%) | 140 (11.7%) |
| Total (Category) | 4,003 (77.8%) | 1,145 (22.2%) |
| Total (Overall) | 13,524 (54.9%) | 11,113 (45.1%) |
Employment Industries by Sex in Crawford County
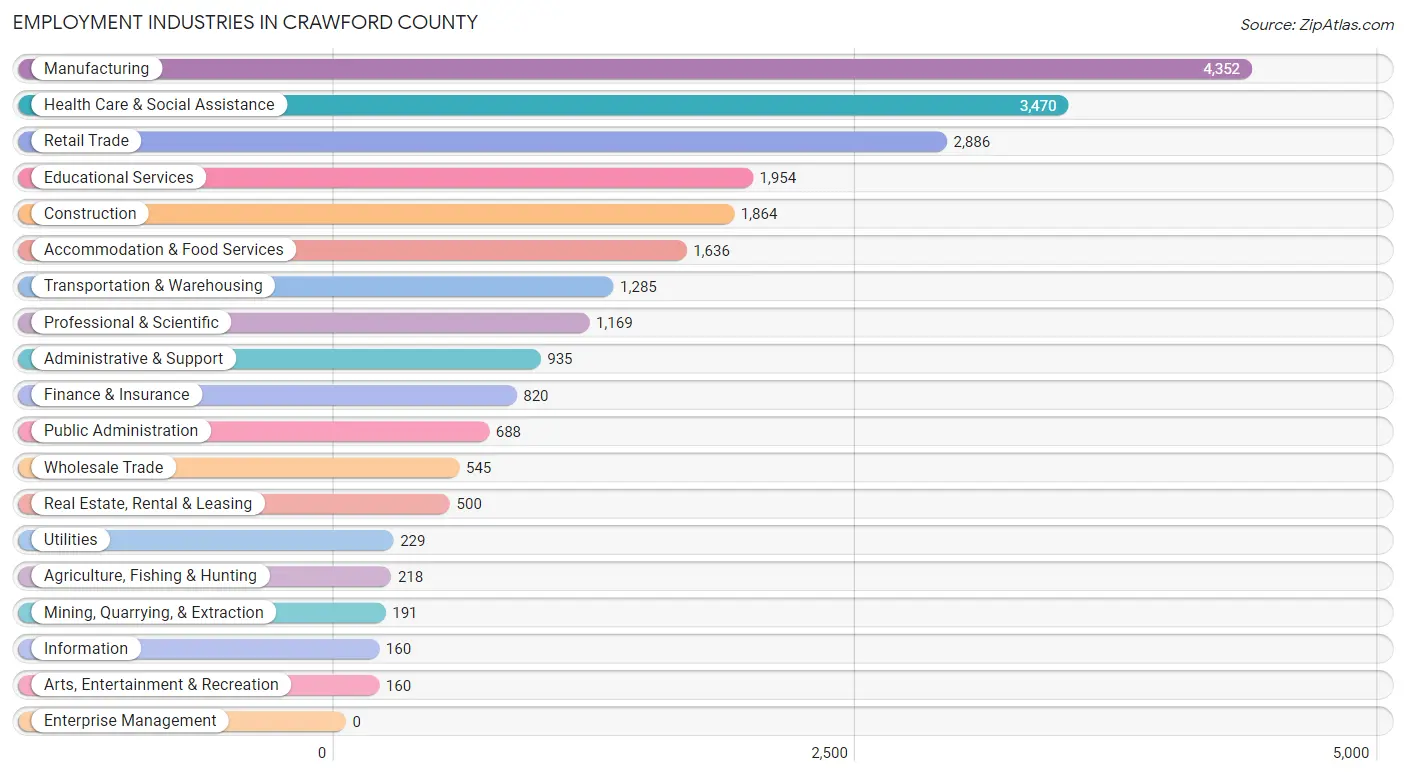
Employment Industries in Crawford County
The major employment industries in Crawford County include Manufacturing (4,352 | 17.7%), Health Care & Social Assistance (3,470 | 14.1%), Retail Trade (2,886 | 11.7%), Educational Services (1,954 | 7.9%), and Construction (1,864 | 7.6%).
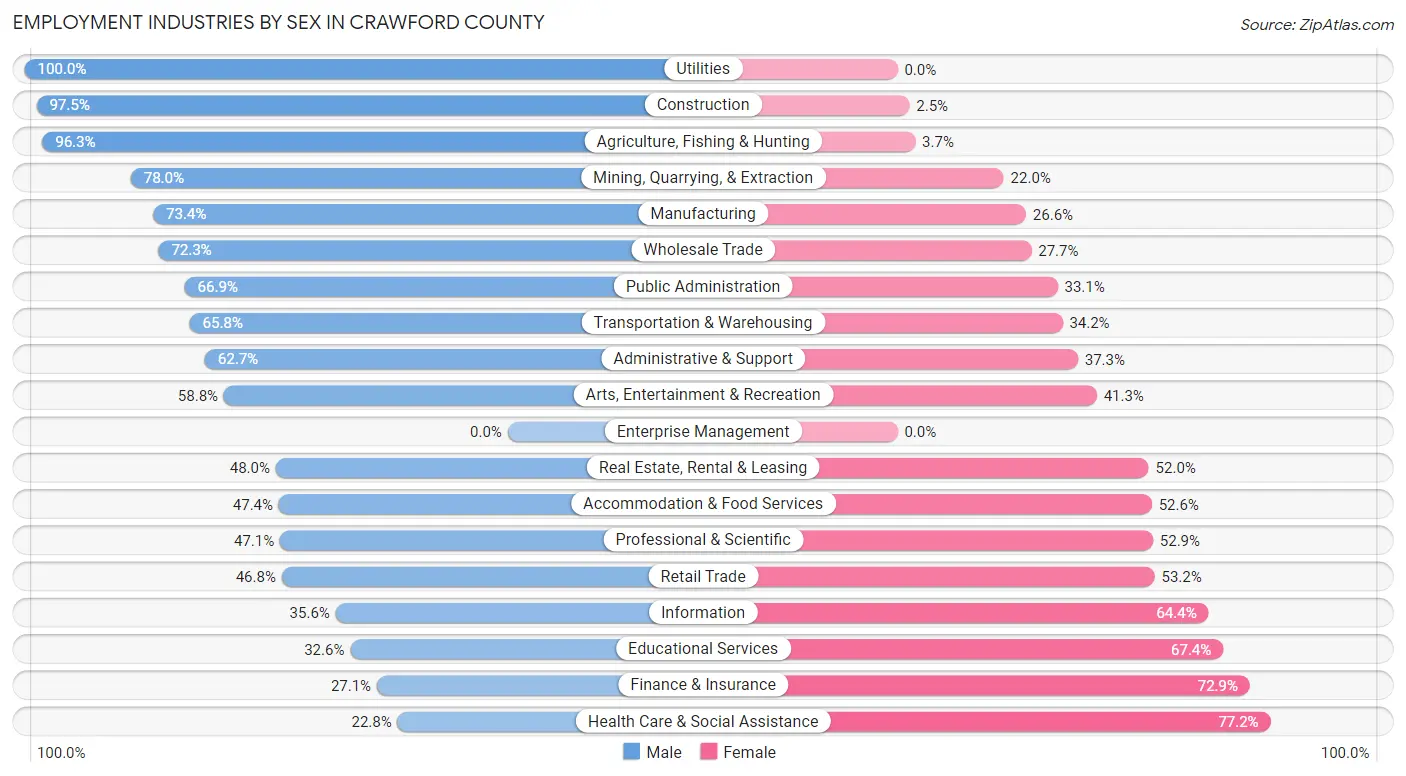
Employment Industries by Sex in Crawford County
The Crawford County industries that see more men than women are Utilities (100.0%), Construction (97.5%), and Agriculture, Fishing & Hunting (96.3%), whereas the industries that tend to have a higher number of women are Health Care & Social Assistance (77.2%), Finance & Insurance (72.9%), and Educational Services (67.4%).
| Industry | Male | Female |
| Agriculture, Fishing & Hunting | 210 (96.3%) | 8 (3.7%) |
| Mining, Quarrying, & Extraction | 149 (78.0%) | 42 (22.0%) |
| Construction | 1,818 (97.5%) | 46 (2.5%) |
| Manufacturing | 3,195 (73.4%) | 1,157 (26.6%) |
| Wholesale Trade | 394 (72.3%) | 151 (27.7%) |
| Retail Trade | 1,350 (46.8%) | 1,536 (53.2%) |
| Transportation & Warehousing | 846 (65.8%) | 439 (34.2%) |
| Utilities | 229 (100.0%) | 0 (0.0%) |
| Information | 57 (35.6%) | 103 (64.4%) |
| Finance & Insurance | 222 (27.1%) | 598 (72.9%) |
| Real Estate, Rental & Leasing | 240 (48.0%) | 260 (52.0%) |
| Professional & Scientific | 551 (47.1%) | 618 (52.9%) |
| Enterprise Management | 0 (0.0%) | 0 (0.0%) |
| Administrative & Support | 586 (62.7%) | 349 (37.3%) |
| Educational Services | 637 (32.6%) | 1,317 (67.4%) |
| Health Care & Social Assistance | 791 (22.8%) | 2,679 (77.2%) |
| Arts, Entertainment & Recreation | 94 (58.8%) | 66 (41.2%) |
| Accommodation & Food Services | 775 (47.4%) | 861 (52.6%) |
| Public Administration | 460 (66.9%) | 228 (33.1%) |
| Total | 13,524 (54.9%) | 11,113 (45.1%) |
Education in Crawford County
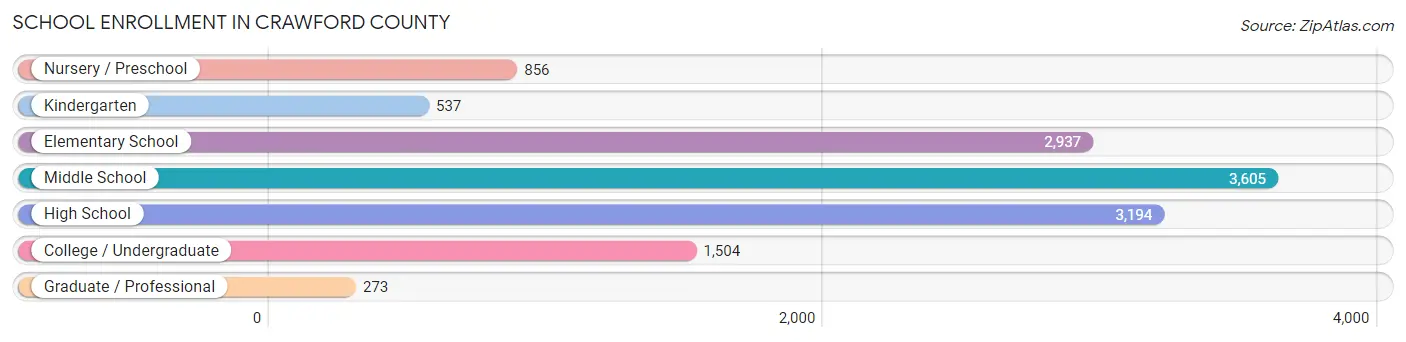
School Enrollment in Crawford County
The most common levels of schooling among the 12,906 students in Crawford County are middle school (3,605 | 27.9%), high school (3,194 | 24.7%), and elementary school (2,937 | 22.8%).
| School Level | # Students | % Students |
| Nursery / Preschool | 856 | 6.6% |
| Kindergarten | 537 | 4.2% |
| Elementary School | 2,937 | 22.8% |
| Middle School | 3,605 | 27.9% |
| High School | 3,194 | 24.7% |
| College / Undergraduate | 1,504 | 11.7% |
| Graduate / Professional | 273 | 2.1% |
| Total | 12,906 | 100.0% |
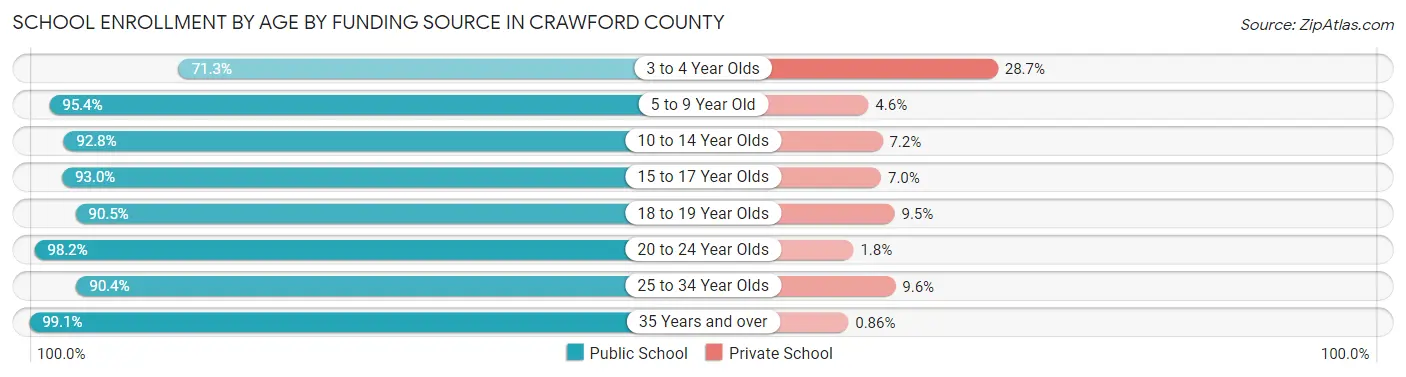
School Enrollment by Age by Funding Source in Crawford County
Out of a total of 12,906 students who are enrolled in schools in Crawford County, 942 (7.3%) attend a private institution, while the remaining 11,964 (92.7%) are enrolled in public schools. The age group of 3 to 4 year olds has the highest likelihood of being enrolled in private schools, with 178 (28.7% in the age bracket) enrolled. Conversely, the age group of 35 years and over has the lowest likelihood of being enrolled in a private school, with 230 (99.1% in the age bracket) attending a public institution.
| Age Bracket | Public School | Private School |
| 3 to 4 Year Olds | 442 (71.3%) | 178 (28.7%) |
| 5 to 9 Year Old | 3,230 (95.4%) | 156 (4.6%) |
| 10 to 14 Year Olds | 3,822 (92.8%) | 298 (7.2%) |
| 15 to 17 Year Olds | 2,327 (93.0%) | 174 (7.0%) |
| 18 to 19 Year Olds | 813 (90.5%) | 85 (9.5%) |
| 20 to 24 Year Olds | 700 (98.2%) | 13 (1.8%) |
| 25 to 34 Year Olds | 394 (90.4%) | 42 (9.6%) |
| 35 Years and over | 230 (99.1%) | 2 (0.9%) |
| Total | 11,964 (92.7%) | 942 (7.3%) |
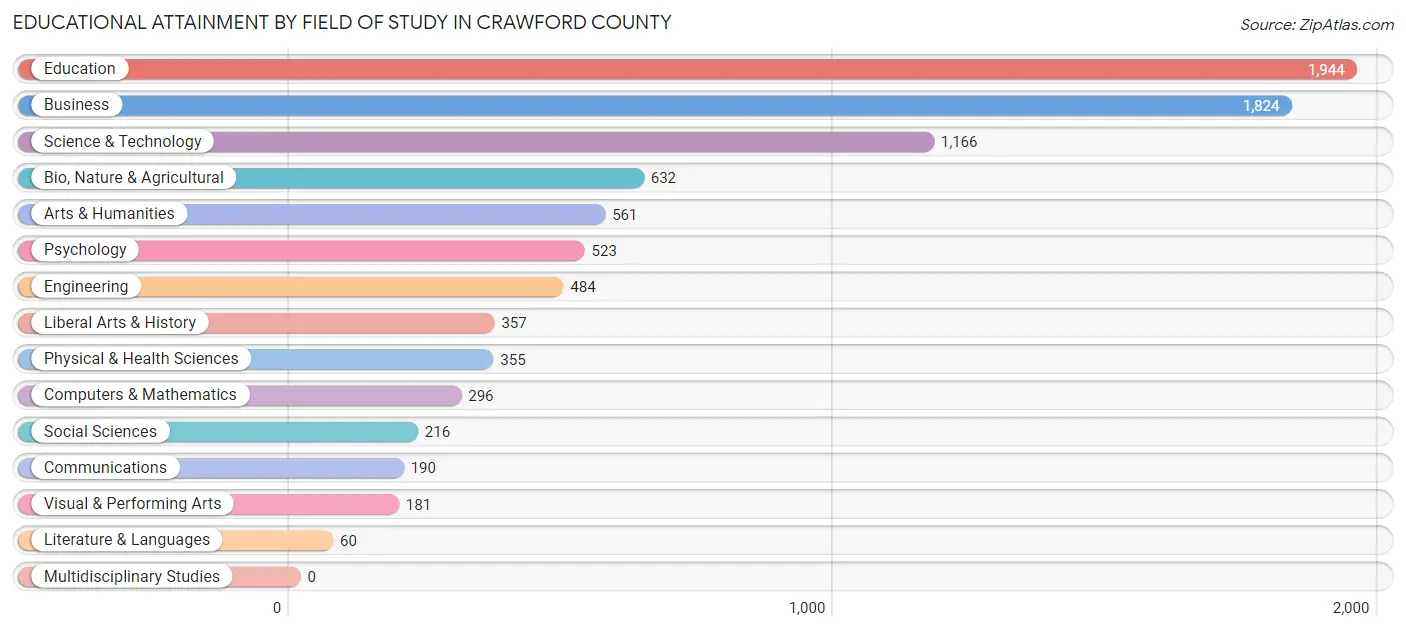
Educational Attainment by Field of Study in Crawford County
Education (1,944 | 22.1%), business (1,824 | 20.7%), science & technology (1,166 | 13.3%), bio, nature & agricultural (632 | 7.2%), and arts & humanities (561 | 6.4%) are the most common fields of study among 8,789 individuals in Crawford County who have obtained a bachelor's degree or higher.
| Field of Study | # Graduates | % Graduates |
| Computers & Mathematics | 296 | 3.4% |
| Bio, Nature & Agricultural | 632 | 7.2% |
| Physical & Health Sciences | 355 | 4.0% |
| Psychology | 523 | 5.9% |
| Social Sciences | 216 | 2.5% |
| Engineering | 484 | 5.5% |
| Multidisciplinary Studies | 0 | 0.0% |
| Science & Technology | 1,166 | 13.3% |
| Business | 1,824 | 20.7% |
| Education | 1,944 | 22.1% |
| Literature & Languages | 60 | 0.7% |
| Liberal Arts & History | 357 | 4.1% |
| Visual & Performing Arts | 181 | 2.1% |
| Communications | 190 | 2.2% |
| Arts & Humanities | 561 | 6.4% |
| Total | 8,789 | 100.0% |
Transportation & Commute in Crawford County
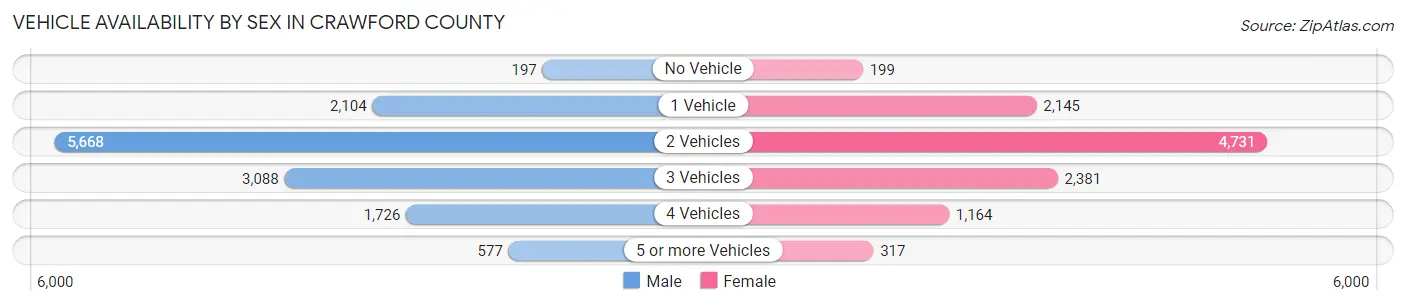
Vehicle Availability by Sex in Crawford County
The most prevalent vehicle ownership categories in Crawford County are males with 2 vehicles (5,668, accounting for 42.4%) and females with 2 vehicles (4,731, making up 51.8%).
| Vehicles Available | Male | Female |
| No Vehicle | 197 (1.5%) | 199 (1.8%) |
| 1 Vehicle | 2,104 (15.8%) | 2,145 (19.6%) |
| 2 Vehicles | 5,668 (42.4%) | 4,731 (43.3%) |
| 3 Vehicles | 3,088 (23.1%) | 2,381 (21.8%) |
| 4 Vehicles | 1,726 (12.9%) | 1,164 (10.6%) |
| 5 or more Vehicles | 577 (4.3%) | 317 (2.9%) |
| Total | 13,360 (100.0%) | 10,937 (100.0%) |
Commute Time in Crawford County
The most frequently occuring commute durations in Crawford County are 20 to 24 minutes (4,813 commuters, 20.7%), 15 to 19 minutes (3,486 commuters, 15.0%), and 10 to 14 minutes (3,253 commuters, 14.0%).
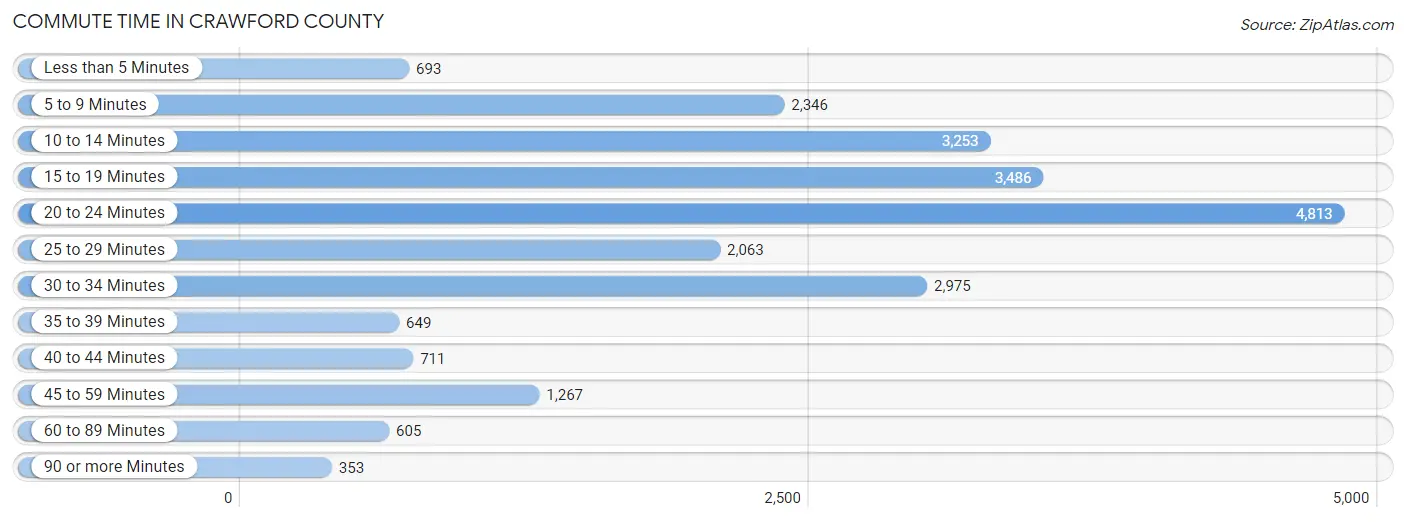
| Commute Time | # Commuters | % Commuters |
| Less than 5 Minutes | 693 | 3.0% |
| 5 to 9 Minutes | 2,346 | 10.1% |
| 10 to 14 Minutes | 3,253 | 14.0% |
| 15 to 19 Minutes | 3,486 | 15.0% |
| 20 to 24 Minutes | 4,813 | 20.7% |
| 25 to 29 Minutes | 2,063 | 8.9% |
| 30 to 34 Minutes | 2,975 | 12.8% |
| 35 to 39 Minutes | 649 | 2.8% |
| 40 to 44 Minutes | 711 | 3.1% |
| 45 to 59 Minutes | 1,267 | 5.5% |
| 60 to 89 Minutes | 605 | 2.6% |
| 90 or more Minutes | 353 | 1.5% |
Commute Time by Sex in Crawford County
The most common commute times in Crawford County are 20 to 24 minutes (2,302 commuters, 18.0%) for males and 20 to 24 minutes (2,511 commuters, 24.0%) for females.
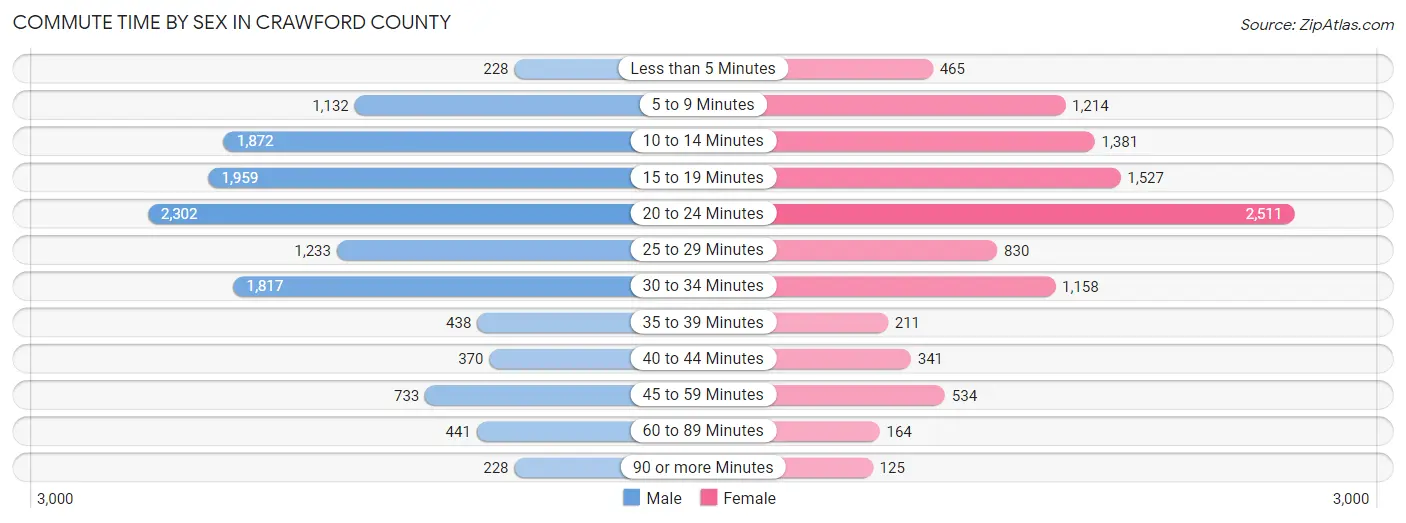
| Commute Time | Male | Female |
| Less than 5 Minutes | 228 (1.8%) | 465 (4.4%) |
| 5 to 9 Minutes | 1,132 (8.9%) | 1,214 (11.6%) |
| 10 to 14 Minutes | 1,872 (14.7%) | 1,381 (13.2%) |
| 15 to 19 Minutes | 1,959 (15.4%) | 1,527 (14.6%) |
| 20 to 24 Minutes | 2,302 (18.0%) | 2,511 (24.0%) |
| 25 to 29 Minutes | 1,233 (9.7%) | 830 (7.9%) |
| 30 to 34 Minutes | 1,817 (14.2%) | 1,158 (11.1%) |
| 35 to 39 Minutes | 438 (3.4%) | 211 (2.0%) |
| 40 to 44 Minutes | 370 (2.9%) | 341 (3.3%) |
| 45 to 59 Minutes | 733 (5.8%) | 534 (5.1%) |
| 60 to 89 Minutes | 441 (3.5%) | 164 (1.6%) |
| 90 or more Minutes | 228 (1.8%) | 125 (1.2%) |
Time of Departure to Work by Sex in Crawford County
The most frequent times of departure to work in Crawford County are 7:00 AM to 7:29 AM (2,172, 17.0%) for males and 7:00 AM to 7:29 AM (1,965, 18.8%) for females.
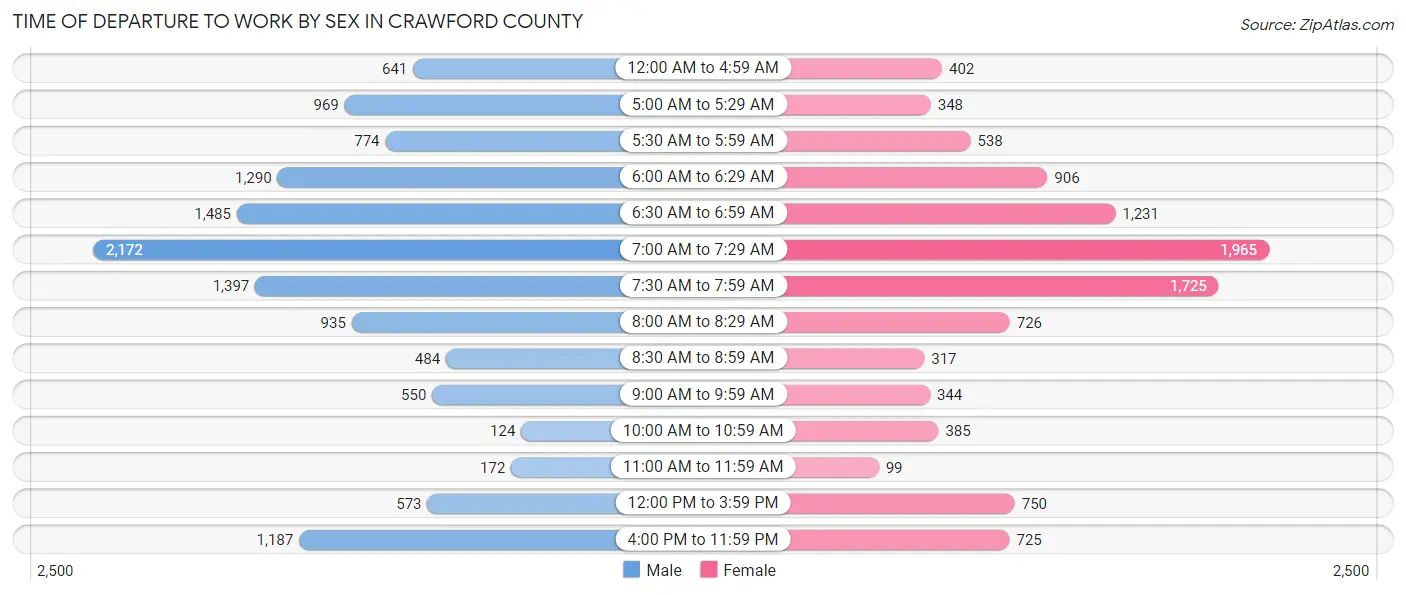
| Time of Departure | Male | Female |
| 12:00 AM to 4:59 AM | 641 (5.0%) | 402 (3.8%) |
| 5:00 AM to 5:29 AM | 969 (7.6%) | 348 (3.3%) |
| 5:30 AM to 5:59 AM | 774 (6.1%) | 538 (5.1%) |
| 6:00 AM to 6:29 AM | 1,290 (10.1%) | 906 (8.7%) |
| 6:30 AM to 6:59 AM | 1,485 (11.6%) | 1,231 (11.8%) |
| 7:00 AM to 7:29 AM | 2,172 (17.0%) | 1,965 (18.8%) |
| 7:30 AM to 7:59 AM | 1,397 (11.0%) | 1,725 (16.5%) |
| 8:00 AM to 8:29 AM | 935 (7.3%) | 726 (6.9%) |
| 8:30 AM to 8:59 AM | 484 (3.8%) | 317 (3.0%) |
| 9:00 AM to 9:59 AM | 550 (4.3%) | 344 (3.3%) |
| 10:00 AM to 10:59 AM | 124 (1.0%) | 385 (3.7%) |
| 11:00 AM to 11:59 AM | 172 (1.3%) | 99 (0.9%) |
| 12:00 PM to 3:59 PM | 573 (4.5%) | 750 (7.2%) |
| 4:00 PM to 11:59 PM | 1,187 (9.3%) | 725 (6.9%) |
| Total | 12,753 (100.0%) | 10,461 (100.0%) |
Housing Occupancy in Crawford County
Occupancy by Ownership in Crawford County
Of the total 22,731 dwellings in Crawford County, owner-occupied units account for 17,171 (75.5%), while renter-occupied units make up 5,560 (24.5%).
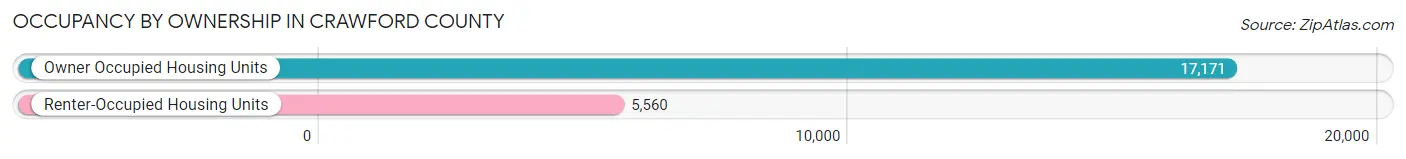
| Occupancy | # Housing Units | % Housing Units |
| Owner Occupied Housing Units | 17,171 | 75.5% |
| Renter-Occupied Housing Units | 5,560 | 24.5% |
| Total Occupied Housing Units | 22,731 | 100.0% |
Occupancy by Household Size in Crawford County
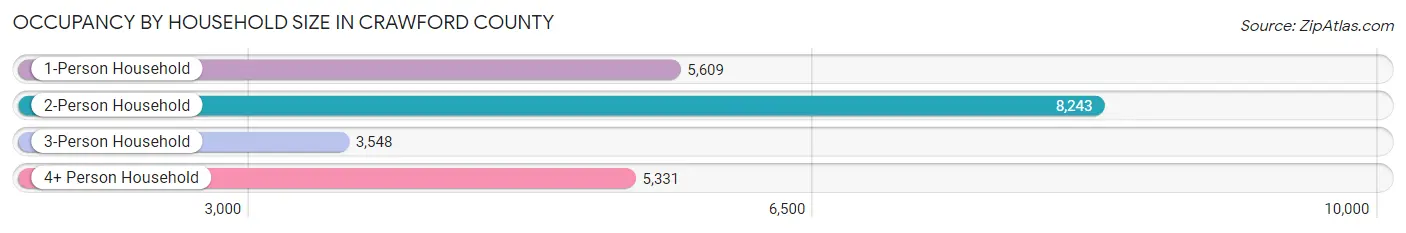
| Household Size | # Housing Units | % Housing Units |
| 1-Person Household | 5,609 | 24.7% |
| 2-Person Household | 8,243 | 36.3% |
| 3-Person Household | 3,548 | 15.6% |
| 4+ Person Household | 5,331 | 23.4% |
| Total Housing Units | 22,731 | 100.0% |
Occupancy by Ownership by Household Size in Crawford County
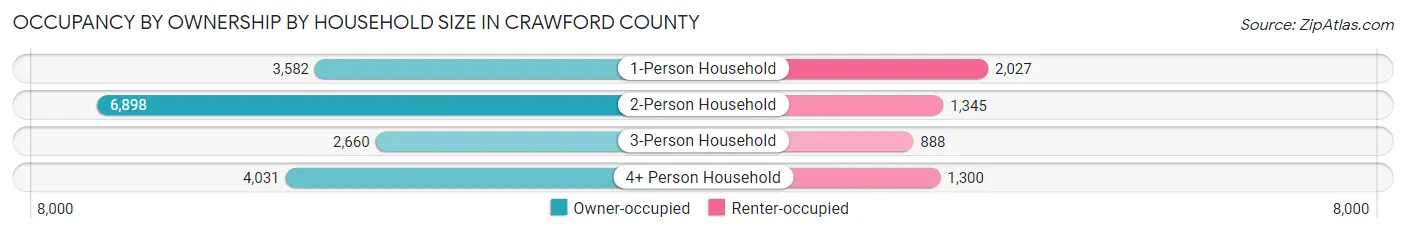
| Household Size | Owner-occupied | Renter-occupied |
| 1-Person Household | 3,582 (63.9%) | 2,027 (36.1%) |
| 2-Person Household | 6,898 (83.7%) | 1,345 (16.3%) |
| 3-Person Household | 2,660 (75.0%) | 888 (25.0%) |
| 4+ Person Household | 4,031 (75.6%) | 1,300 (24.4%) |
| Total Housing Units | 17,171 (75.5%) | 5,560 (24.5%) |
Occupancy by Educational Attainment in Crawford County
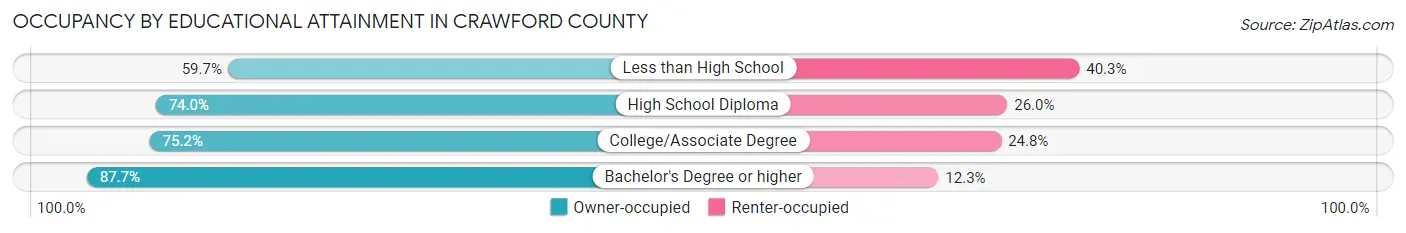
| Household Size | Owner-occupied | Renter-occupied |
| Less than High School | 1,835 (59.7%) | 1,237 (40.3%) |
| High School Diploma | 5,583 (74.0%) | 1,962 (26.0%) |
| College/Associate Degree | 5,233 (75.2%) | 1,725 (24.8%) |
| Bachelor's Degree or higher | 4,520 (87.7%) | 636 (12.3%) |
Occupancy by Age of Householder in Crawford County
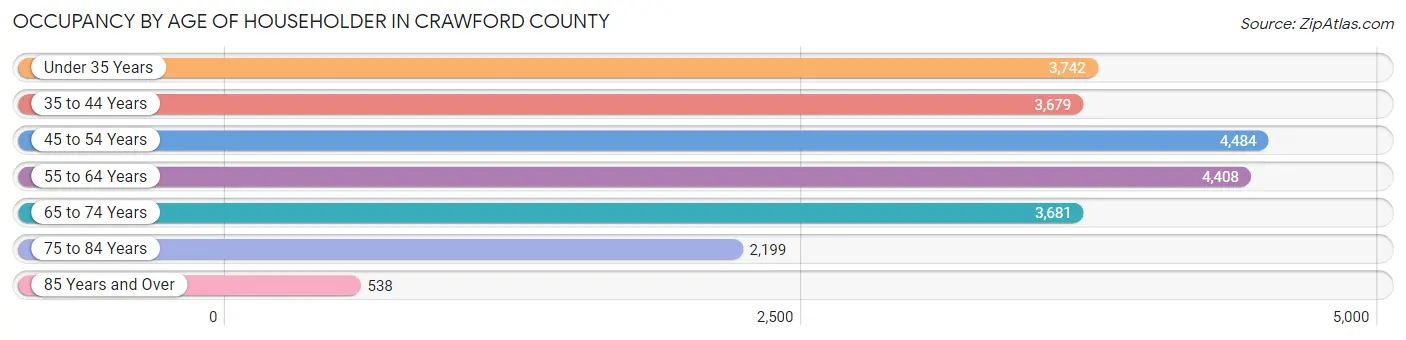
| Age Bracket | # Households | % Households |
| Under 35 Years | 3,742 | 16.5% |
| 35 to 44 Years | 3,679 | 16.2% |
| 45 to 54 Years | 4,484 | 19.7% |
| 55 to 64 Years | 4,408 | 19.4% |
| 65 to 74 Years | 3,681 | 16.2% |
| 75 to 84 Years | 2,199 | 9.7% |
| 85 Years and Over | 538 | 2.4% |
| Total | 22,731 | 100.0% |
Housing Finances in Crawford County
Median Income by Occupancy in Crawford County
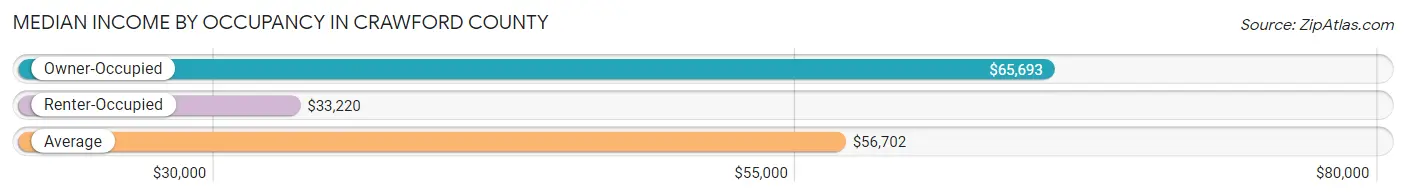
| Occupancy Type | # Households | Median Income |
| Owner-Occupied | 17,171 (75.5%) | $65,693 |
| Renter-Occupied | 5,560 (24.5%) | $33,220 |
| Average | 22,731 (100.0%) | $56,702 |
Occupancy by Householder Income Bracket in Crawford County
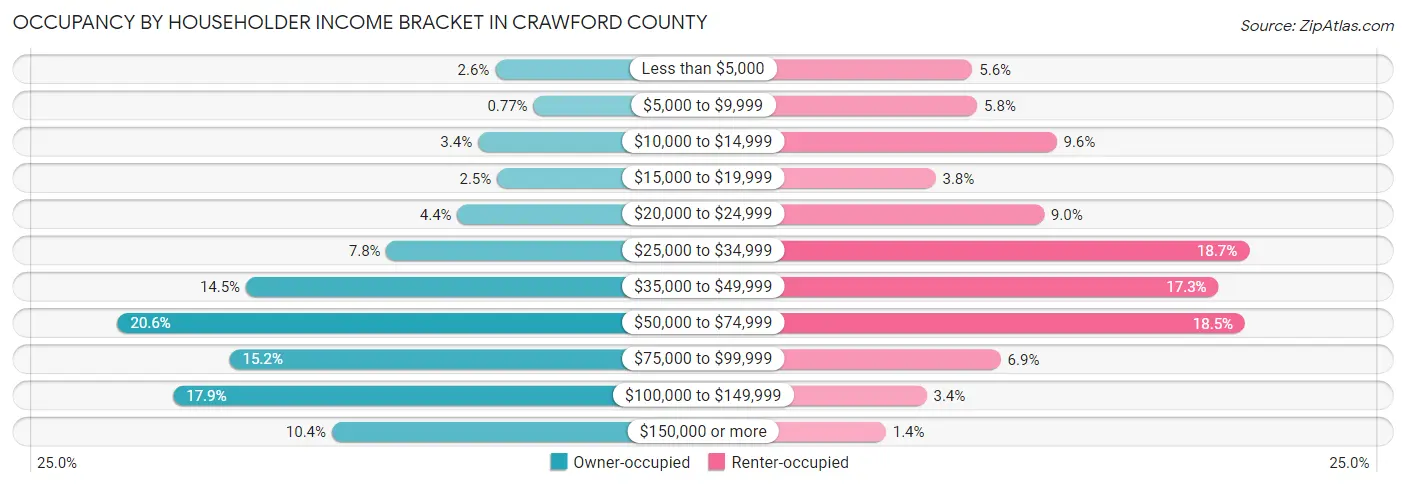
| Income Bracket | Owner-occupied | Renter-occupied |
| Less than $5,000 | 445 (2.6%) | 309 (5.6%) |
| $5,000 to $9,999 | 132 (0.8%) | 322 (5.8%) |
| $10,000 to $14,999 | 586 (3.4%) | 532 (9.6%) |
| $15,000 to $19,999 | 430 (2.5%) | 212 (3.8%) |
| $20,000 to $24,999 | 753 (4.4%) | 499 (9.0%) |
| $25,000 to $34,999 | 1,334 (7.8%) | 1,042 (18.7%) |
| $35,000 to $49,999 | 2,483 (14.5%) | 961 (17.3%) |
| $50,000 to $74,999 | 3,533 (20.6%) | 1,031 (18.5%) |
| $75,000 to $99,999 | 2,617 (15.2%) | 384 (6.9%) |
| $100,000 to $149,999 | 3,077 (17.9%) | 188 (3.4%) |
| $150,000 or more | 1,781 (10.4%) | 80 (1.4%) |
| Total | 17,171 (100.0%) | 5,560 (100.0%) |
Monthly Housing Cost Tiers in Crawford County
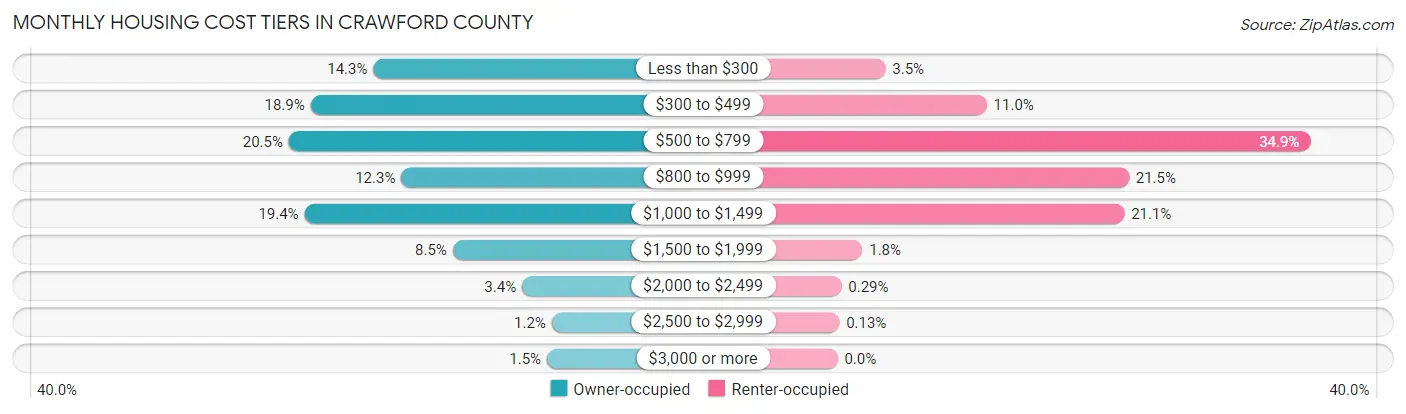
| Monthly Cost | Owner-occupied | Renter-occupied |
| Less than $300 | 2,459 (14.3%) | 196 (3.5%) |
| $300 to $499 | 3,252 (18.9%) | 611 (11.0%) |
| $500 to $799 | 3,527 (20.5%) | 1,940 (34.9%) |
| $800 to $999 | 2,106 (12.3%) | 1,193 (21.5%) |
| $1,000 to $1,499 | 3,329 (19.4%) | 1,174 (21.1%) |
| $1,500 to $1,999 | 1,455 (8.5%) | 102 (1.8%) |
| $2,000 to $2,499 | 578 (3.4%) | 16 (0.3%) |
| $2,500 to $2,999 | 203 (1.2%) | 7 (0.1%) |
| $3,000 or more | 262 (1.5%) | 0 (0.0%) |
| Total | 17,171 (100.0%) | 5,560 (100.0%) |
Physical Housing Characteristics in Crawford County
Housing Structures in Crawford County
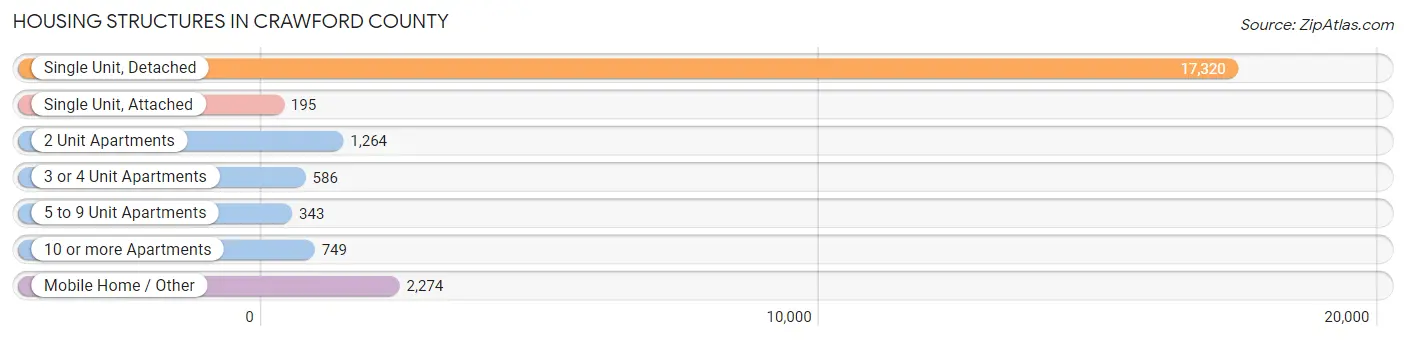
| Structure Type | # Housing Units | % Housing Units |
| Single Unit, Detached | 17,320 | 76.2% |
| Single Unit, Attached | 195 | 0.9% |
| 2 Unit Apartments | 1,264 | 5.6% |
| 3 or 4 Unit Apartments | 586 | 2.6% |
| 5 to 9 Unit Apartments | 343 | 1.5% |
| 10 or more Apartments | 749 | 3.3% |
| Mobile Home / Other | 2,274 | 10.0% |
| Total | 22,731 | 100.0% |
Housing Structures by Occupancy in Crawford County
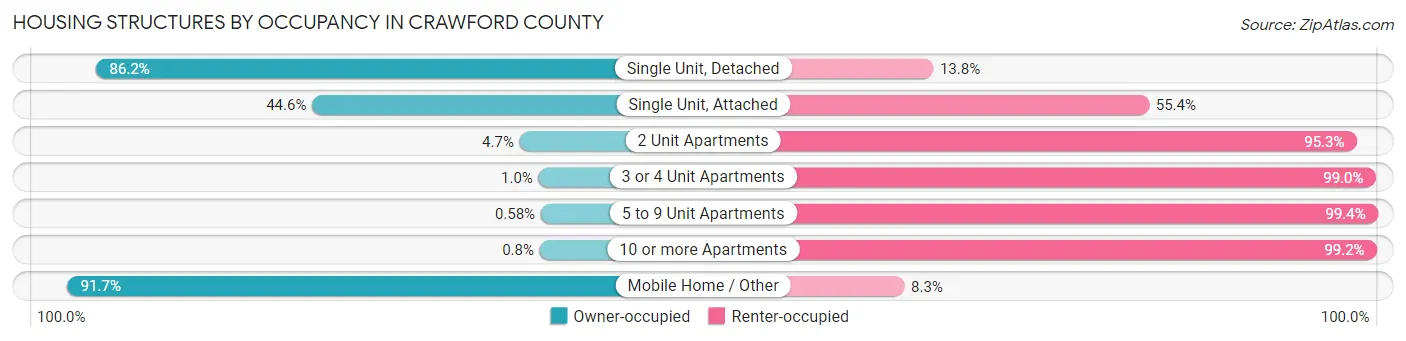
| Structure Type | Owner-occupied | Renter-occupied |
| Single Unit, Detached | 14,925 (86.2%) | 2,395 (13.8%) |
| Single Unit, Attached | 87 (44.6%) | 108 (55.4%) |
| 2 Unit Apartments | 59 (4.7%) | 1,205 (95.3%) |
| 3 or 4 Unit Apartments | 6 (1.0%) | 580 (99.0%) |
| 5 to 9 Unit Apartments | 2 (0.6%) | 341 (99.4%) |
| 10 or more Apartments | 6 (0.8%) | 743 (99.2%) |
| Mobile Home / Other | 2,086 (91.7%) | 188 (8.3%) |
| Total | 17,171 (75.5%) | 5,560 (24.5%) |
Housing Structures by Number of Rooms in Crawford County
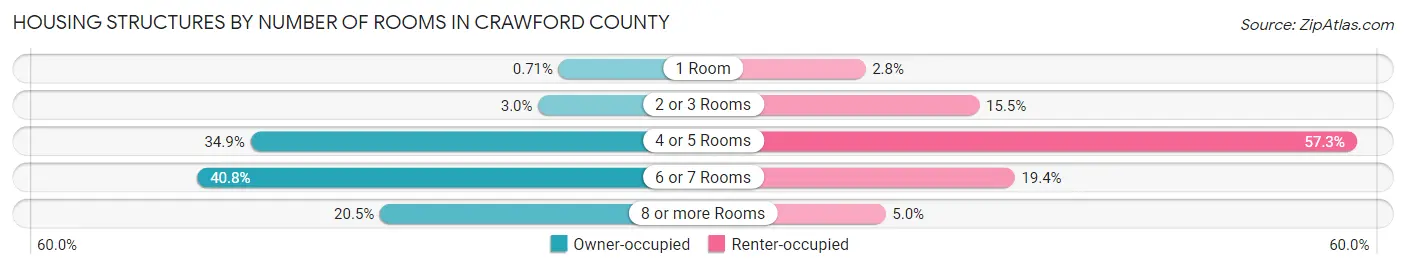
| Number of Rooms | Owner-occupied | Renter-occupied |
| 1 Room | 122 (0.7%) | 156 (2.8%) |
| 2 or 3 Rooms | 511 (3.0%) | 859 (15.4%) |
| 4 or 5 Rooms | 5,998 (34.9%) | 3,188 (57.3%) |
| 6 or 7 Rooms | 7,013 (40.8%) | 1,077 (19.4%) |
| 8 or more Rooms | 3,527 (20.5%) | 280 (5.0%) |
| Total | 17,171 (100.0%) | 5,560 (100.0%) |
Housing Structure by Heating Type in Crawford County
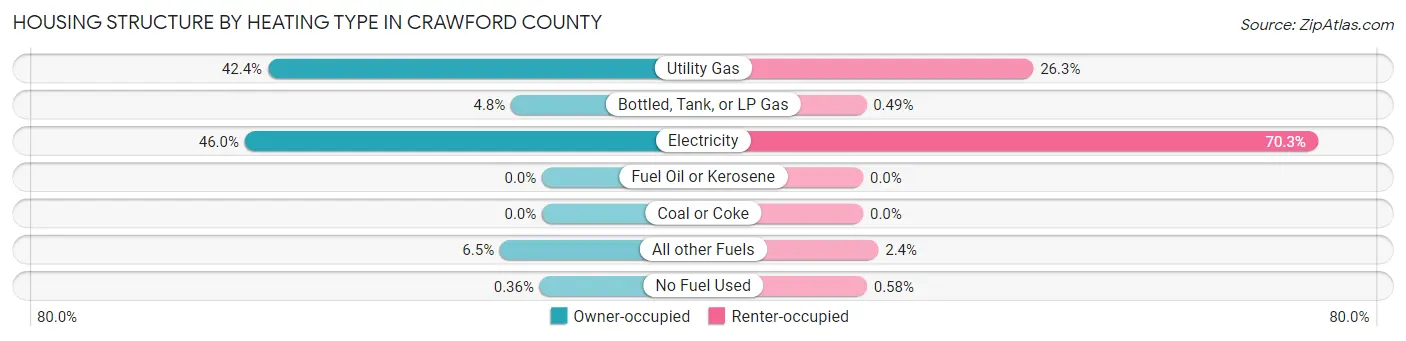
| Heating Type | Owner-occupied | Renter-occupied |
| Utility Gas | 7,279 (42.4%) | 1,463 (26.3%) |
| Bottled, Tank, or LP Gas | 822 (4.8%) | 27 (0.5%) |
| Electricity | 7,892 (46.0%) | 3,907 (70.3%) |
| Fuel Oil or Kerosene | 0 (0.0%) | 0 (0.0%) |
| Coal or Coke | 0 (0.0%) | 0 (0.0%) |
| All other Fuels | 1,117 (6.5%) | 131 (2.4%) |
| No Fuel Used | 61 (0.4%) | 32 (0.6%) |
| Total | 17,171 (100.0%) | 5,560 (100.0%) |
Household Vehicle Usage in Crawford County
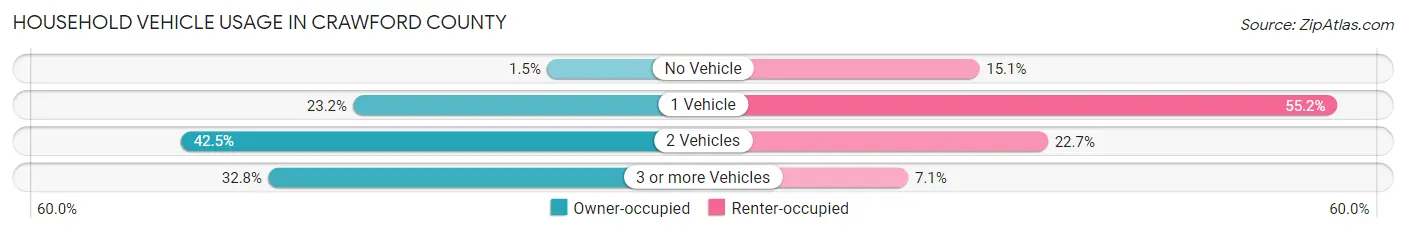
| Vehicles per Household | Owner-occupied | Renter-occupied |
| No Vehicle | 259 (1.5%) | 837 (15.0%) |
| 1 Vehicle | 3,988 (23.2%) | 3,067 (55.2%) |
| 2 Vehicles | 7,300 (42.5%) | 1,263 (22.7%) |
| 3 or more Vehicles | 5,624 (32.8%) | 393 (7.1%) |
| Total | 17,171 (100.0%) | 5,560 (100.0%) |
Real Estate & Mortgages in Crawford County
Real Estate and Mortgage Overview in Crawford County
| Characteristic | Without Mortgage | With Mortgage |
| Housing Units | 7,977 | 9,194 |
| Median Property Value | $140,100 | $163,700 |
| Median Household Income | $54,611 | $1,269 |
| Monthly Housing Costs | $392 | $246 |
| Real Estate Taxes | $826 | $464 |
Property Value by Mortgage Status in Crawford County
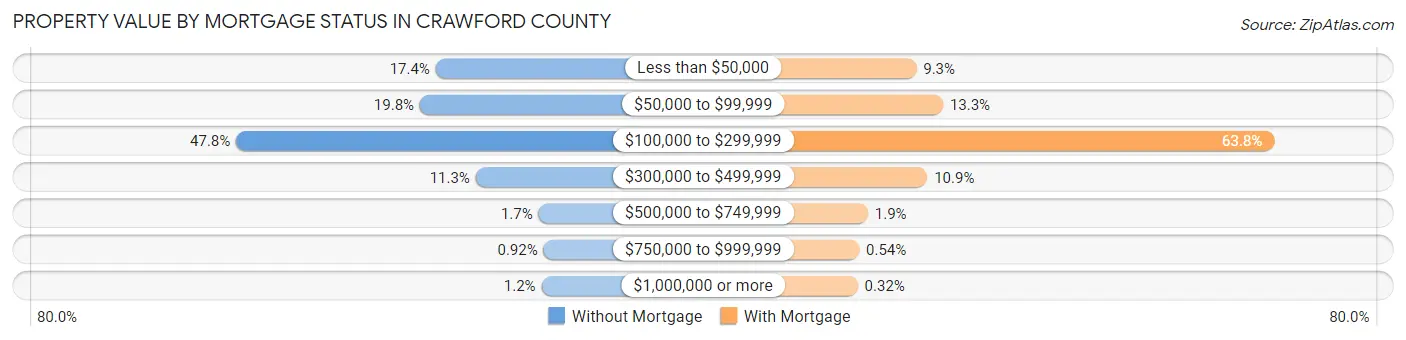
| Property Value | Without Mortgage | With Mortgage |
| Less than $50,000 | 1,385 (17.4%) | 850 (9.2%) |
| $50,000 to $99,999 | 1,576 (19.8%) | 1,225 (13.3%) |
| $100,000 to $299,999 | 3,811 (47.8%) | 5,864 (63.8%) |
| $300,000 to $499,999 | 898 (11.3%) | 1,004 (10.9%) |
| $500,000 to $749,999 | 135 (1.7%) | 172 (1.9%) |
| $750,000 to $999,999 | 73 (0.9%) | 50 (0.5%) |
| $1,000,000 or more | 99 (1.2%) | 29 (0.3%) |
| Total | 7,977 (100.0%) | 9,194 (100.0%) |
Household Income by Mortgage Status in Crawford County
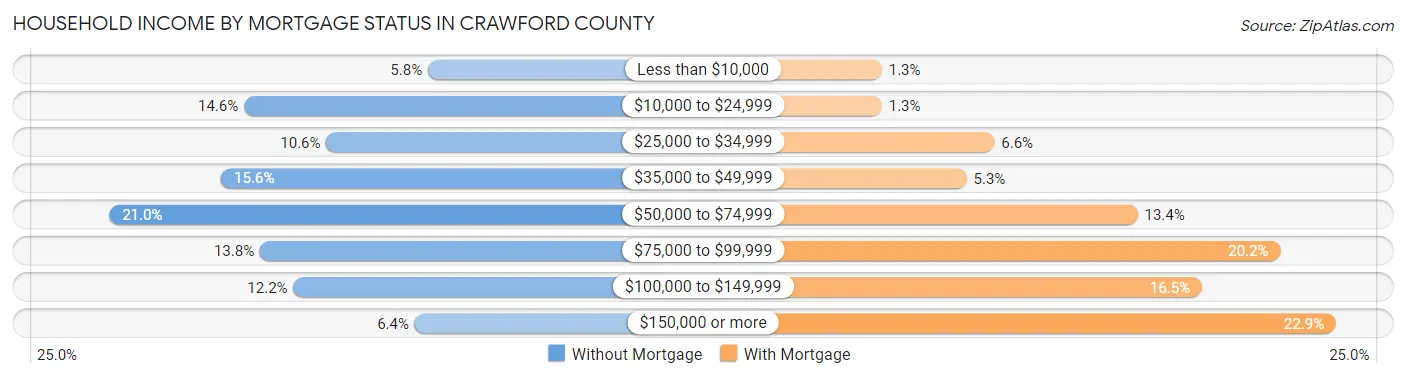
| Household Income | Without Mortgage | With Mortgage |
| Less than $10,000 | 462 (5.8%) | 115 (1.3%) |
| $10,000 to $24,999 | 1,161 (14.5%) | 115 (1.3%) |
| $25,000 to $34,999 | 848 (10.6%) | 608 (6.6%) |
| $35,000 to $49,999 | 1,248 (15.6%) | 486 (5.3%) |
| $50,000 to $74,999 | 1,673 (21.0%) | 1,235 (13.4%) |
| $75,000 to $99,999 | 1,100 (13.8%) | 1,860 (20.2%) |
| $100,000 to $149,999 | 973 (12.2%) | 1,517 (16.5%) |
| $150,000 or more | 512 (6.4%) | 2,104 (22.9%) |
| Total | 7,977 (100.0%) | 9,194 (100.0%) |
Property Value to Household Income Ratio in Crawford County
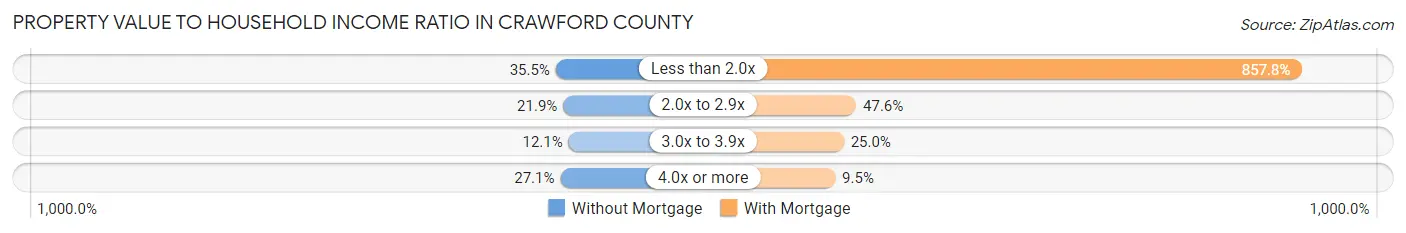
| Value-to-Income Ratio | Without Mortgage | With Mortgage |
| Less than 2.0x | 2,829 (35.5%) | 78,866 (857.8%) |
| 2.0x to 2.9x | 1,746 (21.9%) | 4,374 (47.6%) |
| 3.0x to 3.9x | 966 (12.1%) | 2,301 (25.0%) |
| 4.0x or more | 2,163 (27.1%) | 872 (9.5%) |
| Total | 7,977 (100.0%) | 9,194 (100.0%) |
Real Estate Taxes by Mortgage Status in Crawford County
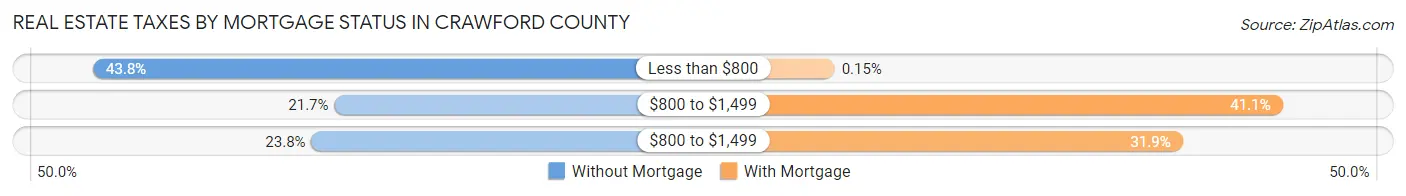
| Property Taxes | Without Mortgage | With Mortgage |
| Less than $800 | 3,491 (43.8%) | 14 (0.2%) |
| $800 to $1,499 | 1,732 (21.7%) | 3,774 (41.0%) |
| $800 to $1,499 | 1,899 (23.8%) | 2,935 (31.9%) |
| Total | 7,977 (100.0%) | 9,194 (100.0%) |
Health & Disability in Crawford County
Health Insurance Coverage by Age in Crawford County
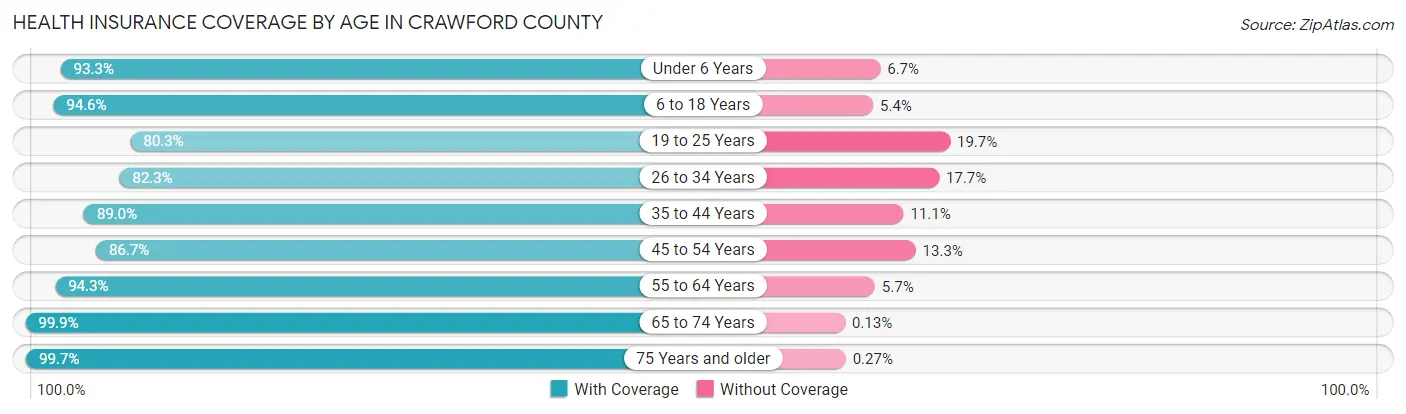
| Age Bracket | With Coverage | Without Coverage |
| Under 6 Years | 4,102 (93.3%) | 295 (6.7%) |
| 6 to 18 Years | 10,345 (94.6%) | 587 (5.4%) |
| 19 to 25 Years | 3,889 (80.3%) | 955 (19.7%) |
| 26 to 34 Years | 5,638 (82.3%) | 1,209 (17.7%) |
| 35 to 44 Years | 6,463 (88.9%) | 803 (11.1%) |
| 45 to 54 Years | 6,518 (86.7%) | 1,001 (13.3%) |
| 55 to 64 Years | 7,552 (94.3%) | 457 (5.7%) |
| 65 to 74 Years | 5,965 (99.9%) | 8 (0.1%) |
| 75 Years and older | 4,027 (99.7%) | 11 (0.3%) |
| Total | 54,499 (91.1%) | 5,326 (8.9%) |
Health Insurance Coverage by Citizenship Status in Crawford County
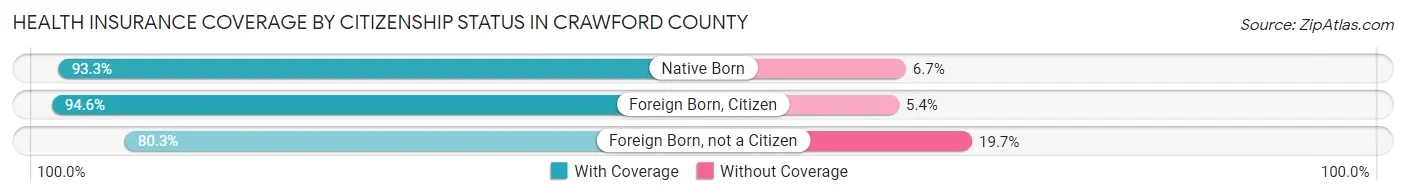
| Citizenship Status | With Coverage | Without Coverage |
| Native Born | 4,102 (93.3%) | 295 (6.7%) |
| Foreign Born, Citizen | 10,345 (94.6%) | 587 (5.4%) |
| Foreign Born, not a Citizen | 3,889 (80.3%) | 955 (19.7%) |
Health Insurance Coverage by Household Income in Crawford County
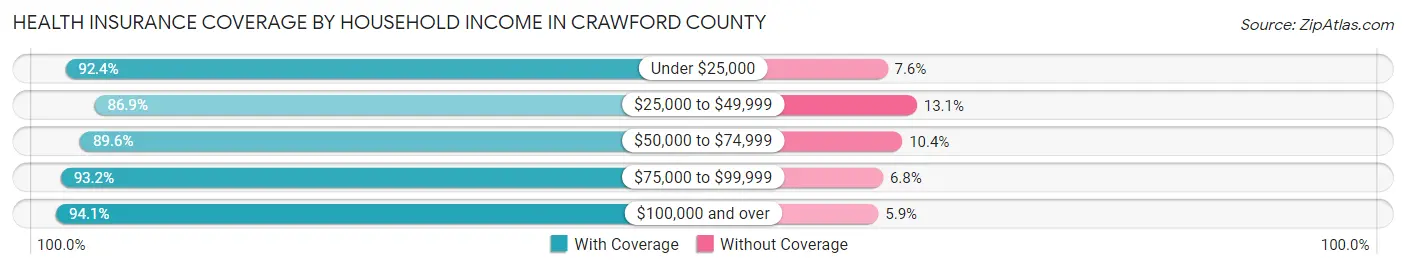
| Household Income | With Coverage | Without Coverage |
| Under $25,000 | 7,882 (92.4%) | 651 (7.6%) |
| $25,000 to $49,999 | 12,095 (86.9%) | 1,825 (13.1%) |
| $50,000 to $74,999 | 11,101 (89.6%) | 1,286 (10.4%) |
| $75,000 to $99,999 | 8,376 (93.2%) | 609 (6.8%) |
| $100,000 and over | 14,978 (94.1%) | 941 (5.9%) |
Public vs Private Health Insurance Coverage by Age in Crawford County
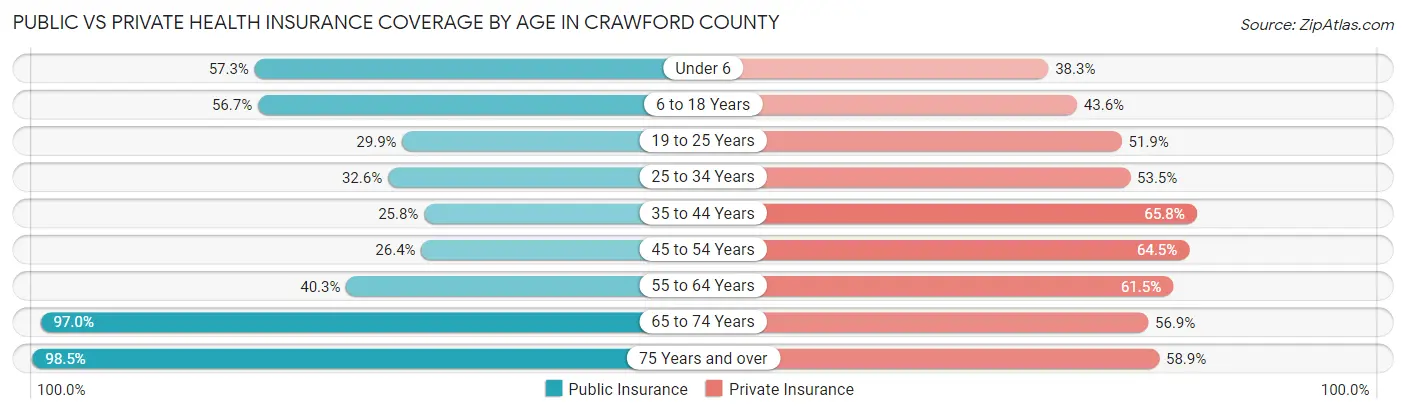
| Age Bracket | Public Insurance | Private Insurance |
| Under 6 | 2,519 (57.3%) | 1,685 (38.3%) |
| 6 to 18 Years | 6,196 (56.7%) | 4,771 (43.6%) |
| 19 to 25 Years | 1,447 (29.9%) | 2,516 (51.9%) |
| 25 to 34 Years | 2,229 (32.6%) | 3,664 (53.5%) |
| 35 to 44 Years | 1,877 (25.8%) | 4,784 (65.8%) |
| 45 to 54 Years | 1,981 (26.4%) | 4,847 (64.5%) |
| 55 to 64 Years | 3,227 (40.3%) | 4,923 (61.5%) |
| 65 to 74 Years | 5,796 (97.0%) | 3,396 (56.9%) |
| 75 Years and over | 3,979 (98.5%) | 2,378 (58.9%) |
| Total | 29,251 (48.9%) | 32,964 (55.1%) |
Disability Status by Sex by Age in Crawford County
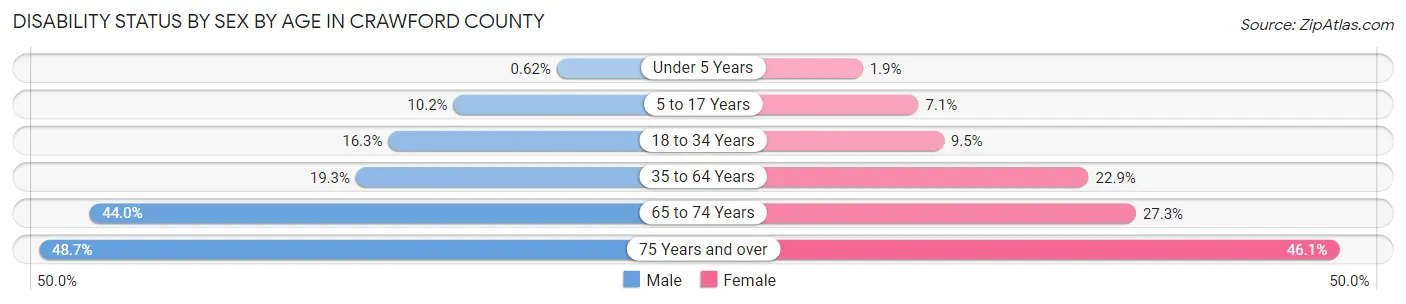
| Age Bracket | Male | Female |
| Under 5 Years | 11 (0.6%) | 37 (1.9%) |
| 5 to 17 Years | 557 (10.2%) | 386 (7.1%) |
| 18 to 34 Years | 1,025 (16.3%) | 584 (9.5%) |
| 35 to 64 Years | 2,190 (19.3%) | 2,617 (22.9%) |
| 65 to 74 Years | 1,237 (44.0%) | 863 (27.3%) |
| 75 Years and over | 869 (48.7%) | 1,039 (46.1%) |
Disability Class by Sex by Age in Crawford County
Disability Class: Hearing Difficulty
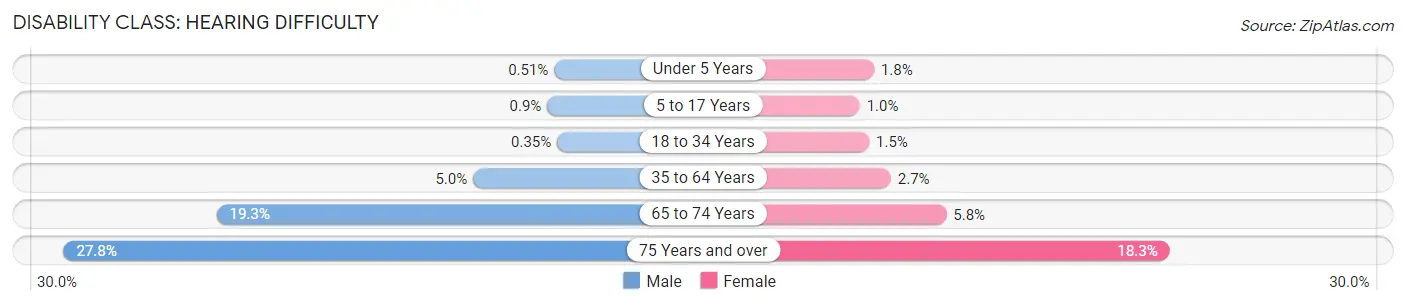
| Age Bracket | Male | Female |
| Under 5 Years | 9 (0.5%) | 34 (1.8%) |
| 5 to 17 Years | 49 (0.9%) | 54 (1.0%) |
| 18 to 34 Years | 22 (0.4%) | 94 (1.5%) |
| 35 to 64 Years | 572 (5.0%) | 312 (2.7%) |
| 65 to 74 Years | 543 (19.3%) | 184 (5.8%) |
| 75 Years and over | 497 (27.8%) | 411 (18.2%) |
Disability Class: Vision Difficulty
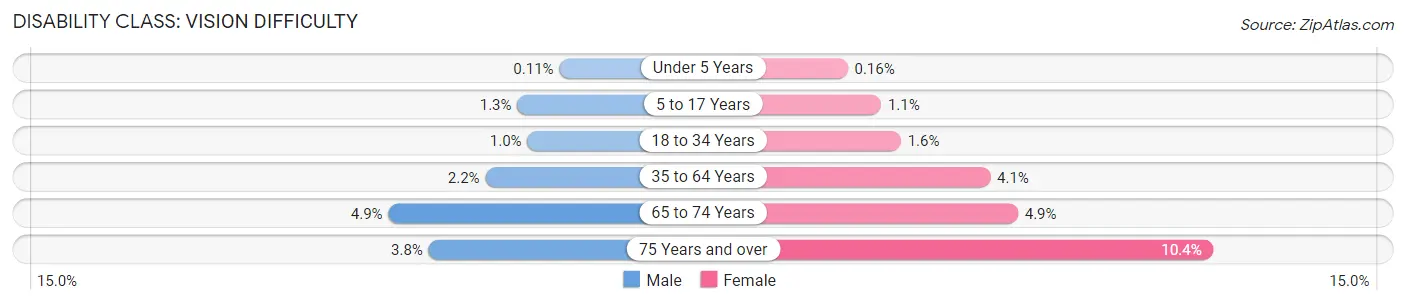
| Age Bracket | Male | Female |
| Under 5 Years | 2 (0.1%) | 3 (0.2%) |
| 5 to 17 Years | 70 (1.3%) | 59 (1.1%) |
| 18 to 34 Years | 63 (1.0%) | 101 (1.6%) |
| 35 to 64 Years | 247 (2.2%) | 472 (4.1%) |
| 65 to 74 Years | 137 (4.9%) | 155 (4.9%) |
| 75 Years and over | 67 (3.7%) | 233 (10.3%) |
Disability Class: Cognitive Difficulty
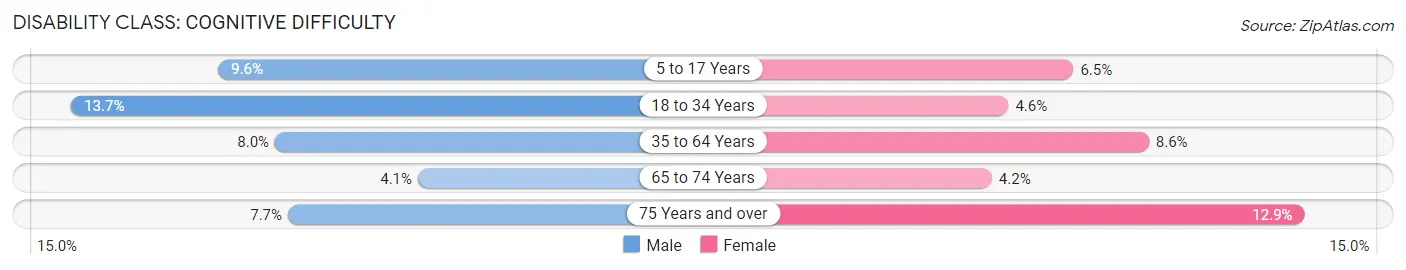
| Age Bracket | Male | Female |
| 5 to 17 Years | 525 (9.6%) | 349 (6.5%) |
| 18 to 34 Years | 864 (13.7%) | 286 (4.6%) |
| 35 to 64 Years | 913 (8.0%) | 977 (8.6%) |
| 65 to 74 Years | 114 (4.1%) | 132 (4.2%) |
| 75 Years and over | 137 (7.7%) | 290 (12.9%) |
Disability Class: Ambulatory Difficulty
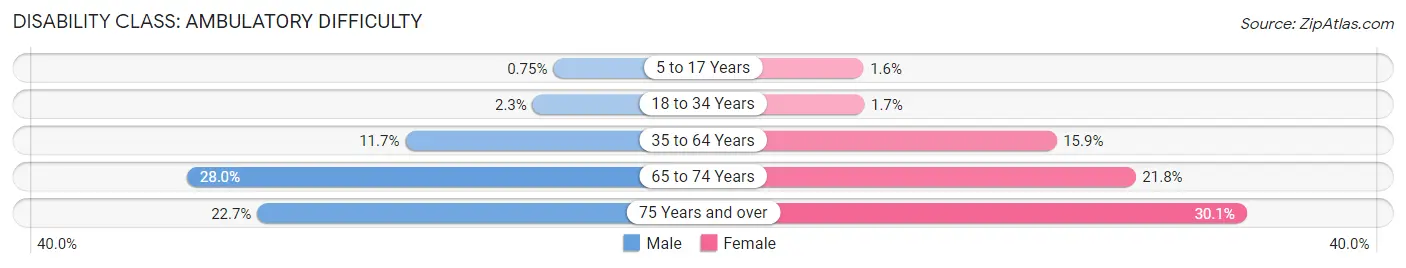
| Age Bracket | Male | Female |
| 5 to 17 Years | 41 (0.7%) | 86 (1.6%) |
| 18 to 34 Years | 144 (2.3%) | 102 (1.7%) |
| 35 to 64 Years | 1,335 (11.7%) | 1,819 (15.9%) |
| 65 to 74 Years | 786 (28.0%) | 689 (21.8%) |
| 75 Years and over | 406 (22.7%) | 677 (30.1%) |
Disability Class: Self-Care Difficulty
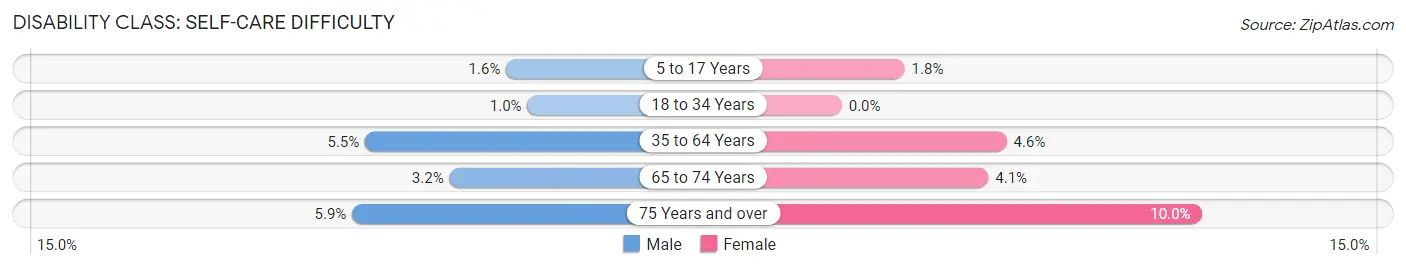
| Age Bracket | Male | Female |
| 5 to 17 Years | 87 (1.6%) | 95 (1.8%) |
| 18 to 34 Years | 63 (1.0%) | 0 (0.0%) |
| 35 to 64 Years | 628 (5.5%) | 524 (4.6%) |
| 65 to 74 Years | 89 (3.2%) | 129 (4.1%) |
| 75 Years and over | 105 (5.9%) | 226 (10.0%) |
Technology Access in Crawford County
Computing Device Access in Crawford County
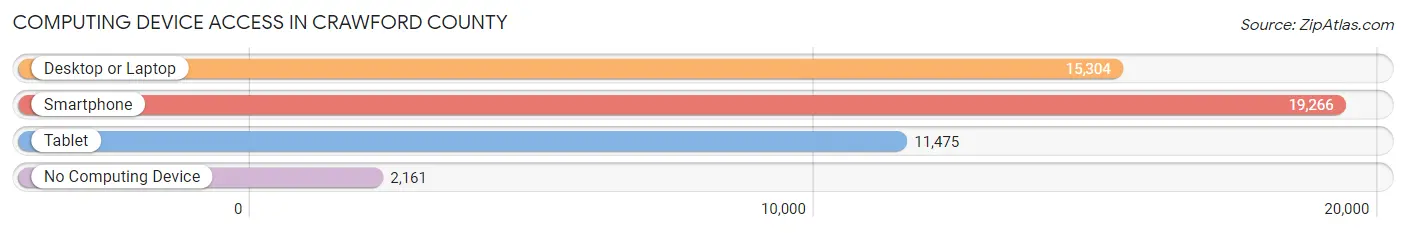
| Device Type | # Households | % Households |
| Desktop or Laptop | 15,304 | 67.3% |
| Smartphone | 19,266 | 84.8% |
| Tablet | 11,475 | 50.5% |
| No Computing Device | 2,161 | 9.5% |
| Total | 22,731 | 100.0% |
Internet Access in Crawford County
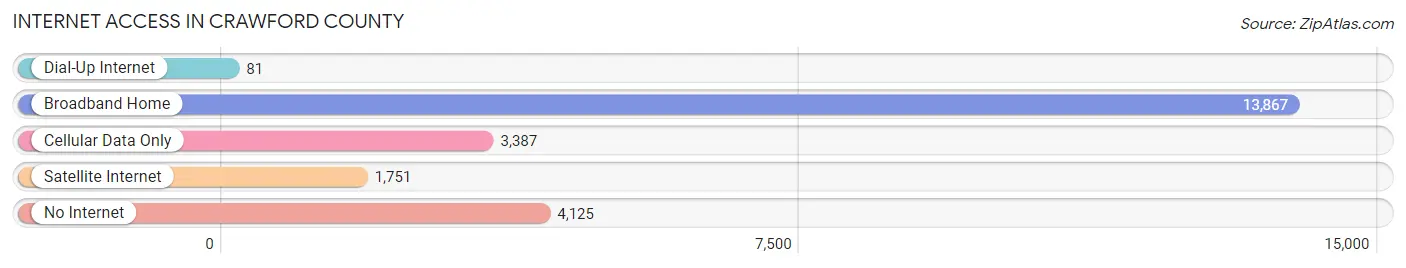
| Internet Type | # Households | % Households |
| Dial-Up Internet | 81 | 0.4% |
| Broadband Home | 13,867 | 61.0% |
| Cellular Data Only | 3,387 | 14.9% |
| Satellite Internet | 1,751 | 7.7% |
| No Internet | 4,125 | 18.1% |
| Total | 22,731 | 100.0% |
Crawford County Summary
Crawford County, Arkansas is located in the northwest corner of the state and is bordered by Washington County to the north, Franklin County to the east, Sebastian County to the south, and Oklahoma to the west. The county seat is Van Buren, and the largest city is Alma. The county was established in 1820 and named after William H. Crawford, the United States Secretary of War at the time.
Geography
Crawford County covers an area of 717 square miles and is located in the Ozark Mountains. The county is mostly hilly and forested, with the highest point being Mount Magazine at 2,753 feet. The county is drained by the Arkansas River and its tributaries, including the Mulberry River, Lee Creek, and Cadron Creek. The county is home to several state parks, including Mount Magazine State Park, Lake Fort Smith State Park, and Devil's Den State Park.
Economy
The economy of Crawford County is largely based on agriculture, with the main crops being corn, soybeans, cotton, and wheat. The county is also home to several manufacturing companies, including Tyson Foods, which has a large poultry processing plant in Van Buren. Other major employers in the county include the University of Arkansas at Fort Smith, Walmart, and the Arkansas Department of Corrections.
Demographics
As of the 2010 census, Crawford County had a population of 61,948. The racial makeup of the county was 87.3% White, 8.2% Black or African American, 0.7% Native American, 0.6% Asian, 0.1% Pacific Islander, 1.2% from other races, and 2.1% from two or more races. Hispanic or Latino of any race were 3.3% of the population.
The median income for a household in the county was $37,945, and the median income for a family was $45,945. The per capita income for the county was $19,945. About 13.2% of families and 17.2% of the population were below the poverty line, including 24.2% of those under age 18 and 11.2% of those age 65 or over.
Education
Crawford County is served by the Crawford County Special School District, which operates seven elementary schools, three middle schools, and two high schools. The county is also home to the University of Arkansas at Fort Smith, a public university with an enrollment of over 8,000 students.
Conclusion
Crawford County, Arkansas is a rural county located in the northwest corner of the state. The county is largely agricultural, with the main crops being corn, soybeans, cotton, and wheat. The county is also home to several manufacturing companies and the University of Arkansas at Fort Smith. The population of the county is largely white, with a median household income of $37,945. The county is served by the Crawford County Special School District, which operates seven elementary schools, three middle schools, and two high schools.
Common Questions
What is Per Capita Income in Crawford County?
Per Capita income in Crawford County is $28,920.
What is the Median Family Income in Crawford County?
Median Family Income in Crawford County is $66,704.
What is the Median Household income in Crawford County?
Median Household Income in Crawford County is $56,702.
What is Income or Wage Gap in Crawford County?
Income or Wage Gap in Crawford County is 32.8%.
Women in Crawford County earn 67.2 cents for every dollar earned by a man.
What is Family Income Deficit in Crawford County?
Family Income Deficit in Crawford County is $11,805.
Families that are below poverty line in Crawford County earn $11,805 less on average than the poverty threshold level.
What is Inequality or Gini Index in Crawford County?
Inequality or Gini Index in Crawford County is 0.44.
What is the Total Population of Crawford County?
Total Population of Crawford County is 60,593.
What is the Total Male Population of Crawford County?
Total Male Population of Crawford County is 29,905.
What is the Total Female Population of Crawford County?
Total Female Population of Crawford County is 30,688.
What is the Ratio of Males per 100 Females in Crawford County?
There are 97.45 Males per 100 Females in Crawford County.
What is the Ratio of Females per 100 Males in Crawford County?
There are 102.62 Females per 100 Males in Crawford County.
What is the Median Population Age in Crawford County?
Median Population Age in Crawford County is 39.2 Years.
What is the Average Family Size in Crawford County
Average Family Size in Crawford County is 3.1 People.
What is the Average Household Size in Crawford County
Average Household Size in Crawford County is 2.6 People.
How Large is the Labor Force in Crawford County?
There are 26,139 People in the Labor Forcein in Crawford County.
What is the Percentage of People in the Labor Force in Crawford County?
55.0% of People are in the Labor Force in Crawford County.
What is the Unemployment Rate in Crawford County?
Unemployment Rate in Crawford County is 5.3%.