Cleburne County, AR Map & Demographics
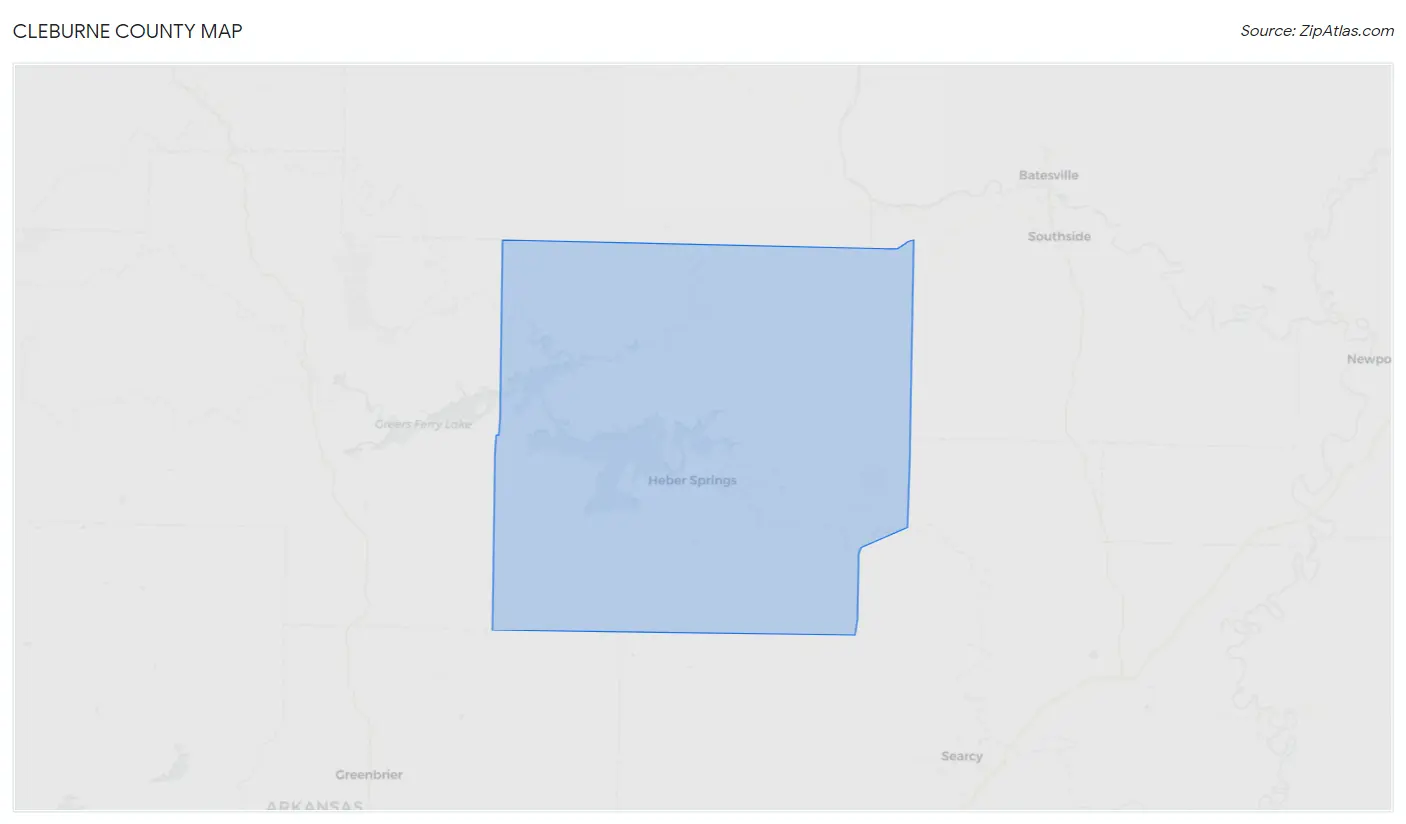
Cleburne County Map
Cleburne County Overview
$31,041
PER CAPITA INCOME
$64,091
AVG FAMILY INCOME
$52,780
AVG HOUSEHOLD INCOME
31.5%
WAGE / INCOME GAP [ % ]
68.5¢/ $1
WAGE / INCOME GAP [ $ ]
$9,018
FAMILY INCOME DEFICIT
0.45
INEQUALITY / GINI INDEX
24,948
TOTAL POPULATION
12,469
MALE POPULATION
12,479
FEMALE POPULATION
99.92
MALES / 100 FEMALES
100.08
FEMALES / 100 MALES
49.5
MEDIAN AGE
2.9
AVG FAMILY SIZE
2.3
AVG HOUSEHOLD SIZE
10,013
LABOR FORCE [ PEOPLE ]
48.0%
PERCENT IN LABOR FORCE
6.0%
UNEMPLOYMENT RATE
Income in Cleburne County
Income Overview in Cleburne County
Per Capita Income in Cleburne County is $31,041, while median incomes of families and households are $64,091 and $52,780 respectively.
| Characteristic | Number | Measure |
| Per Capita Income | 24,948 | $31,041 |
| Median Family Income | 6,990 | $64,091 |
| Mean Family Income | 6,990 | $79,237 |
| Median Household Income | 10,626 | $52,780 |
| Mean Household Income | 10,626 | $71,025 |
| Income Deficit | 6,990 | $9,018 |
| Wage / Income Gap (%) | 24,948 | 31.49% |
| Wage / Income Gap ($) | 24,948 | 68.51¢ per $1 |
| Gini / Inequality Index | 24,948 | 0.45 |
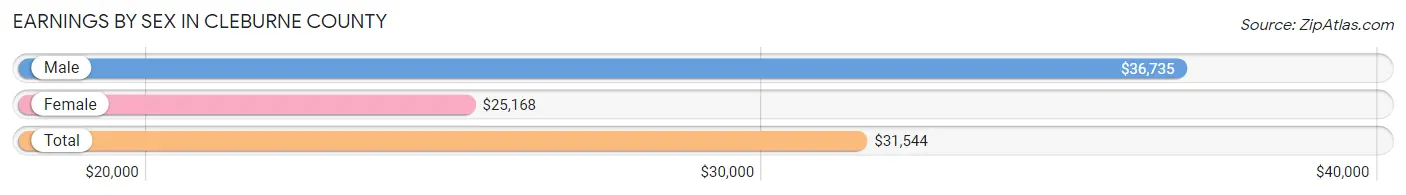
Earnings by Sex in Cleburne County
Average Earnings in Cleburne County are $31,544, $36,735 for men and $25,168 for women, a difference of 31.5%.
| Sex | Number | Average Earnings |
| Male | 5,788 (54.3%) | $36,735 |
| Female | 4,871 (45.7%) | $25,168 |
| Total | 10,659 (100.0%) | $31,544 |
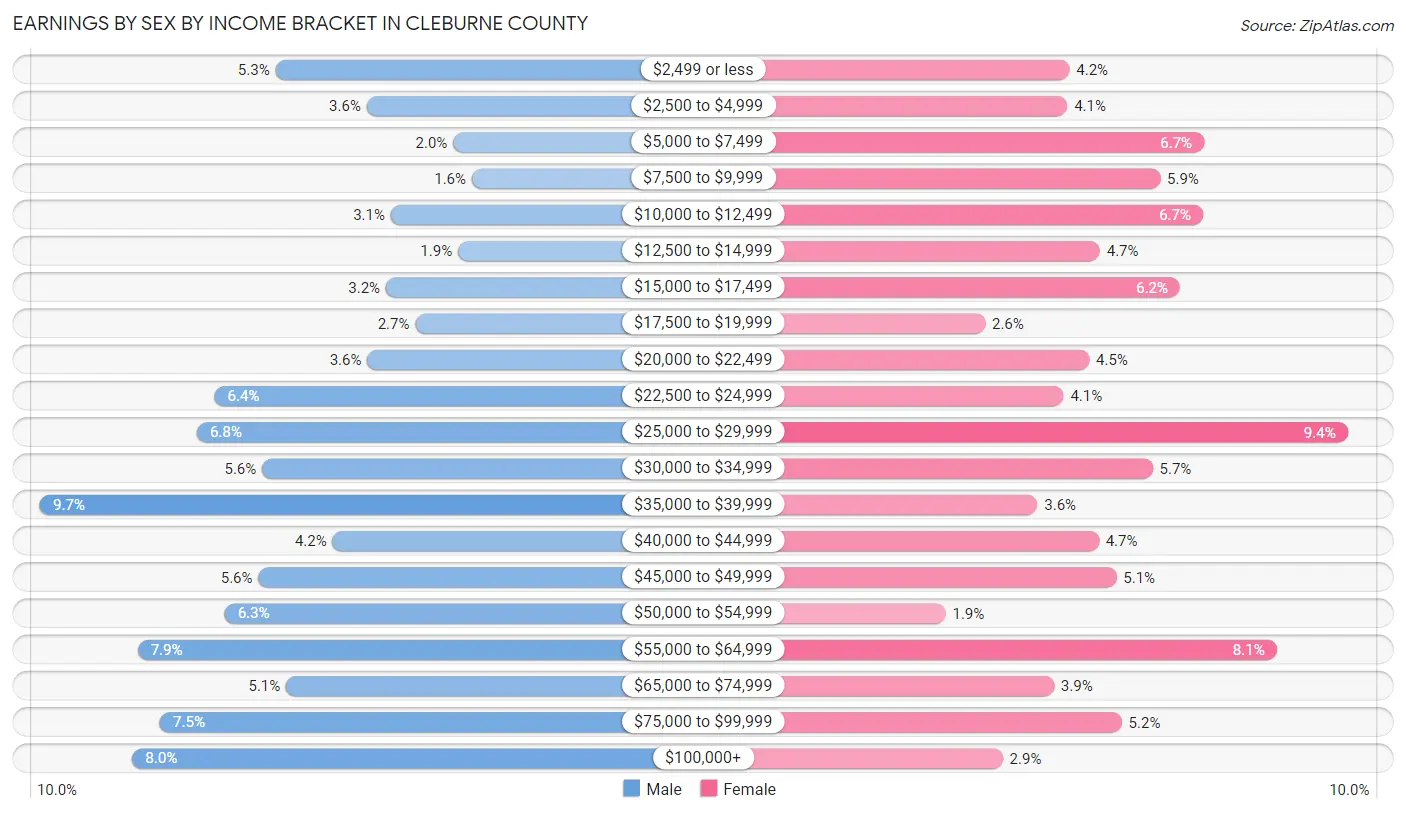
Earnings by Sex by Income Bracket in Cleburne County
The most common earnings brackets in Cleburne County are $35,000 to $39,999 for men (562 | 9.7%) and $25,000 to $29,999 for women (457 | 9.4%).
| Income | Male | Female |
| $2,499 or less | 307 (5.3%) | 203 (4.2%) |
| $2,500 to $4,999 | 208 (3.6%) | 201 (4.1%) |
| $5,000 to $7,499 | 114 (2.0%) | 326 (6.7%) |
| $7,500 to $9,999 | 94 (1.6%) | 286 (5.9%) |
| $10,000 to $12,499 | 182 (3.1%) | 325 (6.7%) |
| $12,500 to $14,999 | 109 (1.9%) | 231 (4.7%) |
| $15,000 to $17,499 | 187 (3.2%) | 304 (6.2%) |
| $17,500 to $19,999 | 155 (2.7%) | 126 (2.6%) |
| $20,000 to $22,499 | 207 (3.6%) | 221 (4.5%) |
| $22,500 to $24,999 | 373 (6.4%) | 198 (4.1%) |
| $25,000 to $29,999 | 392 (6.8%) | 457 (9.4%) |
| $30,000 to $34,999 | 321 (5.6%) | 279 (5.7%) |
| $35,000 to $39,999 | 562 (9.7%) | 174 (3.6%) |
| $40,000 to $44,999 | 245 (4.2%) | 230 (4.7%) |
| $45,000 to $49,999 | 325 (5.6%) | 246 (5.1%) |
| $50,000 to $54,999 | 362 (6.2%) | 90 (1.8%) |
| $55,000 to $64,999 | 456 (7.9%) | 392 (8.1%) |
| $65,000 to $74,999 | 295 (5.1%) | 189 (3.9%) |
| $75,000 to $99,999 | 432 (7.5%) | 251 (5.1%) |
| $100,000+ | 462 (8.0%) | 142 (2.9%) |
| Total | 5,788 (100.0%) | 4,871 (100.0%) |
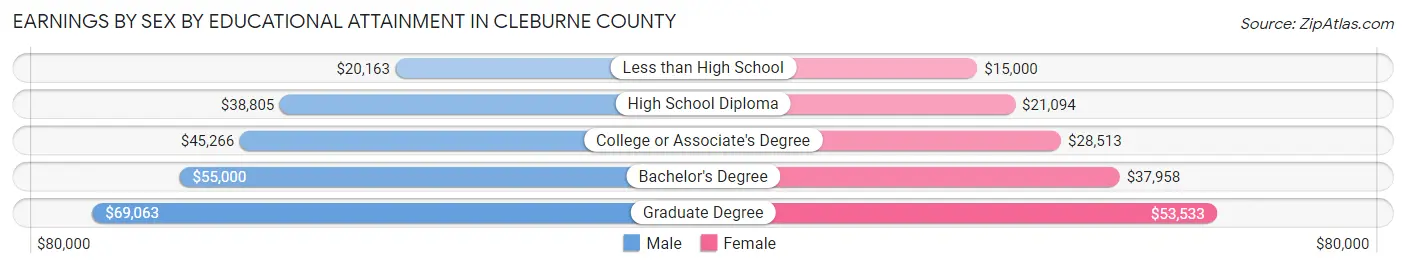
Earnings by Sex by Educational Attainment in Cleburne County
Average earnings in Cleburne County are $39,868 for men and $27,138 for women, a difference of 31.9%. Men with an educational attainment of graduate degree enjoy the highest average annual earnings of $69,063, while those with less than high school education earn the least with $20,163. Women with an educational attainment of graduate degree earn the most with the average annual earnings of $53,533, while those with less than high school education have the smallest earnings of $15,000.
| Educational Attainment | Male Income | Female Income |
| Less than High School | $20,163 | $15,000 |
| High School Diploma | $38,805 | $21,094 |
| College or Associate's Degree | $45,266 | $28,513 |
| Bachelor's Degree | $55,000 | $37,958 |
| Graduate Degree | $69,063 | $53,533 |
| Total | $39,868 | $27,138 |
Family Income in Cleburne County
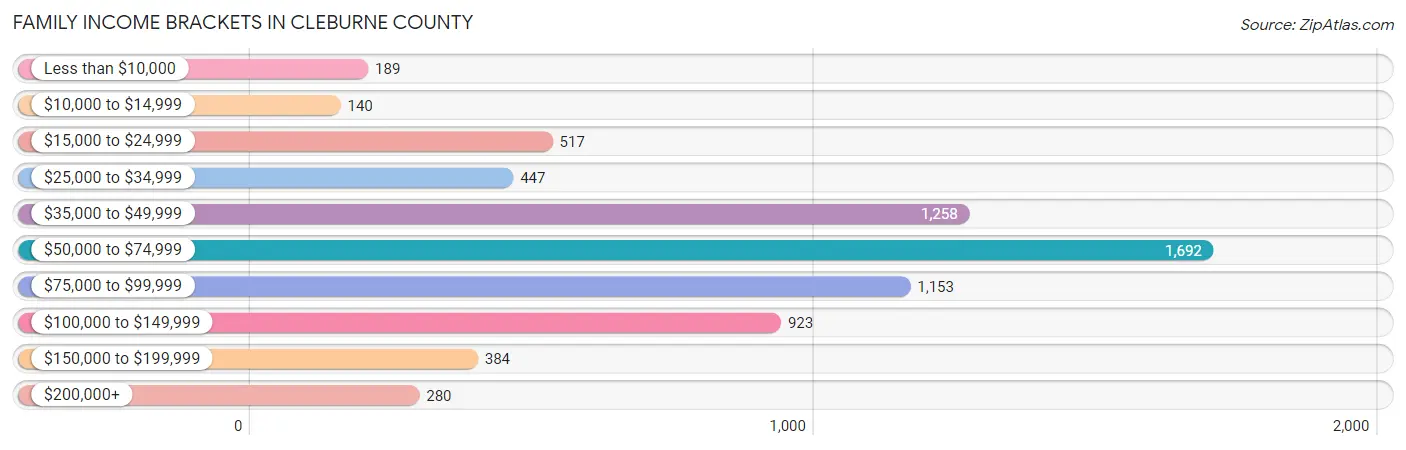
Family Income Brackets in Cleburne County
According to the Cleburne County family income data, there are 1,692 families falling into the $50,000 to $74,999 income range, which is the most common income bracket and makes up 24.2% of all families. Conversely, the $10,000 to $14,999 income bracket is the least frequent group with only 140 families (2.0%) belonging to this category.
| Income Bracket | # Families | % Families |
| Less than $10,000 | 189 | 2.7% |
| $10,000 to $14,999 | 140 | 2.0% |
| $15,000 to $24,999 | 517 | 7.4% |
| $25,000 to $34,999 | 447 | 6.4% |
| $35,000 to $49,999 | 1,258 | 18.0% |
| $50,000 to $74,999 | 1,692 | 24.2% |
| $75,000 to $99,999 | 1,153 | 16.5% |
| $100,000 to $149,999 | 923 | 13.2% |
| $150,000 to $199,999 | 384 | 5.5% |
| $200,000+ | 280 | 4.0% |
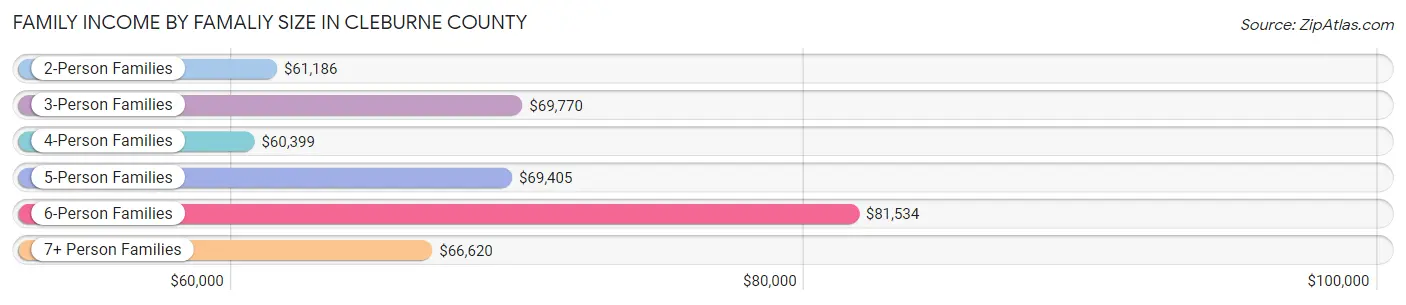
Family Income by Famaliy Size in Cleburne County
6-person families (183 | 2.6%) account for the highest median family income in Cleburne County with $81,534 per family, while 2-person families (4,034 | 57.7%) have the highest median income of $30,593 per family member.
| Income Bracket | # Families | Median Income |
| 2-Person Families | 4,034 (57.7%) | $61,186 |
| 3-Person Families | 1,359 (19.4%) | $69,770 |
| 4-Person Families | 839 (12.0%) | $60,399 |
| 5-Person Families | 440 (6.3%) | $69,405 |
| 6-Person Families | 183 (2.6%) | $81,534 |
| 7+ Person Families | 135 (1.9%) | $66,620 |
| Total | 6,990 (100.0%) | $64,091 |
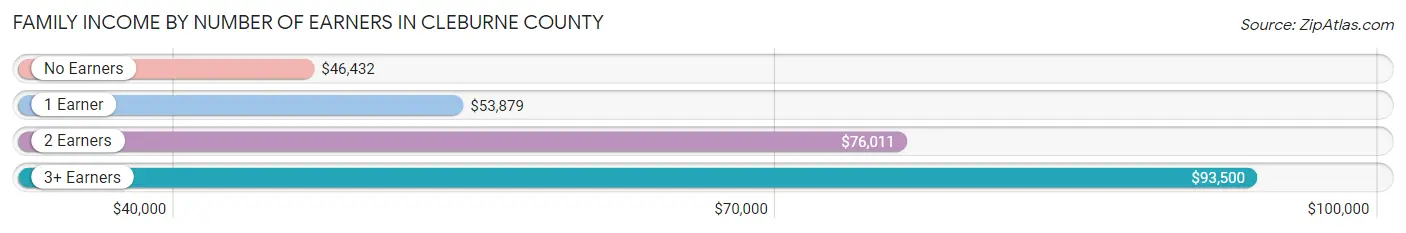
Family Income by Number of Earners in Cleburne County
The median family income in Cleburne County is $64,091, with families comprising 3+ earners (472) having the highest median family income of $93,500, while families with no earners (1,863) have the lowest median family income of $46,432, accounting for 6.8% and 26.7% of families, respectively.
| Number of Earners | # Families | Median Income |
| No Earners | 1,863 (26.7%) | $46,432 |
| 1 Earner | 2,251 (32.2%) | $53,879 |
| 2 Earners | 2,404 (34.4%) | $76,011 |
| 3+ Earners | 472 (6.8%) | $93,500 |
| Total | 6,990 (100.0%) | $64,091 |
Household Income in Cleburne County
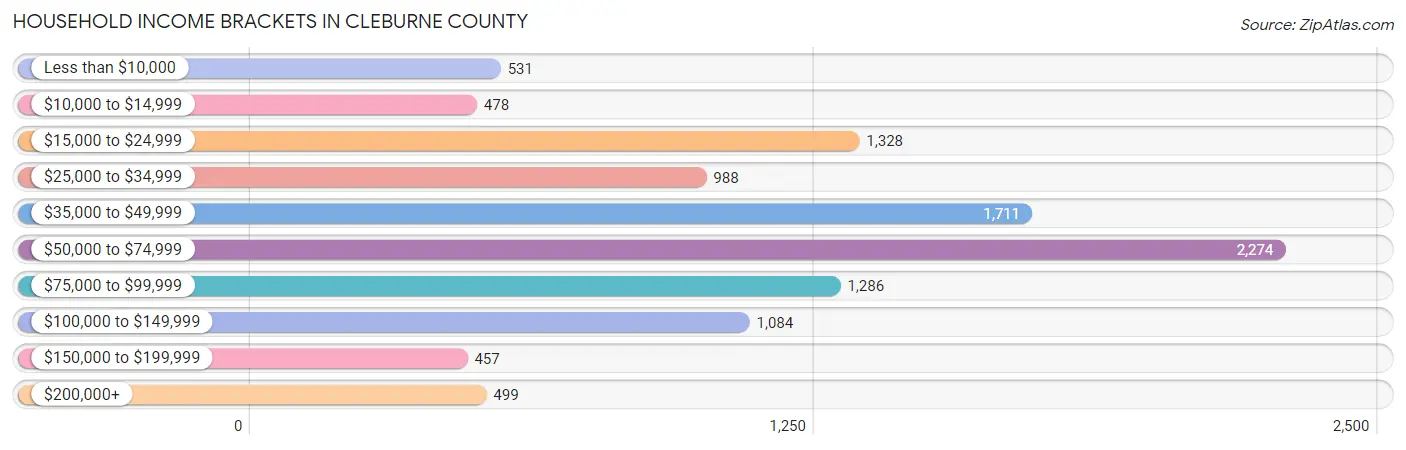
Household Income Brackets in Cleburne County
With 2,274 households falling in the category, the $50,000 to $74,999 income range is the most frequent in Cleburne County, accounting for 21.4% of all households. In contrast, only 457 households (4.3%) fall into the $150,000 to $199,999 income bracket, making it the least populous group.
| Income Bracket | # Households | % Households |
| Less than $10,000 | 531 | 5.0% |
| $10,000 to $14,999 | 478 | 4.5% |
| $15,000 to $24,999 | 1,328 | 12.5% |
| $25,000 to $34,999 | 988 | 9.3% |
| $35,000 to $49,999 | 1,711 | 16.1% |
| $50,000 to $74,999 | 2,274 | 21.4% |
| $75,000 to $99,999 | 1,286 | 12.1% |
| $100,000 to $149,999 | 1,084 | 10.2% |
| $150,000 to $199,999 | 457 | 4.3% |
| $200,000+ | 499 | 4.7% |
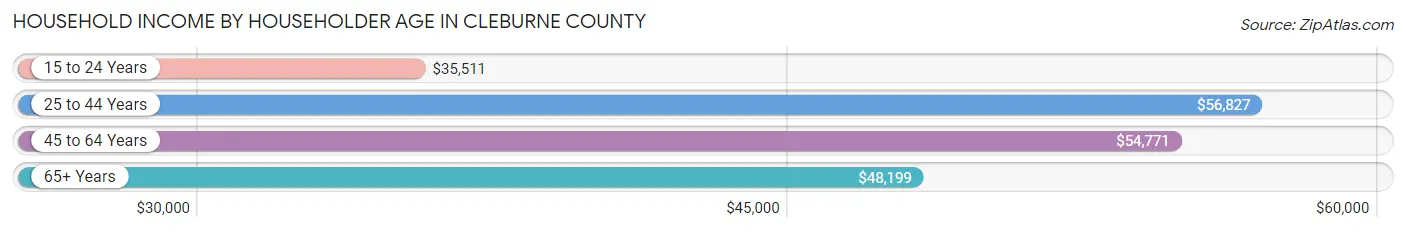
Household Income by Householder Age in Cleburne County
The median household income in Cleburne County is $52,780, with the highest median household income of $56,827 found in the 25 to 44 years age bracket for the primary householder. A total of 2,317 households (21.8%) fall into this category. Meanwhile, the 15 to 24 years age bracket for the primary householder has the lowest median household income of $35,511, with 153 households (1.4%) in this group.
| Income Bracket | # Households | Median Income |
| 15 to 24 Years | 153 (1.4%) | $35,511 |
| 25 to 44 Years | 2,317 (21.8%) | $56,827 |
| 45 to 64 Years | 3,965 (37.3%) | $54,771 |
| 65+ Years | 4,191 (39.4%) | $48,199 |
| Total | 10,626 (100.0%) | $52,780 |
Poverty in Cleburne County
Income Below Poverty by Sex and Age in Cleburne County
With 14.1% poverty level for males and 14.1% for females among the residents of Cleburne County, 5 year old males and 25 to 34 year old females are the most vulnerable to poverty, with 41 males (31.5%) and 322 females (27.7%) in their respective age groups living below the poverty level.
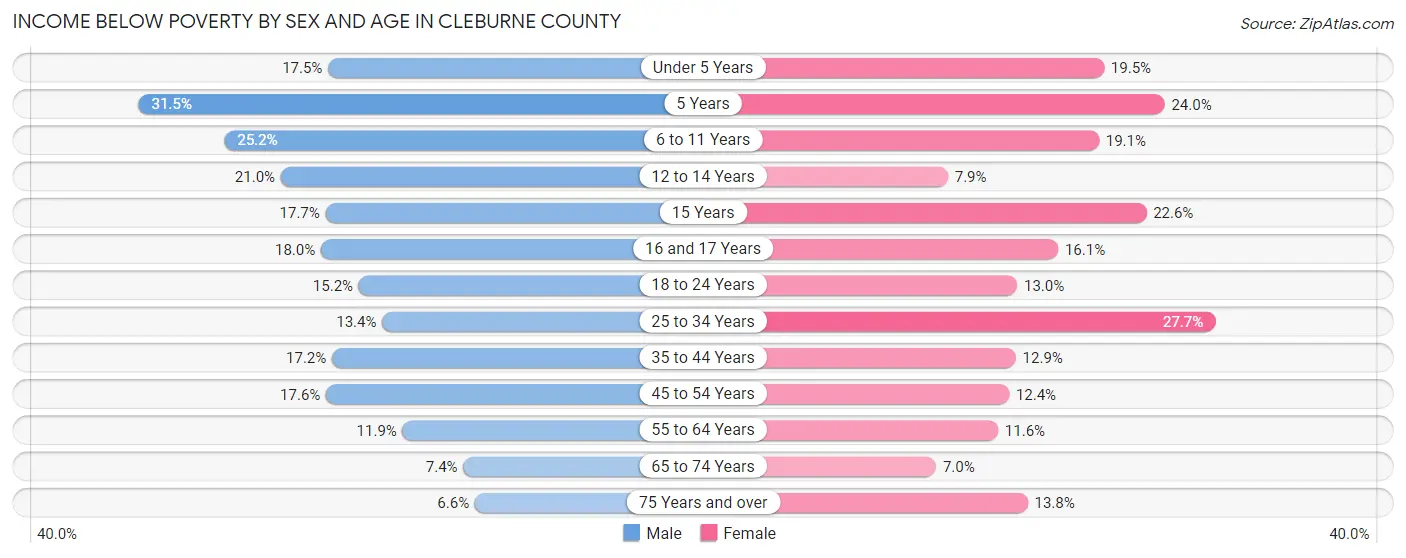
| Age Bracket | Male | Female |
| Under 5 Years | 99 (17.5%) | 94 (19.5%) |
| 5 Years | 41 (31.5%) | 23 (24.0%) |
| 6 to 11 Years | 189 (25.2%) | 166 (19.1%) |
| 12 to 14 Years | 99 (21.0%) | 27 (7.9%) |
| 15 Years | 21 (17.6%) | 40 (22.6%) |
| 16 and 17 Years | 59 (18.0%) | 48 (16.1%) |
| 18 to 24 Years | 134 (15.2%) | 96 (13.0%) |
| 25 to 34 Years | 162 (13.4%) | 322 (27.7%) |
| 35 to 44 Years | 226 (17.2%) | 179 (12.9%) |
| 45 to 54 Years | 249 (17.6%) | 168 (12.4%) |
| 55 to 64 Years | 232 (11.9%) | 223 (11.6%) |
| 65 to 74 Years | 131 (7.4%) | 130 (7.0%) |
| 75 Years and over | 90 (6.6%) | 221 (13.8%) |
| Total | 1,732 (14.1%) | 1,737 (14.1%) |
Income Above Poverty by Sex and Age in Cleburne County
According to the poverty statistics in Cleburne County, males aged 75 years and over and females aged 65 to 74 years are the age groups that are most secure financially, with 93.4% of males and 93.0% of females in these age groups living above the poverty line.
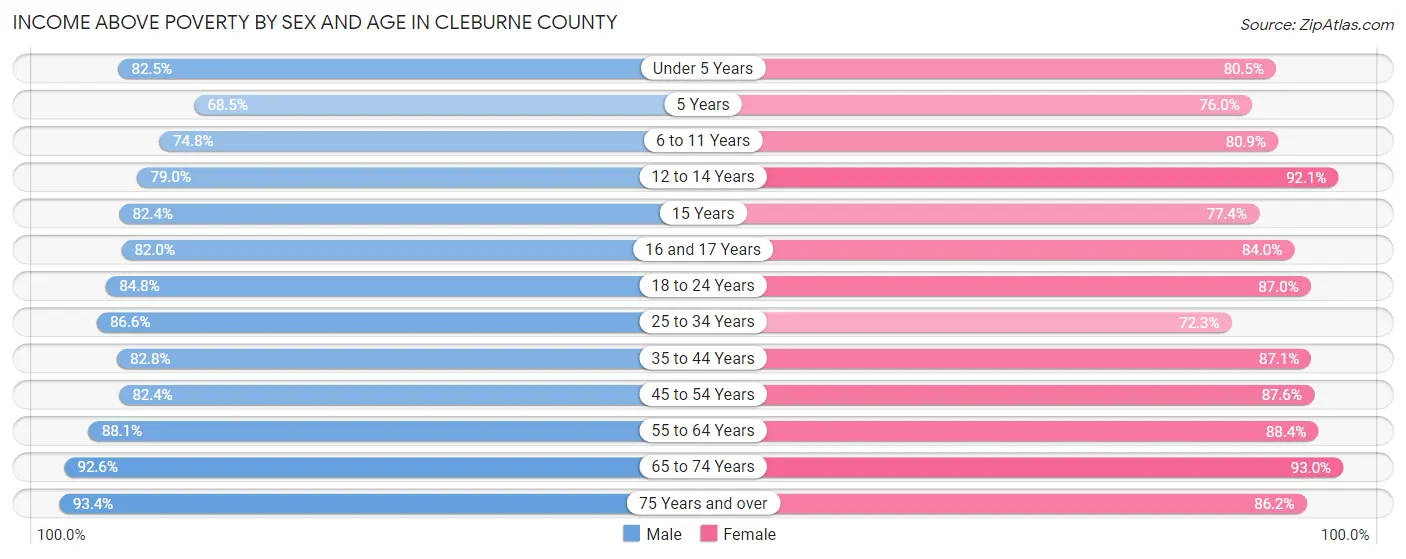
| Age Bracket | Male | Female |
| Under 5 Years | 468 (82.5%) | 389 (80.5%) |
| 5 Years | 89 (68.5%) | 73 (76.0%) |
| 6 to 11 Years | 562 (74.8%) | 704 (80.9%) |
| 12 to 14 Years | 373 (79.0%) | 316 (92.1%) |
| 15 Years | 98 (82.4%) | 137 (77.4%) |
| 16 and 17 Years | 269 (82.0%) | 251 (84.0%) |
| 18 to 24 Years | 749 (84.8%) | 642 (87.0%) |
| 25 to 34 Years | 1,043 (86.6%) | 840 (72.3%) |
| 35 to 44 Years | 1,090 (82.8%) | 1,208 (87.1%) |
| 45 to 54 Years | 1,165 (82.4%) | 1,186 (87.6%) |
| 55 to 64 Years | 1,713 (88.1%) | 1,701 (88.4%) |
| 65 to 74 Years | 1,635 (92.6%) | 1,731 (93.0%) |
| 75 Years and over | 1,282 (93.4%) | 1,382 (86.2%) |
| Total | 10,536 (85.9%) | 10,560 (85.9%) |
Income Below Poverty Among Married-Couple Families in Cleburne County
The poverty statistics for married-couple families in Cleburne County show that 5.9% or 338 of the total 5,679 families live below the poverty line. Families with 5 or more children have the highest poverty rate of 100.0%, comprising of 23 families. On the other hand, families with 1 or 2 children have the lowest poverty rate of 2.9%, which includes 42 families.
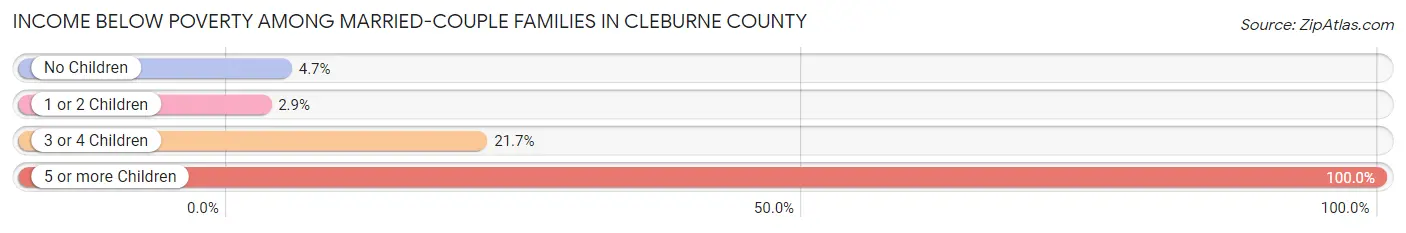
| Children | Above Poverty | Below Poverty |
| No Children | 3,582 (95.3%) | 176 (4.7%) |
| 1 or 2 Children | 1,409 (97.1%) | 42 (2.9%) |
| 3 or 4 Children | 350 (78.3%) | 97 (21.7%) |
| 5 or more Children | 0 (0.0%) | 23 (100.0%) |
| Total | 5,341 (94.1%) | 338 (5.9%) |
Income Below Poverty Among Single-Parent Households in Cleburne County
According to the poverty data in Cleburne County, 33.9% or 177 single-father households and 26.1% or 206 single-mother households are living below the poverty line. Among single-father households, those with 5 or more children have the highest poverty rate, with 12 households (100.0%) experiencing poverty. Likewise, among single-mother households, those with 3 or 4 children have the highest poverty rate, with 61 households (100.0%) falling below the poverty line.
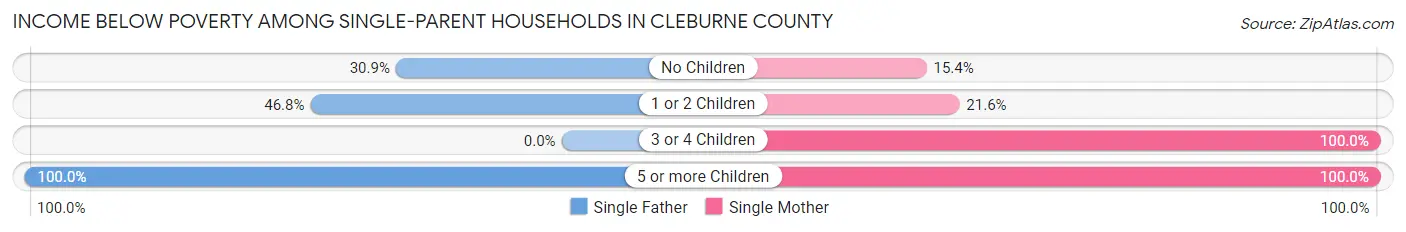
| Children | Single Father | Single Mother |
| No Children | 92 (30.9%) | 44 (15.4%) |
| 1 or 2 Children | 73 (46.8%) | 94 (21.6%) |
| 3 or 4 Children | 0 (0.0%) | 61 (100.0%) |
| 5 or more Children | 12 (100.0%) | 7 (100.0%) |
| Total | 177 (33.9%) | 206 (26.1%) |
Income Below Poverty Among Married-Couple vs Single-Parent Households in Cleburne County
The poverty data for Cleburne County shows that 338 of the married-couple family households (5.9%) and 383 of the single-parent households (29.2%) are living below the poverty level. Within the married-couple family households, those with 5 or more children have the highest poverty rate, with 23 households (100.0%) falling below the poverty line. Among the single-parent households, those with 5 or more children have the highest poverty rate, with 19 household (100.0%) living below poverty.
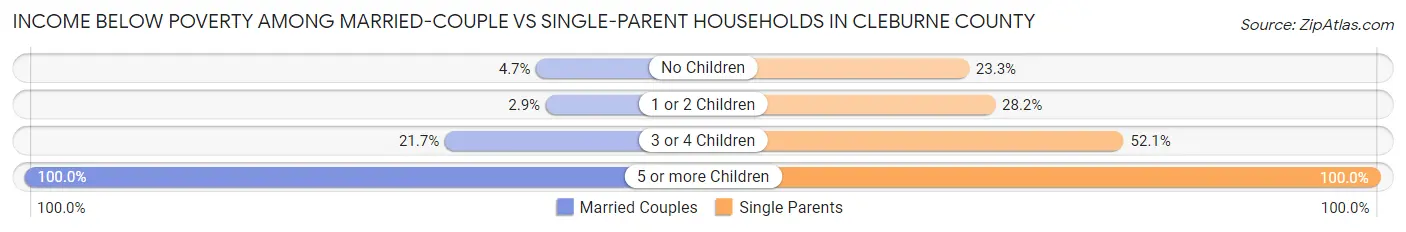
| Children | Married-Couple Families | Single-Parent Households |
| No Children | 176 (4.7%) | 136 (23.3%) |
| 1 or 2 Children | 42 (2.9%) | 167 (28.2%) |
| 3 or 4 Children | 97 (21.7%) | 61 (52.1%) |
| 5 or more Children | 23 (100.0%) | 19 (100.0%) |
| Total | 338 (5.9%) | 383 (29.2%) |
Race in Cleburne County
The most populous races in Cleburne County are White / Caucasian (23,593 | 94.6%), Two or more Races (890 | 3.6%), and Hispanic or Latino (681 | 2.7%).
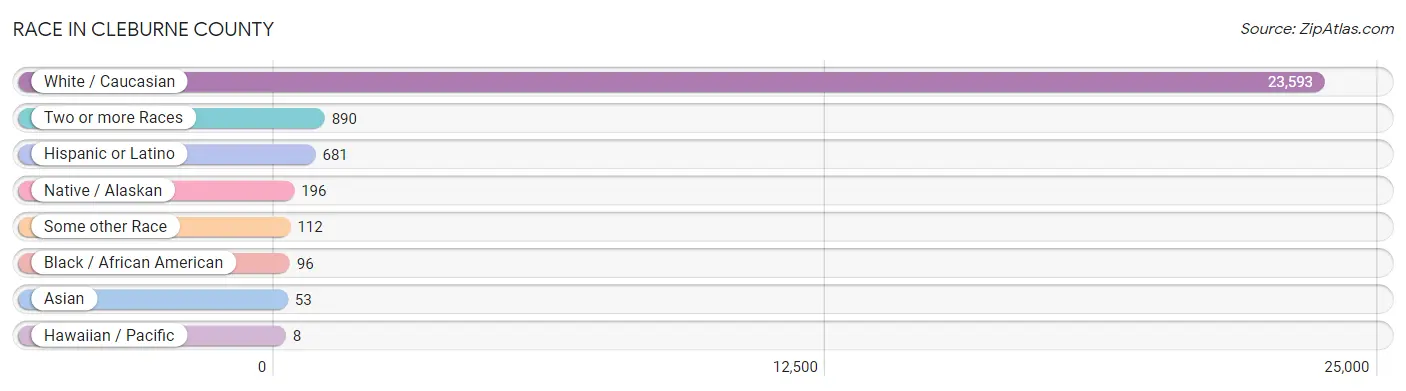
| Race | # Population | % Population |
| Asian | 53 | 0.2% |
| Black / African American | 96 | 0.4% |
| Hawaiian / Pacific | 8 | 0.0% |
| Hispanic or Latino | 681 | 2.7% |
| Native / Alaskan | 196 | 0.8% |
| White / Caucasian | 23,593 | 94.6% |
| Two or more Races | 890 | 3.6% |
| Some other Race | 112 | 0.4% |
| Total | 24,948 | 100.0% |
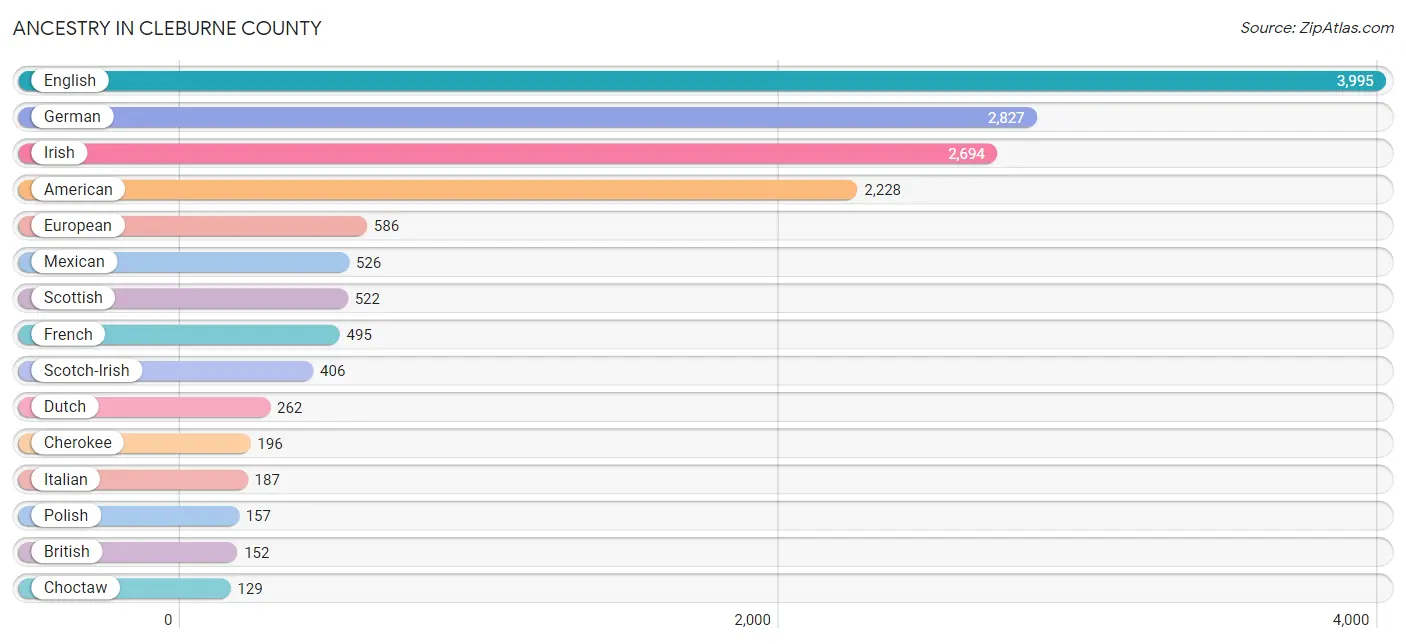
Ancestry in Cleburne County
The most populous ancestries reported in Cleburne County are English (3,995 | 16.0%), German (2,827 | 11.3%), Irish (2,694 | 10.8%), American (2,228 | 8.9%), and European (586 | 2.4%), together accounting for 49.4% of all Cleburne County residents.
| Ancestry | # Population | % Population |
| American | 2,228 | 8.9% |
| Apache | 10 | 0.0% |
| Austrian | 11 | 0.0% |
| Basque | 12 | 0.1% |
| Bhutanese | 26 | 0.1% |
| Blackfeet | 10 | 0.0% |
| British | 152 | 0.6% |
| Burmese | 6 | 0.0% |
| Cajun | 2 | 0.0% |
| Cherokee | 196 | 0.8% |
| Choctaw | 129 | 0.5% |
| Creek | 13 | 0.1% |
| Crow | 1 | 0.0% |
| Cuban | 9 | 0.0% |
| Czech | 31 | 0.1% |
| Danish | 18 | 0.1% |
| Dominican | 7 | 0.0% |
| Dutch | 262 | 1.1% |
| Eastern European | 75 | 0.3% |
| English | 3,995 | 16.0% |
| European | 586 | 2.4% |
| Finnish | 42 | 0.2% |
| French | 495 | 2.0% |
| French Canadian | 16 | 0.1% |
| German | 2,827 | 11.3% |
| Hungarian | 29 | 0.1% |
| Irish | 2,694 | 10.8% |
| Italian | 187 | 0.7% |
| Lumbee | 6 | 0.0% |
| Mexican | 526 | 2.1% |
| Native Hawaiian | 22 | 0.1% |
| Navajo | 33 | 0.1% |
| Northern European | 33 | 0.1% |
| Norwegian | 49 | 0.2% |
| Ottawa | 16 | 0.1% |
| Pennsylvania German | 22 | 0.1% |
| Polish | 157 | 0.6% |
| Potawatomi | 5 | 0.0% |
| Puerto Rican | 71 | 0.3% |
| Russian | 10 | 0.0% |
| Scandinavian | 33 | 0.1% |
| Scotch-Irish | 406 | 1.6% |
| Scottish | 522 | 2.1% |
| Sioux | 8 | 0.0% |
| Slovak | 22 | 0.1% |
| Slovene | 6 | 0.0% |
| Spaniard | 49 | 0.2% |
| Spanish | 19 | 0.1% |
| Swedish | 77 | 0.3% |
| Thai | 25 | 0.1% |
| Ukrainian | 36 | 0.1% |
| Welsh | 62 | 0.3% |
| Yugoslavian | 15 | 0.1% | View All 53 Rows |
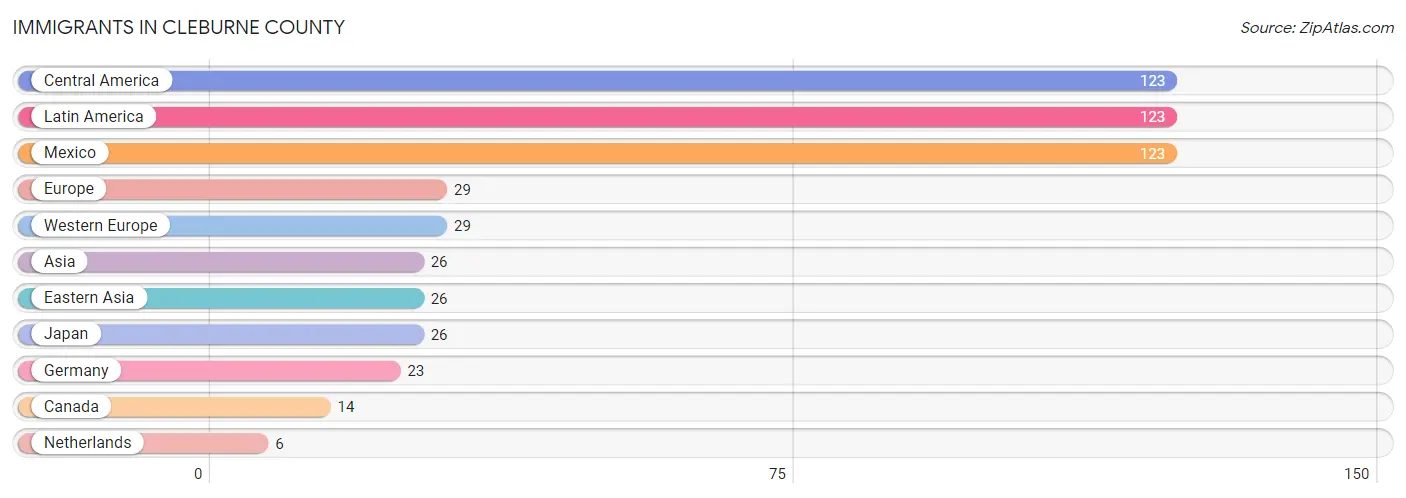
Immigrants in Cleburne County
The most numerous immigrant groups reported in Cleburne County came from Central America (123 | 0.5%), Latin America (123 | 0.5%), Mexico (123 | 0.5%), Europe (29 | 0.1%), and Western Europe (29 | 0.1%), together accounting for 1.7% of all Cleburne County residents.
| Immigration Origin | # Population | % Population |
| Asia | 26 | 0.1% |
| Canada | 14 | 0.1% |
| Central America | 123 | 0.5% |
| Eastern Asia | 26 | 0.1% |
| Europe | 29 | 0.1% |
| Germany | 23 | 0.1% |
| Japan | 26 | 0.1% |
| Latin America | 123 | 0.5% |
| Mexico | 123 | 0.5% |
| Netherlands | 6 | 0.0% |
| Western Europe | 29 | 0.1% | View All 11 Rows |
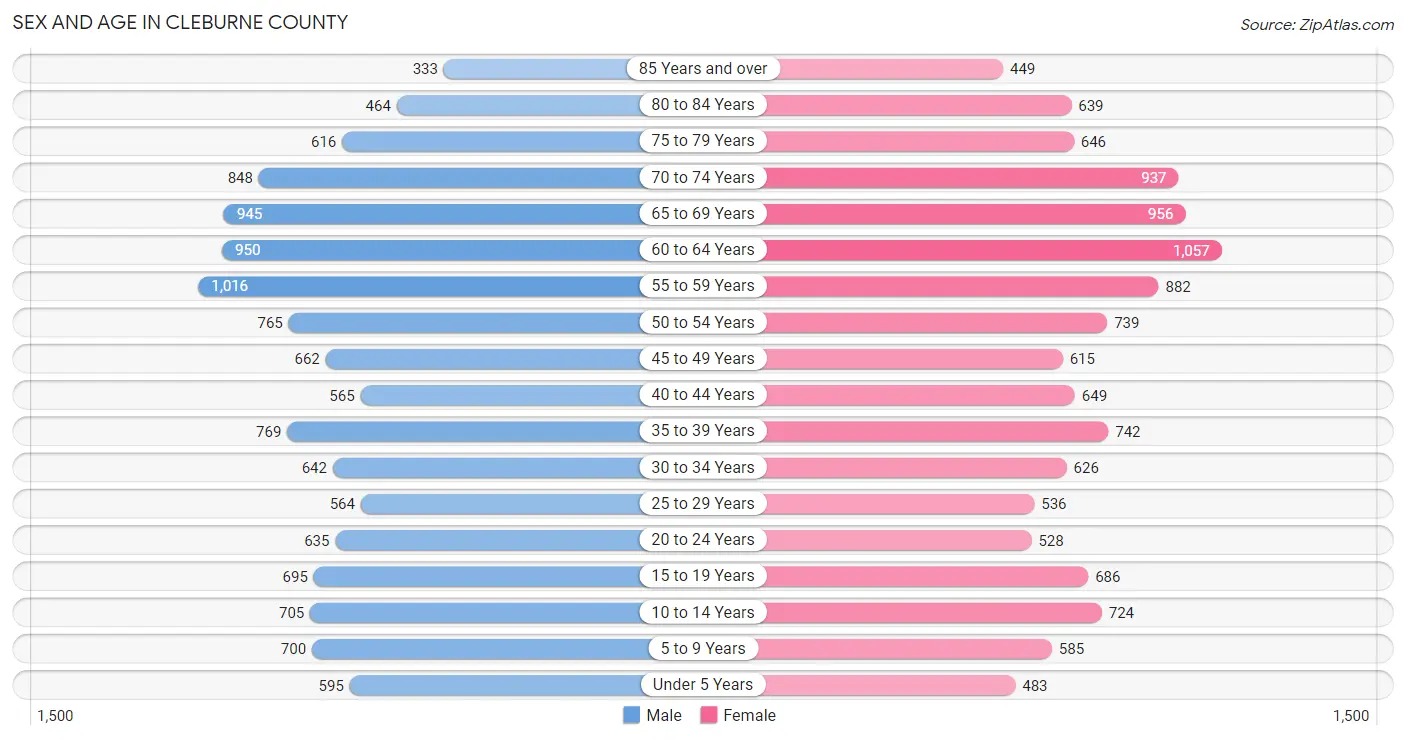
Sex and Age in Cleburne County
Sex and Age in Cleburne County
The most populous age groups in Cleburne County are 55 to 59 Years (1,016 | 8.2%) for men and 60 to 64 Years (1,057 | 8.5%) for women.
| Age Bracket | Male | Female |
| Under 5 Years | 595 (4.8%) | 483 (3.9%) |
| 5 to 9 Years | 700 (5.6%) | 585 (4.7%) |
| 10 to 14 Years | 705 (5.7%) | 724 (5.8%) |
| 15 to 19 Years | 695 (5.6%) | 686 (5.5%) |
| 20 to 24 Years | 635 (5.1%) | 528 (4.2%) |
| 25 to 29 Years | 564 (4.5%) | 536 (4.3%) |
| 30 to 34 Years | 642 (5.1%) | 626 (5.0%) |
| 35 to 39 Years | 769 (6.2%) | 742 (5.9%) |
| 40 to 44 Years | 565 (4.5%) | 649 (5.2%) |
| 45 to 49 Years | 662 (5.3%) | 615 (4.9%) |
| 50 to 54 Years | 765 (6.1%) | 739 (5.9%) |
| 55 to 59 Years | 1,016 (8.2%) | 882 (7.1%) |
| 60 to 64 Years | 950 (7.6%) | 1,057 (8.5%) |
| 65 to 69 Years | 945 (7.6%) | 956 (7.7%) |
| 70 to 74 Years | 848 (6.8%) | 937 (7.5%) |
| 75 to 79 Years | 616 (4.9%) | 646 (5.2%) |
| 80 to 84 Years | 464 (3.7%) | 639 (5.1%) |
| 85 Years and over | 333 (2.7%) | 449 (3.6%) |
| Total | 12,469 (100.0%) | 12,479 (100.0%) |
Families and Households in Cleburne County
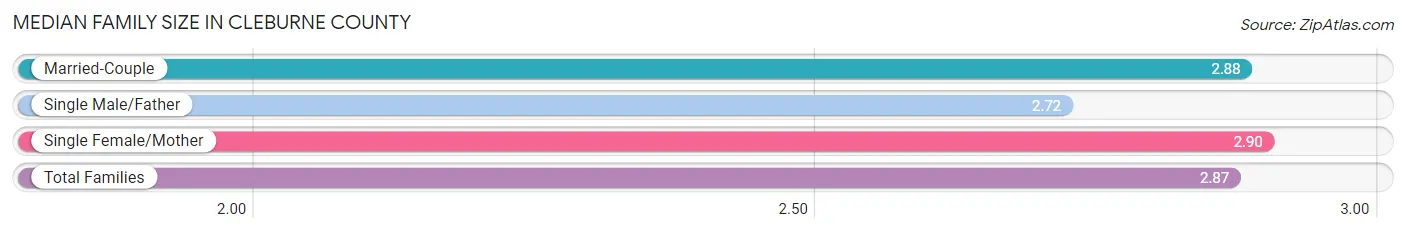
Median Family Size in Cleburne County
The median family size in Cleburne County is 2.87 persons per family, with single female/mother families (789 | 11.3%) accounting for the largest median family size of 2.9 persons per family. On the other hand, single male/father families (522 | 7.5%) represent the smallest median family size with 2.72 persons per family.
| Family Type | # Families | Family Size |
| Married-Couple | 5,679 (81.2%) | 2.88 |
| Single Male/Father | 522 (7.5%) | 2.72 |
| Single Female/Mother | 789 (11.3%) | 2.90 |
| Total Families | 6,990 (100.0%) | 2.87 |
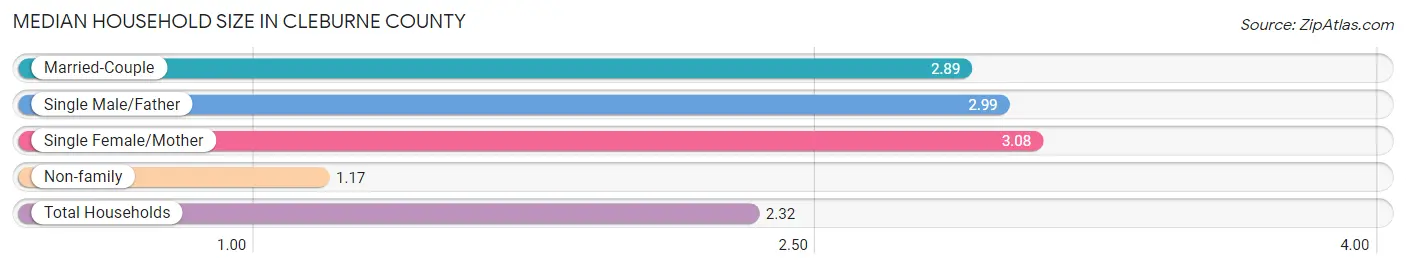
Median Household Size in Cleburne County
The median household size in Cleburne County is 2.32 persons per household, with single female/mother households (789 | 7.4%) accounting for the largest median household size of 3.08 persons per household. non-family households (3,636 | 34.2%) represent the smallest median household size with 1.17 persons per household.
| Household Type | # Households | Household Size |
| Married-Couple | 5,679 (53.4%) | 2.89 |
| Single Male/Father | 522 (4.9%) | 2.99 |
| Single Female/Mother | 789 (7.4%) | 3.08 |
| Non-family | 3,636 (34.2%) | 1.17 |
| Total Households | 10,626 (100.0%) | 2.32 |
Household Size by Marriage Status in Cleburne County
Out of a total of 10,626 households in Cleburne County, 6,990 (65.8%) are family households, while 3,636 (34.2%) are nonfamily households. The most numerous type of family households are 2-person households, comprising 3,923, and the most common type of nonfamily households are 1-person households, comprising 3,269.
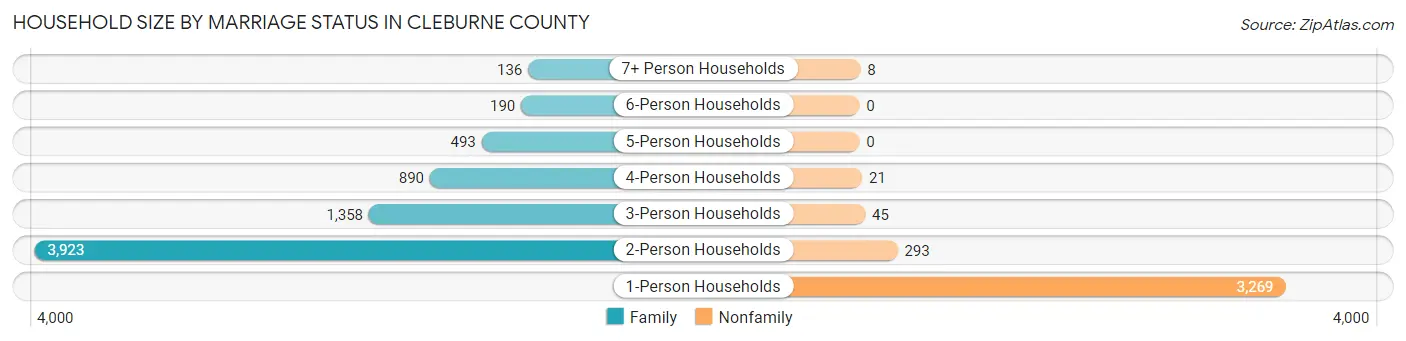
| Household Size | Family Households | Nonfamily Households |
| 1-Person Households | - | 3,269 (30.8%) |
| 2-Person Households | 3,923 (36.9%) | 293 (2.8%) |
| 3-Person Households | 1,358 (12.8%) | 45 (0.4%) |
| 4-Person Households | 890 (8.4%) | 21 (0.2%) |
| 5-Person Households | 493 (4.6%) | 0 (0.0%) |
| 6-Person Households | 190 (1.8%) | 0 (0.0%) |
| 7+ Person Households | 136 (1.3%) | 8 (0.1%) |
| Total | 6,990 (65.8%) | 3,636 (34.2%) |
Female Fertility in Cleburne County
Fertility by Age in Cleburne County
Average fertility rate in Cleburne County is 63.0 births per 1,000 women. Women in the age bracket of 20 to 34 years have the highest fertility rate with 160.0 births per 1,000 women. Women in the age bracket of 20 to 34 years acount for 95.1% of all women with births.
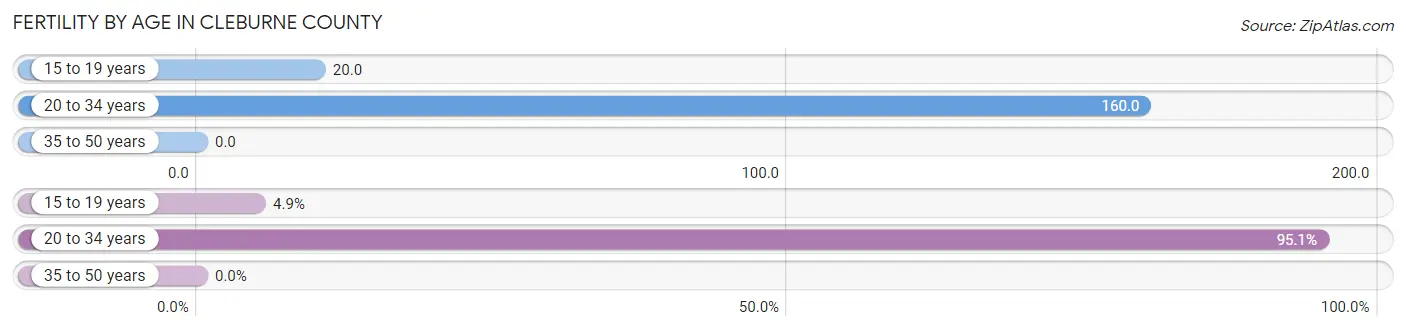
| Age Bracket | Women with Births | Births / 1,000 Women |
| 15 to 19 years | 14 (4.9%) | 20.0 |
| 20 to 34 years | 270 (95.1%) | 160.0 |
| 35 to 50 years | 0 (0.0%) | 0.0 |
| Total | 284 (100.0%) | 63.0 |
Fertility by Age by Marriage Status in Cleburne County
88.4% of women with births (284) in Cleburne County are married. The highest percentage of unmarried women with births falls into 20 to 34 years age bracket with 12.2% of them unmarried at the time of birth, while the lowest percentage of unmarried women with births belong to 15 to 19 years age bracket with 0.0% of them unmarried.
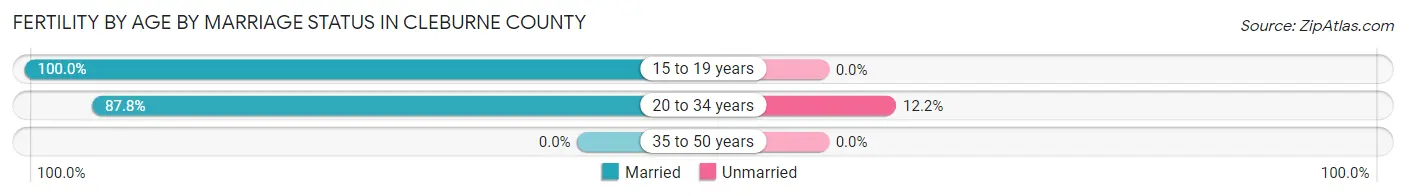
| Age Bracket | Married | Unmarried |
| 15 to 19 years | 14 (100.0%) | 0 (0.0%) |
| 20 to 34 years | 237 (87.8%) | 33 (12.2%) |
| 35 to 50 years | 0 (0.0%) | 0 (0.0%) |
| Total | 251 (88.4%) | 33 (11.6%) |
Fertility by Education in Cleburne County
Average fertility rate in Cleburne County is 63.0 births per 1,000 women. Women with the education attainment of graduate degree have the highest fertility rate of 129.0 births per 1,000 women, while women with the education attainment of college or associate's degree have the lowest fertility at 29.0 births per 1,000 women. Women with the education attainment of high school diploma represent 49.6% of all women with births.
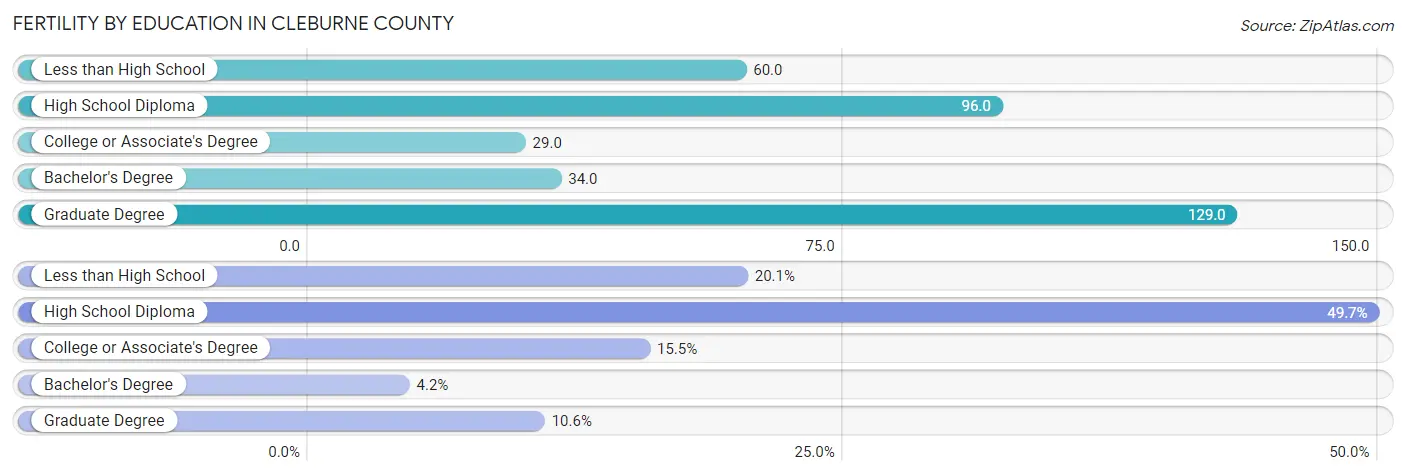
| Educational Attainment | Women with Births | Births / 1,000 Women |
| Less than High School | 57 (20.1%) | 60.0 |
| High School Diploma | 141 (49.6%) | 96.0 |
| College or Associate's Degree | 44 (15.5%) | 29.0 |
| Bachelor's Degree | 12 (4.2%) | 34.0 |
| Graduate Degree | 30 (10.6%) | 129.0 |
| Total | 284 (100.0%) | 63.0 |
Fertility by Education by Marriage Status in Cleburne County
11.6% of women with births in Cleburne County are unmarried. Women with the educational attainment of bachelor's degree are most likely to be married with 100.0% of them married at childbirth, while women with the educational attainment of less than high school are least likely to be married with 36.8% of them unmarried at childbirth.
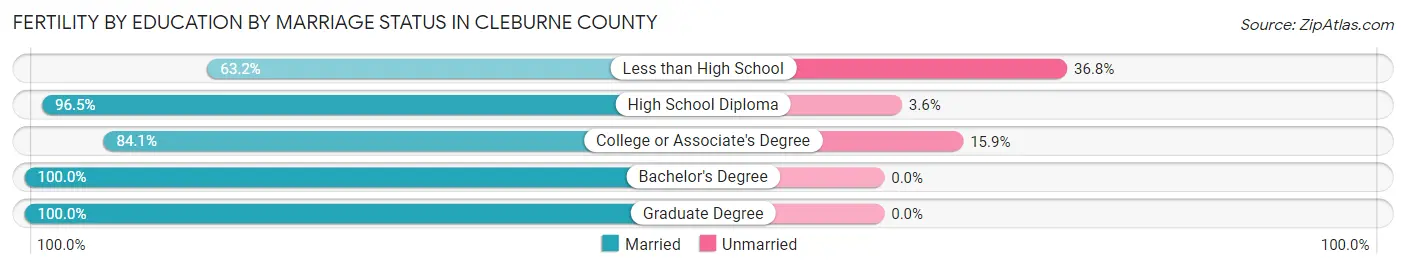
| Educational Attainment | Married | Unmarried |
| Less than High School | 36 (63.2%) | 21 (36.8%) |
| High School Diploma | 136 (96.5%) | 5 (3.5%) |
| College or Associate's Degree | 37 (84.1%) | 7 (15.9%) |
| Bachelor's Degree | 12 (100.0%) | 0 (0.0%) |
| Graduate Degree | 30 (100.0%) | 0 (0.0%) |
| Total | 251 (88.4%) | 33 (11.6%) |
Employment Characteristics in Cleburne County
Employment by Class of Employer in Cleburne County
Among the 9,354 employed individuals in Cleburne County, private company employees (6,359 | 68.0%), self-employed (not incorporated) (1,046 | 11.2%), and local government employees (555 | 5.9%) make up the most common classes of employment.
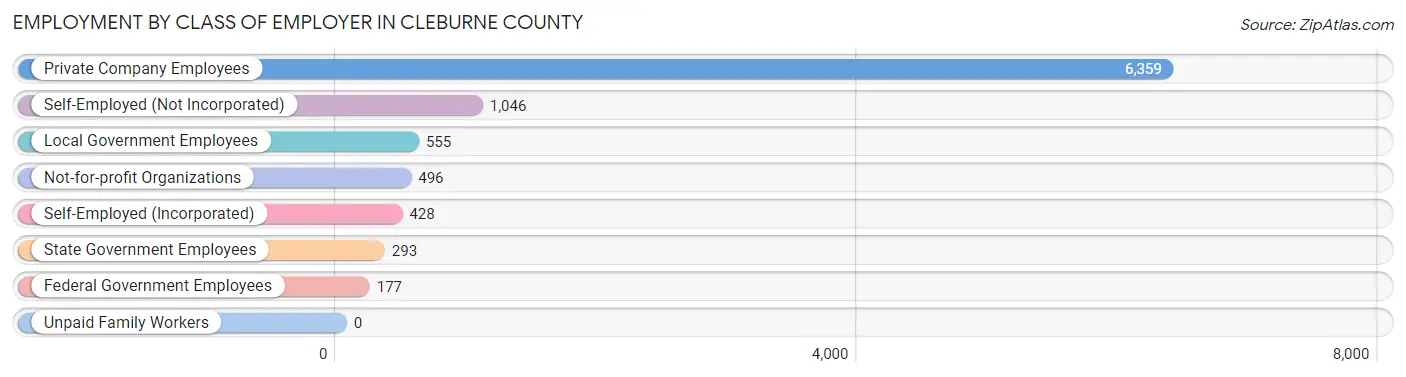
| Employer Class | # Employees | % Employees |
| Private Company Employees | 6,359 | 68.0% |
| Self-Employed (Incorporated) | 428 | 4.6% |
| Self-Employed (Not Incorporated) | 1,046 | 11.2% |
| Not-for-profit Organizations | 496 | 5.3% |
| Local Government Employees | 555 | 5.9% |
| State Government Employees | 293 | 3.1% |
| Federal Government Employees | 177 | 1.9% |
| Unpaid Family Workers | 0 | 0.0% |
| Total | 9,354 | 100.0% |
Employment Status by Age in Cleburne County
According to the labor force statistics for Cleburne County, out of the total population over 16 years of age (20,860), 48.0% or 10,013 individuals are in the labor force, with 6.0% or 601 of them unemployed. The age group with the highest labor force participation rate is 35 to 44 years, with 82.4% or 2,245 individuals in the labor force. Within the labor force, the 20 to 24 years age range has the highest percentage of unemployed individuals, with 26.9% or 239 of them being unemployed.
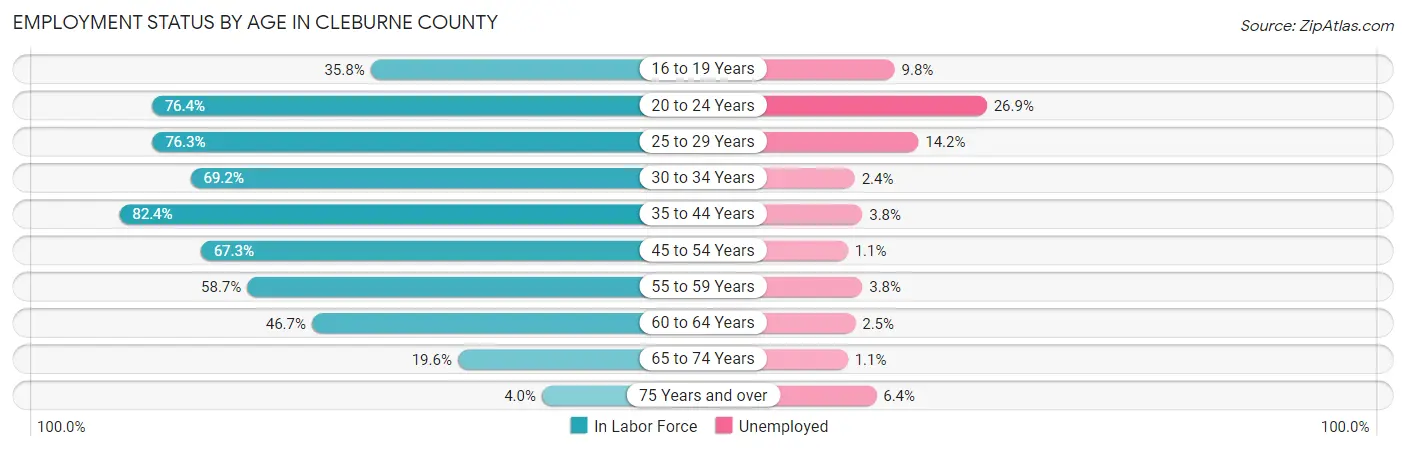
| Age Bracket | In Labor Force | Unemployed |
| 16 to 19 Years | 388 (35.8%) | 38 (9.8%) |
| 20 to 24 Years | 889 (76.4%) | 239 (26.9%) |
| 25 to 29 Years | 839 (76.3%) | 119 (14.2%) |
| 30 to 34 Years | 877 (69.2%) | 21 (2.4%) |
| 35 to 44 Years | 2,245 (82.4%) | 85 (3.8%) |
| 45 to 54 Years | 1,872 (67.3%) | 21 (1.1%) |
| 55 to 59 Years | 1,114 (58.7%) | 42 (3.8%) |
| 60 to 64 Years | 937 (46.7%) | 23 (2.5%) |
| 65 to 74 Years | 722 (19.6%) | 8 (1.1%) |
| 75 Years and over | 126 (4.0%) | 8 (6.4%) |
| Total | 10,013 (48.0%) | 601 (6.0%) |
Employment Status by Educational Attainment in Cleburne County
According to labor force statistics for Cleburne County, 66.9% of individuals (7,880) out of the total population between 25 and 64 years of age (11,779) are in the labor force, with 3.9% or 307 of them being unemployed. The group with the highest labor force participation rate are those with the educational attainment of bachelor's degree or higher, with 71.5% or 1,313 individuals in the labor force. Within the labor force, individuals with less than high school education have the highest percentage of unemployment, with 15.9% or 114 of them being unemployed.
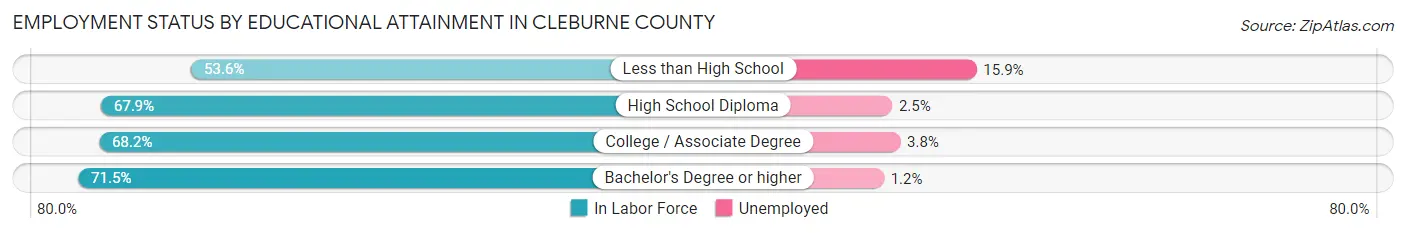
| Educational Attainment | In Labor Force | Unemployed |
| Less than High School | 717 (53.6%) | 213 (15.9%) |
| High School Diploma | 3,285 (67.9%) | 121 (2.5%) |
| College / Associate Degree | 2,568 (68.2%) | 143 (3.8%) |
| Bachelor's Degree or higher | 1,313 (71.5%) | 22 (1.2%) |
| Total | 7,880 (66.9%) | 459 (3.9%) |
Employment Occupations by Sex in Cleburne County
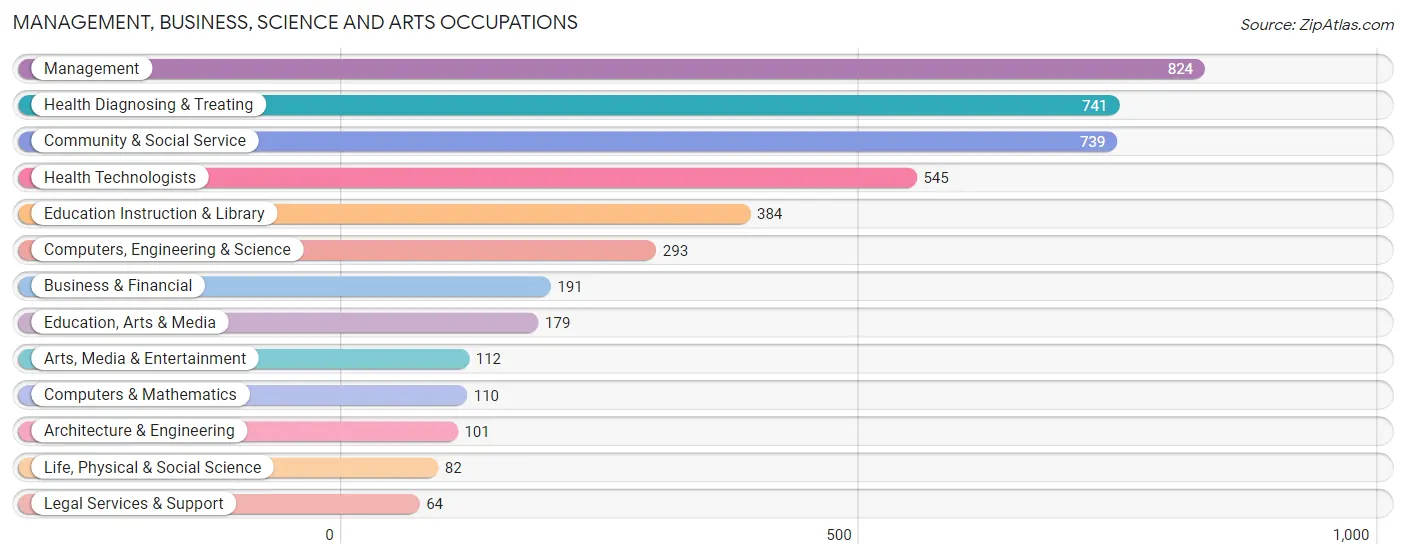
Management, Business, Science and Arts Occupations
The most common Management, Business, Science and Arts occupations in Cleburne County are Management (824 | 8.8%), Health Diagnosing & Treating (741 | 7.9%), Community & Social Service (739 | 7.9%), Health Technologists (545 | 5.8%), and Education Instruction & Library (384 | 4.1%).
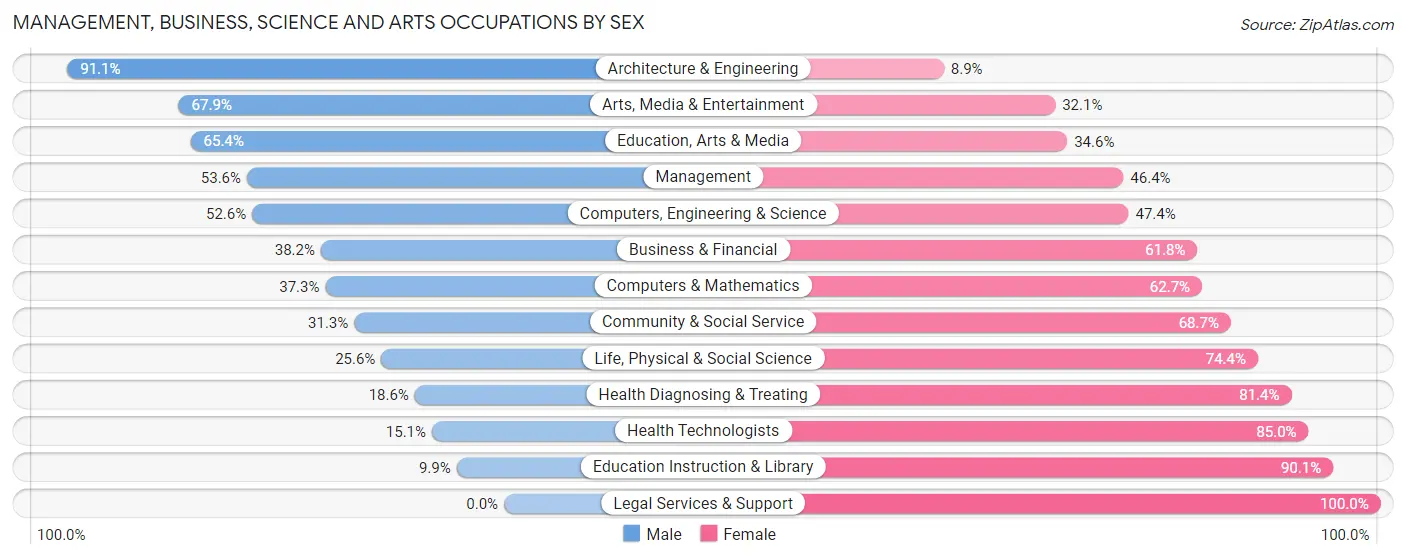
Management, Business, Science and Arts Occupations by Sex
Within the Management, Business, Science and Arts occupations in Cleburne County, the most male-oriented occupations are Architecture & Engineering (91.1%), Arts, Media & Entertainment (67.9%), and Education, Arts & Media (65.4%), while the most female-oriented occupations are Legal Services & Support (100.0%), Education Instruction & Library (90.1%), and Health Technologists (85.0%).
| Occupation | Male | Female |
| Management | 442 (53.6%) | 382 (46.4%) |
| Business & Financial | 73 (38.2%) | 118 (61.8%) |
| Computers, Engineering & Science | 154 (52.6%) | 139 (47.4%) |
| Computers & Mathematics | 41 (37.3%) | 69 (62.7%) |
| Architecture & Engineering | 92 (91.1%) | 9 (8.9%) |
| Life, Physical & Social Science | 21 (25.6%) | 61 (74.4%) |
| Community & Social Service | 231 (31.3%) | 508 (68.7%) |
| Education, Arts & Media | 117 (65.4%) | 62 (34.6%) |
| Legal Services & Support | 0 (0.0%) | 64 (100.0%) |
| Education Instruction & Library | 38 (9.9%) | 346 (90.1%) |
| Arts, Media & Entertainment | 76 (67.9%) | 36 (32.1%) |
| Health Diagnosing & Treating | 138 (18.6%) | 603 (81.4%) |
| Health Technologists | 82 (15.0%) | 463 (85.0%) |
| Total (Category) | 1,038 (37.2%) | 1,750 (62.8%) |
| Total (Overall) | 5,129 (54.6%) | 4,257 (45.4%) |
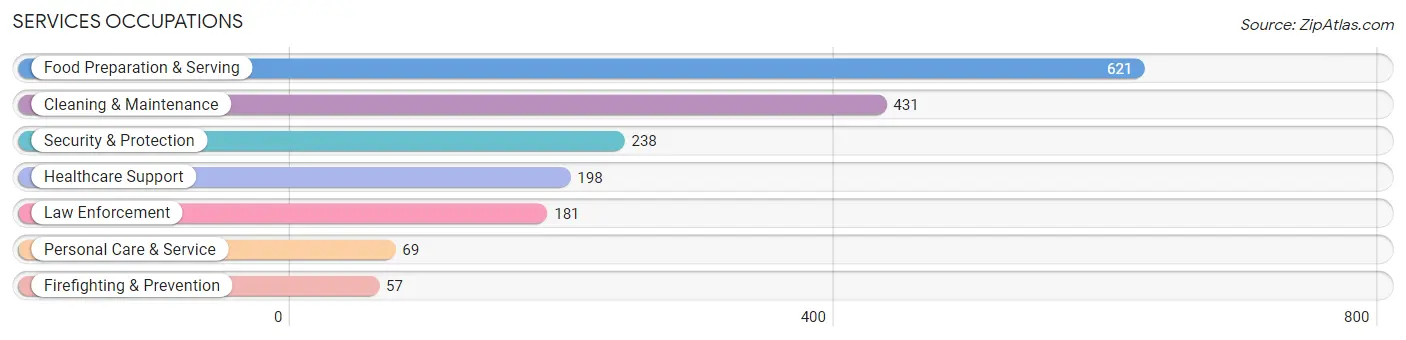
Services Occupations
The most common Services occupations in Cleburne County are Food Preparation & Serving (621 | 6.6%), Cleaning & Maintenance (431 | 4.6%), Security & Protection (238 | 2.5%), Healthcare Support (198 | 2.1%), and Law Enforcement (181 | 1.9%).
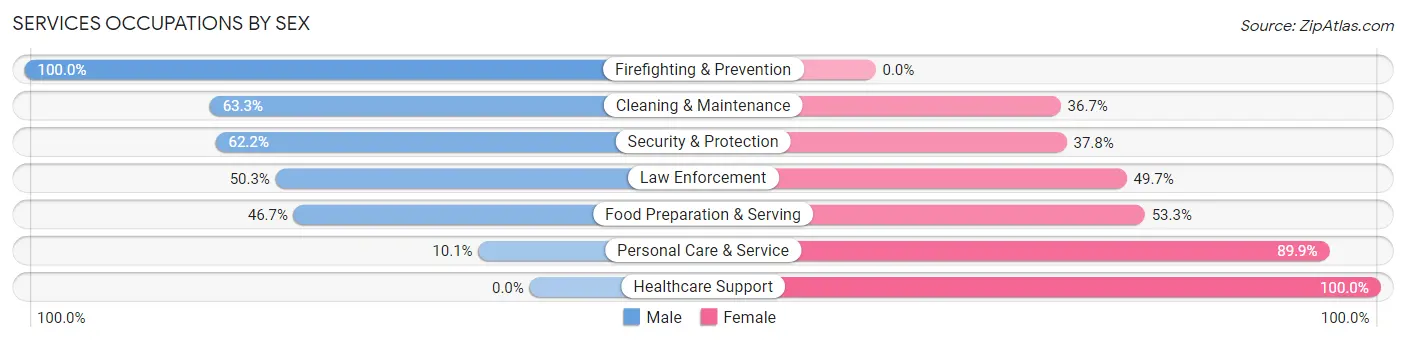
Services Occupations by Sex
Within the Services occupations in Cleburne County, the most male-oriented occupations are Firefighting & Prevention (100.0%), Cleaning & Maintenance (63.3%), and Security & Protection (62.2%), while the most female-oriented occupations are Healthcare Support (100.0%), Personal Care & Service (89.9%), and Food Preparation & Serving (53.3%).
| Occupation | Male | Female |
| Healthcare Support | 0 (0.0%) | 198 (100.0%) |
| Security & Protection | 148 (62.2%) | 90 (37.8%) |
| Firefighting & Prevention | 57 (100.0%) | 0 (0.0%) |
| Law Enforcement | 91 (50.3%) | 90 (49.7%) |
| Food Preparation & Serving | 290 (46.7%) | 331 (53.3%) |
| Cleaning & Maintenance | 273 (63.3%) | 158 (36.7%) |
| Personal Care & Service | 7 (10.1%) | 62 (89.9%) |
| Total (Category) | 718 (46.1%) | 839 (53.9%) |
| Total (Overall) | 5,129 (54.6%) | 4,257 (45.4%) |
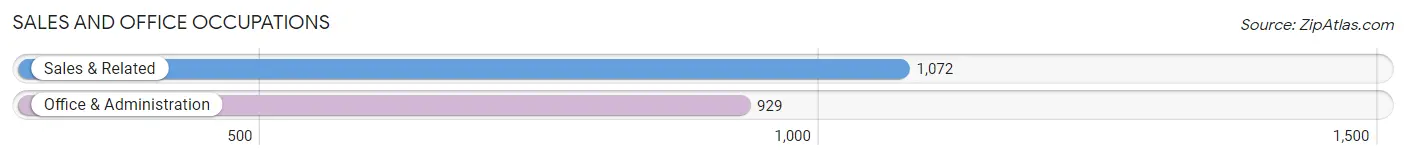
Sales and Office Occupations
The most common Sales and Office occupations in Cleburne County are Sales & Related (1,072 | 11.4%), and Office & Administration (929 | 9.9%).
Sales and Office Occupations by Sex
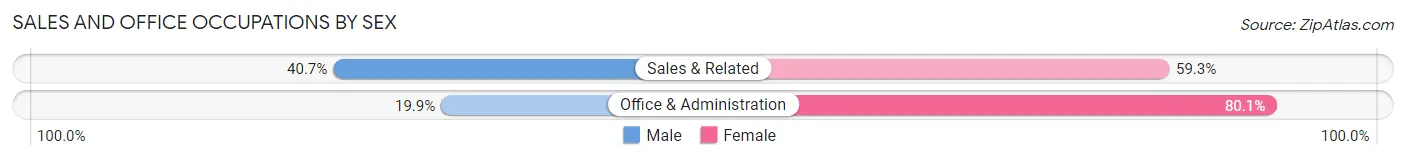
| Occupation | Male | Female |
| Sales & Related | 436 (40.7%) | 636 (59.3%) |
| Office & Administration | 185 (19.9%) | 744 (80.1%) |
| Total (Category) | 621 (31.0%) | 1,380 (69.0%) |
| Total (Overall) | 5,129 (54.6%) | 4,257 (45.4%) |
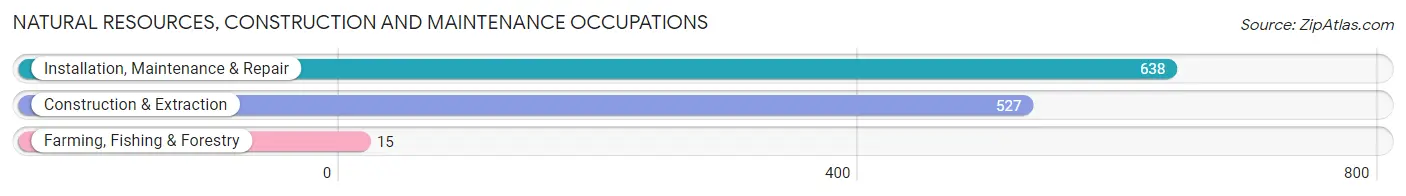
Natural Resources, Construction and Maintenance Occupations
The most common Natural Resources, Construction and Maintenance occupations in Cleburne County are Installation, Maintenance & Repair (638 | 6.8%), Construction & Extraction (527 | 5.6%), and Farming, Fishing & Forestry (15 | 0.2%).
Natural Resources, Construction and Maintenance Occupations by Sex
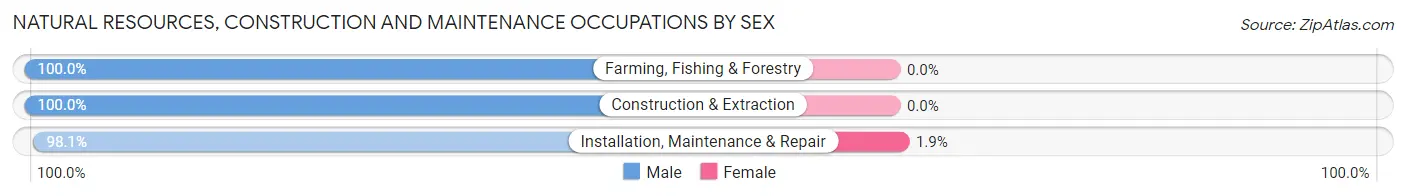
| Occupation | Male | Female |
| Farming, Fishing & Forestry | 15 (100.0%) | 0 (0.0%) |
| Construction & Extraction | 527 (100.0%) | 0 (0.0%) |
| Installation, Maintenance & Repair | 626 (98.1%) | 12 (1.9%) |
| Total (Category) | 1,168 (99.0%) | 12 (1.0%) |
| Total (Overall) | 5,129 (54.6%) | 4,257 (45.4%) |
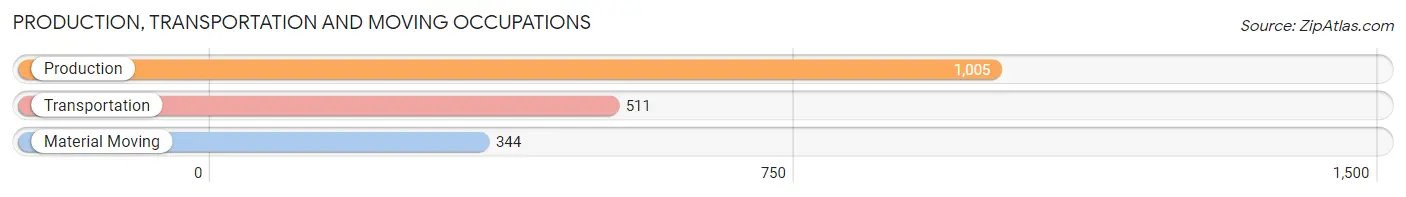
Production, Transportation and Moving Occupations
The most common Production, Transportation and Moving occupations in Cleburne County are Production (1,005 | 10.7%), Transportation (511 | 5.4%), and Material Moving (344 | 3.7%).
Production, Transportation and Moving Occupations by Sex
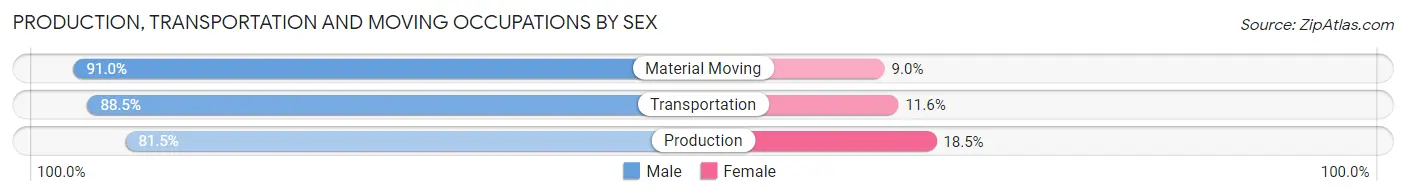
| Occupation | Male | Female |
| Production | 819 (81.5%) | 186 (18.5%) |
| Transportation | 452 (88.4%) | 59 (11.6%) |
| Material Moving | 313 (91.0%) | 31 (9.0%) |
| Total (Category) | 1,584 (85.2%) | 276 (14.8%) |
| Total (Overall) | 5,129 (54.6%) | 4,257 (45.4%) |
Employment Industries by Sex in Cleburne County
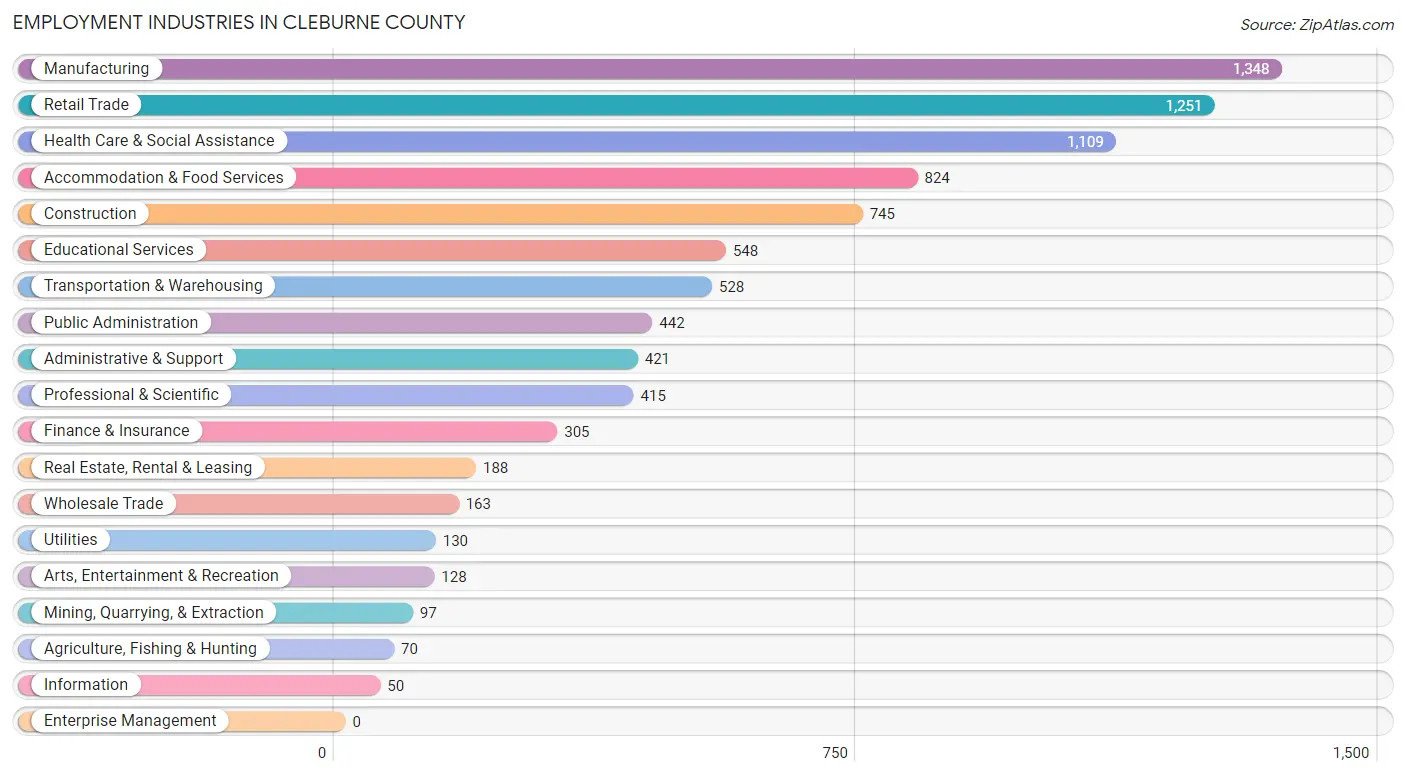
Employment Industries in Cleburne County
The major employment industries in Cleburne County include Manufacturing (1,348 | 14.4%), Retail Trade (1,251 | 13.3%), Health Care & Social Assistance (1,109 | 11.8%), Accommodation & Food Services (824 | 8.8%), and Construction (745 | 7.9%).
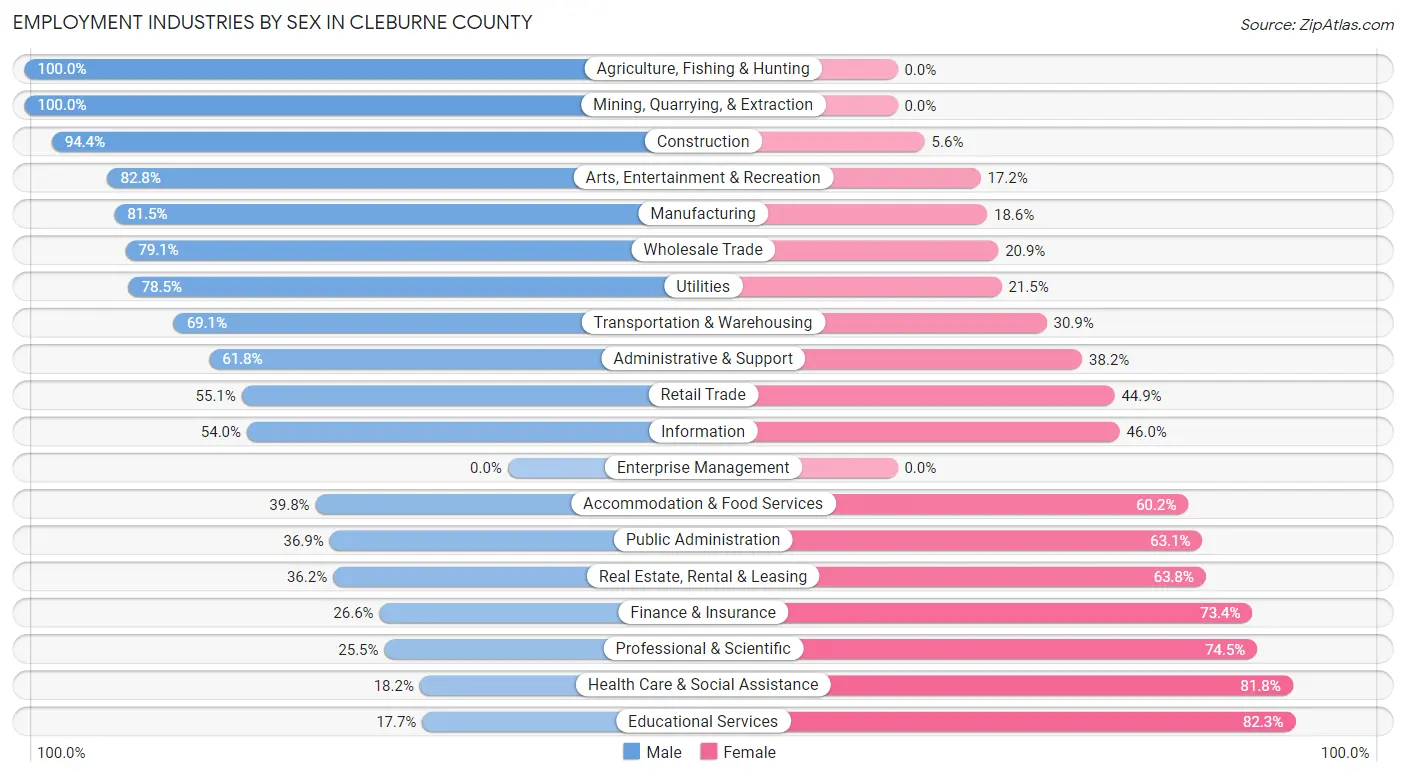
Employment Industries by Sex in Cleburne County
The Cleburne County industries that see more men than women are Agriculture, Fishing & Hunting (100.0%), Mining, Quarrying, & Extraction (100.0%), and Construction (94.4%), whereas the industries that tend to have a higher number of women are Educational Services (82.3%), Health Care & Social Assistance (81.8%), and Professional & Scientific (74.5%).
| Industry | Male | Female |
| Agriculture, Fishing & Hunting | 70 (100.0%) | 0 (0.0%) |
| Mining, Quarrying, & Extraction | 97 (100.0%) | 0 (0.0%) |
| Construction | 703 (94.4%) | 42 (5.6%) |
| Manufacturing | 1,098 (81.5%) | 250 (18.5%) |
| Wholesale Trade | 129 (79.1%) | 34 (20.9%) |
| Retail Trade | 689 (55.1%) | 562 (44.9%) |
| Transportation & Warehousing | 365 (69.1%) | 163 (30.9%) |
| Utilities | 102 (78.5%) | 28 (21.5%) |
| Information | 27 (54.0%) | 23 (46.0%) |
| Finance & Insurance | 81 (26.6%) | 224 (73.4%) |
| Real Estate, Rental & Leasing | 68 (36.2%) | 120 (63.8%) |
| Professional & Scientific | 106 (25.5%) | 309 (74.5%) |
| Enterprise Management | 0 (0.0%) | 0 (0.0%) |
| Administrative & Support | 260 (61.8%) | 161 (38.2%) |
| Educational Services | 97 (17.7%) | 451 (82.3%) |
| Health Care & Social Assistance | 202 (18.2%) | 907 (81.8%) |
| Arts, Entertainment & Recreation | 106 (82.8%) | 22 (17.2%) |
| Accommodation & Food Services | 328 (39.8%) | 496 (60.2%) |
| Public Administration | 163 (36.9%) | 279 (63.1%) |
| Total | 5,129 (54.6%) | 4,257 (45.4%) |
Education in Cleburne County
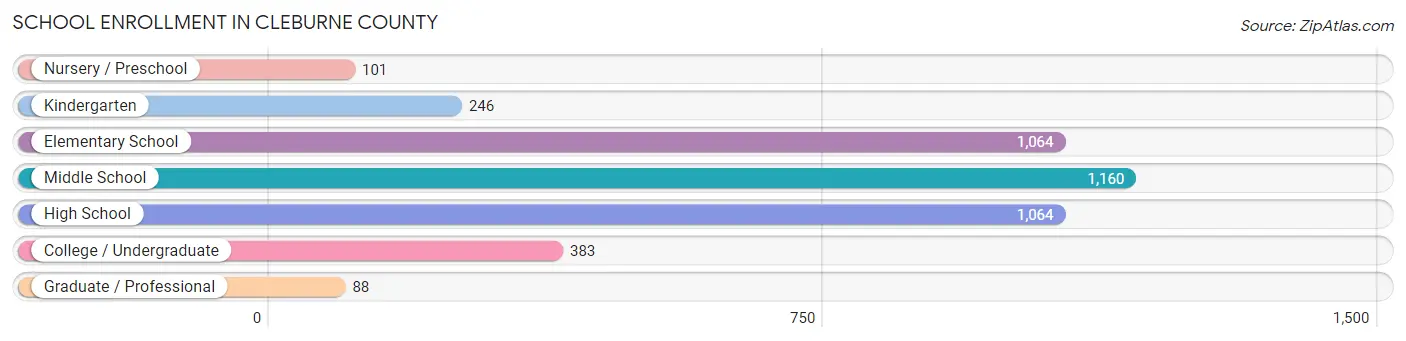
School Enrollment in Cleburne County
The most common levels of schooling among the 4,106 students in Cleburne County are middle school (1,160 | 28.2%), elementary school (1,064 | 25.9%), and high school (1,064 | 25.9%).
| School Level | # Students | % Students |
| Nursery / Preschool | 101 | 2.5% |
| Kindergarten | 246 | 6.0% |
| Elementary School | 1,064 | 25.9% |
| Middle School | 1,160 | 28.2% |
| High School | 1,064 | 25.9% |
| College / Undergraduate | 383 | 9.3% |
| Graduate / Professional | 88 | 2.1% |
| Total | 4,106 | 100.0% |
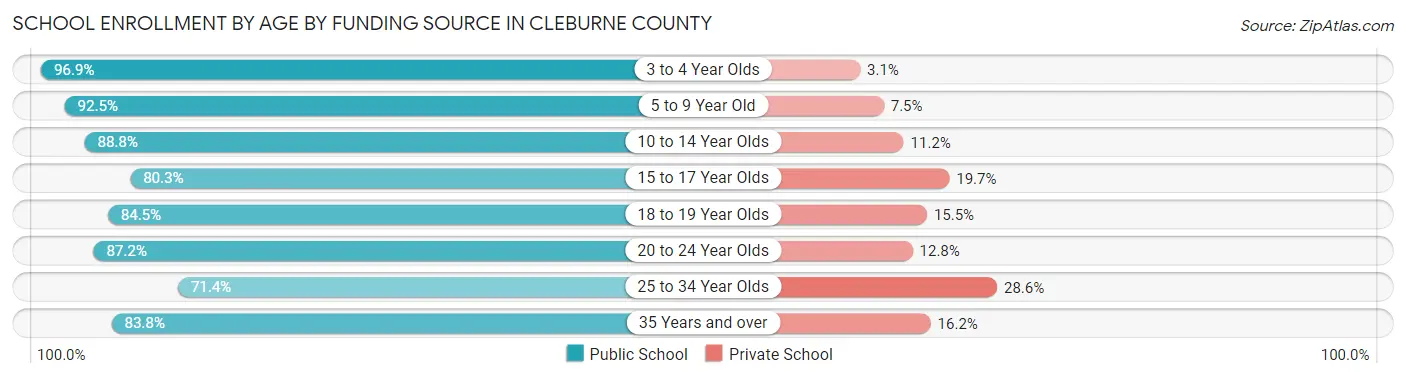
School Enrollment by Age by Funding Source in Cleburne County
Out of a total of 4,106 students who are enrolled in schools in Cleburne County, 521 (12.7%) attend a private institution, while the remaining 3,585 (87.3%) are enrolled in public schools. The age group of 25 to 34 year olds has the highest likelihood of being enrolled in private schools, with 38 (28.6% in the age bracket) enrolled. Conversely, the age group of 3 to 4 year olds has the lowest likelihood of being enrolled in a private school, with 95 (96.9% in the age bracket) attending a public institution.
| Age Bracket | Public School | Private School |
| 3 to 4 Year Olds | 95 (96.9%) | 3 (3.1%) |
| 5 to 9 Year Old | 1,041 (92.5%) | 84 (7.5%) |
| 10 to 14 Year Olds | 1,233 (88.8%) | 155 (11.2%) |
| 15 to 17 Year Olds | 649 (80.3%) | 159 (19.7%) |
| 18 to 19 Year Olds | 256 (84.5%) | 47 (15.5%) |
| 20 to 24 Year Olds | 95 (87.2%) | 14 (12.8%) |
| 25 to 34 Year Olds | 95 (71.4%) | 38 (28.6%) |
| 35 Years and over | 119 (83.8%) | 23 (16.2%) |
| Total | 3,585 (87.3%) | 521 (12.7%) |
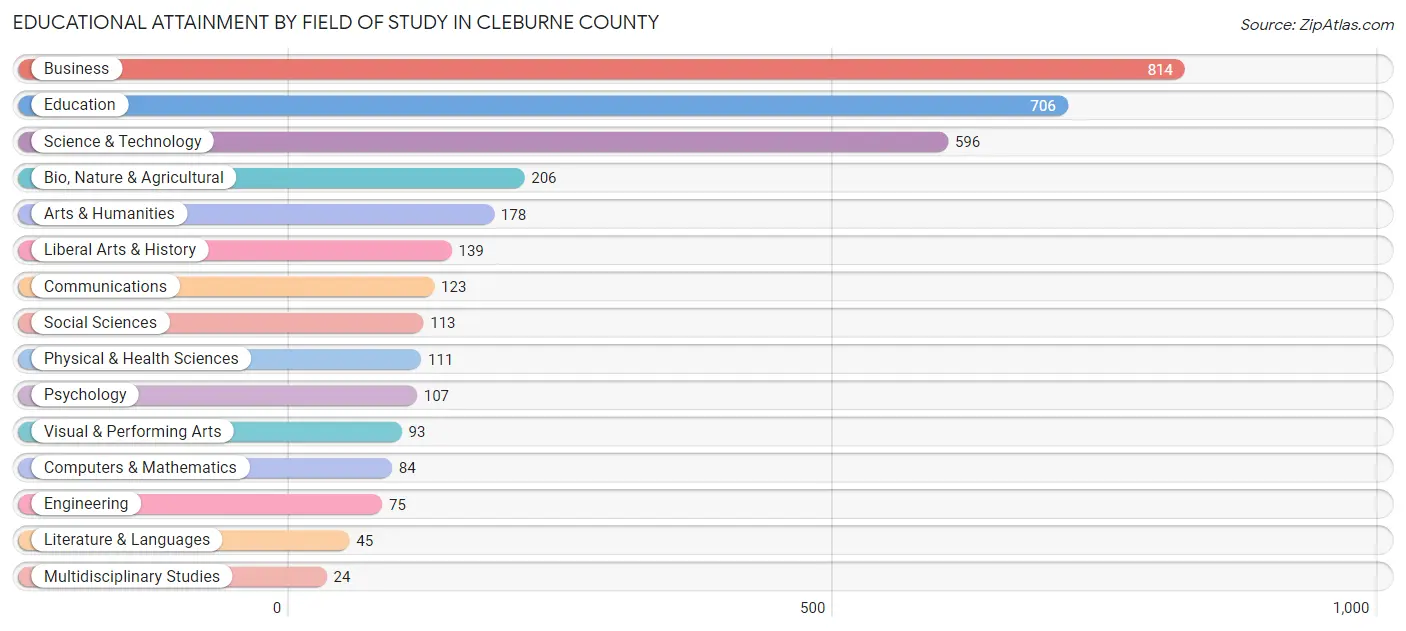
Educational Attainment by Field of Study in Cleburne County
Business (814 | 23.8%), education (706 | 20.7%), science & technology (596 | 17.5%), bio, nature & agricultural (206 | 6.0%), and arts & humanities (178 | 5.2%) are the most common fields of study among 3,414 individuals in Cleburne County who have obtained a bachelor's degree or higher.
| Field of Study | # Graduates | % Graduates |
| Computers & Mathematics | 84 | 2.5% |
| Bio, Nature & Agricultural | 206 | 6.0% |
| Physical & Health Sciences | 111 | 3.3% |
| Psychology | 107 | 3.1% |
| Social Sciences | 113 | 3.3% |
| Engineering | 75 | 2.2% |
| Multidisciplinary Studies | 24 | 0.7% |
| Science & Technology | 596 | 17.5% |
| Business | 814 | 23.8% |
| Education | 706 | 20.7% |
| Literature & Languages | 45 | 1.3% |
| Liberal Arts & History | 139 | 4.1% |
| Visual & Performing Arts | 93 | 2.7% |
| Communications | 123 | 3.6% |
| Arts & Humanities | 178 | 5.2% |
| Total | 3,414 | 100.0% |
Transportation & Commute in Cleburne County
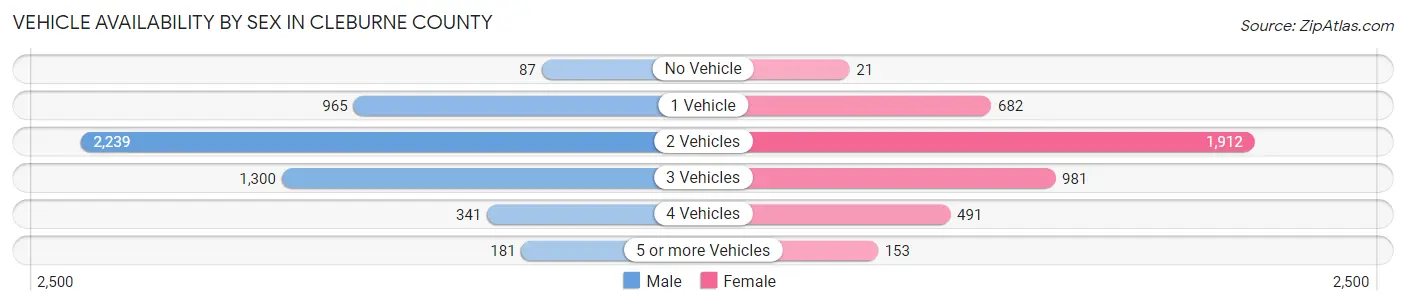
Vehicle Availability by Sex in Cleburne County
The most prevalent vehicle ownership categories in Cleburne County are males with 2 vehicles (2,239, accounting for 43.8%) and females with 2 vehicles (1,912, making up 52.8%).
| Vehicles Available | Male | Female |
| No Vehicle | 87 (1.7%) | 21 (0.5%) |
| 1 Vehicle | 965 (18.9%) | 682 (16.1%) |
| 2 Vehicles | 2,239 (43.8%) | 1,912 (45.1%) |
| 3 Vehicles | 1,300 (25.4%) | 981 (23.1%) |
| 4 Vehicles | 341 (6.7%) | 491 (11.6%) |
| 5 or more Vehicles | 181 (3.5%) | 153 (3.6%) |
| Total | 5,113 (100.0%) | 4,240 (100.0%) |
Commute Time in Cleburne County
The most frequently occuring commute durations in Cleburne County are 10 to 14 minutes (1,694 commuters, 19.5%), 5 to 9 minutes (1,315 commuters, 15.1%), and 15 to 19 minutes (1,221 commuters, 14.0%).
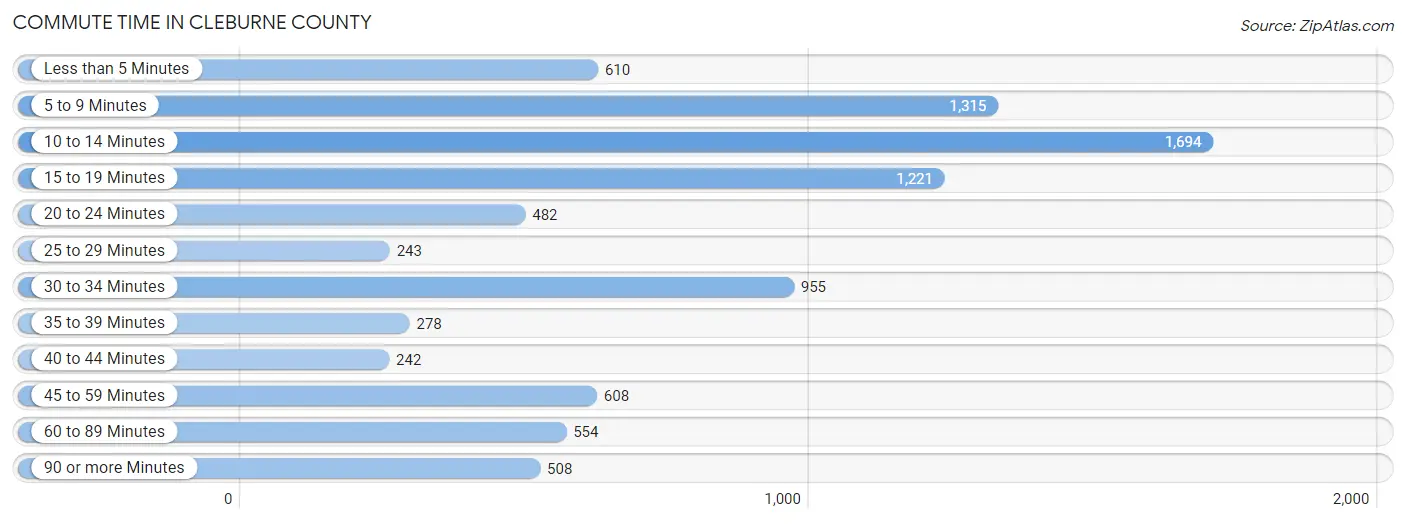
| Commute Time | # Commuters | % Commuters |
| Less than 5 Minutes | 610 | 7.0% |
| 5 to 9 Minutes | 1,315 | 15.1% |
| 10 to 14 Minutes | 1,694 | 19.5% |
| 15 to 19 Minutes | 1,221 | 14.0% |
| 20 to 24 Minutes | 482 | 5.5% |
| 25 to 29 Minutes | 243 | 2.8% |
| 30 to 34 Minutes | 955 | 11.0% |
| 35 to 39 Minutes | 278 | 3.2% |
| 40 to 44 Minutes | 242 | 2.8% |
| 45 to 59 Minutes | 608 | 7.0% |
| 60 to 89 Minutes | 554 | 6.4% |
| 90 or more Minutes | 508 | 5.8% |
Commute Time by Sex in Cleburne County
The most common commute times in Cleburne County are 10 to 14 minutes (1,024 commuters, 20.9%) for males and 15 to 19 minutes (787 commuters, 20.7%) for females.
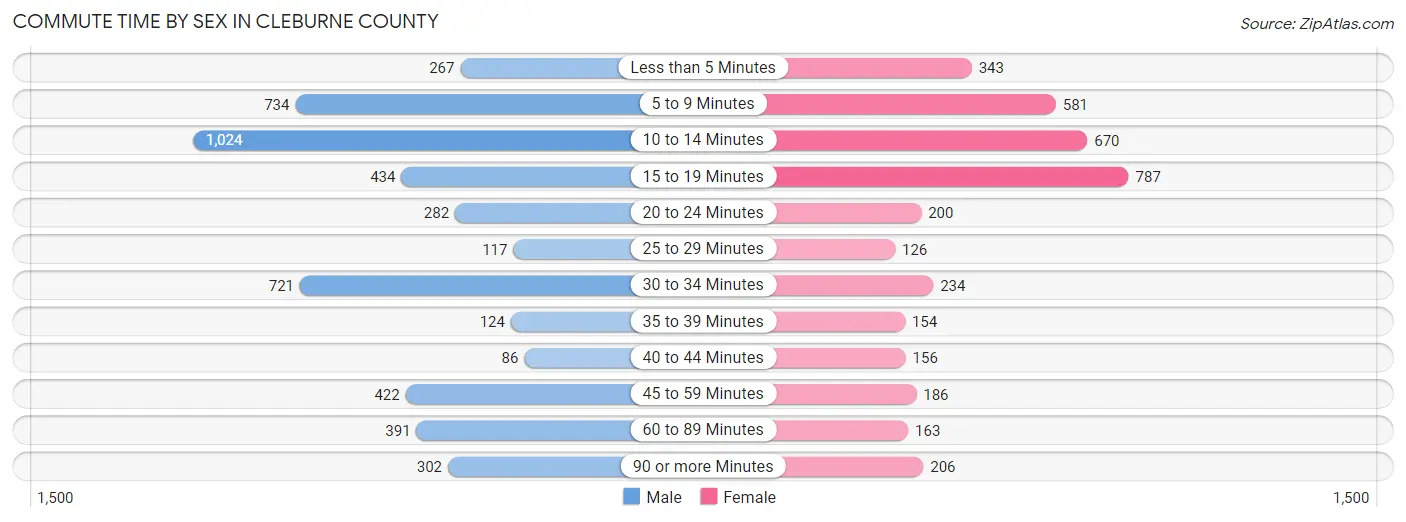
| Commute Time | Male | Female |
| Less than 5 Minutes | 267 (5.4%) | 343 (9.0%) |
| 5 to 9 Minutes | 734 (15.0%) | 581 (15.3%) |
| 10 to 14 Minutes | 1,024 (20.9%) | 670 (17.6%) |
| 15 to 19 Minutes | 434 (8.8%) | 787 (20.7%) |
| 20 to 24 Minutes | 282 (5.8%) | 200 (5.2%) |
| 25 to 29 Minutes | 117 (2.4%) | 126 (3.3%) |
| 30 to 34 Minutes | 721 (14.7%) | 234 (6.1%) |
| 35 to 39 Minutes | 124 (2.5%) | 154 (4.1%) |
| 40 to 44 Minutes | 86 (1.8%) | 156 (4.1%) |
| 45 to 59 Minutes | 422 (8.6%) | 186 (4.9%) |
| 60 to 89 Minutes | 391 (8.0%) | 163 (4.3%) |
| 90 or more Minutes | 302 (6.2%) | 206 (5.4%) |
Time of Departure to Work by Sex in Cleburne County
The most frequent times of departure to work in Cleburne County are 6:00 AM to 6:29 AM (919, 18.7%) for males and 7:00 AM to 7:29 AM (756, 19.9%) for females.
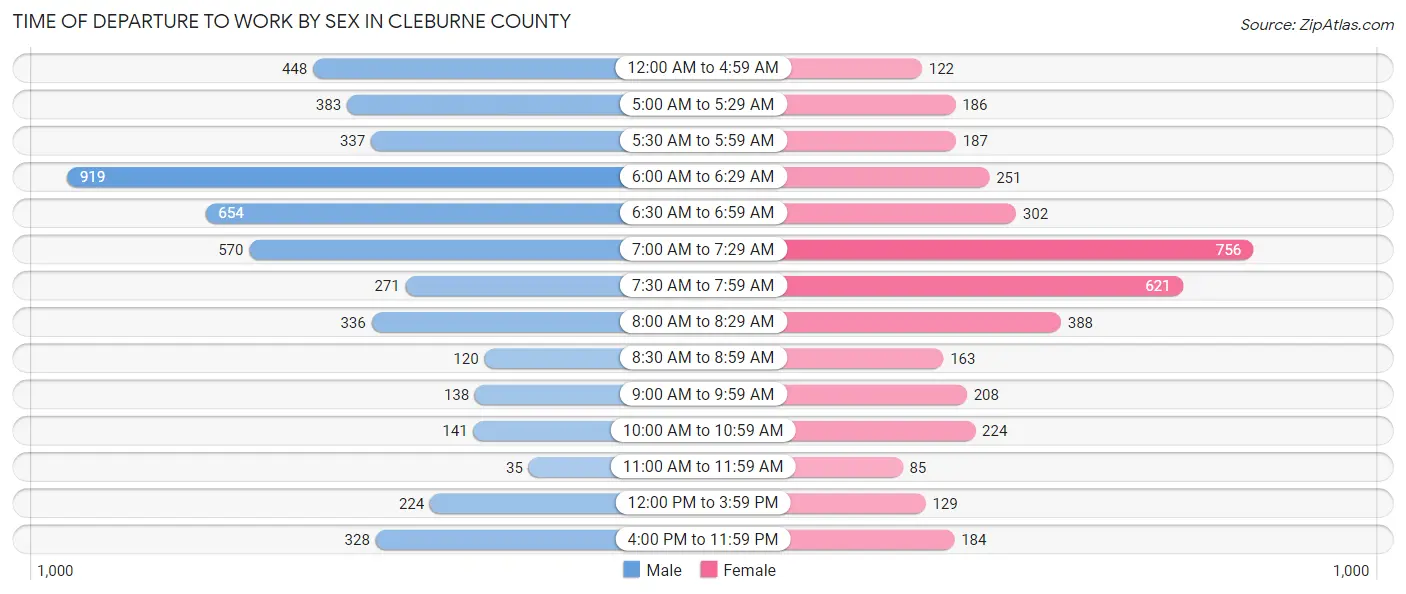
| Time of Departure | Male | Female |
| 12:00 AM to 4:59 AM | 448 (9.1%) | 122 (3.2%) |
| 5:00 AM to 5:29 AM | 383 (7.8%) | 186 (4.9%) |
| 5:30 AM to 5:59 AM | 337 (6.9%) | 187 (4.9%) |
| 6:00 AM to 6:29 AM | 919 (18.7%) | 251 (6.6%) |
| 6:30 AM to 6:59 AM | 654 (13.3%) | 302 (7.9%) |
| 7:00 AM to 7:29 AM | 570 (11.6%) | 756 (19.9%) |
| 7:30 AM to 7:59 AM | 271 (5.5%) | 621 (16.3%) |
| 8:00 AM to 8:29 AM | 336 (6.9%) | 388 (10.2%) |
| 8:30 AM to 8:59 AM | 120 (2.5%) | 163 (4.3%) |
| 9:00 AM to 9:59 AM | 138 (2.8%) | 208 (5.5%) |
| 10:00 AM to 10:59 AM | 141 (2.9%) | 224 (5.9%) |
| 11:00 AM to 11:59 AM | 35 (0.7%) | 85 (2.2%) |
| 12:00 PM to 3:59 PM | 224 (4.6%) | 129 (3.4%) |
| 4:00 PM to 11:59 PM | 328 (6.7%) | 184 (4.8%) |
| Total | 4,904 (100.0%) | 3,806 (100.0%) |
Housing Occupancy in Cleburne County
Occupancy by Ownership in Cleburne County
Of the total 10,626 dwellings in Cleburne County, owner-occupied units account for 8,360 (78.7%), while renter-occupied units make up 2,266 (21.3%).
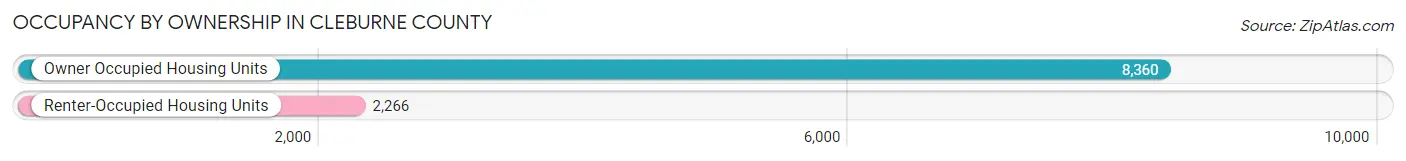
| Occupancy | # Housing Units | % Housing Units |
| Owner Occupied Housing Units | 8,360 | 78.7% |
| Renter-Occupied Housing Units | 2,266 | 21.3% |
| Total Occupied Housing Units | 10,626 | 100.0% |
Occupancy by Household Size in Cleburne County
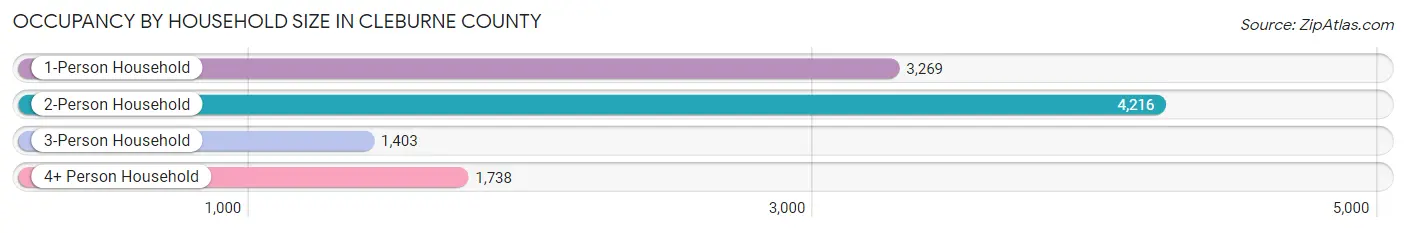
| Household Size | # Housing Units | % Housing Units |
| 1-Person Household | 3,269 | 30.8% |
| 2-Person Household | 4,216 | 39.7% |
| 3-Person Household | 1,403 | 13.2% |
| 4+ Person Household | 1,738 | 16.4% |
| Total Housing Units | 10,626 | 100.0% |
Occupancy by Ownership by Household Size in Cleburne County
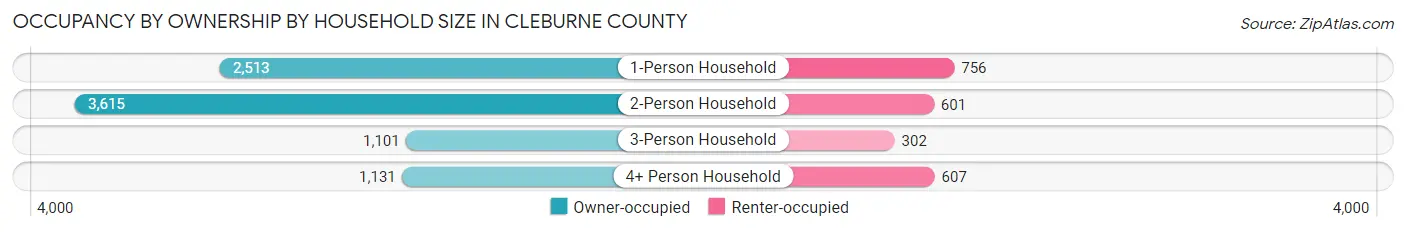
| Household Size | Owner-occupied | Renter-occupied |
| 1-Person Household | 2,513 (76.9%) | 756 (23.1%) |
| 2-Person Household | 3,615 (85.7%) | 601 (14.3%) |
| 3-Person Household | 1,101 (78.5%) | 302 (21.5%) |
| 4+ Person Household | 1,131 (65.1%) | 607 (34.9%) |
| Total Housing Units | 8,360 (78.7%) | 2,266 (21.3%) |
Occupancy by Educational Attainment in Cleburne County
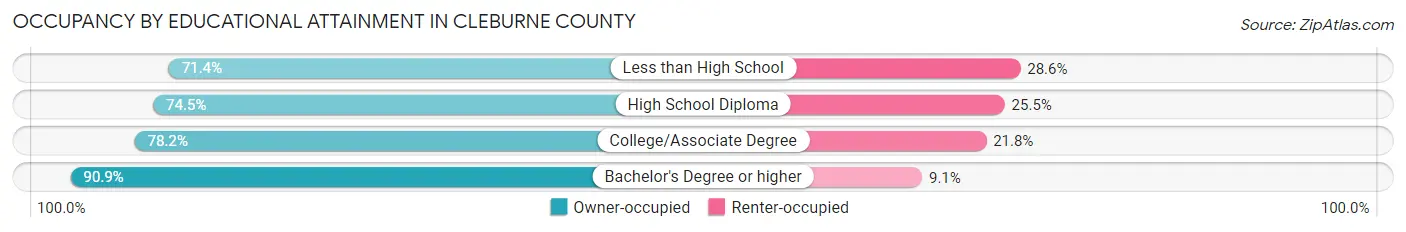
| Household Size | Owner-occupied | Renter-occupied |
| Less than High School | 832 (71.4%) | 333 (28.6%) |
| High School Diploma | 2,902 (74.5%) | 992 (25.5%) |
| College/Associate Degree | 2,675 (78.2%) | 746 (21.8%) |
| Bachelor's Degree or higher | 1,951 (90.9%) | 195 (9.1%) |
Occupancy by Age of Householder in Cleburne County
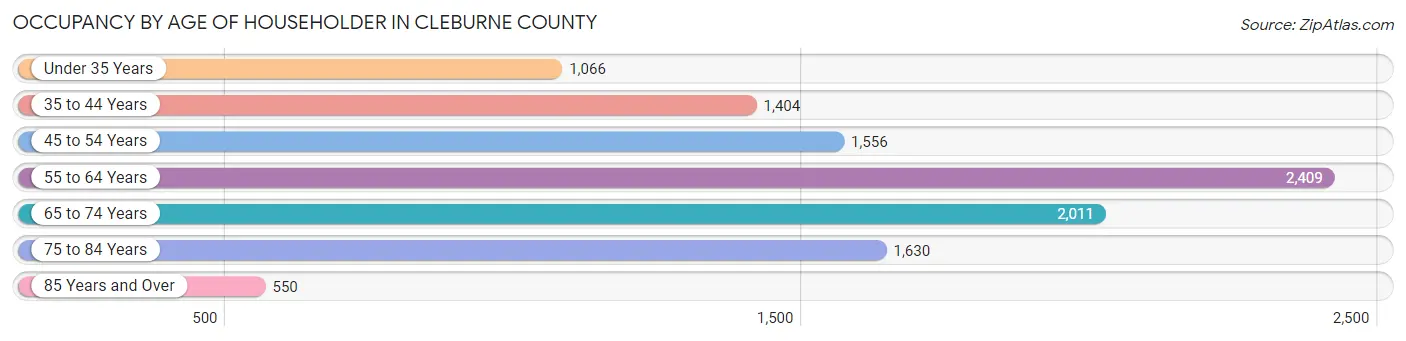
| Age Bracket | # Households | % Households |
| Under 35 Years | 1,066 | 10.0% |
| 35 to 44 Years | 1,404 | 13.2% |
| 45 to 54 Years | 1,556 | 14.6% |
| 55 to 64 Years | 2,409 | 22.7% |
| 65 to 74 Years | 2,011 | 18.9% |
| 75 to 84 Years | 1,630 | 15.3% |
| 85 Years and Over | 550 | 5.2% |
| Total | 10,626 | 100.0% |
Housing Finances in Cleburne County
Median Income by Occupancy in Cleburne County
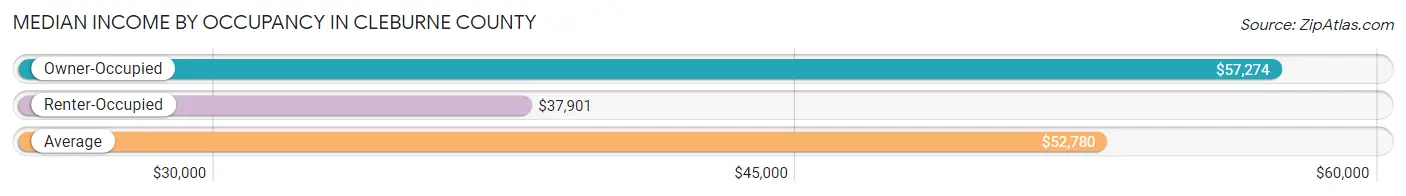
| Occupancy Type | # Households | Median Income |
| Owner-Occupied | 8,360 (78.7%) | $57,274 |
| Renter-Occupied | 2,266 (21.3%) | $37,901 |
| Average | 10,626 (100.0%) | $52,780 |
Occupancy by Householder Income Bracket in Cleburne County
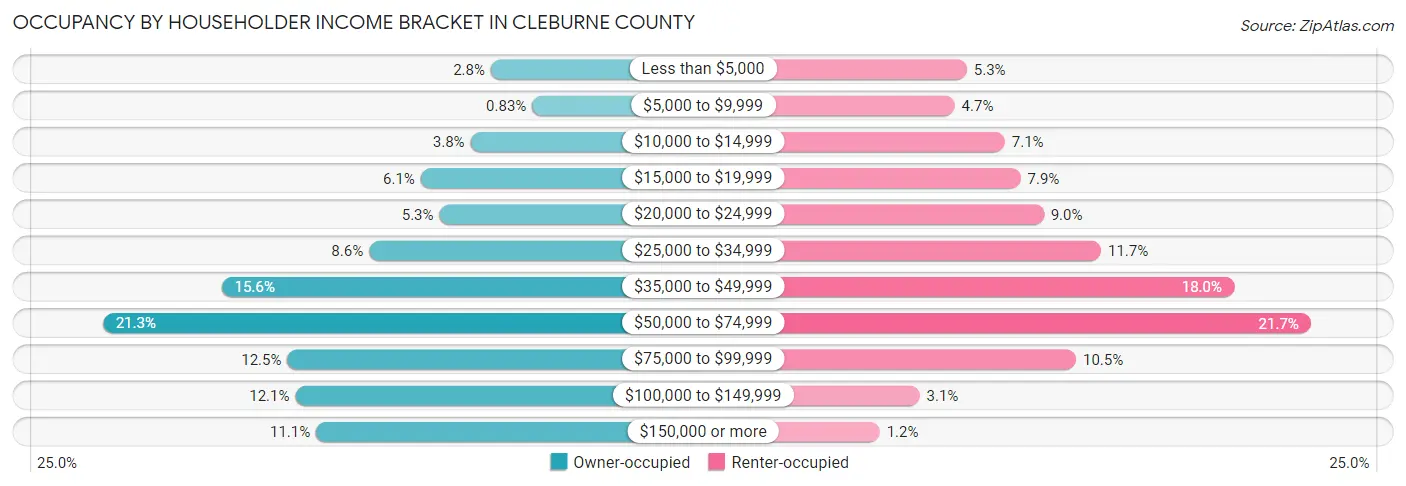
| Income Bracket | Owner-occupied | Renter-occupied |
| Less than $5,000 | 234 (2.8%) | 120 (5.3%) |
| $5,000 to $9,999 | 69 (0.8%) | 107 (4.7%) |
| $10,000 to $14,999 | 315 (3.8%) | 161 (7.1%) |
| $15,000 to $19,999 | 513 (6.1%) | 178 (7.9%) |
| $20,000 to $24,999 | 439 (5.2%) | 203 (9.0%) |
| $25,000 to $34,999 | 719 (8.6%) | 265 (11.7%) |
| $35,000 to $49,999 | 1,306 (15.6%) | 408 (18.0%) |
| $50,000 to $74,999 | 1,779 (21.3%) | 491 (21.7%) |
| $75,000 to $99,999 | 1,044 (12.5%) | 238 (10.5%) |
| $100,000 to $149,999 | 1,012 (12.1%) | 69 (3.0%) |
| $150,000 or more | 930 (11.1%) | 26 (1.1%) |
| Total | 8,360 (100.0%) | 2,266 (100.0%) |
Monthly Housing Cost Tiers in Cleburne County
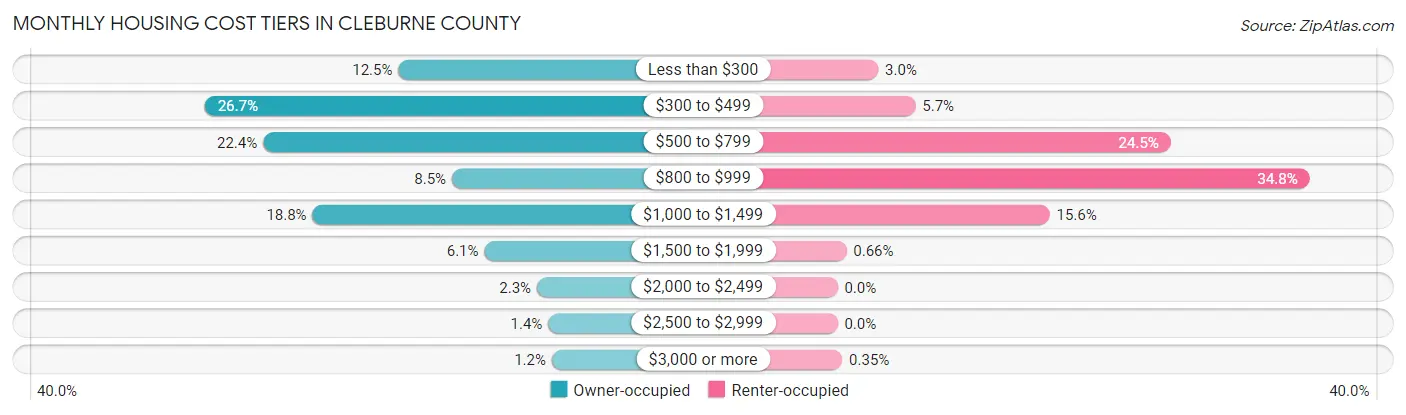
| Monthly Cost | Owner-occupied | Renter-occupied |
| Less than $300 | 1,043 (12.5%) | 68 (3.0%) |
| $300 to $499 | 2,235 (26.7%) | 130 (5.7%) |
| $500 to $799 | 1,876 (22.4%) | 556 (24.5%) |
| $800 to $999 | 713 (8.5%) | 788 (34.8%) |
| $1,000 to $1,499 | 1,572 (18.8%) | 354 (15.6%) |
| $1,500 to $1,999 | 513 (6.1%) | 15 (0.7%) |
| $2,000 to $2,499 | 190 (2.3%) | 0 (0.0%) |
| $2,500 to $2,999 | 120 (1.4%) | 0 (0.0%) |
| $3,000 or more | 98 (1.2%) | 8 (0.4%) |
| Total | 8,360 (100.0%) | 2,266 (100.0%) |
Physical Housing Characteristics in Cleburne County
Housing Structures in Cleburne County
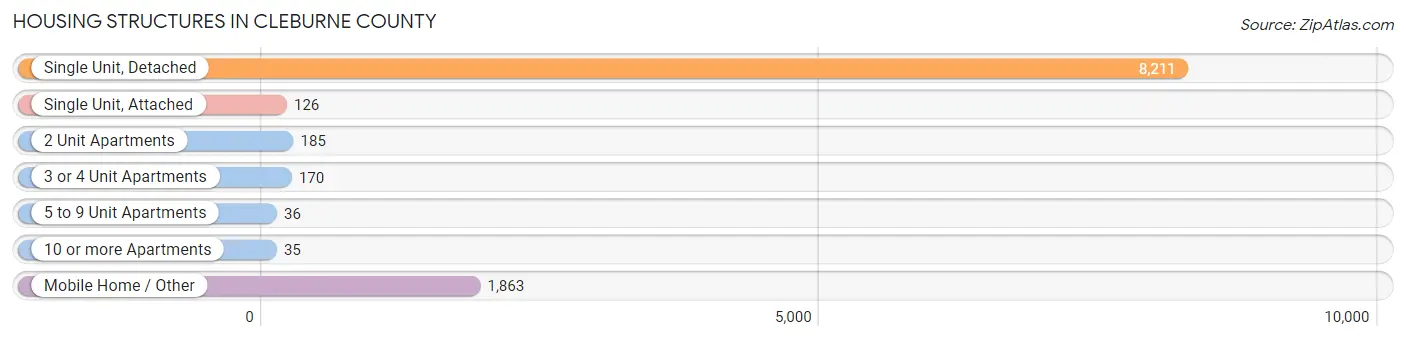
| Structure Type | # Housing Units | % Housing Units |
| Single Unit, Detached | 8,211 | 77.3% |
| Single Unit, Attached | 126 | 1.2% |
| 2 Unit Apartments | 185 | 1.7% |
| 3 or 4 Unit Apartments | 170 | 1.6% |
| 5 to 9 Unit Apartments | 36 | 0.3% |
| 10 or more Apartments | 35 | 0.3% |
| Mobile Home / Other | 1,863 | 17.5% |
| Total | 10,626 | 100.0% |
Housing Structures by Occupancy in Cleburne County
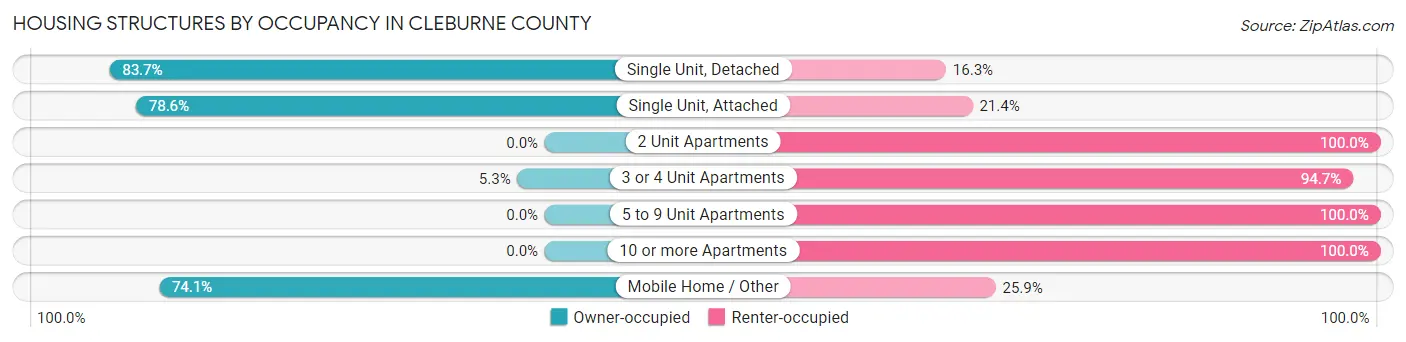
| Structure Type | Owner-occupied | Renter-occupied |
| Single Unit, Detached | 6,871 (83.7%) | 1,340 (16.3%) |
| Single Unit, Attached | 99 (78.6%) | 27 (21.4%) |
| 2 Unit Apartments | 0 (0.0%) | 185 (100.0%) |
| 3 or 4 Unit Apartments | 9 (5.3%) | 161 (94.7%) |
| 5 to 9 Unit Apartments | 0 (0.0%) | 36 (100.0%) |
| 10 or more Apartments | 0 (0.0%) | 35 (100.0%) |
| Mobile Home / Other | 1,381 (74.1%) | 482 (25.9%) |
| Total | 8,360 (78.7%) | 2,266 (21.3%) |
Housing Structures by Number of Rooms in Cleburne County
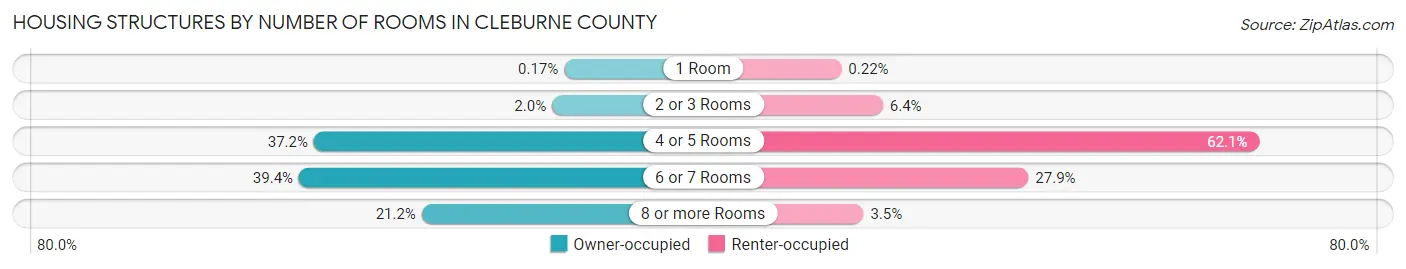
| Number of Rooms | Owner-occupied | Renter-occupied |
| 1 Room | 14 (0.2%) | 5 (0.2%) |
| 2 or 3 Rooms | 164 (2.0%) | 144 (6.4%) |
| 4 or 5 Rooms | 3,111 (37.2%) | 1,406 (62.1%) |
| 6 or 7 Rooms | 3,295 (39.4%) | 632 (27.9%) |
| 8 or more Rooms | 1,776 (21.2%) | 79 (3.5%) |
| Total | 8,360 (100.0%) | 2,266 (100.0%) |
Housing Structure by Heating Type in Cleburne County
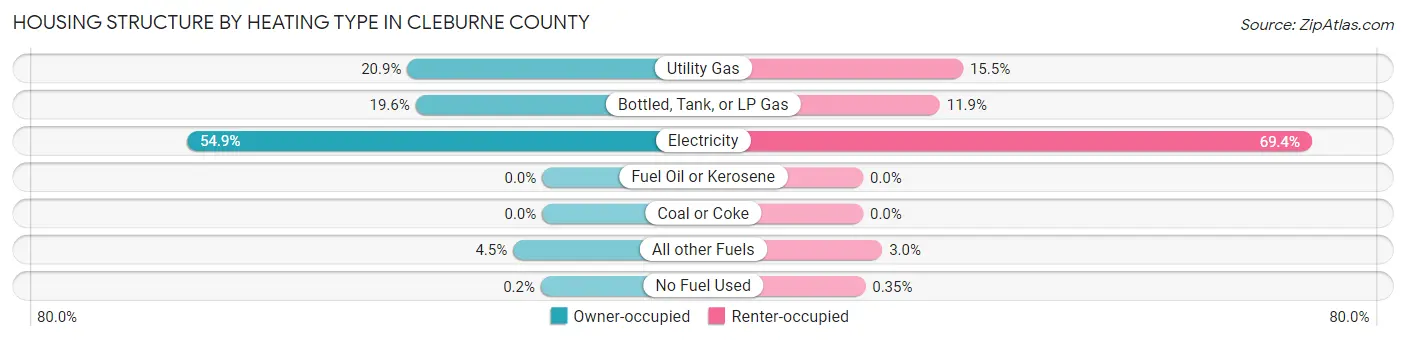
| Heating Type | Owner-occupied | Renter-occupied |
| Utility Gas | 1,743 (20.8%) | 350 (15.4%) |
| Bottled, Tank, or LP Gas | 1,636 (19.6%) | 269 (11.9%) |
| Electricity | 4,589 (54.9%) | 1,572 (69.4%) |
| Fuel Oil or Kerosene | 0 (0.0%) | 0 (0.0%) |
| Coal or Coke | 0 (0.0%) | 0 (0.0%) |
| All other Fuels | 375 (4.5%) | 67 (3.0%) |
| No Fuel Used | 17 (0.2%) | 8 (0.4%) |
| Total | 8,360 (100.0%) | 2,266 (100.0%) |
Household Vehicle Usage in Cleburne County
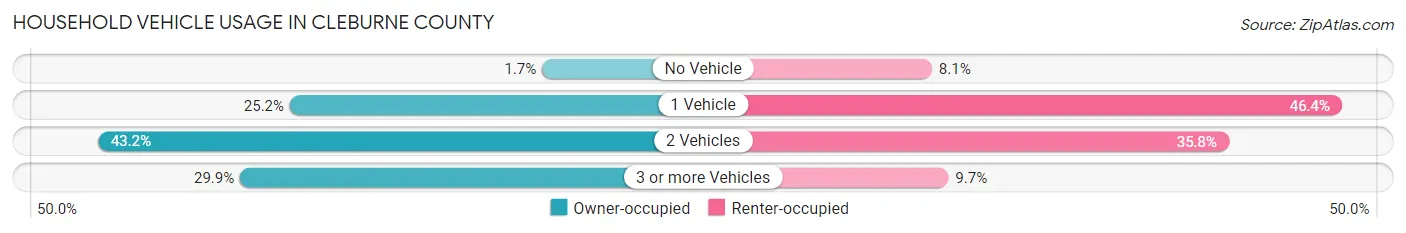
| Vehicles per Household | Owner-occupied | Renter-occupied |
| No Vehicle | 142 (1.7%) | 184 (8.1%) |
| 1 Vehicle | 2,110 (25.2%) | 1,051 (46.4%) |
| 2 Vehicles | 3,609 (43.2%) | 812 (35.8%) |
| 3 or more Vehicles | 2,499 (29.9%) | 219 (9.7%) |
| Total | 8,360 (100.0%) | 2,266 (100.0%) |
Real Estate & Mortgages in Cleburne County
Real Estate and Mortgage Overview in Cleburne County
| Characteristic | Without Mortgage | With Mortgage |
| Housing Units | 4,598 | 3,762 |
| Median Property Value | $148,800 | $182,700 |
| Median Household Income | $48,245 | $423 |
| Monthly Housing Costs | $410 | $98 |
| Real Estate Taxes | $679 | $316 |
Property Value by Mortgage Status in Cleburne County
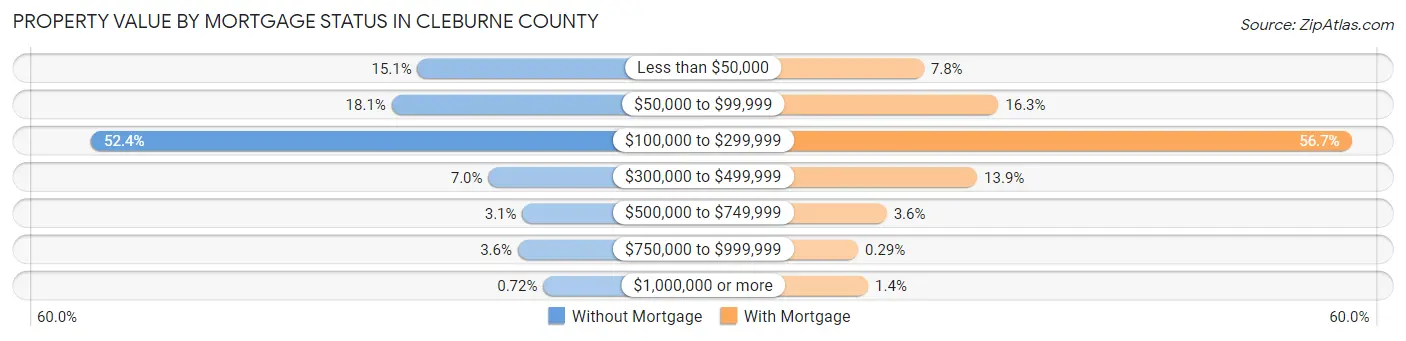
| Property Value | Without Mortgage | With Mortgage |
| Less than $50,000 | 694 (15.1%) | 294 (7.8%) |
| $50,000 to $99,999 | 830 (18.0%) | 614 (16.3%) |
| $100,000 to $299,999 | 2,409 (52.4%) | 2,132 (56.7%) |
| $300,000 to $499,999 | 322 (7.0%) | 523 (13.9%) |
| $500,000 to $749,999 | 143 (3.1%) | 134 (3.6%) |
| $750,000 to $999,999 | 167 (3.6%) | 11 (0.3%) |
| $1,000,000 or more | 33 (0.7%) | 54 (1.4%) |
| Total | 4,598 (100.0%) | 3,762 (100.0%) |
Household Income by Mortgage Status in Cleburne County
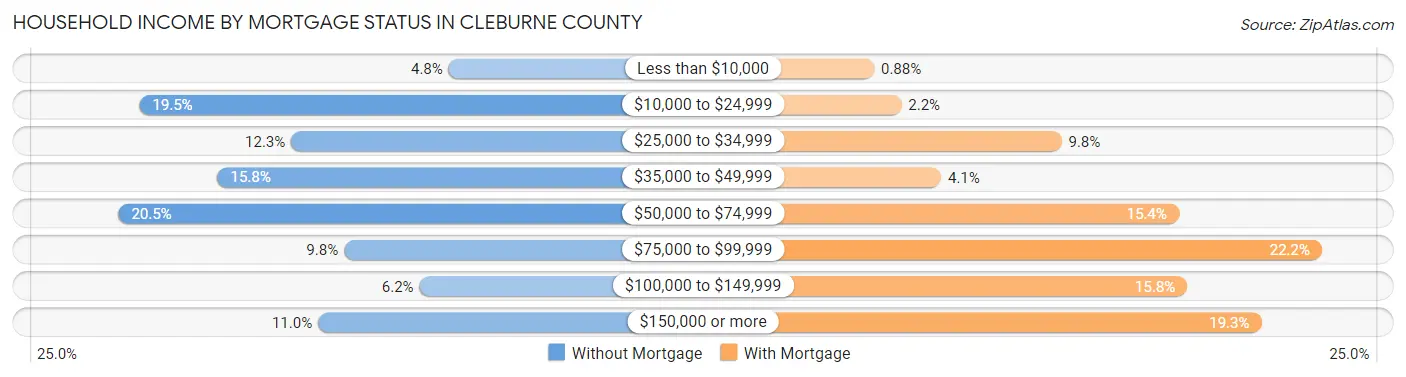
| Household Income | Without Mortgage | With Mortgage |
| Less than $10,000 | 221 (4.8%) | 33 (0.9%) |
| $10,000 to $24,999 | 898 (19.5%) | 82 (2.2%) |
| $25,000 to $34,999 | 566 (12.3%) | 369 (9.8%) |
| $35,000 to $49,999 | 727 (15.8%) | 153 (4.1%) |
| $50,000 to $74,999 | 944 (20.5%) | 579 (15.4%) |
| $75,000 to $99,999 | 450 (9.8%) | 835 (22.2%) |
| $100,000 to $149,999 | 285 (6.2%) | 594 (15.8%) |
| $150,000 or more | 507 (11.0%) | 727 (19.3%) |
| Total | 4,598 (100.0%) | 3,762 (100.0%) |
Property Value to Household Income Ratio in Cleburne County
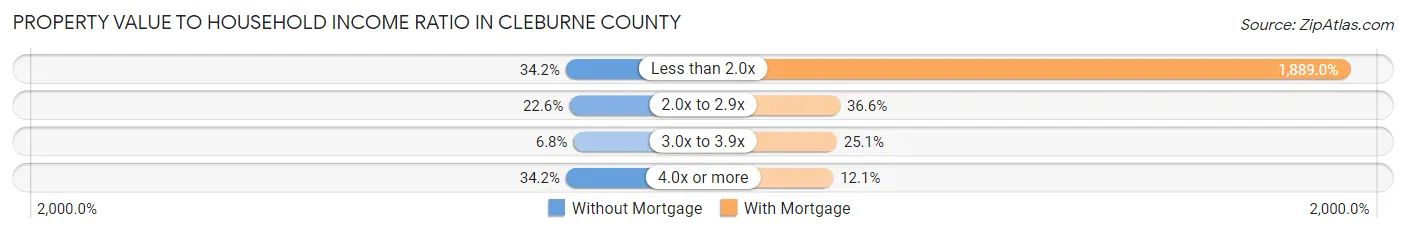
| Value-to-Income Ratio | Without Mortgage | With Mortgage |
| Less than 2.0x | 1,573 (34.2%) | 71,064 (1,889.0%) |
| 2.0x to 2.9x | 1,040 (22.6%) | 1,376 (36.6%) |
| 3.0x to 3.9x | 314 (6.8%) | 944 (25.1%) |
| 4.0x or more | 1,573 (34.2%) | 456 (12.1%) |
| Total | 4,598 (100.0%) | 3,762 (100.0%) |
Real Estate Taxes by Mortgage Status in Cleburne County
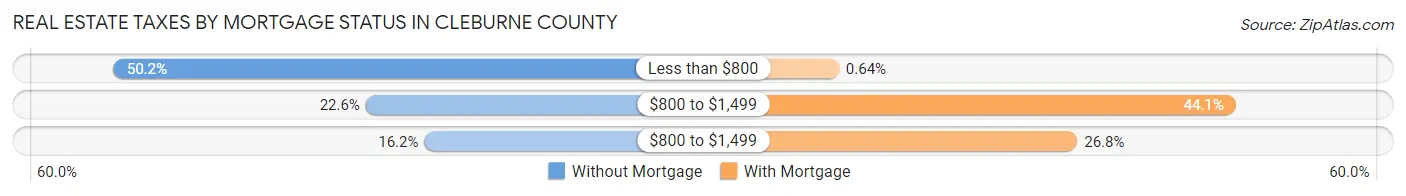
| Property Taxes | Without Mortgage | With Mortgage |
| Less than $800 | 2,309 (50.2%) | 24 (0.6%) |
| $800 to $1,499 | 1,040 (22.6%) | 1,660 (44.1%) |
| $800 to $1,499 | 745 (16.2%) | 1,007 (26.8%) |
| Total | 4,598 (100.0%) | 3,762 (100.0%) |
Health & Disability in Cleburne County
Health Insurance Coverage by Age in Cleburne County
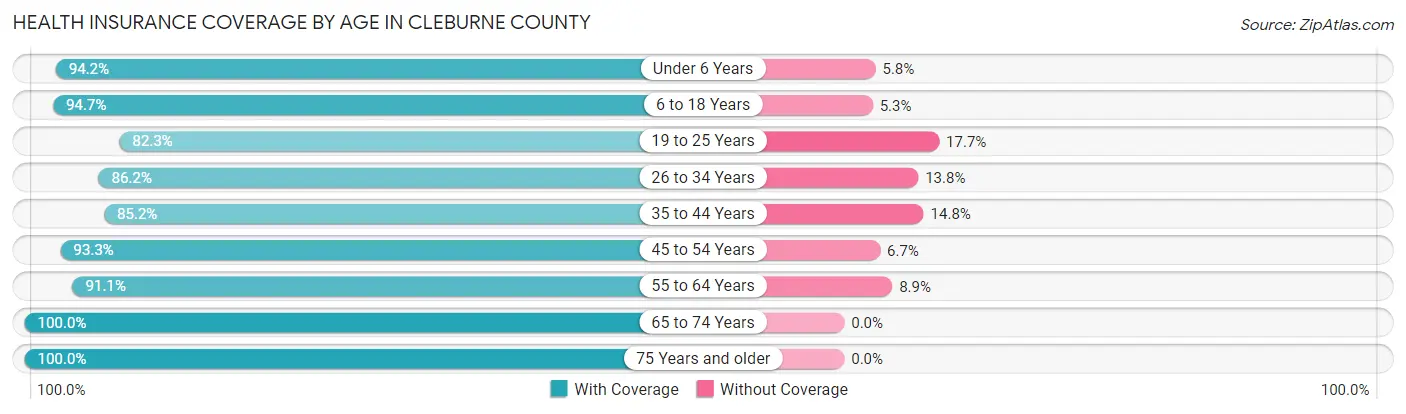
| Age Bracket | With Coverage | Without Coverage |
| Under 6 Years | 1,228 (94.2%) | 76 (5.8%) |
| 6 to 18 Years | 3,523 (94.7%) | 197 (5.3%) |
| 19 to 25 Years | 1,214 (82.3%) | 261 (17.7%) |
| 26 to 34 Years | 1,900 (86.2%) | 304 (13.8%) |
| 35 to 44 Years | 2,285 (85.2%) | 397 (14.8%) |
| 45 to 54 Years | 2,583 (93.3%) | 185 (6.7%) |
| 55 to 64 Years | 3,523 (91.1%) | 346 (8.9%) |
| 65 to 74 Years | 3,627 (100.0%) | 0 (0.0%) |
| 75 Years and older | 2,975 (100.0%) | 0 (0.0%) |
| Total | 22,858 (92.8%) | 1,766 (7.2%) |
Health Insurance Coverage by Citizenship Status in Cleburne County
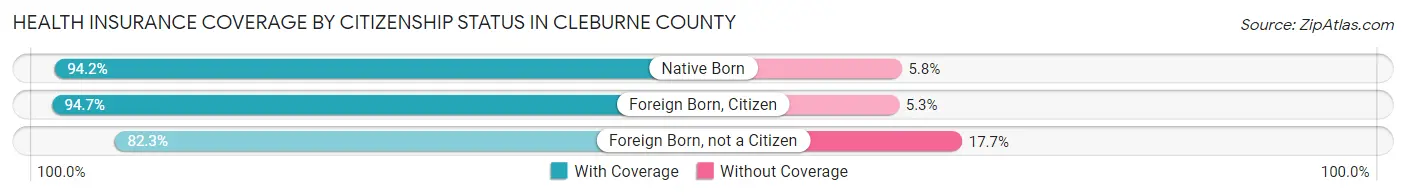
| Citizenship Status | With Coverage | Without Coverage |
| Native Born | 1,228 (94.2%) | 76 (5.8%) |
| Foreign Born, Citizen | 3,523 (94.7%) | 197 (5.3%) |
| Foreign Born, not a Citizen | 1,214 (82.3%) | 261 (17.7%) |
Health Insurance Coverage by Household Income in Cleburne County
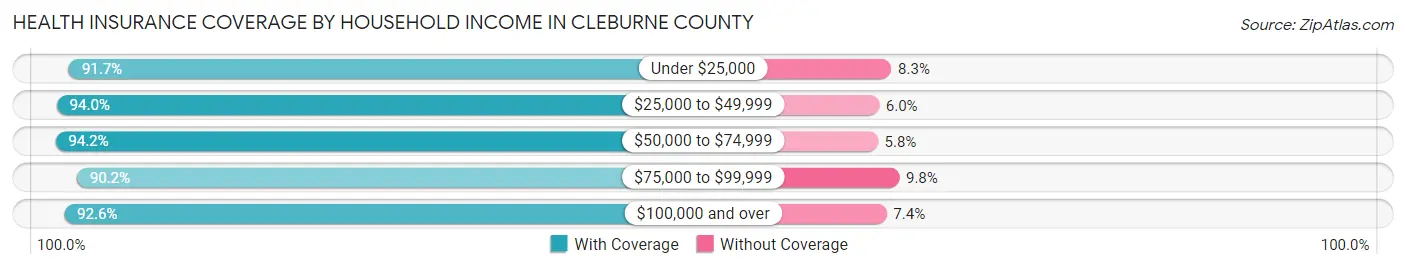
| Household Income | With Coverage | Without Coverage |
| Under $25,000 | 3,555 (91.7%) | 322 (8.3%) |
| $25,000 to $49,999 | 5,643 (94.0%) | 361 (6.0%) |
| $50,000 to $74,999 | 5,402 (94.2%) | 331 (5.8%) |
| $75,000 to $99,999 | 3,207 (90.2%) | 348 (9.8%) |
| $100,000 and over | 5,039 (92.6%) | 404 (7.4%) |
Public vs Private Health Insurance Coverage by Age in Cleburne County
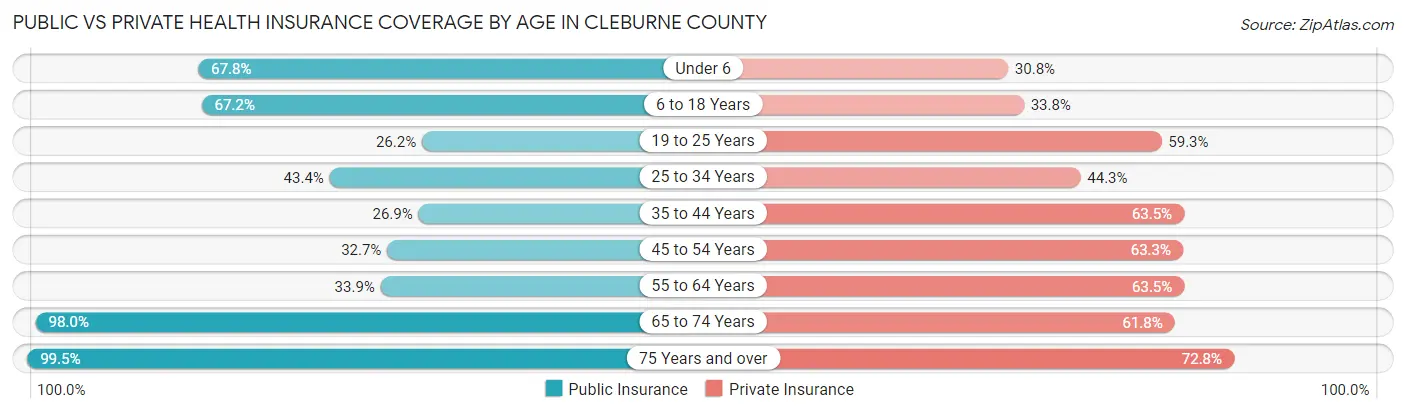
| Age Bracket | Public Insurance | Private Insurance |
| Under 6 | 884 (67.8%) | 402 (30.8%) |
| 6 to 18 Years | 2,498 (67.1%) | 1,256 (33.8%) |
| 19 to 25 Years | 387 (26.2%) | 875 (59.3%) |
| 25 to 34 Years | 956 (43.4%) | 976 (44.3%) |
| 35 to 44 Years | 721 (26.9%) | 1,703 (63.5%) |
| 45 to 54 Years | 905 (32.7%) | 1,752 (63.3%) |
| 55 to 64 Years | 1,312 (33.9%) | 2,458 (63.5%) |
| 65 to 74 Years | 3,553 (98.0%) | 2,240 (61.8%) |
| 75 Years and over | 2,960 (99.5%) | 2,165 (72.8%) |
| Total | 14,176 (57.6%) | 13,827 (56.1%) |
Disability Status by Sex by Age in Cleburne County
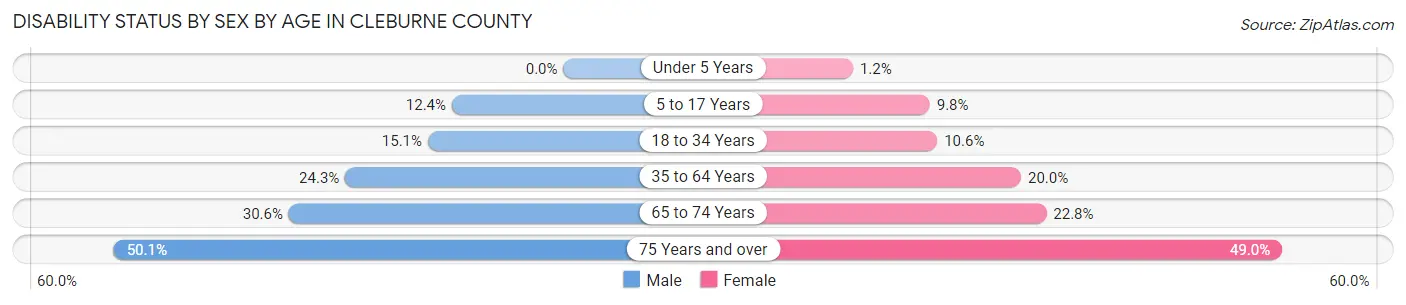
| Age Bracket | Male | Female |
| Under 5 Years | 0 (0.0%) | 6 (1.2%) |
| 5 to 17 Years | 230 (12.4%) | 175 (9.8%) |
| 18 to 34 Years | 315 (15.1%) | 202 (10.6%) |
| 35 to 64 Years | 1,131 (24.3%) | 931 (20.0%) |
| 65 to 74 Years | 540 (30.6%) | 424 (22.8%) |
| 75 Years and over | 687 (50.1%) | 786 (49.0%) |
Disability Class by Sex by Age in Cleburne County
Disability Class: Hearing Difficulty
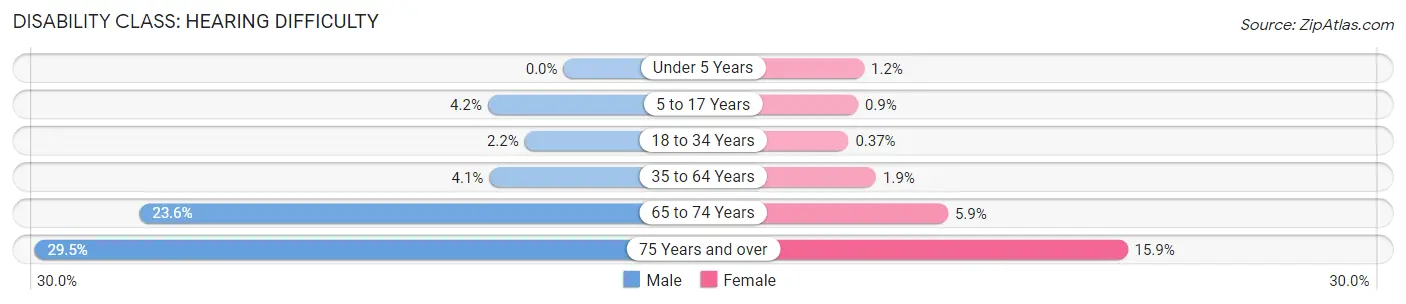
| Age Bracket | Male | Female |
| Under 5 Years | 0 (0.0%) | 6 (1.2%) |
| 5 to 17 Years | 78 (4.2%) | 16 (0.9%) |
| 18 to 34 Years | 45 (2.2%) | 7 (0.4%) |
| 35 to 64 Years | 192 (4.1%) | 89 (1.9%) |
| 65 to 74 Years | 417 (23.6%) | 110 (5.9%) |
| 75 Years and over | 404 (29.4%) | 255 (15.9%) |
Disability Class: Vision Difficulty
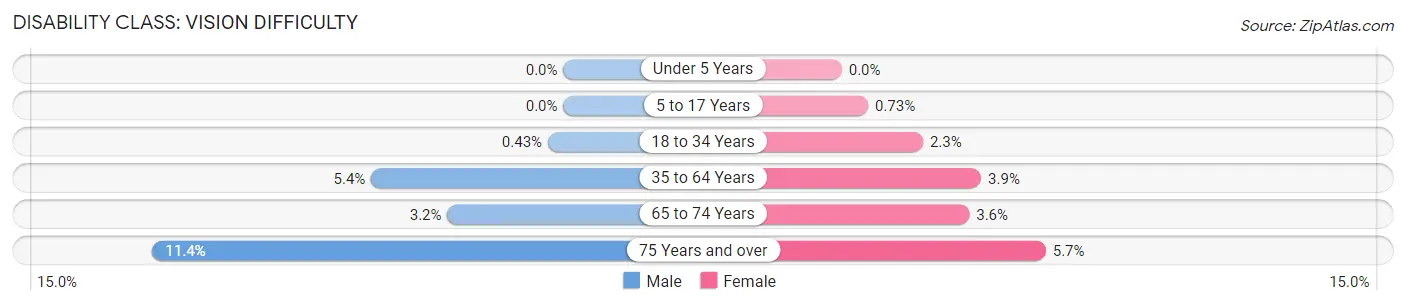
| Age Bracket | Male | Female |
| Under 5 Years | 0 (0.0%) | 0 (0.0%) |
| 5 to 17 Years | 0 (0.0%) | 13 (0.7%) |
| 18 to 34 Years | 9 (0.4%) | 43 (2.3%) |
| 35 to 64 Years | 249 (5.3%) | 181 (3.9%) |
| 65 to 74 Years | 57 (3.2%) | 66 (3.5%) |
| 75 Years and over | 157 (11.4%) | 91 (5.7%) |
Disability Class: Cognitive Difficulty
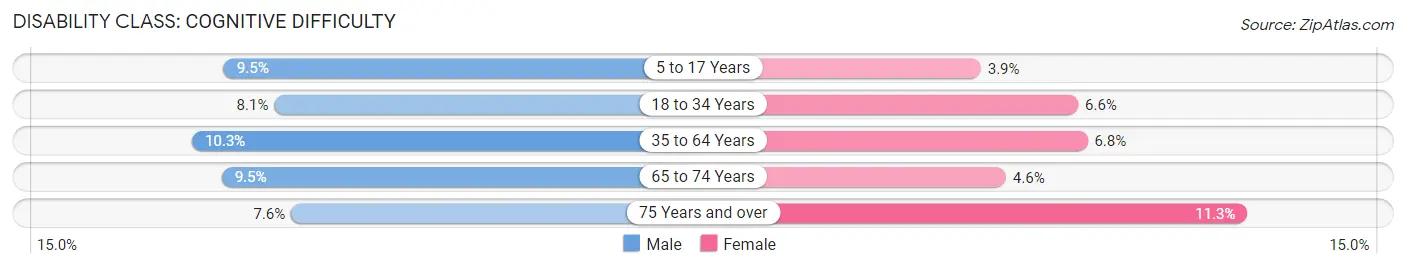
| Age Bracket | Male | Female |
| 5 to 17 Years | 175 (9.5%) | 69 (3.9%) |
| 18 to 34 Years | 168 (8.1%) | 125 (6.6%) |
| 35 to 64 Years | 481 (10.3%) | 319 (6.8%) |
| 65 to 74 Years | 168 (9.5%) | 85 (4.6%) |
| 75 Years and over | 104 (7.6%) | 181 (11.3%) |
Disability Class: Ambulatory Difficulty
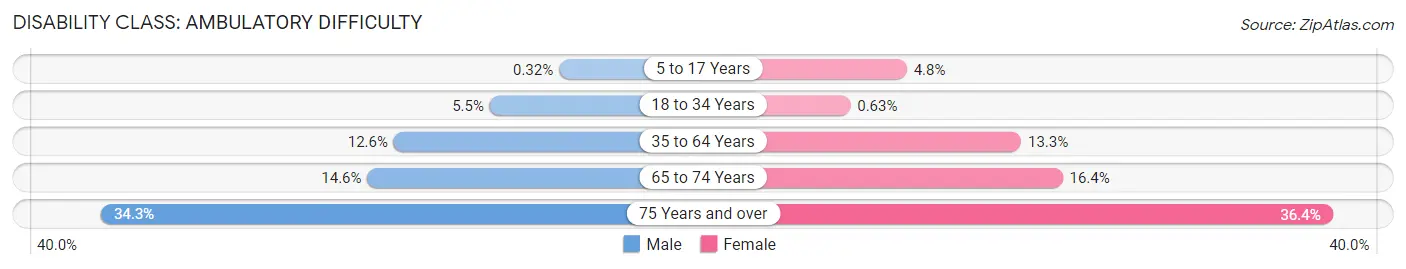
| Age Bracket | Male | Female |
| 5 to 17 Years | 6 (0.3%) | 86 (4.8%) |
| 18 to 34 Years | 114 (5.5%) | 12 (0.6%) |
| 35 to 64 Years | 586 (12.6%) | 621 (13.3%) |
| 65 to 74 Years | 257 (14.5%) | 305 (16.4%) |
| 75 Years and over | 471 (34.3%) | 584 (36.4%) |
Disability Class: Self-Care Difficulty
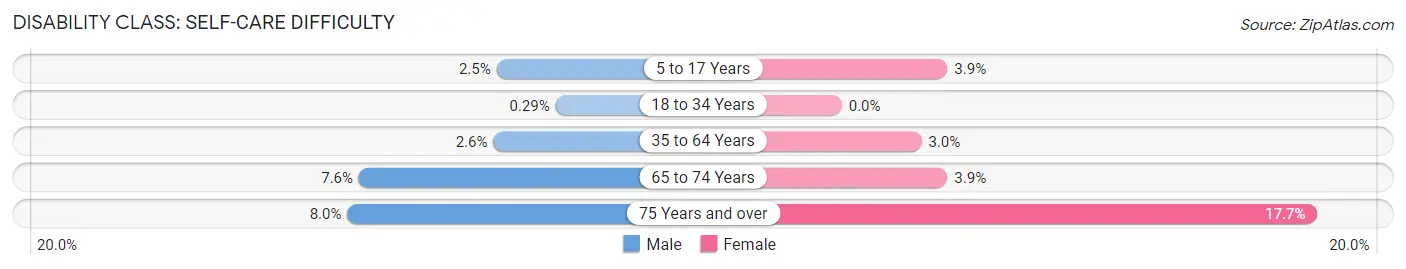
| Age Bracket | Male | Female |
| 5 to 17 Years | 46 (2.5%) | 70 (3.9%) |
| 18 to 34 Years | 6 (0.3%) | 0 (0.0%) |
| 35 to 64 Years | 121 (2.6%) | 138 (3.0%) |
| 65 to 74 Years | 134 (7.6%) | 73 (3.9%) |
| 75 Years and over | 110 (8.0%) | 283 (17.6%) |
Technology Access in Cleburne County
Computing Device Access in Cleburne County
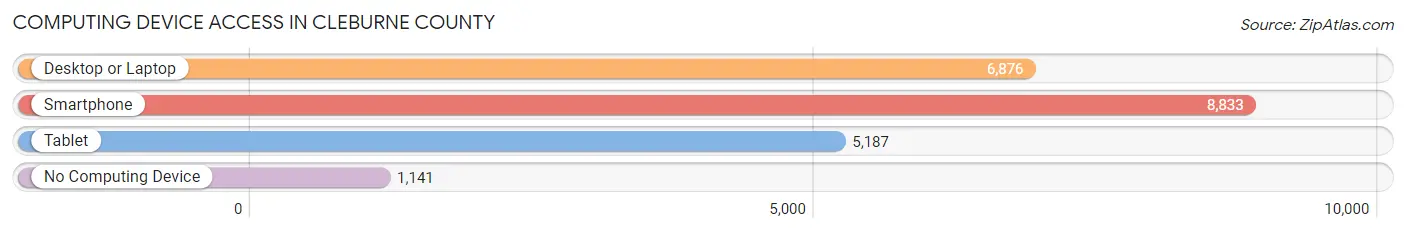
| Device Type | # Households | % Households |
| Desktop or Laptop | 6,876 | 64.7% |
| Smartphone | 8,833 | 83.1% |
| Tablet | 5,187 | 48.8% |
| No Computing Device | 1,141 | 10.7% |
| Total | 10,626 | 100.0% |
Internet Access in Cleburne County
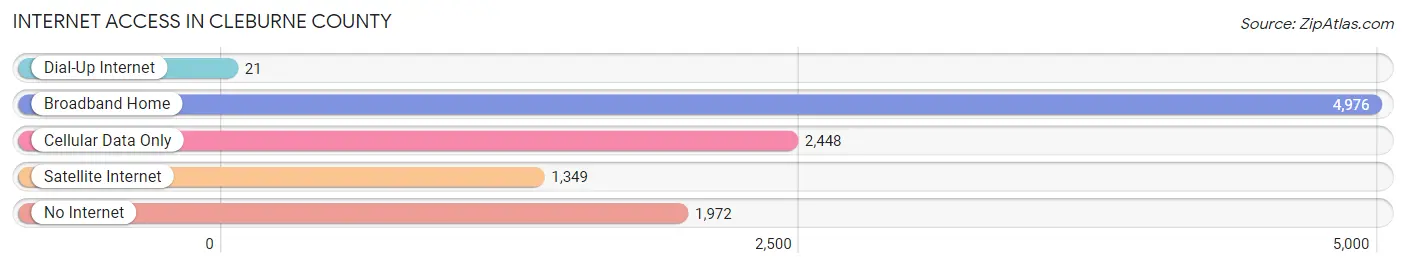
| Internet Type | # Households | % Households |
| Dial-Up Internet | 21 | 0.2% |
| Broadband Home | 4,976 | 46.8% |
| Cellular Data Only | 2,448 | 23.0% |
| Satellite Internet | 1,349 | 12.7% |
| No Internet | 1,972 | 18.6% |
| Total | 10,626 | 100.0% |
Cleburne County Summary
Cleburne County is located in the north-central part of Arkansas, and is part of the Little Rock-North Little Rock-Conway Metropolitan Statistical Area. The county was established in 1883 and is named for Confederate General Patrick Cleburne. As of the 2010 census, the population was 25,970.
Geography
Cleburne County is located in the foothills of the Ozark Mountains and is bordered by White County to the north, Van Buren County to the east, Faulkner County to the south, and Independence County to the west. The county has a total area of 602 square miles, of which 599 square miles is land and 3 square miles (0.5%) is water. The highest point in the county is Sugarloaf Mountain, which has an elevation of 1,890 feet.
The county is divided into two distinct regions: the Ozark Plateau in the north and the Arkansas River Valley in the south. The Ozark Plateau is characterized by rolling hills and is home to the Ozark National Forest. The Arkansas River Valley is characterized by flat terrain and is home to the Greers Ferry Lake.
Economy
The economy of Cleburne County is largely based on agriculture and tourism. The county is home to several large farms, including the largest cattle ranch in the state. The county also has a thriving tourism industry, with visitors coming to enjoy the natural beauty of the Ozark Mountains and Greers Ferry Lake.
The county is also home to several manufacturing companies, including a large poultry processing plant and a furniture manufacturing plant. The county also has a growing service sector, with several medical and financial services companies located in the county.
Demographics
As of the 2010 census, there were 25,970 people, 10,093 households, and 7,072 families residing in the county. The population density was 43 people per square mile. There were 11,845 housing units at an average density of 20 per square mile. The racial makeup of the county was 94.2% White, 0.7% Black or African American, 0.5% Native American, 0.3% Asian, 0.1% Pacific Islander, 2.7% from other races, and 1.5% from two or more races. 5.3% of the population were Hispanic or Latino of any race.
The median income for a household in the county was $35,945, and the median income for a family was $43,945. The per capita income for the county was $18,845. About 13.2% of families and 17.2% of the population were below the poverty line, including 22.2% of those under age 18 and 13.2% of those age 65 or over.
Conclusion
Cleburne County is a rural county located in the north-central part of Arkansas. The county is home to a thriving agricultural and tourism industry, as well as several manufacturing and service sector companies. The population of the county is largely white, with a small minority population. The median income for a household in the county is slightly below the state average, and the poverty rate is slightly higher than the state average.
Common Questions
What is Per Capita Income in Cleburne County?
Per Capita income in Cleburne County is $31,041.
What is the Median Family Income in Cleburne County?
Median Family Income in Cleburne County is $64,091.
What is the Median Household income in Cleburne County?
Median Household Income in Cleburne County is $52,780.
What is Income or Wage Gap in Cleburne County?
Income or Wage Gap in Cleburne County is 31.5%.
Women in Cleburne County earn 68.5 cents for every dollar earned by a man.
What is Family Income Deficit in Cleburne County?
Family Income Deficit in Cleburne County is $9,018.
Families that are below poverty line in Cleburne County earn $9,018 less on average than the poverty threshold level.
What is Inequality or Gini Index in Cleburne County?
Inequality or Gini Index in Cleburne County is 0.45.
What is the Total Population of Cleburne County?
Total Population of Cleburne County is 24,948.
What is the Total Male Population of Cleburne County?
Total Male Population of Cleburne County is 12,469.
What is the Total Female Population of Cleburne County?
Total Female Population of Cleburne County is 12,479.
What is the Ratio of Males per 100 Females in Cleburne County?
There are 99.92 Males per 100 Females in Cleburne County.
What is the Ratio of Females per 100 Males in Cleburne County?
There are 100.08 Females per 100 Males in Cleburne County.
What is the Median Population Age in Cleburne County?
Median Population Age in Cleburne County is 49.5 Years.
What is the Average Family Size in Cleburne County
Average Family Size in Cleburne County is 2.9 People.
What is the Average Household Size in Cleburne County
Average Household Size in Cleburne County is 2.3 People.
How Large is the Labor Force in Cleburne County?
There are 10,013 People in the Labor Forcein in Cleburne County.
What is the Percentage of People in the Labor Force in Cleburne County?
48.0% of People are in the Labor Force in Cleburne County.
What is the Unemployment Rate in Cleburne County?
Unemployment Rate in Cleburne County is 6.0%.