Pope County, AR Map & Demographics
Pope County Map
Pope County Overview
$28,018
PER CAPITA INCOME
$64,117
AVG FAMILY INCOME
$51,678
AVG HOUSEHOLD INCOME
40.0%
WAGE / INCOME GAP [ % ]
60.0¢/ $1
WAGE / INCOME GAP [ $ ]
$8,363
FAMILY INCOME DEFICIT
0.47
INEQUALITY / GINI INDEX
63,475
TOTAL POPULATION
31,401
MALE POPULATION
32,074
FEMALE POPULATION
97.90
MALES / 100 FEMALES
102.14
FEMALES / 100 MALES
36.7
MEDIAN AGE
3.1
AVG FAMILY SIZE
2.5
AVG HOUSEHOLD SIZE
28,563
LABOR FORCE [ PEOPLE ]
56.3%
PERCENT IN LABOR FORCE
4.8%
UNEMPLOYMENT RATE
Income in Pope County
Income Overview in Pope County
Per Capita Income in Pope County is $28,018, while median incomes of families and households are $64,117 and $51,678 respectively.
| Characteristic | Number | Measure |
| Per Capita Income | 63,475 | $28,018 |
| Median Family Income | 15,817 | $64,117 |
| Mean Family Income | 15,817 | $87,779 |
| Median Household Income | 23,684 | $51,678 |
| Mean Household Income | 23,684 | $73,118 |
| Income Deficit | 15,817 | $8,363 |
| Wage / Income Gap (%) | 63,475 | 40.04% |
| Wage / Income Gap ($) | 63,475 | 59.96¢ per $1 |
| Gini / Inequality Index | 63,475 | 0.47 |
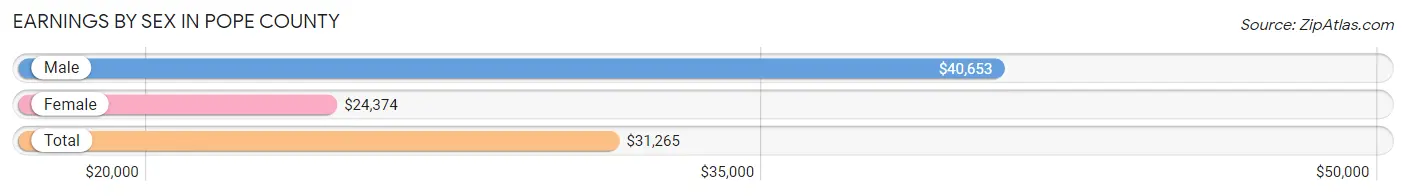
Earnings by Sex in Pope County
Average Earnings in Pope County are $31,265, $40,653 for men and $24,374 for women, a difference of 40.0%.
| Sex | Number | Average Earnings |
| Male | 16,314 (53.7%) | $40,653 |
| Female | 14,078 (46.3%) | $24,374 |
| Total | 30,392 (100.0%) | $31,265 |
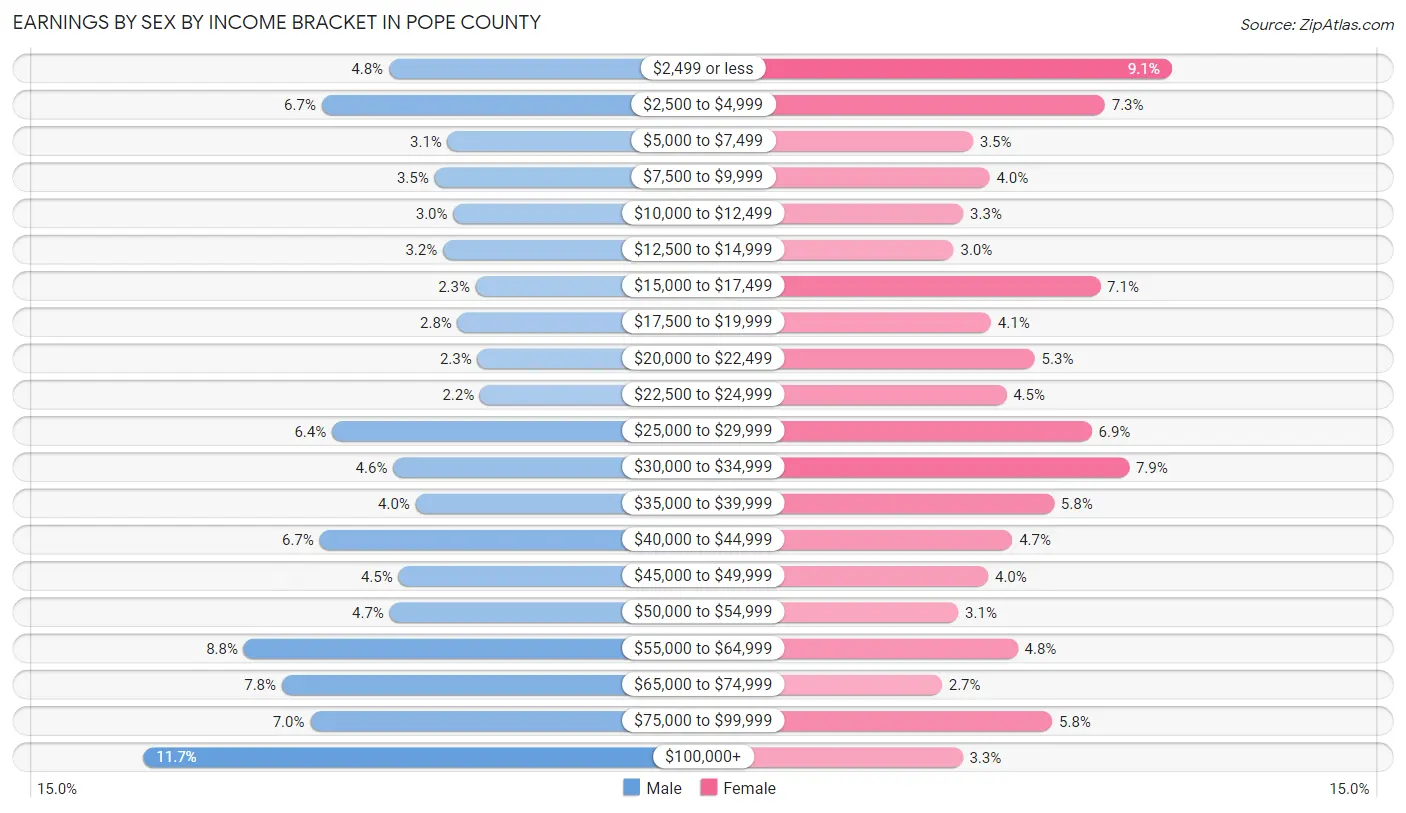
Earnings by Sex by Income Bracket in Pope County
The most common earnings brackets in Pope County are $100,000+ for men (1,902 | 11.7%) and $2,499 or less for women (1,285 | 9.1%).
| Income | Male | Female |
| $2,499 or less | 776 (4.8%) | 1,285 (9.1%) |
| $2,500 to $4,999 | 1,085 (6.7%) | 1,021 (7.2%) |
| $5,000 to $7,499 | 507 (3.1%) | 498 (3.5%) |
| $7,500 to $9,999 | 568 (3.5%) | 564 (4.0%) |
| $10,000 to $12,499 | 482 (2.9%) | 460 (3.3%) |
| $12,500 to $14,999 | 529 (3.2%) | 422 (3.0%) |
| $15,000 to $17,499 | 378 (2.3%) | 1,003 (7.1%) |
| $17,500 to $19,999 | 462 (2.8%) | 570 (4.1%) |
| $20,000 to $22,499 | 370 (2.3%) | 743 (5.3%) |
| $22,500 to $24,999 | 359 (2.2%) | 631 (4.5%) |
| $25,000 to $29,999 | 1,037 (6.4%) | 969 (6.9%) |
| $30,000 to $34,999 | 757 (4.6%) | 1,117 (7.9%) |
| $35,000 to $39,999 | 655 (4.0%) | 820 (5.8%) |
| $40,000 to $44,999 | 1,095 (6.7%) | 654 (4.6%) |
| $45,000 to $49,999 | 733 (4.5%) | 559 (4.0%) |
| $50,000 to $54,999 | 773 (4.7%) | 440 (3.1%) |
| $55,000 to $64,999 | 1,442 (8.8%) | 676 (4.8%) |
| $65,000 to $74,999 | 1,267 (7.8%) | 376 (2.7%) |
| $75,000 to $99,999 | 1,137 (7.0%) | 812 (5.8%) |
| $100,000+ | 1,902 (11.7%) | 458 (3.3%) |
| Total | 16,314 (100.0%) | 14,078 (100.0%) |
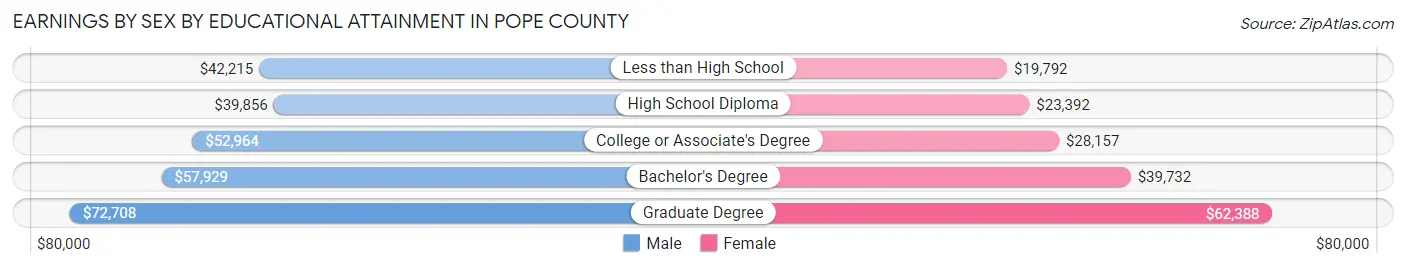
Earnings by Sex by Educational Attainment in Pope County
Average earnings in Pope County are $48,753 for men and $31,178 for women, a difference of 36.0%. Men with an educational attainment of graduate degree enjoy the highest average annual earnings of $72,708, while those with high school diploma education earn the least with $39,856. Women with an educational attainment of graduate degree earn the most with the average annual earnings of $62,388, while those with less than high school education have the smallest earnings of $19,792.
| Educational Attainment | Male Income | Female Income |
| Less than High School | $42,215 | $19,792 |
| High School Diploma | $39,856 | $23,392 |
| College or Associate's Degree | $52,964 | $28,157 |
| Bachelor's Degree | $57,929 | $39,732 |
| Graduate Degree | $72,708 | $62,388 |
| Total | $48,753 | $31,178 |
Family Income in Pope County
Family Income Brackets in Pope County
According to the Pope County family income data, there are 2,910 families falling into the $50,000 to $74,999 income range, which is the most common income bracket and makes up 18.4% of all families. Conversely, the less than $10,000 income bracket is the least frequent group with only 459 families (2.9%) belonging to this category.
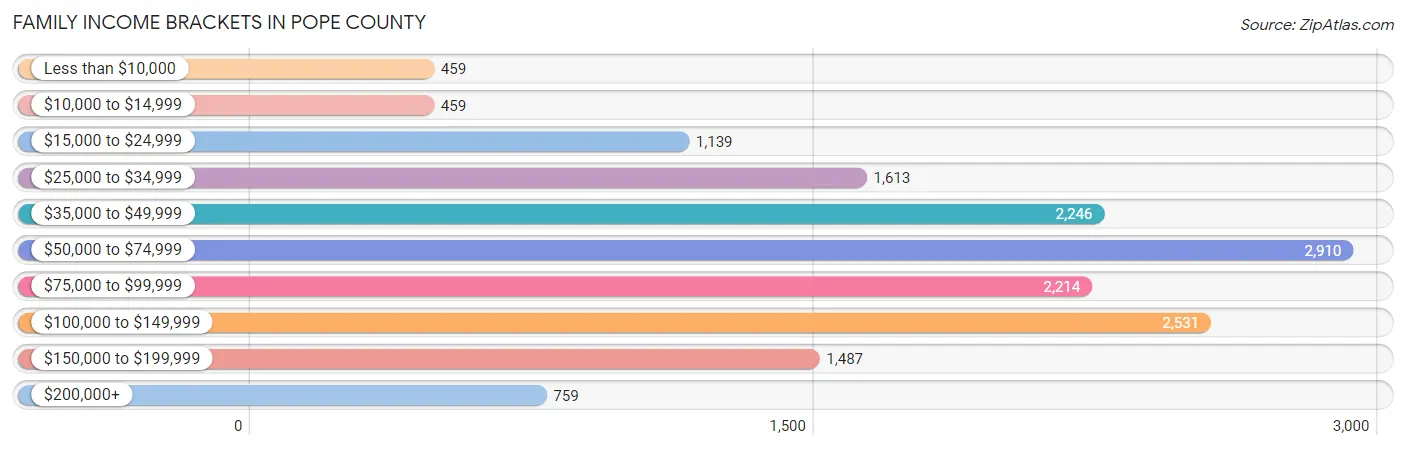
| Income Bracket | # Families | % Families |
| Less than $10,000 | 459 | 2.9% |
| $10,000 to $14,999 | 459 | 2.9% |
| $15,000 to $24,999 | 1,139 | 7.2% |
| $25,000 to $34,999 | 1,613 | 10.2% |
| $35,000 to $49,999 | 2,246 | 14.2% |
| $50,000 to $74,999 | 2,910 | 18.4% |
| $75,000 to $99,999 | 2,214 | 14.0% |
| $100,000 to $149,999 | 2,531 | 16.0% |
| $150,000 to $199,999 | 1,487 | 9.4% |
| $200,000+ | 759 | 4.8% |
Family Income by Famaliy Size in Pope County
5-person families (1,034 | 6.5%) account for the highest median family income in Pope County with $82,547 per family, while 2-person families (7,783 | 49.2%) have the highest median income of $29,948 per family member.
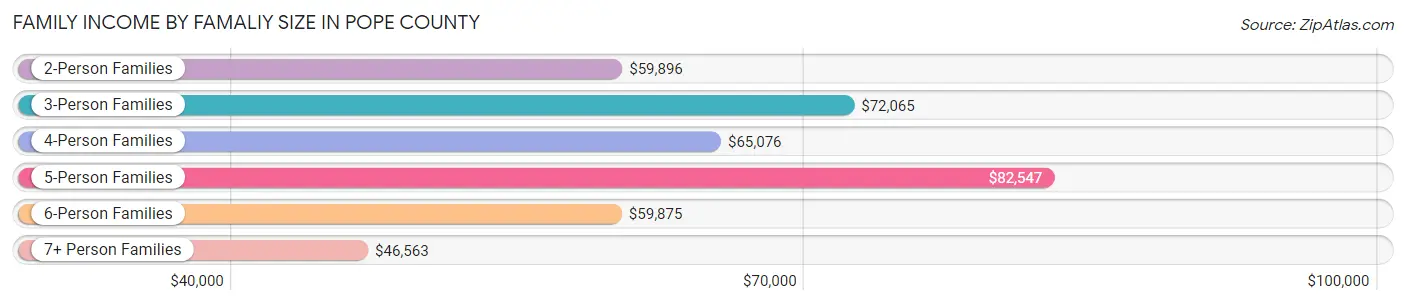
| Income Bracket | # Families | Median Income |
| 2-Person Families | 7,783 (49.2%) | $59,896 |
| 3-Person Families | 3,546 (22.4%) | $72,065 |
| 4-Person Families | 2,806 (17.7%) | $65,076 |
| 5-Person Families | 1,034 (6.5%) | $82,547 |
| 6-Person Families | 389 (2.5%) | $59,875 |
| 7+ Person Families | 259 (1.6%) | $46,563 |
| Total | 15,817 (100.0%) | $64,117 |
Family Income by Number of Earners in Pope County
The median family income in Pope County is $64,117, with families comprising 3+ earners (1,013) having the highest median family income of $122,194, while families with no earners (3,126) have the lowest median family income of $38,731, accounting for 6.4% and 19.8% of families, respectively.
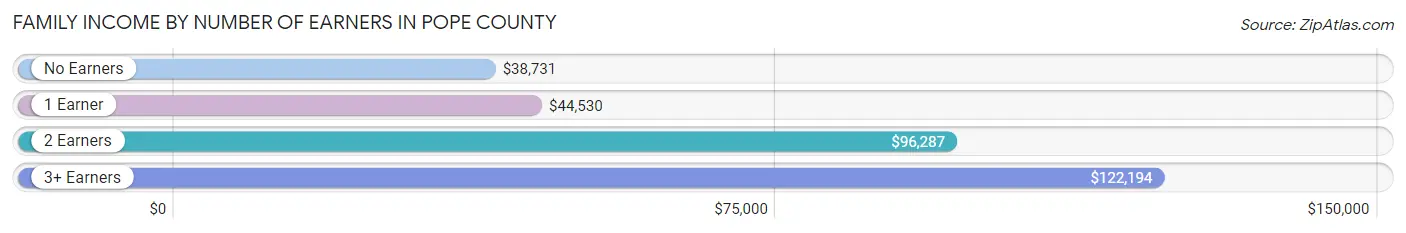
| Number of Earners | # Families | Median Income |
| No Earners | 3,126 (19.8%) | $38,731 |
| 1 Earner | 5,467 (34.6%) | $44,530 |
| 2 Earners | 6,211 (39.3%) | $96,287 |
| 3+ Earners | 1,013 (6.4%) | $122,194 |
| Total | 15,817 (100.0%) | $64,117 |
Household Income in Pope County
Household Income Brackets in Pope County
With 4,358 households falling in the category, the $50,000 to $74,999 income range is the most frequent in Pope County, accounting for 18.4% of all households. In contrast, only 853 households (3.6%) fall into the $200,000+ income bracket, making it the least populous group.
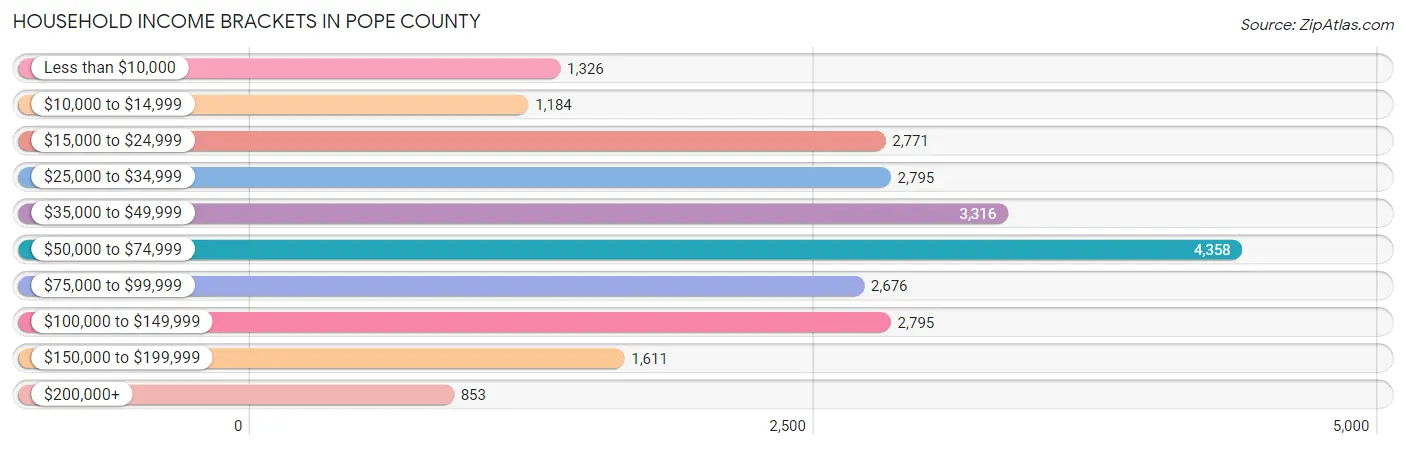
| Income Bracket | # Households | % Households |
| Less than $10,000 | 1,326 | 5.6% |
| $10,000 to $14,999 | 1,184 | 5.0% |
| $15,000 to $24,999 | 2,771 | 11.7% |
| $25,000 to $34,999 | 2,795 | 11.8% |
| $35,000 to $49,999 | 3,316 | 14.0% |
| $50,000 to $74,999 | 4,358 | 18.4% |
| $75,000 to $99,999 | 2,676 | 11.3% |
| $100,000 to $149,999 | 2,795 | 11.8% |
| $150,000 to $199,999 | 1,611 | 6.8% |
| $200,000+ | 853 | 3.6% |
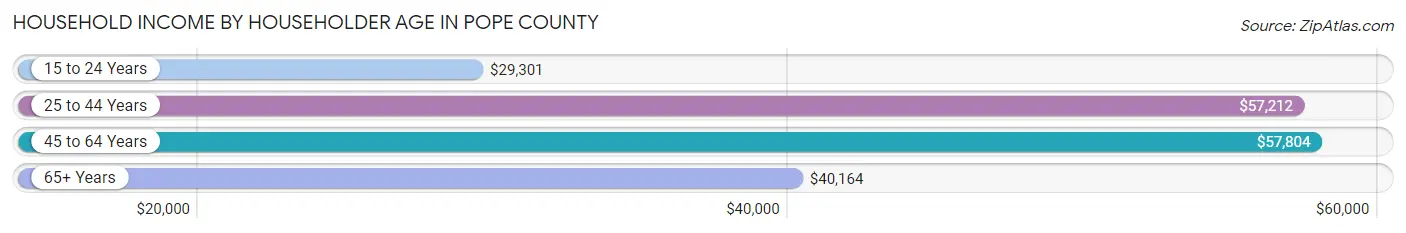
Household Income by Householder Age in Pope County
The median household income in Pope County is $51,678, with the highest median household income of $57,804 found in the 45 to 64 years age bracket for the primary householder. A total of 8,798 households (37.1%) fall into this category. Meanwhile, the 15 to 24 years age bracket for the primary householder has the lowest median household income of $29,301, with 1,347 households (5.7%) in this group.
| Income Bracket | # Households | Median Income |
| 15 to 24 Years | 1,347 (5.7%) | $29,301 |
| 25 to 44 Years | 7,175 (30.3%) | $57,212 |
| 45 to 64 Years | 8,798 (37.1%) | $57,804 |
| 65+ Years | 6,364 (26.9%) | $40,164 |
| Total | 23,684 (100.0%) | $51,678 |
Poverty in Pope County
Income Below Poverty by Sex and Age in Pope County
With 14.5% poverty level for males and 21.1% for females among the residents of Pope County, under 5 year old males and 18 to 24 year old females are the most vulnerable to poverty, with 467 males (25.3%) and 1,152 females (42.8%) in their respective age groups living below the poverty level.
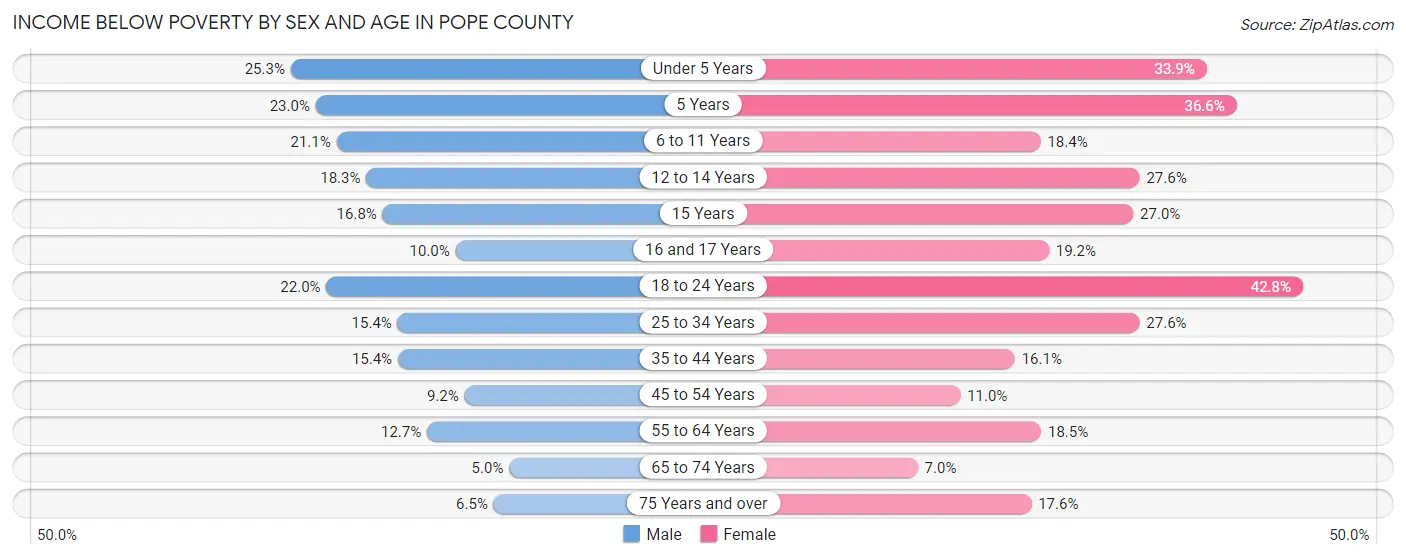
| Age Bracket | Male | Female |
| Under 5 Years | 467 (25.3%) | 631 (33.9%) |
| 5 Years | 54 (23.0%) | 152 (36.6%) |
| 6 to 11 Years | 545 (21.0%) | 474 (18.4%) |
| 12 to 14 Years | 223 (18.3%) | 297 (27.6%) |
| 15 Years | 56 (16.8%) | 73 (27.0%) |
| 16 and 17 Years | 76 (10.0%) | 195 (19.2%) |
| 18 to 24 Years | 593 (22.0%) | 1,152 (42.8%) |
| 25 to 34 Years | 609 (15.4%) | 1,137 (27.6%) |
| 35 to 44 Years | 566 (15.3%) | 591 (16.1%) |
| 45 to 54 Years | 337 (9.2%) | 402 (11.0%) |
| 55 to 64 Years | 507 (12.7%) | 725 (18.5%) |
| 65 to 74 Years | 136 (5.0%) | 213 (7.0%) |
| 75 Years and over | 114 (6.5%) | 403 (17.6%) |
| Total | 4,283 (14.5%) | 6,445 (21.1%) |
Income Above Poverty by Sex and Age in Pope County
According to the poverty statistics in Pope County, males aged 65 to 74 years and females aged 65 to 74 years are the age groups that are most secure financially, with 95.0% of males and 93.0% of females in these age groups living above the poverty line.
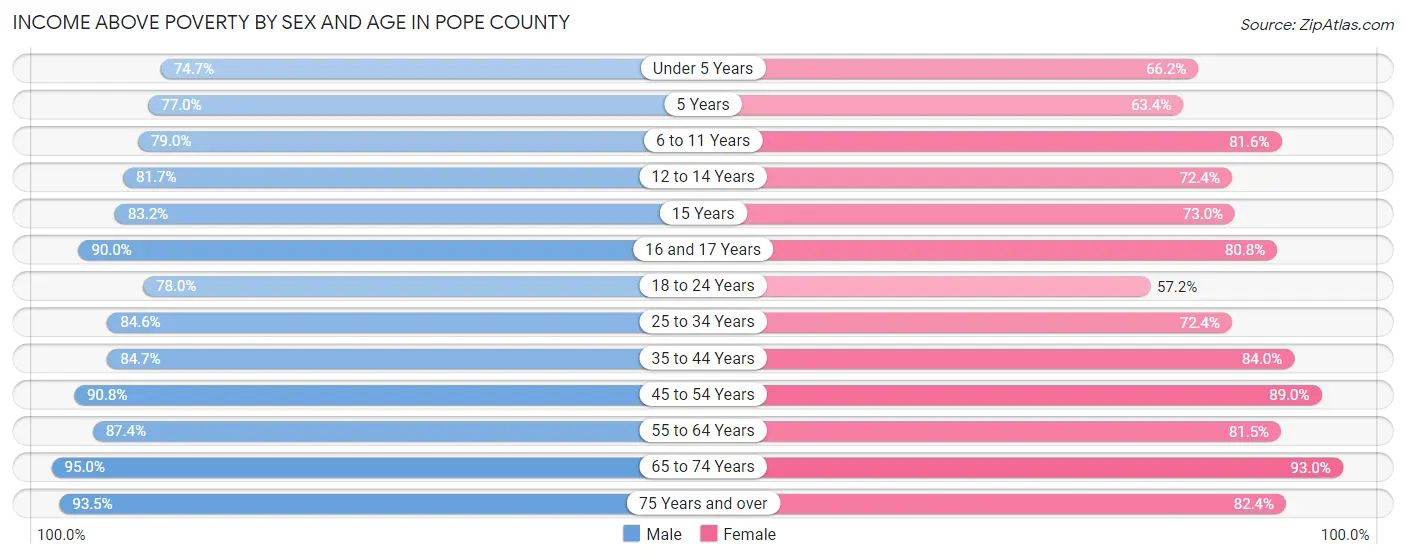
| Age Bracket | Male | Female |
| Under 5 Years | 1,379 (74.7%) | 1,233 (66.1%) |
| 5 Years | 181 (77.0%) | 263 (63.4%) |
| 6 to 11 Years | 2,044 (78.9%) | 2,097 (81.6%) |
| 12 to 14 Years | 996 (81.7%) | 778 (72.4%) |
| 15 Years | 278 (83.2%) | 197 (73.0%) |
| 16 and 17 Years | 684 (90.0%) | 820 (80.8%) |
| 18 to 24 Years | 2,104 (78.0%) | 1,541 (57.2%) |
| 25 to 34 Years | 3,351 (84.6%) | 2,980 (72.4%) |
| 35 to 44 Years | 3,122 (84.7%) | 3,091 (84.0%) |
| 45 to 54 Years | 3,339 (90.8%) | 3,256 (89.0%) |
| 55 to 64 Years | 3,501 (87.4%) | 3,195 (81.5%) |
| 65 to 74 Years | 2,574 (95.0%) | 2,812 (93.0%) |
| 75 Years and over | 1,651 (93.5%) | 1,890 (82.4%) |
| Total | 25,204 (85.5%) | 24,153 (78.9%) |
Income Below Poverty Among Married-Couple Families in Pope County
The poverty statistics for married-couple families in Pope County show that 6.4% or 760 of the total 11,872 families live below the poverty line. Families with 5 or more children have the highest poverty rate of 48.4%, comprising of 46 families. On the other hand, families with no children have the lowest poverty rate of 4.2%, which includes 295 families.
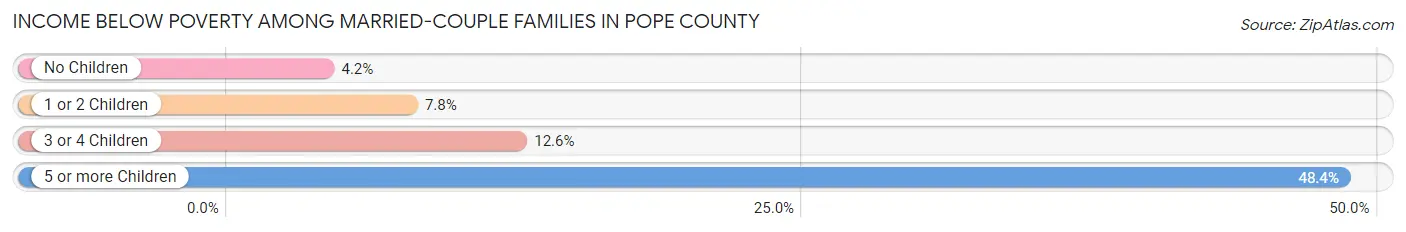
| Children | Above Poverty | Below Poverty |
| No Children | 6,732 (95.8%) | 295 (4.2%) |
| 1 or 2 Children | 3,463 (92.2%) | 294 (7.8%) |
| 3 or 4 Children | 868 (87.4%) | 125 (12.6%) |
| 5 or more Children | 49 (51.6%) | 46 (48.4%) |
| Total | 11,112 (93.6%) | 760 (6.4%) |
Income Below Poverty Among Single-Parent Households in Pope County
According to the poverty data in Pope County, 19.3% or 202 single-father households and 34.9% or 1,012 single-mother households are living below the poverty line. Among single-father households, those with 1 or 2 children have the highest poverty rate, with 123 households (20.6%) experiencing poverty. Likewise, among single-mother households, those with 3 or 4 children have the highest poverty rate, with 332 households (66.9%) falling below the poverty line.
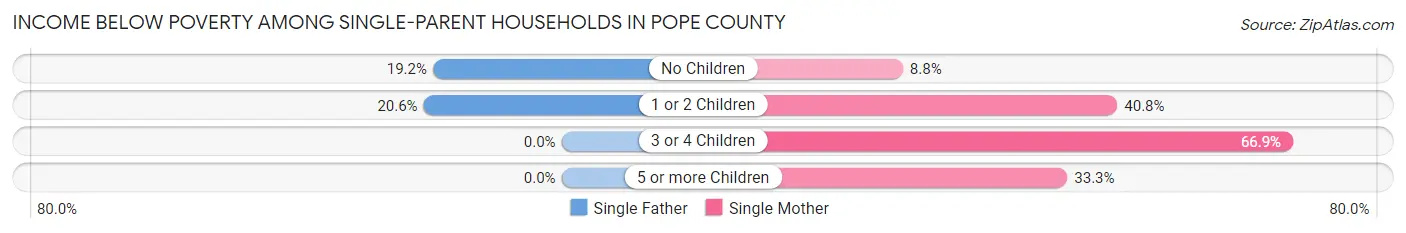
| Children | Single Father | Single Mother |
| No Children | 79 (19.2%) | 82 (8.8%) |
| 1 or 2 Children | 123 (20.6%) | 588 (40.8%) |
| 3 or 4 Children | 0 (0.0%) | 332 (66.9%) |
| 5 or more Children | 0 (0.0%) | 10 (33.3%) |
| Total | 202 (19.3%) | 1,012 (34.9%) |
Income Below Poverty Among Married-Couple vs Single-Parent Households in Pope County
The poverty data for Pope County shows that 760 of the married-couple family households (6.4%) and 1,214 of the single-parent households (30.8%) are living below the poverty level. Within the married-couple family households, those with 5 or more children have the highest poverty rate, with 46 households (48.4%) falling below the poverty line. Among the single-parent households, those with 3 or 4 children have the highest poverty rate, with 332 household (62.2%) living below poverty.
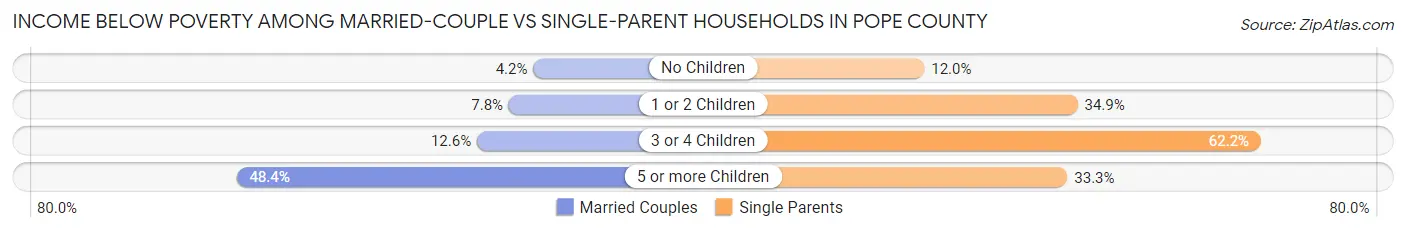
| Children | Married-Couple Families | Single-Parent Households |
| No Children | 295 (4.2%) | 161 (12.0%) |
| 1 or 2 Children | 294 (7.8%) | 711 (34.8%) |
| 3 or 4 Children | 125 (12.6%) | 332 (62.2%) |
| 5 or more Children | 46 (48.4%) | 10 (33.3%) |
| Total | 760 (6.4%) | 1,214 (30.8%) |
Race in Pope County
The most populous races in Pope County are White / Caucasian (54,268 | 85.5%), Hispanic or Latino (6,305 | 9.9%), and Two or more Races (3,844 | 6.1%).
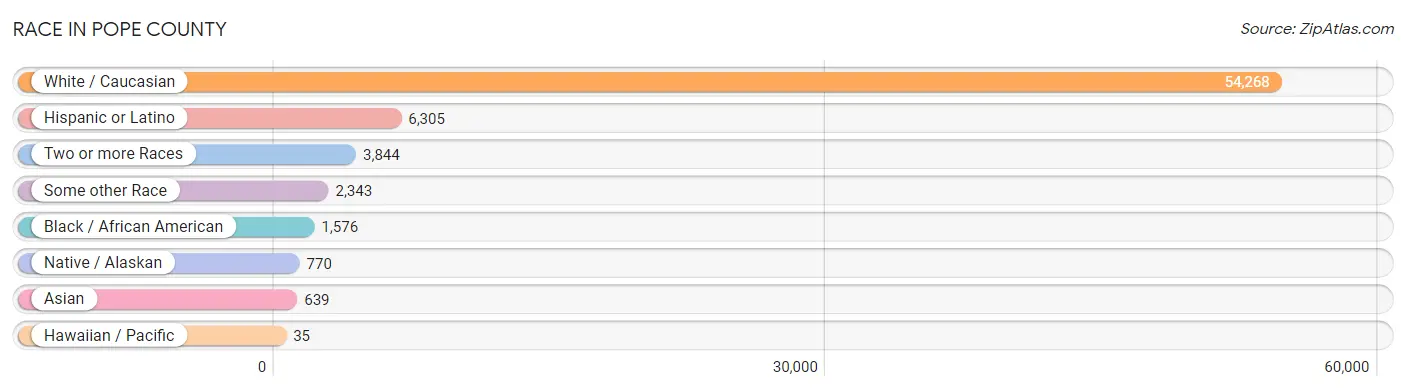
| Race | # Population | % Population |
| Asian | 639 | 1.0% |
| Black / African American | 1,576 | 2.5% |
| Hawaiian / Pacific | 35 | 0.1% |
| Hispanic or Latino | 6,305 | 9.9% |
| Native / Alaskan | 770 | 1.2% |
| White / Caucasian | 54,268 | 85.5% |
| Two or more Races | 3,844 | 6.1% |
| Some other Race | 2,343 | 3.7% |
| Total | 63,475 | 100.0% |
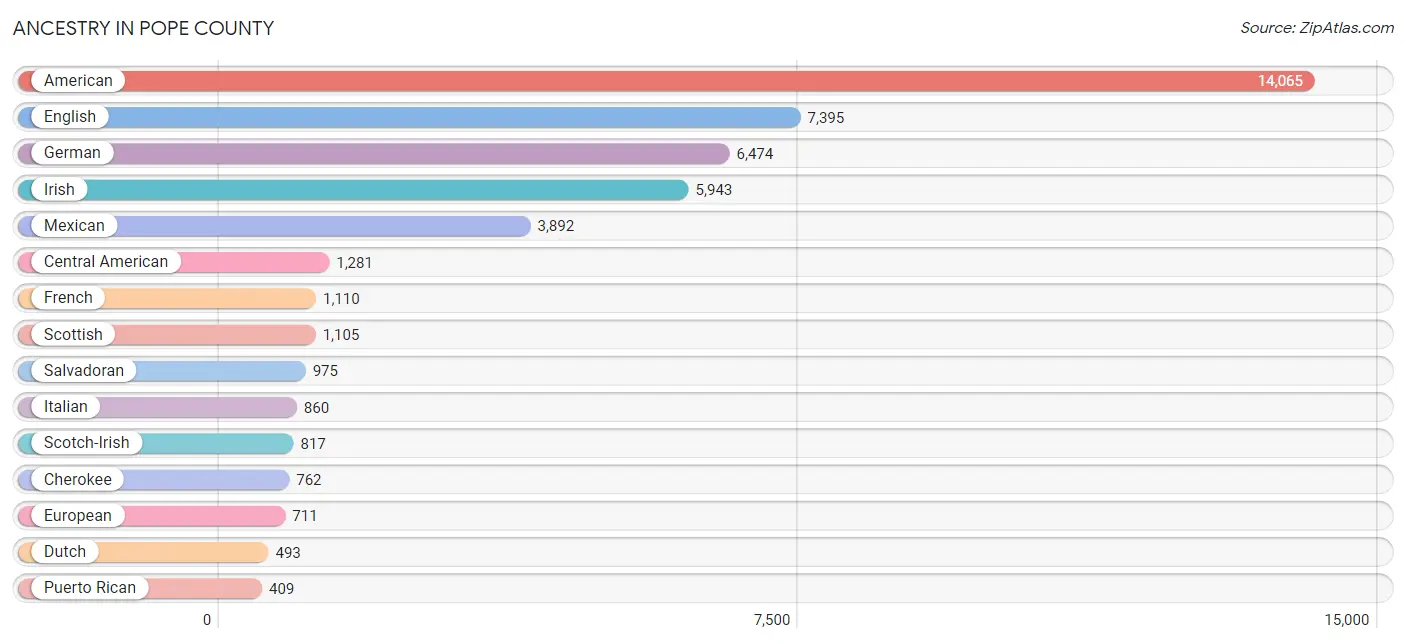
Ancestry in Pope County
The most populous ancestries reported in Pope County are American (14,065 | 22.2%), English (7,395 | 11.7%), German (6,474 | 10.2%), Irish (5,943 | 9.4%), and Mexican (3,892 | 6.1%), together accounting for 59.5% of all Pope County residents.
| Ancestry | # Population | % Population |
| African | 22 | 0.0% |
| Alsatian | 12 | 0.0% |
| American | 14,065 | 22.2% |
| Apache | 19 | 0.0% |
| Arab | 7 | 0.0% |
| Belgian | 11 | 0.0% |
| Bhutanese | 56 | 0.1% |
| Blackfeet | 13 | 0.0% |
| Brazilian | 48 | 0.1% |
| British | 320 | 0.5% |
| Burmese | 114 | 0.2% |
| Canadian | 7 | 0.0% |
| Celtic | 16 | 0.0% |
| Central American | 1,281 | 2.0% |
| Central American Indian | 334 | 0.5% |
| Cherokee | 762 | 1.2% |
| Chickasaw | 4 | 0.0% |
| Chilean | 16 | 0.0% |
| Chippewa | 9 | 0.0% |
| Choctaw | 88 | 0.1% |
| Colombian | 60 | 0.1% |
| Creek | 18 | 0.0% |
| Cuban | 66 | 0.1% |
| Czech | 147 | 0.2% |
| Czechoslovakian | 20 | 0.0% |
| Danish | 69 | 0.1% |
| Dominican | 27 | 0.0% |
| Dutch | 493 | 0.8% |
| Dutch West Indian | 52 | 0.1% |
| Eastern European | 68 | 0.1% |
| Ecuadorian | 5 | 0.0% |
| English | 7,395 | 11.7% |
| European | 711 | 1.1% |
| Filipino | 27 | 0.0% |
| Finnish | 5 | 0.0% |
| French | 1,110 | 1.8% |
| French Canadian | 87 | 0.1% |
| German | 6,474 | 10.2% |
| Greek | 24 | 0.0% |
| Guatemalan | 73 | 0.1% |
| Honduran | 233 | 0.4% |
| Hungarian | 61 | 0.1% |
| Indian (Asian) | 188 | 0.3% |
| Iranian | 67 | 0.1% |
| Irish | 5,943 | 9.4% |
| Italian | 860 | 1.3% |
| Korean | 165 | 0.3% |
| Laotian | 26 | 0.0% |
| Malaysian | 36 | 0.1% |
| Mexican | 3,892 | 6.1% |
| Mexican American Indian | 399 | 0.6% |
| Native Hawaiian | 41 | 0.1% |
| Navajo | 10 | 0.0% |
| New Zealander | 11 | 0.0% |
| Northern European | 161 | 0.3% |
| Norwegian | 361 | 0.6% |
| Osage | 18 | 0.0% |
| Pakistani | 25 | 0.0% |
| Peruvian | 18 | 0.0% |
| Polish | 281 | 0.4% |
| Portuguese | 146 | 0.2% |
| Potawatomi | 9 | 0.0% |
| Puerto Rican | 409 | 0.6% |
| Russian | 62 | 0.1% |
| Salvadoran | 975 | 1.5% |
| Scandinavian | 146 | 0.2% |
| Scotch-Irish | 817 | 1.3% |
| Scottish | 1,105 | 1.7% |
| Sioux | 42 | 0.1% |
| Slovak | 6 | 0.0% |
| South African | 37 | 0.1% |
| South American | 347 | 0.5% |
| Spaniard | 59 | 0.1% |
| Spanish | 75 | 0.1% |
| Sri Lankan | 243 | 0.4% |
| Subsaharan African | 66 | 0.1% |
| Swedish | 304 | 0.5% |
| Swiss | 88 | 0.1% |
| Thai | 164 | 0.3% |
| Tongan | 110 | 0.2% |
| Ugandan | 7 | 0.0% |
| Ukrainian | 11 | 0.0% |
| Venezuelan | 248 | 0.4% |
| Welsh | 381 | 0.6% |
| West Indian | 65 | 0.1% |
| Yugoslavian | 11 | 0.0% | View All 86 Rows |
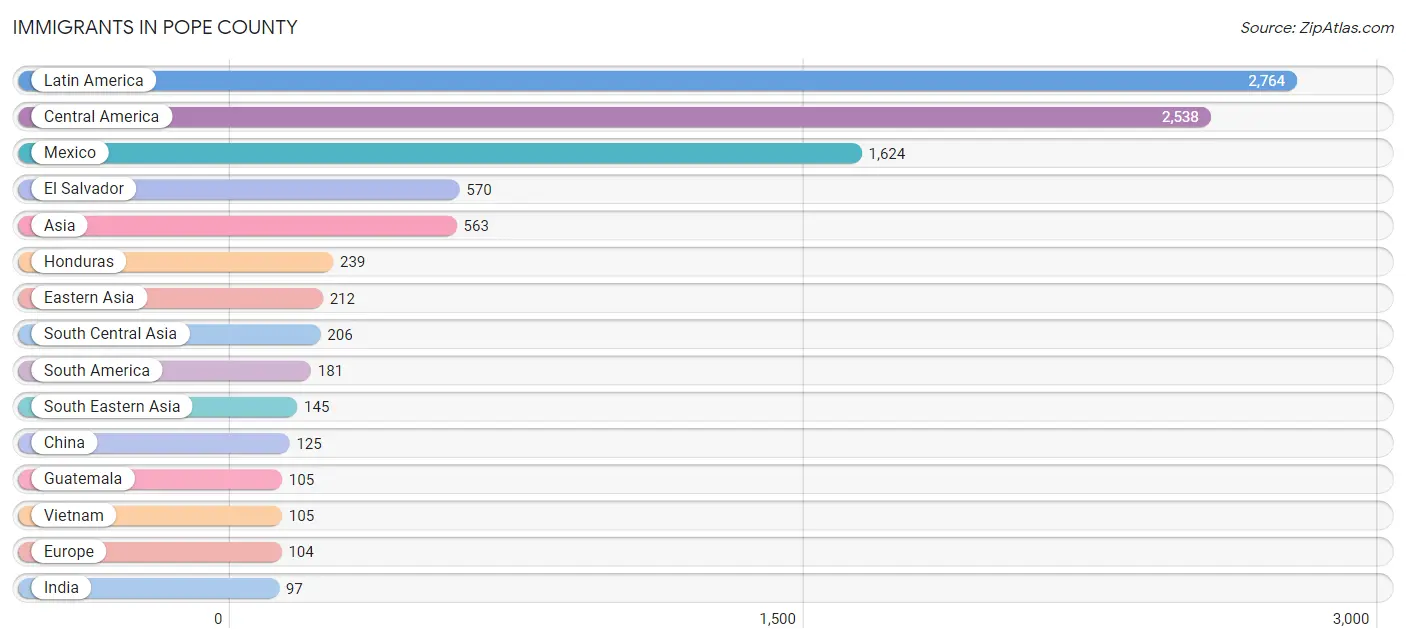
Immigrants in Pope County
The most numerous immigrant groups reported in Pope County came from Latin America (2,764 | 4.3%), Central America (2,538 | 4.0%), Mexico (1,624 | 2.6%), El Salvador (570 | 0.9%), and Asia (563 | 0.9%), together accounting for 12.7% of all Pope County residents.
| Immigration Origin | # Population | % Population |
| Africa | 47 | 0.1% |
| Asia | 563 | 0.9% |
| Australia | 6 | 0.0% |
| Brazil | 48 | 0.1% |
| Caribbean | 45 | 0.1% |
| Central America | 2,538 | 4.0% |
| Chile | 16 | 0.0% |
| China | 125 | 0.2% |
| Colombia | 60 | 0.1% |
| Cuba | 15 | 0.0% |
| Eastern Africa | 7 | 0.0% |
| Eastern Asia | 212 | 0.3% |
| Eastern Europe | 27 | 0.0% |
| Ecuador | 5 | 0.0% |
| El Salvador | 570 | 0.9% |
| England | 14 | 0.0% |
| Europe | 104 | 0.2% |
| Germany | 20 | 0.0% |
| Grenada | 19 | 0.0% |
| Guatemala | 105 | 0.2% |
| Honduras | 239 | 0.4% |
| Hungary | 12 | 0.0% |
| India | 97 | 0.2% |
| Iran | 67 | 0.1% |
| Ireland | 19 | 0.0% |
| Jamaica | 11 | 0.0% |
| Japan | 48 | 0.1% |
| Korea | 39 | 0.1% |
| Laos | 2 | 0.0% |
| Latin America | 2,764 | 4.3% |
| Mexico | 1,624 | 2.6% |
| Nigeria | 3 | 0.0% |
| Northern Europe | 57 | 0.1% |
| Oceania | 87 | 0.1% |
| Pakistan | 42 | 0.1% |
| Philippines | 38 | 0.1% |
| South Africa | 37 | 0.1% |
| South America | 181 | 0.3% |
| South Central Asia | 206 | 0.3% |
| South Eastern Asia | 145 | 0.2% |
| Taiwan | 16 | 0.0% |
| Uganda | 7 | 0.0% |
| Venezuela | 52 | 0.1% |
| Vietnam | 105 | 0.2% |
| Western Africa | 3 | 0.0% |
| Western Europe | 20 | 0.0% | View All 46 Rows |
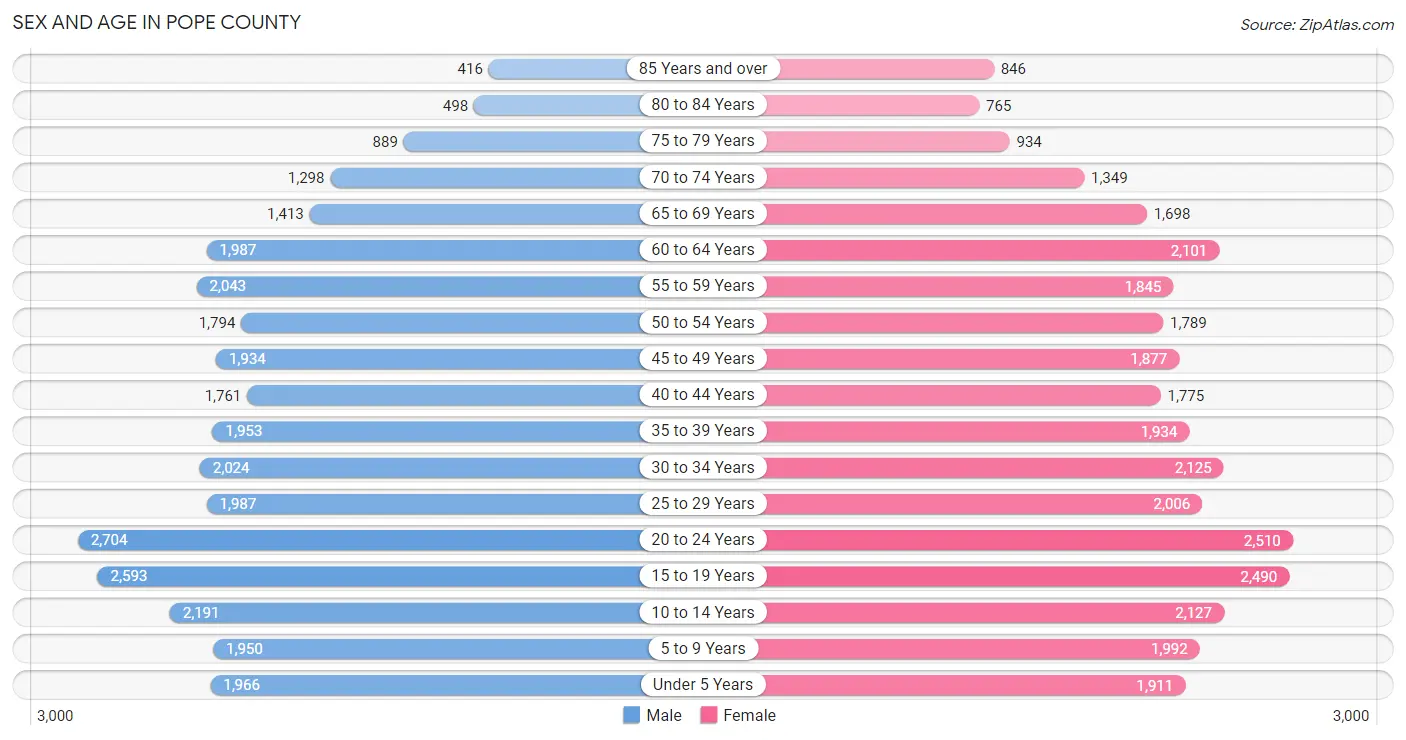
Sex and Age in Pope County
Sex and Age in Pope County
The most populous age groups in Pope County are 20 to 24 Years (2,704 | 8.6%) for men and 20 to 24 Years (2,510 | 7.8%) for women.
| Age Bracket | Male | Female |
| Under 5 Years | 1,966 (6.3%) | 1,911 (6.0%) |
| 5 to 9 Years | 1,950 (6.2%) | 1,992 (6.2%) |
| 10 to 14 Years | 2,191 (7.0%) | 2,127 (6.6%) |
| 15 to 19 Years | 2,593 (8.3%) | 2,490 (7.8%) |
| 20 to 24 Years | 2,704 (8.6%) | 2,510 (7.8%) |
| 25 to 29 Years | 1,987 (6.3%) | 2,006 (6.2%) |
| 30 to 34 Years | 2,024 (6.5%) | 2,125 (6.6%) |
| 35 to 39 Years | 1,953 (6.2%) | 1,934 (6.0%) |
| 40 to 44 Years | 1,761 (5.6%) | 1,775 (5.5%) |
| 45 to 49 Years | 1,934 (6.2%) | 1,877 (5.9%) |
| 50 to 54 Years | 1,794 (5.7%) | 1,789 (5.6%) |
| 55 to 59 Years | 2,043 (6.5%) | 1,845 (5.8%) |
| 60 to 64 Years | 1,987 (6.3%) | 2,101 (6.6%) |
| 65 to 69 Years | 1,413 (4.5%) | 1,698 (5.3%) |
| 70 to 74 Years | 1,298 (4.1%) | 1,349 (4.2%) |
| 75 to 79 Years | 889 (2.8%) | 934 (2.9%) |
| 80 to 84 Years | 498 (1.6%) | 765 (2.4%) |
| 85 Years and over | 416 (1.3%) | 846 (2.6%) |
| Total | 31,401 (100.0%) | 32,074 (100.0%) |
Families and Households in Pope County
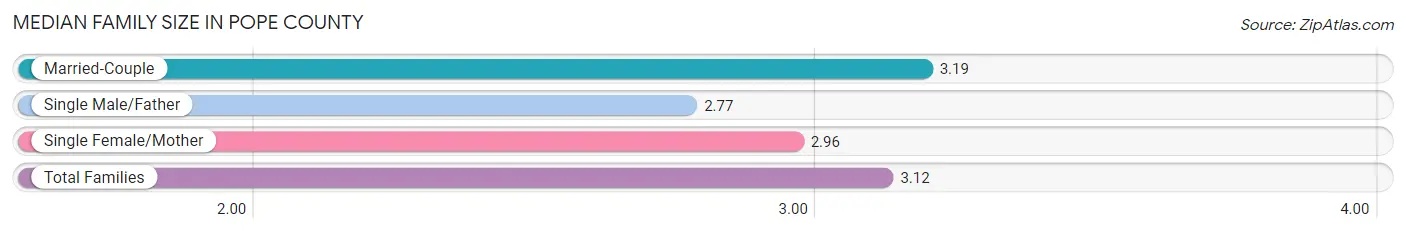
Median Family Size in Pope County
The median family size in Pope County is 3.12 persons per family, with married-couple families (11,872 | 75.1%) accounting for the largest median family size of 3.19 persons per family. On the other hand, single male/father families (1,048 | 6.6%) represent the smallest median family size with 2.77 persons per family.
| Family Type | # Families | Family Size |
| Married-Couple | 11,872 (75.1%) | 3.19 |
| Single Male/Father | 1,048 (6.6%) | 2.77 |
| Single Female/Mother | 2,897 (18.3%) | 2.96 |
| Total Families | 15,817 (100.0%) | 3.12 |
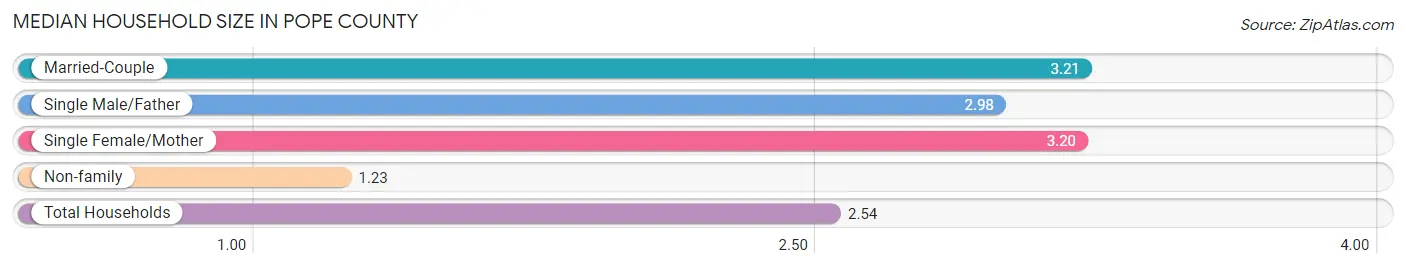
Median Household Size in Pope County
The median household size in Pope County is 2.54 persons per household, with married-couple households (11,872 | 50.1%) accounting for the largest median household size of 3.21 persons per household. non-family households (7,867 | 33.2%) represent the smallest median household size with 1.23 persons per household.
| Household Type | # Households | Household Size |
| Married-Couple | 11,872 (50.1%) | 3.21 |
| Single Male/Father | 1,048 (4.4%) | 2.98 |
| Single Female/Mother | 2,897 (12.2%) | 3.20 |
| Non-family | 7,867 (33.2%) | 1.23 |
| Total Households | 23,684 (100.0%) | 2.54 |
Household Size by Marriage Status in Pope County
Out of a total of 23,684 households in Pope County, 15,817 (66.8%) are family households, while 7,867 (33.2%) are nonfamily households. The most numerous type of family households are 2-person households, comprising 7,276, and the most common type of nonfamily households are 1-person households, comprising 6,719.
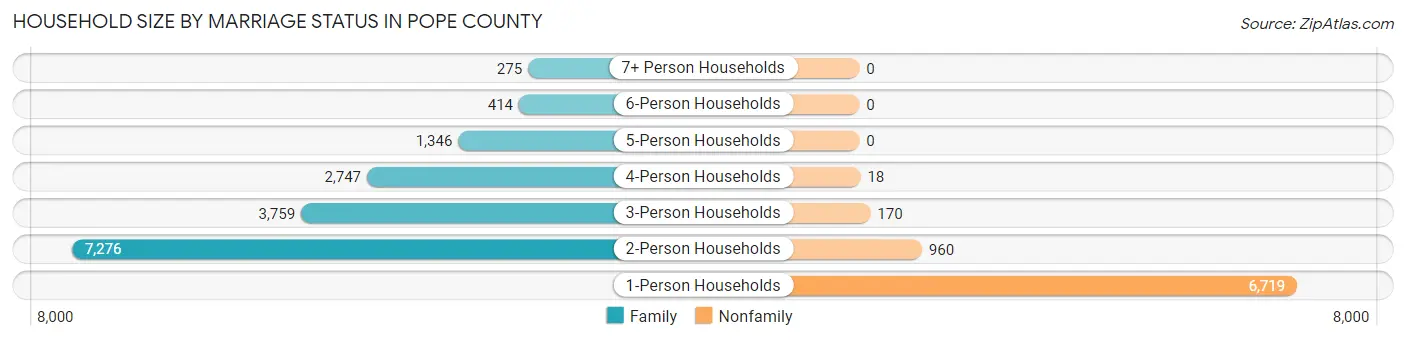
| Household Size | Family Households | Nonfamily Households |
| 1-Person Households | - | 6,719 (28.4%) |
| 2-Person Households | 7,276 (30.7%) | 960 (4.1%) |
| 3-Person Households | 3,759 (15.9%) | 170 (0.7%) |
| 4-Person Households | 2,747 (11.6%) | 18 (0.1%) |
| 5-Person Households | 1,346 (5.7%) | 0 (0.0%) |
| 6-Person Households | 414 (1.8%) | 0 (0.0%) |
| 7+ Person Households | 275 (1.2%) | 0 (0.0%) |
| Total | 15,817 (66.8%) | 7,867 (33.2%) |
Female Fertility in Pope County
Fertility by Age in Pope County
Average fertility rate in Pope County is 37.0 births per 1,000 women. Women in the age bracket of 20 to 34 years have the highest fertility rate with 74.0 births per 1,000 women. Women in the age bracket of 20 to 34 years acount for 87.7% of all women with births.
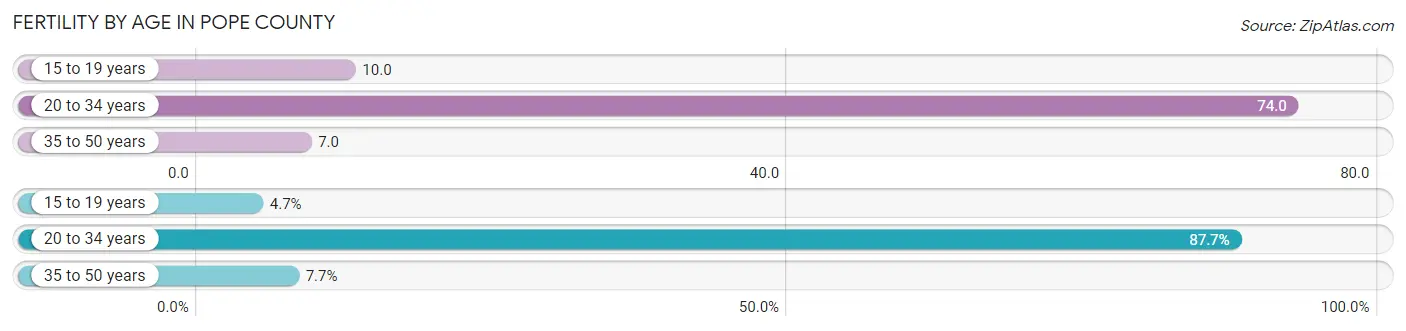
| Age Bracket | Women with Births | Births / 1,000 Women |
| 15 to 19 years | 26 (4.6%) | 10.0 |
| 20 to 34 years | 490 (87.7%) | 74.0 |
| 35 to 50 years | 43 (7.7%) | 7.0 |
| Total | 559 (100.0%) | 37.0 |
Fertility by Age by Marriage Status in Pope County
53.5% of women with births (559) in Pope County are married. The highest percentage of unmarried women with births falls into 15 to 19 years age bracket with 100.0% of them unmarried at the time of birth, while the lowest percentage of unmarried women with births belong to 35 to 50 years age bracket with 23.3% of them unmarried.
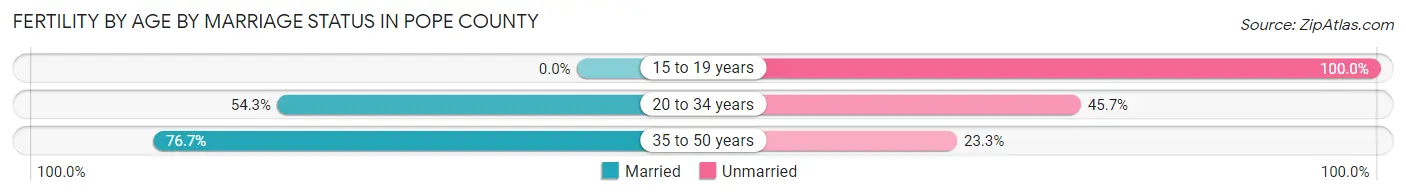
| Age Bracket | Married | Unmarried |
| 15 to 19 years | 0 (0.0%) | 26 (100.0%) |
| 20 to 34 years | 266 (54.3%) | 224 (45.7%) |
| 35 to 50 years | 33 (76.7%) | 10 (23.3%) |
| Total | 299 (53.5%) | 260 (46.5%) |
Fertility by Education in Pope County
Average fertility rate in Pope County is 37.0 births per 1,000 women. Women with the education attainment of college or associate's degree have the highest fertility rate of 58.0 births per 1,000 women, while women with the education attainment of graduate degree have the lowest fertility at 8.0 births per 1,000 women. Women with the education attainment of college or associate's degree represent 58.1% of all women with births.
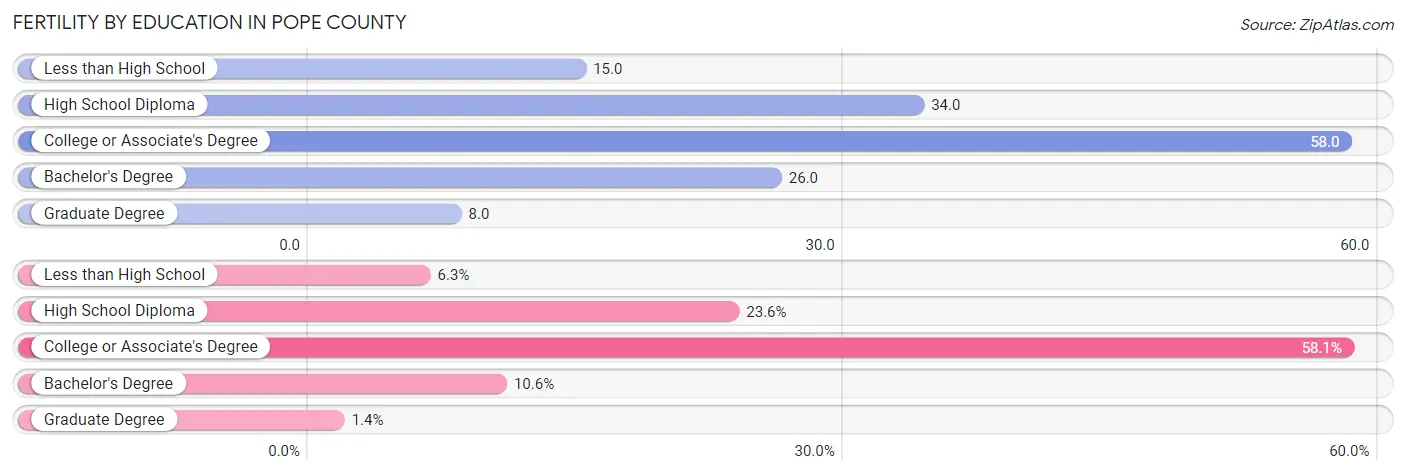
| Educational Attainment | Women with Births | Births / 1,000 Women |
| Less than High School | 35 (6.3%) | 15.0 |
| High School Diploma | 132 (23.6%) | 34.0 |
| College or Associate's Degree | 325 (58.1%) | 58.0 |
| Bachelor's Degree | 59 (10.5%) | 26.0 |
| Graduate Degree | 8 (1.4%) | 8.0 |
| Total | 559 (100.0%) | 37.0 |
Fertility by Education by Marriage Status in Pope County
46.5% of women with births in Pope County are unmarried. Women with the educational attainment of bachelor's degree are most likely to be married with 100.0% of them married at childbirth, while women with the educational attainment of less than high school are least likely to be married with 100.0% of them unmarried at childbirth.
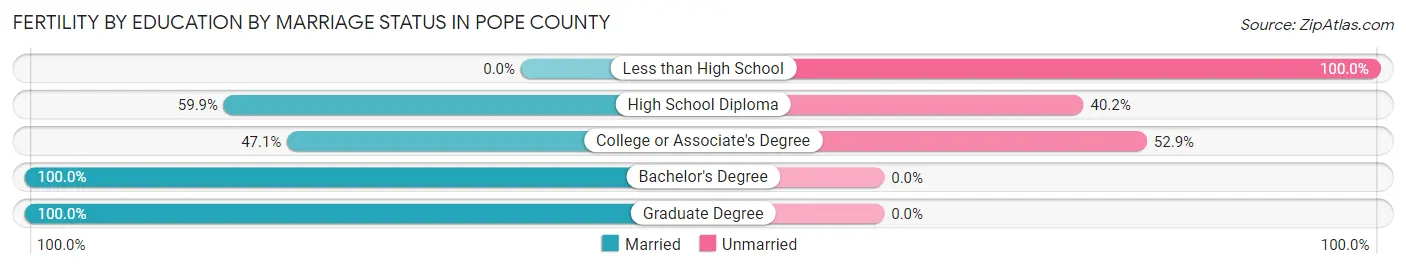
| Educational Attainment | Married | Unmarried |
| Less than High School | 0 (0.0%) | 35 (100.0%) |
| High School Diploma | 79 (59.9%) | 53 (40.2%) |
| College or Associate's Degree | 153 (47.1%) | 172 (52.9%) |
| Bachelor's Degree | 59 (100.0%) | 0 (0.0%) |
| Graduate Degree | 8 (100.0%) | 0 (0.0%) |
| Total | 299 (53.5%) | 260 (46.5%) |
Employment Characteristics in Pope County
Employment by Class of Employer in Pope County
Among the 26,768 employed individuals in Pope County, private company employees (18,336 | 68.5%), state government employees (1,831 | 6.8%), and not-for-profit organizations (1,812 | 6.8%) make up the most common classes of employment.
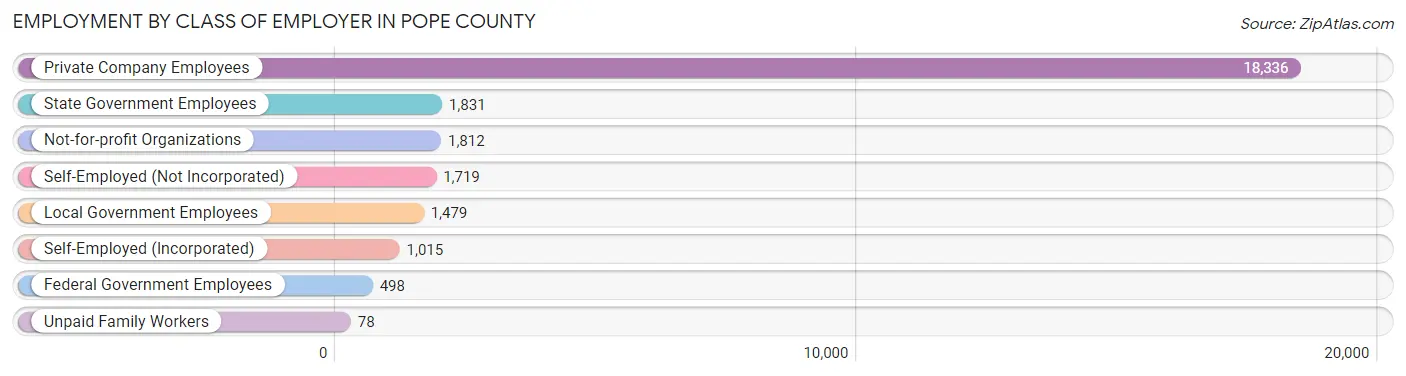
| Employer Class | # Employees | % Employees |
| Private Company Employees | 18,336 | 68.5% |
| Self-Employed (Incorporated) | 1,015 | 3.8% |
| Self-Employed (Not Incorporated) | 1,719 | 6.4% |
| Not-for-profit Organizations | 1,812 | 6.8% |
| Local Government Employees | 1,479 | 5.5% |
| State Government Employees | 1,831 | 6.8% |
| Federal Government Employees | 498 | 1.9% |
| Unpaid Family Workers | 78 | 0.3% |
| Total | 26,768 | 100.0% |
Employment Status by Age in Pope County
According to the labor force statistics for Pope County, out of the total population over 16 years of age (50,734), 56.3% or 28,563 individuals are in the labor force, with 4.8% or 1,371 of them unemployed. The age group with the highest labor force participation rate is 25 to 29 years, with 81.6% or 3,258 individuals in the labor force. Within the labor force, the 75 years and over age range has the highest percentage of unemployed individuals, with 25.7% or 73 of them being unemployed.
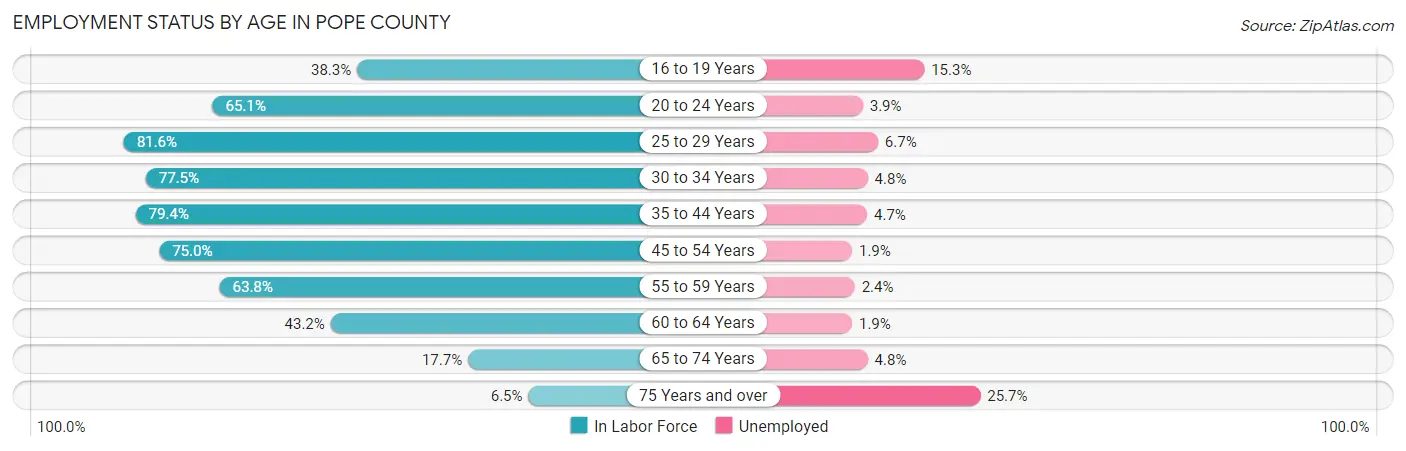
| Age Bracket | In Labor Force | Unemployed |
| 16 to 19 Years | 1,715 (38.3%) | 262 (15.3%) |
| 20 to 24 Years | 3,394 (65.1%) | 132 (3.9%) |
| 25 to 29 Years | 3,258 (81.6%) | 218 (6.7%) |
| 30 to 34 Years | 3,215 (77.5%) | 154 (4.8%) |
| 35 to 44 Years | 5,894 (79.4%) | 277 (4.7%) |
| 45 to 54 Years | 5,546 (75.0%) | 105 (1.9%) |
| 55 to 59 Years | 2,481 (63.8%) | 60 (2.4%) |
| 60 to 64 Years | 1,766 (43.2%) | 34 (1.9%) |
| 65 to 74 Years | 1,019 (17.7%) | 49 (4.8%) |
| 75 Years and over | 283 (6.5%) | 73 (25.7%) |
| Total | 28,563 (56.3%) | 1,371 (4.8%) |
Employment Status by Educational Attainment in Pope County
According to labor force statistics for Pope County, 71.6% of individuals (22,149) out of the total population between 25 and 64 years of age (30,935) are in the labor force, with 3.8% or 842 of them being unemployed. The group with the highest labor force participation rate are those with the educational attainment of bachelor's degree or higher, with 90.6% or 6,512 individuals in the labor force. Within the labor force, individuals with less than high school education have the highest percentage of unemployment, with 5.3% or 123 of them being unemployed.
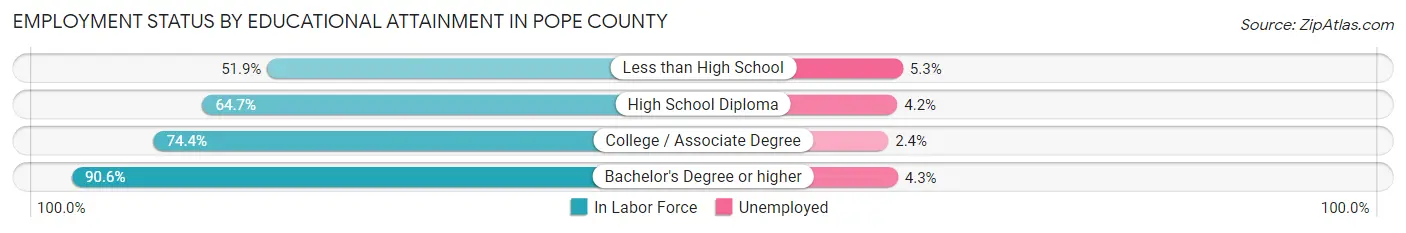
| Educational Attainment | In Labor Force | Unemployed |
| Less than High School | 2,312 (51.9%) | 236 (5.3%) |
| High School Diploma | 6,806 (64.7%) | 442 (4.2%) |
| College / Associate Degree | 6,528 (74.4%) | 211 (2.4%) |
| Bachelor's Degree or higher | 6,512 (90.6%) | 309 (4.3%) |
| Total | 22,149 (71.6%) | 1,176 (3.8%) |
Employment Occupations by Sex in Pope County
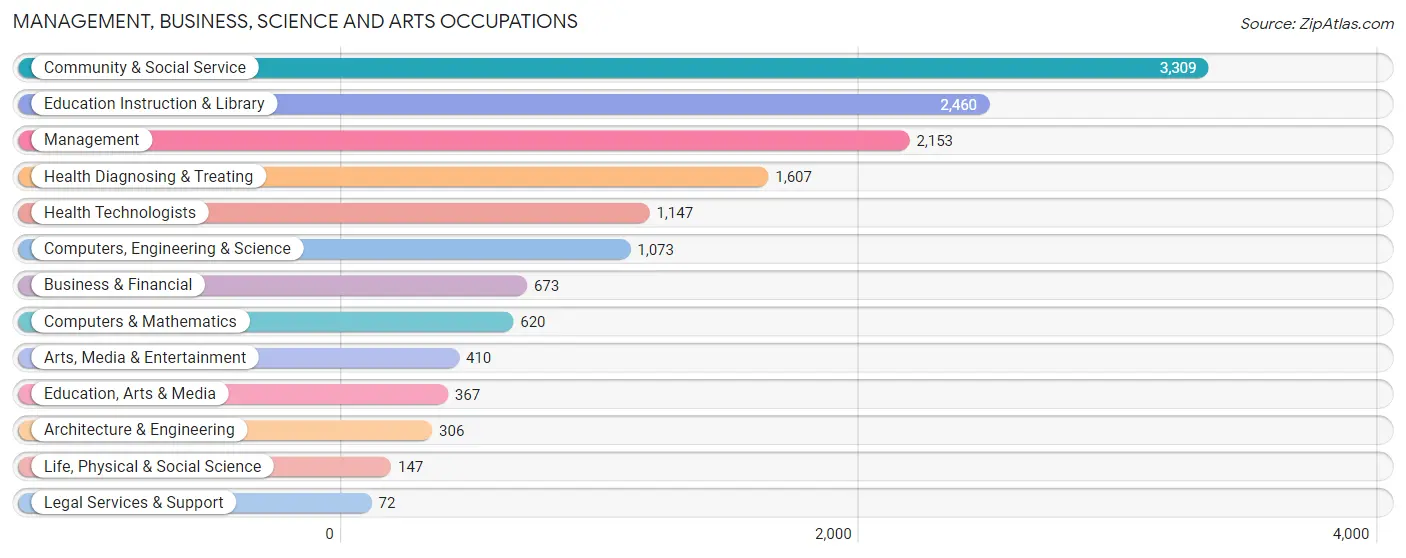
Management, Business, Science and Arts Occupations
The most common Management, Business, Science and Arts occupations in Pope County are Community & Social Service (3,309 | 12.2%), Education Instruction & Library (2,460 | 9.1%), Management (2,153 | 7.9%), Health Diagnosing & Treating (1,607 | 5.9%), and Health Technologists (1,147 | 4.2%).
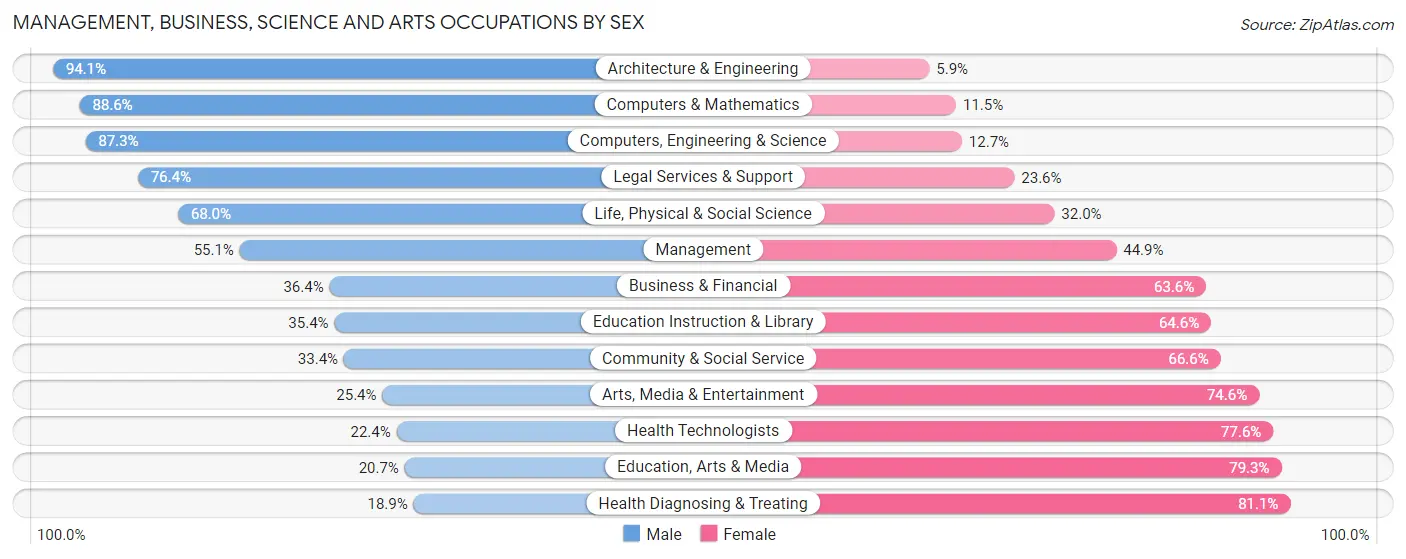
Management, Business, Science and Arts Occupations by Sex
Within the Management, Business, Science and Arts occupations in Pope County, the most male-oriented occupations are Architecture & Engineering (94.1%), Computers & Mathematics (88.5%), and Computers, Engineering & Science (87.3%), while the most female-oriented occupations are Health Diagnosing & Treating (81.1%), Education, Arts & Media (79.3%), and Health Technologists (77.6%).
| Occupation | Male | Female |
| Management | 1,187 (55.1%) | 966 (44.9%) |
| Business & Financial | 245 (36.4%) | 428 (63.6%) |
| Computers, Engineering & Science | 937 (87.3%) | 136 (12.7%) |
| Computers & Mathematics | 549 (88.5%) | 71 (11.5%) |
| Architecture & Engineering | 288 (94.1%) | 18 (5.9%) |
| Life, Physical & Social Science | 100 (68.0%) | 47 (32.0%) |
| Community & Social Service | 1,105 (33.4%) | 2,204 (66.6%) |
| Education, Arts & Media | 76 (20.7%) | 291 (79.3%) |
| Legal Services & Support | 55 (76.4%) | 17 (23.6%) |
| Education Instruction & Library | 870 (35.4%) | 1,590 (64.6%) |
| Arts, Media & Entertainment | 104 (25.4%) | 306 (74.6%) |
| Health Diagnosing & Treating | 303 (18.9%) | 1,304 (81.1%) |
| Health Technologists | 257 (22.4%) | 890 (77.6%) |
| Total (Category) | 3,777 (42.8%) | 5,038 (57.2%) |
| Total (Overall) | 14,630 (53.9%) | 12,528 (46.1%) |
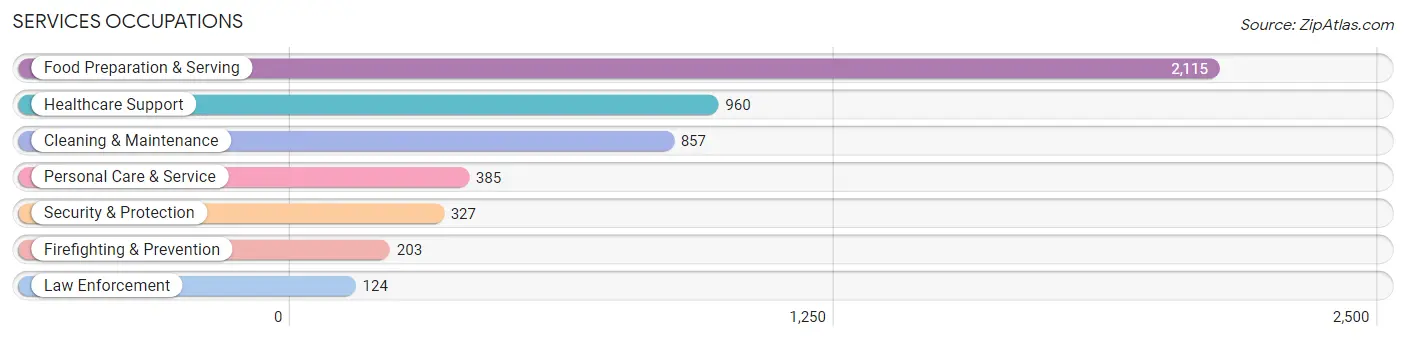
Services Occupations
The most common Services occupations in Pope County are Food Preparation & Serving (2,115 | 7.8%), Healthcare Support (960 | 3.5%), Cleaning & Maintenance (857 | 3.2%), Personal Care & Service (385 | 1.4%), and Security & Protection (327 | 1.2%).
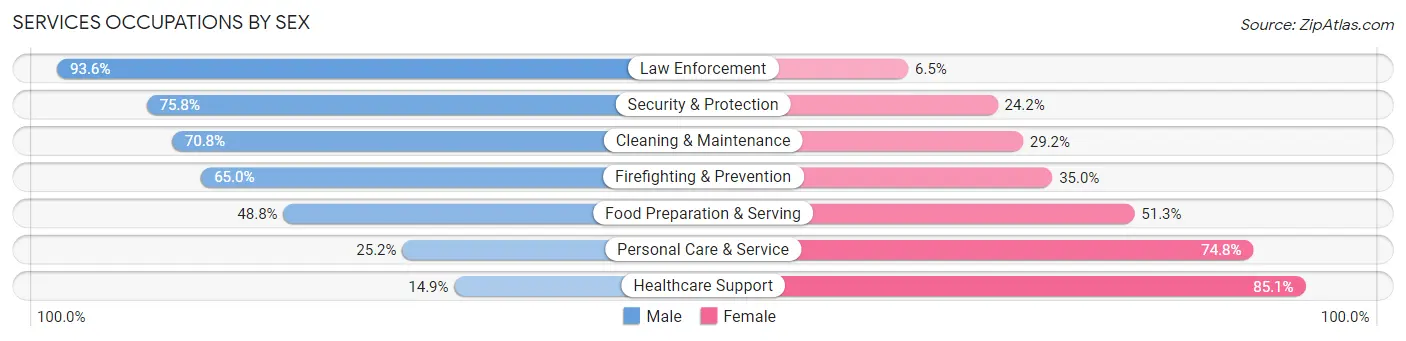
Services Occupations by Sex
Within the Services occupations in Pope County, the most male-oriented occupations are Law Enforcement (93.5%), Security & Protection (75.8%), and Cleaning & Maintenance (70.8%), while the most female-oriented occupations are Healthcare Support (85.1%), Personal Care & Service (74.8%), and Food Preparation & Serving (51.2%).
| Occupation | Male | Female |
| Healthcare Support | 143 (14.9%) | 817 (85.1%) |
| Security & Protection | 248 (75.8%) | 79 (24.2%) |
| Firefighting & Prevention | 132 (65.0%) | 71 (35.0%) |
| Law Enforcement | 116 (93.5%) | 8 (6.5%) |
| Food Preparation & Serving | 1,031 (48.7%) | 1,084 (51.2%) |
| Cleaning & Maintenance | 607 (70.8%) | 250 (29.2%) |
| Personal Care & Service | 97 (25.2%) | 288 (74.8%) |
| Total (Category) | 2,126 (45.8%) | 2,518 (54.2%) |
| Total (Overall) | 14,630 (53.9%) | 12,528 (46.1%) |
Sales and Office Occupations
The most common Sales and Office occupations in Pope County are Sales & Related (2,679 | 9.9%), and Office & Administration (2,597 | 9.6%).

Sales and Office Occupations by Sex
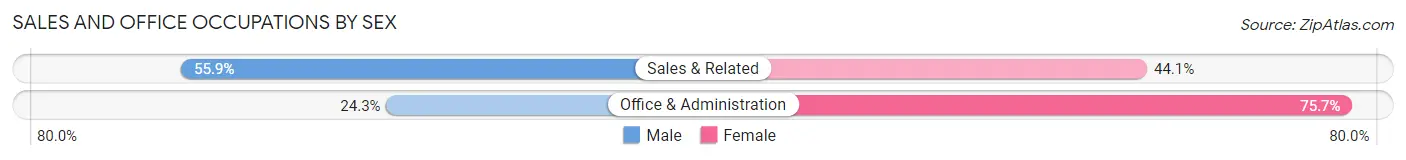
| Occupation | Male | Female |
| Sales & Related | 1,498 (55.9%) | 1,181 (44.1%) |
| Office & Administration | 632 (24.3%) | 1,965 (75.7%) |
| Total (Category) | 2,130 (40.4%) | 3,146 (59.6%) |
| Total (Overall) | 14,630 (53.9%) | 12,528 (46.1%) |
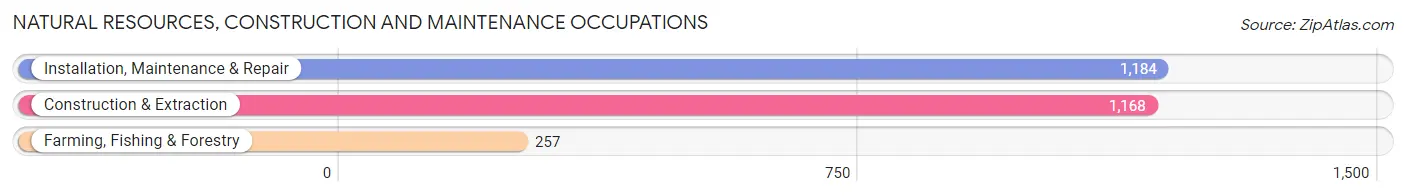
Natural Resources, Construction and Maintenance Occupations
The most common Natural Resources, Construction and Maintenance occupations in Pope County are Installation, Maintenance & Repair (1,184 | 4.4%), Construction & Extraction (1,168 | 4.3%), and Farming, Fishing & Forestry (257 | 0.9%).
Natural Resources, Construction and Maintenance Occupations by Sex
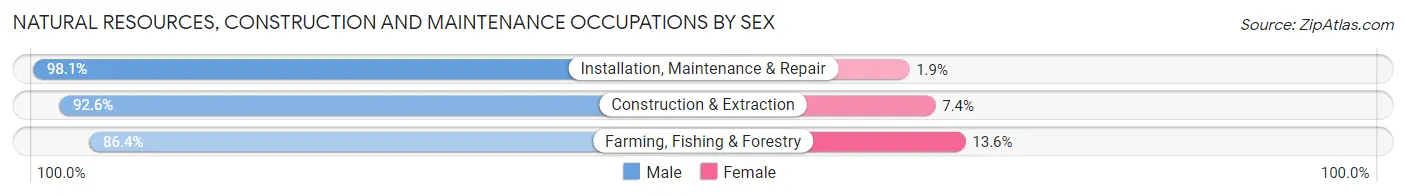
| Occupation | Male | Female |
| Farming, Fishing & Forestry | 222 (86.4%) | 35 (13.6%) |
| Construction & Extraction | 1,082 (92.6%) | 86 (7.4%) |
| Installation, Maintenance & Repair | 1,161 (98.1%) | 23 (1.9%) |
| Total (Category) | 2,465 (94.5%) | 144 (5.5%) |
| Total (Overall) | 14,630 (53.9%) | 12,528 (46.1%) |
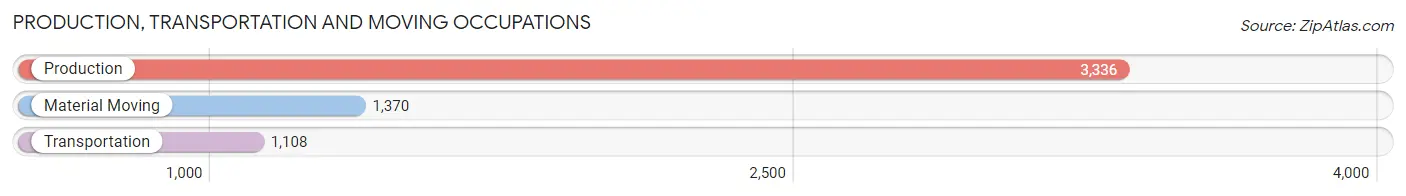
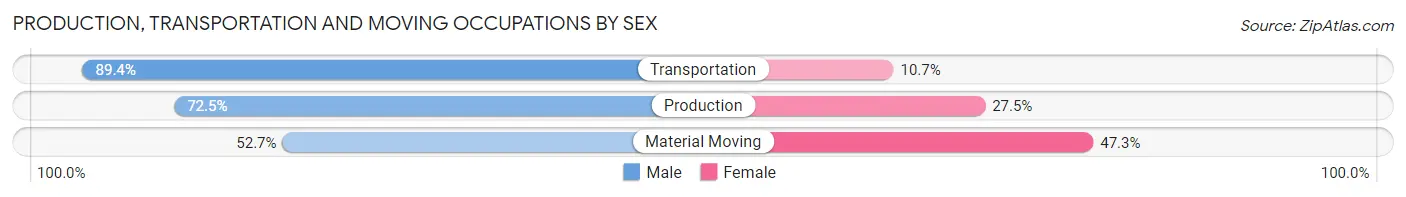
Production, Transportation and Moving Occupations
The most common Production, Transportation and Moving occupations in Pope County are Production (3,336 | 12.3%), Material Moving (1,370 | 5.0%), and Transportation (1,108 | 4.1%).
Production, Transportation and Moving Occupations by Sex
| Occupation | Male | Female |
| Production | 2,420 (72.5%) | 916 (27.5%) |
| Transportation | 990 (89.3%) | 118 (10.6%) |
| Material Moving | 722 (52.7%) | 648 (47.3%) |
| Total (Category) | 4,132 (71.1%) | 1,682 (28.9%) |
| Total (Overall) | 14,630 (53.9%) | 12,528 (46.1%) |
Employment Industries by Sex in Pope County
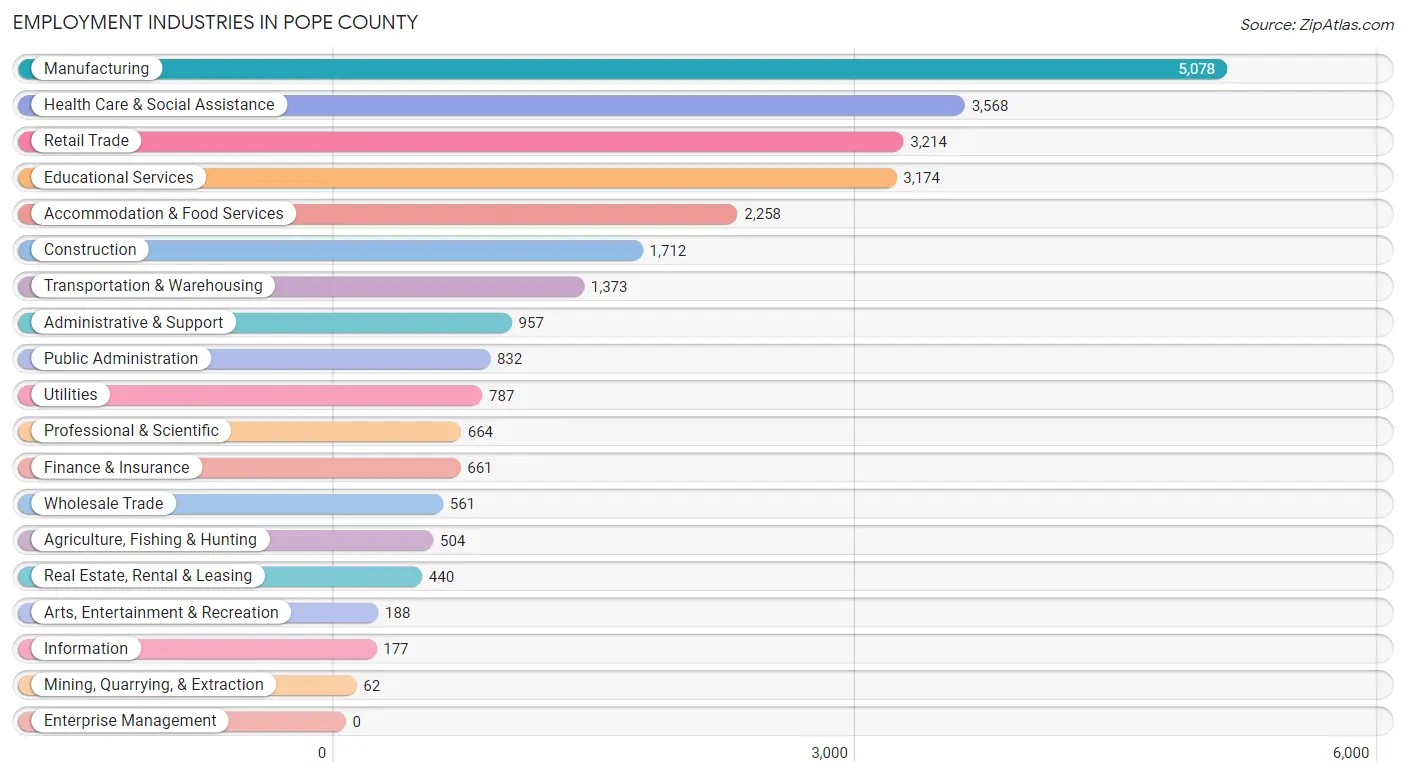
Employment Industries in Pope County
The major employment industries in Pope County include Manufacturing (5,078 | 18.7%), Health Care & Social Assistance (3,568 | 13.1%), Retail Trade (3,214 | 11.8%), Educational Services (3,174 | 11.7%), and Accommodation & Food Services (2,258 | 8.3%).
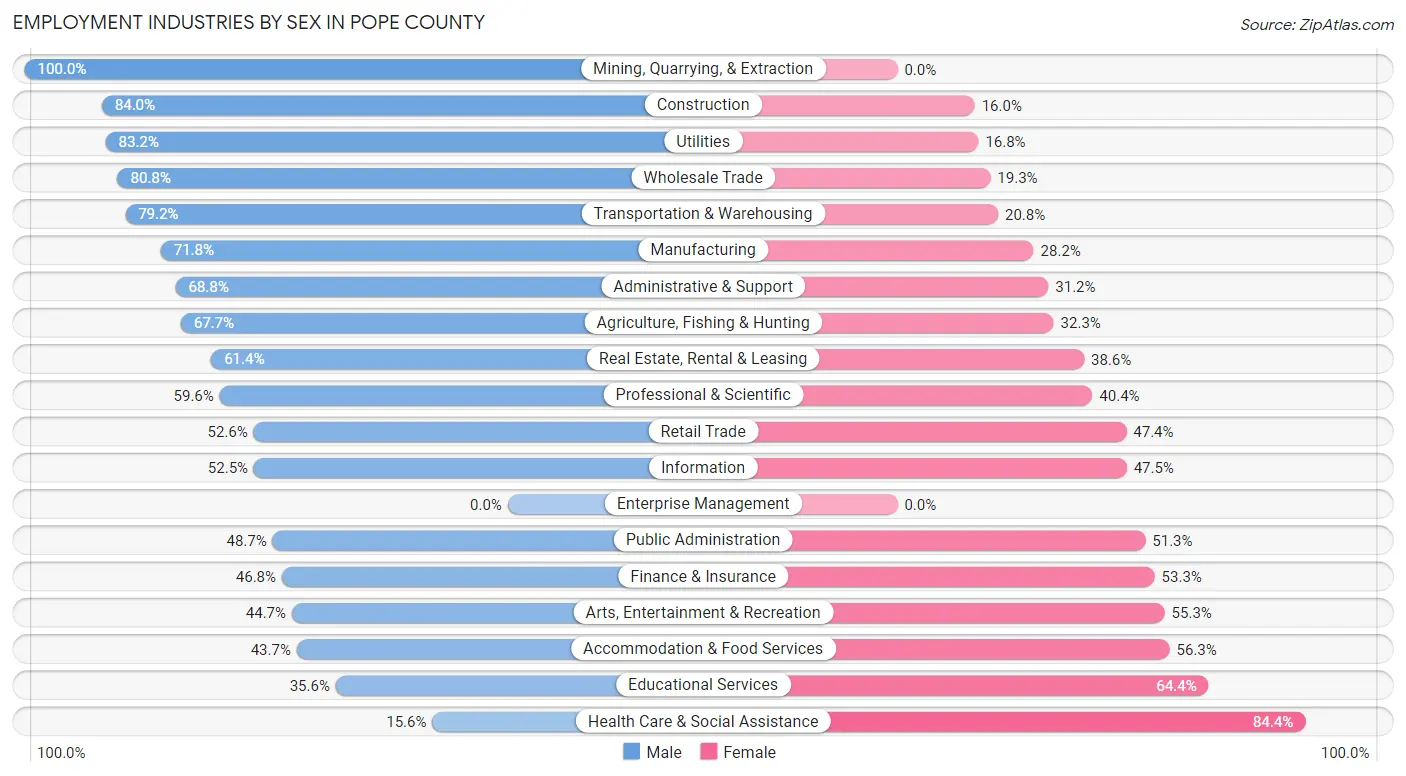
Employment Industries by Sex in Pope County
The Pope County industries that see more men than women are Mining, Quarrying, & Extraction (100.0%), Construction (84.0%), and Utilities (83.2%), whereas the industries that tend to have a higher number of women are Health Care & Social Assistance (84.4%), Educational Services (64.4%), and Accommodation & Food Services (56.3%).
| Industry | Male | Female |
| Agriculture, Fishing & Hunting | 341 (67.7%) | 163 (32.3%) |
| Mining, Quarrying, & Extraction | 62 (100.0%) | 0 (0.0%) |
| Construction | 1,438 (84.0%) | 274 (16.0%) |
| Manufacturing | 3,646 (71.8%) | 1,432 (28.2%) |
| Wholesale Trade | 453 (80.7%) | 108 (19.3%) |
| Retail Trade | 1,691 (52.6%) | 1,523 (47.4%) |
| Transportation & Warehousing | 1,087 (79.2%) | 286 (20.8%) |
| Utilities | 655 (83.2%) | 132 (16.8%) |
| Information | 93 (52.5%) | 84 (47.5%) |
| Finance & Insurance | 309 (46.8%) | 352 (53.2%) |
| Real Estate, Rental & Leasing | 270 (61.4%) | 170 (38.6%) |
| Professional & Scientific | 396 (59.6%) | 268 (40.4%) |
| Enterprise Management | 0 (0.0%) | 0 (0.0%) |
| Administrative & Support | 658 (68.8%) | 299 (31.2%) |
| Educational Services | 1,130 (35.6%) | 2,044 (64.4%) |
| Health Care & Social Assistance | 557 (15.6%) | 3,011 (84.4%) |
| Arts, Entertainment & Recreation | 84 (44.7%) | 104 (55.3%) |
| Accommodation & Food Services | 986 (43.7%) | 1,272 (56.3%) |
| Public Administration | 405 (48.7%) | 427 (51.3%) |
| Total | 14,630 (53.9%) | 12,528 (46.1%) |
Education in Pope County
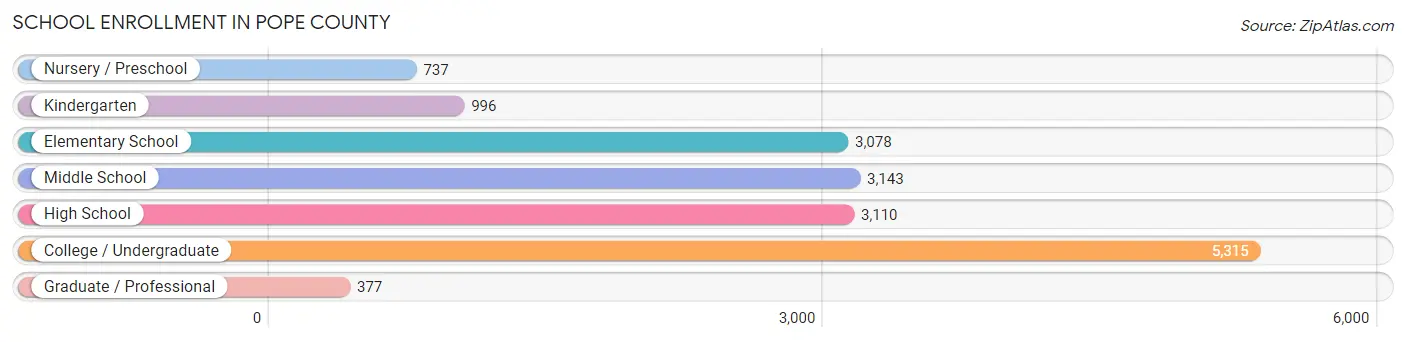
School Enrollment in Pope County
The most common levels of schooling among the 16,756 students in Pope County are college / undergraduate (5,315 | 31.7%), middle school (3,143 | 18.8%), and high school (3,110 | 18.6%).
| School Level | # Students | % Students |
| Nursery / Preschool | 737 | 4.4% |
| Kindergarten | 996 | 5.9% |
| Elementary School | 3,078 | 18.4% |
| Middle School | 3,143 | 18.8% |
| High School | 3,110 | 18.6% |
| College / Undergraduate | 5,315 | 31.7% |
| Graduate / Professional | 377 | 2.2% |
| Total | 16,756 | 100.0% |
School Enrollment by Age by Funding Source in Pope County
Out of a total of 16,756 students who are enrolled in schools in Pope County, 1,374 (8.2%) attend a private institution, while the remaining 15,382 (91.8%) are enrolled in public schools. The age group of 3 to 4 year olds has the highest likelihood of being enrolled in private schools, with 195 (32.9% in the age bracket) enrolled. Conversely, the age group of 15 to 17 year olds has the lowest likelihood of being enrolled in a private school, with 2,167 (96.0% in the age bracket) attending a public institution.
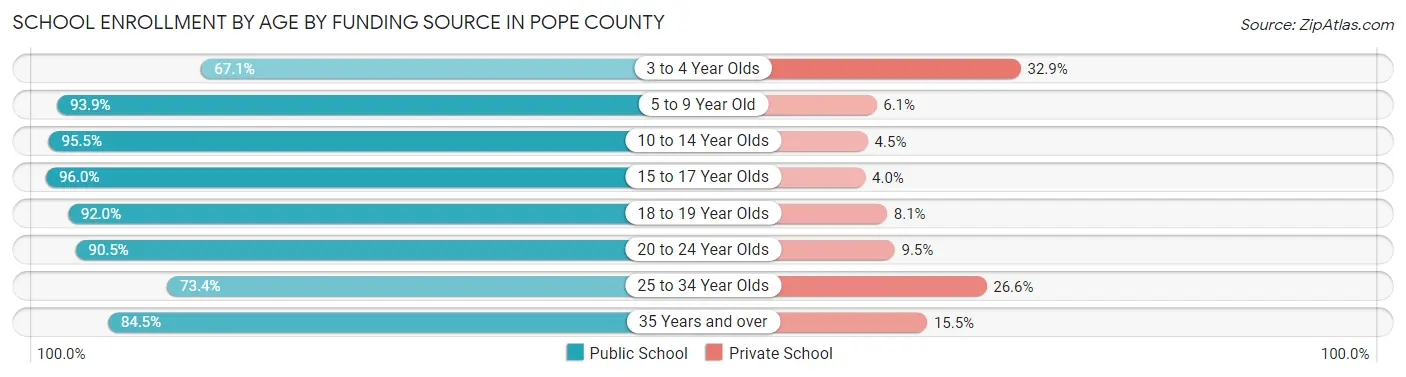
| Age Bracket | Public School | Private School |
| 3 to 4 Year Olds | 397 (67.1%) | 195 (32.9%) |
| 5 to 9 Year Old | 3,419 (93.9%) | 221 (6.1%) |
| 10 to 14 Year Olds | 3,953 (95.5%) | 185 (4.5%) |
| 15 to 17 Year Olds | 2,167 (96.0%) | 90 (4.0%) |
| 18 to 19 Year Olds | 1,998 (91.9%) | 175 (8.1%) |
| 20 to 24 Year Olds | 2,657 (90.5%) | 278 (9.5%) |
| 25 to 34 Year Olds | 423 (73.4%) | 153 (26.6%) |
| 35 Years and over | 376 (84.5%) | 69 (15.5%) |
| Total | 15,382 (91.8%) | 1,374 (8.2%) |
Educational Attainment by Field of Study in Pope County
Education (2,033 | 19.5%), business (1,773 | 17.0%), science & technology (1,276 | 12.2%), engineering (878 | 8.4%), and bio, nature & agricultural (840 | 8.0%) are the most common fields of study among 10,454 individuals in Pope County who have obtained a bachelor's degree or higher.
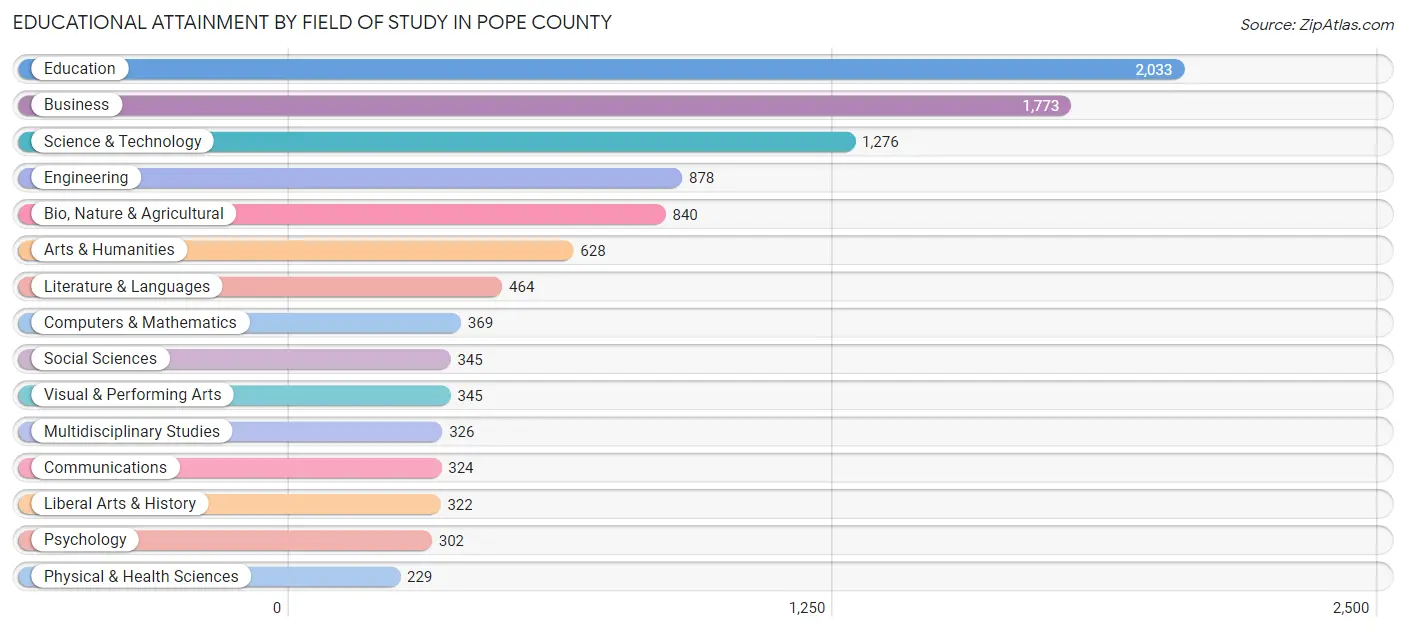
| Field of Study | # Graduates | % Graduates |
| Computers & Mathematics | 369 | 3.5% |
| Bio, Nature & Agricultural | 840 | 8.0% |
| Physical & Health Sciences | 229 | 2.2% |
| Psychology | 302 | 2.9% |
| Social Sciences | 345 | 3.3% |
| Engineering | 878 | 8.4% |
| Multidisciplinary Studies | 326 | 3.1% |
| Science & Technology | 1,276 | 12.2% |
| Business | 1,773 | 17.0% |
| Education | 2,033 | 19.5% |
| Literature & Languages | 464 | 4.4% |
| Liberal Arts & History | 322 | 3.1% |
| Visual & Performing Arts | 345 | 3.3% |
| Communications | 324 | 3.1% |
| Arts & Humanities | 628 | 6.0% |
| Total | 10,454 | 100.0% |
Transportation & Commute in Pope County
Vehicle Availability by Sex in Pope County
The most prevalent vehicle ownership categories in Pope County are males with 2 vehicles (5,865, accounting for 42.0%) and females with 2 vehicles (4,717, making up 49.9%).
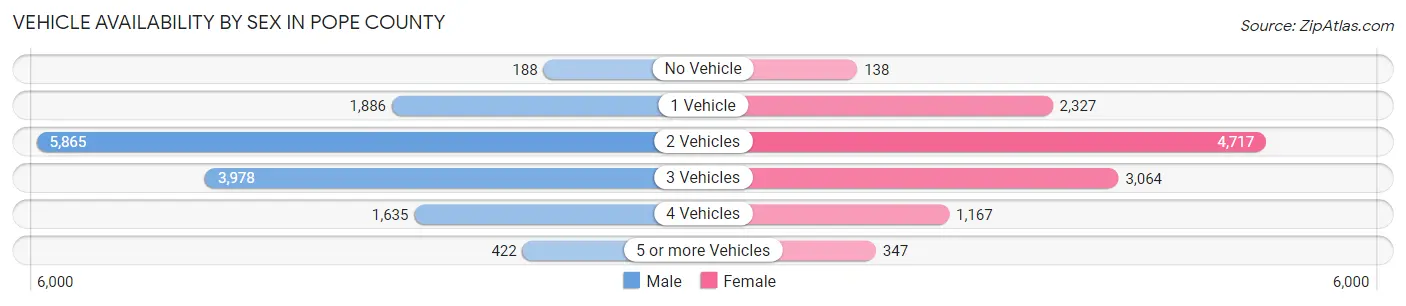
| Vehicles Available | Male | Female |
| No Vehicle | 188 (1.3%) | 138 (1.2%) |
| 1 Vehicle | 1,886 (13.5%) | 2,327 (19.8%) |
| 2 Vehicles | 5,865 (42.0%) | 4,717 (40.1%) |
| 3 Vehicles | 3,978 (28.5%) | 3,064 (26.1%) |
| 4 Vehicles | 1,635 (11.7%) | 1,167 (9.9%) |
| 5 or more Vehicles | 422 (3.0%) | 347 (2.9%) |
| Total | 13,974 (100.0%) | 11,760 (100.0%) |
Commute Time in Pope County
The most frequently occuring commute durations in Pope County are 15 to 19 minutes (5,347 commuters, 20.8%), 10 to 14 minutes (5,307 commuters, 20.6%), and 5 to 9 minutes (4,484 commuters, 17.4%).
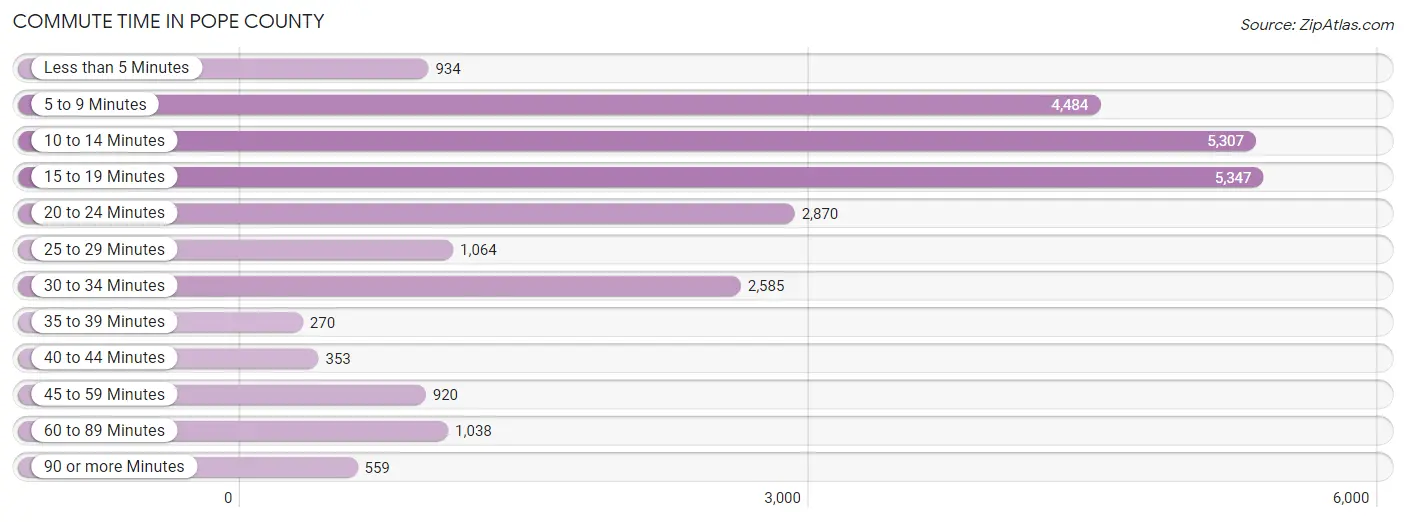
| Commute Time | # Commuters | % Commuters |
| Less than 5 Minutes | 934 | 3.6% |
| 5 to 9 Minutes | 4,484 | 17.4% |
| 10 to 14 Minutes | 5,307 | 20.6% |
| 15 to 19 Minutes | 5,347 | 20.8% |
| 20 to 24 Minutes | 2,870 | 11.2% |
| 25 to 29 Minutes | 1,064 | 4.1% |
| 30 to 34 Minutes | 2,585 | 10.1% |
| 35 to 39 Minutes | 270 | 1.1% |
| 40 to 44 Minutes | 353 | 1.4% |
| 45 to 59 Minutes | 920 | 3.6% |
| 60 to 89 Minutes | 1,038 | 4.0% |
| 90 or more Minutes | 559 | 2.2% |
Commute Time by Sex in Pope County
The most common commute times in Pope County are 15 to 19 minutes (2,931 commuters, 20.7%) for males and 10 to 14 minutes (2,596 commuters, 22.5%) for females.
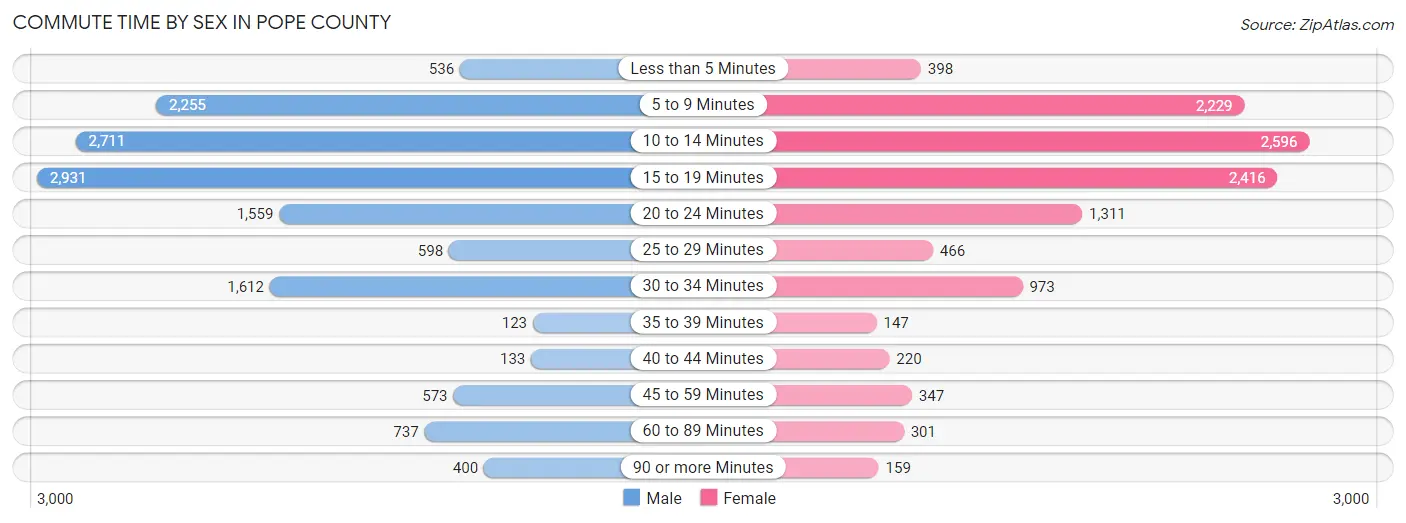
| Commute Time | Male | Female |
| Less than 5 Minutes | 536 (3.8%) | 398 (3.4%) |
| 5 to 9 Minutes | 2,255 (15.9%) | 2,229 (19.3%) |
| 10 to 14 Minutes | 2,711 (19.1%) | 2,596 (22.5%) |
| 15 to 19 Minutes | 2,931 (20.7%) | 2,416 (20.9%) |
| 20 to 24 Minutes | 1,559 (11.0%) | 1,311 (11.3%) |
| 25 to 29 Minutes | 598 (4.2%) | 466 (4.0%) |
| 30 to 34 Minutes | 1,612 (11.4%) | 973 (8.4%) |
| 35 to 39 Minutes | 123 (0.9%) | 147 (1.3%) |
| 40 to 44 Minutes | 133 (0.9%) | 220 (1.9%) |
| 45 to 59 Minutes | 573 (4.0%) | 347 (3.0%) |
| 60 to 89 Minutes | 737 (5.2%) | 301 (2.6%) |
| 90 or more Minutes | 400 (2.8%) | 159 (1.4%) |
Time of Departure to Work by Sex in Pope County
The most frequent times of departure to work in Pope County are 7:30 AM to 7:59 AM (1,724, 12.2%) for males and 7:30 AM to 7:59 AM (2,143, 18.5%) for females.
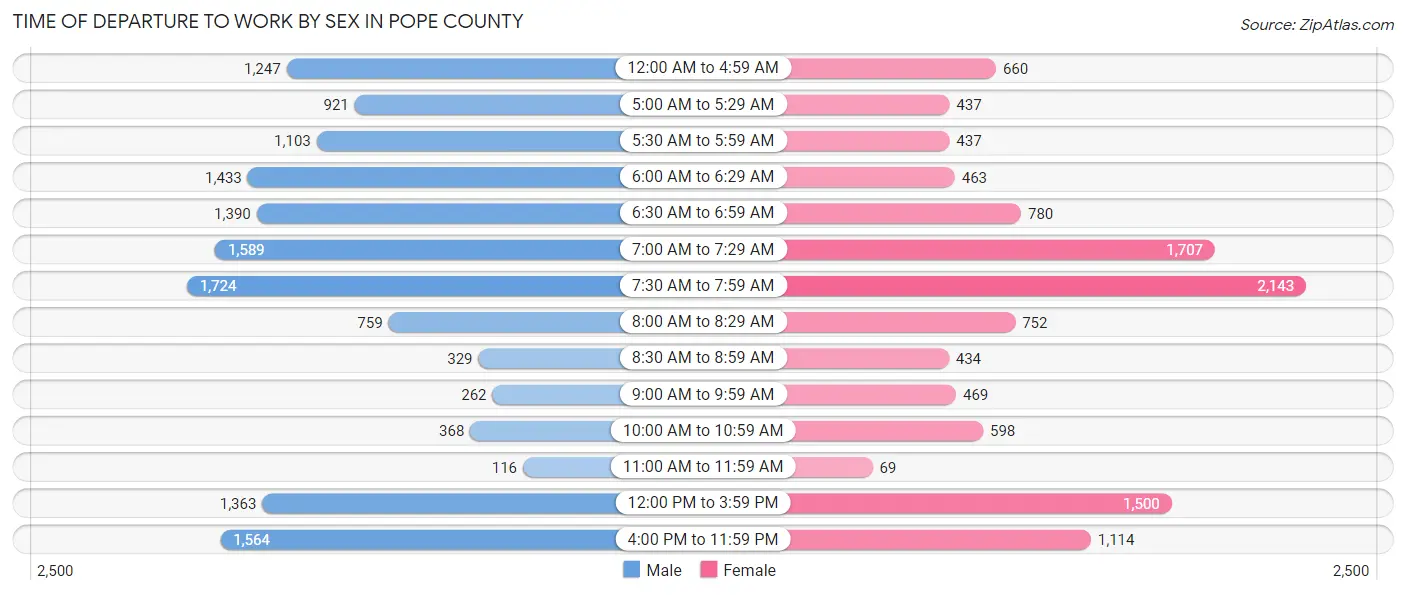
| Time of Departure | Male | Female |
| 12:00 AM to 4:59 AM | 1,247 (8.8%) | 660 (5.7%) |
| 5:00 AM to 5:29 AM | 921 (6.5%) | 437 (3.8%) |
| 5:30 AM to 5:59 AM | 1,103 (7.8%) | 437 (3.8%) |
| 6:00 AM to 6:29 AM | 1,433 (10.1%) | 463 (4.0%) |
| 6:30 AM to 6:59 AM | 1,390 (9.8%) | 780 (6.8%) |
| 7:00 AM to 7:29 AM | 1,589 (11.2%) | 1,707 (14.8%) |
| 7:30 AM to 7:59 AM | 1,724 (12.2%) | 2,143 (18.5%) |
| 8:00 AM to 8:29 AM | 759 (5.4%) | 752 (6.5%) |
| 8:30 AM to 8:59 AM | 329 (2.3%) | 434 (3.7%) |
| 9:00 AM to 9:59 AM | 262 (1.8%) | 469 (4.1%) |
| 10:00 AM to 10:59 AM | 368 (2.6%) | 598 (5.2%) |
| 11:00 AM to 11:59 AM | 116 (0.8%) | 69 (0.6%) |
| 12:00 PM to 3:59 PM | 1,363 (9.6%) | 1,500 (13.0%) |
| 4:00 PM to 11:59 PM | 1,564 (11.0%) | 1,114 (9.6%) |
| Total | 14,168 (100.0%) | 11,563 (100.0%) |
Housing Occupancy in Pope County
Occupancy by Ownership in Pope County
Of the total 23,684 dwellings in Pope County, owner-occupied units account for 17,056 (72.0%), while renter-occupied units make up 6,628 (28.0%).
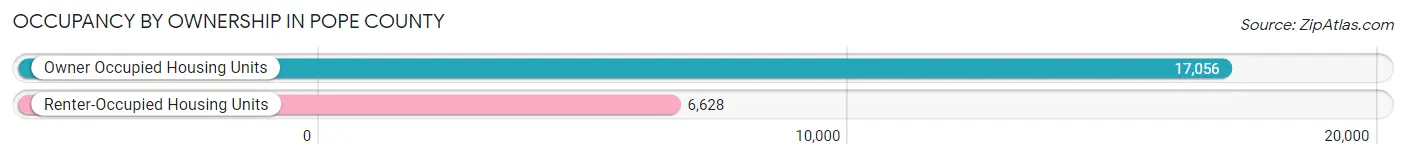
| Occupancy | # Housing Units | % Housing Units |
| Owner Occupied Housing Units | 17,056 | 72.0% |
| Renter-Occupied Housing Units | 6,628 | 28.0% |
| Total Occupied Housing Units | 23,684 | 100.0% |
Occupancy by Household Size in Pope County
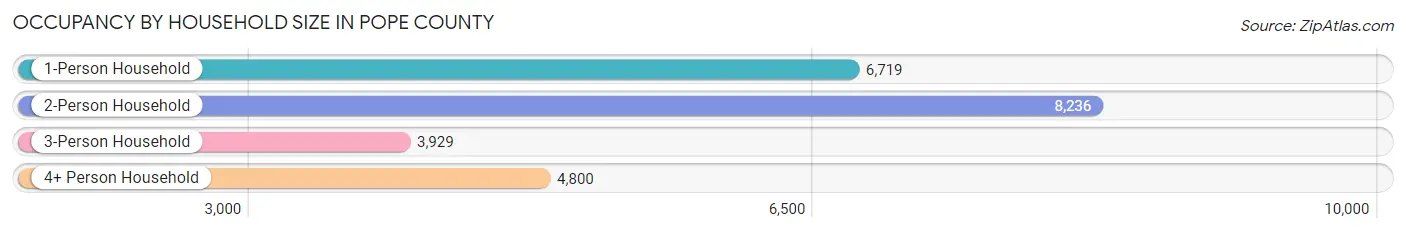
| Household Size | # Housing Units | % Housing Units |
| 1-Person Household | 6,719 | 28.4% |
| 2-Person Household | 8,236 | 34.8% |
| 3-Person Household | 3,929 | 16.6% |
| 4+ Person Household | 4,800 | 20.3% |
| Total Housing Units | 23,684 | 100.0% |
Occupancy by Ownership by Household Size in Pope County
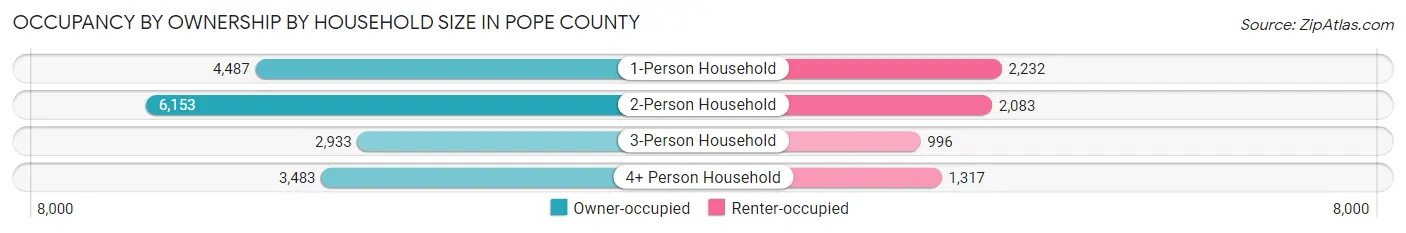
| Household Size | Owner-occupied | Renter-occupied |
| 1-Person Household | 4,487 (66.8%) | 2,232 (33.2%) |
| 2-Person Household | 6,153 (74.7%) | 2,083 (25.3%) |
| 3-Person Household | 2,933 (74.7%) | 996 (25.4%) |
| 4+ Person Household | 3,483 (72.6%) | 1,317 (27.4%) |
| Total Housing Units | 17,056 (72.0%) | 6,628 (28.0%) |
Occupancy by Educational Attainment in Pope County
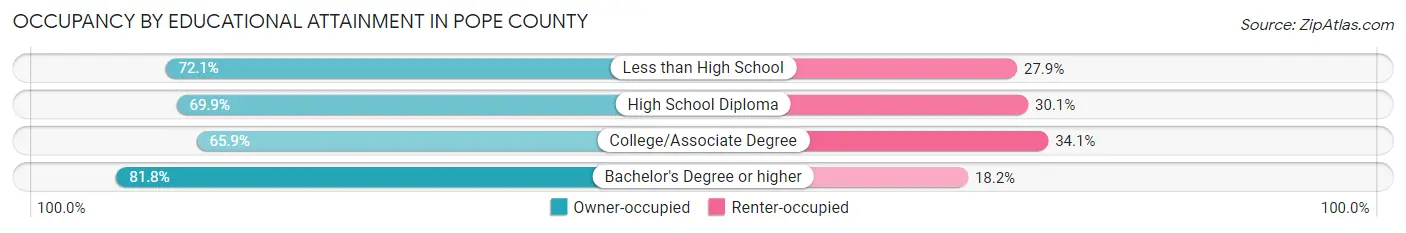
| Household Size | Owner-occupied | Renter-occupied |
| Less than High School | 1,902 (72.1%) | 737 (27.9%) |
| High School Diploma | 5,290 (69.9%) | 2,281 (30.1%) |
| College/Associate Degree | 4,795 (65.9%) | 2,482 (34.1%) |
| Bachelor's Degree or higher | 5,069 (81.8%) | 1,128 (18.2%) |
Occupancy by Age of Householder in Pope County
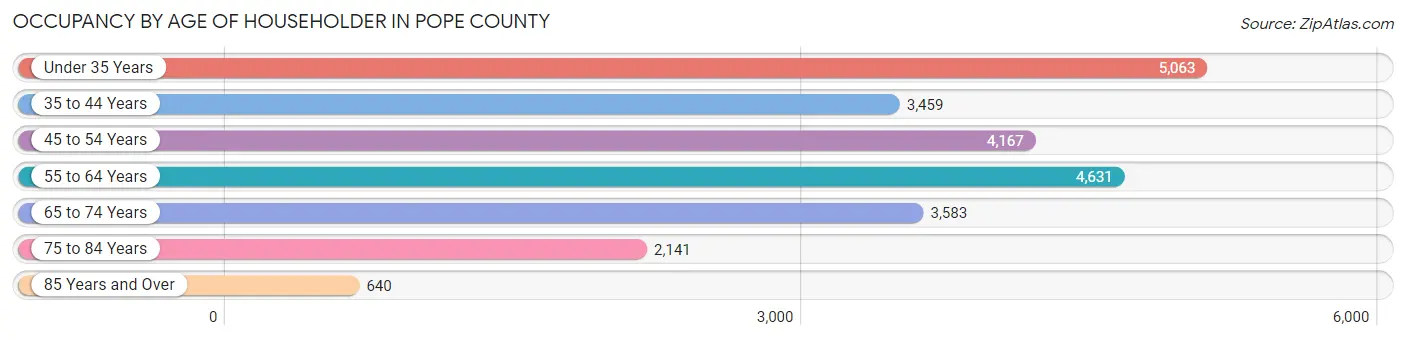
| Age Bracket | # Households | % Households |
| Under 35 Years | 5,063 | 21.4% |
| 35 to 44 Years | 3,459 | 14.6% |
| 45 to 54 Years | 4,167 | 17.6% |
| 55 to 64 Years | 4,631 | 19.6% |
| 65 to 74 Years | 3,583 | 15.1% |
| 75 to 84 Years | 2,141 | 9.0% |
| 85 Years and Over | 640 | 2.7% |
| Total | 23,684 | 100.0% |
Housing Finances in Pope County
Median Income by Occupancy in Pope County
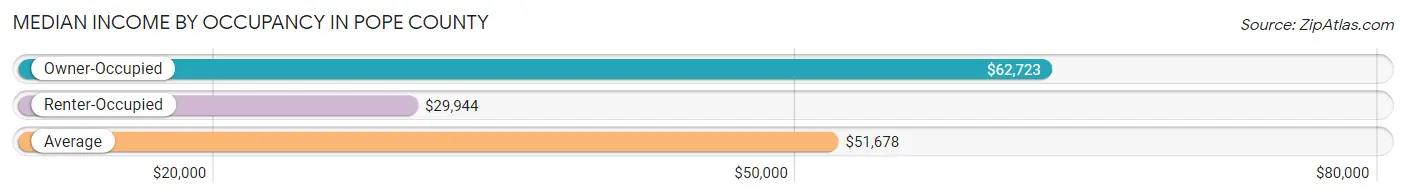
| Occupancy Type | # Households | Median Income |
| Owner-Occupied | 17,056 (72.0%) | $62,723 |
| Renter-Occupied | 6,628 (28.0%) | $29,944 |
| Average | 23,684 (100.0%) | $51,678 |
Occupancy by Householder Income Bracket in Pope County
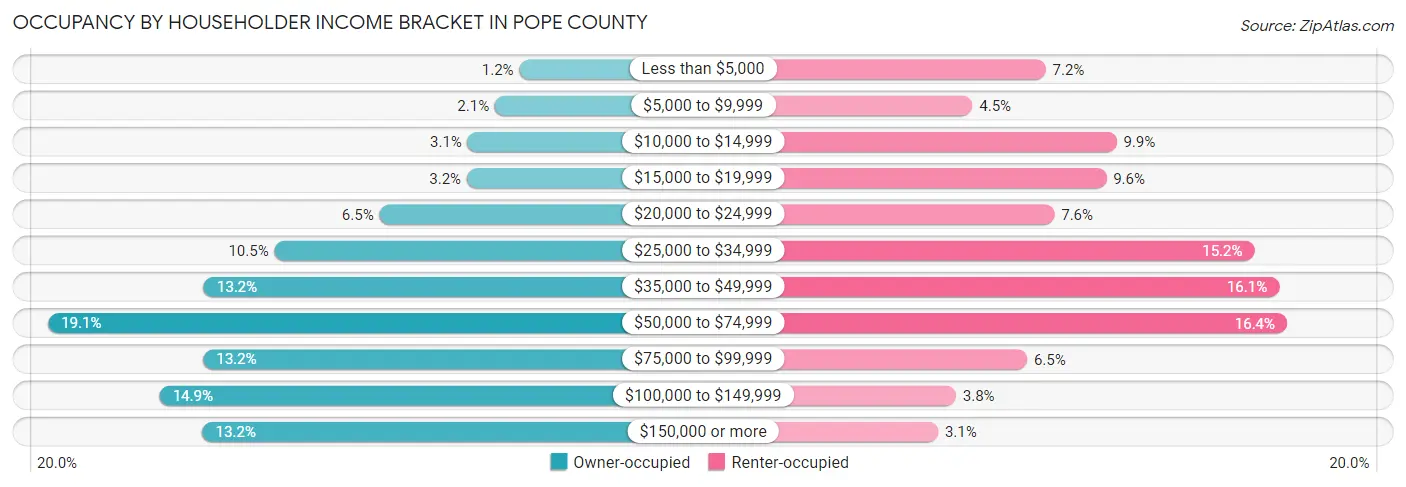
| Income Bracket | Owner-occupied | Renter-occupied |
| Less than $5,000 | 196 (1.1%) | 480 (7.2%) |
| $5,000 to $9,999 | 354 (2.1%) | 295 (4.4%) |
| $10,000 to $14,999 | 533 (3.1%) | 659 (9.9%) |
| $15,000 to $19,999 | 537 (3.2%) | 633 (9.6%) |
| $20,000 to $24,999 | 1,106 (6.5%) | 502 (7.6%) |
| $25,000 to $34,999 | 1,787 (10.5%) | 1,007 (15.2%) |
| $35,000 to $49,999 | 2,247 (13.2%) | 1,069 (16.1%) |
| $50,000 to $74,999 | 3,258 (19.1%) | 1,089 (16.4%) |
| $75,000 to $99,999 | 2,250 (13.2%) | 433 (6.5%) |
| $100,000 to $149,999 | 2,533 (14.8%) | 253 (3.8%) |
| $150,000 or more | 2,255 (13.2%) | 208 (3.1%) |
| Total | 17,056 (100.0%) | 6,628 (100.0%) |
Monthly Housing Cost Tiers in Pope County
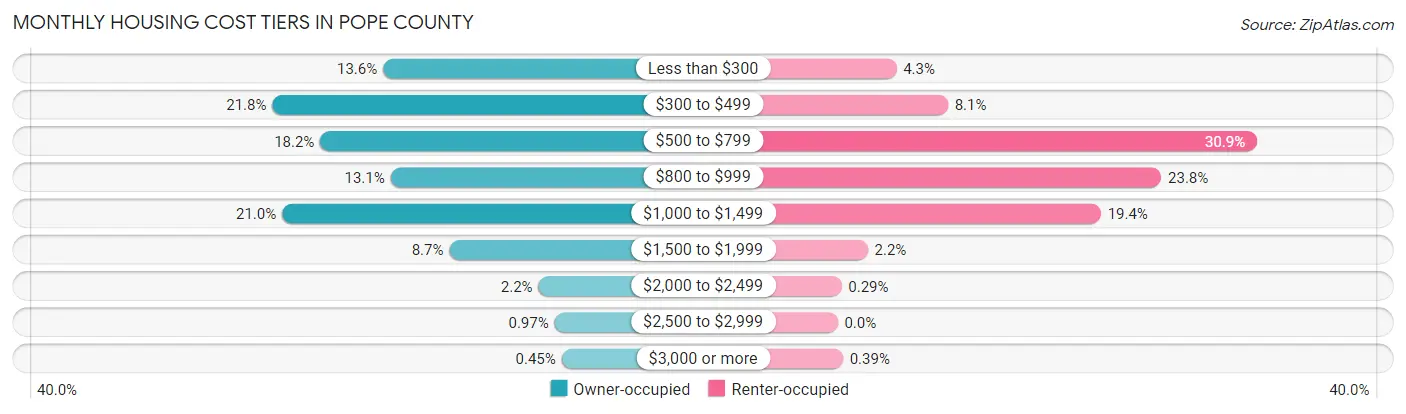
| Monthly Cost | Owner-occupied | Renter-occupied |
| Less than $300 | 2,320 (13.6%) | 287 (4.3%) |
| $300 to $499 | 3,712 (21.8%) | 538 (8.1%) |
| $500 to $799 | 3,109 (18.2%) | 2,048 (30.9%) |
| $800 to $999 | 2,226 (13.1%) | 1,580 (23.8%) |
| $1,000 to $1,499 | 3,589 (21.0%) | 1,285 (19.4%) |
| $1,500 to $1,999 | 1,488 (8.7%) | 147 (2.2%) |
| $2,000 to $2,499 | 369 (2.2%) | 19 (0.3%) |
| $2,500 to $2,999 | 166 (1.0%) | 0 (0.0%) |
| $3,000 or more | 77 (0.4%) | 26 (0.4%) |
| Total | 17,056 (100.0%) | 6,628 (100.0%) |
Physical Housing Characteristics in Pope County
Housing Structures in Pope County
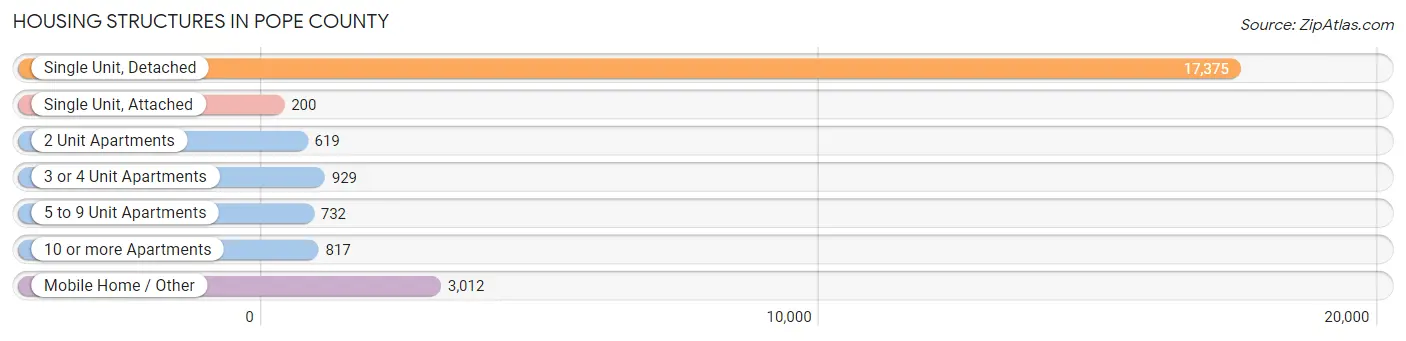
| Structure Type | # Housing Units | % Housing Units |
| Single Unit, Detached | 17,375 | 73.4% |
| Single Unit, Attached | 200 | 0.8% |
| 2 Unit Apartments | 619 | 2.6% |
| 3 or 4 Unit Apartments | 929 | 3.9% |
| 5 to 9 Unit Apartments | 732 | 3.1% |
| 10 or more Apartments | 817 | 3.5% |
| Mobile Home / Other | 3,012 | 12.7% |
| Total | 23,684 | 100.0% |
Housing Structures by Occupancy in Pope County
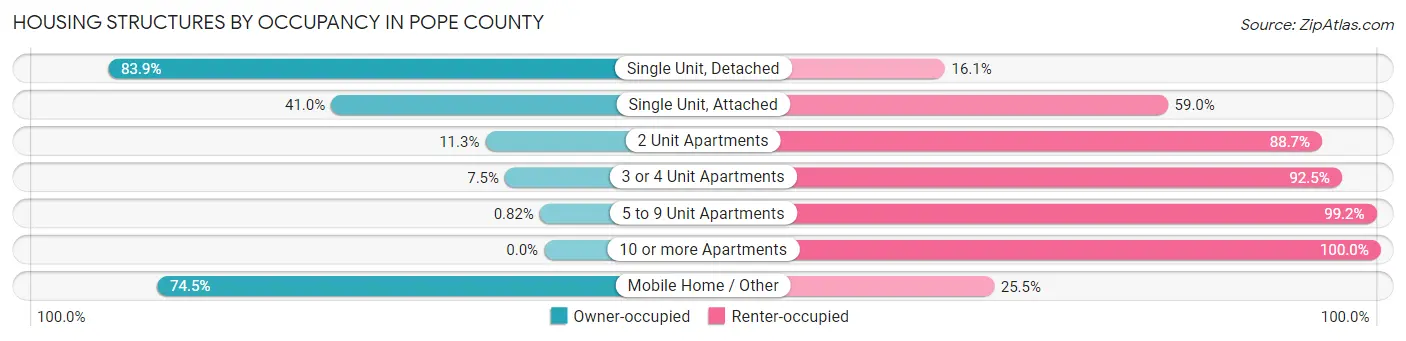
| Structure Type | Owner-occupied | Renter-occupied |
| Single Unit, Detached | 14,585 (83.9%) | 2,790 (16.1%) |
| Single Unit, Attached | 82 (41.0%) | 118 (59.0%) |
| 2 Unit Apartments | 70 (11.3%) | 549 (88.7%) |
| 3 or 4 Unit Apartments | 70 (7.5%) | 859 (92.5%) |
| 5 to 9 Unit Apartments | 6 (0.8%) | 726 (99.2%) |
| 10 or more Apartments | 0 (0.0%) | 817 (100.0%) |
| Mobile Home / Other | 2,243 (74.5%) | 769 (25.5%) |
| Total | 17,056 (72.0%) | 6,628 (28.0%) |
Housing Structures by Number of Rooms in Pope County
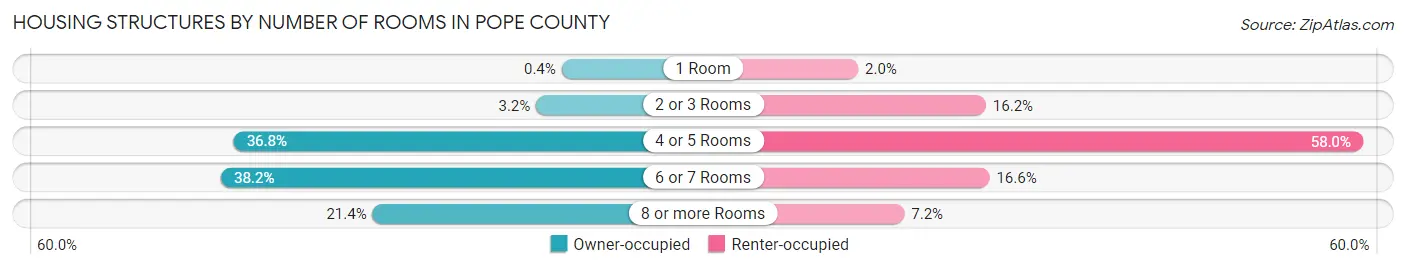
| Number of Rooms | Owner-occupied | Renter-occupied |
| 1 Room | 69 (0.4%) | 134 (2.0%) |
| 2 or 3 Rooms | 551 (3.2%) | 1,074 (16.2%) |
| 4 or 5 Rooms | 6,275 (36.8%) | 3,846 (58.0%) |
| 6 or 7 Rooms | 6,513 (38.2%) | 1,100 (16.6%) |
| 8 or more Rooms | 3,648 (21.4%) | 474 (7.1%) |
| Total | 17,056 (100.0%) | 6,628 (100.0%) |
Housing Structure by Heating Type in Pope County

| Heating Type | Owner-occupied | Renter-occupied |
| Utility Gas | 4,350 (25.5%) | 1,403 (21.2%) |
| Bottled, Tank, or LP Gas | 531 (3.1%) | 80 (1.2%) |
| Electricity | 11,328 (66.4%) | 5,090 (76.8%) |
| Fuel Oil or Kerosene | 31 (0.2%) | 0 (0.0%) |
| Coal or Coke | 0 (0.0%) | 0 (0.0%) |
| All other Fuels | 796 (4.7%) | 50 (0.7%) |
| No Fuel Used | 20 (0.1%) | 5 (0.1%) |
| Total | 17,056 (100.0%) | 6,628 (100.0%) |
Household Vehicle Usage in Pope County
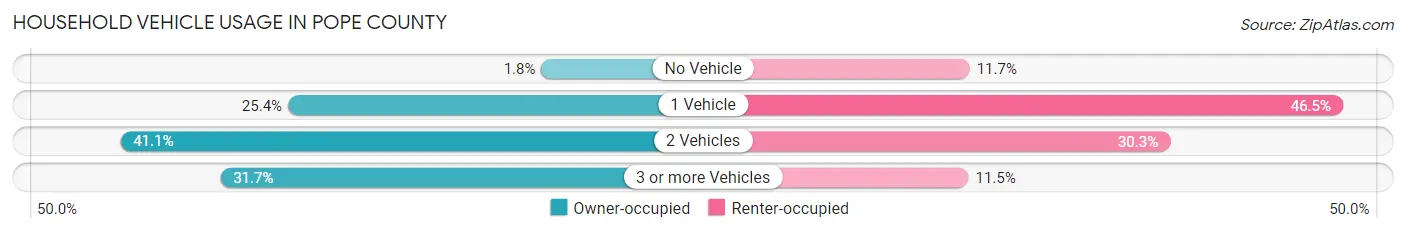
| Vehicles per Household | Owner-occupied | Renter-occupied |
| No Vehicle | 302 (1.8%) | 772 (11.7%) |
| 1 Vehicle | 4,336 (25.4%) | 3,080 (46.5%) |
| 2 Vehicles | 7,005 (41.1%) | 2,011 (30.3%) |
| 3 or more Vehicles | 5,413 (31.7%) | 765 (11.5%) |
| Total | 17,056 (100.0%) | 6,628 (100.0%) |
Real Estate & Mortgages in Pope County
Real Estate and Mortgage Overview in Pope County
| Characteristic | Without Mortgage | With Mortgage |
| Housing Units | 7,320 | 9,736 |
| Median Property Value | $129,900 | $160,100 |
| Median Household Income | $52,811 | $1,597 |
| Monthly Housing Costs | $363 | $70 |
| Real Estate Taxes | $823 | $650 |
Property Value by Mortgage Status in Pope County
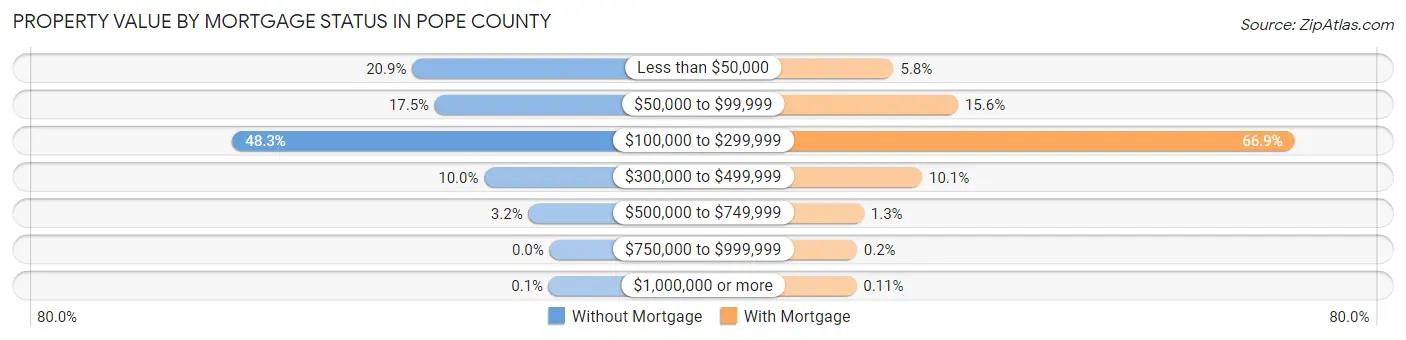
| Property Value | Without Mortgage | With Mortgage |
| Less than $50,000 | 1,532 (20.9%) | 564 (5.8%) |
| $50,000 to $99,999 | 1,279 (17.5%) | 1,520 (15.6%) |
| $100,000 to $299,999 | 3,538 (48.3%) | 6,512 (66.9%) |
| $300,000 to $499,999 | 728 (10.0%) | 986 (10.1%) |
| $500,000 to $749,999 | 236 (3.2%) | 124 (1.3%) |
| $750,000 to $999,999 | 0 (0.0%) | 19 (0.2%) |
| $1,000,000 or more | 7 (0.1%) | 11 (0.1%) |
| Total | 7,320 (100.0%) | 9,736 (100.0%) |
Household Income by Mortgage Status in Pope County
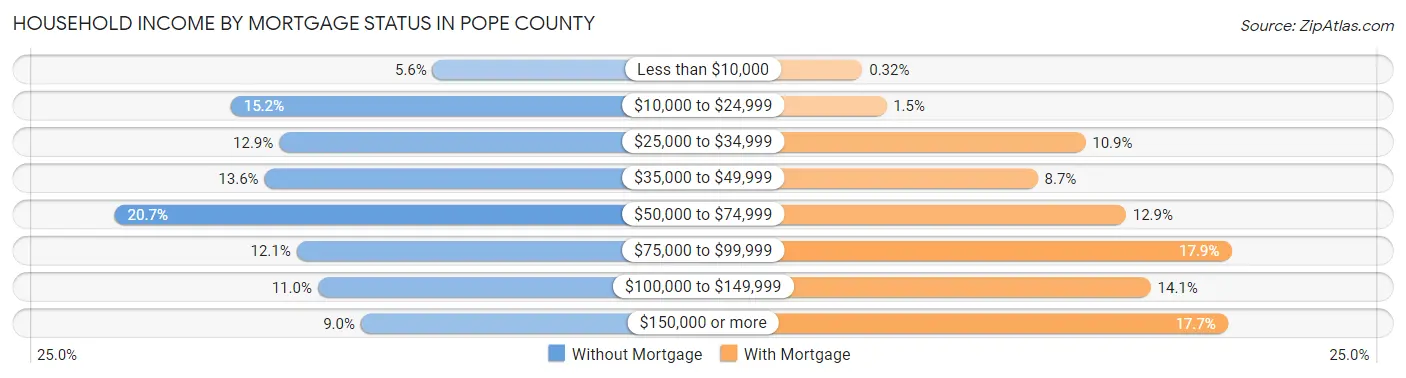
| Household Income | Without Mortgage | With Mortgage |
| Less than $10,000 | 408 (5.6%) | 31 (0.3%) |
| $10,000 to $24,999 | 1,111 (15.2%) | 142 (1.5%) |
| $25,000 to $34,999 | 943 (12.9%) | 1,065 (10.9%) |
| $35,000 to $49,999 | 994 (13.6%) | 844 (8.7%) |
| $50,000 to $74,999 | 1,516 (20.7%) | 1,253 (12.9%) |
| $75,000 to $99,999 | 882 (12.0%) | 1,742 (17.9%) |
| $100,000 to $149,999 | 808 (11.0%) | 1,368 (14.1%) |
| $150,000 or more | 658 (9.0%) | 1,725 (17.7%) |
| Total | 7,320 (100.0%) | 9,736 (100.0%) |
Property Value to Household Income Ratio in Pope County
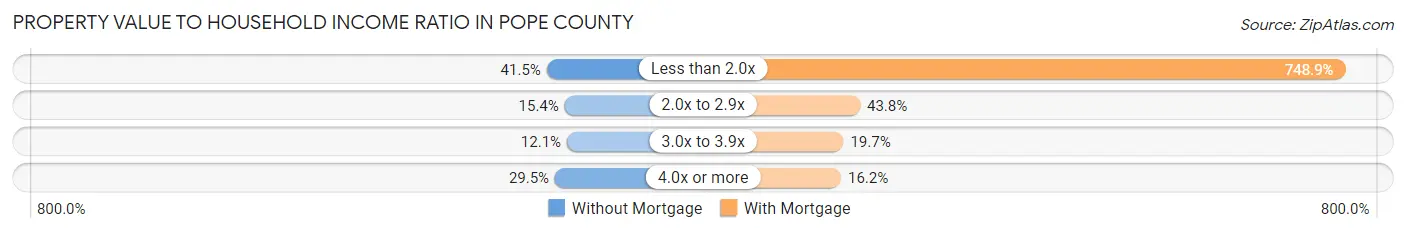
| Value-to-Income Ratio | Without Mortgage | With Mortgage |
| Less than 2.0x | 3,040 (41.5%) | 72,911 (748.9%) |
| 2.0x to 2.9x | 1,129 (15.4%) | 4,263 (43.8%) |
| 3.0x to 3.9x | 885 (12.1%) | 1,918 (19.7%) |
| 4.0x or more | 2,156 (29.4%) | 1,580 (16.2%) |
| Total | 7,320 (100.0%) | 9,736 (100.0%) |
Real Estate Taxes by Mortgage Status in Pope County
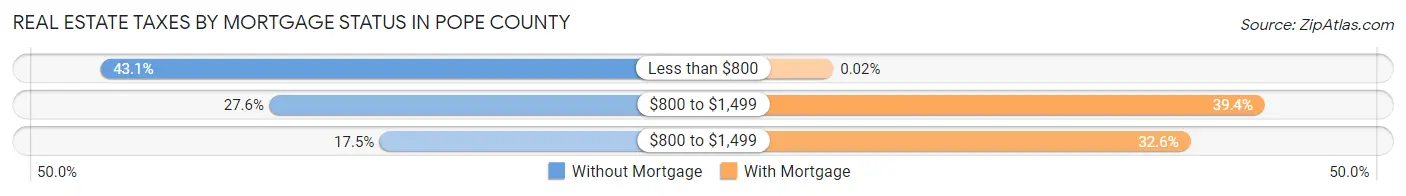
| Property Taxes | Without Mortgage | With Mortgage |
| Less than $800 | 3,154 (43.1%) | 2 (0.0%) |
| $800 to $1,499 | 2,021 (27.6%) | 3,839 (39.4%) |
| $800 to $1,499 | 1,283 (17.5%) | 3,178 (32.6%) |
| Total | 7,320 (100.0%) | 9,736 (100.0%) |
Health & Disability in Pope County
Health Insurance Coverage by Age in Pope County
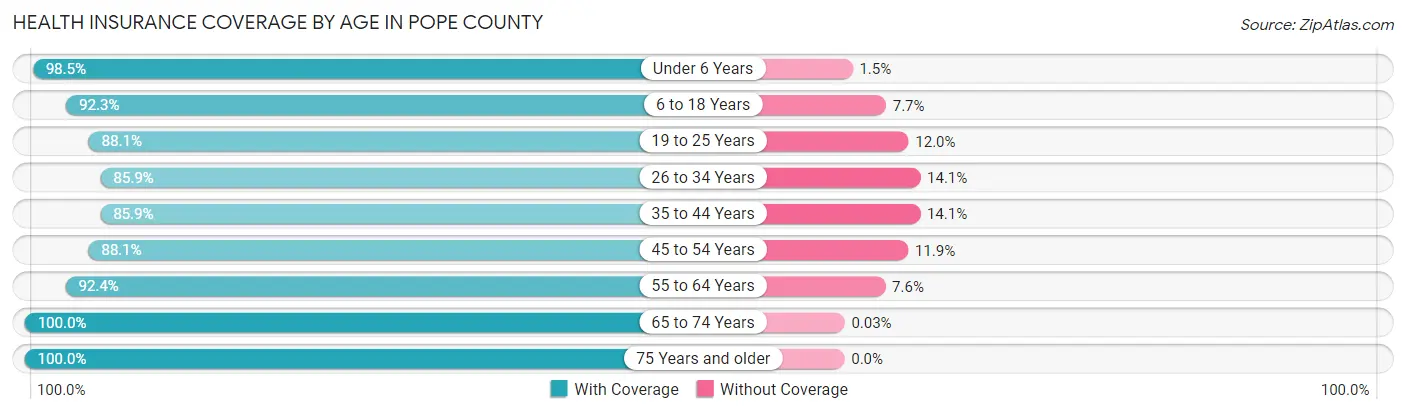
| Age Bracket | With Coverage | Without Coverage |
| Under 6 Years | 4,458 (98.5%) | 69 (1.5%) |
| 6 to 18 Years | 10,341 (92.3%) | 868 (7.7%) |
| 19 to 25 Years | 6,792 (88.0%) | 922 (11.9%) |
| 26 to 34 Years | 6,000 (85.9%) | 988 (14.1%) |
| 35 to 44 Years | 6,330 (85.9%) | 1,040 (14.1%) |
| 45 to 54 Years | 6,463 (88.1%) | 871 (11.9%) |
| 55 to 64 Years | 7,324 (92.4%) | 604 (7.6%) |
| 65 to 74 Years | 5,733 (100.0%) | 2 (0.0%) |
| 75 Years and older | 4,058 (100.0%) | 0 (0.0%) |
| Total | 57,499 (91.5%) | 5,364 (8.5%) |
Health Insurance Coverage by Citizenship Status in Pope County
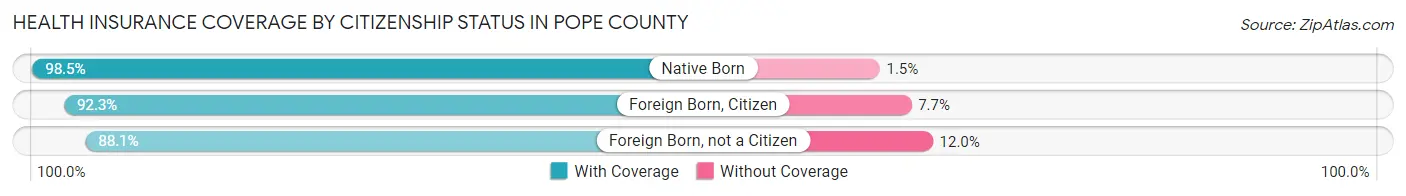
| Citizenship Status | With Coverage | Without Coverage |
| Native Born | 4,458 (98.5%) | 69 (1.5%) |
| Foreign Born, Citizen | 10,341 (92.3%) | 868 (7.7%) |
| Foreign Born, not a Citizen | 6,792 (88.0%) | 922 (11.9%) |
Health Insurance Coverage by Household Income in Pope County
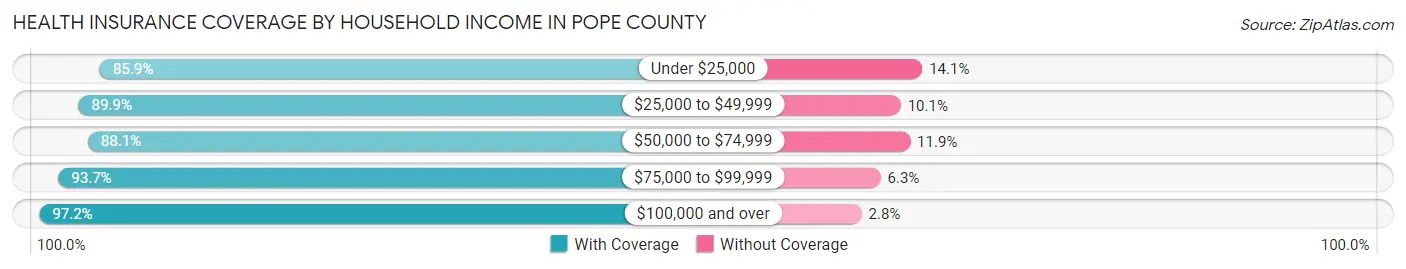
| Household Income | With Coverage | Without Coverage |
| Under $25,000 | 7,958 (85.9%) | 1,310 (14.1%) |
| $25,000 to $49,999 | 13,244 (89.9%) | 1,489 (10.1%) |
| $50,000 to $74,999 | 10,426 (88.1%) | 1,404 (11.9%) |
| $75,000 to $99,999 | 6,786 (93.7%) | 459 (6.3%) |
| $100,000 and over | 16,629 (97.2%) | 475 (2.8%) |
Public vs Private Health Insurance Coverage by Age in Pope County
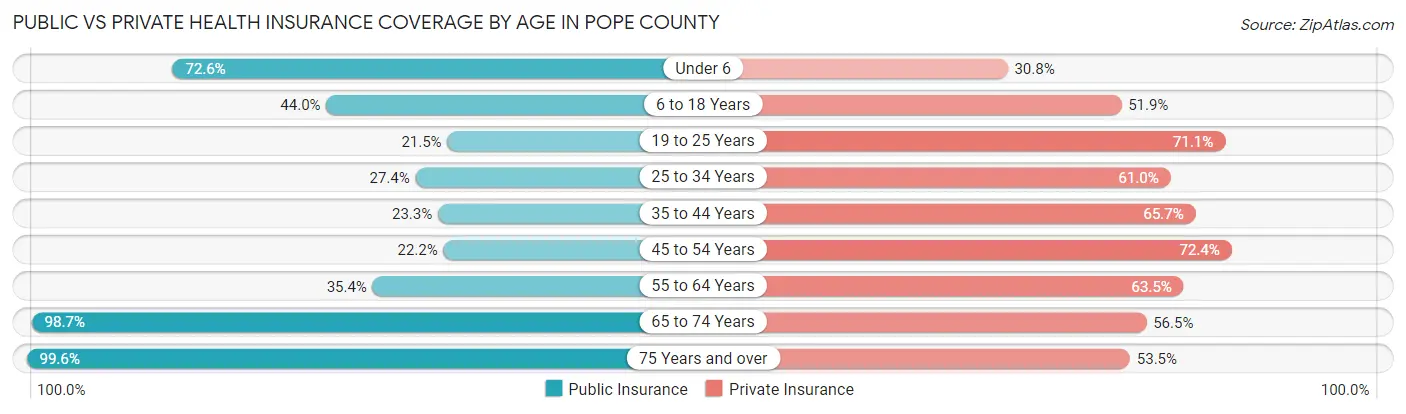
| Age Bracket | Public Insurance | Private Insurance |
| Under 6 | 3,285 (72.6%) | 1,392 (30.7%) |
| 6 to 18 Years | 4,930 (44.0%) | 5,813 (51.9%) |
| 19 to 25 Years | 1,659 (21.5%) | 5,488 (71.1%) |
| 25 to 34 Years | 1,917 (27.4%) | 4,265 (61.0%) |
| 35 to 44 Years | 1,714 (23.3%) | 4,839 (65.7%) |
| 45 to 54 Years | 1,631 (22.2%) | 5,307 (72.4%) |
| 55 to 64 Years | 2,806 (35.4%) | 5,030 (63.4%) |
| 65 to 74 Years | 5,660 (98.7%) | 3,241 (56.5%) |
| 75 Years and over | 4,043 (99.6%) | 2,170 (53.5%) |
| Total | 27,645 (44.0%) | 37,545 (59.7%) |
Disability Status by Sex by Age in Pope County
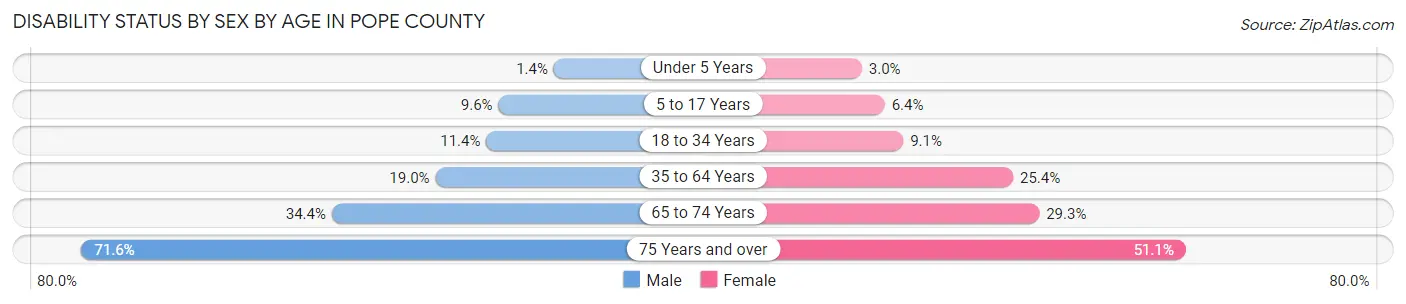
| Age Bracket | Male | Female |
| Under 5 Years | 28 (1.4%) | 57 (3.0%) |
| 5 to 17 Years | 507 (9.6%) | 345 (6.4%) |
| 18 to 34 Years | 923 (11.4%) | 713 (9.1%) |
| 35 to 64 Years | 2,161 (19.0%) | 2,863 (25.4%) |
| 65 to 74 Years | 932 (34.4%) | 887 (29.3%) |
| 75 Years and over | 1,263 (71.6%) | 1,171 (51.1%) |
Disability Class by Sex by Age in Pope County
Disability Class: Hearing Difficulty
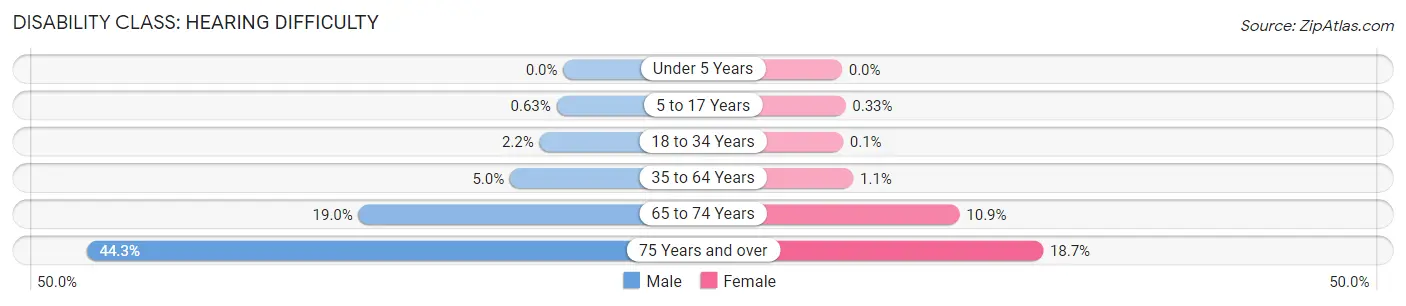
| Age Bracket | Male | Female |
| Under 5 Years | 0 (0.0%) | 0 (0.0%) |
| 5 to 17 Years | 33 (0.6%) | 18 (0.3%) |
| 18 to 34 Years | 178 (2.2%) | 8 (0.1%) |
| 35 to 64 Years | 563 (5.0%) | 118 (1.1%) |
| 65 to 74 Years | 515 (19.0%) | 330 (10.9%) |
| 75 Years and over | 781 (44.3%) | 428 (18.7%) |
Disability Class: Vision Difficulty
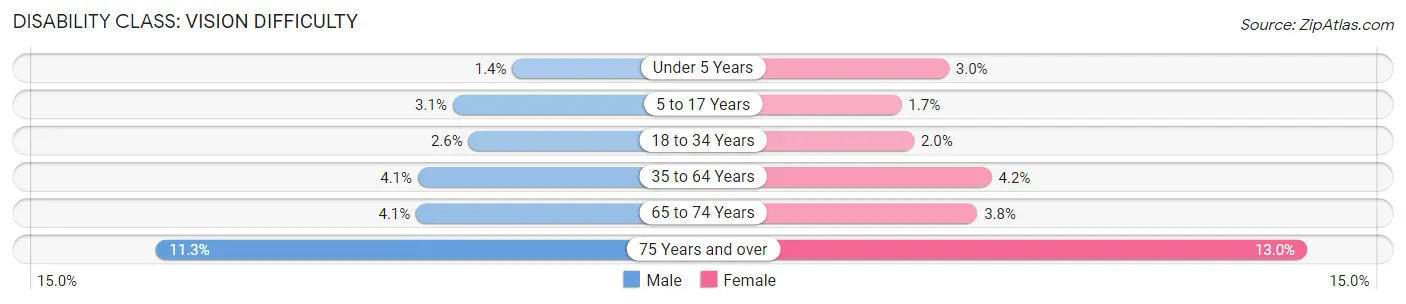
| Age Bracket | Male | Female |
| Under 5 Years | 28 (1.4%) | 57 (3.0%) |
| 5 to 17 Years | 162 (3.1%) | 90 (1.7%) |
| 18 to 34 Years | 213 (2.6%) | 157 (2.0%) |
| 35 to 64 Years | 460 (4.1%) | 469 (4.2%) |
| 65 to 74 Years | 111 (4.1%) | 114 (3.8%) |
| 75 Years and over | 200 (11.3%) | 297 (13.0%) |
Disability Class: Cognitive Difficulty
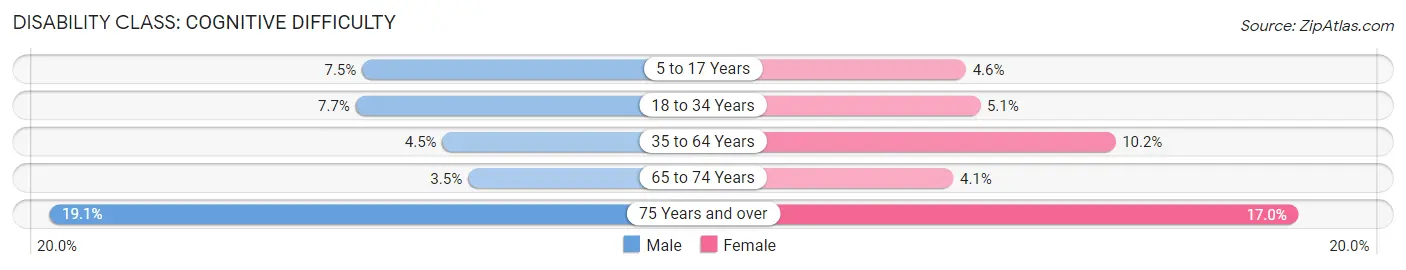
| Age Bracket | Male | Female |
| 5 to 17 Years | 393 (7.5%) | 249 (4.6%) |
| 18 to 34 Years | 622 (7.7%) | 401 (5.1%) |
| 35 to 64 Years | 511 (4.5%) | 1,143 (10.2%) |
| 65 to 74 Years | 96 (3.5%) | 125 (4.1%) |
| 75 Years and over | 337 (19.1%) | 389 (17.0%) |
Disability Class: Ambulatory Difficulty
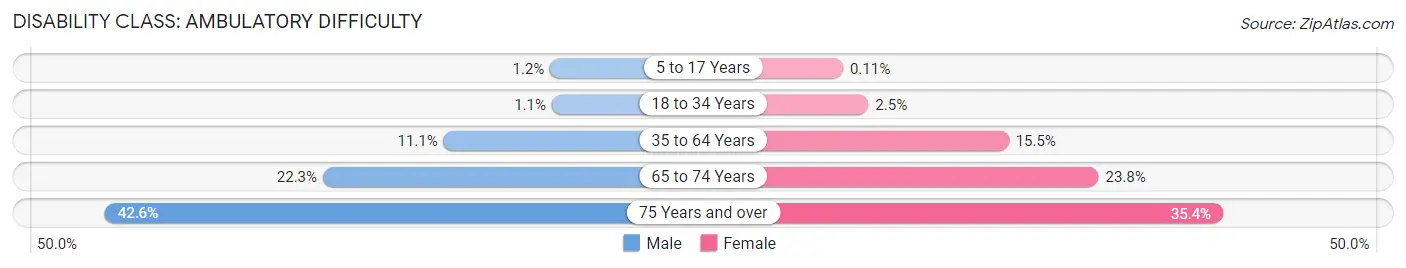
| Age Bracket | Male | Female |
| 5 to 17 Years | 64 (1.2%) | 6 (0.1%) |
| 18 to 34 Years | 86 (1.1%) | 193 (2.5%) |
| 35 to 64 Years | 1,264 (11.1%) | 1,744 (15.5%) |
| 65 to 74 Years | 605 (22.3%) | 721 (23.8%) |
| 75 Years and over | 751 (42.5%) | 811 (35.4%) |
Disability Class: Self-Care Difficulty
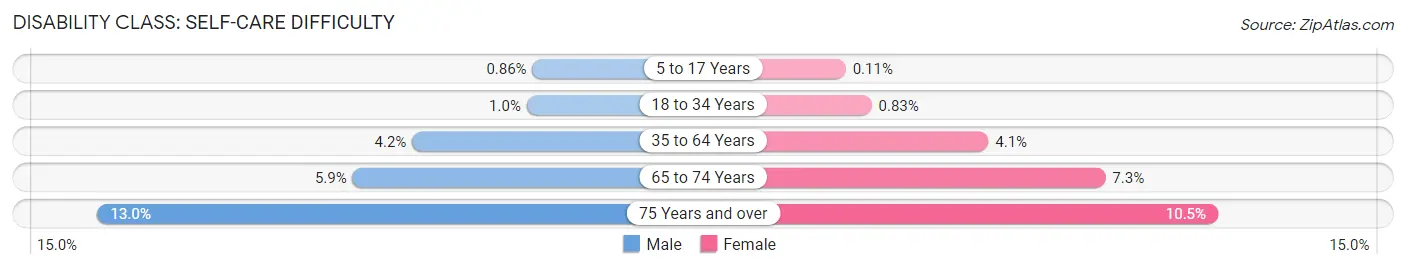
| Age Bracket | Male | Female |
| 5 to 17 Years | 45 (0.9%) | 6 (0.1%) |
| 18 to 34 Years | 82 (1.0%) | 65 (0.8%) |
| 35 to 64 Years | 479 (4.2%) | 459 (4.1%) |
| 65 to 74 Years | 159 (5.9%) | 222 (7.3%) |
| 75 Years and over | 229 (13.0%) | 240 (10.5%) |
Technology Access in Pope County
Computing Device Access in Pope County
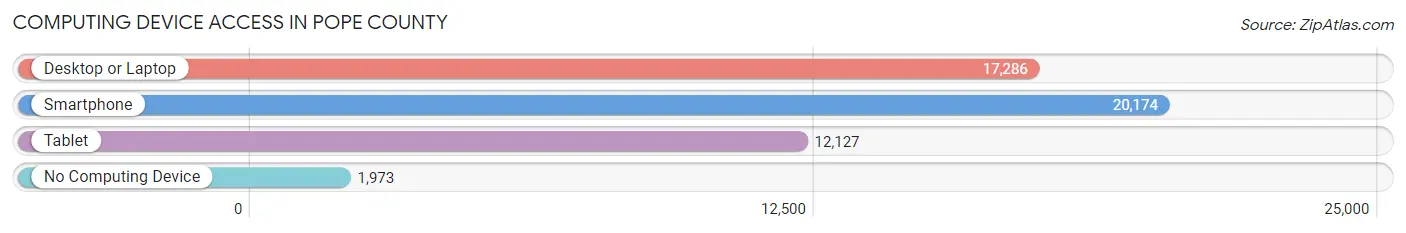
| Device Type | # Households | % Households |
| Desktop or Laptop | 17,286 | 73.0% |
| Smartphone | 20,174 | 85.2% |
| Tablet | 12,127 | 51.2% |
| No Computing Device | 1,973 | 8.3% |
| Total | 23,684 | 100.0% |
Internet Access in Pope County
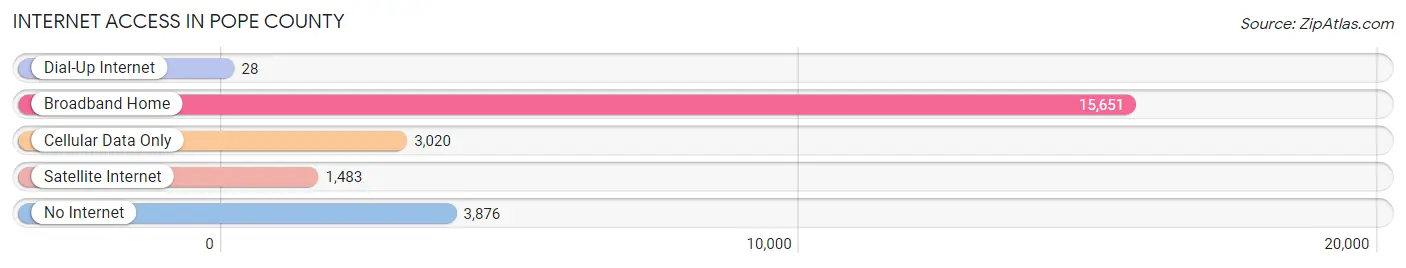
| Internet Type | # Households | % Households |
| Dial-Up Internet | 28 | 0.1% |
| Broadband Home | 15,651 | 66.1% |
| Cellular Data Only | 3,020 | 12.8% |
| Satellite Internet | 1,483 | 6.3% |
| No Internet | 3,876 | 16.4% |
| Total | 23,684 | 100.0% |
Pope County Summary
Introduction
Pope County is located in the northwest corner of Arkansas and is part of the Arkansas River Valley. It is bordered by Johnson County to the north, Yell County to the east, Conway County to the south, and Logan County to the west. The county seat is Russellville, which is also the largest city in the county. Pope County is home to a variety of natural resources, including the Arkansas River, Lake Dardanelle, and the Ozark National Forest. The county is also home to a number of historic sites, including the Arkansas Post National Memorial and the Mount Nebo State Park.
History
Pope County was established in 1829 and named after John Pope, the third governor of the Arkansas Territory. The county was originally part of the Cherokee Nation, but was ceded to the United States in 1828. The first settlers arrived in the area in the 1830s, and the county was officially organized in 1835.
During the Civil War, Pope County was a major site of conflict. The Battle of Pea Ridge was fought in the county in 1862, and the Battle of Prairie Grove was fought in the county in 1863. After the war, the county experienced a period of economic growth, with the development of the railroad and the timber industry.
Geography
Pope County covers an area of 845 square miles and is located in the Arkansas River Valley. The county is bordered by Johnson County to the north, Yell County to the east, Conway County to the south, and Logan County to the west. The county is home to a variety of natural resources, including the Arkansas River, Lake Dardanelle, and the Ozark National Forest.
The county is divided into two distinct regions: the Ozark Plateau in the north and the Arkansas River Valley in the south. The Ozark Plateau is characterized by rolling hills and dense forests, while the Arkansas River Valley is characterized by flat plains and open fields.
Economy
Pope County’s economy is largely based on agriculture and manufacturing. The county is home to a number of large agricultural operations, including poultry farms, cattle ranches, and row crop farms. The county is also home to a number of manufacturing companies, including a paper mill, a steel mill, and a furniture factory.
The county is also home to a number of tourist attractions, including the Arkansas Post National Memorial, the Mount Nebo State Park, and the Ozark National Forest. These attractions draw visitors from all over the state and the region, providing a boost to the local economy.
Demographics
As of the 2010 census, Pope County had a population of 61,754. The population is spread out across the county, with the largest city being Russellville, which has a population of 28,307. The county is predominantly white (86.3%), with smaller percentages of African Americans (7.7%), Hispanics (3.2%), and Asians (1.2%).
Conclusion
Pope County is located in the northwest corner of Arkansas and is part of the Arkansas River Valley. The county is home to a variety of natural resources, including the Arkansas River, Lake Dardanelle, and the Ozark National Forest. The county’s economy is largely based on agriculture and manufacturing, and it is also home to a number of tourist attractions. As of the 2010 census, Pope County had a population of 61,754, with the largest city being Russellville.
Common Questions
What is Per Capita Income in Pope County?
Per Capita income in Pope County is $28,018.
What is the Median Family Income in Pope County?
Median Family Income in Pope County is $64,117.
What is the Median Household income in Pope County?
Median Household Income in Pope County is $51,678.
What is Income or Wage Gap in Pope County?
Income or Wage Gap in Pope County is 40.0%.
Women in Pope County earn 60.0 cents for every dollar earned by a man.
What is Family Income Deficit in Pope County?
Family Income Deficit in Pope County is $8,363.
Families that are below poverty line in Pope County earn $8,363 less on average than the poverty threshold level.
What is Inequality or Gini Index in Pope County?
Inequality or Gini Index in Pope County is 0.47.
What is the Total Population of Pope County?
Total Population of Pope County is 63,475.
What is the Total Male Population of Pope County?
Total Male Population of Pope County is 31,401.
What is the Total Female Population of Pope County?
Total Female Population of Pope County is 32,074.
What is the Ratio of Males per 100 Females in Pope County?
There are 97.90 Males per 100 Females in Pope County.
What is the Ratio of Females per 100 Males in Pope County?
There are 102.14 Females per 100 Males in Pope County.
What is the Median Population Age in Pope County?
Median Population Age in Pope County is 36.7 Years.
What is the Average Family Size in Pope County
Average Family Size in Pope County is 3.1 People.
What is the Average Household Size in Pope County
Average Household Size in Pope County is 2.5 People.
How Large is the Labor Force in Pope County?
There are 28,563 People in the Labor Forcein in Pope County.
What is the Percentage of People in the Labor Force in Pope County?
56.3% of People are in the Labor Force in Pope County.
What is the Unemployment Rate in Pope County?
Unemployment Rate in Pope County is 4.8%.