Mississippi County, AR Map & Demographics
Mississippi County Map
Mississippi County Overview
$27,863
PER CAPITA INCOME
$62,701
AVG FAMILY INCOME
$50,012
AVG HOUSEHOLD INCOME
30.6%
WAGE / INCOME GAP [ % ]
69.4¢/ $1
WAGE / INCOME GAP [ $ ]
$11,340
FAMILY INCOME DEFICIT
0.49
INEQUALITY / GINI INDEX
40,361
TOTAL POPULATION
19,837
MALE POPULATION
20,524
FEMALE POPULATION
96.65
MALES / 100 FEMALES
103.46
FEMALES / 100 MALES
37.0
MEDIAN AGE
3.2
AVG FAMILY SIZE
2.6
AVG HOUSEHOLD SIZE
18,819
LABOR FORCE [ PEOPLE ]
60.4%
PERCENT IN LABOR FORCE
9.8%
UNEMPLOYMENT RATE
Mississippi County Area Codes
Income in Mississippi County
Income Overview in Mississippi County
Per Capita Income in Mississippi County is $27,863, while median incomes of families and households are $62,701 and $50,012 respectively.
| Characteristic | Number | Measure |
| Per Capita Income | 40,361 | $27,863 |
| Median Family Income | 9,877 | $62,701 |
| Mean Family Income | 9,877 | $84,908 |
| Median Household Income | 15,005 | $50,012 |
| Mean Household Income | 15,005 | $71,494 |
| Income Deficit | 9,877 | $11,340 |
| Wage / Income Gap (%) | 40,361 | 30.64% |
| Wage / Income Gap ($) | 40,361 | 69.36¢ per $1 |
| Gini / Inequality Index | 40,361 | 0.49 |
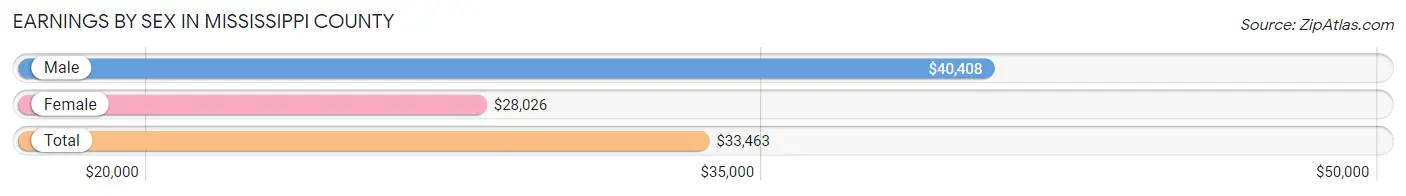
Earnings by Sex in Mississippi County
Average Earnings in Mississippi County are $33,463, $40,408 for men and $28,026 for women, a difference of 30.6%.
| Sex | Number | Average Earnings |
| Male | 10,301 (53.6%) | $40,408 |
| Female | 8,923 (46.4%) | $28,026 |
| Total | 19,224 (100.0%) | $33,463 |
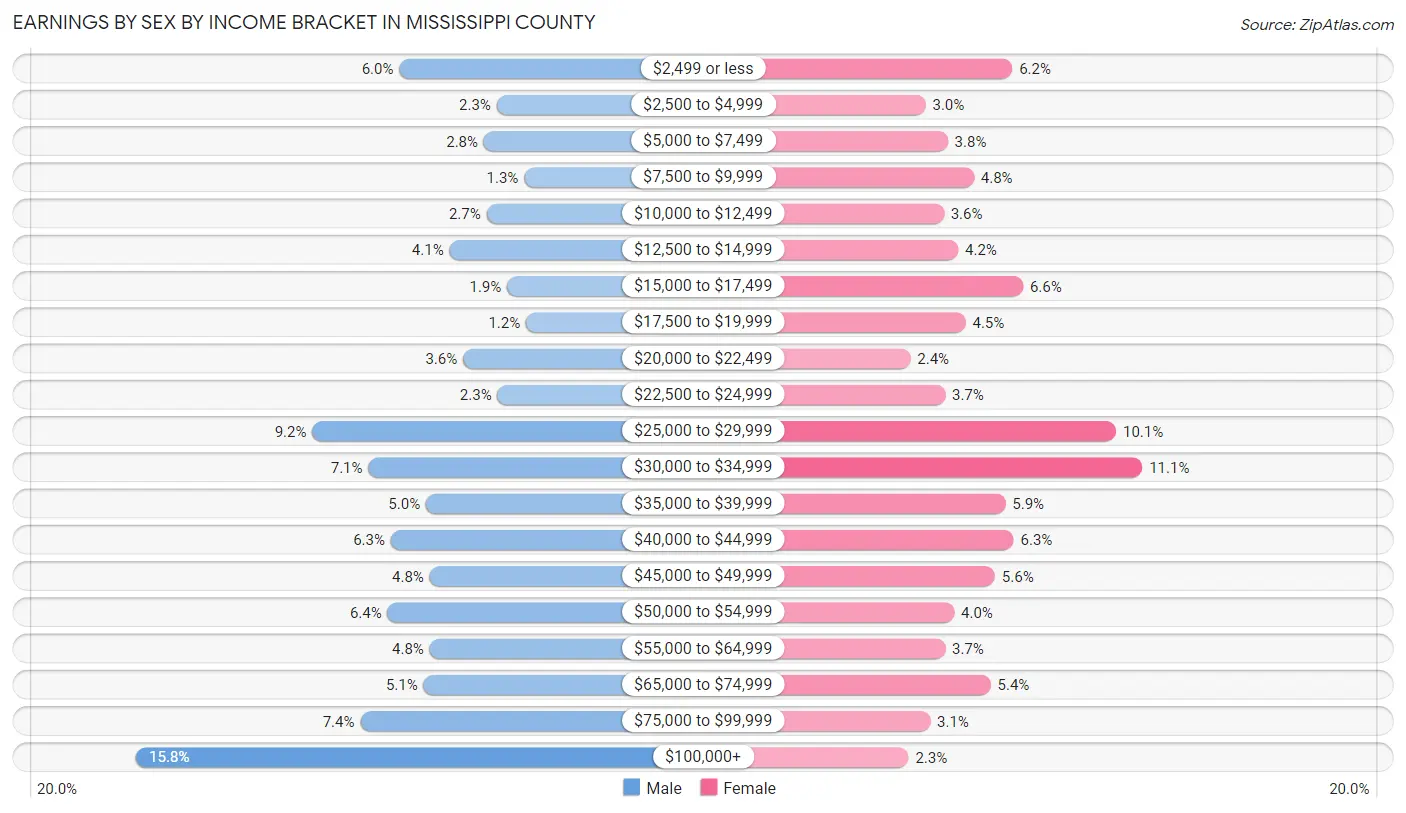
Earnings by Sex by Income Bracket in Mississippi County
The most common earnings brackets in Mississippi County are $100,000+ for men (1,630 | 15.8%) and $30,000 to $34,999 for women (988 | 11.1%).
| Income | Male | Female |
| $2,499 or less | 614 (6.0%) | 553 (6.2%) |
| $2,500 to $4,999 | 238 (2.3%) | 263 (2.9%) |
| $5,000 to $7,499 | 287 (2.8%) | 337 (3.8%) |
| $7,500 to $9,999 | 132 (1.3%) | 425 (4.8%) |
| $10,000 to $12,499 | 277 (2.7%) | 324 (3.6%) |
| $12,500 to $14,999 | 420 (4.1%) | 372 (4.2%) |
| $15,000 to $17,499 | 198 (1.9%) | 589 (6.6%) |
| $17,500 to $19,999 | 125 (1.2%) | 397 (4.4%) |
| $20,000 to $22,499 | 368 (3.6%) | 212 (2.4%) |
| $22,500 to $24,999 | 235 (2.3%) | 328 (3.7%) |
| $25,000 to $29,999 | 950 (9.2%) | 900 (10.1%) |
| $30,000 to $34,999 | 733 (7.1%) | 988 (11.1%) |
| $35,000 to $39,999 | 511 (5.0%) | 530 (5.9%) |
| $40,000 to $44,999 | 647 (6.3%) | 558 (6.2%) |
| $45,000 to $49,999 | 496 (4.8%) | 495 (5.6%) |
| $50,000 to $54,999 | 659 (6.4%) | 359 (4.0%) |
| $55,000 to $64,999 | 497 (4.8%) | 328 (3.7%) |
| $65,000 to $74,999 | 520 (5.1%) | 481 (5.4%) |
| $75,000 to $99,999 | 764 (7.4%) | 278 (3.1%) |
| $100,000+ | 1,630 (15.8%) | 206 (2.3%) |
| Total | 10,301 (100.0%) | 8,923 (100.0%) |
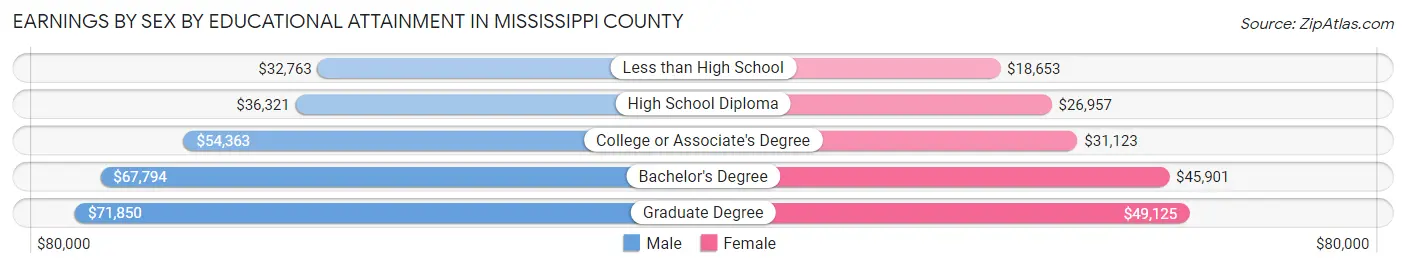
Earnings by Sex by Educational Attainment in Mississippi County
Average earnings in Mississippi County are $43,234 for men and $31,453 for women, a difference of 27.3%. Men with an educational attainment of graduate degree enjoy the highest average annual earnings of $71,850, while those with less than high school education earn the least with $32,763. Women with an educational attainment of graduate degree earn the most with the average annual earnings of $49,125, while those with less than high school education have the smallest earnings of $18,653.
| Educational Attainment | Male Income | Female Income |
| Less than High School | $32,763 | $18,653 |
| High School Diploma | $36,321 | $26,957 |
| College or Associate's Degree | $54,363 | $31,123 |
| Bachelor's Degree | $67,794 | $45,901 |
| Graduate Degree | $71,850 | $49,125 |
| Total | $43,234 | $31,453 |
Family Income in Mississippi County
Family Income Brackets in Mississippi County
According to the Mississippi County family income data, there are 1,521 families falling into the $100,000 to $149,999 income range, which is the most common income bracket and makes up 15.4% of all families. Conversely, the $10,000 to $14,999 income bracket is the least frequent group with only 356 families (3.6%) belonging to this category.
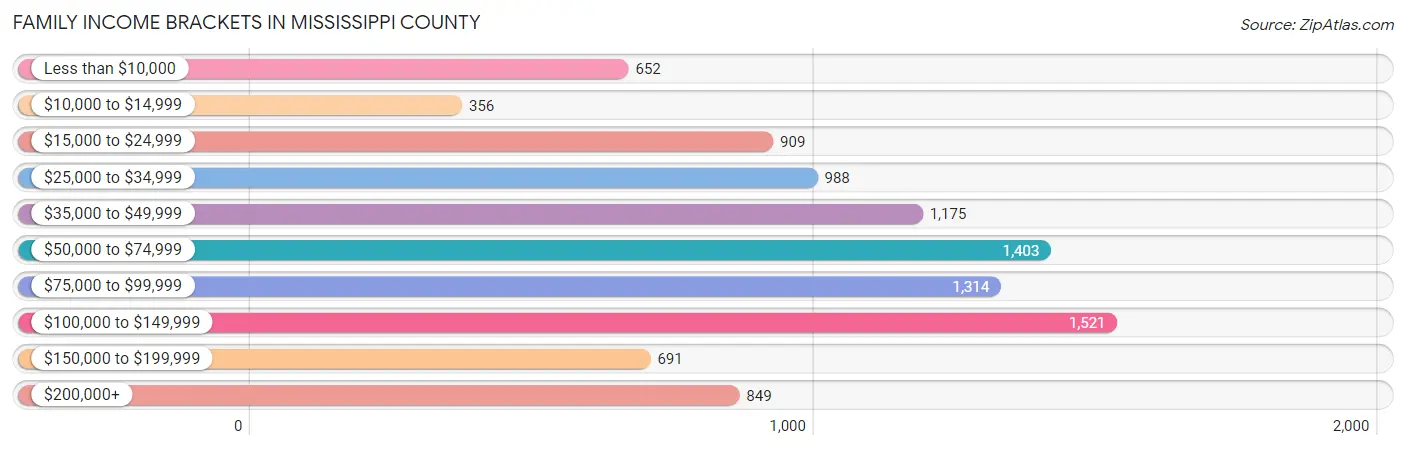
| Income Bracket | # Families | % Families |
| Less than $10,000 | 652 | 6.6% |
| $10,000 to $14,999 | 356 | 3.6% |
| $15,000 to $24,999 | 909 | 9.2% |
| $25,000 to $34,999 | 988 | 10.0% |
| $35,000 to $49,999 | 1,175 | 11.9% |
| $50,000 to $74,999 | 1,403 | 14.2% |
| $75,000 to $99,999 | 1,314 | 13.3% |
| $100,000 to $149,999 | 1,521 | 15.4% |
| $150,000 to $199,999 | 691 | 7.0% |
| $200,000+ | 849 | 8.6% |
Family Income by Famaliy Size in Mississippi County
4-person families (1,540 | 15.6%) account for the highest median family income in Mississippi County with $101,786 per family, while 2-person families (5,067 | 51.3%) have the highest median income of $26,291 per family member.
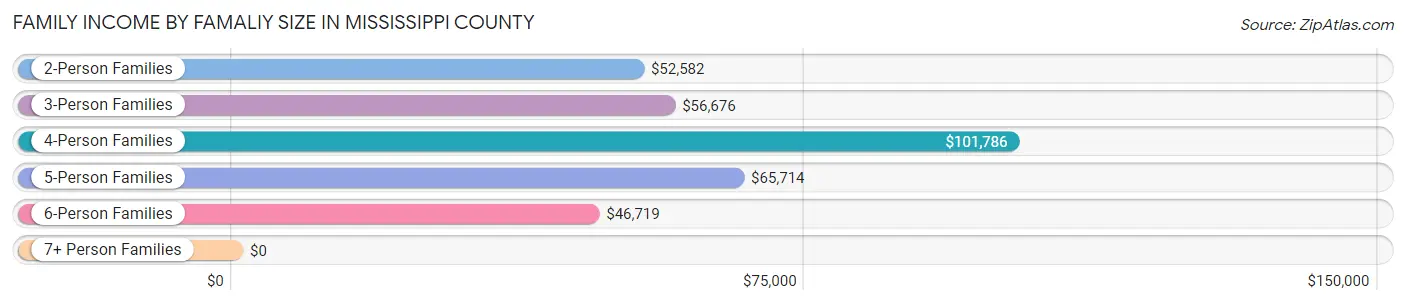
| Income Bracket | # Families | Median Income |
| 2-Person Families | 5,067 (51.3%) | $52,582 |
| 3-Person Families | 2,331 (23.6%) | $56,676 |
| 4-Person Families | 1,540 (15.6%) | $101,786 |
| 5-Person Families | 602 (6.1%) | $65,714 |
| 6-Person Families | 129 (1.3%) | $46,719 |
| 7+ Person Families | 208 (2.1%) | $0 |
| Total | 9,877 (100.0%) | $62,701 |
Family Income by Number of Earners in Mississippi County
The median family income in Mississippi County is $62,701, with families comprising 3+ earners (724) having the highest median family income of $159,118, while families with no earners (1,704) have the lowest median family income of $26,311, accounting for 7.3% and 17.2% of families, respectively.
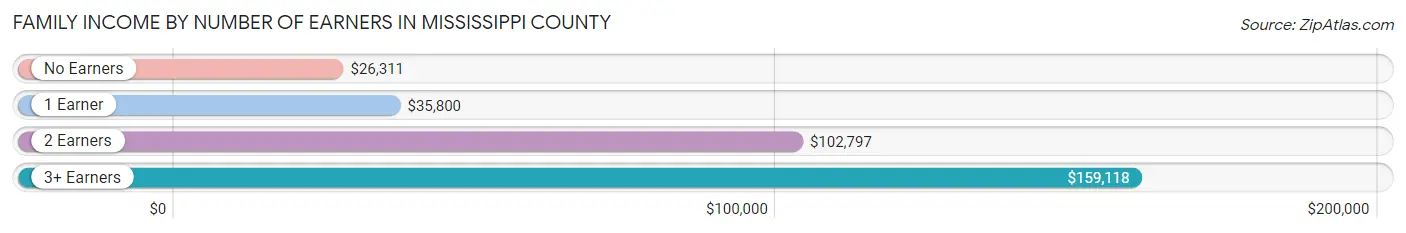
| Number of Earners | # Families | Median Income |
| No Earners | 1,704 (17.2%) | $26,311 |
| 1 Earner | 3,319 (33.6%) | $35,800 |
| 2 Earners | 4,130 (41.8%) | $102,797 |
| 3+ Earners | 724 (7.3%) | $159,118 |
| Total | 9,877 (100.0%) | $62,701 |
Household Income in Mississippi County
Household Income Brackets in Mississippi County
With 2,356 households falling in the category, the $50,000 to $74,999 income range is the most frequent in Mississippi County, accounting for 15.7% of all households. In contrast, only 885 households (5.9%) fall into the $200,000+ income bracket, making it the least populous group.
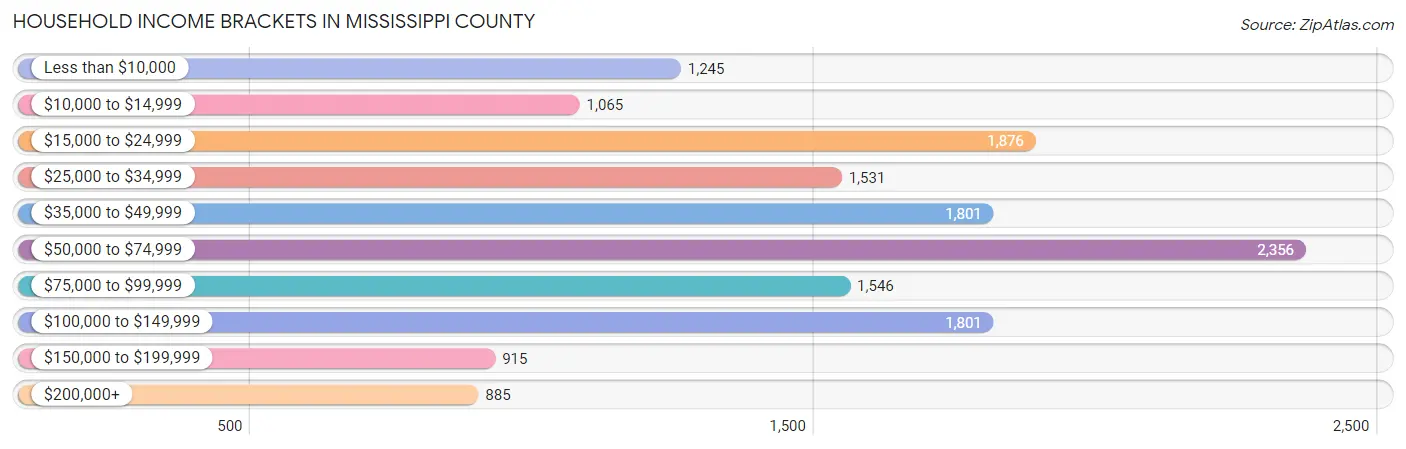
| Income Bracket | # Households | % Households |
| Less than $10,000 | 1,245 | 8.3% |
| $10,000 to $14,999 | 1,065 | 7.1% |
| $15,000 to $24,999 | 1,876 | 12.5% |
| $25,000 to $34,999 | 1,531 | 10.2% |
| $35,000 to $49,999 | 1,801 | 12.0% |
| $50,000 to $74,999 | 2,356 | 15.7% |
| $75,000 to $99,999 | 1,546 | 10.3% |
| $100,000 to $149,999 | 1,801 | 12.0% |
| $150,000 to $199,999 | 915 | 6.1% |
| $200,000+ | 885 | 5.9% |
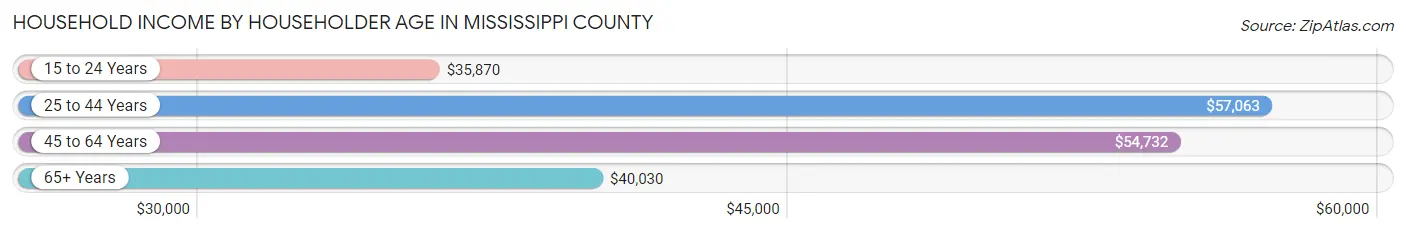
Household Income by Householder Age in Mississippi County
The median household income in Mississippi County is $50,012, with the highest median household income of $57,063 found in the 25 to 44 years age bracket for the primary householder. A total of 4,865 households (32.4%) fall into this category. Meanwhile, the 15 to 24 years age bracket for the primary householder has the lowest median household income of $35,870, with 824 households (5.5%) in this group.
| Income Bracket | # Households | Median Income |
| 15 to 24 Years | 824 (5.5%) | $35,870 |
| 25 to 44 Years | 4,865 (32.4%) | $57,063 |
| 45 to 64 Years | 5,591 (37.3%) | $54,732 |
| 65+ Years | 3,725 (24.8%) | $40,030 |
| Total | 15,005 (100.0%) | $50,012 |
Poverty in Mississippi County
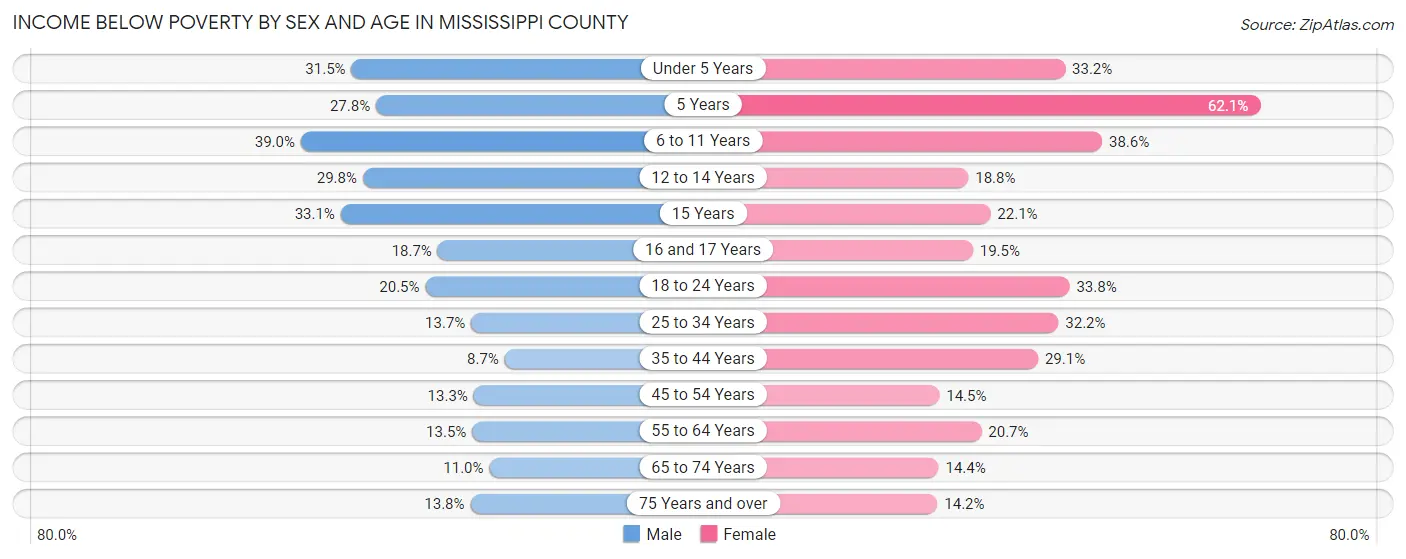
Income Below Poverty by Sex and Age in Mississippi County
With 18.3% poverty level for males and 25.2% for females among the residents of Mississippi County, 6 to 11 year old males and 5 year old females are the most vulnerable to poverty, with 597 males (39.0%) and 182 females (62.1%) in their respective age groups living below the poverty level.
| Age Bracket | Male | Female |
| Under 5 Years | 417 (31.5%) | 456 (33.2%) |
| 5 Years | 101 (27.8%) | 182 (62.1%) |
| 6 to 11 Years | 597 (39.0%) | 546 (38.6%) |
| 12 to 14 Years | 332 (29.8%) | 184 (18.8%) |
| 15 Years | 82 (33.1%) | 66 (22.1%) |
| 16 and 17 Years | 128 (18.7%) | 120 (19.5%) |
| 18 to 24 Years | 375 (20.5%) | 590 (33.8%) |
| 25 to 34 Years | 351 (13.7%) | 838 (32.2%) |
| 35 to 44 Years | 194 (8.7%) | 737 (29.1%) |
| 45 to 54 Years | 282 (13.3%) | 348 (14.5%) |
| 55 to 64 Years | 349 (13.5%) | 556 (20.7%) |
| 65 to 74 Years | 186 (11.0%) | 276 (14.4%) |
| 75 Years and over | 120 (13.8%) | 186 (14.2%) |
| Total | 3,514 (18.3%) | 5,085 (25.2%) |
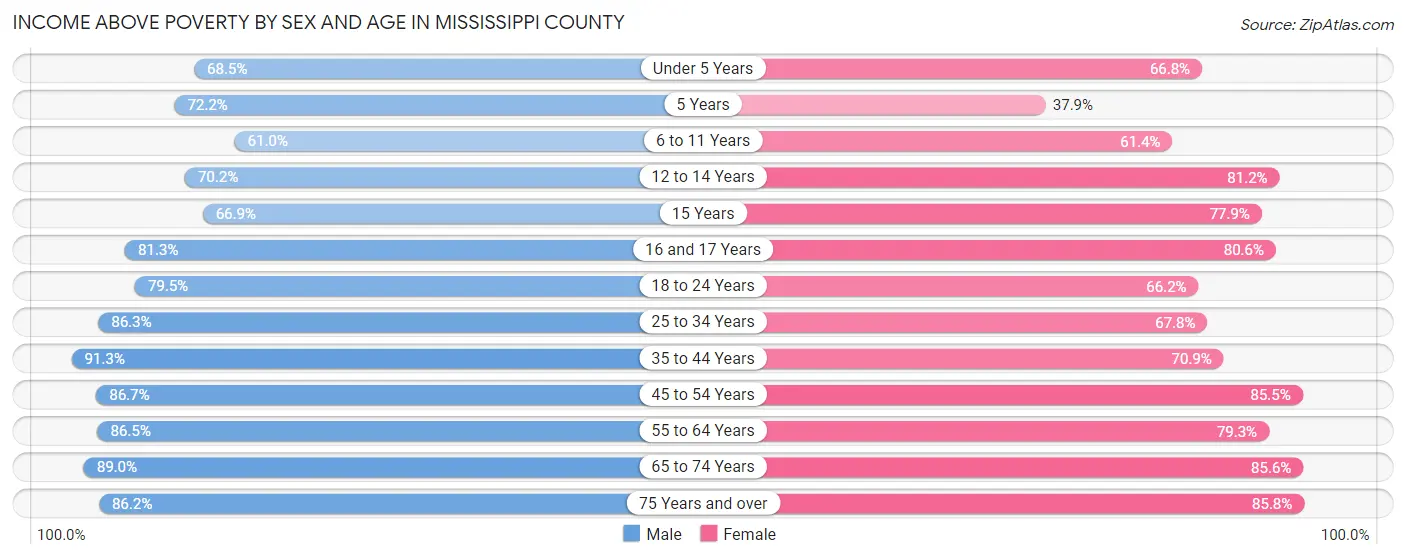
Income Above Poverty by Sex and Age in Mississippi County
According to the poverty statistics in Mississippi County, males aged 35 to 44 years and females aged 75 years and over are the age groups that are most secure financially, with 91.3% of males and 85.8% of females in these age groups living above the poverty line.
| Age Bracket | Male | Female |
| Under 5 Years | 908 (68.5%) | 919 (66.8%) |
| 5 Years | 262 (72.2%) | 111 (37.9%) |
| 6 to 11 Years | 934 (61.0%) | 867 (61.4%) |
| 12 to 14 Years | 783 (70.2%) | 796 (81.2%) |
| 15 Years | 166 (66.9%) | 233 (77.9%) |
| 16 and 17 Years | 558 (81.3%) | 497 (80.5%) |
| 18 to 24 Years | 1,455 (79.5%) | 1,155 (66.2%) |
| 25 to 34 Years | 2,212 (86.3%) | 1,768 (67.8%) |
| 35 to 44 Years | 2,033 (91.3%) | 1,793 (70.9%) |
| 45 to 54 Years | 1,835 (86.7%) | 2,055 (85.5%) |
| 55 to 64 Years | 2,229 (86.5%) | 2,128 (79.3%) |
| 65 to 74 Years | 1,507 (89.0%) | 1,645 (85.6%) |
| 75 Years and over | 749 (86.2%) | 1,125 (85.8%) |
| Total | 15,631 (81.7%) | 15,092 (74.8%) |
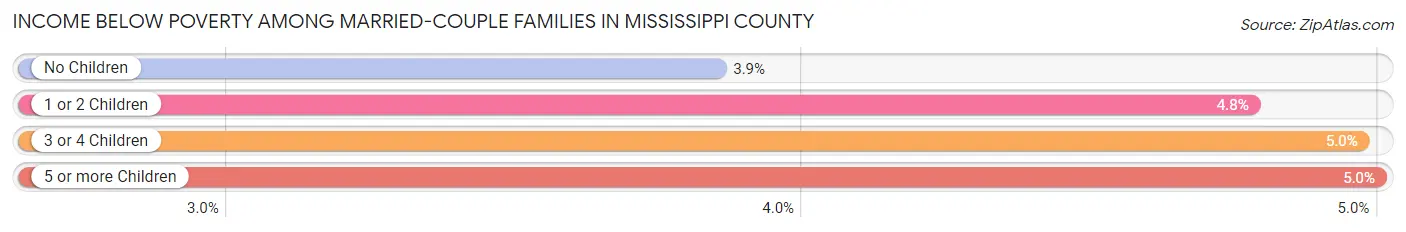
Income Below Poverty Among Married-Couple Families in Mississippi County
The poverty statistics for married-couple families in Mississippi County show that 4.2% or 261 of the total 6,195 families live below the poverty line. Families with 5 or more children have the highest poverty rate of 5.0%, comprising of 1 families. On the other hand, families with no children have the lowest poverty rate of 3.8%, which includes 148 families.
| Children | Above Poverty | Below Poverty |
| No Children | 3,700 (96.2%) | 148 (3.8%) |
| 1 or 2 Children | 1,794 (95.2%) | 90 (4.8%) |
| 3 or 4 Children | 421 (95.0%) | 22 (5.0%) |
| 5 or more Children | 19 (95.0%) | 1 (5.0%) |
| Total | 5,934 (95.8%) | 261 (4.2%) |
Income Below Poverty Among Single-Parent Households in Mississippi County
According to the poverty data in Mississippi County, 13.3% or 112 single-father households and 44.4% or 1,261 single-mother households are living below the poverty line. Among single-father households, those with 1 or 2 children have the highest poverty rate, with 73 households (21.3%) experiencing poverty. Likewise, among single-mother households, those with 5 or more children have the highest poverty rate, with 58 households (100.0%) falling below the poverty line.
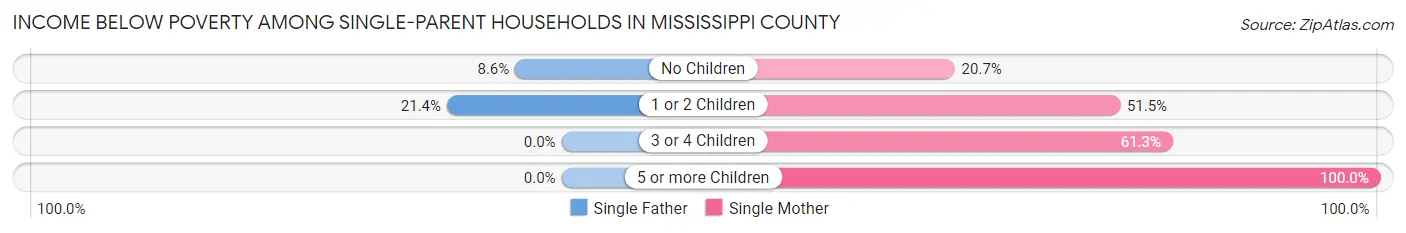
| Children | Single Father | Single Mother |
| No Children | 39 (8.6%) | 174 (20.7%) |
| 1 or 2 Children | 73 (21.3%) | 831 (51.5%) |
| 3 or 4 Children | 0 (0.0%) | 198 (61.3%) |
| 5 or more Children | 0 (0.0%) | 58 (100.0%) |
| Total | 112 (13.3%) | 1,261 (44.4%) |
Income Below Poverty Among Married-Couple vs Single-Parent Households in Mississippi County
The poverty data for Mississippi County shows that 261 of the married-couple family households (4.2%) and 1,373 of the single-parent households (37.3%) are living below the poverty level. Within the married-couple family households, those with 5 or more children have the highest poverty rate, with 1 households (5.0%) falling below the poverty line. Among the single-parent households, those with 3 or 4 children have the highest poverty rate, with 198 household (61.1%) living below poverty.
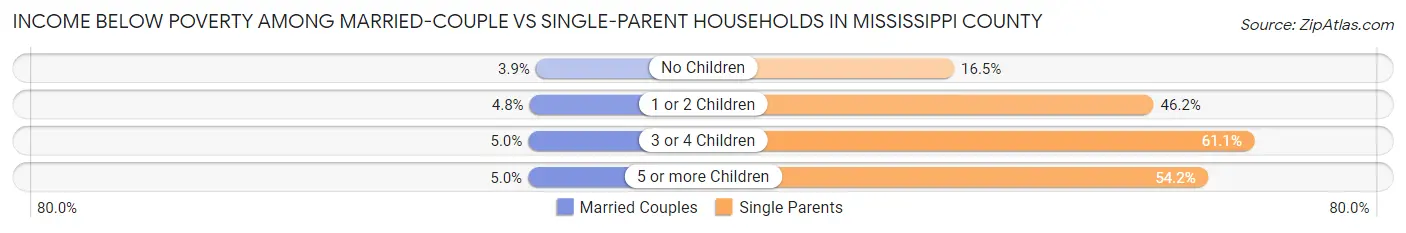
| Children | Married-Couple Families | Single-Parent Households |
| No Children | 148 (3.8%) | 213 (16.5%) |
| 1 or 2 Children | 90 (4.8%) | 904 (46.2%) |
| 3 or 4 Children | 22 (5.0%) | 198 (61.1%) |
| 5 or more Children | 1 (5.0%) | 58 (54.2%) |
| Total | 261 (4.2%) | 1,373 (37.3%) |
Race in Mississippi County
The most populous races in Mississippi County are White / Caucasian (23,530 | 58.3%), Black / African American (14,037 | 34.8%), and Two or more Races (1,981 | 4.9%).
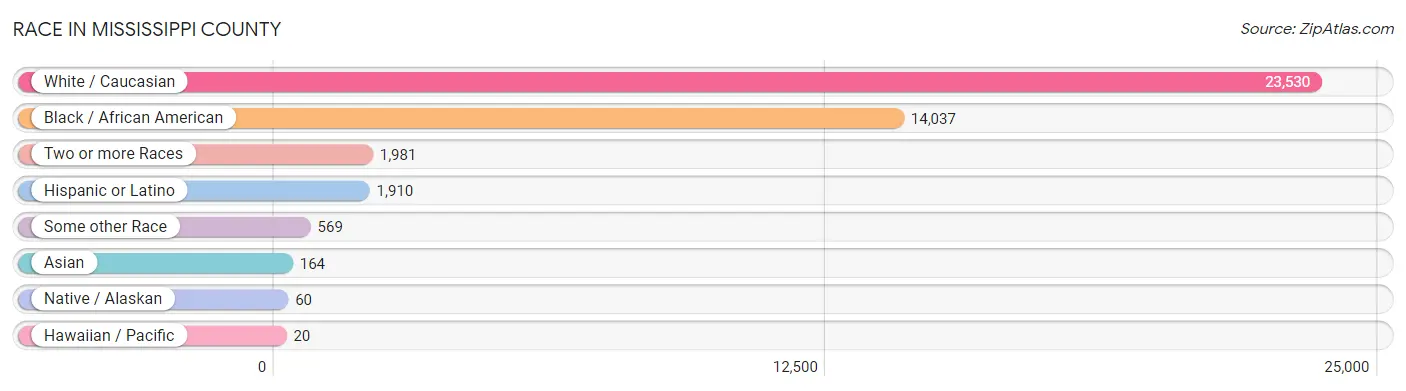
| Race | # Population | % Population |
| Asian | 164 | 0.4% |
| Black / African American | 14,037 | 34.8% |
| Hawaiian / Pacific | 20 | 0.1% |
| Hispanic or Latino | 1,910 | 4.7% |
| Native / Alaskan | 60 | 0.2% |
| White / Caucasian | 23,530 | 58.3% |
| Two or more Races | 1,981 | 4.9% |
| Some other Race | 569 | 1.4% |
| Total | 40,361 | 100.0% |
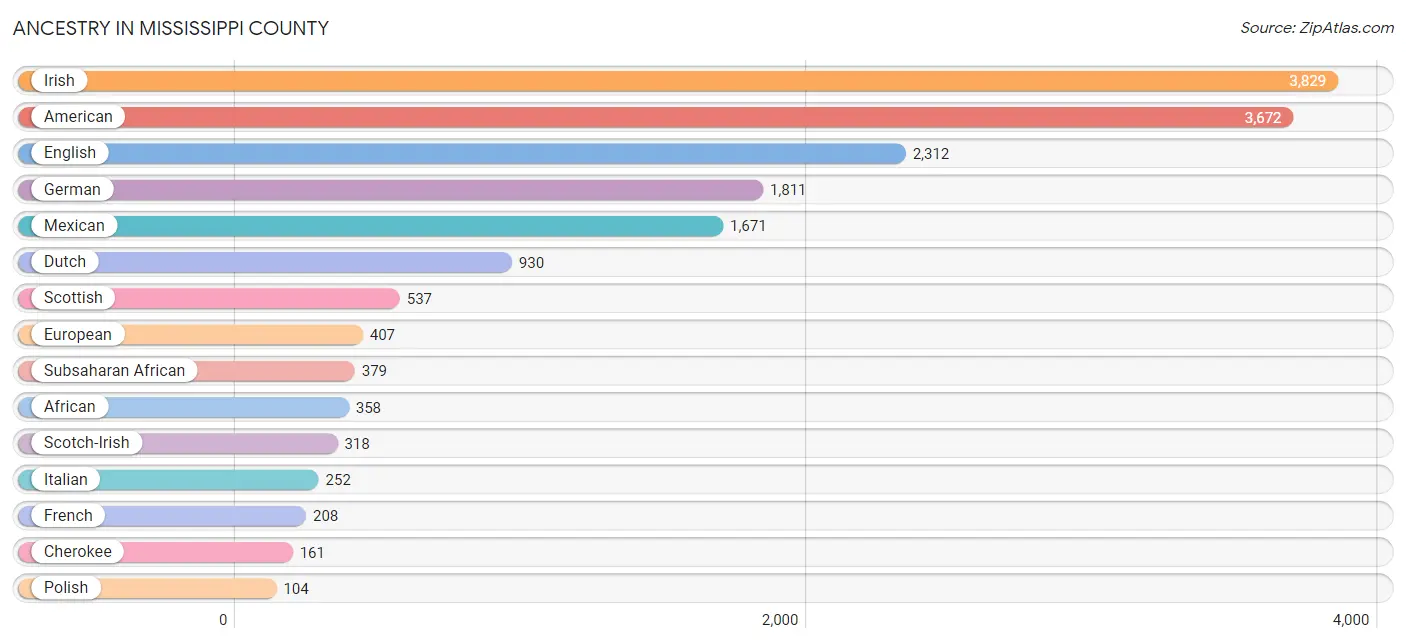
Ancestry in Mississippi County
The most populous ancestries reported in Mississippi County are Irish (3,829 | 9.5%), American (3,672 | 9.1%), English (2,312 | 5.7%), German (1,811 | 4.5%), and Mexican (1,671 | 4.1%), together accounting for 33.0% of all Mississippi County residents.
| Ancestry | # Population | % Population |
| African | 358 | 0.9% |
| American | 3,672 | 9.1% |
| Apache | 8 | 0.0% |
| Austrian | 19 | 0.1% |
| Basque | 13 | 0.0% |
| Bhutanese | 5 | 0.0% |
| Blackfeet | 51 | 0.1% |
| British | 69 | 0.2% |
| Cajun | 2 | 0.0% |
| Canadian | 4 | 0.0% |
| Celtic | 1 | 0.0% |
| Central American | 37 | 0.1% |
| Cherokee | 161 | 0.4% |
| Choctaw | 26 | 0.1% |
| Czech | 49 | 0.1% |
| Danish | 8 | 0.0% |
| Dutch | 930 | 2.3% |
| Eastern European | 5 | 0.0% |
| English | 2,312 | 5.7% |
| European | 407 | 1.0% |
| Fijian | 14 | 0.0% |
| French | 208 | 0.5% |
| French American Indian | 5 | 0.0% |
| French Canadian | 15 | 0.0% |
| German | 1,811 | 4.5% |
| Greek | 4 | 0.0% |
| Haitian | 8 | 0.0% |
| Honduran | 33 | 0.1% |
| Indian (Asian) | 44 | 0.1% |
| Inupiat | 9 | 0.0% |
| Irish | 3,829 | 9.5% |
| Italian | 252 | 0.6% |
| Japanese | 101 | 0.3% |
| Korean | 7 | 0.0% |
| Lithuanian | 1 | 0.0% |
| Mexican | 1,671 | 4.1% |
| Mexican American Indian | 44 | 0.1% |
| Navajo | 80 | 0.2% |
| Norwegian | 9 | 0.0% |
| Osage | 3 | 0.0% |
| Panamanian | 4 | 0.0% |
| Peruvian | 13 | 0.0% |
| Polish | 104 | 0.3% |
| Portuguese | 29 | 0.1% |
| Puerto Rican | 11 | 0.0% |
| Russian | 17 | 0.0% |
| Samoan | 20 | 0.1% |
| Scandinavian | 54 | 0.1% |
| Scotch-Irish | 318 | 0.8% |
| Scottish | 537 | 1.3% |
| South African | 21 | 0.1% |
| South American | 35 | 0.1% |
| Spaniard | 6 | 0.0% |
| Spanish | 95 | 0.2% |
| Sri Lankan | 32 | 0.1% |
| Subsaharan African | 379 | 0.9% |
| Swedish | 70 | 0.2% |
| Swiss | 10 | 0.0% |
| Thai | 103 | 0.3% |
| Venezuelan | 22 | 0.1% |
| Welsh | 95 | 0.2% | View All 61 Rows |
Immigrants in Mississippi County
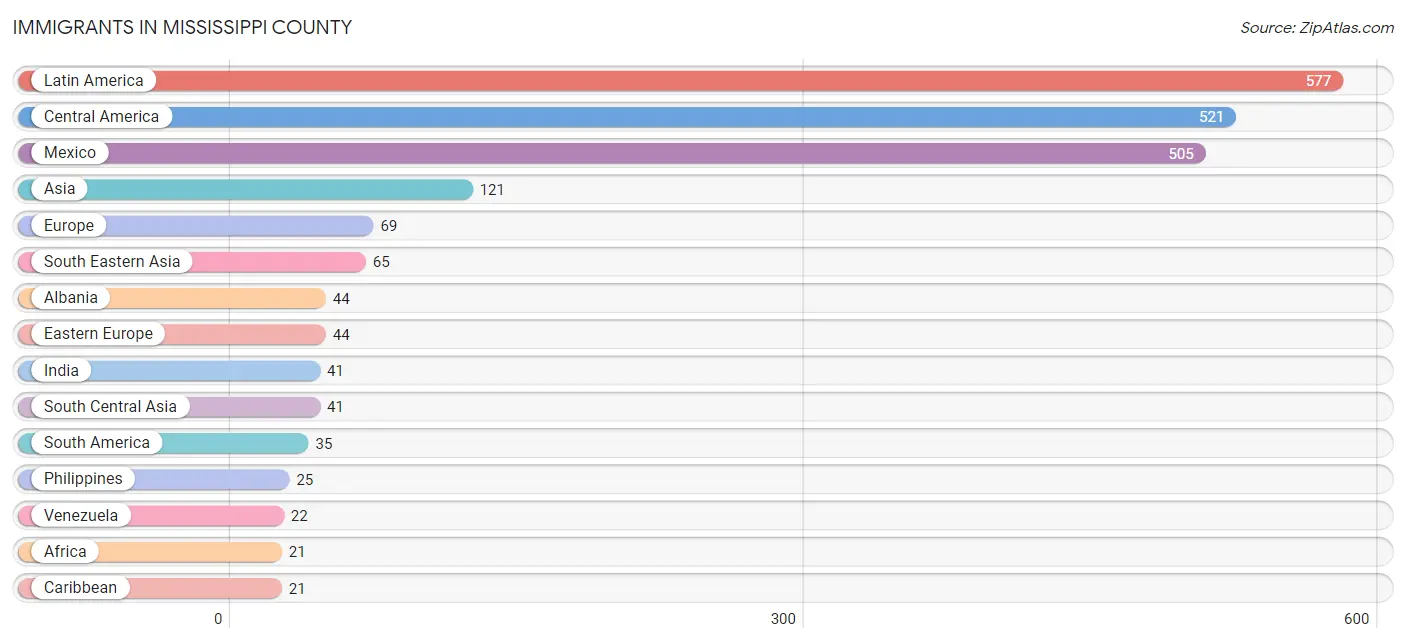
The most numerous immigrant groups reported in Mississippi County came from Latin America (577 | 1.4%), Central America (521 | 1.3%), Mexico (505 | 1.3%), Asia (121 | 0.3%), and Europe (69 | 0.2%), together accounting for 4.4% of all Mississippi County residents.
| Immigration Origin | # Population | % Population |
| Africa | 21 | 0.1% |
| Albania | 44 | 0.1% |
| Asia | 121 | 0.3% |
| Cambodia | 14 | 0.0% |
| Caribbean | 21 | 0.1% |
| Central America | 521 | 1.3% |
| Eastern Asia | 15 | 0.0% |
| Eastern Europe | 44 | 0.1% |
| England | 17 | 0.0% |
| Europe | 69 | 0.2% |
| Germany | 2 | 0.0% |
| Honduras | 16 | 0.0% |
| India | 41 | 0.1% |
| Indonesia | 11 | 0.0% |
| Ireland | 2 | 0.0% |
| Jamaica | 21 | 0.1% |
| Japan | 6 | 0.0% |
| Korea | 9 | 0.0% |
| Latin America | 577 | 1.4% |
| Mexico | 505 | 1.3% |
| Northern Europe | 19 | 0.1% |
| Peru | 13 | 0.0% |
| Philippines | 25 | 0.1% |
| South Africa | 21 | 0.1% |
| South America | 35 | 0.1% |
| South Central Asia | 41 | 0.1% |
| South Eastern Asia | 65 | 0.2% |
| Southern Europe | 4 | 0.0% |
| Spain | 4 | 0.0% |
| Venezuela | 22 | 0.1% |
| Vietnam | 15 | 0.0% |
| Western Europe | 2 | 0.0% | View All 32 Rows |
Sex and Age in Mississippi County
Sex and Age in Mississippi County
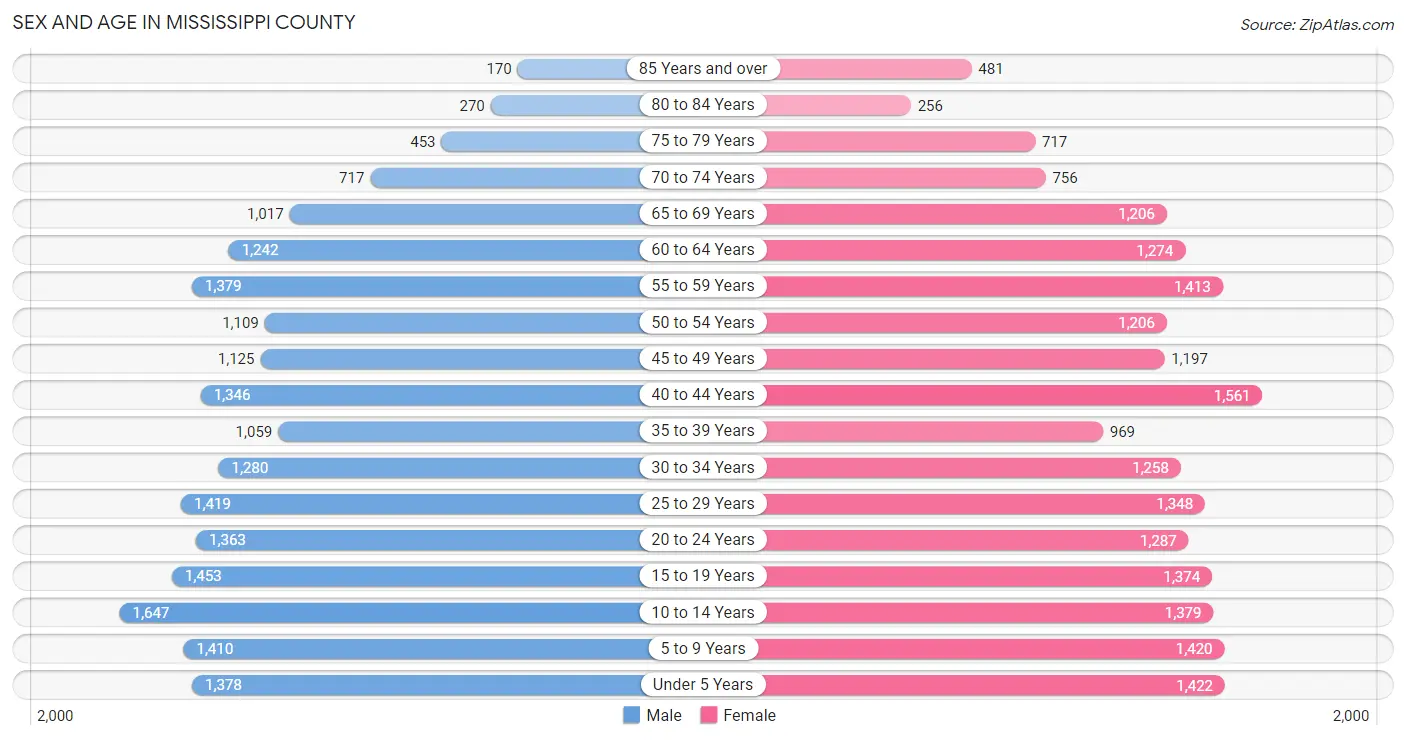
The most populous age groups in Mississippi County are 10 to 14 Years (1,647 | 8.3%) for men and 40 to 44 Years (1,561 | 7.6%) for women.
| Age Bracket | Male | Female |
| Under 5 Years | 1,378 (7.0%) | 1,422 (6.9%) |
| 5 to 9 Years | 1,410 (7.1%) | 1,420 (6.9%) |
| 10 to 14 Years | 1,647 (8.3%) | 1,379 (6.7%) |
| 15 to 19 Years | 1,453 (7.3%) | 1,374 (6.7%) |
| 20 to 24 Years | 1,363 (6.9%) | 1,287 (6.3%) |
| 25 to 29 Years | 1,419 (7.1%) | 1,348 (6.6%) |
| 30 to 34 Years | 1,280 (6.5%) | 1,258 (6.1%) |
| 35 to 39 Years | 1,059 (5.3%) | 969 (4.7%) |
| 40 to 44 Years | 1,346 (6.8%) | 1,561 (7.6%) |
| 45 to 49 Years | 1,125 (5.7%) | 1,197 (5.8%) |
| 50 to 54 Years | 1,109 (5.6%) | 1,206 (5.9%) |
| 55 to 59 Years | 1,379 (7.0%) | 1,413 (6.9%) |
| 60 to 64 Years | 1,242 (6.3%) | 1,274 (6.2%) |
| 65 to 69 Years | 1,017 (5.1%) | 1,206 (5.9%) |
| 70 to 74 Years | 717 (3.6%) | 756 (3.7%) |
| 75 to 79 Years | 453 (2.3%) | 717 (3.5%) |
| 80 to 84 Years | 270 (1.4%) | 256 (1.3%) |
| 85 Years and over | 170 (0.9%) | 481 (2.3%) |
| Total | 19,837 (100.0%) | 20,524 (100.0%) |
Families and Households in Mississippi County
Median Family Size in Mississippi County
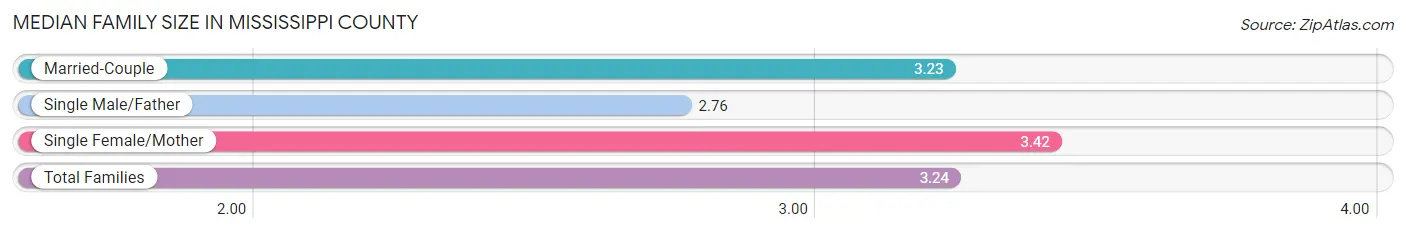
The median family size in Mississippi County is 3.24 persons per family, with single female/mother families (2,838 | 28.7%) accounting for the largest median family size of 3.42 persons per family. On the other hand, single male/father families (844 | 8.6%) represent the smallest median family size with 2.76 persons per family.
| Family Type | # Families | Family Size |
| Married-Couple | 6,195 (62.7%) | 3.23 |
| Single Male/Father | 844 (8.6%) | 2.76 |
| Single Female/Mother | 2,838 (28.7%) | 3.42 |
| Total Families | 9,877 (100.0%) | 3.24 |
Median Household Size in Mississippi County
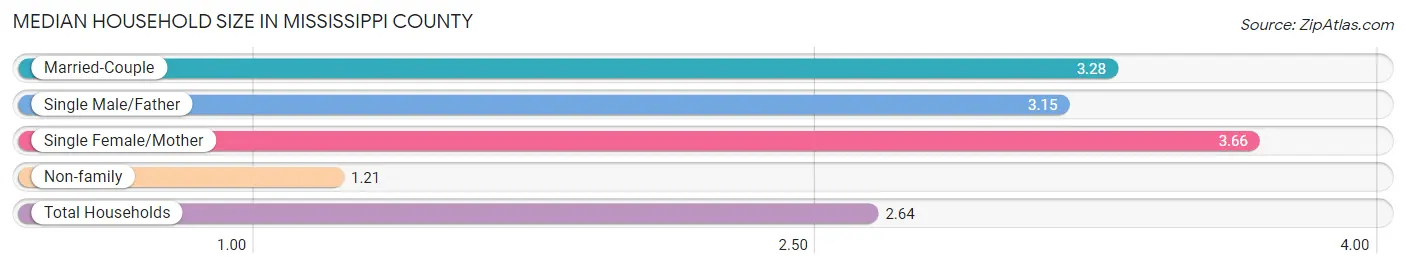
The median household size in Mississippi County is 2.64 persons per household, with single female/mother households (2,838 | 18.9%) accounting for the largest median household size of 3.66 persons per household. non-family households (5,128 | 34.2%) represent the smallest median household size with 1.21 persons per household.
| Household Type | # Households | Household Size |
| Married-Couple | 6,195 (41.3%) | 3.28 |
| Single Male/Father | 844 (5.6%) | 3.15 |
| Single Female/Mother | 2,838 (18.9%) | 3.66 |
| Non-family | 5,128 (34.2%) | 1.21 |
| Total Households | 15,005 (100.0%) | 2.64 |
Household Size by Marriage Status in Mississippi County
Out of a total of 15,005 households in Mississippi County, 9,877 (65.8%) are family households, while 5,128 (34.2%) are nonfamily households. The most numerous type of family households are 2-person households, comprising 4,516, and the most common type of nonfamily households are 1-person households, comprising 4,439.
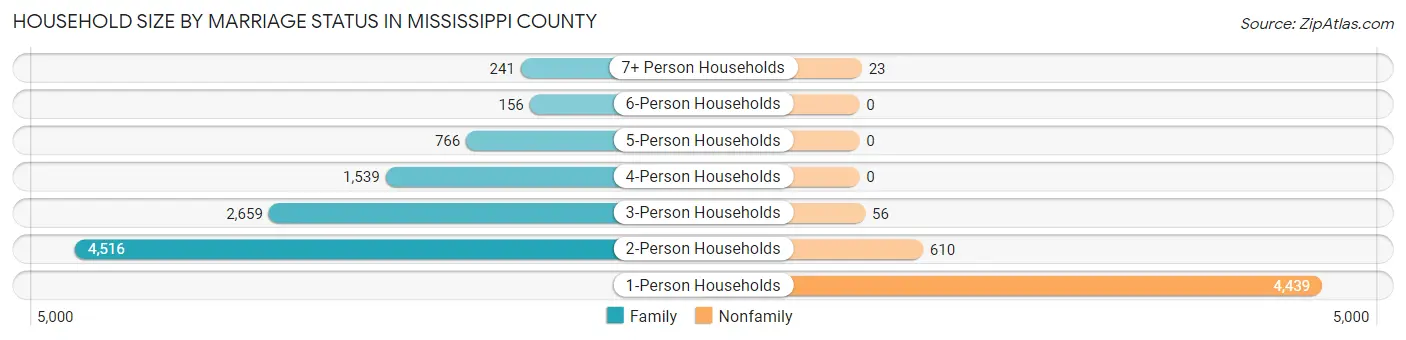
| Household Size | Family Households | Nonfamily Households |
| 1-Person Households | - | 4,439 (29.6%) |
| 2-Person Households | 4,516 (30.1%) | 610 (4.1%) |
| 3-Person Households | 2,659 (17.7%) | 56 (0.4%) |
| 4-Person Households | 1,539 (10.3%) | 0 (0.0%) |
| 5-Person Households | 766 (5.1%) | 0 (0.0%) |
| 6-Person Households | 156 (1.0%) | 0 (0.0%) |
| 7+ Person Households | 241 (1.6%) | 23 (0.2%) |
| Total | 9,877 (65.8%) | 5,128 (34.2%) |
Female Fertility in Mississippi County
Fertility by Age in Mississippi County
Average fertility rate in Mississippi County is 66.0 births per 1,000 women. Women in the age bracket of 20 to 34 years have the highest fertility rate with 129.0 births per 1,000 women. Women in the age bracket of 20 to 34 years acount for 82.5% of all women with births.
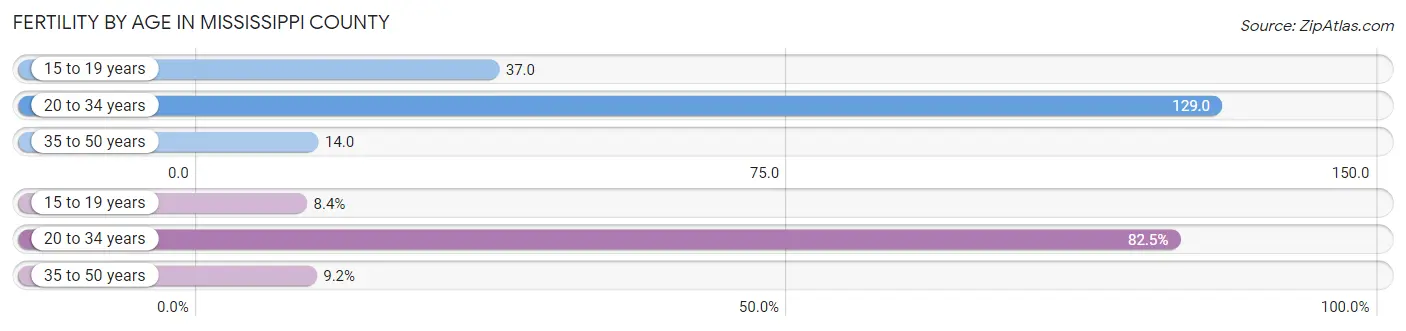
| Age Bracket | Women with Births | Births / 1,000 Women |
| 15 to 19 years | 51 (8.4%) | 37.0 |
| 20 to 34 years | 503 (82.5%) | 129.0 |
| 35 to 50 years | 56 (9.2%) | 14.0 |
| Total | 610 (100.0%) | 66.0 |
Fertility by Age by Marriage Status in Mississippi County
35.9% of women with births (610) in Mississippi County are married. The highest percentage of unmarried women with births falls into 35 to 50 years age bracket with 98.2% of them unmarried at the time of birth, while the lowest percentage of unmarried women with births belong to 20 to 34 years age bracket with 58.9% of them unmarried.
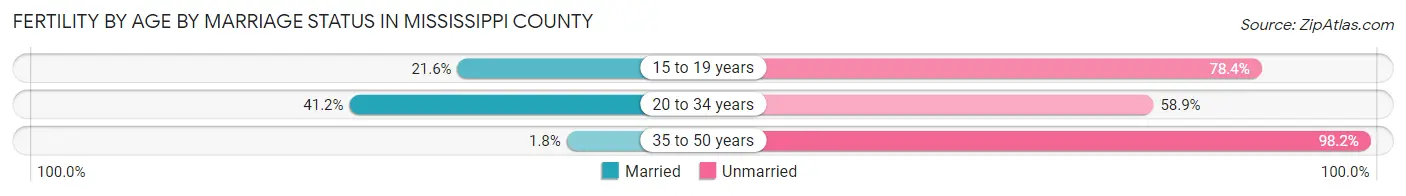
| Age Bracket | Married | Unmarried |
| 15 to 19 years | 11 (21.6%) | 40 (78.4%) |
| 20 to 34 years | 207 (41.1%) | 296 (58.9%) |
| 35 to 50 years | 1 (1.8%) | 55 (98.2%) |
| Total | 219 (35.9%) | 391 (64.1%) |
Fertility by Education in Mississippi County
Average fertility rate in Mississippi County is 66.0 births per 1,000 women. Women with the education attainment of graduate degree have the highest fertility rate of 156.0 births per 1,000 women, while women with the education attainment of less than high school have the lowest fertility at 12.0 births per 1,000 women. Women with the education attainment of college or associate's degree represent 41.3% of all women with births.
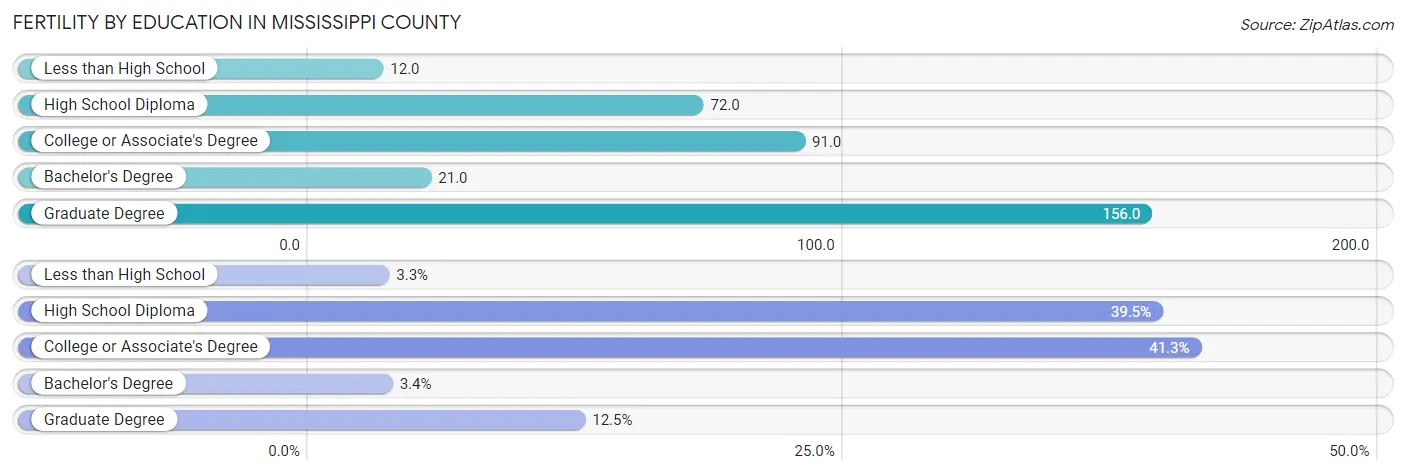
| Educational Attainment | Women with Births | Births / 1,000 Women |
| Less than High School | 20 (3.3%) | 12.0 |
| High School Diploma | 241 (39.5%) | 72.0 |
| College or Associate's Degree | 252 (41.3%) | 91.0 |
| Bachelor's Degree | 21 (3.4%) | 21.0 |
| Graduate Degree | 76 (12.5%) | 156.0 |
| Total | 610 (100.0%) | 66.0 |
Fertility by Education by Marriage Status in Mississippi County
64.1% of women with births in Mississippi County are unmarried. Women with the educational attainment of bachelor's degree are most likely to be married with 100.0% of them married at childbirth, while women with the educational attainment of high school diploma are least likely to be married with 86.7% of them unmarried at childbirth.
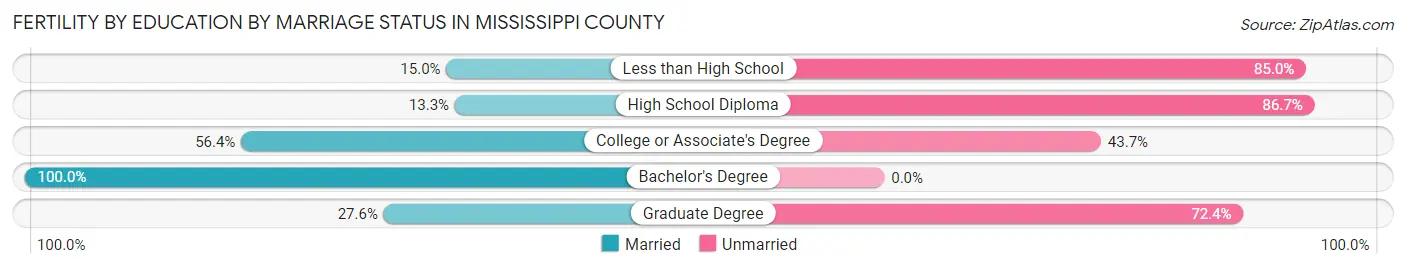
| Educational Attainment | Married | Unmarried |
| Less than High School | 3 (15.0%) | 17 (85.0%) |
| High School Diploma | 32 (13.3%) | 209 (86.7%) |
| College or Associate's Degree | 142 (56.4%) | 110 (43.6%) |
| Bachelor's Degree | 21 (100.0%) | 0 (0.0%) |
| Graduate Degree | 21 (27.6%) | 55 (72.4%) |
| Total | 219 (35.9%) | 391 (64.1%) |
Employment Characteristics in Mississippi County
Employment by Class of Employer in Mississippi County
Among the 16,253 employed individuals in Mississippi County, private company employees (11,453 | 70.5%), local government employees (1,545 | 9.5%), and state government employees (885 | 5.4%) make up the most common classes of employment.
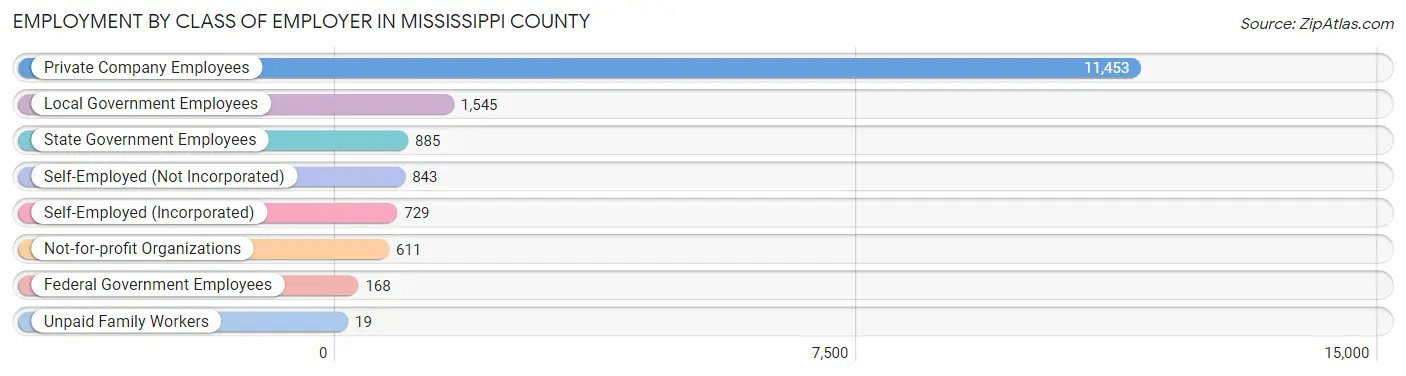
| Employer Class | # Employees | % Employees |
| Private Company Employees | 11,453 | 70.5% |
| Self-Employed (Incorporated) | 729 | 4.5% |
| Self-Employed (Not Incorporated) | 843 | 5.2% |
| Not-for-profit Organizations | 611 | 3.8% |
| Local Government Employees | 1,545 | 9.5% |
| State Government Employees | 885 | 5.4% |
| Federal Government Employees | 168 | 1.0% |
| Unpaid Family Workers | 19 | 0.1% |
| Total | 16,253 | 100.0% |
Employment Status by Age in Mississippi County
According to the labor force statistics for Mississippi County, out of the total population over 16 years of age (31,158), 60.4% or 18,819 individuals are in the labor force, with 9.8% or 1,844 of them unemployed. The age group with the highest labor force participation rate is 30 to 34 years, with 83.8% or 2,127 individuals in the labor force. Within the labor force, the 16 to 19 years age range has the highest percentage of unemployed individuals, with 39.9% or 439 of them being unemployed.
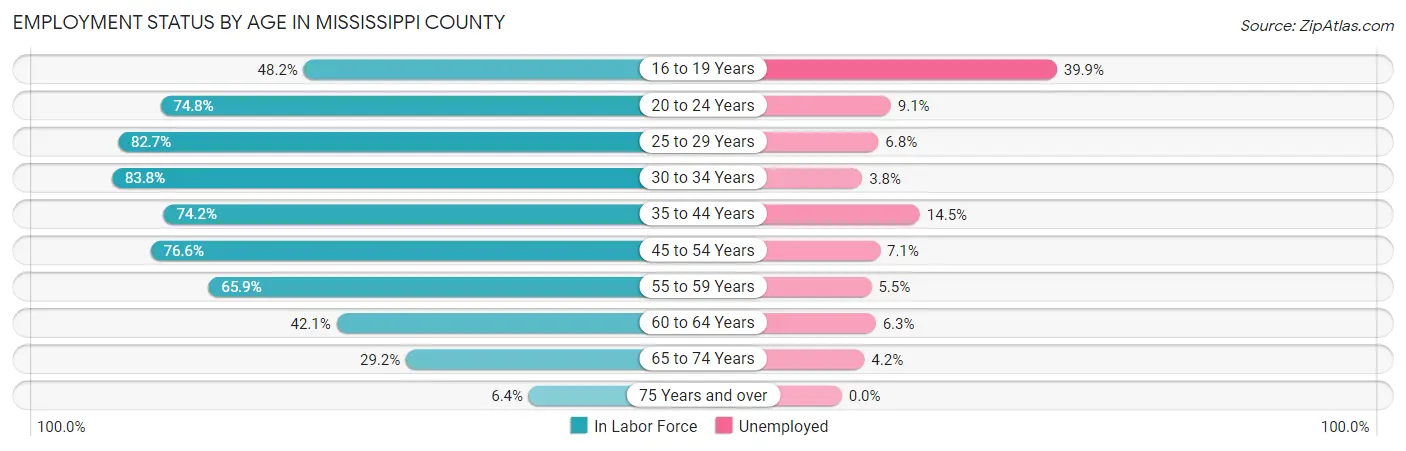
| Age Bracket | In Labor Force | Unemployed |
| 16 to 19 Years | 1,099 (48.2%) | 439 (39.9%) |
| 20 to 24 Years | 1,982 (74.8%) | 180 (9.1%) |
| 25 to 29 Years | 2,288 (82.7%) | 156 (6.8%) |
| 30 to 34 Years | 2,127 (83.8%) | 81 (3.8%) |
| 35 to 44 Years | 3,662 (74.2%) | 531 (14.5%) |
| 45 to 54 Years | 3,552 (76.6%) | 252 (7.1%) |
| 55 to 59 Years | 1,840 (65.9%) | 101 (5.5%) |
| 60 to 64 Years | 1,059 (42.1%) | 67 (6.3%) |
| 65 to 74 Years | 1,079 (29.2%) | 45 (4.2%) |
| 75 Years and over | 150 (6.4%) | 0 (0.0%) |
| Total | 18,819 (60.4%) | 1,844 (9.8%) |
Employment Status by Educational Attainment in Mississippi County
According to labor force statistics for Mississippi County, 72.0% of individuals (14,533) out of the total population between 25 and 64 years of age (20,185) are in the labor force, with 8.2% or 1,192 of them being unemployed. The group with the highest labor force participation rate are those with the educational attainment of bachelor's degree or higher, with 91.3% or 2,724 individuals in the labor force. Within the labor force, individuals with high school diploma education have the highest percentage of unemployment, with 12.4% or 720 of them being unemployed.
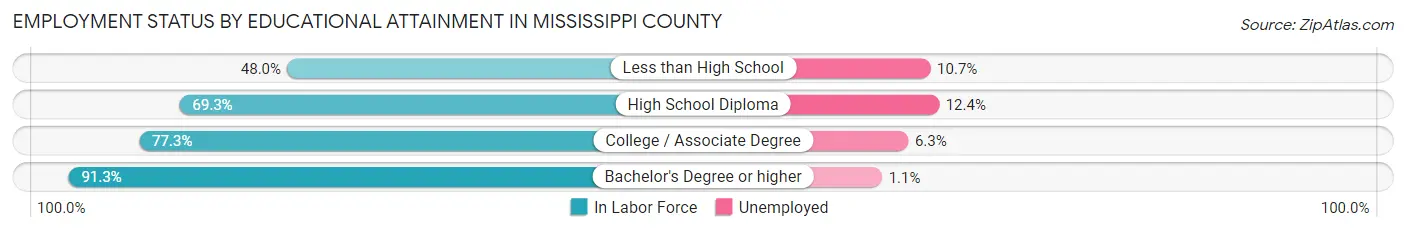
| Educational Attainment | In Labor Force | Unemployed |
| Less than High School | 1,352 (48.0%) | 301 (10.7%) |
| High School Diploma | 5,803 (69.3%) | 1,038 (12.4%) |
| College / Associate Degree | 4,647 (77.3%) | 379 (6.3%) |
| Bachelor's Degree or higher | 2,724 (91.3%) | 33 (1.1%) |
| Total | 14,533 (72.0%) | 1,655 (8.2%) |
Employment Occupations by Sex in Mississippi County
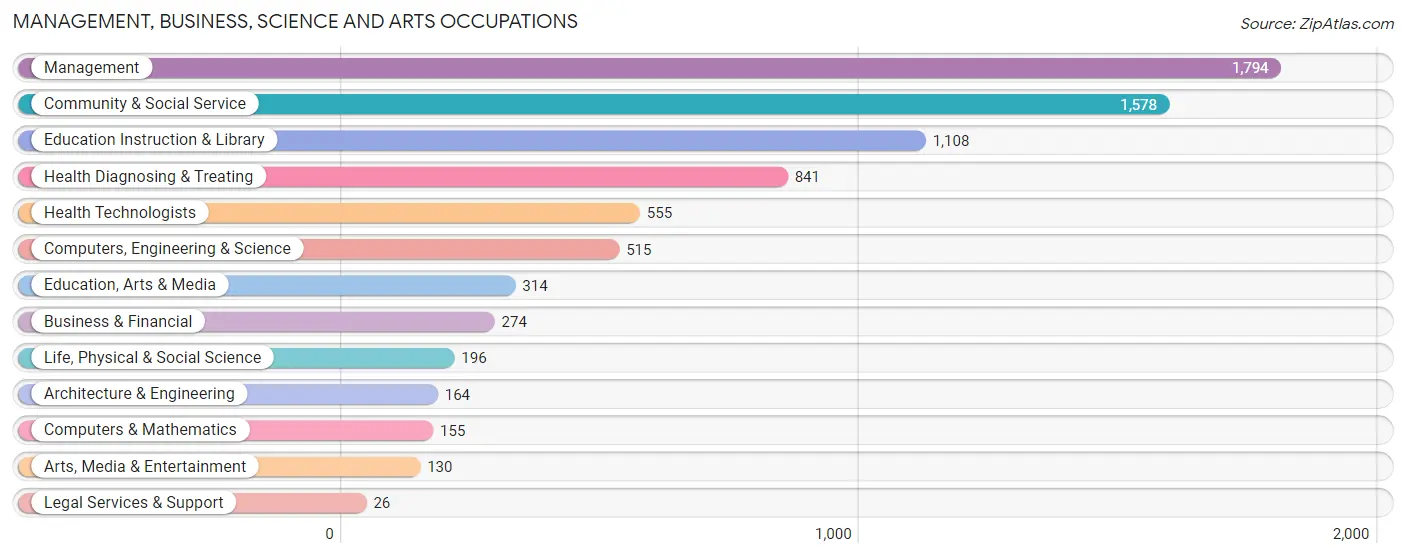
Management, Business, Science and Arts Occupations
The most common Management, Business, Science and Arts occupations in Mississippi County are Management (1,794 | 10.6%), Community & Social Service (1,578 | 9.3%), Education Instruction & Library (1,108 | 6.5%), Health Diagnosing & Treating (841 | 5.0%), and Health Technologists (555 | 3.3%).
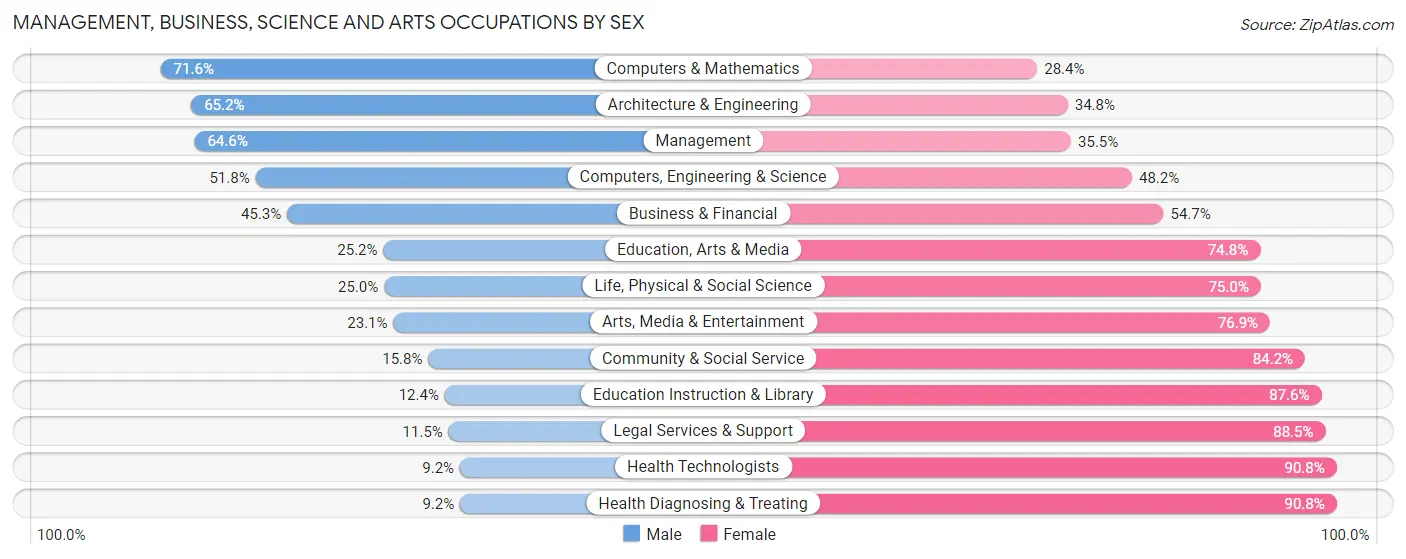
Management, Business, Science and Arts Occupations by Sex
Within the Management, Business, Science and Arts occupations in Mississippi County, the most male-oriented occupations are Computers & Mathematics (71.6%), Architecture & Engineering (65.2%), and Management (64.5%), while the most female-oriented occupations are Health Diagnosing & Treating (90.8%), Health Technologists (90.8%), and Legal Services & Support (88.5%).
| Occupation | Male | Female |
| Management | 1,158 (64.5%) | 636 (35.4%) |
| Business & Financial | 124 (45.3%) | 150 (54.7%) |
| Computers, Engineering & Science | 267 (51.8%) | 248 (48.2%) |
| Computers & Mathematics | 111 (71.6%) | 44 (28.4%) |
| Architecture & Engineering | 107 (65.2%) | 57 (34.8%) |
| Life, Physical & Social Science | 49 (25.0%) | 147 (75.0%) |
| Community & Social Service | 249 (15.8%) | 1,329 (84.2%) |
| Education, Arts & Media | 79 (25.2%) | 235 (74.8%) |
| Legal Services & Support | 3 (11.5%) | 23 (88.5%) |
| Education Instruction & Library | 137 (12.4%) | 971 (87.6%) |
| Arts, Media & Entertainment | 30 (23.1%) | 100 (76.9%) |
| Health Diagnosing & Treating | 77 (9.2%) | 764 (90.8%) |
| Health Technologists | 51 (9.2%) | 504 (90.8%) |
| Total (Category) | 1,875 (37.5%) | 3,127 (62.5%) |
| Total (Overall) | 8,888 (52.4%) | 8,077 (47.6%) |
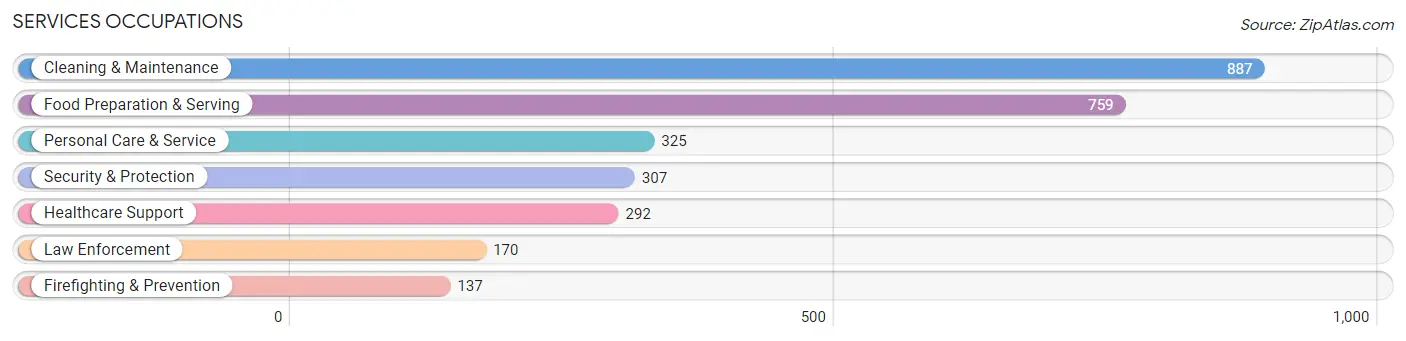
Services Occupations
The most common Services occupations in Mississippi County are Cleaning & Maintenance (887 | 5.2%), Food Preparation & Serving (759 | 4.5%), Personal Care & Service (325 | 1.9%), Security & Protection (307 | 1.8%), and Healthcare Support (292 | 1.7%).
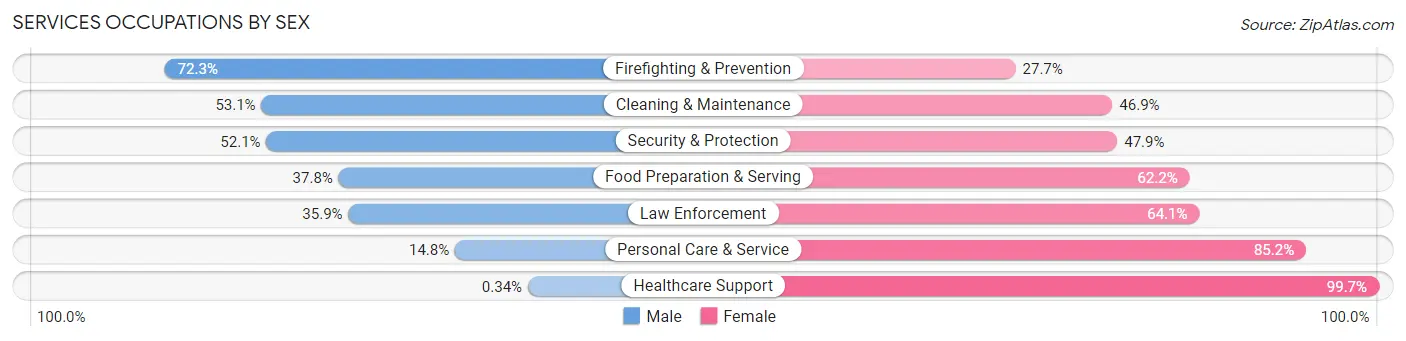
Services Occupations by Sex
Within the Services occupations in Mississippi County, the most male-oriented occupations are Firefighting & Prevention (72.3%), Cleaning & Maintenance (53.1%), and Security & Protection (52.1%), while the most female-oriented occupations are Healthcare Support (99.7%), Personal Care & Service (85.2%), and Law Enforcement (64.1%).
| Occupation | Male | Female |
| Healthcare Support | 1 (0.3%) | 291 (99.7%) |
| Security & Protection | 160 (52.1%) | 147 (47.9%) |
| Firefighting & Prevention | 99 (72.3%) | 38 (27.7%) |
| Law Enforcement | 61 (35.9%) | 109 (64.1%) |
| Food Preparation & Serving | 287 (37.8%) | 472 (62.2%) |
| Cleaning & Maintenance | 471 (53.1%) | 416 (46.9%) |
| Personal Care & Service | 48 (14.8%) | 277 (85.2%) |
| Total (Category) | 967 (37.6%) | 1,603 (62.4%) |
| Total (Overall) | 8,888 (52.4%) | 8,077 (47.6%) |
Sales and Office Occupations
The most common Sales and Office occupations in Mississippi County are Office & Administration (1,472 | 8.7%), and Sales & Related (1,414 | 8.3%).
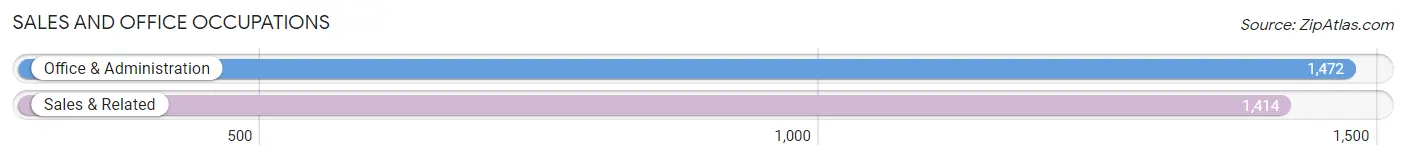
Sales and Office Occupations by Sex
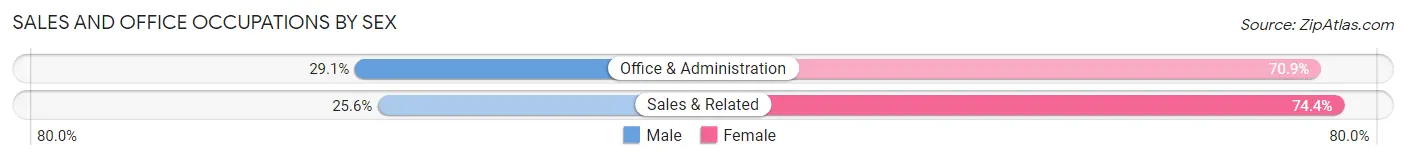
| Occupation | Male | Female |
| Sales & Related | 362 (25.6%) | 1,052 (74.4%) |
| Office & Administration | 429 (29.1%) | 1,043 (70.9%) |
| Total (Category) | 791 (27.4%) | 2,095 (72.6%) |
| Total (Overall) | 8,888 (52.4%) | 8,077 (47.6%) |
Natural Resources, Construction and Maintenance Occupations
The most common Natural Resources, Construction and Maintenance occupations in Mississippi County are Construction & Extraction (798 | 4.7%), Installation, Maintenance & Repair (664 | 3.9%), and Farming, Fishing & Forestry (546 | 3.2%).
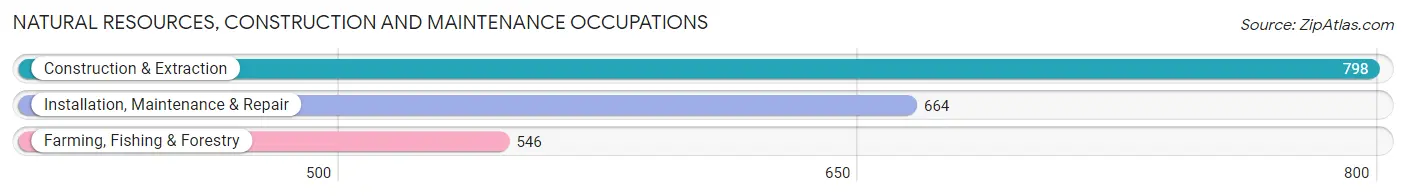
Natural Resources, Construction and Maintenance Occupations by Sex
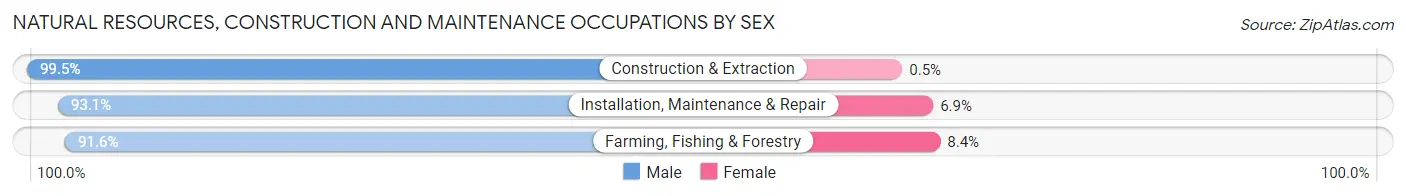
| Occupation | Male | Female |
| Farming, Fishing & Forestry | 500 (91.6%) | 46 (8.4%) |
| Construction & Extraction | 794 (99.5%) | 4 (0.5%) |
| Installation, Maintenance & Repair | 618 (93.1%) | 46 (6.9%) |
| Total (Category) | 1,912 (95.2%) | 96 (4.8%) |
| Total (Overall) | 8,888 (52.4%) | 8,077 (47.6%) |
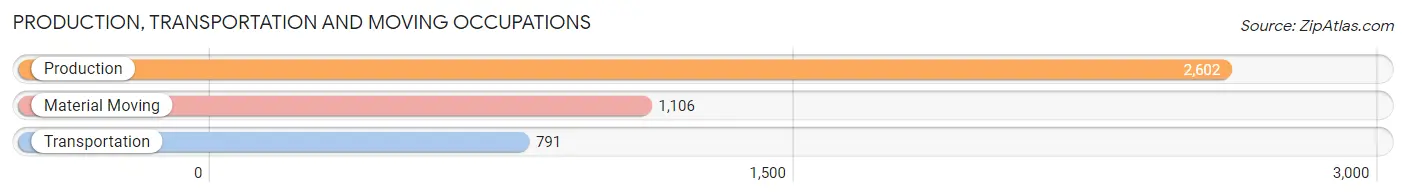
Production, Transportation and Moving Occupations
The most common Production, Transportation and Moving occupations in Mississippi County are Production (2,602 | 15.3%), Material Moving (1,106 | 6.5%), and Transportation (791 | 4.7%).
Production, Transportation and Moving Occupations by Sex
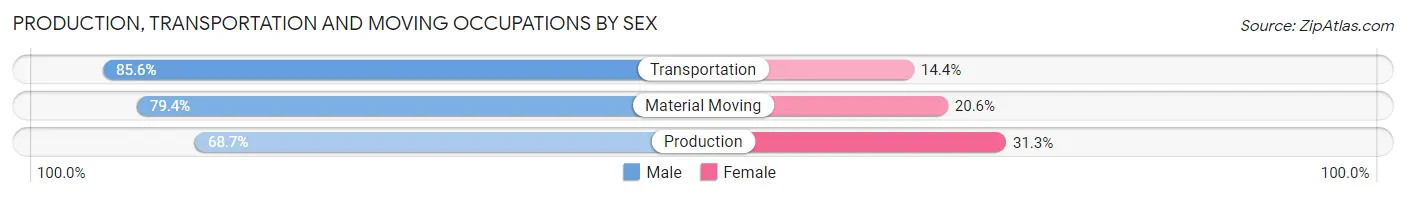
| Occupation | Male | Female |
| Production | 1,788 (68.7%) | 814 (31.3%) |
| Transportation | 677 (85.6%) | 114 (14.4%) |
| Material Moving | 878 (79.4%) | 228 (20.6%) |
| Total (Category) | 3,343 (74.3%) | 1,156 (25.7%) |
| Total (Overall) | 8,888 (52.4%) | 8,077 (47.6%) |
Employment Industries by Sex in Mississippi County
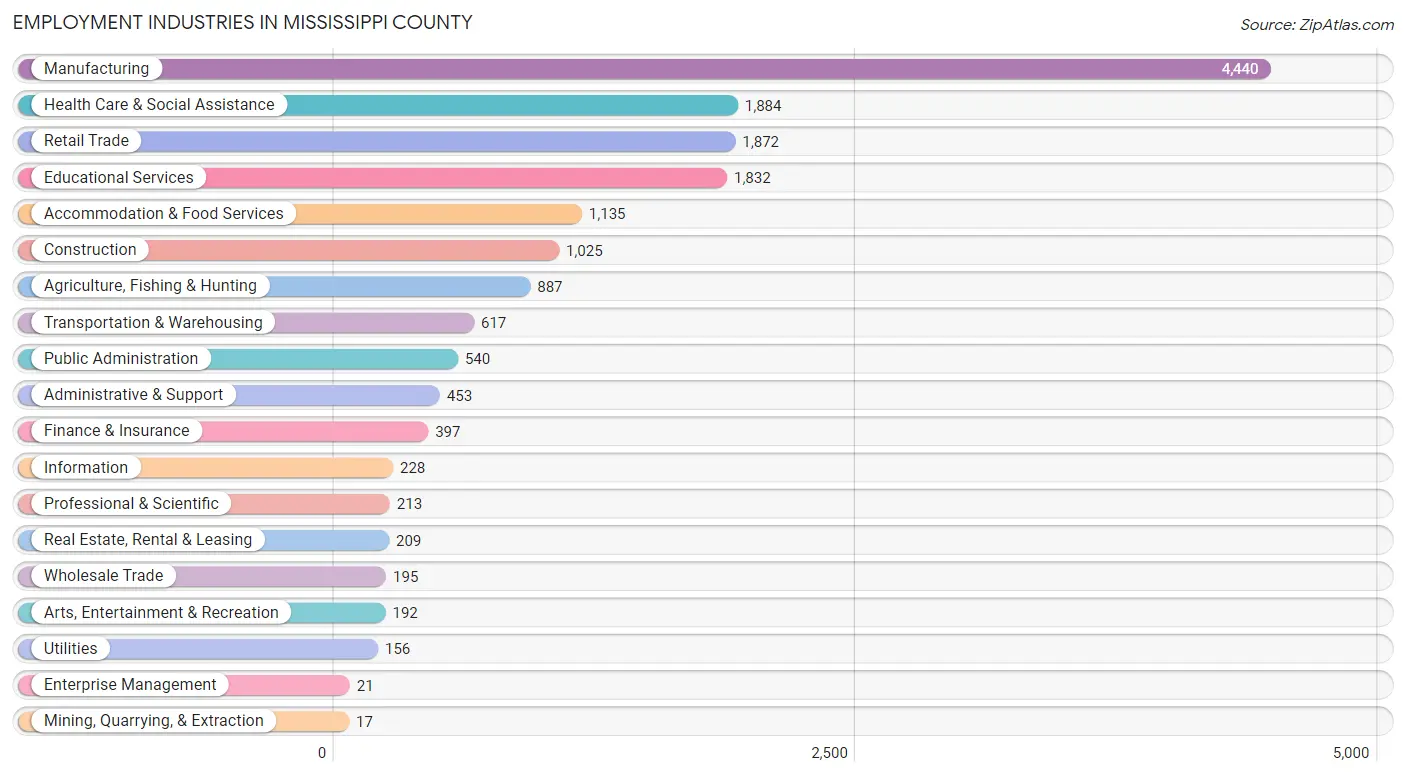
Employment Industries in Mississippi County
The major employment industries in Mississippi County include Manufacturing (4,440 | 26.2%), Health Care & Social Assistance (1,884 | 11.1%), Retail Trade (1,872 | 11.0%), Educational Services (1,832 | 10.8%), and Accommodation & Food Services (1,135 | 6.7%).
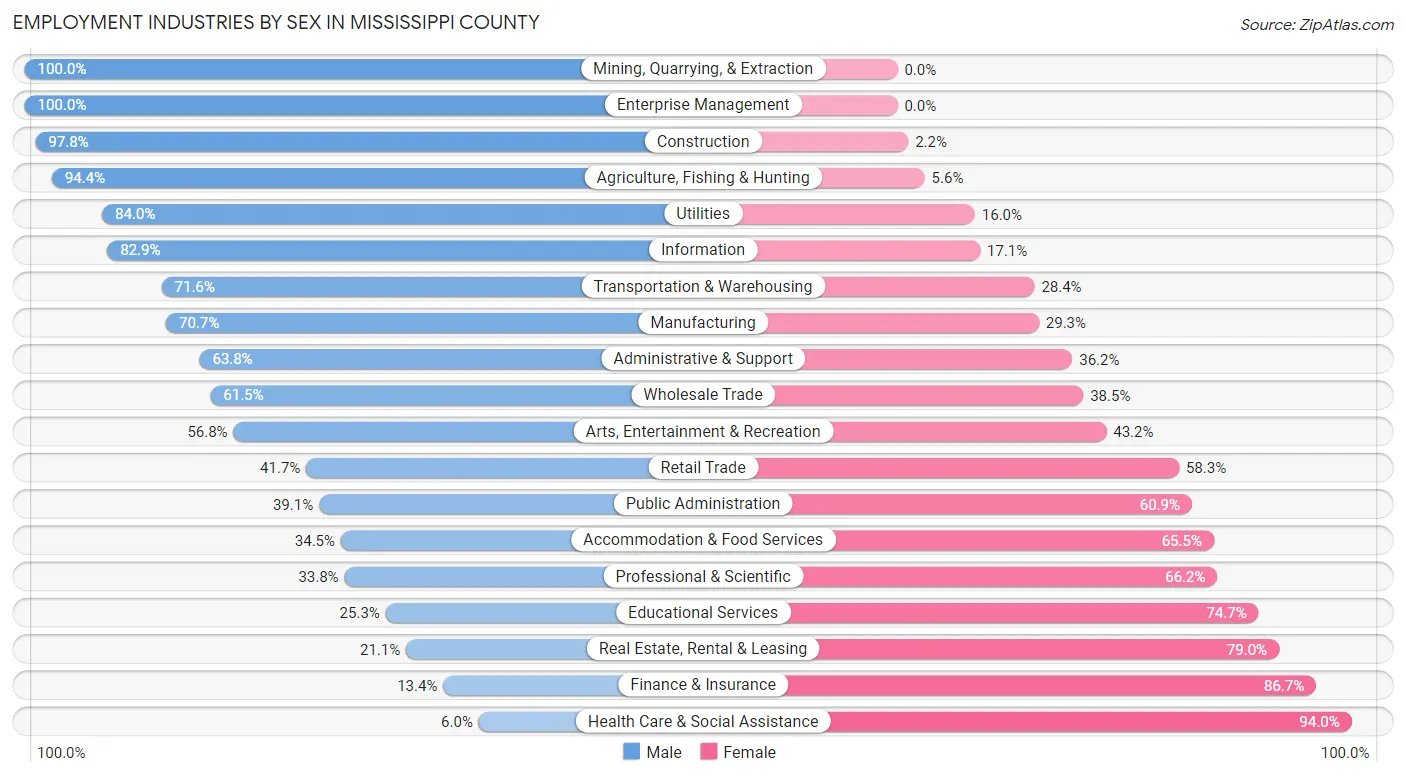
Employment Industries by Sex in Mississippi County
The Mississippi County industries that see more men than women are Mining, Quarrying, & Extraction (100.0%), Enterprise Management (100.0%), and Construction (97.8%), whereas the industries that tend to have a higher number of women are Health Care & Social Assistance (94.0%), Finance & Insurance (86.7%), and Real Estate, Rental & Leasing (78.9%).
| Industry | Male | Female |
| Agriculture, Fishing & Hunting | 837 (94.4%) | 50 (5.6%) |
| Mining, Quarrying, & Extraction | 17 (100.0%) | 0 (0.0%) |
| Construction | 1,002 (97.8%) | 23 (2.2%) |
| Manufacturing | 3,140 (70.7%) | 1,300 (29.3%) |
| Wholesale Trade | 120 (61.5%) | 75 (38.5%) |
| Retail Trade | 781 (41.7%) | 1,091 (58.3%) |
| Transportation & Warehousing | 442 (71.6%) | 175 (28.4%) |
| Utilities | 131 (84.0%) | 25 (16.0%) |
| Information | 189 (82.9%) | 39 (17.1%) |
| Finance & Insurance | 53 (13.4%) | 344 (86.7%) |
| Real Estate, Rental & Leasing | 44 (21.0%) | 165 (78.9%) |
| Professional & Scientific | 72 (33.8%) | 141 (66.2%) |
| Enterprise Management | 21 (100.0%) | 0 (0.0%) |
| Administrative & Support | 289 (63.8%) | 164 (36.2%) |
| Educational Services | 463 (25.3%) | 1,369 (74.7%) |
| Health Care & Social Assistance | 113 (6.0%) | 1,771 (94.0%) |
| Arts, Entertainment & Recreation | 109 (56.8%) | 83 (43.2%) |
| Accommodation & Food Services | 392 (34.5%) | 743 (65.5%) |
| Public Administration | 211 (39.1%) | 329 (60.9%) |
| Total | 8,888 (52.4%) | 8,077 (47.6%) |
Education in Mississippi County
School Enrollment in Mississippi County
The most common levels of schooling among the 10,112 students in Mississippi County are high school (2,419 | 23.9%), middle school (2,279 | 22.5%), and elementary school (2,184 | 21.6%).
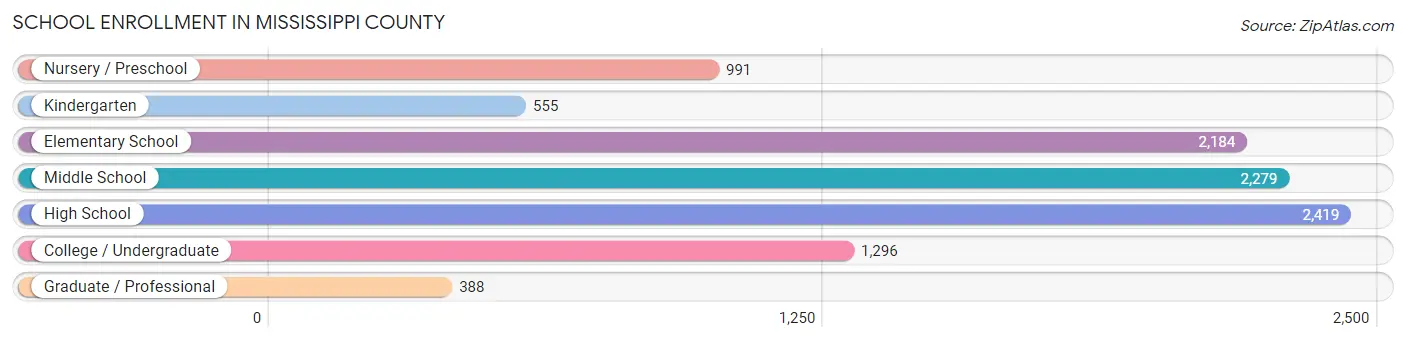
| School Level | # Students | % Students |
| Nursery / Preschool | 991 | 9.8% |
| Kindergarten | 555 | 5.5% |
| Elementary School | 2,184 | 21.6% |
| Middle School | 2,279 | 22.5% |
| High School | 2,419 | 23.9% |
| College / Undergraduate | 1,296 | 12.8% |
| Graduate / Professional | 388 | 3.8% |
| Total | 10,112 | 100.0% |
School Enrollment by Age by Funding Source in Mississippi County
Out of a total of 10,112 students who are enrolled in schools in Mississippi County, 637 (6.3%) attend a private institution, while the remaining 9,475 (93.7%) are enrolled in public schools. The age group of 25 to 34 year olds has the highest likelihood of being enrolled in private schools, with 141 (30.1% in the age bracket) enrolled. Conversely, the age group of 20 to 24 year olds has the lowest likelihood of being enrolled in a private school, with 409 (98.6% in the age bracket) attending a public institution.
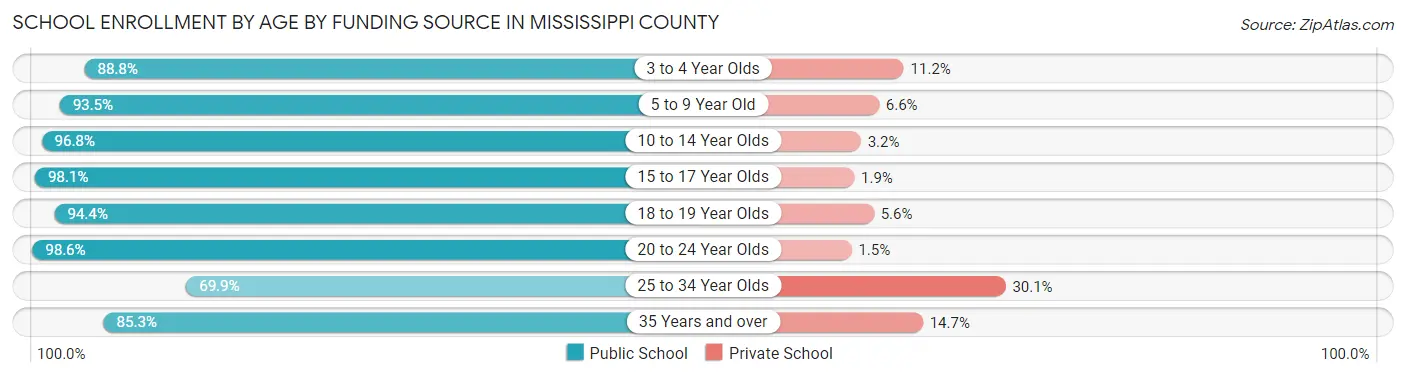
| Age Bracket | Public School | Private School |
| 3 to 4 Year Olds | 533 (88.8%) | 67 (11.2%) |
| 5 to 9 Year Old | 2,539 (93.4%) | 178 (6.6%) |
| 10 to 14 Year Olds | 2,872 (96.8%) | 94 (3.2%) |
| 15 to 17 Year Olds | 1,718 (98.1%) | 34 (1.9%) |
| 18 to 19 Year Olds | 608 (94.4%) | 36 (5.6%) |
| 20 to 24 Year Olds | 409 (98.6%) | 6 (1.5%) |
| 25 to 34 Year Olds | 327 (69.9%) | 141 (30.1%) |
| 35 Years and over | 469 (85.3%) | 81 (14.7%) |
| Total | 9,475 (93.7%) | 637 (6.3%) |
Educational Attainment by Field of Study in Mississippi County
Education (1,344 | 33.0%), business (675 | 16.6%), science & technology (487 | 12.0%), bio, nature & agricultural (294 | 7.2%), and arts & humanities (233 | 5.7%) are the most common fields of study among 4,073 individuals in Mississippi County who have obtained a bachelor's degree or higher.
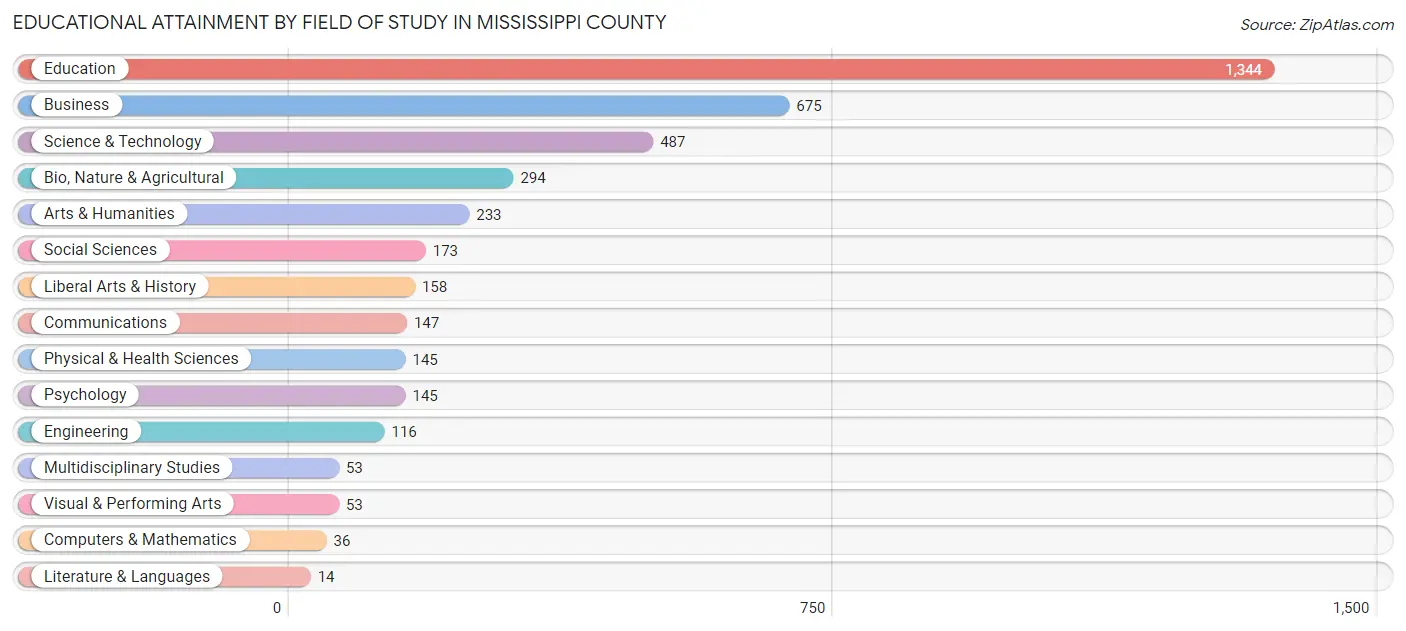
| Field of Study | # Graduates | % Graduates |
| Computers & Mathematics | 36 | 0.9% |
| Bio, Nature & Agricultural | 294 | 7.2% |
| Physical & Health Sciences | 145 | 3.6% |
| Psychology | 145 | 3.6% |
| Social Sciences | 173 | 4.3% |
| Engineering | 116 | 2.9% |
| Multidisciplinary Studies | 53 | 1.3% |
| Science & Technology | 487 | 12.0% |
| Business | 675 | 16.6% |
| Education | 1,344 | 33.0% |
| Literature & Languages | 14 | 0.3% |
| Liberal Arts & History | 158 | 3.9% |
| Visual & Performing Arts | 53 | 1.3% |
| Communications | 147 | 3.6% |
| Arts & Humanities | 233 | 5.7% |
| Total | 4,073 | 100.0% |
Transportation & Commute in Mississippi County
Vehicle Availability by Sex in Mississippi County
The most prevalent vehicle ownership categories in Mississippi County are males with 2 vehicles (3,090, accounting for 36.2%) and females with 2 vehicles (2,539, making up 40.2%).
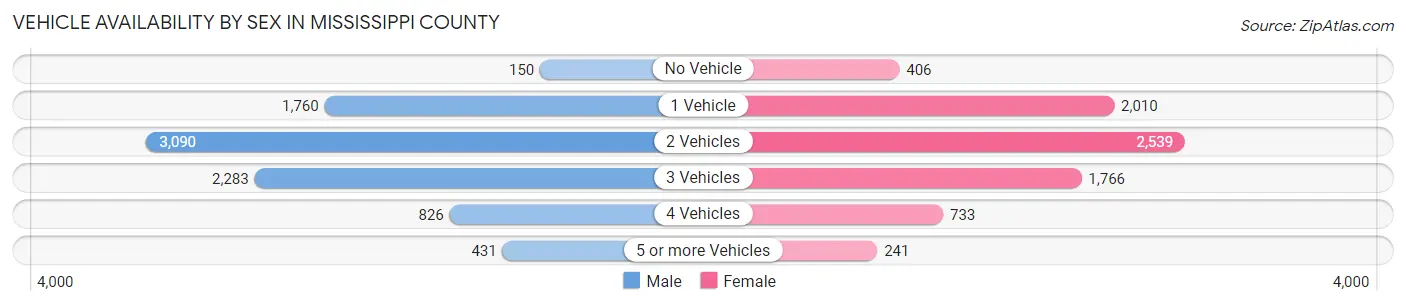
| Vehicles Available | Male | Female |
| No Vehicle | 150 (1.8%) | 406 (5.3%) |
| 1 Vehicle | 1,760 (20.6%) | 2,010 (26.1%) |
| 2 Vehicles | 3,090 (36.2%) | 2,539 (33.0%) |
| 3 Vehicles | 2,283 (26.7%) | 1,766 (23.0%) |
| 4 Vehicles | 826 (9.7%) | 733 (9.5%) |
| 5 or more Vehicles | 431 (5.1%) | 241 (3.1%) |
| Total | 8,540 (100.0%) | 7,695 (100.0%) |
Commute Time in Mississippi County
The most frequently occuring commute durations in Mississippi County are 5 to 9 minutes (3,387 commuters, 21.3%), 10 to 14 minutes (2,707 commuters, 17.0%), and 15 to 19 minutes (2,592 commuters, 16.3%).
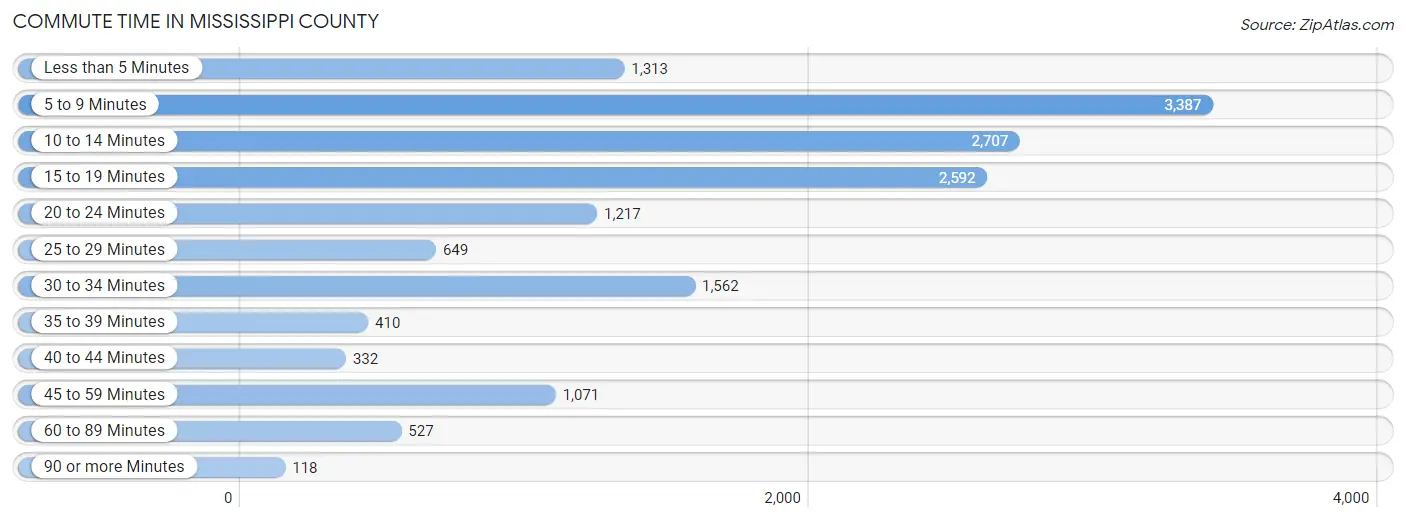
| Commute Time | # Commuters | % Commuters |
| Less than 5 Minutes | 1,313 | 8.3% |
| 5 to 9 Minutes | 3,387 | 21.3% |
| 10 to 14 Minutes | 2,707 | 17.0% |
| 15 to 19 Minutes | 2,592 | 16.3% |
| 20 to 24 Minutes | 1,217 | 7.7% |
| 25 to 29 Minutes | 649 | 4.1% |
| 30 to 34 Minutes | 1,562 | 9.8% |
| 35 to 39 Minutes | 410 | 2.6% |
| 40 to 44 Minutes | 332 | 2.1% |
| 45 to 59 Minutes | 1,071 | 6.7% |
| 60 to 89 Minutes | 527 | 3.3% |
| 90 or more Minutes | 118 | 0.7% |
Commute Time by Sex in Mississippi County
The most common commute times in Mississippi County are 5 to 9 minutes (1,957 commuters, 23.3%) for males and 5 to 9 minutes (1,430 commuters, 19.1%) for females.
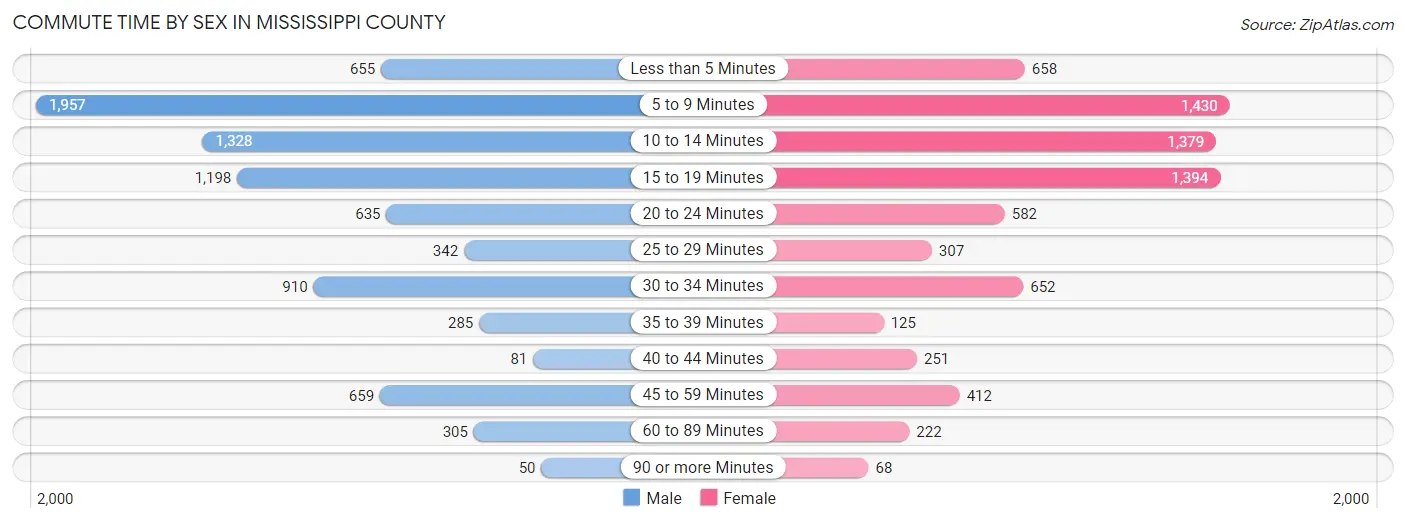
| Commute Time | Male | Female |
| Less than 5 Minutes | 655 (7.8%) | 658 (8.8%) |
| 5 to 9 Minutes | 1,957 (23.3%) | 1,430 (19.1%) |
| 10 to 14 Minutes | 1,328 (15.8%) | 1,379 (18.4%) |
| 15 to 19 Minutes | 1,198 (14.2%) | 1,394 (18.6%) |
| 20 to 24 Minutes | 635 (7.6%) | 582 (7.8%) |
| 25 to 29 Minutes | 342 (4.1%) | 307 (4.1%) |
| 30 to 34 Minutes | 910 (10.8%) | 652 (8.7%) |
| 35 to 39 Minutes | 285 (3.4%) | 125 (1.7%) |
| 40 to 44 Minutes | 81 (1.0%) | 251 (3.4%) |
| 45 to 59 Minutes | 659 (7.8%) | 412 (5.5%) |
| 60 to 89 Minutes | 305 (3.6%) | 222 (3.0%) |
| 90 or more Minutes | 50 (0.6%) | 68 (0.9%) |
Time of Departure to Work by Sex in Mississippi County
The most frequent times of departure to work in Mississippi County are 6:30 AM to 6:59 AM (1,407, 16.7%) for males and 7:30 AM to 7:59 AM (1,242, 16.6%) for females.
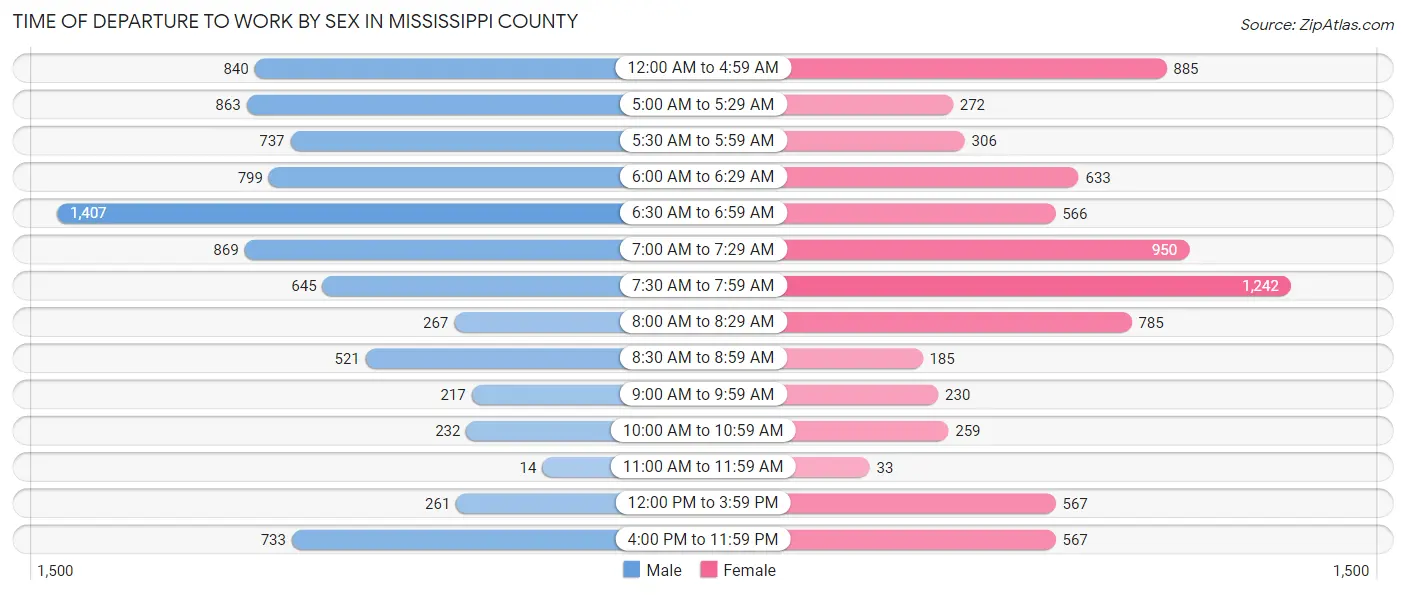
| Time of Departure | Male | Female |
| 12:00 AM to 4:59 AM | 840 (10.0%) | 885 (11.8%) |
| 5:00 AM to 5:29 AM | 863 (10.3%) | 272 (3.6%) |
| 5:30 AM to 5:59 AM | 737 (8.8%) | 306 (4.1%) |
| 6:00 AM to 6:29 AM | 799 (9.5%) | 633 (8.5%) |
| 6:30 AM to 6:59 AM | 1,407 (16.7%) | 566 (7.6%) |
| 7:00 AM to 7:29 AM | 869 (10.3%) | 950 (12.7%) |
| 7:30 AM to 7:59 AM | 645 (7.7%) | 1,242 (16.6%) |
| 8:00 AM to 8:29 AM | 267 (3.2%) | 785 (10.5%) |
| 8:30 AM to 8:59 AM | 521 (6.2%) | 185 (2.5%) |
| 9:00 AM to 9:59 AM | 217 (2.6%) | 230 (3.1%) |
| 10:00 AM to 10:59 AM | 232 (2.8%) | 259 (3.5%) |
| 11:00 AM to 11:59 AM | 14 (0.2%) | 33 (0.4%) |
| 12:00 PM to 3:59 PM | 261 (3.1%) | 567 (7.6%) |
| 4:00 PM to 11:59 PM | 733 (8.7%) | 567 (7.6%) |
| Total | 8,405 (100.0%) | 7,480 (100.0%) |
Housing Occupancy in Mississippi County
Occupancy by Ownership in Mississippi County
Of the total 15,005 dwellings in Mississippi County, owner-occupied units account for 9,027 (60.2%), while renter-occupied units make up 5,978 (39.8%).
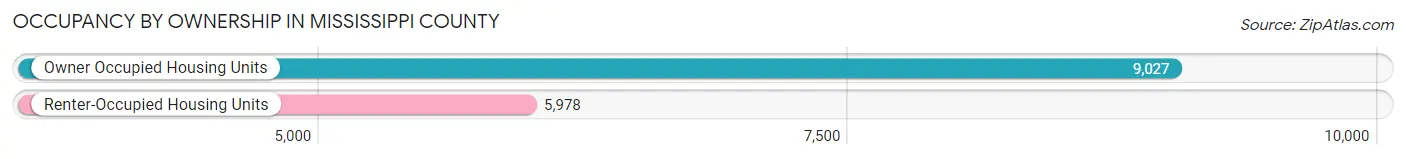
| Occupancy | # Housing Units | % Housing Units |
| Owner Occupied Housing Units | 9,027 | 60.2% |
| Renter-Occupied Housing Units | 5,978 | 39.8% |
| Total Occupied Housing Units | 15,005 | 100.0% |
Occupancy by Household Size in Mississippi County
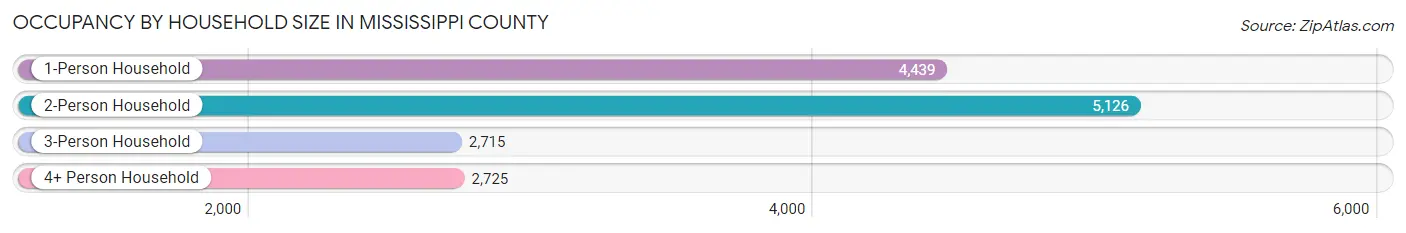
| Household Size | # Housing Units | % Housing Units |
| 1-Person Household | 4,439 | 29.6% |
| 2-Person Household | 5,126 | 34.2% |
| 3-Person Household | 2,715 | 18.1% |
| 4+ Person Household | 2,725 | 18.2% |
| Total Housing Units | 15,005 | 100.0% |
Occupancy by Ownership by Household Size in Mississippi County
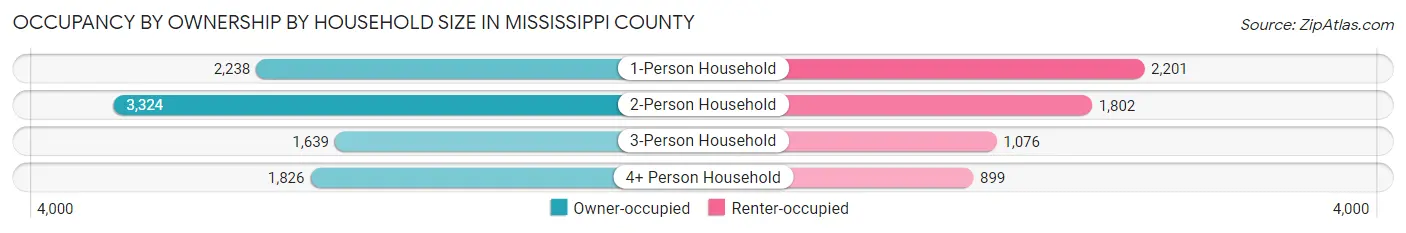
| Household Size | Owner-occupied | Renter-occupied |
| 1-Person Household | 2,238 (50.4%) | 2,201 (49.6%) |
| 2-Person Household | 3,324 (64.8%) | 1,802 (35.1%) |
| 3-Person Household | 1,639 (60.4%) | 1,076 (39.6%) |
| 4+ Person Household | 1,826 (67.0%) | 899 (33.0%) |
| Total Housing Units | 9,027 (60.2%) | 5,978 (39.8%) |
Occupancy by Educational Attainment in Mississippi County
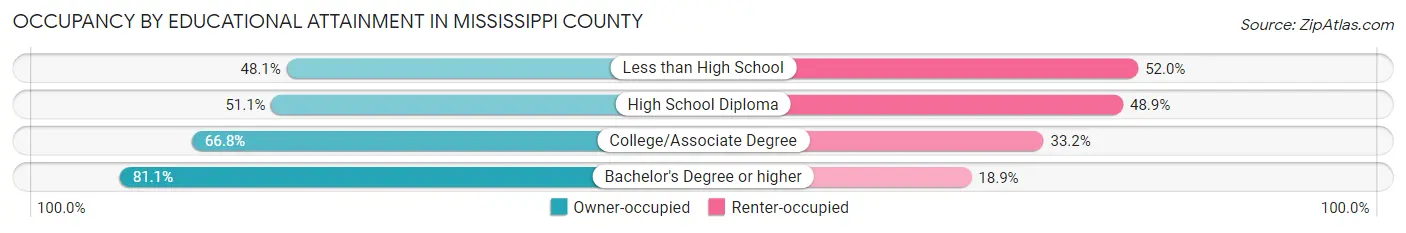
| Household Size | Owner-occupied | Renter-occupied |
| Less than High School | 1,207 (48.0%) | 1,305 (51.9%) |
| High School Diploma | 2,930 (51.1%) | 2,808 (48.9%) |
| College/Associate Degree | 2,755 (66.8%) | 1,368 (33.2%) |
| Bachelor's Degree or higher | 2,135 (81.1%) | 497 (18.9%) |
Occupancy by Age of Householder in Mississippi County
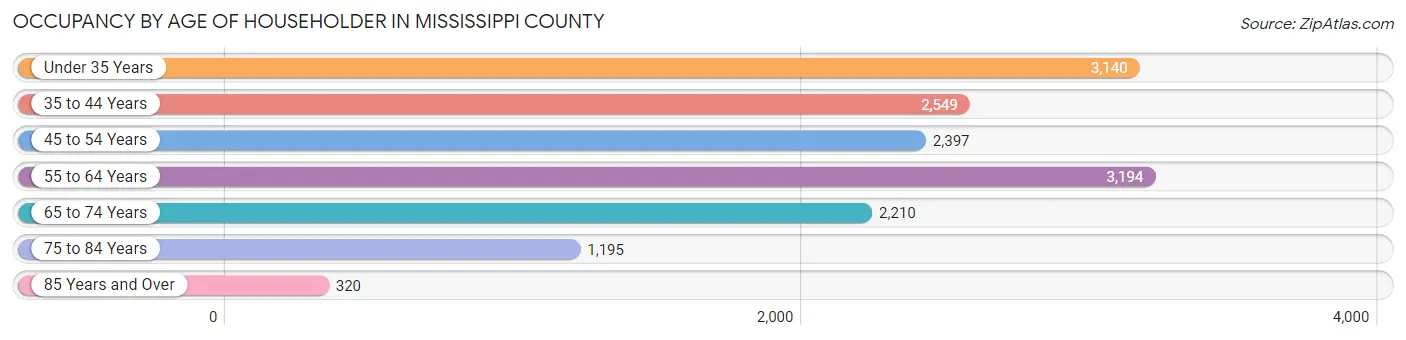
| Age Bracket | # Households | % Households |
| Under 35 Years | 3,140 | 20.9% |
| 35 to 44 Years | 2,549 | 17.0% |
| 45 to 54 Years | 2,397 | 16.0% |
| 55 to 64 Years | 3,194 | 21.3% |
| 65 to 74 Years | 2,210 | 14.7% |
| 75 to 84 Years | 1,195 | 8.0% |
| 85 Years and Over | 320 | 2.1% |
| Total | 15,005 | 100.0% |
Housing Finances in Mississippi County
Median Income by Occupancy in Mississippi County
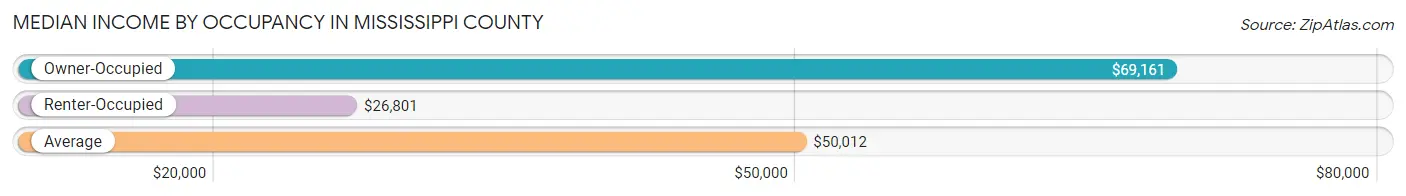
| Occupancy Type | # Households | Median Income |
| Owner-Occupied | 9,027 (60.2%) | $69,161 |
| Renter-Occupied | 5,978 (39.8%) | $26,801 |
| Average | 15,005 (100.0%) | $50,012 |
Occupancy by Householder Income Bracket in Mississippi County
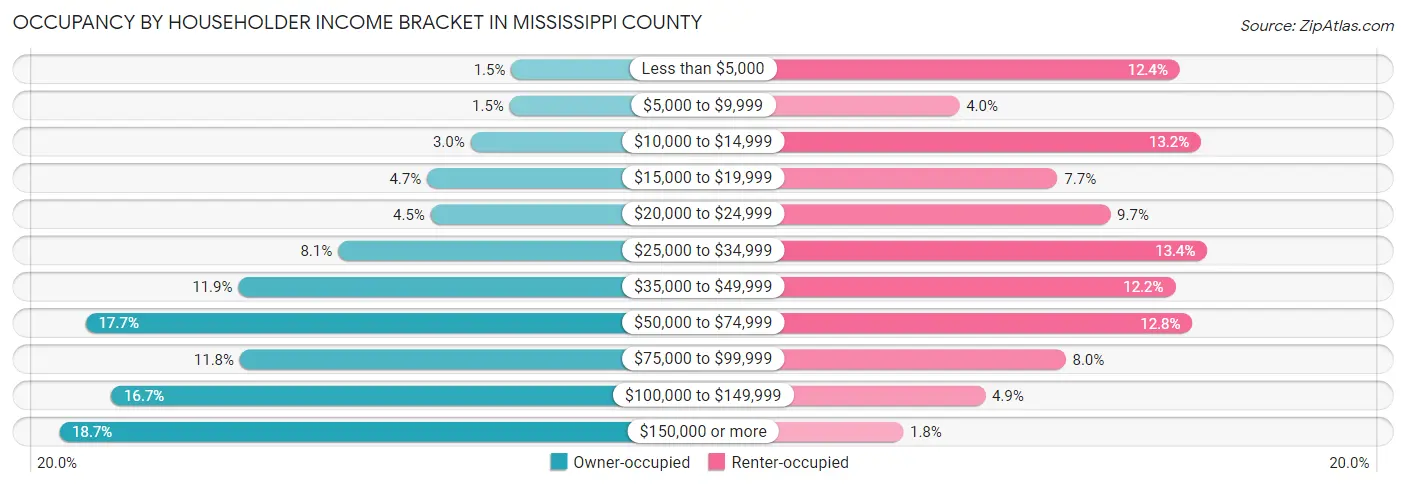
| Income Bracket | Owner-occupied | Renter-occupied |
| Less than $5,000 | 132 (1.5%) | 738 (12.3%) |
| $5,000 to $9,999 | 137 (1.5%) | 236 (4.0%) |
| $10,000 to $14,999 | 272 (3.0%) | 787 (13.2%) |
| $15,000 to $19,999 | 422 (4.7%) | 460 (7.7%) |
| $20,000 to $24,999 | 409 (4.5%) | 580 (9.7%) |
| $25,000 to $34,999 | 728 (8.1%) | 801 (13.4%) |
| $35,000 to $49,999 | 1,071 (11.9%) | 728 (12.2%) |
| $50,000 to $74,999 | 1,596 (17.7%) | 767 (12.8%) |
| $75,000 to $99,999 | 1,065 (11.8%) | 478 (8.0%) |
| $100,000 to $149,999 | 1,508 (16.7%) | 295 (4.9%) |
| $150,000 or more | 1,687 (18.7%) | 108 (1.8%) |
| Total | 9,027 (100.0%) | 5,978 (100.0%) |
Monthly Housing Cost Tiers in Mississippi County
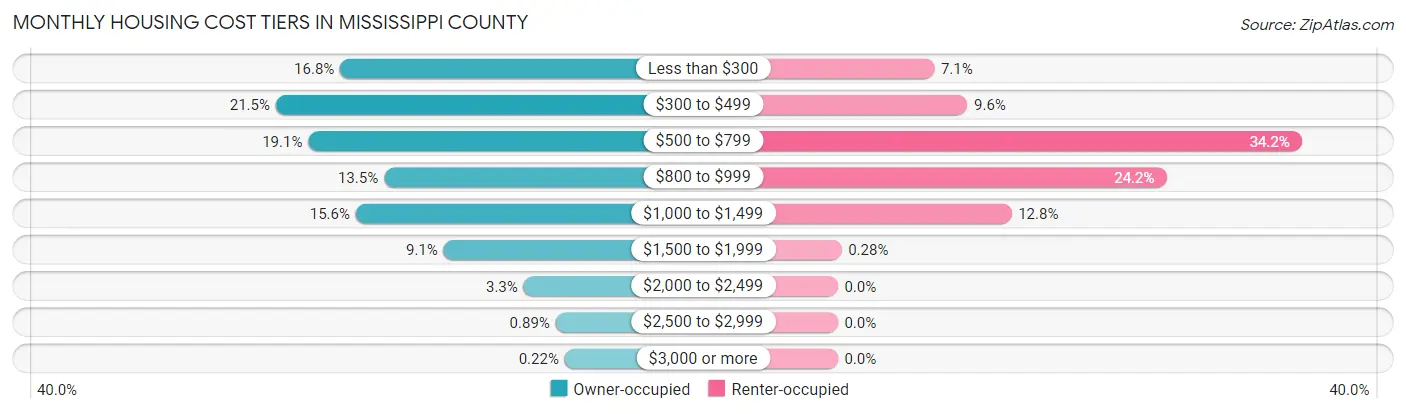
| Monthly Cost | Owner-occupied | Renter-occupied |
| Less than $300 | 1,513 (16.8%) | 425 (7.1%) |
| $300 to $499 | 1,941 (21.5%) | 571 (9.6%) |
| $500 to $799 | 1,725 (19.1%) | 2,044 (34.2%) |
| $800 to $999 | 1,221 (13.5%) | 1,448 (24.2%) |
| $1,000 to $1,499 | 1,409 (15.6%) | 765 (12.8%) |
| $1,500 to $1,999 | 825 (9.1%) | 17 (0.3%) |
| $2,000 to $2,499 | 293 (3.3%) | 0 (0.0%) |
| $2,500 to $2,999 | 80 (0.9%) | 0 (0.0%) |
| $3,000 or more | 20 (0.2%) | 0 (0.0%) |
| Total | 9,027 (100.0%) | 5,978 (100.0%) |
Physical Housing Characteristics in Mississippi County
Housing Structures in Mississippi County
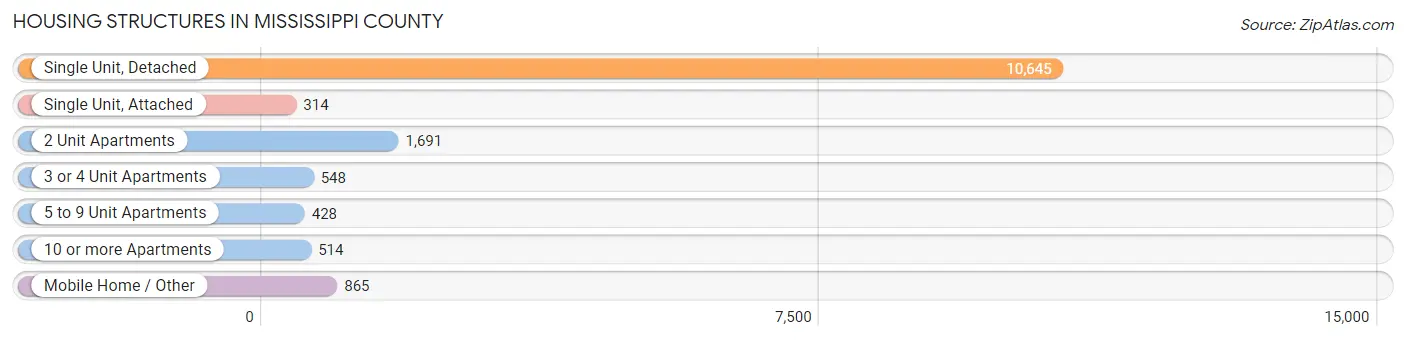
| Structure Type | # Housing Units | % Housing Units |
| Single Unit, Detached | 10,645 | 70.9% |
| Single Unit, Attached | 314 | 2.1% |
| 2 Unit Apartments | 1,691 | 11.3% |
| 3 or 4 Unit Apartments | 548 | 3.6% |
| 5 to 9 Unit Apartments | 428 | 2.9% |
| 10 or more Apartments | 514 | 3.4% |
| Mobile Home / Other | 865 | 5.8% |
| Total | 15,005 | 100.0% |
Housing Structures by Occupancy in Mississippi County
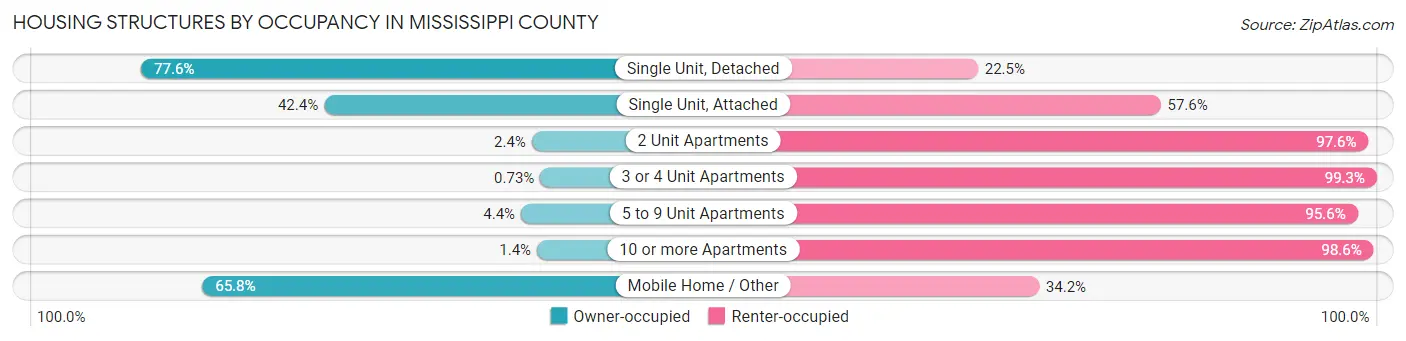
| Structure Type | Owner-occupied | Renter-occupied |
| Single Unit, Detached | 8,255 (77.5%) | 2,390 (22.5%) |
| Single Unit, Attached | 133 (42.4%) | 181 (57.6%) |
| 2 Unit Apartments | 40 (2.4%) | 1,651 (97.6%) |
| 3 or 4 Unit Apartments | 4 (0.7%) | 544 (99.3%) |
| 5 to 9 Unit Apartments | 19 (4.4%) | 409 (95.6%) |
| 10 or more Apartments | 7 (1.4%) | 507 (98.6%) |
| Mobile Home / Other | 569 (65.8%) | 296 (34.2%) |
| Total | 9,027 (60.2%) | 5,978 (39.8%) |
Housing Structures by Number of Rooms in Mississippi County
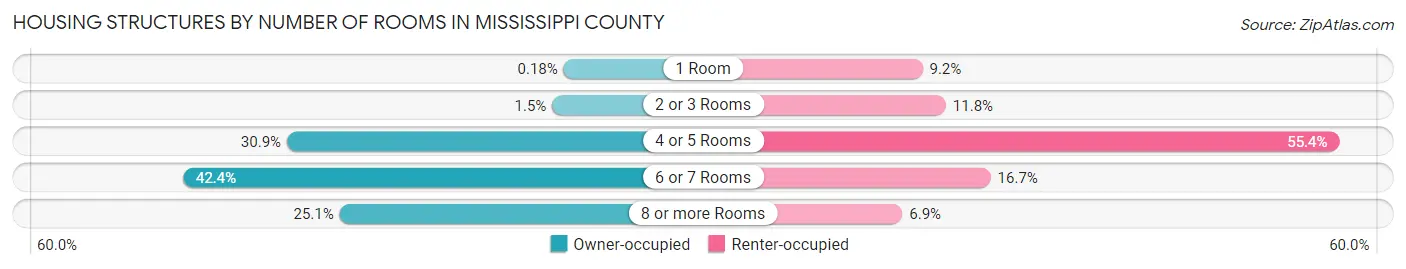
| Number of Rooms | Owner-occupied | Renter-occupied |
| 1 Room | 16 (0.2%) | 548 (9.2%) |
| 2 or 3 Rooms | 131 (1.5%) | 703 (11.8%) |
| 4 or 5 Rooms | 2,788 (30.9%) | 3,313 (55.4%) |
| 6 or 7 Rooms | 3,831 (42.4%) | 1,000 (16.7%) |
| 8 or more Rooms | 2,261 (25.1%) | 414 (6.9%) |
| Total | 9,027 (100.0%) | 5,978 (100.0%) |
Housing Structure by Heating Type in Mississippi County
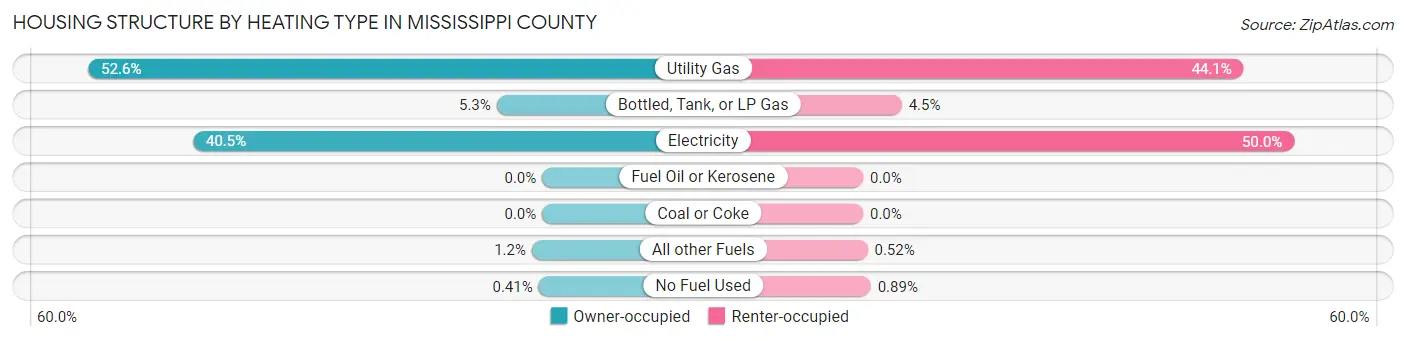
| Heating Type | Owner-occupied | Renter-occupied |
| Utility Gas | 4,751 (52.6%) | 2,638 (44.1%) |
| Bottled, Tank, or LP Gas | 476 (5.3%) | 268 (4.5%) |
| Electricity | 3,656 (40.5%) | 2,988 (50.0%) |
| Fuel Oil or Kerosene | 0 (0.0%) | 0 (0.0%) |
| Coal or Coke | 0 (0.0%) | 0 (0.0%) |
| All other Fuels | 107 (1.2%) | 31 (0.5%) |
| No Fuel Used | 37 (0.4%) | 53 (0.9%) |
| Total | 9,027 (100.0%) | 5,978 (100.0%) |
Household Vehicle Usage in Mississippi County
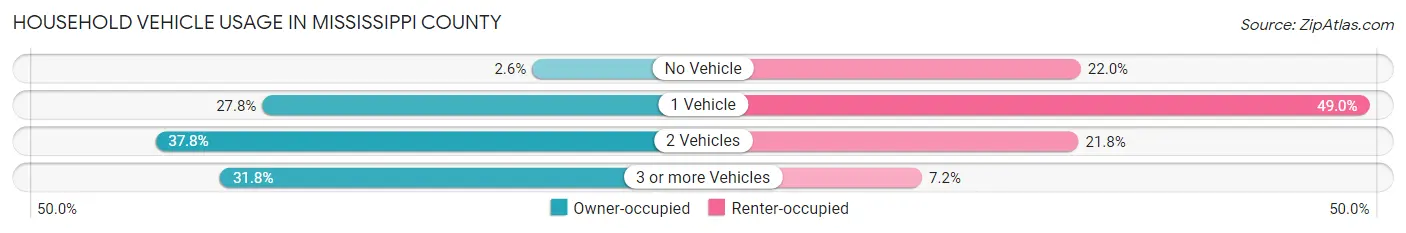
| Vehicles per Household | Owner-occupied | Renter-occupied |
| No Vehicle | 237 (2.6%) | 1,317 (22.0%) |
| 1 Vehicle | 2,511 (27.8%) | 2,926 (48.9%) |
| 2 Vehicles | 3,412 (37.8%) | 1,304 (21.8%) |
| 3 or more Vehicles | 2,867 (31.8%) | 431 (7.2%) |
| Total | 9,027 (100.0%) | 5,978 (100.0%) |
Real Estate & Mortgages in Mississippi County
Real Estate and Mortgage Overview in Mississippi County
| Characteristic | Without Mortgage | With Mortgage |
| Housing Units | 4,596 | 4,431 |
| Median Property Value | $85,800 | $136,100 |
| Median Household Income | $52,190 | $1,278 |
| Monthly Housing Costs | $380 | $20 |
| Real Estate Taxes | $392 | $234 |
Property Value by Mortgage Status in Mississippi County
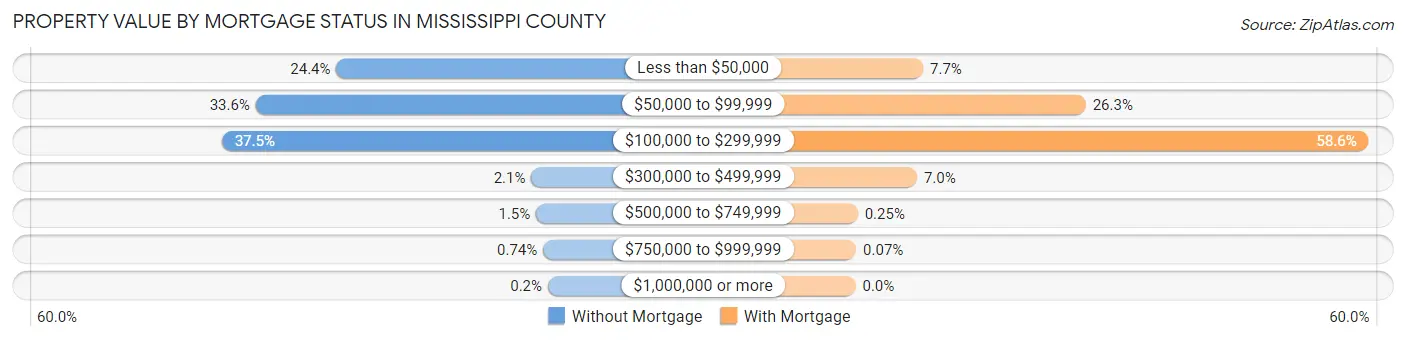
| Property Value | Without Mortgage | With Mortgage |
| Less than $50,000 | 1,120 (24.4%) | 342 (7.7%) |
| $50,000 to $99,999 | 1,544 (33.6%) | 1,166 (26.3%) |
| $100,000 to $299,999 | 1,722 (37.5%) | 2,598 (58.6%) |
| $300,000 to $499,999 | 96 (2.1%) | 311 (7.0%) |
| $500,000 to $749,999 | 71 (1.5%) | 11 (0.3%) |
| $750,000 to $999,999 | 34 (0.7%) | 3 (0.1%) |
| $1,000,000 or more | 9 (0.2%) | 0 (0.0%) |
| Total | 4,596 (100.0%) | 4,431 (100.0%) |
Household Income by Mortgage Status in Mississippi County
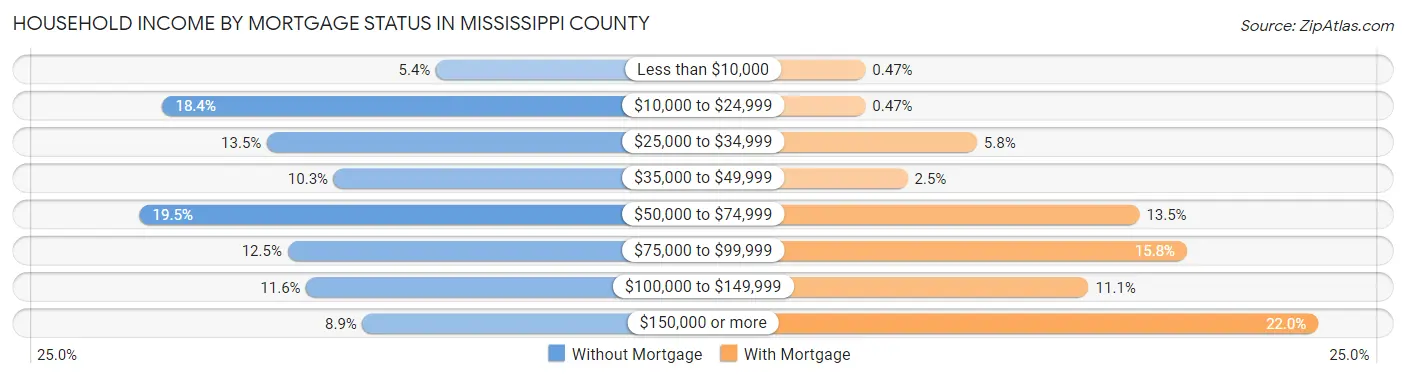
| Household Income | Without Mortgage | With Mortgage |
| Less than $10,000 | 248 (5.4%) | 21 (0.5%) |
| $10,000 to $24,999 | 847 (18.4%) | 21 (0.5%) |
| $25,000 to $34,999 | 618 (13.5%) | 256 (5.8%) |
| $35,000 to $49,999 | 472 (10.3%) | 110 (2.5%) |
| $50,000 to $74,999 | 897 (19.5%) | 599 (13.5%) |
| $75,000 to $99,999 | 573 (12.5%) | 699 (15.8%) |
| $100,000 to $149,999 | 532 (11.6%) | 492 (11.1%) |
| $150,000 or more | 409 (8.9%) | 976 (22.0%) |
| Total | 4,596 (100.0%) | 4,431 (100.0%) |
Property Value to Household Income Ratio in Mississippi County
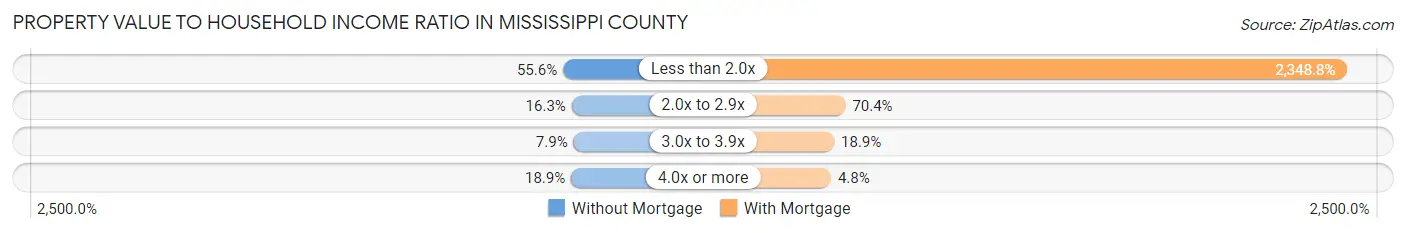
| Value-to-Income Ratio | Without Mortgage | With Mortgage |
| Less than 2.0x | 2,556 (55.6%) | 104,077 (2,348.8%) |
| 2.0x to 2.9x | 749 (16.3%) | 3,121 (70.4%) |
| 3.0x to 3.9x | 364 (7.9%) | 837 (18.9%) |
| 4.0x or more | 870 (18.9%) | 212 (4.8%) |
| Total | 4,596 (100.0%) | 4,431 (100.0%) |
Real Estate Taxes by Mortgage Status in Mississippi County
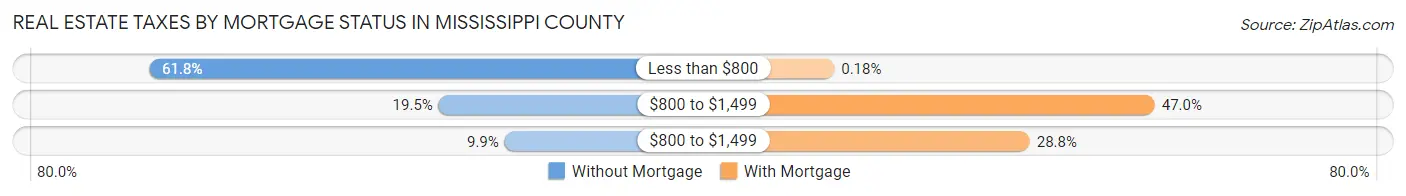
| Property Taxes | Without Mortgage | With Mortgage |
| Less than $800 | 2,841 (61.8%) | 8 (0.2%) |
| $800 to $1,499 | 896 (19.5%) | 2,083 (47.0%) |
| $800 to $1,499 | 453 (9.9%) | 1,274 (28.7%) |
| Total | 4,596 (100.0%) | 4,431 (100.0%) |
Health & Disability in Mississippi County
Health Insurance Coverage by Age in Mississippi County
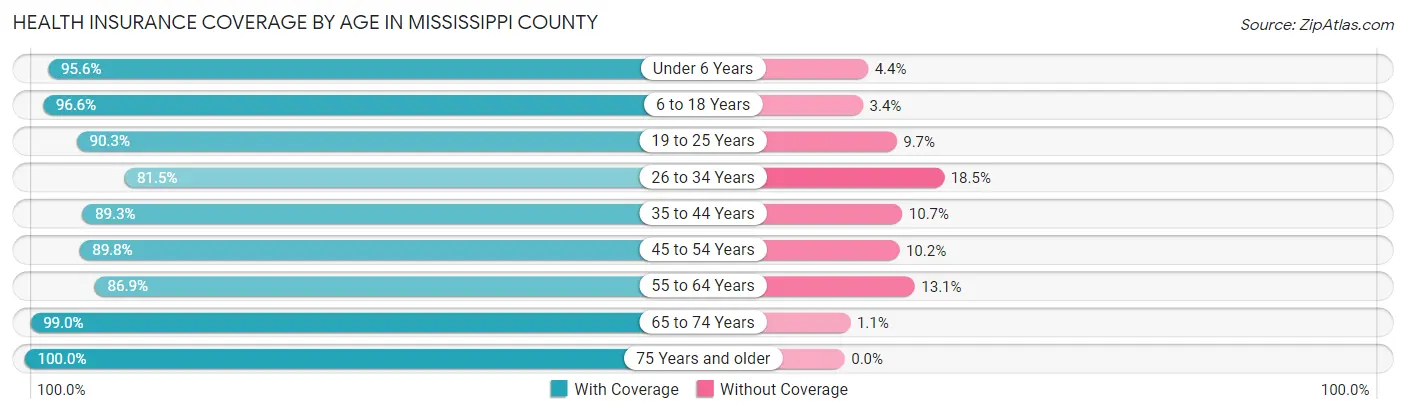
| Age Bracket | With Coverage | Without Coverage |
| Under 6 Years | 3,328 (95.6%) | 152 (4.4%) |
| 6 to 18 Years | 7,274 (96.6%) | 257 (3.4%) |
| 19 to 25 Years | 3,484 (90.3%) | 374 (9.7%) |
| 26 to 34 Years | 3,551 (81.5%) | 808 (18.5%) |
| 35 to 44 Years | 4,246 (89.3%) | 511 (10.7%) |
| 45 to 54 Years | 4,059 (89.8%) | 461 (10.2%) |
| 55 to 64 Years | 4,574 (86.9%) | 688 (13.1%) |
| 65 to 74 Years | 3,576 (99.0%) | 38 (1.1%) |
| 75 Years and older | 2,180 (100.0%) | 0 (0.0%) |
| Total | 36,272 (91.7%) | 3,289 (8.3%) |
Health Insurance Coverage by Citizenship Status in Mississippi County
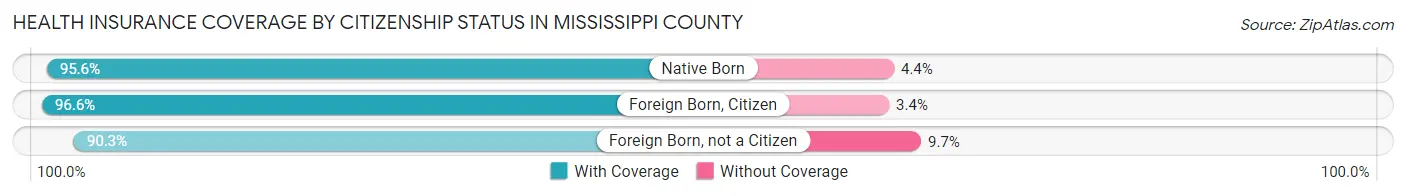
| Citizenship Status | With Coverage | Without Coverage |
| Native Born | 3,328 (95.6%) | 152 (4.4%) |
| Foreign Born, Citizen | 7,274 (96.6%) | 257 (3.4%) |
| Foreign Born, not a Citizen | 3,484 (90.3%) | 374 (9.7%) |
Health Insurance Coverage by Household Income in Mississippi County
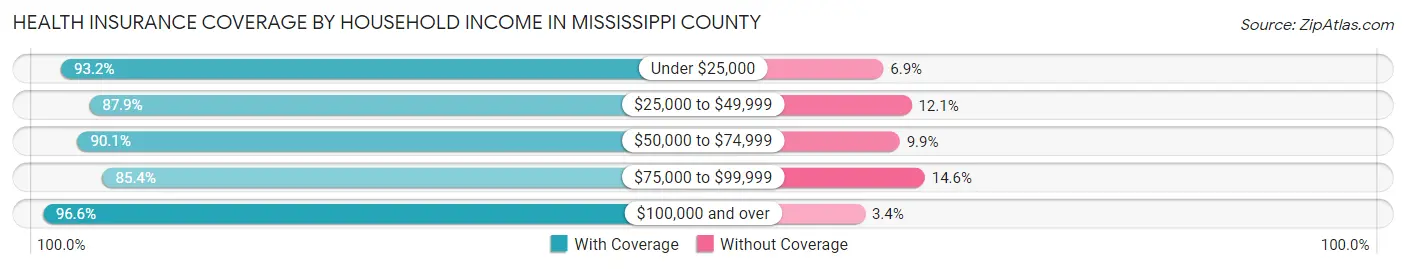
| Household Income | With Coverage | Without Coverage |
| Under $25,000 | 7,503 (93.1%) | 552 (6.9%) |
| $25,000 to $49,999 | 7,077 (87.9%) | 976 (12.1%) |
| $50,000 to $74,999 | 6,168 (90.1%) | 679 (9.9%) |
| $75,000 to $99,999 | 3,896 (85.4%) | 667 (14.6%) |
| $100,000 and over | 11,593 (96.6%) | 409 (3.4%) |
Public vs Private Health Insurance Coverage by Age in Mississippi County
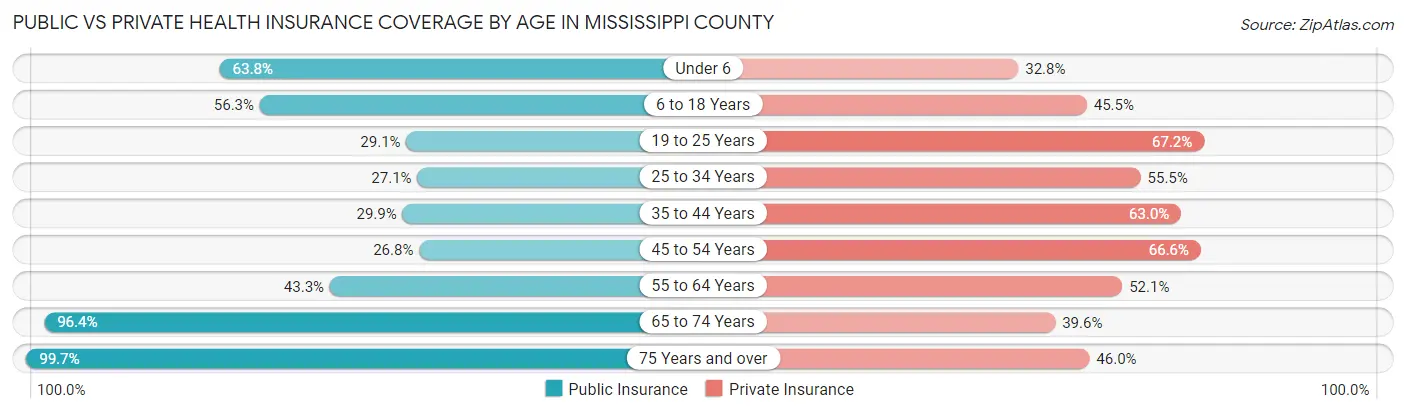
| Age Bracket | Public Insurance | Private Insurance |
| Under 6 | 2,220 (63.8%) | 1,140 (32.8%) |
| 6 to 18 Years | 4,242 (56.3%) | 3,425 (45.5%) |
| 19 to 25 Years | 1,124 (29.1%) | 2,594 (67.2%) |
| 25 to 34 Years | 1,181 (27.1%) | 2,418 (55.5%) |
| 35 to 44 Years | 1,420 (29.8%) | 2,996 (63.0%) |
| 45 to 54 Years | 1,209 (26.8%) | 3,012 (66.6%) |
| 55 to 64 Years | 2,280 (43.3%) | 2,739 (52.0%) |
| 65 to 74 Years | 3,482 (96.4%) | 1,432 (39.6%) |
| 75 Years and over | 2,173 (99.7%) | 1,002 (46.0%) |
| Total | 19,331 (48.9%) | 20,758 (52.5%) |
Disability Status by Sex by Age in Mississippi County
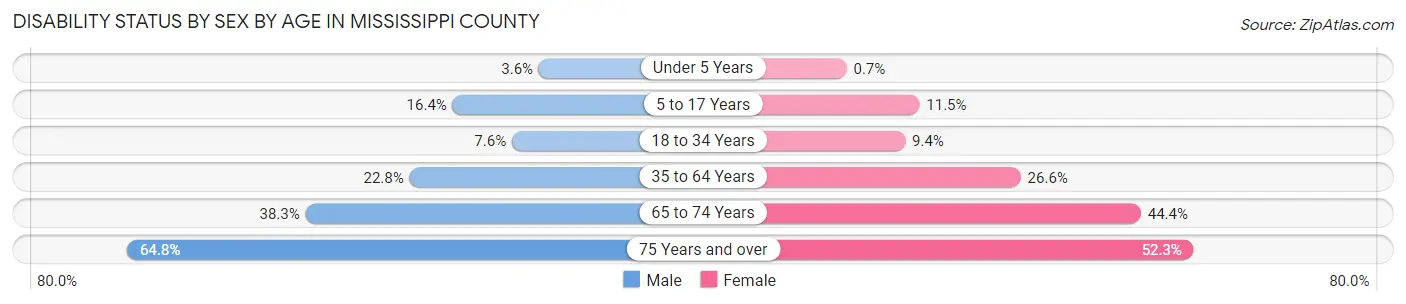
| Age Bracket | Male | Female |
| Under 5 Years | 50 (3.6%) | 10 (0.7%) |
| 5 to 17 Years | 656 (16.4%) | 428 (11.5%) |
| 18 to 34 Years | 334 (7.6%) | 408 (9.4%) |
| 35 to 64 Years | 1,581 (22.8%) | 2,023 (26.6%) |
| 65 to 74 Years | 648 (38.3%) | 853 (44.4%) |
| 75 Years and over | 563 (64.8%) | 685 (52.2%) |
Disability Class by Sex by Age in Mississippi County
Disability Class: Hearing Difficulty
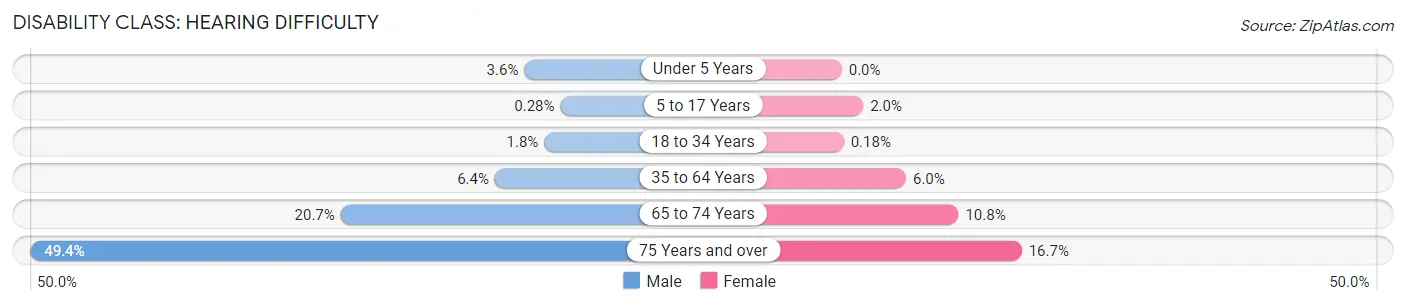
| Age Bracket | Male | Female |
| Under 5 Years | 50 (3.6%) | 0 (0.0%) |
| 5 to 17 Years | 11 (0.3%) | 74 (2.0%) |
| 18 to 34 Years | 78 (1.8%) | 8 (0.2%) |
| 35 to 64 Years | 440 (6.4%) | 454 (6.0%) |
| 65 to 74 Years | 350 (20.7%) | 208 (10.8%) |
| 75 Years and over | 429 (49.4%) | 219 (16.7%) |
Disability Class: Vision Difficulty
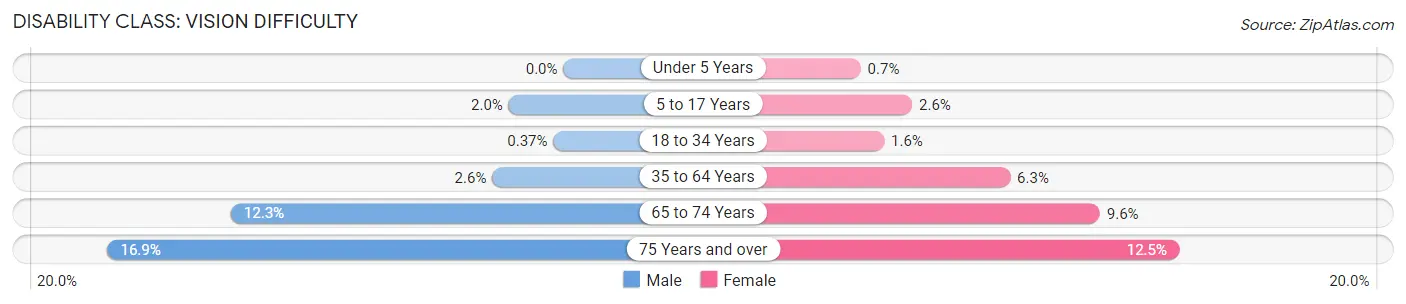
| Age Bracket | Male | Female |
| Under 5 Years | 0 (0.0%) | 10 (0.7%) |
| 5 to 17 Years | 81 (2.0%) | 97 (2.6%) |
| 18 to 34 Years | 16 (0.4%) | 68 (1.6%) |
| 35 to 64 Years | 183 (2.6%) | 476 (6.2%) |
| 65 to 74 Years | 209 (12.3%) | 184 (9.6%) |
| 75 Years and over | 147 (16.9%) | 164 (12.5%) |
Disability Class: Cognitive Difficulty
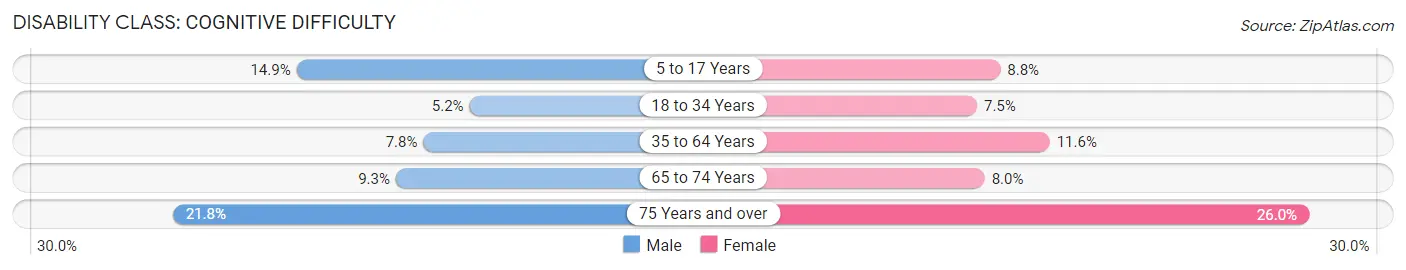
| Age Bracket | Male | Female |
| 5 to 17 Years | 593 (14.9%) | 328 (8.8%) |
| 18 to 34 Years | 229 (5.2%) | 327 (7.5%) |
| 35 to 64 Years | 540 (7.8%) | 882 (11.6%) |
| 65 to 74 Years | 158 (9.3%) | 153 (8.0%) |
| 75 Years and over | 189 (21.7%) | 341 (26.0%) |
Disability Class: Ambulatory Difficulty
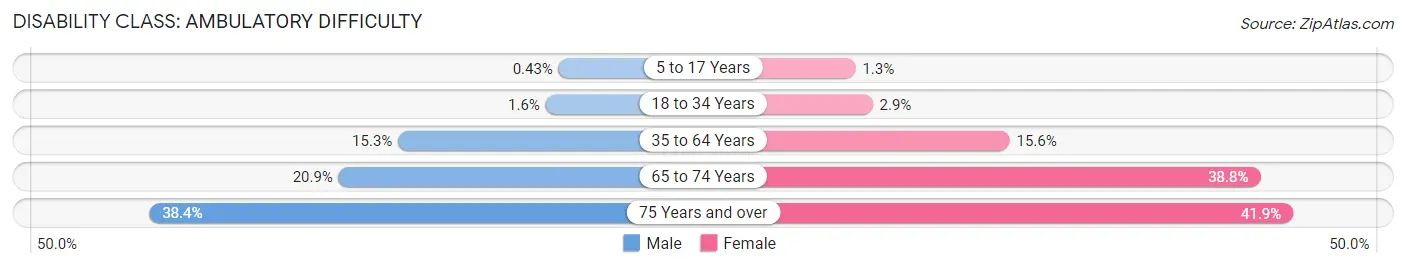
| Age Bracket | Male | Female |
| 5 to 17 Years | 17 (0.4%) | 47 (1.3%) |
| 18 to 34 Years | 72 (1.6%) | 124 (2.9%) |
| 35 to 64 Years | 1,061 (15.3%) | 1,186 (15.6%) |
| 65 to 74 Years | 353 (20.8%) | 746 (38.8%) |
| 75 Years and over | 334 (38.4%) | 549 (41.9%) |
Disability Class: Self-Care Difficulty
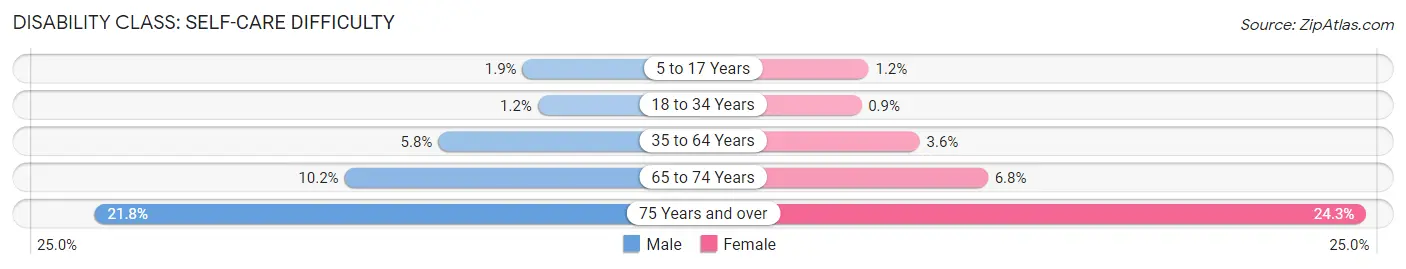
| Age Bracket | Male | Female |
| 5 to 17 Years | 76 (1.9%) | 46 (1.2%) |
| 18 to 34 Years | 52 (1.2%) | 39 (0.9%) |
| 35 to 64 Years | 402 (5.8%) | 275 (3.6%) |
| 65 to 74 Years | 172 (10.2%) | 130 (6.8%) |
| 75 Years and over | 189 (21.7%) | 319 (24.3%) |
Technology Access in Mississippi County
Computing Device Access in Mississippi County
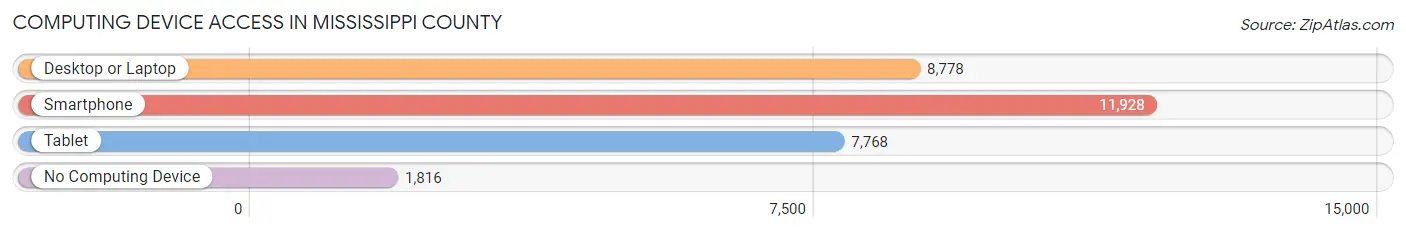
| Device Type | # Households | % Households |
| Desktop or Laptop | 8,778 | 58.5% |
| Smartphone | 11,928 | 79.5% |
| Tablet | 7,768 | 51.8% |
| No Computing Device | 1,816 | 12.1% |
| Total | 15,005 | 100.0% |
Internet Access in Mississippi County
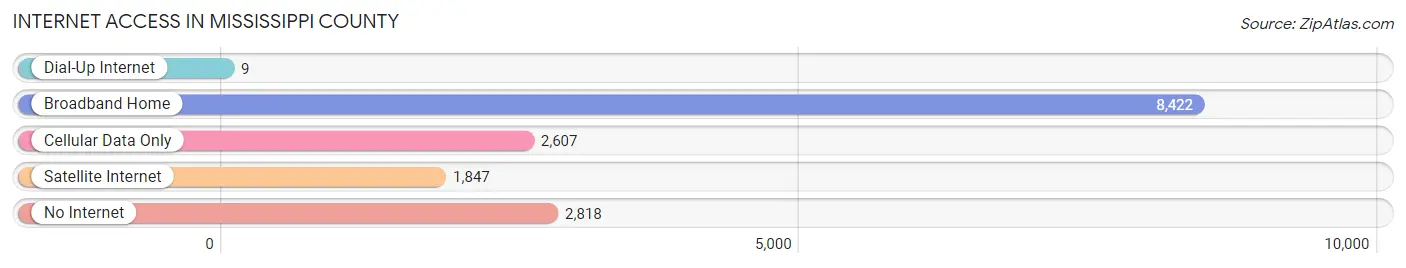
| Internet Type | # Households | % Households |
| Dial-Up Internet | 9 | 0.1% |
| Broadband Home | 8,422 | 56.1% |
| Cellular Data Only | 2,607 | 17.4% |
| Satellite Internet | 1,847 | 12.3% |
| No Internet | 2,818 | 18.8% |
| Total | 15,005 | 100.0% |
Mississippi County Summary
Mississippi County, Arkansas is located in the northeast corner of the state and is the largest county in Arkansas by land area. It is bordered by the Mississippi River to the east, the Missouri state line to the north, and the counties of Crittenden, Poinsett, and Craighead to the south and west. The county seat is Osceola, and the largest city is Blytheville.
History
Mississippi County was formed in 1833 from parts of Crittenden and Phillips counties. It was named for the Mississippi River, which forms its eastern border. The county was originally part of the Chickasaw Cession of 1818, and the first settlers arrived in the area in the early 1820s.
The county was an important center of cotton production in the 19th century, and the town of Osceola was established in 1853. The county was also home to a large number of African-American slaves, who worked on the cotton plantations.
In the early 20th century, the county was a major center of the timber industry, and the town of Blytheville was established in 1906. The county was also home to a large number of African-American sharecroppers, who worked on the cotton and timber plantations.
Geography
Mississippi County is located in the northeast corner of Arkansas and is the largest county in the state by land area. It is bordered by the Mississippi River to the east, the Missouri state line to the north, and the counties of Crittenden, Poinsett, and Craighead to the south and west. The county has a total area of 1,814 square miles, of which 1,788 square miles is land and 26 square miles is water.
The county is mostly flat, with some rolling hills in the northern and western parts. The highest point in the county is in the northwest corner, at an elevation of 545 feet. The county is drained by the St. Francis River and its tributaries, including the Little River, Big Lake Creek, and the L'Anguille River.
Economy
Mississippi County is a largely rural county, and its economy is largely based on agriculture. The county is a major producer of cotton, soybeans, rice, and wheat. The county is also home to a number of poultry farms, and the town of Blytheville is home to a large Tyson Foods poultry processing plant.
The county is also home to a number of manufacturing plants, including a steel mill in Blytheville and a paper mill in Osceola. The county is also home to a number of retail stores, including Walmart, Lowe's, and Home Depot.
Demographics
As of the 2010 census, Mississippi County had a population of 46,480. The racial makeup of the county was 68.3% White, 28.2% Black or African American, 0.4% Native American, 0.5% Asian, 0.1% Pacific Islander, 0.7% from other races, and 1.8% from two or more races. Hispanic or Latino of any race were 2.2% of the population.
The median income for a household in the county was $35,945, and the median income for a family was $41,945. The per capita income for the county was $17,845. About 17.2% of the population was below the poverty line.
Common Questions
What is Per Capita Income in Mississippi County?
Per Capita income in Mississippi County is $27,863.
What is the Median Family Income in Mississippi County?
Median Family Income in Mississippi County is $62,701.
What is the Median Household income in Mississippi County?
Median Household Income in Mississippi County is $50,012.
What is Income or Wage Gap in Mississippi County?
Income or Wage Gap in Mississippi County is 30.6%.
Women in Mississippi County earn 69.4 cents for every dollar earned by a man.
What is Family Income Deficit in Mississippi County?
Family Income Deficit in Mississippi County is $11,340.
Families that are below poverty line in Mississippi County earn $11,340 less on average than the poverty threshold level.
What is Inequality or Gini Index in Mississippi County?
Inequality or Gini Index in Mississippi County is 0.49.
What is the Total Population of Mississippi County?
Total Population of Mississippi County is 40,361.
What is the Total Male Population of Mississippi County?
Total Male Population of Mississippi County is 19,837.
What is the Total Female Population of Mississippi County?
Total Female Population of Mississippi County is 20,524.
What is the Ratio of Males per 100 Females in Mississippi County?
There are 96.65 Males per 100 Females in Mississippi County.
What is the Ratio of Females per 100 Males in Mississippi County?
There are 103.46 Females per 100 Males in Mississippi County.
What is the Median Population Age in Mississippi County?
Median Population Age in Mississippi County is 37.0 Years.
What is the Average Family Size in Mississippi County
Average Family Size in Mississippi County is 3.2 People.
What is the Average Household Size in Mississippi County
Average Household Size in Mississippi County is 2.6 People.
How Large is the Labor Force in Mississippi County?
There are 18,819 People in the Labor Forcein in Mississippi County.
What is the Percentage of People in the Labor Force in Mississippi County?
60.4% of People are in the Labor Force in Mississippi County.
What is the Unemployment Rate in Mississippi County?
Unemployment Rate in Mississippi County is 9.8%.