Crittenden County, AR Map & Demographics
Crittenden County Map
Crittenden County Overview
$27,834
PER CAPITA INCOME
$60,037
AVG FAMILY INCOME
$51,860
AVG HOUSEHOLD INCOME
29.9%
WAGE / INCOME GAP [ % ]
70.1¢/ $1
WAGE / INCOME GAP [ $ ]
$11,679
FAMILY INCOME DEFICIT
0.48
INEQUALITY / GINI INDEX
47,945
TOTAL POPULATION
22,739
MALE POPULATION
25,206
FEMALE POPULATION
90.21
MALES / 100 FEMALES
110.85
FEMALES / 100 MALES
35.8
MEDIAN AGE
3.2
AVG FAMILY SIZE
2.5
AVG HOUSEHOLD SIZE
22,712
LABOR FORCE [ PEOPLE ]
62.4%
PERCENT IN LABOR FORCE
10.4%
UNEMPLOYMENT RATE
Crittenden County Area Codes
Income in Crittenden County
Income Overview in Crittenden County
Per Capita Income in Crittenden County is $27,834, while median incomes of families and households are $60,037 and $51,860 respectively.
| Characteristic | Number | Measure |
| Per Capita Income | 47,945 | $27,834 |
| Median Family Income | 11,946 | $60,037 |
| Mean Family Income | 11,946 | $81,761 |
| Median Household Income | 18,587 | $51,860 |
| Mean Household Income | 18,587 | $70,749 |
| Income Deficit | 11,946 | $11,679 |
| Wage / Income Gap (%) | 47,945 | 29.95% |
| Wage / Income Gap ($) | 47,945 | 70.05¢ per $1 |
| Gini / Inequality Index | 47,945 | 0.48 |
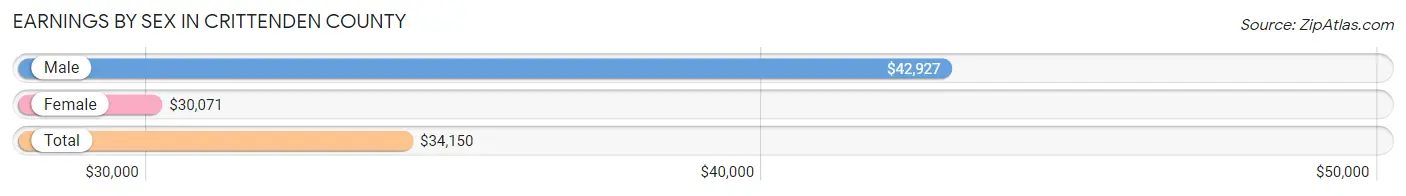
Earnings by Sex in Crittenden County
Average Earnings in Crittenden County are $34,150, $42,927 for men and $30,071 for women, a difference of 29.9%.
| Sex | Number | Average Earnings |
| Male | 10,981 (47.6%) | $42,927 |
| Female | 12,083 (52.4%) | $30,071 |
| Total | 23,064 (100.0%) | $34,150 |
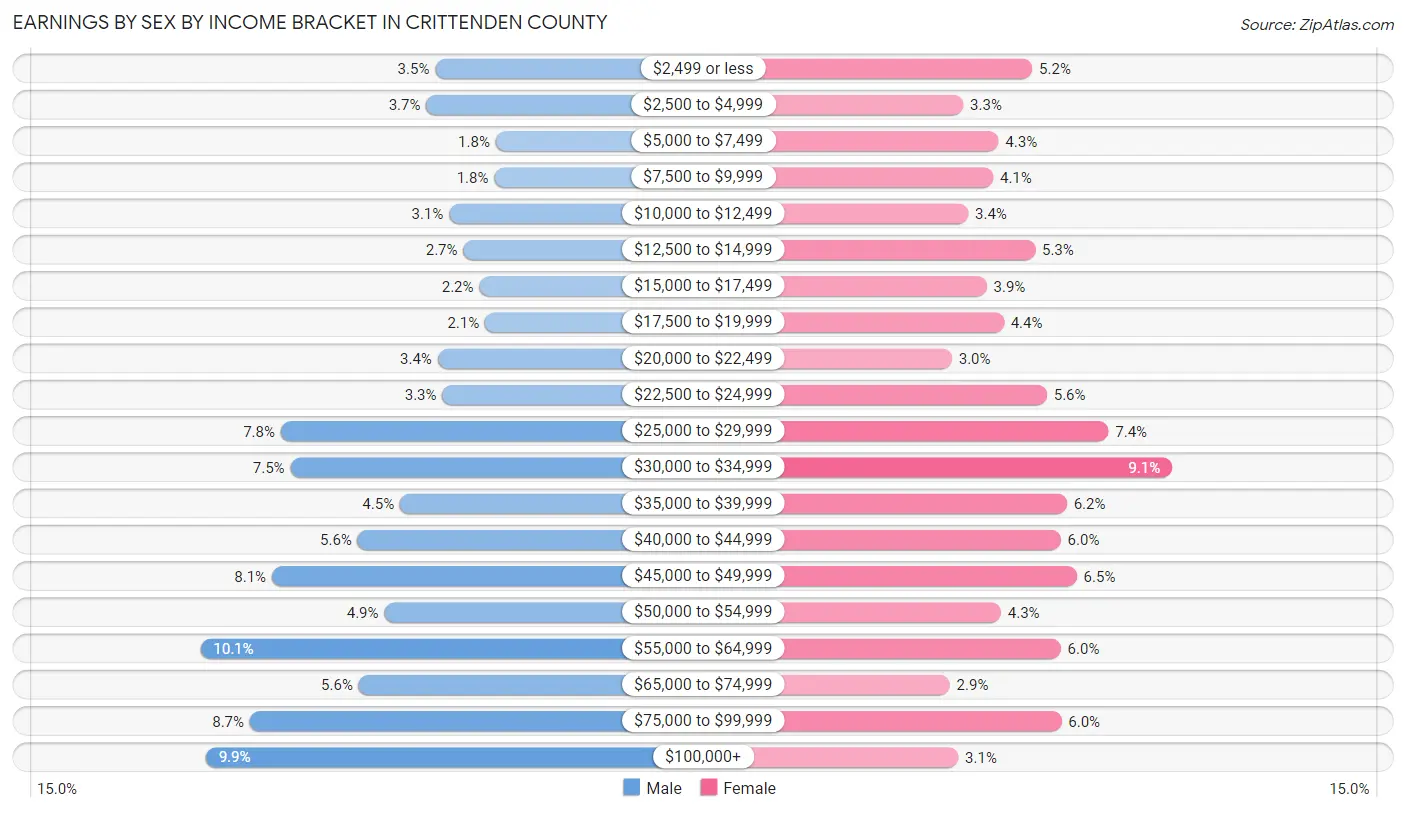
Earnings by Sex by Income Bracket in Crittenden County
The most common earnings brackets in Crittenden County are $55,000 to $64,999 for men (1,105 | 10.1%) and $30,000 to $34,999 for women (1,104 | 9.1%).
| Income | Male | Female |
| $2,499 or less | 380 (3.5%) | 630 (5.2%) |
| $2,500 to $4,999 | 407 (3.7%) | 395 (3.3%) |
| $5,000 to $7,499 | 193 (1.8%) | 515 (4.3%) |
| $7,500 to $9,999 | 198 (1.8%) | 497 (4.1%) |
| $10,000 to $12,499 | 337 (3.1%) | 412 (3.4%) |
| $12,500 to $14,999 | 293 (2.7%) | 639 (5.3%) |
| $15,000 to $17,499 | 244 (2.2%) | 475 (3.9%) |
| $17,500 to $19,999 | 226 (2.1%) | 533 (4.4%) |
| $20,000 to $22,499 | 372 (3.4%) | 357 (2.9%) |
| $22,500 to $24,999 | 358 (3.3%) | 679 (5.6%) |
| $25,000 to $29,999 | 856 (7.8%) | 888 (7.3%) |
| $30,000 to $34,999 | 827 (7.5%) | 1,104 (9.1%) |
| $35,000 to $39,999 | 489 (4.4%) | 747 (6.2%) |
| $40,000 to $44,999 | 619 (5.6%) | 726 (6.0%) |
| $45,000 to $49,999 | 884 (8.1%) | 781 (6.5%) |
| $50,000 to $54,999 | 537 (4.9%) | 523 (4.3%) |
| $55,000 to $64,999 | 1,105 (10.1%) | 726 (6.0%) |
| $65,000 to $74,999 | 616 (5.6%) | 349 (2.9%) |
| $75,000 to $99,999 | 952 (8.7%) | 729 (6.0%) |
| $100,000+ | 1,088 (9.9%) | 378 (3.1%) |
| Total | 10,981 (100.0%) | 12,083 (100.0%) |
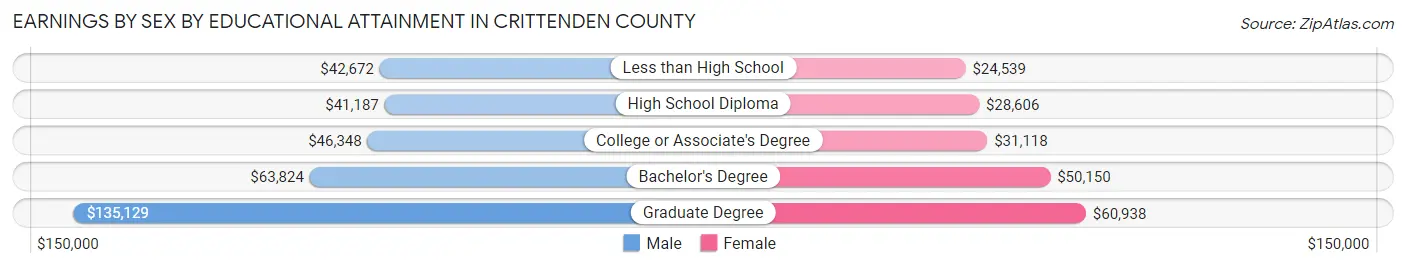
Earnings by Sex by Educational Attainment in Crittenden County
Average earnings in Crittenden County are $46,117 for men and $32,445 for women, a difference of 29.6%. Men with an educational attainment of graduate degree enjoy the highest average annual earnings of $135,129, while those with high school diploma education earn the least with $41,187. Women with an educational attainment of graduate degree earn the most with the average annual earnings of $60,938, while those with less than high school education have the smallest earnings of $24,539.
| Educational Attainment | Male Income | Female Income |
| Less than High School | $42,672 | $24,539 |
| High School Diploma | $41,187 | $28,606 |
| College or Associate's Degree | $46,348 | $31,118 |
| Bachelor's Degree | $63,824 | $50,150 |
| Graduate Degree | $135,129 | $60,938 |
| Total | $46,117 | $32,445 |
Family Income in Crittenden County
Family Income Brackets in Crittenden County
According to the Crittenden County family income data, there are 2,258 families falling into the $50,000 to $74,999 income range, which is the most common income bracket and makes up 18.9% of all families. Conversely, the $150,000 to $199,999 income bracket is the least frequent group with only 538 families (4.5%) belonging to this category.
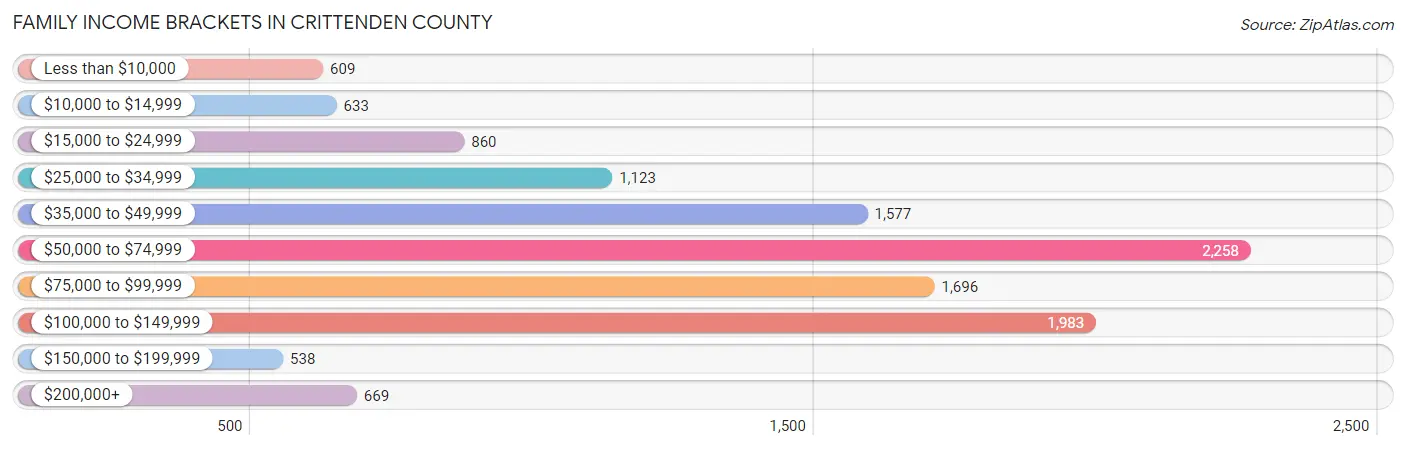
| Income Bracket | # Families | % Families |
| Less than $10,000 | 609 | 5.1% |
| $10,000 to $14,999 | 633 | 5.3% |
| $15,000 to $24,999 | 860 | 7.2% |
| $25,000 to $34,999 | 1,123 | 9.4% |
| $35,000 to $49,999 | 1,577 | 13.2% |
| $50,000 to $74,999 | 2,258 | 18.9% |
| $75,000 to $99,999 | 1,696 | 14.2% |
| $100,000 to $149,999 | 1,983 | 16.6% |
| $150,000 to $199,999 | 538 | 4.5% |
| $200,000+ | 669 | 5.6% |
Family Income by Famaliy Size in Crittenden County
7+ person families (182 | 1.5%) account for the highest median family income in Crittenden County with $82,333 per family, while 2-person families (5,807 | 48.6%) have the highest median income of $27,909 per family member.
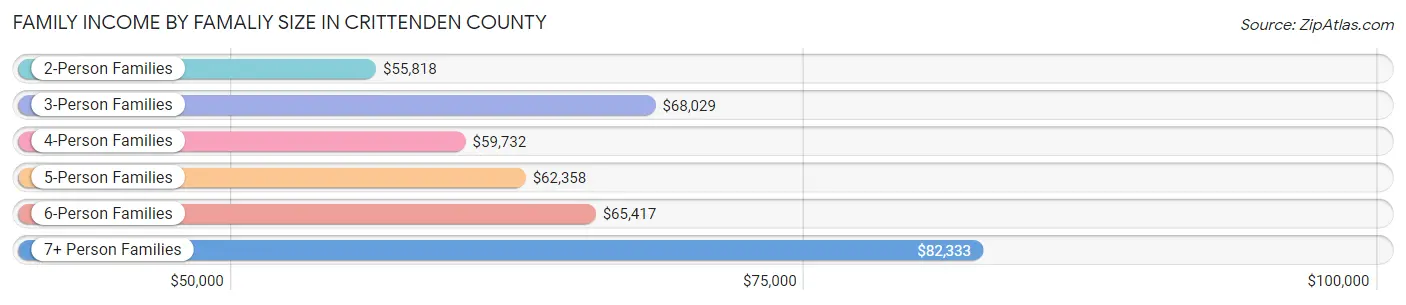
| Income Bracket | # Families | Median Income |
| 2-Person Families | 5,807 (48.6%) | $55,818 |
| 3-Person Families | 2,807 (23.5%) | $68,029 |
| 4-Person Families | 1,851 (15.5%) | $59,732 |
| 5-Person Families | 1,041 (8.7%) | $62,358 |
| 6-Person Families | 258 (2.2%) | $65,417 |
| 7+ Person Families | 182 (1.5%) | $82,333 |
| Total | 11,946 (100.0%) | $60,037 |
Family Income by Number of Earners in Crittenden County
The median family income in Crittenden County is $60,037, with families comprising 3+ earners (901) having the highest median family income of $121,985, while families with no earners (1,764) have the lowest median family income of $22,149, accounting for 7.5% and 14.8% of families, respectively.
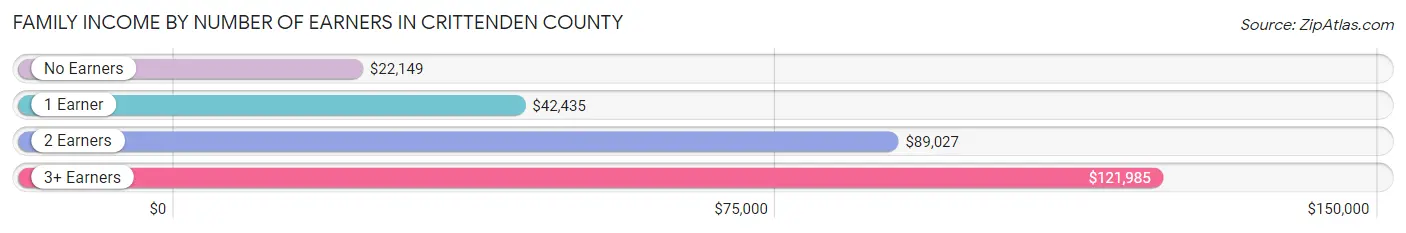
| Number of Earners | # Families | Median Income |
| No Earners | 1,764 (14.8%) | $22,149 |
| 1 Earner | 4,802 (40.2%) | $42,435 |
| 2 Earners | 4,479 (37.5%) | $89,027 |
| 3+ Earners | 901 (7.5%) | $121,985 |
| Total | 11,946 (100.0%) | $60,037 |
Household Income in Crittenden County
Household Income Brackets in Crittenden County
With 3,253 households falling in the category, the $50,000 to $74,999 income range is the most frequent in Crittenden County, accounting for 17.5% of all households. In contrast, only 613 households (3.3%) fall into the $150,000 to $199,999 income bracket, making it the least populous group.
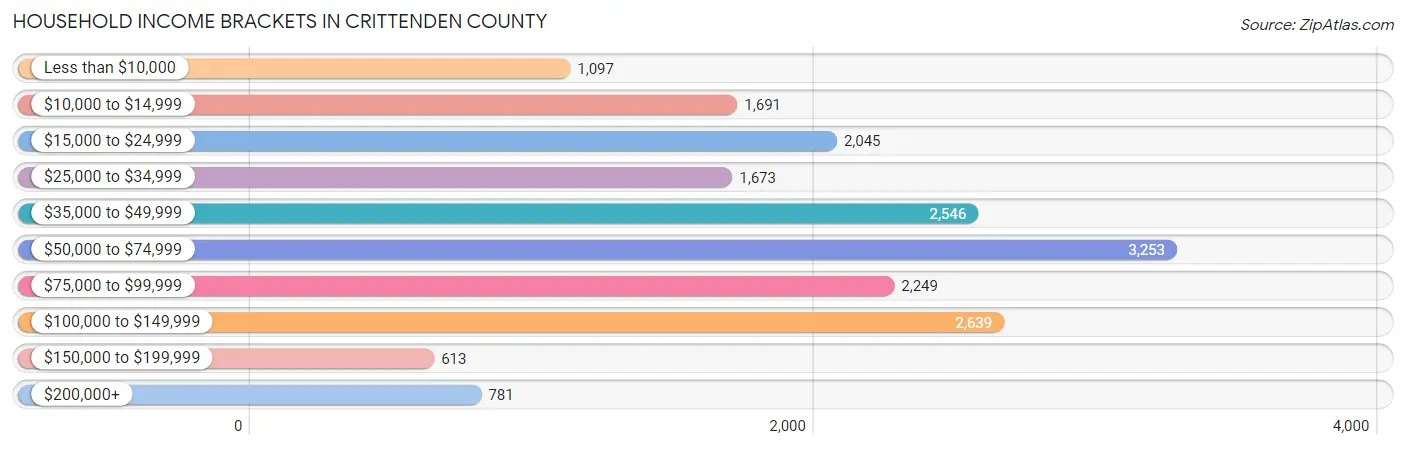
| Income Bracket | # Households | % Households |
| Less than $10,000 | 1,097 | 5.9% |
| $10,000 to $14,999 | 1,691 | 9.1% |
| $15,000 to $24,999 | 2,045 | 11.0% |
| $25,000 to $34,999 | 1,673 | 9.0% |
| $35,000 to $49,999 | 2,546 | 13.7% |
| $50,000 to $74,999 | 3,253 | 17.5% |
| $75,000 to $99,999 | 2,249 | 12.1% |
| $100,000 to $149,999 | 2,639 | 14.2% |
| $150,000 to $199,999 | 613 | 3.3% |
| $200,000+ | 781 | 4.2% |
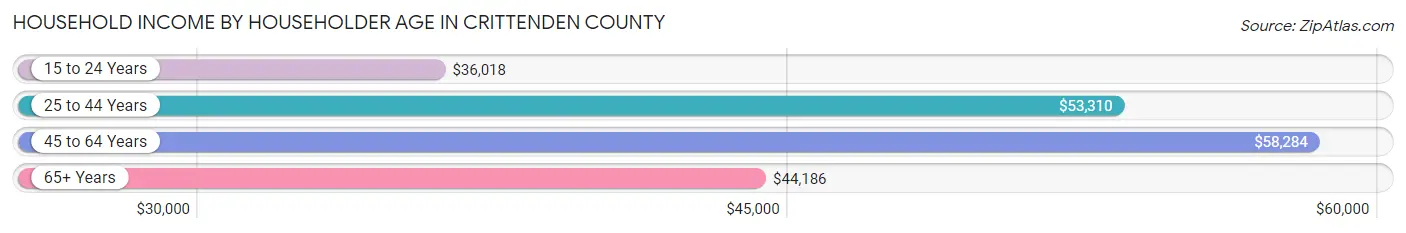
Household Income by Householder Age in Crittenden County
The median household income in Crittenden County is $51,860, with the highest median household income of $58,284 found in the 45 to 64 years age bracket for the primary householder. A total of 6,979 households (37.6%) fall into this category. Meanwhile, the 15 to 24 years age bracket for the primary householder has the lowest median household income of $36,018, with 883 households (4.8%) in this group.
| Income Bracket | # Households | Median Income |
| 15 to 24 Years | 883 (4.8%) | $36,018 |
| 25 to 44 Years | 6,186 (33.3%) | $53,310 |
| 45 to 64 Years | 6,979 (37.6%) | $58,284 |
| 65+ Years | 4,539 (24.4%) | $44,186 |
| Total | 18,587 (100.0%) | $51,860 |
Poverty in Crittenden County
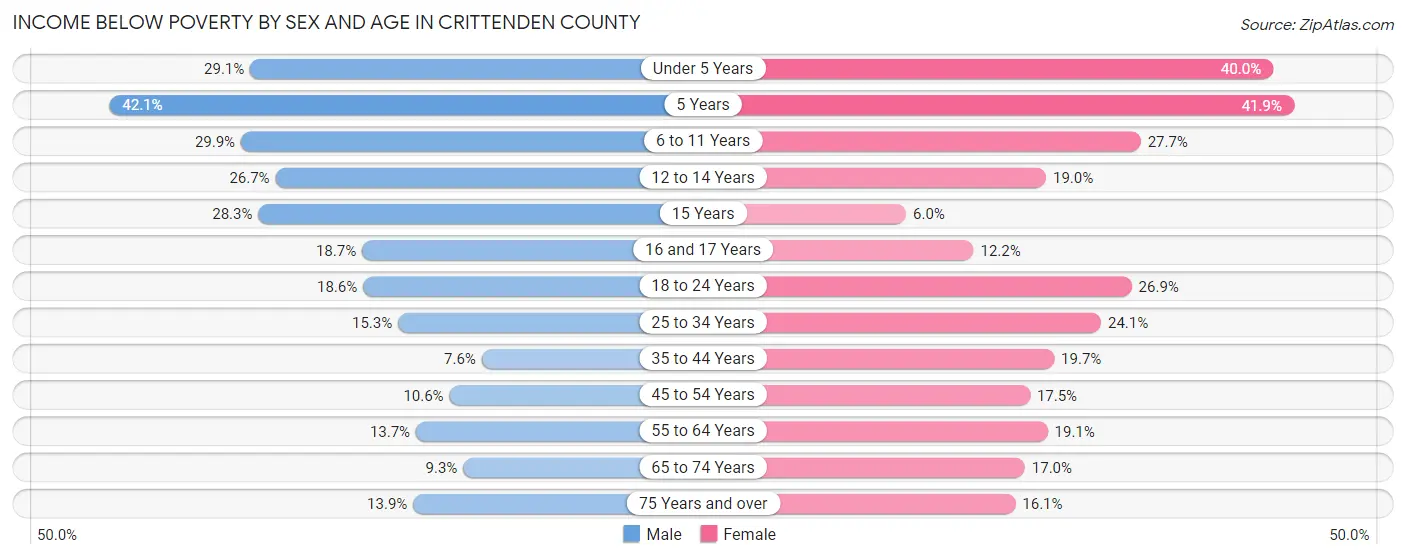
Income Below Poverty by Sex and Age in Crittenden County
With 17.3% poverty level for males and 21.8% for females among the residents of Crittenden County, 5 year old males and 5 year old females are the most vulnerable to poverty, with 166 males (42.1%) and 130 females (41.9%) in their respective age groups living below the poverty level.
| Age Bracket | Male | Female |
| Under 5 Years | 527 (29.1%) | 658 (40.0%) |
| 5 Years | 166 (42.1%) | 130 (41.9%) |
| 6 to 11 Years | 660 (29.9%) | 534 (27.7%) |
| 12 to 14 Years | 284 (26.7%) | 215 (19.0%) |
| 15 Years | 122 (28.3%) | 25 (6.0%) |
| 16 and 17 Years | 123 (18.7%) | 96 (12.2%) |
| 18 to 24 Years | 413 (18.6%) | 577 (26.9%) |
| 25 to 34 Years | 427 (15.3%) | 797 (24.1%) |
| 35 to 44 Years | 195 (7.6%) | 598 (19.7%) |
| 45 to 54 Years | 265 (10.6%) | 547 (17.5%) |
| 55 to 64 Years | 391 (13.7%) | 596 (19.1%) |
| 65 to 74 Years | 176 (9.3%) | 379 (17.0%) |
| 75 Years and over | 146 (13.9%) | 258 (16.1%) |
| Total | 3,895 (17.3%) | 5,410 (21.8%) |
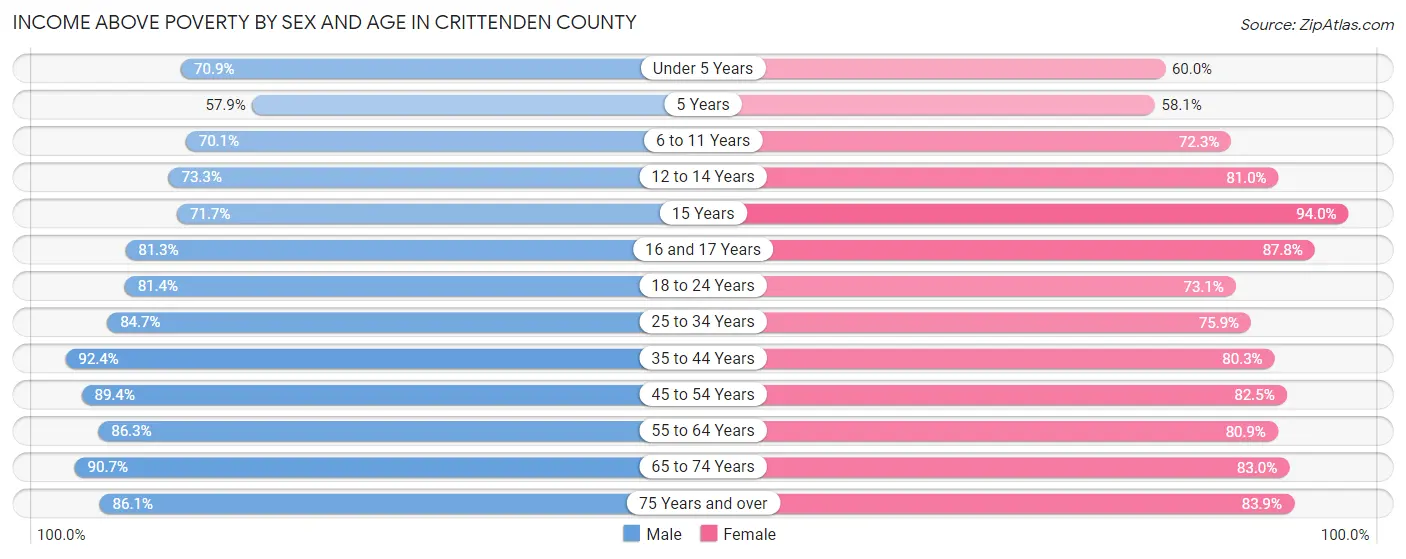
Income Above Poverty by Sex and Age in Crittenden County
According to the poverty statistics in Crittenden County, males aged 35 to 44 years and females aged 15 years are the age groups that are most secure financially, with 92.4% of males and 94.0% of females in these age groups living above the poverty line.
| Age Bracket | Male | Female |
| Under 5 Years | 1,286 (70.9%) | 986 (60.0%) |
| 5 Years | 228 (57.9%) | 180 (58.1%) |
| 6 to 11 Years | 1,546 (70.1%) | 1,391 (72.3%) |
| 12 to 14 Years | 779 (73.3%) | 919 (81.0%) |
| 15 Years | 309 (71.7%) | 394 (94.0%) |
| 16 and 17 Years | 535 (81.3%) | 689 (87.8%) |
| 18 to 24 Years | 1,809 (81.4%) | 1,568 (73.1%) |
| 25 to 34 Years | 2,357 (84.7%) | 2,515 (75.9%) |
| 35 to 44 Years | 2,376 (92.4%) | 2,436 (80.3%) |
| 45 to 54 Years | 2,241 (89.4%) | 2,585 (82.5%) |
| 55 to 64 Years | 2,468 (86.3%) | 2,524 (80.9%) |
| 65 to 74 Years | 1,717 (90.7%) | 1,852 (83.0%) |
| 75 Years and over | 901 (86.1%) | 1,343 (83.9%) |
| Total | 18,552 (82.7%) | 19,382 (78.2%) |
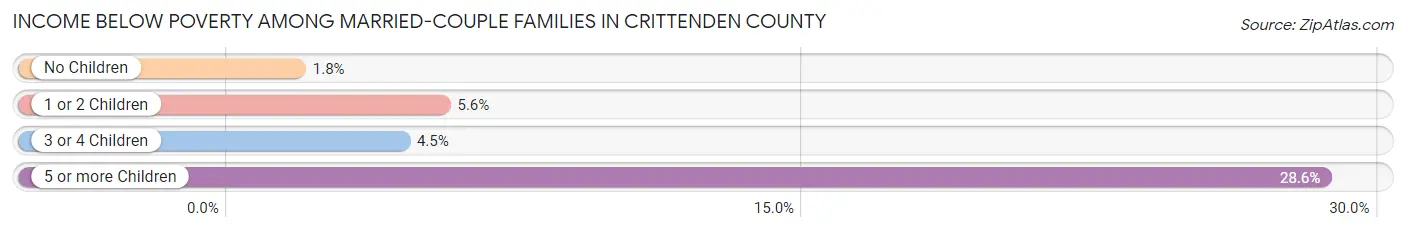
Income Below Poverty Among Married-Couple Families in Crittenden County
The poverty statistics for married-couple families in Crittenden County show that 3.5% or 227 of the total 6,476 families live below the poverty line. Families with 5 or more children have the highest poverty rate of 28.6%, comprising of 20 families. On the other hand, families with no children have the lowest poverty rate of 1.8%, which includes 67 families.
| Children | Above Poverty | Below Poverty |
| No Children | 3,721 (98.2%) | 67 (1.8%) |
| 1 or 2 Children | 2,010 (94.5%) | 118 (5.6%) |
| 3 or 4 Children | 468 (95.5%) | 22 (4.5%) |
| 5 or more Children | 50 (71.4%) | 20 (28.6%) |
| Total | 6,249 (96.5%) | 227 (3.5%) |
Income Below Poverty Among Single-Parent Households in Crittenden County
According to the poverty data in Crittenden County, 15.4% or 185 single-father households and 33.8% or 1,443 single-mother households are living below the poverty line. Among single-father households, those with 3 or 4 children have the highest poverty rate, with 28 households (50.9%) experiencing poverty. Likewise, among single-mother households, those with 5 or more children have the highest poverty rate, with 40 households (64.5%) falling below the poverty line.
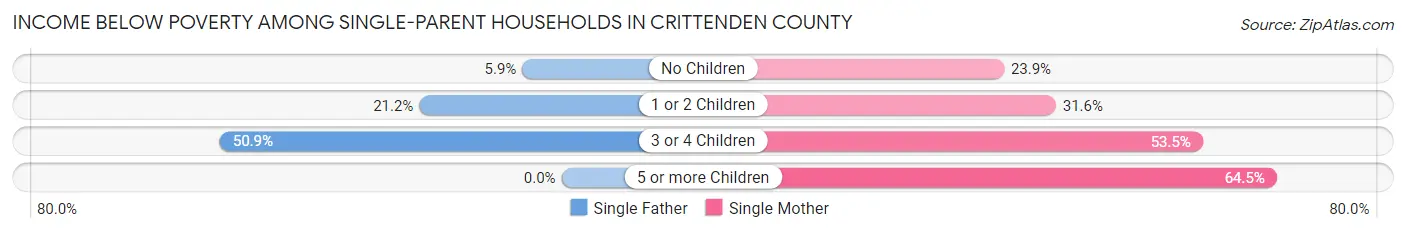
| Children | Single Father | Single Mother |
| No Children | 33 (5.9%) | 314 (23.9%) |
| 1 or 2 Children | 124 (21.2%) | 660 (31.6%) |
| 3 or 4 Children | 28 (50.9%) | 429 (53.5%) |
| 5 or more Children | 0 (0.0%) | 40 (64.5%) |
| Total | 185 (15.4%) | 1,443 (33.8%) |
Income Below Poverty Among Married-Couple vs Single-Parent Households in Crittenden County
The poverty data for Crittenden County shows that 227 of the married-couple family households (3.5%) and 1,628 of the single-parent households (29.8%) are living below the poverty level. Within the married-couple family households, those with 5 or more children have the highest poverty rate, with 20 households (28.6%) falling below the poverty line. Among the single-parent households, those with 5 or more children have the highest poverty rate, with 40 household (64.5%) living below poverty.
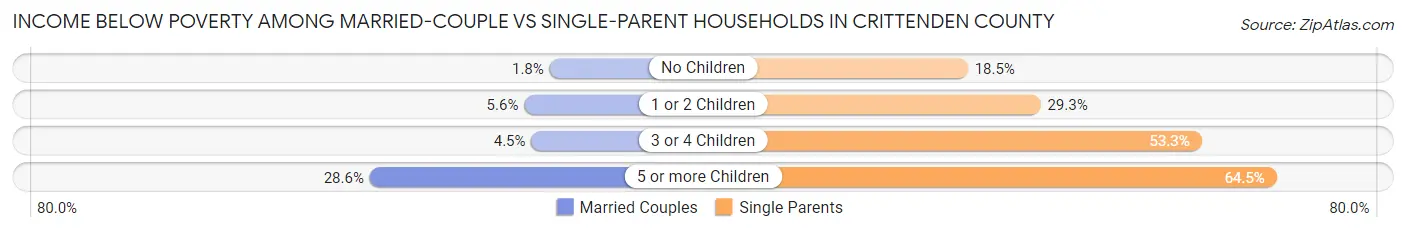
| Children | Married-Couple Families | Single-Parent Households |
| No Children | 67 (1.8%) | 347 (18.5%) |
| 1 or 2 Children | 118 (5.6%) | 784 (29.3%) |
| 3 or 4 Children | 22 (4.5%) | 457 (53.3%) |
| 5 or more Children | 20 (28.6%) | 40 (64.5%) |
| Total | 227 (3.5%) | 1,628 (29.8%) |
Race in Crittenden County
The most populous races in Crittenden County are Black / African American (24,005 | 50.1%), White / Caucasian (19,945 | 41.6%), and Two or more Races (3,446 | 7.2%).
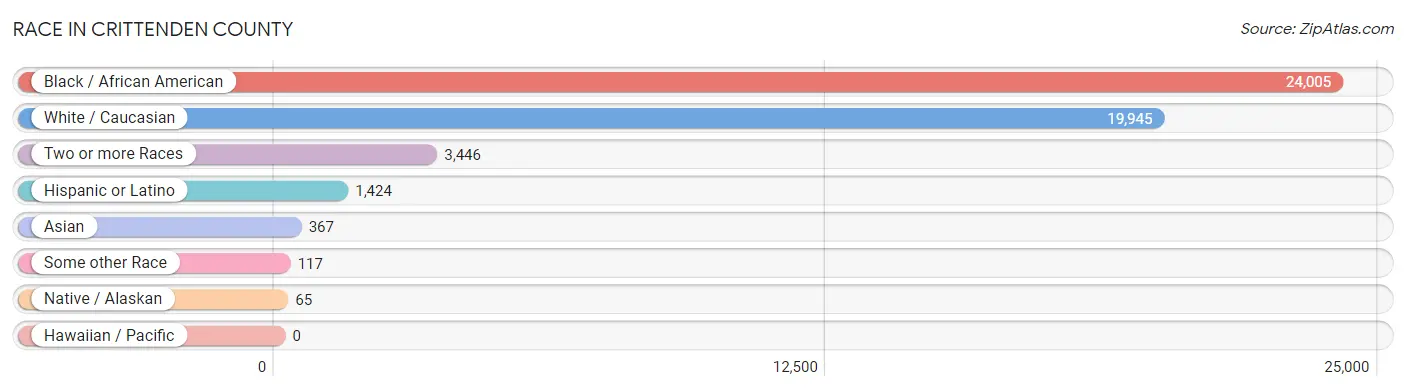
| Race | # Population | % Population |
| Asian | 367 | 0.8% |
| Black / African American | 24,005 | 50.1% |
| Hawaiian / Pacific | 0 | 0.0% |
| Hispanic or Latino | 1,424 | 3.0% |
| Native / Alaskan | 65 | 0.1% |
| White / Caucasian | 19,945 | 41.6% |
| Two or more Races | 3,446 | 7.2% |
| Some other Race | 117 | 0.2% |
| Total | 47,945 | 100.0% |
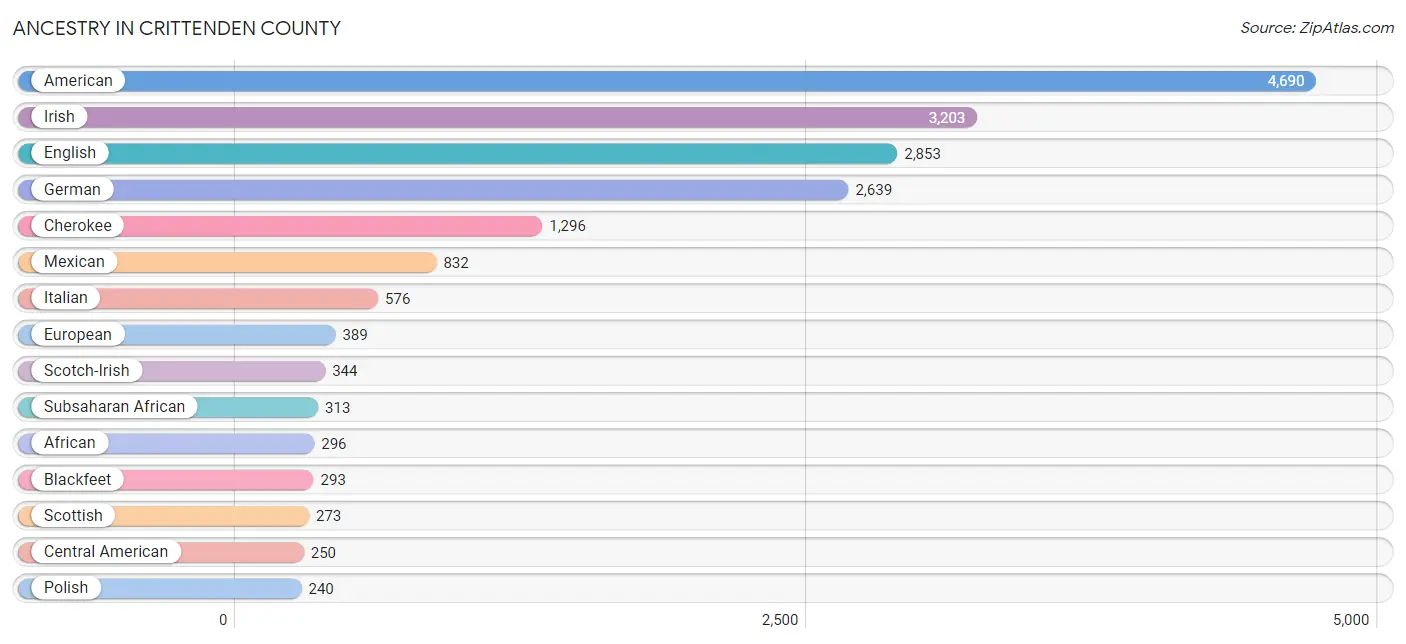
Ancestry in Crittenden County
The most populous ancestries reported in Crittenden County are American (4,690 | 9.8%), Irish (3,203 | 6.7%), English (2,853 | 5.9%), German (2,639 | 5.5%), and Cherokee (1,296 | 2.7%), together accounting for 30.6% of all Crittenden County residents.
| Ancestry | # Population | % Population |
| African | 296 | 0.6% |
| American | 4,690 | 9.8% |
| Arab | 116 | 0.2% |
| Argentinean | 101 | 0.2% |
| Belizean | 12 | 0.0% |
| Bhutanese | 6 | 0.0% |
| Blackfeet | 293 | 0.6% |
| British | 29 | 0.1% |
| Burmese | 131 | 0.3% |
| Cajun | 2 | 0.0% |
| Canadian | 19 | 0.0% |
| Central American | 250 | 0.5% |
| Central American Indian | 11 | 0.0% |
| Cherokee | 1,296 | 2.7% |
| Chickasaw | 33 | 0.1% |
| Chippewa | 35 | 0.1% |
| Choctaw | 62 | 0.1% |
| Costa Rican | 23 | 0.1% |
| Crow | 3 | 0.0% |
| Cuban | 66 | 0.1% |
| Czech | 5 | 0.0% |
| Czechoslovakian | 11 | 0.0% |
| Danish | 40 | 0.1% |
| Dutch | 159 | 0.3% |
| English | 2,853 | 5.9% |
| European | 389 | 0.8% |
| Finnish | 5 | 0.0% |
| French | 198 | 0.4% |
| French Canadian | 7 | 0.0% |
| German | 2,639 | 5.5% |
| German Russian | 13 | 0.0% |
| Guatemalan | 173 | 0.4% |
| Haitian | 19 | 0.0% |
| Honduran | 18 | 0.0% |
| Indian (Asian) | 43 | 0.1% |
| Irish | 3,203 | 6.7% |
| Iroquois | 20 | 0.0% |
| Italian | 576 | 1.2% |
| Jordanian | 12 | 0.0% |
| Korean | 135 | 0.3% |
| Mexican | 832 | 1.7% |
| Navajo | 10 | 0.0% |
| Nicaraguan | 2 | 0.0% |
| Nigerian | 17 | 0.0% |
| Norwegian | 119 | 0.3% |
| Panamanian | 6 | 0.0% |
| Polish | 240 | 0.5% |
| Potawatomi | 7 | 0.0% |
| Puerto Rican | 28 | 0.1% |
| Russian | 72 | 0.2% |
| Salvadoran | 28 | 0.1% |
| Samoan | 177 | 0.4% |
| Scandinavian | 148 | 0.3% |
| Scotch-Irish | 344 | 0.7% |
| Scottish | 273 | 0.6% |
| Sioux | 98 | 0.2% |
| Slavic | 6 | 0.0% |
| Slovene | 9 | 0.0% |
| South American | 105 | 0.2% |
| Spanish | 52 | 0.1% |
| Sri Lankan | 72 | 0.2% |
| Subsaharan African | 313 | 0.6% |
| Swedish | 60 | 0.1% |
| Swiss | 8 | 0.0% |
| Thai | 58 | 0.1% |
| Ukrainian | 44 | 0.1% |
| Venezuelan | 4 | 0.0% |
| Welsh | 79 | 0.2% |
| West Indian | 23 | 0.1% |
| Yugoslavian | 22 | 0.1% | View All 70 Rows |
Immigrants in Crittenden County
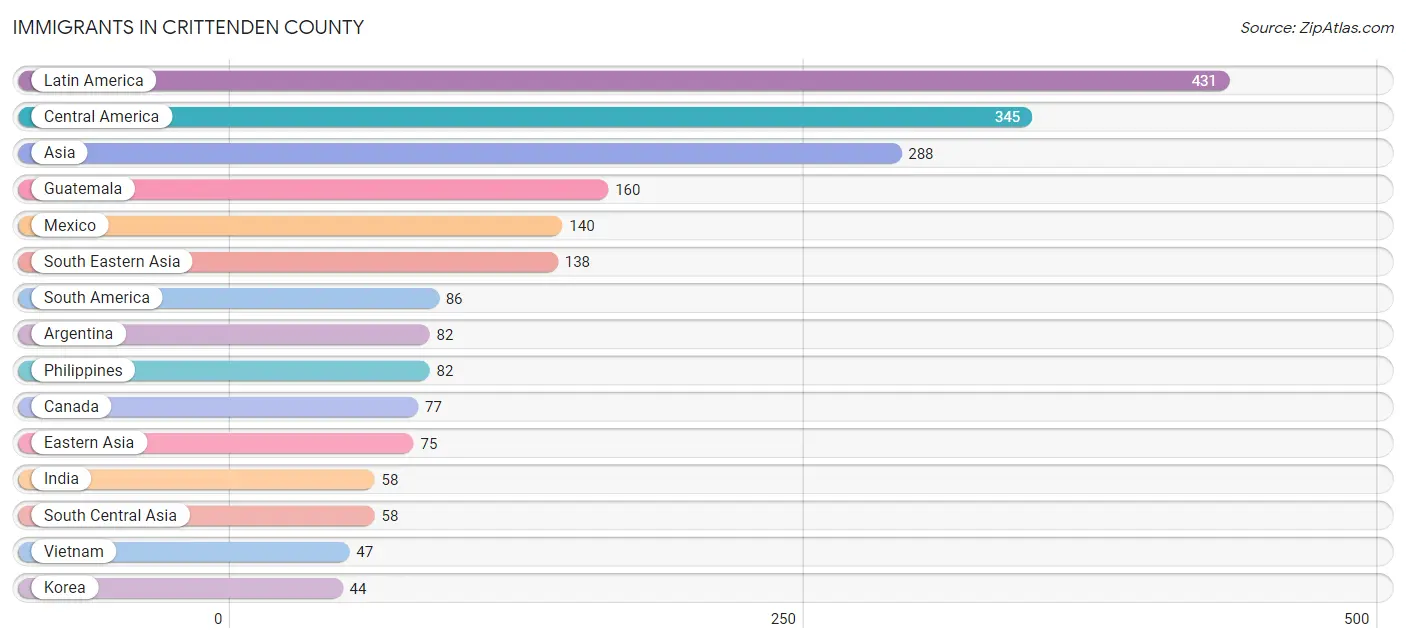
The most numerous immigrant groups reported in Crittenden County came from Latin America (431 | 0.9%), Central America (345 | 0.7%), Asia (288 | 0.6%), Guatemala (160 | 0.3%), and Mexico (140 | 0.3%), together accounting for 2.8% of all Crittenden County residents.
| Immigration Origin | # Population | % Population |
| Africa | 22 | 0.1% |
| Argentina | 82 | 0.2% |
| Asia | 288 | 0.6% |
| Canada | 77 | 0.2% |
| Central America | 345 | 0.7% |
| China | 25 | 0.1% |
| Costa Rica | 19 | 0.0% |
| Eastern Asia | 75 | 0.2% |
| Eastern Europe | 12 | 0.0% |
| El Salvador | 18 | 0.0% |
| Europe | 40 | 0.1% |
| France | 28 | 0.1% |
| Guatemala | 160 | 0.3% |
| Honduras | 6 | 0.0% |
| Hong Kong | 16 | 0.0% |
| India | 58 | 0.1% |
| Indonesia | 9 | 0.0% |
| Japan | 6 | 0.0% |
| Jordan | 12 | 0.0% |
| Korea | 44 | 0.1% |
| Kuwait | 5 | 0.0% |
| Latin America | 431 | 0.9% |
| Mexico | 140 | 0.3% |
| Nicaragua | 2 | 0.0% |
| Nigeria | 7 | 0.0% |
| Northern Africa | 15 | 0.0% |
| Philippines | 82 | 0.2% |
| Russia | 12 | 0.0% |
| South America | 86 | 0.2% |
| South Central Asia | 58 | 0.1% |
| South Eastern Asia | 138 | 0.3% |
| Venezuela | 4 | 0.0% |
| Vietnam | 47 | 0.1% |
| Western Africa | 7 | 0.0% |
| Western Asia | 17 | 0.0% |
| Western Europe | 28 | 0.1% | View All 36 Rows |
Sex and Age in Crittenden County
Sex and Age in Crittenden County
The most populous age groups in Crittenden County are 5 to 9 Years (1,880 | 8.3%) for men and 5 to 9 Years (1,830 | 7.3%) for women.

| Age Bracket | Male | Female |
| Under 5 Years | 1,813 (8.0%) | 1,721 (6.8%) |
| 5 to 9 Years | 1,880 (8.3%) | 1,830 (7.3%) |
| 10 to 14 Years | 1,812 (8.0%) | 1,640 (6.5%) |
| 15 to 19 Years | 1,767 (7.8%) | 1,796 (7.1%) |
| 20 to 24 Years | 1,553 (6.8%) | 1,561 (6.2%) |
| 25 to 29 Years | 1,480 (6.5%) | 1,708 (6.8%) |
| 30 to 34 Years | 1,368 (6.0%) | 1,623 (6.4%) |
| 35 to 39 Years | 1,302 (5.7%) | 1,632 (6.5%) |
| 40 to 44 Years | 1,331 (5.9%) | 1,431 (5.7%) |
| 45 to 49 Years | 1,204 (5.3%) | 1,549 (6.1%) |
| 50 to 54 Years | 1,311 (5.8%) | 1,596 (6.3%) |
| 55 to 59 Years | 1,402 (6.2%) | 1,528 (6.1%) |
| 60 to 64 Years | 1,489 (6.6%) | 1,617 (6.4%) |
| 65 to 69 Years | 1,148 (5.1%) | 1,398 (5.6%) |
| 70 to 74 Years | 792 (3.5%) | 873 (3.5%) |
| 75 to 79 Years | 536 (2.4%) | 834 (3.3%) |
| 80 to 84 Years | 342 (1.5%) | 427 (1.7%) |
| 85 Years and over | 209 (0.9%) | 442 (1.8%) |
| Total | 22,739 (100.0%) | 25,206 (100.0%) |
Families and Households in Crittenden County
Median Family Size in Crittenden County
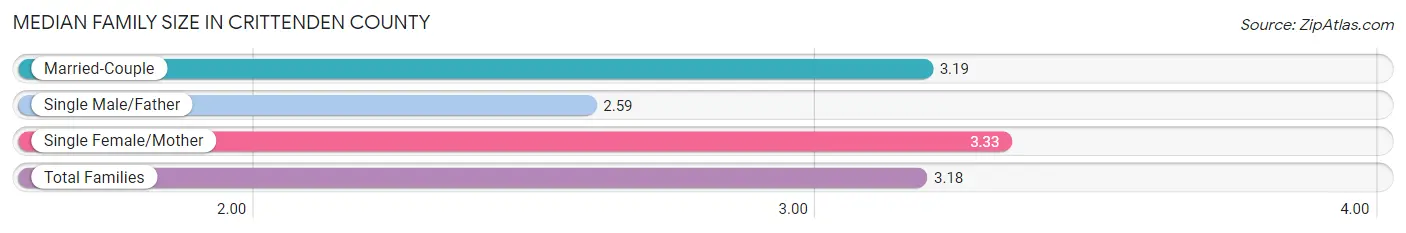
The median family size in Crittenden County is 3.18 persons per family, with single female/mother families (4,267 | 35.7%) accounting for the largest median family size of 3.33 persons per family. On the other hand, single male/father families (1,203 | 10.1%) represent the smallest median family size with 2.59 persons per family.
| Family Type | # Families | Family Size |
| Married-Couple | 6,476 (54.2%) | 3.19 |
| Single Male/Father | 1,203 (10.1%) | 2.59 |
| Single Female/Mother | 4,267 (35.7%) | 3.33 |
| Total Families | 11,946 (100.0%) | 3.18 |
Median Household Size in Crittenden County
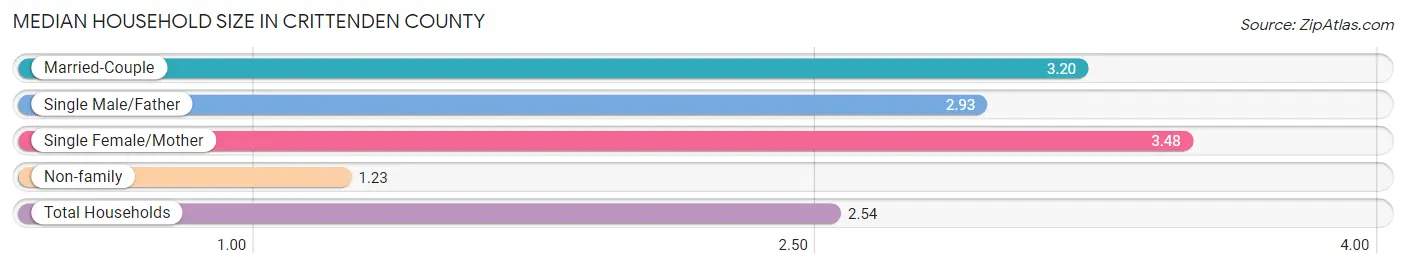
The median household size in Crittenden County is 2.54 persons per household, with single female/mother households (4,267 | 23.0%) accounting for the largest median household size of 3.48 persons per household. non-family households (6,641 | 35.7%) represent the smallest median household size with 1.23 persons per household.
| Household Type | # Households | Household Size |
| Married-Couple | 6,476 (34.8%) | 3.20 |
| Single Male/Father | 1,203 (6.5%) | 2.93 |
| Single Female/Mother | 4,267 (23.0%) | 3.48 |
| Non-family | 6,641 (35.7%) | 1.23 |
| Total Households | 18,587 (100.0%) | 2.54 |
Household Size by Marriage Status in Crittenden County
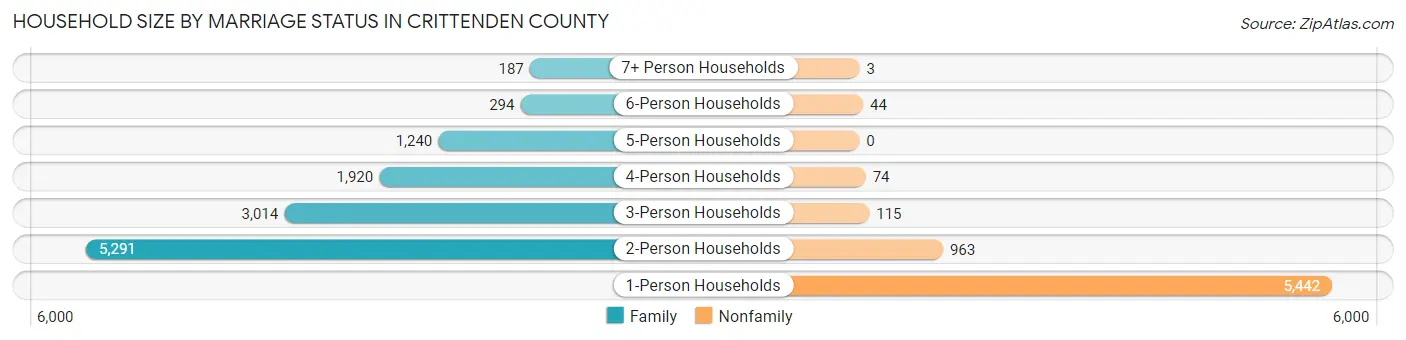
Out of a total of 18,587 households in Crittenden County, 11,946 (64.3%) are family households, while 6,641 (35.7%) are nonfamily households. The most numerous type of family households are 2-person households, comprising 5,291, and the most common type of nonfamily households are 1-person households, comprising 5,442.
| Household Size | Family Households | Nonfamily Households |
| 1-Person Households | - | 5,442 (29.3%) |
| 2-Person Households | 5,291 (28.5%) | 963 (5.2%) |
| 3-Person Households | 3,014 (16.2%) | 115 (0.6%) |
| 4-Person Households | 1,920 (10.3%) | 74 (0.4%) |
| 5-Person Households | 1,240 (6.7%) | 0 (0.0%) |
| 6-Person Households | 294 (1.6%) | 44 (0.2%) |
| 7+ Person Households | 187 (1.0%) | 3 (0.0%) |
| Total | 11,946 (64.3%) | 6,641 (35.7%) |
Female Fertility in Crittenden County
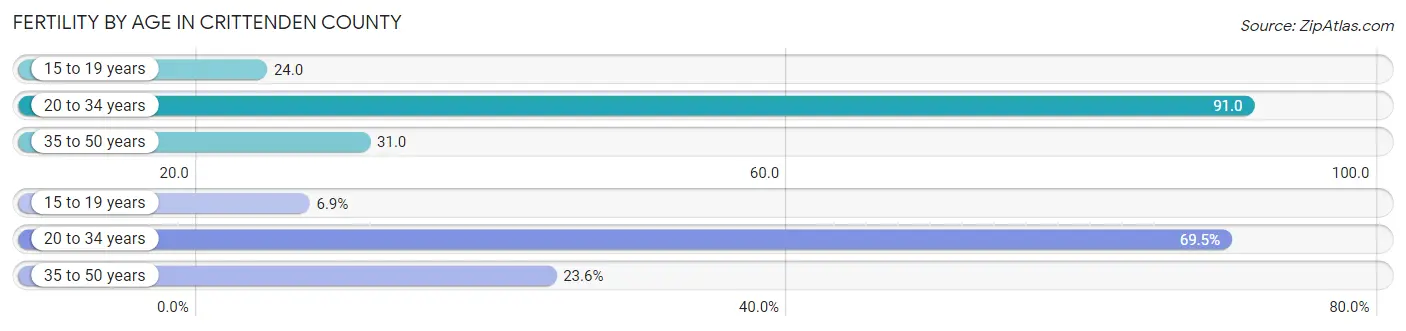
Fertility by Age in Crittenden County
Average fertility rate in Crittenden County is 55.0 births per 1,000 women. Women in the age bracket of 20 to 34 years have the highest fertility rate with 91.0 births per 1,000 women. Women in the age bracket of 20 to 34 years acount for 69.5% of all women with births.
| Age Bracket | Women with Births | Births / 1,000 Women |
| 15 to 19 years | 44 (6.9%) | 24.0 |
| 20 to 34 years | 444 (69.5%) | 91.0 |
| 35 to 50 years | 151 (23.6%) | 31.0 |
| Total | 639 (100.0%) | 55.0 |
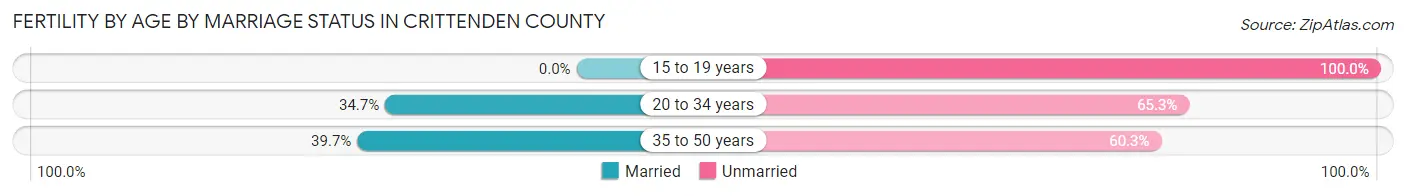
Fertility by Age by Marriage Status in Crittenden County
33.5% of women with births (639) in Crittenden County are married. The highest percentage of unmarried women with births falls into 15 to 19 years age bracket with 100.0% of them unmarried at the time of birth, while the lowest percentage of unmarried women with births belong to 35 to 50 years age bracket with 60.3% of them unmarried.
| Age Bracket | Married | Unmarried |
| 15 to 19 years | 0 (0.0%) | 44 (100.0%) |
| 20 to 34 years | 154 (34.7%) | 290 (65.3%) |
| 35 to 50 years | 60 (39.7%) | 91 (60.3%) |
| Total | 214 (33.5%) | 425 (66.5%) |
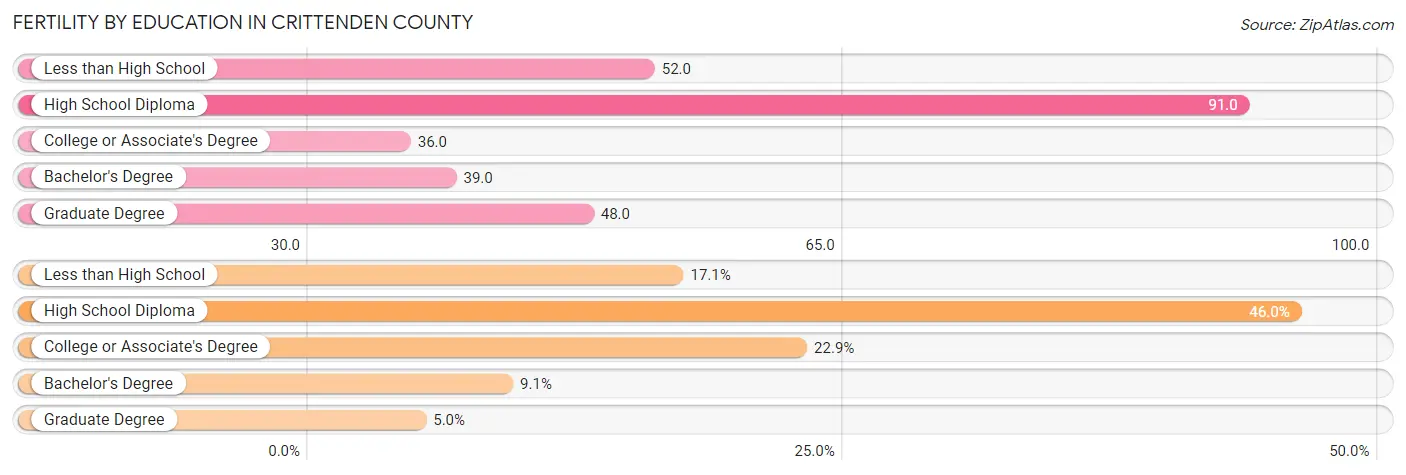
Fertility by Education in Crittenden County
Average fertility rate in Crittenden County is 55.0 births per 1,000 women. Women with the education attainment of high school diploma have the highest fertility rate of 91.0 births per 1,000 women, while women with the education attainment of college or associate's degree have the lowest fertility at 36.0 births per 1,000 women. Women with the education attainment of high school diploma represent 46.0% of all women with births.
| Educational Attainment | Women with Births | Births / 1,000 Women |
| Less than High School | 109 (17.1%) | 52.0 |
| High School Diploma | 294 (46.0%) | 91.0 |
| College or Associate's Degree | 146 (22.9%) | 36.0 |
| Bachelor's Degree | 58 (9.1%) | 39.0 |
| Graduate Degree | 32 (5.0%) | 48.0 |
| Total | 639 (100.0%) | 55.0 |
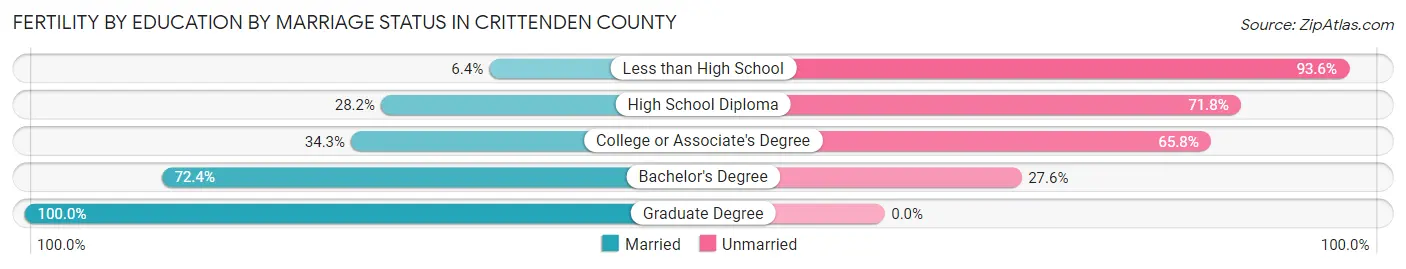
Fertility by Education by Marriage Status in Crittenden County
66.5% of women with births in Crittenden County are unmarried. Women with the educational attainment of graduate degree are most likely to be married with 100.0% of them married at childbirth, while women with the educational attainment of less than high school are least likely to be married with 93.6% of them unmarried at childbirth.
| Educational Attainment | Married | Unmarried |
| Less than High School | 7 (6.4%) | 102 (93.6%) |
| High School Diploma | 83 (28.2%) | 211 (71.8%) |
| College or Associate's Degree | 50 (34.3%) | 96 (65.7%) |
| Bachelor's Degree | 42 (72.4%) | 16 (27.6%) |
| Graduate Degree | 32 (100.0%) | 0 (0.0%) |
| Total | 214 (33.5%) | 425 (66.5%) |
Employment Characteristics in Crittenden County
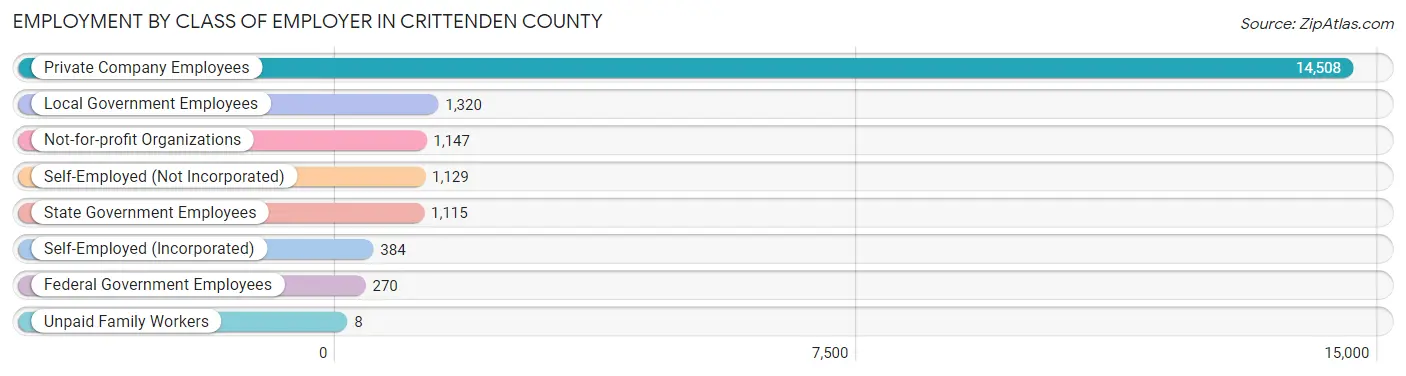
Employment by Class of Employer in Crittenden County
Among the 19,881 employed individuals in Crittenden County, private company employees (14,508 | 73.0%), local government employees (1,320 | 6.6%), and not-for-profit organizations (1,147 | 5.8%) make up the most common classes of employment.
| Employer Class | # Employees | % Employees |
| Private Company Employees | 14,508 | 73.0% |
| Self-Employed (Incorporated) | 384 | 1.9% |
| Self-Employed (Not Incorporated) | 1,129 | 5.7% |
| Not-for-profit Organizations | 1,147 | 5.8% |
| Local Government Employees | 1,320 | 6.6% |
| State Government Employees | 1,115 | 5.6% |
| Federal Government Employees | 270 | 1.4% |
| Unpaid Family Workers | 8 | 0.0% |
| Total | 19,881 | 100.0% |
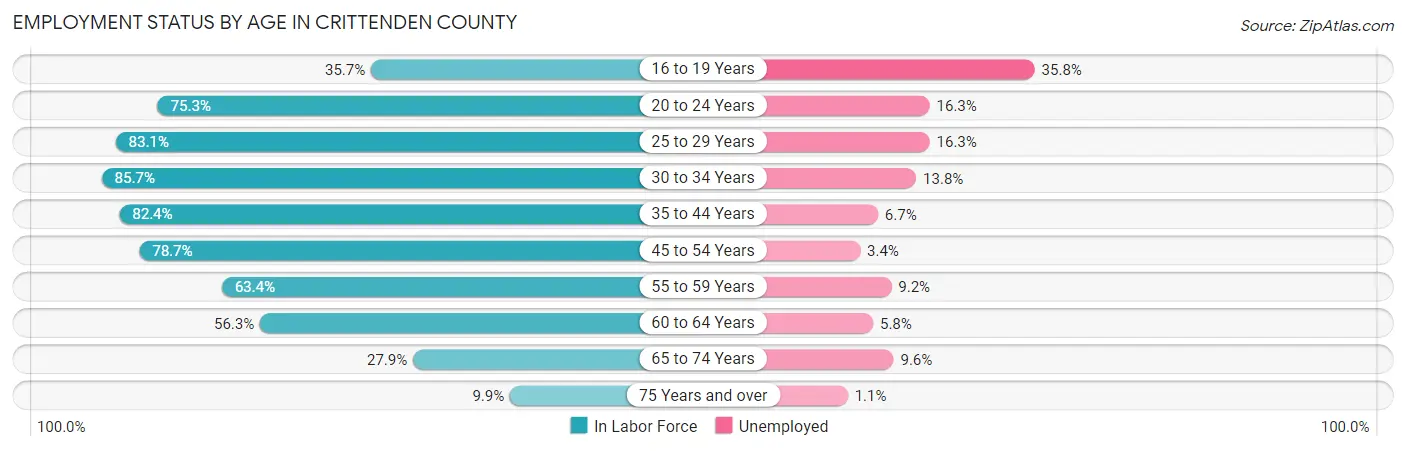
Employment Status by Age in Crittenden County
According to the labor force statistics for Crittenden County, out of the total population over 16 years of age (36,397), 62.4% or 22,712 individuals are in the labor force, with 10.4% or 2,362 of them unemployed. The age group with the highest labor force participation rate is 30 to 34 years, with 85.7% or 2,563 individuals in the labor force. Within the labor force, the 16 to 19 years age range has the highest percentage of unemployed individuals, with 35.8% or 347 of them being unemployed.
| Age Bracket | In Labor Force | Unemployed |
| 16 to 19 Years | 968 (35.7%) | 347 (35.8%) |
| 20 to 24 Years | 2,345 (75.3%) | 382 (16.3%) |
| 25 to 29 Years | 2,649 (83.1%) | 432 (16.3%) |
| 30 to 34 Years | 2,563 (85.7%) | 354 (13.8%) |
| 35 to 44 Years | 4,694 (82.4%) | 314 (6.7%) |
| 45 to 54 Years | 4,454 (78.7%) | 151 (3.4%) |
| 55 to 59 Years | 1,858 (63.4%) | 171 (9.2%) |
| 60 to 64 Years | 1,749 (56.3%) | 101 (5.8%) |
| 65 to 74 Years | 1,175 (27.9%) | 113 (9.6%) |
| 75 Years and over | 276 (9.9%) | 3 (1.1%) |
| Total | 22,712 (62.4%) | 2,362 (10.4%) |
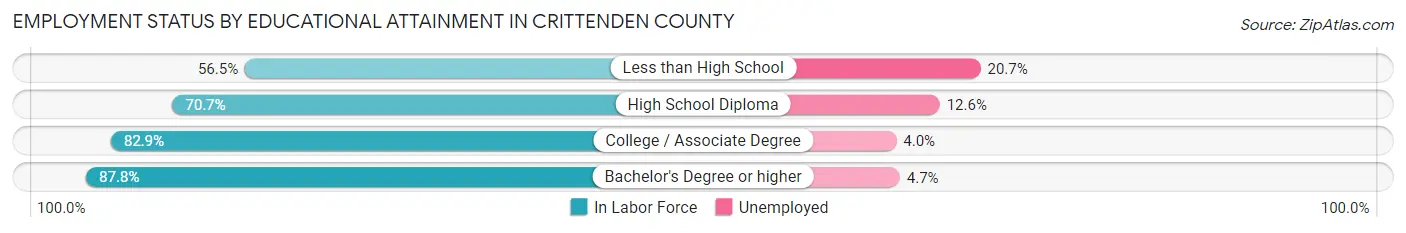
Employment Status by Educational Attainment in Crittenden County
According to labor force statistics for Crittenden County, 76.2% of individuals (17,961) out of the total population between 25 and 64 years of age (23,571) are in the labor force, with 8.5% or 1,527 of them being unemployed. The group with the highest labor force participation rate are those with the educational attainment of bachelor's degree or higher, with 87.8% or 3,801 individuals in the labor force. Within the labor force, individuals with less than high school education have the highest percentage of unemployment, with 20.7% or 330 of them being unemployed.
| Educational Attainment | In Labor Force | Unemployed |
| Less than High School | 1,596 (56.5%) | 585 (20.7%) |
| High School Diploma | 6,034 (70.7%) | 1,075 (12.6%) |
| College / Associate Degree | 6,536 (82.9%) | 315 (4.0%) |
| Bachelor's Degree or higher | 3,801 (87.8%) | 203 (4.7%) |
| Total | 17,961 (76.2%) | 2,004 (8.5%) |
Employment Occupations by Sex in Crittenden County
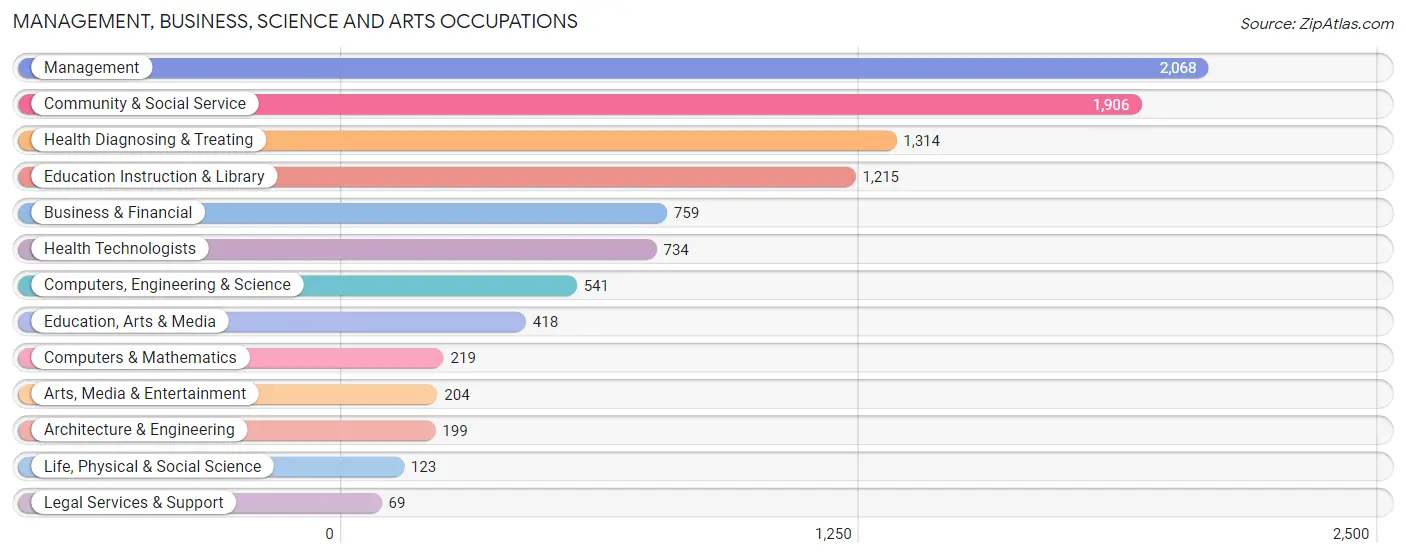
Management, Business, Science and Arts Occupations
The most common Management, Business, Science and Arts occupations in Crittenden County are Management (2,068 | 10.2%), Community & Social Service (1,906 | 9.4%), Health Diagnosing & Treating (1,314 | 6.5%), Education Instruction & Library (1,215 | 6.0%), and Business & Financial (759 | 3.7%).
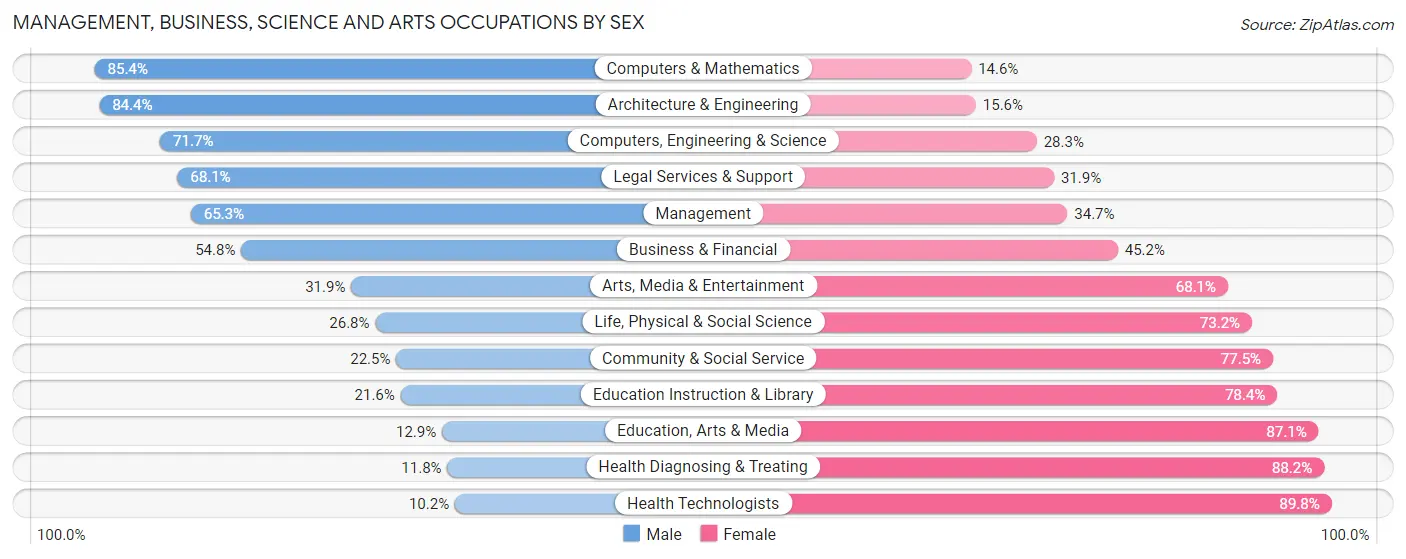
Management, Business, Science and Arts Occupations by Sex
Within the Management, Business, Science and Arts occupations in Crittenden County, the most male-oriented occupations are Computers & Mathematics (85.4%), Architecture & Engineering (84.4%), and Computers, Engineering & Science (71.7%), while the most female-oriented occupations are Health Technologists (89.8%), Health Diagnosing & Treating (88.2%), and Education, Arts & Media (87.1%).
| Occupation | Male | Female |
| Management | 1,351 (65.3%) | 717 (34.7%) |
| Business & Financial | 416 (54.8%) | 343 (45.2%) |
| Computers, Engineering & Science | 388 (71.7%) | 153 (28.3%) |
| Computers & Mathematics | 187 (85.4%) | 32 (14.6%) |
| Architecture & Engineering | 168 (84.4%) | 31 (15.6%) |
| Life, Physical & Social Science | 33 (26.8%) | 90 (73.2%) |
| Community & Social Service | 428 (22.5%) | 1,478 (77.5%) |
| Education, Arts & Media | 54 (12.9%) | 364 (87.1%) |
| Legal Services & Support | 47 (68.1%) | 22 (31.9%) |
| Education Instruction & Library | 262 (21.6%) | 953 (78.4%) |
| Arts, Media & Entertainment | 65 (31.9%) | 139 (68.1%) |
| Health Diagnosing & Treating | 155 (11.8%) | 1,159 (88.2%) |
| Health Technologists | 75 (10.2%) | 659 (89.8%) |
| Total (Category) | 2,738 (41.6%) | 3,850 (58.4%) |
| Total (Overall) | 9,793 (48.1%) | 10,562 (51.9%) |
Services Occupations
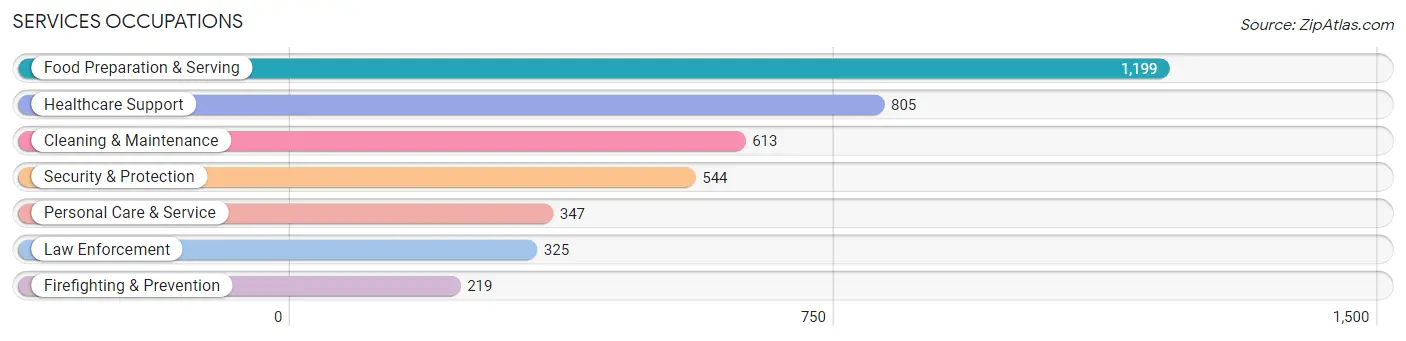
The most common Services occupations in Crittenden County are Food Preparation & Serving (1,199 | 5.9%), Healthcare Support (805 | 4.0%), Cleaning & Maintenance (613 | 3.0%), Security & Protection (544 | 2.7%), and Personal Care & Service (347 | 1.7%).
Services Occupations by Sex
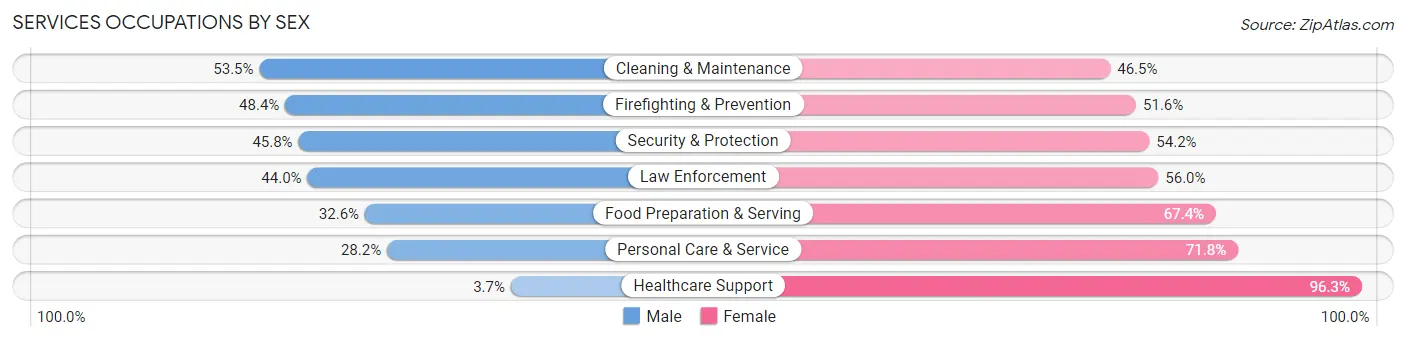
Within the Services occupations in Crittenden County, the most male-oriented occupations are Cleaning & Maintenance (53.5%), Firefighting & Prevention (48.4%), and Security & Protection (45.8%), while the most female-oriented occupations are Healthcare Support (96.3%), Personal Care & Service (71.8%), and Food Preparation & Serving (67.4%).
| Occupation | Male | Female |
| Healthcare Support | 30 (3.7%) | 775 (96.3%) |
| Security & Protection | 249 (45.8%) | 295 (54.2%) |
| Firefighting & Prevention | 106 (48.4%) | 113 (51.6%) |
| Law Enforcement | 143 (44.0%) | 182 (56.0%) |
| Food Preparation & Serving | 391 (32.6%) | 808 (67.4%) |
| Cleaning & Maintenance | 328 (53.5%) | 285 (46.5%) |
| Personal Care & Service | 98 (28.2%) | 249 (71.8%) |
| Total (Category) | 1,096 (31.2%) | 2,412 (68.8%) |
| Total (Overall) | 9,793 (48.1%) | 10,562 (51.9%) |
Sales and Office Occupations
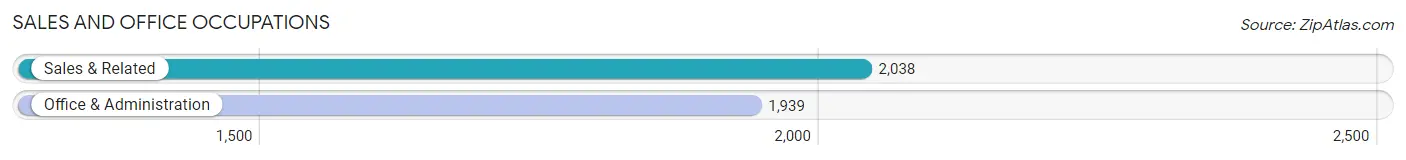
The most common Sales and Office occupations in Crittenden County are Sales & Related (2,038 | 10.0%), and Office & Administration (1,939 | 9.5%).
Sales and Office Occupations by Sex
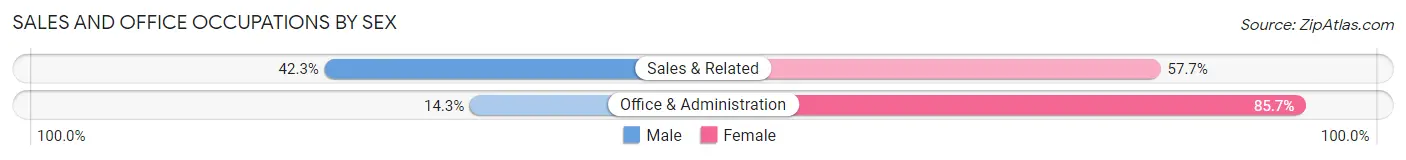
| Occupation | Male | Female |
| Sales & Related | 862 (42.3%) | 1,176 (57.7%) |
| Office & Administration | 278 (14.3%) | 1,661 (85.7%) |
| Total (Category) | 1,140 (28.7%) | 2,837 (71.3%) |
| Total (Overall) | 9,793 (48.1%) | 10,562 (51.9%) |
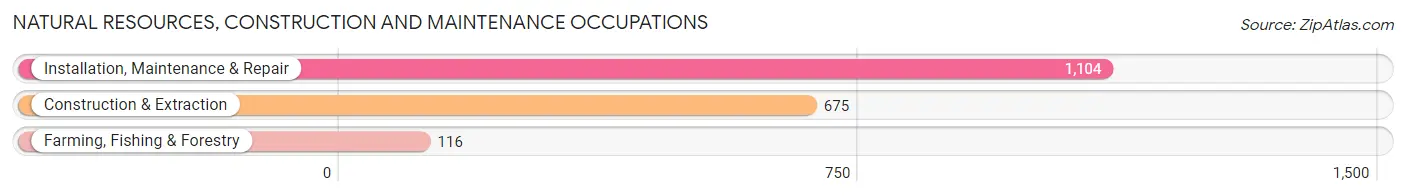
Natural Resources, Construction and Maintenance Occupations
The most common Natural Resources, Construction and Maintenance occupations in Crittenden County are Installation, Maintenance & Repair (1,104 | 5.4%), Construction & Extraction (675 | 3.3%), and Farming, Fishing & Forestry (116 | 0.6%).
Natural Resources, Construction and Maintenance Occupations by Sex
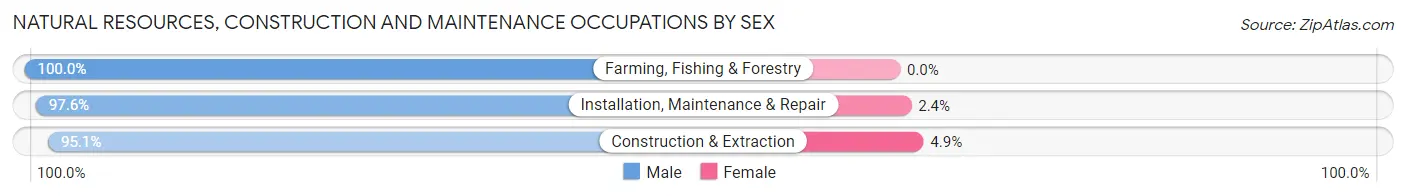
| Occupation | Male | Female |
| Farming, Fishing & Forestry | 116 (100.0%) | 0 (0.0%) |
| Construction & Extraction | 642 (95.1%) | 33 (4.9%) |
| Installation, Maintenance & Repair | 1,078 (97.6%) | 26 (2.4%) |
| Total (Category) | 1,836 (96.9%) | 59 (3.1%) |
| Total (Overall) | 9,793 (48.1%) | 10,562 (51.9%) |
Production, Transportation and Moving Occupations
The most common Production, Transportation and Moving occupations in Crittenden County are Material Moving (1,739 | 8.5%), Production (1,376 | 6.8%), and Transportation (1,272 | 6.2%).
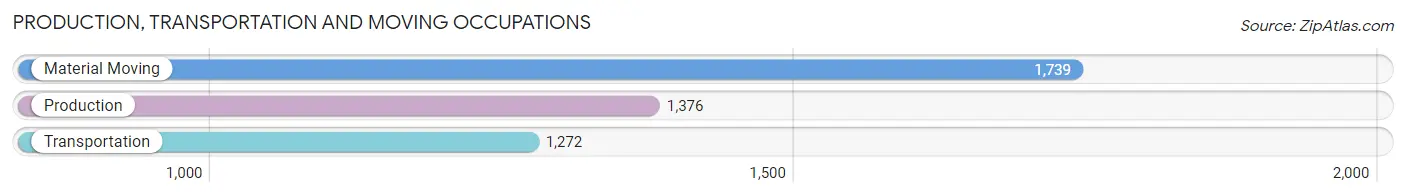
Production, Transportation and Moving Occupations by Sex
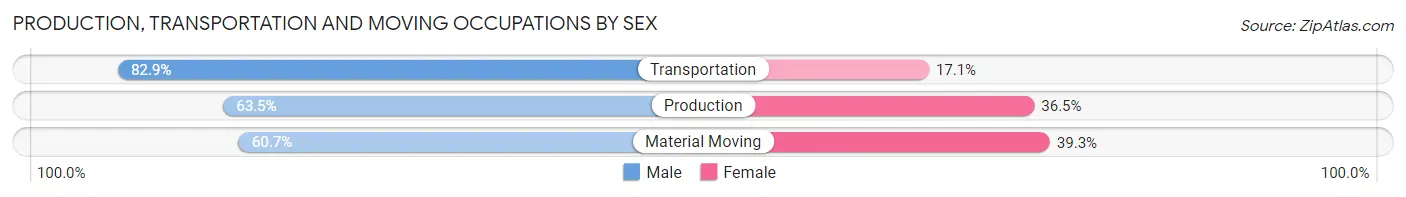
| Occupation | Male | Female |
| Production | 874 (63.5%) | 502 (36.5%) |
| Transportation | 1,054 (82.9%) | 218 (17.1%) |
| Material Moving | 1,055 (60.7%) | 684 (39.3%) |
| Total (Category) | 2,983 (68.0%) | 1,404 (32.0%) |
| Total (Overall) | 9,793 (48.1%) | 10,562 (51.9%) |
Employment Industries by Sex in Crittenden County
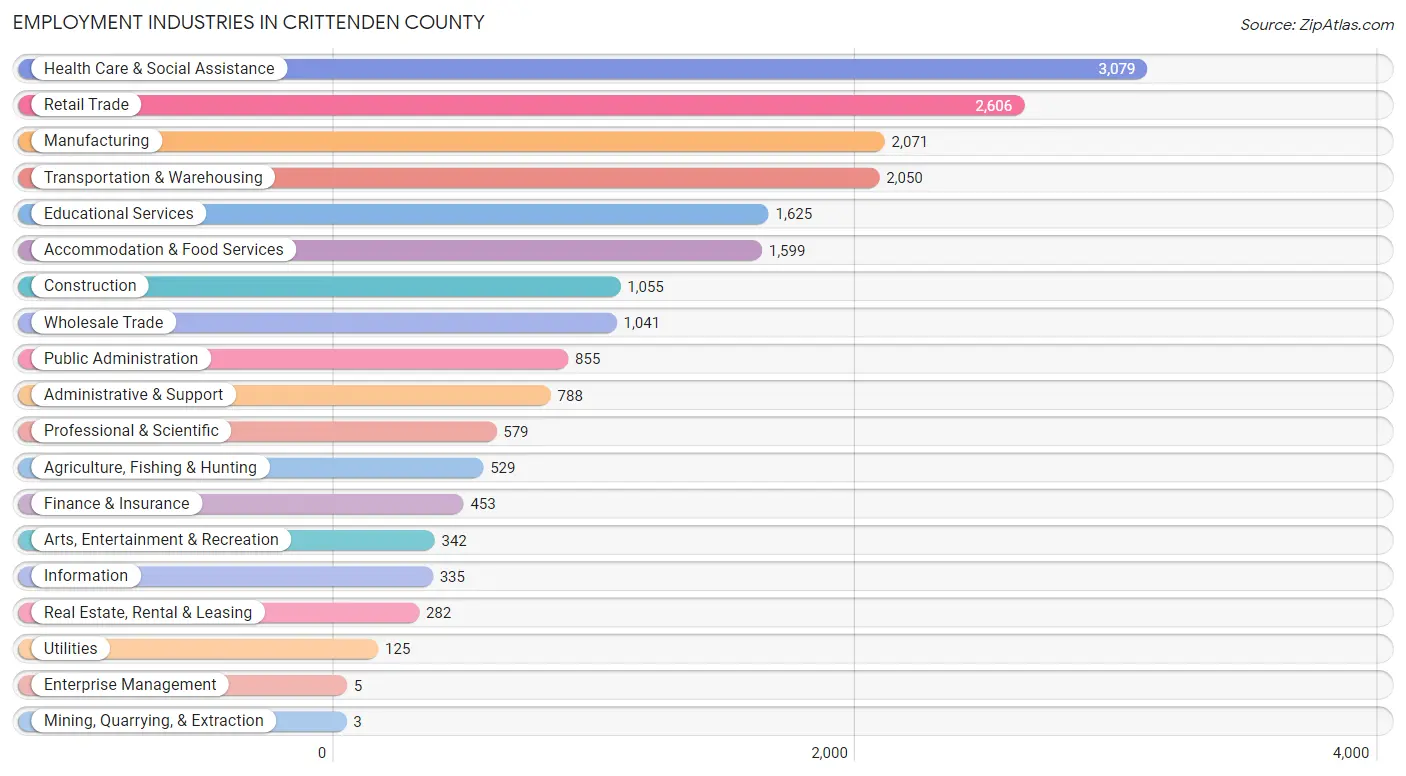
Employment Industries in Crittenden County
The major employment industries in Crittenden County include Health Care & Social Assistance (3,079 | 15.1%), Retail Trade (2,606 | 12.8%), Manufacturing (2,071 | 10.2%), Transportation & Warehousing (2,050 | 10.1%), and Educational Services (1,625 | 8.0%).
Employment Industries by Sex in Crittenden County
The Crittenden County industries that see more men than women are Mining, Quarrying, & Extraction (100.0%), Agriculture, Fishing & Hunting (89.6%), and Construction (87.5%), whereas the industries that tend to have a higher number of women are Enterprise Management (100.0%), Health Care & Social Assistance (86.7%), and Educational Services (74.7%).
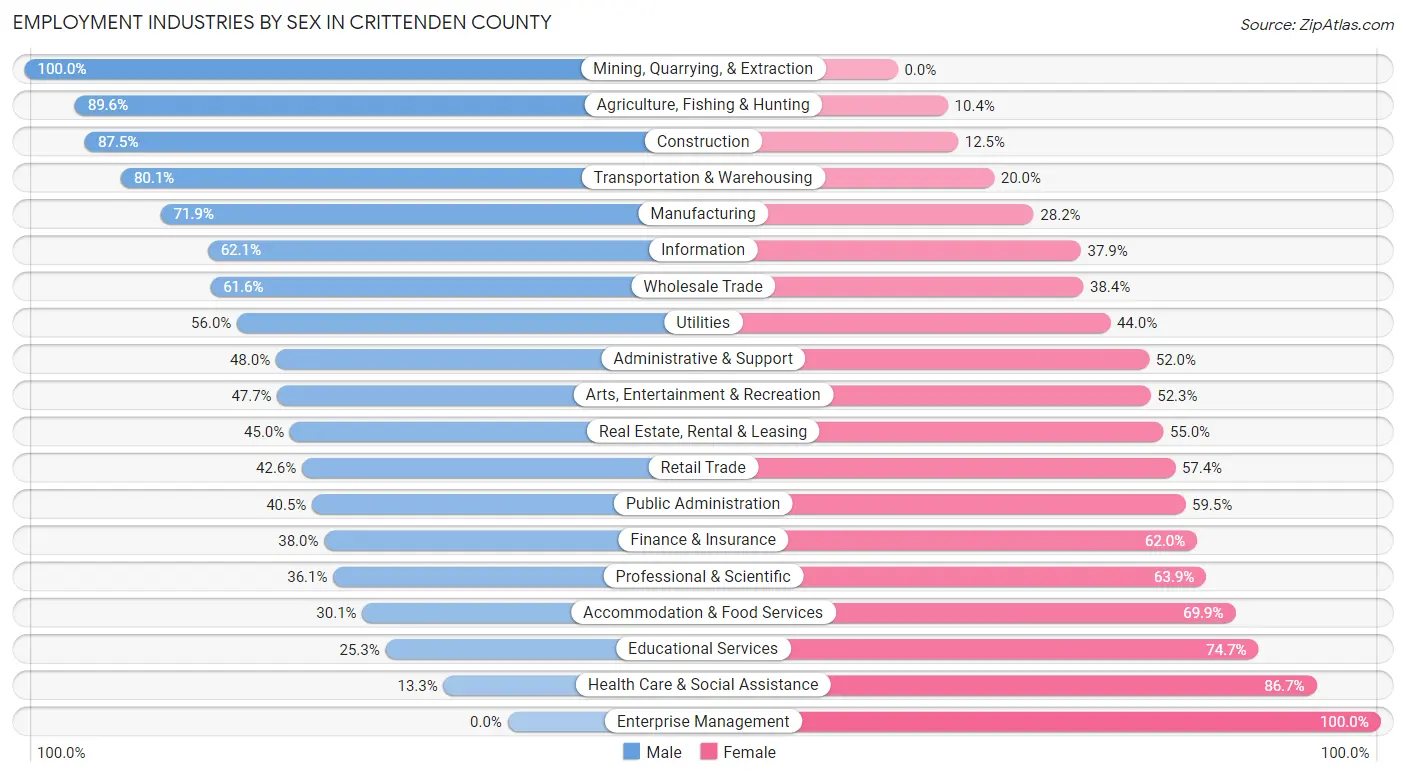
| Industry | Male | Female |
| Agriculture, Fishing & Hunting | 474 (89.6%) | 55 (10.4%) |
| Mining, Quarrying, & Extraction | 3 (100.0%) | 0 (0.0%) |
| Construction | 923 (87.5%) | 132 (12.5%) |
| Manufacturing | 1,488 (71.9%) | 583 (28.1%) |
| Wholesale Trade | 641 (61.6%) | 400 (38.4%) |
| Retail Trade | 1,109 (42.6%) | 1,497 (57.4%) |
| Transportation & Warehousing | 1,641 (80.0%) | 409 (20.0%) |
| Utilities | 70 (56.0%) | 55 (44.0%) |
| Information | 208 (62.1%) | 127 (37.9%) |
| Finance & Insurance | 172 (38.0%) | 281 (62.0%) |
| Real Estate, Rental & Leasing | 127 (45.0%) | 155 (55.0%) |
| Professional & Scientific | 209 (36.1%) | 370 (63.9%) |
| Enterprise Management | 0 (0.0%) | 5 (100.0%) |
| Administrative & Support | 378 (48.0%) | 410 (52.0%) |
| Educational Services | 411 (25.3%) | 1,214 (74.7%) |
| Health Care & Social Assistance | 409 (13.3%) | 2,670 (86.7%) |
| Arts, Entertainment & Recreation | 163 (47.7%) | 179 (52.3%) |
| Accommodation & Food Services | 481 (30.1%) | 1,118 (69.9%) |
| Public Administration | 346 (40.5%) | 509 (59.5%) |
| Total | 9,793 (48.1%) | 10,562 (51.9%) |
Education in Crittenden County
School Enrollment in Crittenden County
The most common levels of schooling among the 12,704 students in Crittenden County are high school (3,063 | 24.1%), elementary school (2,789 | 22.0%), and middle school (2,716 | 21.4%).
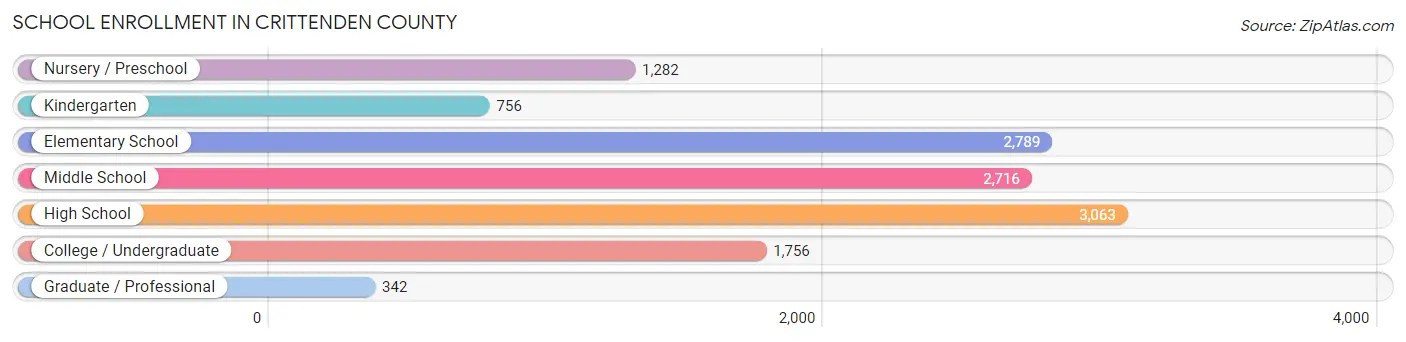
| School Level | # Students | % Students |
| Nursery / Preschool | 1,282 | 10.1% |
| Kindergarten | 756 | 5.9% |
| Elementary School | 2,789 | 22.0% |
| Middle School | 2,716 | 21.4% |
| High School | 3,063 | 24.1% |
| College / Undergraduate | 1,756 | 13.8% |
| Graduate / Professional | 342 | 2.7% |
| Total | 12,704 | 100.0% |
School Enrollment by Age by Funding Source in Crittenden County
Out of a total of 12,704 students who are enrolled in schools in Crittenden County, 1,270 (10.0%) attend a private institution, while the remaining 11,434 (90.0%) are enrolled in public schools. The age group of 35 years and over has the highest likelihood of being enrolled in private schools, with 94 (14.4% in the age bracket) enrolled. Conversely, the age group of 10 to 14 year olds has the lowest likelihood of being enrolled in a private school, with 3,140 (92.7% in the age bracket) attending a public institution.
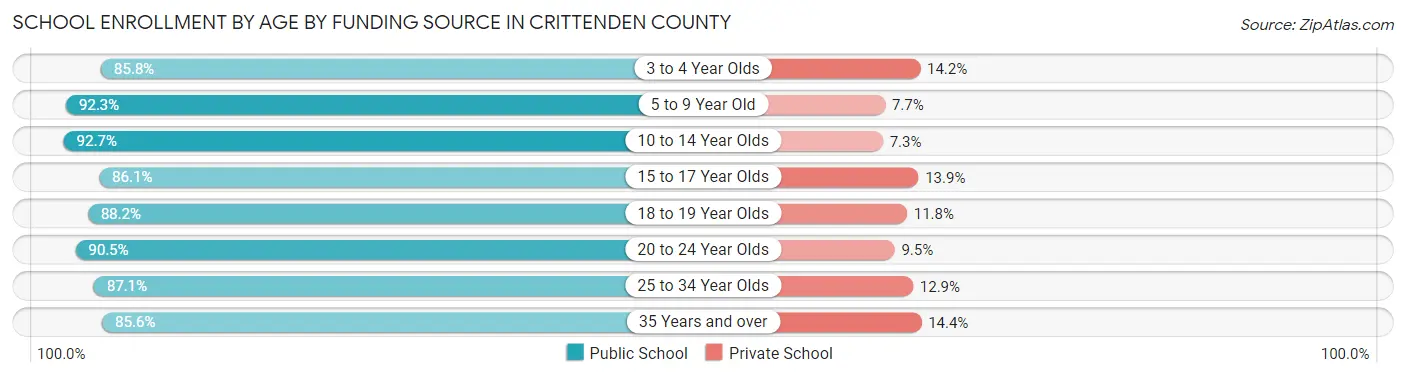
| Age Bracket | Public School | Private School |
| 3 to 4 Year Olds | 802 (85.8%) | 133 (14.2%) |
| 5 to 9 Year Old | 3,241 (92.3%) | 270 (7.7%) |
| 10 to 14 Year Olds | 3,140 (92.7%) | 246 (7.3%) |
| 15 to 17 Year Olds | 1,934 (86.1%) | 312 (13.9%) |
| 18 to 19 Year Olds | 548 (88.2%) | 73 (11.8%) |
| 20 to 24 Year Olds | 727 (90.5%) | 76 (9.5%) |
| 25 to 34 Year Olds | 480 (87.1%) | 71 (12.9%) |
| 35 Years and over | 557 (85.6%) | 94 (14.4%) |
| Total | 11,434 (90.0%) | 1,270 (10.0%) |
Educational Attainment by Field of Study in Crittenden County
Education (1,255 | 22.4%), business (1,137 | 20.3%), science & technology (817 | 14.6%), arts & humanities (396 | 7.1%), and bio, nature & agricultural (365 | 6.5%) are the most common fields of study among 5,608 individuals in Crittenden County who have obtained a bachelor's degree or higher.
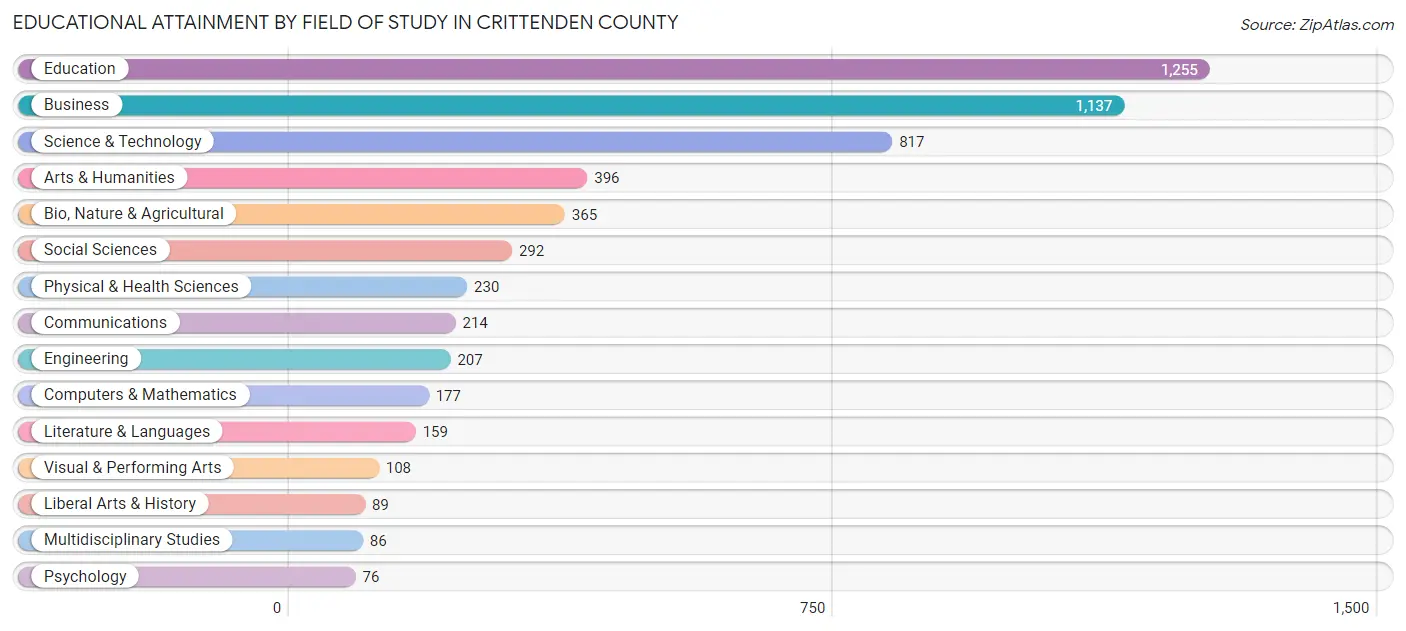
| Field of Study | # Graduates | % Graduates |
| Computers & Mathematics | 177 | 3.2% |
| Bio, Nature & Agricultural | 365 | 6.5% |
| Physical & Health Sciences | 230 | 4.1% |
| Psychology | 76 | 1.4% |
| Social Sciences | 292 | 5.2% |
| Engineering | 207 | 3.7% |
| Multidisciplinary Studies | 86 | 1.5% |
| Science & Technology | 817 | 14.6% |
| Business | 1,137 | 20.3% |
| Education | 1,255 | 22.4% |
| Literature & Languages | 159 | 2.8% |
| Liberal Arts & History | 89 | 1.6% |
| Visual & Performing Arts | 108 | 1.9% |
| Communications | 214 | 3.8% |
| Arts & Humanities | 396 | 7.1% |
| Total | 5,608 | 100.0% |
Transportation & Commute in Crittenden County
Vehicle Availability by Sex in Crittenden County
The most prevalent vehicle ownership categories in Crittenden County are males with 2 vehicles (4,371, accounting for 45.8%) and females with 2 vehicles (3,995, making up 42.4%).
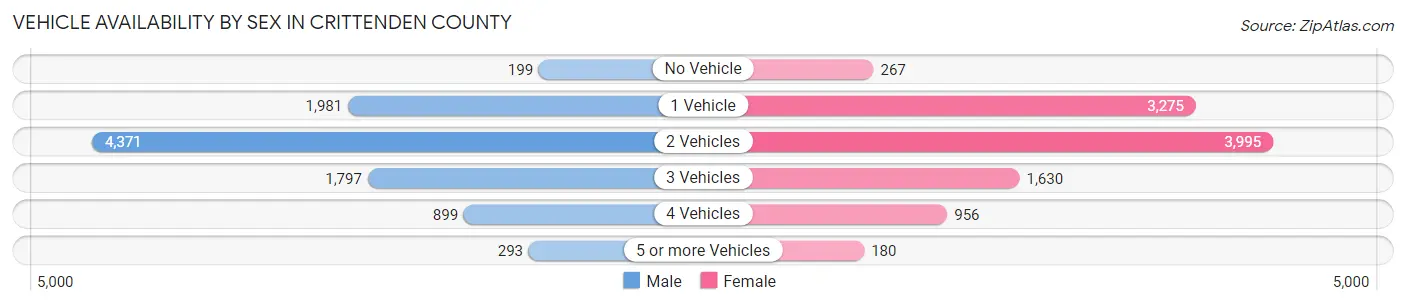
| Vehicles Available | Male | Female |
| No Vehicle | 199 (2.1%) | 267 (2.6%) |
| 1 Vehicle | 1,981 (20.8%) | 3,275 (31.8%) |
| 2 Vehicles | 4,371 (45.8%) | 3,995 (38.8%) |
| 3 Vehicles | 1,797 (18.8%) | 1,630 (15.8%) |
| 4 Vehicles | 899 (9.4%) | 956 (9.3%) |
| 5 or more Vehicles | 293 (3.1%) | 180 (1.8%) |
| Total | 9,540 (100.0%) | 10,303 (100.0%) |
Commute Time in Crittenden County
The most frequently occuring commute durations in Crittenden County are 5 to 9 minutes (3,866 commuters, 20.6%), 10 to 14 minutes (2,919 commuters, 15.5%), and 15 to 19 minutes (2,242 commuters, 11.9%).
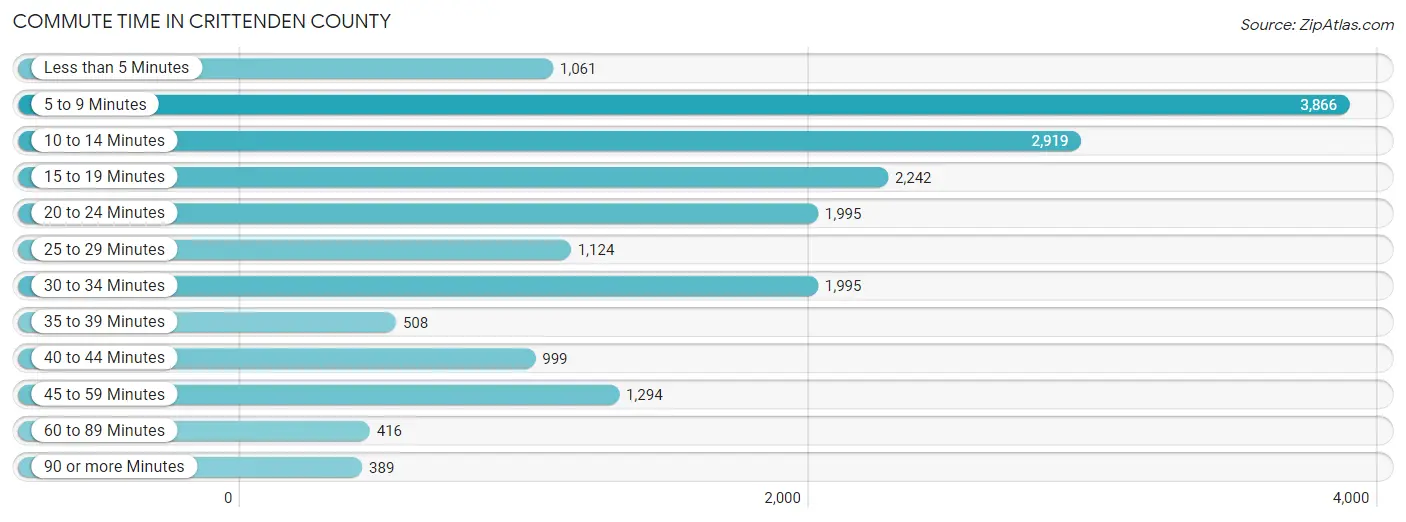
| Commute Time | # Commuters | % Commuters |
| Less than 5 Minutes | 1,061 | 5.6% |
| 5 to 9 Minutes | 3,866 | 20.6% |
| 10 to 14 Minutes | 2,919 | 15.5% |
| 15 to 19 Minutes | 2,242 | 11.9% |
| 20 to 24 Minutes | 1,995 | 10.6% |
| 25 to 29 Minutes | 1,124 | 6.0% |
| 30 to 34 Minutes | 1,995 | 10.6% |
| 35 to 39 Minutes | 508 | 2.7% |
| 40 to 44 Minutes | 999 | 5.3% |
| 45 to 59 Minutes | 1,294 | 6.9% |
| 60 to 89 Minutes | 416 | 2.2% |
| 90 or more Minutes | 389 | 2.1% |
Commute Time by Sex in Crittenden County
The most common commute times in Crittenden County are 5 to 9 minutes (1,685 commuters, 18.6%) for males and 5 to 9 minutes (2,181 commuters, 22.4%) for females.
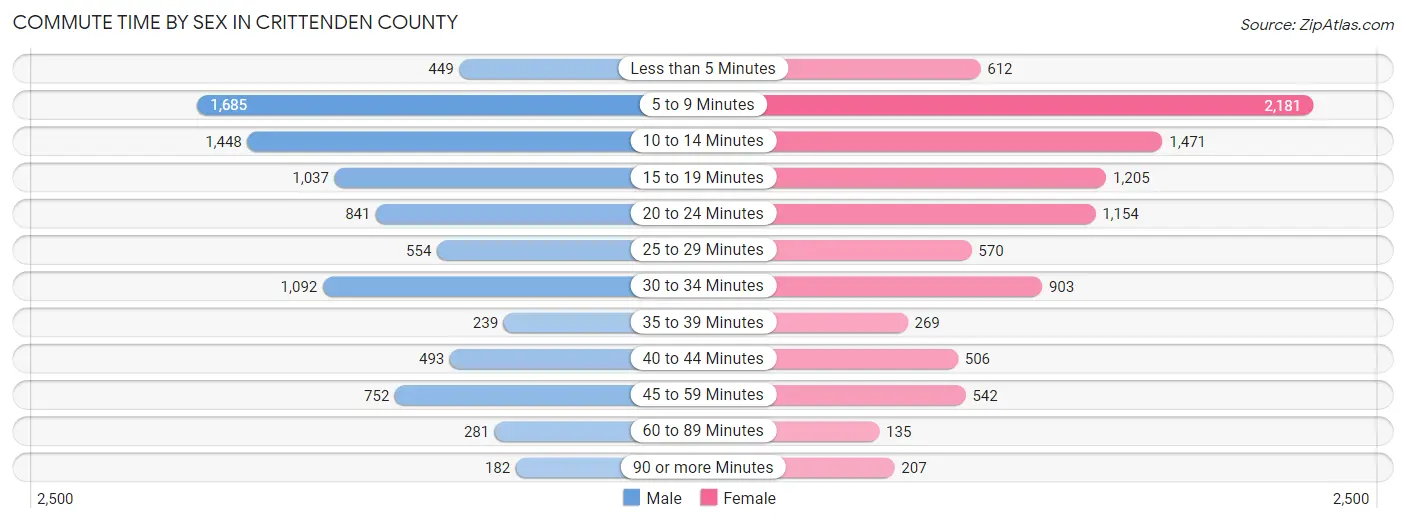
| Commute Time | Male | Female |
| Less than 5 Minutes | 449 (5.0%) | 612 (6.3%) |
| 5 to 9 Minutes | 1,685 (18.6%) | 2,181 (22.4%) |
| 10 to 14 Minutes | 1,448 (16.0%) | 1,471 (15.1%) |
| 15 to 19 Minutes | 1,037 (11.5%) | 1,205 (12.3%) |
| 20 to 24 Minutes | 841 (9.3%) | 1,154 (11.8%) |
| 25 to 29 Minutes | 554 (6.1%) | 570 (5.8%) |
| 30 to 34 Minutes | 1,092 (12.1%) | 903 (9.3%) |
| 35 to 39 Minutes | 239 (2.6%) | 269 (2.8%) |
| 40 to 44 Minutes | 493 (5.4%) | 506 (5.2%) |
| 45 to 59 Minutes | 752 (8.3%) | 542 (5.6%) |
| 60 to 89 Minutes | 281 (3.1%) | 135 (1.4%) |
| 90 or more Minutes | 182 (2.0%) | 207 (2.1%) |
Time of Departure to Work by Sex in Crittenden County
The most frequent times of departure to work in Crittenden County are 7:30 AM to 7:59 AM (1,198, 13.2%) for males and 7:30 AM to 7:59 AM (1,901, 19.5%) for females.
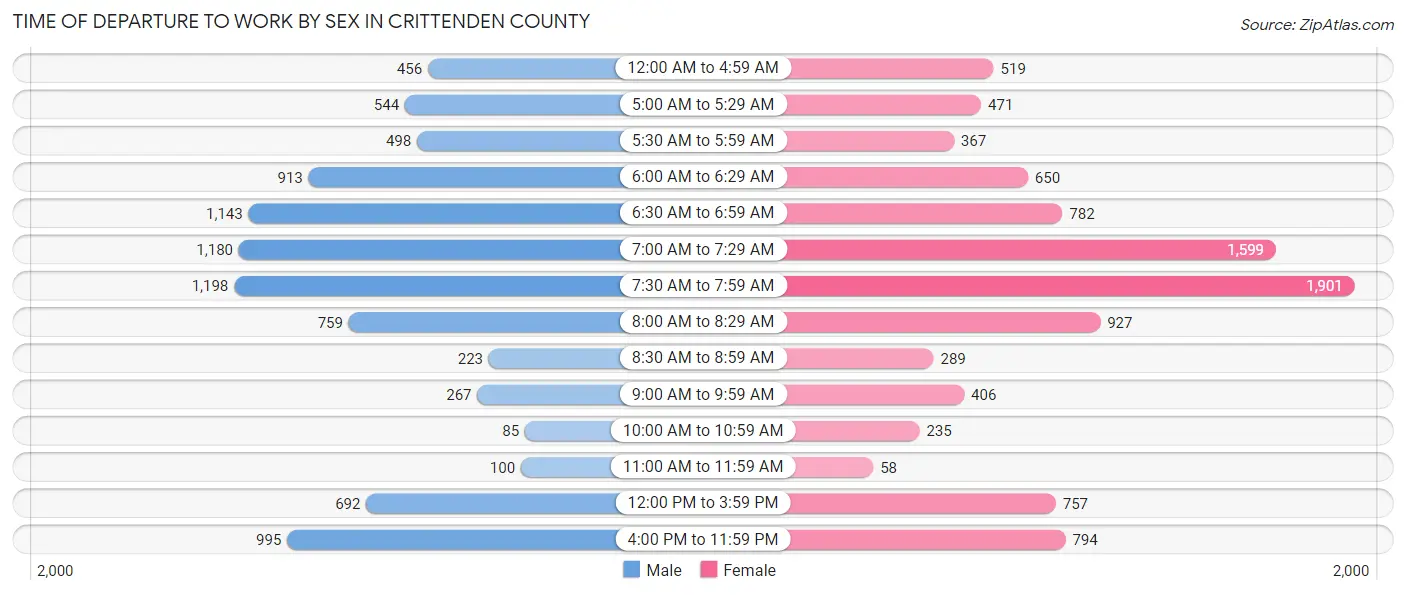
| Time of Departure | Male | Female |
| 12:00 AM to 4:59 AM | 456 (5.0%) | 519 (5.3%) |
| 5:00 AM to 5:29 AM | 544 (6.0%) | 471 (4.8%) |
| 5:30 AM to 5:59 AM | 498 (5.5%) | 367 (3.8%) |
| 6:00 AM to 6:29 AM | 913 (10.1%) | 650 (6.7%) |
| 6:30 AM to 6:59 AM | 1,143 (12.6%) | 782 (8.0%) |
| 7:00 AM to 7:29 AM | 1,180 (13.0%) | 1,599 (16.4%) |
| 7:30 AM to 7:59 AM | 1,198 (13.2%) | 1,901 (19.5%) |
| 8:00 AM to 8:29 AM | 759 (8.4%) | 927 (9.5%) |
| 8:30 AM to 8:59 AM | 223 (2.5%) | 289 (3.0%) |
| 9:00 AM to 9:59 AM | 267 (2.9%) | 406 (4.2%) |
| 10:00 AM to 10:59 AM | 85 (0.9%) | 235 (2.4%) |
| 11:00 AM to 11:59 AM | 100 (1.1%) | 58 (0.6%) |
| 12:00 PM to 3:59 PM | 692 (7.6%) | 757 (7.8%) |
| 4:00 PM to 11:59 PM | 995 (11.0%) | 794 (8.1%) |
| Total | 9,053 (100.0%) | 9,755 (100.0%) |
Housing Occupancy in Crittenden County
Occupancy by Ownership in Crittenden County
Of the total 18,587 dwellings in Crittenden County, owner-occupied units account for 10,443 (56.2%), while renter-occupied units make up 8,144 (43.8%).
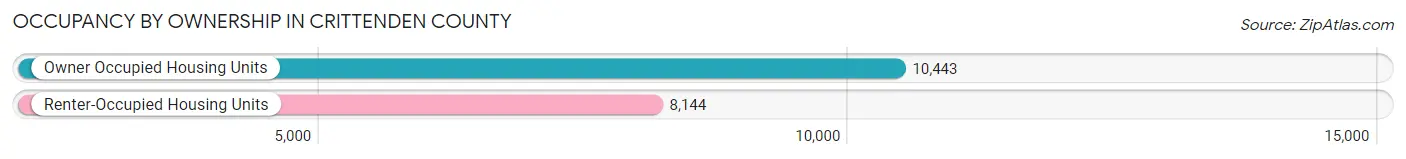
| Occupancy | # Housing Units | % Housing Units |
| Owner Occupied Housing Units | 10,443 | 56.2% |
| Renter-Occupied Housing Units | 8,144 | 43.8% |
| Total Occupied Housing Units | 18,587 | 100.0% |
Occupancy by Household Size in Crittenden County
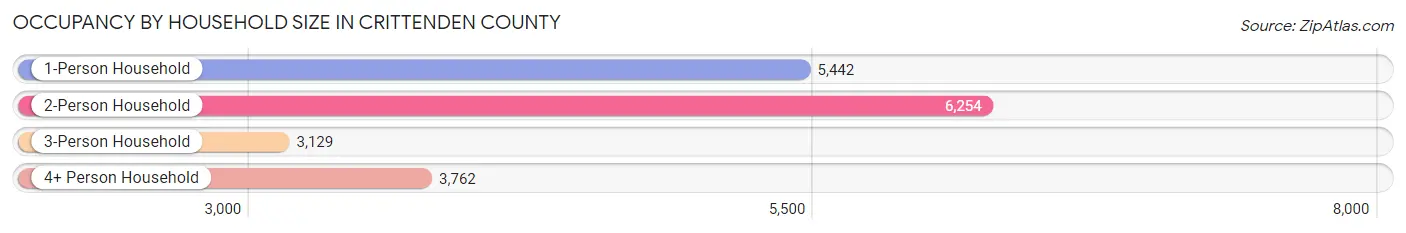
| Household Size | # Housing Units | % Housing Units |
| 1-Person Household | 5,442 | 29.3% |
| 2-Person Household | 6,254 | 33.7% |
| 3-Person Household | 3,129 | 16.8% |
| 4+ Person Household | 3,762 | 20.2% |
| Total Housing Units | 18,587 | 100.0% |
Occupancy by Ownership by Household Size in Crittenden County
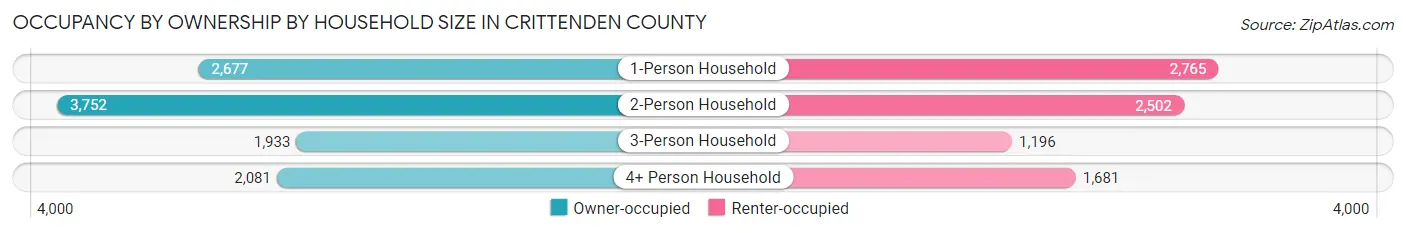
| Household Size | Owner-occupied | Renter-occupied |
| 1-Person Household | 2,677 (49.2%) | 2,765 (50.8%) |
| 2-Person Household | 3,752 (60.0%) | 2,502 (40.0%) |
| 3-Person Household | 1,933 (61.8%) | 1,196 (38.2%) |
| 4+ Person Household | 2,081 (55.3%) | 1,681 (44.7%) |
| Total Housing Units | 10,443 (56.2%) | 8,144 (43.8%) |
Occupancy by Educational Attainment in Crittenden County
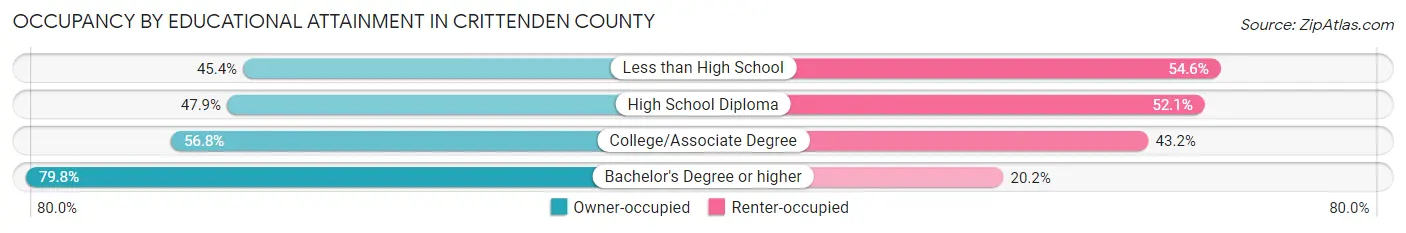
| Household Size | Owner-occupied | Renter-occupied |
| Less than High School | 1,199 (45.4%) | 1,444 (54.6%) |
| High School Diploma | 3,245 (47.9%) | 3,527 (52.1%) |
| College/Associate Degree | 3,257 (56.8%) | 2,479 (43.2%) |
| Bachelor's Degree or higher | 2,742 (79.8%) | 694 (20.2%) |
Occupancy by Age of Householder in Crittenden County
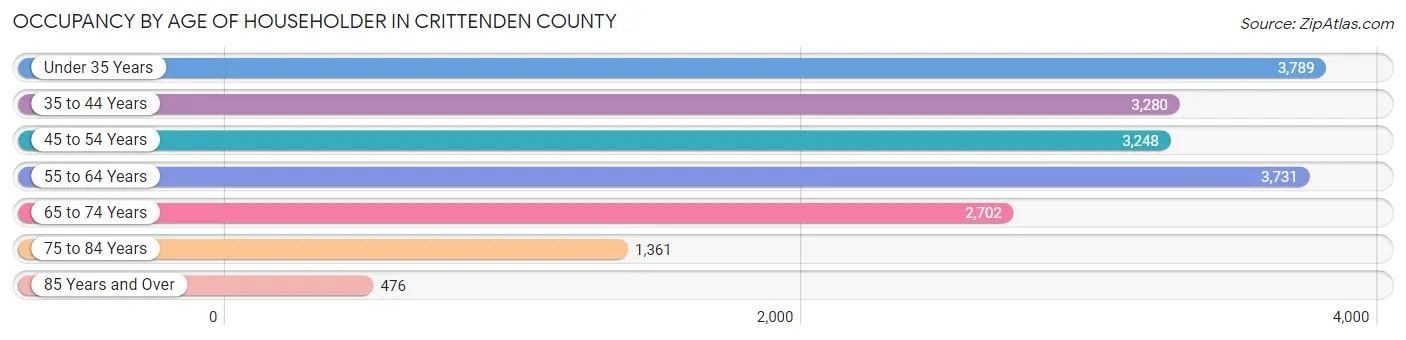
| Age Bracket | # Households | % Households |
| Under 35 Years | 3,789 | 20.4% |
| 35 to 44 Years | 3,280 | 17.6% |
| 45 to 54 Years | 3,248 | 17.5% |
| 55 to 64 Years | 3,731 | 20.1% |
| 65 to 74 Years | 2,702 | 14.5% |
| 75 to 84 Years | 1,361 | 7.3% |
| 85 Years and Over | 476 | 2.6% |
| Total | 18,587 | 100.0% |
Housing Finances in Crittenden County
Median Income by Occupancy in Crittenden County
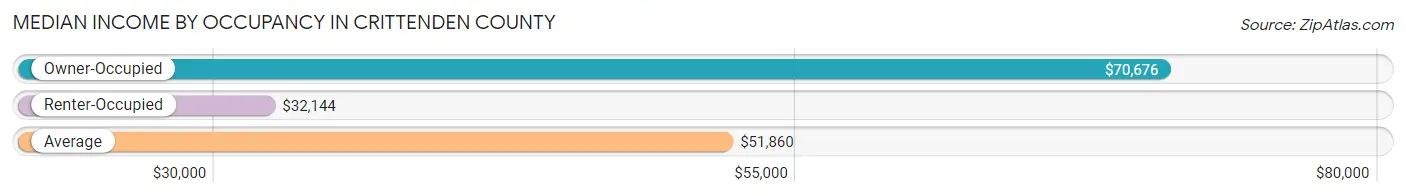
| Occupancy Type | # Households | Median Income |
| Owner-Occupied | 10,443 (56.2%) | $70,676 |
| Renter-Occupied | 8,144 (43.8%) | $32,144 |
| Average | 18,587 (100.0%) | $51,860 |
Occupancy by Householder Income Bracket in Crittenden County
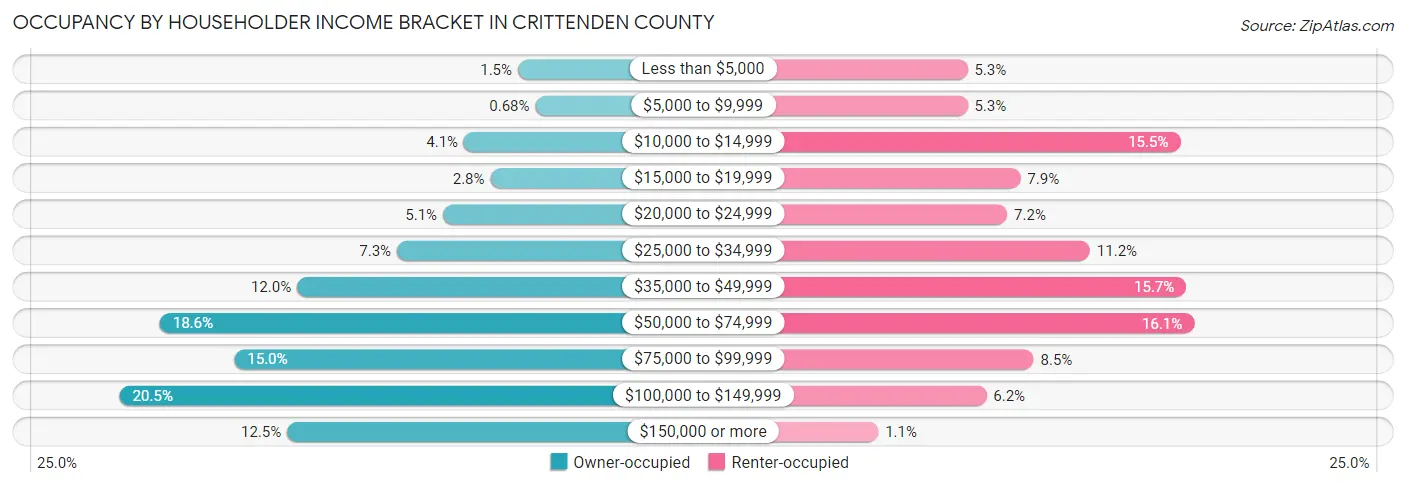
| Income Bracket | Owner-occupied | Renter-occupied |
| Less than $5,000 | 158 (1.5%) | 434 (5.3%) |
| $5,000 to $9,999 | 71 (0.7%) | 434 (5.3%) |
| $10,000 to $14,999 | 426 (4.1%) | 1,259 (15.5%) |
| $15,000 to $19,999 | 294 (2.8%) | 639 (7.9%) |
| $20,000 to $24,999 | 530 (5.1%) | 588 (7.2%) |
| $25,000 to $34,999 | 759 (7.3%) | 909 (11.2%) |
| $35,000 to $49,999 | 1,256 (12.0%) | 1,282 (15.7%) |
| $50,000 to $74,999 | 1,938 (18.6%) | 1,313 (16.1%) |
| $75,000 to $99,999 | 1,567 (15.0%) | 691 (8.5%) |
| $100,000 to $149,999 | 2,139 (20.5%) | 507 (6.2%) |
| $150,000 or more | 1,305 (12.5%) | 88 (1.1%) |
| Total | 10,443 (100.0%) | 8,144 (100.0%) |
Monthly Housing Cost Tiers in Crittenden County
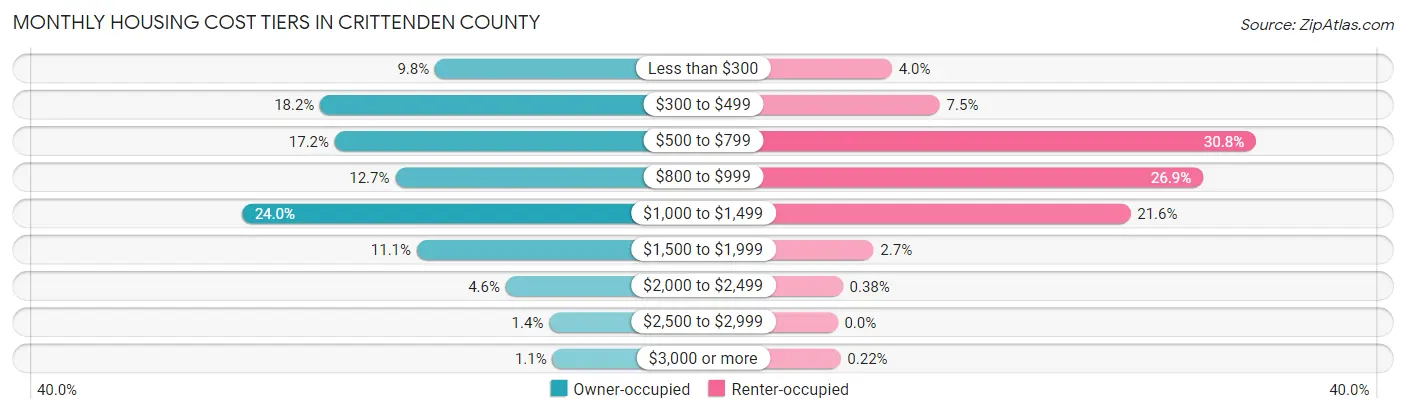
| Monthly Cost | Owner-occupied | Renter-occupied |
| Less than $300 | 1,020 (9.8%) | 326 (4.0%) |
| $300 to $499 | 1,904 (18.2%) | 613 (7.5%) |
| $500 to $799 | 1,791 (17.2%) | 2,511 (30.8%) |
| $800 to $999 | 1,326 (12.7%) | 2,193 (26.9%) |
| $1,000 to $1,499 | 2,507 (24.0%) | 1,757 (21.6%) |
| $1,500 to $1,999 | 1,160 (11.1%) | 216 (2.6%) |
| $2,000 to $2,499 | 476 (4.6%) | 31 (0.4%) |
| $2,500 to $2,999 | 142 (1.4%) | 0 (0.0%) |
| $3,000 or more | 117 (1.1%) | 18 (0.2%) |
| Total | 10,443 (100.0%) | 8,144 (100.0%) |
Physical Housing Characteristics in Crittenden County
Housing Structures in Crittenden County
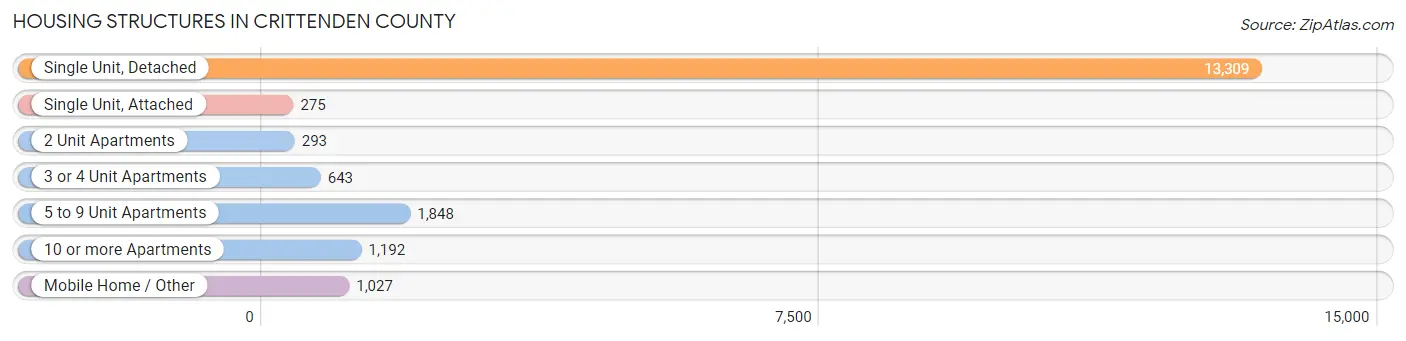
| Structure Type | # Housing Units | % Housing Units |
| Single Unit, Detached | 13,309 | 71.6% |
| Single Unit, Attached | 275 | 1.5% |
| 2 Unit Apartments | 293 | 1.6% |
| 3 or 4 Unit Apartments | 643 | 3.5% |
| 5 to 9 Unit Apartments | 1,848 | 9.9% |
| 10 or more Apartments | 1,192 | 6.4% |
| Mobile Home / Other | 1,027 | 5.5% |
| Total | 18,587 | 100.0% |
Housing Structures by Occupancy in Crittenden County
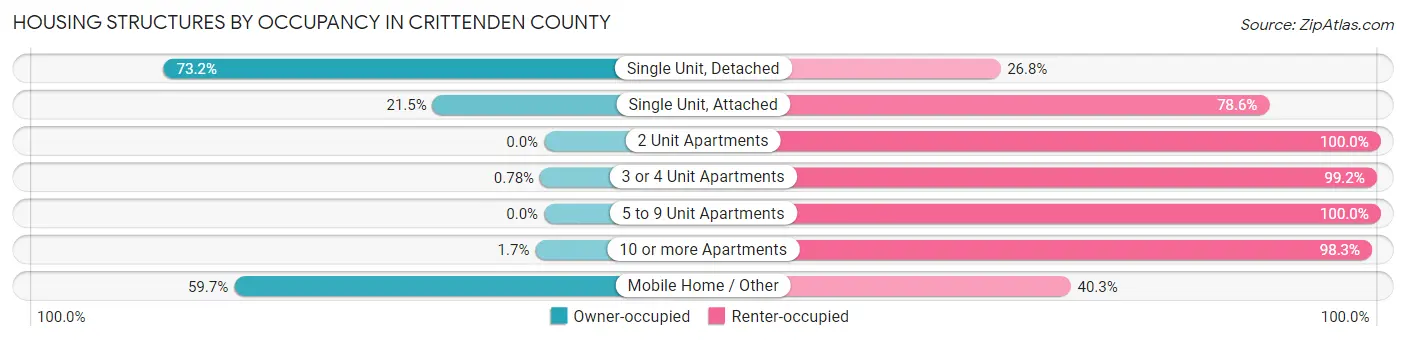
| Structure Type | Owner-occupied | Renter-occupied |
| Single Unit, Detached | 9,746 (73.2%) | 3,563 (26.8%) |
| Single Unit, Attached | 59 (21.4%) | 216 (78.5%) |
| 2 Unit Apartments | 0 (0.0%) | 293 (100.0%) |
| 3 or 4 Unit Apartments | 5 (0.8%) | 638 (99.2%) |
| 5 to 9 Unit Apartments | 0 (0.0%) | 1,848 (100.0%) |
| 10 or more Apartments | 20 (1.7%) | 1,172 (98.3%) |
| Mobile Home / Other | 613 (59.7%) | 414 (40.3%) |
| Total | 10,443 (56.2%) | 8,144 (43.8%) |
Housing Structures by Number of Rooms in Crittenden County

| Number of Rooms | Owner-occupied | Renter-occupied |
| 1 Room | 2 (0.0%) | 61 (0.7%) |
| 2 or 3 Rooms | 269 (2.6%) | 1,746 (21.4%) |
| 4 or 5 Rooms | 3,480 (33.3%) | 4,919 (60.4%) |
| 6 or 7 Rooms | 4,231 (40.5%) | 1,146 (14.1%) |
| 8 or more Rooms | 2,461 (23.6%) | 272 (3.3%) |
| Total | 10,443 (100.0%) | 8,144 (100.0%) |
Housing Structure by Heating Type in Crittenden County
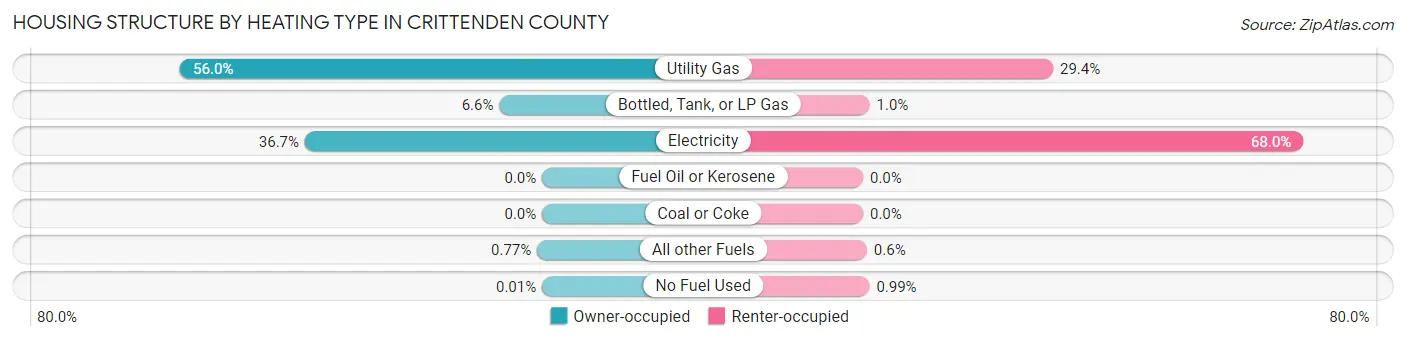
| Heating Type | Owner-occupied | Renter-occupied |
| Utility Gas | 5,843 (55.9%) | 2,392 (29.4%) |
| Bottled, Tank, or LP Gas | 690 (6.6%) | 82 (1.0%) |
| Electricity | 3,829 (36.7%) | 5,540 (68.0%) |
| Fuel Oil or Kerosene | 0 (0.0%) | 0 (0.0%) |
| Coal or Coke | 0 (0.0%) | 0 (0.0%) |
| All other Fuels | 80 (0.8%) | 49 (0.6%) |
| No Fuel Used | 1 (0.0%) | 81 (1.0%) |
| Total | 10,443 (100.0%) | 8,144 (100.0%) |
Household Vehicle Usage in Crittenden County
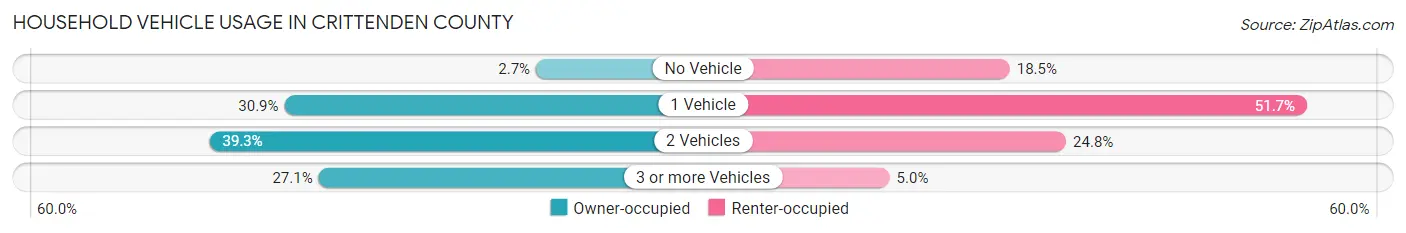
| Vehicles per Household | Owner-occupied | Renter-occupied |
| No Vehicle | 284 (2.7%) | 1,504 (18.5%) |
| 1 Vehicle | 3,227 (30.9%) | 4,214 (51.7%) |
| 2 Vehicles | 4,104 (39.3%) | 2,018 (24.8%) |
| 3 or more Vehicles | 2,828 (27.1%) | 408 (5.0%) |
| Total | 10,443 (100.0%) | 8,144 (100.0%) |
Real Estate & Mortgages in Crittenden County
Real Estate and Mortgage Overview in Crittenden County
| Characteristic | Without Mortgage | With Mortgage |
| Housing Units | 4,109 | 6,334 |
| Median Property Value | $120,900 | $161,500 |
| Median Household Income | $52,617 | $894 |
| Monthly Housing Costs | $388 | $117 |
| Real Estate Taxes | $642 | $396 |
Property Value by Mortgage Status in Crittenden County
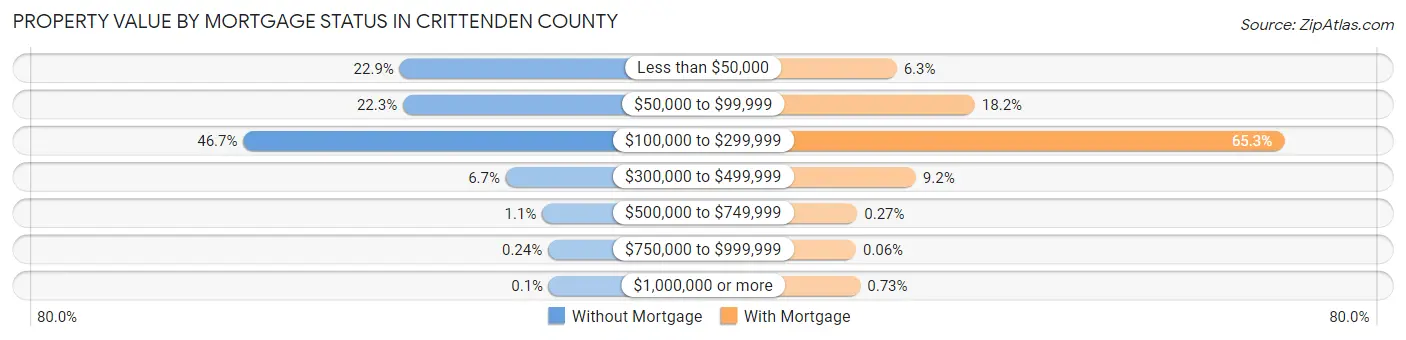
| Property Value | Without Mortgage | With Mortgage |
| Less than $50,000 | 939 (22.9%) | 397 (6.3%) |
| $50,000 to $99,999 | 918 (22.3%) | 1,152 (18.2%) |
| $100,000 to $299,999 | 1,918 (46.7%) | 4,135 (65.3%) |
| $300,000 to $499,999 | 274 (6.7%) | 583 (9.2%) |
| $500,000 to $749,999 | 46 (1.1%) | 17 (0.3%) |
| $750,000 to $999,999 | 10 (0.2%) | 4 (0.1%) |
| $1,000,000 or more | 4 (0.1%) | 46 (0.7%) |
| Total | 4,109 (100.0%) | 6,334 (100.0%) |
Household Income by Mortgage Status in Crittenden County
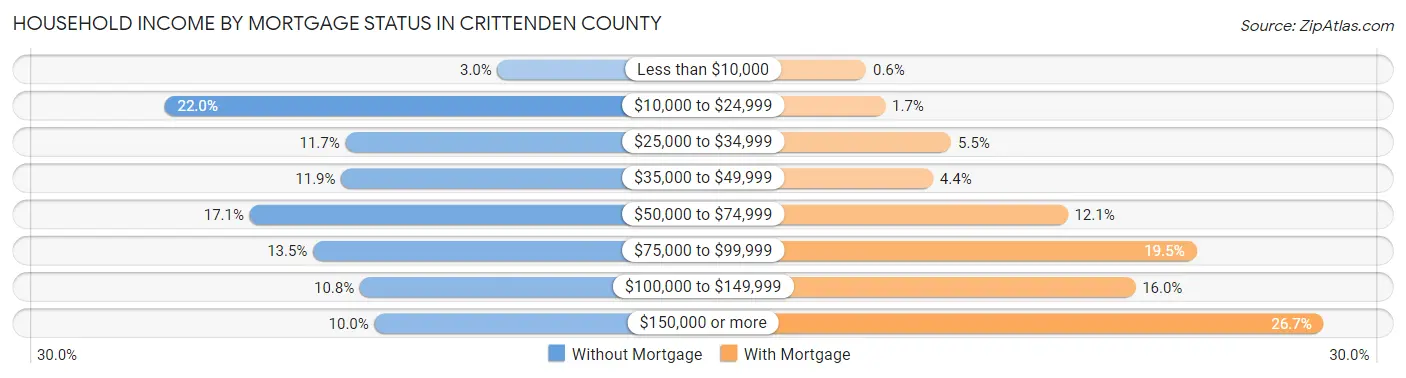
| Household Income | Without Mortgage | With Mortgage |
| Less than $10,000 | 122 (3.0%) | 38 (0.6%) |
| $10,000 to $24,999 | 904 (22.0%) | 107 (1.7%) |
| $25,000 to $34,999 | 479 (11.7%) | 346 (5.5%) |
| $35,000 to $49,999 | 489 (11.9%) | 280 (4.4%) |
| $50,000 to $74,999 | 704 (17.1%) | 767 (12.1%) |
| $75,000 to $99,999 | 555 (13.5%) | 1,234 (19.5%) |
| $100,000 to $149,999 | 445 (10.8%) | 1,012 (16.0%) |
| $150,000 or more | 411 (10.0%) | 1,694 (26.7%) |
| Total | 4,109 (100.0%) | 6,334 (100.0%) |
Property Value to Household Income Ratio in Crittenden County
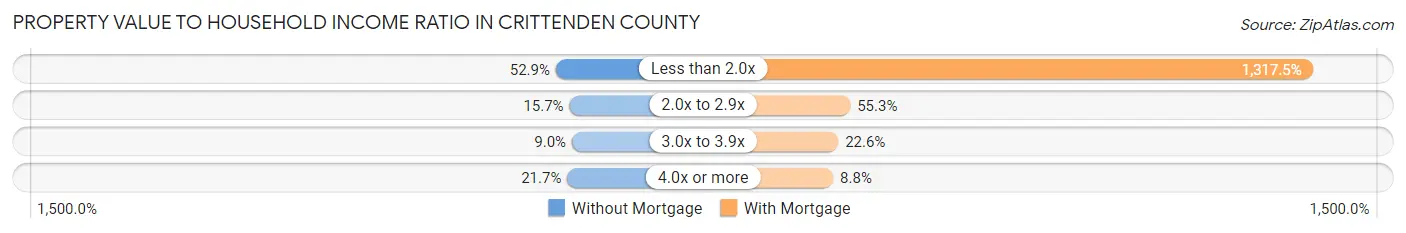
| Value-to-Income Ratio | Without Mortgage | With Mortgage |
| Less than 2.0x | 2,174 (52.9%) | 83,452 (1,317.5%) |
| 2.0x to 2.9x | 646 (15.7%) | 3,503 (55.3%) |
| 3.0x to 3.9x | 369 (9.0%) | 1,429 (22.6%) |
| 4.0x or more | 893 (21.7%) | 560 (8.8%) |
| Total | 4,109 (100.0%) | 6,334 (100.0%) |
Real Estate Taxes by Mortgage Status in Crittenden County
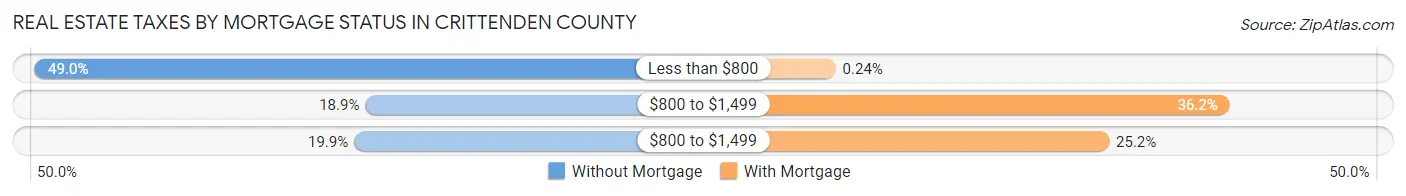
| Property Taxes | Without Mortgage | With Mortgage |
| Less than $800 | 2,015 (49.0%) | 15 (0.2%) |
| $800 to $1,499 | 776 (18.9%) | 2,294 (36.2%) |
| $800 to $1,499 | 818 (19.9%) | 1,597 (25.2%) |
| Total | 4,109 (100.0%) | 6,334 (100.0%) |
Health & Disability in Crittenden County
Health Insurance Coverage by Age in Crittenden County
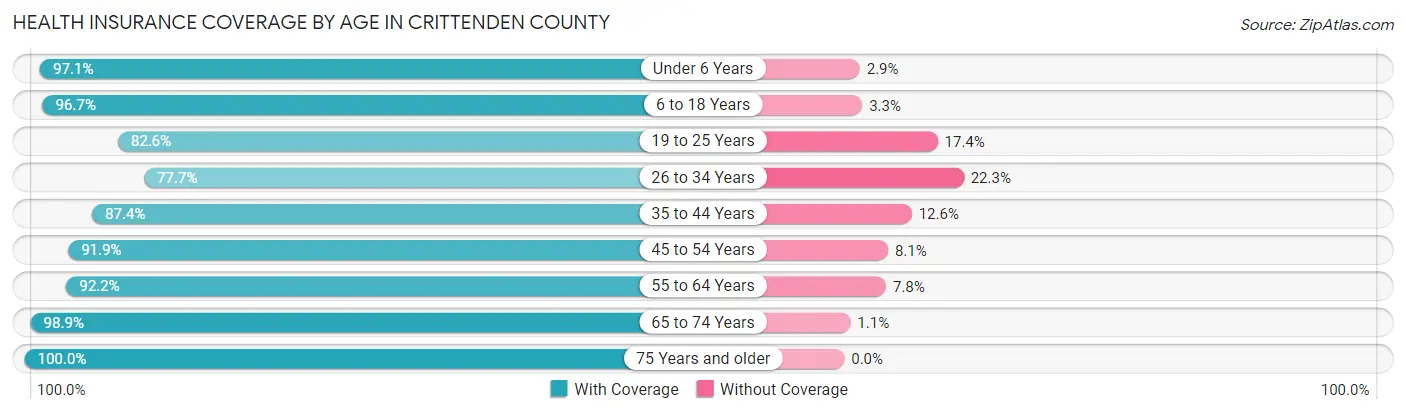
| Age Bracket | With Coverage | Without Coverage |
| Under 6 Years | 4,162 (97.1%) | 124 (2.9%) |
| 6 to 18 Years | 9,094 (96.7%) | 314 (3.3%) |
| 19 to 25 Years | 3,717 (82.6%) | 783 (17.4%) |
| 26 to 34 Years | 4,087 (77.7%) | 1,171 (22.3%) |
| 35 to 44 Years | 4,900 (87.4%) | 705 (12.6%) |
| 45 to 54 Years | 5,179 (91.9%) | 459 (8.1%) |
| 55 to 64 Years | 5,514 (92.2%) | 465 (7.8%) |
| 65 to 74 Years | 4,077 (98.9%) | 47 (1.1%) |
| 75 Years and older | 2,648 (100.0%) | 0 (0.0%) |
| Total | 43,378 (91.4%) | 4,068 (8.6%) |
Health Insurance Coverage by Citizenship Status in Crittenden County
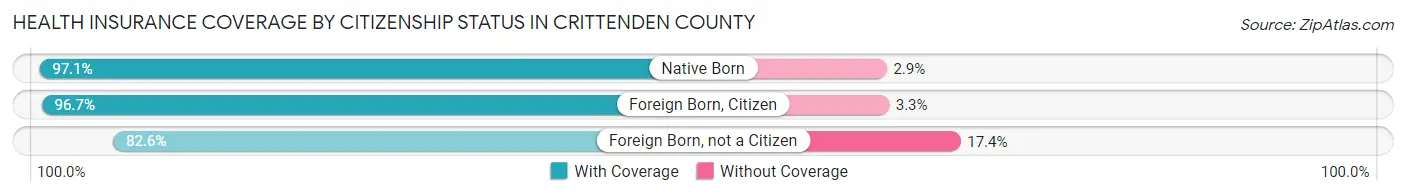
| Citizenship Status | With Coverage | Without Coverage |
| Native Born | 4,162 (97.1%) | 124 (2.9%) |
| Foreign Born, Citizen | 9,094 (96.7%) | 314 (3.3%) |
| Foreign Born, not a Citizen | 3,717 (82.6%) | 783 (17.4%) |
Health Insurance Coverage by Household Income in Crittenden County
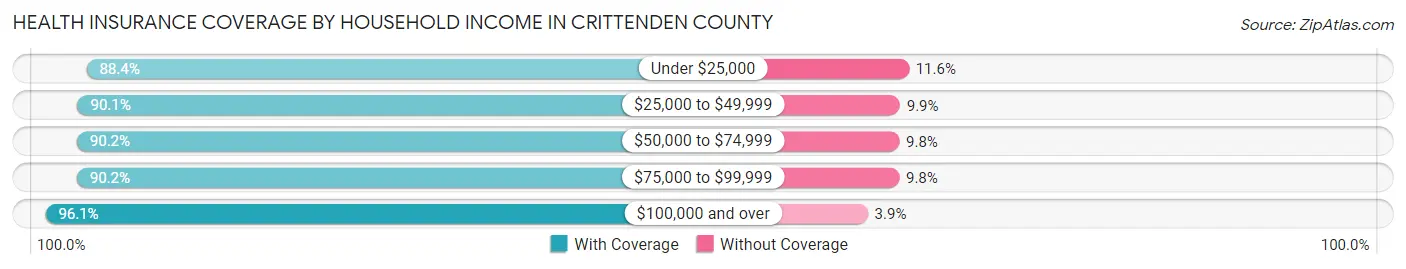
| Household Income | With Coverage | Without Coverage |
| Under $25,000 | 8,036 (88.4%) | 1,054 (11.6%) |
| $25,000 to $49,999 | 8,749 (90.1%) | 965 (9.9%) |
| $50,000 to $74,999 | 8,204 (90.2%) | 891 (9.8%) |
| $75,000 to $99,999 | 5,882 (90.2%) | 638 (9.8%) |
| $100,000 and over | 12,372 (96.1%) | 503 (3.9%) |
Public vs Private Health Insurance Coverage by Age in Crittenden County
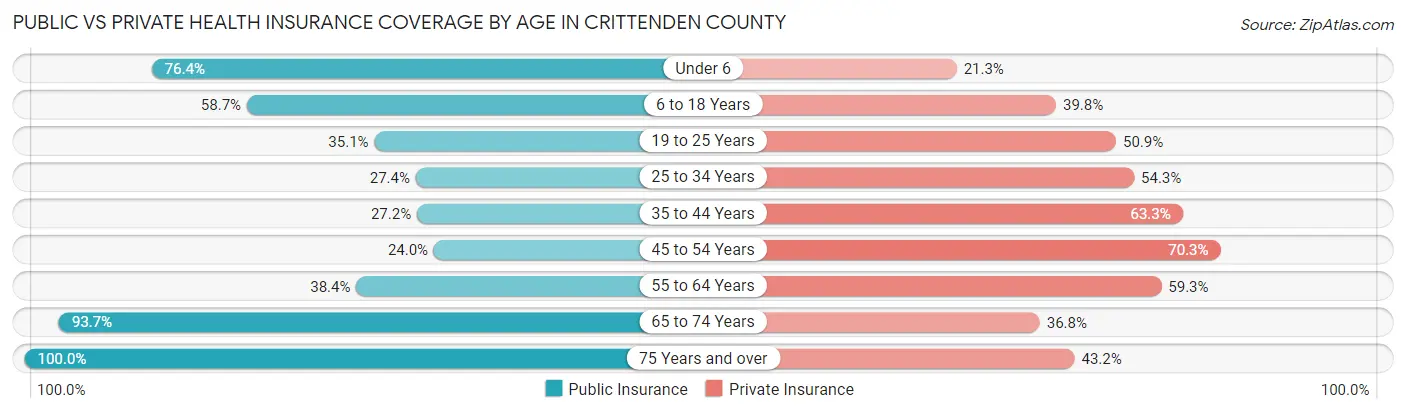
| Age Bracket | Public Insurance | Private Insurance |
| Under 6 | 3,275 (76.4%) | 914 (21.3%) |
| 6 to 18 Years | 5,526 (58.7%) | 3,742 (39.8%) |
| 19 to 25 Years | 1,578 (35.1%) | 2,291 (50.9%) |
| 25 to 34 Years | 1,440 (27.4%) | 2,853 (54.3%) |
| 35 to 44 Years | 1,523 (27.2%) | 3,545 (63.2%) |
| 45 to 54 Years | 1,354 (24.0%) | 3,961 (70.3%) |
| 55 to 64 Years | 2,298 (38.4%) | 3,547 (59.3%) |
| 65 to 74 Years | 3,862 (93.6%) | 1,516 (36.8%) |
| 75 Years and over | 2,648 (100.0%) | 1,144 (43.2%) |
| Total | 23,504 (49.5%) | 23,513 (49.6%) |
Disability Status by Sex by Age in Crittenden County
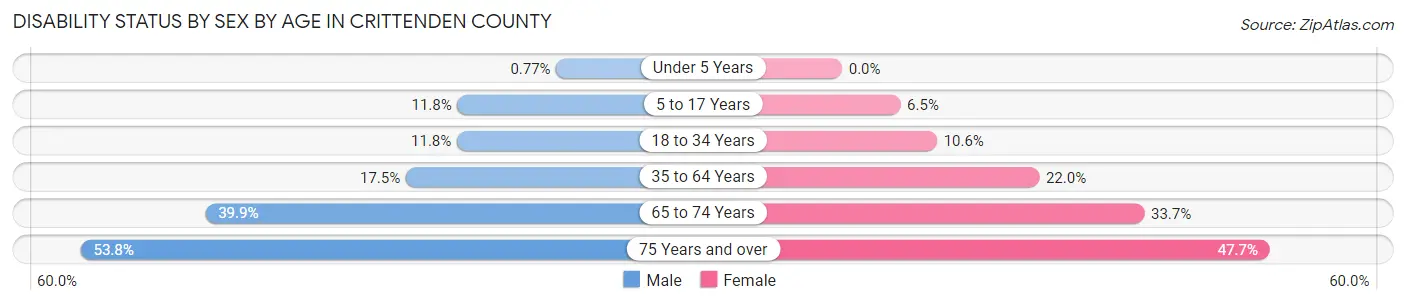
| Age Bracket | Male | Female |
| Under 5 Years | 14 (0.8%) | 0 (0.0%) |
| 5 to 17 Years | 563 (11.8%) | 304 (6.5%) |
| 18 to 34 Years | 592 (11.8%) | 577 (10.6%) |
| 35 to 64 Years | 1,390 (17.5%) | 2,039 (22.0%) |
| 65 to 74 Years | 755 (39.9%) | 751 (33.7%) |
| 75 Years and over | 563 (53.8%) | 763 (47.7%) |
Disability Class by Sex by Age in Crittenden County
Disability Class: Hearing Difficulty
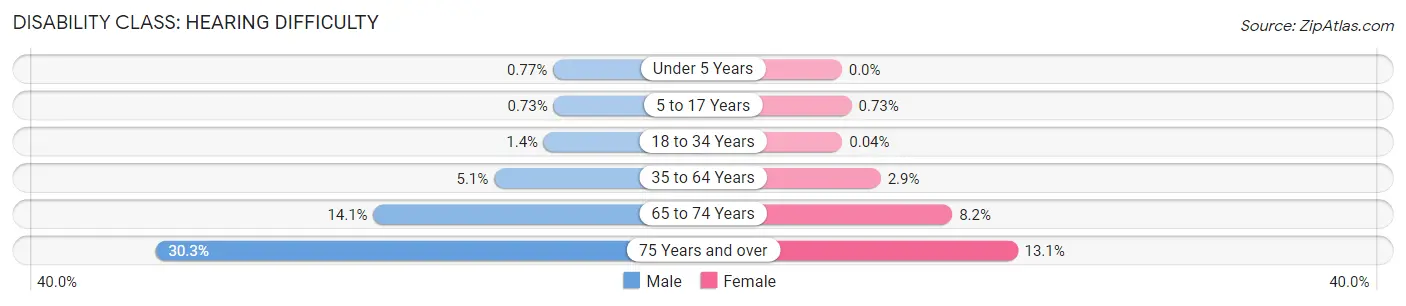
| Age Bracket | Male | Female |
| Under 5 Years | 14 (0.8%) | 0 (0.0%) |
| 5 to 17 Years | 35 (0.7%) | 34 (0.7%) |
| 18 to 34 Years | 72 (1.4%) | 2 (0.0%) |
| 35 to 64 Years | 408 (5.1%) | 268 (2.9%) |
| 65 to 74 Years | 267 (14.1%) | 183 (8.2%) |
| 75 Years and over | 317 (30.3%) | 209 (13.1%) |
Disability Class: Vision Difficulty
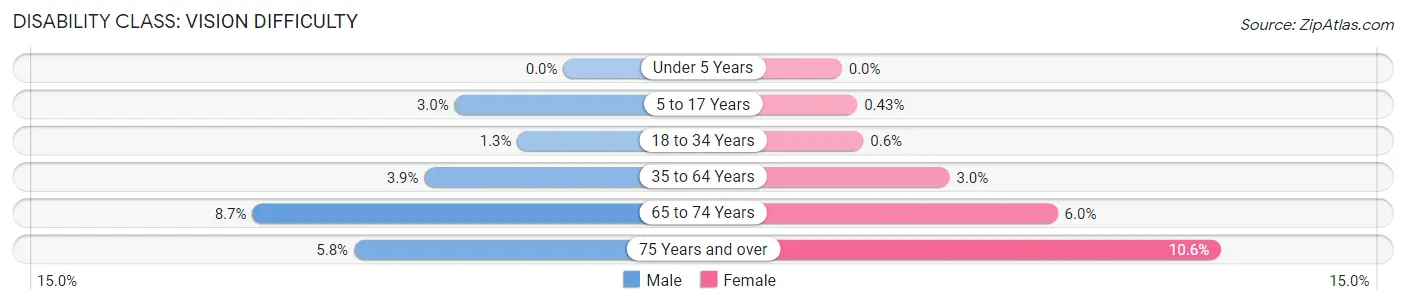
| Age Bracket | Male | Female |
| Under 5 Years | 0 (0.0%) | 0 (0.0%) |
| 5 to 17 Years | 145 (3.0%) | 20 (0.4%) |
| 18 to 34 Years | 64 (1.3%) | 33 (0.6%) |
| 35 to 64 Years | 307 (3.9%) | 279 (3.0%) |
| 65 to 74 Years | 164 (8.7%) | 134 (6.0%) |
| 75 Years and over | 61 (5.8%) | 169 (10.6%) |
Disability Class: Cognitive Difficulty
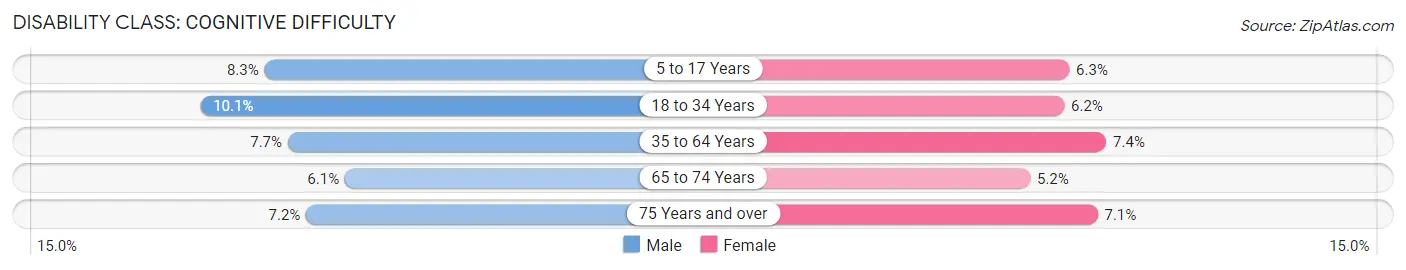
| Age Bracket | Male | Female |
| 5 to 17 Years | 398 (8.3%) | 296 (6.3%) |
| 18 to 34 Years | 506 (10.1%) | 338 (6.2%) |
| 35 to 64 Years | 609 (7.7%) | 683 (7.4%) |
| 65 to 74 Years | 115 (6.1%) | 117 (5.2%) |
| 75 Years and over | 75 (7.2%) | 114 (7.1%) |
Disability Class: Ambulatory Difficulty
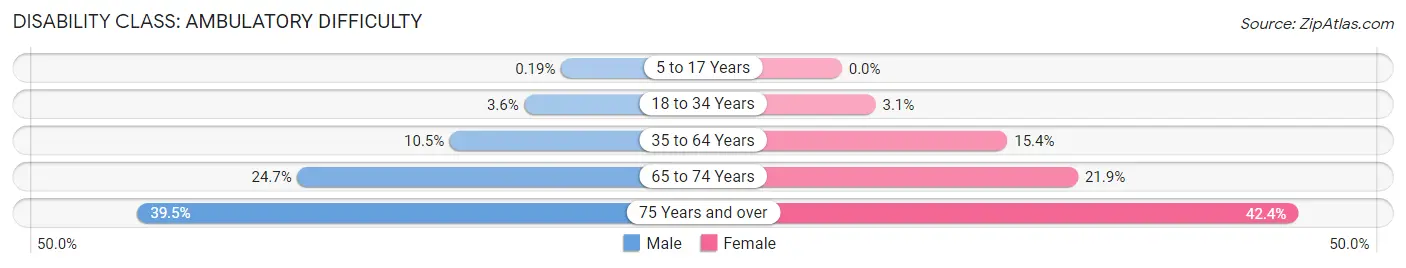
| Age Bracket | Male | Female |
| 5 to 17 Years | 9 (0.2%) | 0 (0.0%) |
| 18 to 34 Years | 180 (3.6%) | 171 (3.1%) |
| 35 to 64 Years | 834 (10.5%) | 1,426 (15.4%) |
| 65 to 74 Years | 467 (24.7%) | 489 (21.9%) |
| 75 Years and over | 414 (39.5%) | 678 (42.3%) |
Disability Class: Self-Care Difficulty
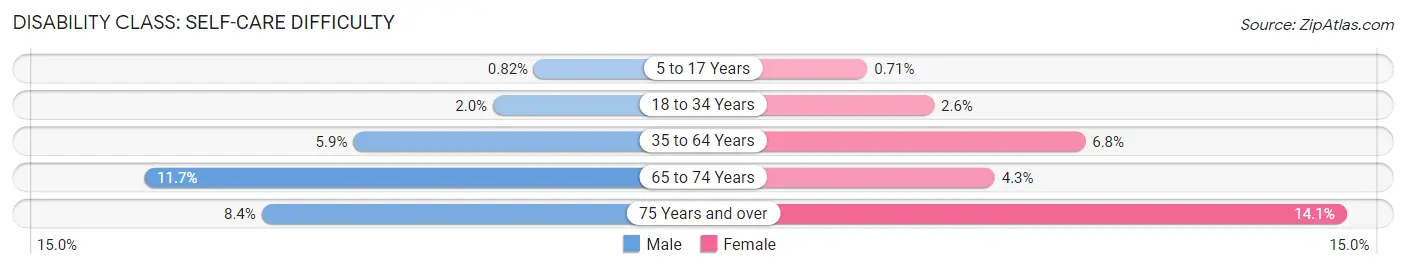
| Age Bracket | Male | Female |
| 5 to 17 Years | 39 (0.8%) | 33 (0.7%) |
| 18 to 34 Years | 98 (2.0%) | 140 (2.6%) |
| 35 to 64 Years | 464 (5.9%) | 630 (6.8%) |
| 65 to 74 Years | 221 (11.7%) | 95 (4.3%) |
| 75 Years and over | 88 (8.4%) | 225 (14.1%) |
Technology Access in Crittenden County
Computing Device Access in Crittenden County
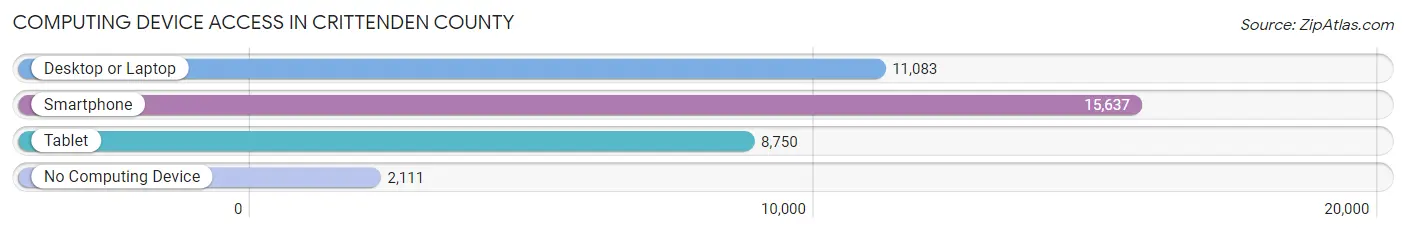
| Device Type | # Households | % Households |
| Desktop or Laptop | 11,083 | 59.6% |
| Smartphone | 15,637 | 84.1% |
| Tablet | 8,750 | 47.1% |
| No Computing Device | 2,111 | 11.4% |
| Total | 18,587 | 100.0% |
Internet Access in Crittenden County
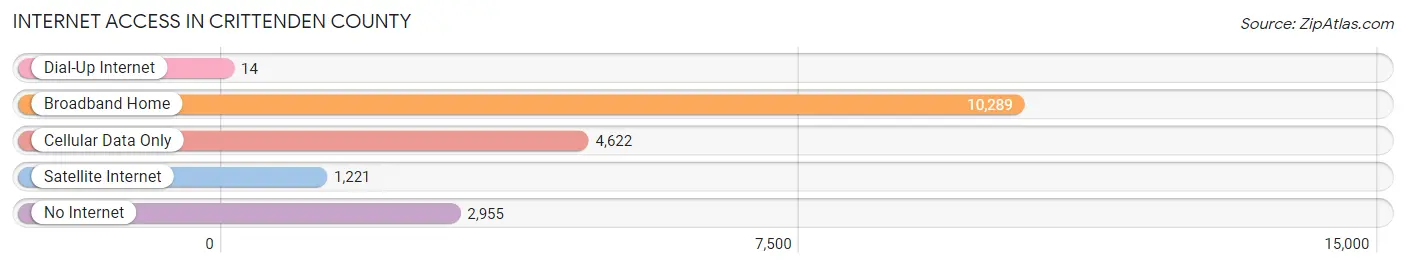
| Internet Type | # Households | % Households |
| Dial-Up Internet | 14 | 0.1% |
| Broadband Home | 10,289 | 55.4% |
| Cellular Data Only | 4,622 | 24.9% |
| Satellite Internet | 1,221 | 6.6% |
| No Internet | 2,955 | 15.9% |
| Total | 18,587 | 100.0% |
Crittenden County Summary
Crittenden County, Arkansas is located in the eastern part of the state, and is bordered by Mississippi to the east, St. Francis County to the south, Cross County to the west, and Poinsett County to the north. The county seat is Marion, and the county is part of the Memphis, TN-MS-AR Metropolitan Statistical Area. As of the 2010 census, the population of Crittenden County was 50,902, making it the second most populous county in Arkansas.
History
Crittenden County was formed in 1825 from a portion of Phillips County. It was named for Robert Crittenden, the first Secretary of the Arkansas Territory. The county was initially divided into four townships: Marion, Crawfordsville, Horseshoe Lake, and Tyronza.
The county was home to several Native American tribes, including the Quapaw, Chickasaw, and Choctaw. The first European settlers arrived in the area in the early 1800s, and the county was officially organized in 1825.
During the Civil War, Crittenden County was the site of several battles, including the Battle of Chalk Bluff and the Battle of Helena. After the war, the county experienced a period of economic growth, with the development of cotton plantations and the construction of the Memphis and Little Rock Railroad.
Geography
Crittenden County is located in the eastern part of Arkansas, and is bordered by Mississippi to the east, St. Francis County to the south, Cross County to the west, and Poinsett County to the north. The county has a total area of 545 square miles, of which 543 square miles is land and 2 square miles is water.
The county is located in the Mississippi Alluvial Plain, and is mostly flat with some rolling hills. The St. Francis River runs through the county, and there are several lakes, including Horseshoe Lake and Tyronza Lake.
Economy
Crittenden County has a diverse economy, with agriculture, manufacturing, and tourism being the main industries. The county is home to several large agricultural operations, including cotton, soybeans, corn, and rice.
Manufacturing is also an important part of the county’s economy, with several large companies located in the area, including Procter & Gamble, Tyson Foods, and International Paper. Tourism is also an important part of the economy, with several attractions, including the Arkansas Delta Music Museum, the Arkansas Delta Heritage Trail, and the Arkansas Delta Byway.
Demographics
As of the 2010 census, the population of Crittenden County was 50,902, making it the second most populous county in Arkansas. The population is made up of a diverse mix of races and ethnicities, with the largest groups being White (63.3%), African American (30.2%), and Hispanic or Latino (3.3%).
The median household income in the county is $41,945, and the median home value is $97,400. The unemployment rate is 6.2%, and the poverty rate is 19.3%.
Conclusion
Crittenden County, Arkansas is a diverse and vibrant county located in the eastern part of the state. The county has a rich history, and is home to several large agricultural operations, manufacturing companies, and tourist attractions. The population is made up of a diverse mix of races and ethnicities, and the median household income is $41,945. Crittenden County is an important part of the state of Arkansas, and is an excellent place to live and work.
Common Questions
What is Per Capita Income in Crittenden County?
Per Capita income in Crittenden County is $27,834.
What is the Median Family Income in Crittenden County?
Median Family Income in Crittenden County is $60,037.
What is the Median Household income in Crittenden County?
Median Household Income in Crittenden County is $51,860.
What is Income or Wage Gap in Crittenden County?
Income or Wage Gap in Crittenden County is 29.9%.
Women in Crittenden County earn 70.1 cents for every dollar earned by a man.
What is Family Income Deficit in Crittenden County?
Family Income Deficit in Crittenden County is $11,679.
Families that are below poverty line in Crittenden County earn $11,679 less on average than the poverty threshold level.
What is Inequality or Gini Index in Crittenden County?
Inequality or Gini Index in Crittenden County is 0.48.
What is the Total Population of Crittenden County?
Total Population of Crittenden County is 47,945.
What is the Total Male Population of Crittenden County?
Total Male Population of Crittenden County is 22,739.
What is the Total Female Population of Crittenden County?
Total Female Population of Crittenden County is 25,206.
What is the Ratio of Males per 100 Females in Crittenden County?
There are 90.21 Males per 100 Females in Crittenden County.
What is the Ratio of Females per 100 Males in Crittenden County?
There are 110.85 Females per 100 Males in Crittenden County.
What is the Median Population Age in Crittenden County?
Median Population Age in Crittenden County is 35.8 Years.
What is the Average Family Size in Crittenden County
Average Family Size in Crittenden County is 3.2 People.
What is the Average Household Size in Crittenden County
Average Household Size in Crittenden County is 2.5 People.
How Large is the Labor Force in Crittenden County?
There are 22,712 People in the Labor Forcein in Crittenden County.
What is the Percentage of People in the Labor Force in Crittenden County?
62.4% of People are in the Labor Force in Crittenden County.
What is the Unemployment Rate in Crittenden County?
Unemployment Rate in Crittenden County is 10.4%.