Area Code 513 Map & Demographics
Area Code 513 Map
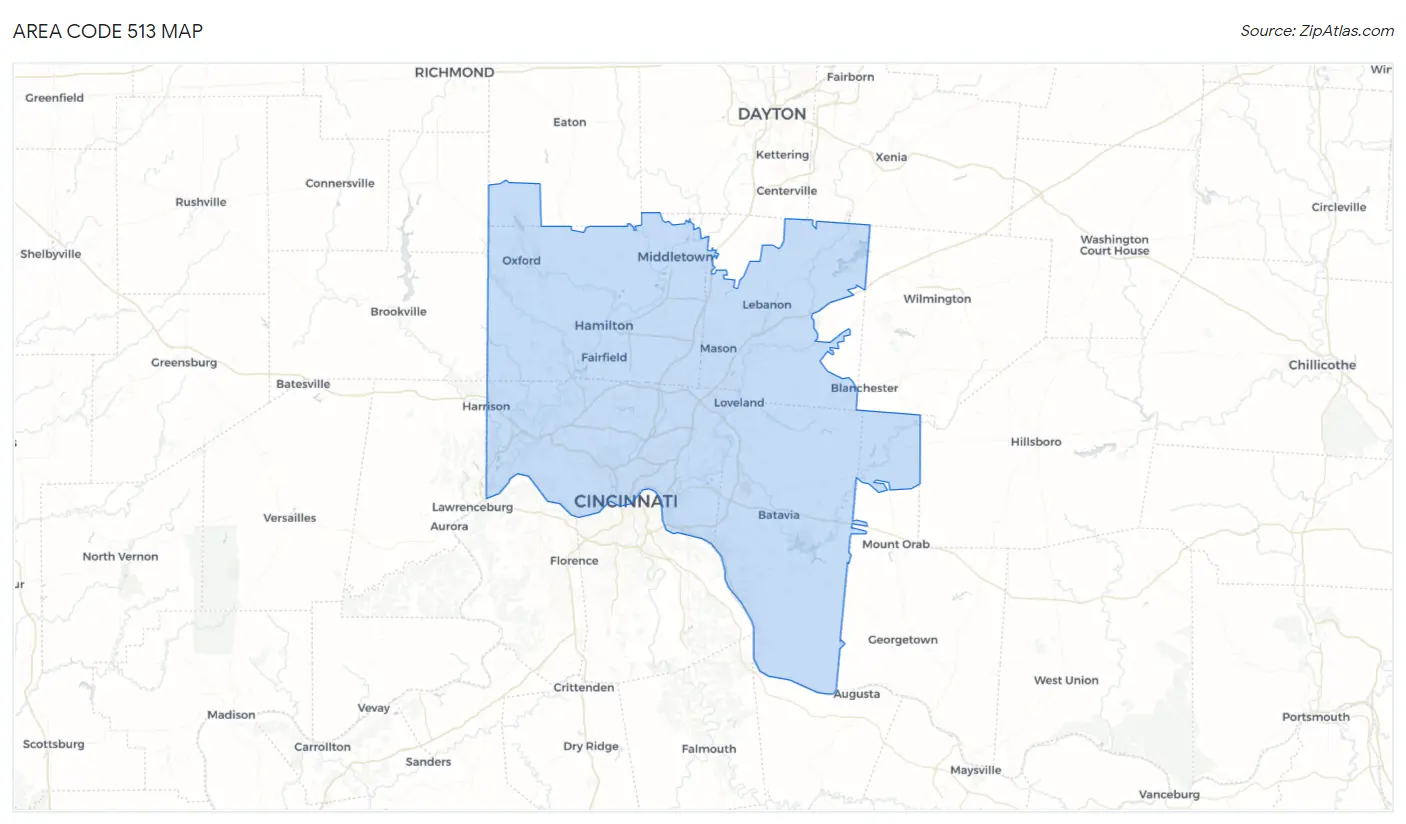
Area Code 513 Overview
$41,010
PER CAPITA INCOME
$97,078
AVG FAMILY INCOME
$76,696
AVG HOUSEHOLD INCOME
28.9%
WAGE / INCOME GAP [ % ]
71.1¢/ $1
WAGE / INCOME GAP [ $ ]
$11,057
FAMILY INCOME DEFICIT
40.05
INEQUALITY / GINI INDEX
1,614,801
TOTAL POPULATION
795,037
MALE POPULATION
819,764
FEMALE POPULATION
96.98
MALES / 100 FEMALES
103.11
FEMALES / 100 MALES
40.0
MEDIAN AGE
3.0
AVG FAMILY SIZE
2.5
AVG HOUSEHOLD SIZE
825,358
LABOR FORCE [ PEOPLE ]
64.2%
PERCENT IN LABOR FORCE
5.8%
UNEMPLOYMENT RATE
Income in Area Code 513
Income Overview in Area Code 513
Per Capita Income in Area Code 513 is $41,010, while median incomes of families and households are $97,078 and $76,696 respectively.
| Characteristic | Number | Measure |
| Per Capita Income | 1,614,801 | $41,010 |
| Median Family Income | 402,647 | $97,078 |
| Mean Family Income | 402,647 | $10,705,058 |
| Median Household Income | 644,525 | $76,696 |
| Mean Household Income | 644,525 | $8,993,569 |
| Income Deficit | 402,647 | $11,057 |
| Wage / Income Gap (%) | 1,614,801 | 28.86% |
| Wage / Income Gap ($) | 1,614,801 | 71.14¢ per $1 |
| Gini / Inequality Index | 1,614,801 | 40.05 |
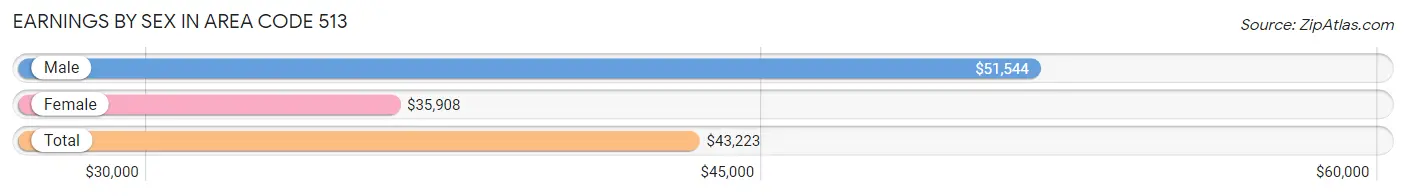
Earnings by Sex in Area Code 513
Average Earnings in Area Code 513 are $43,223, $51,544 for men and $35,908 for women, a difference of 30.3%.
| Sex | Number | Average Earnings |
| Male | 459,616 (51.7%) | $51,544 |
| Female | 428,602 (48.2%) | $35,908 |
| Total | 888,218 (100.0%) | $43,223 |
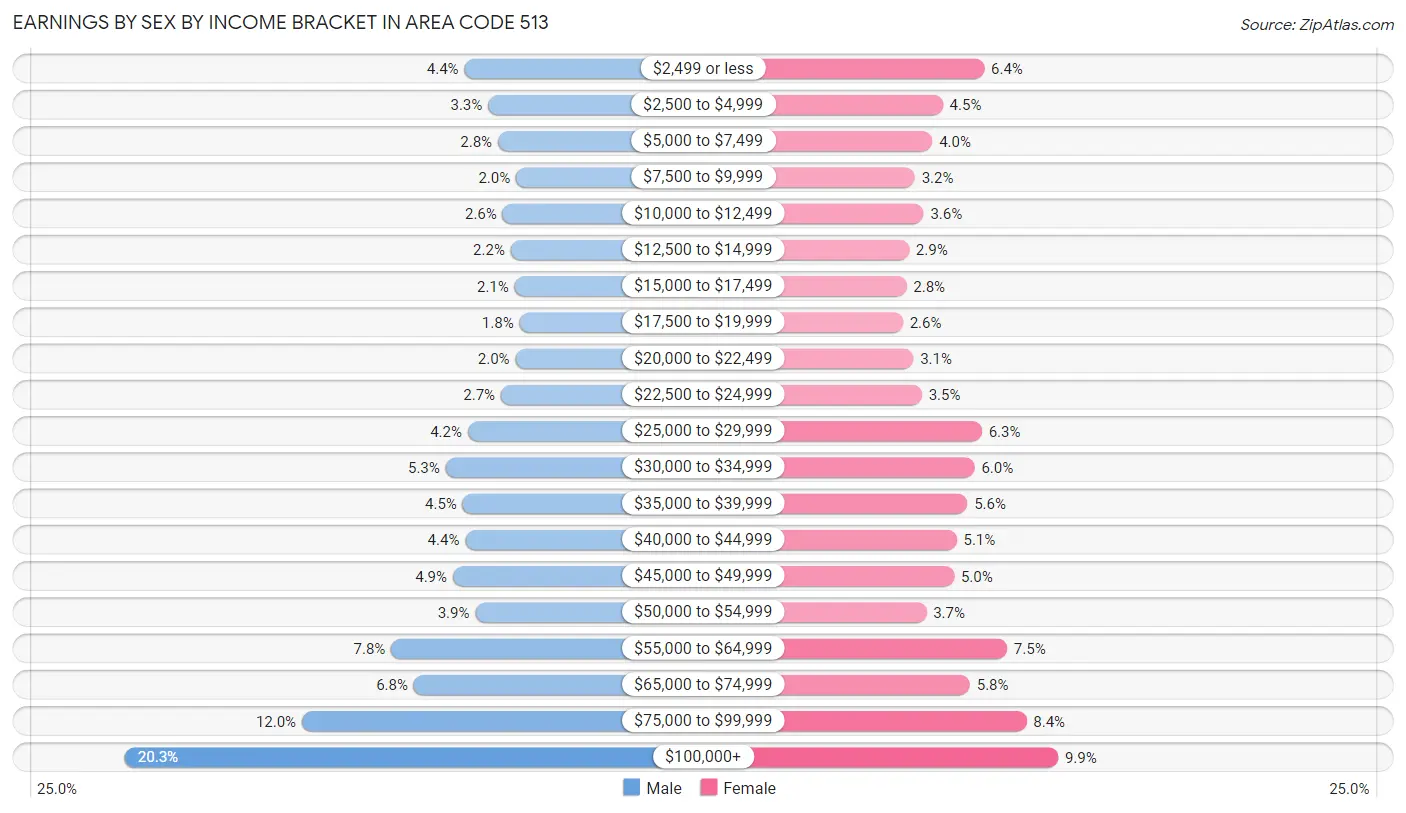
Earnings by Sex by Income Bracket in Area Code 513
The most common earnings brackets in Area Code 513 are $100,000+ for men (93,280 | 20.3%) and $100,000+ for women (42,404 | 9.9%).
| Income | Male | Female |
| $2,499 or less | 20,215 (4.4%) | 27,573 (6.4%) |
| $2,500 to $4,999 | 15,124 (3.3%) | 19,240 (4.5%) |
| $5,000 to $7,499 | 12,993 (2.8%) | 17,155 (4.0%) |
| $7,500 to $9,999 | 9,082 (2.0%) | 13,643 (3.2%) |
| $10,000 to $12,499 | 11,999 (2.6%) | 15,373 (3.6%) |
| $12,500 to $14,999 | 10,256 (2.2%) | 12,465 (2.9%) |
| $15,000 to $17,499 | 9,432 (2.1%) | 11,946 (2.8%) |
| $17,500 to $19,999 | 8,345 (1.8%) | 11,214 (2.6%) |
| $20,000 to $22,499 | 9,247 (2.0%) | 13,329 (3.1%) |
| $22,500 to $24,999 | 12,376 (2.7%) | 15,030 (3.5%) |
| $25,000 to $29,999 | 19,501 (4.2%) | 27,075 (6.3%) |
| $30,000 to $34,999 | 24,264 (5.3%) | 25,624 (6.0%) |
| $35,000 to $39,999 | 20,571 (4.5%) | 24,170 (5.6%) |
| $40,000 to $44,999 | 20,050 (4.4%) | 22,037 (5.1%) |
| $45,000 to $49,999 | 22,703 (4.9%) | 21,500 (5.0%) |
| $50,000 to $54,999 | 17,861 (3.9%) | 15,959 (3.7%) |
| $55,000 to $64,999 | 35,965 (7.8%) | 32,159 (7.5%) |
| $65,000 to $74,999 | 31,136 (6.8%) | 24,676 (5.8%) |
| $75,000 to $99,999 | 55,216 (12.0%) | 36,030 (8.4%) |
| $100,000+ | 93,280 (20.3%) | 42,404 (9.9%) |
| Total | 459,616 (100.0%) | 428,602 (100.0%) |
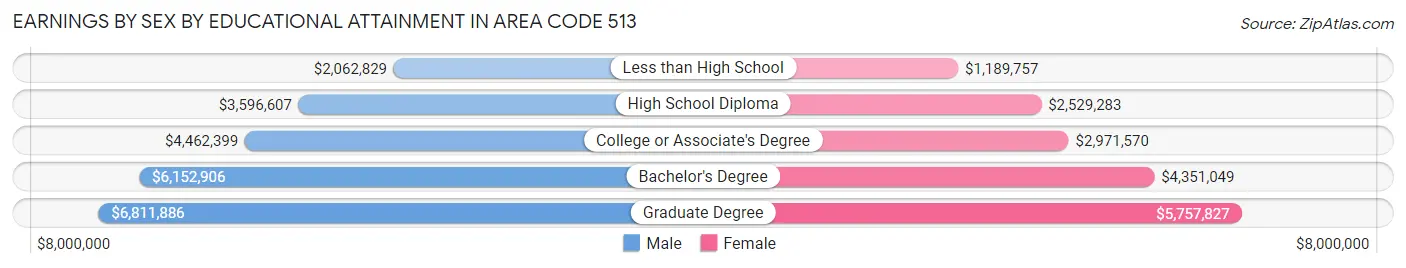
Earnings by Sex by Educational Attainment in Area Code 513
Average earnings in Area Code 513 are $5,158,897 for men and $3,686,266 for women, a difference of 28.5%. Men with an educational attainment of graduate degree enjoy the highest average annual earnings of $6,811,886, while those with less than high school education earn the least with $2,062,829. Women with an educational attainment of graduate degree earn the most with the average annual earnings of $5,757,827, while those with less than high school education have the smallest earnings of $1,189,757.
| Educational Attainment | Male Income | Female Income |
| Less than High School | $2,062,829 | $1,189,757 |
| High School Diploma | $3,596,607 | $2,529,283 |
| College or Associate's Degree | $4,462,399 | $2,971,570 |
| Bachelor's Degree | $6,152,906 | $4,351,049 |
| Graduate Degree | $6,811,886 | $5,757,827 |
| Total | $5,158,897 | $3,686,266 |
Family Income in Area Code 513
Family Income Brackets in Area Code 513
According to the Area Code 513 family income data, there are 7,109,538 families falling into the $100,000 to $149,999 income range, which is the most common income bracket and makes up 1,765.7% of all families. Conversely, the $10,000 to $14,999 income bracket is the least frequent group with only 942,597 families (234.1%) belonging to this category.
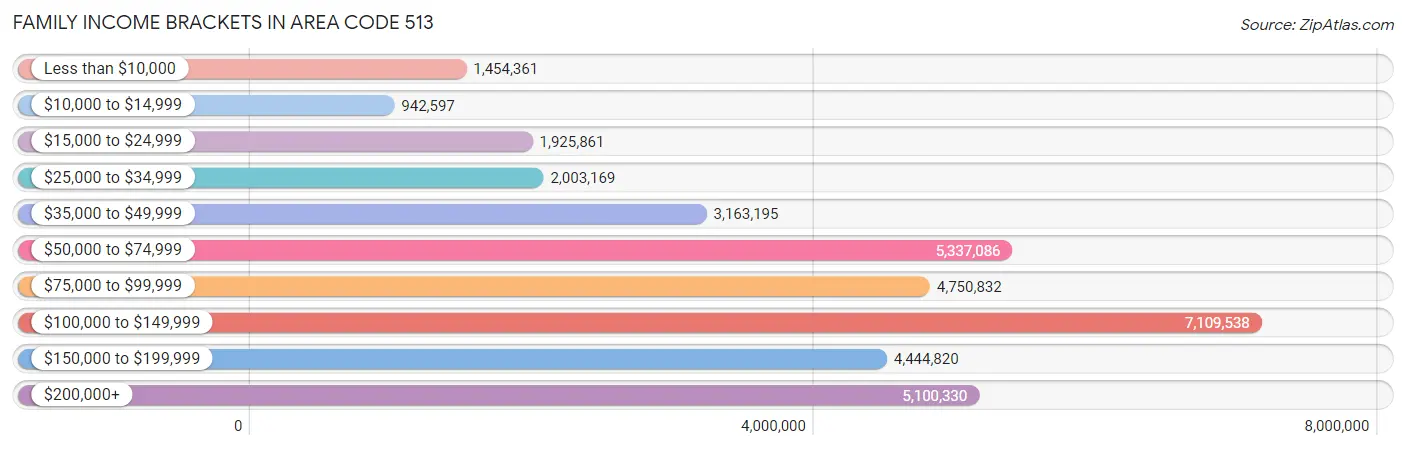
| Income Bracket | # Families | % Families |
| Less than $10,000 | 1,454,361 | 361.2% |
| $10,000 to $14,999 | 942,597 | 234.1% |
| $15,000 to $24,999 | 1,925,861 | 478.3% |
| $25,000 to $34,999 | 2,003,169 | 497.5% |
| $35,000 to $49,999 | 3,163,195 | 785.6% |
| $50,000 to $74,999 | 5,337,086 | 1,325.5% |
| $75,000 to $99,999 | 4,750,832 | 1,179.9% |
| $100,000 to $149,999 | 7,109,538 | 1,765.7% |
| $150,000 to $199,999 | 4,444,820 | 1,103.9% |
| $200,000+ | 5,100,330 | 1,266.7% |
Family Income by Famaliy Size in Area Code 513
6-person families (11,100 | 2.8%) account for the highest median family income in Area Code 513 with $138,286 per family, while 2-person families (193,314 | 48.0%) have the highest median income of $42,720 per family member.
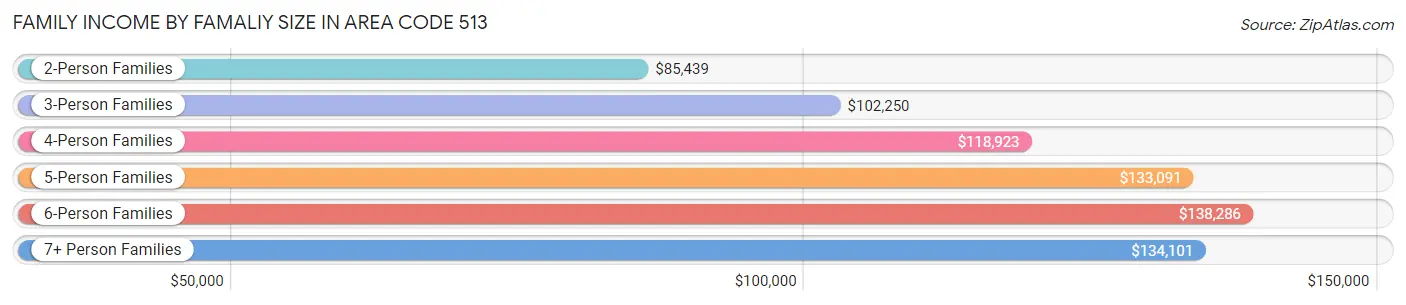
| Income Bracket | # Families | Median Income |
| 2-Person Families | 193,314 (48.0%) | $85,439 |
| 3-Person Families | 85,611 (21.3%) | $102,250 |
| 4-Person Families | 75,194 (18.7%) | $118,923 |
| 5-Person Families | 32,063 (8.0%) | $133,091 |
| 6-Person Families | 11,100 (2.8%) | $138,286 |
| 7+ Person Families | 5,365 (1.3%) | $134,101 |
| Total | 402,647 (100.0%) | $97,078 |
Family Income by Number of Earners in Area Code 513
The median family income in Area Code 513 is $97,078, with families comprising 3+ earners (47,405) having the highest median family income of $156,279, while families with no earners (56,068) have the lowest median family income of $52,704, accounting for 11.8% and 13.9% of families, respectively.
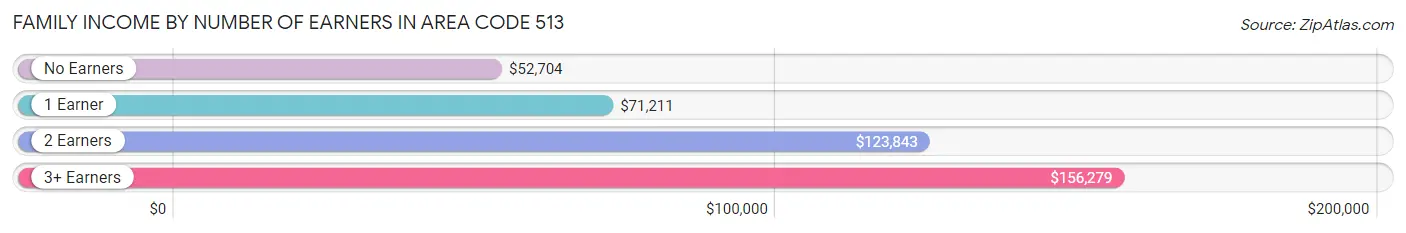
| Number of Earners | # Families | Median Income |
| No Earners | 56,068 (13.9%) | $52,704 |
| 1 Earner | 125,950 (31.3%) | $71,211 |
| 2 Earners | 173,224 (43.0%) | $123,843 |
| 3+ Earners | 47,405 (11.8%) | $156,279 |
| Total | 402,647 (100.0%) | $97,078 |
Household Income in Area Code 513
Household Income Brackets in Area Code 513
With 9,428,112 households falling in the category, the $100,000 to $149,999 income range is the most frequent in Area Code 513, accounting for 1,462.8% of all households. In contrast, only 2,625,795 households (407.4%) fall into the $10,000 to $14,999 income bracket, making it the least populous group.
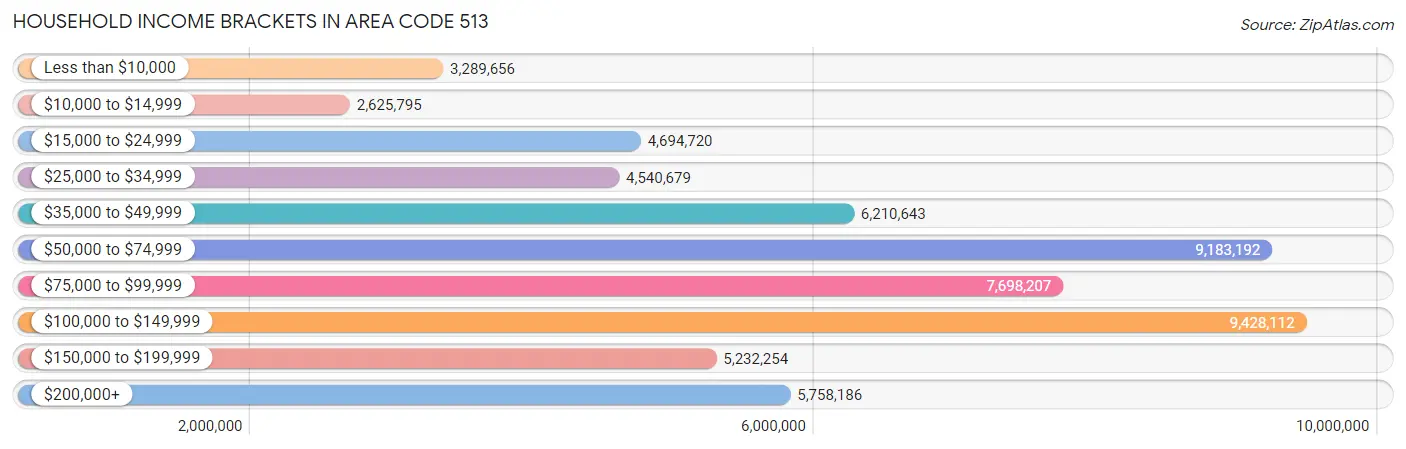
| Income Bracket | # Households | % Households |
| Less than $10,000 | 3,289,656 | 510.4% |
| $10,000 to $14,999 | 2,625,795 | 407.4% |
| $15,000 to $24,999 | 4,694,720 | 728.4% |
| $25,000 to $34,999 | 4,540,679 | 704.5% |
| $35,000 to $49,999 | 6,210,643 | 963.6% |
| $50,000 to $74,999 | 9,183,192 | 1,424.8% |
| $75,000 to $99,999 | 7,698,207 | 1,194.4% |
| $100,000 to $149,999 | 9,428,112 | 1,462.8% |
| $150,000 to $199,999 | 5,232,254 | 811.8% |
| $200,000+ | 5,758,186 | 893.4% |
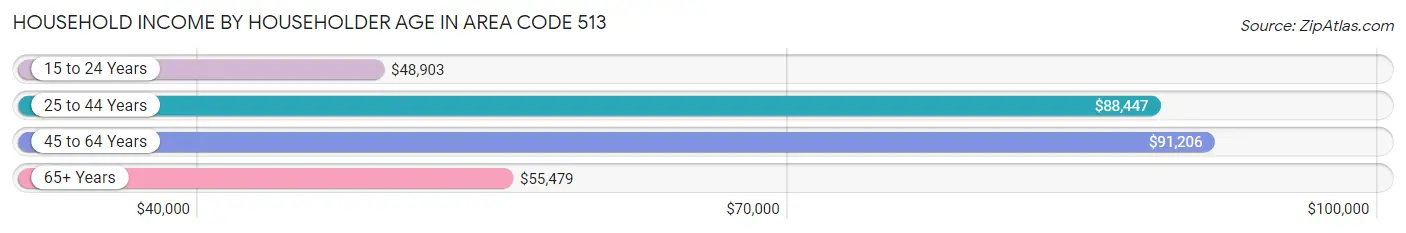
Household Income by Householder Age in Area Code 513
The median household income in Area Code 513 is $76,696, with the highest median household income of $91,206 found in the 45 to 64 years age bracket for the primary householder. A total of 235,158 households (36.5%) fall into this category. Meanwhile, the 15 to 24 years age bracket for the primary householder has the lowest median household income of $48,903, with 29,632 households (4.6%) in this group.
| Income Bracket | # Households | Median Income |
| 15 to 24 Years | 29,632 (4.6%) | $48,903 |
| 25 to 44 Years | 215,519 (33.4%) | $88,447 |
| 45 to 64 Years | 235,158 (36.5%) | $91,206 |
| 65+ Years | 164,216 (25.5%) | $55,479 |
| Total | 644,525 (100.0%) | $76,696 |
Poverty in Area Code 513
Income Below Poverty by Sex and Age in Area Code 513
With 10.8% poverty level for males and 13.5% for females among the residents of Area Code 513, 18 to 24 year old males and 18 to 24 year old females are the most vulnerable to poverty, with 14,295 males (19.7%) and 19,130 females (27.2%) in their respective age groups living below the poverty level.
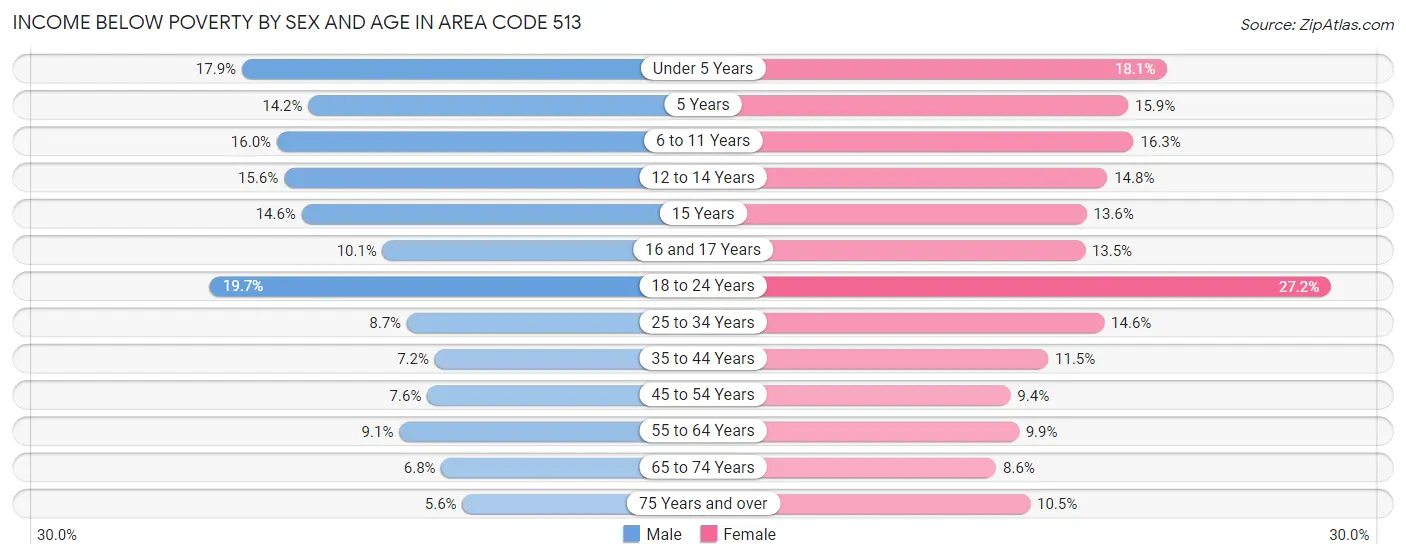
| Age Bracket | Male | Female |
| Under 5 Years | 8,701 (17.9%) | 8,418 (18.1%) |
| 5 Years | 1,358 (14.2%) | 1,464 (15.9%) |
| 6 to 11 Years | 9,906 (16.0%) | 9,638 (16.3%) |
| 12 to 14 Years | 5,188 (15.5%) | 4,838 (14.8%) |
| 15 Years | 1,662 (14.6%) | 1,439 (13.6%) |
| 16 and 17 Years | 2,218 (10.1%) | 2,816 (13.5%) |
| 18 to 24 Years | 14,295 (19.7%) | 19,130 (27.2%) |
| 25 to 34 Years | 9,237 (8.7%) | 15,755 (14.6%) |
| 35 to 44 Years | 7,127 (7.2%) | 11,714 (11.5%) |
| 45 to 54 Years | 7,274 (7.6%) | 9,199 (9.4%) |
| 55 to 64 Years | 9,405 (9.1%) | 10,721 (9.9%) |
| 65 to 74 Years | 4,804 (6.8%) | 6,899 (8.6%) |
| 75 Years and over | 2,185 (5.6%) | 5,896 (10.5%) |
| Total | 83,360 (10.8%) | 107,927 (13.5%) |
Income Above Poverty by Sex and Age in Area Code 513
According to the poverty statistics in Area Code 513, males aged 75 years and over and females aged 65 to 74 years are the age groups that are most secure financially, with 94.4% of males and 91.4% of females in these age groups living above the poverty line.
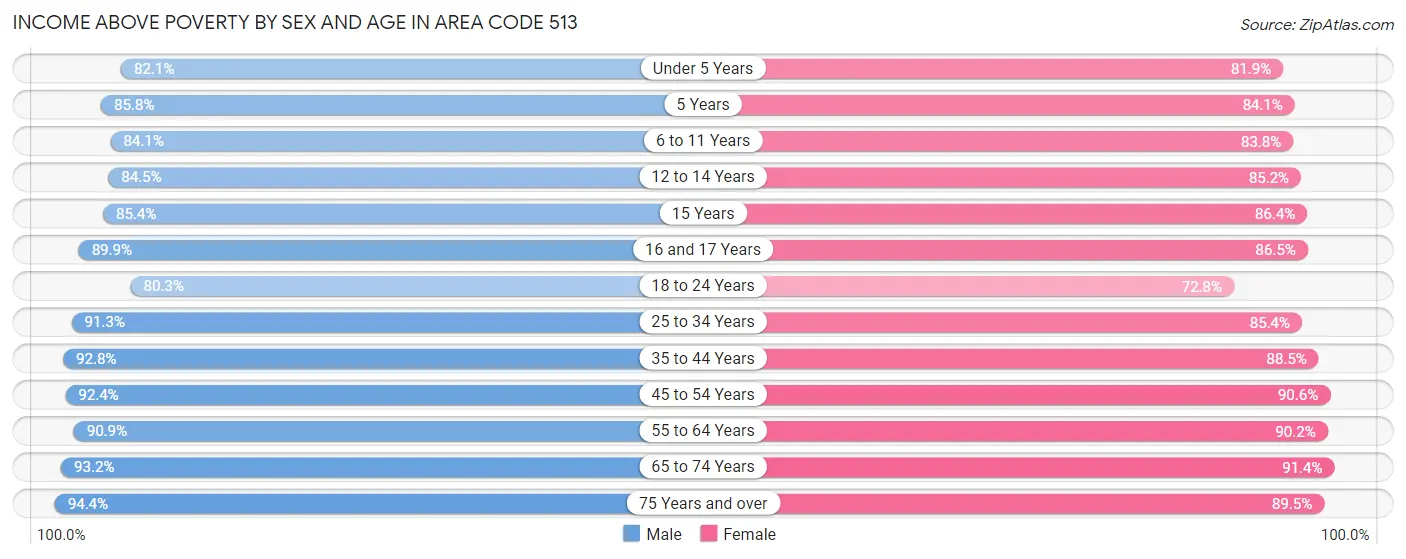
| Age Bracket | Male | Female |
| Under 5 Years | 39,913 (82.1%) | 38,052 (81.9%) |
| 5 Years | 8,206 (85.8%) | 7,721 (84.1%) |
| 6 to 11 Years | 52,207 (84.1%) | 49,660 (83.8%) |
| 12 to 14 Years | 28,178 (84.5%) | 27,902 (85.2%) |
| 15 Years | 9,744 (85.4%) | 9,121 (86.4%) |
| 16 and 17 Years | 19,819 (89.9%) | 17,982 (86.5%) |
| 18 to 24 Years | 58,331 (80.3%) | 51,105 (72.8%) |
| 25 to 34 Years | 96,789 (91.3%) | 92,056 (85.4%) |
| 35 to 44 Years | 92,432 (92.8%) | 90,237 (88.5%) |
| 45 to 54 Years | 88,659 (92.4%) | 88,733 (90.6%) |
| 55 to 64 Years | 93,477 (90.9%) | 98,084 (90.1%) |
| 65 to 74 Years | 65,976 (93.2%) | 73,457 (91.4%) |
| 75 Years and over | 36,691 (94.4%) | 50,383 (89.5%) |
| Total | 690,422 (89.2%) | 694,493 (86.6%) |
Income Below Poverty Among Married-Couple Families in Area Code 513
The poverty statistics for married-couple families in Area Code 513 show that 2.8% or 8,353 of the total 295,041 families live below the poverty line. Families with 5 or more children have the highest poverty rate of 17.6%, comprising of 378 families. On the other hand, families with no children have the lowest poverty rate of 2.2%, which includes 3,697 families.
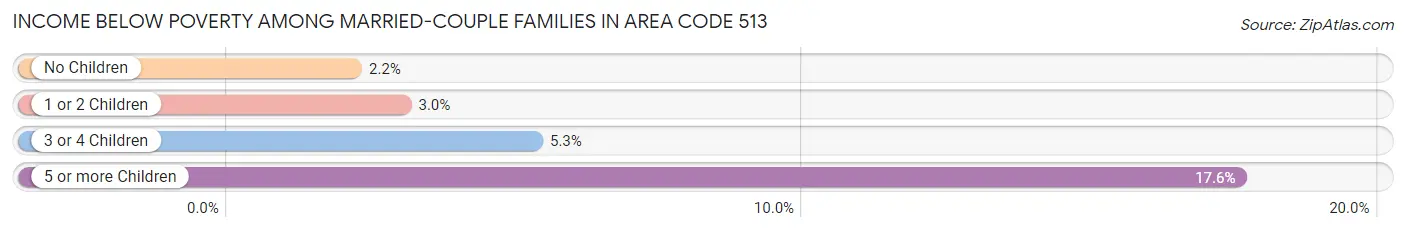
| Children | Above Poverty | Below Poverty |
| No Children | 167,107 (97.8%) | 3,697 (2.2%) |
| 1 or 2 Children | 93,360 (97.0%) | 2,908 (3.0%) |
| 3 or 4 Children | 24,448 (94.7%) | 1,370 (5.3%) |
| 5 or more Children | 1,773 (82.4%) | 378 (17.6%) |
| Total | 286,688 (97.2%) | 8,353 (2.8%) |
Income Below Poverty Among Single-Parent Households in Area Code 513
According to the poverty data in Area Code 513, 9.5% or 2,768 single-father households and 27.5% or 21,598 single-mother households are living below the poverty line. Among single-father households, those with 5 or more children have the highest poverty rate, with 103 households (32.1%) experiencing poverty. Likewise, among single-mother households, those with 5 or more children have the highest poverty rate, with 718 households (74.6%) falling below the poverty line.
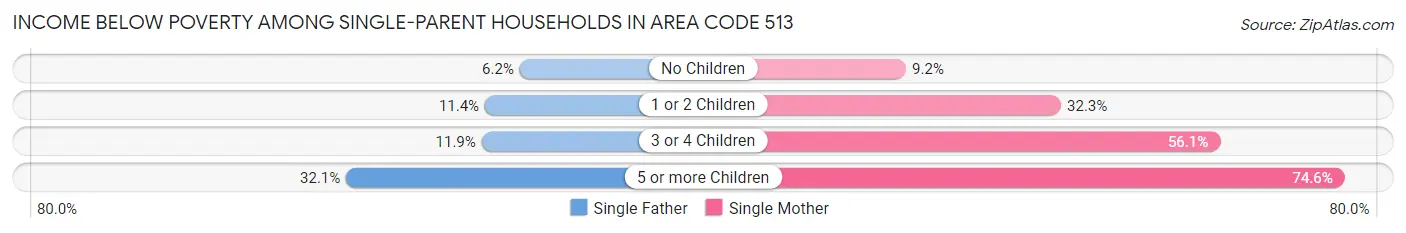
| Children | Single Father | Single Mother |
| No Children | 763 (6.2%) | 2,509 (9.2%) |
| 1 or 2 Children | 1,613 (11.4%) | 13,155 (32.3%) |
| 3 or 4 Children | 289 (11.9%) | 5,216 (56.1%) |
| 5 or more Children | 103 (32.1%) | 718 (74.6%) |
| Total | 2,768 (9.5%) | 21,598 (27.5%) |
Income Below Poverty Among Married-Couple vs Single-Parent Households in Area Code 513
The poverty data for Area Code 513 shows that 8,353 of the married-couple family households (2.8%) and 24,366 of the single-parent households (22.6%) are living below the poverty level. Within the married-couple family households, those with 5 or more children have the highest poverty rate, with 378 households (17.6%) falling below the poverty line. Among the single-parent households, those with 5 or more children have the highest poverty rate, with 821 household (64.0%) living below poverty.
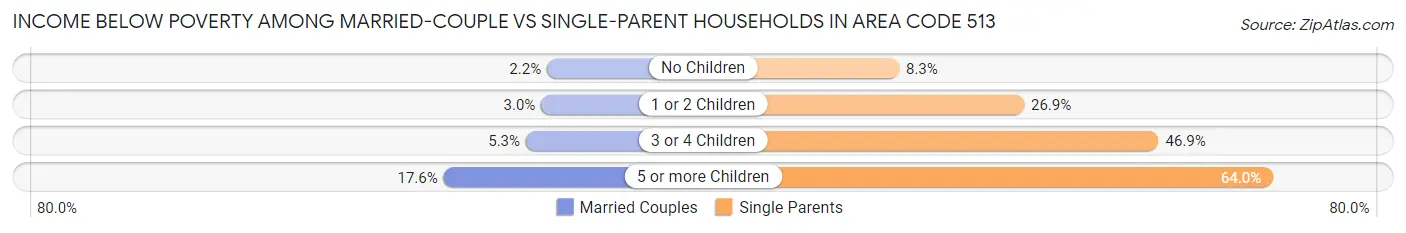
| Children | Married-Couple Families | Single-Parent Households |
| No Children | 3,697 (2.2%) | 3,272 (8.3%) |
| 1 or 2 Children | 2,908 (3.0%) | 14,768 (26.9%) |
| 3 or 4 Children | 1,370 (5.3%) | 5,505 (46.9%) |
| 5 or more Children | 378 (17.6%) | 821 (64.0%) |
| Total | 8,353 (2.8%) | 24,366 (22.6%) |
Race in Area Code 513
The most populous races in Area Code 513 are White / Caucasian (1,206,262 | 74.7%), Black / African American (252,995 | 15.7%), and Two or more Races (76,923 | 4.8%).
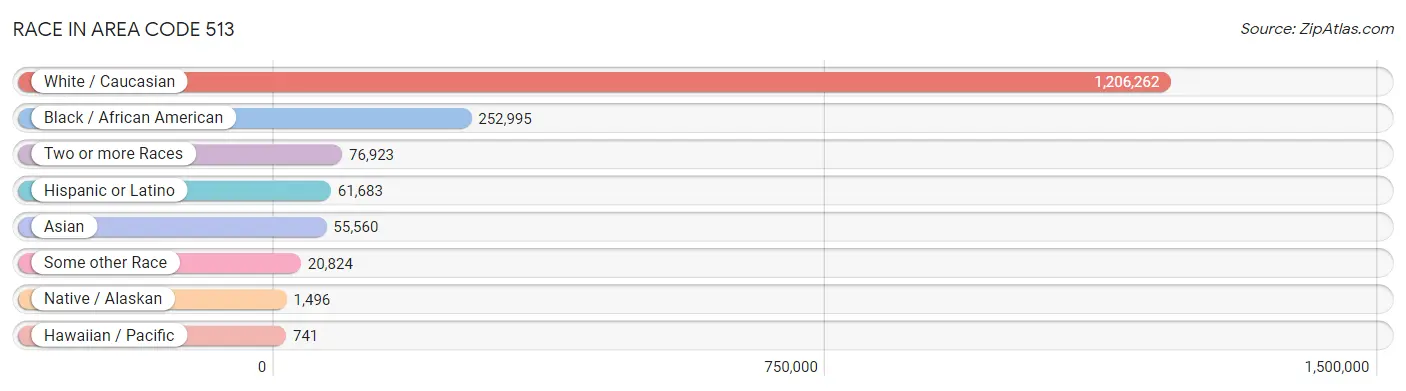
| Race | # Population | % Population |
| Asian | 55,560 | 3.4% |
| Black / African American | 252,995 | 15.7% |
| Hawaiian / Pacific | 741 | 0.1% |
| Hispanic or Latino | 61,683 | 3.8% |
| Native / Alaskan | 1,496 | 0.1% |
| White / Caucasian | 1,206,262 | 74.7% |
| Two or more Races | 76,923 | 4.8% |
| Some other Race | 20,824 | 1.3% |
| Total | 1,614,801 | 100.0% |
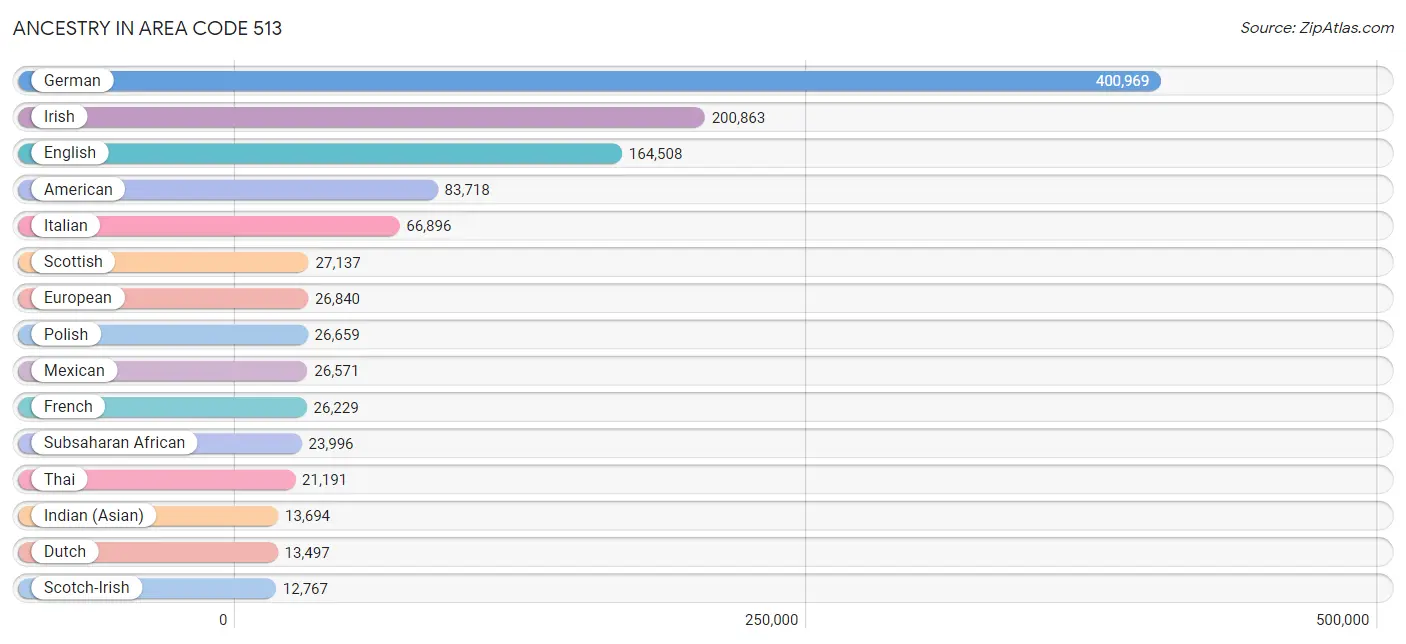
Ancestry in Area Code 513
The most populous ancestries reported in Area Code 513 are German (400,969 | 24.8%), Irish (200,863 | 12.4%), English (164,508 | 10.2%), American (83,718 | 5.2%), and Italian (66,896 | 4.1%), together accounting for 56.8% of all Area Code 513 residents.
| Ancestry | # Population | % Population |
| Afghan | 105 | 0.0% |
| African | 12,115 | 0.7% |
| Albanian | 136 | 0.0% |
| Aleut | 4 | 0.0% |
| Alsatian | 165 | 0.0% |
| American | 83,718 | 5.2% |
| Apache | 66 | 0.0% |
| Arab | 9,028 | 0.6% |
| Argentinean | 625 | 0.0% |
| Armenian | 874 | 0.1% |
| Australian | 107 | 0.0% |
| Austrian | 2,646 | 0.2% |
| Bahamian | 24 | 0.0% |
| Bangladeshi | 79 | 0.0% |
| Barbadian | 146 | 0.0% |
| Basque | 1 | 0.0% |
| Belgian | 1,098 | 0.1% |
| Belizean | 35 | 0.0% |
| Bermudan | 17 | 0.0% |
| Bhutanese | 3,813 | 0.2% |
| Blackfeet | 734 | 0.1% |
| Bolivian | 212 | 0.0% |
| Brazilian | 906 | 0.1% |
| British | 9,754 | 0.6% |
| British West Indian | 60 | 0.0% |
| Bulgarian | 283 | 0.0% |
| Burmese | 4,294 | 0.3% |
| Cajun | 74 | 0.0% |
| Cambodian | 55 | 0.0% |
| Canadian | 2,432 | 0.2% |
| Cape Verdean | 19 | 0.0% |
| Carpatho Rusyn | 121 | 0.0% |
| Celtic | 408 | 0.0% |
| Central American | 11,797 | 0.7% |
| Central American Indian | 320 | 0.0% |
| Cherokee | 4,578 | 0.3% |
| Cheyenne | 70 | 0.0% |
| Chickasaw | 116 | 0.0% |
| Chilean | 485 | 0.0% |
| Chinese | 40 | 0.0% |
| Chippewa | 251 | 0.0% |
| Choctaw | 128 | 0.0% |
| Colombian | 1,467 | 0.1% |
| Comanche | 27 | 0.0% |
| Costa Rican | 766 | 0.1% |
| Cree | 74 | 0.0% |
| Creek | 141 | 0.0% |
| Croatian | 1,497 | 0.1% |
| Crow | 8 | 0.0% |
| Cuban | 2,871 | 0.2% |
| Cypriot | 10 | 0.0% |
| Czech | 3,439 | 0.2% |
| Czechoslovakian | 858 | 0.1% |
| Danish | 2,039 | 0.1% |
| Dominican | 2,196 | 0.1% |
| Dutch | 13,497 | 0.8% |
| Eastern European | 4,468 | 0.3% |
| Ecuadorian | 293 | 0.0% |
| Egyptian | 626 | 0.0% |
| English | 164,508 | 10.2% |
| Estonian | 53 | 0.0% |
| Ethiopian | 3,029 | 0.2% |
| European | 26,840 | 1.7% |
| Filipino | 825 | 0.1% |
| Finnish | 1,442 | 0.1% |
| French | 26,229 | 1.6% |
| French American Indian | 19 | 0.0% |
| French Canadian | 2,769 | 0.2% |
| German | 400,969 | 24.8% |
| German Russian | 170 | 0.0% |
| Ghanaian | 1,348 | 0.1% |
| Greek | 5,820 | 0.4% |
| Guamanian / Chamorro | 107 | 0.0% |
| Guatemalan | 6,536 | 0.4% |
| Guyanese | 93 | 0.0% |
| Haitian | 610 | 0.0% |
| Honduran | 1,197 | 0.1% |
| Hopi | 21 | 0.0% |
| Hungarian | 8,059 | 0.5% |
| Icelander | 209 | 0.0% |
| Indian (Asian) | 13,694 | 0.9% |
| Indonesian | 95 | 0.0% |
| Inupiat | 19 | 0.0% |
| Iranian | 738 | 0.1% |
| Iraqi | 91 | 0.0% |
| Irish | 200,863 | 12.4% |
| Iroquois | 159 | 0.0% |
| Israeli | 605 | 0.0% |
| Italian | 66,896 | 4.1% |
| Jamaican | 1,720 | 0.1% |
| Japanese | 1,450 | 0.1% |
| Jordanian | 620 | 0.0% |
| Kenyan | 220 | 0.0% |
| Korean | 6,736 | 0.4% |
| Laotian | 197 | 0.0% |
| Latvian | 259 | 0.0% |
| Lebanese | 2,528 | 0.2% |
| Liberian | 41 | 0.0% |
| Lithuanian | 1,785 | 0.1% |
| Lumbee | 3 | 0.0% |
| Luxembourger | 136 | 0.0% |
| Macedonian | 369 | 0.0% |
| Malaysian | 287 | 0.0% |
| Maltese | 77 | 0.0% |
| Mexican | 26,571 | 1.7% |
| Mexican American Indian | 321 | 0.0% |
| Mongolian | 240 | 0.0% |
| Moroccan | 635 | 0.0% |
| Native Hawaiian | 720 | 0.0% |
| Navajo | 334 | 0.0% |
| New Zealander | 28 | 0.0% |
| Nicaraguan | 469 | 0.0% |
| Nigerian | 2,561 | 0.2% |
| Northern European | 2,495 | 0.2% |
| Norwegian | 6,535 | 0.4% |
| Okinawan | 34 | 0.0% |
| Osage | 9 | 0.0% |
| Pakistani | 977 | 0.1% |
| Palestinian | 499 | 0.0% |
| Panamanian | 1,291 | 0.1% |
| Paraguayan | 32 | 0.0% |
| Pennsylvania German | 221 | 0.0% |
| Peruvian | 1,143 | 0.1% |
| Polish | 26,659 | 1.7% |
| Portuguese | 904 | 0.1% |
| Puerto Rican | 7,603 | 0.5% |
| Romanian | 1,684 | 0.1% |
| Russian | 7,957 | 0.5% |
| Salvadoran | 1,531 | 0.1% |
| Samoan | 144 | 0.0% |
| Scandinavian | 3,127 | 0.2% |
| Scotch-Irish | 12,767 | 0.8% |
| Scottish | 27,137 | 1.7% |
| Seminole | 72 | 0.0% |
| Senegalese | 830 | 0.1% |
| Serbian | 803 | 0.1% |
| Shoshone | 17 | 0.0% |
| Sierra Leonean | 75 | 0.0% |
| Sioux | 171 | 0.0% |
| Slavic | 618 | 0.0% |
| Slovak | 2,668 | 0.2% |
| Slovene | 1,621 | 0.1% |
| South African | 270 | 0.0% |
| South American | 4,618 | 0.3% |
| South American Indian | 40 | 0.0% |
| Spaniard | 1,418 | 0.1% |
| Spanish | 1,121 | 0.1% |
| Spanish American | 114 | 0.0% |
| Spanish American Indian | 1 | 0.0% |
| Sri Lankan | 3,653 | 0.2% |
| Subsaharan African | 23,996 | 1.5% |
| Sudanese | 61 | 0.0% |
| Swedish | 7,823 | 0.5% |
| Swiss | 4,553 | 0.3% |
| Syrian | 887 | 0.1% |
| Thai | 21,191 | 1.3% |
| Tlingit-Haida | 11 | 0.0% |
| Tongan | 43 | 0.0% |
| Trinidadian and Tobagonian | 266 | 0.0% |
| Turkish | 802 | 0.1% |
| Ugandan | 208 | 0.0% |
| Ukrainian | 2,399 | 0.2% |
| Uruguayan | 12 | 0.0% |
| Ute | 2 | 0.0% |
| Venezuelan | 349 | 0.0% |
| Vietnamese | 175 | 0.0% |
| Welsh | 11,026 | 0.7% |
| West Indian | 73 | 0.0% |
| Yugoslavian | 636 | 0.0% |
| Zimbabwean | 326 | 0.0% | View All 170 Rows |
Immigrants in Area Code 513
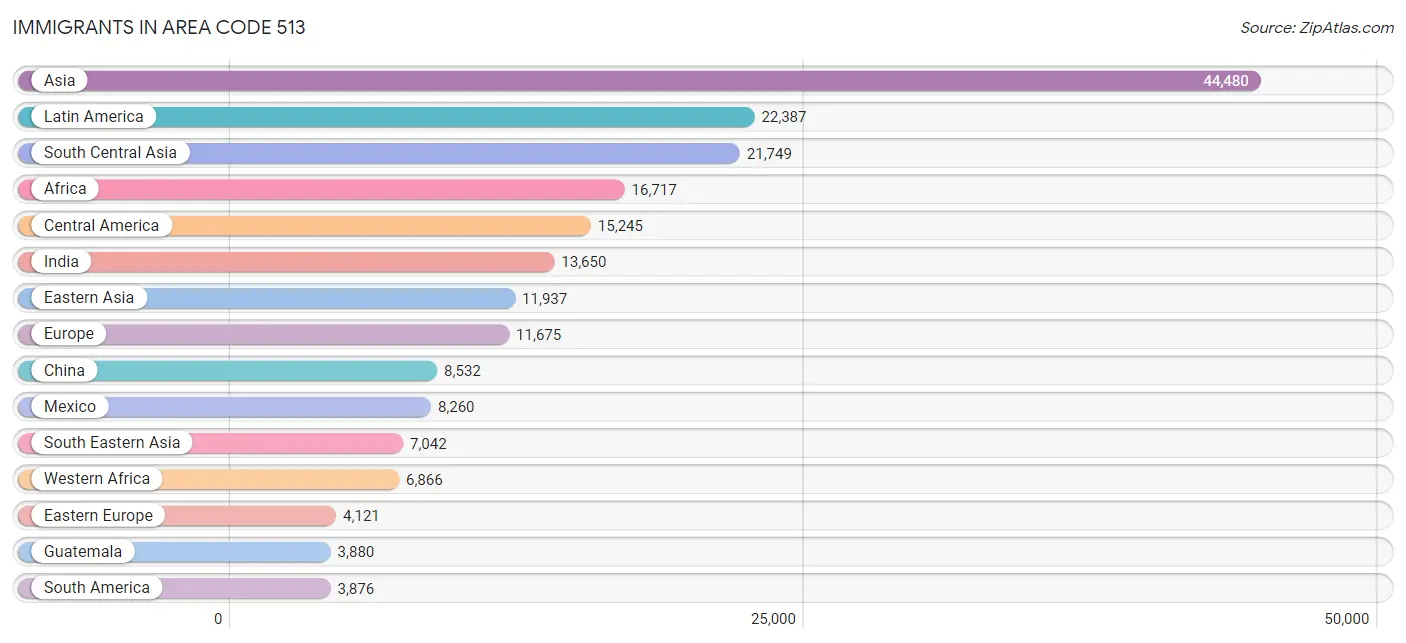
The most numerous immigrant groups reported in Area Code 513 came from Asia (44,480 | 2.8%), Latin America (22,387 | 1.4%), South Central Asia (21,749 | 1.3%), Africa (16,717 | 1.0%), and Central America (15,245 | 0.9%), together accounting for 7.5% of all Area Code 513 residents.
| Immigration Origin | # Population | % Population |
| Afghanistan | 148 | 0.0% |
| Africa | 16,717 | 1.0% |
| Albania | 36 | 0.0% |
| Argentina | 360 | 0.0% |
| Armenia | 105 | 0.0% |
| Asia | 44,480 | 2.8% |
| Australia | 236 | 0.0% |
| Austria | 238 | 0.0% |
| Bahamas | 77 | 0.0% |
| Bangladesh | 228 | 0.0% |
| Barbados | 19 | 0.0% |
| Belarus | 171 | 0.0% |
| Belgium | 232 | 0.0% |
| Belize | 9 | 0.0% |
| Bolivia | 24 | 0.0% |
| Bosnia and Herzegovina | 216 | 0.0% |
| Brazil | 737 | 0.1% |
| Bulgaria | 182 | 0.0% |
| Cambodia | 654 | 0.0% |
| Cameroon | 345 | 0.0% |
| Canada | 2,401 | 0.2% |
| Caribbean | 3,266 | 0.2% |
| Central America | 15,245 | 0.9% |
| Chile | 341 | 0.0% |
| China | 8,532 | 0.5% |
| Colombia | 825 | 0.1% |
| Congo | 518 | 0.0% |
| Costa Rica | 545 | 0.0% |
| Croatia | 90 | 0.0% |
| Cuba | 625 | 0.0% |
| Czechoslovakia | 227 | 0.0% |
| Denmark | 28 | 0.0% |
| Dominica | 34 | 0.0% |
| Dominican Republic | 1,319 | 0.1% |
| Eastern Africa | 3,755 | 0.2% |
| Eastern Asia | 11,937 | 0.7% |
| Eastern Europe | 4,121 | 0.3% |
| Ecuador | 81 | 0.0% |
| Egypt | 438 | 0.0% |
| El Salvador | 1,018 | 0.1% |
| England | 853 | 0.1% |
| Eritrea | 594 | 0.0% |
| Ethiopia | 1,527 | 0.1% |
| Europe | 11,675 | 0.7% |
| France | 996 | 0.1% |
| Germany | 1,478 | 0.1% |
| Ghana | 1,746 | 0.1% |
| Greece | 427 | 0.0% |
| Grenada | 67 | 0.0% |
| Guatemala | 3,880 | 0.2% |
| Guyana | 78 | 0.0% |
| Haiti | 92 | 0.0% |
| Honduras | 941 | 0.1% |
| Hong Kong | 368 | 0.0% |
| Hungary | 109 | 0.0% |
| India | 13,650 | 0.9% |
| Indonesia | 176 | 0.0% |
| Iran | 542 | 0.0% |
| Iraq | 119 | 0.0% |
| Ireland | 116 | 0.0% |
| Israel | 365 | 0.0% |
| Italy | 631 | 0.0% |
| Jamaica | 903 | 0.1% |
| Japan | 1,747 | 0.1% |
| Jordan | 745 | 0.1% |
| Kazakhstan | 96 | 0.0% |
| Kenya | 461 | 0.0% |
| Korea | 1,641 | 0.1% |
| Kuwait | 167 | 0.0% |
| Laos | 70 | 0.0% |
| Latin America | 22,387 | 1.4% |
| Latvia | 29 | 0.0% |
| Lebanon | 302 | 0.0% |
| Liberia | 83 | 0.0% |
| Lithuania | 113 | 0.0% |
| Malaysia | 407 | 0.0% |
| Mexico | 8,260 | 0.5% |
| Micronesia | 466 | 0.0% |
| Middle Africa | 1,039 | 0.1% |
| Moldova | 103 | 0.0% |
| Morocco | 594 | 0.0% |
| Nepal | 2,119 | 0.1% |
| Netherlands | 490 | 0.0% |
| Nicaragua | 308 | 0.0% |
| Nigeria | 1,376 | 0.1% |
| North Macedonia | 115 | 0.0% |
| Northern Africa | 1,828 | 0.1% |
| Northern Europe | 2,599 | 0.2% |
| Norway | 77 | 0.0% |
| Oceania | 769 | 0.1% |
| Pakistan | 985 | 0.1% |
| Panama | 204 | 0.0% |
| Peru | 942 | 0.1% |
| Philippines | 2,725 | 0.2% |
| Poland | 260 | 0.0% |
| Portugal | 33 | 0.0% |
| Romania | 388 | 0.0% |
| Russia | 1,123 | 0.1% |
| Saudi Arabia | 399 | 0.0% |
| Scotland | 298 | 0.0% |
| Senegal | 1,339 | 0.1% |
| Serbia | 47 | 0.0% |
| Sierra Leone | 75 | 0.0% |
| Singapore | 205 | 0.0% |
| Somalia | 18 | 0.0% |
| South Africa | 537 | 0.0% |
| South America | 3,876 | 0.2% |
| South Central Asia | 21,749 | 1.3% |
| South Eastern Asia | 7,042 | 0.4% |
| Southern Europe | 1,395 | 0.1% |
| Spain | 304 | 0.0% |
| Sri Lanka | 488 | 0.0% |
| Sudan | 160 | 0.0% |
| Sweden | 79 | 0.0% |
| Switzerland | 126 | 0.0% |
| Syria | 209 | 0.0% |
| Taiwan | 791 | 0.1% |
| Thailand | 208 | 0.0% |
| Trinidad and Tobago | 110 | 0.0% |
| Turkey | 362 | 0.0% |
| Uganda | 180 | 0.0% |
| Ukraine | 665 | 0.0% |
| Uruguay | 65 | 0.0% |
| Uzbekistan | 973 | 0.1% |
| Venezuela | 359 | 0.0% |
| Vietnam | 2,541 | 0.2% |
| Western Africa | 6,866 | 0.4% |
| Western Asia | 3,012 | 0.2% |
| Western Europe | 3,560 | 0.2% |
| Zaire | 95 | 0.0% |
| Zimbabwe | 419 | 0.0% | View All 131 Rows |
Sex and Age in Area Code 513
Sex and Age in Area Code 513
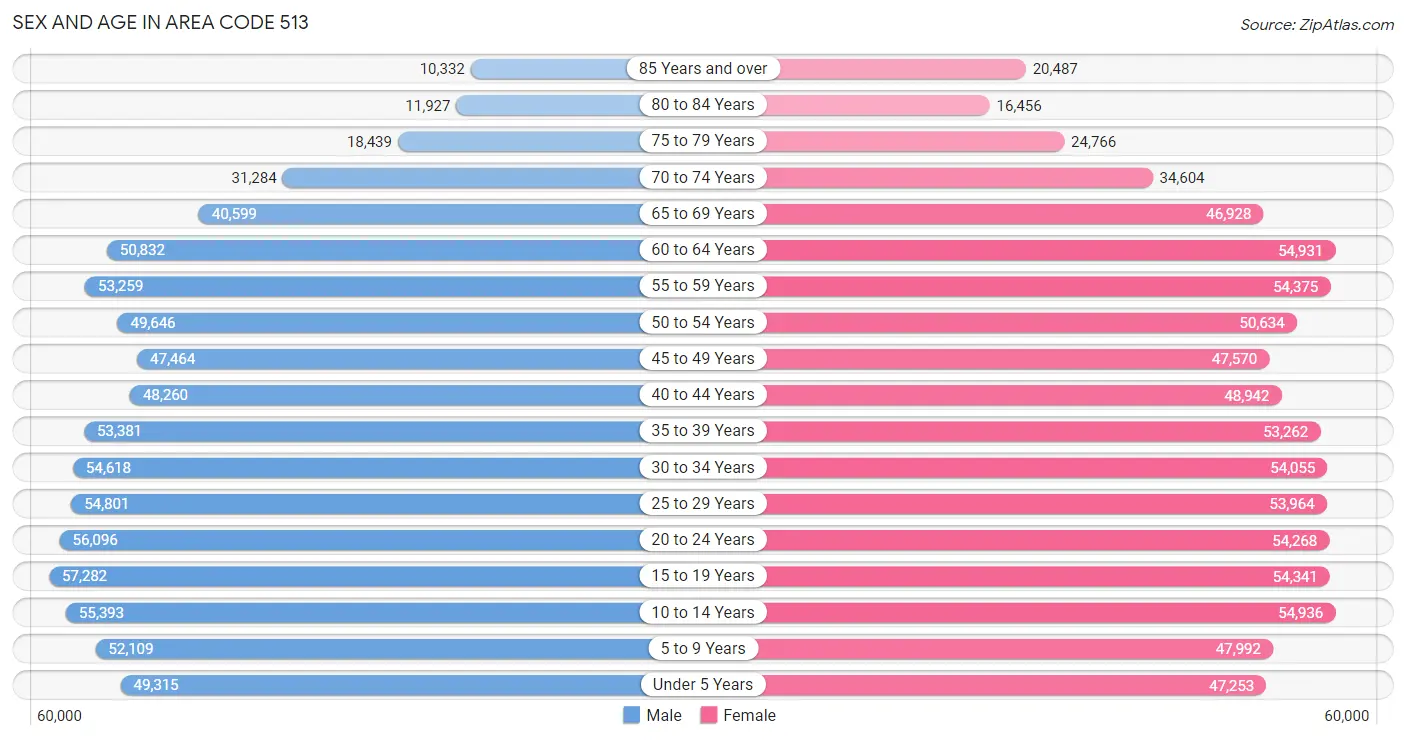
The most populous age groups in Area Code 513 are 15 to 19 Years (57,282 | 7.2%) for men and 10 to 14 Years (54,936 | 6.7%) for women.
| Age Bracket | Male | Female |
| Under 5 Years | 49,315 (6.2%) | 47,253 (5.8%) |
| 5 to 9 Years | 52,109 (6.6%) | 47,992 (5.9%) |
| 10 to 14 Years | 55,393 (7.0%) | 54,936 (6.7%) |
| 15 to 19 Years | 57,282 (7.2%) | 54,341 (6.6%) |
| 20 to 24 Years | 56,096 (7.1%) | 54,268 (6.6%) |
| 25 to 29 Years | 54,801 (6.9%) | 53,964 (6.6%) |
| 30 to 34 Years | 54,618 (6.9%) | 54,055 (6.6%) |
| 35 to 39 Years | 53,381 (6.7%) | 53,262 (6.5%) |
| 40 to 44 Years | 48,260 (6.1%) | 48,942 (6.0%) |
| 45 to 49 Years | 47,464 (6.0%) | 47,570 (5.8%) |
| 50 to 54 Years | 49,646 (6.2%) | 50,634 (6.2%) |
| 55 to 59 Years | 53,259 (6.7%) | 54,375 (6.6%) |
| 60 to 64 Years | 50,832 (6.4%) | 54,931 (6.7%) |
| 65 to 69 Years | 40,599 (5.1%) | 46,928 (5.7%) |
| 70 to 74 Years | 31,284 (3.9%) | 34,604 (4.2%) |
| 75 to 79 Years | 18,439 (2.3%) | 24,766 (3.0%) |
| 80 to 84 Years | 11,927 (1.5%) | 16,456 (2.0%) |
| 85 Years and over | 10,332 (1.3%) | 20,487 (2.5%) |
| Total | 795,037 (100.0%) | 819,764 (100.0%) |
Families and Households in Area Code 513
Median Family Size in Area Code 513
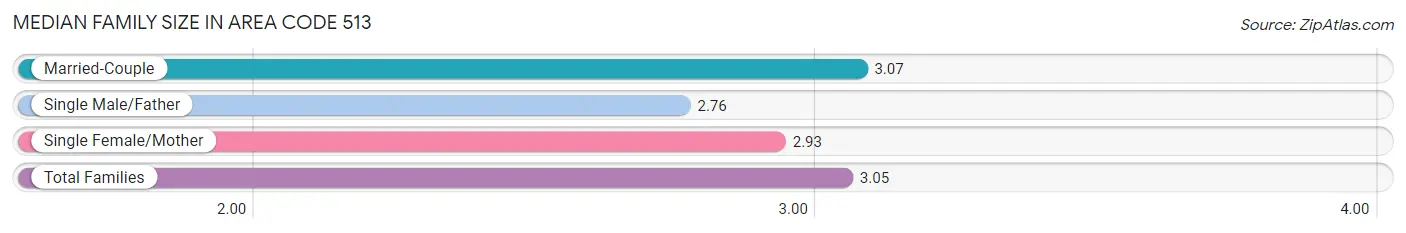
The median family size in Area Code 513 is 3.05 persons per family, with married-couple families (295,041 | 73.3%) accounting for the largest median family size of 3.07359 persons per family. On the other hand, single male/father families (29,166 | 7.2%) represent the smallest median family size with 2.76 persons per family.
| Family Type | # Families | Family Size |
| Married-Couple | 295,041 (73.3%) | 3.07 |
| Single Male/Father | 29,166 (7.2%) | 2.76 |
| Single Female/Mother | 78,440 (19.5%) | 2.93 |
| Total Families | 402,647 (100.0%) | 3.05 |
Median Household Size in Area Code 513
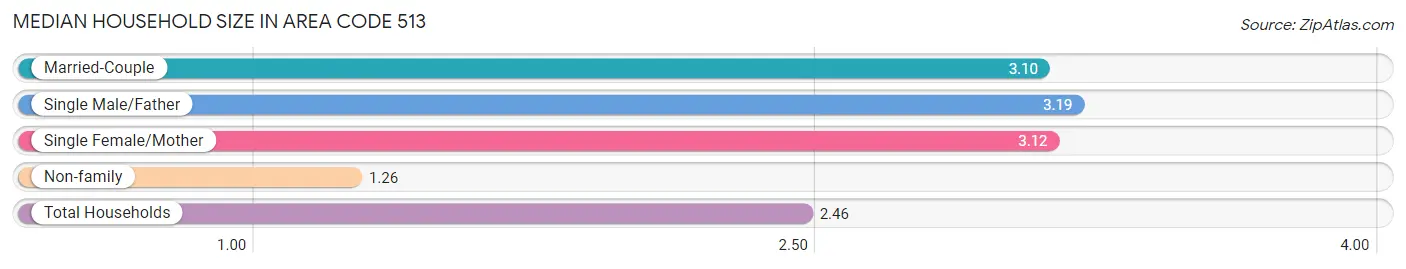
The median household size in Area Code 513 is 2.46 persons per household, with single male/father households (29,166 | 4.5%) accounting for the largest median household size of 3.19 persons per household. non-family households (241,878 | 37.5%) represent the smallest median household size with 1.26 persons per household.
| Household Type | # Households | Household Size |
| Married-Couple | 295,041 (45.8%) | 3.10 |
| Single Male/Father | 29,166 (4.5%) | 3.19 |
| Single Female/Mother | 78,440 (12.2%) | 3.12 |
| Non-family | 241,878 (37.5%) | 1.26 |
| Total Households | 644,525 (100.0%) | 2.46 |
Household Size by Marriage Status in Area Code 513
Out of a total of 644,525 households in Area Code 513, 402,647 (62.5%) are family households, while 241,878 (37.5%) are nonfamily households. The most numerous type of family households are 2-person households, comprising 181,297, and the most common type of nonfamily households are 1-person households, comprising 196,944.
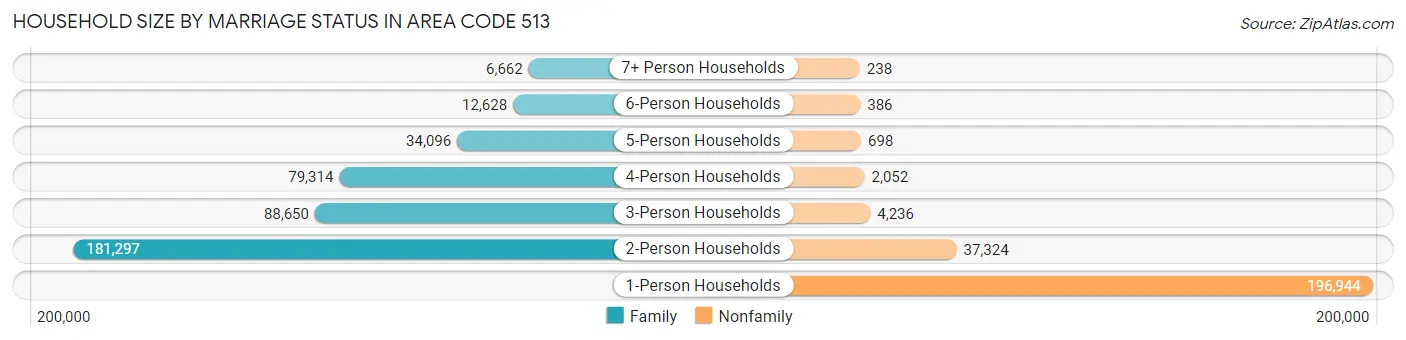
| Household Size | Family Households | Nonfamily Households |
| 1-Person Households | - | 196,944 (30.6%) |
| 2-Person Households | 181,297 (28.1%) | 37,324 (5.8%) |
| 3-Person Households | 88,650 (13.8%) | 4,236 (0.7%) |
| 4-Person Households | 79,314 (12.3%) | 2,052 (0.3%) |
| 5-Person Households | 34,096 (5.3%) | 698 (0.1%) |
| 6-Person Households | 12,628 (2.0%) | 386 (0.1%) |
| 7+ Person Households | 6,662 (1.0%) | 238 (0.0%) |
| Total | 402,647 (62.5%) | 241,878 (37.5%) |
Female Fertility in Area Code 513
Fertility by Age in Area Code 513
Average fertility rate in Area Code 513 is 64.1 births per 1,000 women. Women in the age bracket of 20 to 34 years have the highest fertility rate with 112.4 births per 1,000 women. Women in the age bracket of 20 to 34 years acount for 75.5% of all women with births.
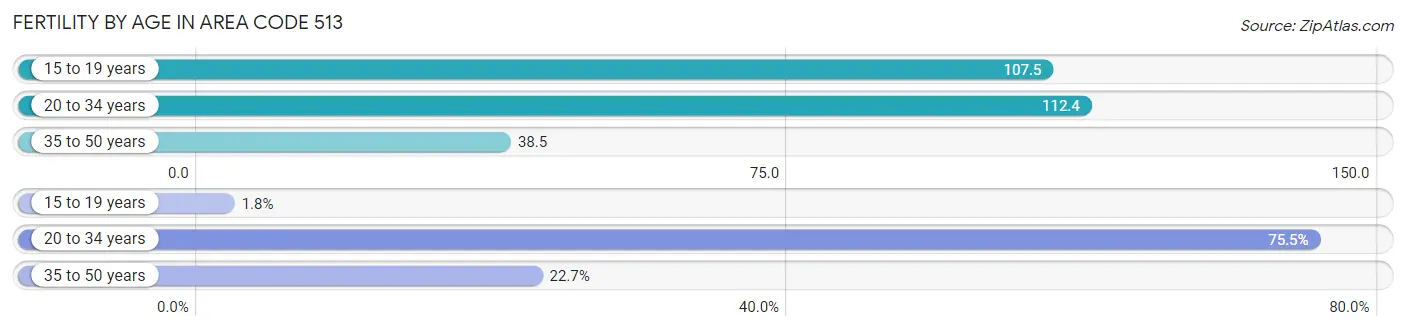
| Age Bracket | Women with Births | Births / 1,000 Women |
| 15 to 19 years | 367 (1.8%) | 107.5 |
| 20 to 34 years | 15,288 (75.5%) | 112.4 |
| 35 to 50 years | 4,596 (22.7%) | 38.5 |
| Total | 20,251 (100.0%) | 64.1 |
Fertility by Age by Marriage Status in Area Code 513
57.3% of women with births (20,251) in Area Code 513 are married. The highest percentage of unmarried women with births falls into 15 to 19 years age bracket with 100.0% of them unmarried at the time of birth, while the lowest percentage of unmarried women with births belong to 35 to 50 years age bracket with 45.0% of them unmarried.
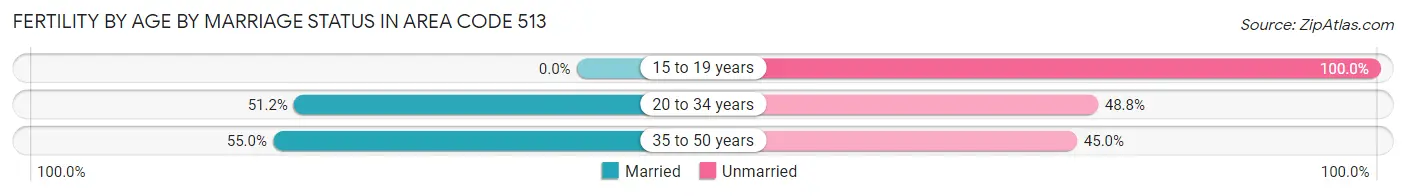
| Age Bracket | Married | Unmarried |
| 15 to 19 years | 0 (0.0%) | 367 (100.0%) |
| 20 to 34 years | 7,834 (51.2%) | 7,454 (48.8%) |
| 35 to 50 years | 2,529 (55.0%) | 2,067 (45.0%) |
| Total | 11,611 (57.3%) | 8,640 (42.7%) |
Fertility by Education in Area Code 513
Average fertility rate in Area Code 513 is 64.1 births per 1,000 women. Women with the education attainment of graduate degree have the highest fertility rate of 98.2 births per 1,000 women, while women with the education attainment of college or associate's degree have the lowest fertility at 63.9 births per 1,000 women. Women with the education attainment of high school diploma represent 26.5% of all women with births.
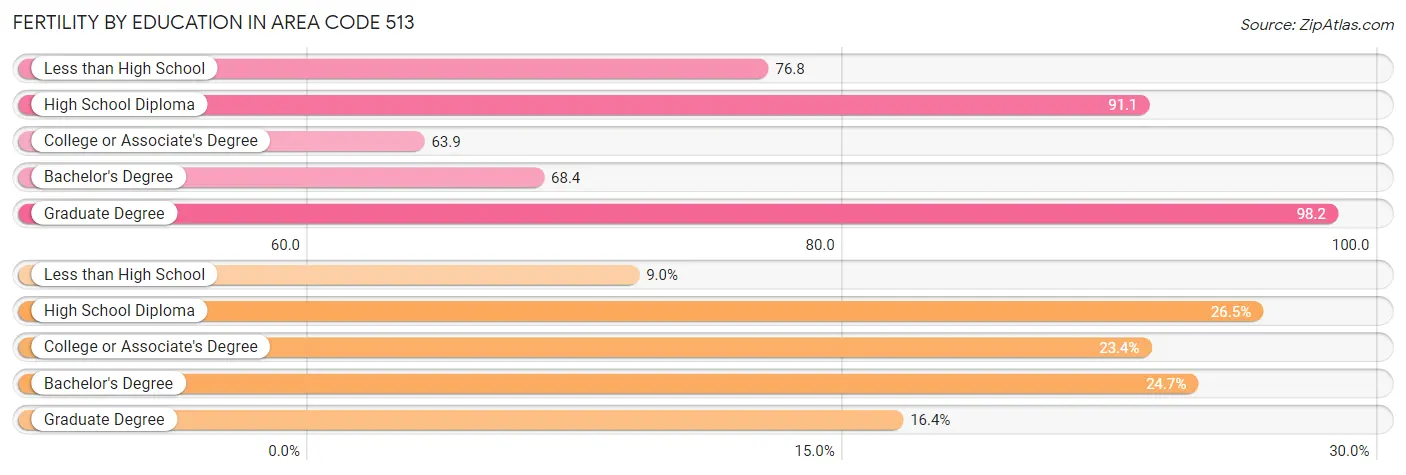
| Educational Attainment | Women with Births | Births / 1,000 Women |
| Less than High School | 1,821 (9.0%) | 76.8 |
| High School Diploma | 5,371 (26.5%) | 91.1 |
| College or Associate's Degree | 4,734 (23.4%) | 63.9 |
| Bachelor's Degree | 5,002 (24.7%) | 68.4 |
| Graduate Degree | 3,323 (16.4%) | 98.2 |
| Total | 20,251 (100.0%) | 64.1 |
Fertility by Education by Marriage Status in Area Code 513
42.7% of women with births in Area Code 513 are unmarried. Women with the educational attainment of graduate degree are most likely to be married with 61.0% of them married at childbirth, while women with the educational attainment of less than high school are least likely to be married with 88.2% of them unmarried at childbirth.
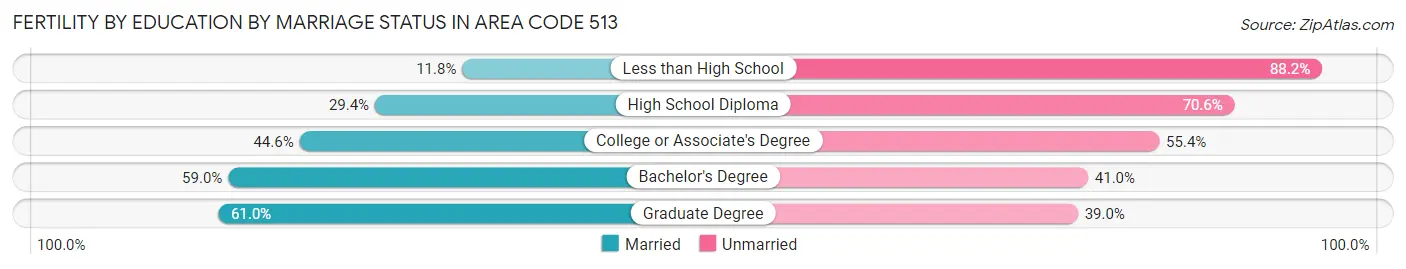
| Educational Attainment | Married | Unmarried |
| Less than High School | 215 (11.8%) | 1,606 (88.2%) |
| High School Diploma | 1,579 (29.4%) | 3,792 (70.6%) |
| College or Associate's Degree | 2,112 (44.6%) | 2,622 (55.4%) |
| Bachelor's Degree | 2,950 (59.0%) | 2,052 (41.0%) |
| Graduate Degree | 2,028 (61.0%) | 1,295 (39.0%) |
| Total | 11,611 (57.3%) | 8,640 (42.7%) |
Employment Characteristics in Area Code 513
Employment by Class of Employer in Area Code 513
Among the 787,688 employed individuals in Area Code 513, private company employees (560,682 | 71.2%), not-for-profit organizations (79,738 | 10.1%), and local government employees (51,100 | 6.5%) make up the most common classes of employment.
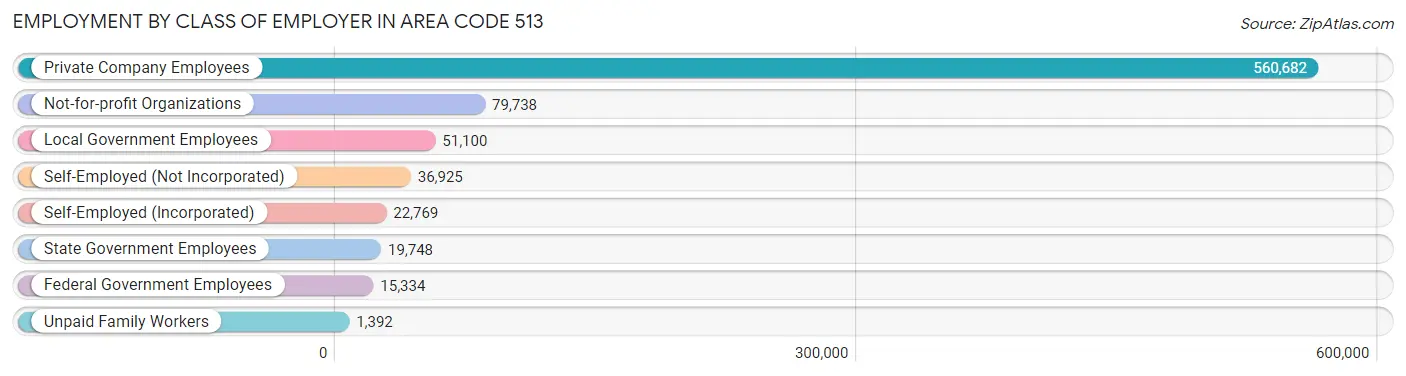
| Employer Class | # Employees | % Employees |
| Private Company Employees | 560,682 | 71.2% |
| Self-Employed (Incorporated) | 22,769 | 2.9% |
| Self-Employed (Not Incorporated) | 36,925 | 4.7% |
| Not-for-profit Organizations | 79,738 | 10.1% |
| Local Government Employees | 51,100 | 6.5% |
| State Government Employees | 19,748 | 2.5% |
| Federal Government Employees | 15,334 | 1.9% |
| Unpaid Family Workers | 1,392 | 0.2% |
| Total | 787,688 | 100.0% |
Employment Status by Age in Area Code 513
According to the labor force statistics for Area Code 513, out of the total population over 16 years of age (1,285,805), 64.2% or 825,358 individuals are in the labor force, with 5.8% or 47,541 of them unemployed. The age group with the highest labor force participation rate is 25 to 29 years, with 86.0% or 93,516 individuals in the labor force. Within the labor force, the 16 to 19 years age range has the highest percentage of unemployed individuals, with 948.4% or 386,663 of them being unemployed.
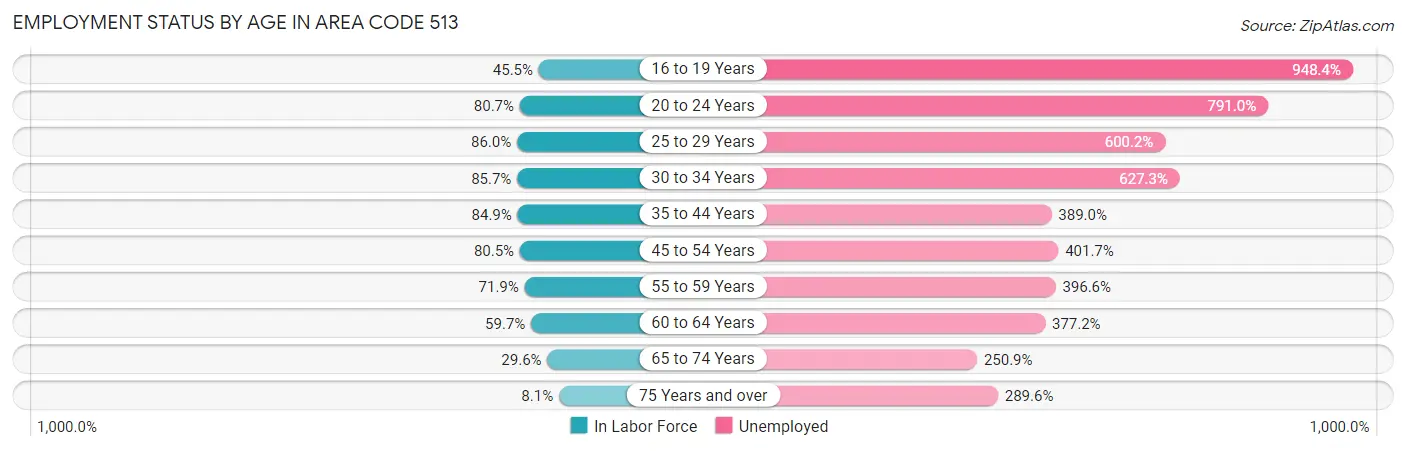
| Age Bracket | In Labor Force | Unemployed |
| 16 to 19 Years | 40,771 (45.5%) | 386,663 (948.4%) |
| 20 to 24 Years | 89,031 (80.7%) | 704,235 (791.0%) |
| 25 to 29 Years | 93,520 (86.0%) | 561,283 (600.2%) |
| 30 to 34 Years | 93,127 (85.7%) | 584,154 (627.3%) |
| 35 to 44 Years | 173,111 (84.9%) | 673,378 (389.0%) |
| 45 to 54 Years | 157,314 (80.5%) | 631,898 (401.7%) |
| 55 to 59 Years | 77,409 (71.9%) | 307,008 (396.6%) |
| 60 to 64 Years | 63,163 (59.7%) | 238,247 (377.2%) |
| 65 to 74 Years | 45,369 (29.6%) | 113,821 (250.9%) |
| 75 Years and over | 8,263 (8.1%) | 23,933 (289.6%) |
| Total | 825,358 (64.2%) | 47,550 (5.8%) |
Employment Status by Educational Attainment in Area Code 513
According to labor force statistics for Area Code 513, 78.9% of individuals (654,948) out of the total population between 25 and 64 years of age (829,994) are in the labor force, with 439.7% or 2,879,806 of them being unemployed. The group with the highest labor force participation rate are those with the educational attainment of bachelor's degree or higher, with 88.2% or 292,740 individuals in the labor force. Within the labor force, individuals with less than high school education have the highest percentage of unemployment, with 1,047.7% or 340,199 of them being unemployed.
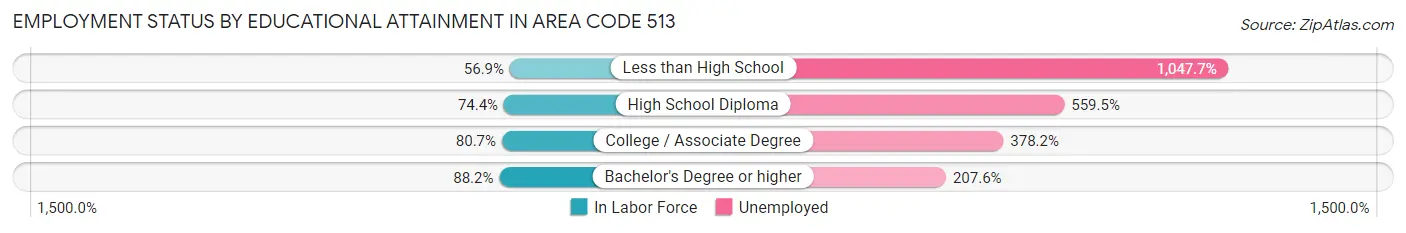
| Educational Attainment | In Labor Force | Unemployed |
| Less than High School | 32,473 (56.9%) | 597,880 (1,047.7%) |
| High School Diploma | 163,137 (74.4%) | 1,226,161 (559.5%) |
| College / Associate Degree | 178,971 (80.7%) | 838,829 (378.2%) |
| Bachelor's Degree or higher | 292,746 (88.2%) | 689,190 (207.6%) |
| Total | 654,985 (78.9%) | 3,649,484 (439.7%) |
Employment Occupations by Sex in Area Code 513
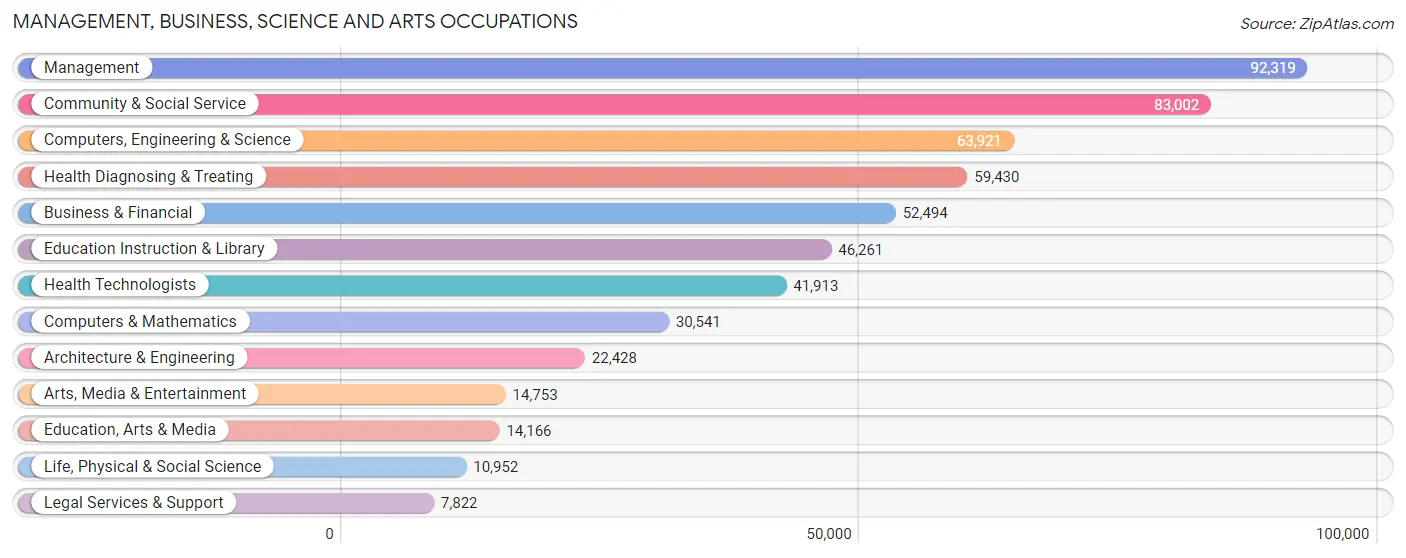
Management, Business, Science and Arts Occupations
The most common Management, Business, Science and Arts occupations in Area Code 513 are Management (92,319 | 11.5%), Community & Social Service (83,002 | 10.3%), Computers, Engineering & Science (63,921 | 8.0%), Health Diagnosing & Treating (59,430 | 7.4%), and Business & Financial (52,494 | 6.5%).
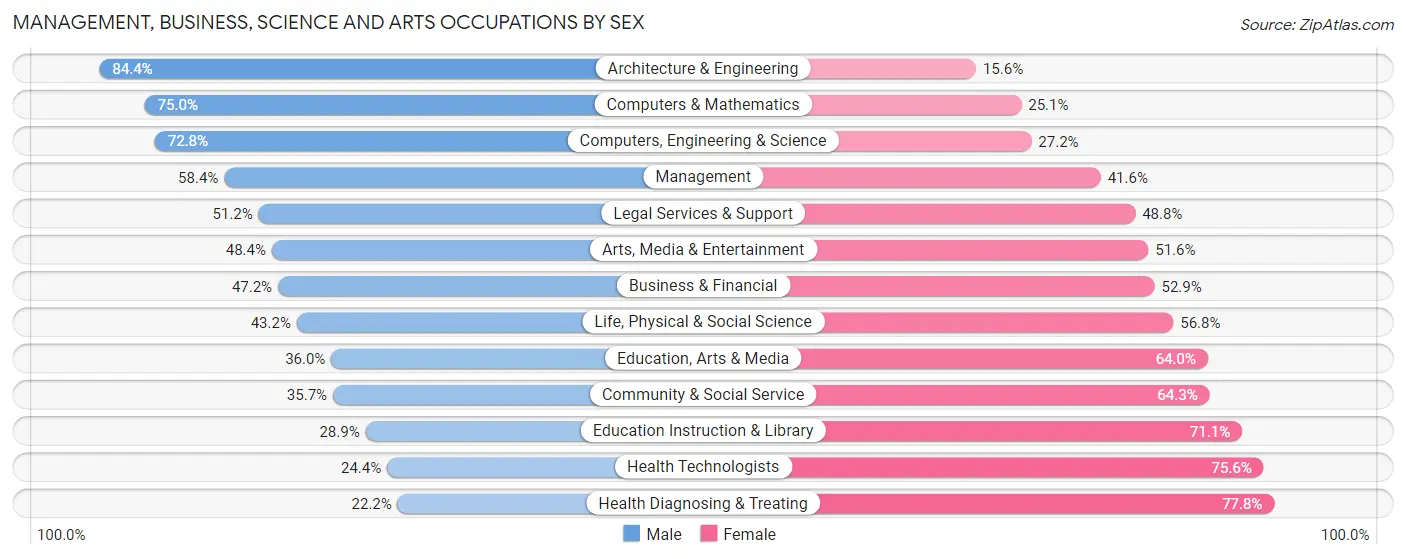
Management, Business, Science and Arts Occupations by Sex
Within the Management, Business, Science and Arts occupations in Area Code 513, the most male-oriented occupations are Architecture & Engineering (84.4%), Computers & Mathematics (75.0%), and Computers, Engineering & Science (72.8%), while the most female-oriented occupations are Health Diagnosing & Treating (77.8%), Health Technologists (75.6%), and Education Instruction & Library (71.1%).
| Occupation | Male | Female |
| Management | 53,885 (58.4%) | 38,434 (41.6%) |
| Business & Financial | 24,751 (47.1%) | 27,743 (52.8%) |
| Computers, Engineering & Science | 46,552 (72.8%) | 17,369 (27.2%) |
| Computers & Mathematics | 22,890 (75.0%) | 7,651 (25.1%) |
| Architecture & Engineering | 18,927 (84.4%) | 3,501 (15.6%) |
| Life, Physical & Social Science | 4,735 (43.2%) | 6,217 (56.8%) |
| Community & Social Service | 29,622 (35.7%) | 53,380 (64.3%) |
| Education, Arts & Media | 5,105 (36.0%) | 9,061 (64.0%) |
| Legal Services & Support | 4,003 (51.2%) | 3,819 (48.8%) |
| Education Instruction & Library | 13,367 (28.9%) | 32,894 (71.1%) |
| Arts, Media & Entertainment | 7,147 (48.4%) | 7,606 (51.6%) |
| Health Diagnosing & Treating | 13,187 (22.2%) | 46,243 (77.8%) |
| Health Technologists | 10,223 (24.4%) | 31,690 (75.6%) |
| Total (Category) | 167,997 (47.8%) | 183,169 (52.2%) |
| Total (Overall) | 415,877 (51.8%) | 386,274 (48.1%) |
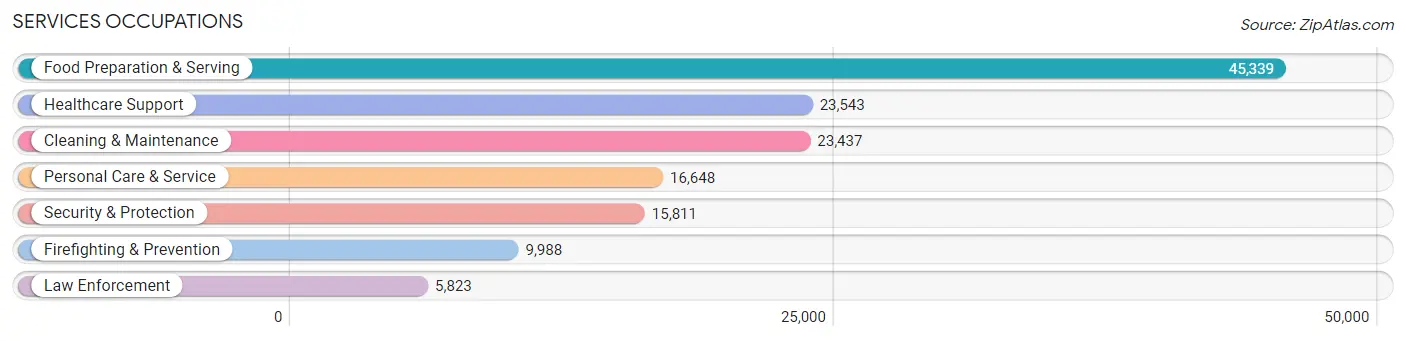
Services Occupations
The most common Services occupations in Area Code 513 are Food Preparation & Serving (45,339 | 5.7%), Healthcare Support (23,543 | 2.9%), Cleaning & Maintenance (23,437 | 2.9%), Personal Care & Service (16,648 | 2.1%), and Security & Protection (15,811 | 2.0%).
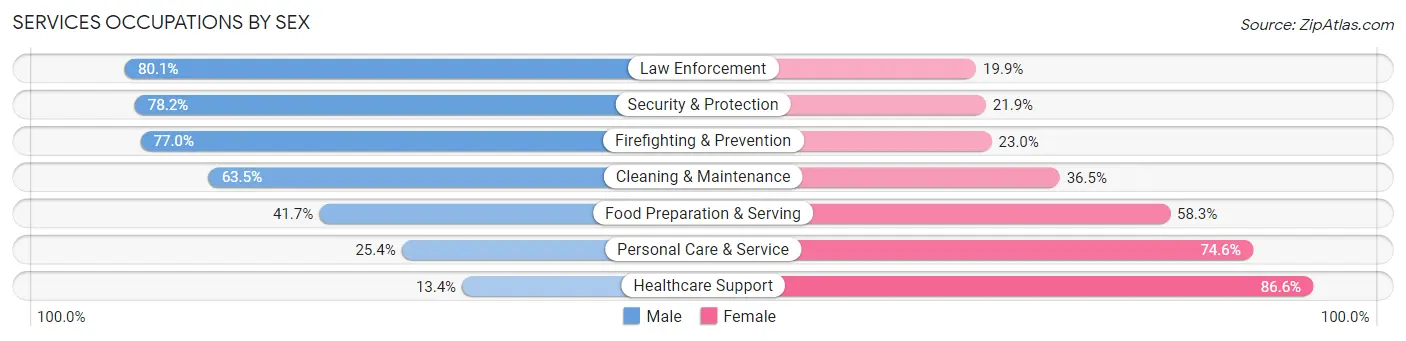
Services Occupations by Sex
Within the Services occupations in Area Code 513, the most male-oriented occupations are Law Enforcement (80.1%), Security & Protection (78.1%), and Firefighting & Prevention (77.0%), while the most female-oriented occupations are Healthcare Support (86.6%), Personal Care & Service (74.6%), and Food Preparation & Serving (58.3%).
| Occupation | Male | Female |
| Healthcare Support | 3,154 (13.4%) | 20,389 (86.6%) |
| Security & Protection | 12,356 (78.1%) | 3,455 (21.8%) |
| Firefighting & Prevention | 7,693 (77.0%) | 2,295 (23.0%) |
| Law Enforcement | 4,663 (80.1%) | 1,160 (19.9%) |
| Food Preparation & Serving | 18,903 (41.7%) | 26,436 (58.3%) |
| Cleaning & Maintenance | 14,889 (63.5%) | 8,548 (36.5%) |
| Personal Care & Service | 4,223 (25.4%) | 12,425 (74.6%) |
| Total (Category) | 53,525 (42.9%) | 71,253 (57.1%) |
| Total (Overall) | 415,877 (51.8%) | 386,274 (48.1%) |
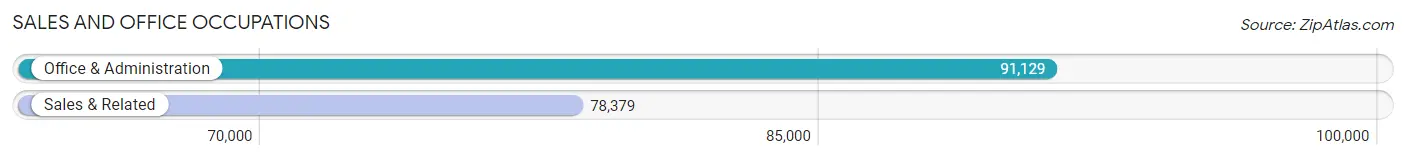
Sales and Office Occupations
The most common Sales and Office occupations in Area Code 513 are Office & Administration (91,129 | 11.4%), and Sales & Related (78,379 | 9.8%).
Sales and Office Occupations by Sex
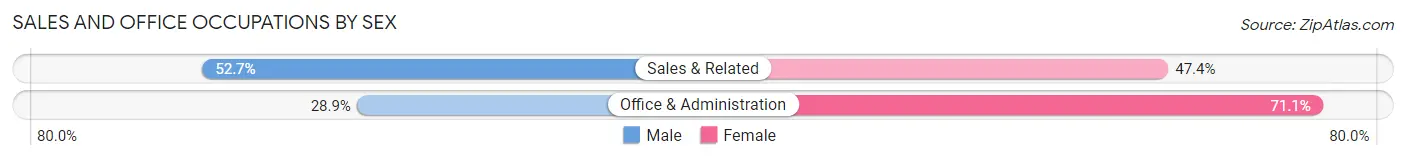
| Occupation | Male | Female |
| Sales & Related | 41,265 (52.6%) | 37,114 (47.3%) |
| Office & Administration | 26,345 (28.9%) | 64,784 (71.1%) |
| Total (Category) | 67,610 (39.9%) | 101,898 (60.1%) |
| Total (Overall) | 415,877 (51.8%) | 386,274 (48.1%) |
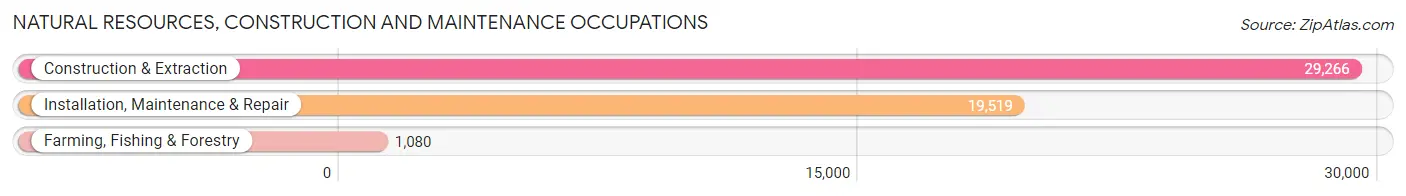
Natural Resources, Construction and Maintenance Occupations
The most common Natural Resources, Construction and Maintenance occupations in Area Code 513 are Construction & Extraction (29,266 | 3.6%), Installation, Maintenance & Repair (19,519 | 2.4%), and Farming, Fishing & Forestry (1,080 | 0.1%).
Natural Resources, Construction and Maintenance Occupations by Sex
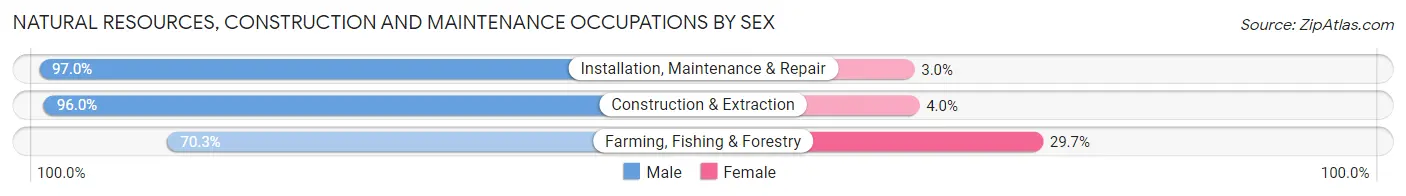
| Occupation | Male | Female |
| Farming, Fishing & Forestry | 759 (70.3%) | 321 (29.7%) |
| Construction & Extraction | 28,090 (96.0%) | 1,176 (4.0%) |
| Installation, Maintenance & Repair | 18,936 (97.0%) | 583 (3.0%) |
| Total (Category) | 47,785 (95.8%) | 2,080 (4.2%) |
| Total (Overall) | 415,877 (51.8%) | 386,274 (48.1%) |
Production, Transportation and Moving Occupations
The most common Production, Transportation and Moving occupations in Area Code 513 are Production (47,625 | 5.9%), Material Moving (33,628 | 4.2%), and Transportation (25,581 | 3.2%).
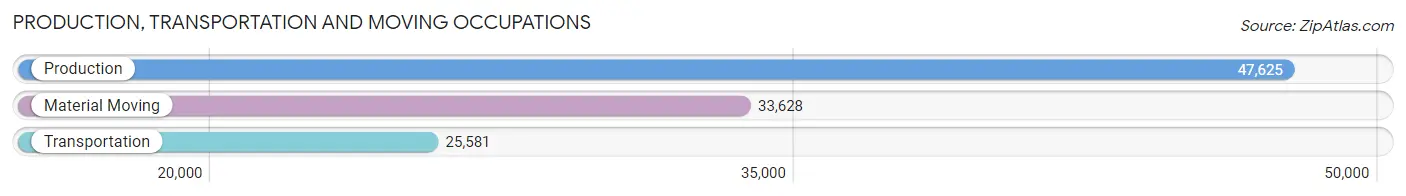
Production, Transportation and Moving Occupations by Sex
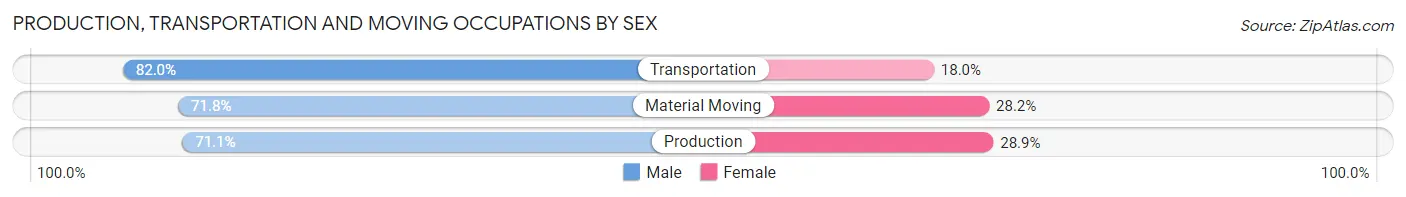
| Occupation | Male | Female |
| Production | 33,841 (71.1%) | 13,784 (28.9%) |
| Transportation | 20,966 (82.0%) | 4,615 (18.0%) |
| Material Moving | 24,153 (71.8%) | 9,475 (28.2%) |
| Total (Category) | 78,960 (73.9%) | 27,874 (26.1%) |
| Total (Overall) | 415,877 (51.8%) | 386,274 (48.1%) |
Employment Industries by Sex in Area Code 513
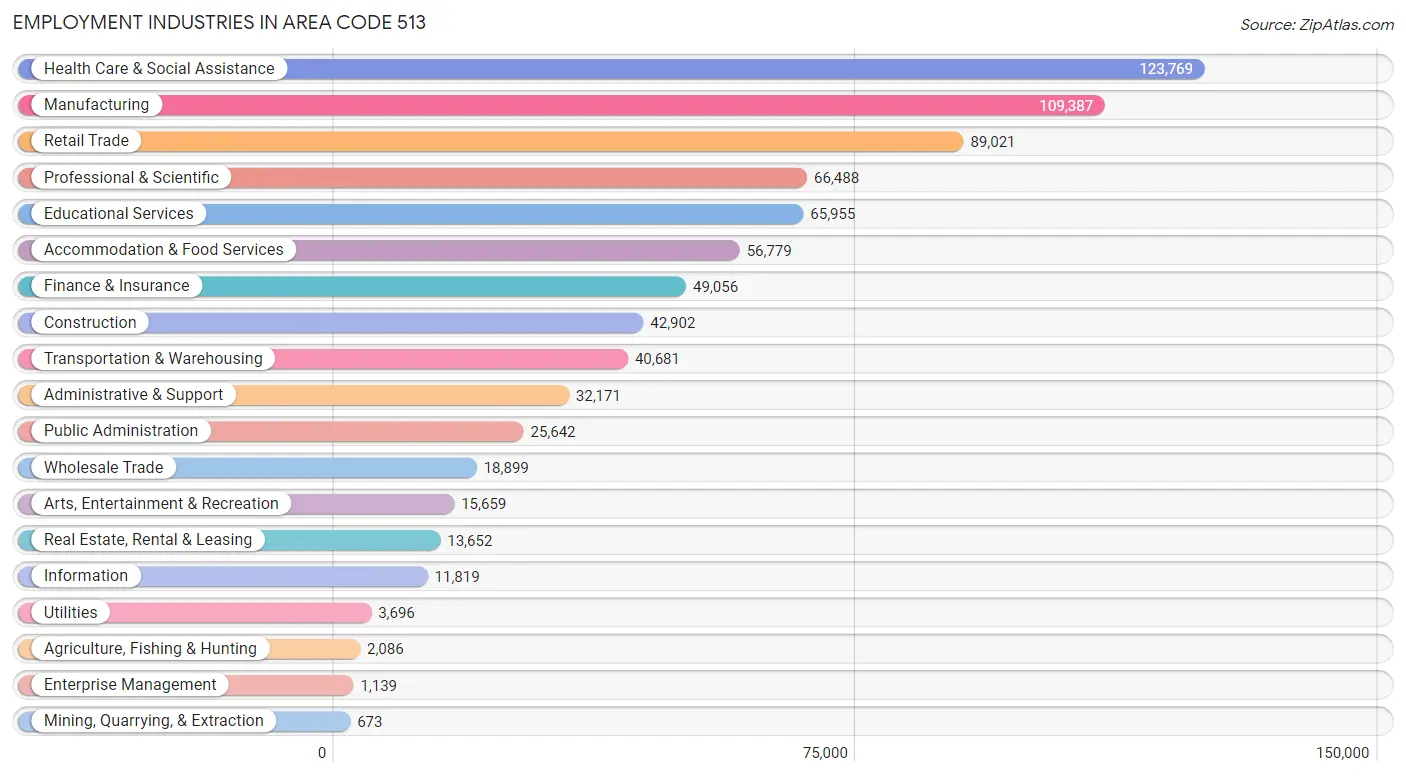
Employment Industries in Area Code 513
The major employment industries in Area Code 513 include Health Care & Social Assistance (123,769 | 15.4%), Manufacturing (109,387 | 13.6%), Retail Trade (89,021 | 11.1%), Professional & Scientific (66,488 | 8.3%), and Educational Services (65,955 | 8.2%).
Employment Industries by Sex in Area Code 513
The Area Code 513 industries that see more men than women are Construction (89.5%), Mining, Quarrying, & Extraction (84.0%), and Utilities (83.2%), whereas the industries that tend to have a higher number of women are Health Care & Social Assistance (78.3%), Educational Services (68.2%), and Accommodation & Food Services (55.5%).
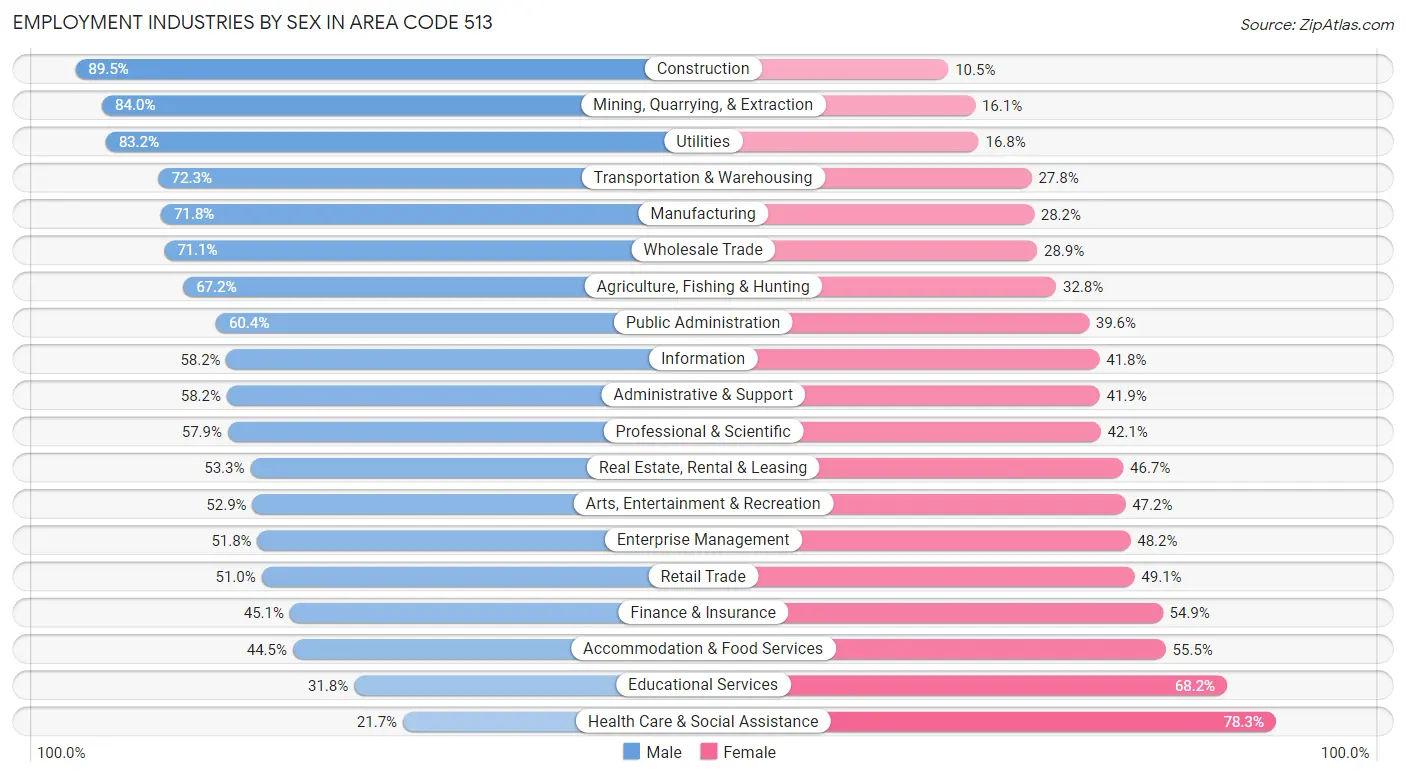
| Industry | Male | Female |
| Agriculture, Fishing & Hunting | 1,401 (67.2%) | 685 (32.8%) |
| Mining, Quarrying, & Extraction | 565 (84.0%) | 108 (16.1%) |
| Construction | 38,389 (89.5%) | 4,513 (10.5%) |
| Manufacturing | 78,502 (71.8%) | 30,885 (28.2%) |
| Wholesale Trade | 13,438 (71.1%) | 5,461 (28.9%) |
| Retail Trade | 45,357 (50.9%) | 43,664 (49.0%) |
| Transportation & Warehousing | 29,392 (72.3%) | 11,289 (27.8%) |
| Utilities | 3,075 (83.2%) | 621 (16.8%) |
| Information | 6,881 (58.2%) | 4,938 (41.8%) |
| Finance & Insurance | 22,131 (45.1%) | 26,925 (54.9%) |
| Real Estate, Rental & Leasing | 7,275 (53.3%) | 6,377 (46.7%) |
| Professional & Scientific | 38,525 (57.9%) | 27,963 (42.1%) |
| Enterprise Management | 590 (51.8%) | 549 (48.2%) |
| Administrative & Support | 18,707 (58.2%) | 13,464 (41.8%) |
| Educational Services | 20,974 (31.8%) | 44,981 (68.2%) |
| Health Care & Social Assistance | 26,852 (21.7%) | 96,917 (78.3%) |
| Arts, Entertainment & Recreation | 8,275 (52.8%) | 7,384 (47.1%) |
| Accommodation & Food Services | 25,255 (44.5%) | 31,524 (55.5%) |
| Public Administration | 15,483 (60.4%) | 10,159 (39.6%) |
| Total | 415,877 (51.8%) | 386,274 (48.1%) |
Education in Area Code 513
School Enrollment in Area Code 513
The most common levels of schooling among the 405,106 students in Area Code 513 are high school (86,824 | 21.4%), middle school (85,900 | 21.2%), and college / undergraduate (84,869 | 20.9%).
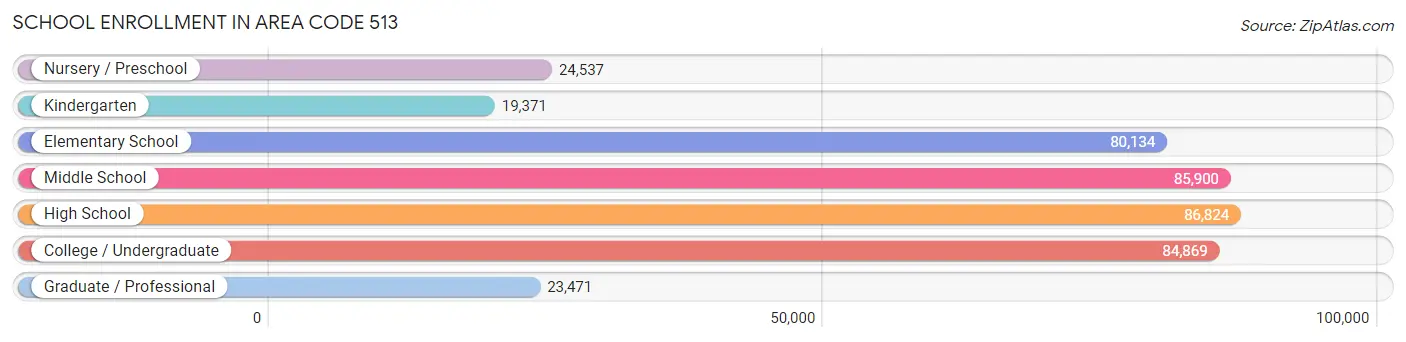
| School Level | # Students | % Students |
| Nursery / Preschool | 24,537 | 6.1% |
| Kindergarten | 19,371 | 4.8% |
| Elementary School | 80,134 | 19.8% |
| Middle School | 85,900 | 21.2% |
| High School | 86,824 | 21.4% |
| College / Undergraduate | 84,869 | 20.9% |
| Graduate / Professional | 23,471 | 5.8% |
| Total | 405,106 | 100.0% |
School Enrollment by Age by Funding Source in Area Code 513
Out of a total of 405,106 students who are enrolled in schools in Area Code 513, 82,200 (20.3%) attend a private institution, while the remaining 322,906 (79.7%) are enrolled in public schools. The age group of 3 to 4 year olds has the highest likelihood of being enrolled in private schools, with 9,137 (47.5% in the age bracket) enrolled. Conversely, the age group of 18 to 19 year olds has the lowest likelihood of being enrolled in a private school, with 29,627 (84.5% in the age bracket) attending a public institution.
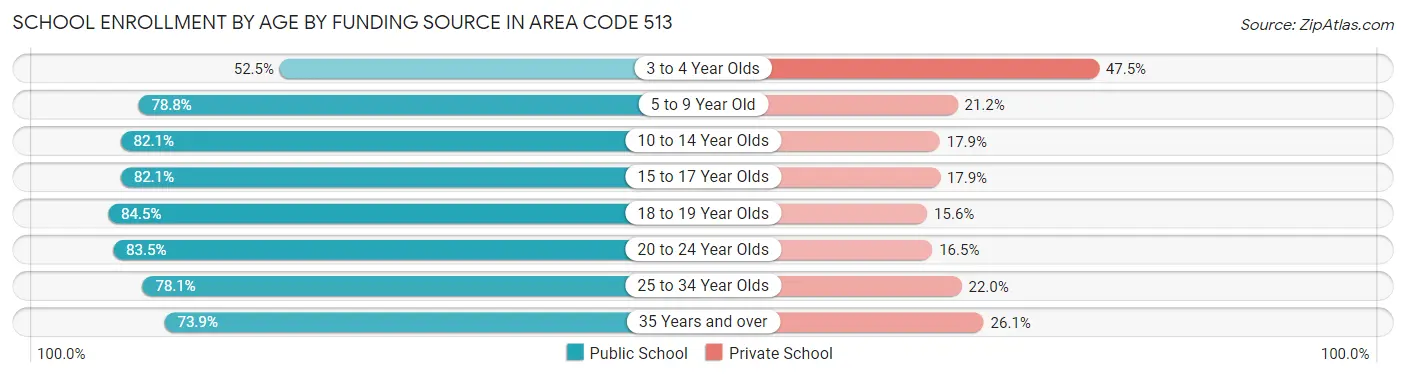
| Age Bracket | Public School | Private School |
| 3 to 4 Year Olds | 10,083 (52.5%) | 9,137 (47.5%) |
| 5 to 9 Year Old | 73,749 (78.8%) | 19,855 (21.2%) |
| 10 to 14 Year Olds | 87,815 (82.1%) | 19,144 (17.9%) |
| 15 to 17 Year Olds | 51,379 (82.1%) | 11,225 (17.9%) |
| 18 to 19 Year Olds | 29,627 (84.5%) | 5,457 (15.5%) |
| 20 to 24 Year Olds | 39,840 (83.5%) | 7,873 (16.5%) |
| 25 to 34 Year Olds | 16,997 (78.0%) | 4,779 (22.0%) |
| 35 Years and over | 13,415 (73.9%) | 4,731 (26.1%) |
| Total | 322,906 (79.7%) | 82,200 (20.3%) |
Educational Attainment by Field of Study in Area Code 513
Business (91,096 | 20.6%), education (50,236 | 11.4%), science & technology (48,972 | 11.1%), engineering (40,563 | 9.2%), and bio, nature & agricultural (26,809 | 6.1%) are the most common fields of study among 441,581 individuals in Area Code 513 who have obtained a bachelor's degree or higher.
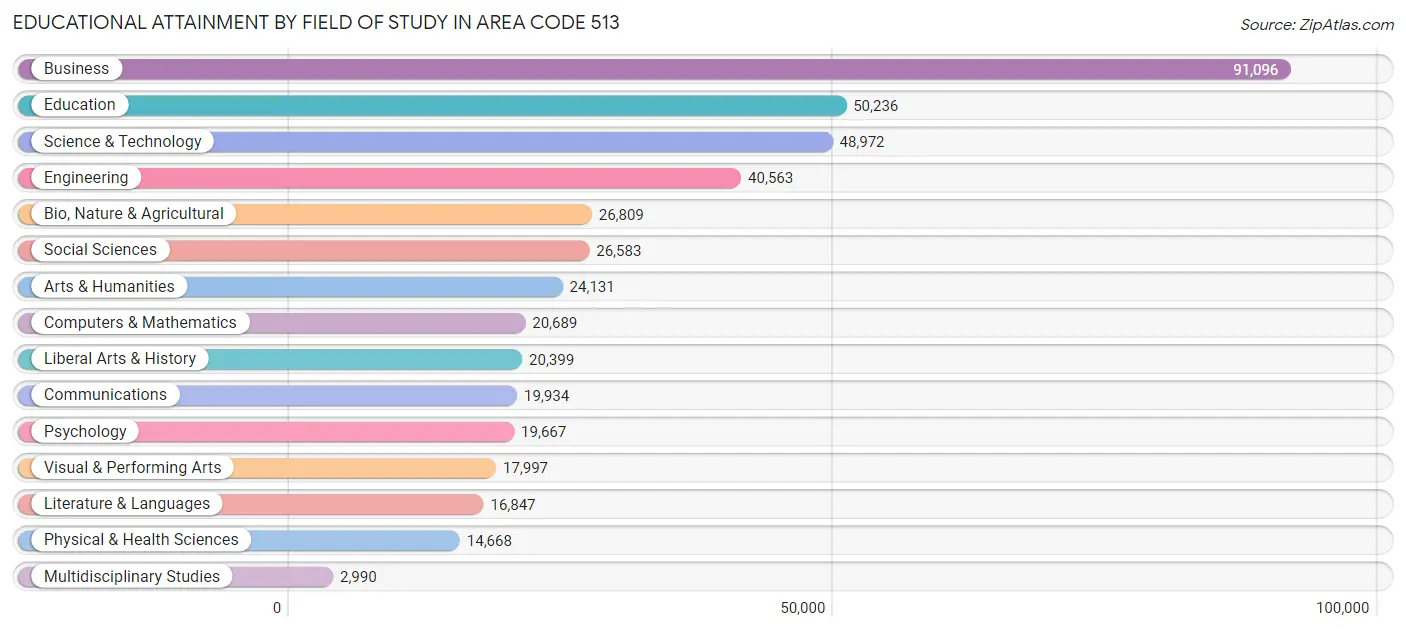
| Field of Study | # Graduates | % Graduates |
| Computers & Mathematics | 20,689 | 4.7% |
| Bio, Nature & Agricultural | 26,809 | 6.1% |
| Physical & Health Sciences | 14,668 | 3.3% |
| Psychology | 19,667 | 4.4% |
| Social Sciences | 26,583 | 6.0% |
| Engineering | 40,563 | 9.2% |
| Multidisciplinary Studies | 2,990 | 0.7% |
| Science & Technology | 48,972 | 11.1% |
| Business | 91,096 | 20.6% |
| Education | 50,236 | 11.4% |
| Literature & Languages | 16,847 | 3.8% |
| Liberal Arts & History | 20,399 | 4.6% |
| Visual & Performing Arts | 17,997 | 4.1% |
| Communications | 19,934 | 4.5% |
| Arts & Humanities | 24,131 | 5.5% |
| Total | 441,581 | 100.0% |
Transportation & Commute in Area Code 513
Vehicle Availability by Sex in Area Code 513
The most prevalent vehicle ownership categories in Area Code 513 are males with 2 vehicles (181,692, accounting for 44.6%) and females with 2 vehicles (156,277, making up 48.4%).
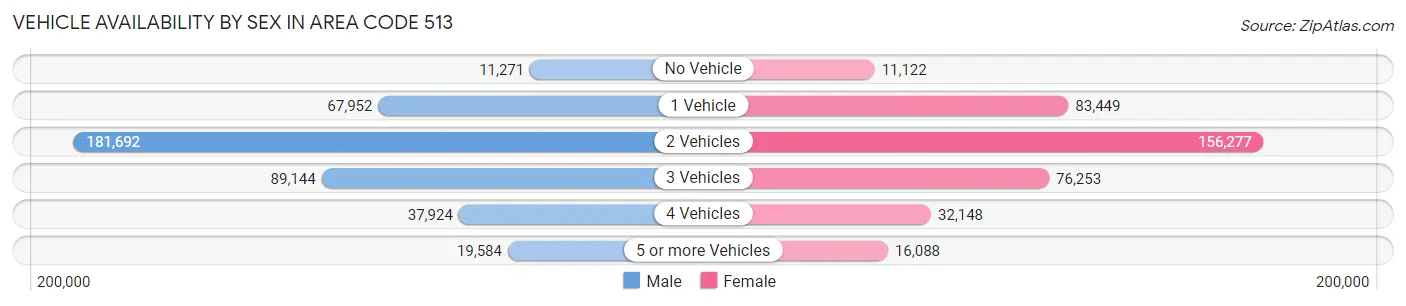
| Vehicles Available | Male | Female |
| No Vehicle | 11,271 (2.8%) | 11,122 (3.0%) |
| 1 Vehicle | 67,952 (16.7%) | 83,449 (22.2%) |
| 2 Vehicles | 181,692 (44.6%) | 156,277 (41.6%) |
| 3 Vehicles | 89,144 (21.9%) | 76,253 (20.3%) |
| 4 Vehicles | 37,924 (9.3%) | 32,148 (8.6%) |
| 5 or more Vehicles | 19,584 (4.8%) | 16,088 (4.3%) |
| Total | 407,567 (100.0%) | 375,337 (100.0%) |
Commute Time in Area Code 513
The most frequently occuring commute durations in Area Code 513 are 20 to 24 minutes (116,473 commuters, 16.7%), 30 to 34 minutes (109,369 commuters, 15.7%), and 15 to 19 minutes (107,439 commuters, 15.4%).
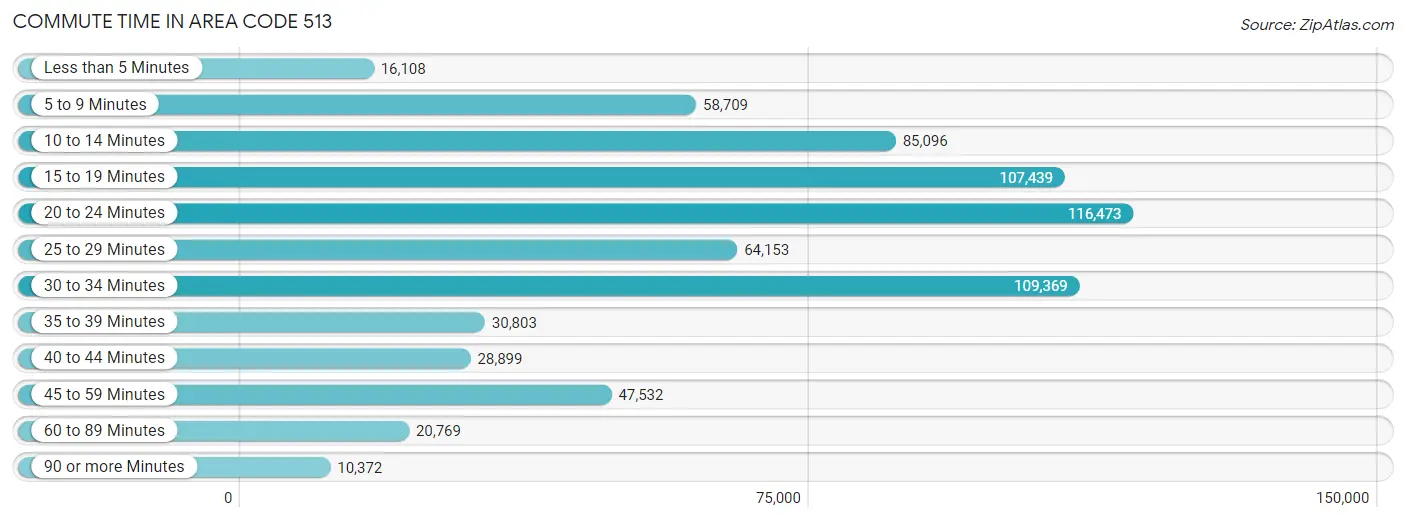
| Commute Time | # Commuters | % Commuters |
| Less than 5 Minutes | 16,108 | 2.3% |
| 5 to 9 Minutes | 58,709 | 8.4% |
| 10 to 14 Minutes | 85,096 | 12.2% |
| 15 to 19 Minutes | 107,439 | 15.4% |
| 20 to 24 Minutes | 116,473 | 16.7% |
| 25 to 29 Minutes | 64,153 | 9.2% |
| 30 to 34 Minutes | 109,369 | 15.7% |
| 35 to 39 Minutes | 30,803 | 4.4% |
| 40 to 44 Minutes | 28,899 | 4.2% |
| 45 to 59 Minutes | 47,532 | 6.8% |
| 60 to 89 Minutes | 20,769 | 3.0% |
| 90 or more Minutes | 10,372 | 1.5% |
Commute Time by Sex in Area Code 513
The most common commute times in Area Code 513 are 30 to 34 minutes (61,621 commuters, 16.9%) for males and 20 to 24 minutes (56,862 commuters, 17.2%) for females.
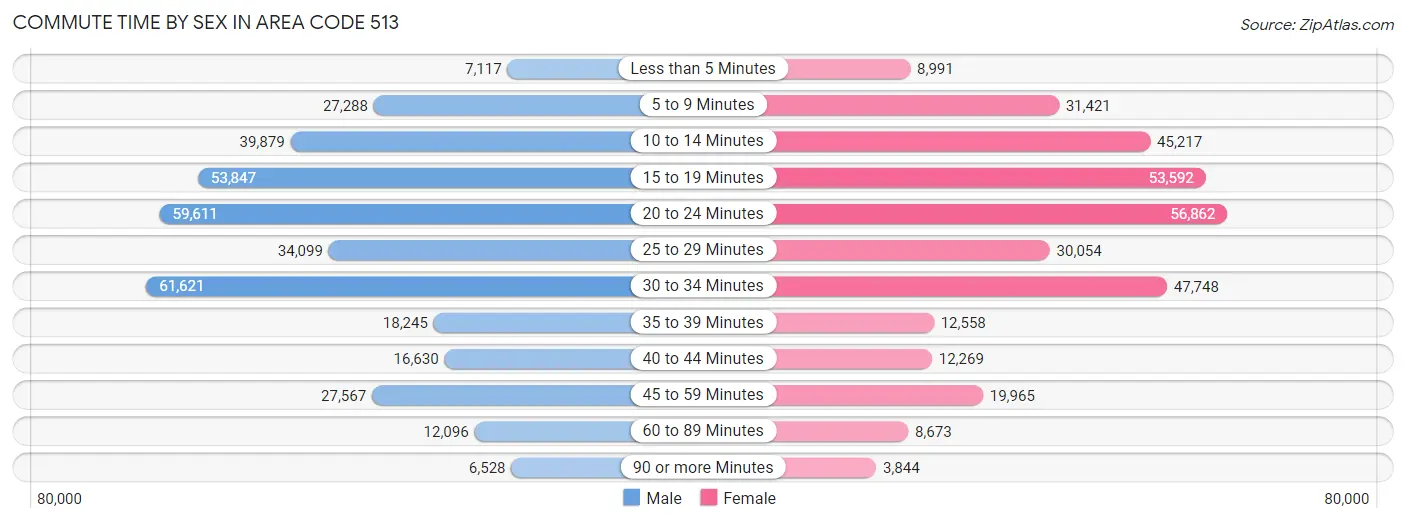
| Commute Time | Male | Female |
| Less than 5 Minutes | 7,117 (1.9%) | 8,991 (2.7%) |
| 5 to 9 Minutes | 27,288 (7.5%) | 31,421 (9.5%) |
| 10 to 14 Minutes | 39,879 (10.9%) | 45,217 (13.7%) |
| 15 to 19 Minutes | 53,847 (14.8%) | 53,592 (16.2%) |
| 20 to 24 Minutes | 59,611 (16.4%) | 56,862 (17.2%) |
| 25 to 29 Minutes | 34,099 (9.3%) | 30,054 (9.1%) |
| 30 to 34 Minutes | 61,621 (16.9%) | 47,748 (14.4%) |
| 35 to 39 Minutes | 18,245 (5.0%) | 12,558 (3.8%) |
| 40 to 44 Minutes | 16,630 (4.6%) | 12,269 (3.7%) |
| 45 to 59 Minutes | 27,567 (7.6%) | 19,965 (6.0%) |
| 60 to 89 Minutes | 12,096 (3.3%) | 8,673 (2.6%) |
| 90 or more Minutes | 6,528 (1.8%) | 3,844 (1.2%) |
Time of Departure to Work by Sex in Area Code 513
The most frequent times of departure to work in Area Code 513 are 7:00 AM to 7:29 AM (51,990, 14.3%) for males and 7:00 AM to 7:29 AM (49,739, 15.0%) for females.
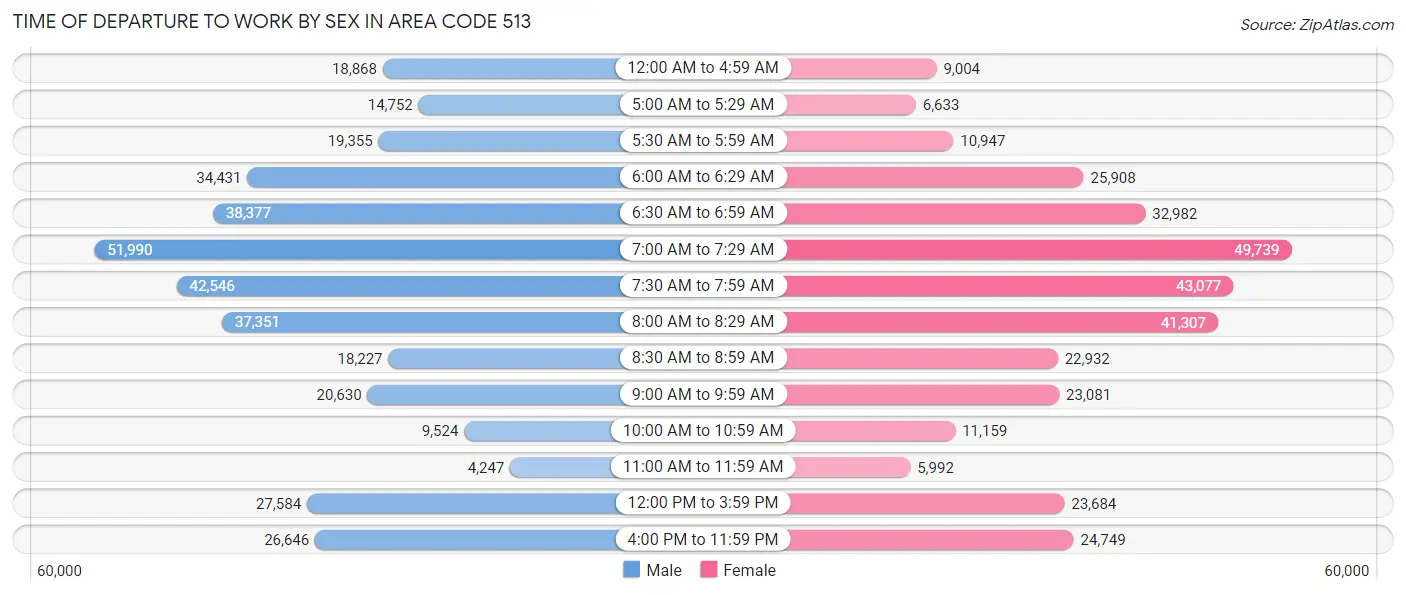
| Time of Departure | Male | Female |
| 12:00 AM to 4:59 AM | 18,868 (5.2%) | 9,004 (2.7%) |
| 5:00 AM to 5:29 AM | 14,752 (4.1%) | 6,633 (2.0%) |
| 5:30 AM to 5:59 AM | 19,355 (5.3%) | 10,947 (3.3%) |
| 6:00 AM to 6:29 AM | 34,431 (9.5%) | 25,908 (7.8%) |
| 6:30 AM to 6:59 AM | 38,377 (10.5%) | 32,982 (10.0%) |
| 7:00 AM to 7:29 AM | 51,990 (14.3%) | 49,739 (15.0%) |
| 7:30 AM to 7:59 AM | 42,546 (11.7%) | 43,077 (13.0%) |
| 8:00 AM to 8:29 AM | 37,351 (10.2%) | 41,307 (12.5%) |
| 8:30 AM to 8:59 AM | 18,227 (5.0%) | 22,932 (6.9%) |
| 9:00 AM to 9:59 AM | 20,630 (5.7%) | 23,081 (7.0%) |
| 10:00 AM to 10:59 AM | 9,524 (2.6%) | 11,159 (3.4%) |
| 11:00 AM to 11:59 AM | 4,247 (1.2%) | 5,992 (1.8%) |
| 12:00 PM to 3:59 PM | 27,584 (7.6%) | 23,684 (7.1%) |
| 4:00 PM to 11:59 PM | 26,646 (7.3%) | 24,749 (7.5%) |
| Total | 364,528 (100.0%) | 331,194 (100.0%) |
Housing Occupancy in Area Code 513
Occupancy by Ownership in Area Code 513
Of the total 644,525 dwellings in Area Code 513, owner-occupied units account for 421,465 (65.4%), while renter-occupied units make up 223,060 (34.6%).
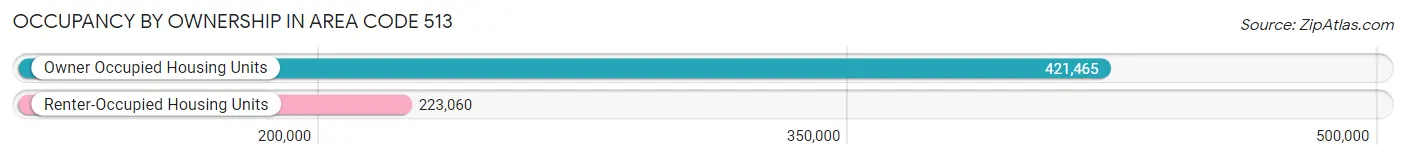
| Occupancy | # Housing Units | % Housing Units |
| Owner Occupied Housing Units | 421,465 | 65.4% |
| Renter-Occupied Housing Units | 223,060 | 34.6% |
| Total Occupied Housing Units | 644,525 | 100.0% |
Occupancy by Household Size in Area Code 513
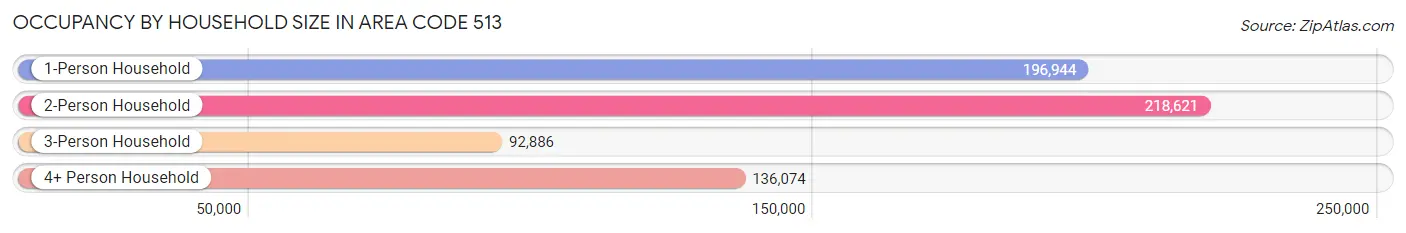
| Household Size | # Housing Units | % Housing Units |
| 1-Person Household | 196,944 | 30.6% |
| 2-Person Household | 218,621 | 33.9% |
| 3-Person Household | 92,886 | 14.4% |
| 4+ Person Household | 136,074 | 21.1% |
| Total Housing Units | 644,525 | 100.0% |
Occupancy by Ownership by Household Size in Area Code 513
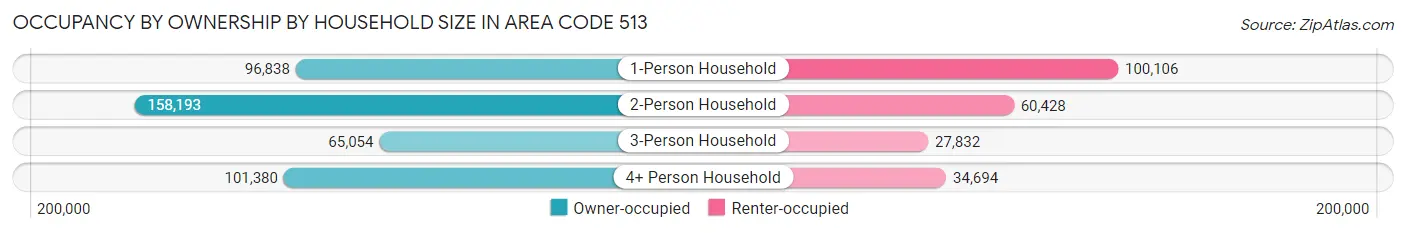
| Household Size | Owner-occupied | Renter-occupied |
| 1-Person Household | 96,838 (49.2%) | 100,106 (50.8%) |
| 2-Person Household | 158,193 (72.4%) | 60,428 (27.6%) |
| 3-Person Household | 65,054 (70.0%) | 27,832 (30.0%) |
| 4+ Person Household | 101,380 (74.5%) | 34,694 (25.5%) |
| Total Housing Units | 421,465 (65.4%) | 223,060 (34.6%) |
Occupancy by Educational Attainment in Area Code 513
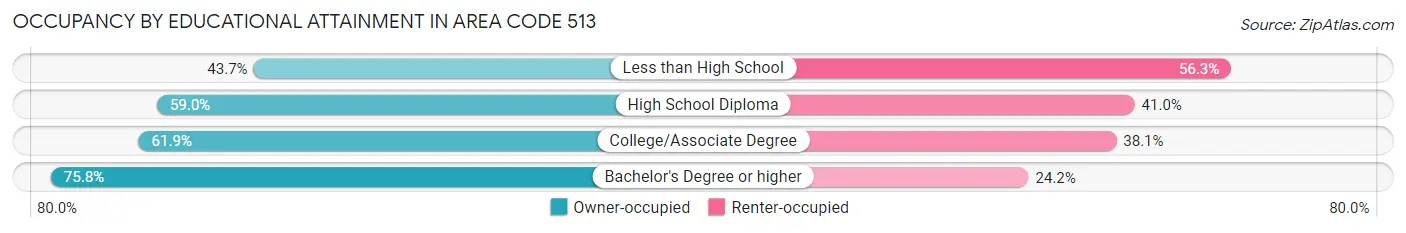
| Household Size | Owner-occupied | Renter-occupied |
| Less than High School | 19,522 (43.7%) | 25,140 (56.3%) |
| High School Diploma | 96,282 (59.0%) | 66,896 (41.0%) |
| College/Associate Degree | 113,101 (61.9%) | 69,601 (38.1%) |
| Bachelor's Degree or higher | 192,560 (75.8%) | 61,423 (24.2%) |
Occupancy by Age of Householder in Area Code 513
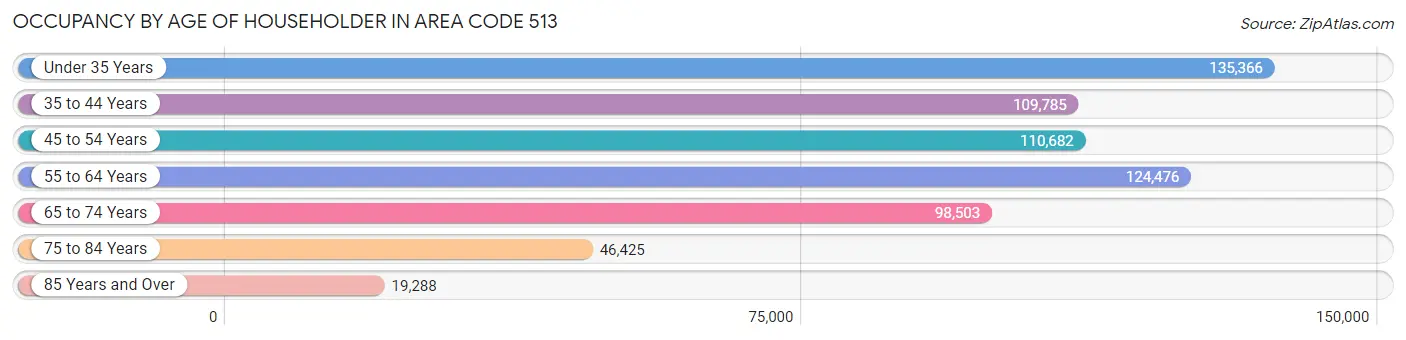
| Age Bracket | # Households | % Households |
| Under 35 Years | 135,366 | 21.0% |
| 35 to 44 Years | 109,785 | 17.0% |
| 45 to 54 Years | 110,682 | 17.2% |
| 55 to 64 Years | 124,476 | 19.3% |
| 65 to 74 Years | 98,503 | 15.3% |
| 75 to 84 Years | 46,425 | 7.2% |
| 85 Years and Over | 19,288 | 3.0% |
| Total | 644,525 | 100.0% |
Housing Finances in Area Code 513
Median Income by Occupancy in Area Code 513
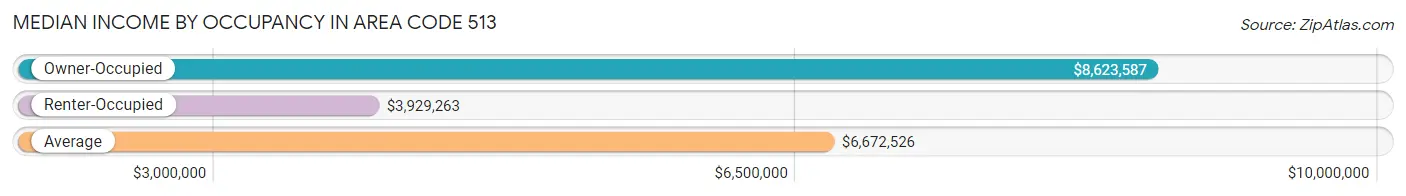
| Occupancy Type | # Households | Median Income |
| Owner-Occupied | 421,465 (65.4%) | $8,623,587 |
| Renter-Occupied | 223,060 (34.6%) | $3,929,263 |
| Average | 644,525 (100.0%) | $6,672,526 |
Occupancy by Householder Income Bracket in Area Code 513
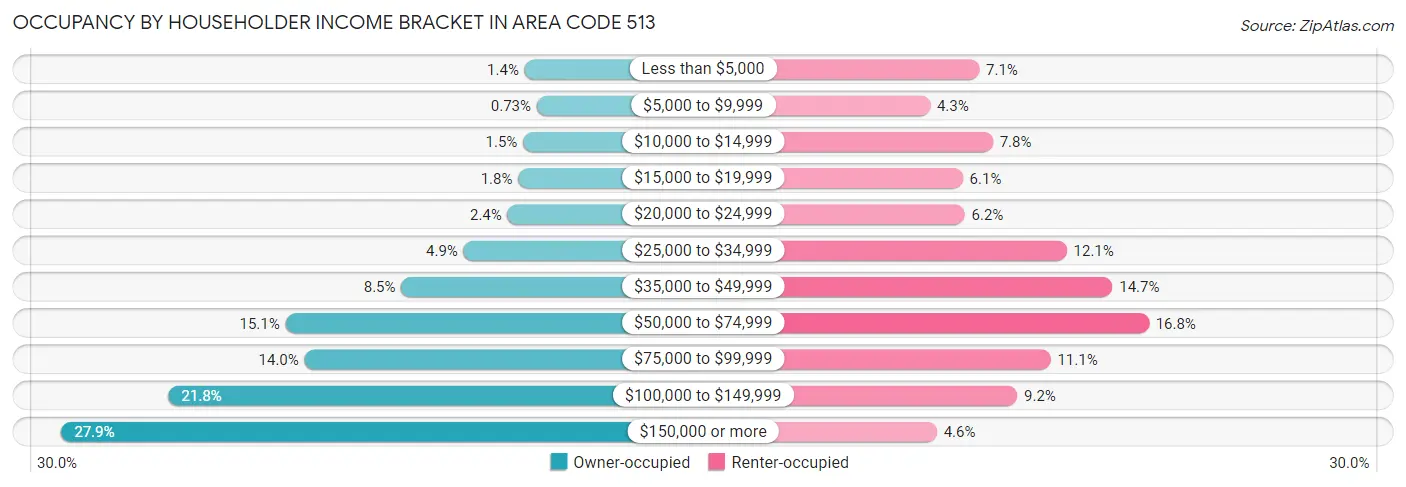
| Income Bracket | Owner-occupied | Renter-occupied |
| Less than $5,000 | 5,965 (1.4%) | 15,758 (7.1%) |
| $5,000 to $9,999 | 3,061 (0.7%) | 9,483 (4.3%) |
| $10,000 to $14,999 | 6,376 (1.5%) | 17,481 (7.8%) |
| $15,000 to $19,999 | 7,562 (1.8%) | 13,646 (6.1%) |
| $20,000 to $24,999 | 10,122 (2.4%) | 13,892 (6.2%) |
| $25,000 to $34,999 | 20,696 (4.9%) | 26,906 (12.1%) |
| $35,000 to $49,999 | 35,696 (8.5%) | 32,733 (14.7%) |
| $50,000 to $74,999 | 63,609 (15.1%) | 37,367 (16.8%) |
| $75,000 to $99,999 | 58,986 (14.0%) | 24,844 (11.1%) |
| $100,000 to $149,999 | 91,808 (21.8%) | 20,595 (9.2%) |
| $150,000 or more | 117,584 (27.9%) | 10,355 (4.6%) |
| Total | 421,465 (100.0%) | 223,060 (100.0%) |
Monthly Housing Cost Tiers in Area Code 513
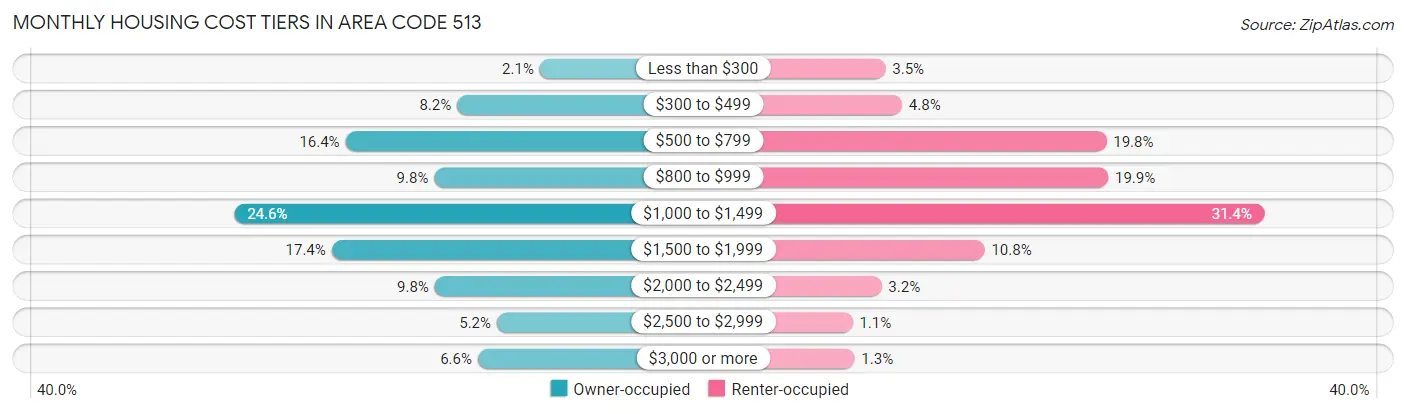
| Monthly Cost | Owner-occupied | Renter-occupied |
| Less than $300 | 8,683 (2.1%) | 7,884 (3.5%) |
| $300 to $499 | 34,370 (8.2%) | 10,600 (4.8%) |
| $500 to $799 | 68,999 (16.4%) | 44,163 (19.8%) |
| $800 to $999 | 41,411 (9.8%) | 44,462 (19.9%) |
| $1,000 to $1,499 | 103,522 (24.6%) | 70,043 (31.4%) |
| $1,500 to $1,999 | 73,272 (17.4%) | 24,147 (10.8%) |
| $2,000 to $2,499 | 41,294 (9.8%) | 7,233 (3.2%) |
| $2,500 to $2,999 | 22,015 (5.2%) | 2,469 (1.1%) |
| $3,000 or more | 27,899 (6.6%) | 2,788 (1.3%) |
| Total | 421,465 (100.0%) | 223,060 (100.0%) |
Physical Housing Characteristics in Area Code 513
Housing Structures in Area Code 513
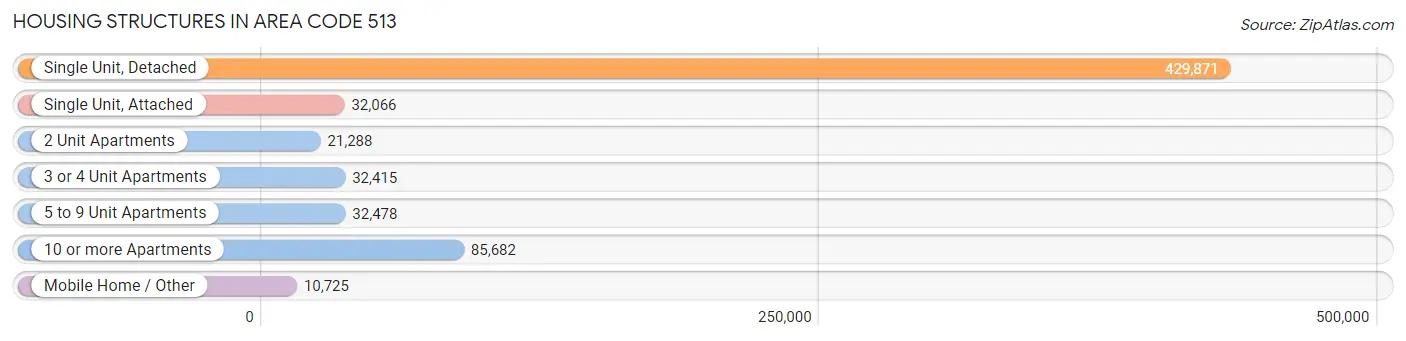
| Structure Type | # Housing Units | % Housing Units |
| Single Unit, Detached | 429,871 | 66.7% |
| Single Unit, Attached | 32,066 | 5.0% |
| 2 Unit Apartments | 21,288 | 3.3% |
| 3 or 4 Unit Apartments | 32,415 | 5.0% |
| 5 to 9 Unit Apartments | 32,478 | 5.0% |
| 10 or more Apartments | 85,682 | 13.3% |
| Mobile Home / Other | 10,725 | 1.7% |
| Total | 644,525 | 100.0% |
Housing Structures by Occupancy in Area Code 513
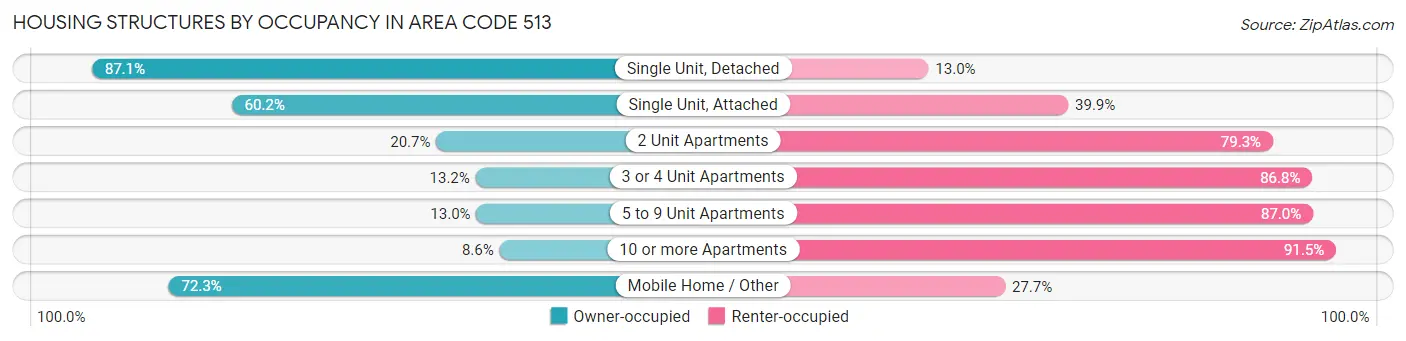
| Structure Type | Owner-occupied | Renter-occupied |
| Single Unit, Detached | 374,186 (87.1%) | 55,685 (13.0%) |
| Single Unit, Attached | 19,289 (60.2%) | 12,777 (39.9%) |
| 2 Unit Apartments | 4,414 (20.7%) | 16,874 (79.3%) |
| 3 or 4 Unit Apartments | 4,267 (13.2%) | 28,148 (86.8%) |
| 5 to 9 Unit Apartments | 4,227 (13.0%) | 28,251 (87.0%) |
| 10 or more Apartments | 7,328 (8.6%) | 78,354 (91.4%) |
| Mobile Home / Other | 7,754 (72.3%) | 2,971 (27.7%) |
| Total | 421,465 (65.4%) | 223,060 (34.6%) |
Housing Structures by Number of Rooms in Area Code 513
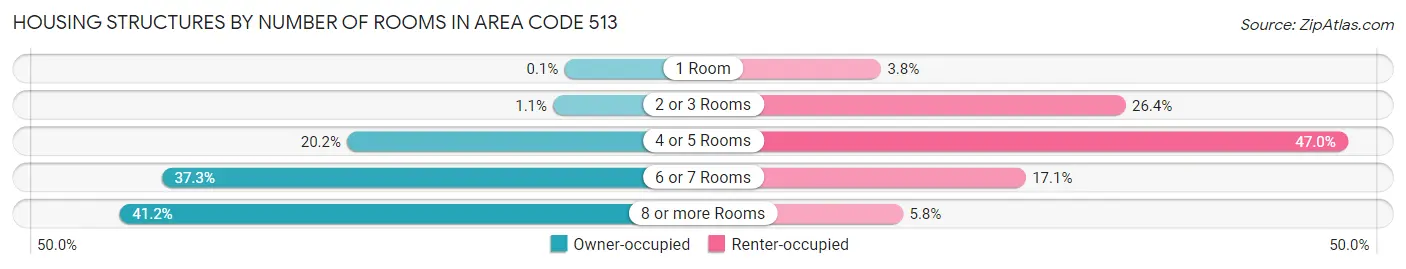
| Number of Rooms | Owner-occupied | Renter-occupied |
| 1 Room | 435 (0.1%) | 8,370 (3.7%) |
| 2 or 3 Rooms | 4,820 (1.1%) | 58,826 (26.4%) |
| 4 or 5 Rooms | 85,123 (20.2%) | 104,720 (46.9%) |
| 6 or 7 Rooms | 157,315 (37.3%) | 38,235 (17.1%) |
| 8 or more Rooms | 173,772 (41.2%) | 12,909 (5.8%) |
| Total | 421,465 (100.0%) | 223,060 (100.0%) |
Housing Structure by Heating Type in Area Code 513
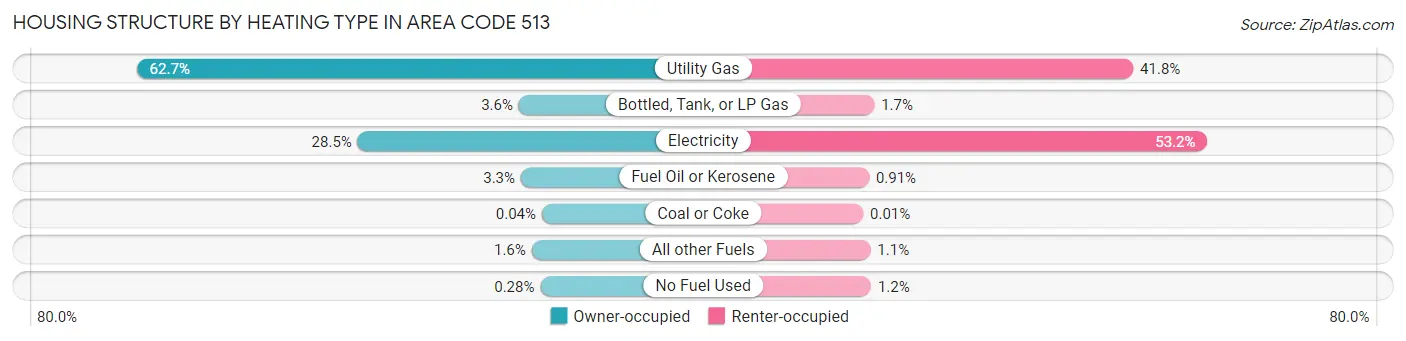
| Heating Type | Owner-occupied | Renter-occupied |
| Utility Gas | 264,116 (62.7%) | 93,159 (41.8%) |
| Bottled, Tank, or LP Gas | 15,193 (3.6%) | 3,869 (1.7%) |
| Electricity | 120,157 (28.5%) | 118,710 (53.2%) |
| Fuel Oil or Kerosene | 13,840 (3.3%) | 2,029 (0.9%) |
| Coal or Coke | 165 (0.0%) | 32 (0.0%) |
| All other Fuels | 6,819 (1.6%) | 2,536 (1.1%) |
| No Fuel Used | 1,175 (0.3%) | 2,725 (1.2%) |
| Total | 421,465 (100.0%) | 223,060 (100.0%) |
Household Vehicle Usage in Area Code 513
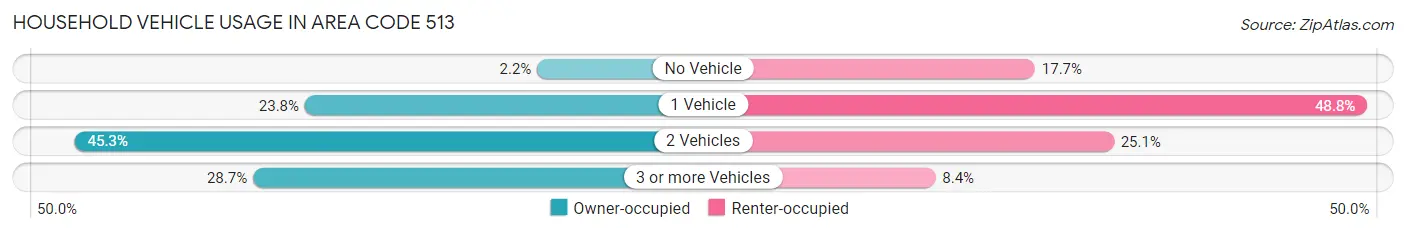
| Vehicles per Household | Owner-occupied | Renter-occupied |
| No Vehicle | 9,044 (2.1%) | 39,544 (17.7%) |
| 1 Vehicle | 100,468 (23.8%) | 108,735 (48.7%) |
| 2 Vehicles | 191,064 (45.3%) | 55,964 (25.1%) |
| 3 or more Vehicles | 120,889 (28.7%) | 18,817 (8.4%) |
| Total | 421,465 (100.0%) | 223,060 (100.0%) |
Real Estate & Mortgages in Area Code 513
Real Estate and Mortgage Overview in Area Code 513
| Characteristic | Without Mortgage | With Mortgage |
| Housing Units | 138,000 | 283,465 |
| Median Property Value | $17,701,400 | $20,728,100 |
| Median Household Income | $6,449,513 | $90,959 |
| Monthly Housing Costs | $56,015 | $27,322 |
| Real Estate Taxes | $264,403 | $5,036 |
Property Value by Mortgage Status in Area Code 513
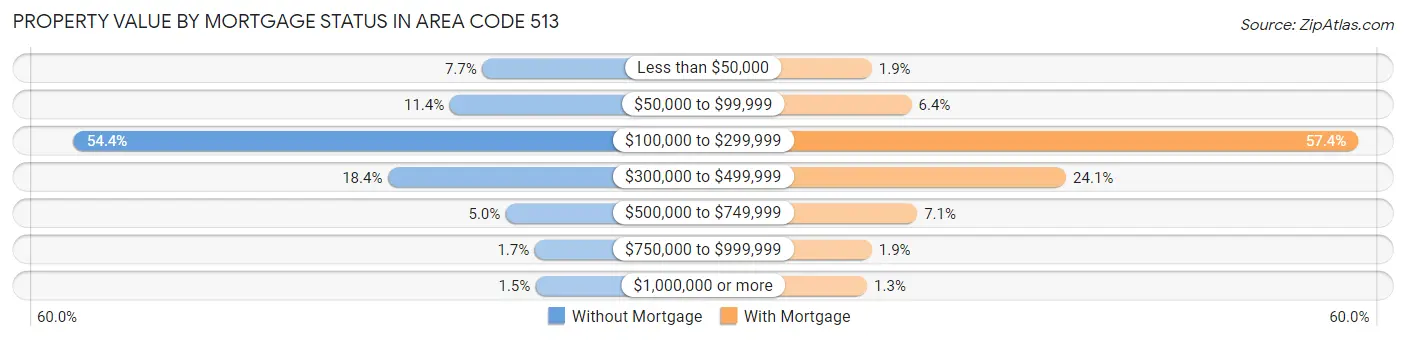
| Property Value | Without Mortgage | With Mortgage |
| Less than $50,000 | 10,565 (7.7%) | 5,270 (1.9%) |
| $50,000 to $99,999 | 15,708 (11.4%) | 18,176 (6.4%) |
| $100,000 to $299,999 | 75,011 (54.4%) | 162,780 (57.4%) |
| $300,000 to $499,999 | 25,451 (18.4%) | 68,217 (24.1%) |
| $500,000 to $749,999 | 6,857 (5.0%) | 19,996 (7.0%) |
| $750,000 to $999,999 | 2,286 (1.7%) | 5,269 (1.9%) |
| $1,000,000 or more | 2,122 (1.5%) | 3,757 (1.3%) |
| Total | 138,000 (100.0%) | 283,465 (100.0%) |
Household Income by Mortgage Status in Area Code 513
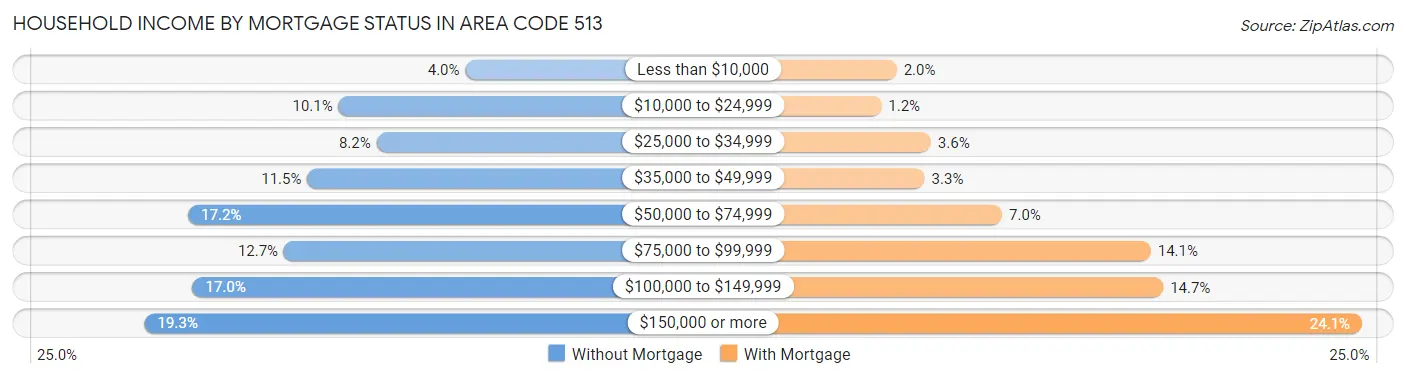
| Household Income | Without Mortgage | With Mortgage |
| Less than $10,000 | 5,533 (4.0%) | 5,554 (2.0%) |
| $10,000 to $24,999 | 13,875 (10.1%) | 3,493 (1.2%) |
| $25,000 to $34,999 | 11,373 (8.2%) | 10,185 (3.6%) |
| $35,000 to $49,999 | 15,921 (11.5%) | 9,323 (3.3%) |
| $50,000 to $74,999 | 23,749 (17.2%) | 19,775 (7.0%) |
| $75,000 to $99,999 | 17,462 (12.7%) | 39,860 (14.1%) |
| $100,000 to $149,999 | 23,462 (17.0%) | 41,524 (14.6%) |
| $150,000 or more | 26,625 (19.3%) | 68,346 (24.1%) |
| Total | 138,000 (100.0%) | 283,465 (100.0%) |
Property Value to Household Income Ratio in Area Code 513
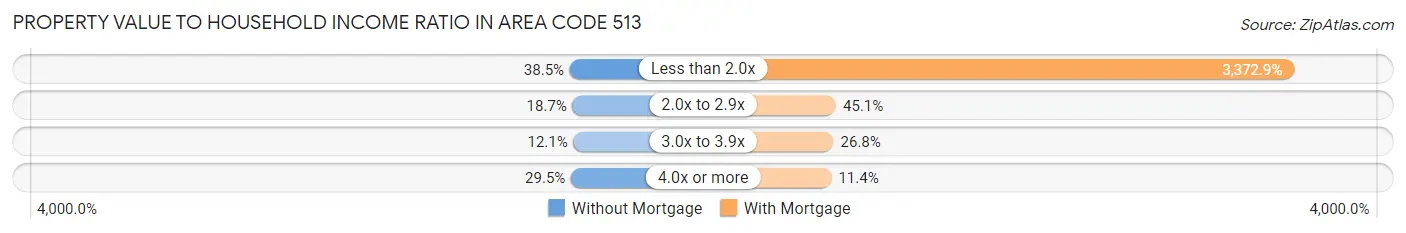
| Value-to-Income Ratio | Without Mortgage | With Mortgage |
| Less than 2.0x | 53,151 (38.5%) | 9,560,898 (3,372.9%) |
| 2.0x to 2.9x | 25,739 (18.6%) | 127,773 (45.1%) |
| 3.0x to 3.9x | 16,693 (12.1%) | 76,077 (26.8%) |
| 4.0x or more | 40,636 (29.4%) | 32,201 (11.4%) |
| Total | 138,000 (100.0%) | 283,465 (100.0%) |
Real Estate Taxes by Mortgage Status in Area Code 513
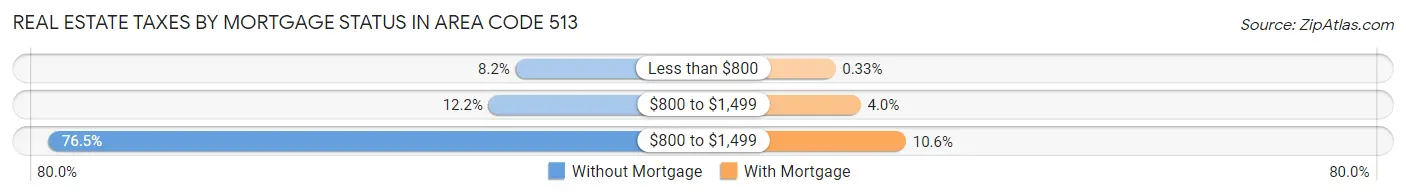
| Property Taxes | Without Mortgage | With Mortgage |
| Less than $800 | 11,375 (8.2%) | 945 (0.3%) |
| $800 to $1,499 | 16,806 (12.2%) | 11,404 (4.0%) |
| $800 to $1,499 | 105,501 (76.4%) | 30,139 (10.6%) |
| Total | 138,000 (100.0%) | 283,465 (100.0%) |
Health & Disability in Area Code 513
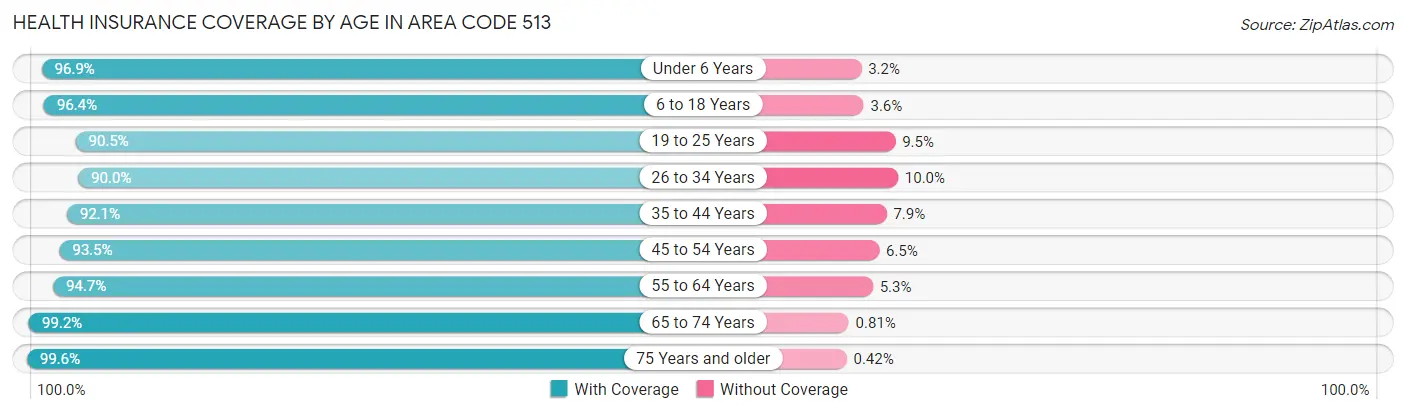
Health Insurance Coverage by Age in Area Code 513
| Age Bracket | With Coverage | Without Coverage |
| Under 6 Years | 111,870 (96.9%) | 3,634 (3.2%) |
| 6 to 18 Years | 269,992 (96.4%) | 10,053 (3.6%) |
| 19 to 25 Years | 139,370 (90.5%) | 14,621 (9.5%) |
| 26 to 34 Years | 172,568 (90.0%) | 19,156 (10.0%) |
| 35 to 44 Years | 185,495 (92.1%) | 15,853 (7.9%) |
| 45 to 54 Years | 181,232 (93.5%) | 12,566 (6.5%) |
| 55 to 64 Years | 200,477 (94.7%) | 11,210 (5.3%) |
| 65 to 74 Years | 149,906 (99.2%) | 1,230 (0.8%) |
| 75 Years and older | 94,760 (99.6%) | 395 (0.4%) |
| Total | 1,505,670 (94.4%) | 88,718 (5.6%) |
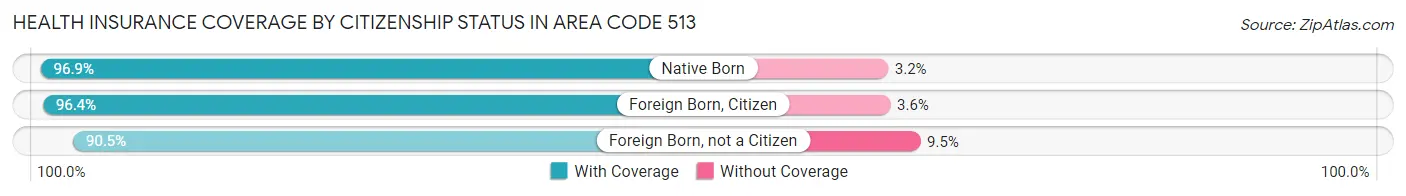
Health Insurance Coverage by Citizenship Status in Area Code 513
| Citizenship Status | With Coverage | Without Coverage |
| Native Born | 111,870 (96.9%) | 3,634 (3.2%) |
| Foreign Born, Citizen | 269,992 (96.4%) | 10,053 (3.6%) |
| Foreign Born, not a Citizen | 139,370 (90.5%) | 14,621 (9.5%) |
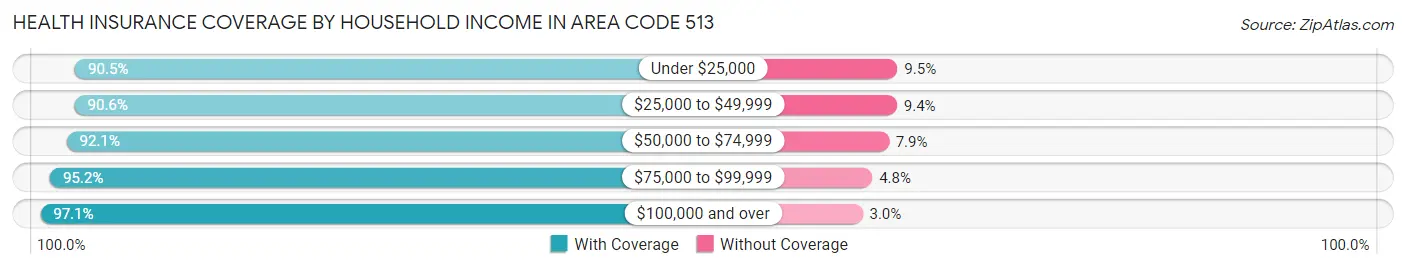
Health Insurance Coverage by Household Income in Area Code 513
| Household Income | With Coverage | Without Coverage |
| Under $25,000 | 161,181 (90.5%) | 16,885 (9.5%) |
| $25,000 to $49,999 | 205,185 (90.6%) | 21,240 (9.4%) |
| $50,000 to $74,999 | 213,327 (92.1%) | 18,190 (7.9%) |
| $75,000 to $99,999 | 198,669 (95.2%) | 9,928 (4.8%) |
| $100,000 and over | 710,280 (97.1%) | 21,569 (2.9%) |
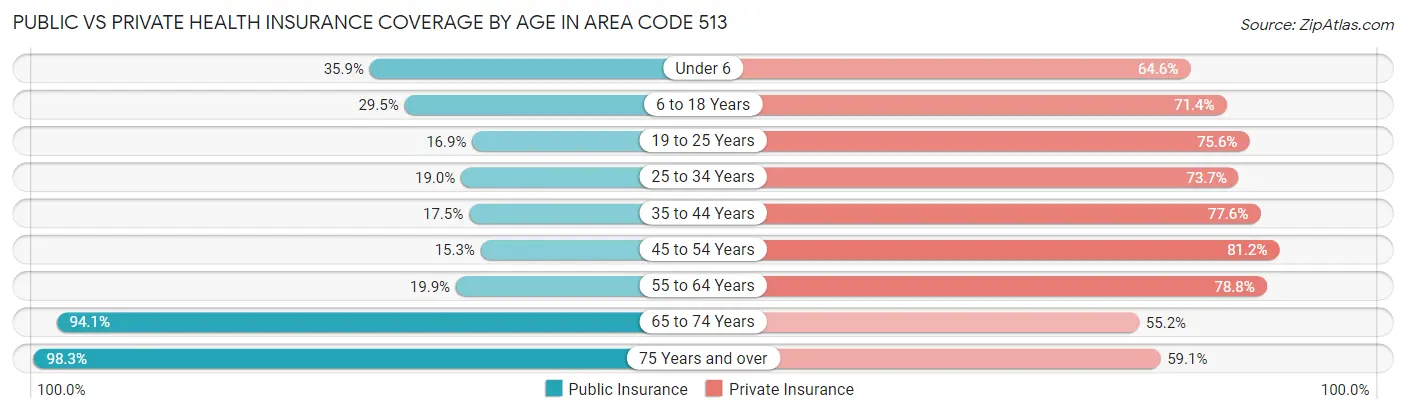
Public vs Private Health Insurance Coverage by Age in Area Code 513
| Age Bracket | Public Insurance | Private Insurance |
| Under 6 | 41,512 (35.9%) | 74,666 (64.6%) |
| 6 to 18 Years | 82,593 (29.5%) | 199,857 (71.4%) |
| 19 to 25 Years | 26,035 (16.9%) | 116,434 (75.6%) |
| 25 to 34 Years | 36,390 (19.0%) | 141,205 (73.7%) |
| 35 to 44 Years | 35,229 (17.5%) | 156,311 (77.6%) |
| 45 to 54 Years | 29,732 (15.3%) | 157,350 (81.2%) |
| 55 to 64 Years | 42,208 (19.9%) | 166,901 (78.8%) |
| 65 to 74 Years | 142,162 (94.1%) | 83,357 (55.1%) |
| 75 Years and over | 93,565 (98.3%) | 56,248 (59.1%) |
| Total | 529,426 (33.2%) | 1,152,329 (72.3%) |
Disability Status by Sex by Age in Area Code 513
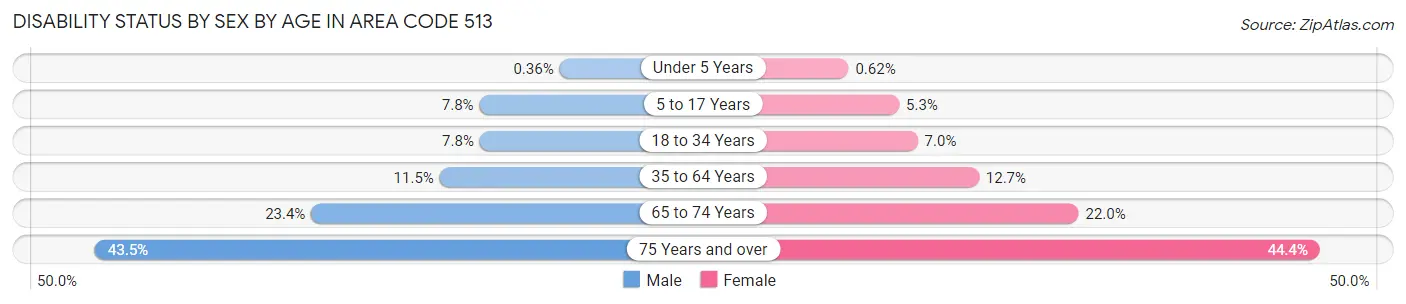
| Age Bracket | Male | Female |
| Under 5 Years | 176 (0.4%) | 292 (0.6%) |
| 5 to 17 Years | 10,976 (7.8%) | 7,147 (5.3%) |
| 18 to 34 Years | 14,325 (7.8%) | 13,017 (7.0%) |
| 35 to 64 Years | 34,245 (11.5%) | 39,253 (12.7%) |
| 65 to 74 Years | 16,563 (23.4%) | 17,657 (22.0%) |
| 75 Years and over | 16,899 (43.5%) | 24,965 (44.4%) |
Disability Class by Sex by Age in Area Code 513
Disability Class: Hearing Difficulty
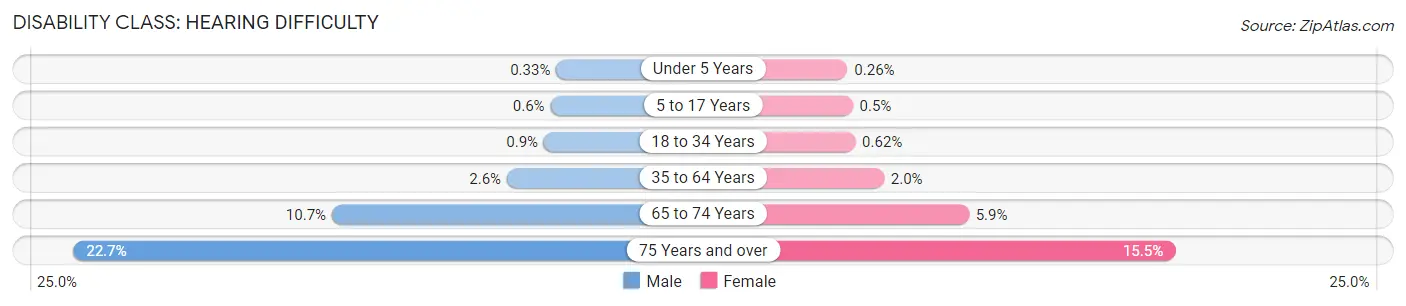
| Age Bracket | Male | Female |
| Under 5 Years | 162 (0.3%) | 124 (0.3%) |
| 5 to 17 Years | 848 (0.6%) | 672 (0.5%) |
| 18 to 34 Years | 1,664 (0.9%) | 1,137 (0.6%) |
| 35 to 64 Years | 7,818 (2.6%) | 6,030 (1.9%) |
| 65 to 74 Years | 7,603 (10.7%) | 4,729 (5.9%) |
| 75 Years and over | 8,841 (22.7%) | 8,702 (15.5%) |
Disability Class: Vision Difficulty
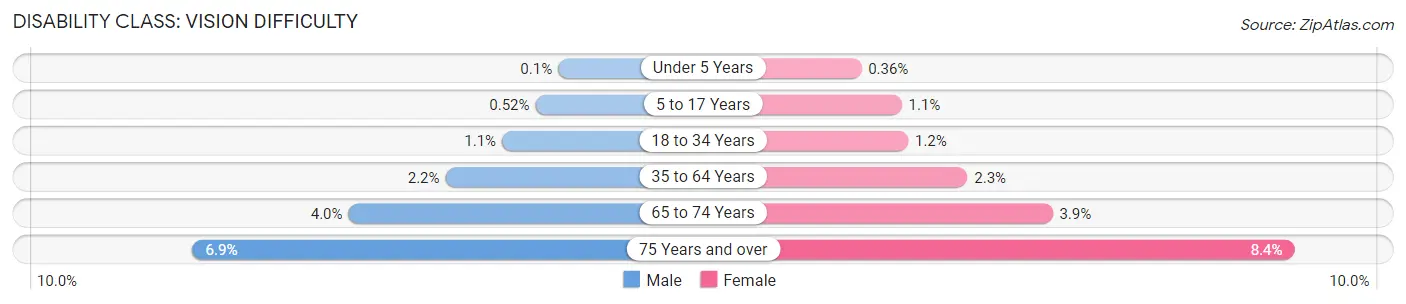
| Age Bracket | Male | Female |
| Under 5 Years | 49 (0.1%) | 168 (0.4%) |
| 5 to 17 Years | 729 (0.5%) | 1,488 (1.1%) |
| 18 to 34 Years | 2,109 (1.1%) | 2,269 (1.2%) |
| 35 to 64 Years | 6,524 (2.2%) | 7,187 (2.3%) |
| 65 to 74 Years | 2,824 (4.0%) | 3,142 (3.9%) |
| 75 Years and over | 2,674 (6.9%) | 4,726 (8.4%) |
Disability Class: Cognitive Difficulty
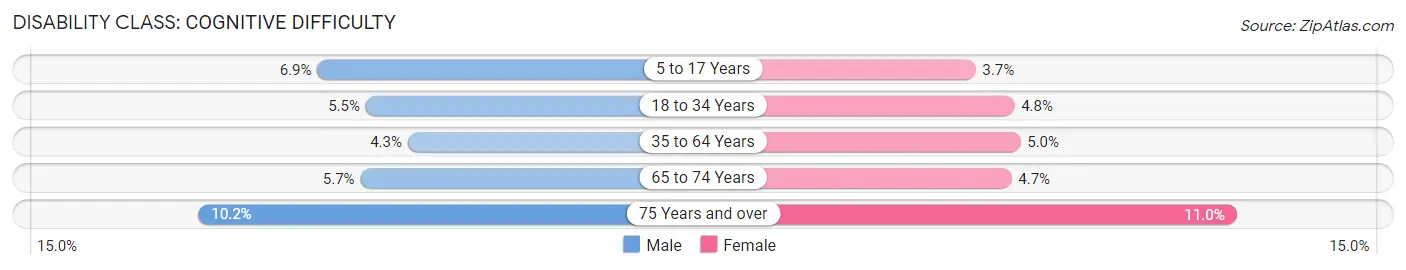
| Age Bracket | Male | Female |
| 5 to 17 Years | 9,649 (6.9%) | 4,995 (3.7%) |
| 18 to 34 Years | 10,155 (5.5%) | 8,862 (4.8%) |
| 35 to 64 Years | 12,906 (4.3%) | 15,354 (5.0%) |
| 65 to 74 Years | 4,000 (5.7%) | 3,792 (4.7%) |
| 75 Years and over | 3,949 (10.2%) | 6,184 (11.0%) |
Disability Class: Ambulatory Difficulty
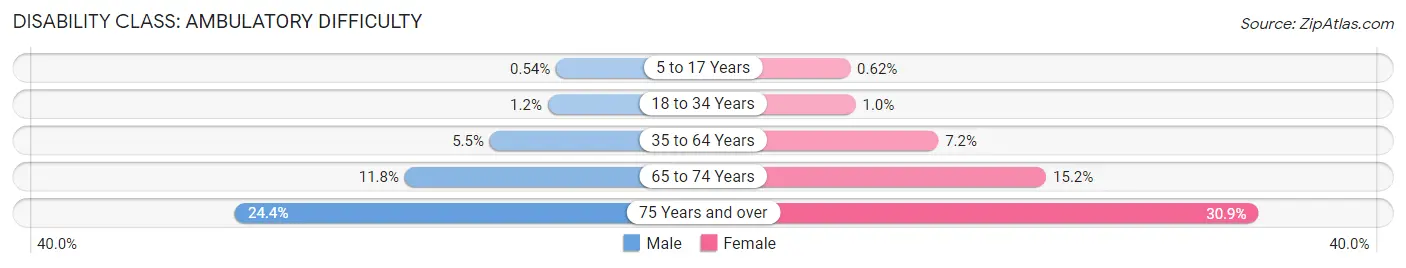
| Age Bracket | Male | Female |
| 5 to 17 Years | 766 (0.5%) | 839 (0.6%) |
| 18 to 34 Years | 2,140 (1.2%) | 1,878 (1.0%) |
| 35 to 64 Years | 16,269 (5.5%) | 22,084 (7.2%) |
| 65 to 74 Years | 8,328 (11.8%) | 12,194 (15.2%) |
| 75 Years and over | 9,476 (24.4%) | 17,400 (30.9%) |
Disability Class: Self-Care Difficulty
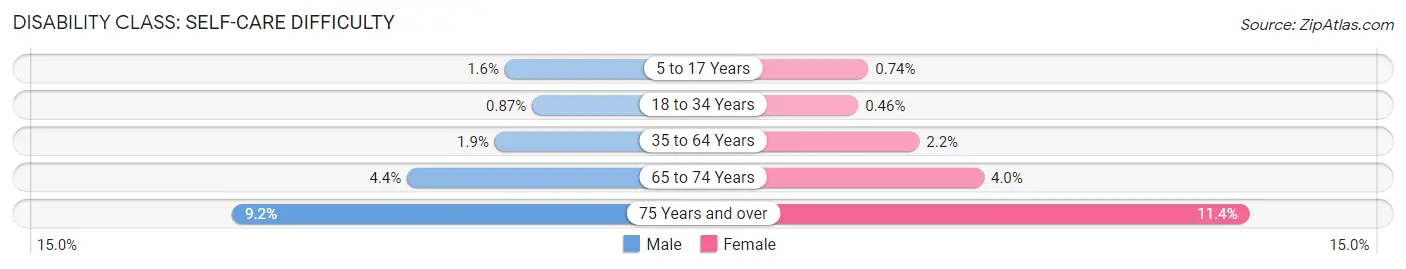
| Age Bracket | Male | Female |
| 5 to 17 Years | 2,304 (1.6%) | 997 (0.7%) |
| 18 to 34 Years | 1,599 (0.9%) | 855 (0.5%) |
| 35 to 64 Years | 5,682 (1.9%) | 6,670 (2.2%) |
| 65 to 74 Years | 3,082 (4.3%) | 3,183 (4.0%) |
| 75 Years and over | 3,586 (9.2%) | 6,385 (11.4%) |
Technology Access in Area Code 513
Computing Device Access in Area Code 513
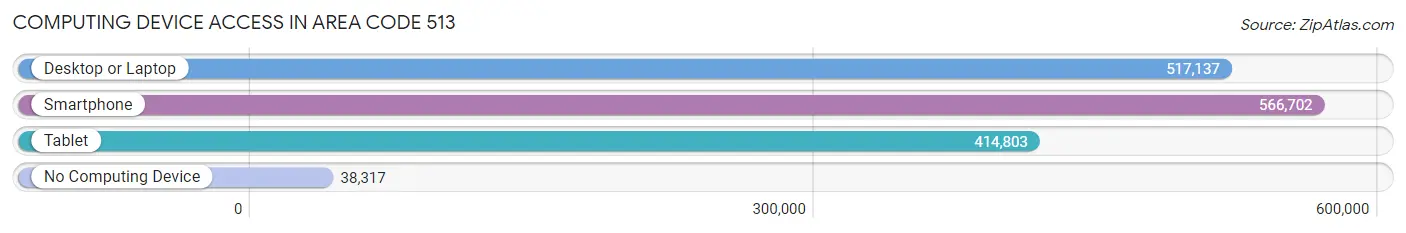
| Device Type | # Households | % Households |
| Desktop or Laptop | 517,137 | 80.2% |
| Smartphone | 566,702 | 87.9% |
| Tablet | 414,803 | 64.4% |
| No Computing Device | 38,317 | 5.9% |
| Total | 644,525 | 100.0% |
Internet Access in Area Code 513
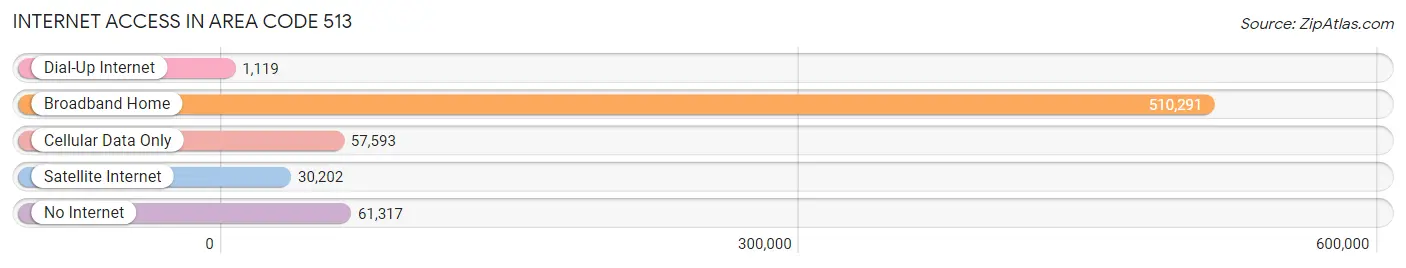
| Internet Type | # Households | % Households |
| Dial-Up Internet | 1,119 | 0.2% |
| Broadband Home | 510,291 | 79.2% |
| Cellular Data Only | 57,593 | 8.9% |
| Satellite Internet | 30,202 | 4.7% |
| No Internet | 61,317 | 9.5% |
| Total | 644,525 | 100.0% |
Area Code 513 Summary
Geography
Area code 513 is located in the state of Ohio and covers the Cincinnati metropolitan area. It includes the cities of Cincinnati, Hamilton, Middletown, and Oxford.
Social
Area code 513 is home to a diverse population of people from all walks of life. The area is known for its vibrant arts and culture scene, with a variety of museums, galleries, and performing arts venues.
Economics
Area code 513 is a major economic hub in the Midwest. It is home to several Fortune 500 companies, including Procter & Gamble, Kroger, and Macy's. The area is also home to a number of universities and colleges, including the University of Cincinnati and Xavier University.
Demographics
Area code 513 is home to a population of over 1.3 million people. The area is predominantly white, with a large African American population. The median household income is around $50,000, and the median age is around 35 years old.
Common Questions
What is Per Capita Income in Area Code 513?
Per Capita income in Area Code 513 is $41,010.
What is the Median Family Income in Area Code 513?
Median Family Income in Area Code 513 is $97,078.
What is the Median Household income in Area Code 513?
Median Household Income in Area Code 513 is $76,696.
What is Income or Wage Gap in Area Code 513?
Income or Wage Gap in Area Code 513 is 28.9%.
Women in Area Code 513 earn 71.1 cents for every dollar earned by a man.
What is Family Income Deficit in Area Code 513?
Family Income Deficit in Area Code 513 is $11,057.
Families that are below poverty line in Area Code 513 earn $11,057 less on average than the poverty threshold level.
What is Inequality or Gini Index in Area Code 513?
Inequality or Gini Index in Area Code 513 is 40.05.
What is the Total Population of Area Code 513?
Total Population of Area Code 513 is 1,614,801.
What is the Total Male Population of Area Code 513?
Total Male Population of Area Code 513 is 795,037.
What is the Total Female Population of Area Code 513?
Total Female Population of Area Code 513 is 819,764.
What is the Ratio of Males per 100 Females in Area Code 513?
There are 96.98 Males per 100 Females in Area Code 513.
What is the Ratio of Females per 100 Males in Area Code 513?
There are 103.11 Females per 100 Males in Area Code 513.
What is the Median Population Age in Area Code 513?
Median Population Age in Area Code 513 is 40.0 Years.
What is the Average Family Size in Area Code 513
Average Family Size in Area Code 513 is 3.0 People.
What is the Average Household Size in Area Code 513
Average Household Size in Area Code 513 is 2.5 People.
How Large is the Labor Force in Area Code 513?
There are 825,358 People in the Labor Forcein in Area Code 513.
What is the Percentage of People in the Labor Force in Area Code 513?
64.2% of People are in the Labor Force in Area Code 513.
What is the Unemployment Rate in Area Code 513?
Unemployment Rate in Area Code 513 is 5.8%.