Area Code 567 Map & Demographics
Area Code 567 Map
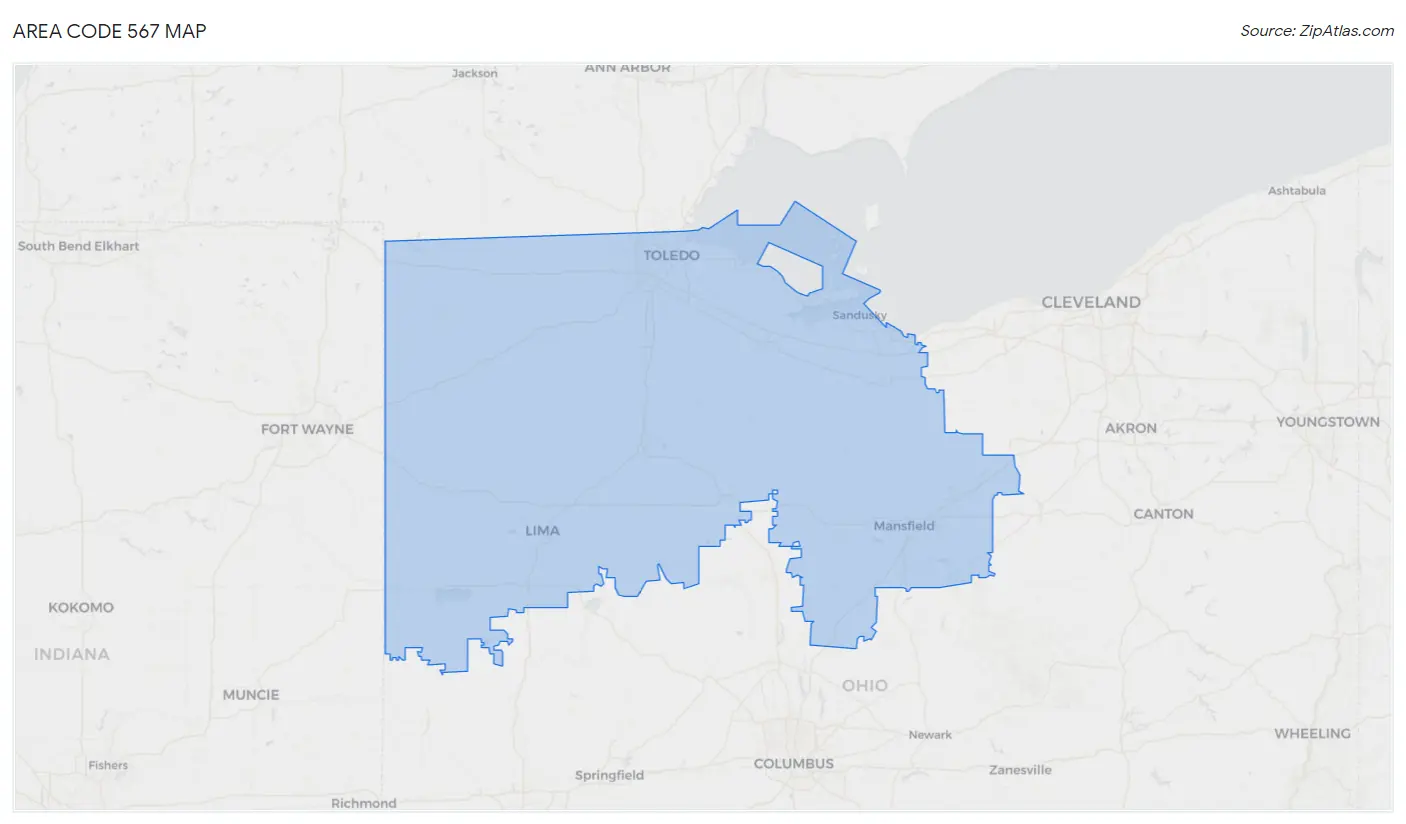
Area Code 567 Overview
$33,355
PER CAPITA INCOME
$81,749
AVG FAMILY INCOME
$68,229
AVG HOUSEHOLD INCOME
32.7%
WAGE / INCOME GAP [ % ]
67.3¢/ $1
WAGE / INCOME GAP [ $ ]
$10,633
FAMILY INCOME DEFICIT
47.42
INEQUALITY / GINI INDEX
1,131,059
TOTAL POPULATION
561,127
MALE POPULATION
569,932
FEMALE POPULATION
98.46
MALES / 100 FEMALES
101.57
FEMALES / 100 MALES
41.1
MEDIAN AGE
3.0
AVG FAMILY SIZE
2.5
AVG HOUSEHOLD SIZE
567,315
LABOR FORCE [ PEOPLE ]
62.3%
PERCENT IN LABOR FORCE
4.2%
UNEMPLOYMENT RATE
Income in Area Code 567
Income Overview in Area Code 567
Per Capita Income in Area Code 567 is $33,355, while median incomes of families and households are $81,749 and $68,229 respectively.
| Characteristic | Number | Measure |
| Per Capita Income | 1,131,059 | $33,355 |
| Median Family Income | 287,174 | $81,749 |
| Mean Family Income | 287,174 | $11,378,264 |
| Median Household Income | 467,383 | $68,229 |
| Mean Household Income | 467,383 | $9,842,185 |
| Income Deficit | 287,174 | $10,633 |
| Wage / Income Gap (%) | 1,131,059 | 32.72% |
| Wage / Income Gap ($) | 1,131,059 | 67.28¢ per $1 |
| Gini / Inequality Index | 1,131,059 | 47.42 |
Earnings by Sex in Area Code 567
Average Earnings in Area Code 567 are $39,245, $47,569 for men and $31,613 for women, a difference of 33.5%.
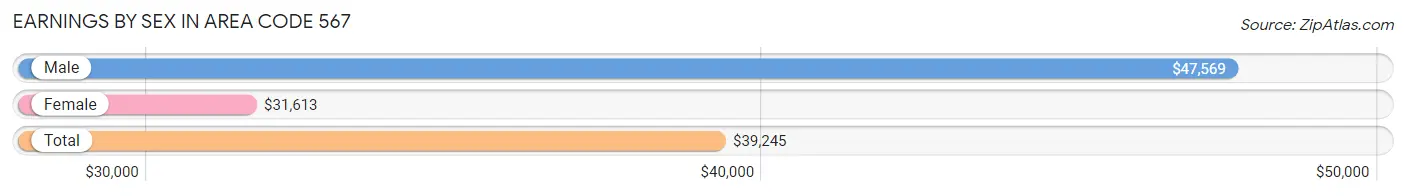
| Sex | Number | Average Earnings |
| Male | 316,525 (52.8%) | $47,569 |
| Female | 283,370 (47.2%) | $31,613 |
| Total | 599,895 (100.0%) | $39,245 |
Earnings by Sex by Income Bracket in Area Code 567
The most common earnings brackets in Area Code 567 are $100,000+ for men (38,876 | 12.3%) and $25,000 to $29,999 for women (21,661 | 7.6%).
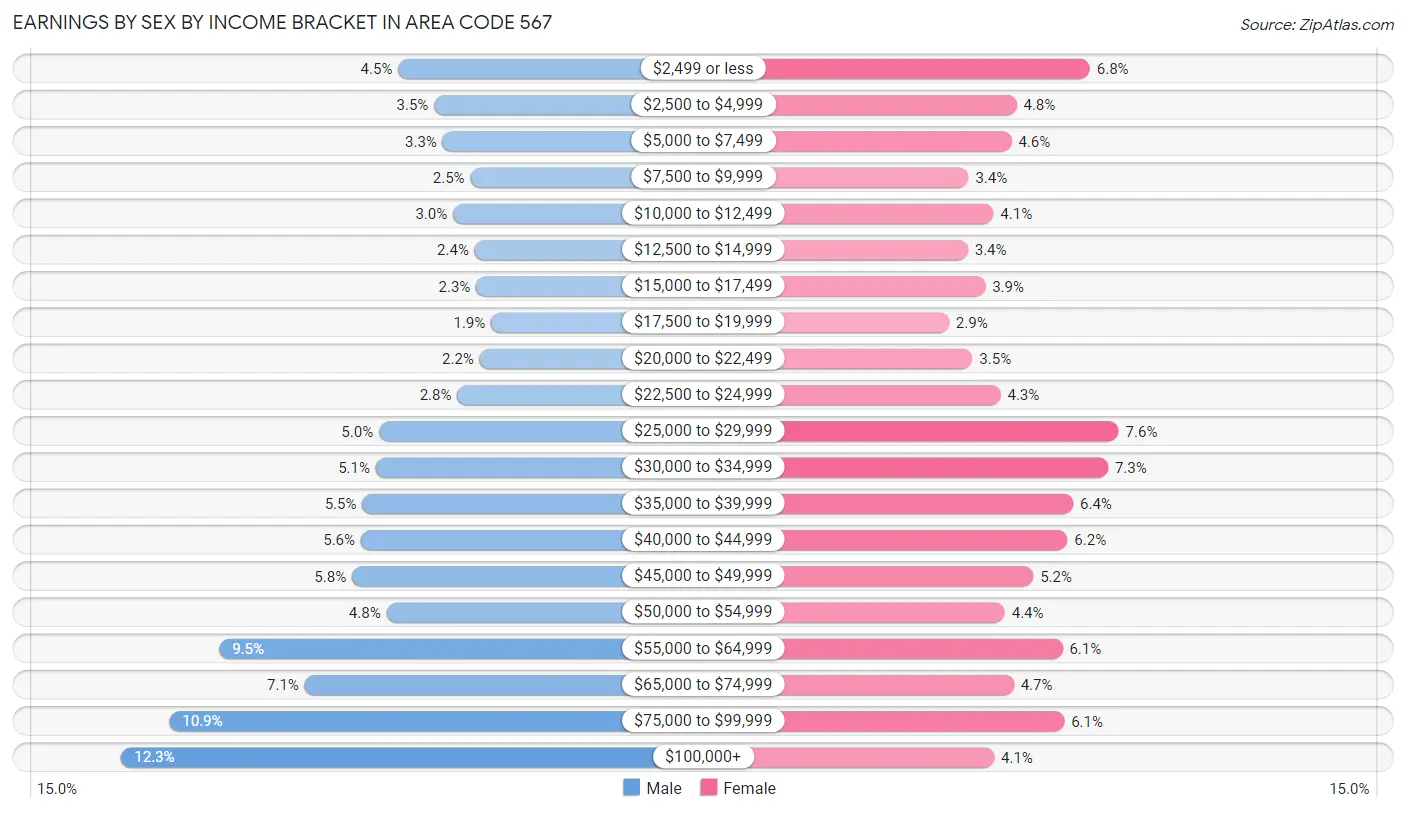
| Income | Male | Female |
| $2,499 or less | 14,251 (4.5%) | 19,364 (6.8%) |
| $2,500 to $4,999 | 11,057 (3.5%) | 13,506 (4.8%) |
| $5,000 to $7,499 | 10,273 (3.3%) | 13,124 (4.6%) |
| $7,500 to $9,999 | 7,827 (2.5%) | 9,691 (3.4%) |
| $10,000 to $12,499 | 9,376 (3.0%) | 11,682 (4.1%) |
| $12,500 to $14,999 | 7,451 (2.4%) | 9,633 (3.4%) |
| $15,000 to $17,499 | 7,307 (2.3%) | 11,015 (3.9%) |
| $17,500 to $19,999 | 5,975 (1.9%) | 8,142 (2.9%) |
| $20,000 to $22,499 | 6,989 (2.2%) | 10,009 (3.5%) |
| $22,500 to $24,999 | 8,982 (2.8%) | 12,238 (4.3%) |
| $25,000 to $29,999 | 15,954 (5.0%) | 21,661 (7.6%) |
| $30,000 to $34,999 | 16,227 (5.1%) | 20,786 (7.3%) |
| $35,000 to $39,999 | 17,441 (5.5%) | 18,017 (6.4%) |
| $40,000 to $44,999 | 17,567 (5.6%) | 17,573 (6.2%) |
| $45,000 to $49,999 | 18,343 (5.8%) | 14,837 (5.2%) |
| $50,000 to $54,999 | 15,295 (4.8%) | 12,569 (4.4%) |
| $55,000 to $64,999 | 30,151 (9.5%) | 17,178 (6.1%) |
| $65,000 to $74,999 | 22,578 (7.1%) | 13,283 (4.7%) |
| $75,000 to $99,999 | 34,605 (10.9%) | 17,328 (6.1%) |
| $100,000+ | 38,876 (12.3%) | 11,734 (4.1%) |
| Total | 316,525 (100.0%) | 283,370 (100.0%) |
Earnings by Sex by Educational Attainment in Area Code 567
Average earnings in Area Code 567 are $6,370,742 for men and $4,209,036 for women, a difference of 33.9%. Men with an educational attainment of bachelor's degree enjoy the highest average annual earnings of $7,212,859, while those with less than high school education earn the least with $3,138,366. Women with an educational attainment of graduate degree earn the most with the average annual earnings of $6,036,138, while those with less than high school education have the smallest earnings of $1,116,043.
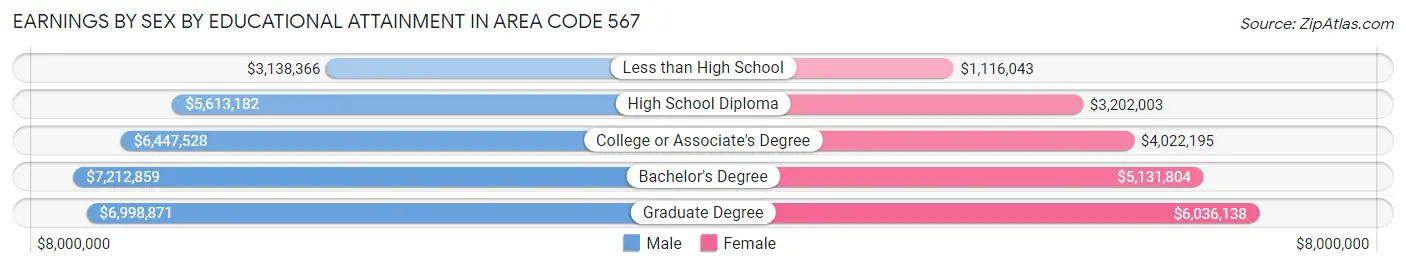
| Educational Attainment | Male Income | Female Income |
| Less than High School | $3,138,366 | $1,116,043 |
| High School Diploma | $5,613,182 | $3,202,003 |
| College or Associate's Degree | $6,447,528 | $4,022,195 |
| Bachelor's Degree | $7,212,859 | $5,131,804 |
| Graduate Degree | $6,998,871 | $6,036,138 |
| Total | $6,370,742 | $4,209,036 |
Family Income in Area Code 567
Family Income Brackets in Area Code 567
According to the Area Code 567 family income data, there are 7,959,602 families falling into the $100,000 to $149,999 income range, which is the most common income bracket and makes up 2,771.7% of all families. Conversely, the $10,000 to $14,999 income bracket is the least frequent group with only 603,927 families (210.3%) belonging to this category.
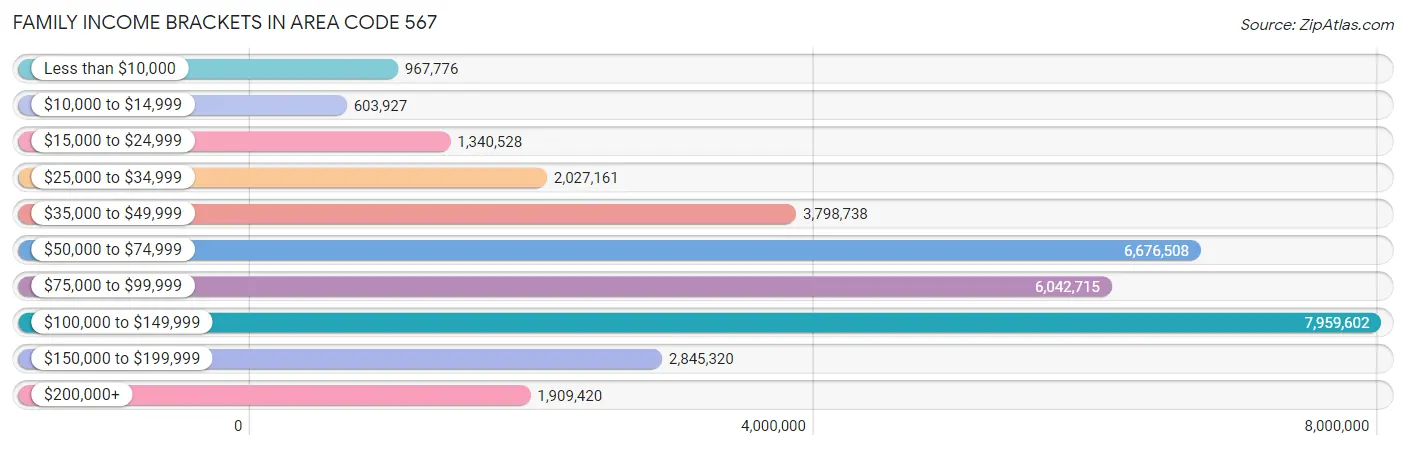
| Income Bracket | # Families | % Families |
| Less than $10,000 | 967,776 | 337.0% |
| $10,000 to $14,999 | 603,927 | 210.3% |
| $15,000 to $24,999 | 1,340,528 | 466.8% |
| $25,000 to $34,999 | 2,027,161 | 705.9% |
| $35,000 to $49,999 | 3,798,738 | 1,322.8% |
| $50,000 to $74,999 | 6,676,508 | 2,324.9% |
| $75,000 to $99,999 | 6,042,715 | 2,104.2% |
| $100,000 to $149,999 | 7,959,602 | 2,771.7% |
| $150,000 to $199,999 | 2,845,320 | 990.8% |
| $200,000+ | 1,909,420 | 664.9% |
Family Income by Famaliy Size in Area Code 567
6-person families (7,545 | 2.6%) account for the highest median family income in Area Code 567 with $111,154 per family, while 2-person families (151,443 | 52.7%) have the highest median income of $35,260 per family member.
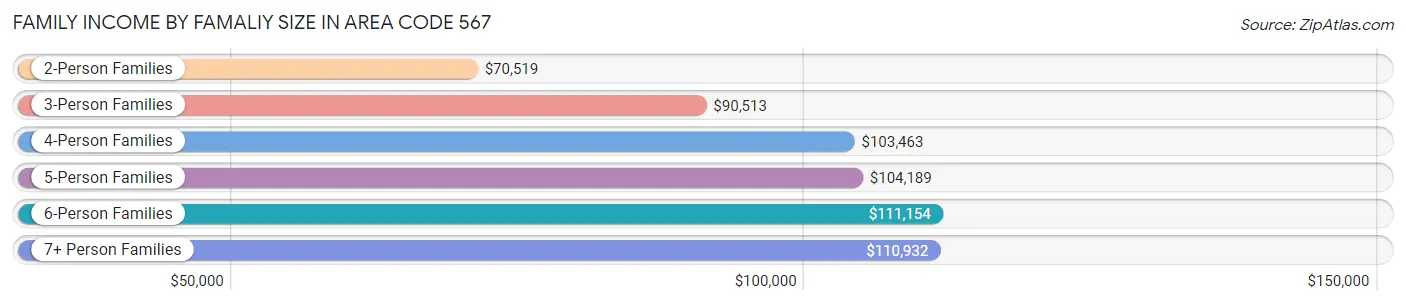
| Income Bracket | # Families | Median Income |
| 2-Person Families | 151,443 (52.7%) | $70,519 |
| 3-Person Families | 56,407 (19.6%) | $90,513 |
| 4-Person Families | 46,452 (16.2%) | $103,463 |
| 5-Person Families | 21,388 (7.4%) | $104,189 |
| 6-Person Families | 7,545 (2.6%) | $111,154 |
| 7+ Person Families | 3,939 (1.4%) | $110,932 |
| Total | 287,174 (100.0%) | $81,749 |
Family Income by Number of Earners in Area Code 567
The median family income in Area Code 567 is $81,749, with families comprising 3+ earners (30,876) having the highest median family income of $133,359, while families with no earners (47,041) have the lowest median family income of $49,586, accounting for 10.7% and 16.4% of families, respectively.
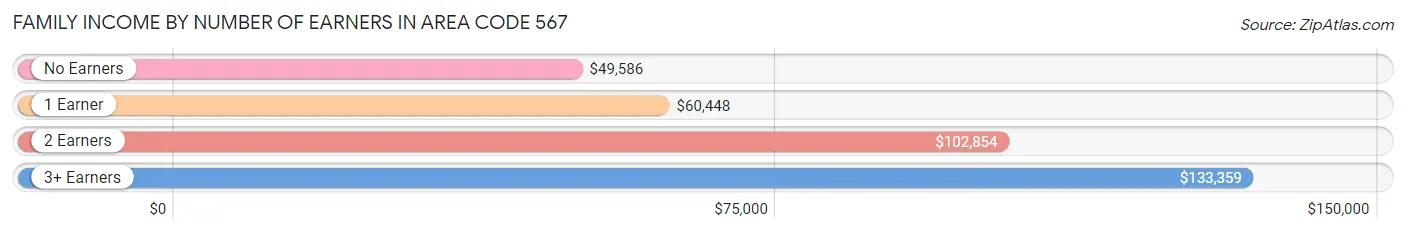
| Number of Earners | # Families | Median Income |
| No Earners | 47,041 (16.4%) | $49,586 |
| 1 Earner | 94,025 (32.7%) | $60,448 |
| 2 Earners | 115,232 (40.1%) | $102,854 |
| 3+ Earners | 30,876 (10.7%) | $133,359 |
| Total | 287,174 (100.0%) | $81,749 |
Household Income in Area Code 567
Household Income Brackets in Area Code 567
With 10,578,747 households falling in the category, the $50,000 to $74,999 income range is the most frequent in Area Code 567, accounting for 2,263.4% of all households. In contrast, only 2,096,213 households (448.5%) fall into the $10,000 to $14,999 income bracket, making it the least populous group.
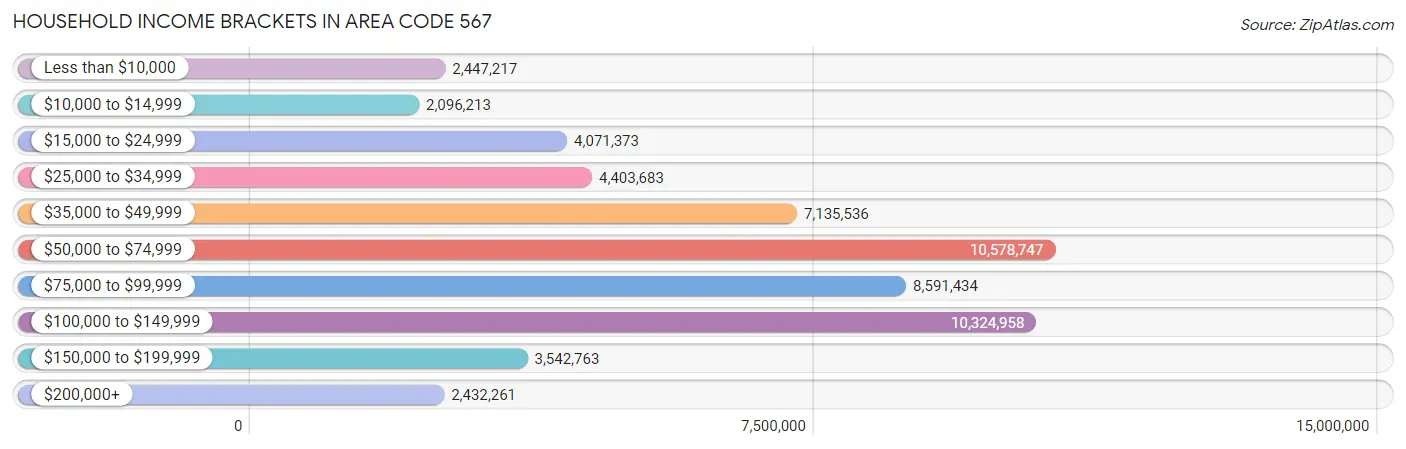
| Income Bracket | # Households | % Households |
| Less than $10,000 | 2,447,217 | 523.6% |
| $10,000 to $14,999 | 2,096,213 | 448.5% |
| $15,000 to $24,999 | 4,071,373 | 871.1% |
| $25,000 to $34,999 | 4,403,683 | 942.2% |
| $35,000 to $49,999 | 7,135,536 | 1,526.7% |
| $50,000 to $74,999 | 10,578,747 | 2,263.4% |
| $75,000 to $99,999 | 8,591,434 | 1,838.2% |
| $100,000 to $149,999 | 10,324,958 | 2,209.1% |
| $150,000 to $199,999 | 3,542,763 | 758.0% |
| $200,000+ | 2,432,261 | 520.4% |
Household Income by Householder Age in Area Code 567
The median household income in Area Code 567 is $68,229, with the highest median household income of $81,611 found in the 25 to 44 years age bracket for the primary householder. A total of 138,289 households (29.6%) fall into this category. Meanwhile, the 65+ years age bracket for the primary householder has the lowest median household income of $48,715, with 134,717 households (28.8%) in this group.
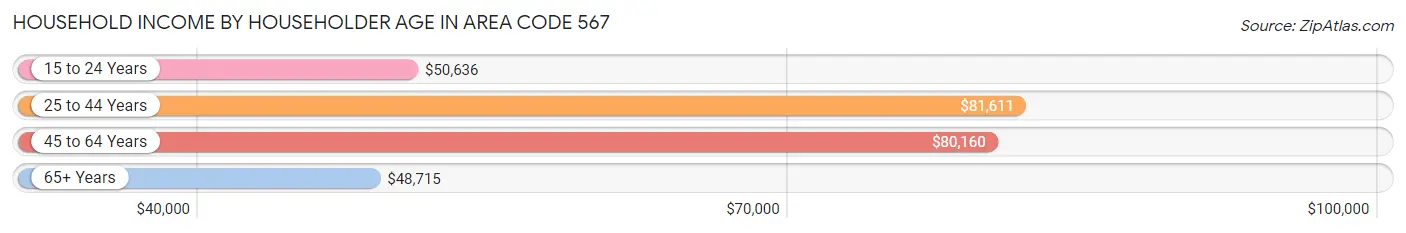
| Income Bracket | # Households | Median Income |
| 15 to 24 Years | 24,628 (5.3%) | $50,636 |
| 25 to 44 Years | 138,289 (29.6%) | $81,611 |
| 45 to 64 Years | 169,749 (36.3%) | $80,160 |
| 65+ Years | 134,717 (28.8%) | $48,715 |
| Total | 467,383 (100.0%) | $68,229 |
Poverty in Area Code 567
Income Below Poverty by Sex and Age in Area Code 567
With 11.9% poverty level for males and 15.0% for females among the residents of Area Code 567, 5 year old males and 18 to 24 year old females are the most vulnerable to poverty, with 1,394 males (21.2%) and 12,552 females (26.1%) in their respective age groups living below the poverty level.
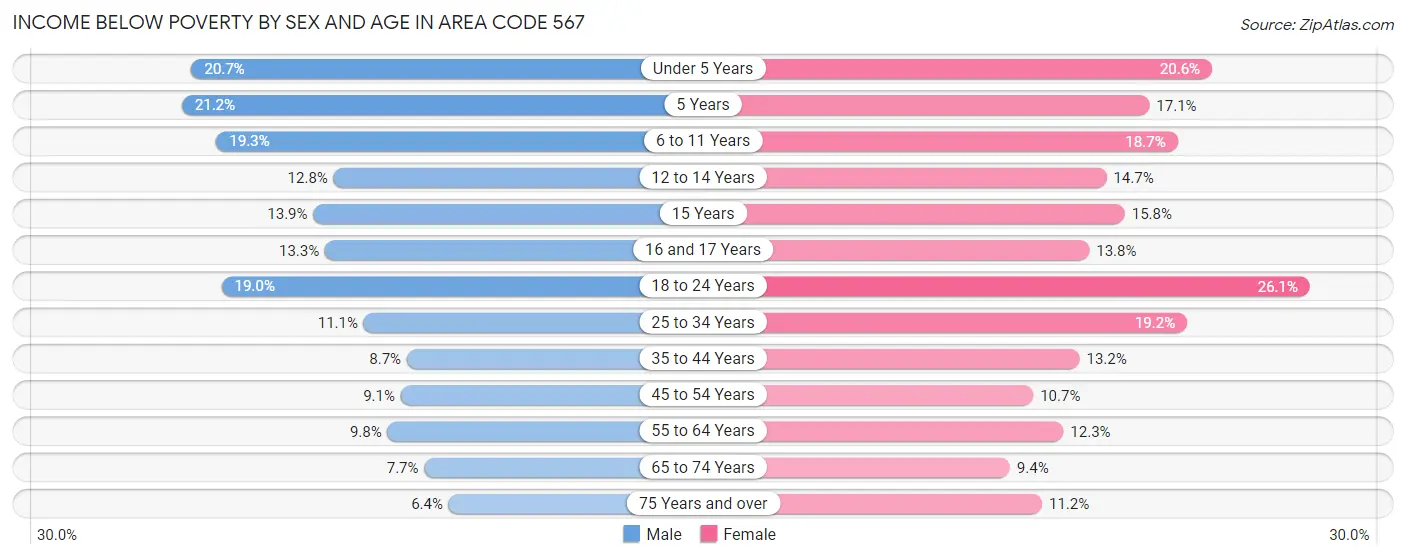
| Age Bracket | Male | Female |
| Under 5 Years | 6,426 (20.7%) | 6,542 (20.6%) |
| 5 Years | 1,394 (21.2%) | 1,115 (17.1%) |
| 6 to 11 Years | 8,011 (19.3%) | 7,367 (18.7%) |
| 12 to 14 Years | 3,000 (12.8%) | 2,956 (14.7%) |
| 15 Years | 1,061 (13.9%) | 1,140 (15.8%) |
| 16 and 17 Years | 2,004 (13.3%) | 2,089 (13.8%) |
| 18 to 24 Years | 9,890 (19.0%) | 12,552 (26.1%) |
| 25 to 34 Years | 7,730 (11.1%) | 12,957 (19.2%) |
| 35 to 44 Years | 5,743 (8.7%) | 8,557 (13.2%) |
| 45 to 54 Years | 6,043 (9.0%) | 7,083 (10.7%) |
| 55 to 64 Years | 7,411 (9.8%) | 9,653 (12.3%) |
| 65 to 74 Years | 4,547 (7.7%) | 5,942 (9.4%) |
| 75 Years and over | 2,117 (6.4%) | 5,382 (11.2%) |
| Total | 65,377 (11.9%) | 83,335 (15.0%) |
Income Above Poverty by Sex and Age in Area Code 567
According to the poverty statistics in Area Code 567, males aged 75 years and over and females aged 65 to 74 years are the age groups that are most secure financially, with 93.6% of males and 90.6% of females in these age groups living above the poverty line.
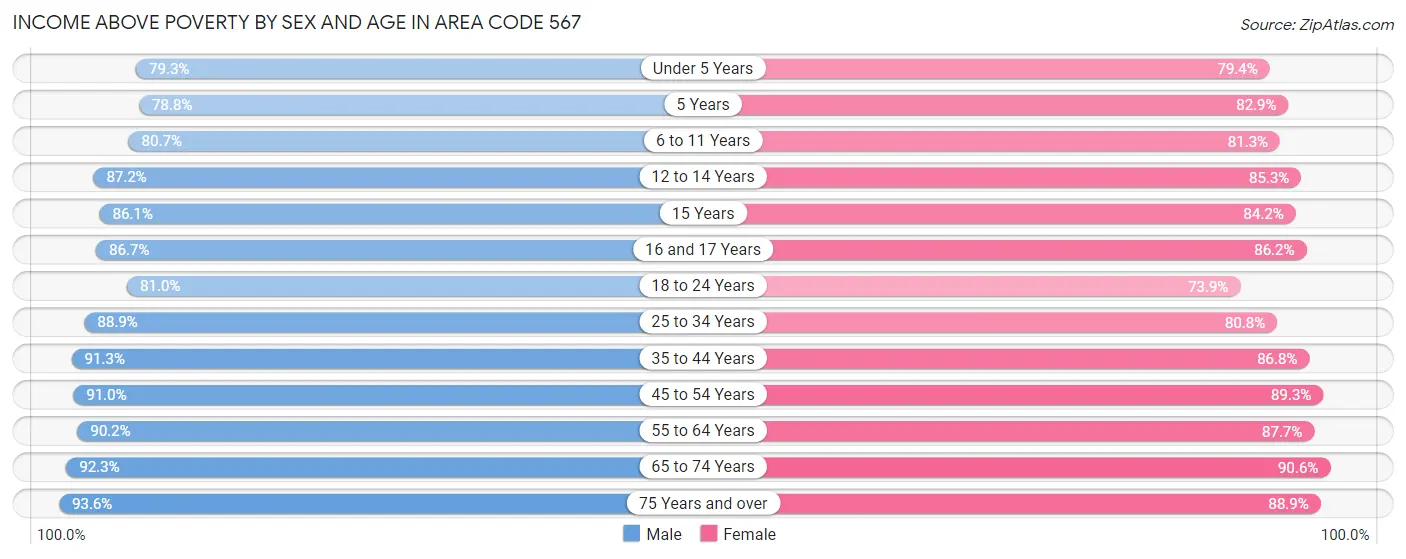
| Age Bracket | Male | Female |
| Under 5 Years | 24,596 (79.3%) | 25,195 (79.4%) |
| 5 Years | 5,169 (78.8%) | 5,394 (82.9%) |
| 6 to 11 Years | 33,448 (80.7%) | 32,049 (81.3%) |
| 12 to 14 Years | 20,448 (87.2%) | 17,103 (85.3%) |
| 15 Years | 6,562 (86.1%) | 6,095 (84.2%) |
| 16 and 17 Years | 13,098 (86.7%) | 13,074 (86.2%) |
| 18 to 24 Years | 42,084 (81.0%) | 35,612 (73.9%) |
| 25 to 34 Years | 61,863 (88.9%) | 54,471 (80.8%) |
| 35 to 44 Years | 60,209 (91.3%) | 56,069 (86.8%) |
| 45 to 54 Years | 60,697 (90.9%) | 59,387 (89.3%) |
| 55 to 64 Years | 68,305 (90.2%) | 68,555 (87.7%) |
| 65 to 74 Years | 54,163 (92.3%) | 57,522 (90.6%) |
| 75 Years and over | 31,088 (93.6%) | 42,905 (88.8%) |
| Total | 481,730 (88.0%) | 473,431 (85.0%) |
Income Below Poverty Among Married-Couple Families in Area Code 567
The poverty statistics for married-couple families in Area Code 567 show that 3.5% or 7,314 of the total 211,188 families live below the poverty line. Families with 5 or more children have the highest poverty rate of 24.4%, comprising of 502 families. On the other hand, families with no children have the lowest poverty rate of 3.0%, which includes 3,937 families.
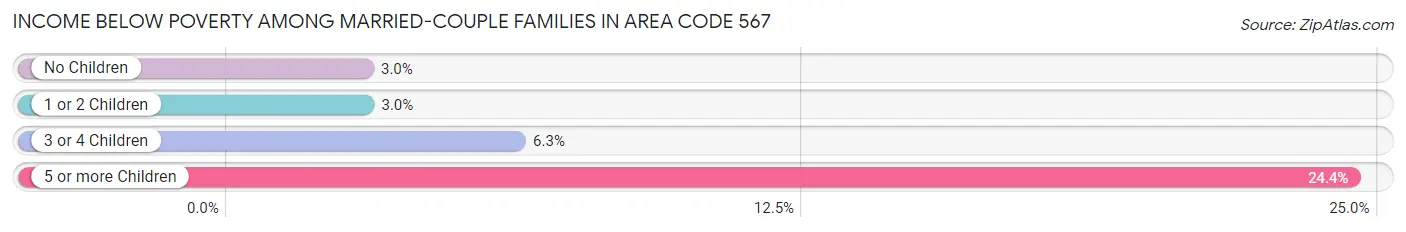
| Children | Above Poverty | Below Poverty |
| No Children | 129,122 (97.0%) | 3,937 (3.0%) |
| 1 or 2 Children | 55,747 (97.0%) | 1,707 (3.0%) |
| 3 or 4 Children | 17,451 (93.7%) | 1,168 (6.3%) |
| 5 or more Children | 1,554 (75.6%) | 502 (24.4%) |
| Total | 203,874 (96.5%) | 7,314 (3.5%) |
Income Below Poverty Among Single-Parent Households in Area Code 567
According to the poverty data in Area Code 567, 11.8% or 2,695 single-father households and 29.4% or 15,607 single-mother households are living below the poverty line. Among single-father households, those with 3 or 4 children have the highest poverty rate, with 408 households (20.7%) experiencing poverty. Likewise, among single-mother households, those with 5 or more children have the highest poverty rate, with 403 households (73.3%) falling below the poverty line.
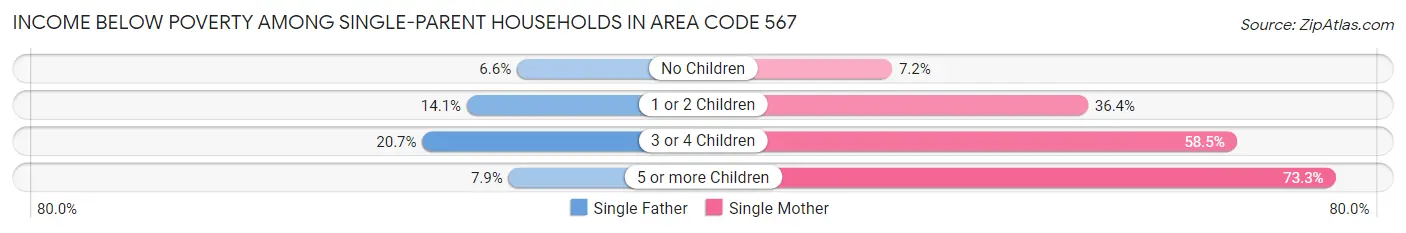
| Children | Single Father | Single Mother |
| No Children | 582 (6.6%) | 1,327 (7.2%) |
| 1 or 2 Children | 1,699 (14.1%) | 10,017 (36.4%) |
| 3 or 4 Children | 408 (20.7%) | 3,860 (58.5%) |
| 5 or more Children | 6 (7.9%) | 403 (73.3%) |
| Total | 2,695 (11.8%) | 15,607 (29.4%) |
Income Below Poverty Among Married-Couple vs Single-Parent Households in Area Code 567
The poverty data for Area Code 567 shows that 7,314 of the married-couple family households (3.5%) and 18,302 of the single-parent households (24.1%) are living below the poverty level. Within the married-couple family households, those with 5 or more children have the highest poverty rate, with 502 households (24.4%) falling below the poverty line. Among the single-parent households, those with 5 or more children have the highest poverty rate, with 409 household (65.3%) living below poverty.
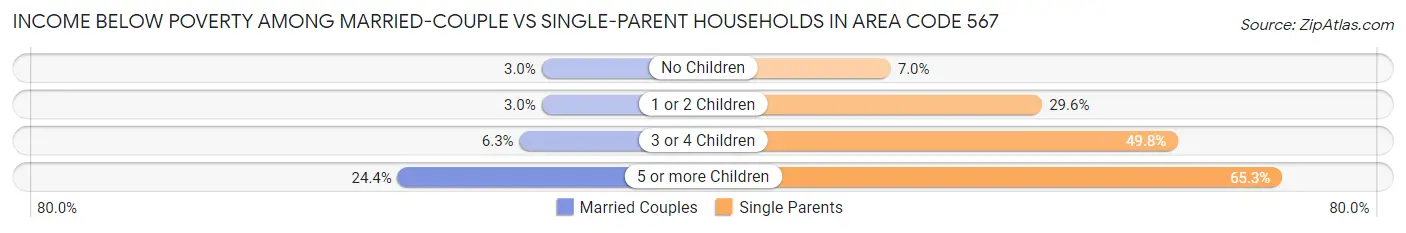
| Children | Married-Couple Families | Single-Parent Households |
| No Children | 3,937 (3.0%) | 1,909 (7.0%) |
| 1 or 2 Children | 1,707 (3.0%) | 11,716 (29.6%) |
| 3 or 4 Children | 1,168 (6.3%) | 4,268 (49.8%) |
| 5 or more Children | 502 (24.4%) | 409 (65.3%) |
| Total | 7,314 (3.5%) | 18,302 (24.1%) |
Race in Area Code 567
The most populous races in Area Code 567 are White / Caucasian (959,951 | 84.9%), Black / African American (81,124 | 7.2%), and Hispanic or Latino (65,105 | 5.8%).
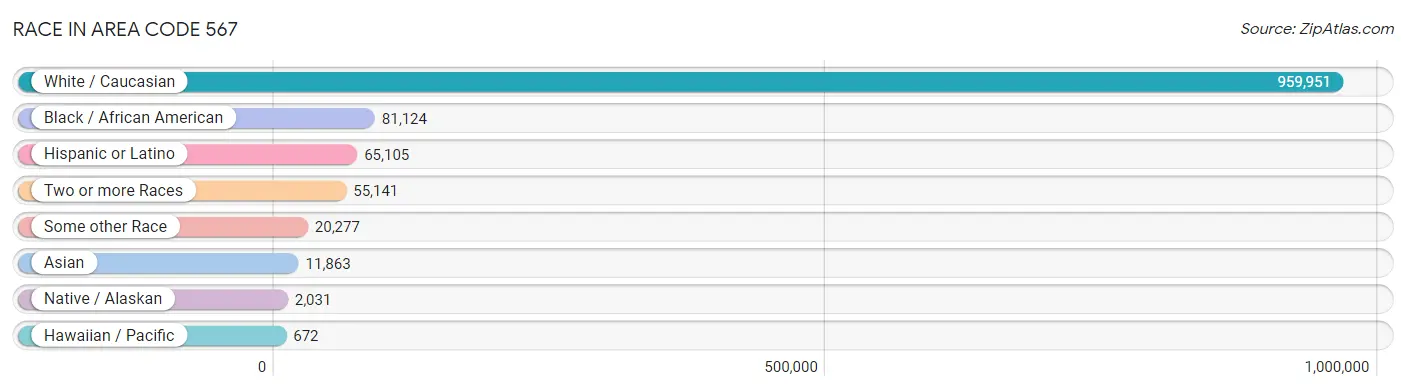
| Race | # Population | % Population |
| Asian | 11,863 | 1.1% |
| Black / African American | 81,124 | 7.2% |
| Hawaiian / Pacific | 672 | 0.1% |
| Hispanic or Latino | 65,105 | 5.8% |
| Native / Alaskan | 2,031 | 0.2% |
| White / Caucasian | 959,951 | 84.9% |
| Two or more Races | 55,141 | 4.9% |
| Some other Race | 20,277 | 1.8% |
| Total | 1,131,059 | 100.0% |
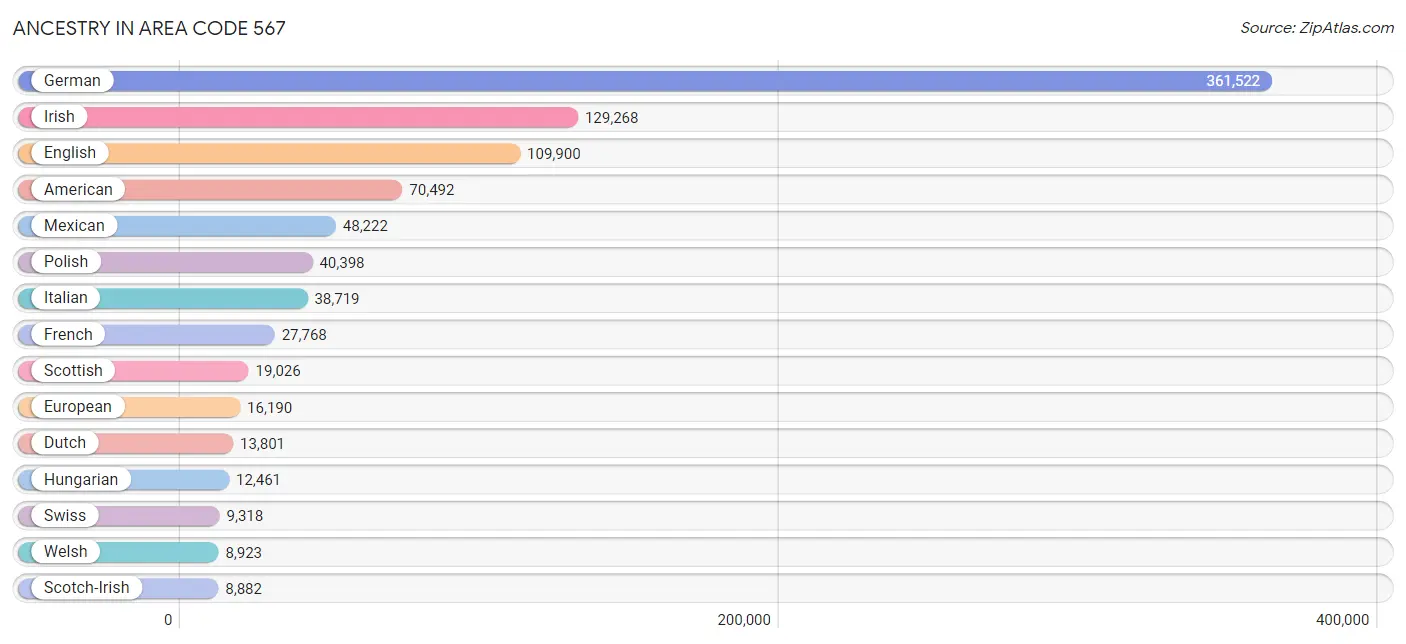
Ancestry in Area Code 567
The most populous ancestries reported in Area Code 567 are German (361,522 | 32.0%), Irish (129,268 | 11.4%), English (109,900 | 9.7%), American (70,492 | 6.2%), and Mexican (48,222 | 4.3%), together accounting for 63.6% of all Area Code 567 residents.
| Ancestry | # Population | % Population |
| Afghan | 105 | 0.0% |
| African | 5,704 | 0.5% |
| Alaska Native | 20 | 0.0% |
| Alaskan Athabascan | 13 | 0.0% |
| Albanian | 72 | 0.0% |
| Alsatian | 88 | 0.0% |
| American | 70,492 | 6.2% |
| Apache | 233 | 0.0% |
| Arab | 5,215 | 0.5% |
| Arapaho | 28 | 0.0% |
| Argentinean | 186 | 0.0% |
| Armenian | 187 | 0.0% |
| Australian | 174 | 0.0% |
| Austrian | 1,638 | 0.1% |
| Bangladeshi | 5 | 0.0% |
| Barbadian | 50 | 0.0% |
| Basque | 5 | 0.0% |
| Belgian | 1,760 | 0.2% |
| Belizean | 20 | 0.0% |
| Bhutanese | 1,495 | 0.1% |
| Blackfeet | 1,548 | 0.1% |
| Bolivian | 37 | 0.0% |
| Brazilian | 250 | 0.0% |
| British | 5,445 | 0.5% |
| British West Indian | 30 | 0.0% |
| Bulgarian | 197 | 0.0% |
| Burmese | 1,953 | 0.2% |
| Cajun | 19 | 0.0% |
| Cambodian | 28 | 0.0% |
| Canadian | 1,145 | 0.1% |
| Carpatho Rusyn | 29 | 0.0% |
| Celtic | 391 | 0.0% |
| Central American | 1,954 | 0.2% |
| Central American Indian | 363 | 0.0% |
| Cherokee | 3,295 | 0.3% |
| Chickasaw | 33 | 0.0% |
| Chilean | 75 | 0.0% |
| Chippewa | 284 | 0.0% |
| Choctaw | 157 | 0.0% |
| Colombian | 638 | 0.1% |
| Comanche | 31 | 0.0% |
| Costa Rican | 208 | 0.0% |
| Creek | 5 | 0.0% |
| Croatian | 816 | 0.1% |
| Crow | 9 | 0.0% |
| Cuban | 977 | 0.1% |
| Cypriot | 58 | 0.0% |
| Czech | 4,222 | 0.4% |
| Czechoslovakian | 1,787 | 0.2% |
| Danish | 1,532 | 0.1% |
| Delaware | 70 | 0.0% |
| Dominican | 286 | 0.0% |
| Dutch | 13,801 | 1.2% |
| Eastern European | 2,762 | 0.2% |
| Ecuadorian | 139 | 0.0% |
| Egyptian | 460 | 0.0% |
| English | 109,900 | 9.7% |
| Estonian | 18 | 0.0% |
| Ethiopian | 134 | 0.0% |
| European | 16,190 | 1.4% |
| Fijian | 210 | 0.0% |
| Filipino | 158 | 0.0% |
| Finnish | 930 | 0.1% |
| French | 27,768 | 2.5% |
| French American Indian | 107 | 0.0% |
| French Canadian | 4,105 | 0.4% |
| German | 361,522 | 32.0% |
| German Russian | 107 | 0.0% |
| Ghanaian | 190 | 0.0% |
| Greek | 3,277 | 0.3% |
| Guamanian / Chamorro | 124 | 0.0% |
| Guatemalan | 541 | 0.1% |
| Guyanese | 88 | 0.0% |
| Haitian | 103 | 0.0% |
| Honduran | 396 | 0.0% |
| Hopi | 2 | 0.0% |
| Hungarian | 12,461 | 1.1% |
| Icelander | 48 | 0.0% |
| Indian (Asian) | 3,617 | 0.3% |
| Indonesian | 50 | 0.0% |
| Inupiat | 10 | 0.0% |
| Iranian | 266 | 0.0% |
| Iraqi | 166 | 0.0% |
| Irish | 129,268 | 11.4% |
| Iroquois | 333 | 0.0% |
| Israeli | 74 | 0.0% |
| Italian | 38,719 | 3.4% |
| Jamaican | 678 | 0.1% |
| Japanese | 187 | 0.0% |
| Jordanian | 377 | 0.0% |
| Kenyan | 151 | 0.0% |
| Korean | 2,553 | 0.2% |
| Laotian | 113 | 0.0% |
| Latvian | 194 | 0.0% |
| Lebanese | 2,140 | 0.2% |
| Liberian | 342 | 0.0% |
| Lithuanian | 705 | 0.1% |
| Lumbee | 29 | 0.0% |
| Luxembourger | 169 | 0.0% |
| Macedonian | 230 | 0.0% |
| Malaysian | 689 | 0.1% |
| Maltese | 27 | 0.0% |
| Menominee | 21 | 0.0% |
| Mexican | 48,222 | 4.3% |
| Mexican American Indian | 355 | 0.0% |
| Mongolian | 47 | 0.0% |
| Moroccan | 69 | 0.0% |
| Native Hawaiian | 501 | 0.0% |
| Navajo | 96 | 0.0% |
| New Zealander | 76 | 0.0% |
| Nicaraguan | 218 | 0.0% |
| Nigerian | 334 | 0.0% |
| Northern European | 905 | 0.1% |
| Norwegian | 4,388 | 0.4% |
| Osage | 47 | 0.0% |
| Ottawa | 37 | 0.0% |
| Pakistani | 386 | 0.0% |
| Palestinian | 155 | 0.0% |
| Panamanian | 157 | 0.0% |
| Paraguayan | 45 | 0.0% |
| Pennsylvania German | 1,823 | 0.2% |
| Peruvian | 389 | 0.0% |
| Polish | 40,398 | 3.6% |
| Portuguese | 842 | 0.1% |
| Potawatomi | 37 | 0.0% |
| Pueblo | 44 | 0.0% |
| Puerto Rican | 7,576 | 0.7% |
| Romanian | 923 | 0.1% |
| Russian | 3,299 | 0.3% |
| Salvadoran | 434 | 0.0% |
| Samoan | 127 | 0.0% |
| Scandinavian | 1,870 | 0.2% |
| Scotch-Irish | 8,882 | 0.8% |
| Scottish | 19,026 | 1.7% |
| Seminole | 49 | 0.0% |
| Serbian | 536 | 0.1% |
| Shoshone | 19 | 0.0% |
| Sierra Leonean | 47 | 0.0% |
| Sioux | 192 | 0.0% |
| Slavic | 264 | 0.0% |
| Slovak | 3,273 | 0.3% |
| Slovene | 599 | 0.1% |
| Somali | 30 | 0.0% |
| South African | 155 | 0.0% |
| South American | 2,166 | 0.2% |
| South American Indian | 40 | 0.0% |
| Spaniard | 817 | 0.1% |
| Spanish | 964 | 0.1% |
| Spanish American | 24 | 0.0% |
| Spanish American Indian | 10 | 0.0% |
| Sri Lankan | 1,157 | 0.1% |
| Subsaharan African | 7,326 | 0.6% |
| Sudanese | 8 | 0.0% |
| Swedish | 5,550 | 0.5% |
| Swiss | 9,318 | 0.8% |
| Syrian | 620 | 0.1% |
| Taiwanese | 55 | 0.0% |
| Thai | 2,810 | 0.3% |
| Tohono O'Odham | 1 | 0.0% |
| Tongan | 13 | 0.0% |
| Trinidadian and Tobagonian | 109 | 0.0% |
| Turkish | 339 | 0.0% |
| U.S. Virgin Islander | 55 | 0.0% |
| Ugandan | 3 | 0.0% |
| Ukrainian | 2,219 | 0.2% |
| Uruguayan | 28 | 0.0% |
| Ute | 15 | 0.0% |
| Venezuelan | 629 | 0.1% |
| Vietnamese | 33 | 0.0% |
| Welsh | 8,923 | 0.8% |
| West Indian | 272 | 0.0% |
| Yaqui | 39 | 0.0% |
| Yugoslavian | 423 | 0.0% |
| Yup'ik | 4 | 0.0% |
| Zimbabwean | 71 | 0.0% | View All 175 Rows |
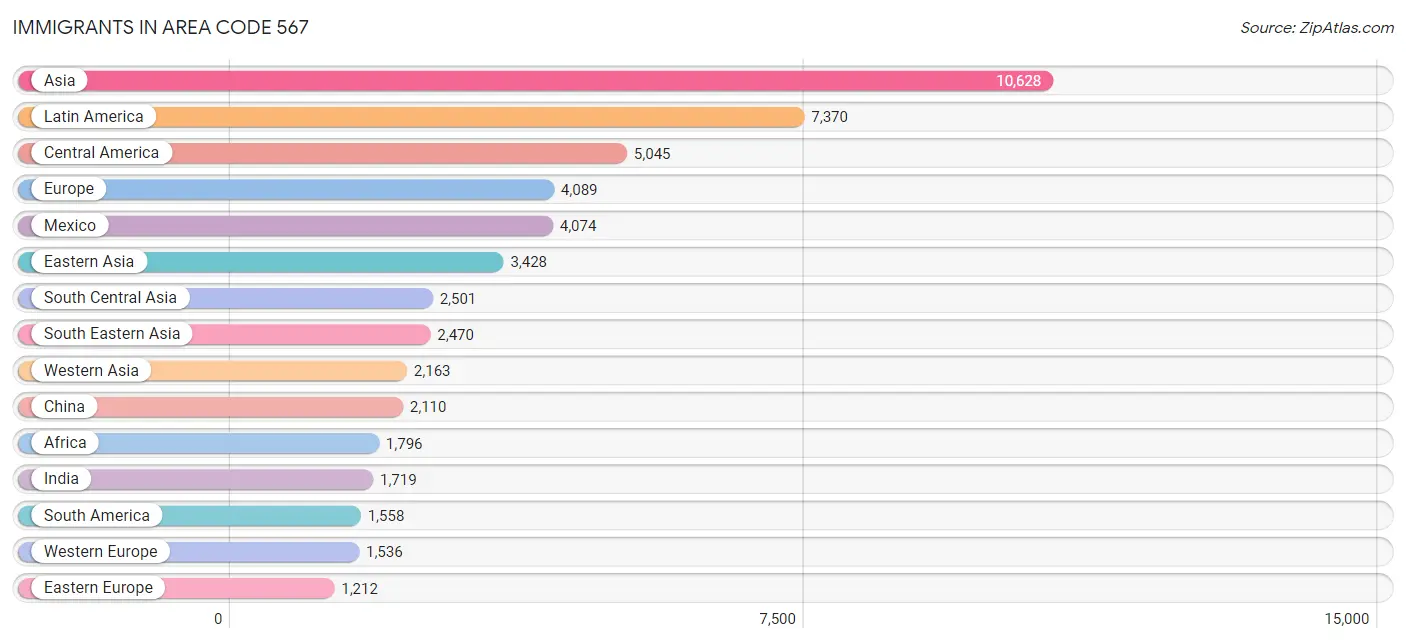
Immigrants in Area Code 567
The most numerous immigrant groups reported in Area Code 567 came from Asia (10,628 | 0.9%), Latin America (7,370 | 0.6%), Central America (5,045 | 0.4%), Europe (4,089 | 0.4%), and Mexico (4,074 | 0.4%), together accounting for 2.8% of all Area Code 567 residents.
| Immigration Origin | # Population | % Population |
| Afghanistan | 91 | 0.0% |
| Africa | 1,796 | 0.2% |
| Albania | 17 | 0.0% |
| Argentina | 117 | 0.0% |
| Armenia | 5 | 0.0% |
| Asia | 10,628 | 0.9% |
| Australia | 122 | 0.0% |
| Austria | 43 | 0.0% |
| Bahamas | 26 | 0.0% |
| Bangladesh | 26 | 0.0% |
| Barbados | 16 | 0.0% |
| Belarus | 27 | 0.0% |
| Belize | 49 | 0.0% |
| Bolivia | 11 | 0.0% |
| Bosnia and Herzegovina | 12 | 0.0% |
| Brazil | 271 | 0.0% |
| Bulgaria | 65 | 0.0% |
| Cambodia | 67 | 0.0% |
| Cameroon | 98 | 0.0% |
| Canada | 963 | 0.1% |
| Caribbean | 767 | 0.1% |
| Central America | 5,045 | 0.4% |
| Chile | 62 | 0.0% |
| China | 2,110 | 0.2% |
| Colombia | 300 | 0.0% |
| Congo | 22 | 0.0% |
| Costa Rica | 113 | 0.0% |
| Croatia | 42 | 0.0% |
| Cuba | 152 | 0.0% |
| Czechoslovakia | 46 | 0.0% |
| Denmark | 9 | 0.0% |
| Dominican Republic | 160 | 0.0% |
| Eastern Africa | 460 | 0.0% |
| Eastern Asia | 3,428 | 0.3% |
| Eastern Europe | 1,212 | 0.1% |
| Ecuador | 86 | 0.0% |
| Egypt | 130 | 0.0% |
| El Salvador | 218 | 0.0% |
| England | 311 | 0.0% |
| Eritrea | 15 | 0.0% |
| Ethiopia | 73 | 0.0% |
| Europe | 4,089 | 0.4% |
| Fiji | 38 | 0.0% |
| France | 108 | 0.0% |
| Germany | 1,198 | 0.1% |
| Ghana | 168 | 0.0% |
| Greece | 124 | 0.0% |
| Guatemala | 282 | 0.0% |
| Guyana | 74 | 0.0% |
| Haiti | 79 | 0.0% |
| Honduras | 119 | 0.0% |
| Hong Kong | 119 | 0.0% |
| Hungary | 31 | 0.0% |
| India | 1,719 | 0.2% |
| Indonesia | 91 | 0.0% |
| Iran | 199 | 0.0% |
| Iraq | 271 | 0.0% |
| Ireland | 69 | 0.0% |
| Israel | 16 | 0.0% |
| Italy | 245 | 0.0% |
| Jamaica | 177 | 0.0% |
| Japan | 531 | 0.1% |
| Jordan | 228 | 0.0% |
| Kazakhstan | 32 | 0.0% |
| Kenya | 119 | 0.0% |
| Korea | 756 | 0.1% |
| Kuwait | 78 | 0.0% |
| Laos | 266 | 0.0% |
| Latin America | 7,370 | 0.6% |
| Lebanon | 502 | 0.0% |
| Liberia | 231 | 0.0% |
| Malaysia | 110 | 0.0% |
| Mexico | 4,074 | 0.4% |
| Middle Africa | 161 | 0.0% |
| Moldova | 11 | 0.0% |
| Morocco | 67 | 0.0% |
| Nepal | 76 | 0.0% |
| Netherlands | 167 | 0.0% |
| Nicaragua | 170 | 0.0% |
| Nigeria | 194 | 0.0% |
| North Macedonia | 13 | 0.0% |
| Northern Africa | 412 | 0.0% |
| Northern Europe | 790 | 0.1% |
| Oceania | 339 | 0.0% |
| Pakistan | 276 | 0.0% |
| Panama | 20 | 0.0% |
| Peru | 187 | 0.0% |
| Philippines | 1,103 | 0.1% |
| Poland | 128 | 0.0% |
| Portugal | 105 | 0.0% |
| Romania | 187 | 0.0% |
| Russia | 232 | 0.0% |
| Saudi Arabia | 504 | 0.0% |
| Scotland | 59 | 0.0% |
| Senegal | 19 | 0.0% |
| Serbia | 13 | 0.0% |
| Sierra Leone | 68 | 0.0% |
| Somalia | 30 | 0.0% |
| South Africa | 77 | 0.0% |
| South America | 1,558 | 0.1% |
| South Central Asia | 2,501 | 0.2% |
| South Eastern Asia | 2,470 | 0.2% |
| Southern Europe | 551 | 0.1% |
| Spain | 53 | 0.0% |
| Sri Lanka | 82 | 0.0% |
| Sudan | 161 | 0.0% |
| Sweden | 69 | 0.0% |
| Switzerland | 20 | 0.0% |
| Syria | 382 | 0.0% |
| Taiwan | 207 | 0.0% |
| Thailand | 293 | 0.0% |
| Trinidad and Tobago | 87 | 0.0% |
| Turkey | 143 | 0.0% |
| Uganda | 42 | 0.0% |
| Ukraine | 227 | 0.0% |
| Uruguay | 15 | 0.0% |
| Venezuela | 383 | 0.0% |
| Vietnam | 527 | 0.1% |
| Western Africa | 686 | 0.1% |
| Western Asia | 2,163 | 0.2% |
| Western Europe | 1,536 | 0.1% |
| Zaire | 41 | 0.0% |
| Zimbabwe | 91 | 0.0% | View All 123 Rows |
Sex and Age in Area Code 567
Sex and Age in Area Code 567
The most populous age groups in Area Code 567 are 20 to 24 Years (40,253 | 7.2%) for men and 60 to 64 Years (39,962 | 7.0%) for women.
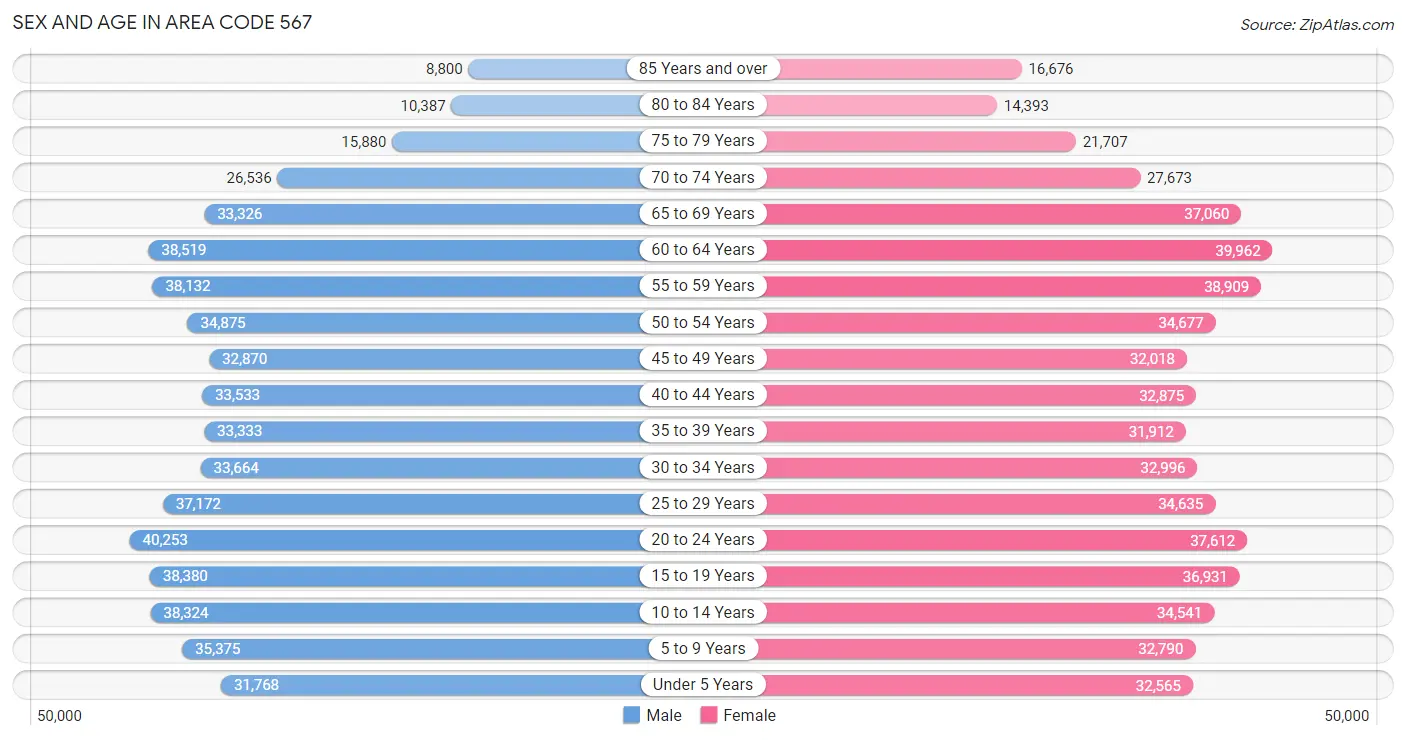
| Age Bracket | Male | Female |
| Under 5 Years | 31,768 (5.7%) | 32,565 (5.7%) |
| 5 to 9 Years | 35,375 (6.3%) | 32,790 (5.8%) |
| 10 to 14 Years | 38,324 (6.8%) | 34,541 (6.1%) |
| 15 to 19 Years | 38,380 (6.8%) | 36,931 (6.5%) |
| 20 to 24 Years | 40,253 (7.2%) | 37,612 (6.6%) |
| 25 to 29 Years | 37,172 (6.6%) | 34,635 (6.1%) |
| 30 to 34 Years | 33,664 (6.0%) | 32,996 (5.8%) |
| 35 to 39 Years | 33,333 (5.9%) | 31,912 (5.6%) |
| 40 to 44 Years | 33,533 (6.0%) | 32,875 (5.8%) |
| 45 to 49 Years | 32,870 (5.9%) | 32,018 (5.6%) |
| 50 to 54 Years | 34,875 (6.2%) | 34,677 (6.1%) |
| 55 to 59 Years | 38,132 (6.8%) | 38,909 (6.8%) |
| 60 to 64 Years | 38,519 (6.9%) | 39,962 (7.0%) |
| 65 to 69 Years | 33,326 (5.9%) | 37,060 (6.5%) |
| 70 to 74 Years | 26,536 (4.7%) | 27,673 (4.9%) |
| 75 to 79 Years | 15,880 (2.8%) | 21,707 (3.8%) |
| 80 to 84 Years | 10,387 (1.8%) | 14,393 (2.5%) |
| 85 Years and over | 8,800 (1.6%) | 16,676 (2.9%) |
| Total | 561,127 (100.0%) | 569,932 (100.0%) |
Families and Households in Area Code 567
Median Family Size in Area Code 567
The median family size in Area Code 567 is 3.01 persons per family, with married-couple families (211,188 | 73.5%) accounting for the largest median family size of 3.04478 persons per family. On the other hand, single male/father families (22,884 | 8.0%) represent the smallest median family size with 2.78 persons per family.
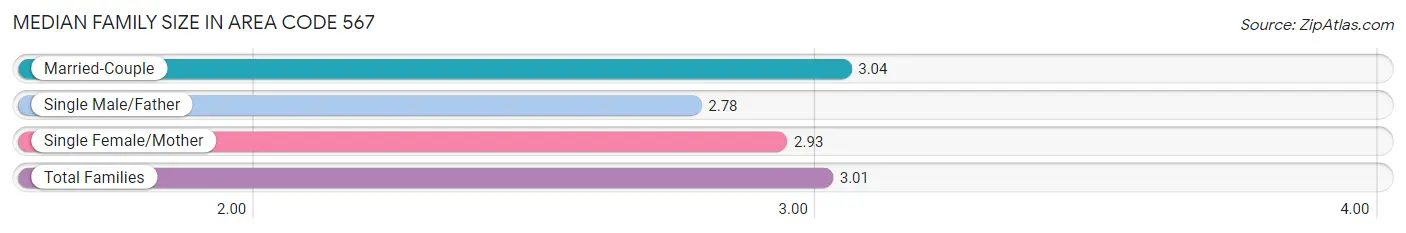
| Family Type | # Families | Family Size |
| Married-Couple | 211,188 (73.5%) | 3.04 |
| Single Male/Father | 22,884 (8.0%) | 2.78 |
| Single Female/Mother | 53,102 (18.5%) | 2.93 |
| Total Families | 287,174 (100.0%) | 3.01 |
Median Household Size in Area Code 567
The median household size in Area Code 567 is 2.48 persons per household, with single male/father households (22,884 | 4.9%) accounting for the largest median household size of 3.24211 persons per household. non-family households (180,209 | 38.6%) represent the smallest median household size with 1.22 persons per household.
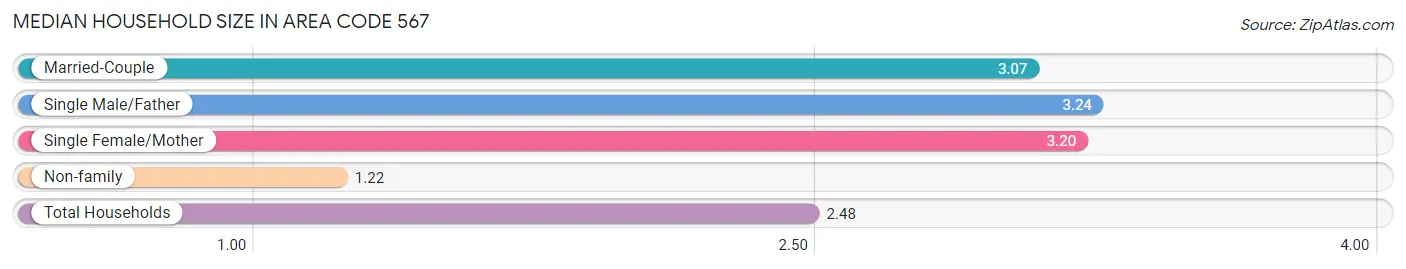
| Household Type | # Households | Household Size |
| Married-Couple | 211,188 (45.2%) | 3.07 |
| Single Male/Father | 22,884 (4.9%) | 3.24 |
| Single Female/Mother | 53,102 (11.4%) | 3.20 |
| Non-family | 180,209 (38.6%) | 1.22 |
| Total Households | 467,383 (100.0%) | 2.48 |
Household Size by Marriage Status in Area Code 567
Out of a total of 467,383 households in Area Code 567, 287,174 (61.4%) are family households, while 180,209 (38.6%) are nonfamily households. The most numerous type of family households are 2-person households, comprising 140,576, and the most common type of nonfamily households are 1-person households, comprising 148,394.
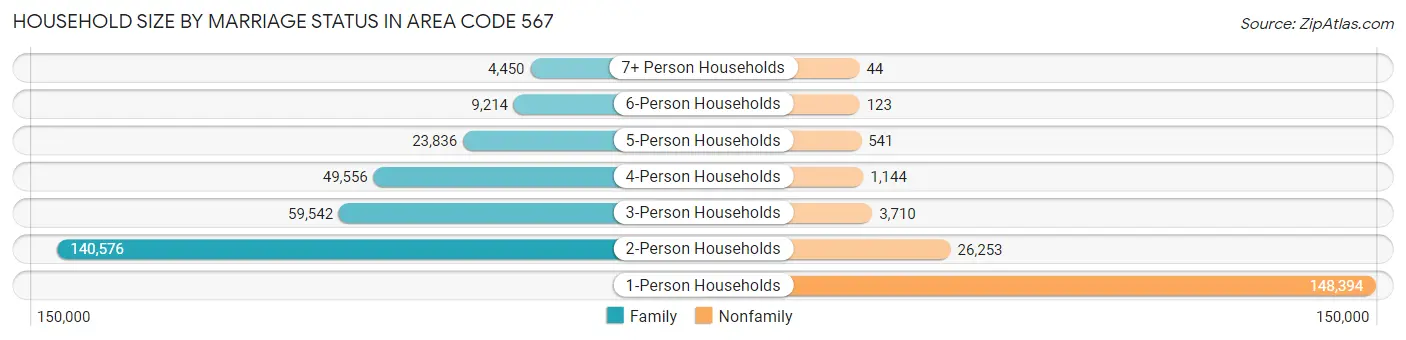
| Household Size | Family Households | Nonfamily Households |
| 1-Person Households | - | 148,394 (31.8%) |
| 2-Person Households | 140,576 (30.1%) | 26,253 (5.6%) |
| 3-Person Households | 59,542 (12.7%) | 3,710 (0.8%) |
| 4-Person Households | 49,556 (10.6%) | 1,144 (0.2%) |
| 5-Person Households | 23,836 (5.1%) | 541 (0.1%) |
| 6-Person Households | 9,214 (2.0%) | 123 (0.0%) |
| 7+ Person Households | 4,450 (0.9%) | 44 (0.0%) |
| Total | 287,174 (61.4%) | 180,209 (38.6%) |
Female Fertility in Area Code 567
Fertility by Age in Area Code 567
Average fertility rate in Area Code 567 is 60.3 births per 1,000 women. Women in the age bracket of 20 to 34 years have the highest fertility rate with 121.6 births per 1,000 women. Women in the age bracket of 20 to 34 years acount for 77.4% of all women with births.
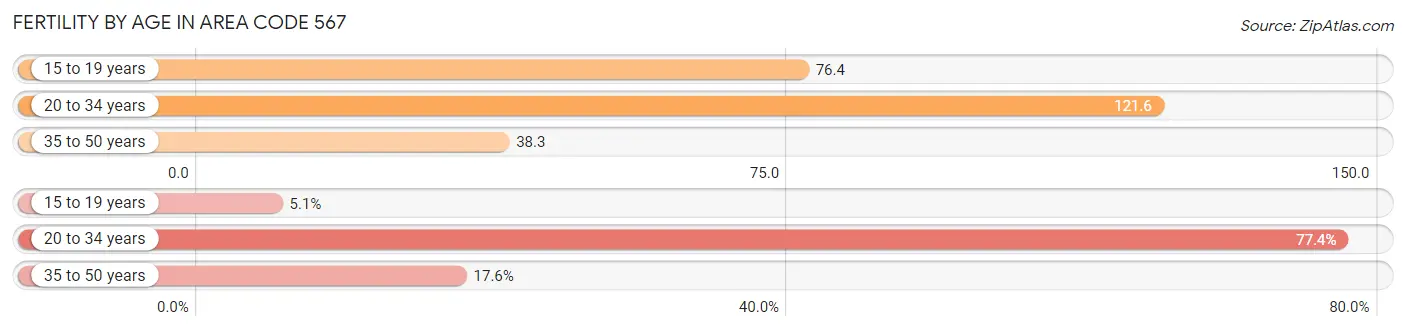
| Age Bracket | Women with Births | Births / 1,000 Women |
| 15 to 19 years | 686 (5.1%) | 76.4 |
| 20 to 34 years | 10,492 (77.4%) | 121.6 |
| 35 to 50 years | 2,380 (17.5%) | 38.3 |
| Total | 13,558 (100.0%) | 60.3 |
Fertility by Age by Marriage Status in Area Code 567
59.1% of women with births (13,558) in Area Code 567 are married. The highest percentage of unmarried women with births falls into 15 to 19 years age bracket with 99.0% of them unmarried at the time of birth, while the lowest percentage of unmarried women with births belong to 20 to 34 years age bracket with 44.6% of them unmarried.
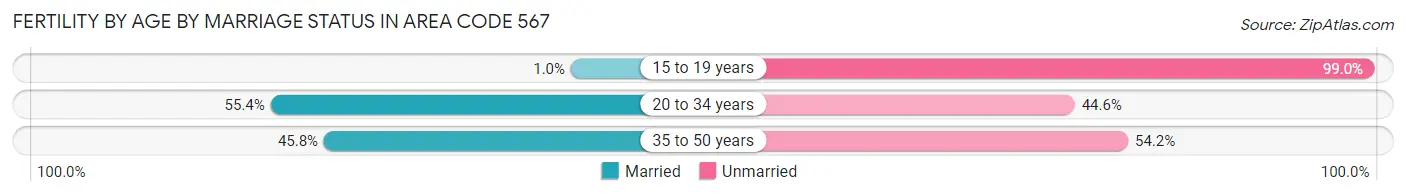
| Age Bracket | Married | Unmarried |
| 15 to 19 years | 7 (1.0%) | 679 (99.0%) |
| 20 to 34 years | 5,815 (55.4%) | 4,677 (44.6%) |
| 35 to 50 years | 1,089 (45.8%) | 1,291 (54.2%) |
| Total | 8,009 (59.1%) | 5,549 (40.9%) |
Fertility by Education in Area Code 567
Average fertility rate in Area Code 567 is 60.3 births per 1,000 women. Women with the education attainment of graduate degree have the highest fertility rate of 141.0 births per 1,000 women, while women with the education attainment of college or associate's degree have the lowest fertility at 61.4 births per 1,000 women. Women with the education attainment of high school diploma represent 31.4% of all women with births.
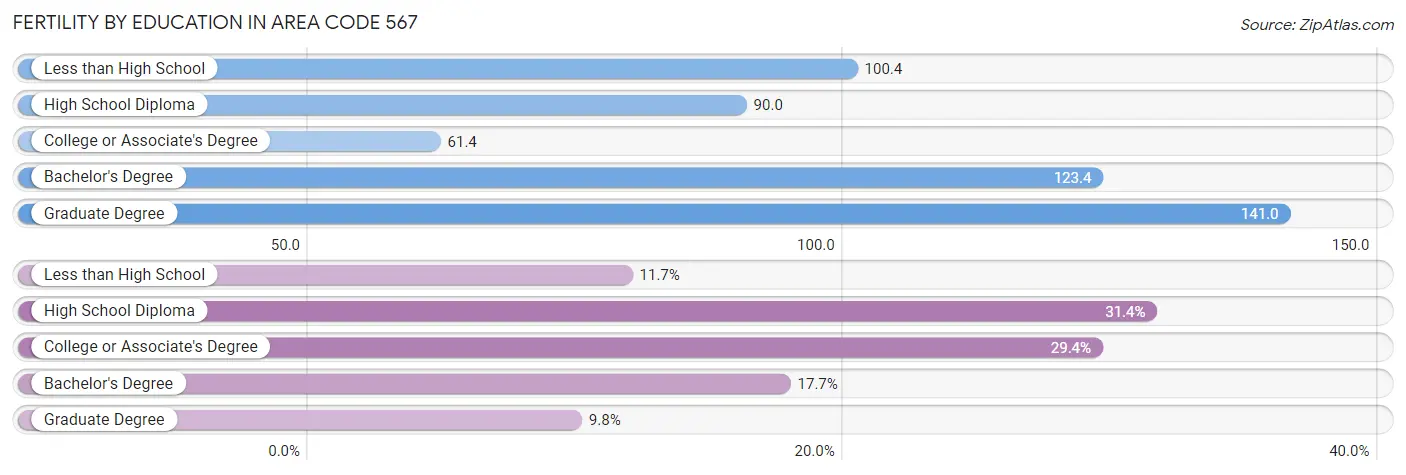
| Educational Attainment | Women with Births | Births / 1,000 Women |
| Less than High School | 1,592 (11.7%) | 100.4 |
| High School Diploma | 4,257 (31.4%) | 90.0 |
| College or Associate's Degree | 3,980 (29.4%) | 61.4 |
| Bachelor's Degree | 2,395 (17.7%) | 123.4 |
| Graduate Degree | 1,334 (9.8%) | 141.0 |
| Total | 13,558 (100.0%) | 60.3 |
Fertility by Education by Marriage Status in Area Code 567
40.9% of women with births in Area Code 567 are unmarried. Women with the educational attainment of college or associate's degree are most likely to be married with 46.4% of them married at childbirth, while women with the educational attainment of less than high school are least likely to be married with 88.9% of them unmarried at childbirth.
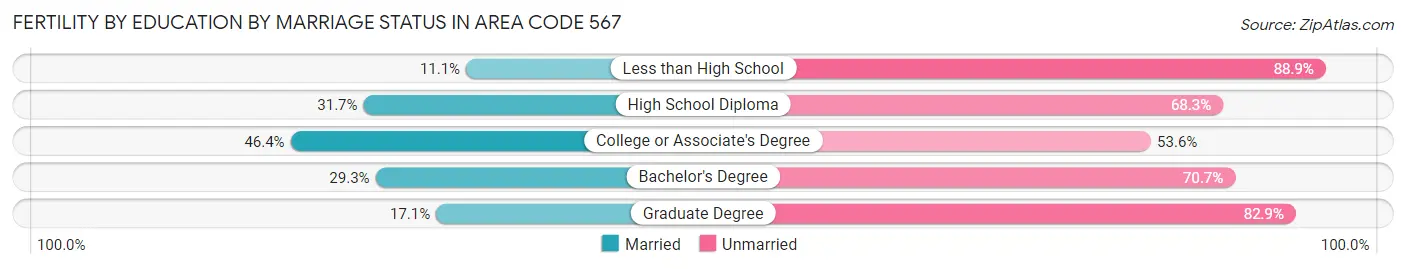
| Educational Attainment | Married | Unmarried |
| Less than High School | 176 (11.1%) | 1,416 (88.9%) |
| High School Diploma | 1,351 (31.7%) | 2,906 (68.3%) |
| College or Associate's Degree | 1,848 (46.4%) | 2,132 (53.6%) |
| Bachelor's Degree | 702 (29.3%) | 1,693 (70.7%) |
| Graduate Degree | 228 (17.1%) | 1,106 (82.9%) |
| Total | 8,009 (59.1%) | 5,549 (40.9%) |
Employment Characteristics in Area Code 567
Employment by Class of Employer in Area Code 567
Among the 527,067 employed individuals in Area Code 567, private company employees (374,521 | 71.1%), not-for-profit organizations (47,938 | 9.1%), and local government employees (41,563 | 7.9%) make up the most common classes of employment.
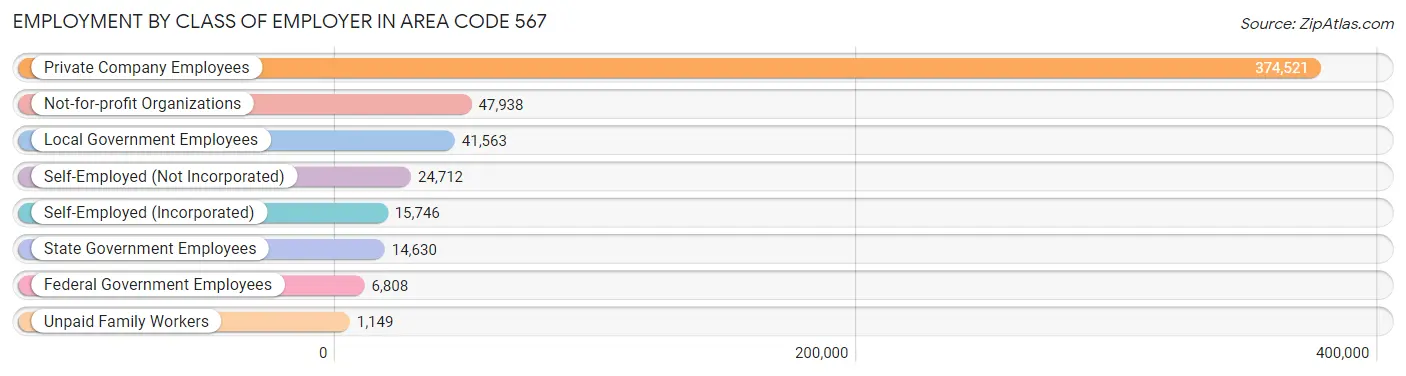
| Employer Class | # Employees | % Employees |
| Private Company Employees | 374,521 | 71.1% |
| Self-Employed (Incorporated) | 15,746 | 3.0% |
| Self-Employed (Not Incorporated) | 24,712 | 4.7% |
| Not-for-profit Organizations | 47,938 | 9.1% |
| Local Government Employees | 41,563 | 7.9% |
| State Government Employees | 14,630 | 2.8% |
| Federal Government Employees | 6,808 | 1.3% |
| Unpaid Family Workers | 1,149 | 0.2% |
| Total | 527,067 | 100.0% |
Employment Status by Age in Area Code 567
According to the labor force statistics for Area Code 567, out of the total population over 16 years of age (910,765), 62.3% or 567,316 individuals are in the labor force, with 4.2% or 24,054 of them unemployed. The age group with the highest labor force participation rate is 30 to 34 years, with 85.9% or 57,268 individuals in the labor force. Within the labor force, the 16 to 19 years age range has the highest percentage of unemployed individuals, with 1,218.4% or 352,751 of them being unemployed.
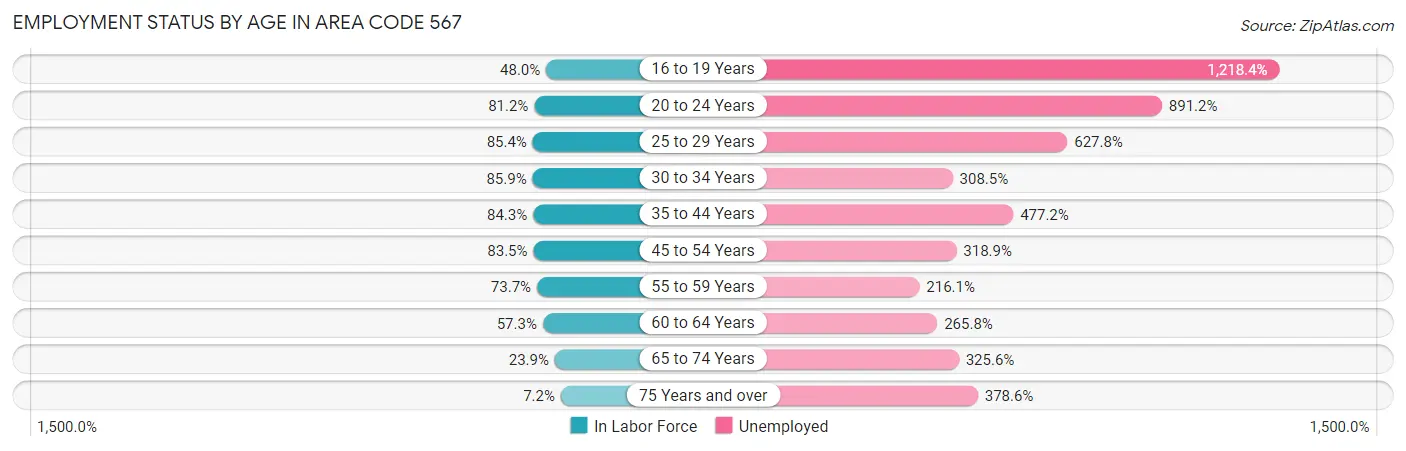
| Age Bracket | In Labor Force | Unemployed |
| 16 to 19 Years | 28,951 (47.9%) | 352,751 (1,218.4%) |
| 20 to 24 Years | 63,184 (81.1%) | 563,123 (891.2%) |
| 25 to 29 Years | 61,297 (85.4%) | 384,804 (627.8%) |
| 30 to 34 Years | 57,266 (85.9%) | 176,672 (308.5%) |
| 35 to 44 Years | 110,974 (84.3%) | 529,549 (477.2%) |
| 45 to 54 Years | 112,228 (83.5%) | 357,905 (318.9%) |
| 55 to 59 Years | 56,766 (73.7%) | 122,667 (216.1%) |
| 60 to 64 Years | 44,987 (57.3%) | 119,570 (265.8%) |
| 65 to 74 Years | 29,778 (23.9%) | 96,957 (325.6%) |
| 75 Years and over | 6,301 (7.2%) | 23,844 (378.6%) |
| Total | 567,315 (62.3%) | 24,070 (4.2%) |
Employment Status by Educational Attainment in Area Code 567
According to labor force statistics for Area Code 567, 79.0% of individuals (442,297) out of the total population between 25 and 64 years of age (560,082) are in the labor force, with 385.8% or 1,706,382 of them being unemployed. The group with the highest labor force participation rate are those with the educational attainment of bachelor's degree or higher, with 88.1% or 123,691 individuals in the labor force. Within the labor force, individuals with less than high school education have the highest percentage of unemployment, with 898.8% or 220,008 of them being unemployed.
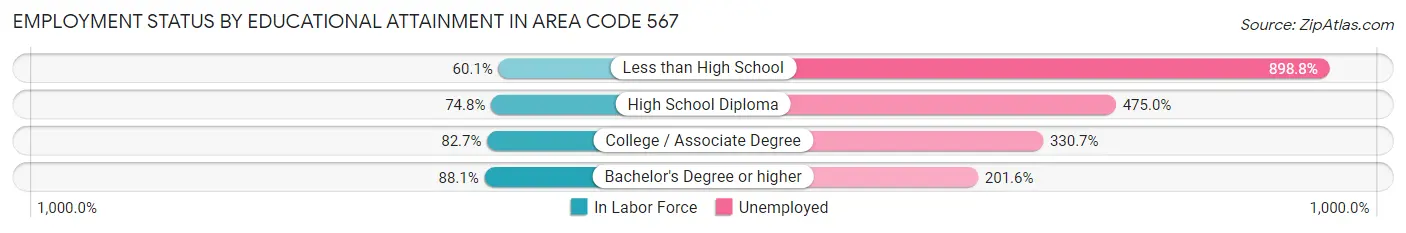
| Educational Attainment | In Labor Force | Unemployed |
| Less than High School | 24,477 (60.1%) | 365,892 (898.8%) |
| High School Diploma | 148,044 (74.8%) | 939,569 (475.0%) |
| College / Associate Degree | 149,697 (82.7%) | 598,974 (330.7%) |
| Bachelor's Degree or higher | 123,694 (88.1%) | 283,139 (201.6%) |
| Total | 442,272 (79.0%) | 2,160,796 (385.8%) |
Employment Occupations by Sex in Area Code 567
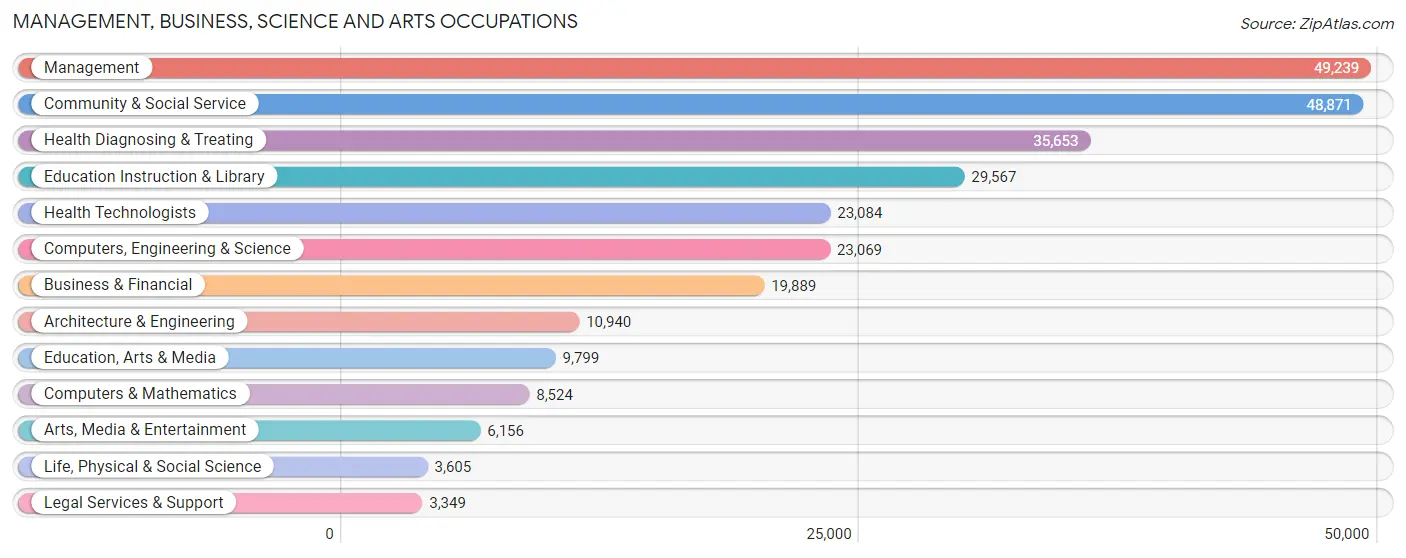
Management, Business, Science and Arts Occupations
The most common Management, Business, Science and Arts occupations in Area Code 567 are Management (49,239 | 9.1%), Community & Social Service (48,871 | 9.1%), Health Diagnosing & Treating (35,653 | 6.6%), Education Instruction & Library (29,567 | 5.5%), and Health Technologists (23,084 | 4.3%).
Management, Business, Science and Arts Occupations by Sex
Within the Management, Business, Science and Arts occupations in Area Code 567, the most male-oriented occupations are Architecture & Engineering (85.2%), Computers, Engineering & Science (77.2%), and Computers & Mathematics (76.9%), while the most female-oriented occupations are Health Diagnosing & Treating (80.2%), Health Technologists (76.8%), and Education Instruction & Library (73.6%).
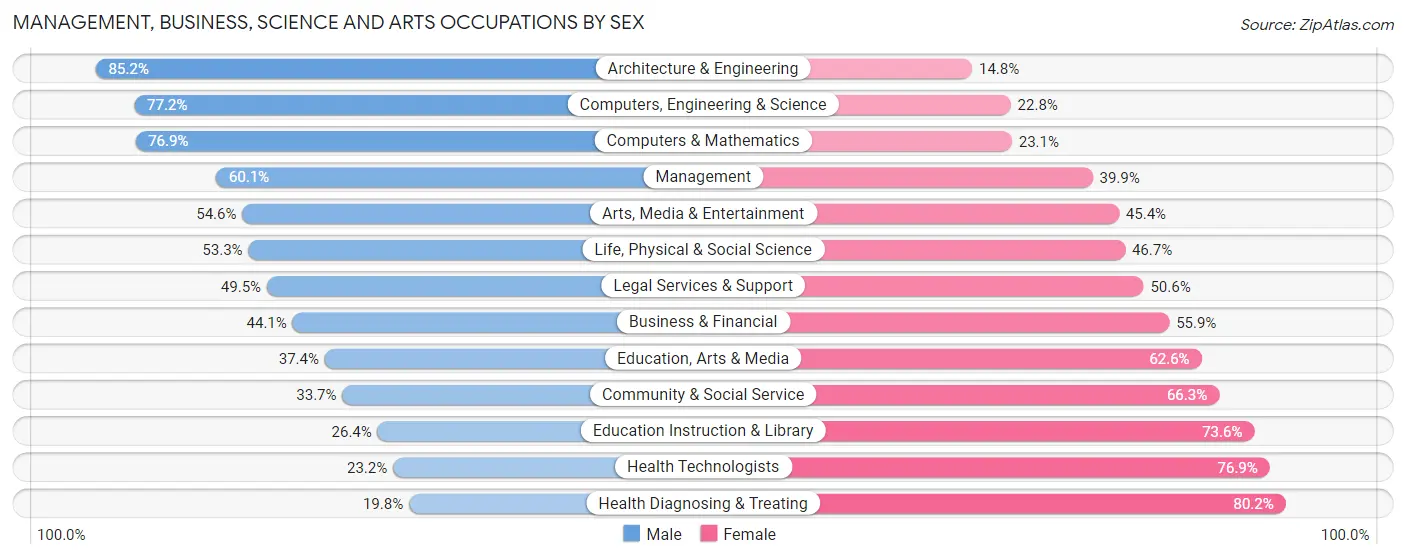
| Occupation | Male | Female |
| Management | 29,582 (60.1%) | 19,657 (39.9%) |
| Business & Financial | 8,769 (44.1%) | 11,120 (55.9%) |
| Computers, Engineering & Science | 17,801 (77.2%) | 5,268 (22.8%) |
| Computers & Mathematics | 6,557 (76.9%) | 1,967 (23.1%) |
| Architecture & Engineering | 9,322 (85.2%) | 1,618 (14.8%) |
| Life, Physical & Social Science | 1,922 (53.3%) | 1,683 (46.7%) |
| Community & Social Service | 16,473 (33.7%) | 32,398 (66.3%) |
| Education, Arts & Media | 3,662 (37.4%) | 6,137 (62.6%) |
| Legal Services & Support | 1,656 (49.4%) | 1,693 (50.5%) |
| Education Instruction & Library | 7,795 (26.4%) | 21,772 (73.6%) |
| Arts, Media & Entertainment | 3,360 (54.6%) | 2,796 (45.4%) |
| Health Diagnosing & Treating | 7,068 (19.8%) | 28,585 (80.2%) |
| Health Technologists | 5,345 (23.2%) | 17,739 (76.8%) |
| Total (Category) | 79,693 (45.1%) | 97,028 (54.9%) |
| Total (Overall) | 284,005 (52.8%) | 253,934 (47.2%) |
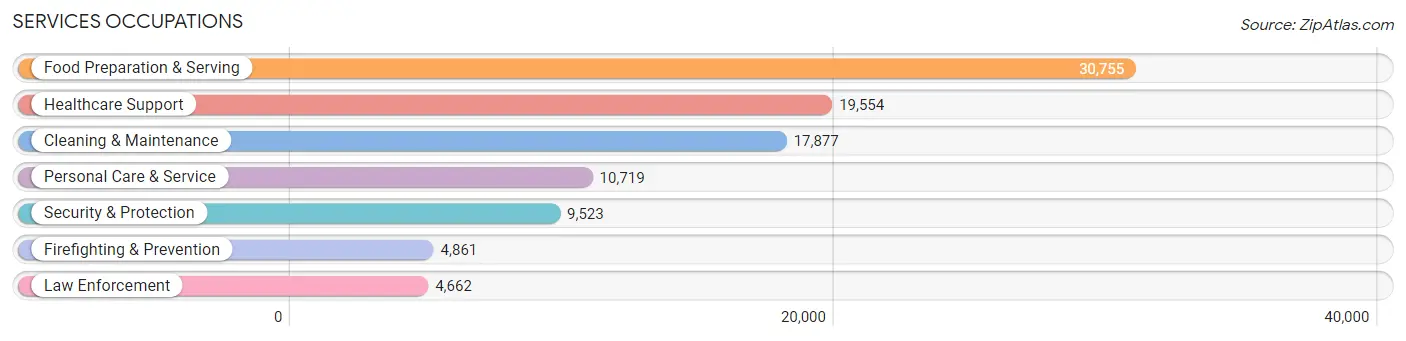
Services Occupations
The most common Services occupations in Area Code 567 are Food Preparation & Serving (30,755 | 5.7%), Healthcare Support (19,554 | 3.6%), Cleaning & Maintenance (17,877 | 3.3%), Personal Care & Service (10,719 | 2.0%), and Security & Protection (9,523 | 1.8%).
Services Occupations by Sex
Within the Services occupations in Area Code 567, the most male-oriented occupations are Law Enforcement (86.8%), Security & Protection (79.5%), and Firefighting & Prevention (72.6%), while the most female-oriented occupations are Healthcare Support (90.9%), Personal Care & Service (83.3%), and Food Preparation & Serving (60.9%).
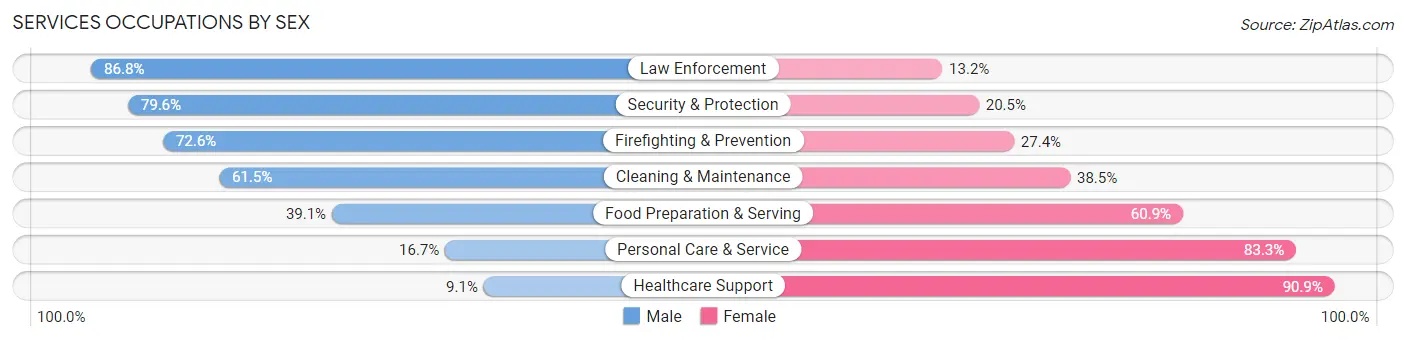
| Occupation | Male | Female |
| Healthcare Support | 1,775 (9.1%) | 17,779 (90.9%) |
| Security & Protection | 7,576 (79.5%) | 1,947 (20.4%) |
| Firefighting & Prevention | 3,529 (72.6%) | 1,332 (27.4%) |
| Law Enforcement | 4,047 (86.8%) | 615 (13.2%) |
| Food Preparation & Serving | 12,036 (39.1%) | 18,719 (60.9%) |
| Cleaning & Maintenance | 10,993 (61.5%) | 6,884 (38.5%) |
| Personal Care & Service | 1,793 (16.7%) | 8,926 (83.3%) |
| Total (Category) | 34,173 (38.6%) | 54,255 (61.4%) |
| Total (Overall) | 284,005 (52.8%) | 253,934 (47.2%) |
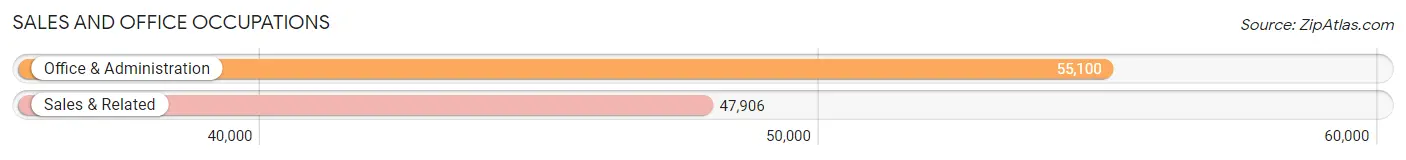
Sales and Office Occupations
The most common Sales and Office occupations in Area Code 567 are Office & Administration (55,100 | 10.2%), and Sales & Related (47,906 | 8.9%).
Sales and Office Occupations by Sex
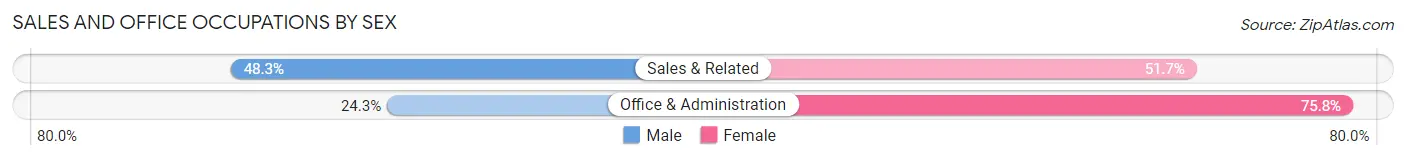
| Occupation | Male | Female |
| Sales & Related | 23,133 (48.3%) | 24,773 (51.7%) |
| Office & Administration | 13,361 (24.2%) | 41,739 (75.7%) |
| Total (Category) | 36,494 (35.4%) | 66,512 (64.6%) |
| Total (Overall) | 284,005 (52.8%) | 253,934 (47.2%) |
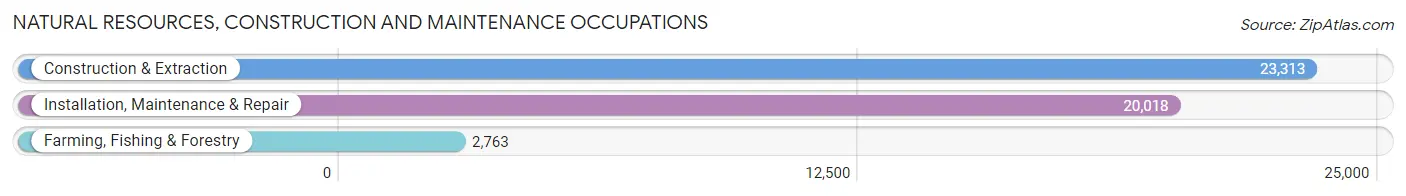
Natural Resources, Construction and Maintenance Occupations
The most common Natural Resources, Construction and Maintenance occupations in Area Code 567 are Construction & Extraction (23,313 | 4.3%), Installation, Maintenance & Repair (20,018 | 3.7%), and Farming, Fishing & Forestry (2,763 | 0.5%).
Natural Resources, Construction and Maintenance Occupations by Sex
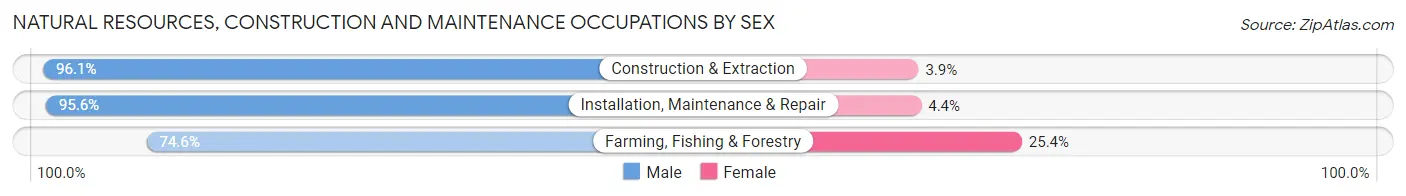
| Occupation | Male | Female |
| Farming, Fishing & Forestry | 2,062 (74.6%) | 701 (25.4%) |
| Construction & Extraction | 22,412 (96.1%) | 901 (3.9%) |
| Installation, Maintenance & Repair | 19,129 (95.6%) | 889 (4.4%) |
| Total (Category) | 43,603 (94.6%) | 2,491 (5.4%) |
| Total (Overall) | 284,005 (52.8%) | 253,934 (47.2%) |
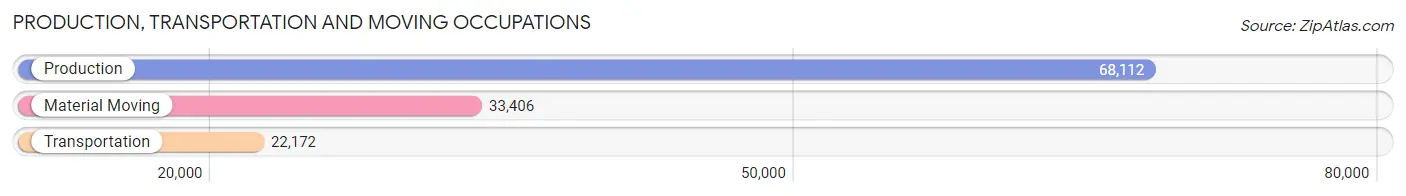
Production, Transportation and Moving Occupations
The most common Production, Transportation and Moving occupations in Area Code 567 are Production (68,112 | 12.7%), Material Moving (33,406 | 6.2%), and Transportation (22,172 | 4.1%).
Production, Transportation and Moving Occupations by Sex
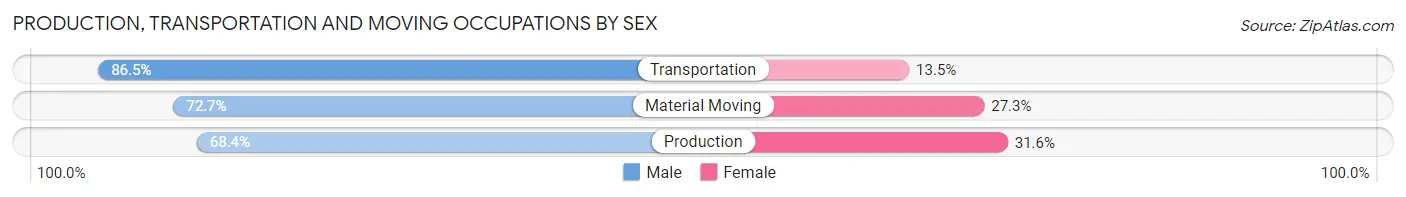
| Occupation | Male | Female |
| Production | 46,580 (68.4%) | 21,532 (31.6%) |
| Transportation | 19,176 (86.5%) | 2,996 (13.5%) |
| Material Moving | 24,286 (72.7%) | 9,120 (27.3%) |
| Total (Category) | 90,042 (72.8%) | 33,648 (27.2%) |
| Total (Overall) | 284,005 (52.8%) | 253,934 (47.2%) |
Employment Industries by Sex in Area Code 567
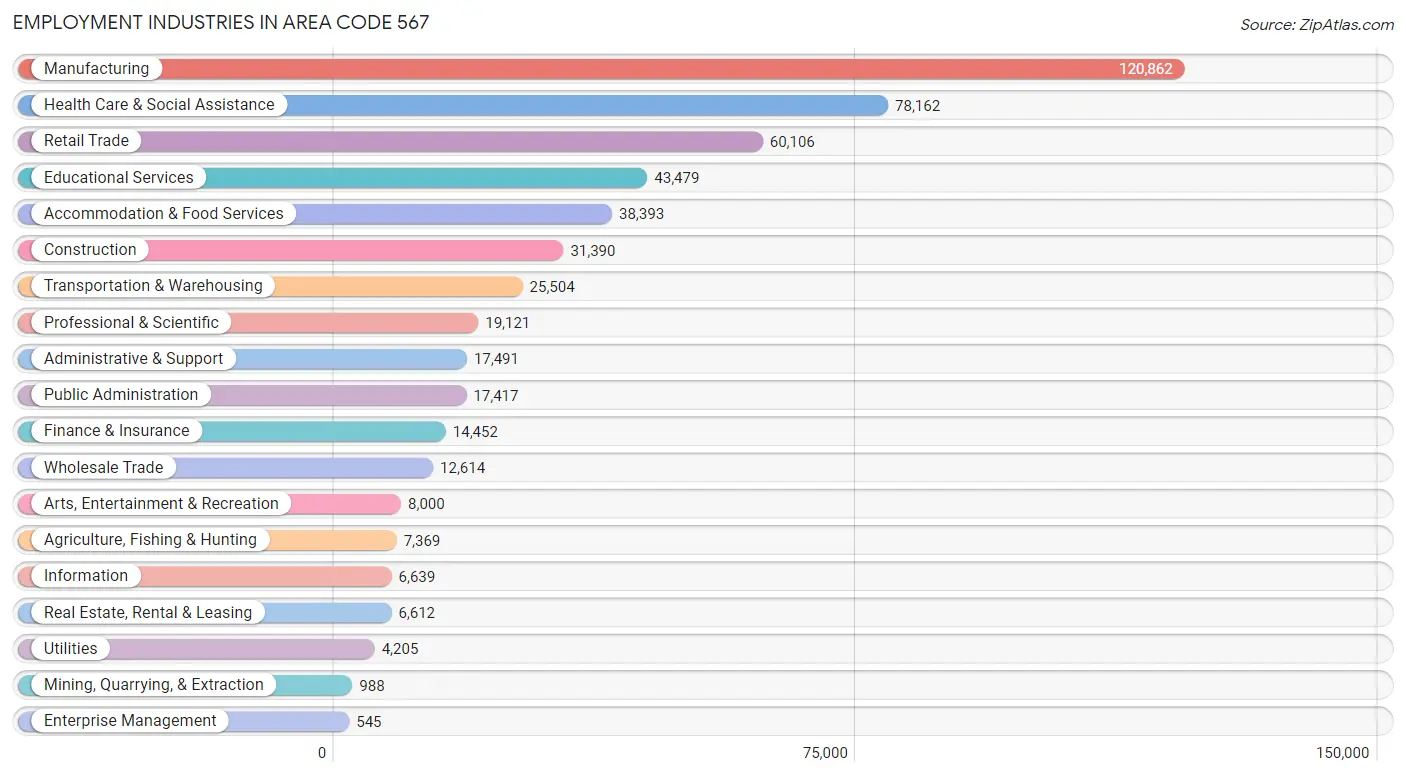
Employment Industries in Area Code 567
The major employment industries in Area Code 567 include Manufacturing (120,862 | 22.5%), Health Care & Social Assistance (78,162 | 14.5%), Retail Trade (60,106 | 11.2%), Educational Services (43,479 | 8.1%), and Accommodation & Food Services (38,393 | 7.1%).
Employment Industries by Sex in Area Code 567
The Area Code 567 industries that see more men than women are Construction (89.5%), Mining, Quarrying, & Extraction (81.5%), and Agriculture, Fishing & Hunting (79.2%), whereas the industries that tend to have a higher number of women are Health Care & Social Assistance (82.1%), Educational Services (68.9%), and Finance & Insurance (65.7%).
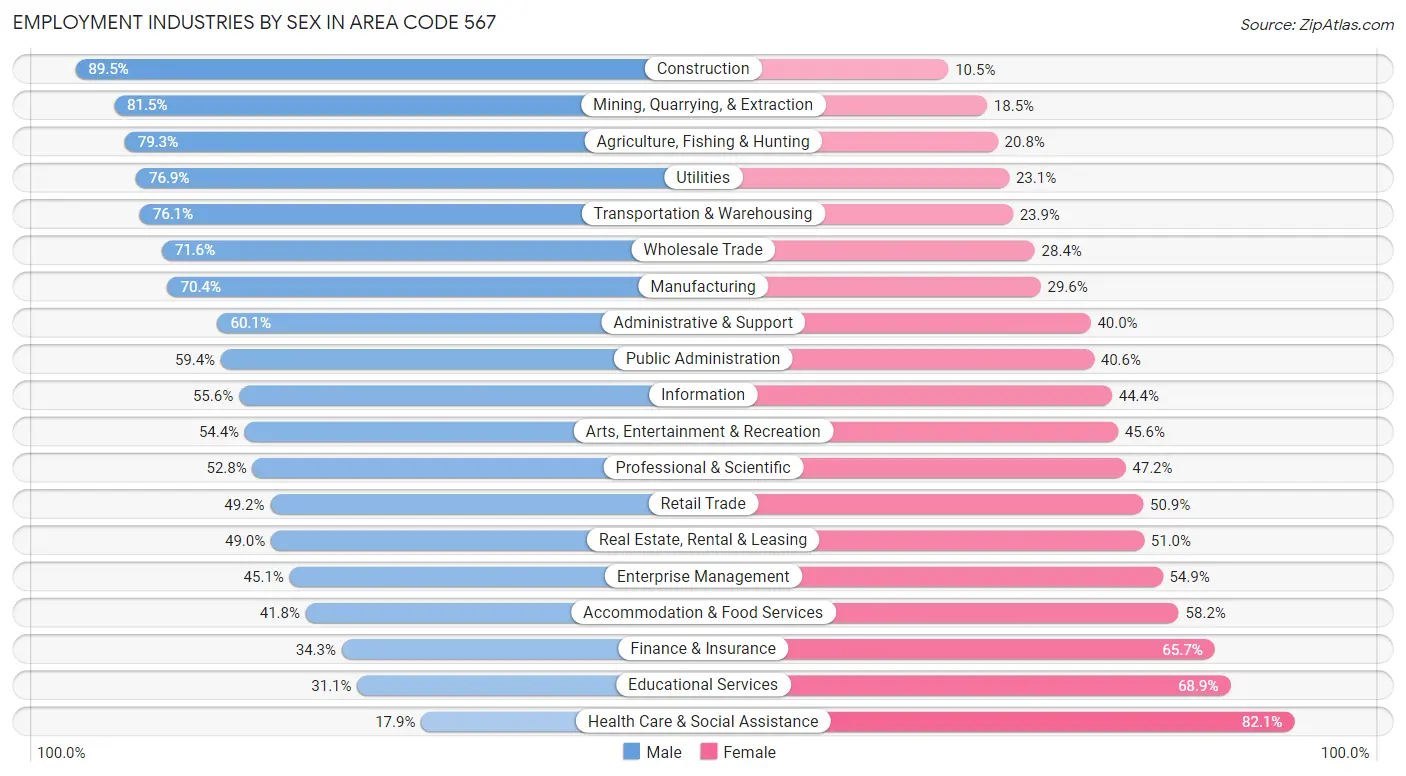
| Industry | Male | Female |
| Agriculture, Fishing & Hunting | 5,840 (79.2%) | 1,529 (20.7%) |
| Mining, Quarrying, & Extraction | 805 (81.5%) | 183 (18.5%) |
| Construction | 28,089 (89.5%) | 3,301 (10.5%) |
| Manufacturing | 85,059 (70.4%) | 35,803 (29.6%) |
| Wholesale Trade | 9,032 (71.6%) | 3,582 (28.4%) |
| Retail Trade | 29,540 (49.1%) | 30,566 (50.8%) |
| Transportation & Warehousing | 19,419 (76.1%) | 6,085 (23.9%) |
| Utilities | 3,234 (76.9%) | 971 (23.1%) |
| Information | 3,693 (55.6%) | 2,946 (44.4%) |
| Finance & Insurance | 4,963 (34.3%) | 9,489 (65.7%) |
| Real Estate, Rental & Leasing | 3,239 (49.0%) | 3,373 (51.0%) |
| Professional & Scientific | 10,100 (52.8%) | 9,021 (47.2%) |
| Enterprise Management | 246 (45.1%) | 299 (54.9%) |
| Administrative & Support | 10,503 (60.1%) | 6,988 (40.0%) |
| Educational Services | 13,531 (31.1%) | 29,948 (68.9%) |
| Health Care & Social Assistance | 13,993 (17.9%) | 64,169 (82.1%) |
| Arts, Entertainment & Recreation | 4,351 (54.4%) | 3,649 (45.6%) |
| Accommodation & Food Services | 16,044 (41.8%) | 22,349 (58.2%) |
| Public Administration | 10,339 (59.4%) | 7,078 (40.6%) |
| Total | 284,005 (52.8%) | 253,934 (47.2%) |
Education in Area Code 567
School Enrollment in Area Code 567
The most common levels of schooling among the 262,042 students in Area Code 567 are high school (58,081 | 22.2%), middle school (57,487 | 21.9%), and elementary school (53,664 | 20.5%).
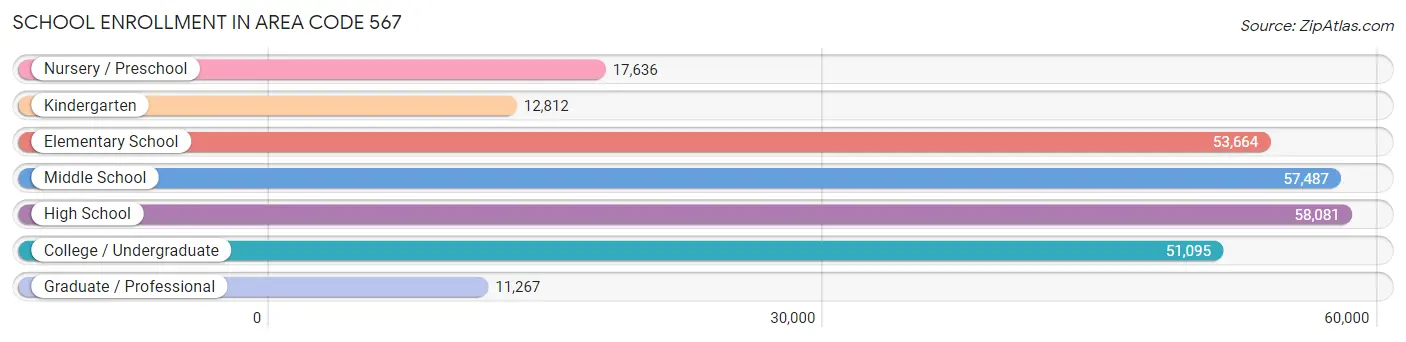
| School Level | # Students | % Students |
| Nursery / Preschool | 17,636 | 6.7% |
| Kindergarten | 12,812 | 4.9% |
| Elementary School | 53,664 | 20.5% |
| Middle School | 57,487 | 21.9% |
| High School | 58,081 | 22.2% |
| College / Undergraduate | 51,095 | 19.5% |
| Graduate / Professional | 11,267 | 4.3% |
| Total | 262,042 | 100.0% |
School Enrollment by Age by Funding Source in Area Code 567
Out of a total of 262,042 students who are enrolled in schools in Area Code 567, 46,079 (17.6%) attend a private institution, while the remaining 215,963 (82.4%) are enrolled in public schools. The age group of 3 to 4 year olds has the highest likelihood of being enrolled in private schools, with 3,907 (33.5% in the age bracket) enrolled. Conversely, the age group of 15 to 17 year olds has the lowest likelihood of being enrolled in a private school, with 38,834 (89.6% in the age bracket) attending a public institution.
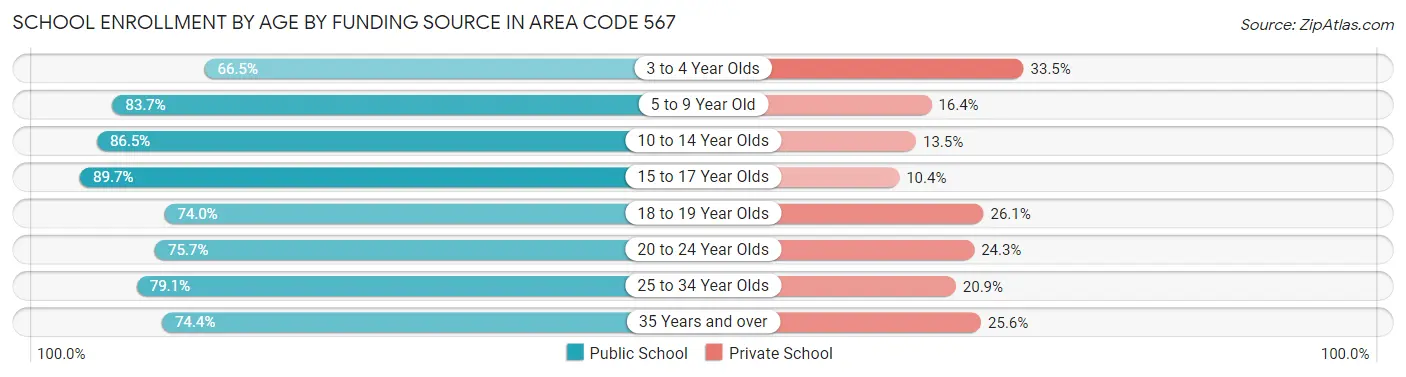
| Age Bracket | Public School | Private School |
| 3 to 4 Year Olds | 7,750 (66.5%) | 3,907 (33.5%) |
| 5 to 9 Year Old | 53,160 (83.7%) | 10,393 (16.4%) |
| 10 to 14 Year Olds | 61,074 (86.5%) | 9,519 (13.5%) |
| 15 to 17 Year Olds | 38,834 (89.6%) | 4,484 (10.3%) |
| 18 to 19 Year Olds | 15,121 (74.0%) | 5,327 (26.1%) |
| 20 to 24 Year Olds | 22,317 (75.7%) | 7,169 (24.3%) |
| 25 to 34 Year Olds | 10,104 (79.1%) | 2,670 (20.9%) |
| 35 Years and over | 7,598 (74.4%) | 2,615 (25.6%) |
| Total | 215,963 (82.4%) | 46,079 (17.6%) |
Educational Attainment by Field of Study in Area Code 567
Business (39,515 | 20.2%), education (39,145 | 20.0%), science & technology (26,116 | 13.3%), arts & humanities (12,572 | 6.4%), and engineering (11,847 | 6.0%) are the most common fields of study among 195,949 individuals in Area Code 567 who have obtained a bachelor's degree or higher.
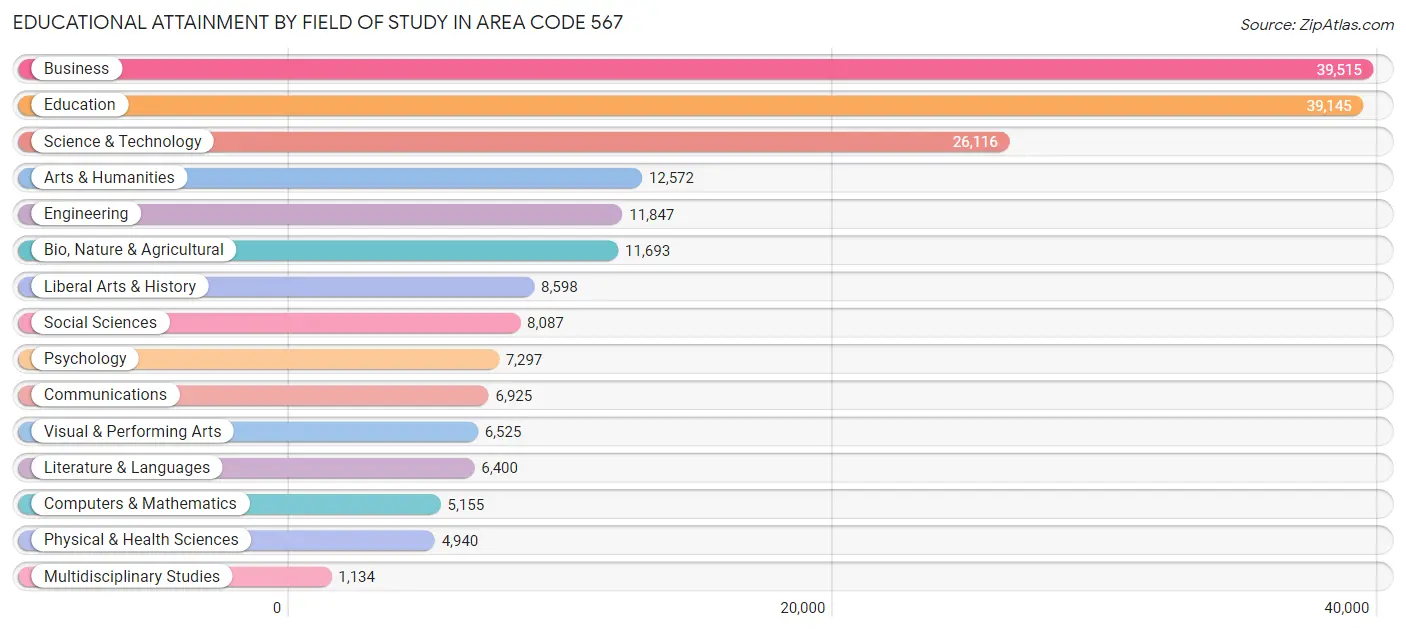
| Field of Study | # Graduates | % Graduates |
| Computers & Mathematics | 5,155 | 2.6% |
| Bio, Nature & Agricultural | 11,693 | 6.0% |
| Physical & Health Sciences | 4,940 | 2.5% |
| Psychology | 7,297 | 3.7% |
| Social Sciences | 8,087 | 4.1% |
| Engineering | 11,847 | 6.0% |
| Multidisciplinary Studies | 1,134 | 0.6% |
| Science & Technology | 26,116 | 13.3% |
| Business | 39,515 | 20.2% |
| Education | 39,145 | 20.0% |
| Literature & Languages | 6,400 | 3.3% |
| Liberal Arts & History | 8,598 | 4.4% |
| Visual & Performing Arts | 6,525 | 3.3% |
| Communications | 6,925 | 3.5% |
| Arts & Humanities | 12,572 | 6.4% |
| Total | 195,949 | 100.0% |
Transportation & Commute in Area Code 567
Vehicle Availability by Sex in Area Code 567
The most prevalent vehicle ownership categories in Area Code 567 are males with 2 vehicles (116,688, accounting for 42.0%) and females with 2 vehicles (98,140, making up 47.5%).
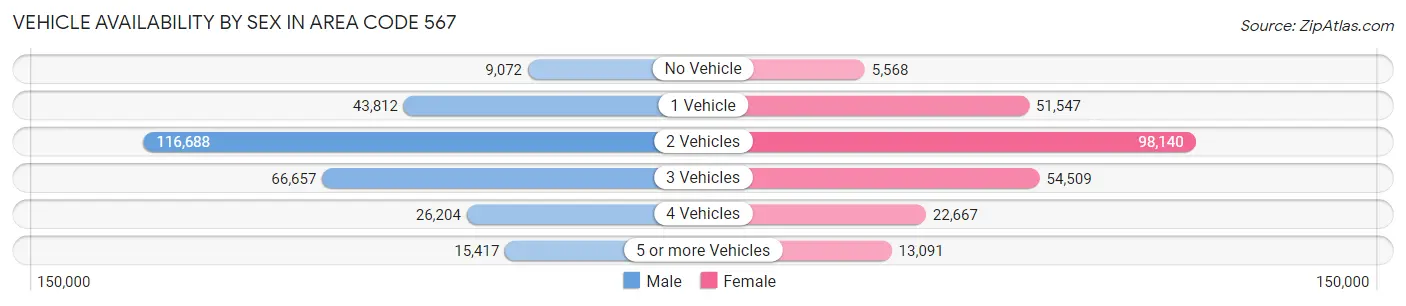
| Vehicles Available | Male | Female |
| No Vehicle | 9,072 (3.3%) | 5,568 (2.3%) |
| 1 Vehicle | 43,812 (15.8%) | 51,547 (21.0%) |
| 2 Vehicles | 116,688 (42.0%) | 98,140 (40.0%) |
| 3 Vehicles | 66,657 (24.0%) | 54,509 (22.2%) |
| 4 Vehicles | 26,204 (9.4%) | 22,667 (9.2%) |
| 5 or more Vehicles | 15,417 (5.6%) | 13,091 (5.3%) |
| Total | 277,850 (100.0%) | 245,522 (100.0%) |
Commute Time in Area Code 567
The most frequently occuring commute durations in Area Code 567 are 10 to 14 minutes (86,725 commuters, 17.4%), 5 to 9 minutes (82,080 commuters, 16.5%), and 15 to 19 minutes (80,238 commuters, 16.1%).
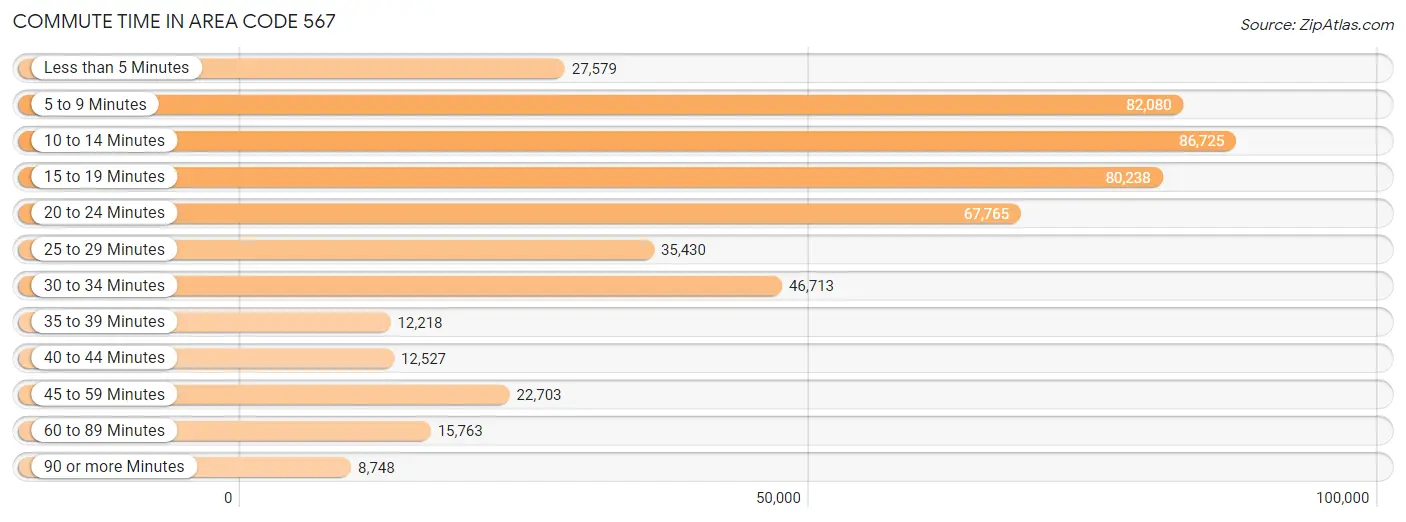
| Commute Time | # Commuters | % Commuters |
| Less than 5 Minutes | 27,579 | 5.5% |
| 5 to 9 Minutes | 82,080 | 16.5% |
| 10 to 14 Minutes | 86,725 | 17.4% |
| 15 to 19 Minutes | 80,238 | 16.1% |
| 20 to 24 Minutes | 67,765 | 13.6% |
| 25 to 29 Minutes | 35,430 | 7.1% |
| 30 to 34 Minutes | 46,713 | 9.4% |
| 35 to 39 Minutes | 12,218 | 2.5% |
| 40 to 44 Minutes | 12,527 | 2.5% |
| 45 to 59 Minutes | 22,703 | 4.5% |
| 60 to 89 Minutes | 15,763 | 3.2% |
| 90 or more Minutes | 8,748 | 1.8% |
Commute Time by Sex in Area Code 567
The most common commute times in Area Code 567 are 10 to 14 minutes (42,667 commuters, 16.0%) for males and 10 to 14 minutes (44,058 commuters, 19.0%) for females.
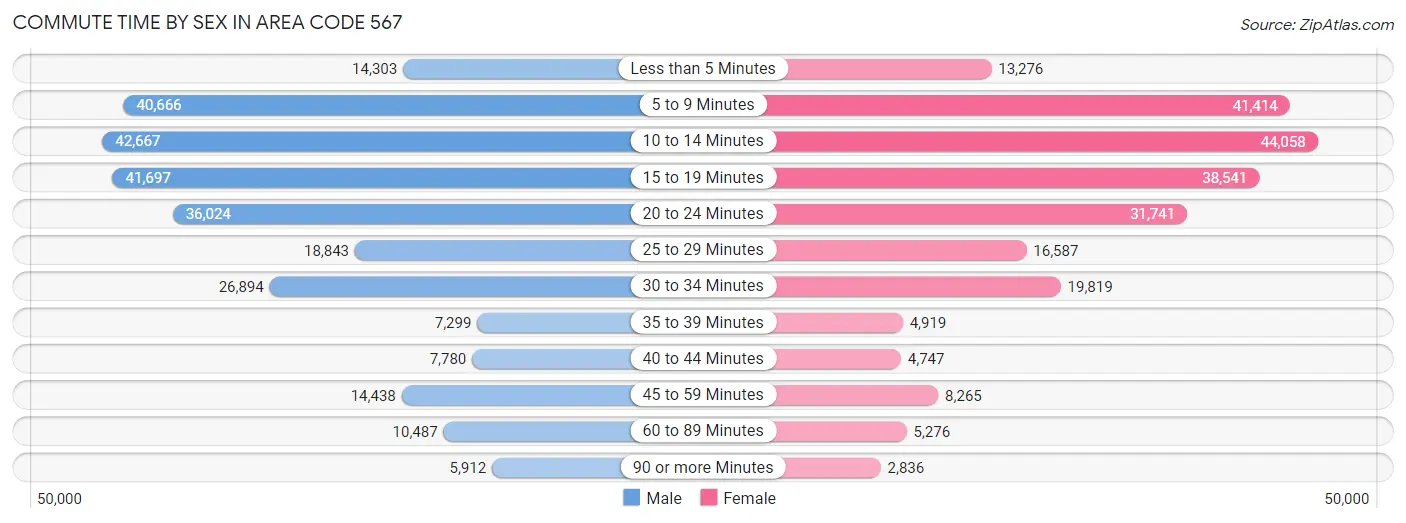
| Commute Time | Male | Female |
| Less than 5 Minutes | 14,303 (5.4%) | 13,276 (5.7%) |
| 5 to 9 Minutes | 40,666 (15.2%) | 41,414 (17.9%) |
| 10 to 14 Minutes | 42,667 (16.0%) | 44,058 (19.0%) |
| 15 to 19 Minutes | 41,697 (15.6%) | 38,541 (16.7%) |
| 20 to 24 Minutes | 36,024 (13.5%) | 31,741 (13.7%) |
| 25 to 29 Minutes | 18,843 (7.1%) | 16,587 (7.2%) |
| 30 to 34 Minutes | 26,894 (10.1%) | 19,819 (8.6%) |
| 35 to 39 Minutes | 7,299 (2.7%) | 4,919 (2.1%) |
| 40 to 44 Minutes | 7,780 (2.9%) | 4,747 (2.1%) |
| 45 to 59 Minutes | 14,438 (5.4%) | 8,265 (3.6%) |
| 60 to 89 Minutes | 10,487 (3.9%) | 5,276 (2.3%) |
| 90 or more Minutes | 5,912 (2.2%) | 2,836 (1.2%) |
Time of Departure to Work by Sex in Area Code 567
The most frequent times of departure to work in Area Code 567 are 7:00 AM to 7:29 AM (32,385, 12.1%) for males and 7:30 AM to 7:59 AM (34,466, 14.9%) for females.
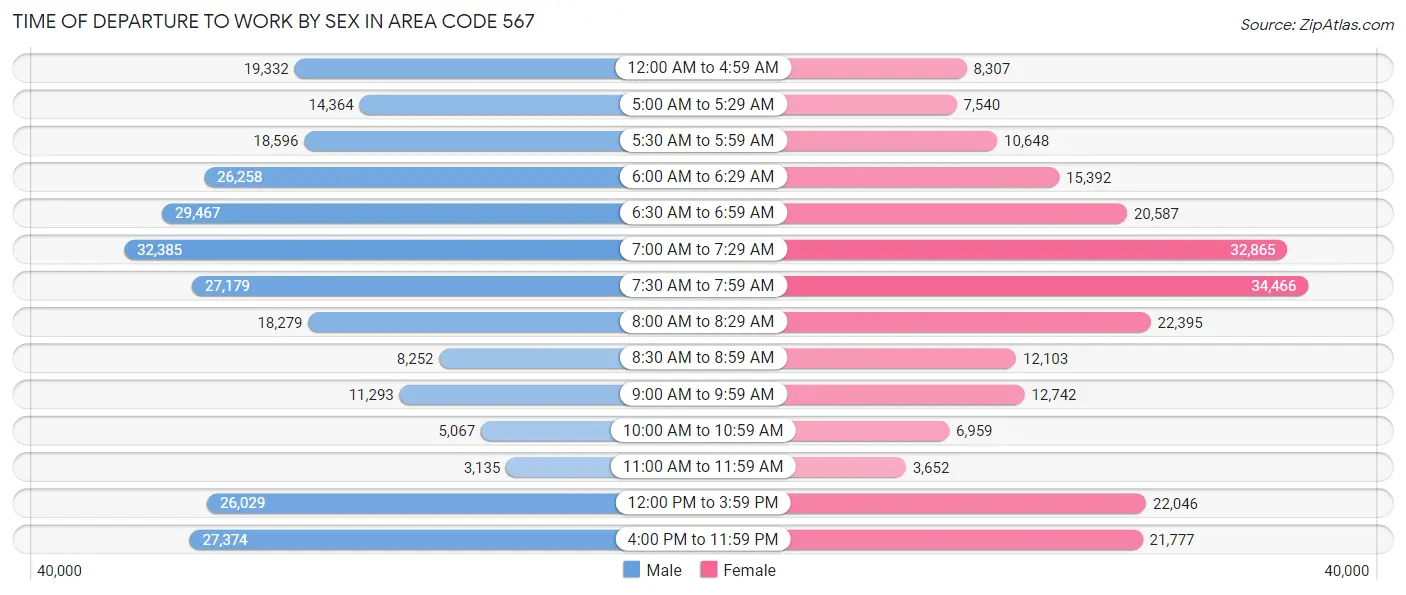
| Time of Departure | Male | Female |
| 12:00 AM to 4:59 AM | 19,332 (7.2%) | 8,307 (3.6%) |
| 5:00 AM to 5:29 AM | 14,364 (5.4%) | 7,540 (3.3%) |
| 5:30 AM to 5:59 AM | 18,596 (7.0%) | 10,648 (4.6%) |
| 6:00 AM to 6:29 AM | 26,258 (9.8%) | 15,392 (6.7%) |
| 6:30 AM to 6:59 AM | 29,467 (11.0%) | 20,587 (8.9%) |
| 7:00 AM to 7:29 AM | 32,385 (12.1%) | 32,865 (14.2%) |
| 7:30 AM to 7:59 AM | 27,179 (10.2%) | 34,466 (14.9%) |
| 8:00 AM to 8:29 AM | 18,279 (6.9%) | 22,395 (9.7%) |
| 8:30 AM to 8:59 AM | 8,252 (3.1%) | 12,103 (5.2%) |
| 9:00 AM to 9:59 AM | 11,293 (4.2%) | 12,742 (5.5%) |
| 10:00 AM to 10:59 AM | 5,067 (1.9%) | 6,959 (3.0%) |
| 11:00 AM to 11:59 AM | 3,135 (1.2%) | 3,652 (1.6%) |
| 12:00 PM to 3:59 PM | 26,029 (9.8%) | 22,046 (9.5%) |
| 4:00 PM to 11:59 PM | 27,374 (10.2%) | 21,777 (9.4%) |
| Total | 267,010 (100.0%) | 231,479 (100.0%) |
Housing Occupancy in Area Code 567
Occupancy by Ownership in Area Code 567
Of the total 467,383 dwellings in Area Code 567, owner-occupied units account for 320,527 (68.6%), while renter-occupied units make up 146,856 (31.4%).
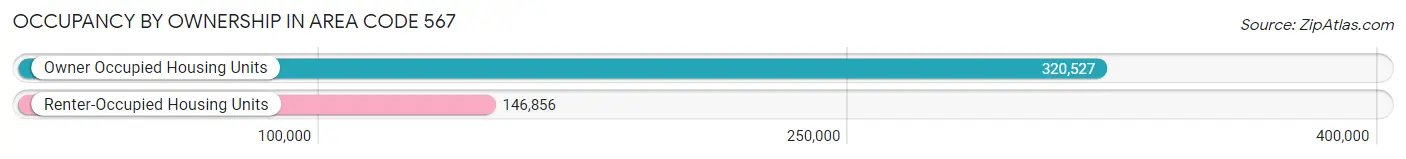
| Occupancy | # Housing Units | % Housing Units |
| Owner Occupied Housing Units | 320,527 | 68.6% |
| Renter-Occupied Housing Units | 146,856 | 31.4% |
| Total Occupied Housing Units | 467,383 | 100.0% |
Occupancy by Household Size in Area Code 567
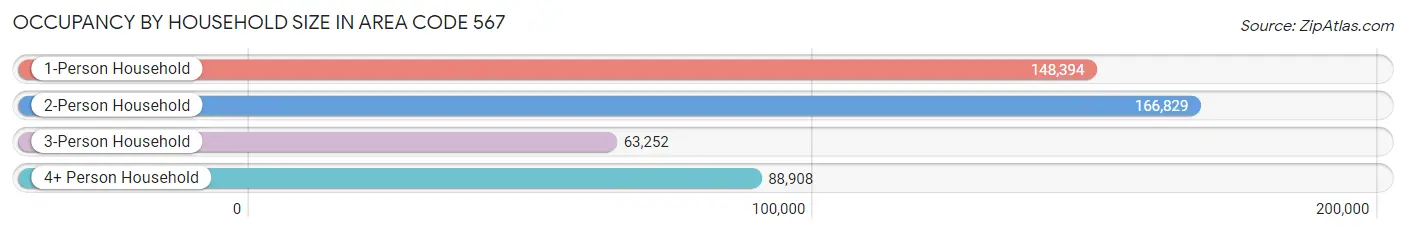
| Household Size | # Housing Units | % Housing Units |
| 1-Person Household | 148,394 | 31.8% |
| 2-Person Household | 166,829 | 35.7% |
| 3-Person Household | 63,252 | 13.5% |
| 4+ Person Household | 88,908 | 19.0% |
| Total Housing Units | 467,383 | 100.0% |
Occupancy by Ownership by Household Size in Area Code 567
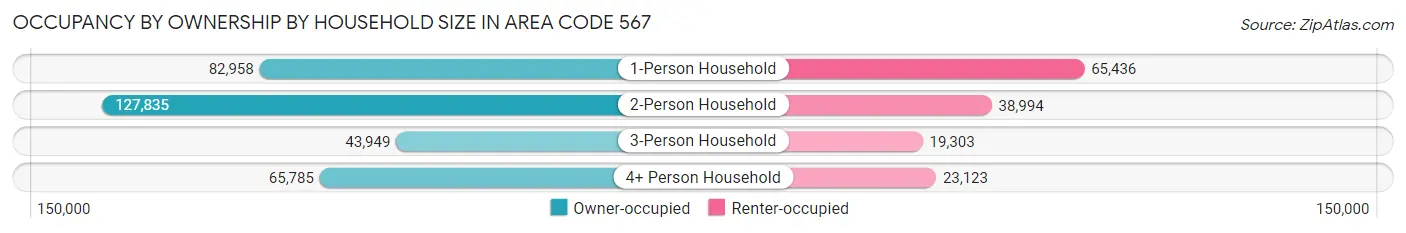
| Household Size | Owner-occupied | Renter-occupied |
| 1-Person Household | 82,958 (55.9%) | 65,436 (44.1%) |
| 2-Person Household | 127,835 (76.6%) | 38,994 (23.4%) |
| 3-Person Household | 43,949 (69.5%) | 19,303 (30.5%) |
| 4+ Person Household | 65,785 (74.0%) | 23,123 (26.0%) |
| Total Housing Units | 320,527 (68.6%) | 146,856 (31.4%) |
Occupancy by Educational Attainment in Area Code 567
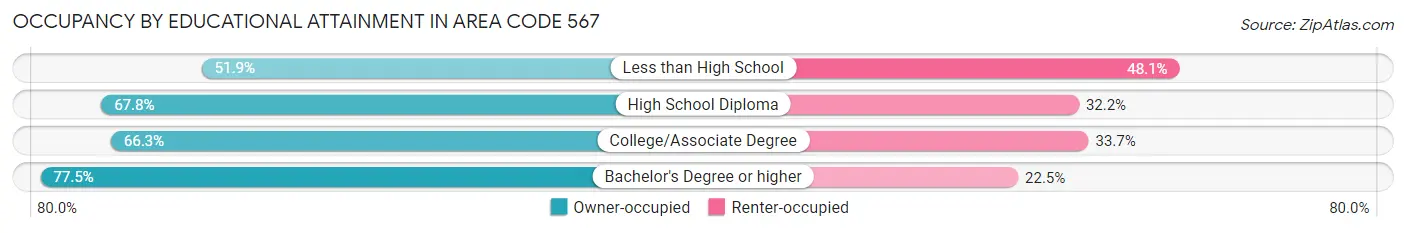
| Household Size | Owner-occupied | Renter-occupied |
| Less than High School | 17,477 (51.9%) | 16,192 (48.1%) |
| High School Diploma | 111,578 (67.8%) | 52,889 (32.2%) |
| College/Associate Degree | 101,857 (66.3%) | 51,744 (33.7%) |
| Bachelor's Degree or higher | 89,615 (77.5%) | 26,031 (22.5%) |
Occupancy by Age of Householder in Area Code 567
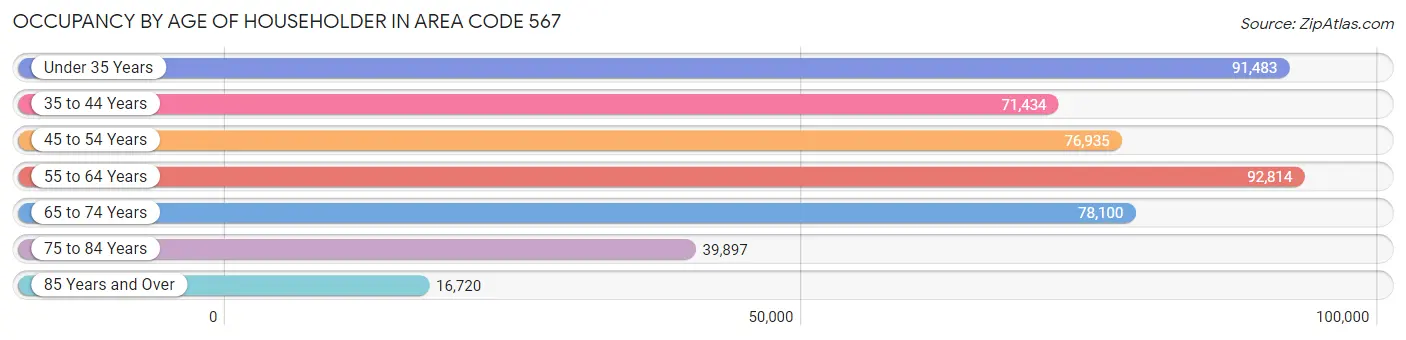
| Age Bracket | # Households | % Households |
| Under 35 Years | 91,483 | 19.6% |
| 35 to 44 Years | 71,434 | 15.3% |
| 45 to 54 Years | 76,935 | 16.5% |
| 55 to 64 Years | 92,814 | 19.9% |
| 65 to 74 Years | 78,100 | 16.7% |
| 75 to 84 Years | 39,897 | 8.5% |
| 85 Years and Over | 16,720 | 3.6% |
| Total | 467,383 | 100.0% |
Housing Finances in Area Code 567
Median Income by Occupancy in Area Code 567
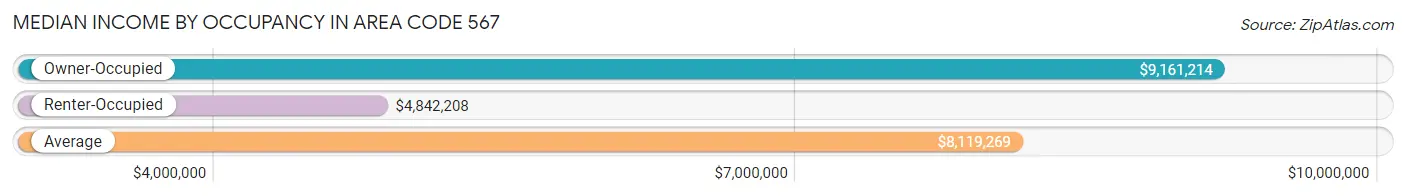
| Occupancy Type | # Households | Median Income |
| Owner-Occupied | 320,527 (68.6%) | $9,161,214 |
| Renter-Occupied | 146,856 (31.4%) | $4,842,208 |
| Average | 467,383 (100.0%) | $8,119,269 |
Occupancy by Householder Income Bracket in Area Code 567
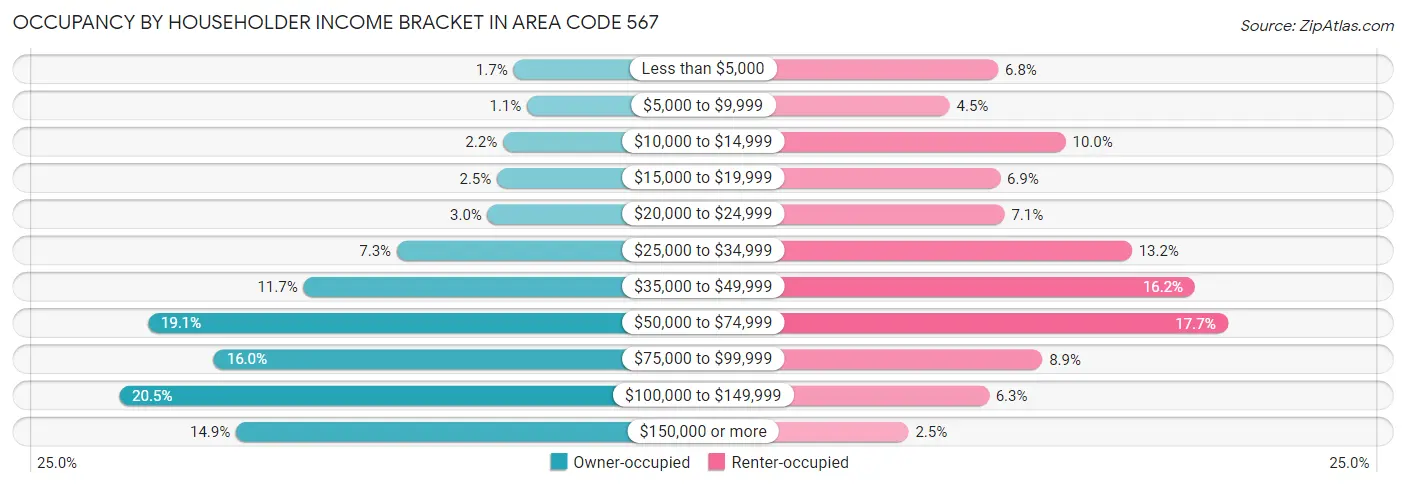
| Income Bracket | Owner-occupied | Renter-occupied |
| Less than $5,000 | 5,511 (1.7%) | 9,971 (6.8%) |
| $5,000 to $9,999 | 3,426 (1.1%) | 6,578 (4.5%) |
| $10,000 to $14,999 | 7,130 (2.2%) | 14,690 (10.0%) |
| $15,000 to $19,999 | 8,012 (2.5%) | 10,107 (6.9%) |
| $20,000 to $24,999 | 9,469 (2.9%) | 10,405 (7.1%) |
| $25,000 to $34,999 | 23,294 (7.3%) | 19,313 (13.2%) |
| $35,000 to $49,999 | 37,573 (11.7%) | 23,731 (16.2%) |
| $50,000 to $74,999 | 61,306 (19.1%) | 26,005 (17.7%) |
| $75,000 to $99,999 | 51,238 (16.0%) | 13,050 (8.9%) |
| $100,000 to $149,999 | 65,699 (20.5%) | 9,312 (6.3%) |
| $150,000 or more | 47,869 (14.9%) | 3,694 (2.5%) |
| Total | 320,527 (100.0%) | 146,856 (100.0%) |
Monthly Housing Cost Tiers in Area Code 567
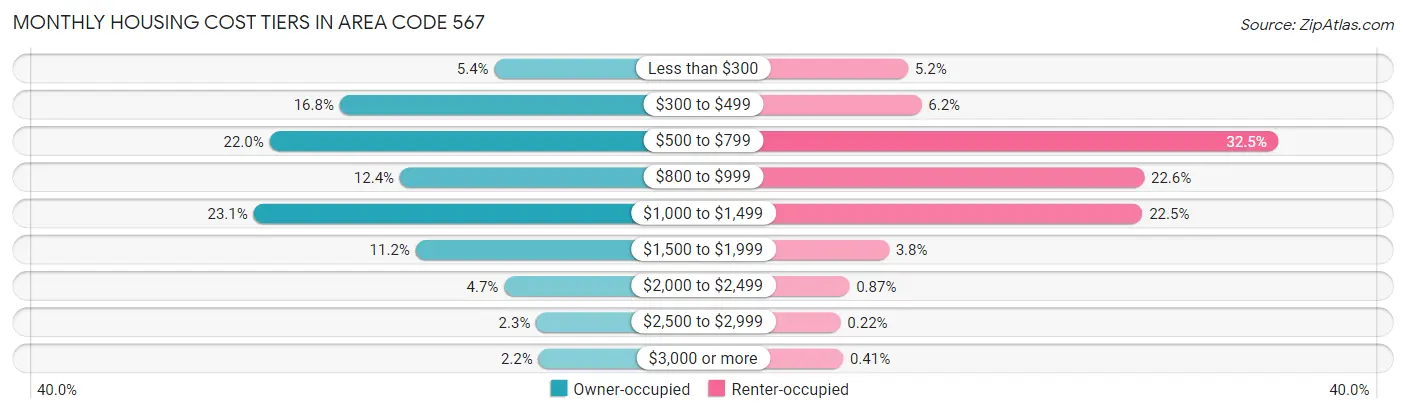
| Monthly Cost | Owner-occupied | Renter-occupied |
| Less than $300 | 17,317 (5.4%) | 7,618 (5.2%) |
| $300 to $499 | 53,809 (16.8%) | 9,082 (6.2%) |
| $500 to $799 | 70,399 (22.0%) | 47,718 (32.5%) |
| $800 to $999 | 39,625 (12.4%) | 33,167 (22.6%) |
| $1,000 to $1,499 | 74,154 (23.1%) | 32,965 (22.5%) |
| $1,500 to $1,999 | 35,913 (11.2%) | 5,550 (3.8%) |
| $2,000 to $2,499 | 15,005 (4.7%) | 1,282 (0.9%) |
| $2,500 to $2,999 | 7,427 (2.3%) | 325 (0.2%) |
| $3,000 or more | 6,878 (2.1%) | 598 (0.4%) |
| Total | 320,527 (100.0%) | 146,856 (100.0%) |
Physical Housing Characteristics in Area Code 567
Housing Structures in Area Code 567
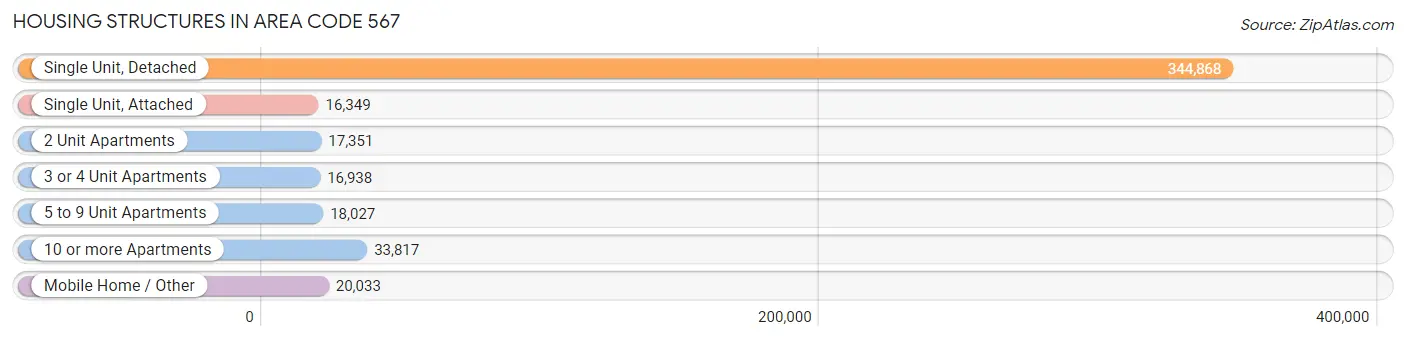
| Structure Type | # Housing Units | % Housing Units |
| Single Unit, Detached | 344,868 | 73.8% |
| Single Unit, Attached | 16,349 | 3.5% |
| 2 Unit Apartments | 17,351 | 3.7% |
| 3 or 4 Unit Apartments | 16,938 | 3.6% |
| 5 to 9 Unit Apartments | 18,027 | 3.9% |
| 10 or more Apartments | 33,817 | 7.2% |
| Mobile Home / Other | 20,033 | 4.3% |
| Total | 467,383 | 100.0% |
Housing Structures by Occupancy in Area Code 567
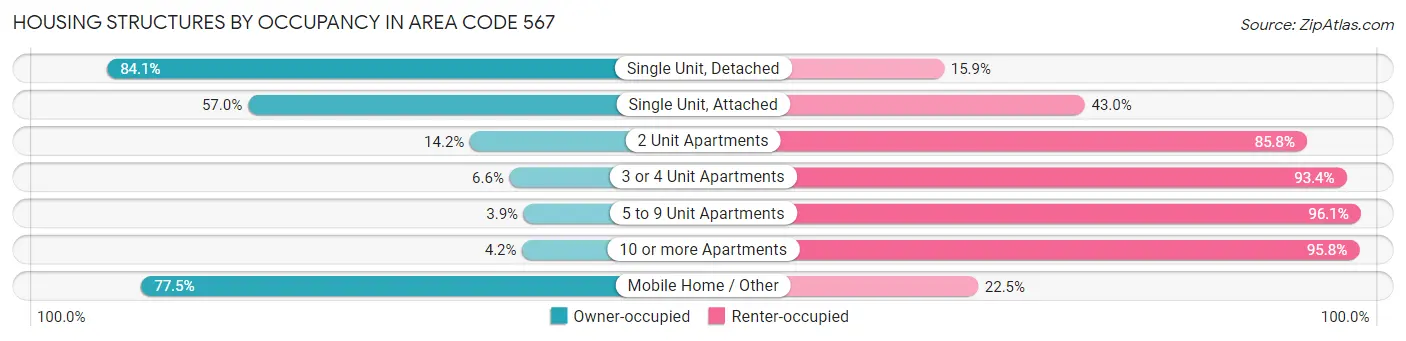
| Structure Type | Owner-occupied | Renter-occupied |
| Single Unit, Detached | 289,992 (84.1%) | 54,876 (15.9%) |
| Single Unit, Attached | 9,318 (57.0%) | 7,031 (43.0%) |
| 2 Unit Apartments | 2,466 (14.2%) | 14,885 (85.8%) |
| 3 or 4 Unit Apartments | 1,117 (6.6%) | 15,821 (93.4%) |
| 5 to 9 Unit Apartments | 695 (3.9%) | 17,332 (96.1%) |
| 10 or more Apartments | 1,408 (4.2%) | 32,409 (95.8%) |
| Mobile Home / Other | 15,531 (77.5%) | 4,502 (22.5%) |
| Total | 320,527 (68.6%) | 146,856 (31.4%) |
Housing Structures by Number of Rooms in Area Code 567
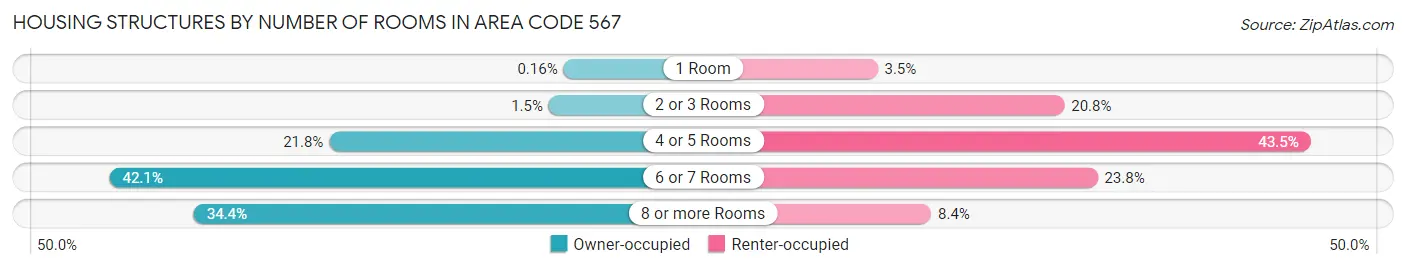
| Number of Rooms | Owner-occupied | Renter-occupied |
| 1 Room | 509 (0.2%) | 5,116 (3.5%) |
| 2 or 3 Rooms | 4,875 (1.5%) | 30,466 (20.7%) |
| 4 or 5 Rooms | 69,956 (21.8%) | 63,910 (43.5%) |
| 6 or 7 Rooms | 135,078 (42.1%) | 34,981 (23.8%) |
| 8 or more Rooms | 110,109 (34.4%) | 12,383 (8.4%) |
| Total | 320,527 (100.0%) | 146,856 (100.0%) |
Housing Structure by Heating Type in Area Code 567
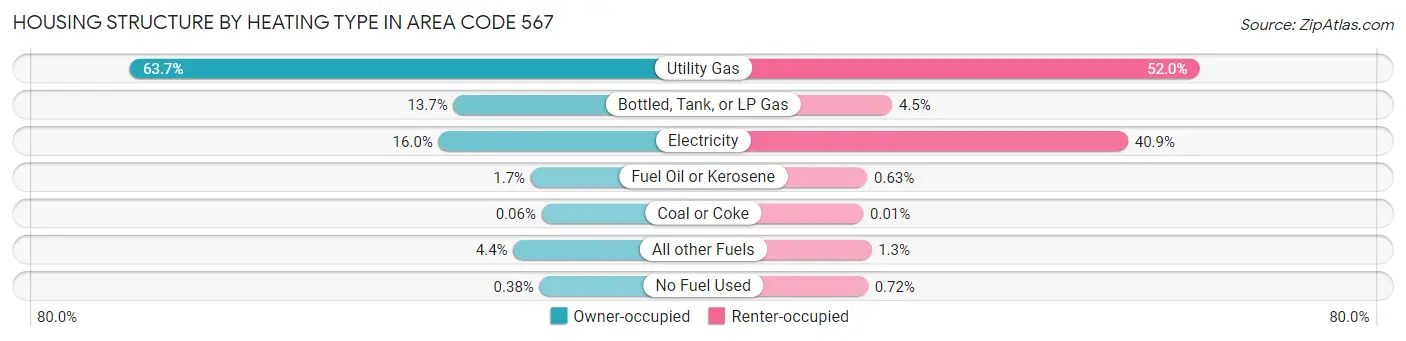
| Heating Type | Owner-occupied | Renter-occupied |
| Utility Gas | 204,178 (63.7%) | 76,330 (52.0%) |
| Bottled, Tank, or LP Gas | 43,913 (13.7%) | 6,579 (4.5%) |
| Electricity | 51,261 (16.0%) | 60,104 (40.9%) |
| Fuel Oil or Kerosene | 5,550 (1.7%) | 920 (0.6%) |
| Coal or Coke | 194 (0.1%) | 15 (0.0%) |
| All other Fuels | 14,199 (4.4%) | 1,857 (1.3%) |
| No Fuel Used | 1,232 (0.4%) | 1,051 (0.7%) |
| Total | 320,527 (100.0%) | 146,856 (100.0%) |
Household Vehicle Usage in Area Code 567
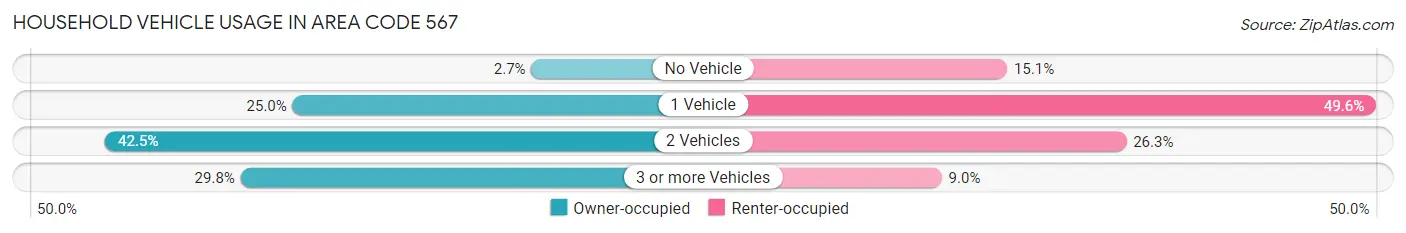
| Vehicles per Household | Owner-occupied | Renter-occupied |
| No Vehicle | 8,626 (2.7%) | 22,215 (15.1%) |
| 1 Vehicle | 80,079 (25.0%) | 72,811 (49.6%) |
| 2 Vehicles | 136,207 (42.5%) | 38,562 (26.3%) |
| 3 or more Vehicles | 95,615 (29.8%) | 13,268 (9.0%) |
| Total | 320,527 (100.0%) | 146,856 (100.0%) |
Real Estate & Mortgages in Area Code 567
Real Estate and Mortgage Overview in Area Code 567
| Characteristic | Without Mortgage | With Mortgage |
| Housing Units | 134,010 | 186,517 |
| Median Property Value | $17,865,500 | $19,235,900 |
| Median Household Income | $7,154,000 | $34,512 |
| Monthly Housing Costs | $59,121 | $6,586 |
| Real Estate Taxes | $210,978 | $4,128 |
Property Value by Mortgage Status in Area Code 567
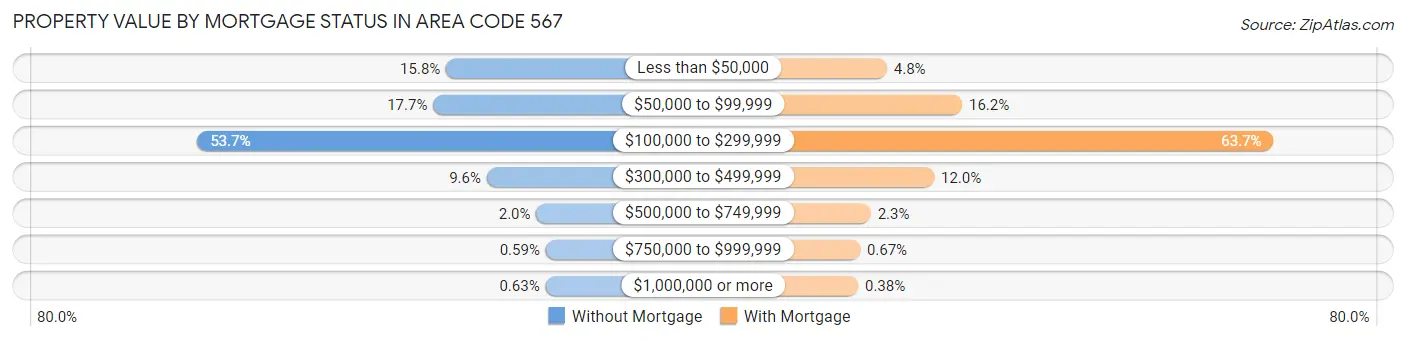
| Property Value | Without Mortgage | With Mortgage |
| Less than $50,000 | 21,123 (15.8%) | 8,898 (4.8%) |
| $50,000 to $99,999 | 23,757 (17.7%) | 30,271 (16.2%) |
| $100,000 to $299,999 | 71,950 (53.7%) | 118,759 (63.7%) |
| $300,000 to $499,999 | 12,830 (9.6%) | 22,312 (12.0%) |
| $500,000 to $749,999 | 2,712 (2.0%) | 4,312 (2.3%) |
| $750,000 to $999,999 | 790 (0.6%) | 1,257 (0.7%) |
| $1,000,000 or more | 848 (0.6%) | 708 (0.4%) |
| Total | 134,010 (100.0%) | 186,517 (100.0%) |
Household Income by Mortgage Status in Area Code 567
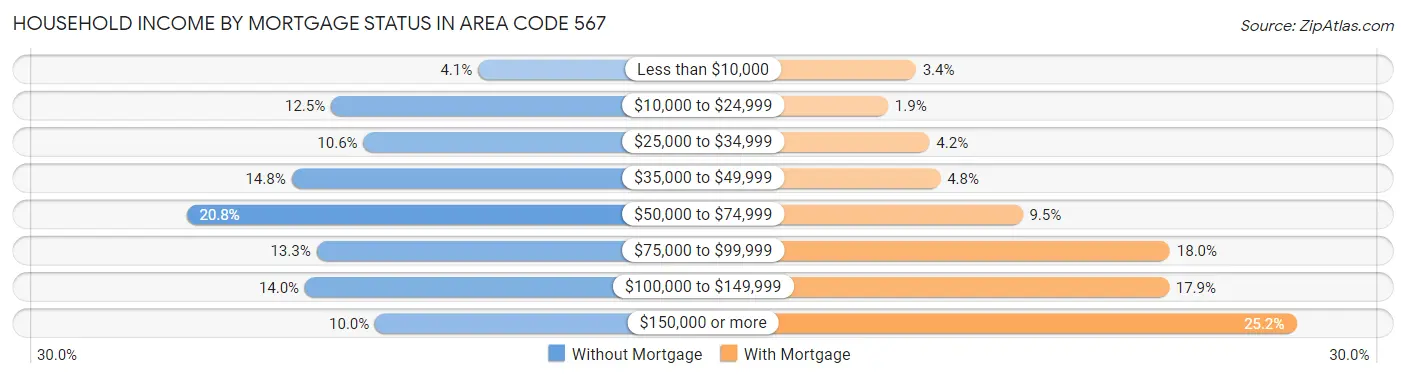
| Household Income | Without Mortgage | With Mortgage |
| Less than $10,000 | 5,482 (4.1%) | 6,417 (3.4%) |
| $10,000 to $24,999 | 16,737 (12.5%) | 3,455 (1.8%) |
| $25,000 to $34,999 | 14,260 (10.6%) | 7,874 (4.2%) |
| $35,000 to $49,999 | 19,770 (14.7%) | 9,034 (4.8%) |
| $50,000 to $74,999 | 27,811 (20.7%) | 17,803 (9.5%) |
| $75,000 to $99,999 | 17,852 (13.3%) | 33,495 (18.0%) |
| $100,000 to $149,999 | 18,741 (14.0%) | 33,386 (17.9%) |
| $150,000 or more | 13,357 (10.0%) | 46,958 (25.2%) |
| Total | 134,010 (100.0%) | 186,517 (100.0%) |
Property Value to Household Income Ratio in Area Code 567
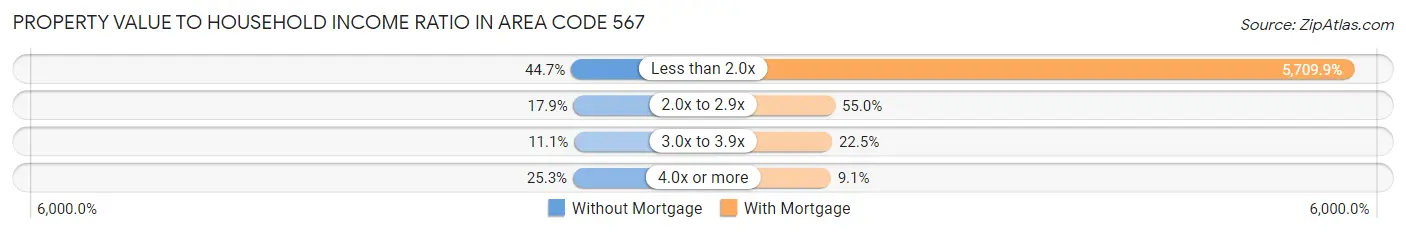
| Value-to-Income Ratio | Without Mortgage | With Mortgage |
| Less than 2.0x | 59,858 (44.7%) | 10,650,016 (5,709.9%) |
| 2.0x to 2.9x | 23,996 (17.9%) | 102,508 (55.0%) |
| 3.0x to 3.9x | 14,851 (11.1%) | 42,015 (22.5%) |
| 4.0x or more | 33,907 (25.3%) | 16,875 (9.0%) |
| Total | 134,010 (100.0%) | 186,517 (100.0%) |
Real Estate Taxes by Mortgage Status in Area Code 567
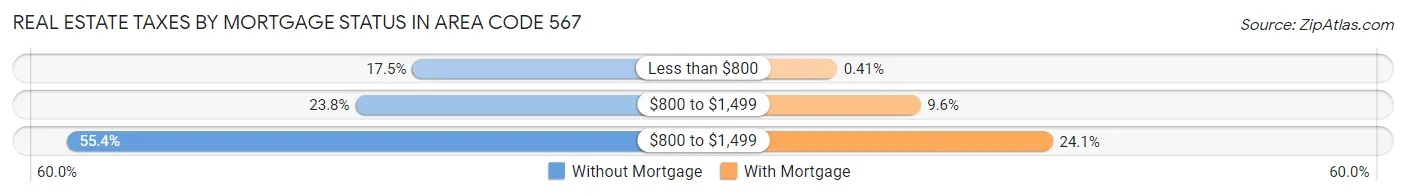
| Property Taxes | Without Mortgage | With Mortgage |
| Less than $800 | 23,484 (17.5%) | 762 (0.4%) |
| $800 to $1,499 | 31,827 (23.7%) | 17,837 (9.6%) |
| $800 to $1,499 | 74,245 (55.4%) | 44,861 (24.0%) |
| Total | 134,010 (100.0%) | 186,517 (100.0%) |
Health & Disability in Area Code 567
Health Insurance Coverage by Age in Area Code 567
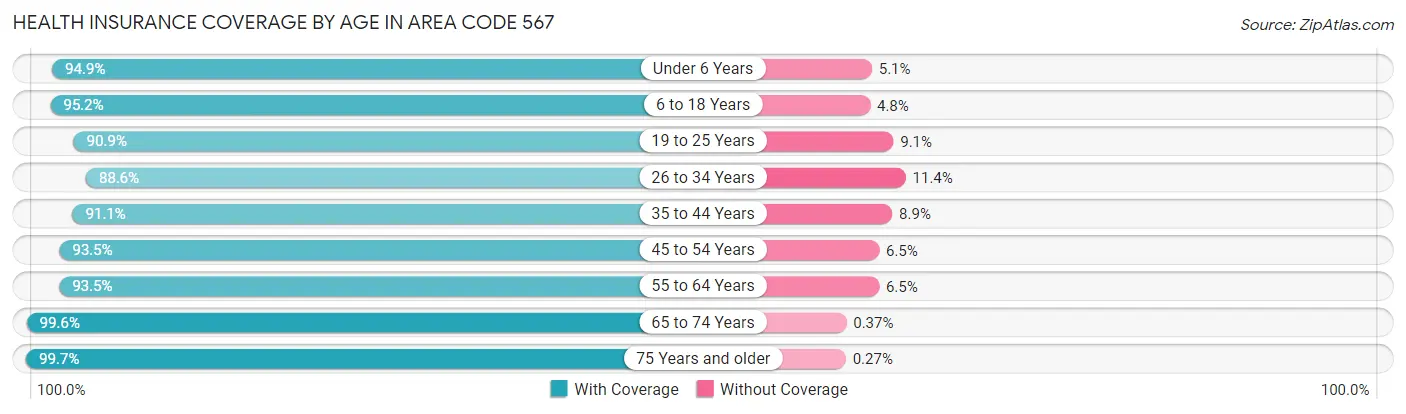
| Age Bracket | With Coverage | Without Coverage |
| Under 6 Years | 73,688 (94.9%) | 3,982 (5.1%) |
| 6 to 18 Years | 178,599 (95.2%) | 9,012 (4.8%) |
| 19 to 25 Years | 95,936 (90.9%) | 9,656 (9.1%) |
| 26 to 34 Years | 109,296 (88.6%) | 14,109 (11.4%) |
| 35 to 44 Years | 118,647 (91.1%) | 11,635 (8.9%) |
| 45 to 54 Years | 124,563 (93.5%) | 8,628 (6.5%) |
| 55 to 64 Years | 143,968 (93.5%) | 9,948 (6.5%) |
| 65 to 74 Years | 121,727 (99.6%) | 447 (0.4%) |
| 75 Years and older | 81,275 (99.7%) | 217 (0.3%) |
| Total | 1,047,699 (93.9%) | 67,634 (6.1%) |
Health Insurance Coverage by Citizenship Status in Area Code 567
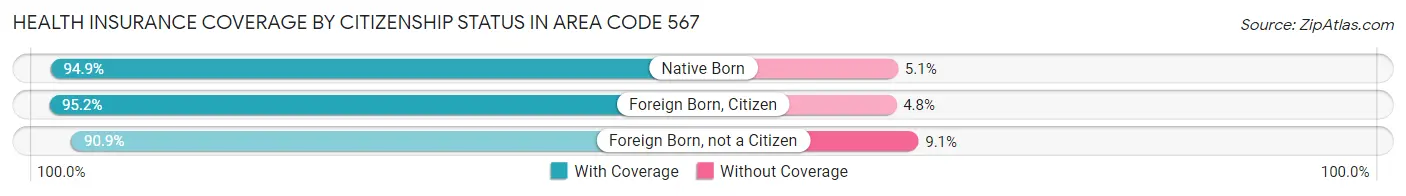
| Citizenship Status | With Coverage | Without Coverage |
| Native Born | 73,688 (94.9%) | 3,982 (5.1%) |
| Foreign Born, Citizen | 178,599 (95.2%) | 9,012 (4.8%) |
| Foreign Born, not a Citizen | 95,936 (90.9%) | 9,656 (9.1%) |
Health Insurance Coverage by Household Income in Area Code 567
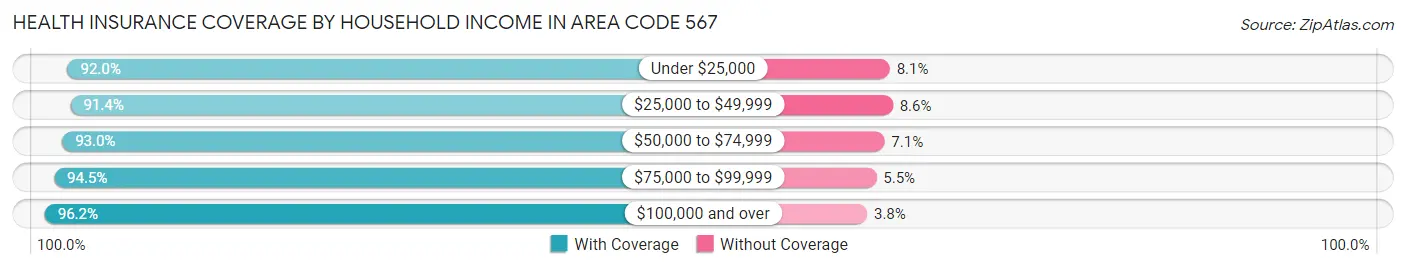
| Household Income | With Coverage | Without Coverage |
| Under $25,000 | 126,110 (91.9%) | 11,036 (8.1%) |
| $25,000 to $49,999 | 183,747 (91.4%) | 17,286 (8.6%) |
| $50,000 to $74,999 | 188,804 (92.9%) | 14,311 (7.0%) |
| $75,000 to $99,999 | 161,857 (94.5%) | 9,477 (5.5%) |
| $100,000 and over | 376,366 (96.2%) | 14,825 (3.8%) |
Public vs Private Health Insurance Coverage by Age in Area Code 567
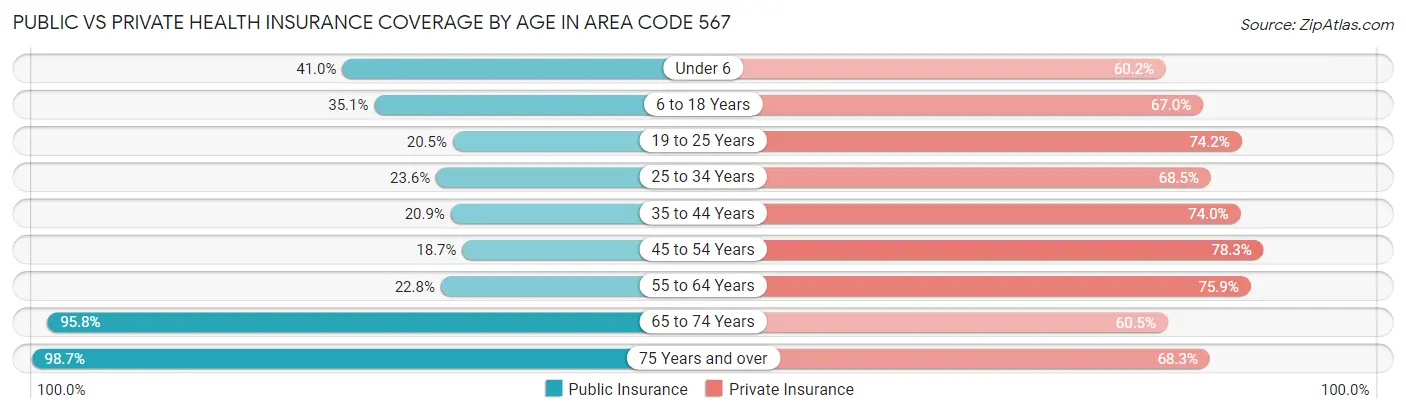
| Age Bracket | Public Insurance | Private Insurance |
| Under 6 | 31,870 (41.0%) | 46,727 (60.2%) |
| 6 to 18 Years | 65,824 (35.1%) | 125,774 (67.0%) |
| 19 to 25 Years | 21,670 (20.5%) | 78,331 (74.2%) |
| 25 to 34 Years | 29,147 (23.6%) | 84,512 (68.5%) |
| 35 to 44 Years | 27,236 (20.9%) | 96,379 (74.0%) |
| 45 to 54 Years | 24,954 (18.7%) | 104,281 (78.3%) |
| 55 to 64 Years | 35,029 (22.8%) | 116,774 (75.9%) |
| 65 to 74 Years | 117,046 (95.8%) | 73,940 (60.5%) |
| 75 Years and over | 80,441 (98.7%) | 55,649 (68.3%) |
| Total | 433,217 (38.8%) | 782,367 (70.2%) |
Disability Status by Sex by Age in Area Code 567
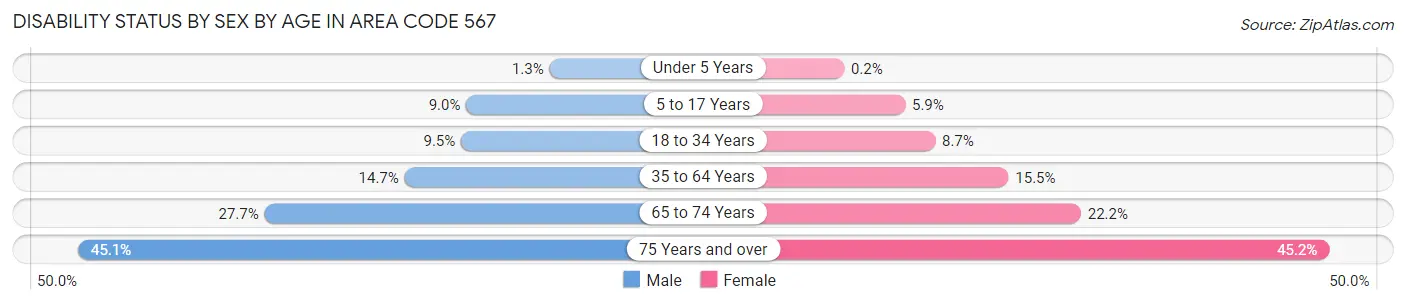
| Age Bracket | Male | Female |
| Under 5 Years | 406 (1.3%) | 65 (0.2%) |
| 5 to 17 Years | 8,685 (9.0%) | 5,265 (5.9%) |
| 18 to 34 Years | 11,808 (9.5%) | 10,327 (8.6%) |
| 35 to 64 Years | 30,656 (14.7%) | 32,353 (15.5%) |
| 65 to 74 Years | 16,279 (27.7%) | 14,077 (22.2%) |
| 75 Years and over | 14,958 (45.1%) | 21,841 (45.2%) |
Disability Class by Sex by Age in Area Code 567
Disability Class: Hearing Difficulty
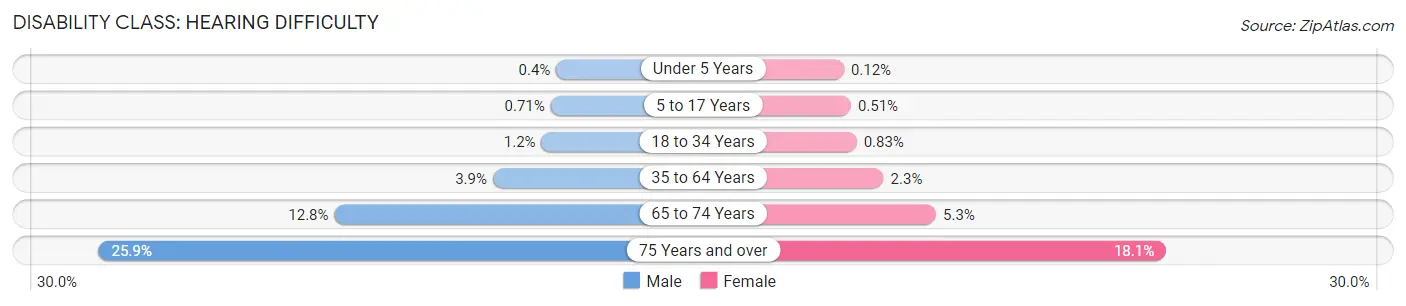
| Age Bracket | Male | Female |
| Under 5 Years | 128 (0.4%) | 40 (0.1%) |
| 5 to 17 Years | 683 (0.7%) | 455 (0.5%) |
| 18 to 34 Years | 1,515 (1.2%) | 986 (0.8%) |
| 35 to 64 Years | 8,171 (3.9%) | 4,873 (2.3%) |
| 65 to 74 Years | 7,486 (12.8%) | 3,335 (5.2%) |
| 75 Years and over | 8,593 (25.9%) | 8,715 (18.0%) |
Disability Class: Vision Difficulty
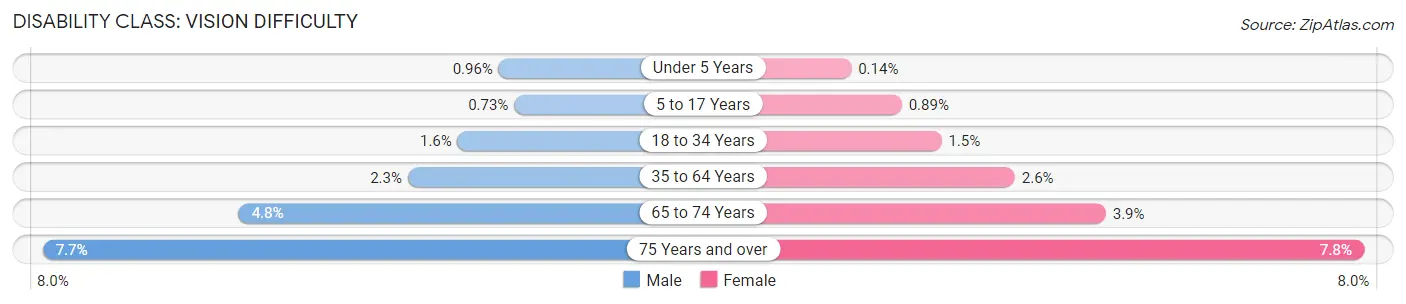
| Age Bracket | Male | Female |
| Under 5 Years | 306 (1.0%) | 47 (0.1%) |
| 5 to 17 Years | 707 (0.7%) | 796 (0.9%) |
| 18 to 34 Years | 1,955 (1.6%) | 1,766 (1.5%) |
| 35 to 64 Years | 4,812 (2.3%) | 5,372 (2.6%) |
| 65 to 74 Years | 2,829 (4.8%) | 2,487 (3.9%) |
| 75 Years and over | 2,568 (7.7%) | 3,743 (7.7%) |
Disability Class: Cognitive Difficulty
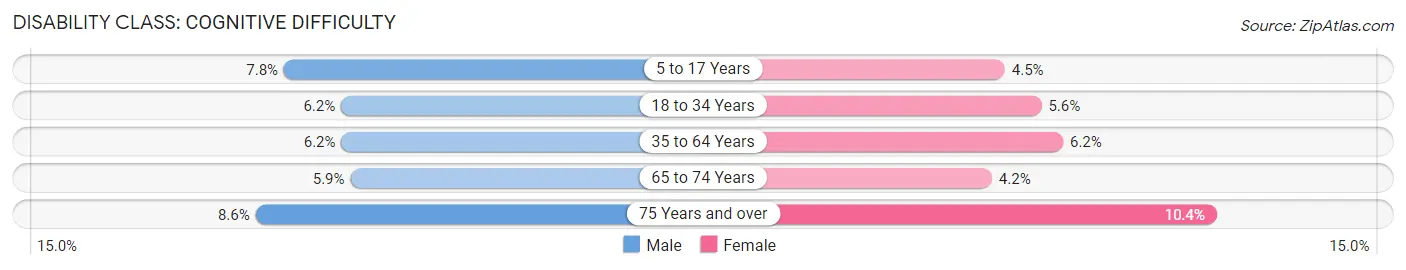
| Age Bracket | Male | Female |
| 5 to 17 Years | 7,497 (7.8%) | 4,075 (4.5%) |
| 18 to 34 Years | 7,695 (6.2%) | 6,634 (5.6%) |
| 35 to 64 Years | 12,867 (6.2%) | 12,892 (6.2%) |
| 65 to 74 Years | 3,482 (5.9%) | 2,650 (4.2%) |
| 75 Years and over | 2,845 (8.6%) | 5,041 (10.4%) |
Disability Class: Ambulatory Difficulty
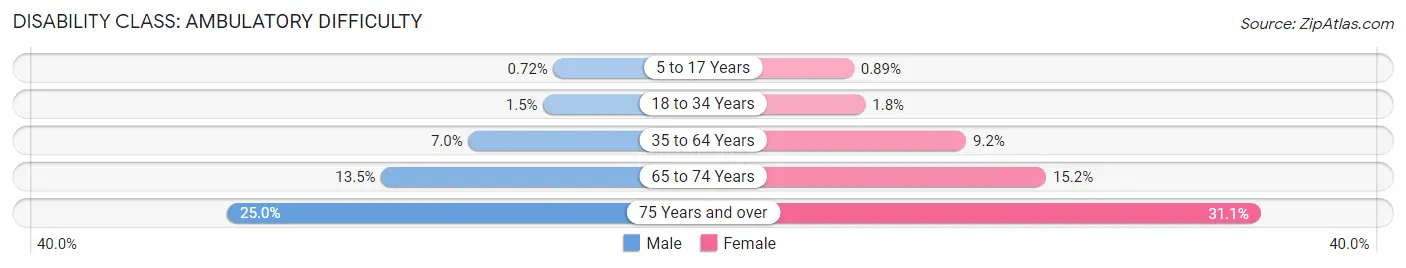
| Age Bracket | Male | Female |
| 5 to 17 Years | 696 (0.7%) | 795 (0.9%) |
| 18 to 34 Years | 1,842 (1.5%) | 2,094 (1.8%) |
| 35 to 64 Years | 14,657 (7.0%) | 19,313 (9.2%) |
| 65 to 74 Years | 7,929 (13.5%) | 9,620 (15.2%) |
| 75 Years and over | 8,287 (25.0%) | 15,014 (31.1%) |
Disability Class: Self-Care Difficulty
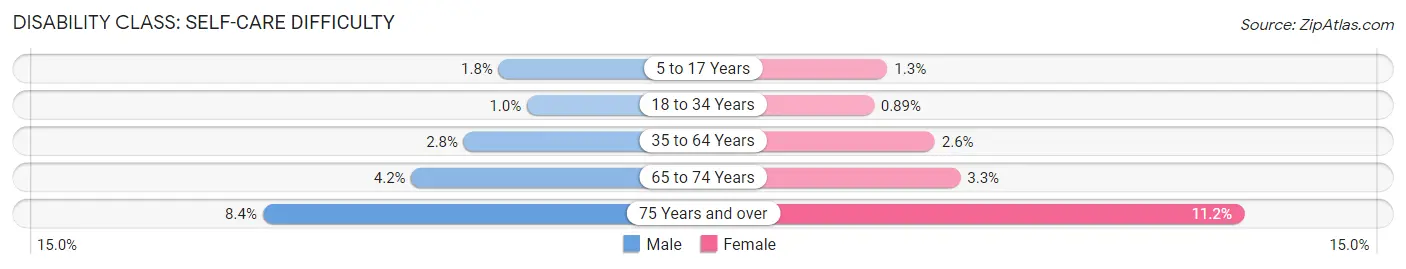
| Age Bracket | Male | Female |
| 5 to 17 Years | 1,733 (1.8%) | 1,140 (1.3%) |
| 18 to 34 Years | 1,258 (1.0%) | 1,057 (0.9%) |
| 35 to 64 Years | 5,761 (2.8%) | 5,410 (2.6%) |
| 65 to 74 Years | 2,481 (4.2%) | 2,094 (3.3%) |
| 75 Years and over | 2,778 (8.4%) | 5,401 (11.2%) |
Technology Access in Area Code 567
Computing Device Access in Area Code 567
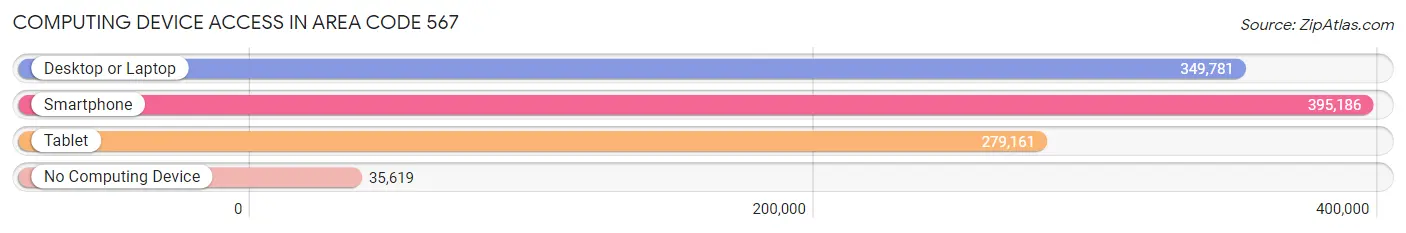
| Device Type | # Households | % Households |
| Desktop or Laptop | 349,781 | 74.8% |
| Smartphone | 395,186 | 84.6% |
| Tablet | 279,161 | 59.7% |
| No Computing Device | 35,619 | 7.6% |
| Total | 467,383 | 100.0% |
Internet Access in Area Code 567
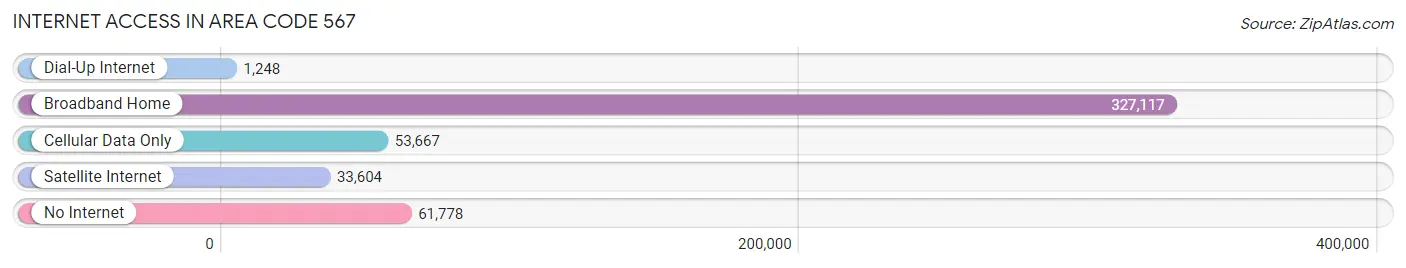
| Internet Type | # Households | % Households |
| Dial-Up Internet | 1,248 | 0.3% |
| Broadband Home | 327,117 | 70.0% |
| Cellular Data Only | 53,667 | 11.5% |
| Satellite Internet | 33,604 | 7.2% |
| No Internet | 61,778 | 13.2% |
| Total | 467,383 | 100.0% |
Area Code 567 Summary
Geography
Area code 567 is located in the state of Ohio and serves the northwest corner of the state. It covers the cities of Toledo, Mansfield, and Youngstown, as well as the surrounding areas.
Social
Area code 567 is home to a diverse population of people from all walks of life. The area is known for its vibrant culture, with a variety of restaurants, shops, and entertainment venues.
Economics
Area code 567 is home to a strong economy, with a variety of industries and businesses. The area is known for its manufacturing and automotive industries, as well as its agricultural and tourism sectors.
Demographics
Area code 567 is home to a population of over 1.5 million people. The area is predominantly white, with a large Hispanic population. The median household income is around $50,000, and the unemployment rate is around 4%.
Common Questions
What is Per Capita Income in Area Code 567?
Per Capita income in Area Code 567 is $33,355.
What is the Median Family Income in Area Code 567?
Median Family Income in Area Code 567 is $81,749.
What is the Median Household income in Area Code 567?
Median Household Income in Area Code 567 is $68,229.
What is Income or Wage Gap in Area Code 567?
Income or Wage Gap in Area Code 567 is 32.7%.
Women in Area Code 567 earn 67.3 cents for every dollar earned by a man.
What is Family Income Deficit in Area Code 567?
Family Income Deficit in Area Code 567 is $10,633.
Families that are below poverty line in Area Code 567 earn $10,633 less on average than the poverty threshold level.
What is Inequality or Gini Index in Area Code 567?
Inequality or Gini Index in Area Code 567 is 47.42.
What is the Total Population of Area Code 567?
Total Population of Area Code 567 is 1,131,059.
What is the Total Male Population of Area Code 567?
Total Male Population of Area Code 567 is 561,127.
What is the Total Female Population of Area Code 567?
Total Female Population of Area Code 567 is 569,932.
What is the Ratio of Males per 100 Females in Area Code 567?
There are 98.46 Males per 100 Females in Area Code 567.
What is the Ratio of Females per 100 Males in Area Code 567?
There are 101.57 Females per 100 Males in Area Code 567.
What is the Median Population Age in Area Code 567?
Median Population Age in Area Code 567 is 41.1 Years.
What is the Average Family Size in Area Code 567
Average Family Size in Area Code 567 is 3.0 People.
What is the Average Household Size in Area Code 567
Average Household Size in Area Code 567 is 2.5 People.
How Large is the Labor Force in Area Code 567?
There are 567,315 People in the Labor Forcein in Area Code 567.
What is the Percentage of People in the Labor Force in Area Code 567?
62.3% of People are in the Labor Force in Area Code 567.
What is the Unemployment Rate in Area Code 567?
Unemployment Rate in Area Code 567 is 4.2%.