Area Code 234 Map & Demographics
Area Code 234 Map
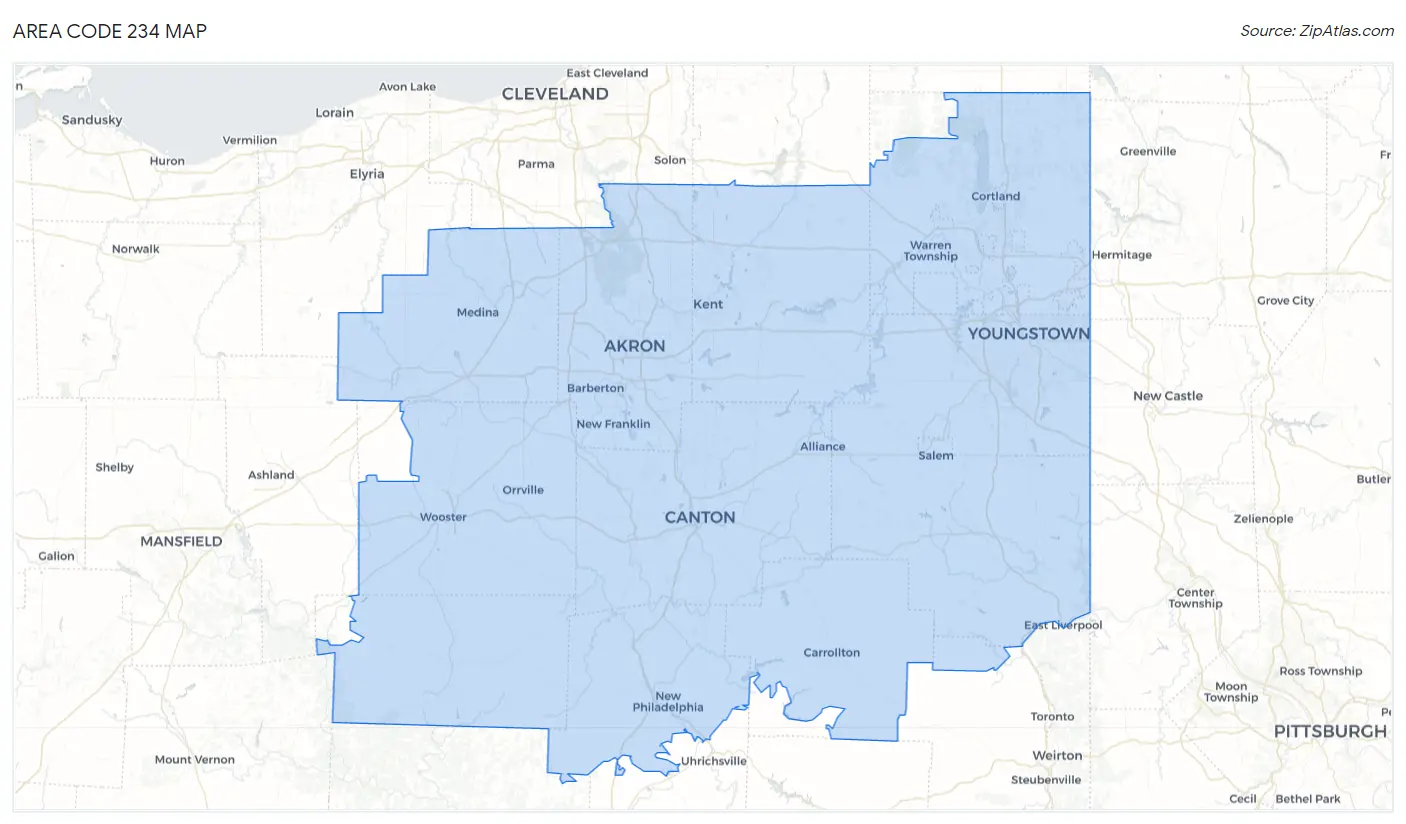
Area Code 234 Overview
$33,837
PER CAPITA INCOME
$82,616
AVG FAMILY INCOME
$67,095
AVG HOUSEHOLD INCOME
33.0%
WAGE / INCOME GAP [ % ]
67.0¢/ $1
WAGE / INCOME GAP [ $ ]
$10,745
FAMILY INCOME DEFICIT
44.95
INEQUALITY / GINI INDEX
1,167,004
TOTAL POPULATION
578,504
MALE POPULATION
588,500
FEMALE POPULATION
98.30
MALES / 100 FEMALES
101.73
FEMALES / 100 MALES
43.1
MEDIAN AGE
3.0
AVG FAMILY SIZE
2.4
AVG HOUSEHOLD SIZE
581,440
LABOR FORCE [ PEOPLE ]
61.0%
PERCENT IN LABOR FORCE
5.7%
UNEMPLOYMENT RATE
Income in Area Code 234
Income Overview in Area Code 234
Per Capita Income in Area Code 234 is $33,837, while median incomes of families and households are $82,616 and $67,095 respectively.
| Characteristic | Number | Measure |
| Per Capita Income | 1,167,004 | $33,837 |
| Median Family Income | 306,841 | $82,616 |
| Mean Family Income | 306,841 | $10,578,703 |
| Median Household Income | 476,274 | $67,095 |
| Mean Household Income | 476,274 | $9,175,845 |
| Income Deficit | 306,841 | $10,745 |
| Wage / Income Gap (%) | 1,167,004 | 33.04% |
| Wage / Income Gap ($) | 1,167,004 | 66.96¢ per $1 |
| Gini / Inequality Index | 1,167,004 | 44.95 |
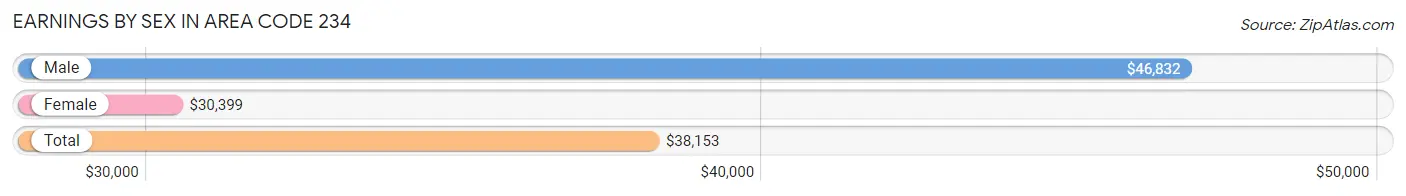
Earnings by Sex in Area Code 234
Average Earnings in Area Code 234 are $38,153, $46,832 for men and $30,399 for women, a difference of 35.1%.
| Sex | Number | Average Earnings |
| Male | 331,671 (53.1%) | $46,832 |
| Female | 292,654 (46.9%) | $30,399 |
| Total | 624,325 (100.0%) | $38,153 |
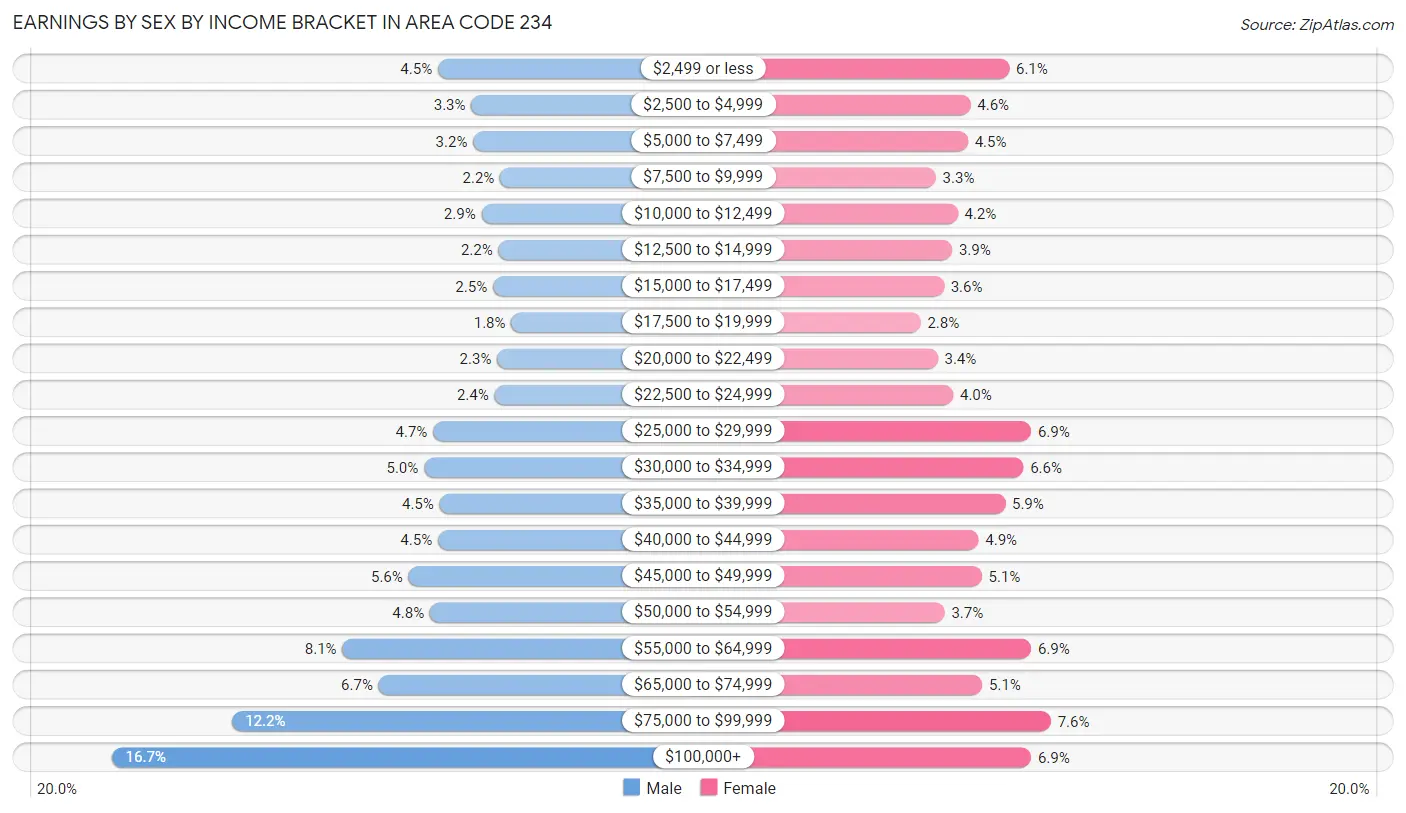
Earnings by Sex by Income Bracket in Area Code 234
The most common earnings brackets in Area Code 234 are $100,000+ for men (55,392 | 16.7%) and $75,000 to $99,999 for women (22,351 | 7.6%).
| Income | Male | Female |
| $2,499 or less | 14,960 (4.5%) | 17,793 (6.1%) |
| $2,500 to $4,999 | 10,803 (3.3%) | 13,549 (4.6%) |
| $5,000 to $7,499 | 10,587 (3.2%) | 13,258 (4.5%) |
| $7,500 to $9,999 | 7,229 (2.2%) | 9,738 (3.3%) |
| $10,000 to $12,499 | 9,559 (2.9%) | 12,155 (4.2%) |
| $12,500 to $14,999 | 7,431 (2.2%) | 11,539 (3.9%) |
| $15,000 to $17,499 | 8,137 (2.5%) | 10,633 (3.6%) |
| $17,500 to $19,999 | 5,824 (1.8%) | 8,067 (2.8%) |
| $20,000 to $22,499 | 7,599 (2.3%) | 9,942 (3.4%) |
| $22,500 to $24,999 | 7,911 (2.4%) | 11,635 (4.0%) |
| $25,000 to $29,999 | 15,568 (4.7%) | 20,179 (6.9%) |
| $30,000 to $34,999 | 16,682 (5.0%) | 19,346 (6.6%) |
| $35,000 to $39,999 | 14,765 (4.4%) | 17,346 (5.9%) |
| $40,000 to $44,999 | 14,965 (4.5%) | 14,422 (4.9%) |
| $45,000 to $49,999 | 18,610 (5.6%) | 14,765 (5.1%) |
| $50,000 to $54,999 | 15,962 (4.8%) | 10,702 (3.7%) |
| $55,000 to $64,999 | 26,842 (8.1%) | 20,193 (6.9%) |
| $65,000 to $74,999 | 22,317 (6.7%) | 14,851 (5.1%) |
| $75,000 to $99,999 | 40,528 (12.2%) | 22,351 (7.6%) |
| $100,000+ | 55,392 (16.7%) | 20,190 (6.9%) |
| Total | 331,671 (100.0%) | 292,654 (100.0%) |
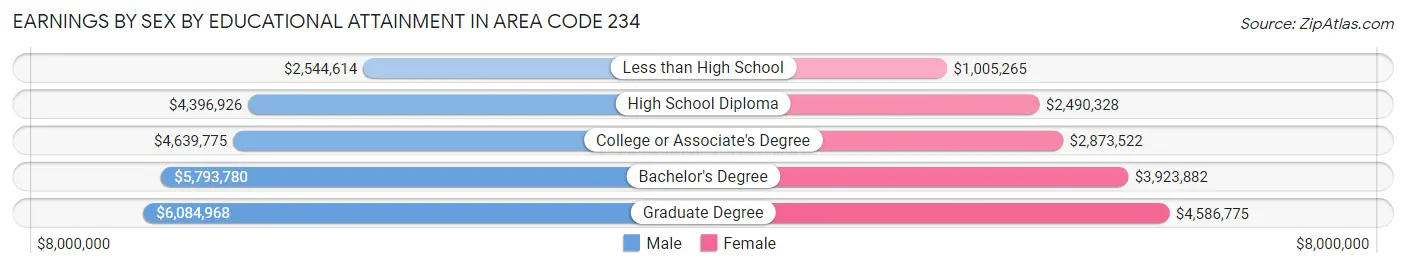
Earnings by Sex by Educational Attainment in Area Code 234
Average earnings in Area Code 234 are $5,356,124 for men and $3,454,062 for women, a difference of 35.5%. Men with an educational attainment of graduate degree enjoy the highest average annual earnings of $6,084,968, while those with less than high school education earn the least with $2,544,614. Women with an educational attainment of graduate degree earn the most with the average annual earnings of $4,586,775, while those with less than high school education have the smallest earnings of $1,005,265.
| Educational Attainment | Male Income | Female Income |
| Less than High School | $2,544,614 | $1,005,265 |
| High School Diploma | $4,396,926 | $2,490,328 |
| College or Associate's Degree | $4,639,775 | $2,873,522 |
| Bachelor's Degree | $5,793,780 | $3,923,882 |
| Graduate Degree | $6,084,968 | $4,586,775 |
| Total | $5,356,124 | $3,454,062 |
Family Income in Area Code 234
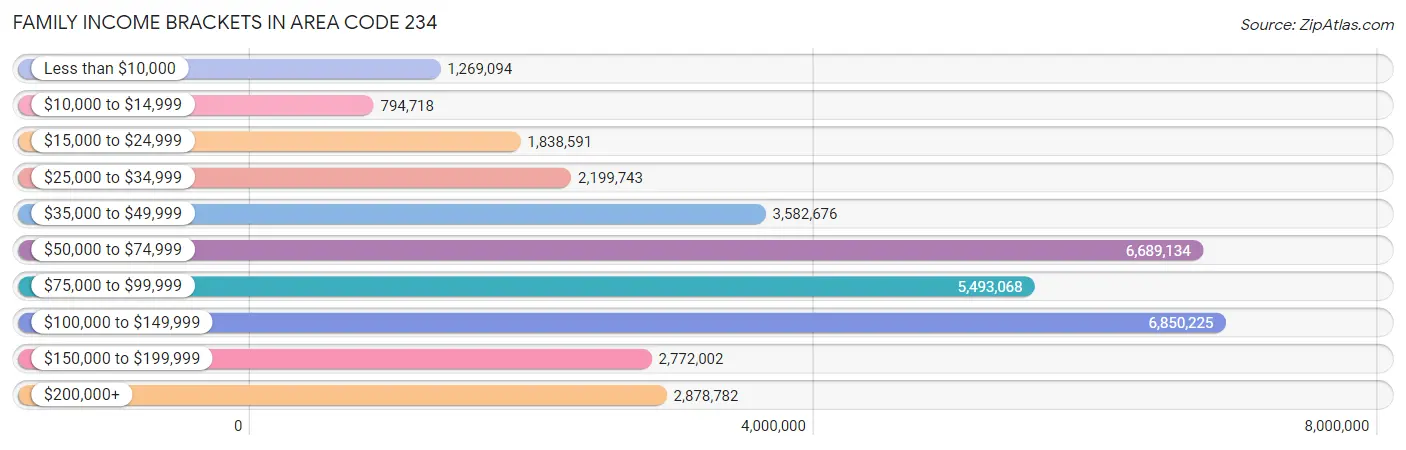
Family Income Brackets in Area Code 234
According to the Area Code 234 family income data, there are 6,850,225 families falling into the $100,000 to $149,999 income range, which is the most common income bracket and makes up 2,232.5% of all families. Conversely, the $10,000 to $14,999 income bracket is the least frequent group with only 794,718 families (259.0%) belonging to this category.
| Income Bracket | # Families | % Families |
| Less than $10,000 | 1,269,094 | 413.6% |
| $10,000 to $14,999 | 794,718 | 259.0% |
| $15,000 to $24,999 | 1,838,591 | 599.2% |
| $25,000 to $34,999 | 2,199,743 | 716.9% |
| $35,000 to $49,999 | 3,582,676 | 1,167.6% |
| $50,000 to $74,999 | 6,689,134 | 2,180.0% |
| $75,000 to $99,999 | 5,493,068 | 1,790.2% |
| $100,000 to $149,999 | 6,850,225 | 2,232.5% |
| $150,000 to $199,999 | 2,772,002 | 903.4% |
| $200,000+ | 2,878,782 | 938.2% |
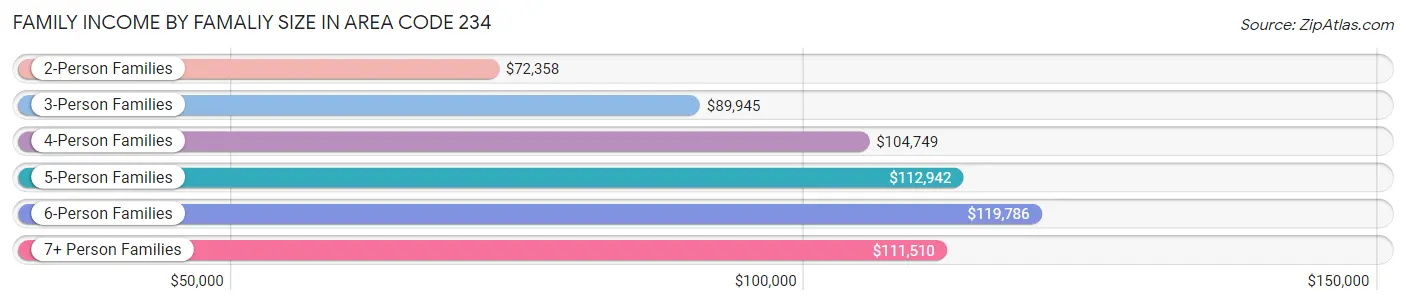
Family Income by Famaliy Size in Area Code 234
6-person families (6,625 | 2.2%) account for the highest median family income in Area Code 234 with $119,786 per family, while 2-person families (158,769 | 51.7%) have the highest median income of $36,179 per family member.
| Income Bracket | # Families | Median Income |
| 2-Person Families | 158,769 (51.7%) | $72,358 |
| 3-Person Families | 65,116 (21.2%) | $89,945 |
| 4-Person Families | 51,066 (16.6%) | $104,749 |
| 5-Person Families | 20,571 (6.7%) | $112,942 |
| 6-Person Families | 6,625 (2.2%) | $119,786 |
| 7+ Person Families | 4,694 (1.5%) | $111,510 |
| Total | 306,841 (100.0%) | $82,616 |
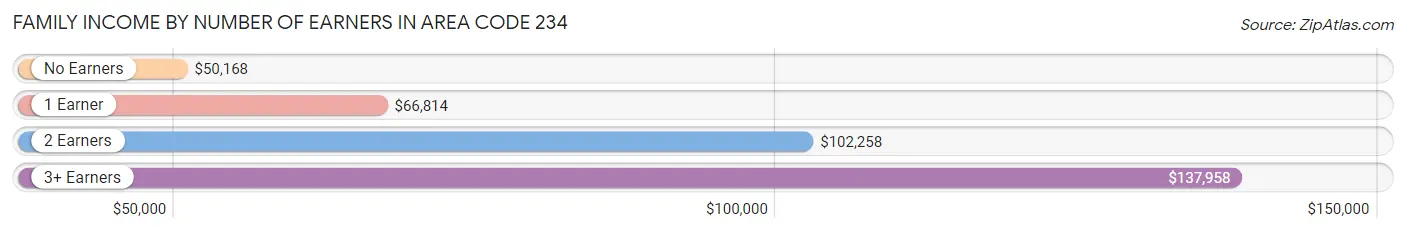
Family Income by Number of Earners in Area Code 234
The median family income in Area Code 234 is $82,616, with families comprising 3+ earners (36,489) having the highest median family income of $137,958, while families with no earners (50,373) have the lowest median family income of $50,168, accounting for 11.9% and 16.4% of families, respectively.
| Number of Earners | # Families | Median Income |
| No Earners | 50,373 (16.4%) | $50,168 |
| 1 Earner | 96,545 (31.5%) | $66,814 |
| 2 Earners | 123,434 (40.2%) | $102,258 |
| 3+ Earners | 36,489 (11.9%) | $137,958 |
| Total | 306,841 (100.0%) | $82,616 |
Household Income in Area Code 234
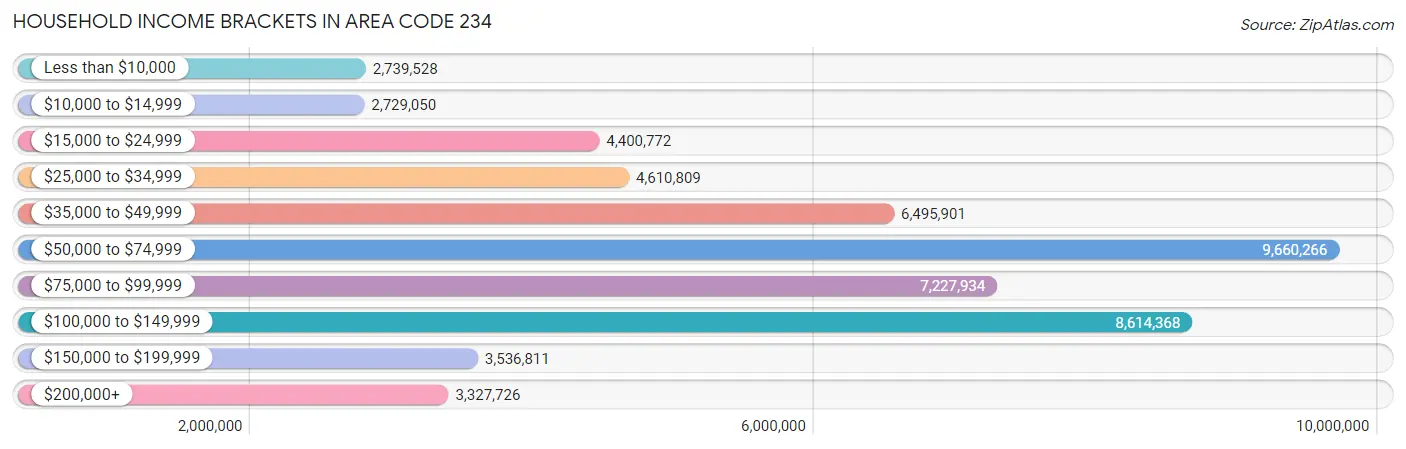
Household Income Brackets in Area Code 234
With 9,660,266 households falling in the category, the $50,000 to $74,999 income range is the most frequent in Area Code 234, accounting for 2,028.3% of all households. In contrast, only 2,729,050 households (573.0%) fall into the $10,000 to $14,999 income bracket, making it the least populous group.
| Income Bracket | # Households | % Households |
| Less than $10,000 | 2,739,528 | 575.2% |
| $10,000 to $14,999 | 2,729,050 | 573.0% |
| $15,000 to $24,999 | 4,400,772 | 924.0% |
| $25,000 to $34,999 | 4,610,809 | 968.1% |
| $35,000 to $49,999 | 6,495,901 | 1,363.9% |
| $50,000 to $74,999 | 9,660,266 | 2,028.3% |
| $75,000 to $99,999 | 7,227,934 | 1,517.6% |
| $100,000 to $149,999 | 8,614,368 | 1,808.7% |
| $150,000 to $199,999 | 3,536,811 | 742.6% |
| $200,000+ | 3,327,726 | 698.7% |
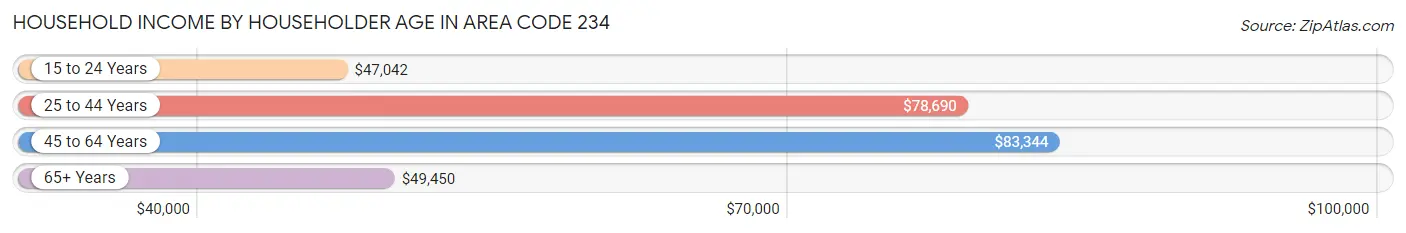
Household Income by Householder Age in Area Code 234
The median household income in Area Code 234 is $67,095, with the highest median household income of $83,344 found in the 45 to 64 years age bracket for the primary householder. A total of 181,653 households (38.1%) fall into this category. Meanwhile, the 15 to 24 years age bracket for the primary householder has the lowest median household income of $47,042, with 15,380 households (3.2%) in this group.
| Income Bracket | # Households | Median Income |
| 15 to 24 Years | 15,380 (3.2%) | $47,042 |
| 25 to 44 Years | 134,039 (28.1%) | $78,690 |
| 45 to 64 Years | 181,653 (38.1%) | $83,344 |
| 65+ Years | 145,202 (30.5%) | $49,450 |
| Total | 476,274 (100.0%) | $67,095 |
Poverty in Area Code 234
Income Below Poverty by Sex and Age in Area Code 234
With 10.2% poverty level for males and 12.6% for females among the residents of Area Code 234, under 5 year old males and under 5 year old females are the most vulnerable to poverty, with 5,363 males (17.8%) and 5,441 females (18.4%) in their respective age groups living below the poverty level.
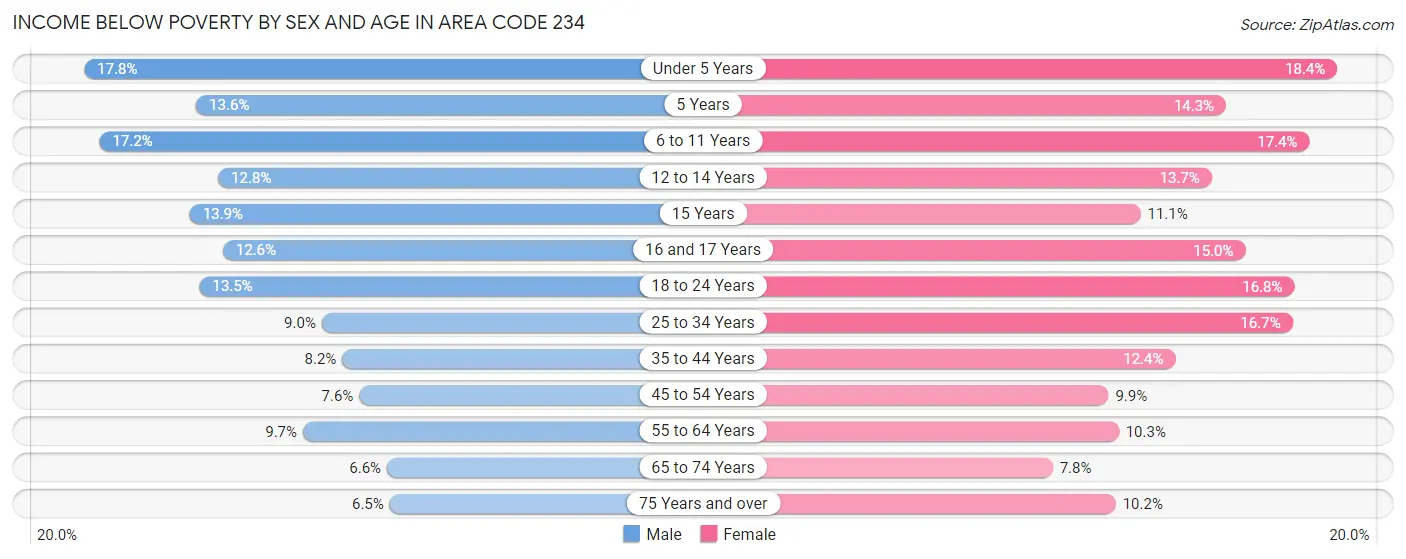
| Age Bracket | Male | Female |
| Under 5 Years | 5,363 (17.8%) | 5,441 (18.4%) |
| 5 Years | 963 (13.6%) | 784 (14.3%) |
| 6 to 11 Years | 7,362 (17.2%) | 6,726 (17.4%) |
| 12 to 14 Years | 2,648 (12.8%) | 2,780 (13.7%) |
| 15 Years | 1,116 (13.9%) | 755 (11.1%) |
| 16 and 17 Years | 2,085 (12.6%) | 2,086 (15.0%) |
| 18 to 24 Years | 6,515 (13.5%) | 7,466 (16.8%) |
| 25 to 34 Years | 6,203 (9.0%) | 11,366 (16.7%) |
| 35 to 44 Years | 5,465 (8.2%) | 8,305 (12.4%) |
| 45 to 54 Years | 5,511 (7.6%) | 7,241 (9.9%) |
| 55 to 64 Years | 7,975 (9.7%) | 8,732 (10.3%) |
| 65 to 74 Years | 4,165 (6.6%) | 5,495 (7.8%) |
| 75 Years and over | 2,390 (6.5%) | 5,300 (10.2%) |
| Total | 57,761 (10.2%) | 72,477 (12.6%) |
Income Above Poverty by Sex and Age in Area Code 234
According to the poverty statistics in Area Code 234, males aged 75 years and over and females aged 65 to 74 years are the age groups that are most secure financially, with 93.5% of males and 92.2% of females in these age groups living above the poverty line.
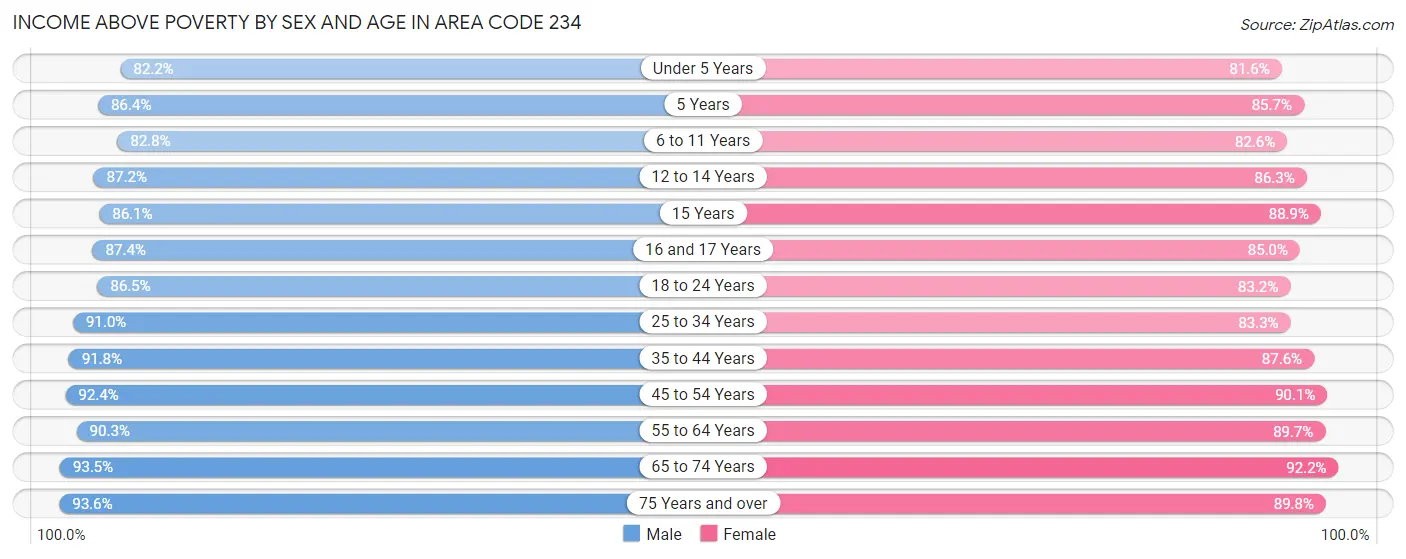
| Age Bracket | Male | Female |
| Under 5 Years | 24,790 (82.2%) | 24,153 (81.6%) |
| 5 Years | 6,102 (86.4%) | 4,712 (85.7%) |
| 6 to 11 Years | 35,386 (82.8%) | 32,026 (82.6%) |
| 12 to 14 Years | 18,000 (87.2%) | 17,472 (86.3%) |
| 15 Years | 6,929 (86.1%) | 6,051 (88.9%) |
| 16 and 17 Years | 14,415 (87.4%) | 11,842 (85.0%) |
| 18 to 24 Years | 41,718 (86.5%) | 36,977 (83.2%) |
| 25 to 34 Years | 62,976 (91.0%) | 56,554 (83.3%) |
| 35 to 44 Years | 61,135 (91.8%) | 58,783 (87.6%) |
| 45 to 54 Years | 67,160 (92.4%) | 65,870 (90.1%) |
| 55 to 64 Years | 74,506 (90.3%) | 76,195 (89.7%) |
| 65 to 74 Years | 59,398 (93.4%) | 64,704 (92.2%) |
| 75 Years and over | 34,639 (93.5%) | 46,837 (89.8%) |
| Total | 507,154 (89.8%) | 502,176 (87.4%) |
Income Below Poverty Among Married-Couple Families in Area Code 234
The poverty statistics for married-couple families in Area Code 234 show that 3.2% or 7,469 of the total 232,494 families live below the poverty line. Families with 5 or more children have the highest poverty rate of 19.0%, comprising of 474 families. On the other hand, families with no children have the lowest poverty rate of 2.6%, which includes 3,817 families.
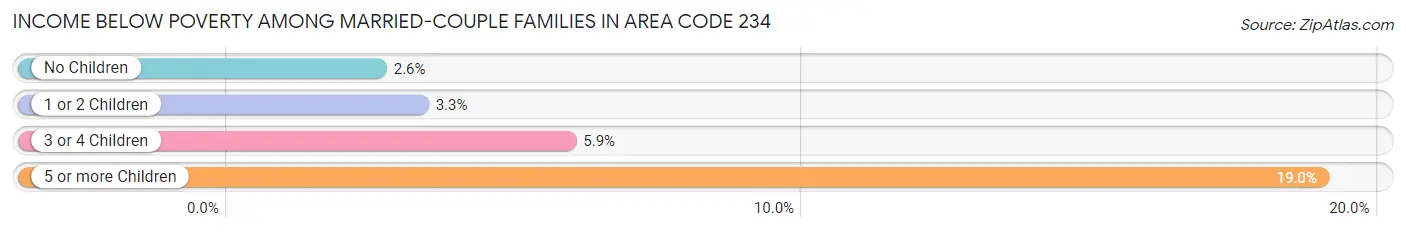
| Children | Above Poverty | Below Poverty |
| No Children | 143,347 (97.4%) | 3,817 (2.6%) |
| 1 or 2 Children | 63,890 (96.7%) | 2,192 (3.3%) |
| 3 or 4 Children | 15,766 (94.1%) | 986 (5.9%) |
| 5 or more Children | 2,022 (81.0%) | 474 (19.0%) |
| Total | 225,025 (96.8%) | 7,469 (3.2%) |
Income Below Poverty Among Single-Parent Households in Area Code 234
According to the poverty data in Area Code 234, 13.7% or 3,079 single-father households and 27.7% or 14,354 single-mother households are living below the poverty line. Among single-father households, those with 5 or more children have the highest poverty rate, with 39 households (47.0%) experiencing poverty. Likewise, among single-mother households, those with 5 or more children have the highest poverty rate, with 338 households (83.7%) falling below the poverty line.
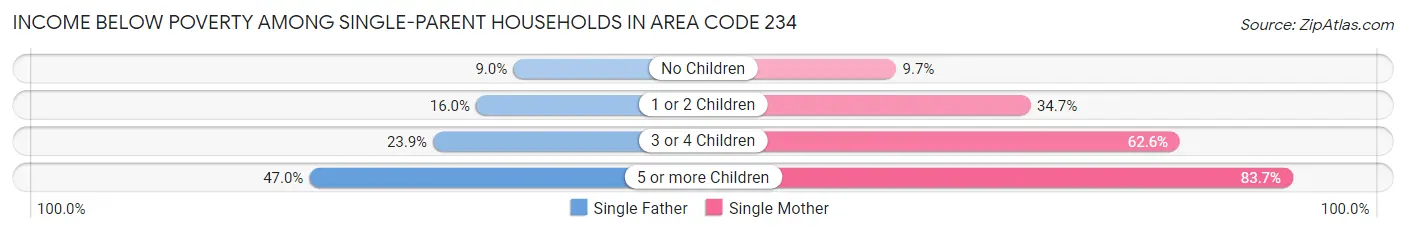
| Children | Single Father | Single Mother |
| No Children | 870 (9.0%) | 1,979 (9.7%) |
| 1 or 2 Children | 1,799 (16.0%) | 9,122 (34.7%) |
| 3 or 4 Children | 371 (23.9%) | 2,915 (62.6%) |
| 5 or more Children | 39 (47.0%) | 338 (83.7%) |
| Total | 3,079 (13.7%) | 14,354 (27.7%) |
Income Below Poverty Among Married-Couple vs Single-Parent Households in Area Code 234
The poverty data for Area Code 234 shows that 7,469 of the married-couple family households (3.2%) and 17,433 of the single-parent households (23.4%) are living below the poverty level. Within the married-couple family households, those with 5 or more children have the highest poverty rate, with 474 households (19.0%) falling below the poverty line. Among the single-parent households, those with 5 or more children have the highest poverty rate, with 377 household (77.4%) living below poverty.

| Children | Married-Couple Families | Single-Parent Households |
| No Children | 3,817 (2.6%) | 2,849 (9.5%) |
| 1 or 2 Children | 2,192 (3.3%) | 10,921 (29.1%) |
| 3 or 4 Children | 986 (5.9%) | 3,286 (53.0%) |
| 5 or more Children | 474 (19.0%) | 377 (77.4%) |
| Total | 7,469 (3.2%) | 17,433 (23.4%) |
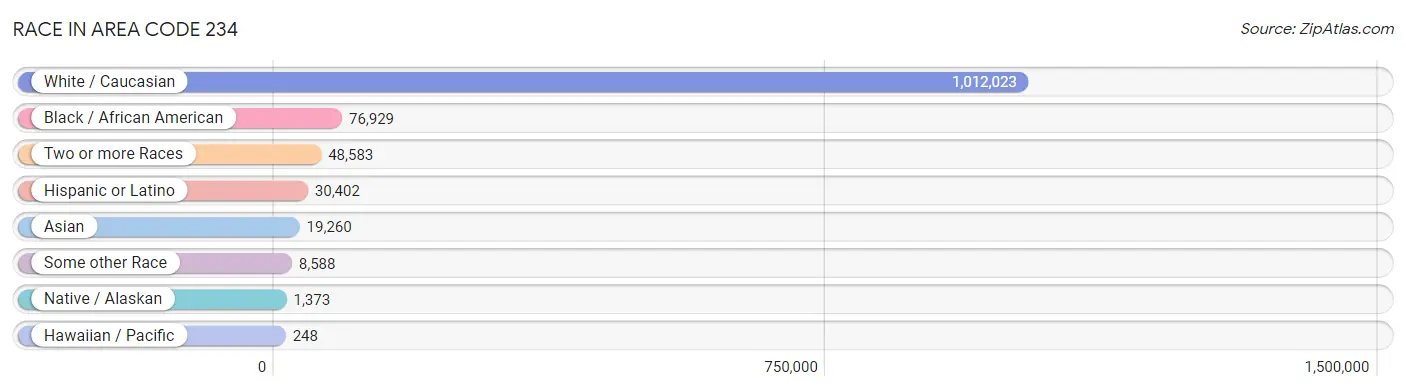
Race in Area Code 234
The most populous races in Area Code 234 are White / Caucasian (1,012,023 | 86.7%), Black / African American (76,929 | 6.6%), and Two or more Races (48,583 | 4.2%).
| Race | # Population | % Population |
| Asian | 19,260 | 1.7% |
| Black / African American | 76,929 | 6.6% |
| Hawaiian / Pacific | 248 | 0.0% |
| Hispanic or Latino | 30,402 | 2.6% |
| Native / Alaskan | 1,373 | 0.1% |
| White / Caucasian | 1,012,023 | 86.7% |
| Two or more Races | 48,583 | 4.2% |
| Some other Race | 8,588 | 0.7% |
| Total | 1,167,004 | 100.0% |
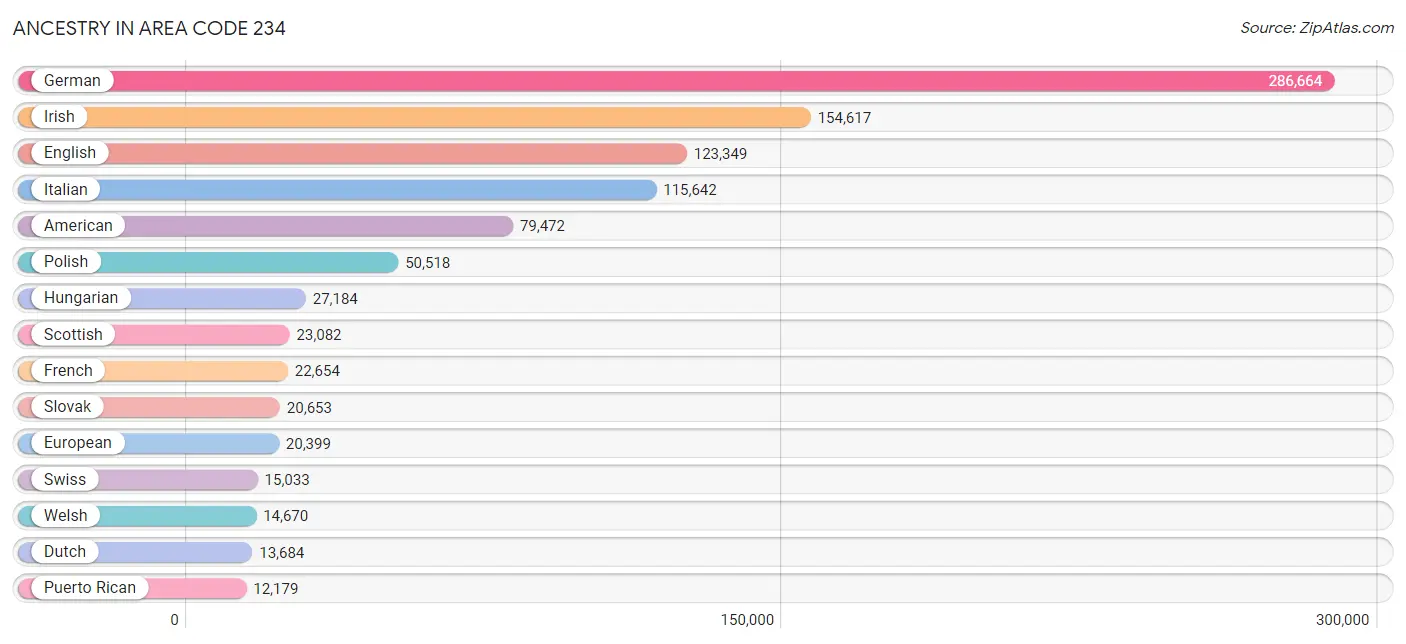
Ancestry in Area Code 234
The most populous ancestries reported in Area Code 234 are German (286,664 | 24.6%), Irish (154,617 | 13.3%), English (123,349 | 10.6%), Italian (115,642 | 9.9%), and American (79,472 | 6.8%), together accounting for 65.1% of all Area Code 234 residents.
| Ancestry | # Population | % Population |
| African | 7,838 | 0.7% |
| Alaska Native | 5 | 0.0% |
| Albanian | 324 | 0.0% |
| Alsatian | 18 | 0.0% |
| American | 79,472 | 6.8% |
| Apache | 187 | 0.0% |
| Arab | 6,209 | 0.5% |
| Argentinean | 317 | 0.0% |
| Armenian | 570 | 0.1% |
| Australian | 220 | 0.0% |
| Austrian | 3,443 | 0.3% |
| Bahamian | 57 | 0.0% |
| Bangladeshi | 177 | 0.0% |
| Barbadian | 67 | 0.0% |
| Belgian | 607 | 0.1% |
| Belizean | 27 | 0.0% |
| Bhutanese | 1,327 | 0.1% |
| Blackfeet | 819 | 0.1% |
| Brazilian | 576 | 0.1% |
| British | 5,994 | 0.5% |
| British West Indian | 10 | 0.0% |
| Bulgarian | 439 | 0.0% |
| Burmese | 1,701 | 0.2% |
| Cajun | 9 | 0.0% |
| Cambodian | 10 | 0.0% |
| Canadian | 1,217 | 0.1% |
| Cape Verdean | 78 | 0.0% |
| Carpatho Rusyn | 166 | 0.0% |
| Celtic | 165 | 0.0% |
| Central American | 3,506 | 0.3% |
| Central American Indian | 432 | 0.0% |
| Cherokee | 3,037 | 0.3% |
| Cheyenne | 42 | 0.0% |
| Chickasaw | 4 | 0.0% |
| Chilean | 276 | 0.0% |
| Chippewa | 176 | 0.0% |
| Choctaw | 67 | 0.0% |
| Colombian | 704 | 0.1% |
| Colville | 4 | 0.0% |
| Comanche | 6 | 0.0% |
| Costa Rican | 192 | 0.0% |
| Cree | 16 | 0.0% |
| Creek | 54 | 0.0% |
| Croatian | 6,103 | 0.5% |
| Crow | 11 | 0.0% |
| Cuban | 515 | 0.0% |
| Cypriot | 14 | 0.0% |
| Czech | 8,733 | 0.7% |
| Czechoslovakian | 2,921 | 0.3% |
| Danish | 1,993 | 0.2% |
| Delaware | 138 | 0.0% |
| Dominican | 177 | 0.0% |
| Dutch | 13,684 | 1.2% |
| Dutch West Indian | 14 | 0.0% |
| Eastern European | 4,455 | 0.4% |
| Ecuadorian | 171 | 0.0% |
| Egyptian | 244 | 0.0% |
| English | 123,349 | 10.6% |
| Estonian | 38 | 0.0% |
| Ethiopian | 140 | 0.0% |
| European | 20,399 | 1.8% |
| Filipino | 367 | 0.0% |
| Finnish | 1,870 | 0.2% |
| French | 22,654 | 1.9% |
| French American Indian | 29 | 0.0% |
| French Canadian | 2,603 | 0.2% |
| German | 286,664 | 24.6% |
| German Russian | 15 | 0.0% |
| Ghanaian | 333 | 0.0% |
| Greek | 9,047 | 0.8% |
| Guamanian / Chamorro | 85 | 0.0% |
| Guatemalan | 1,156 | 0.1% |
| Guyanese | 32 | 0.0% |
| Haitian | 336 | 0.0% |
| Honduran | 907 | 0.1% |
| Hungarian | 27,184 | 2.3% |
| Icelander | 131 | 0.0% |
| Indian (Asian) | 4,372 | 0.4% |
| Indonesian | 156 | 0.0% |
| Inupiat | 45 | 0.0% |
| Iranian | 807 | 0.1% |
| Iraqi | 143 | 0.0% |
| Irish | 154,617 | 13.3% |
| Iroquois | 165 | 0.0% |
| Israeli | 107 | 0.0% |
| Italian | 115,642 | 9.9% |
| Jamaican | 799 | 0.1% |
| Japanese | 199 | 0.0% |
| Jordanian | 147 | 0.0% |
| Kenyan | 82 | 0.0% |
| Korean | 3,826 | 0.3% |
| Laotian | 107 | 0.0% |
| Latvian | 325 | 0.0% |
| Lebanese | 3,255 | 0.3% |
| Liberian | 36 | 0.0% |
| Lithuanian | 1,873 | 0.2% |
| Luxembourger | 74 | 0.0% |
| Macedonian | 967 | 0.1% |
| Malaysian | 265 | 0.0% |
| Maltese | 47 | 0.0% |
| Mexican | 9,011 | 0.8% |
| Mexican American Indian | 76 | 0.0% |
| Mongolian | 110 | 0.0% |
| Moroccan | 197 | 0.0% |
| Native Hawaiian | 356 | 0.0% |
| Navajo | 54 | 0.0% |
| New Zealander | 32 | 0.0% |
| Nicaraguan | 111 | 0.0% |
| Nigerian | 750 | 0.1% |
| Northern European | 966 | 0.1% |
| Norwegian | 4,007 | 0.3% |
| Okinawan | 10 | 0.0% |
| Osage | 28 | 0.0% |
| Ottawa | 5 | 0.0% |
| Paiute | 12 | 0.0% |
| Pakistani | 265 | 0.0% |
| Palestinian | 272 | 0.0% |
| Panamanian | 198 | 0.0% |
| Pennsylvania German | 7,686 | 0.7% |
| Peruvian | 122 | 0.0% |
| Polish | 50,518 | 4.3% |
| Portuguese | 1,792 | 0.2% |
| Potawatomi | 26 | 0.0% |
| Puerto Rican | 12,179 | 1.0% |
| Romanian | 5,415 | 0.5% |
| Russian | 7,531 | 0.6% |
| Salvadoran | 942 | 0.1% |
| Samoan | 33 | 0.0% |
| Scandinavian | 1,950 | 0.2% |
| Scotch-Irish | 11,428 | 1.0% |
| Scottish | 23,082 | 2.0% |
| Seminole | 10 | 0.0% |
| Serbian | 3,916 | 0.3% |
| Sierra Leonean | 26 | 0.0% |
| Sioux | 245 | 0.0% |
| Slavic | 887 | 0.1% |
| Slovak | 20,653 | 1.8% |
| Slovene | 5,719 | 0.5% |
| South African | 188 | 0.0% |
| South American | 1,759 | 0.2% |
| Spaniard | 1,089 | 0.1% |
| Spanish | 845 | 0.1% |
| Sri Lankan | 1,428 | 0.1% |
| Subsaharan African | 9,764 | 0.8% |
| Sudanese | 29 | 0.0% |
| Swedish | 8,391 | 0.7% |
| Swiss | 15,033 | 1.3% |
| Syrian | 598 | 0.1% |
| Thai | 6,543 | 0.6% |
| Tongan | 6 | 0.0% |
| Trinidadian and Tobagonian | 43 | 0.0% |
| Turkish | 150 | 0.0% |
| U.S. Virgin Islander | 9 | 0.0% |
| Ukrainian | 5,610 | 0.5% |
| Uruguayan | 43 | 0.0% |
| Ute | 8 | 0.0% |
| Venezuelan | 126 | 0.0% |
| Vietnamese | 123 | 0.0% |
| Welsh | 14,670 | 1.3% |
| West Indian | 294 | 0.0% |
| Yugoslavian | 992 | 0.1% | View All 161 Rows |
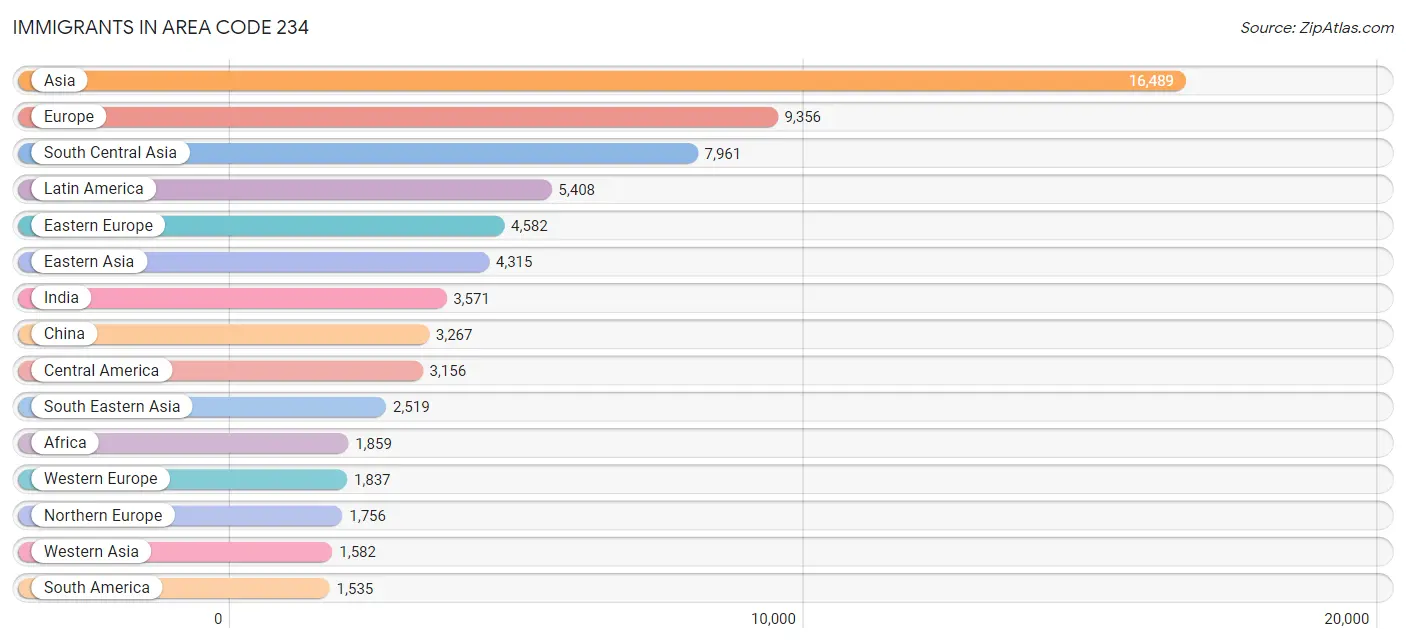
Immigrants in Area Code 234
The most numerous immigrant groups reported in Area Code 234 came from Asia (16,489 | 1.4%), Europe (9,356 | 0.8%), South Central Asia (7,961 | 0.7%), Latin America (5,408 | 0.5%), and Eastern Europe (4,582 | 0.4%), together accounting for 3.7% of all Area Code 234 residents.
| Immigration Origin | # Population | % Population |
| Africa | 1,859 | 0.2% |
| Albania | 136 | 0.0% |
| Argentina | 152 | 0.0% |
| Armenia | 33 | 0.0% |
| Asia | 16,489 | 1.4% |
| Australia | 91 | 0.0% |
| Austria | 213 | 0.0% |
| Bahamas | 112 | 0.0% |
| Bangladesh | 308 | 0.0% |
| Belarus | 50 | 0.0% |
| Belgium | 81 | 0.0% |
| Bosnia and Herzegovina | 196 | 0.0% |
| Brazil | 528 | 0.1% |
| Bulgaria | 23 | 0.0% |
| Cabo Verde | 46 | 0.0% |
| Cambodia | 157 | 0.0% |
| Cameroon | 59 | 0.0% |
| Canada | 1,524 | 0.1% |
| Caribbean | 717 | 0.1% |
| Central America | 3,156 | 0.3% |
| Chile | 192 | 0.0% |
| China | 3,267 | 0.3% |
| Colombia | 381 | 0.0% |
| Congo | 9 | 0.0% |
| Costa Rica | 113 | 0.0% |
| Croatia | 236 | 0.0% |
| Cuba | 69 | 0.0% |
| Czechoslovakia | 105 | 0.0% |
| Denmark | 81 | 0.0% |
| Dominican Republic | 40 | 0.0% |
| Eastern Africa | 356 | 0.0% |
| Eastern Asia | 4,315 | 0.4% |
| Eastern Europe | 4,582 | 0.4% |
| Ecuador | 29 | 0.0% |
| Egypt | 105 | 0.0% |
| El Salvador | 544 | 0.1% |
| England | 886 | 0.1% |
| Ethiopia | 149 | 0.0% |
| Europe | 9,356 | 0.8% |
| France | 139 | 0.0% |
| Germany | 1,165 | 0.1% |
| Ghana | 299 | 0.0% |
| Greece | 324 | 0.0% |
| Guatemala | 613 | 0.1% |
| Guyana | 38 | 0.0% |
| Haiti | 72 | 0.0% |
| Honduras | 389 | 0.0% |
| Hong Kong | 167 | 0.0% |
| Hungary | 197 | 0.0% |
| India | 3,571 | 0.3% |
| Indonesia | 80 | 0.0% |
| Iran | 397 | 0.0% |
| Iraq | 139 | 0.0% |
| Ireland | 104 | 0.0% |
| Israel | 155 | 0.0% |
| Italy | 747 | 0.1% |
| Jamaica | 185 | 0.0% |
| Japan | 181 | 0.0% |
| Jordan | 104 | 0.0% |
| Kazakhstan | 67 | 0.0% |
| Kenya | 90 | 0.0% |
| Korea | 857 | 0.1% |
| Kuwait | 34 | 0.0% |
| Laos | 115 | 0.0% |
| Latin America | 5,408 | 0.5% |
| Latvia | 60 | 0.0% |
| Lebanon | 181 | 0.0% |
| Liberia | 21 | 0.0% |
| Lithuania | 18 | 0.0% |
| Malaysia | 58 | 0.0% |
| Mexico | 1,388 | 0.1% |
| Middle Africa | 68 | 0.0% |
| Moldova | 44 | 0.0% |
| Morocco | 111 | 0.0% |
| Nepal | 1,047 | 0.1% |
| Netherlands | 213 | 0.0% |
| Nicaragua | 32 | 0.0% |
| Nigeria | 382 | 0.0% |
| North Macedonia | 123 | 0.0% |
| Northern Africa | 405 | 0.0% |
| Northern Europe | 1,756 | 0.2% |
| Norway | 5 | 0.0% |
| Oceania | 206 | 0.0% |
| Pakistan | 393 | 0.0% |
| Panama | 77 | 0.0% |
| Peru | 83 | 0.0% |
| Philippines | 1,318 | 0.1% |
| Poland | 388 | 0.0% |
| Portugal | 53 | 0.0% |
| Romania | 729 | 0.1% |
| Russia | 790 | 0.1% |
| Saudi Arabia | 503 | 0.0% |
| Scotland | 180 | 0.0% |
| Senegal | 9 | 0.0% |
| Serbia | 495 | 0.0% |
| Sierra Leone | 35 | 0.0% |
| Singapore | 10 | 0.0% |
| South Africa | 187 | 0.0% |
| South America | 1,535 | 0.1% |
| South Central Asia | 7,961 | 0.7% |
| South Eastern Asia | 2,519 | 0.2% |
| Southern Europe | 1,181 | 0.1% |
| Spain | 53 | 0.0% |
| Sri Lanka | 34 | 0.0% |
| St. Vincent and the Grenadines | 11 | 0.0% |
| Sudan | 36 | 0.0% |
| Sweden | 61 | 0.0% |
| Switzerland | 26 | 0.0% |
| Syria | 151 | 0.0% |
| Taiwan | 440 | 0.0% |
| Thailand | 114 | 0.0% |
| Trinidad and Tobago | 93 | 0.0% |
| Turkey | 34 | 0.0% |
| Ukraine | 621 | 0.1% |
| Uruguay | 17 | 0.0% |
| Uzbekistan | 489 | 0.0% |
| Venezuela | 115 | 0.0% |
| Vietnam | 571 | 0.1% |
| Western Africa | 829 | 0.1% |
| Western Asia | 1,582 | 0.1% |
| Western Europe | 1,837 | 0.2% |
| Yemen | 103 | 0.0% |
| Zimbabwe | 20 | 0.0% | View All 123 Rows |
Sex and Age in Area Code 234
Sex and Age in Area Code 234
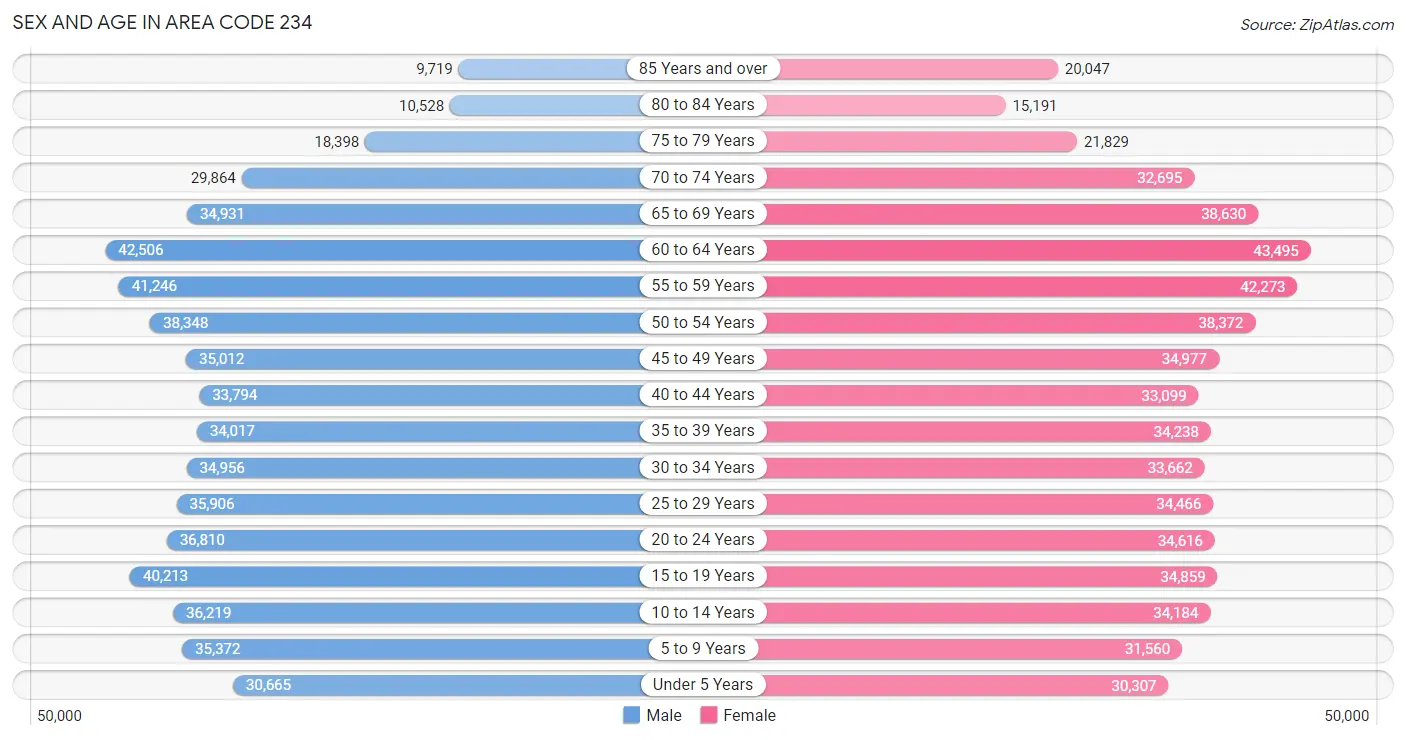
The most populous age groups in Area Code 234 are 60 to 64 Years (42,506 | 7.3%) for men and 60 to 64 Years (43,495 | 7.4%) for women.
| Age Bracket | Male | Female |
| Under 5 Years | 30,665 (5.3%) | 30,307 (5.1%) |
| 5 to 9 Years | 35,372 (6.1%) | 31,560 (5.4%) |
| 10 to 14 Years | 36,219 (6.3%) | 34,184 (5.8%) |
| 15 to 19 Years | 40,213 (7.0%) | 34,859 (5.9%) |
| 20 to 24 Years | 36,810 (6.4%) | 34,616 (5.9%) |
| 25 to 29 Years | 35,906 (6.2%) | 34,466 (5.9%) |
| 30 to 34 Years | 34,956 (6.0%) | 33,662 (5.7%) |
| 35 to 39 Years | 34,017 (5.9%) | 34,238 (5.8%) |
| 40 to 44 Years | 33,794 (5.8%) | 33,099 (5.6%) |
| 45 to 49 Years | 35,012 (6.0%) | 34,977 (5.9%) |
| 50 to 54 Years | 38,348 (6.6%) | 38,372 (6.5%) |
| 55 to 59 Years | 41,246 (7.1%) | 42,273 (7.2%) |
| 60 to 64 Years | 42,506 (7.3%) | 43,495 (7.4%) |
| 65 to 69 Years | 34,931 (6.0%) | 38,630 (6.6%) |
| 70 to 74 Years | 29,864 (5.2%) | 32,695 (5.6%) |
| 75 to 79 Years | 18,398 (3.2%) | 21,829 (3.7%) |
| 80 to 84 Years | 10,528 (1.8%) | 15,191 (2.6%) |
| 85 Years and over | 9,719 (1.7%) | 20,047 (3.4%) |
| Total | 578,504 (100.0%) | 588,500 (100.0%) |
Families and Households in Area Code 234
Median Family Size in Area Code 234
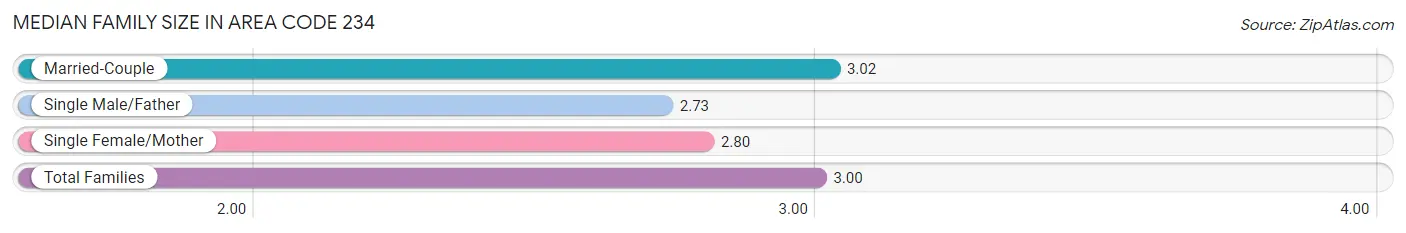
The median family size in Area Code 234 is 3.00 persons per family, with married-couple families (232,494 | 75.8%) accounting for the largest median family size of 3.02459 persons per family. On the other hand, single male/father families (22,554 | 7.3%) represent the smallest median family size with 2.73 persons per family.
| Family Type | # Families | Family Size |
| Married-Couple | 232,494 (75.8%) | 3.02 |
| Single Male/Father | 22,554 (7.3%) | 2.73 |
| Single Female/Mother | 51,793 (16.9%) | 2.80 |
| Total Families | 306,841 (100.0%) | 3.00 |
Median Household Size in Area Code 234
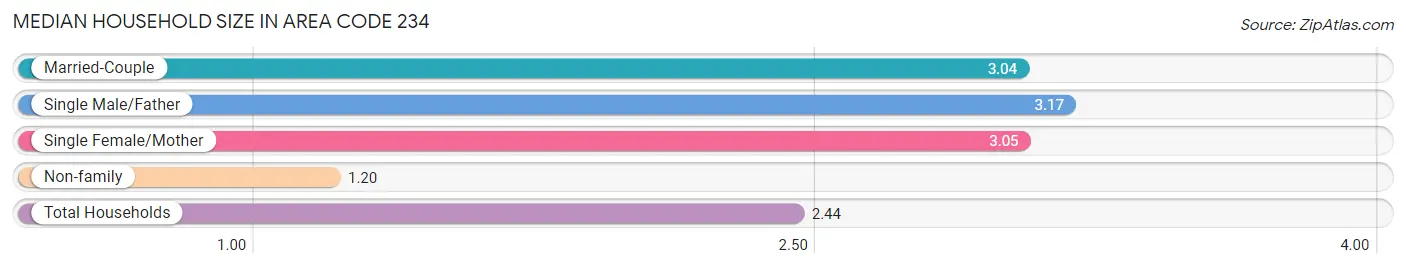
The median household size in Area Code 234 is 2.44 persons per household, with single male/father households (22,554 | 4.7%) accounting for the largest median household size of 3.16741 persons per household. non-family households (169,433 | 35.6%) represent the smallest median household size with 1.20 persons per household.
| Household Type | # Households | Household Size |
| Married-Couple | 232,494 (48.8%) | 3.04 |
| Single Male/Father | 22,554 (4.7%) | 3.17 |
| Single Female/Mother | 51,793 (10.9%) | 3.05 |
| Non-family | 169,433 (35.6%) | 1.20 |
| Total Households | 476,274 (100.0%) | 2.44 |
Household Size by Marriage Status in Area Code 234
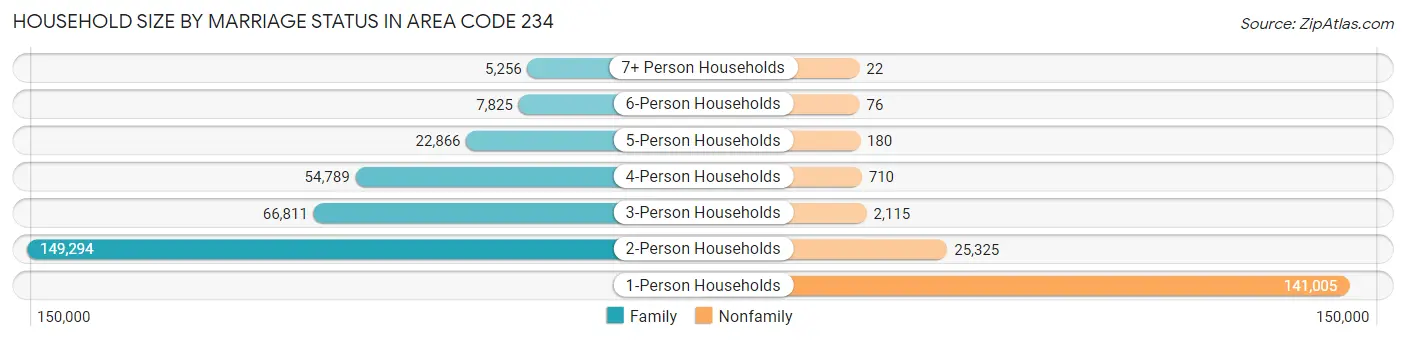
Out of a total of 476,274 households in Area Code 234, 306,841 (64.4%) are family households, while 169,433 (35.6%) are nonfamily households. The most numerous type of family households are 2-person households, comprising 149,294, and the most common type of nonfamily households are 1-person households, comprising 141,005.
| Household Size | Family Households | Nonfamily Households |
| 1-Person Households | - | 141,005 (29.6%) |
| 2-Person Households | 149,294 (31.4%) | 25,325 (5.3%) |
| 3-Person Households | 66,811 (14.0%) | 2,115 (0.4%) |
| 4-Person Households | 54,789 (11.5%) | 710 (0.2%) |
| 5-Person Households | 22,866 (4.8%) | 180 (0.0%) |
| 6-Person Households | 7,825 (1.6%) | 76 (0.0%) |
| 7+ Person Households | 5,256 (1.1%) | 22 (0.0%) |
| Total | 306,841 (64.4%) | 169,433 (35.6%) |
Female Fertility in Area Code 234
Fertility by Age in Area Code 234
Average fertility rate in Area Code 234 is 72.9 births per 1,000 women. Women in the age bracket of 20 to 34 years have the highest fertility rate with 138.3 births per 1,000 women. Women in the age bracket of 20 to 34 years acount for 76.5% of all women with births.

| Age Bracket | Women with Births | Births / 1,000 Women |
| 15 to 19 years | 217 (1.7%) | 69.8 |
| 20 to 34 years | 9,619 (76.5%) | 138.3 |
| 35 to 50 years | 2,731 (21.7%) | 32.6 |
| Total | 12,567 (100.0%) | 72.9 |
Fertility by Age by Marriage Status in Area Code 234
53.4% of women with births (12,567) in Area Code 234 are married. The highest percentage of unmarried women with births falls into 15 to 19 years age bracket with 100.0% of them unmarried at the time of birth, while the lowest percentage of unmarried women with births belong to 35 to 50 years age bracket with 47.7% of them unmarried.
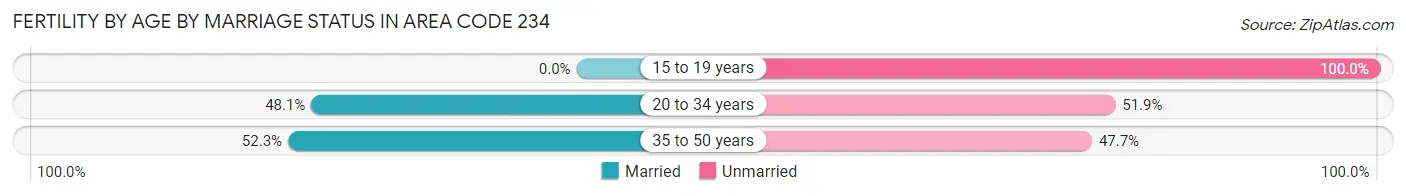
| Age Bracket | Married | Unmarried |
| 15 to 19 years | 0 (0.0%) | 217 (100.0%) |
| 20 to 34 years | 4,624 (48.1%) | 4,995 (51.9%) |
| 35 to 50 years | 1,428 (52.3%) | 1,303 (47.7%) |
| Total | 6,713 (53.4%) | 5,854 (46.6%) |
Fertility by Education in Area Code 234
Average fertility rate in Area Code 234 is 72.9 births per 1,000 women. Women with the education attainment of bachelor's degree have the highest fertility rate of 111.3 births per 1,000 women, while women with the education attainment of high school diploma have the lowest fertility at 83.8 births per 1,000 women. Women with the education attainment of college or associate's degree represent 28.2% of all women with births.
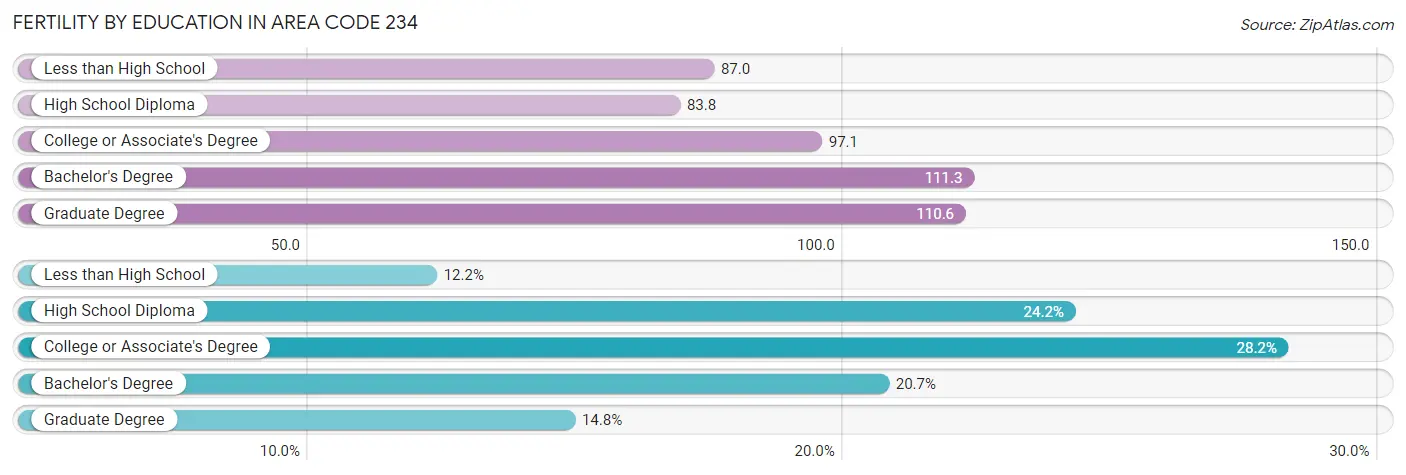
| Educational Attainment | Women with Births | Births / 1,000 Women |
| Less than High School | 1,533 (12.2%) | 87.0 |
| High School Diploma | 3,038 (24.2%) | 83.8 |
| College or Associate's Degree | 3,539 (28.2%) | 97.1 |
| Bachelor's Degree | 2,598 (20.7%) | 111.3 |
| Graduate Degree | 1,859 (14.8%) | 110.6 |
| Total | 12,567 (100.0%) | 72.9 |
Fertility by Education by Marriage Status in Area Code 234
46.6% of women with births in Area Code 234 are unmarried. Women with the educational attainment of bachelor's degree are most likely to be married with 39.2% of them married at childbirth, while women with the educational attainment of less than high school are least likely to be married with 87.7% of them unmarried at childbirth.

| Educational Attainment | Married | Unmarried |
| Less than High School | 188 (12.3%) | 1,345 (87.7%) |
| High School Diploma | 760 (25.0%) | 2,278 (75.0%) |
| College or Associate's Degree | 1,118 (31.6%) | 2,421 (68.4%) |
| Bachelor's Degree | 1,017 (39.2%) | 1,581 (60.9%) |
| Graduate Degree | 604 (32.5%) | 1,255 (67.5%) |
| Total | 6,713 (53.4%) | 5,854 (46.6%) |
Employment Characteristics in Area Code 234
Employment by Class of Employer in Area Code 234
Among the 559,218 employed individuals in Area Code 234, private company employees (394,807 | 70.6%), not-for-profit organizations (52,126 | 9.3%), and local government employees (42,265 | 7.6%) make up the most common classes of employment.
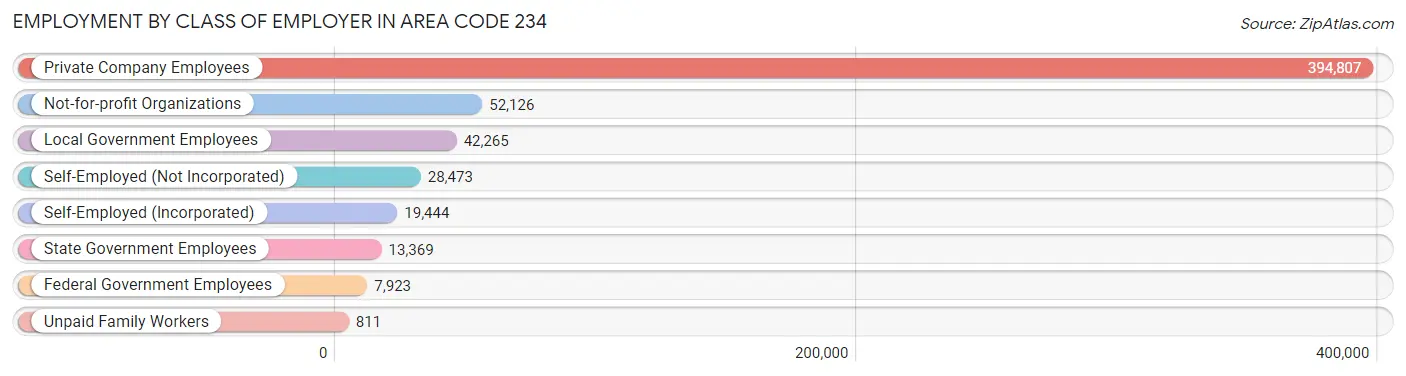
| Employer Class | # Employees | % Employees |
| Private Company Employees | 394,807 | 70.6% |
| Self-Employed (Incorporated) | 19,444 | 3.5% |
| Self-Employed (Not Incorporated) | 28,473 | 5.1% |
| Not-for-profit Organizations | 52,126 | 9.3% |
| Local Government Employees | 42,265 | 7.6% |
| State Government Employees | 13,369 | 2.4% |
| Federal Government Employees | 7,923 | 1.4% |
| Unpaid Family Workers | 811 | 0.2% |
| Total | 559,218 | 100.0% |
Employment Status by Age in Area Code 234
According to the labor force statistics for Area Code 234, out of the total population over 16 years of age (953,770), 61.0% or 581,418 individuals are in the labor force, with 5.7% or 33,315 of them unemployed. The age group with the highest labor force participation rate is 35 to 44 years, with 83.4% or 112,740 individuals in the labor force. Within the labor force, the 16 to 19 years age range has the highest percentage of unemployed individuals, with 1,107.4% or 368,653 of them being unemployed.
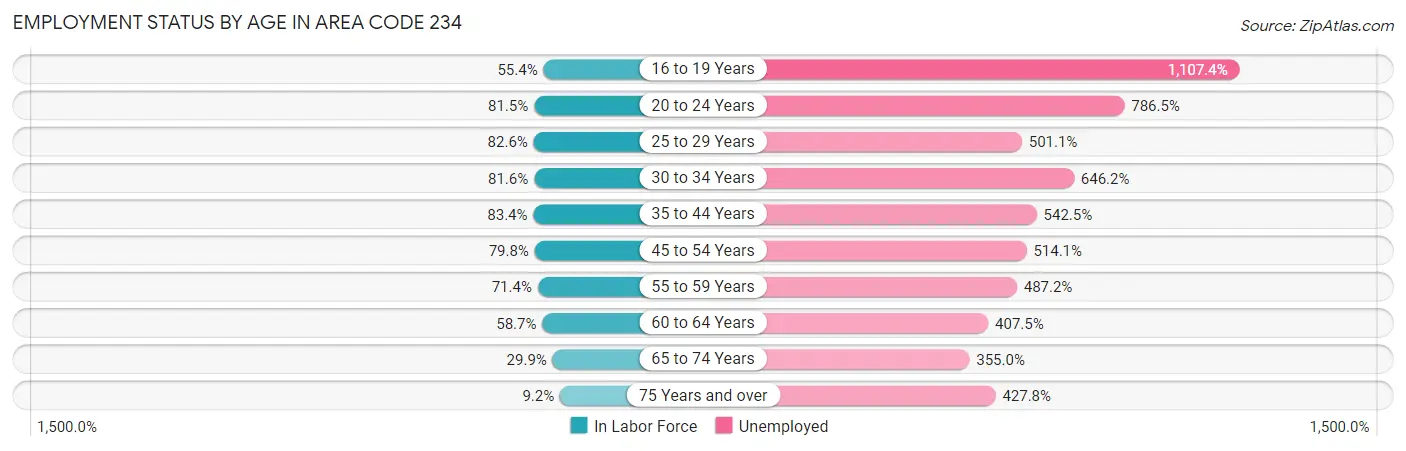
| Age Bracket | In Labor Force | Unemployed |
| 16 to 19 Years | 33,293 (55.3%) | 368,653 (1,107.4%) |
| 20 to 24 Years | 58,240 (81.5%) | 458,065 (786.5%) |
| 25 to 29 Years | 58,148 (82.6%) | 291,380 (501.1%) |
| 30 to 34 Years | 55,991 (81.6%) | 361,820 (646.2%) |
| 35 to 44 Years | 112,745 (83.4%) | 611,614 (542.5%) |
| 45 to 54 Years | 117,018 (79.8%) | 601,574 (514.1%) |
| 55 to 59 Years | 59,597 (71.4%) | 290,366 (487.2%) |
| 60 to 64 Years | 50,444 (58.7%) | 205,543 (407.5%) |
| 65 to 74 Years | 40,626 (29.8%) | 144,244 (355.0%) |
| 75 Years and over | 8,818 (9.2%) | 37,711 (427.8%) |
| Total | 581,440 (61.0%) | 33,304 (5.7%) |
Employment Status by Educational Attainment in Area Code 234
According to labor force statistics for Area Code 234, 76.6% of individuals (452,162) out of the total population between 25 and 64 years of age (590,367) are in the labor force, with 542.1% or 2,451,170 of them being unemployed. The group with the highest labor force participation rate are those with the educational attainment of bachelor's degree or higher, with 88.0% or 169,726 individuals in the labor force. Within the labor force, individuals with less than high school education have the highest percentage of unemployment, with 1,199.7% or 298,917 of them being unemployed.
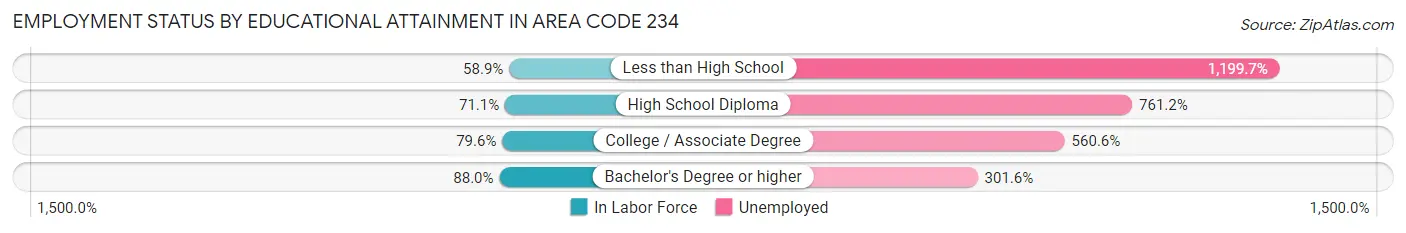
| Educational Attainment | In Labor Force | Unemployed |
| Less than High School | 24,914 (58.9%) | 507,317 (1,199.7%) |
| High School Diploma | 132,977 (71.1%) | 1,423,893 (761.2%) |
| College / Associate Degree | 133,840 (79.6%) | 943,019 (560.6%) |
| Bachelor's Degree or higher | 169,724 (88.0%) | 581,500 (301.6%) |
| Total | 452,148 (76.6%) | 3,200,380 (542.1%) |
Employment Occupations by Sex in Area Code 234
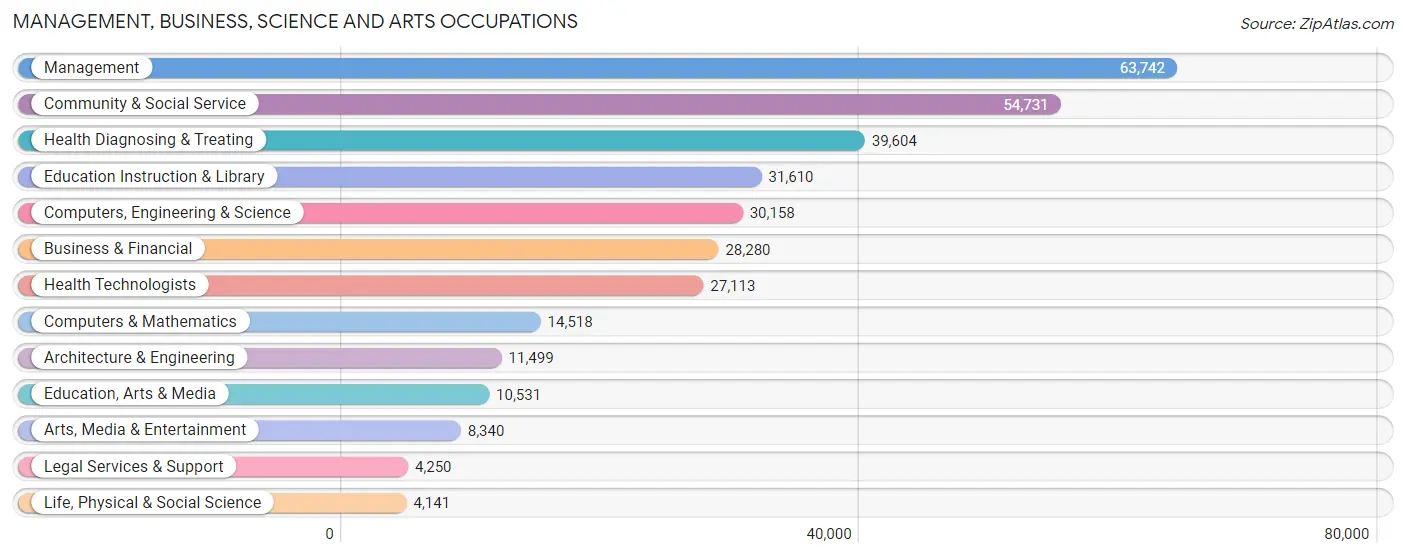
Management, Business, Science and Arts Occupations
The most common Management, Business, Science and Arts occupations in Area Code 234 are Management (63,742 | 11.2%), Community & Social Service (54,731 | 9.6%), Health Diagnosing & Treating (39,604 | 7.0%), Education Instruction & Library (31,610 | 5.5%), and Computers, Engineering & Science (30,158 | 5.3%).
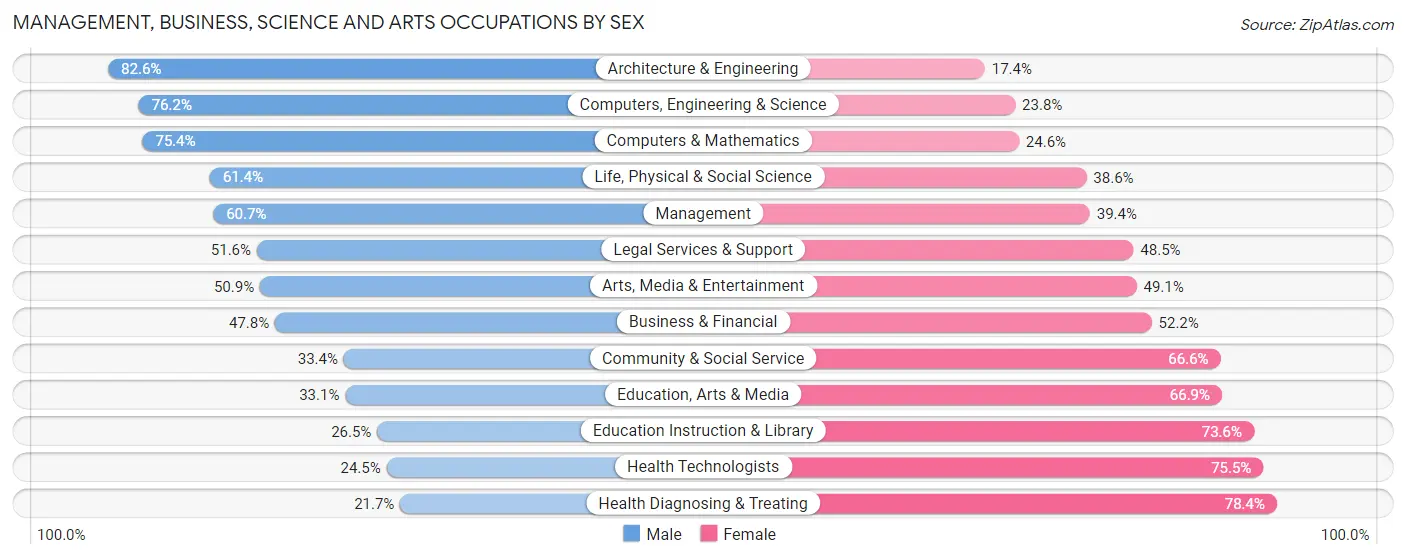
Management, Business, Science and Arts Occupations by Sex
Within the Management, Business, Science and Arts occupations in Area Code 234, the most male-oriented occupations are Architecture & Engineering (82.6%), Computers, Engineering & Science (76.2%), and Computers & Mathematics (75.4%), while the most female-oriented occupations are Health Diagnosing & Treating (78.3%), Health Technologists (75.5%), and Education Instruction & Library (73.6%).
| Occupation | Male | Female |
| Management | 38,658 (60.7%) | 25,084 (39.4%) |
| Business & Financial | 13,506 (47.8%) | 14,774 (52.2%) |
| Computers, Engineering & Science | 22,987 (76.2%) | 7,171 (23.8%) |
| Computers & Mathematics | 10,953 (75.4%) | 3,565 (24.6%) |
| Architecture & Engineering | 9,493 (82.6%) | 2,006 (17.4%) |
| Life, Physical & Social Science | 2,541 (61.4%) | 1,600 (38.6%) |
| Community & Social Service | 18,284 (33.4%) | 36,447 (66.6%) |
| Education, Arts & Media | 3,487 (33.1%) | 7,044 (66.9%) |
| Legal Services & Support | 2,191 (51.5%) | 2,059 (48.4%) |
| Education Instruction & Library | 8,361 (26.5%) | 23,249 (73.6%) |
| Arts, Media & Entertainment | 4,245 (50.9%) | 4,095 (49.1%) |
| Health Diagnosing & Treating | 8,573 (21.6%) | 31,031 (78.3%) |
| Health Technologists | 6,639 (24.5%) | 20,474 (75.5%) |
| Total (Category) | 102,008 (47.1%) | 114,507 (52.9%) |
| Total (Overall) | 302,183 (53.0%) | 267,930 (47.0%) |
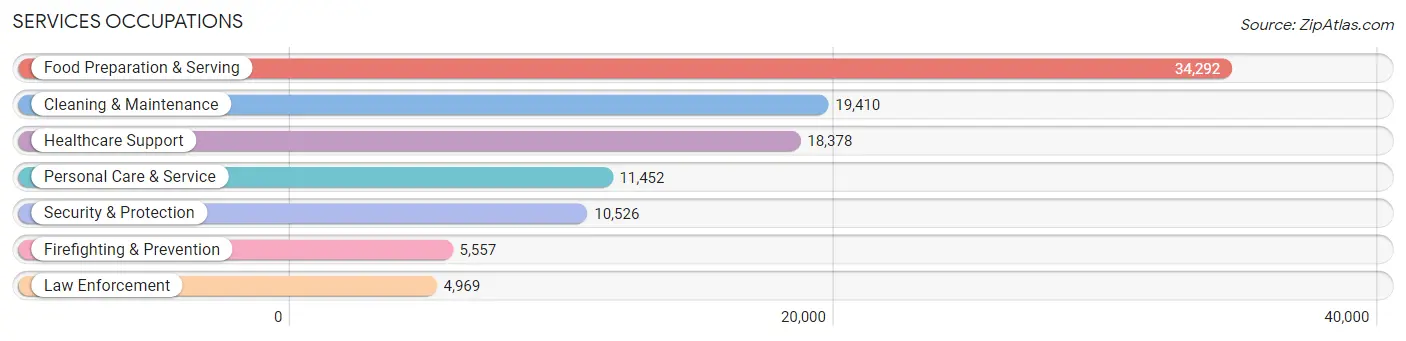
Services Occupations
The most common Services occupations in Area Code 234 are Food Preparation & Serving (34,292 | 6.0%), Cleaning & Maintenance (19,410 | 3.4%), Healthcare Support (18,378 | 3.2%), Personal Care & Service (11,452 | 2.0%), and Security & Protection (10,526 | 1.8%).
Services Occupations by Sex
Within the Services occupations in Area Code 234, the most male-oriented occupations are Law Enforcement (88.8%), Security & Protection (83.9%), and Firefighting & Prevention (79.6%), while the most female-oriented occupations are Healthcare Support (88.0%), Personal Care & Service (77.6%), and Food Preparation & Serving (60.6%).

| Occupation | Male | Female |
| Healthcare Support | 2,202 (12.0%) | 16,176 (88.0%) |
| Security & Protection | 8,834 (83.9%) | 1,692 (16.1%) |
| Firefighting & Prevention | 4,421 (79.6%) | 1,136 (20.4%) |
| Law Enforcement | 4,413 (88.8%) | 556 (11.2%) |
| Food Preparation & Serving | 13,515 (39.4%) | 20,777 (60.6%) |
| Cleaning & Maintenance | 12,651 (65.2%) | 6,759 (34.8%) |
| Personal Care & Service | 2,570 (22.4%) | 8,882 (77.6%) |
| Total (Category) | 39,772 (42.3%) | 54,286 (57.7%) |
| Total (Overall) | 302,183 (53.0%) | 267,930 (47.0%) |
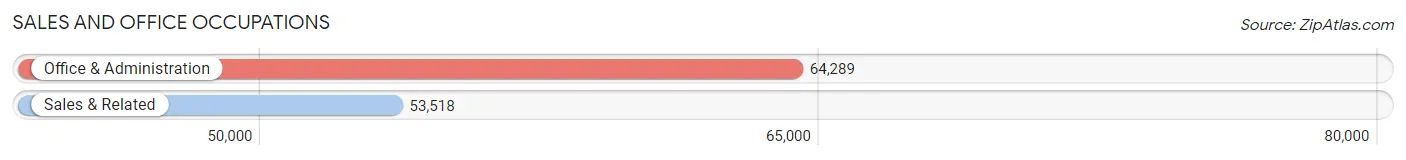
Sales and Office Occupations
The most common Sales and Office occupations in Area Code 234 are Office & Administration (64,289 | 11.3%), and Sales & Related (53,518 | 9.4%).
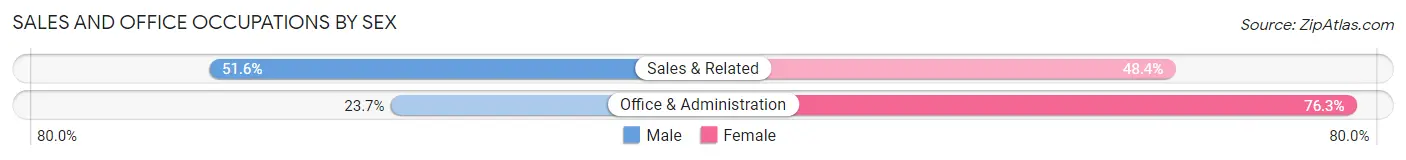
Sales and Office Occupations by Sex
| Occupation | Male | Female |
| Sales & Related | 27,626 (51.6%) | 25,892 (48.4%) |
| Office & Administration | 15,257 (23.7%) | 49,032 (76.3%) |
| Total (Category) | 42,883 (36.4%) | 74,924 (63.6%) |
| Total (Overall) | 302,183 (53.0%) | 267,930 (47.0%) |
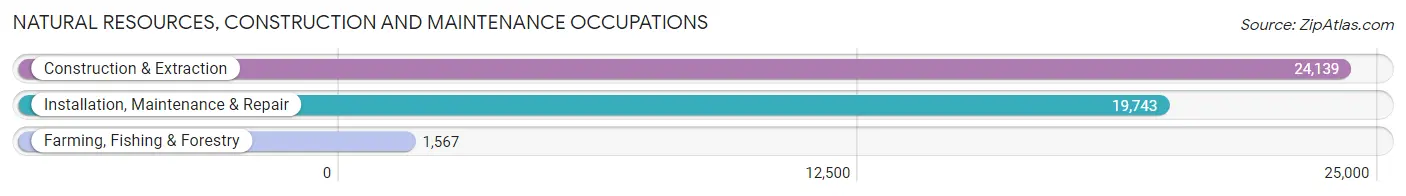
Natural Resources, Construction and Maintenance Occupations
The most common Natural Resources, Construction and Maintenance occupations in Area Code 234 are Construction & Extraction (24,139 | 4.2%), Installation, Maintenance & Repair (19,743 | 3.5%), and Farming, Fishing & Forestry (1,567 | 0.3%).
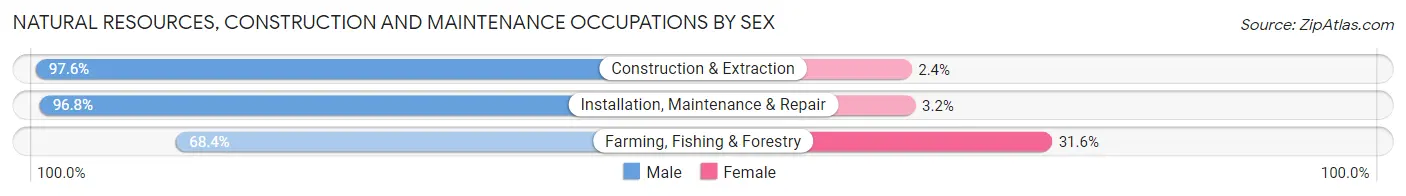
Natural Resources, Construction and Maintenance Occupations by Sex
| Occupation | Male | Female |
| Farming, Fishing & Forestry | 1,072 (68.4%) | 495 (31.6%) |
| Construction & Extraction | 23,570 (97.6%) | 569 (2.4%) |
| Installation, Maintenance & Repair | 19,119 (96.8%) | 624 (3.2%) |
| Total (Category) | 43,761 (96.3%) | 1,688 (3.7%) |
| Total (Overall) | 302,183 (53.0%) | 267,930 (47.0%) |
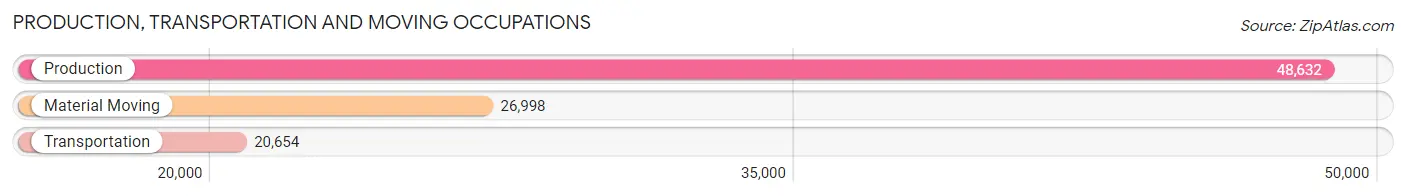
Production, Transportation and Moving Occupations
The most common Production, Transportation and Moving occupations in Area Code 234 are Production (48,632 | 8.5%), Material Moving (26,998 | 4.7%), and Transportation (20,654 | 3.6%).
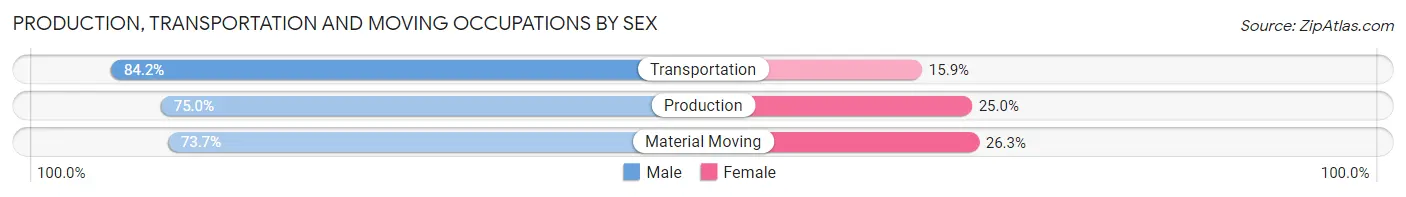
Production, Transportation and Moving Occupations by Sex
| Occupation | Male | Female |
| Production | 36,477 (75.0%) | 12,155 (25.0%) |
| Transportation | 17,381 (84.2%) | 3,273 (15.9%) |
| Material Moving | 19,901 (73.7%) | 7,097 (26.3%) |
| Total (Category) | 73,759 (76.6%) | 22,525 (23.4%) |
| Total (Overall) | 302,183 (53.0%) | 267,930 (47.0%) |
Employment Industries by Sex in Area Code 234
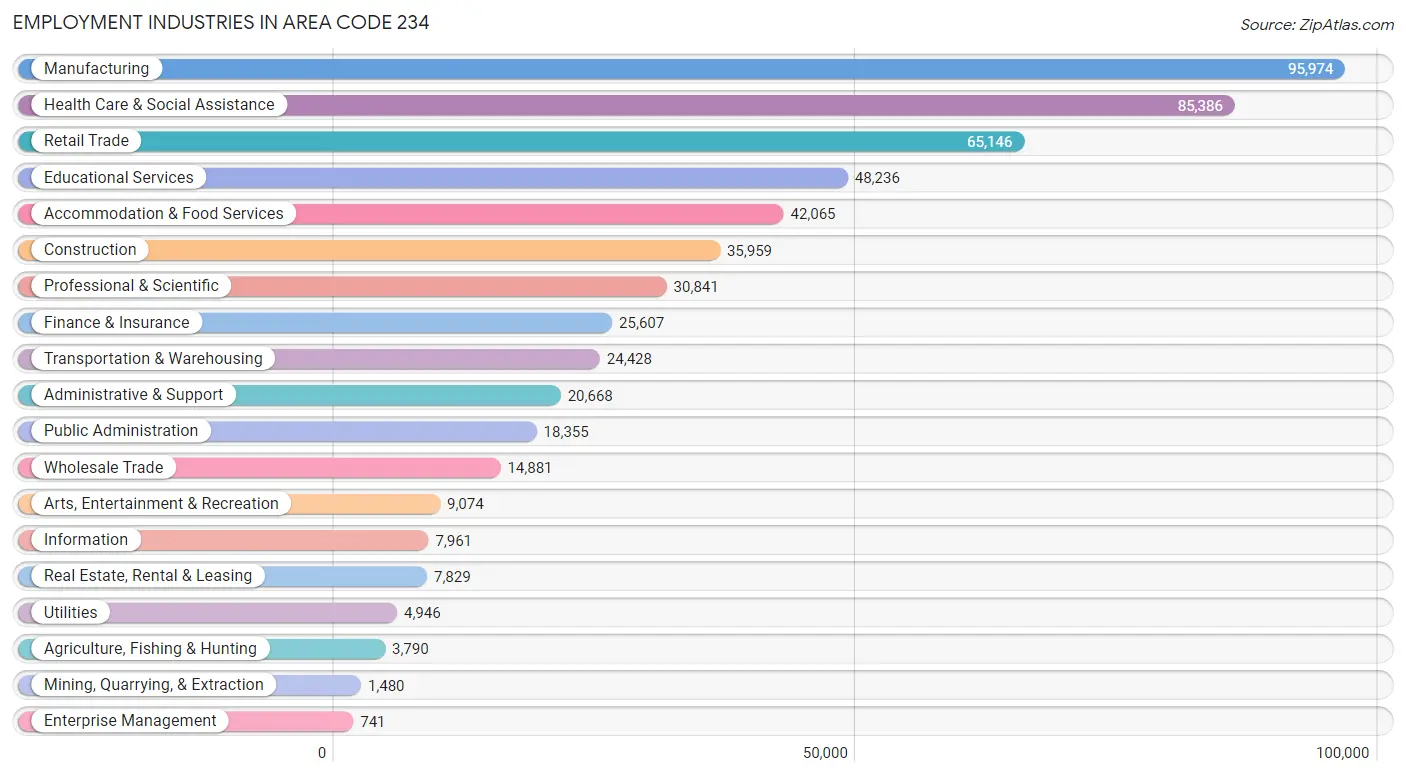
Employment Industries in Area Code 234
The major employment industries in Area Code 234 include Manufacturing (95,974 | 16.8%), Health Care & Social Assistance (85,386 | 15.0%), Retail Trade (65,146 | 11.4%), Educational Services (48,236 | 8.5%), and Accommodation & Food Services (42,065 | 7.4%).
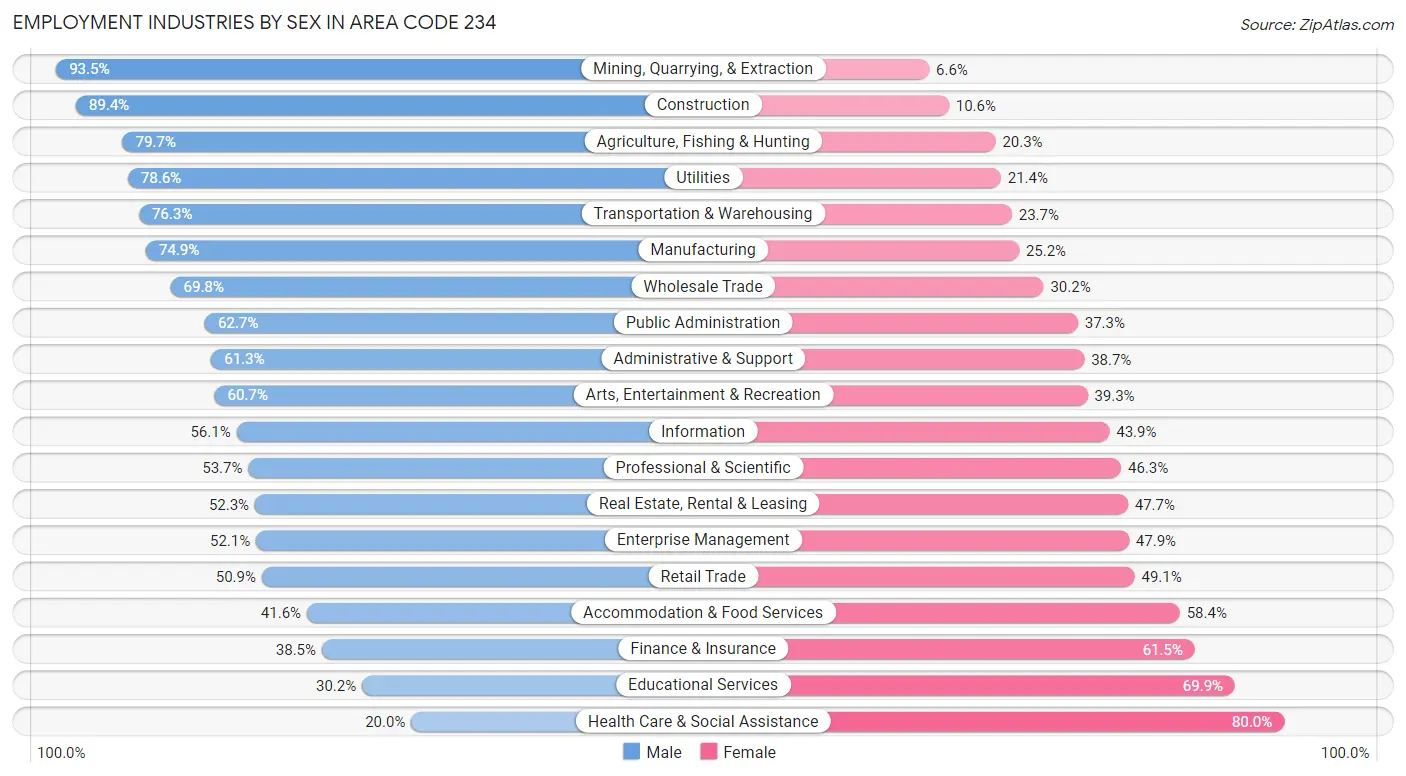
Employment Industries by Sex in Area Code 234
The Area Code 234 industries that see more men than women are Mining, Quarrying, & Extraction (93.4%), Construction (89.4%), and Agriculture, Fishing & Hunting (79.7%), whereas the industries that tend to have a higher number of women are Health Care & Social Assistance (80.0%), Educational Services (69.9%), and Finance & Insurance (61.5%).
| Industry | Male | Female |
| Agriculture, Fishing & Hunting | 3,021 (79.7%) | 769 (20.3%) |
| Mining, Quarrying, & Extraction | 1,383 (93.4%) | 97 (6.6%) |
| Construction | 32,137 (89.4%) | 3,822 (10.6%) |
| Manufacturing | 71,839 (74.9%) | 24,135 (25.2%) |
| Wholesale Trade | 10,382 (69.8%) | 4,499 (30.2%) |
| Retail Trade | 33,163 (50.9%) | 31,983 (49.1%) |
| Transportation & Warehousing | 18,643 (76.3%) | 5,785 (23.7%) |
| Utilities | 3,888 (78.6%) | 1,058 (21.4%) |
| Information | 4,469 (56.1%) | 3,492 (43.9%) |
| Finance & Insurance | 9,850 (38.5%) | 15,757 (61.5%) |
| Real Estate, Rental & Leasing | 4,096 (52.3%) | 3,733 (47.7%) |
| Professional & Scientific | 16,561 (53.7%) | 14,280 (46.3%) |
| Enterprise Management | 386 (52.1%) | 355 (47.9%) |
| Administrative & Support | 12,677 (61.3%) | 7,991 (38.7%) |
| Educational Services | 14,544 (30.1%) | 33,692 (69.9%) |
| Health Care & Social Assistance | 17,048 (20.0%) | 68,338 (80.0%) |
| Arts, Entertainment & Recreation | 5,505 (60.7%) | 3,569 (39.3%) |
| Accommodation & Food Services | 17,485 (41.6%) | 24,580 (58.4%) |
| Public Administration | 11,502 (62.7%) | 6,853 (37.3%) |
| Total | 302,183 (53.0%) | 267,930 (47.0%) |
Education in Area Code 234
School Enrollment in Area Code 234
The most common levels of schooling among the 255,413 students in Area Code 234 are high school (57,805 | 22.6%), middle school (55,780 | 21.8%), and elementary school (52,076 | 20.4%).
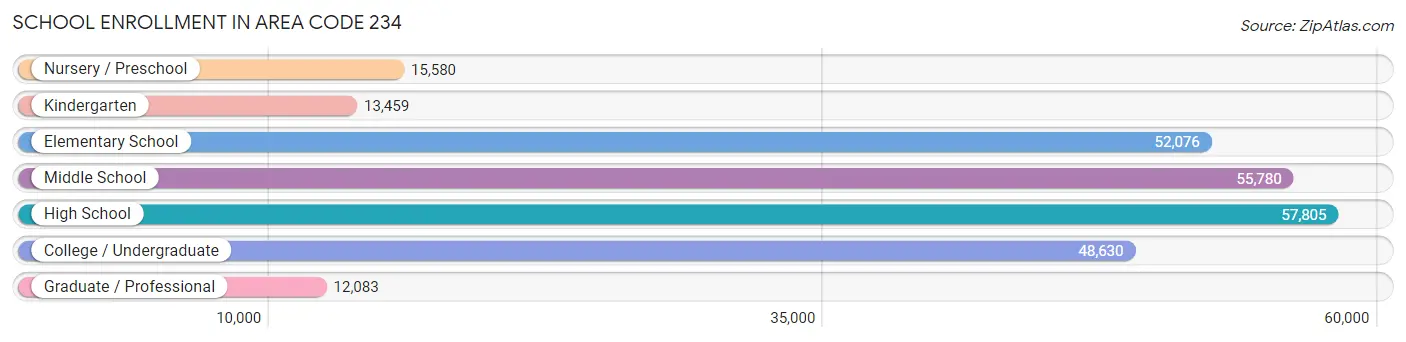
| School Level | # Students | % Students |
| Nursery / Preschool | 15,580 | 6.1% |
| Kindergarten | 13,459 | 5.3% |
| Elementary School | 52,076 | 20.4% |
| Middle School | 55,780 | 21.8% |
| High School | 57,805 | 22.6% |
| College / Undergraduate | 48,630 | 19.0% |
| Graduate / Professional | 12,083 | 4.7% |
| Total | 255,413 | 100.0% |
School Enrollment by Age by Funding Source in Area Code 234
Out of a total of 255,413 students who are enrolled in schools in Area Code 234, 45,498 (17.8%) attend a private institution, while the remaining 209,915 (82.2%) are enrolled in public schools. The age group of 3 to 4 year olds has the highest likelihood of being enrolled in private schools, with 4,786 (41.5% in the age bracket) enrolled. Conversely, the age group of 15 to 17 year olds has the lowest likelihood of being enrolled in a private school, with 38,332 (89.9% in the age bracket) attending a public institution.
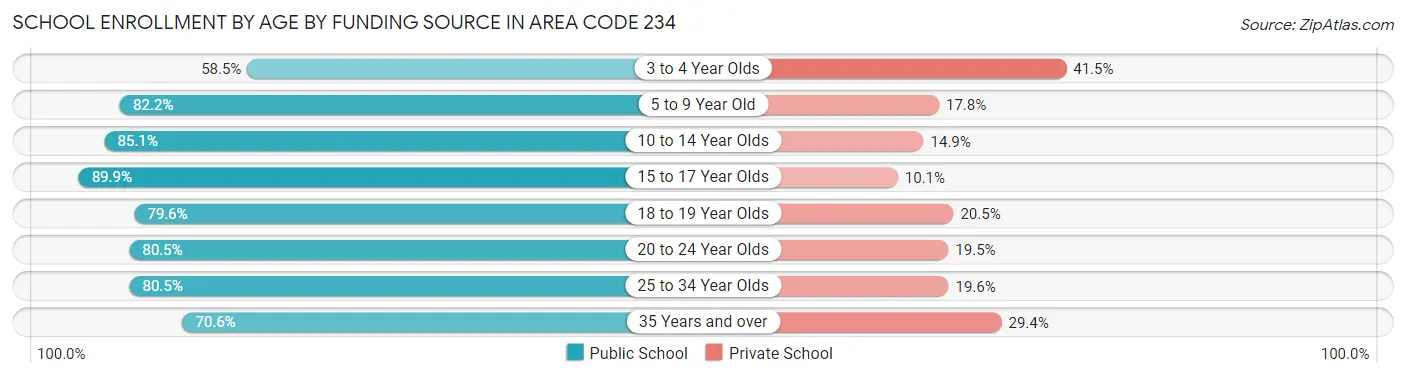
| Age Bracket | Public School | Private School |
| 3 to 4 Year Olds | 6,759 (58.5%) | 4,786 (41.5%) |
| 5 to 9 Year Old | 51,206 (82.2%) | 11,068 (17.8%) |
| 10 to 14 Year Olds | 57,746 (85.1%) | 10,102 (14.9%) |
| 15 to 17 Year Olds | 38,332 (89.9%) | 4,302 (10.1%) |
| 18 to 19 Year Olds | 16,575 (79.5%) | 4,261 (20.4%) |
| 20 to 24 Year Olds | 20,985 (80.5%) | 5,088 (19.5%) |
| 25 to 34 Year Olds | 9,989 (80.4%) | 2,428 (19.6%) |
| 35 Years and over | 8,321 (70.6%) | 3,465 (29.4%) |
| Total | 209,915 (82.2%) | 45,498 (17.8%) |
Educational Attainment by Field of Study in Area Code 234
Business (59,067 | 22.2%), education (43,295 | 16.3%), science & technology (33,727 | 12.7%), engineering (18,511 | 7.0%), and arts & humanities (16,401 | 6.2%) are the most common fields of study among 266,180 individuals in Area Code 234 who have obtained a bachelor's degree or higher.
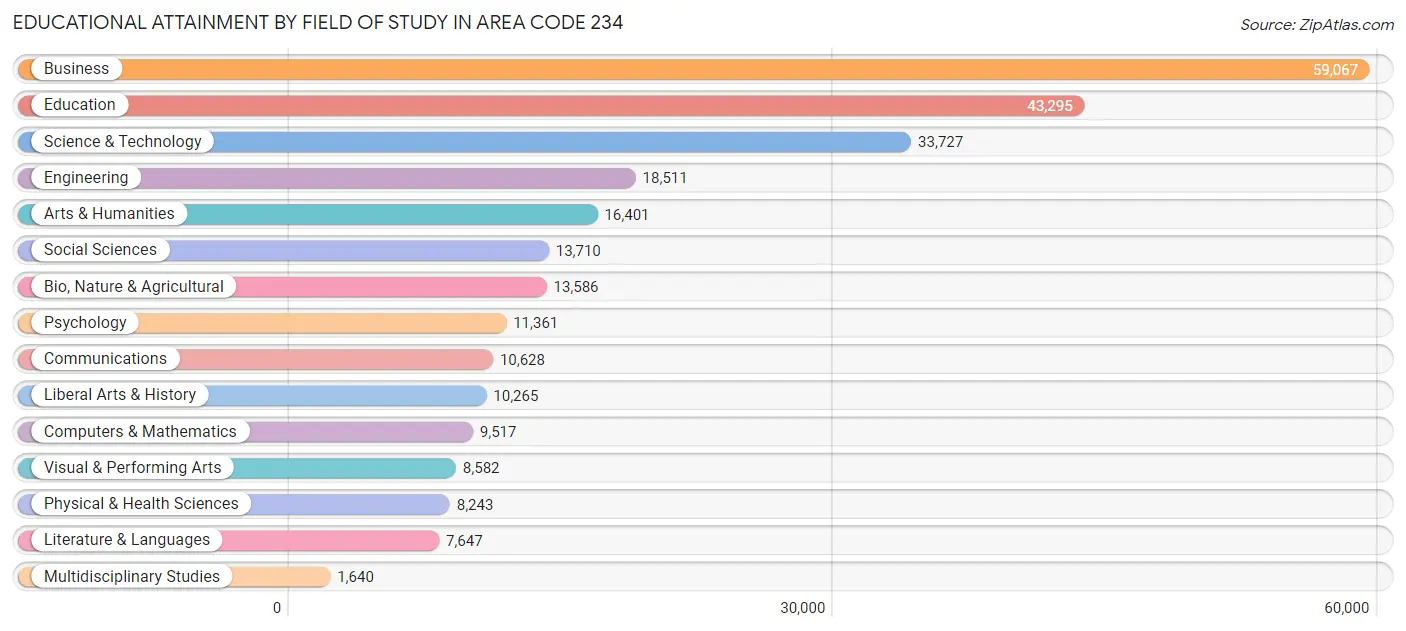
| Field of Study | # Graduates | % Graduates |
| Computers & Mathematics | 9,517 | 3.6% |
| Bio, Nature & Agricultural | 13,586 | 5.1% |
| Physical & Health Sciences | 8,243 | 3.1% |
| Psychology | 11,361 | 4.3% |
| Social Sciences | 13,710 | 5.1% |
| Engineering | 18,511 | 7.0% |
| Multidisciplinary Studies | 1,640 | 0.6% |
| Science & Technology | 33,727 | 12.7% |
| Business | 59,067 | 22.2% |
| Education | 43,295 | 16.3% |
| Literature & Languages | 7,647 | 2.9% |
| Liberal Arts & History | 10,265 | 3.9% |
| Visual & Performing Arts | 8,582 | 3.2% |
| Communications | 10,628 | 4.0% |
| Arts & Humanities | 16,401 | 6.2% |
| Total | 266,180 | 100.0% |
Transportation & Commute in Area Code 234
Vehicle Availability by Sex in Area Code 234
The most prevalent vehicle ownership categories in Area Code 234 are males with 2 vehicles (130,345, accounting for 44.0%) and females with 2 vehicles (110,301, making up 50.2%).
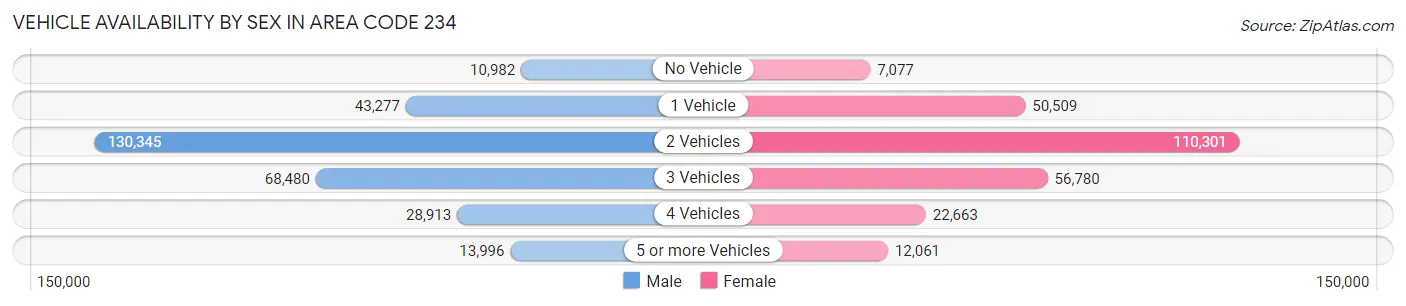
| Vehicles Available | Male | Female |
| No Vehicle | 10,982 (3.7%) | 7,077 (2.7%) |
| 1 Vehicle | 43,277 (14.6%) | 50,509 (19.5%) |
| 2 Vehicles | 130,345 (44.0%) | 110,301 (42.5%) |
| 3 Vehicles | 68,480 (23.1%) | 56,780 (21.9%) |
| 4 Vehicles | 28,913 (9.8%) | 22,663 (8.7%) |
| 5 or more Vehicles | 13,996 (4.7%) | 12,061 (4.6%) |
| Total | 295,993 (100.0%) | 259,391 (100.0%) |
Commute Time in Area Code 234
The most frequently occuring commute durations in Area Code 234 are 15 to 19 minutes (79,748 commuters, 15.8%), 10 to 14 minutes (76,016 commuters, 15.0%), and 20 to 24 minutes (72,722 commuters, 14.4%).
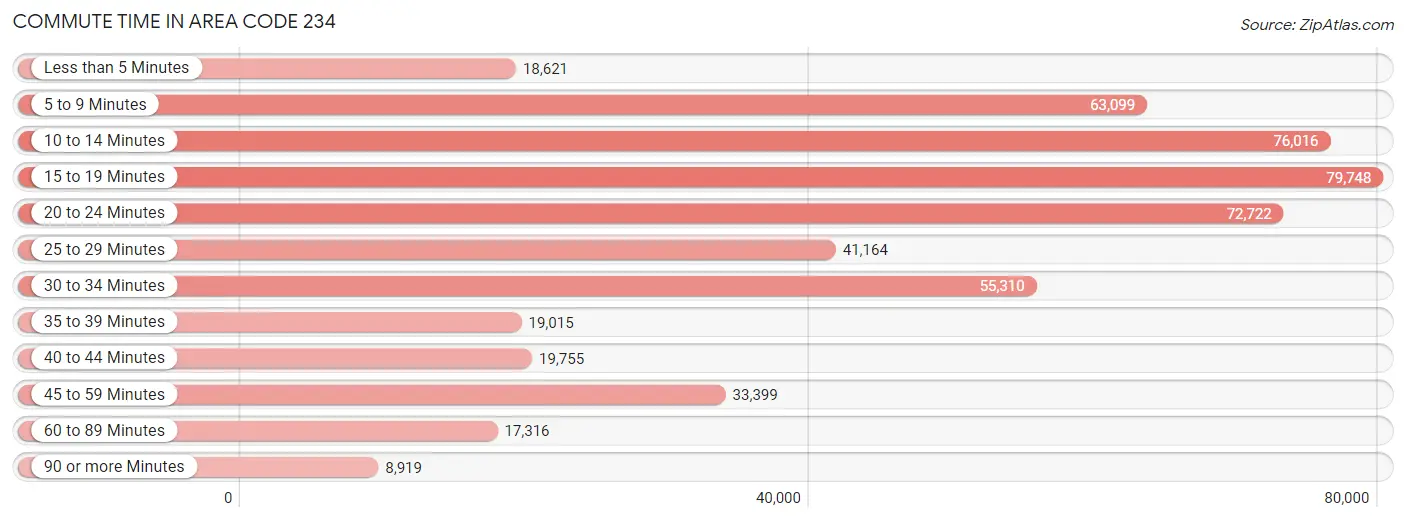
| Commute Time | # Commuters | % Commuters |
| Less than 5 Minutes | 18,621 | 3.7% |
| 5 to 9 Minutes | 63,099 | 12.5% |
| 10 to 14 Minutes | 76,016 | 15.0% |
| 15 to 19 Minutes | 79,748 | 15.8% |
| 20 to 24 Minutes | 72,722 | 14.4% |
| 25 to 29 Minutes | 41,164 | 8.2% |
| 30 to 34 Minutes | 55,310 | 11.0% |
| 35 to 39 Minutes | 19,015 | 3.8% |
| 40 to 44 Minutes | 19,755 | 3.9% |
| 45 to 59 Minutes | 33,399 | 6.6% |
| 60 to 89 Minutes | 17,316 | 3.4% |
| 90 or more Minutes | 8,919 | 1.8% |
Commute Time by Sex in Area Code 234
The most common commute times in Area Code 234 are 15 to 19 minutes (39,758 commuters, 14.7%) for males and 15 to 19 minutes (39,990 commuters, 17.1%) for females.
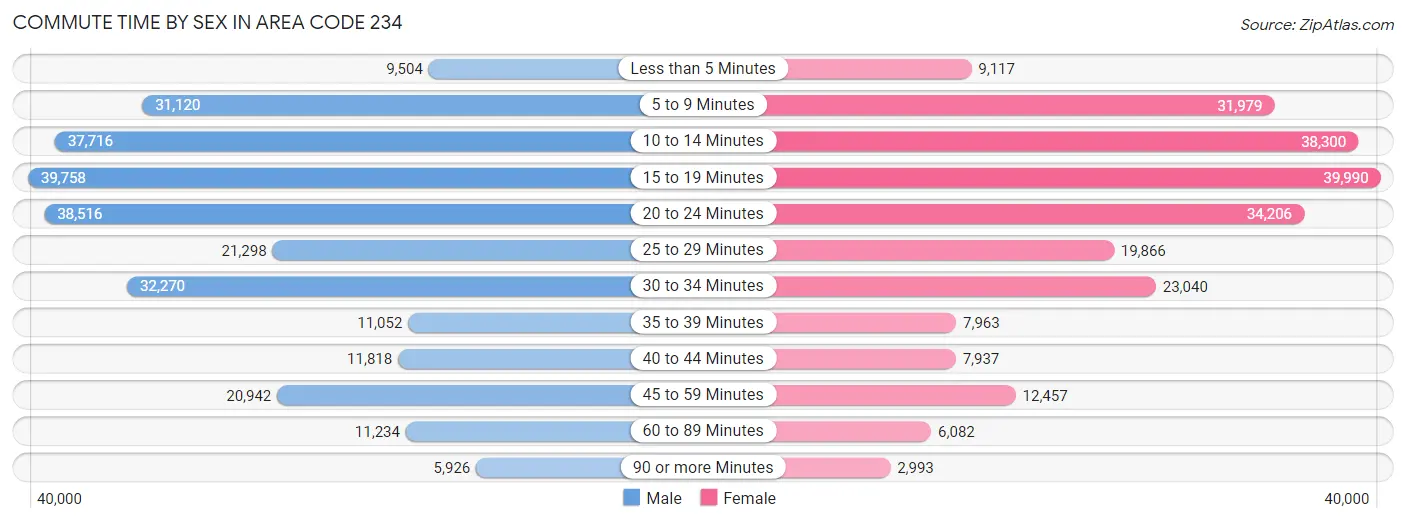
| Commute Time | Male | Female |
| Less than 5 Minutes | 9,504 (3.5%) | 9,117 (3.9%) |
| 5 to 9 Minutes | 31,120 (11.5%) | 31,979 (13.7%) |
| 10 to 14 Minutes | 37,716 (13.9%) | 38,300 (16.4%) |
| 15 to 19 Minutes | 39,758 (14.7%) | 39,990 (17.1%) |
| 20 to 24 Minutes | 38,516 (14.2%) | 34,206 (14.6%) |
| 25 to 29 Minutes | 21,298 (7.9%) | 19,866 (8.5%) |
| 30 to 34 Minutes | 32,270 (11.9%) | 23,040 (9.9%) |
| 35 to 39 Minutes | 11,052 (4.1%) | 7,963 (3.4%) |
| 40 to 44 Minutes | 11,818 (4.4%) | 7,937 (3.4%) |
| 45 to 59 Minutes | 20,942 (7.7%) | 12,457 (5.3%) |
| 60 to 89 Minutes | 11,234 (4.1%) | 6,082 (2.6%) |
| 90 or more Minutes | 5,926 (2.2%) | 2,993 (1.3%) |
Time of Departure to Work by Sex in Area Code 234
The most frequent times of departure to work in Area Code 234 are 7:00 AM to 7:29 AM (38,402, 14.2%) for males and 7:30 AM to 7:59 AM (34,423, 14.7%) for females.
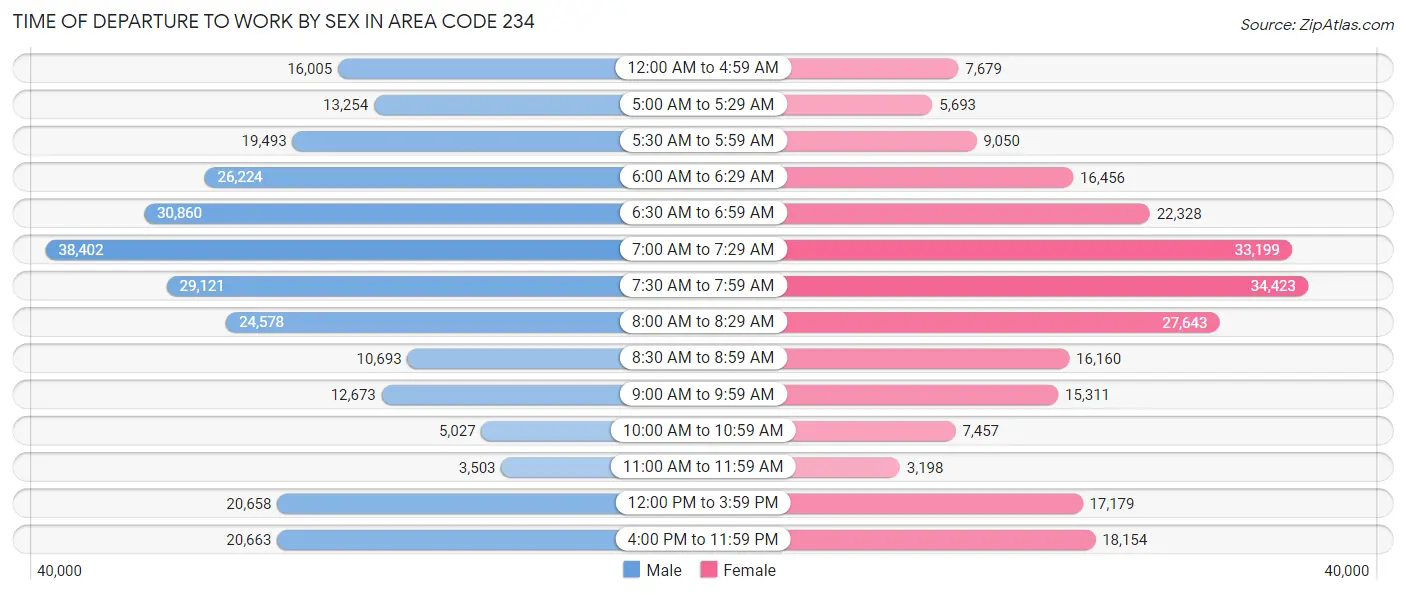
| Time of Departure | Male | Female |
| 12:00 AM to 4:59 AM | 16,005 (5.9%) | 7,679 (3.3%) |
| 5:00 AM to 5:29 AM | 13,254 (4.9%) | 5,693 (2.4%) |
| 5:30 AM to 5:59 AM | 19,493 (7.2%) | 9,050 (3.9%) |
| 6:00 AM to 6:29 AM | 26,224 (9.7%) | 16,456 (7.0%) |
| 6:30 AM to 6:59 AM | 30,860 (11.4%) | 22,328 (9.5%) |
| 7:00 AM to 7:29 AM | 38,402 (14.2%) | 33,199 (14.2%) |
| 7:30 AM to 7:59 AM | 29,121 (10.7%) | 34,423 (14.7%) |
| 8:00 AM to 8:29 AM | 24,578 (9.1%) | 27,643 (11.8%) |
| 8:30 AM to 8:59 AM | 10,693 (3.9%) | 16,160 (6.9%) |
| 9:00 AM to 9:59 AM | 12,673 (4.7%) | 15,311 (6.6%) |
| 10:00 AM to 10:59 AM | 5,027 (1.8%) | 7,457 (3.2%) |
| 11:00 AM to 11:59 AM | 3,503 (1.3%) | 3,198 (1.4%) |
| 12:00 PM to 3:59 PM | 20,658 (7.6%) | 17,179 (7.3%) |
| 4:00 PM to 11:59 PM | 20,663 (7.6%) | 18,154 (7.8%) |
| Total | 271,154 (100.0%) | 233,930 (100.0%) |
Housing Occupancy in Area Code 234
Occupancy by Ownership in Area Code 234
Of the total 476,274 dwellings in Area Code 234, owner-occupied units account for 344,955 (72.4%), while renter-occupied units make up 131,319 (27.6%).
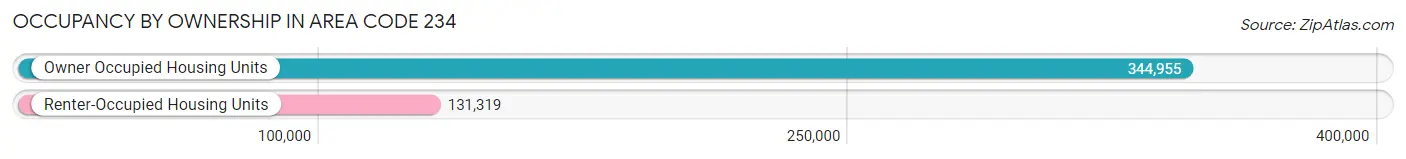
| Occupancy | # Housing Units | % Housing Units |
| Owner Occupied Housing Units | 344,955 | 72.4% |
| Renter-Occupied Housing Units | 131,319 | 27.6% |
| Total Occupied Housing Units | 476,274 | 100.0% |
Occupancy by Household Size in Area Code 234
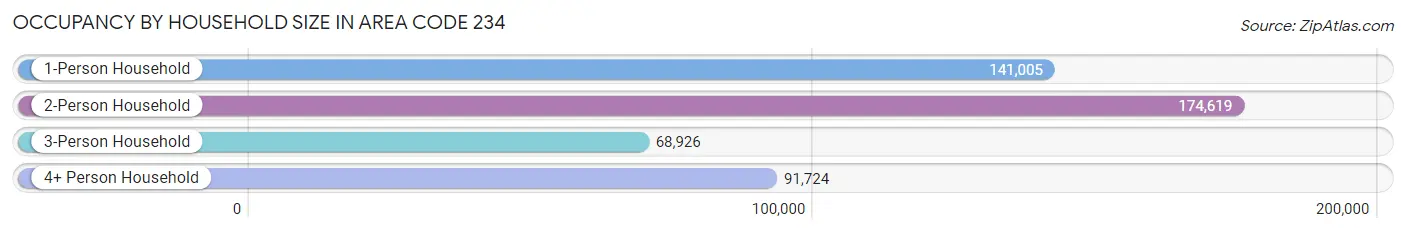
| Household Size | # Housing Units | % Housing Units |
| 1-Person Household | 141,005 | 29.6% |
| 2-Person Household | 174,619 | 36.7% |
| 3-Person Household | 68,926 | 14.5% |
| 4+ Person Household | 91,724 | 19.3% |
| Total Housing Units | 476,274 | 100.0% |
Occupancy by Ownership by Household Size in Area Code 234
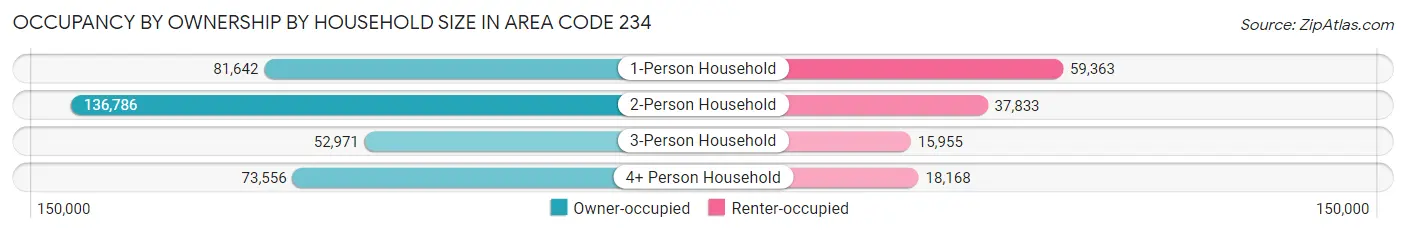
| Household Size | Owner-occupied | Renter-occupied |
| 1-Person Household | 81,642 (57.9%) | 59,363 (42.1%) |
| 2-Person Household | 136,786 (78.3%) | 37,833 (21.7%) |
| 3-Person Household | 52,971 (76.8%) | 15,955 (23.2%) |
| 4+ Person Household | 73,556 (80.2%) | 18,168 (19.8%) |
| Total Housing Units | 344,955 (72.4%) | 131,319 (27.6%) |
Occupancy by Educational Attainment in Area Code 234
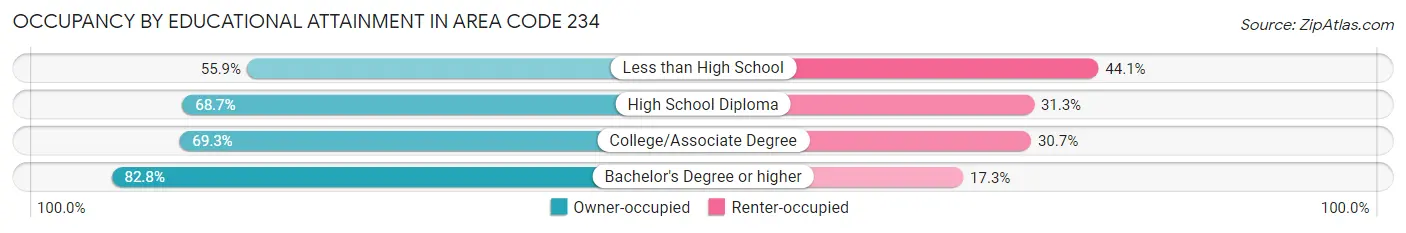
| Household Size | Owner-occupied | Renter-occupied |
| Less than High School | 18,886 (55.9%) | 14,877 (44.1%) |
| High School Diploma | 104,604 (68.7%) | 47,615 (31.3%) |
| College/Associate Degree | 96,606 (69.3%) | 42,797 (30.7%) |
| Bachelor's Degree or higher | 124,859 (82.8%) | 26,030 (17.2%) |
Occupancy by Age of Householder in Area Code 234
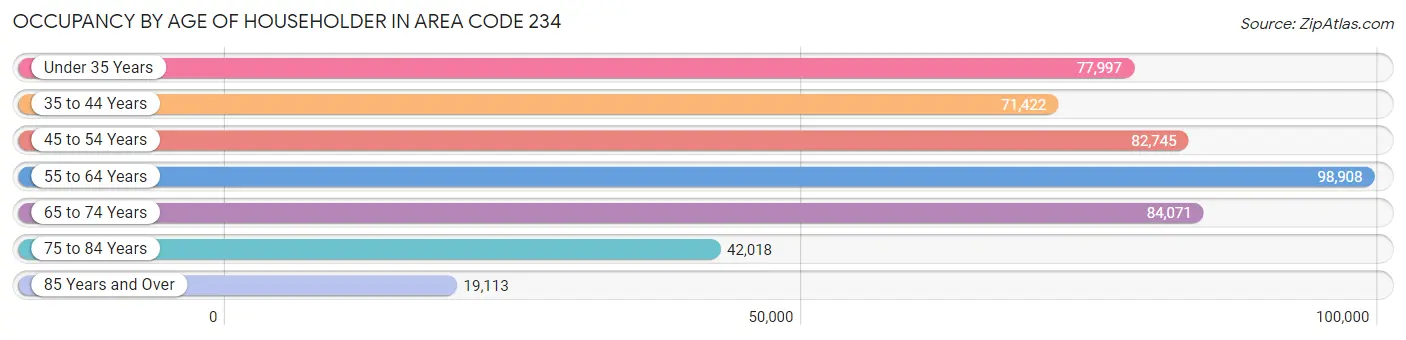
| Age Bracket | # Households | % Households |
| Under 35 Years | 77,997 | 16.4% |
| 35 to 44 Years | 71,422 | 15.0% |
| 45 to 54 Years | 82,745 | 17.4% |
| 55 to 64 Years | 98,908 | 20.8% |
| 65 to 74 Years | 84,071 | 17.6% |
| 75 to 84 Years | 42,018 | 8.8% |
| 85 Years and Over | 19,113 | 4.0% |
| Total | 476,274 | 100.0% |
Housing Finances in Area Code 234
Median Income by Occupancy in Area Code 234
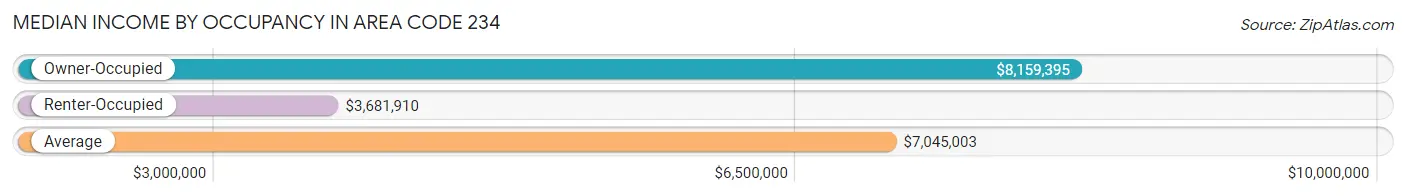
| Occupancy Type | # Households | Median Income |
| Owner-Occupied | 344,955 (72.4%) | $8,159,395 |
| Renter-Occupied | 131,319 (27.6%) | $3,681,910 |
| Average | 476,274 (100.0%) | $7,045,003 |
Occupancy by Householder Income Bracket in Area Code 234
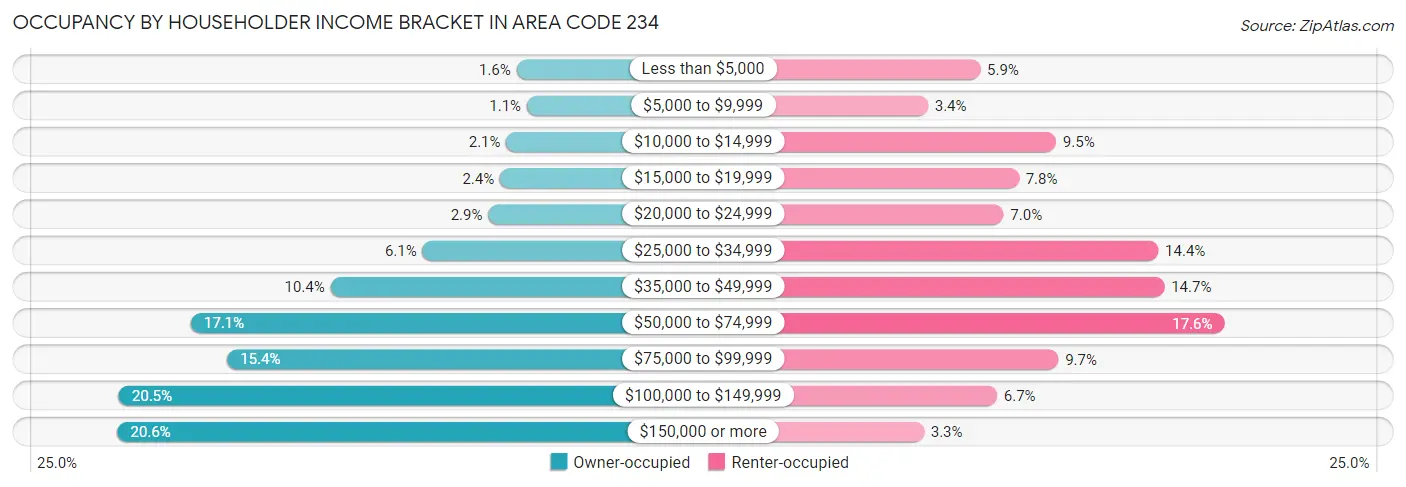
| Income Bracket | Owner-occupied | Renter-occupied |
| Less than $5,000 | 5,415 (1.6%) | 7,784 (5.9%) |
| $5,000 to $9,999 | 3,718 (1.1%) | 4,514 (3.4%) |
| $10,000 to $14,999 | 7,112 (2.1%) | 12,524 (9.5%) |
| $15,000 to $19,999 | 8,141 (2.4%) | 10,201 (7.8%) |
| $20,000 to $24,999 | 10,087 (2.9%) | 9,251 (7.0%) |
| $25,000 to $34,999 | 20,875 (6.0%) | 18,917 (14.4%) |
| $35,000 to $49,999 | 35,996 (10.4%) | 19,299 (14.7%) |
| $50,000 to $74,999 | 58,921 (17.1%) | 23,059 (17.6%) |
| $75,000 to $99,999 | 52,949 (15.3%) | 12,669 (9.7%) |
| $100,000 to $149,999 | 70,758 (20.5%) | 8,837 (6.7%) |
| $150,000 or more | 70,983 (20.6%) | 4,264 (3.3%) |
| Total | 344,955 (100.0%) | 131,319 (100.0%) |
Monthly Housing Cost Tiers in Area Code 234
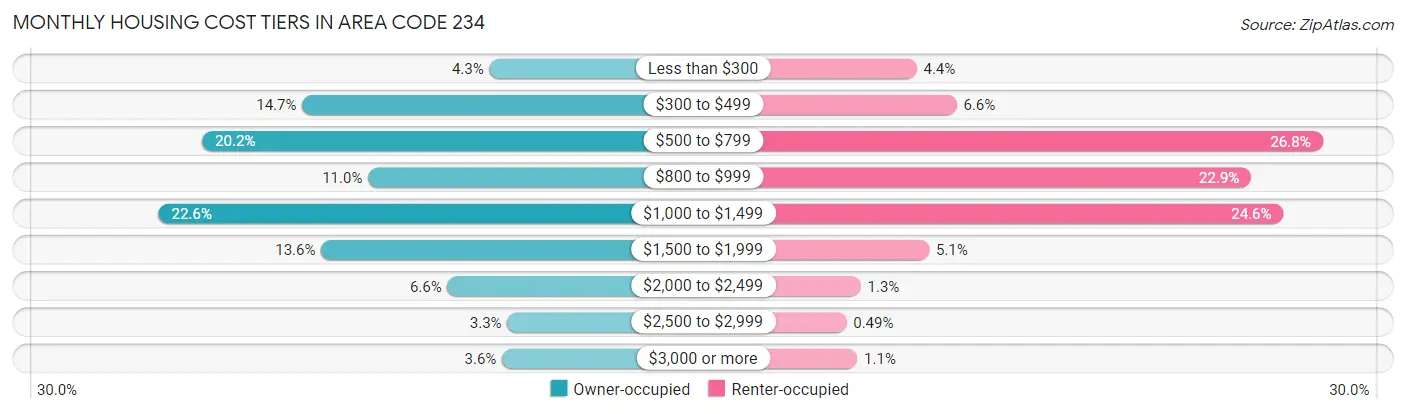
| Monthly Cost | Owner-occupied | Renter-occupied |
| Less than $300 | 14,917 (4.3%) | 5,745 (4.4%) |
| $300 to $499 | 50,585 (14.7%) | 8,645 (6.6%) |
| $500 to $799 | 69,645 (20.2%) | 35,184 (26.8%) |
| $800 to $999 | 38,002 (11.0%) | 30,012 (22.9%) |
| $1,000 to $1,499 | 77,968 (22.6%) | 32,344 (24.6%) |
| $1,500 to $1,999 | 46,955 (13.6%) | 6,647 (5.1%) |
| $2,000 to $2,499 | 22,896 (6.6%) | 1,681 (1.3%) |
| $2,500 to $2,999 | 11,485 (3.3%) | 639 (0.5%) |
| $3,000 or more | 12,502 (3.6%) | 1,434 (1.1%) |
| Total | 344,955 (100.0%) | 131,319 (100.0%) |
Physical Housing Characteristics in Area Code 234
Housing Structures in Area Code 234
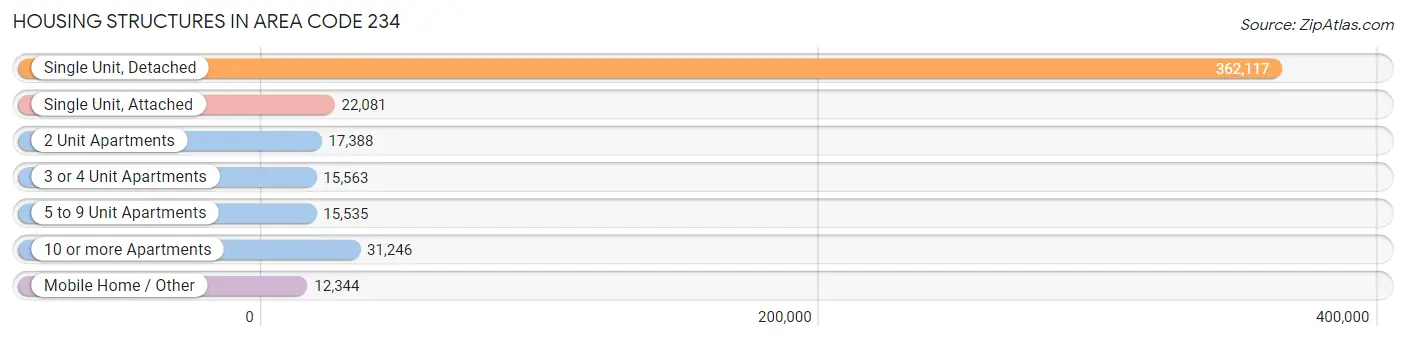
| Structure Type | # Housing Units | % Housing Units |
| Single Unit, Detached | 362,117 | 76.0% |
| Single Unit, Attached | 22,081 | 4.6% |
| 2 Unit Apartments | 17,388 | 3.6% |
| 3 or 4 Unit Apartments | 15,563 | 3.3% |
| 5 to 9 Unit Apartments | 15,535 | 3.3% |
| 10 or more Apartments | 31,246 | 6.6% |
| Mobile Home / Other | 12,344 | 2.6% |
| Total | 476,274 | 100.0% |
Housing Structures by Occupancy in Area Code 234
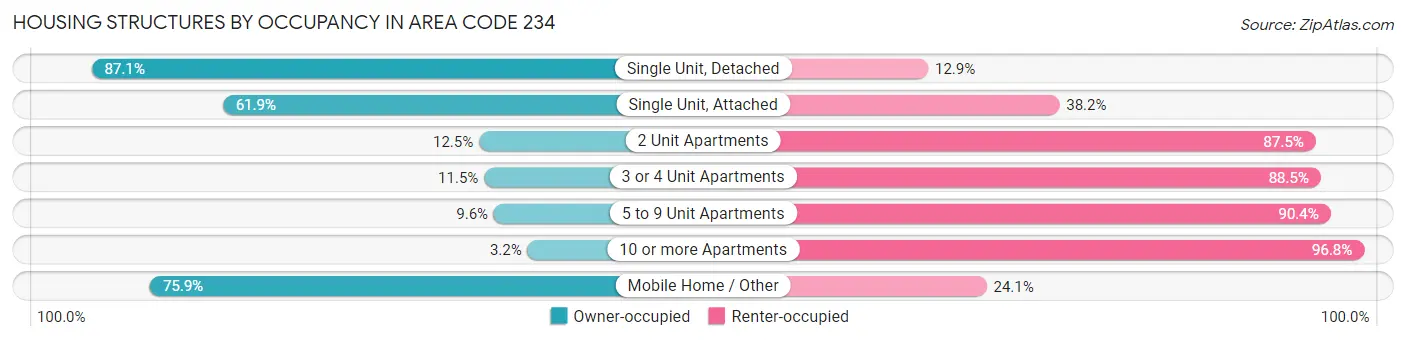
| Structure Type | Owner-occupied | Renter-occupied |
| Single Unit, Detached | 315,478 (87.1%) | 46,639 (12.9%) |
| Single Unit, Attached | 13,658 (61.9%) | 8,423 (38.2%) |
| 2 Unit Apartments | 2,173 (12.5%) | 15,215 (87.5%) |
| 3 or 4 Unit Apartments | 1,793 (11.5%) | 13,770 (88.5%) |
| 5 to 9 Unit Apartments | 1,497 (9.6%) | 14,038 (90.4%) |
| 10 or more Apartments | 992 (3.2%) | 30,254 (96.8%) |
| Mobile Home / Other | 9,364 (75.9%) | 2,980 (24.1%) |
| Total | 344,955 (72.4%) | 131,319 (27.6%) |
Housing Structures by Number of Rooms in Area Code 234
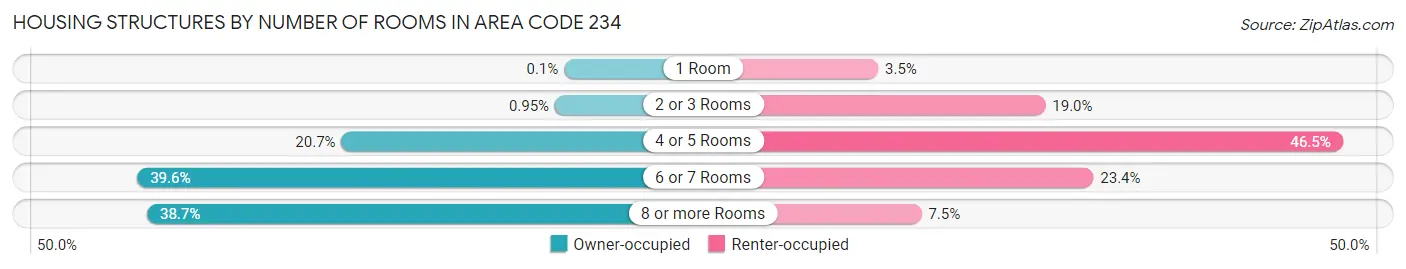
| Number of Rooms | Owner-occupied | Renter-occupied |
| 1 Room | 352 (0.1%) | 4,642 (3.5%) |
| 2 or 3 Rooms | 3,264 (0.9%) | 24,945 (19.0%) |
| 4 or 5 Rooms | 71,407 (20.7%) | 61,055 (46.5%) |
| 6 or 7 Rooms | 136,550 (39.6%) | 30,778 (23.4%) |
| 8 or more Rooms | 133,382 (38.7%) | 9,899 (7.5%) |
| Total | 344,955 (100.0%) | 131,319 (100.0%) |
Housing Structure by Heating Type in Area Code 234
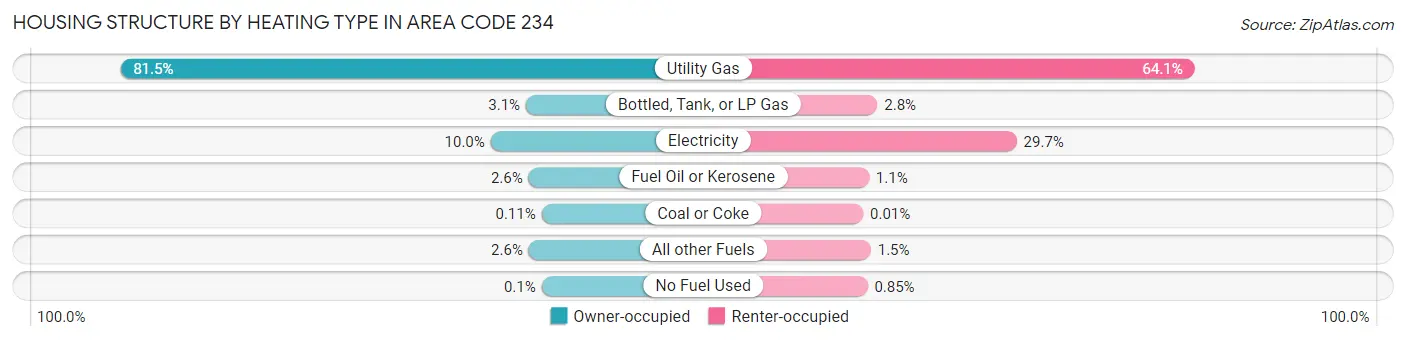
| Heating Type | Owner-occupied | Renter-occupied |
| Utility Gas | 281,191 (81.5%) | 84,121 (64.1%) |
| Bottled, Tank, or LP Gas | 10,760 (3.1%) | 3,626 (2.8%) |
| Electricity | 34,319 (10.0%) | 38,982 (29.7%) |
| Fuel Oil or Kerosene | 9,047 (2.6%) | 1,490 (1.1%) |
| Coal or Coke | 383 (0.1%) | 16 (0.0%) |
| All other Fuels | 8,913 (2.6%) | 1,974 (1.5%) |
| No Fuel Used | 342 (0.1%) | 1,110 (0.9%) |
| Total | 344,955 (100.0%) | 131,319 (100.0%) |
Household Vehicle Usage in Area Code 234
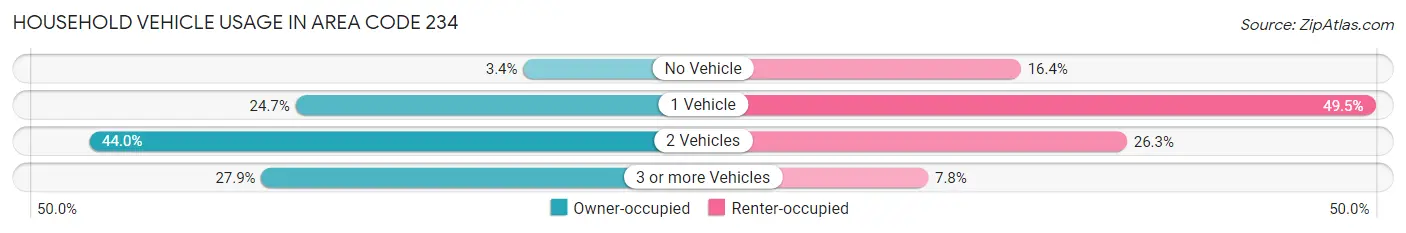
| Vehicles per Household | Owner-occupied | Renter-occupied |
| No Vehicle | 11,865 (3.4%) | 21,553 (16.4%) |
| 1 Vehicle | 85,194 (24.7%) | 65,016 (49.5%) |
| 2 Vehicles | 151,698 (44.0%) | 34,554 (26.3%) |
| 3 or more Vehicles | 96,198 (27.9%) | 10,196 (7.8%) |
| Total | 344,955 (100.0%) | 131,319 (100.0%) |
Real Estate & Mortgages in Area Code 234
Real Estate and Mortgage Overview in Area Code 234
| Characteristic | Without Mortgage | With Mortgage |
| Housing Units | 134,604 | 210,351 |
| Median Property Value | $15,443,200 | $16,467,800 |
| Median Household Income | $6,259,897 | $51,848 |
| Monthly Housing Costs | $50,720 | $12,201 |
| Real Estate Taxes | $209,986 | $3,590 |
Property Value by Mortgage Status in Area Code 234
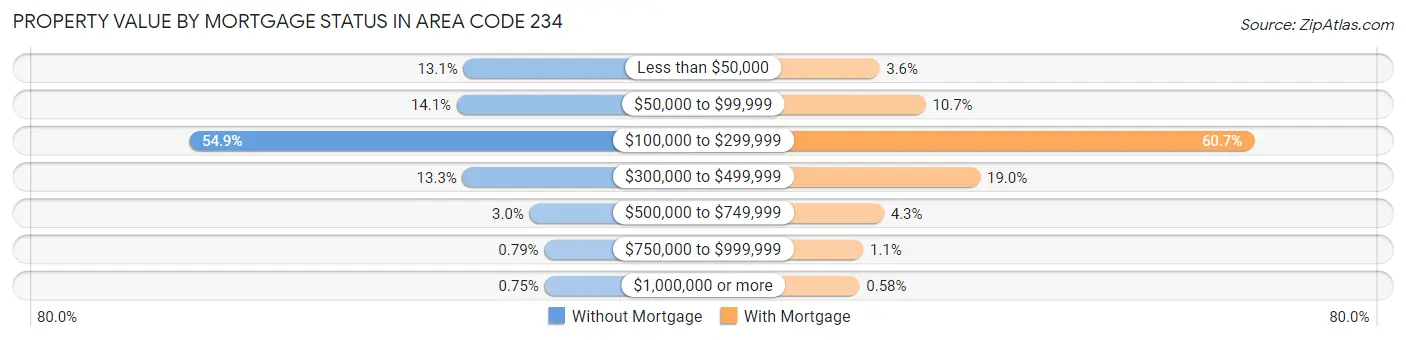
| Property Value | Without Mortgage | With Mortgage |
| Less than $50,000 | 17,660 (13.1%) | 7,625 (3.6%) |
| $50,000 to $99,999 | 19,012 (14.1%) | 22,394 (10.6%) |
| $100,000 to $299,999 | 73,934 (54.9%) | 127,775 (60.7%) |
| $300,000 to $499,999 | 17,832 (13.3%) | 39,902 (19.0%) |
| $500,000 to $749,999 | 4,094 (3.0%) | 9,047 (4.3%) |
| $750,000 to $999,999 | 1,061 (0.8%) | 2,392 (1.1%) |
| $1,000,000 or more | 1,011 (0.7%) | 1,216 (0.6%) |
| Total | 134,604 (100.0%) | 210,351 (100.0%) |
Household Income by Mortgage Status in Area Code 234
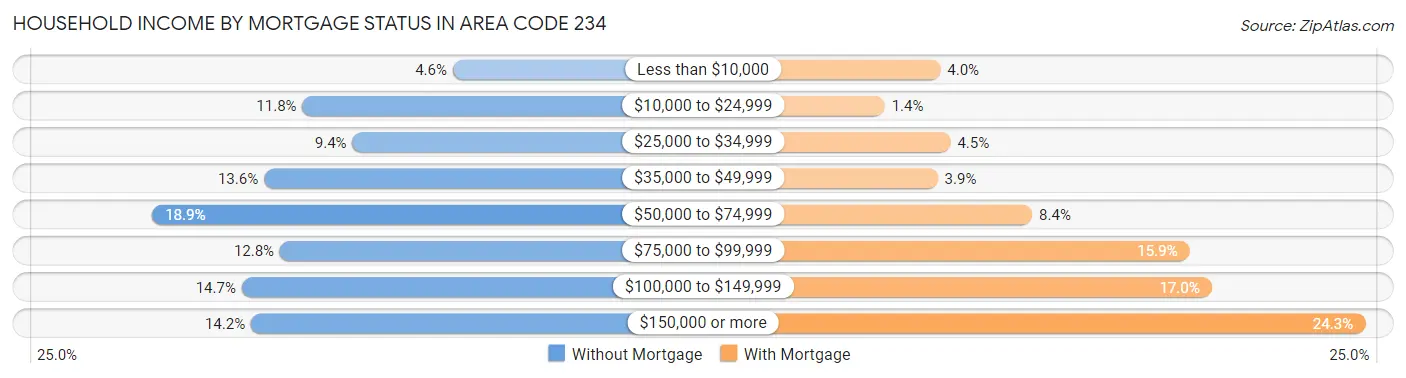
| Household Income | Without Mortgage | With Mortgage |
| Less than $10,000 | 6,201 (4.6%) | 8,503 (4.0%) |
| $10,000 to $24,999 | 15,838 (11.8%) | 2,932 (1.4%) |
| $25,000 to $34,999 | 12,642 (9.4%) | 9,502 (4.5%) |
| $35,000 to $49,999 | 18,303 (13.6%) | 8,233 (3.9%) |
| $50,000 to $74,999 | 25,467 (18.9%) | 17,693 (8.4%) |
| $75,000 to $99,999 | 17,283 (12.8%) | 33,454 (15.9%) |
| $100,000 to $149,999 | 19,735 (14.7%) | 35,666 (17.0%) |
| $150,000 or more | 19,135 (14.2%) | 51,023 (24.3%) |
| Total | 134,604 (100.0%) | 210,351 (100.0%) |
Property Value to Household Income Ratio in Area Code 234
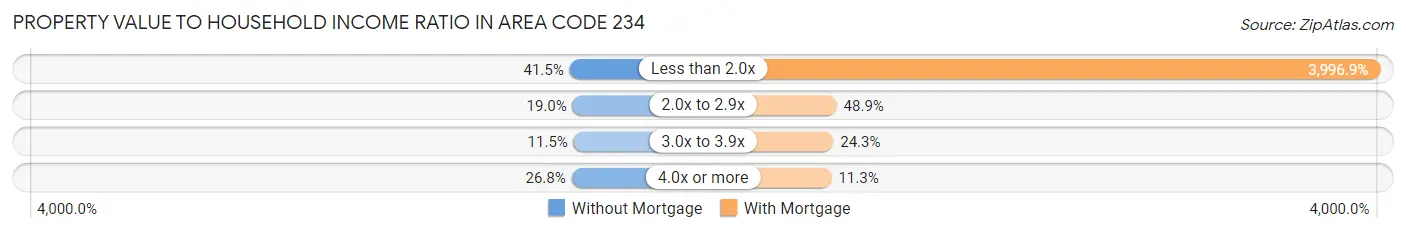
| Value-to-Income Ratio | Without Mortgage | With Mortgage |
| Less than 2.0x | 55,826 (41.5%) | 8,407,457 (3,996.9%) |
| 2.0x to 2.9x | 25,568 (19.0%) | 102,836 (48.9%) |
| 3.0x to 3.9x | 15,418 (11.5%) | 51,162 (24.3%) |
| 4.0x or more | 36,109 (26.8%) | 23,799 (11.3%) |
| Total | 134,604 (100.0%) | 210,351 (100.0%) |
Real Estate Taxes by Mortgage Status in Area Code 234
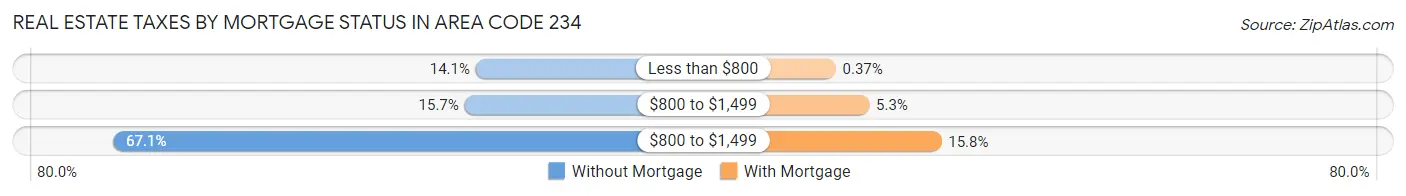
| Property Taxes | Without Mortgage | With Mortgage |
| Less than $800 | 18,942 (14.1%) | 788 (0.4%) |
| $800 to $1,499 | 21,150 (15.7%) | 11,088 (5.3%) |
| $800 to $1,499 | 90,280 (67.1%) | 33,272 (15.8%) |
| Total | 134,604 (100.0%) | 210,351 (100.0%) |
Health & Disability in Area Code 234
Health Insurance Coverage by Age in Area Code 234
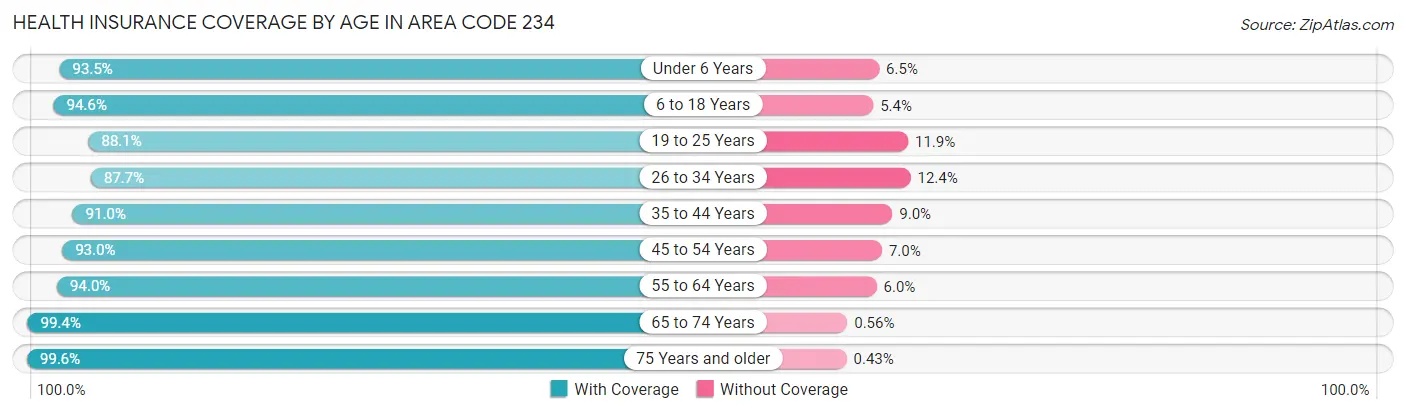
| Age Bracket | With Coverage | Without Coverage |
| Under 6 Years | 69,074 (93.5%) | 4,800 (6.5%) |
| 6 to 18 Years | 175,526 (94.6%) | 10,025 (5.4%) |
| 19 to 25 Years | 85,704 (88.1%) | 11,560 (11.9%) |
| 26 to 34 Years | 108,745 (87.6%) | 15,326 (12.3%) |
| 35 to 44 Years | 121,568 (91.0%) | 11,966 (9.0%) |
| 45 to 54 Years | 135,463 (93.0%) | 10,222 (7.0%) |
| 55 to 64 Years | 157,316 (94.0%) | 10,092 (6.0%) |
| 65 to 74 Years | 133,019 (99.4%) | 743 (0.6%) |
| 75 Years and older | 88,787 (99.6%) | 379 (0.4%) |
| Total | 1,075,202 (93.5%) | 75,113 (6.5%) |
Health Insurance Coverage by Citizenship Status in Area Code 234
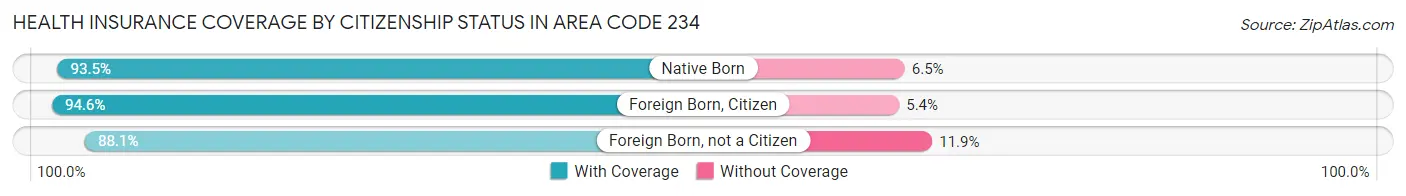
| Citizenship Status | With Coverage | Without Coverage |
| Native Born | 69,074 (93.5%) | 4,800 (6.5%) |
| Foreign Born, Citizen | 175,526 (94.6%) | 10,025 (5.4%) |
| Foreign Born, not a Citizen | 85,704 (88.1%) | 11,560 (11.9%) |
Health Insurance Coverage by Household Income in Area Code 234
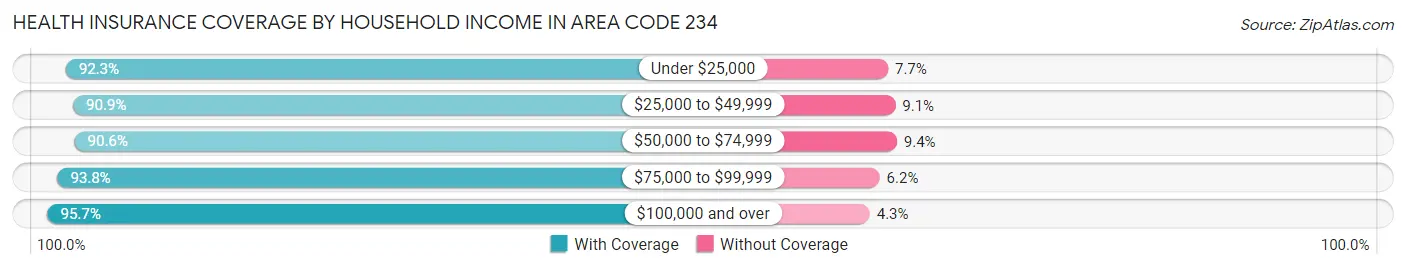
| Household Income | With Coverage | Without Coverage |
| Under $25,000 | 116,770 (92.3%) | 9,778 (7.7%) |
| $25,000 to $49,999 | 164,349 (90.9%) | 16,456 (9.1%) |
| $50,000 to $74,999 | 169,083 (90.6%) | 17,492 (9.4%) |
| $75,000 to $99,999 | 160,669 (93.8%) | 10,545 (6.2%) |
| $100,000 and over | 453,746 (95.7%) | 20,422 (4.3%) |
Public vs Private Health Insurance Coverage by Age in Area Code 234
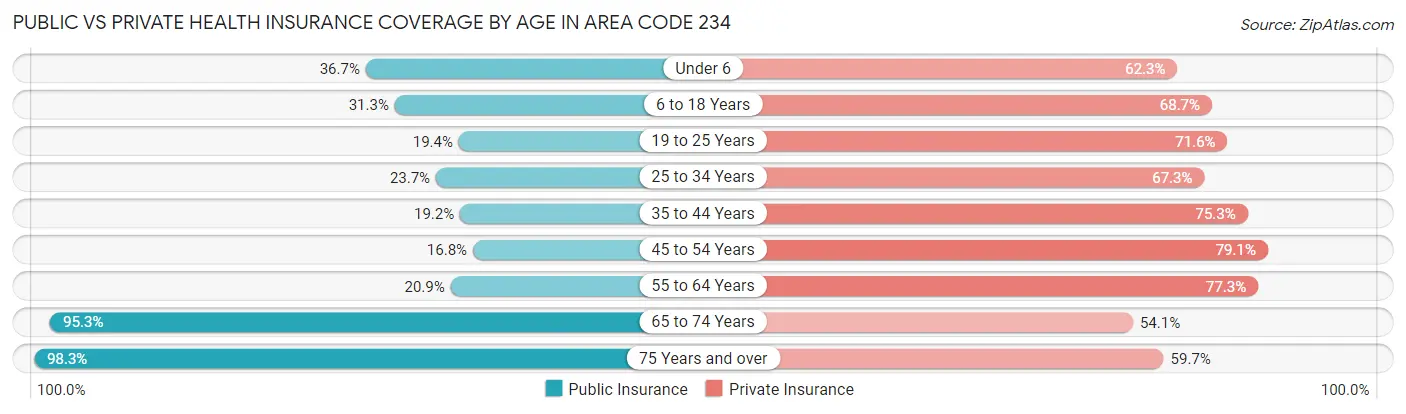
| Age Bracket | Public Insurance | Private Insurance |
| Under 6 | 27,099 (36.7%) | 46,000 (62.3%) |
| 6 to 18 Years | 58,075 (31.3%) | 127,438 (68.7%) |
| 19 to 25 Years | 18,865 (19.4%) | 69,616 (71.6%) |
| 25 to 34 Years | 29,342 (23.6%) | 83,480 (67.3%) |
| 35 to 44 Years | 25,617 (19.2%) | 100,564 (75.3%) |
| 45 to 54 Years | 24,462 (16.8%) | 115,158 (79.0%) |
| 55 to 64 Years | 35,057 (20.9%) | 129,335 (77.3%) |
| 65 to 74 Years | 127,423 (95.3%) | 72,300 (54.0%) |
| 75 Years and over | 87,616 (98.3%) | 53,268 (59.7%) |
| Total | 433,556 (37.7%) | 797,159 (69.3%) |
Disability Status by Sex by Age in Area Code 234
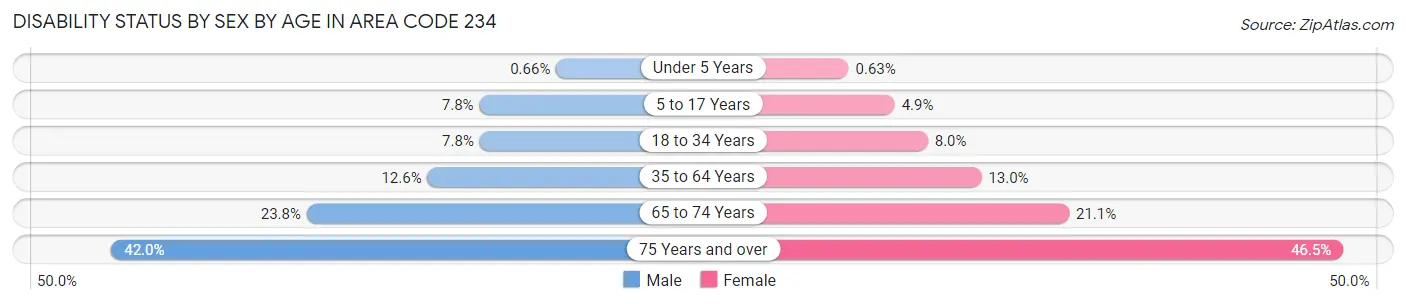
| Age Bracket | Male | Female |
| Under 5 Years | 203 (0.7%) | 190 (0.6%) |
| 5 to 17 Years | 7,494 (7.8%) | 4,249 (4.9%) |
| 18 to 34 Years | 9,369 (7.8%) | 9,293 (8.0%) |
| 35 to 64 Years | 27,940 (12.6%) | 29,177 (13.0%) |
| 65 to 74 Years | 15,132 (23.8%) | 14,808 (21.1%) |
| 75 Years and over | 15,534 (41.9%) | 24,258 (46.5%) |
Disability Class by Sex by Age in Area Code 234
Disability Class: Hearing Difficulty
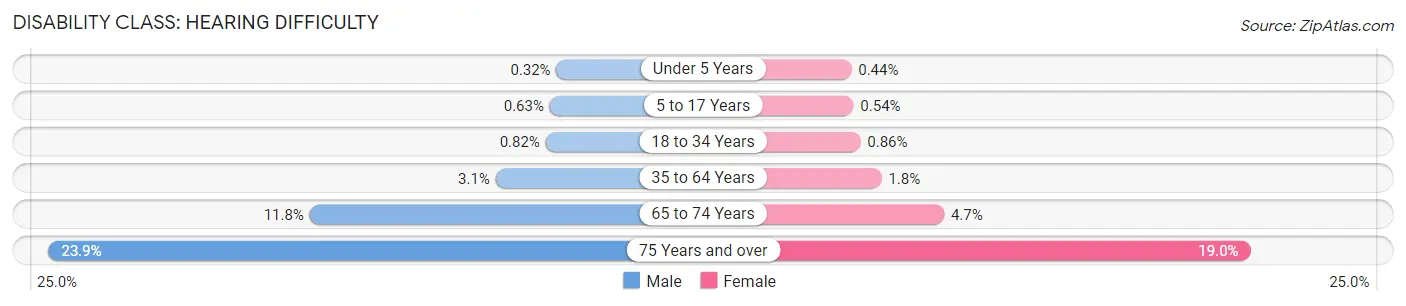
| Age Bracket | Male | Female |
| Under 5 Years | 98 (0.3%) | 132 (0.4%) |
| 5 to 17 Years | 602 (0.6%) | 469 (0.5%) |
| 18 to 34 Years | 995 (0.8%) | 1,005 (0.9%) |
| 35 to 64 Years | 6,951 (3.1%) | 4,145 (1.8%) |
| 65 to 74 Years | 7,482 (11.8%) | 3,326 (4.7%) |
| 75 Years and over | 8,850 (23.9%) | 9,886 (19.0%) |
Disability Class: Vision Difficulty
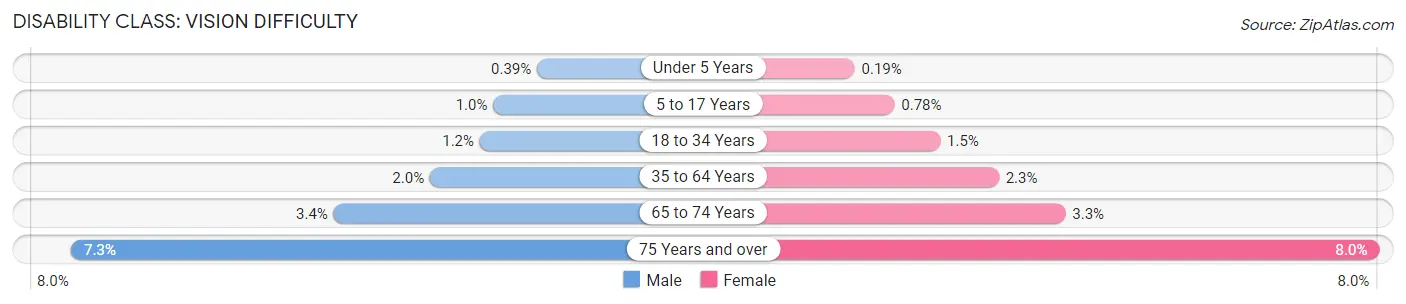
| Age Bracket | Male | Female |
| Under 5 Years | 119 (0.4%) | 58 (0.2%) |
| 5 to 17 Years | 996 (1.0%) | 675 (0.8%) |
| 18 to 34 Years | 1,498 (1.2%) | 1,703 (1.5%) |
| 35 to 64 Years | 4,387 (2.0%) | 5,243 (2.3%) |
| 65 to 74 Years | 2,166 (3.4%) | 2,331 (3.3%) |
| 75 Years and over | 2,708 (7.3%) | 4,158 (8.0%) |
Disability Class: Cognitive Difficulty
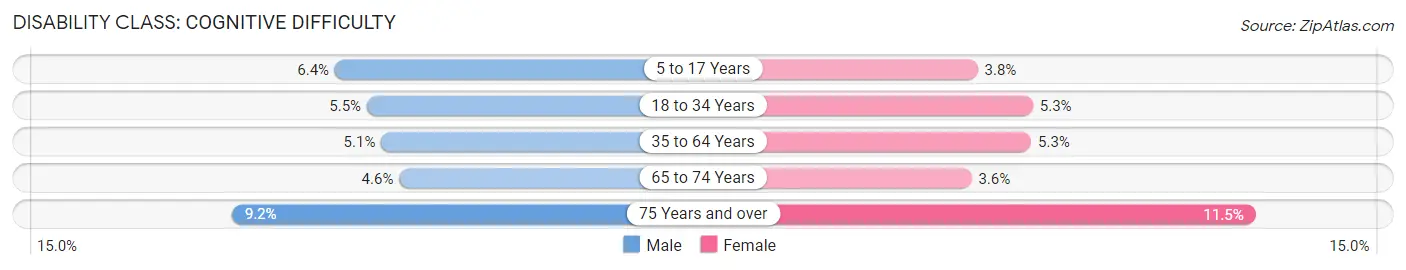
| Age Bracket | Male | Female |
| 5 to 17 Years | 6,112 (6.4%) | 3,270 (3.8%) |
| 18 to 34 Years | 6,603 (5.5%) | 6,197 (5.3%) |
| 35 to 64 Years | 11,231 (5.1%) | 11,854 (5.3%) |
| 65 to 74 Years | 2,902 (4.6%) | 2,534 (3.6%) |
| 75 Years and over | 3,419 (9.2%) | 6,007 (11.5%) |
Disability Class: Ambulatory Difficulty

| Age Bracket | Male | Female |
| 5 to 17 Years | 722 (0.7%) | 617 (0.7%) |
| 18 to 34 Years | 1,443 (1.2%) | 1,545 (1.3%) |
| 35 to 64 Years | 13,398 (6.0%) | 16,441 (7.3%) |
| 65 to 74 Years | 7,667 (12.1%) | 10,451 (14.9%) |
| 75 Years and over | 8,392 (22.7%) | 16,377 (31.4%) |
Disability Class: Self-Care Difficulty
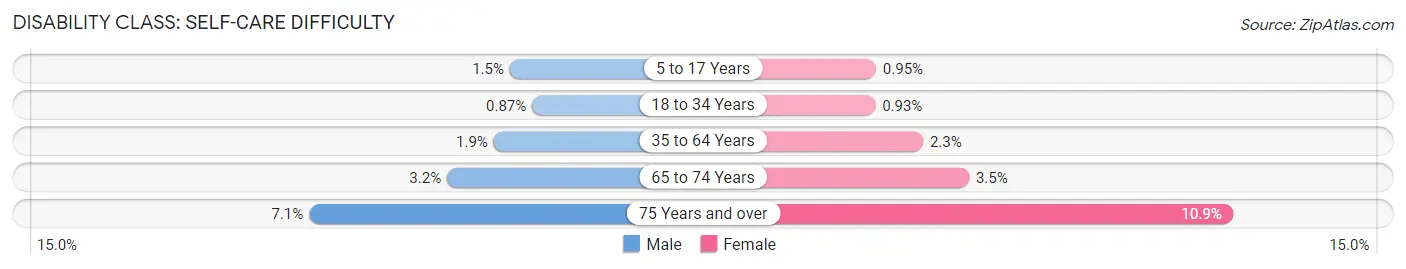
| Age Bracket | Male | Female |
| 5 to 17 Years | 1,434 (1.5%) | 821 (0.9%) |
| 18 to 34 Years | 1,045 (0.9%) | 1,080 (0.9%) |
| 35 to 64 Years | 4,294 (1.9%) | 5,097 (2.3%) |
| 65 to 74 Years | 2,058 (3.2%) | 2,488 (3.5%) |
| 75 Years and over | 2,622 (7.1%) | 5,688 (10.9%) |
Technology Access in Area Code 234
Computing Device Access in Area Code 234
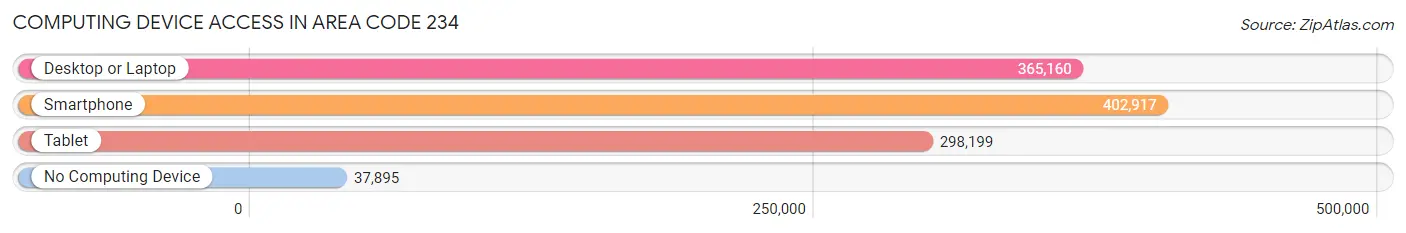
| Device Type | # Households | % Households |
| Desktop or Laptop | 365,160 | 76.7% |
| Smartphone | 402,917 | 84.6% |
| Tablet | 298,199 | 62.6% |
| No Computing Device | 37,895 | 8.0% |
| Total | 476,274 | 100.0% |
Internet Access in Area Code 234
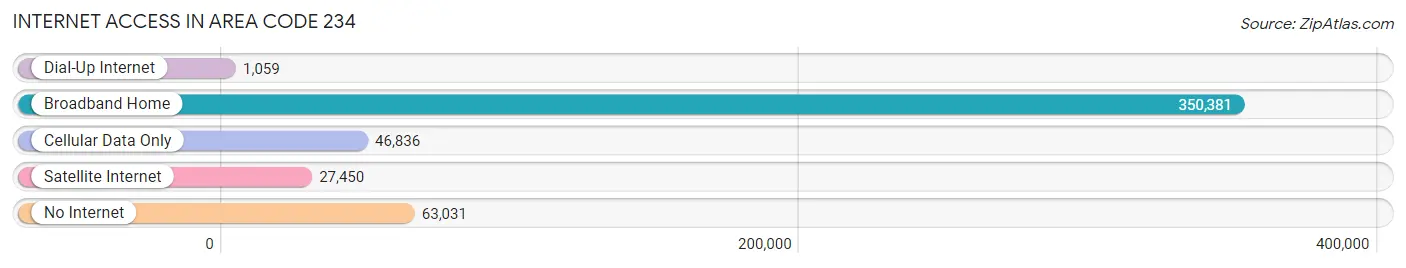
| Internet Type | # Households | % Households |
| Dial-Up Internet | 1,059 | 0.2% |
| Broadband Home | 350,381 | 73.6% |
| Cellular Data Only | 46,836 | 9.8% |
| Satellite Internet | 27,450 | 5.8% |
| No Internet | 63,031 | 13.2% |
| Total | 476,274 | 100.0% |
Area Code 234 Summary
Geography
Area code 234 is an area code in the North American Numbering Plan (NANP) for the Akron, Canton, and Youngstown metropolitan areas in northeastern Ohio. It was created in 2000 as an overlay to area code 330.
Social
Area code 234 is a source of pride for many Ohioans, as it is the only area code in the state that is not shared with any other state. This has created a sense of unity among the people of the region, as they are the only ones who can claim the area code as their own.
Economics
The area code 234 region is home to a number of large companies, including Goodyear Tire and Rubber Company, FirstEnergy, and Diebold Nixdorf. These companies provide a significant amount of employment and economic activity to the region.
Demographics
The area code 234 region is home to a diverse population, with a mix of urban and rural areas. The population is largely white, with a significant African American population. The median household income is slightly below the national average, and the poverty rate is slightly above the national average.
Common Questions
What is Per Capita Income in Area Code 234?
Per Capita income in Area Code 234 is $33,837.
What is the Median Family Income in Area Code 234?
Median Family Income in Area Code 234 is $82,616.
What is the Median Household income in Area Code 234?
Median Household Income in Area Code 234 is $67,095.
What is Income or Wage Gap in Area Code 234?
Income or Wage Gap in Area Code 234 is 33.0%.
Women in Area Code 234 earn 67.0 cents for every dollar earned by a man.
What is Family Income Deficit in Area Code 234?
Family Income Deficit in Area Code 234 is $10,745.
Families that are below poverty line in Area Code 234 earn $10,745 less on average than the poverty threshold level.
What is Inequality or Gini Index in Area Code 234?
Inequality or Gini Index in Area Code 234 is 44.95.
What is the Total Population of Area Code 234?
Total Population of Area Code 234 is 1,167,004.
What is the Total Male Population of Area Code 234?
Total Male Population of Area Code 234 is 578,504.
What is the Total Female Population of Area Code 234?
Total Female Population of Area Code 234 is 588,500.
What is the Ratio of Males per 100 Females in Area Code 234?
There are 98.30 Males per 100 Females in Area Code 234.
What is the Ratio of Females per 100 Males in Area Code 234?
There are 101.73 Females per 100 Males in Area Code 234.
What is the Median Population Age in Area Code 234?
Median Population Age in Area Code 234 is 43.1 Years.
What is the Average Family Size in Area Code 234
Average Family Size in Area Code 234 is 3.0 People.
What is the Average Household Size in Area Code 234
Average Household Size in Area Code 234 is 2.4 People.
How Large is the Labor Force in Area Code 234?
There are 581,440 People in the Labor Forcein in Area Code 234.
What is the Percentage of People in the Labor Force in Area Code 234?
61.0% of People are in the Labor Force in Area Code 234.
What is the Unemployment Rate in Area Code 234?
Unemployment Rate in Area Code 234 is 5.7%.