Van Wert County, OH Map & Demographics
Van Wert County Map
Van Wert County Overview
$31,831
PER CAPITA INCOME
$78,597
AVG FAMILY INCOME
$64,841
AVG HOUSEHOLD INCOME
30.3%
WAGE / INCOME GAP [ % ]
69.7¢/ $1
WAGE / INCOME GAP [ $ ]
$10,478
FAMILY INCOME DEFICIT
0.37
INEQUALITY / GINI INDEX
28,833
TOTAL POPULATION
14,236
MALE POPULATION
14,597
FEMALE POPULATION
97.53
MALES / 100 FEMALES
102.54
FEMALES / 100 MALES
41.3
MEDIAN AGE
2.9
AVG FAMILY SIZE
2.4
AVG HOUSEHOLD SIZE
14,826
LABOR FORCE [ PEOPLE ]
64.2%
PERCENT IN LABOR FORCE
3.8%
UNEMPLOYMENT RATE
Income in Van Wert County
Income Overview in Van Wert County
Per Capita Income in Van Wert County is $31,831, while median incomes of families and households are $78,597 and $64,841 respectively.
| Characteristic | Number | Measure |
| Per Capita Income | 28,833 | $31,831 |
| Median Family Income | 8,021 | $78,597 |
| Mean Family Income | 8,021 | $88,070 |
| Median Household Income | 11,666 | $64,841 |
| Mean Household Income | 11,666 | $76,259 |
| Income Deficit | 8,021 | $10,478 |
| Wage / Income Gap (%) | 28,833 | 30.35% |
| Wage / Income Gap ($) | 28,833 | 69.65¢ per $1 |
| Gini / Inequality Index | 28,833 | 0.37 |
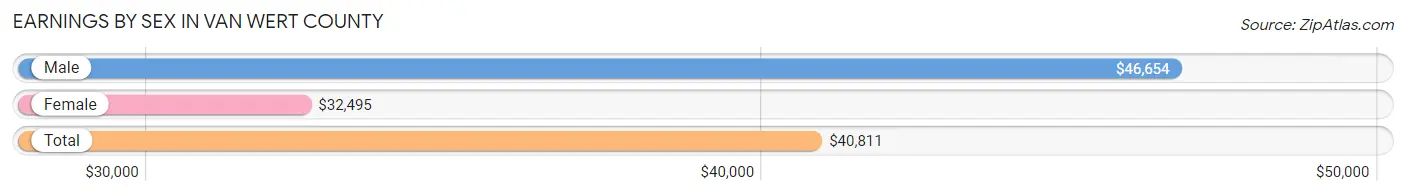
Earnings by Sex in Van Wert County
Average Earnings in Van Wert County are $40,811, $46,654 for men and $32,495 for women, a difference of 30.3%.
| Sex | Number | Average Earnings |
| Male | 8,049 (52.0%) | $46,654 |
| Female | 7,425 (48.0%) | $32,495 |
| Total | 15,474 (100.0%) | $40,811 |
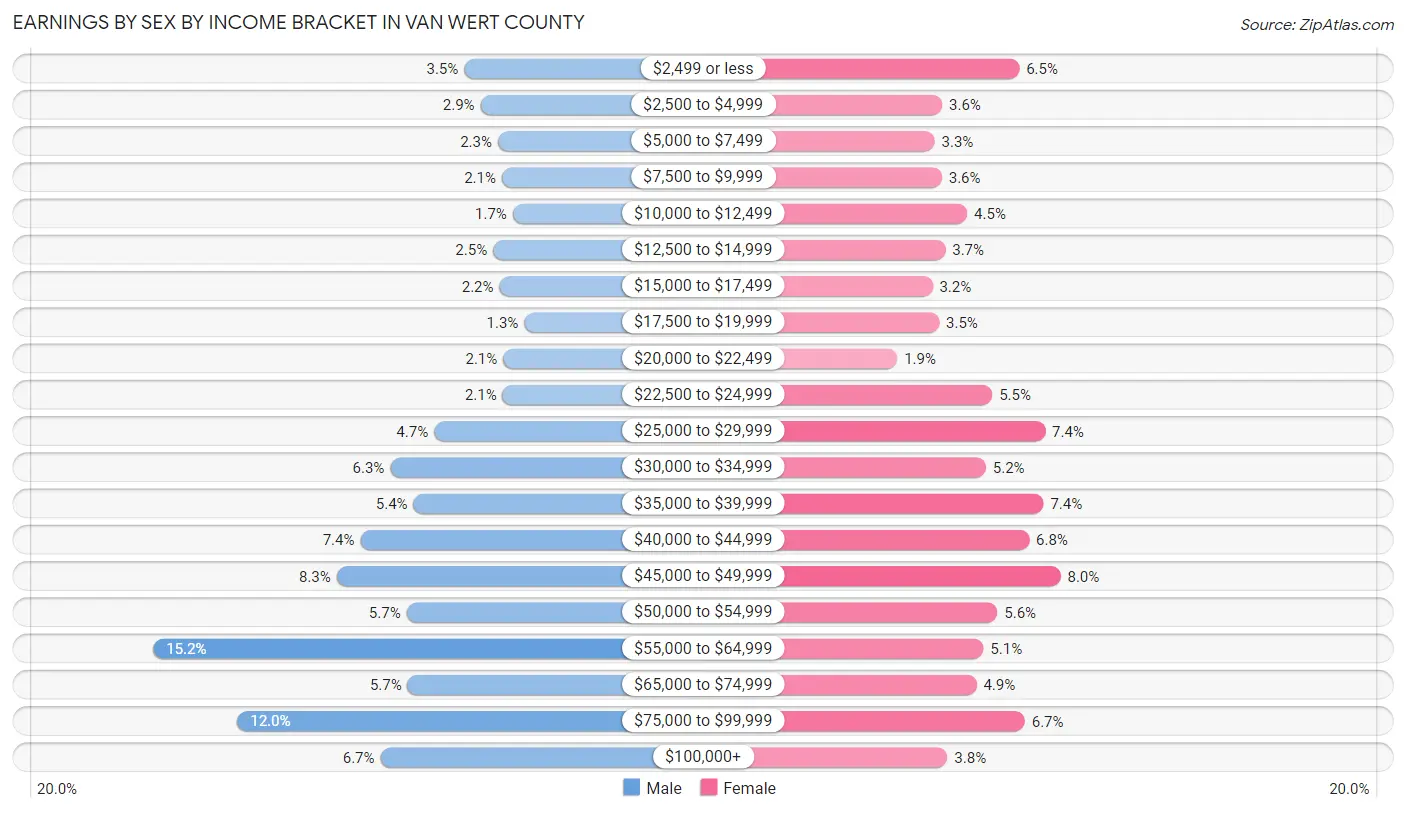
Earnings by Sex by Income Bracket in Van Wert County
The most common earnings brackets in Van Wert County are $55,000 to $64,999 for men (1,222 | 15.2%) and $45,000 to $49,999 for women (595 | 8.0%).
| Income | Male | Female |
| $2,499 or less | 284 (3.5%) | 480 (6.5%) |
| $2,500 to $4,999 | 235 (2.9%) | 265 (3.6%) |
| $5,000 to $7,499 | 183 (2.3%) | 244 (3.3%) |
| $7,500 to $9,999 | 171 (2.1%) | 264 (3.6%) |
| $10,000 to $12,499 | 138 (1.7%) | 335 (4.5%) |
| $12,500 to $14,999 | 197 (2.5%) | 274 (3.7%) |
| $15,000 to $17,499 | 178 (2.2%) | 238 (3.2%) |
| $17,500 to $19,999 | 103 (1.3%) | 257 (3.5%) |
| $20,000 to $22,499 | 167 (2.1%) | 140 (1.9%) |
| $22,500 to $24,999 | 168 (2.1%) | 405 (5.4%) |
| $25,000 to $29,999 | 375 (4.7%) | 552 (7.4%) |
| $30,000 to $34,999 | 507 (6.3%) | 387 (5.2%) |
| $35,000 to $39,999 | 437 (5.4%) | 547 (7.4%) |
| $40,000 to $44,999 | 597 (7.4%) | 507 (6.8%) |
| $45,000 to $49,999 | 669 (8.3%) | 595 (8.0%) |
| $50,000 to $54,999 | 458 (5.7%) | 419 (5.6%) |
| $55,000 to $64,999 | 1,222 (15.2%) | 380 (5.1%) |
| $65,000 to $74,999 | 455 (5.7%) | 361 (4.9%) |
| $75,000 to $99,999 | 968 (12.0%) | 495 (6.7%) |
| $100,000+ | 537 (6.7%) | 280 (3.8%) |
| Total | 8,049 (100.0%) | 7,425 (100.0%) |
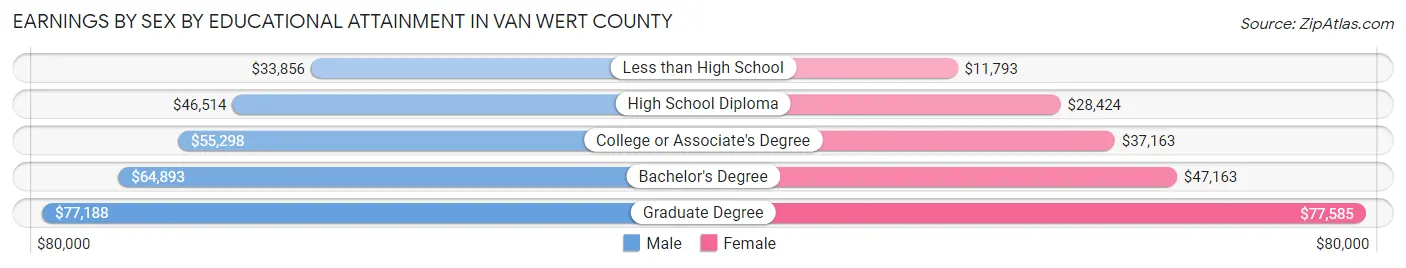
Earnings by Sex by Educational Attainment in Van Wert County
Average earnings in Van Wert County are $51,457 for men and $37,320 for women, a difference of 27.5%. Men with an educational attainment of graduate degree enjoy the highest average annual earnings of $77,188, while those with less than high school education earn the least with $33,856. Women with an educational attainment of graduate degree earn the most with the average annual earnings of $77,585, while those with less than high school education have the smallest earnings of $11,793.
| Educational Attainment | Male Income | Female Income |
| Less than High School | $33,856 | $11,793 |
| High School Diploma | $46,514 | $28,424 |
| College or Associate's Degree | $55,298 | $37,163 |
| Bachelor's Degree | $64,893 | $47,163 |
| Graduate Degree | $77,188 | $77,585 |
| Total | $51,457 | $37,320 |
Family Income in Van Wert County
Family Income Brackets in Van Wert County
According to the Van Wert County family income data, there are 1,837 families falling into the $100,000 to $149,999 income range, which is the most common income bracket and makes up 22.9% of all families. Conversely, the $10,000 to $14,999 income bracket is the least frequent group with only 88 families (1.1%) belonging to this category.
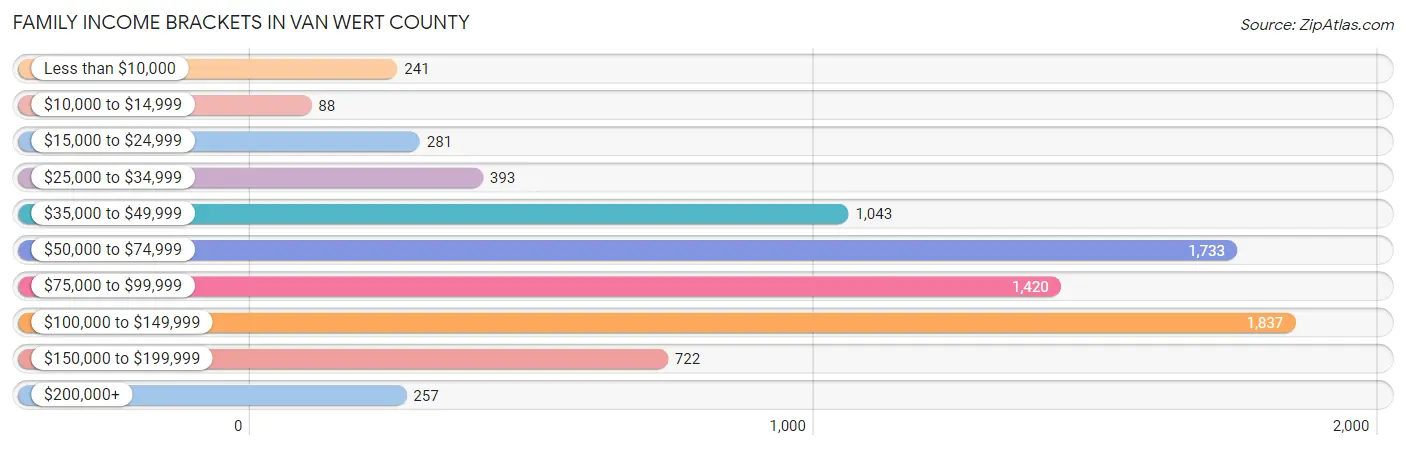
| Income Bracket | # Families | % Families |
| Less than $10,000 | 241 | 3.0% |
| $10,000 to $14,999 | 88 | 1.1% |
| $15,000 to $24,999 | 281 | 3.5% |
| $25,000 to $34,999 | 393 | 4.9% |
| $35,000 to $49,999 | 1,043 | 13.0% |
| $50,000 to $74,999 | 1,733 | 21.6% |
| $75,000 to $99,999 | 1,420 | 17.7% |
| $100,000 to $149,999 | 1,837 | 22.9% |
| $150,000 to $199,999 | 722 | 9.0% |
| $200,000+ | 257 | 3.2% |
Family Income by Famaliy Size in Van Wert County
6-person families (207 | 2.6%) account for the highest median family income in Van Wert County with $114,250 per family, while 2-person families (4,362 | 54.4%) have the highest median income of $35,022 per family member.
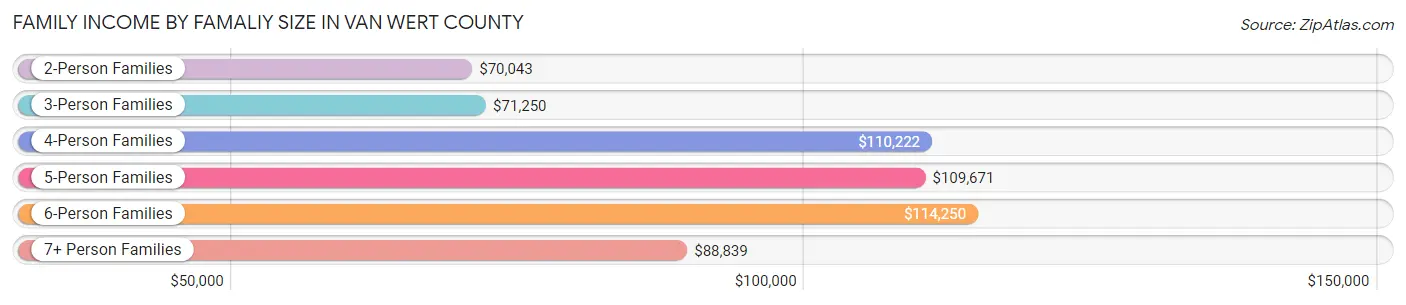
| Income Bracket | # Families | Median Income |
| 2-Person Families | 4,362 (54.4%) | $70,043 |
| 3-Person Families | 1,522 (19.0%) | $71,250 |
| 4-Person Families | 1,306 (16.3%) | $110,222 |
| 5-Person Families | 569 (7.1%) | $109,671 |
| 6-Person Families | 207 (2.6%) | $114,250 |
| 7+ Person Families | 55 (0.7%) | $88,839 |
| Total | 8,021 (100.0%) | $78,597 |
Family Income by Number of Earners in Van Wert County
The median family income in Van Wert County is $78,597, with families comprising 3+ earners (795) having the highest median family income of $127,969, while families with no earners (1,281) have the lowest median family income of $51,250, accounting for 9.9% and 16.0% of families, respectively.
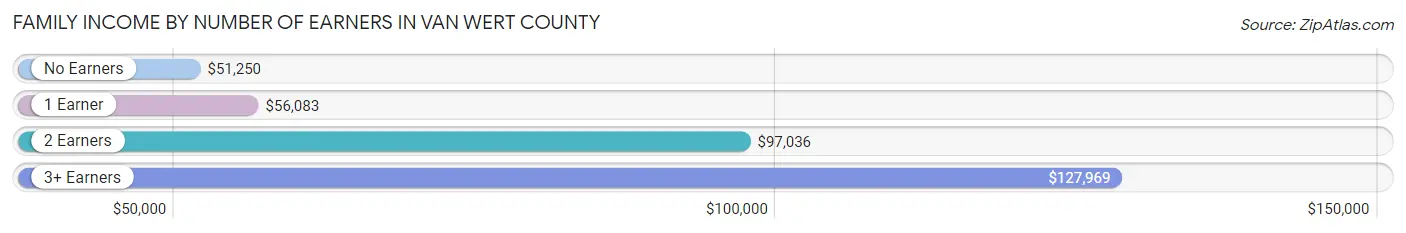
| Number of Earners | # Families | Median Income |
| No Earners | 1,281 (16.0%) | $51,250 |
| 1 Earner | 2,494 (31.1%) | $56,083 |
| 2 Earners | 3,451 (43.0%) | $97,036 |
| 3+ Earners | 795 (9.9%) | $127,969 |
| Total | 8,021 (100.0%) | $78,597 |
Household Income in Van Wert County
Household Income Brackets in Van Wert County
With 2,450 households falling in the category, the $50,000 to $74,999 income range is the most frequent in Van Wert County, accounting for 21.0% of all households. In contrast, only 303 households (2.6%) fall into the $200,000+ income bracket, making it the least populous group.
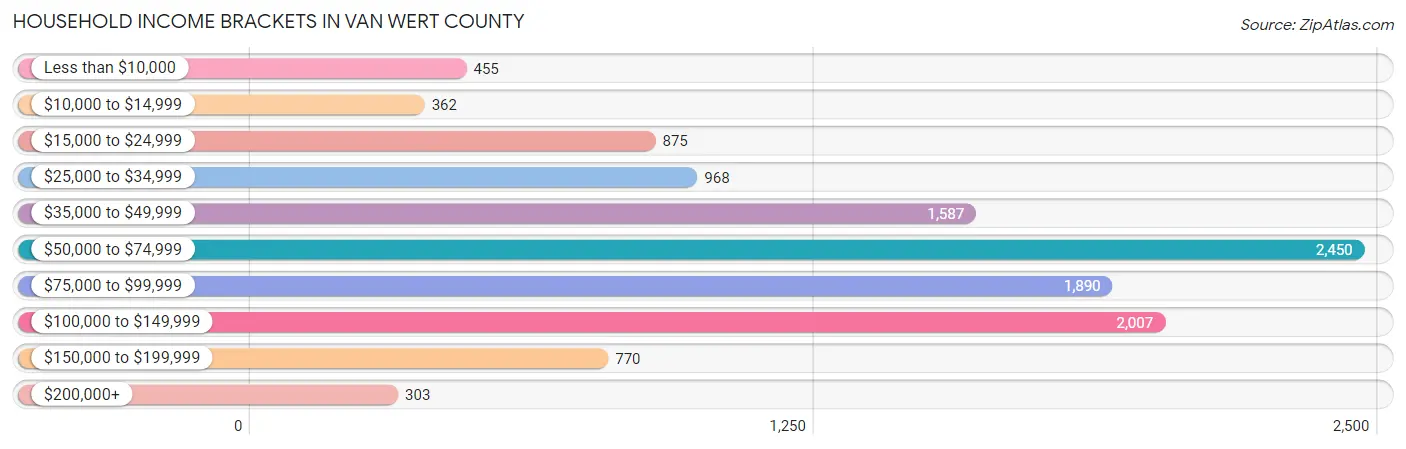
| Income Bracket | # Households | % Households |
| Less than $10,000 | 455 | 3.9% |
| $10,000 to $14,999 | 362 | 3.1% |
| $15,000 to $24,999 | 875 | 7.5% |
| $25,000 to $34,999 | 968 | 8.3% |
| $35,000 to $49,999 | 1,587 | 13.6% |
| $50,000 to $74,999 | 2,450 | 21.0% |
| $75,000 to $99,999 | 1,890 | 16.2% |
| $100,000 to $149,999 | 2,007 | 17.2% |
| $150,000 to $199,999 | 770 | 6.6% |
| $200,000+ | 303 | 2.6% |
Household Income by Householder Age in Van Wert County
The median household income in Van Wert County is $64,841, with the highest median household income of $80,290 found in the 25 to 44 years age bracket for the primary householder. A total of 3,463 households (29.7%) fall into this category. Meanwhile, the 15 to 24 years age bracket for the primary householder has the lowest median household income of $48,167, with 374 households (3.2%) in this group.
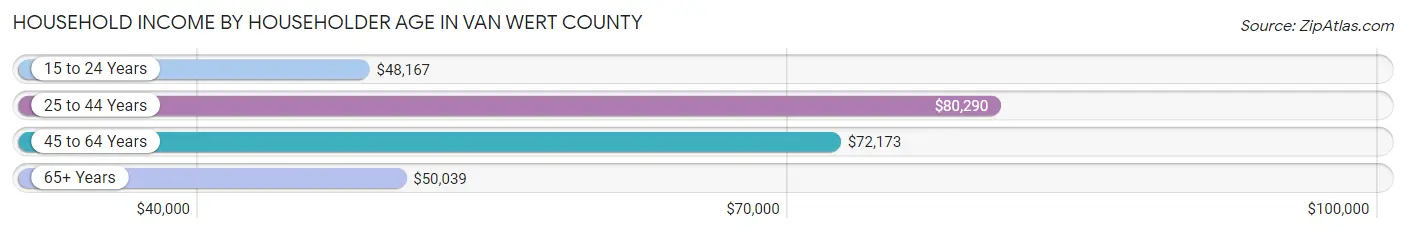
| Income Bracket | # Households | Median Income |
| 15 to 24 Years | 374 (3.2%) | $48,167 |
| 25 to 44 Years | 3,463 (29.7%) | $80,290 |
| 45 to 64 Years | 4,257 (36.5%) | $72,173 |
| 65+ Years | 3,572 (30.6%) | $50,039 |
| Total | 11,666 (100.0%) | $64,841 |
Poverty in Van Wert County
Income Below Poverty by Sex and Age in Van Wert County
With 6.8% poverty level for males and 9.9% for females among the residents of Van Wert County, 6 to 11 year old males and 25 to 34 year old females are the most vulnerable to poverty, with 155 males (15.9%) and 280 females (16.8%) in their respective age groups living below the poverty level.
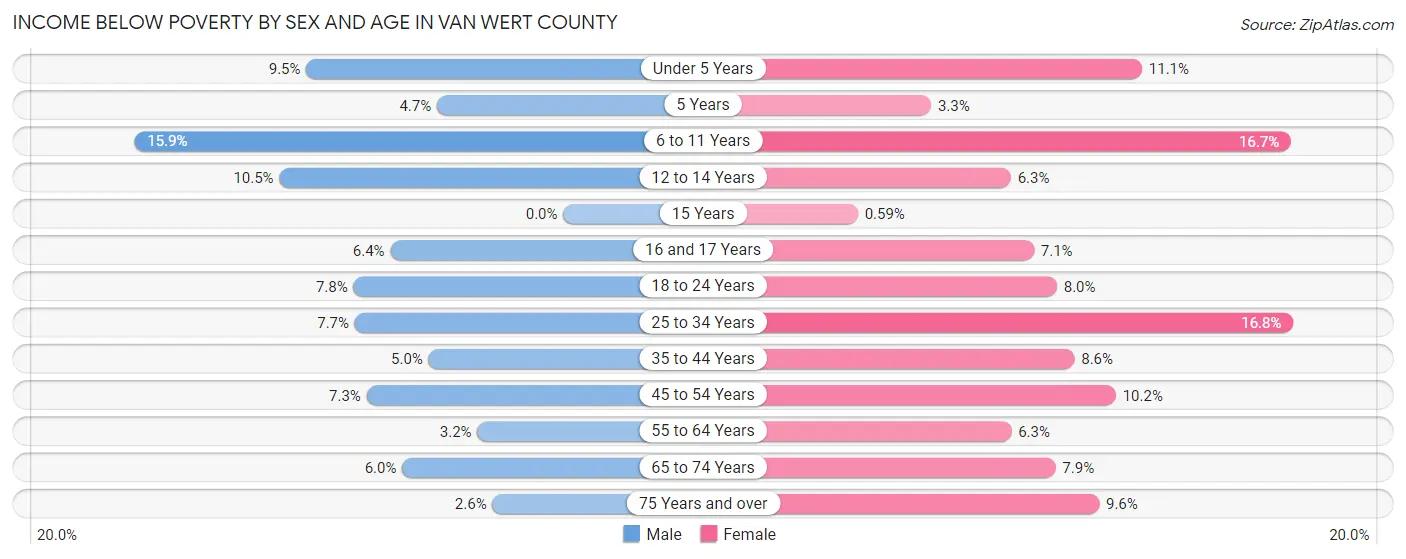
| Age Bracket | Male | Female |
| Under 5 Years | 86 (9.5%) | 99 (11.1%) |
| 5 Years | 12 (4.7%) | 4 (3.3%) |
| 6 to 11 Years | 155 (15.9%) | 183 (16.7%) |
| 12 to 14 Years | 59 (10.5%) | 32 (6.3%) |
| 15 Years | 0 (0.0%) | 1 (0.6%) |
| 16 and 17 Years | 31 (6.4%) | 33 (7.1%) |
| 18 to 24 Years | 88 (7.8%) | 89 (8.0%) |
| 25 to 34 Years | 131 (7.7%) | 280 (16.8%) |
| 35 to 44 Years | 87 (5.0%) | 144 (8.6%) |
| 45 to 54 Years | 133 (7.3%) | 176 (10.2%) |
| 55 to 64 Years | 62 (3.2%) | 130 (6.3%) |
| 65 to 74 Years | 92 (6.0%) | 128 (7.9%) |
| 75 Years and over | 24 (2.6%) | 119 (9.6%) |
| Total | 960 (6.8%) | 1,418 (9.9%) |
Income Above Poverty by Sex and Age in Van Wert County
According to the poverty statistics in Van Wert County, males aged 15 years and females aged 15 years are the age groups that are most secure financially, with 100.0% of males and 99.4% of females in these age groups living above the poverty line.
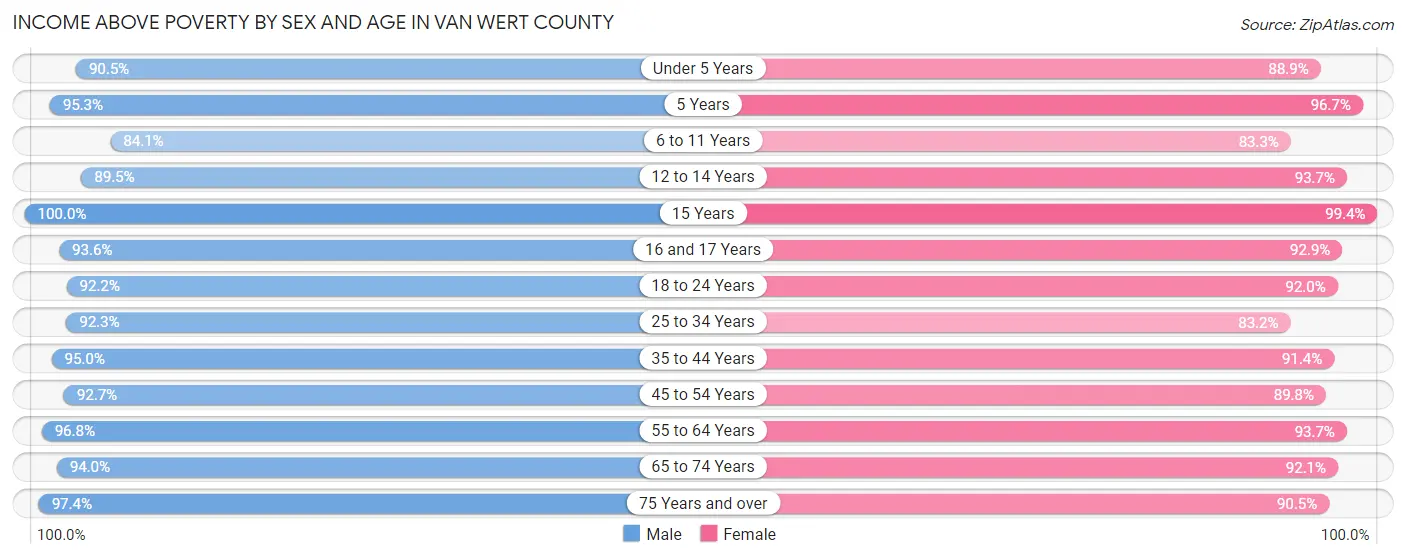
| Age Bracket | Male | Female |
| Under 5 Years | 815 (90.5%) | 790 (88.9%) |
| 5 Years | 244 (95.3%) | 117 (96.7%) |
| 6 to 11 Years | 818 (84.1%) | 914 (83.3%) |
| 12 to 14 Years | 501 (89.5%) | 478 (93.7%) |
| 15 Years | 102 (100.0%) | 168 (99.4%) |
| 16 and 17 Years | 452 (93.6%) | 430 (92.9%) |
| 18 to 24 Years | 1,041 (92.2%) | 1,026 (92.0%) |
| 25 to 34 Years | 1,561 (92.3%) | 1,391 (83.2%) |
| 35 to 44 Years | 1,653 (95.0%) | 1,525 (91.4%) |
| 45 to 54 Years | 1,688 (92.7%) | 1,555 (89.8%) |
| 55 to 64 Years | 1,881 (96.8%) | 1,937 (93.7%) |
| 65 to 74 Years | 1,446 (94.0%) | 1,487 (92.1%) |
| 75 Years and over | 889 (97.4%) | 1,127 (90.4%) |
| Total | 13,091 (93.2%) | 12,945 (90.1%) |
Income Below Poverty Among Married-Couple Families in Van Wert County
The poverty statistics for married-couple families in Van Wert County show that 1.9% or 117 of the total 6,084 families live below the poverty line. Families with 5 or more children have the highest poverty rate of 52.2%, comprising of 12 families. On the other hand, families with 1 or 2 children have the lowest poverty rate of 0.9%, which includes 15 families.
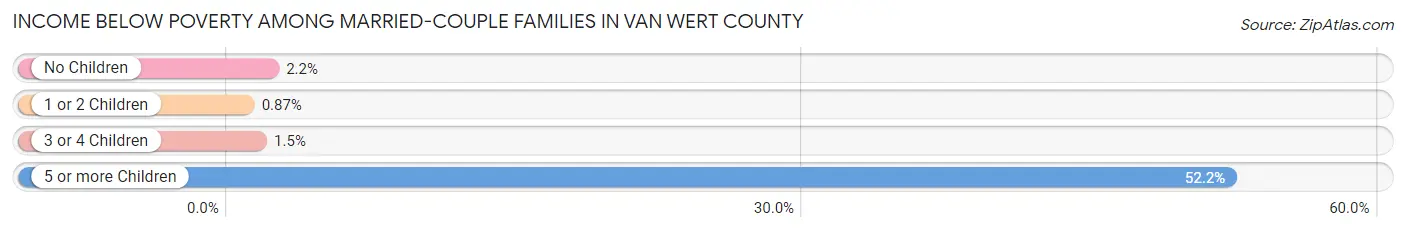
| Children | Above Poverty | Below Poverty |
| No Children | 3,725 (97.9%) | 82 (2.1%) |
| 1 or 2 Children | 1,713 (99.1%) | 15 (0.9%) |
| 3 or 4 Children | 518 (98.5%) | 8 (1.5%) |
| 5 or more Children | 11 (47.8%) | 12 (52.2%) |
| Total | 5,967 (98.1%) | 117 (1.9%) |
Income Below Poverty Among Single-Parent Households in Van Wert County
According to the poverty data in Van Wert County, 22.8% or 154 single-father households and 17.1% or 215 single-mother households are living below the poverty line. Among single-father households, those with 3 or 4 children have the highest poverty rate, with 24 households (42.1%) experiencing poverty. Likewise, among single-mother households, those with 3 or 4 children have the highest poverty rate, with 43 households (61.4%) falling below the poverty line.
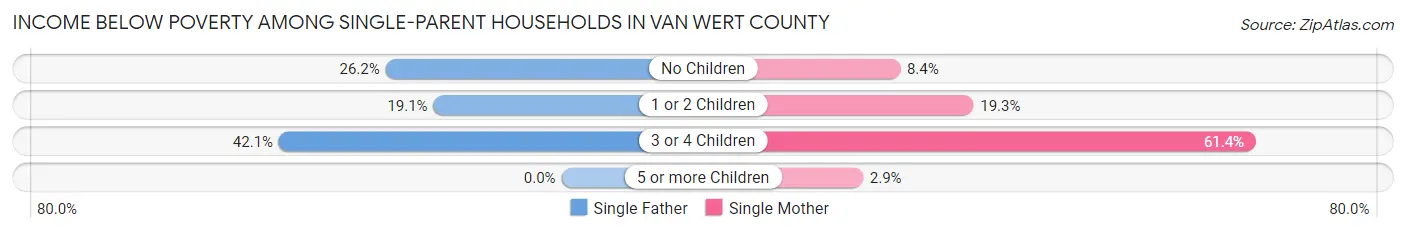
| Children | Single Father | Single Mother |
| No Children | 43 (26.2%) | 40 (8.4%) |
| 1 or 2 Children | 87 (19.1%) | 131 (19.3%) |
| 3 or 4 Children | 24 (42.1%) | 43 (61.4%) |
| 5 or more Children | 0 (0.0%) | 1 (2.9%) |
| Total | 154 (22.8%) | 215 (17.1%) |
Income Below Poverty Among Married-Couple vs Single-Parent Households in Van Wert County
The poverty data for Van Wert County shows that 117 of the married-couple family households (1.9%) and 369 of the single-parent households (19.1%) are living below the poverty level. Within the married-couple family households, those with 5 or more children have the highest poverty rate, with 12 households (52.2%) falling below the poverty line. Among the single-parent households, those with 3 or 4 children have the highest poverty rate, with 67 household (52.8%) living below poverty.
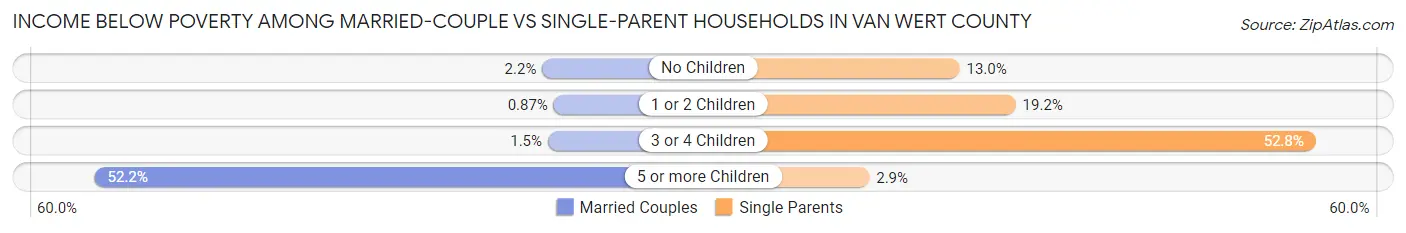
| Children | Married-Couple Families | Single-Parent Households |
| No Children | 82 (2.1%) | 83 (13.0%) |
| 1 or 2 Children | 15 (0.9%) | 218 (19.2%) |
| 3 or 4 Children | 8 (1.5%) | 67 (52.8%) |
| 5 or more Children | 12 (52.2%) | 1 (2.9%) |
| Total | 117 (1.9%) | 369 (19.1%) |
Race in Van Wert County
The most populous races in Van Wert County are White / Caucasian (27,167 | 94.2%), Hispanic or Latino (1,122 | 3.9%), and Two or more Races (1,058 | 3.7%).
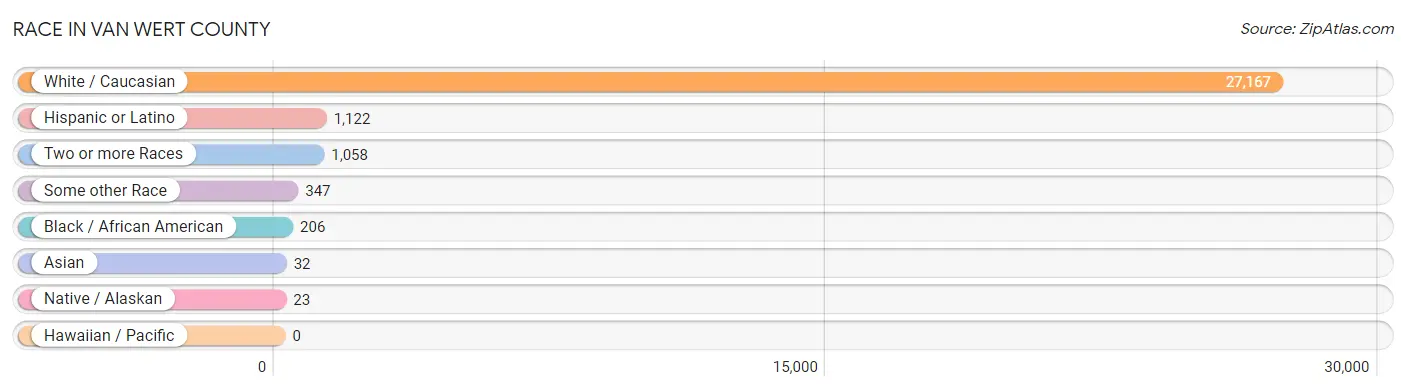
| Race | # Population | % Population |
| Asian | 32 | 0.1% |
| Black / African American | 206 | 0.7% |
| Hawaiian / Pacific | 0 | 0.0% |
| Hispanic or Latino | 1,122 | 3.9% |
| Native / Alaskan | 23 | 0.1% |
| White / Caucasian | 27,167 | 94.2% |
| Two or more Races | 1,058 | 3.7% |
| Some other Race | 347 | 1.2% |
| Total | 28,833 | 100.0% |
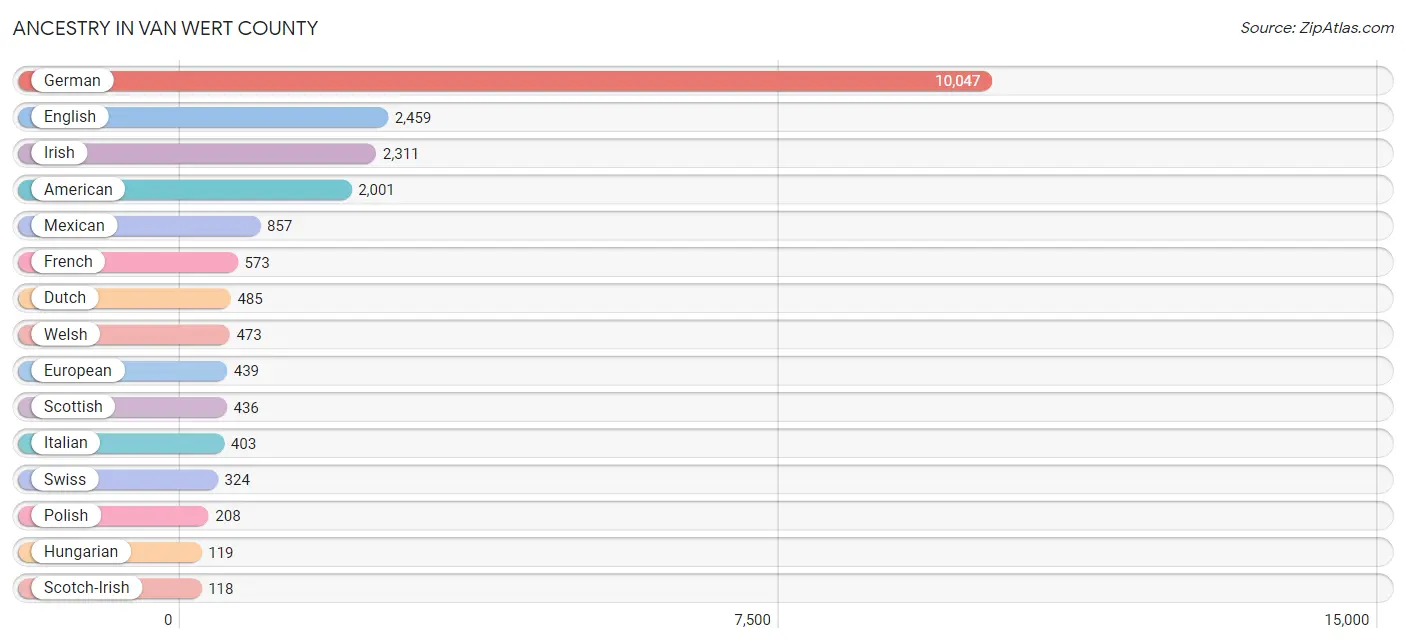
Ancestry in Van Wert County
The most populous ancestries reported in Van Wert County are German (10,047 | 34.8%), English (2,459 | 8.5%), Irish (2,311 | 8.0%), American (2,001 | 6.9%), and Mexican (857 | 3.0%), together accounting for 61.3% of all Van Wert County residents.
| Ancestry | # Population | % Population |
| African | 25 | 0.1% |
| American | 2,001 | 6.9% |
| Apache | 15 | 0.1% |
| Arab | 7 | 0.0% |
| Australian | 3 | 0.0% |
| Austrian | 56 | 0.2% |
| Barbadian | 9 | 0.0% |
| Belgian | 19 | 0.1% |
| Blackfeet | 18 | 0.1% |
| British | 65 | 0.2% |
| British West Indian | 9 | 0.0% |
| Burmese | 21 | 0.1% |
| Celtic | 4 | 0.0% |
| Central American | 18 | 0.1% |
| Cherokee | 51 | 0.2% |
| Colombian | 8 | 0.0% |
| Costa Rican | 11 | 0.0% |
| Cuban | 26 | 0.1% |
| Czech | 12 | 0.0% |
| Dutch | 485 | 1.7% |
| Eastern European | 34 | 0.1% |
| English | 2,459 | 8.5% |
| European | 439 | 1.5% |
| French | 573 | 2.0% |
| French Canadian | 27 | 0.1% |
| German | 10,047 | 34.8% |
| Ghanaian | 7 | 0.0% |
| Greek | 22 | 0.1% |
| Hungarian | 119 | 0.4% |
| Indian (Asian) | 2 | 0.0% |
| Irish | 2,311 | 8.0% |
| Iroquois | 9 | 0.0% |
| Italian | 403 | 1.4% |
| Korean | 10 | 0.0% |
| Lebanese | 7 | 0.0% |
| Lithuanian | 4 | 0.0% |
| Mexican | 857 | 3.0% |
| Norwegian | 40 | 0.1% |
| Pennsylvania German | 27 | 0.1% |
| Polish | 208 | 0.7% |
| Puerto Rican | 61 | 0.2% |
| Romanian | 8 | 0.0% |
| Russian | 61 | 0.2% |
| Salvadoran | 7 | 0.0% |
| Scandinavian | 26 | 0.1% |
| Scotch-Irish | 118 | 0.4% |
| Scottish | 436 | 1.5% |
| Seminole | 18 | 0.1% |
| Slovak | 7 | 0.0% |
| South African | 3 | 0.0% |
| South American | 59 | 0.2% |
| Spaniard | 83 | 0.3% |
| Subsaharan African | 35 | 0.1% |
| Swedish | 60 | 0.2% |
| Swiss | 324 | 1.1% |
| Thai | 4 | 0.0% |
| Venezuelan | 51 | 0.2% |
| Welsh | 473 | 1.6% |
| Yup'ik | 4 | 0.0% | View All 59 Rows |
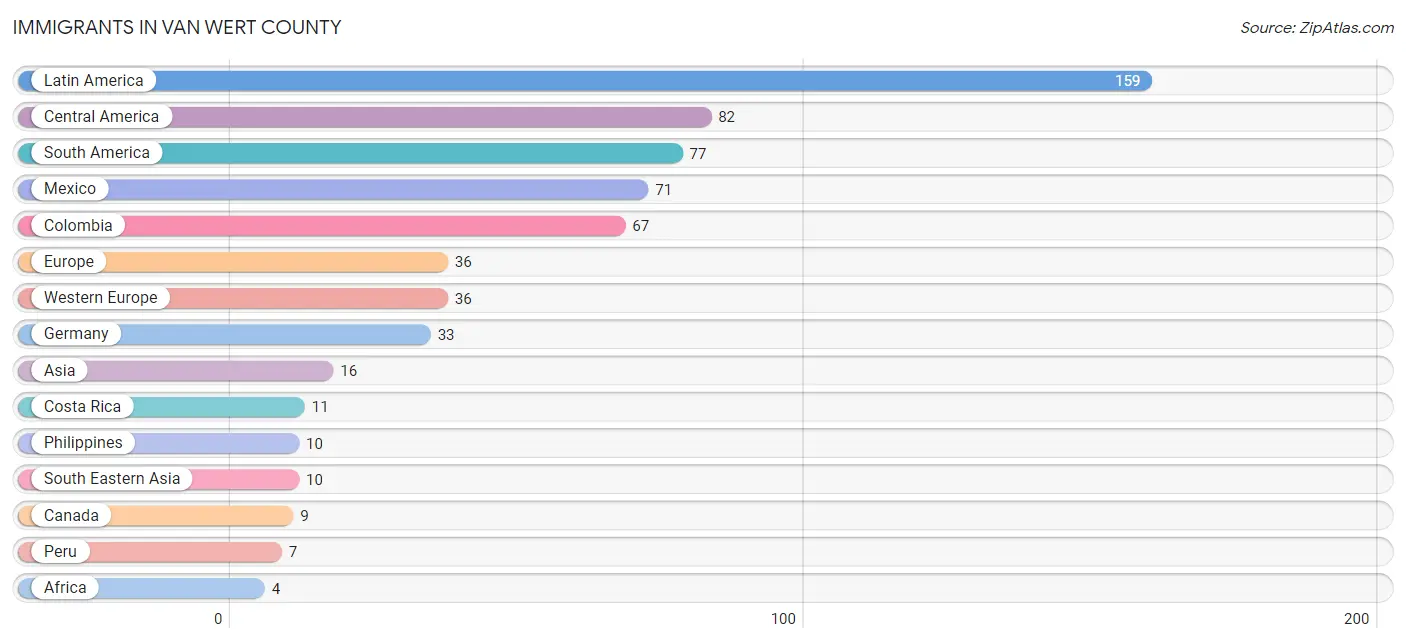
Immigrants in Van Wert County
The most numerous immigrant groups reported in Van Wert County came from Latin America (159 | 0.5%), Central America (82 | 0.3%), South America (77 | 0.3%), Mexico (71 | 0.3%), and Colombia (67 | 0.2%), together accounting for 1.6% of all Van Wert County residents.
| Immigration Origin | # Population | % Population |
| Africa | 4 | 0.0% |
| Asia | 16 | 0.1% |
| Austria | 3 | 0.0% |
| Canada | 9 | 0.0% |
| Central America | 82 | 0.3% |
| China | 2 | 0.0% |
| Colombia | 67 | 0.2% |
| Costa Rica | 11 | 0.0% |
| Eastern Asia | 2 | 0.0% |
| Europe | 36 | 0.1% |
| Germany | 33 | 0.1% |
| Ghana | 4 | 0.0% |
| India | 4 | 0.0% |
| Latin America | 159 | 0.5% |
| Mexico | 71 | 0.3% |
| Peru | 7 | 0.0% |
| Philippines | 10 | 0.0% |
| South America | 77 | 0.3% |
| South Central Asia | 4 | 0.0% |
| South Eastern Asia | 10 | 0.0% |
| Venezuela | 3 | 0.0% |
| Western Africa | 4 | 0.0% |
| Western Europe | 36 | 0.1% | View All 23 Rows |
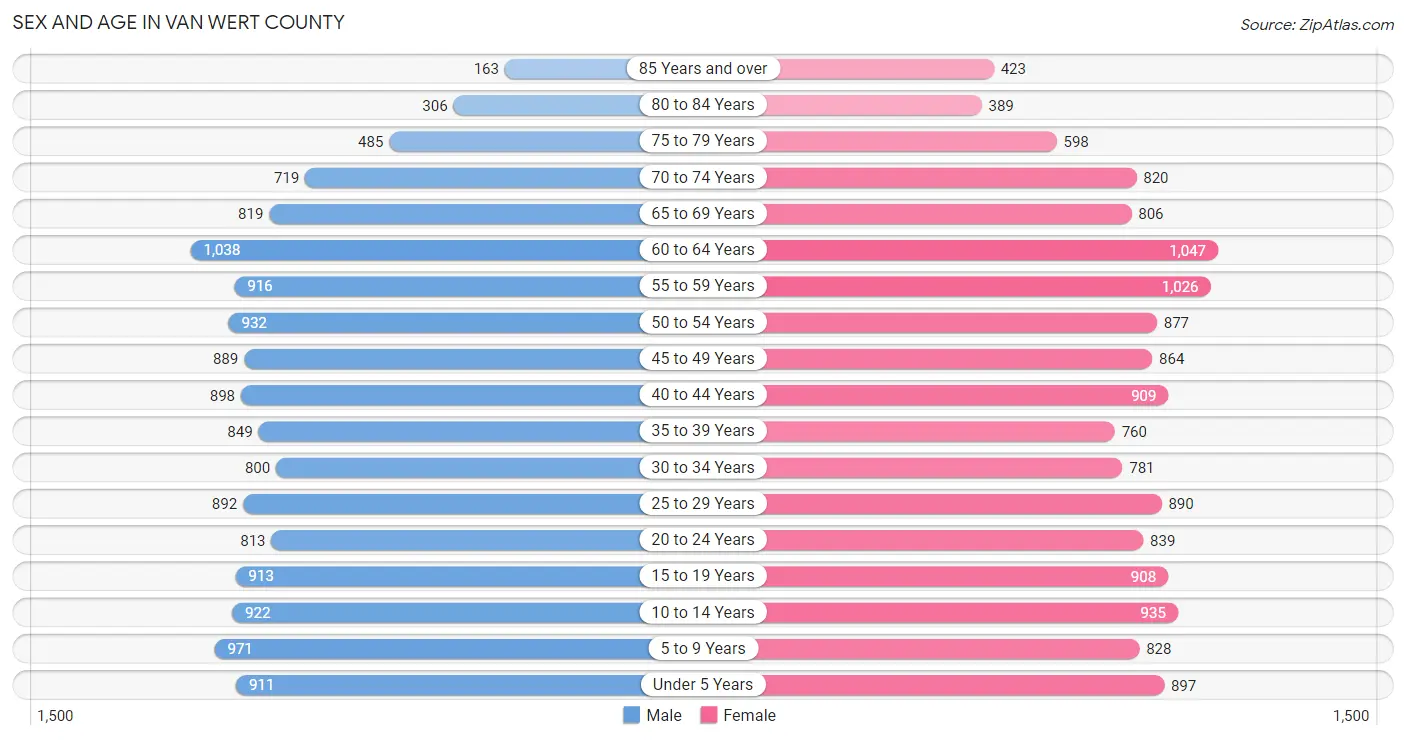
Sex and Age in Van Wert County
Sex and Age in Van Wert County
The most populous age groups in Van Wert County are 60 to 64 Years (1,038 | 7.3%) for men and 60 to 64 Years (1,047 | 7.2%) for women.
| Age Bracket | Male | Female |
| Under 5 Years | 911 (6.4%) | 897 (6.1%) |
| 5 to 9 Years | 971 (6.8%) | 828 (5.7%) |
| 10 to 14 Years | 922 (6.5%) | 935 (6.4%) |
| 15 to 19 Years | 913 (6.4%) | 908 (6.2%) |
| 20 to 24 Years | 813 (5.7%) | 839 (5.8%) |
| 25 to 29 Years | 892 (6.3%) | 890 (6.1%) |
| 30 to 34 Years | 800 (5.6%) | 781 (5.3%) |
| 35 to 39 Years | 849 (6.0%) | 760 (5.2%) |
| 40 to 44 Years | 898 (6.3%) | 909 (6.2%) |
| 45 to 49 Years | 889 (6.2%) | 864 (5.9%) |
| 50 to 54 Years | 932 (6.6%) | 877 (6.0%) |
| 55 to 59 Years | 916 (6.4%) | 1,026 (7.0%) |
| 60 to 64 Years | 1,038 (7.3%) | 1,047 (7.2%) |
| 65 to 69 Years | 819 (5.8%) | 806 (5.5%) |
| 70 to 74 Years | 719 (5.1%) | 820 (5.6%) |
| 75 to 79 Years | 485 (3.4%) | 598 (4.1%) |
| 80 to 84 Years | 306 (2.1%) | 389 (2.7%) |
| 85 Years and over | 163 (1.1%) | 423 (2.9%) |
| Total | 14,236 (100.0%) | 14,597 (100.0%) |
Families and Households in Van Wert County
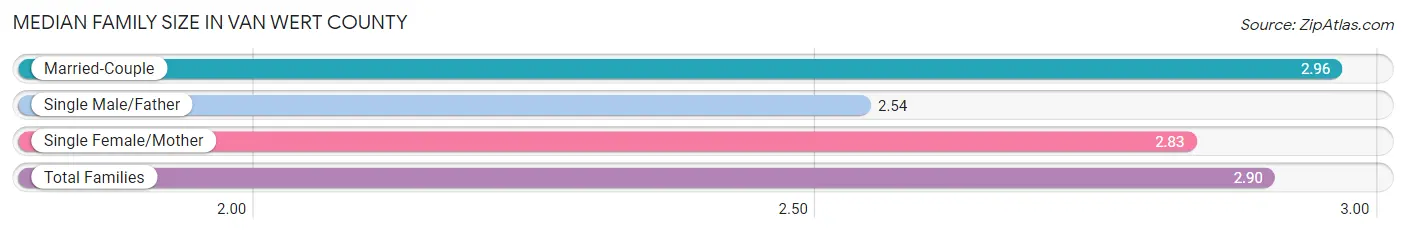
Median Family Size in Van Wert County
The median family size in Van Wert County is 2.90 persons per family, with married-couple families (6,084 | 75.8%) accounting for the largest median family size of 2.96 persons per family. On the other hand, single male/father families (677 | 8.4%) represent the smallest median family size with 2.54 persons per family.
| Family Type | # Families | Family Size |
| Married-Couple | 6,084 (75.8%) | 2.96 |
| Single Male/Father | 677 (8.4%) | 2.54 |
| Single Female/Mother | 1,260 (15.7%) | 2.83 |
| Total Families | 8,021 (100.0%) | 2.90 |
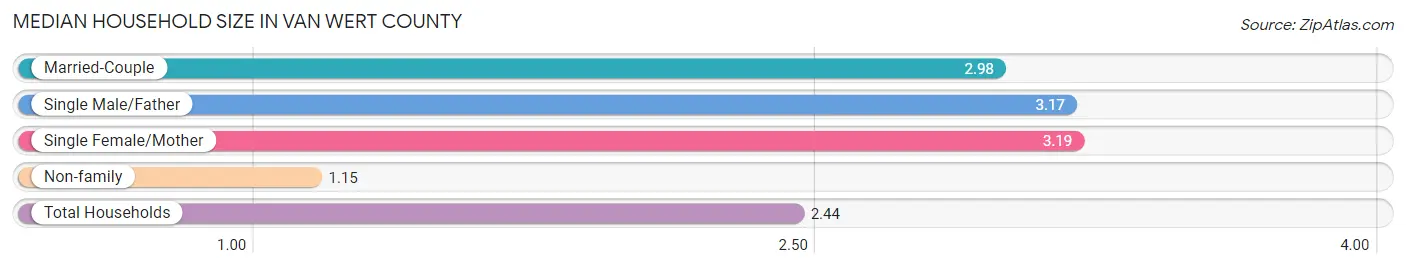
Median Household Size in Van Wert County
The median household size in Van Wert County is 2.44 persons per household, with single female/mother households (1,260 | 10.8%) accounting for the largest median household size of 3.19 persons per household. non-family households (3,645 | 31.2%) represent the smallest median household size with 1.15 persons per household.
| Household Type | # Households | Household Size |
| Married-Couple | 6,084 (52.1%) | 2.98 |
| Single Male/Father | 677 (5.8%) | 3.17 |
| Single Female/Mother | 1,260 (10.8%) | 3.19 |
| Non-family | 3,645 (31.2%) | 1.15 |
| Total Households | 11,666 (100.0%) | 2.44 |
Household Size by Marriage Status in Van Wert County
Out of a total of 11,666 households in Van Wert County, 8,021 (68.8%) are family households, while 3,645 (31.2%) are nonfamily households. The most numerous type of family households are 2-person households, comprising 3,931, and the most common type of nonfamily households are 1-person households, comprising 3,199.
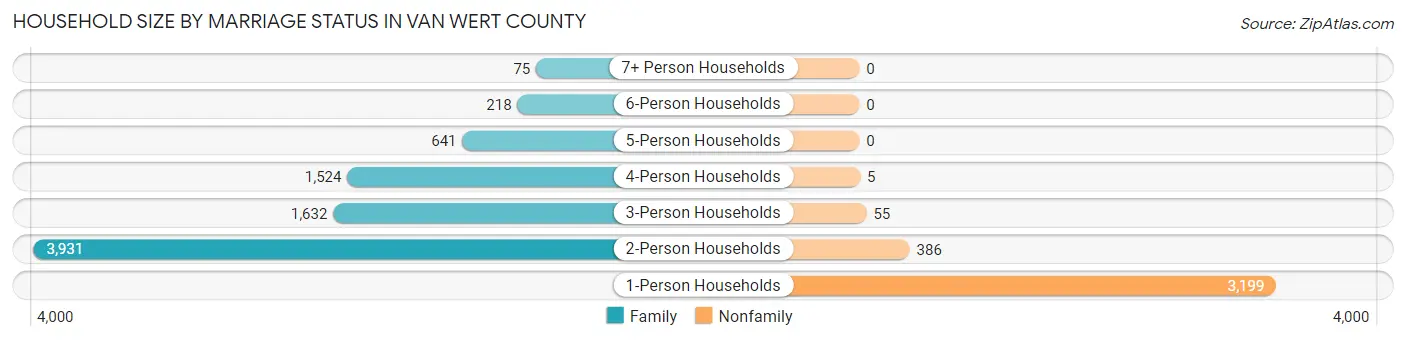
| Household Size | Family Households | Nonfamily Households |
| 1-Person Households | - | 3,199 (27.4%) |
| 2-Person Households | 3,931 (33.7%) | 386 (3.3%) |
| 3-Person Households | 1,632 (14.0%) | 55 (0.5%) |
| 4-Person Households | 1,524 (13.1%) | 5 (0.0%) |
| 5-Person Households | 641 (5.5%) | 0 (0.0%) |
| 6-Person Households | 218 (1.9%) | 0 (0.0%) |
| 7+ Person Households | 75 (0.6%) | 0 (0.0%) |
| Total | 8,021 (68.8%) | 3,645 (31.2%) |
Female Fertility in Van Wert County
Fertility by Age in Van Wert County
Average fertility rate in Van Wert County is 64.0 births per 1,000 women. Women in the age bracket of 20 to 34 years have the highest fertility rate with 130.0 births per 1,000 women. Women in the age bracket of 20 to 34 years acount for 84.9% of all women with births.
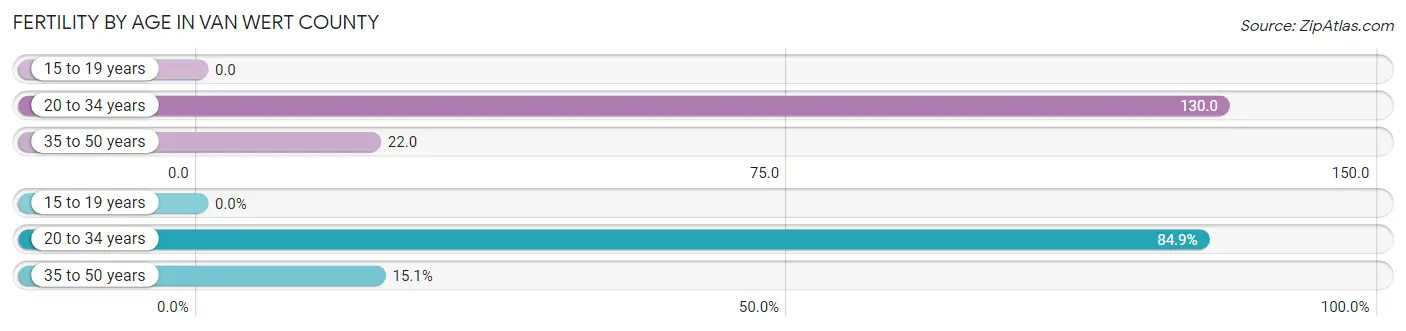
| Age Bracket | Women with Births | Births / 1,000 Women |
| 15 to 19 years | 0 (0.0%) | 0.0 |
| 20 to 34 years | 327 (84.9%) | 130.0 |
| 35 to 50 years | 58 (15.1%) | 22.0 |
| Total | 385 (100.0%) | 64.0 |
Fertility by Age by Marriage Status in Van Wert County
50.4% of women with births (385) in Van Wert County are married. The highest percentage of unmarried women with births falls into 20 to 34 years age bracket with 51.1% of them unmarried at the time of birth, while the lowest percentage of unmarried women with births belong to 35 to 50 years age bracket with 41.4% of them unmarried.
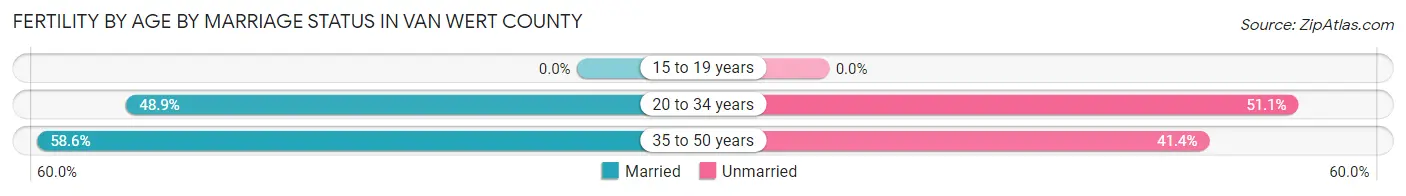
| Age Bracket | Married | Unmarried |
| 15 to 19 years | 0 (0.0%) | 0 (0.0%) |
| 20 to 34 years | 160 (48.9%) | 167 (51.1%) |
| 35 to 50 years | 34 (58.6%) | 24 (41.4%) |
| Total | 194 (50.4%) | 191 (49.6%) |
Fertility by Education in Van Wert County
Average fertility rate in Van Wert County is 64.0 births per 1,000 women. Women with the education attainment of graduate degree have the highest fertility rate of 99.0 births per 1,000 women, while women with the education attainment of less than high school have the lowest fertility at 32.0 births per 1,000 women. Women with the education attainment of college or associate's degree represent 40.8% of all women with births.
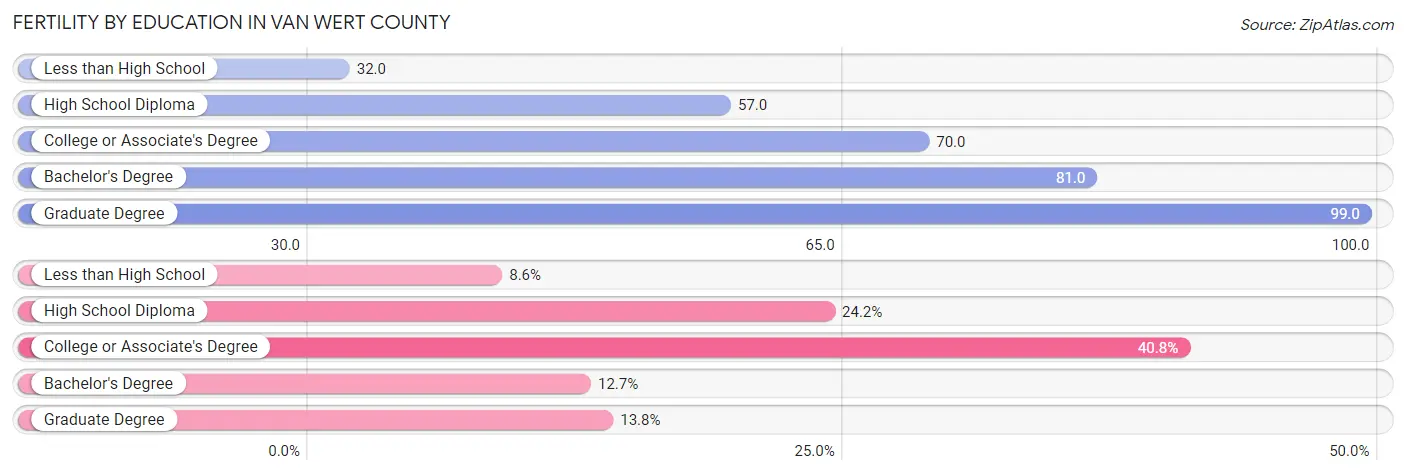
| Educational Attainment | Women with Births | Births / 1,000 Women |
| Less than High School | 33 (8.6%) | 32.0 |
| High School Diploma | 93 (24.2%) | 57.0 |
| College or Associate's Degree | 157 (40.8%) | 70.0 |
| Bachelor's Degree | 49 (12.7%) | 81.0 |
| Graduate Degree | 53 (13.8%) | 99.0 |
| Total | 385 (100.0%) | 64.0 |
Fertility by Education by Marriage Status in Van Wert County
49.6% of women with births in Van Wert County are unmarried. Women with the educational attainment of graduate degree are most likely to be married with 100.0% of them married at childbirth, while women with the educational attainment of high school diploma are least likely to be married with 86.0% of them unmarried at childbirth.
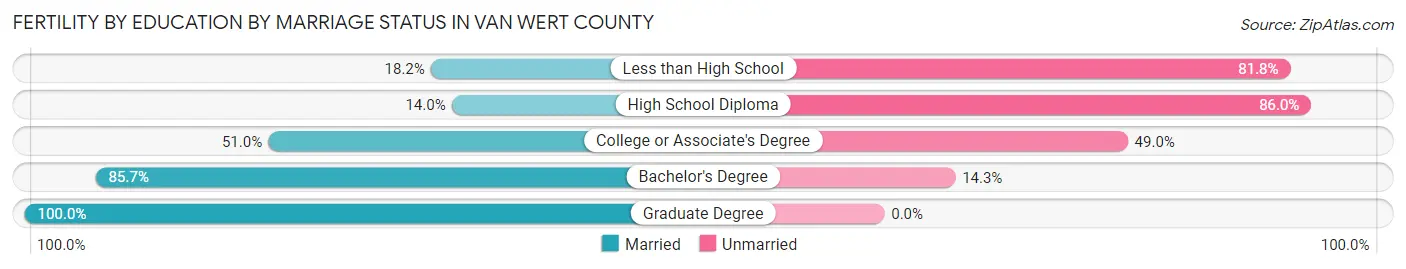
| Educational Attainment | Married | Unmarried |
| Less than High School | 6 (18.2%) | 27 (81.8%) |
| High School Diploma | 13 (14.0%) | 80 (86.0%) |
| College or Associate's Degree | 80 (51.0%) | 77 (49.0%) |
| Bachelor's Degree | 42 (85.7%) | 7 (14.3%) |
| Graduate Degree | 53 (100.0%) | 0 (0.0%) |
| Total | 194 (50.4%) | 191 (49.6%) |
Employment Characteristics in Van Wert County
Employment by Class of Employer in Van Wert County
Among the 13,971 employed individuals in Van Wert County, private company employees (10,462 | 74.9%), local government employees (1,114 | 8.0%), and not-for-profit organizations (983 | 7.0%) make up the most common classes of employment.
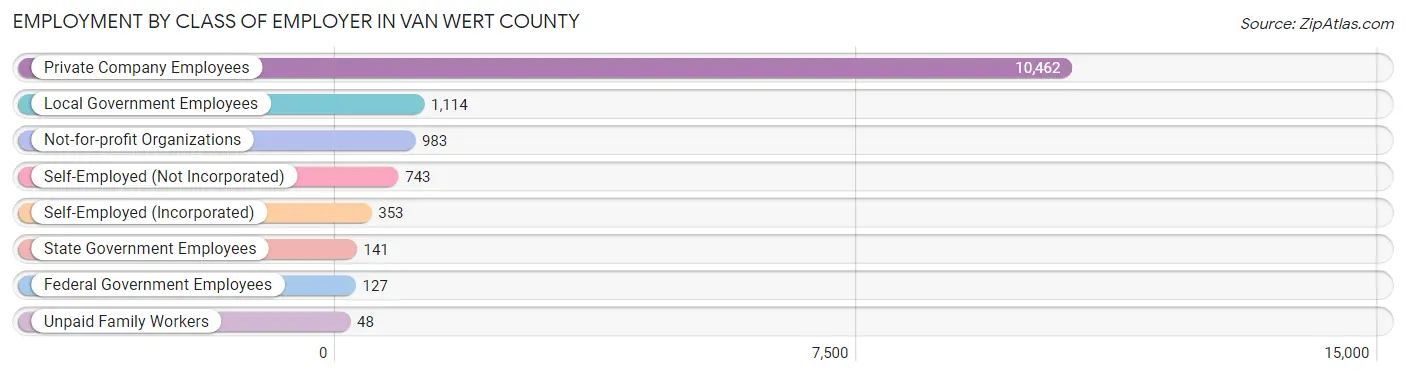
| Employer Class | # Employees | % Employees |
| Private Company Employees | 10,462 | 74.9% |
| Self-Employed (Incorporated) | 353 | 2.5% |
| Self-Employed (Not Incorporated) | 743 | 5.3% |
| Not-for-profit Organizations | 983 | 7.0% |
| Local Government Employees | 1,114 | 8.0% |
| State Government Employees | 141 | 1.0% |
| Federal Government Employees | 127 | 0.9% |
| Unpaid Family Workers | 48 | 0.3% |
| Total | 13,971 | 100.0% |
Employment Status by Age in Van Wert County
According to the labor force statistics for Van Wert County, out of the total population over 16 years of age (23,094), 64.2% or 14,826 individuals are in the labor force, with 3.8% or 563 of them unemployed. The age group with the highest labor force participation rate is 30 to 34 years, with 92.7% or 1,466 individuals in the labor force. Within the labor force, the 16 to 19 years age range has the highest percentage of unemployed individuals, with 14.2% or 121 of them being unemployed.
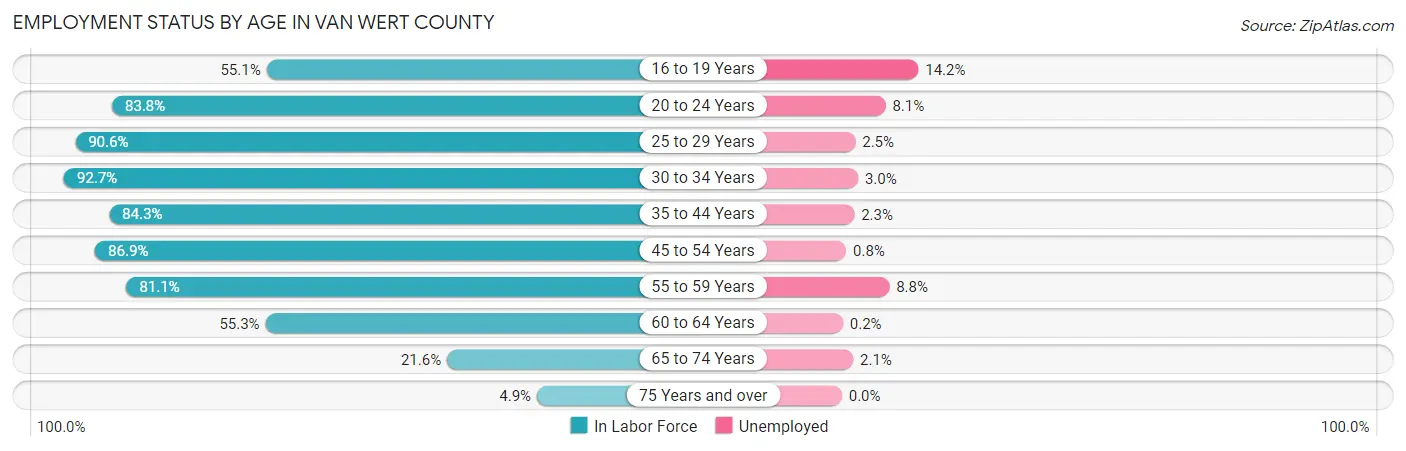
| Age Bracket | In Labor Force | Unemployed |
| 16 to 19 Years | 852 (55.1%) | 121 (14.2%) |
| 20 to 24 Years | 1,384 (83.8%) | 112 (8.1%) |
| 25 to 29 Years | 1,614 (90.6%) | 40 (2.5%) |
| 30 to 34 Years | 1,466 (92.7%) | 44 (3.0%) |
| 35 to 44 Years | 2,880 (84.3%) | 66 (2.3%) |
| 45 to 54 Years | 3,095 (86.9%) | 25 (0.8%) |
| 55 to 59 Years | 1,575 (81.1%) | 139 (8.8%) |
| 60 to 64 Years | 1,153 (55.3%) | 2 (0.2%) |
| 65 to 74 Years | 683 (21.6%) | 14 (2.1%) |
| 75 Years and over | 116 (4.9%) | 0 (0.0%) |
| Total | 14,826 (64.2%) | 563 (3.8%) |
Employment Status by Educational Attainment in Van Wert County
According to labor force statistics for Van Wert County, 82.0% of individuals (11,782) out of the total population between 25 and 64 years of age (14,368) are in the labor force, with 2.7% or 318 of them being unemployed. The group with the highest labor force participation rate are those with the educational attainment of bachelor's degree or higher, with 90.9% or 2,487 individuals in the labor force. Within the labor force, individuals with college / associate degree education have the highest percentage of unemployment, with 3.5% or 155 of them being unemployed.
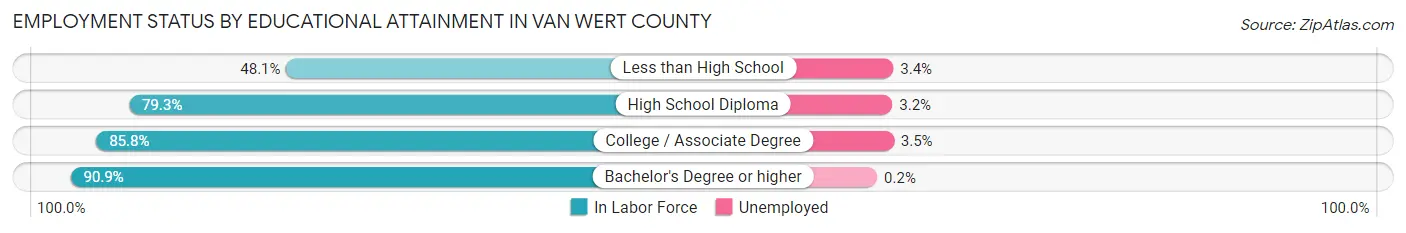
| Educational Attainment | In Labor Force | Unemployed |
| Less than High School | 412 (48.1%) | 29 (3.4%) |
| High School Diploma | 4,443 (79.3%) | 179 (3.2%) |
| College / Associate Degree | 4,438 (85.8%) | 181 (3.5%) |
| Bachelor's Degree or higher | 2,487 (90.9%) | 5 (0.2%) |
| Total | 11,782 (82.0%) | 388 (2.7%) |
Employment Occupations by Sex in Van Wert County
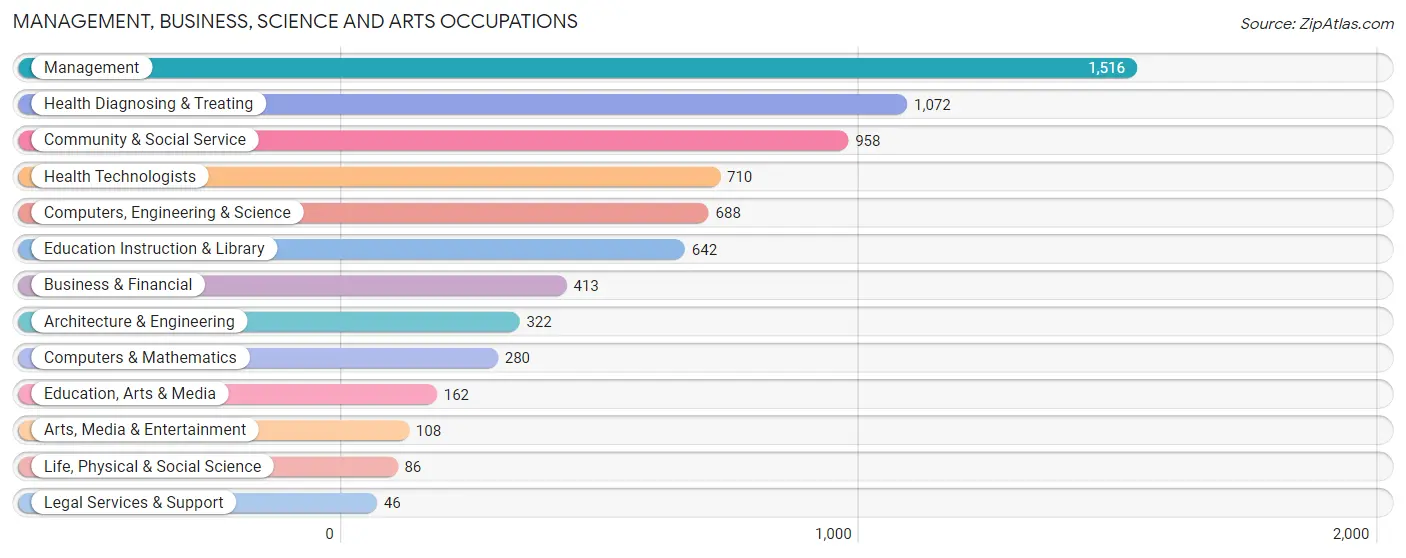
Management, Business, Science and Arts Occupations
The most common Management, Business, Science and Arts occupations in Van Wert County are Management (1,516 | 10.7%), Health Diagnosing & Treating (1,072 | 7.5%), Community & Social Service (958 | 6.7%), Health Technologists (710 | 5.0%), and Computers, Engineering & Science (688 | 4.8%).
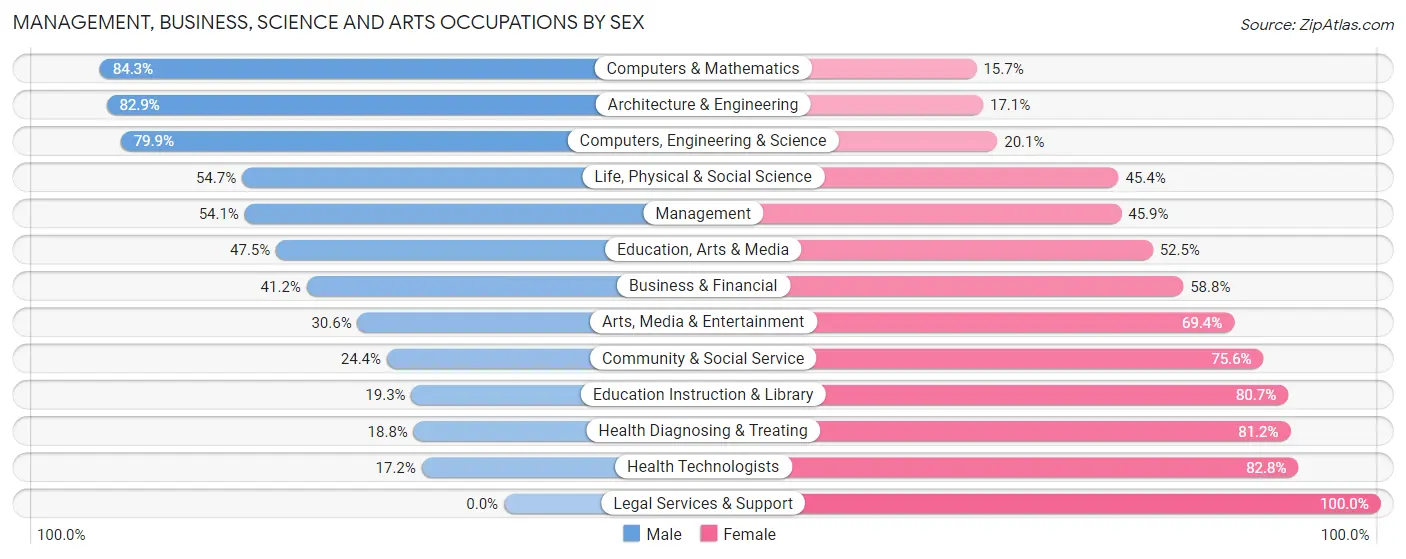
Management, Business, Science and Arts Occupations by Sex
Within the Management, Business, Science and Arts occupations in Van Wert County, the most male-oriented occupations are Computers & Mathematics (84.3%), Architecture & Engineering (82.9%), and Computers, Engineering & Science (79.9%), while the most female-oriented occupations are Legal Services & Support (100.0%), Health Technologists (82.8%), and Health Diagnosing & Treating (81.2%).
| Occupation | Male | Female |
| Management | 820 (54.1%) | 696 (45.9%) |
| Business & Financial | 170 (41.2%) | 243 (58.8%) |
| Computers, Engineering & Science | 550 (79.9%) | 138 (20.1%) |
| Computers & Mathematics | 236 (84.3%) | 44 (15.7%) |
| Architecture & Engineering | 267 (82.9%) | 55 (17.1%) |
| Life, Physical & Social Science | 47 (54.6%) | 39 (45.4%) |
| Community & Social Service | 234 (24.4%) | 724 (75.6%) |
| Education, Arts & Media | 77 (47.5%) | 85 (52.5%) |
| Legal Services & Support | 0 (0.0%) | 46 (100.0%) |
| Education Instruction & Library | 124 (19.3%) | 518 (80.7%) |
| Arts, Media & Entertainment | 33 (30.6%) | 75 (69.4%) |
| Health Diagnosing & Treating | 202 (18.8%) | 870 (81.2%) |
| Health Technologists | 122 (17.2%) | 588 (82.8%) |
| Total (Category) | 1,976 (42.5%) | 2,671 (57.5%) |
| Total (Overall) | 7,429 (52.2%) | 6,796 (47.8%) |
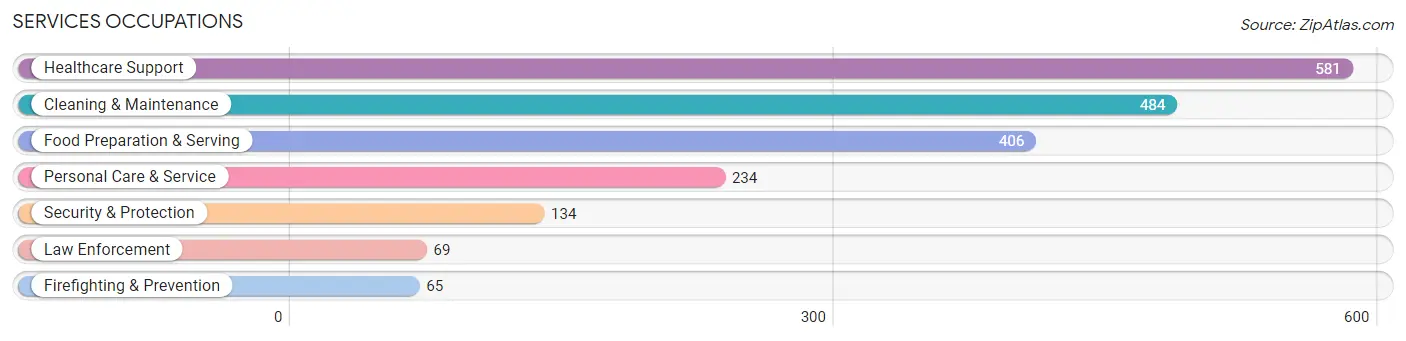
Services Occupations
The most common Services occupations in Van Wert County are Healthcare Support (581 | 4.1%), Cleaning & Maintenance (484 | 3.4%), Food Preparation & Serving (406 | 2.9%), Personal Care & Service (234 | 1.6%), and Security & Protection (134 | 0.9%).
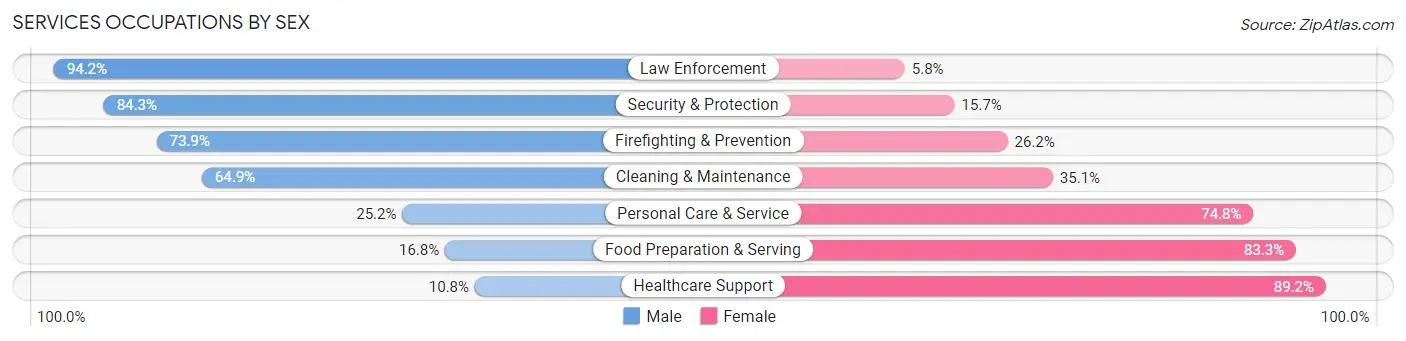
Services Occupations by Sex
Within the Services occupations in Van Wert County, the most male-oriented occupations are Law Enforcement (94.2%), Security & Protection (84.3%), and Firefighting & Prevention (73.9%), while the most female-oriented occupations are Healthcare Support (89.2%), Food Preparation & Serving (83.3%), and Personal Care & Service (74.8%).
| Occupation | Male | Female |
| Healthcare Support | 63 (10.8%) | 518 (89.2%) |
| Security & Protection | 113 (84.3%) | 21 (15.7%) |
| Firefighting & Prevention | 48 (73.9%) | 17 (26.2%) |
| Law Enforcement | 65 (94.2%) | 4 (5.8%) |
| Food Preparation & Serving | 68 (16.8%) | 338 (83.3%) |
| Cleaning & Maintenance | 314 (64.9%) | 170 (35.1%) |
| Personal Care & Service | 59 (25.2%) | 175 (74.8%) |
| Total (Category) | 617 (33.6%) | 1,222 (66.4%) |
| Total (Overall) | 7,429 (52.2%) | 6,796 (47.8%) |
Sales and Office Occupations
The most common Sales and Office occupations in Van Wert County are Office & Administration (1,358 | 9.6%), and Sales & Related (1,088 | 7.6%).

Sales and Office Occupations by Sex
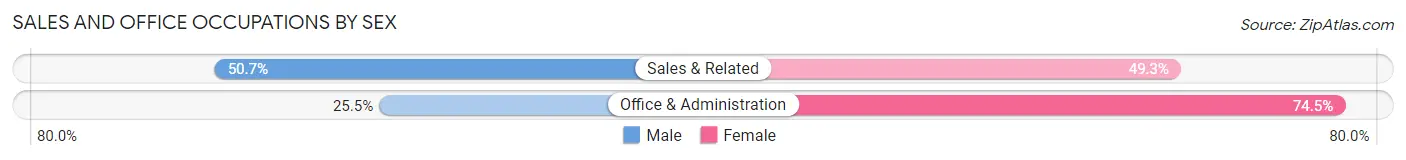
| Occupation | Male | Female |
| Sales & Related | 552 (50.7%) | 536 (49.3%) |
| Office & Administration | 346 (25.5%) | 1,012 (74.5%) |
| Total (Category) | 898 (36.7%) | 1,548 (63.3%) |
| Total (Overall) | 7,429 (52.2%) | 6,796 (47.8%) |
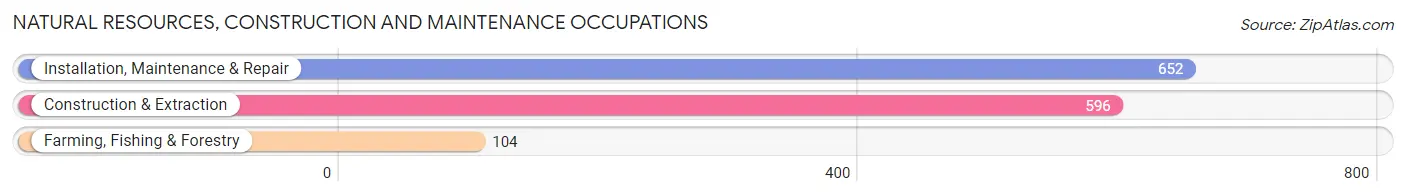
Natural Resources, Construction and Maintenance Occupations
The most common Natural Resources, Construction and Maintenance occupations in Van Wert County are Installation, Maintenance & Repair (652 | 4.6%), Construction & Extraction (596 | 4.2%), and Farming, Fishing & Forestry (104 | 0.7%).
Natural Resources, Construction and Maintenance Occupations by Sex
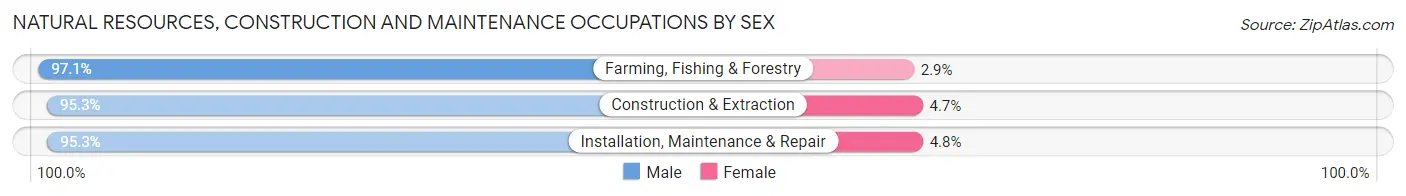
| Occupation | Male | Female |
| Farming, Fishing & Forestry | 101 (97.1%) | 3 (2.9%) |
| Construction & Extraction | 568 (95.3%) | 28 (4.7%) |
| Installation, Maintenance & Repair | 621 (95.3%) | 31 (4.8%) |
| Total (Category) | 1,290 (95.4%) | 62 (4.6%) |
| Total (Overall) | 7,429 (52.2%) | 6,796 (47.8%) |
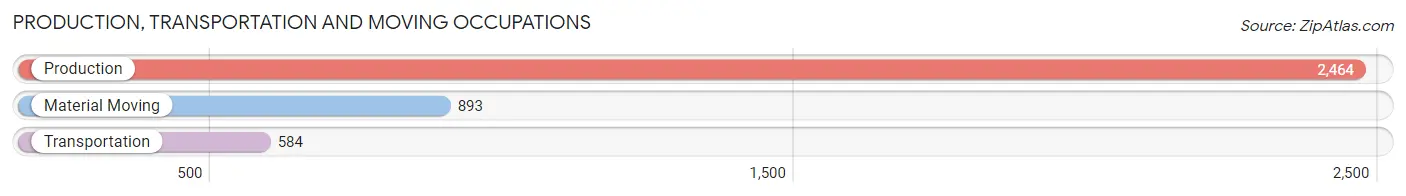
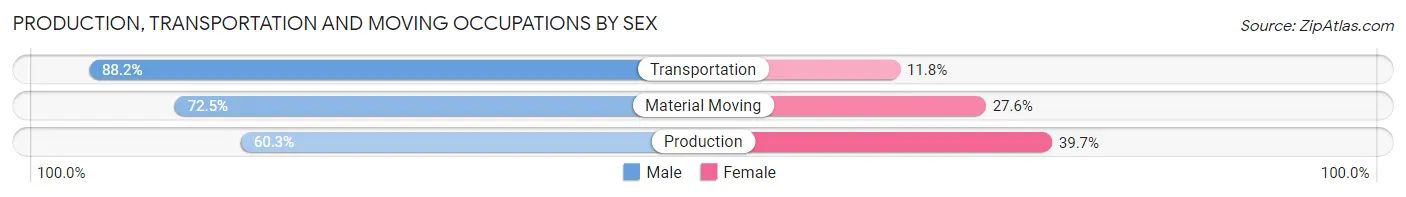
Production, Transportation and Moving Occupations
The most common Production, Transportation and Moving occupations in Van Wert County are Production (2,464 | 17.3%), Material Moving (893 | 6.3%), and Transportation (584 | 4.1%).
Production, Transportation and Moving Occupations by Sex
| Occupation | Male | Female |
| Production | 1,486 (60.3%) | 978 (39.7%) |
| Transportation | 515 (88.2%) | 69 (11.8%) |
| Material Moving | 647 (72.5%) | 246 (27.6%) |
| Total (Category) | 2,648 (67.2%) | 1,293 (32.8%) |
| Total (Overall) | 7,429 (52.2%) | 6,796 (47.8%) |
Employment Industries by Sex in Van Wert County
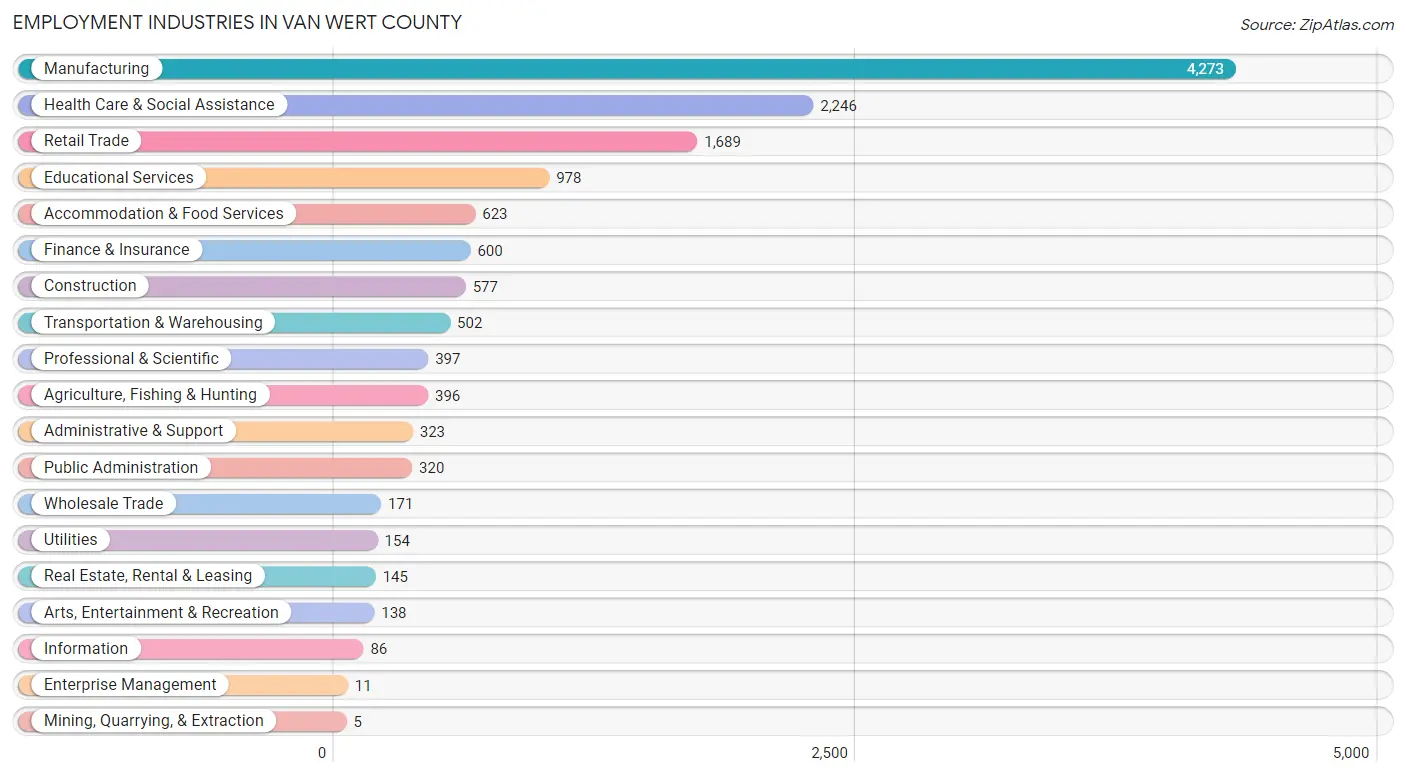
Employment Industries in Van Wert County
The major employment industries in Van Wert County include Manufacturing (4,273 | 30.0%), Health Care & Social Assistance (2,246 | 15.8%), Retail Trade (1,689 | 11.9%), Educational Services (978 | 6.9%), and Accommodation & Food Services (623 | 4.4%).
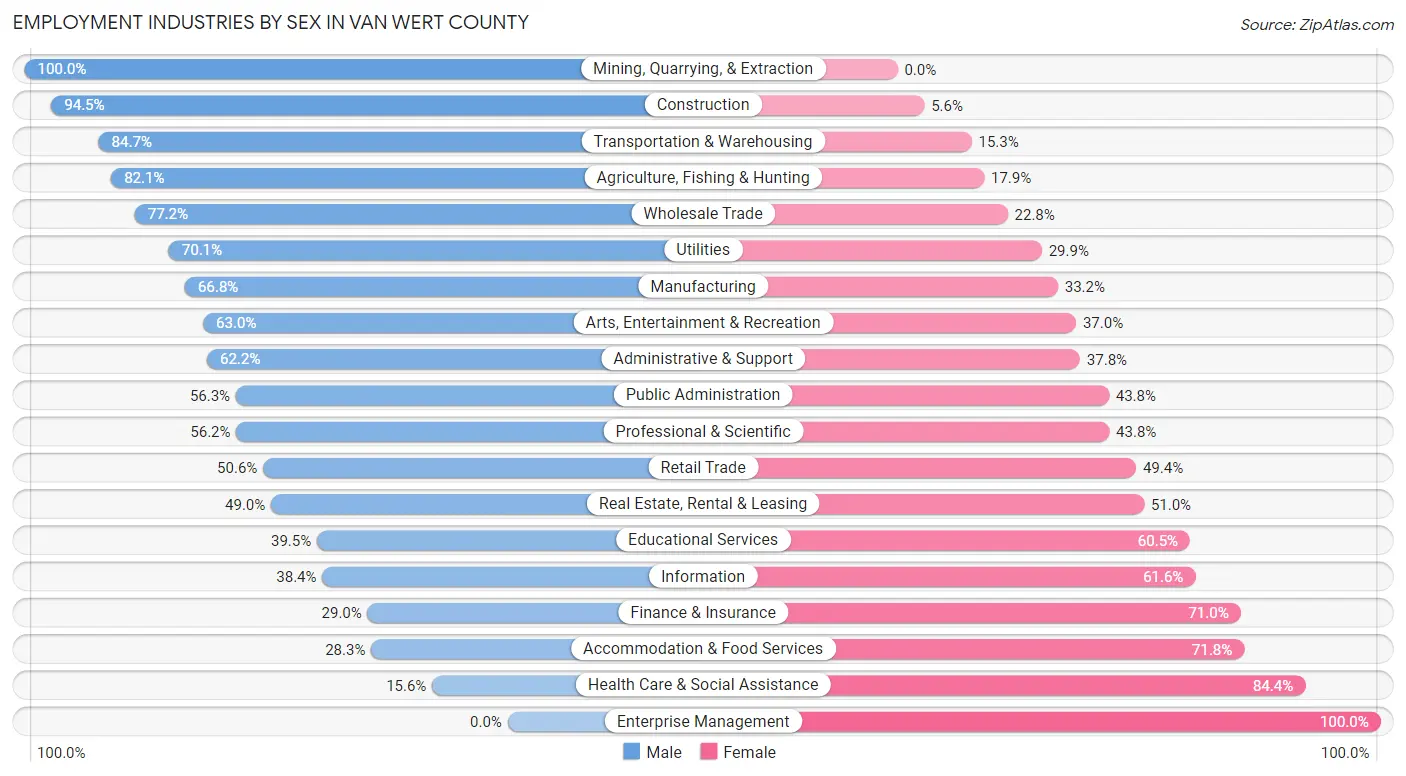
Employment Industries by Sex in Van Wert County
The Van Wert County industries that see more men than women are Mining, Quarrying, & Extraction (100.0%), Construction (94.5%), and Transportation & Warehousing (84.7%), whereas the industries that tend to have a higher number of women are Enterprise Management (100.0%), Health Care & Social Assistance (84.4%), and Accommodation & Food Services (71.8%).
| Industry | Male | Female |
| Agriculture, Fishing & Hunting | 325 (82.1%) | 71 (17.9%) |
| Mining, Quarrying, & Extraction | 5 (100.0%) | 0 (0.0%) |
| Construction | 545 (94.5%) | 32 (5.6%) |
| Manufacturing | 2,855 (66.8%) | 1,418 (33.2%) |
| Wholesale Trade | 132 (77.2%) | 39 (22.8%) |
| Retail Trade | 855 (50.6%) | 834 (49.4%) |
| Transportation & Warehousing | 425 (84.7%) | 77 (15.3%) |
| Utilities | 108 (70.1%) | 46 (29.9%) |
| Information | 33 (38.4%) | 53 (61.6%) |
| Finance & Insurance | 174 (29.0%) | 426 (71.0%) |
| Real Estate, Rental & Leasing | 71 (49.0%) | 74 (51.0%) |
| Professional & Scientific | 223 (56.2%) | 174 (43.8%) |
| Enterprise Management | 0 (0.0%) | 11 (100.0%) |
| Administrative & Support | 201 (62.2%) | 122 (37.8%) |
| Educational Services | 386 (39.5%) | 592 (60.5%) |
| Health Care & Social Assistance | 351 (15.6%) | 1,895 (84.4%) |
| Arts, Entertainment & Recreation | 87 (63.0%) | 51 (37.0%) |
| Accommodation & Food Services | 176 (28.2%) | 447 (71.8%) |
| Public Administration | 180 (56.2%) | 140 (43.8%) |
| Total | 7,429 (52.2%) | 6,796 (47.8%) |
Education in Van Wert County
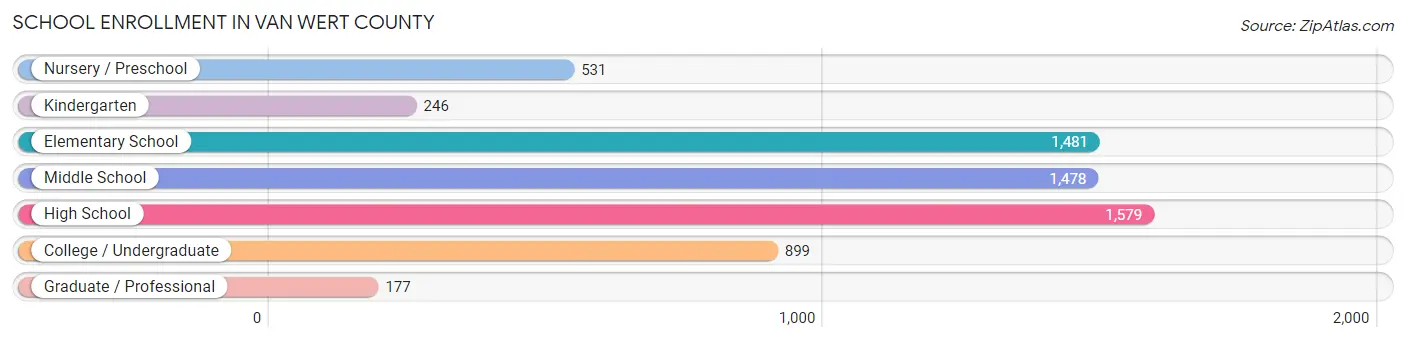
School Enrollment in Van Wert County
The most common levels of schooling among the 6,391 students in Van Wert County are high school (1,579 | 24.7%), elementary school (1,481 | 23.2%), and middle school (1,478 | 23.1%).
| School Level | # Students | % Students |
| Nursery / Preschool | 531 | 8.3% |
| Kindergarten | 246 | 3.8% |
| Elementary School | 1,481 | 23.2% |
| Middle School | 1,478 | 23.1% |
| High School | 1,579 | 24.7% |
| College / Undergraduate | 899 | 14.1% |
| Graduate / Professional | 177 | 2.8% |
| Total | 6,391 | 100.0% |
School Enrollment by Age by Funding Source in Van Wert County
Out of a total of 6,391 students who are enrolled in schools in Van Wert County, 703 (11.0%) attend a private institution, while the remaining 5,688 (89.0%) are enrolled in public schools. The age group of 20 to 24 year olds has the highest likelihood of being enrolled in private schools, with 126 (29.6% in the age bracket) enrolled. Conversely, the age group of 10 to 14 year olds has the lowest likelihood of being enrolled in a private school, with 1,723 (94.6% in the age bracket) attending a public institution.
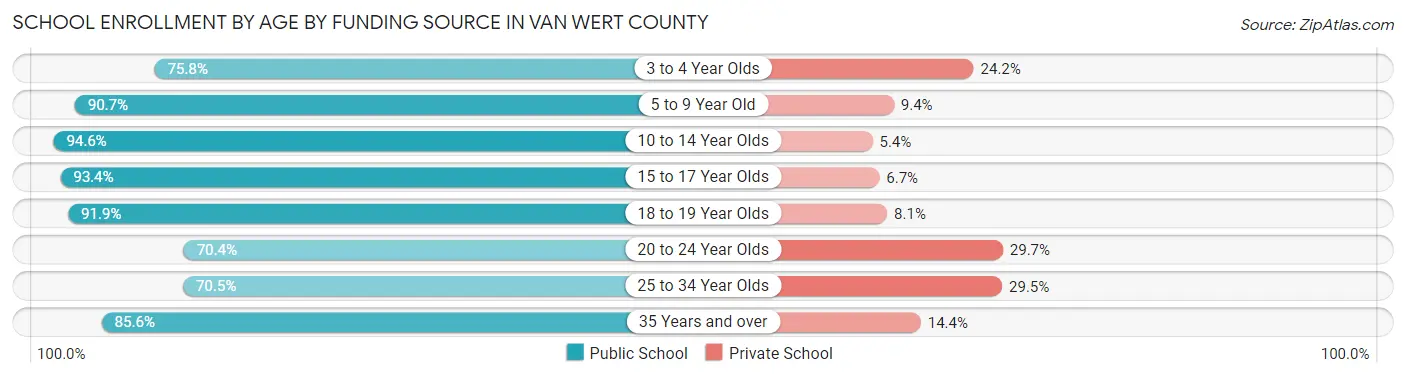
| Age Bracket | Public School | Private School |
| 3 to 4 Year Olds | 260 (75.8%) | 83 (24.2%) |
| 5 to 9 Year Old | 1,532 (90.6%) | 158 (9.3%) |
| 10 to 14 Year Olds | 1,723 (94.6%) | 98 (5.4%) |
| 15 to 17 Year Olds | 1,095 (93.3%) | 78 (6.7%) |
| 18 to 19 Year Olds | 363 (91.9%) | 32 (8.1%) |
| 20 to 24 Year Olds | 299 (70.4%) | 126 (29.6%) |
| 25 to 34 Year Olds | 246 (70.5%) | 103 (29.5%) |
| 35 Years and over | 167 (85.6%) | 28 (14.4%) |
| Total | 5,688 (89.0%) | 703 (11.0%) |
Educational Attainment by Field of Study in Van Wert County
Education (868 | 23.7%), business (658 | 18.0%), science & technology (491 | 13.4%), arts & humanities (320 | 8.7%), and engineering (276 | 7.5%) are the most common fields of study among 3,662 individuals in Van Wert County who have obtained a bachelor's degree or higher.
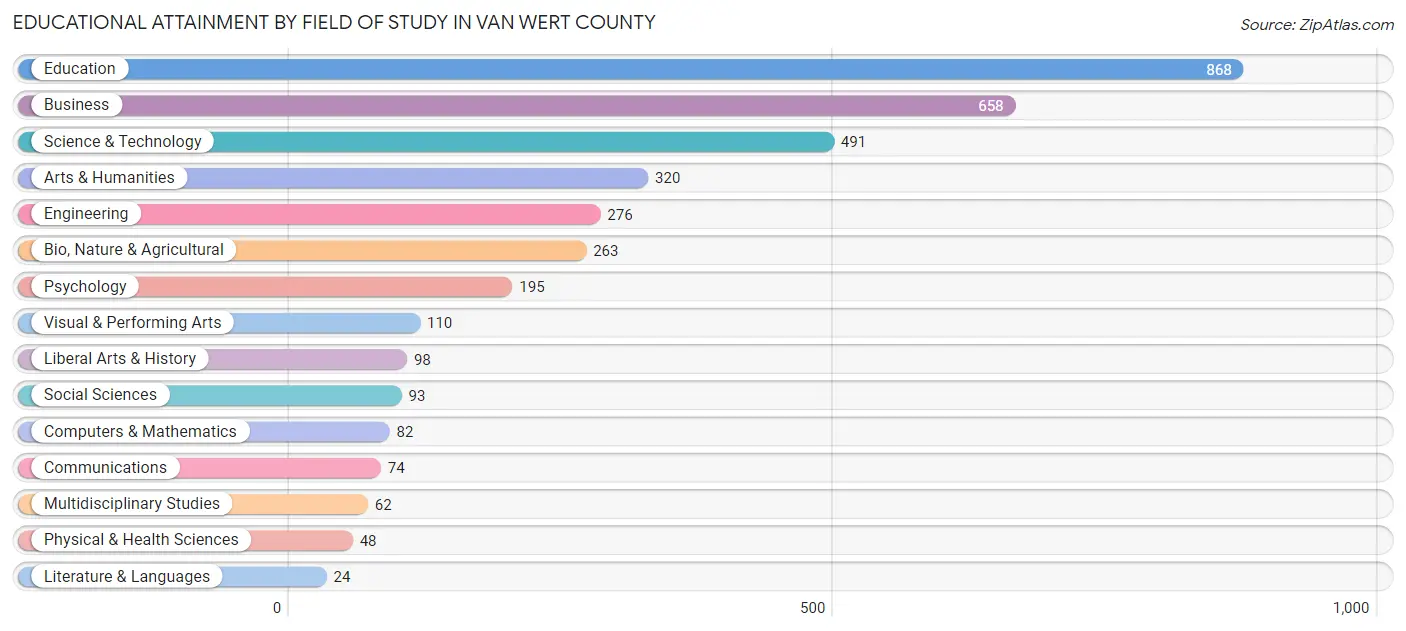
| Field of Study | # Graduates | % Graduates |
| Computers & Mathematics | 82 | 2.2% |
| Bio, Nature & Agricultural | 263 | 7.2% |
| Physical & Health Sciences | 48 | 1.3% |
| Psychology | 195 | 5.3% |
| Social Sciences | 93 | 2.5% |
| Engineering | 276 | 7.5% |
| Multidisciplinary Studies | 62 | 1.7% |
| Science & Technology | 491 | 13.4% |
| Business | 658 | 18.0% |
| Education | 868 | 23.7% |
| Literature & Languages | 24 | 0.7% |
| Liberal Arts & History | 98 | 2.7% |
| Visual & Performing Arts | 110 | 3.0% |
| Communications | 74 | 2.0% |
| Arts & Humanities | 320 | 8.7% |
| Total | 3,662 | 100.0% |
Transportation & Commute in Van Wert County
Vehicle Availability by Sex in Van Wert County
The most prevalent vehicle ownership categories in Van Wert County are males with 2 vehicles (2,835, accounting for 38.7%) and females with 2 vehicles (2,355, making up 42.7%).
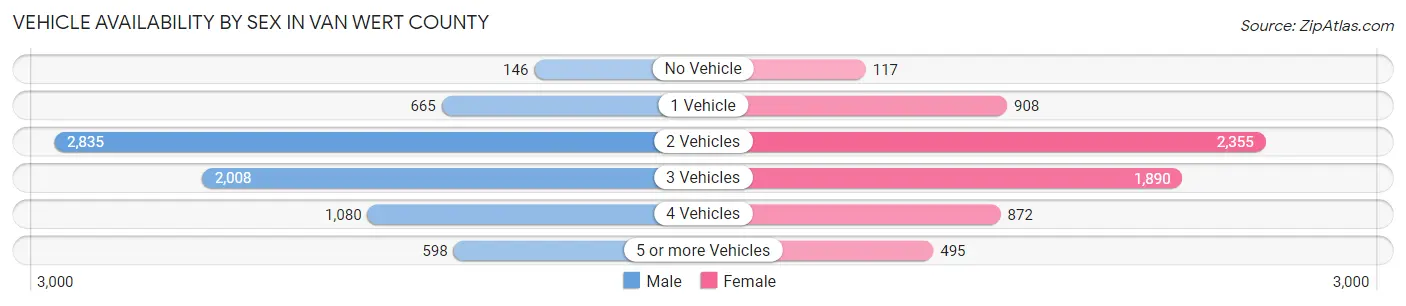
| Vehicles Available | Male | Female |
| No Vehicle | 146 (2.0%) | 117 (1.8%) |
| 1 Vehicle | 665 (9.1%) | 908 (13.7%) |
| 2 Vehicles | 2,835 (38.7%) | 2,355 (35.5%) |
| 3 Vehicles | 2,008 (27.4%) | 1,890 (28.5%) |
| 4 Vehicles | 1,080 (14.7%) | 872 (13.1%) |
| 5 or more Vehicles | 598 (8.2%) | 495 (7.5%) |
| Total | 7,332 (100.0%) | 6,637 (100.0%) |
Commute Time in Van Wert County
The most frequently occuring commute durations in Van Wert County are 5 to 9 minutes (2,985 commuters, 22.2%), 10 to 14 minutes (2,563 commuters, 19.0%), and 15 to 19 minutes (1,602 commuters, 11.9%).
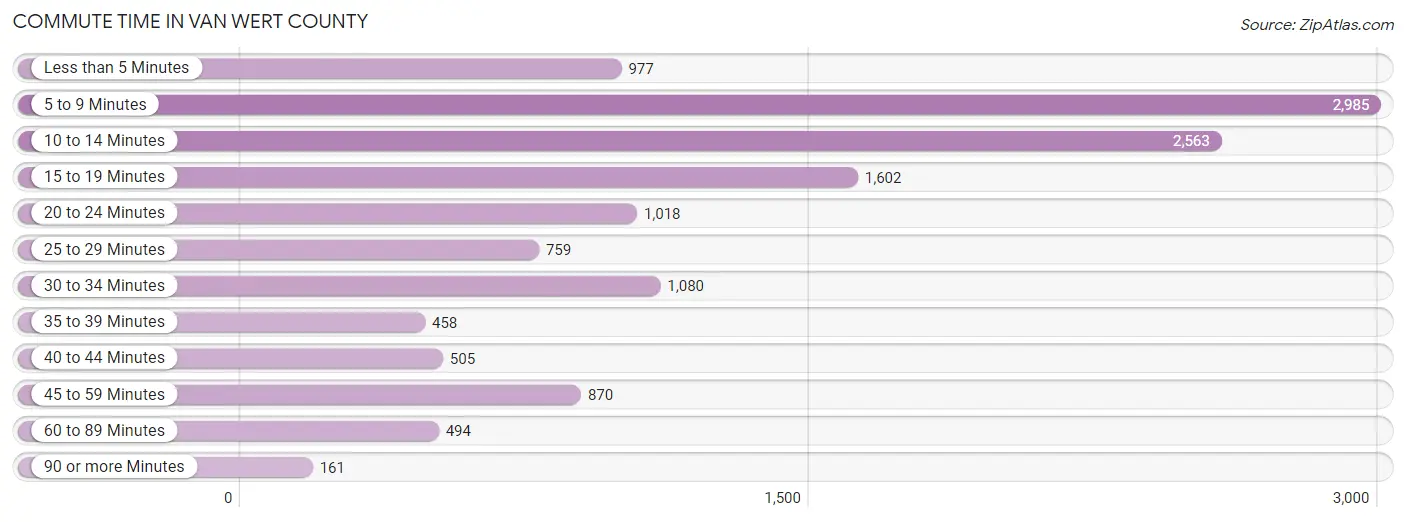
| Commute Time | # Commuters | % Commuters |
| Less than 5 Minutes | 977 | 7.2% |
| 5 to 9 Minutes | 2,985 | 22.2% |
| 10 to 14 Minutes | 2,563 | 19.0% |
| 15 to 19 Minutes | 1,602 | 11.9% |
| 20 to 24 Minutes | 1,018 | 7.6% |
| 25 to 29 Minutes | 759 | 5.6% |
| 30 to 34 Minutes | 1,080 | 8.0% |
| 35 to 39 Minutes | 458 | 3.4% |
| 40 to 44 Minutes | 505 | 3.7% |
| 45 to 59 Minutes | 870 | 6.5% |
| 60 to 89 Minutes | 494 | 3.7% |
| 90 or more Minutes | 161 | 1.2% |
Commute Time by Sex in Van Wert County
The most common commute times in Van Wert County are 5 to 9 minutes (1,458 commuters, 20.6%) for males and 5 to 9 minutes (1,527 commuters, 23.9%) for females.
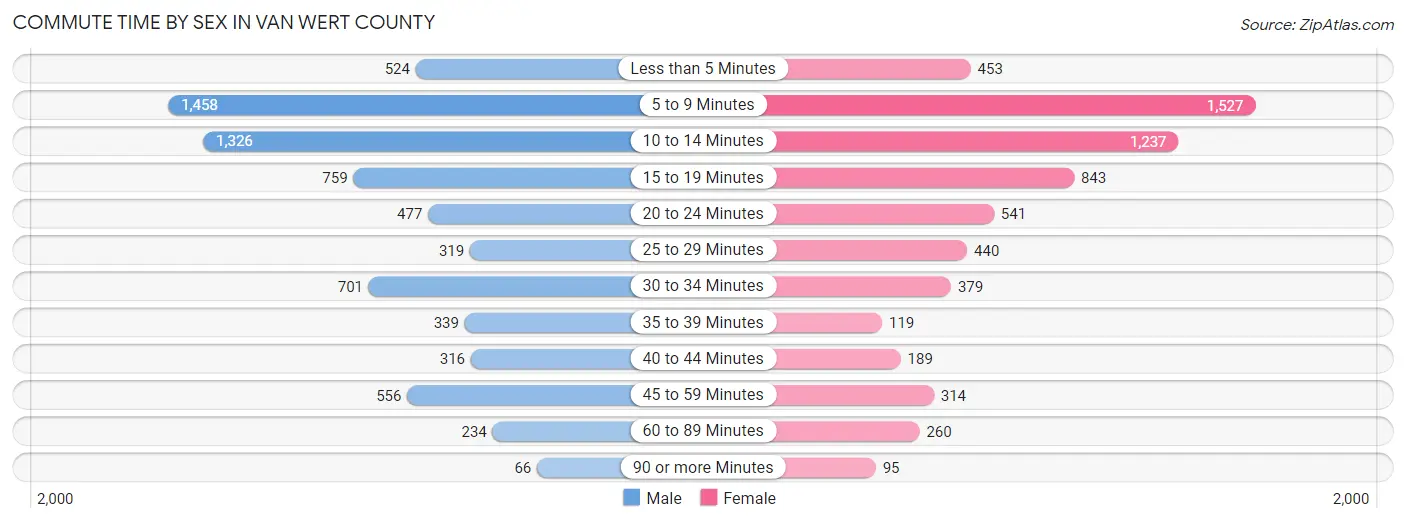
| Commute Time | Male | Female |
| Less than 5 Minutes | 524 (7.4%) | 453 (7.1%) |
| 5 to 9 Minutes | 1,458 (20.6%) | 1,527 (23.9%) |
| 10 to 14 Minutes | 1,326 (18.7%) | 1,237 (19.3%) |
| 15 to 19 Minutes | 759 (10.7%) | 843 (13.2%) |
| 20 to 24 Minutes | 477 (6.7%) | 541 (8.5%) |
| 25 to 29 Minutes | 319 (4.5%) | 440 (6.9%) |
| 30 to 34 Minutes | 701 (9.9%) | 379 (5.9%) |
| 35 to 39 Minutes | 339 (4.8%) | 119 (1.9%) |
| 40 to 44 Minutes | 316 (4.5%) | 189 (2.9%) |
| 45 to 59 Minutes | 556 (7.9%) | 314 (4.9%) |
| 60 to 89 Minutes | 234 (3.3%) | 260 (4.1%) |
| 90 or more Minutes | 66 (0.9%) | 95 (1.5%) |
Time of Departure to Work by Sex in Van Wert County
The most frequent times of departure to work in Van Wert County are 6:30 AM to 6:59 AM (861, 12.2%) for males and 7:30 AM to 7:59 AM (988, 15.4%) for females.
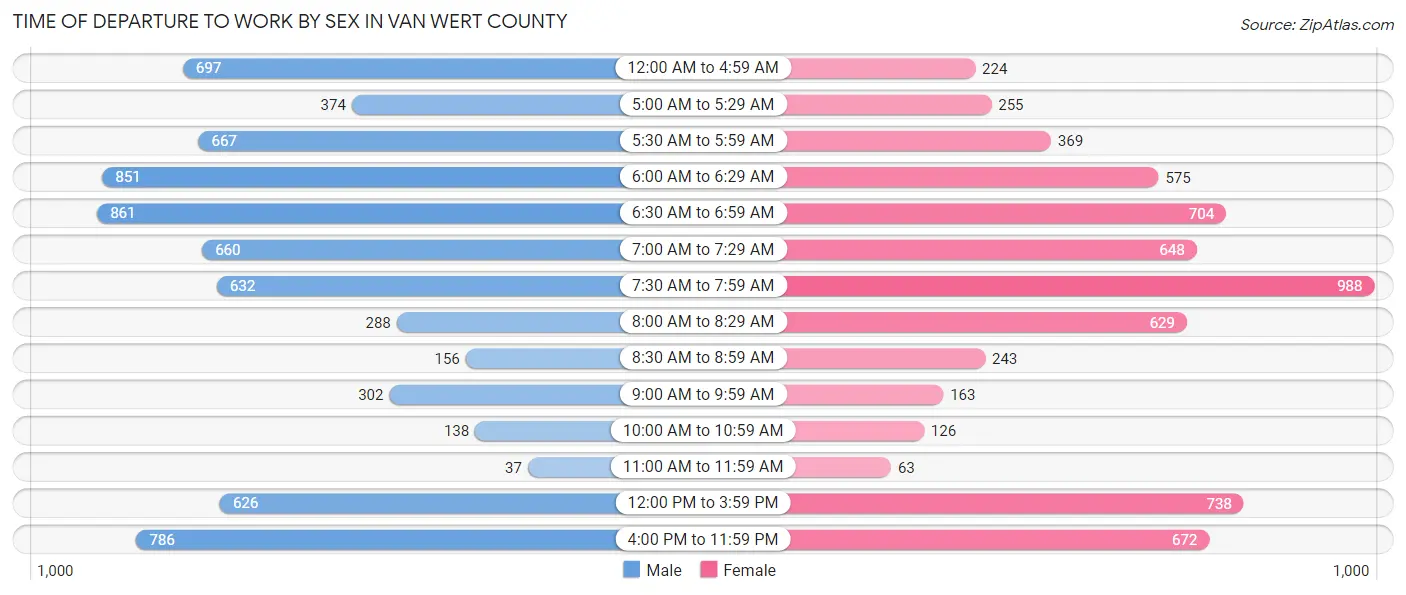
| Time of Departure | Male | Female |
| 12:00 AM to 4:59 AM | 697 (9.9%) | 224 (3.5%) |
| 5:00 AM to 5:29 AM | 374 (5.3%) | 255 (4.0%) |
| 5:30 AM to 5:59 AM | 667 (9.4%) | 369 (5.8%) |
| 6:00 AM to 6:29 AM | 851 (12.0%) | 575 (9.0%) |
| 6:30 AM to 6:59 AM | 861 (12.2%) | 704 (11.0%) |
| 7:00 AM to 7:29 AM | 660 (9.3%) | 648 (10.1%) |
| 7:30 AM to 7:59 AM | 632 (8.9%) | 988 (15.4%) |
| 8:00 AM to 8:29 AM | 288 (4.1%) | 629 (9.8%) |
| 8:30 AM to 8:59 AM | 156 (2.2%) | 243 (3.8%) |
| 9:00 AM to 9:59 AM | 302 (4.3%) | 163 (2.5%) |
| 10:00 AM to 10:59 AM | 138 (1.9%) | 126 (2.0%) |
| 11:00 AM to 11:59 AM | 37 (0.5%) | 63 (1.0%) |
| 12:00 PM to 3:59 PM | 626 (8.8%) | 738 (11.5%) |
| 4:00 PM to 11:59 PM | 786 (11.1%) | 672 (10.5%) |
| Total | 7,075 (100.0%) | 6,397 (100.0%) |
Housing Occupancy in Van Wert County
Occupancy by Ownership in Van Wert County
Of the total 11,666 dwellings in Van Wert County, owner-occupied units account for 9,258 (79.4%), while renter-occupied units make up 2,408 (20.6%).
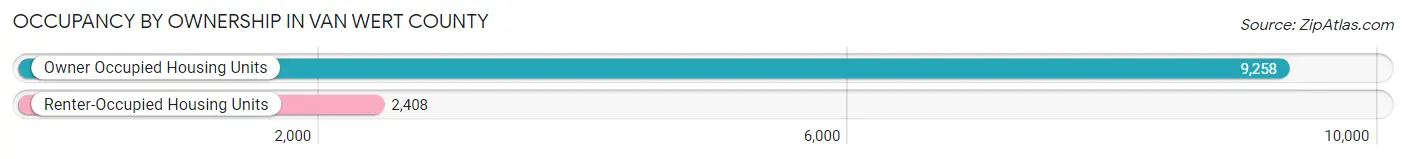
| Occupancy | # Housing Units | % Housing Units |
| Owner Occupied Housing Units | 9,258 | 79.4% |
| Renter-Occupied Housing Units | 2,408 | 20.6% |
| Total Occupied Housing Units | 11,666 | 100.0% |
Occupancy by Household Size in Van Wert County
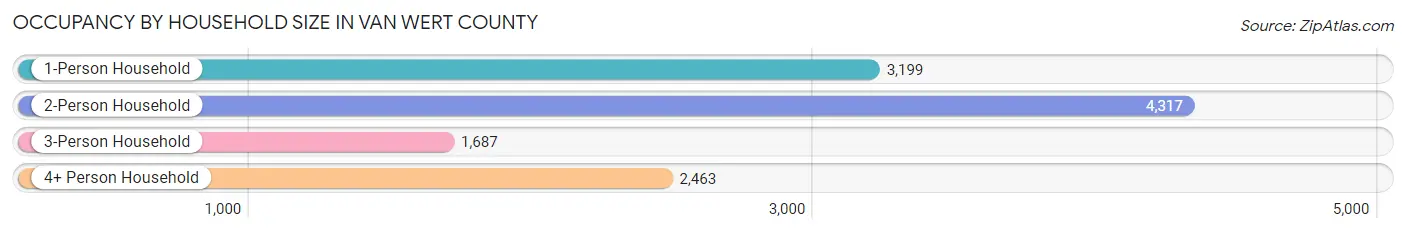
| Household Size | # Housing Units | % Housing Units |
| 1-Person Household | 3,199 | 27.4% |
| 2-Person Household | 4,317 | 37.0% |
| 3-Person Household | 1,687 | 14.5% |
| 4+ Person Household | 2,463 | 21.1% |
| Total Housing Units | 11,666 | 100.0% |
Occupancy by Ownership by Household Size in Van Wert County
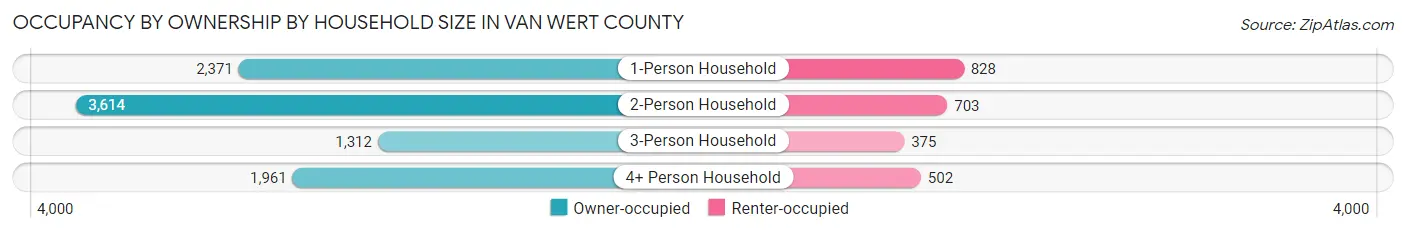
| Household Size | Owner-occupied | Renter-occupied |
| 1-Person Household | 2,371 (74.1%) | 828 (25.9%) |
| 2-Person Household | 3,614 (83.7%) | 703 (16.3%) |
| 3-Person Household | 1,312 (77.8%) | 375 (22.2%) |
| 4+ Person Household | 1,961 (79.6%) | 502 (20.4%) |
| Total Housing Units | 9,258 (79.4%) | 2,408 (20.6%) |
Occupancy by Educational Attainment in Van Wert County
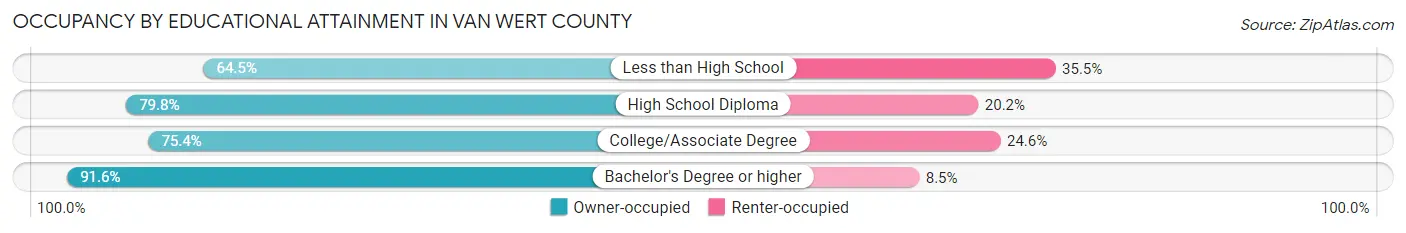
| Household Size | Owner-occupied | Renter-occupied |
| Less than High School | 520 (64.5%) | 286 (35.5%) |
| High School Diploma | 4,080 (79.8%) | 1,030 (20.2%) |
| College/Associate Degree | 2,838 (75.4%) | 924 (24.6%) |
| Bachelor's Degree or higher | 1,820 (91.5%) | 168 (8.5%) |
Occupancy by Age of Householder in Van Wert County
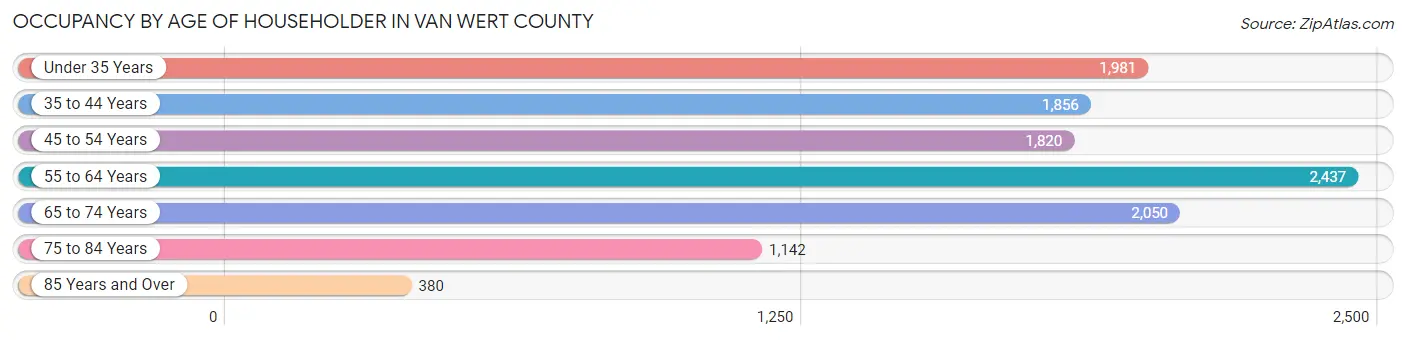
| Age Bracket | # Households | % Households |
| Under 35 Years | 1,981 | 17.0% |
| 35 to 44 Years | 1,856 | 15.9% |
| 45 to 54 Years | 1,820 | 15.6% |
| 55 to 64 Years | 2,437 | 20.9% |
| 65 to 74 Years | 2,050 | 17.6% |
| 75 to 84 Years | 1,142 | 9.8% |
| 85 Years and Over | 380 | 3.3% |
| Total | 11,666 | 100.0% |
Housing Finances in Van Wert County
Median Income by Occupancy in Van Wert County
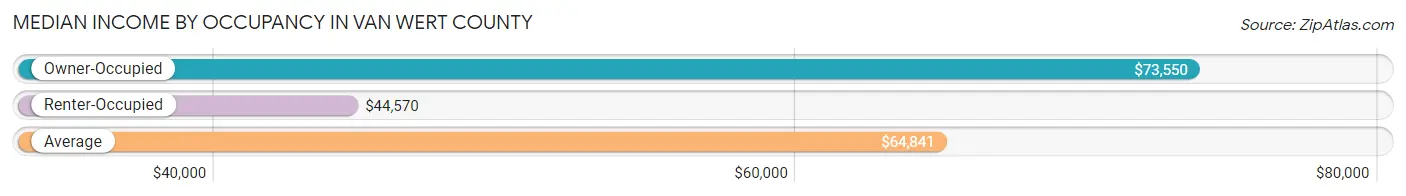
| Occupancy Type | # Households | Median Income |
| Owner-Occupied | 9,258 (79.4%) | $73,550 |
| Renter-Occupied | 2,408 (20.6%) | $44,570 |
| Average | 11,666 (100.0%) | $64,841 |
Occupancy by Householder Income Bracket in Van Wert County
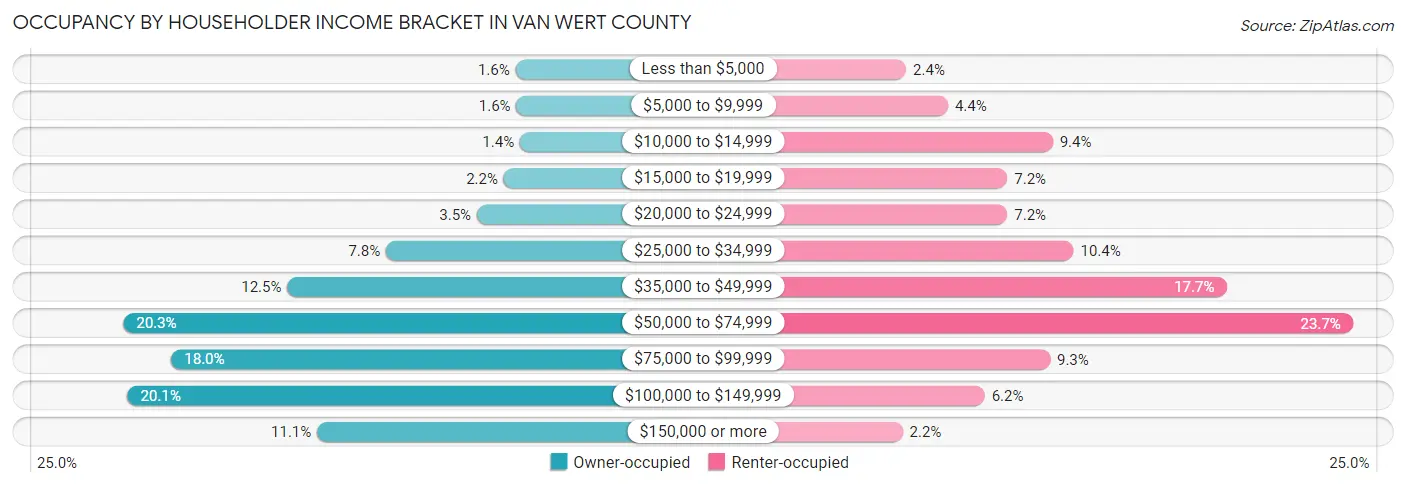
| Income Bracket | Owner-occupied | Renter-occupied |
| Less than $5,000 | 150 (1.6%) | 58 (2.4%) |
| $5,000 to $9,999 | 146 (1.6%) | 106 (4.4%) |
| $10,000 to $14,999 | 131 (1.4%) | 226 (9.4%) |
| $15,000 to $19,999 | 202 (2.2%) | 174 (7.2%) |
| $20,000 to $24,999 | 320 (3.5%) | 174 (7.2%) |
| $25,000 to $34,999 | 721 (7.8%) | 250 (10.4%) |
| $35,000 to $49,999 | 1,156 (12.5%) | 425 (17.6%) |
| $50,000 to $74,999 | 1,879 (20.3%) | 570 (23.7%) |
| $75,000 to $99,999 | 1,667 (18.0%) | 223 (9.3%) |
| $100,000 to $149,999 | 1,861 (20.1%) | 148 (6.1%) |
| $150,000 or more | 1,025 (11.1%) | 54 (2.2%) |
| Total | 9,258 (100.0%) | 2,408 (100.0%) |
Monthly Housing Cost Tiers in Van Wert County
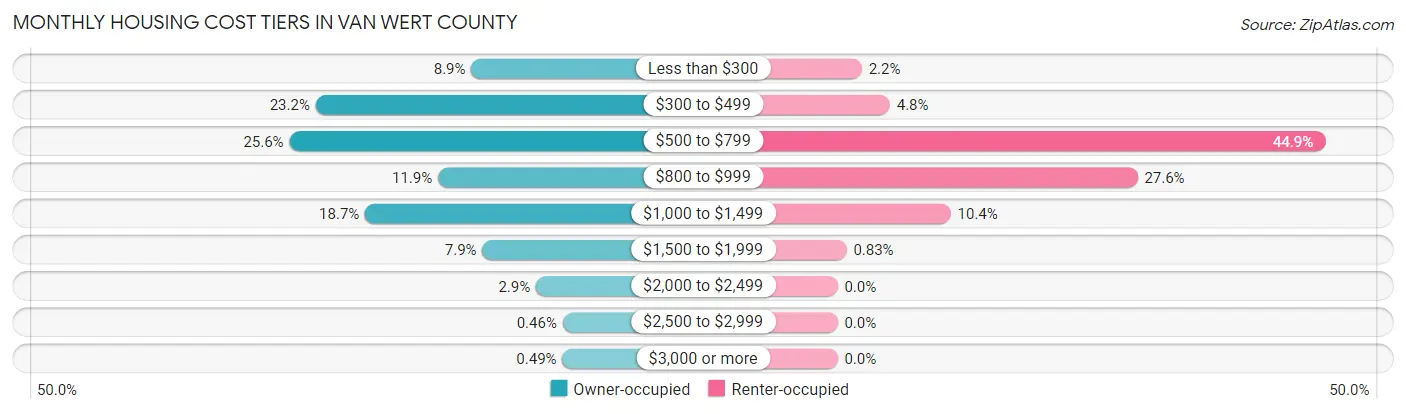
| Monthly Cost | Owner-occupied | Renter-occupied |
| Less than $300 | 821 (8.9%) | 54 (2.2%) |
| $300 to $499 | 2,148 (23.2%) | 116 (4.8%) |
| $500 to $799 | 2,372 (25.6%) | 1,081 (44.9%) |
| $800 to $999 | 1,105 (11.9%) | 665 (27.6%) |
| $1,000 to $1,499 | 1,727 (18.6%) | 251 (10.4%) |
| $1,500 to $1,999 | 727 (7.9%) | 20 (0.8%) |
| $2,000 to $2,499 | 270 (2.9%) | 0 (0.0%) |
| $2,500 to $2,999 | 43 (0.5%) | 0 (0.0%) |
| $3,000 or more | 45 (0.5%) | 0 (0.0%) |
| Total | 9,258 (100.0%) | 2,408 (100.0%) |
Physical Housing Characteristics in Van Wert County
Housing Structures in Van Wert County
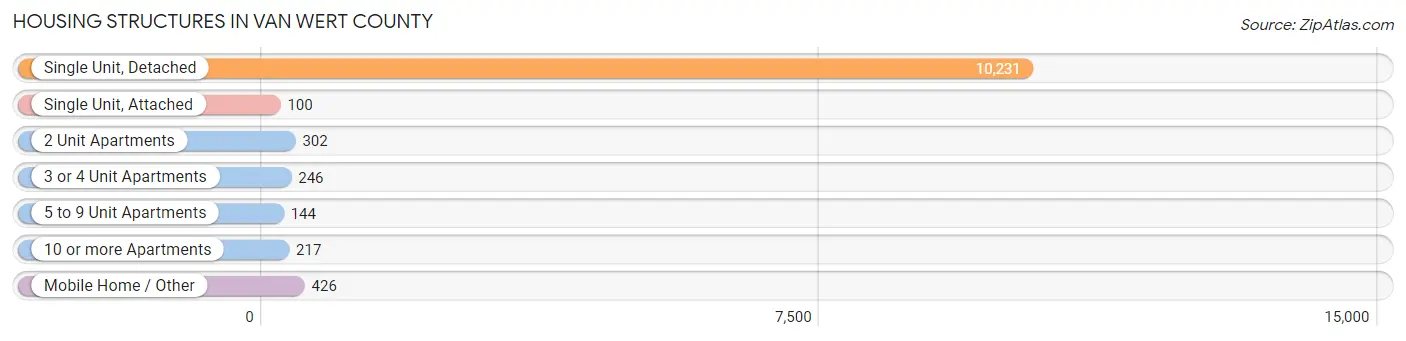
| Structure Type | # Housing Units | % Housing Units |
| Single Unit, Detached | 10,231 | 87.7% |
| Single Unit, Attached | 100 | 0.9% |
| 2 Unit Apartments | 302 | 2.6% |
| 3 or 4 Unit Apartments | 246 | 2.1% |
| 5 to 9 Unit Apartments | 144 | 1.2% |
| 10 or more Apartments | 217 | 1.9% |
| Mobile Home / Other | 426 | 3.6% |
| Total | 11,666 | 100.0% |
Housing Structures by Occupancy in Van Wert County
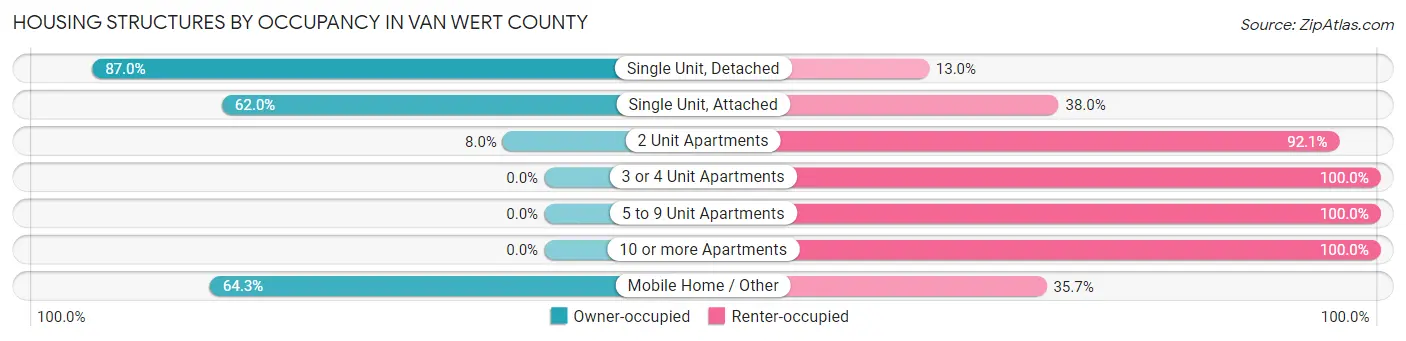
| Structure Type | Owner-occupied | Renter-occupied |
| Single Unit, Detached | 8,898 (87.0%) | 1,333 (13.0%) |
| Single Unit, Attached | 62 (62.0%) | 38 (38.0%) |
| 2 Unit Apartments | 24 (8.0%) | 278 (92.0%) |
| 3 or 4 Unit Apartments | 0 (0.0%) | 246 (100.0%) |
| 5 to 9 Unit Apartments | 0 (0.0%) | 144 (100.0%) |
| 10 or more Apartments | 0 (0.0%) | 217 (100.0%) |
| Mobile Home / Other | 274 (64.3%) | 152 (35.7%) |
| Total | 9,258 (79.4%) | 2,408 (20.6%) |
Housing Structures by Number of Rooms in Van Wert County
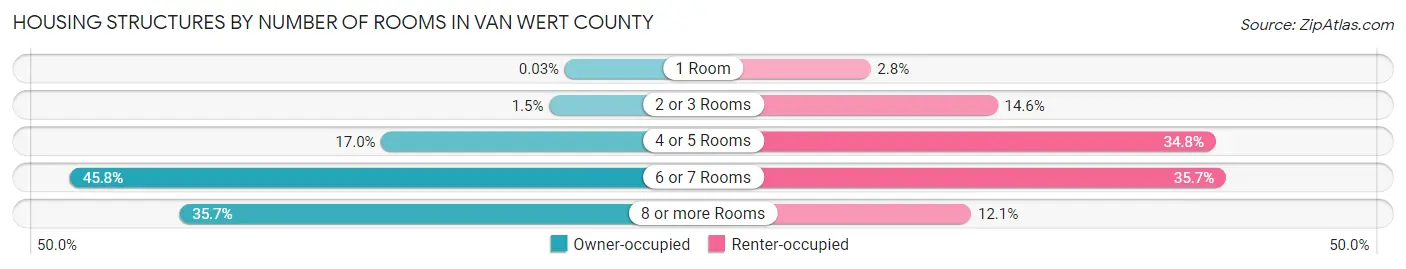
| Number of Rooms | Owner-occupied | Renter-occupied |
| 1 Room | 3 (0.0%) | 68 (2.8%) |
| 2 or 3 Rooms | 136 (1.5%) | 351 (14.6%) |
| 4 or 5 Rooms | 1,574 (17.0%) | 837 (34.8%) |
| 6 or 7 Rooms | 4,241 (45.8%) | 860 (35.7%) |
| 8 or more Rooms | 3,304 (35.7%) | 292 (12.1%) |
| Total | 9,258 (100.0%) | 2,408 (100.0%) |
Housing Structure by Heating Type in Van Wert County
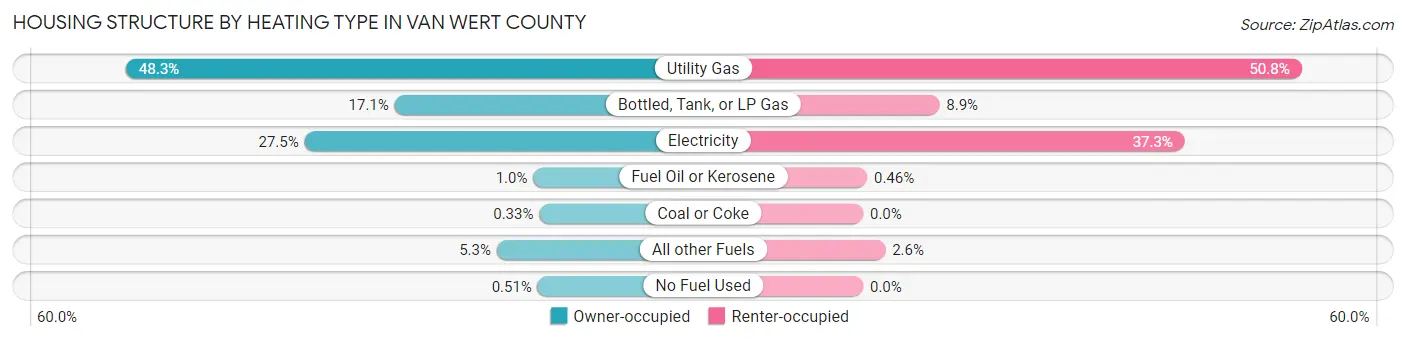
| Heating Type | Owner-occupied | Renter-occupied |
| Utility Gas | 4,467 (48.2%) | 1,224 (50.8%) |
| Bottled, Tank, or LP Gas | 1,583 (17.1%) | 213 (8.8%) |
| Electricity | 2,550 (27.5%) | 898 (37.3%) |
| Fuel Oil or Kerosene | 94 (1.0%) | 11 (0.5%) |
| Coal or Coke | 31 (0.3%) | 0 (0.0%) |
| All other Fuels | 486 (5.2%) | 62 (2.6%) |
| No Fuel Used | 47 (0.5%) | 0 (0.0%) |
| Total | 9,258 (100.0%) | 2,408 (100.0%) |
Household Vehicle Usage in Van Wert County
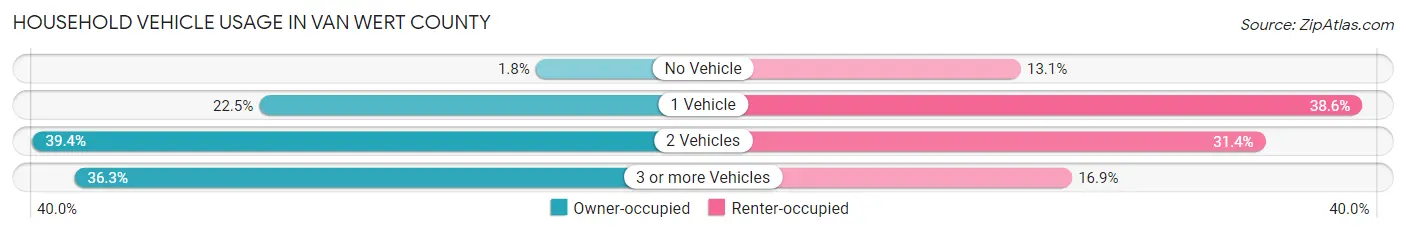
| Vehicles per Household | Owner-occupied | Renter-occupied |
| No Vehicle | 170 (1.8%) | 315 (13.1%) |
| 1 Vehicle | 2,082 (22.5%) | 930 (38.6%) |
| 2 Vehicles | 3,648 (39.4%) | 756 (31.4%) |
| 3 or more Vehicles | 3,358 (36.3%) | 407 (16.9%) |
| Total | 9,258 (100.0%) | 2,408 (100.0%) |
Real Estate & Mortgages in Van Wert County
Real Estate and Mortgage Overview in Van Wert County
| Characteristic | Without Mortgage | With Mortgage |
| Housing Units | 4,294 | 4,964 |
| Median Property Value | $131,500 | $127,300 |
| Median Household Income | $62,236 | $607 |
| Monthly Housing Costs | $436 | $36 |
| Real Estate Taxes | $1,316 | $162 |
Property Value by Mortgage Status in Van Wert County
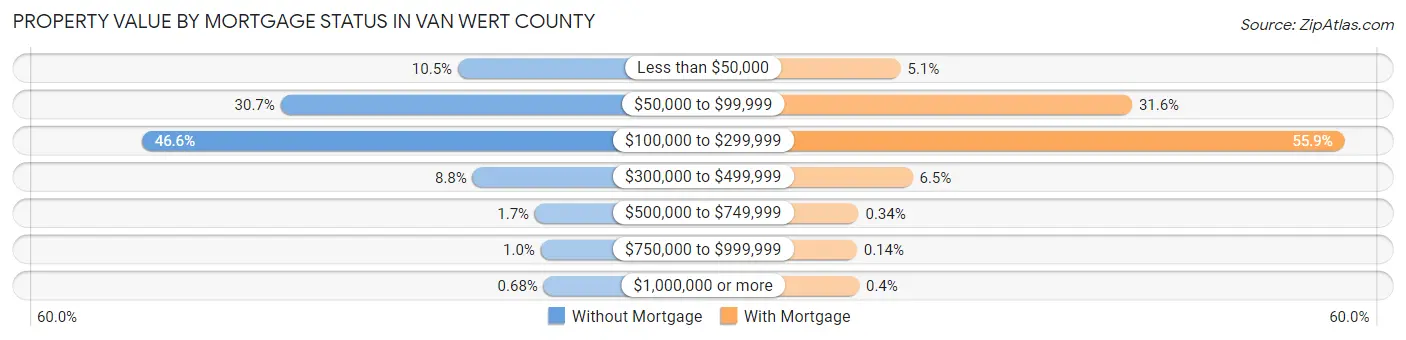
| Property Value | Without Mortgage | With Mortgage |
| Less than $50,000 | 450 (10.5%) | 255 (5.1%) |
| $50,000 to $99,999 | 1,320 (30.7%) | 1,568 (31.6%) |
| $100,000 to $299,999 | 2,001 (46.6%) | 2,774 (55.9%) |
| $300,000 to $499,999 | 378 (8.8%) | 323 (6.5%) |
| $500,000 to $749,999 | 72 (1.7%) | 17 (0.3%) |
| $750,000 to $999,999 | 44 (1.0%) | 7 (0.1%) |
| $1,000,000 or more | 29 (0.7%) | 20 (0.4%) |
| Total | 4,294 (100.0%) | 4,964 (100.0%) |
Household Income by Mortgage Status in Van Wert County
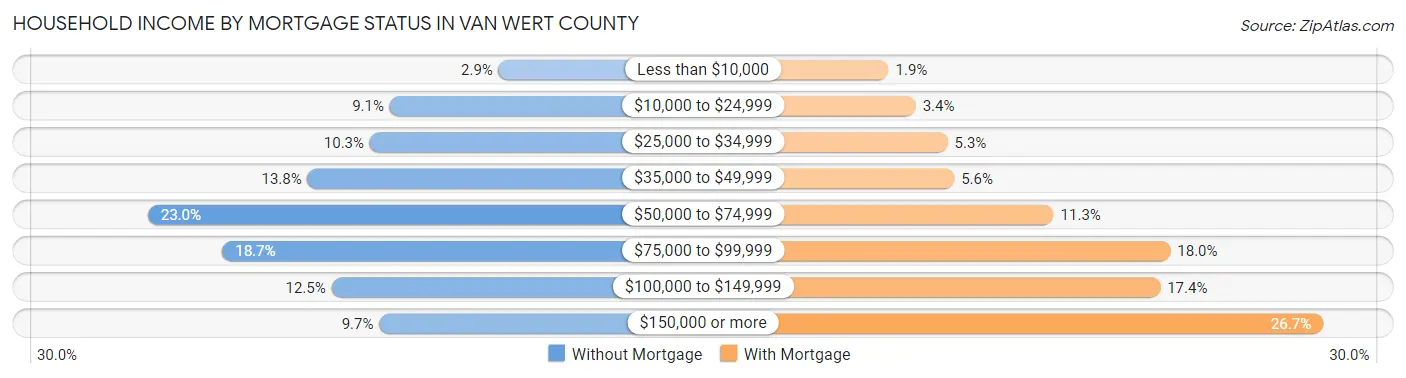
| Household Income | Without Mortgage | With Mortgage |
| Less than $10,000 | 125 (2.9%) | 94 (1.9%) |
| $10,000 to $24,999 | 392 (9.1%) | 171 (3.4%) |
| $25,000 to $34,999 | 441 (10.3%) | 261 (5.3%) |
| $35,000 to $49,999 | 594 (13.8%) | 280 (5.6%) |
| $50,000 to $74,999 | 986 (23.0%) | 562 (11.3%) |
| $75,000 to $99,999 | 803 (18.7%) | 893 (18.0%) |
| $100,000 to $149,999 | 535 (12.5%) | 864 (17.4%) |
| $150,000 or more | 418 (9.7%) | 1,326 (26.7%) |
| Total | 4,294 (100.0%) | 4,964 (100.0%) |
Property Value to Household Income Ratio in Van Wert County
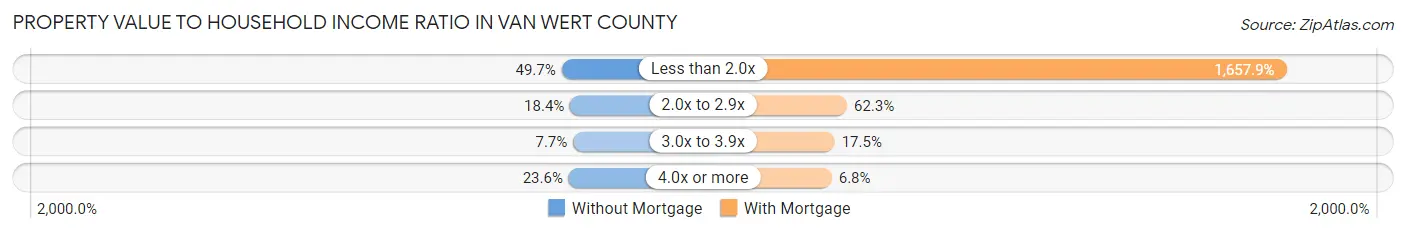
| Value-to-Income Ratio | Without Mortgage | With Mortgage |
| Less than 2.0x | 2,136 (49.7%) | 82,298 (1,657.9%) |
| 2.0x to 2.9x | 789 (18.4%) | 3,091 (62.3%) |
| 3.0x to 3.9x | 331 (7.7%) | 870 (17.5%) |
| 4.0x or more | 1,014 (23.6%) | 336 (6.8%) |
| Total | 4,294 (100.0%) | 4,964 (100.0%) |
Real Estate Taxes by Mortgage Status in Van Wert County
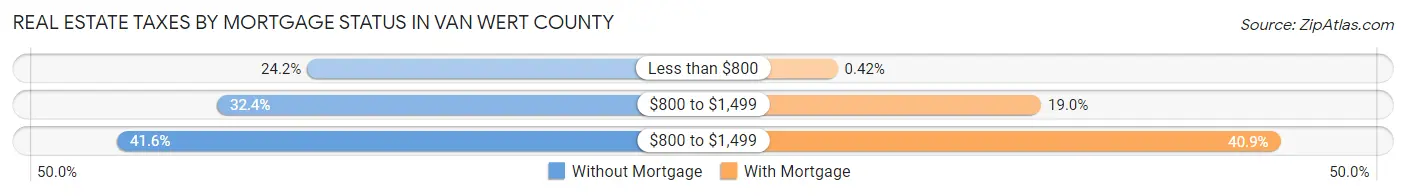
| Property Taxes | Without Mortgage | With Mortgage |
| Less than $800 | 1,039 (24.2%) | 21 (0.4%) |
| $800 to $1,499 | 1,392 (32.4%) | 943 (19.0%) |
| $800 to $1,499 | 1,784 (41.5%) | 2,028 (40.8%) |
| Total | 4,294 (100.0%) | 4,964 (100.0%) |
Health & Disability in Van Wert County
Health Insurance Coverage by Age in Van Wert County
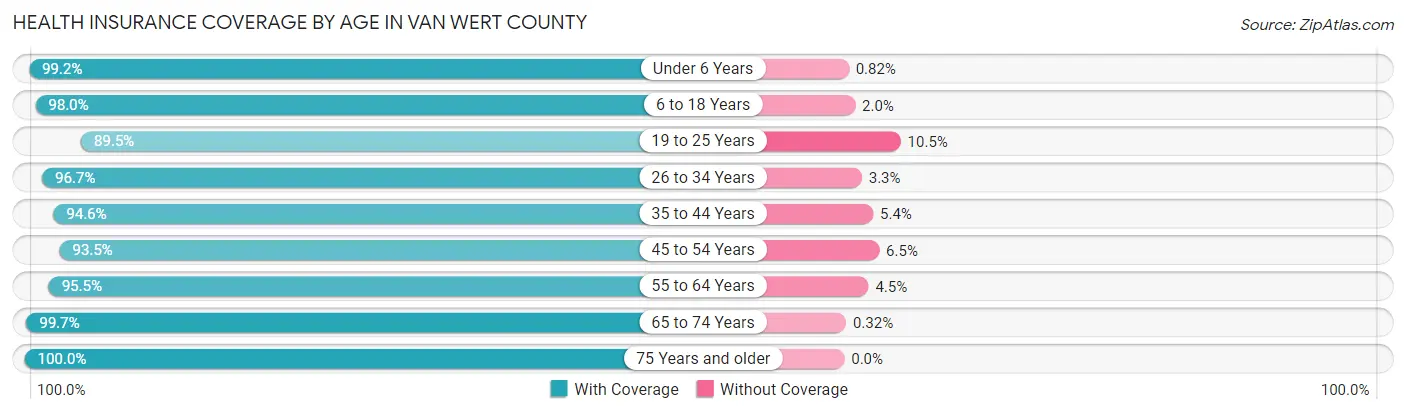
| Age Bracket | With Coverage | Without Coverage |
| Under 6 Years | 2,176 (99.2%) | 18 (0.8%) |
| 6 to 18 Years | 4,730 (98.0%) | 97 (2.0%) |
| 19 to 25 Years | 2,070 (89.5%) | 243 (10.5%) |
| 26 to 34 Years | 2,823 (96.7%) | 95 (3.3%) |
| 35 to 44 Years | 3,226 (94.6%) | 183 (5.4%) |
| 45 to 54 Years | 3,321 (93.5%) | 231 (6.5%) |
| 55 to 64 Years | 3,829 (95.5%) | 181 (4.5%) |
| 65 to 74 Years | 3,143 (99.7%) | 10 (0.3%) |
| 75 Years and older | 2,159 (100.0%) | 0 (0.0%) |
| Total | 27,477 (96.3%) | 1,058 (3.7%) |
Health Insurance Coverage by Citizenship Status in Van Wert County
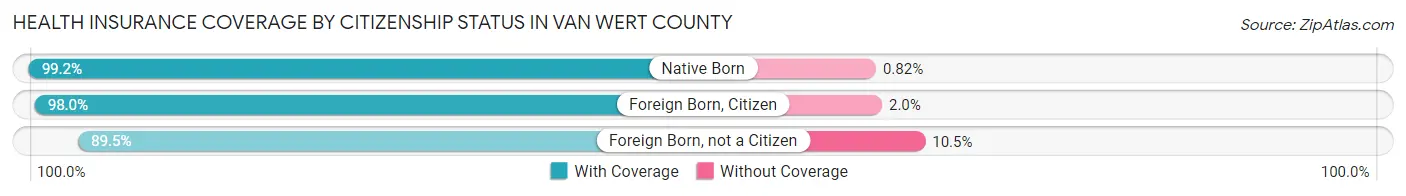
| Citizenship Status | With Coverage | Without Coverage |
| Native Born | 2,176 (99.2%) | 18 (0.8%) |
| Foreign Born, Citizen | 4,730 (98.0%) | 97 (2.0%) |
| Foreign Born, not a Citizen | 2,070 (89.5%) | 243 (10.5%) |
Health Insurance Coverage by Household Income in Van Wert County
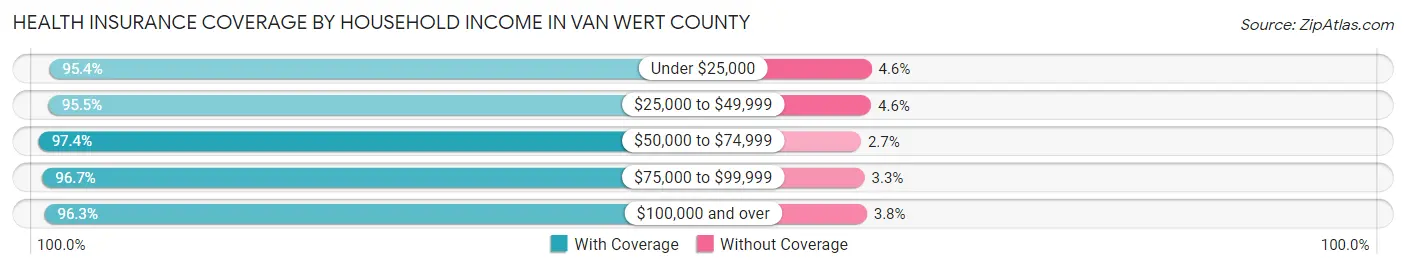
| Household Income | With Coverage | Without Coverage |
| Under $25,000 | 2,309 (95.4%) | 112 (4.6%) |
| $25,000 to $49,999 | 4,764 (95.5%) | 227 (4.5%) |
| $50,000 to $74,999 | 5,263 (97.4%) | 143 (2.6%) |
| $75,000 to $99,999 | 5,183 (96.7%) | 179 (3.3%) |
| $100,000 and over | 9,923 (96.3%) | 387 (3.7%) |
Public vs Private Health Insurance Coverage by Age in Van Wert County
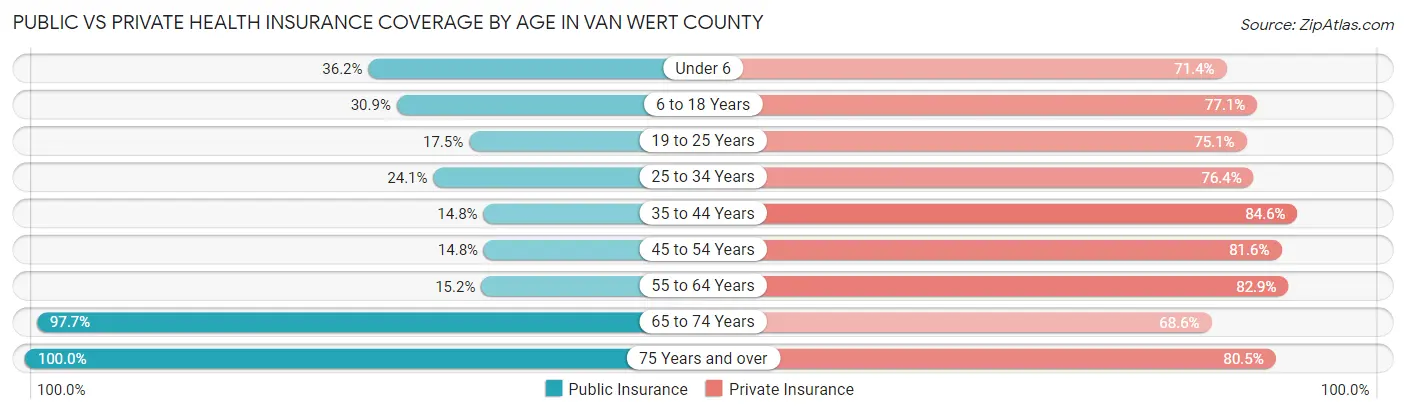
| Age Bracket | Public Insurance | Private Insurance |
| Under 6 | 794 (36.2%) | 1,566 (71.4%) |
| 6 to 18 Years | 1,493 (30.9%) | 3,721 (77.1%) |
| 19 to 25 Years | 405 (17.5%) | 1,737 (75.1%) |
| 25 to 34 Years | 704 (24.1%) | 2,230 (76.4%) |
| 35 to 44 Years | 506 (14.8%) | 2,883 (84.6%) |
| 45 to 54 Years | 524 (14.7%) | 2,897 (81.6%) |
| 55 to 64 Years | 611 (15.2%) | 3,323 (82.9%) |
| 65 to 74 Years | 3,081 (97.7%) | 2,163 (68.6%) |
| 75 Years and over | 2,158 (100.0%) | 1,738 (80.5%) |
| Total | 10,276 (36.0%) | 22,258 (78.0%) |
Disability Status by Sex by Age in Van Wert County
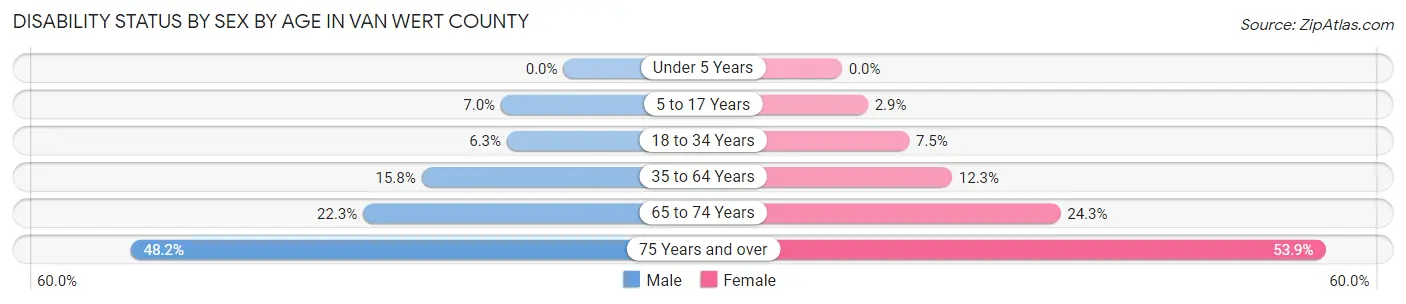
| Age Bracket | Male | Female |
| Under 5 Years | 0 (0.0%) | 0 (0.0%) |
| 5 to 17 Years | 172 (7.0%) | 69 (2.9%) |
| 18 to 34 Years | 177 (6.3%) | 207 (7.5%) |
| 35 to 64 Years | 869 (15.8%) | 670 (12.3%) |
| 65 to 74 Years | 343 (22.3%) | 393 (24.3%) |
| 75 Years and over | 440 (48.2%) | 671 (53.8%) |
Disability Class by Sex by Age in Van Wert County
Disability Class: Hearing Difficulty
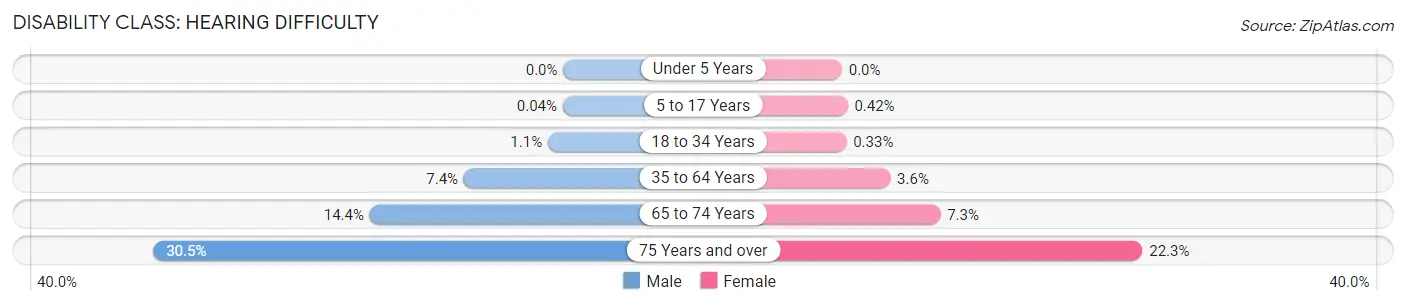
| Age Bracket | Male | Female |
| Under 5 Years | 0 (0.0%) | 0 (0.0%) |
| 5 to 17 Years | 1 (0.0%) | 10 (0.4%) |
| 18 to 34 Years | 32 (1.1%) | 9 (0.3%) |
| 35 to 64 Years | 406 (7.4%) | 196 (3.6%) |
| 65 to 74 Years | 221 (14.4%) | 118 (7.3%) |
| 75 Years and over | 278 (30.4%) | 278 (22.3%) |
Disability Class: Vision Difficulty
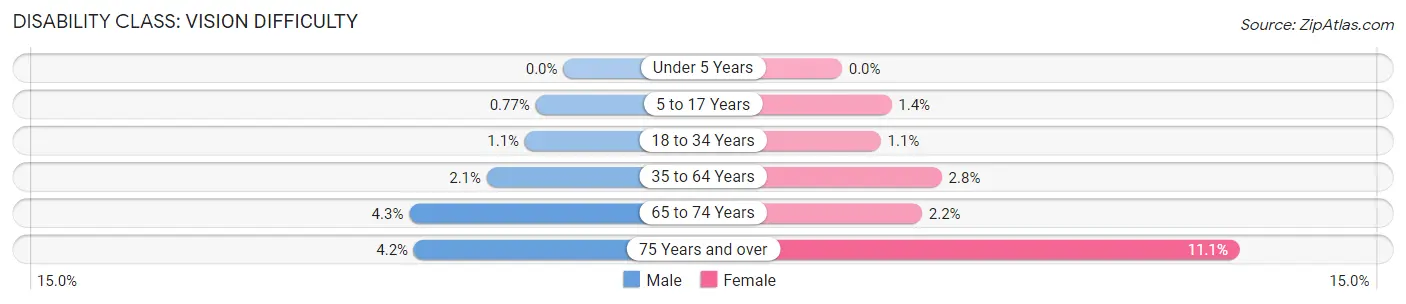
| Age Bracket | Male | Female |
| Under 5 Years | 0 (0.0%) | 0 (0.0%) |
| 5 to 17 Years | 19 (0.8%) | 33 (1.4%) |
| 18 to 34 Years | 30 (1.1%) | 30 (1.1%) |
| 35 to 64 Years | 117 (2.1%) | 152 (2.8%) |
| 65 to 74 Years | 66 (4.3%) | 36 (2.2%) |
| 75 Years and over | 38 (4.2%) | 138 (11.1%) |
Disability Class: Cognitive Difficulty
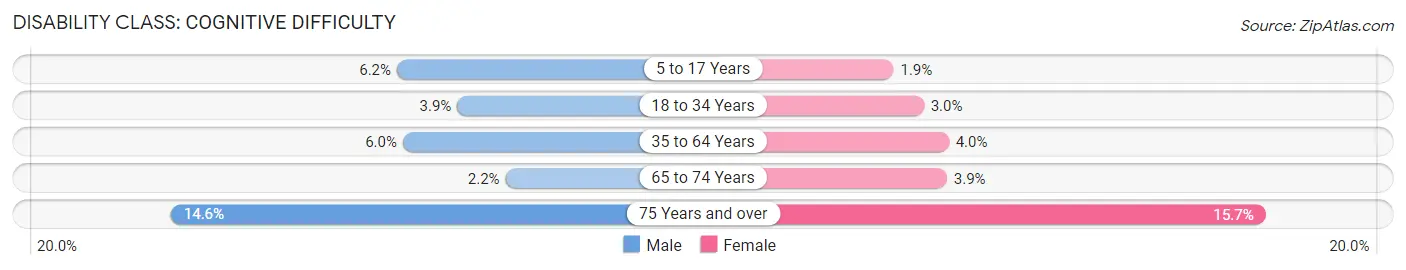
| Age Bracket | Male | Female |
| 5 to 17 Years | 153 (6.2%) | 46 (1.9%) |
| 18 to 34 Years | 111 (3.9%) | 84 (3.0%) |
| 35 to 64 Years | 328 (6.0%) | 217 (4.0%) |
| 65 to 74 Years | 33 (2.1%) | 63 (3.9%) |
| 75 Years and over | 133 (14.6%) | 196 (15.7%) |
Disability Class: Ambulatory Difficulty
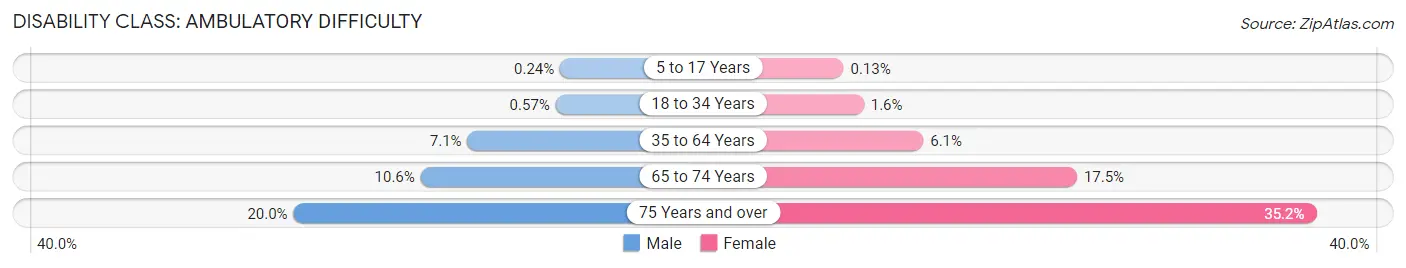
| Age Bracket | Male | Female |
| 5 to 17 Years | 6 (0.2%) | 3 (0.1%) |
| 18 to 34 Years | 16 (0.6%) | 45 (1.6%) |
| 35 to 64 Years | 392 (7.1%) | 331 (6.0%) |
| 65 to 74 Years | 163 (10.6%) | 282 (17.5%) |
| 75 Years and over | 183 (20.0%) | 439 (35.2%) |
Disability Class: Self-Care Difficulty
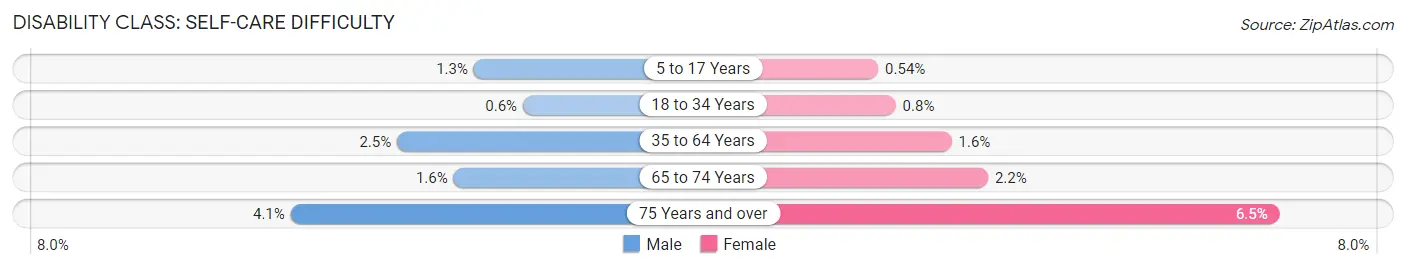
| Age Bracket | Male | Female |
| 5 to 17 Years | 33 (1.3%) | 13 (0.5%) |
| 18 to 34 Years | 17 (0.6%) | 22 (0.8%) |
| 35 to 64 Years | 136 (2.5%) | 89 (1.6%) |
| 65 to 74 Years | 25 (1.6%) | 35 (2.2%) |
| 75 Years and over | 37 (4.1%) | 81 (6.5%) |
Technology Access in Van Wert County
Computing Device Access in Van Wert County
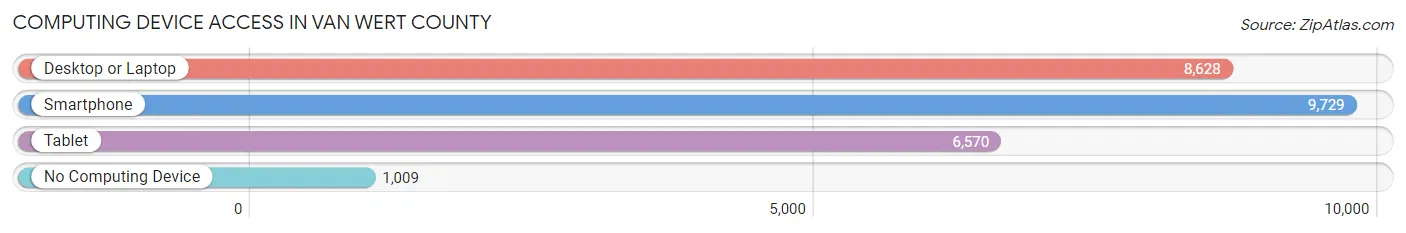
| Device Type | # Households | % Households |
| Desktop or Laptop | 8,628 | 74.0% |
| Smartphone | 9,729 | 83.4% |
| Tablet | 6,570 | 56.3% |
| No Computing Device | 1,009 | 8.6% |
| Total | 11,666 | 100.0% |
Internet Access in Van Wert County
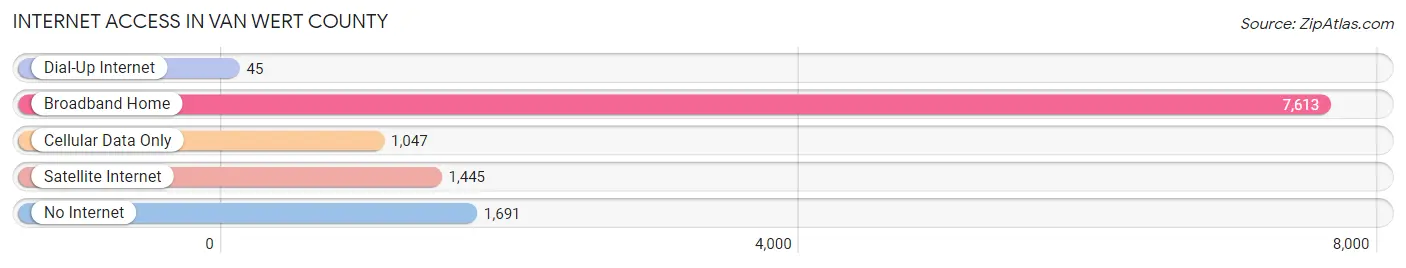
| Internet Type | # Households | % Households |
| Dial-Up Internet | 45 | 0.4% |
| Broadband Home | 7,613 | 65.3% |
| Cellular Data Only | 1,047 | 9.0% |
| Satellite Internet | 1,445 | 12.4% |
| No Internet | 1,691 | 14.5% |
| Total | 11,666 | 100.0% |
Van Wert County Summary
Van Wert County is located in the northwestern part of the state of Ohio, and is bordered by the states of Indiana and Michigan. It is part of the Great Lakes region and is part of the Toledo Metropolitan Statistical Area. The county seat is Van Wert, and the county has a population of 28,744 as of the 2010 census.
History
Van Wert County was formed in 1820 from parts of Allen and Mercer counties. It was named after Isaac Van Wart, a Revolutionary War hero who was one of the captors of Major John Andre. The county was originally part of the Great Black Swamp, which was drained in the late 19th century.
The first settlers in the area were of German and Dutch descent, and the county was largely agricultural. The first railroad line was built in 1851, and the county was connected to the rest of the state by the Toledo and Ohio Central Railroad in 1871.
Geography
Van Wert County is located in the northwestern part of Ohio, and is bordered by the states of Indiana and Michigan. It is part of the Great Lakes region and is part of the Toledo Metropolitan Statistical Area. The county has a total area of 437 square miles, of which 434 square miles is land and 3 square miles is water. The county is mostly flat, with some rolling hills in the northern part. The highest point in the county is 1,093 feet above sea level.
The county is drained by the Auglaize River, which flows through the county from north to south. The county is also home to several small lakes, including Grand Lake St. Marys, which is the largest lake in the state.
Economy
Van Wert County has a diverse economy, with a mix of manufacturing, agriculture, and services. The county is home to several large employers, including the Van Wert County Hospital, the Van Wert County Board of Education, and the Van Wert County Sheriff's Office.
The county is also home to several manufacturing companies, including the Van Wert County Manufacturing Company, which produces automotive parts, and the Van Wert County Tool and Die Company, which produces tools and dies.
Agriculture is also an important part of the economy, with corn, soybeans, and wheat being the main crops. The county is also home to several dairy farms, as well as beef and pork producers.
Demographics
As of the 2010 census, Van Wert County had a population of 28,744. The population was spread out, with 24.3% under the age of 18, 8.2% from 18 to 24, 25.7% from 25 to 44, 24.7% from 45 to 64, and 17.1% who were 65 years of age or older. The median age was 38.4 years.
The racial makeup of the county was 95.2% White, 0.7% African American, 0.3% Native American, 0.4% Asian, 0.1% Pacific Islander, 1.7% from other races, and 1.6% from two or more races. Hispanic or Latino of any race were 3.3% of the population.
The median income for a household in the county was $45,837, and the median income for a family was $54,837. The per capita income for the county was $21,837. About 8.7% of families and 11.2% of the population were below the poverty line, including 15.2% of those under age 18 and 8.2% of those age 65 or over.
Common Questions
What is Per Capita Income in Van Wert County?
Per Capita income in Van Wert County is $31,831.
What is the Median Family Income in Van Wert County?
Median Family Income in Van Wert County is $78,597.
What is the Median Household income in Van Wert County?
Median Household Income in Van Wert County is $64,841.
What is Income or Wage Gap in Van Wert County?
Income or Wage Gap in Van Wert County is 30.3%.
Women in Van Wert County earn 69.7 cents for every dollar earned by a man.
What is Family Income Deficit in Van Wert County?
Family Income Deficit in Van Wert County is $10,478.
Families that are below poverty line in Van Wert County earn $10,478 less on average than the poverty threshold level.
What is Inequality or Gini Index in Van Wert County?
Inequality or Gini Index in Van Wert County is 0.37.
What is the Total Population of Van Wert County?
Total Population of Van Wert County is 28,833.
What is the Total Male Population of Van Wert County?
Total Male Population of Van Wert County is 14,236.
What is the Total Female Population of Van Wert County?
Total Female Population of Van Wert County is 14,597.
What is the Ratio of Males per 100 Females in Van Wert County?
There are 97.53 Males per 100 Females in Van Wert County.
What is the Ratio of Females per 100 Males in Van Wert County?
There are 102.54 Females per 100 Males in Van Wert County.
What is the Median Population Age in Van Wert County?
Median Population Age in Van Wert County is 41.3 Years.
What is the Average Family Size in Van Wert County
Average Family Size in Van Wert County is 2.9 People.
What is the Average Household Size in Van Wert County
Average Household Size in Van Wert County is 2.4 People.
How Large is the Labor Force in Van Wert County?
There are 14,826 People in the Labor Forcein in Van Wert County.
What is the Percentage of People in the Labor Force in Van Wert County?
64.2% of People are in the Labor Force in Van Wert County.
What is the Unemployment Rate in Van Wert County?
Unemployment Rate in Van Wert County is 3.8%.