Sandusky County, OH Map & Demographics
Sandusky County Map
Sandusky County Overview
$32,788
PER CAPITA INCOME
$80,692
AVG FAMILY INCOME
$60,814
AVG HOUSEHOLD INCOME
32.7%
WAGE / INCOME GAP [ % ]
67.3¢/ $1
WAGE / INCOME GAP [ $ ]
$11,069
FAMILY INCOME DEFICIT
0.44
INEQUALITY / GINI INDEX
58,885
TOTAL POPULATION
29,370
MALE POPULATION
29,515
FEMALE POPULATION
99.51
MALES / 100 FEMALES
100.49
FEMALES / 100 MALES
42.3
MEDIAN AGE
3.0
AVG FAMILY SIZE
2.4
AVG HOUSEHOLD SIZE
29,135
LABOR FORCE [ PEOPLE ]
60.9%
PERCENT IN LABOR FORCE
4.8%
UNEMPLOYMENT RATE
Income in Sandusky County
Income Overview in Sandusky County
Per Capita Income in Sandusky County is $32,788, while median incomes of families and households are $80,692 and $60,814 respectively.
| Characteristic | Number | Measure |
| Per Capita Income | 58,885 | $32,788 |
| Median Family Income | 15,562 | $80,692 |
| Mean Family Income | 15,562 | $96,193 |
| Median Household Income | 24,038 | $60,814 |
| Mean Household Income | 24,038 | $79,320 |
| Income Deficit | 15,562 | $11,069 |
| Wage / Income Gap (%) | 58,885 | 32.73% |
| Wage / Income Gap ($) | 58,885 | 67.27¢ per $1 |
| Gini / Inequality Index | 58,885 | 0.44 |
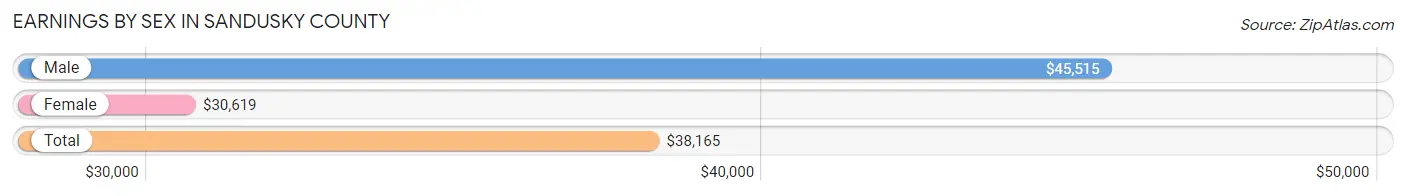
Earnings by Sex in Sandusky County
Average Earnings in Sandusky County are $38,165, $45,515 for men and $30,619 for women, a difference of 32.7%.
| Sex | Number | Average Earnings |
| Male | 16,692 (54.0%) | $45,515 |
| Female | 14,222 (46.0%) | $30,619 |
| Total | 30,914 (100.0%) | $38,165 |
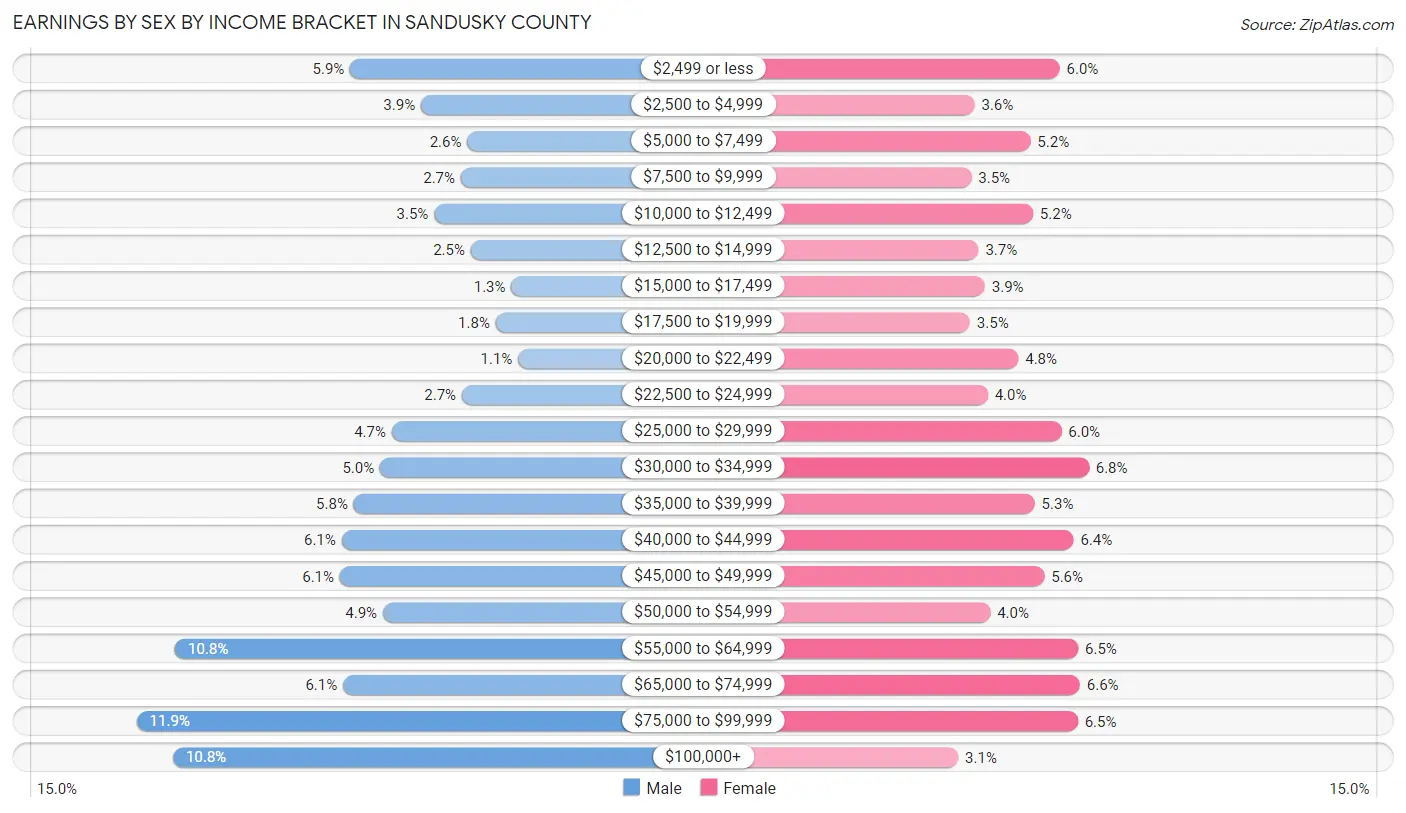
Earnings by Sex by Income Bracket in Sandusky County
The most common earnings brackets in Sandusky County are $75,000 to $99,999 for men (1,978 | 11.8%) and $30,000 to $34,999 for women (967 | 6.8%).
| Income | Male | Female |
| $2,499 or less | 976 (5.9%) | 850 (6.0%) |
| $2,500 to $4,999 | 645 (3.9%) | 510 (3.6%) |
| $5,000 to $7,499 | 428 (2.6%) | 734 (5.2%) |
| $7,500 to $9,999 | 458 (2.7%) | 498 (3.5%) |
| $10,000 to $12,499 | 582 (3.5%) | 744 (5.2%) |
| $12,500 to $14,999 | 411 (2.5%) | 526 (3.7%) |
| $15,000 to $17,499 | 221 (1.3%) | 552 (3.9%) |
| $17,500 to $19,999 | 293 (1.8%) | 492 (3.5%) |
| $20,000 to $22,499 | 189 (1.1%) | 686 (4.8%) |
| $22,500 to $24,999 | 453 (2.7%) | 563 (4.0%) |
| $25,000 to $29,999 | 782 (4.7%) | 857 (6.0%) |
| $30,000 to $34,999 | 837 (5.0%) | 967 (6.8%) |
| $35,000 to $39,999 | 960 (5.8%) | 751 (5.3%) |
| $40,000 to $44,999 | 1,017 (6.1%) | 906 (6.4%) |
| $45,000 to $49,999 | 1,025 (6.1%) | 790 (5.6%) |
| $50,000 to $54,999 | 823 (4.9%) | 573 (4.0%) |
| $55,000 to $64,999 | 1,797 (10.8%) | 924 (6.5%) |
| $65,000 to $74,999 | 1,010 (6.0%) | 931 (6.6%) |
| $75,000 to $99,999 | 1,978 (11.8%) | 923 (6.5%) |
| $100,000+ | 1,807 (10.8%) | 445 (3.1%) |
| Total | 16,692 (100.0%) | 14,222 (100.0%) |
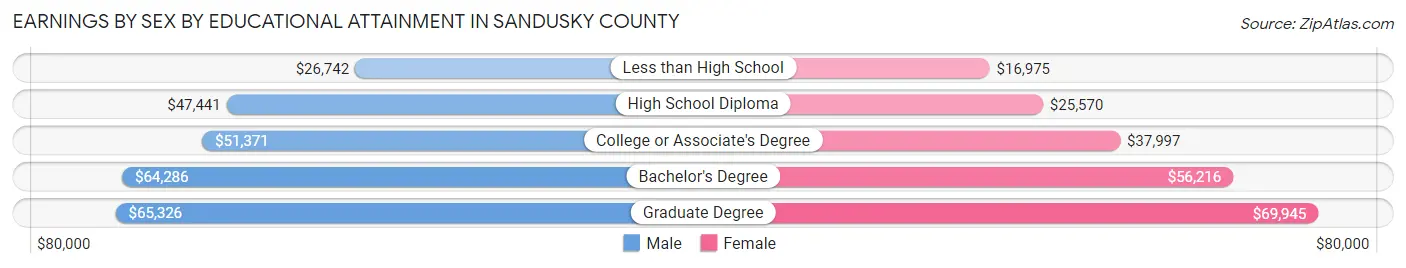
Earnings by Sex by Educational Attainment in Sandusky County
Average earnings in Sandusky County are $50,428 for men and $35,446 for women, a difference of 29.7%. Men with an educational attainment of graduate degree enjoy the highest average annual earnings of $65,326, while those with less than high school education earn the least with $26,742. Women with an educational attainment of graduate degree earn the most with the average annual earnings of $69,945, while those with less than high school education have the smallest earnings of $16,975.
| Educational Attainment | Male Income | Female Income |
| Less than High School | $26,742 | $16,975 |
| High School Diploma | $47,441 | $25,570 |
| College or Associate's Degree | $51,371 | $37,997 |
| Bachelor's Degree | $64,286 | $56,216 |
| Graduate Degree | $65,326 | $69,945 |
| Total | $50,428 | $35,446 |
Family Income in Sandusky County
Family Income Brackets in Sandusky County
According to the Sandusky County family income data, there are 3,424 families falling into the $100,000 to $149,999 income range, which is the most common income bracket and makes up 22.0% of all families. Conversely, the $10,000 to $14,999 income bracket is the least frequent group with only 311 families (2.0%) belonging to this category.
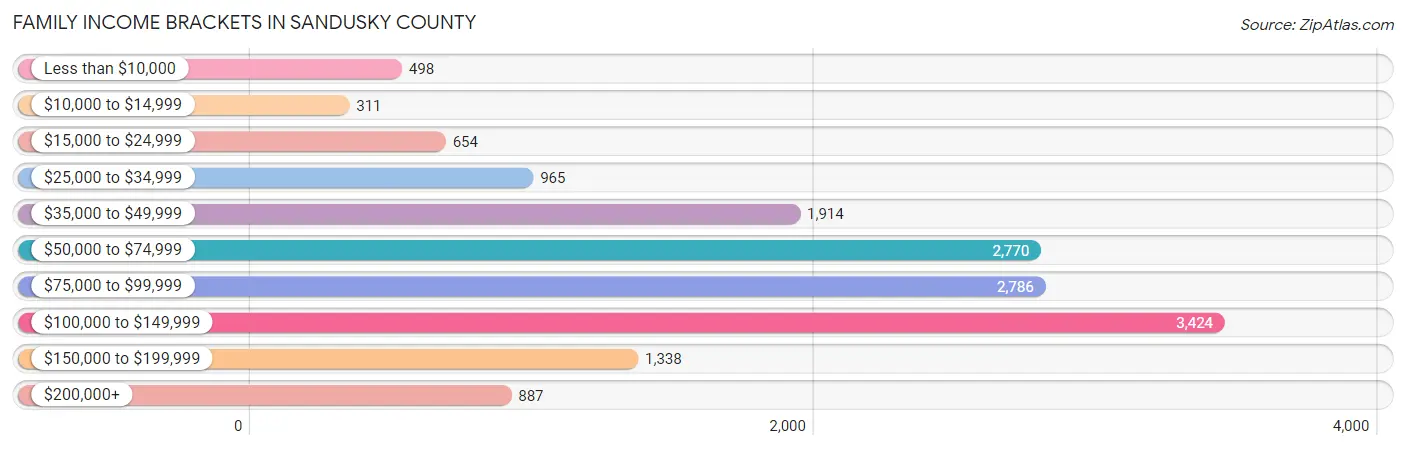
| Income Bracket | # Families | % Families |
| Less than $10,000 | 498 | 3.2% |
| $10,000 to $14,999 | 311 | 2.0% |
| $15,000 to $24,999 | 654 | 4.2% |
| $25,000 to $34,999 | 965 | 6.2% |
| $35,000 to $49,999 | 1,914 | 12.3% |
| $50,000 to $74,999 | 2,770 | 17.8% |
| $75,000 to $99,999 | 2,786 | 17.9% |
| $100,000 to $149,999 | 3,424 | 22.0% |
| $150,000 to $199,999 | 1,338 | 8.6% |
| $200,000+ | 887 | 5.7% |
Family Income by Famaliy Size in Sandusky County
7+ person families (124 | 0.8%) account for the highest median family income in Sandusky County with $114,318 per family, while 2-person families (8,440 | 54.2%) have the highest median income of $34,457 per family member.
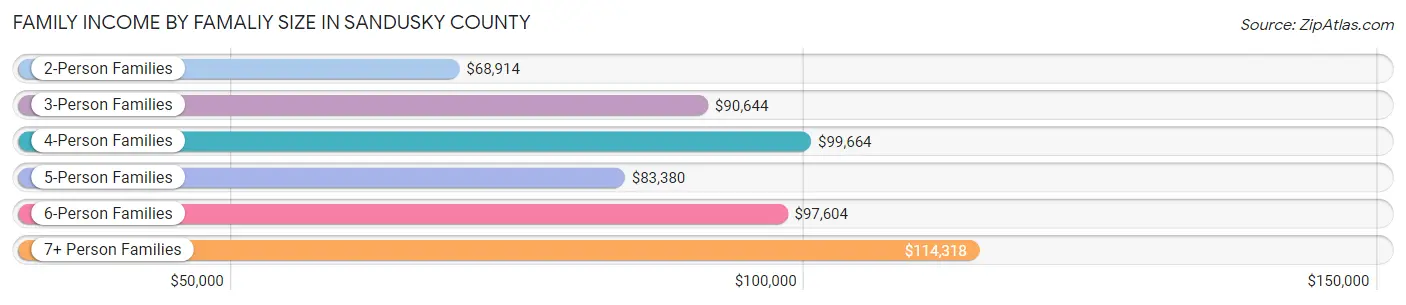
| Income Bracket | # Families | Median Income |
| 2-Person Families | 8,440 (54.2%) | $68,914 |
| 3-Person Families | 2,643 (17.0%) | $90,644 |
| 4-Person Families | 2,712 (17.4%) | $99,664 |
| 5-Person Families | 1,268 (8.2%) | $83,380 |
| 6-Person Families | 375 (2.4%) | $97,604 |
| 7+ Person Families | 124 (0.8%) | $114,318 |
| Total | 15,562 (100.0%) | $80,692 |
Family Income by Number of Earners in Sandusky County
The median family income in Sandusky County is $80,692, with families comprising 3+ earners (1,519) having the highest median family income of $127,525, while families with no earners (2,404) have the lowest median family income of $49,043, accounting for 9.8% and 15.4% of families, respectively.
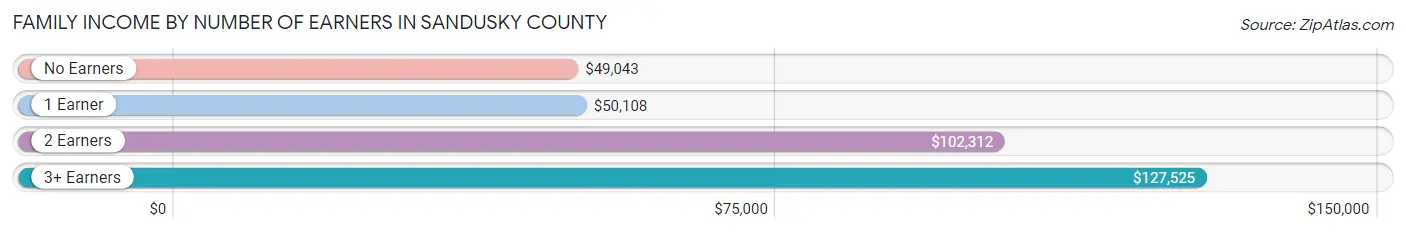
| Number of Earners | # Families | Median Income |
| No Earners | 2,404 (15.4%) | $49,043 |
| 1 Earner | 5,076 (32.6%) | $50,108 |
| 2 Earners | 6,563 (42.2%) | $102,312 |
| 3+ Earners | 1,519 (9.8%) | $127,525 |
| Total | 15,562 (100.0%) | $80,692 |
Household Income in Sandusky County
Household Income Brackets in Sandusky County
With 4,279 households falling in the category, the $50,000 to $74,999 income range is the most frequent in Sandusky County, accounting for 17.8% of all households. In contrast, only 962 households (4.0%) fall into the $200,000+ income bracket, making it the least populous group.
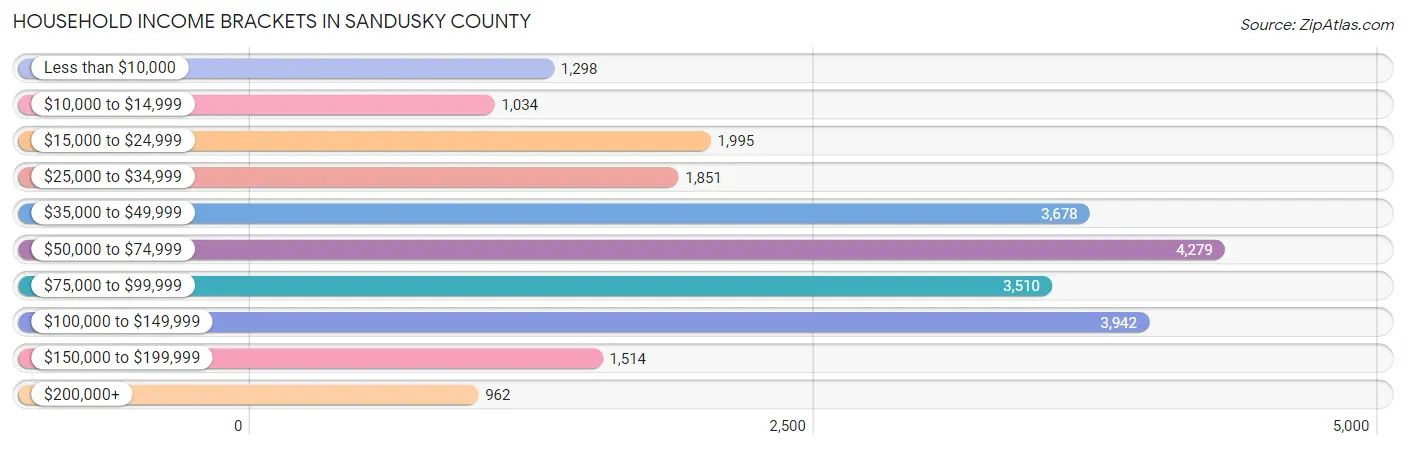
| Income Bracket | # Households | % Households |
| Less than $10,000 | 1,298 | 5.4% |
| $10,000 to $14,999 | 1,034 | 4.3% |
| $15,000 to $24,999 | 1,995 | 8.3% |
| $25,000 to $34,999 | 1,851 | 7.7% |
| $35,000 to $49,999 | 3,678 | 15.3% |
| $50,000 to $74,999 | 4,279 | 17.8% |
| $75,000 to $99,999 | 3,510 | 14.6% |
| $100,000 to $149,999 | 3,942 | 16.4% |
| $150,000 to $199,999 | 1,514 | 6.3% |
| $200,000+ | 962 | 4.0% |
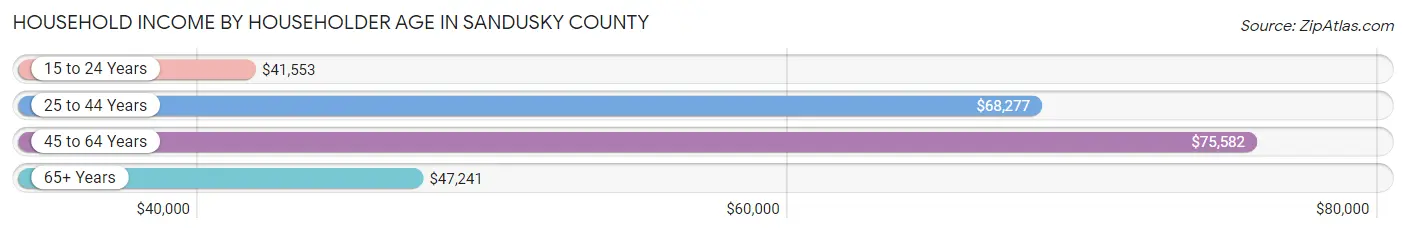
Household Income by Householder Age in Sandusky County
The median household income in Sandusky County is $60,814, with the highest median household income of $75,582 found in the 45 to 64 years age bracket for the primary householder. A total of 9,553 households (39.7%) fall into this category. Meanwhile, the 15 to 24 years age bracket for the primary householder has the lowest median household income of $41,553, with 819 households (3.4%) in this group.
| Income Bracket | # Households | Median Income |
| 15 to 24 Years | 819 (3.4%) | $41,553 |
| 25 to 44 Years | 6,809 (28.3%) | $68,277 |
| 45 to 64 Years | 9,553 (39.7%) | $75,582 |
| 65+ Years | 6,857 (28.5%) | $47,241 |
| Total | 24,038 (100.0%) | $60,814 |
Poverty in Sandusky County
Income Below Poverty by Sex and Age in Sandusky County
With 11.6% poverty level for males and 14.3% for females among the residents of Sandusky County, under 5 year old males and 25 to 34 year old females are the most vulnerable to poverty, with 496 males (30.1%) and 873 females (25.4%) in their respective age groups living below the poverty level.
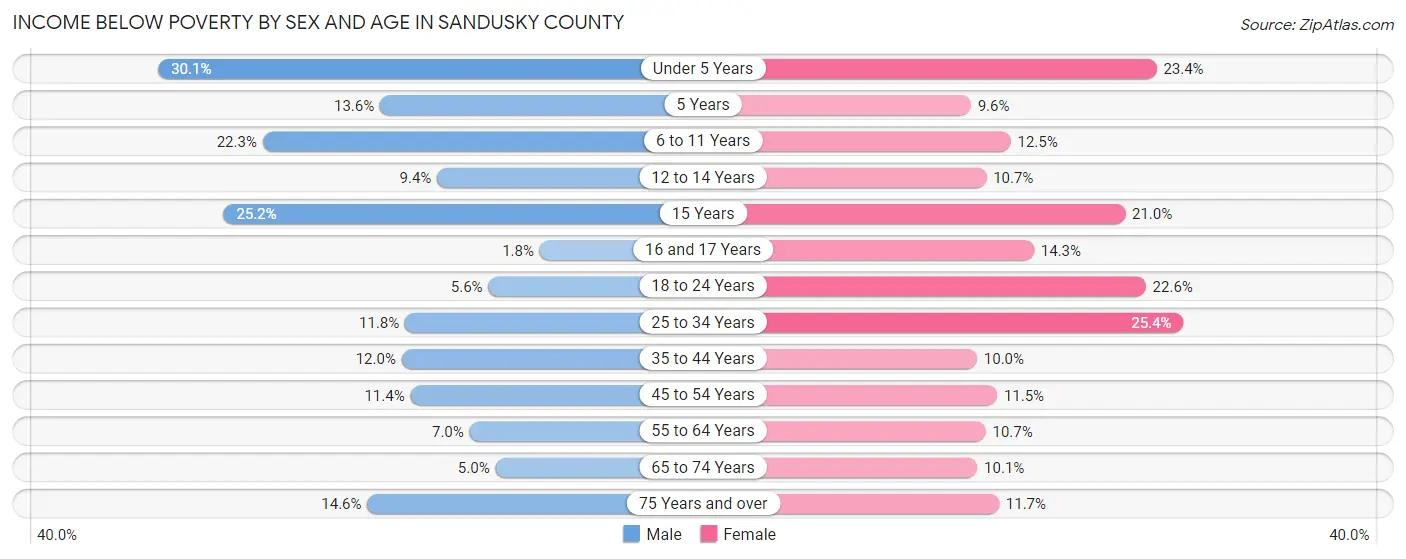
| Age Bracket | Male | Female |
| Under 5 Years | 496 (30.1%) | 348 (23.4%) |
| 5 Years | 26 (13.6%) | 40 (9.6%) |
| 6 to 11 Years | 472 (22.3%) | 240 (12.5%) |
| 12 to 14 Years | 118 (9.4%) | 134 (10.7%) |
| 15 Years | 106 (25.2%) | 45 (21.0%) |
| 16 and 17 Years | 14 (1.8%) | 141 (14.3%) |
| 18 to 24 Years | 126 (5.6%) | 496 (22.6%) |
| 25 to 34 Years | 421 (11.7%) | 873 (25.4%) |
| 35 to 44 Years | 418 (12.0%) | 342 (10.0%) |
| 45 to 54 Years | 438 (11.4%) | 413 (11.5%) |
| 55 to 64 Years | 296 (7.0%) | 454 (10.7%) |
| 65 to 74 Years | 164 (5.0%) | 339 (10.1%) |
| 75 Years and over | 255 (14.5%) | 283 (11.7%) |
| Total | 3,350 (11.6%) | 4,148 (14.3%) |
Income Above Poverty by Sex and Age in Sandusky County
According to the poverty statistics in Sandusky County, males aged 16 and 17 years and females aged 5 years are the age groups that are most secure financially, with 98.3% of males and 90.4% of females in these age groups living above the poverty line.
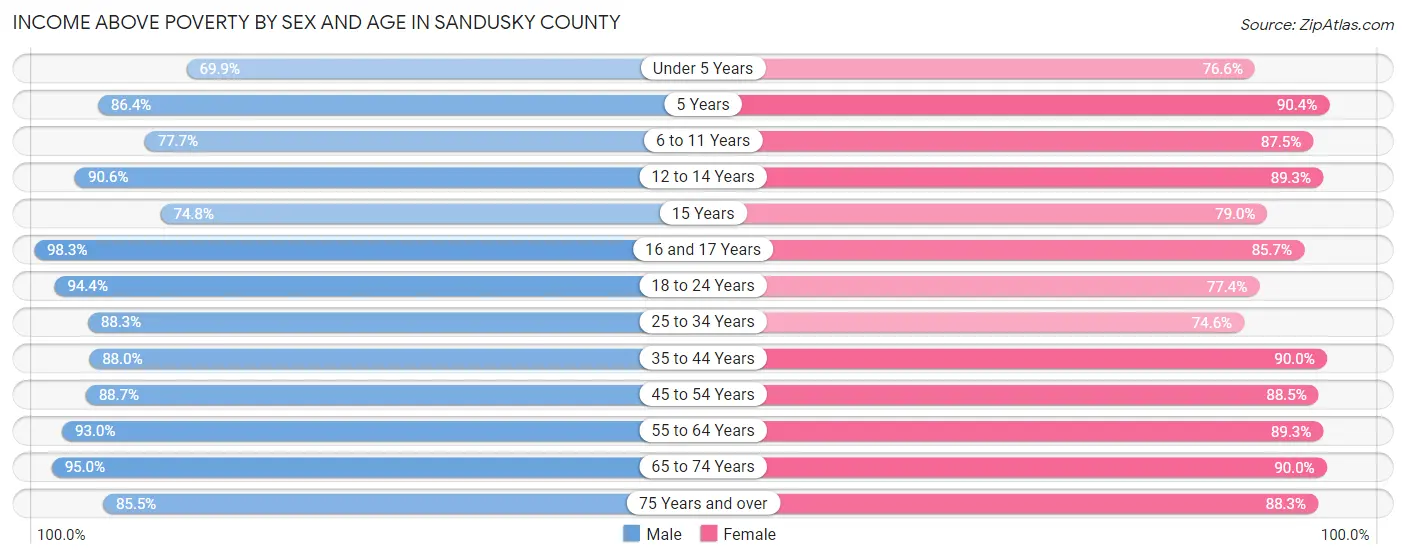
| Age Bracket | Male | Female |
| Under 5 Years | 1,153 (69.9%) | 1,142 (76.6%) |
| 5 Years | 165 (86.4%) | 378 (90.4%) |
| 6 to 11 Years | 1,643 (77.7%) | 1,676 (87.5%) |
| 12 to 14 Years | 1,142 (90.6%) | 1,116 (89.3%) |
| 15 Years | 314 (74.8%) | 169 (79.0%) |
| 16 and 17 Years | 787 (98.3%) | 848 (85.7%) |
| 18 to 24 Years | 2,139 (94.4%) | 1,703 (77.4%) |
| 25 to 34 Years | 3,163 (88.2%) | 2,570 (74.6%) |
| 35 to 44 Years | 3,066 (88.0%) | 3,069 (90.0%) |
| 45 to 54 Years | 3,421 (88.6%) | 3,173 (88.5%) |
| 55 to 64 Years | 3,959 (93.0%) | 3,800 (89.3%) |
| 65 to 74 Years | 3,093 (95.0%) | 3,035 (89.9%) |
| 75 Years and over | 1,497 (85.5%) | 2,145 (88.3%) |
| Total | 25,542 (88.4%) | 24,824 (85.7%) |
Income Below Poverty Among Married-Couple Families in Sandusky County
The poverty statistics for married-couple families in Sandusky County show that 3.9% or 448 of the total 11,516 families live below the poverty line. Families with 3 or 4 children have the highest poverty rate of 7.6%, comprising of 86 families. On the other hand, families with no children have the lowest poverty rate of 2.6%, which includes 194 families.
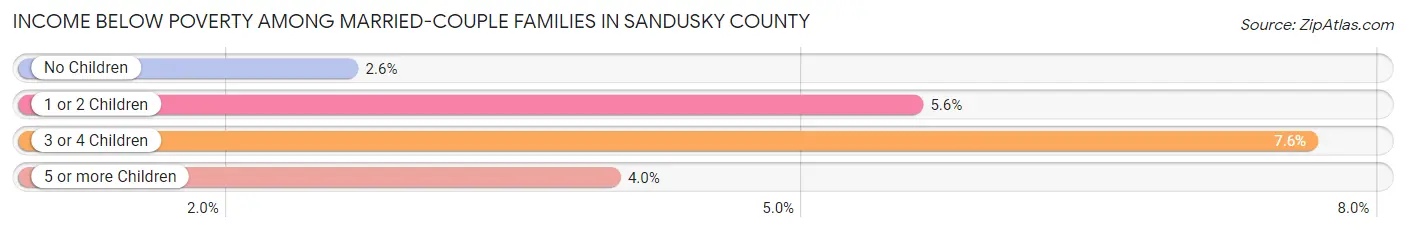
| Children | Above Poverty | Below Poverty |
| No Children | 7,180 (97.4%) | 194 (2.6%) |
| 1 or 2 Children | 2,824 (94.4%) | 167 (5.6%) |
| 3 or 4 Children | 1,040 (92.4%) | 86 (7.6%) |
| 5 or more Children | 24 (96.0%) | 1 (4.0%) |
| Total | 11,068 (96.1%) | 448 (3.9%) |
Income Below Poverty Among Single-Parent Households in Sandusky County
According to the poverty data in Sandusky County, 7.9% or 114 single-father households and 30.9% or 801 single-mother households are living below the poverty line. Among single-father households, those with 1 or 2 children have the highest poverty rate, with 114 households (13.2%) experiencing poverty. Likewise, among single-mother households, those with 3 or 4 children have the highest poverty rate, with 328 households (79.6%) falling below the poverty line.
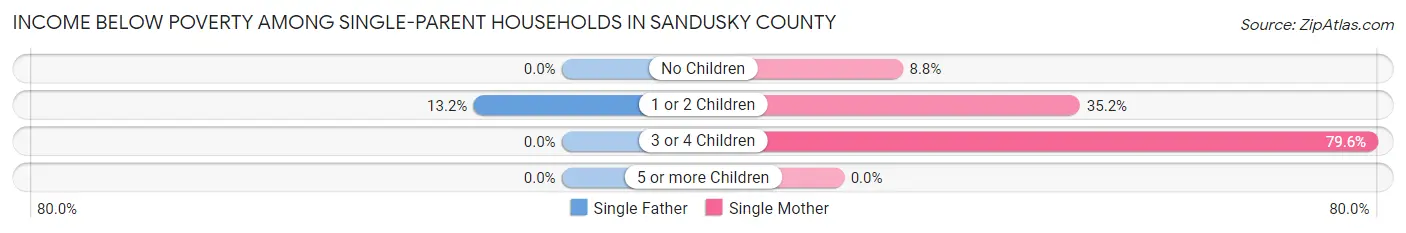
| Children | Single Father | Single Mother |
| No Children | 0 (0.0%) | 96 (8.8%) |
| 1 or 2 Children | 114 (13.2%) | 377 (35.2%) |
| 3 or 4 Children | 0 (0.0%) | 328 (79.6%) |
| 5 or more Children | 0 (0.0%) | 0 (0.0%) |
| Total | 114 (7.9%) | 801 (30.9%) |
Income Below Poverty Among Married-Couple vs Single-Parent Households in Sandusky County
The poverty data for Sandusky County shows that 448 of the married-couple family households (3.9%) and 915 of the single-parent households (22.6%) are living below the poverty level. Within the married-couple family households, those with 3 or 4 children have the highest poverty rate, with 86 households (7.6%) falling below the poverty line. Among the single-parent households, those with 3 or 4 children have the highest poverty rate, with 328 household (66.4%) living below poverty.
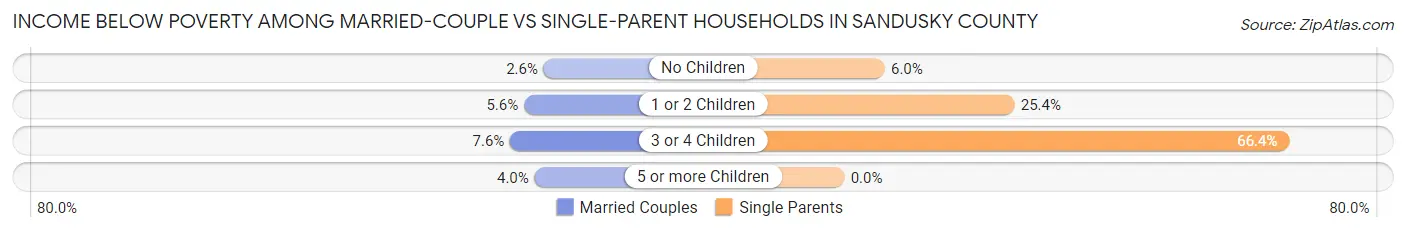
| Children | Married-Couple Families | Single-Parent Households |
| No Children | 194 (2.6%) | 96 (6.0%) |
| 1 or 2 Children | 167 (5.6%) | 491 (25.4%) |
| 3 or 4 Children | 86 (7.6%) | 328 (66.4%) |
| 5 or more Children | 1 (4.0%) | 0 (0.0%) |
| Total | 448 (3.9%) | 915 (22.6%) |
Race in Sandusky County
The most populous races in Sandusky County are White / Caucasian (51,345 | 87.2%), Hispanic or Latino (6,210 | 10.5%), and Two or more Races (3,601 | 6.1%).
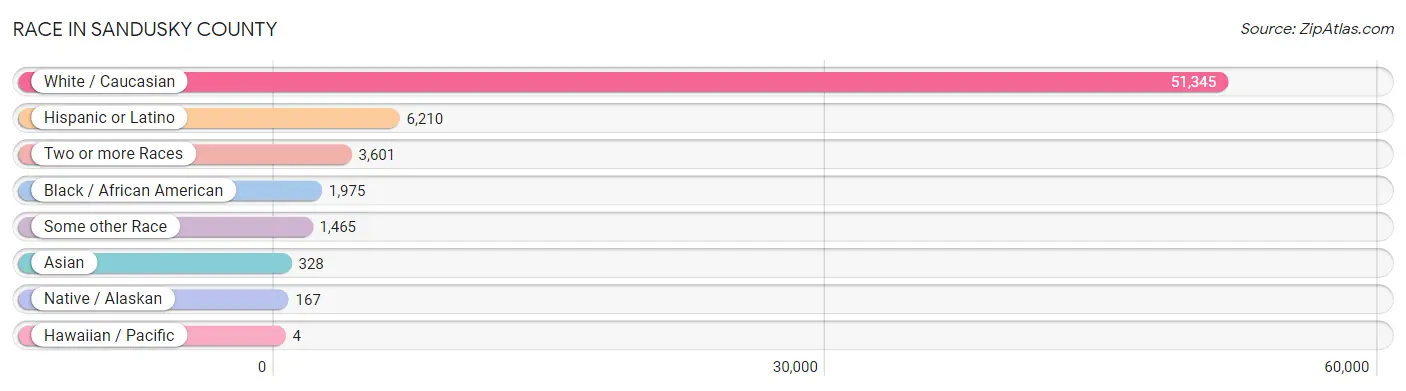
| Race | # Population | % Population |
| Asian | 328 | 0.6% |
| Black / African American | 1,975 | 3.4% |
| Hawaiian / Pacific | 4 | 0.0% |
| Hispanic or Latino | 6,210 | 10.5% |
| Native / Alaskan | 167 | 0.3% |
| White / Caucasian | 51,345 | 87.2% |
| Two or more Races | 3,601 | 6.1% |
| Some other Race | 1,465 | 2.5% |
| Total | 58,885 | 100.0% |
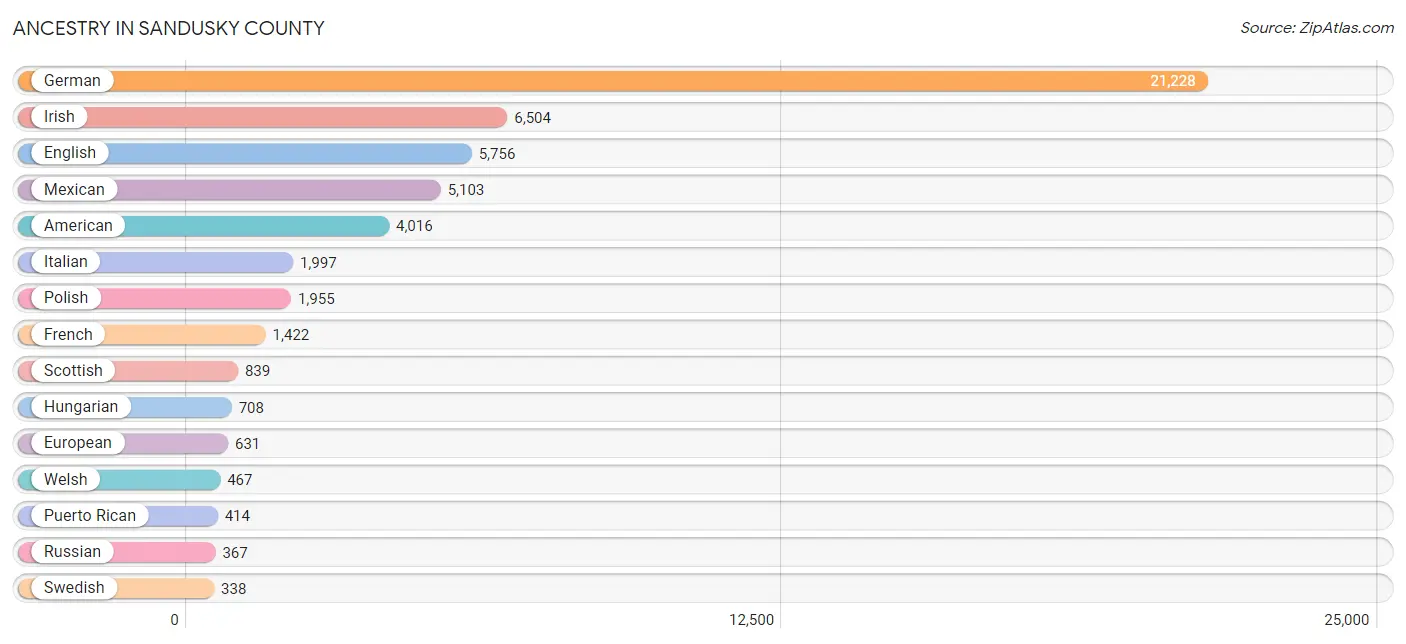
Ancestry in Sandusky County
The most populous ancestries reported in Sandusky County are German (21,228 | 36.0%), Irish (6,504 | 11.1%), English (5,756 | 9.8%), Mexican (5,103 | 8.7%), and American (4,016 | 6.8%), together accounting for 72.4% of all Sandusky County residents.
| Ancestry | # Population | % Population |
| African | 272 | 0.5% |
| Alaska Native | 9 | 0.0% |
| American | 4,016 | 6.8% |
| Apache | 14 | 0.0% |
| Arab | 90 | 0.2% |
| Argentinean | 74 | 0.1% |
| Austrian | 78 | 0.1% |
| Barbadian | 29 | 0.1% |
| Belgian | 34 | 0.1% |
| Bhutanese | 80 | 0.1% |
| Blackfeet | 11 | 0.0% |
| Bolivian | 8 | 0.0% |
| British | 127 | 0.2% |
| Bulgarian | 25 | 0.0% |
| Burmese | 92 | 0.2% |
| Canadian | 13 | 0.0% |
| Celtic | 38 | 0.1% |
| Central American | 26 | 0.0% |
| Cherokee | 221 | 0.4% |
| Croatian | 5 | 0.0% |
| Cuban | 45 | 0.1% |
| Cypriot | 30 | 0.1% |
| Czech | 110 | 0.2% |
| Czechoslovakian | 72 | 0.1% |
| Danish | 41 | 0.1% |
| Dominican | 19 | 0.0% |
| Dutch | 307 | 0.5% |
| Eastern European | 102 | 0.2% |
| English | 5,756 | 9.8% |
| European | 631 | 1.1% |
| Finnish | 12 | 0.0% |
| French | 1,422 | 2.4% |
| French American Indian | 13 | 0.0% |
| French Canadian | 102 | 0.2% |
| German | 21,228 | 36.0% |
| Greek | 109 | 0.2% |
| Guatemalan | 25 | 0.0% |
| Hungarian | 708 | 1.2% |
| Indian (Asian) | 17 | 0.0% |
| Irish | 6,504 | 11.1% |
| Italian | 1,997 | 3.4% |
| Japanese | 31 | 0.1% |
| Korean | 54 | 0.1% |
| Lebanese | 84 | 0.1% |
| Lithuanian | 28 | 0.1% |
| Mexican | 5,103 | 8.7% |
| Native Hawaiian | 48 | 0.1% |
| Navajo | 4 | 0.0% |
| Northern European | 22 | 0.0% |
| Norwegian | 275 | 0.5% |
| Ottawa | 4 | 0.0% |
| Pakistani | 13 | 0.0% |
| Palestinian | 6 | 0.0% |
| Panamanian | 1 | 0.0% |
| Pennsylvania German | 33 | 0.1% |
| Peruvian | 4 | 0.0% |
| Polish | 1,955 | 3.3% |
| Portuguese | 80 | 0.1% |
| Pueblo | 29 | 0.1% |
| Puerto Rican | 414 | 0.7% |
| Romanian | 36 | 0.1% |
| Russian | 367 | 0.6% |
| Scandinavian | 45 | 0.1% |
| Scotch-Irish | 149 | 0.3% |
| Scottish | 839 | 1.4% |
| Seminole | 38 | 0.1% |
| Serbian | 2 | 0.0% |
| Sioux | 9 | 0.0% |
| Slavic | 21 | 0.0% |
| Slovak | 220 | 0.4% |
| Slovene | 31 | 0.1% |
| South American | 275 | 0.5% |
| Spaniard | 76 | 0.1% |
| Spanish | 68 | 0.1% |
| Sri Lankan | 4 | 0.0% |
| Subsaharan African | 272 | 0.5% |
| Swedish | 338 | 0.6% |
| Swiss | 268 | 0.5% |
| Thai | 199 | 0.3% |
| Ukrainian | 8 | 0.0% |
| Venezuelan | 189 | 0.3% |
| Welsh | 467 | 0.8% |
| Yugoslavian | 34 | 0.1% | View All 83 Rows |
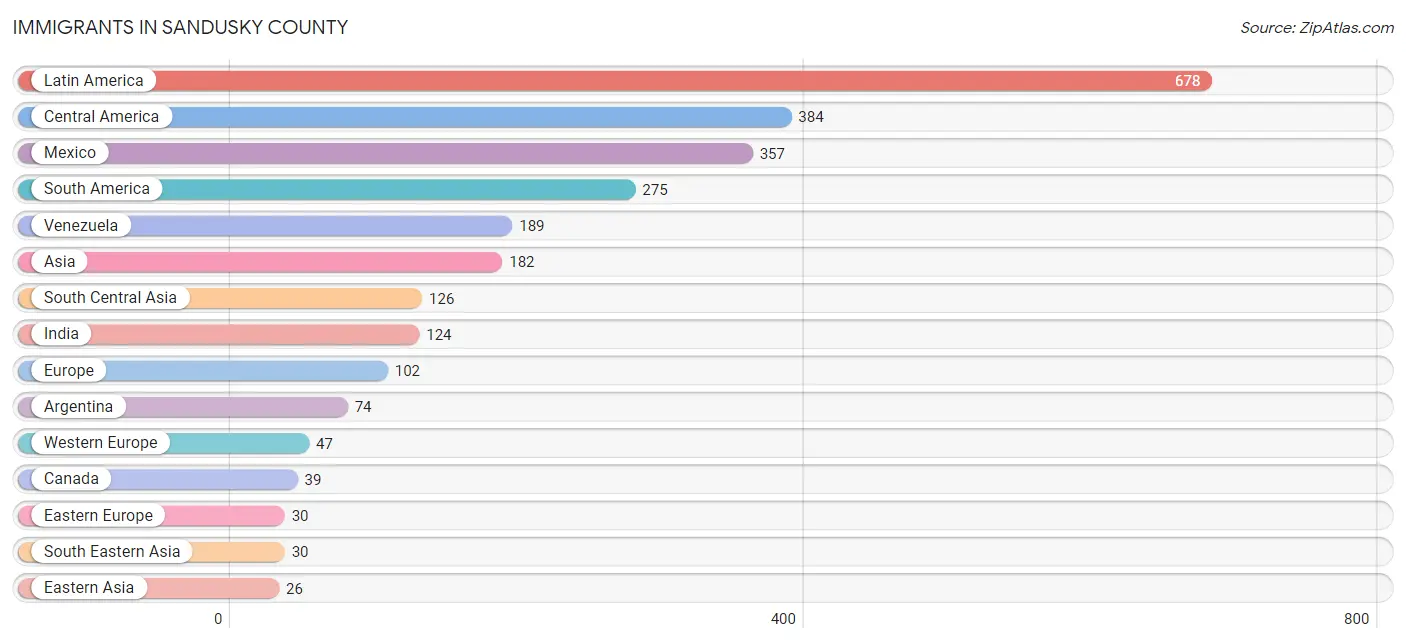
Immigrants in Sandusky County
The most numerous immigrant groups reported in Sandusky County came from Latin America (678 | 1.1%), Central America (384 | 0.6%), Mexico (357 | 0.6%), South America (275 | 0.5%), and Venezuela (189 | 0.3%), together accounting for 3.2% of all Sandusky County residents.
| Immigration Origin | # Population | % Population |
| Africa | 24 | 0.0% |
| Argentina | 74 | 0.1% |
| Asia | 182 | 0.3% |
| Australia | 25 | 0.0% |
| Bolivia | 8 | 0.0% |
| Cambodia | 17 | 0.0% |
| Canada | 39 | 0.1% |
| Caribbean | 19 | 0.0% |
| Central America | 384 | 0.6% |
| China | 7 | 0.0% |
| Czechoslovakia | 11 | 0.0% |
| Dominican Republic | 19 | 0.0% |
| Eastern Africa | 24 | 0.0% |
| Eastern Asia | 26 | 0.0% |
| Eastern Europe | 30 | 0.1% |
| Europe | 102 | 0.2% |
| France | 21 | 0.0% |
| Germany | 26 | 0.0% |
| Guatemala | 25 | 0.0% |
| Hong Kong | 5 | 0.0% |
| India | 124 | 0.2% |
| Italy | 5 | 0.0% |
| Korea | 19 | 0.0% |
| Latin America | 678 | 1.1% |
| Mexico | 357 | 0.6% |
| Oceania | 25 | 0.0% |
| Pakistan | 2 | 0.0% |
| Panama | 2 | 0.0% |
| Peru | 4 | 0.0% |
| Poland | 1 | 0.0% |
| Portugal | 20 | 0.0% |
| Russia | 18 | 0.0% |
| South America | 275 | 0.5% |
| South Central Asia | 126 | 0.2% |
| South Eastern Asia | 30 | 0.1% |
| Southern Europe | 25 | 0.0% |
| Thailand | 13 | 0.0% |
| Venezuela | 189 | 0.3% |
| Western Europe | 47 | 0.1% |
| Zimbabwe | 14 | 0.0% | View All 40 Rows |
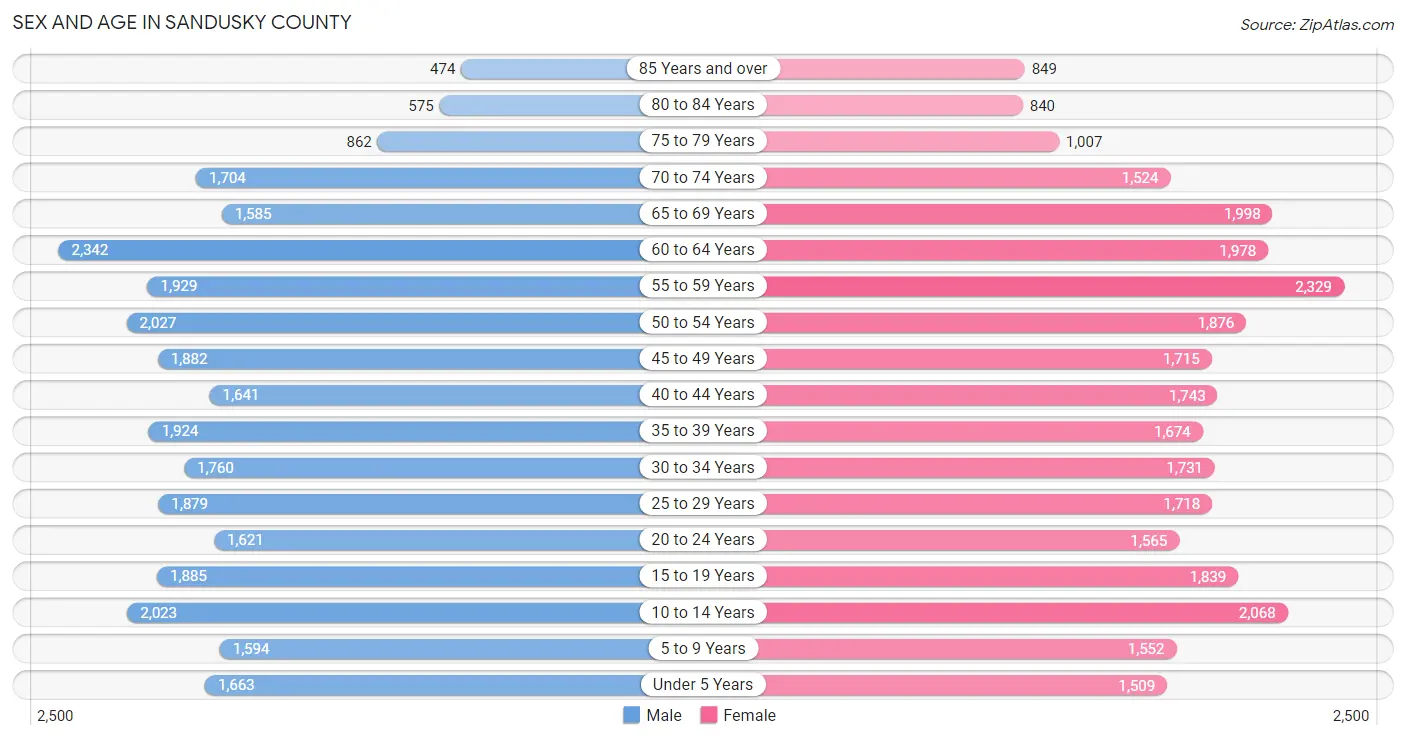
Sex and Age in Sandusky County
Sex and Age in Sandusky County
The most populous age groups in Sandusky County are 60 to 64 Years (2,342 | 8.0%) for men and 55 to 59 Years (2,329 | 7.9%) for women.
| Age Bracket | Male | Female |
| Under 5 Years | 1,663 (5.7%) | 1,509 (5.1%) |
| 5 to 9 Years | 1,594 (5.4%) | 1,552 (5.3%) |
| 10 to 14 Years | 2,023 (6.9%) | 2,068 (7.0%) |
| 15 to 19 Years | 1,885 (6.4%) | 1,839 (6.2%) |
| 20 to 24 Years | 1,621 (5.5%) | 1,565 (5.3%) |
| 25 to 29 Years | 1,879 (6.4%) | 1,718 (5.8%) |
| 30 to 34 Years | 1,760 (6.0%) | 1,731 (5.9%) |
| 35 to 39 Years | 1,924 (6.6%) | 1,674 (5.7%) |
| 40 to 44 Years | 1,641 (5.6%) | 1,743 (5.9%) |
| 45 to 49 Years | 1,882 (6.4%) | 1,715 (5.8%) |
| 50 to 54 Years | 2,027 (6.9%) | 1,876 (6.4%) |
| 55 to 59 Years | 1,929 (6.6%) | 2,329 (7.9%) |
| 60 to 64 Years | 2,342 (8.0%) | 1,978 (6.7%) |
| 65 to 69 Years | 1,585 (5.4%) | 1,998 (6.8%) |
| 70 to 74 Years | 1,704 (5.8%) | 1,524 (5.2%) |
| 75 to 79 Years | 862 (2.9%) | 1,007 (3.4%) |
| 80 to 84 Years | 575 (2.0%) | 840 (2.9%) |
| 85 Years and over | 474 (1.6%) | 849 (2.9%) |
| Total | 29,370 (100.0%) | 29,515 (100.0%) |
Families and Households in Sandusky County
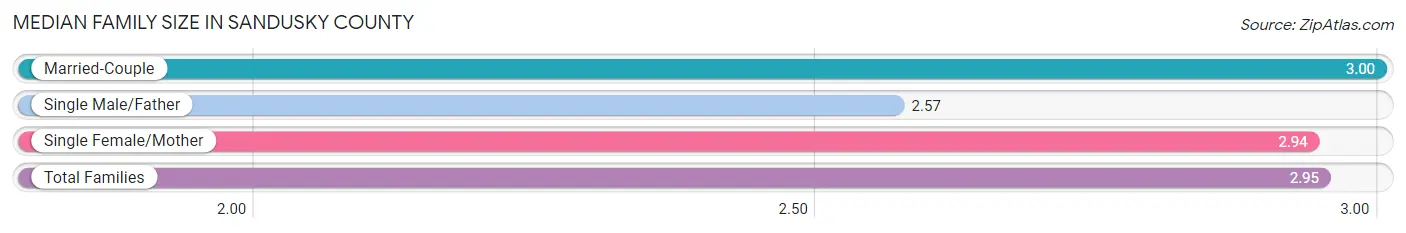
Median Family Size in Sandusky County
The median family size in Sandusky County is 2.95 persons per family, with married-couple families (11,516 | 74.0%) accounting for the largest median family size of 3 persons per family. On the other hand, single male/father families (1,451 | 9.3%) represent the smallest median family size with 2.57 persons per family.
| Family Type | # Families | Family Size |
| Married-Couple | 11,516 (74.0%) | 3.00 |
| Single Male/Father | 1,451 (9.3%) | 2.57 |
| Single Female/Mother | 2,595 (16.7%) | 2.94 |
| Total Families | 15,562 (100.0%) | 2.95 |
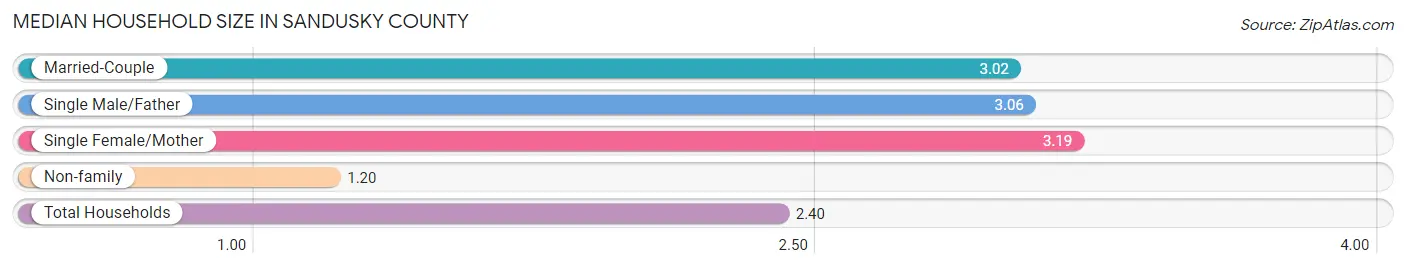
Median Household Size in Sandusky County
The median household size in Sandusky County is 2.40 persons per household, with single female/mother households (2,595 | 10.8%) accounting for the largest median household size of 3.19 persons per household. non-family households (8,476 | 35.3%) represent the smallest median household size with 1.20 persons per household.
| Household Type | # Households | Household Size |
| Married-Couple | 11,516 (47.9%) | 3.02 |
| Single Male/Father | 1,451 (6.0%) | 3.06 |
| Single Female/Mother | 2,595 (10.8%) | 3.19 |
| Non-family | 8,476 (35.3%) | 1.20 |
| Total Households | 24,038 (100.0%) | 2.40 |
Household Size by Marriage Status in Sandusky County
Out of a total of 24,038 households in Sandusky County, 15,562 (64.7%) are family households, while 8,476 (35.3%) are nonfamily households. The most numerous type of family households are 2-person households, comprising 7,828, and the most common type of nonfamily households are 1-person households, comprising 7,021.
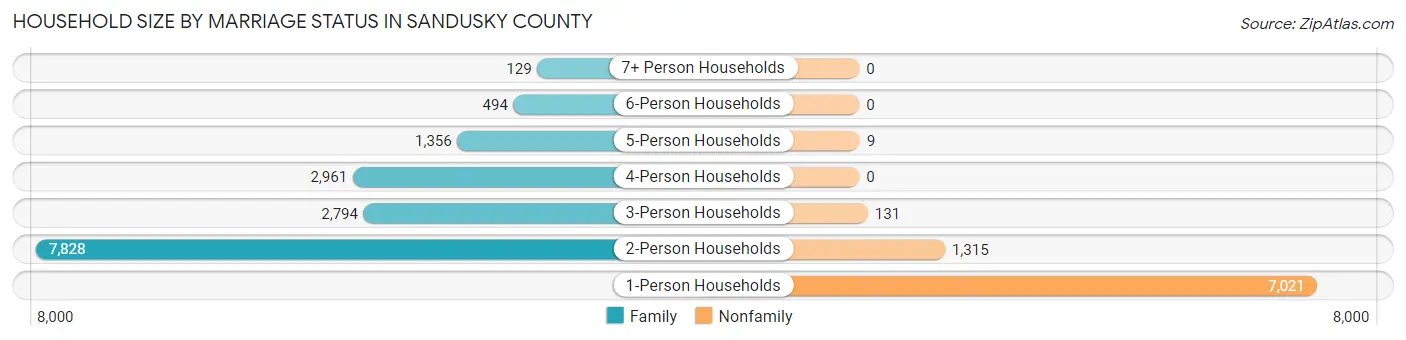
| Household Size | Family Households | Nonfamily Households |
| 1-Person Households | - | 7,021 (29.2%) |
| 2-Person Households | 7,828 (32.6%) | 1,315 (5.5%) |
| 3-Person Households | 2,794 (11.6%) | 131 (0.5%) |
| 4-Person Households | 2,961 (12.3%) | 0 (0.0%) |
| 5-Person Households | 1,356 (5.6%) | 9 (0.0%) |
| 6-Person Households | 494 (2.1%) | 0 (0.0%) |
| 7+ Person Households | 129 (0.5%) | 0 (0.0%) |
| Total | 15,562 (64.7%) | 8,476 (35.3%) |
Female Fertility in Sandusky County
Fertility by Age in Sandusky County
Average fertility rate in Sandusky County is 50.0 births per 1,000 women. Women in the age bracket of 20 to 34 years have the highest fertility rate with 91.0 births per 1,000 women. Women in the age bracket of 20 to 34 years acount for 74.2% of all women with births.

| Age Bracket | Women with Births | Births / 1,000 Women |
| 15 to 19 years | 38 (6.2%) | 21.0 |
| 20 to 34 years | 454 (74.2%) | 91.0 |
| 35 to 50 years | 120 (19.6%) | 22.0 |
| Total | 612 (100.0%) | 50.0 |
Fertility by Age by Marriage Status in Sandusky County
41.2% of women with births (612) in Sandusky County are married. The highest percentage of unmarried women with births falls into 15 to 19 years age bracket with 100.0% of them unmarried at the time of birth, while the lowest percentage of unmarried women with births belong to 35 to 50 years age bracket with 38.3% of them unmarried.
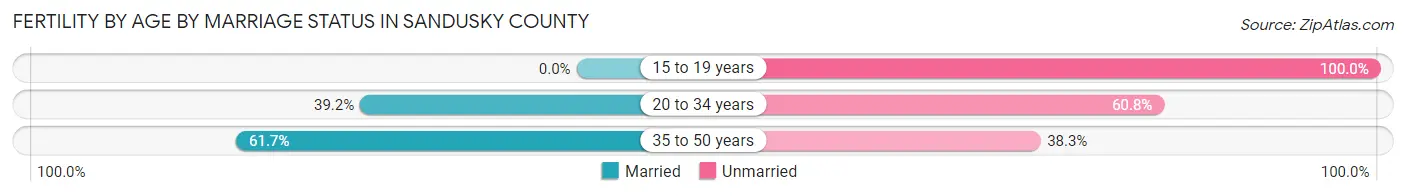
| Age Bracket | Married | Unmarried |
| 15 to 19 years | 0 (0.0%) | 38 (100.0%) |
| 20 to 34 years | 178 (39.2%) | 276 (60.8%) |
| 35 to 50 years | 74 (61.7%) | 46 (38.3%) |
| Total | 252 (41.2%) | 360 (58.8%) |
Fertility by Education in Sandusky County
Average fertility rate in Sandusky County is 50.0 births per 1,000 women. Women with the education attainment of high school diploma have the highest fertility rate of 82.0 births per 1,000 women, while women with the education attainment of graduate degree have the lowest fertility at 22.0 births per 1,000 women. Women with the education attainment of high school diploma represent 53.6% of all women with births.
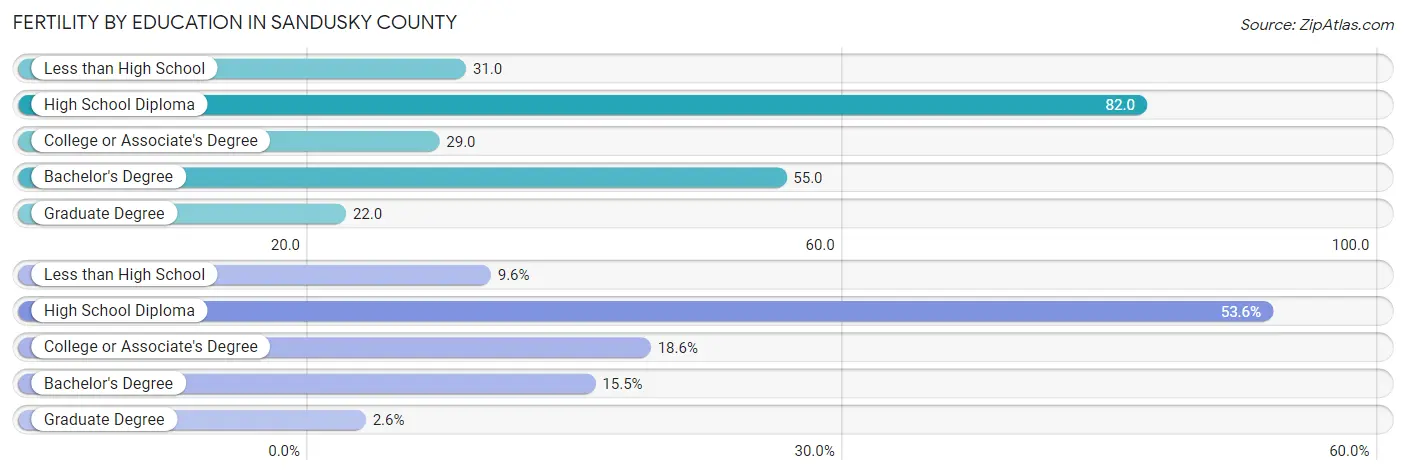
| Educational Attainment | Women with Births | Births / 1,000 Women |
| Less than High School | 59 (9.6%) | 31.0 |
| High School Diploma | 328 (53.6%) | 82.0 |
| College or Associate's Degree | 114 (18.6%) | 29.0 |
| Bachelor's Degree | 95 (15.5%) | 55.0 |
| Graduate Degree | 16 (2.6%) | 22.0 |
| Total | 612 (100.0%) | 50.0 |
Fertility by Education by Marriage Status in Sandusky County
58.8% of women with births in Sandusky County are unmarried. Women with the educational attainment of bachelor's degree are most likely to be married with 84.2% of them married at childbirth, while women with the educational attainment of less than high school are least likely to be married with 88.1% of them unmarried at childbirth.
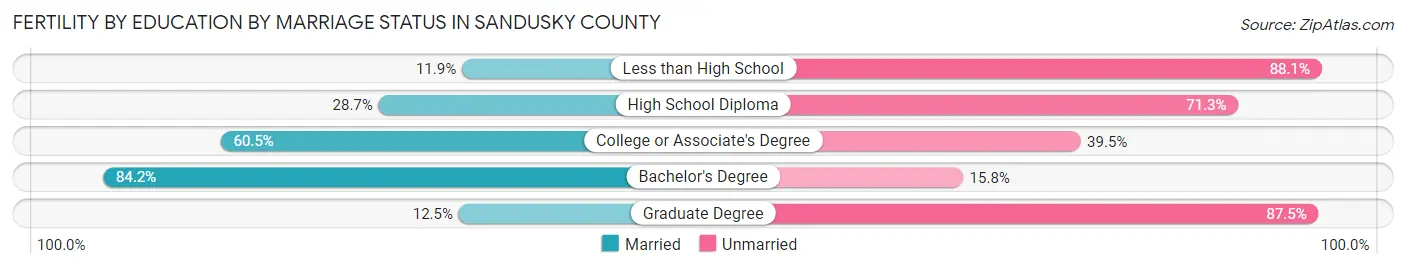
| Educational Attainment | Married | Unmarried |
| Less than High School | 7 (11.9%) | 52 (88.1%) |
| High School Diploma | 94 (28.7%) | 234 (71.3%) |
| College or Associate's Degree | 69 (60.5%) | 45 (39.5%) |
| Bachelor's Degree | 80 (84.2%) | 15 (15.8%) |
| Graduate Degree | 2 (12.5%) | 14 (87.5%) |
| Total | 252 (41.2%) | 360 (58.8%) |
Employment Characteristics in Sandusky County
Employment by Class of Employer in Sandusky County
Among the 27,071 employed individuals in Sandusky County, private company employees (19,969 | 73.8%), not-for-profit organizations (2,234 | 8.3%), and local government employees (2,186 | 8.1%) make up the most common classes of employment.
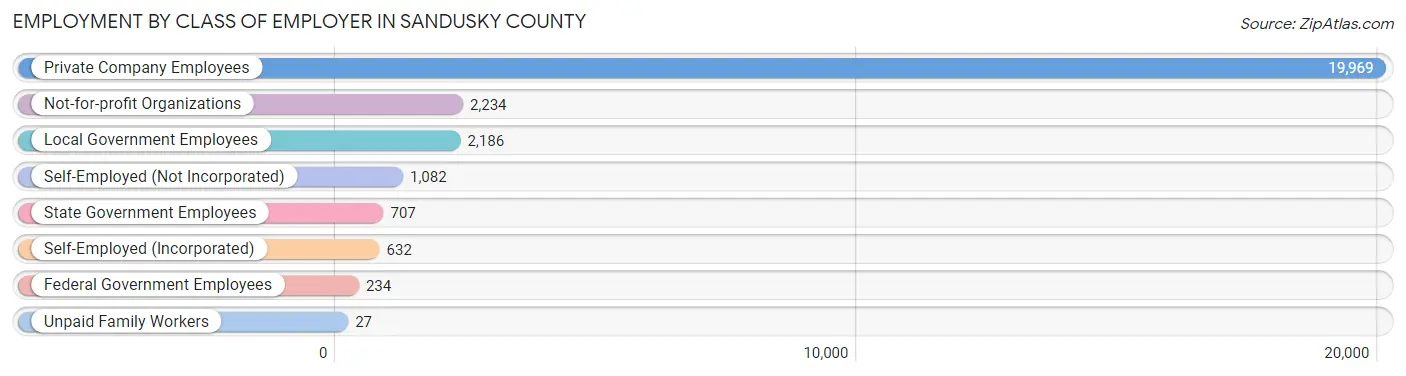
| Employer Class | # Employees | % Employees |
| Private Company Employees | 19,969 | 73.8% |
| Self-Employed (Incorporated) | 632 | 2.3% |
| Self-Employed (Not Incorporated) | 1,082 | 4.0% |
| Not-for-profit Organizations | 2,234 | 8.3% |
| Local Government Employees | 2,186 | 8.1% |
| State Government Employees | 707 | 2.6% |
| Federal Government Employees | 234 | 0.9% |
| Unpaid Family Workers | 27 | 0.1% |
| Total | 27,071 | 100.0% |
Employment Status by Age in Sandusky County
According to the labor force statistics for Sandusky County, out of the total population over 16 years of age (47,840), 60.9% or 29,135 individuals are in the labor force, with 4.8% or 1,398 of them unemployed. The age group with the highest labor force participation rate is 30 to 34 years, with 84.1% or 2,936 individuals in the labor force. Within the labor force, the 75 years and over age range has the highest percentage of unemployed individuals, with 12.3% or 29 of them being unemployed.
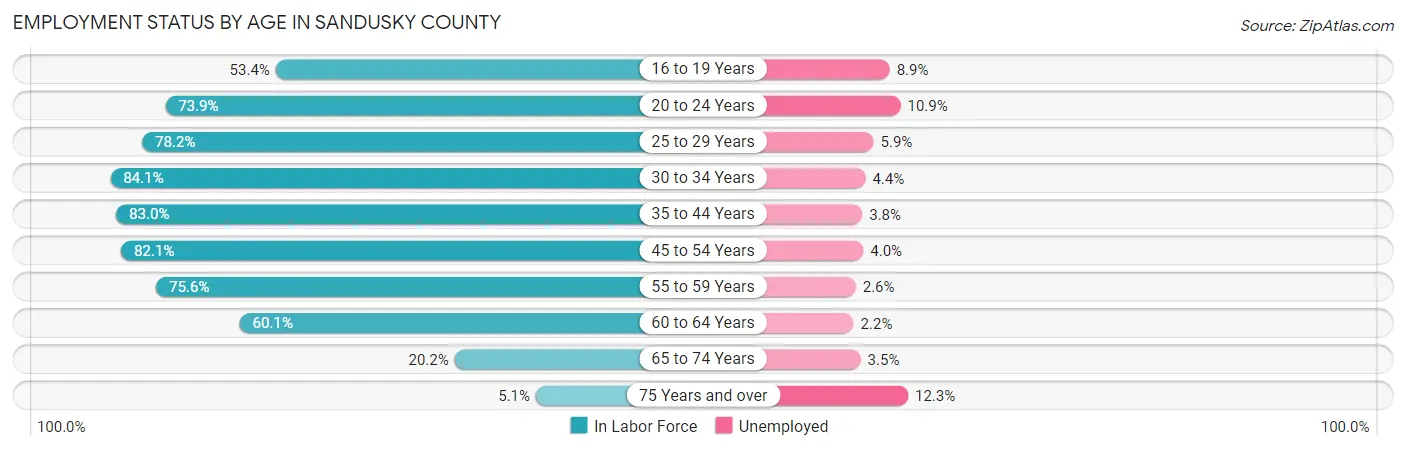
| Age Bracket | In Labor Force | Unemployed |
| 16 to 19 Years | 1,649 (53.4%) | 147 (8.9%) |
| 20 to 24 Years | 2,354 (73.9%) | 257 (10.9%) |
| 25 to 29 Years | 2,813 (78.2%) | 166 (5.9%) |
| 30 to 34 Years | 2,936 (84.1%) | 129 (4.4%) |
| 35 to 44 Years | 5,795 (83.0%) | 220 (3.8%) |
| 45 to 54 Years | 6,158 (82.1%) | 246 (4.0%) |
| 55 to 59 Years | 3,219 (75.6%) | 84 (2.6%) |
| 60 to 64 Years | 2,596 (60.1%) | 57 (2.2%) |
| 65 to 74 Years | 1,376 (20.2%) | 48 (3.5%) |
| 75 Years and over | 235 (5.1%) | 29 (12.3%) |
| Total | 29,135 (60.9%) | 1,398 (4.8%) |
Employment Status by Educational Attainment in Sandusky County
According to labor force statistics for Sandusky County, 78.0% of individuals (23,515) out of the total population between 25 and 64 years of age (30,148) are in the labor force, with 3.9% or 917 of them being unemployed. The group with the highest labor force participation rate are those with the educational attainment of bachelor's degree or higher, with 86.7% or 5,160 individuals in the labor force. Within the labor force, individuals with less than high school education have the highest percentage of unemployment, with 17.5% or 162 of them being unemployed.
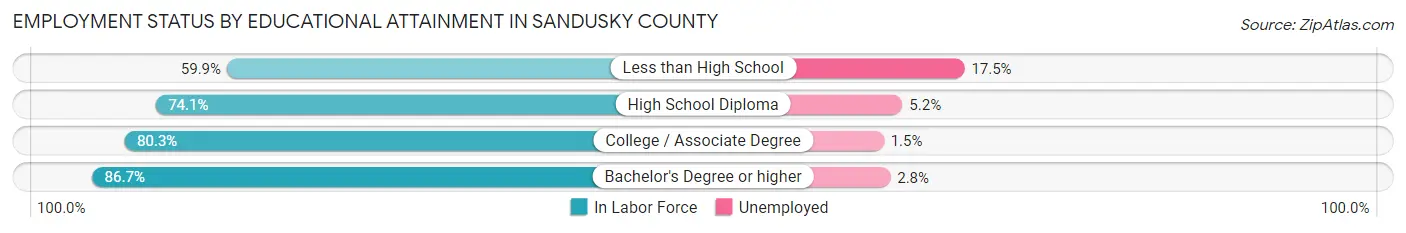
| Educational Attainment | In Labor Force | Unemployed |
| Less than High School | 924 (59.9%) | 270 (17.5%) |
| High School Diploma | 9,120 (74.1%) | 640 (5.2%) |
| College / Associate Degree | 8,308 (80.3%) | 155 (1.5%) |
| Bachelor's Degree or higher | 5,160 (86.7%) | 167 (2.8%) |
| Total | 23,515 (78.0%) | 1,176 (3.9%) |
Employment Occupations by Sex in Sandusky County
Management, Business, Science and Arts Occupations
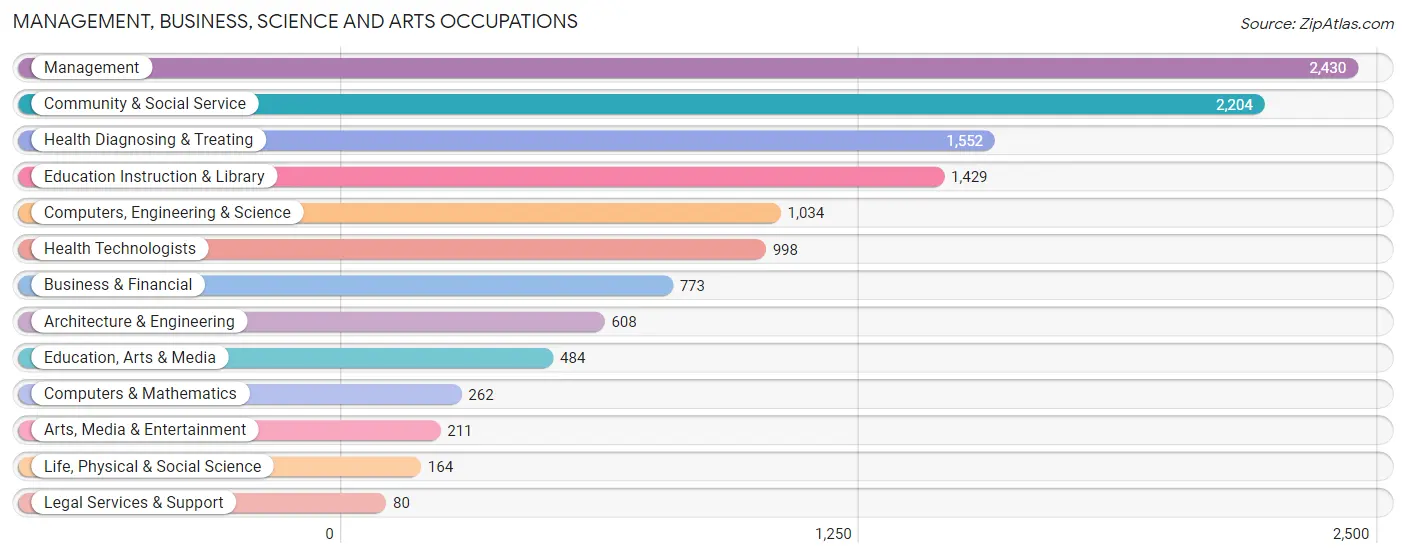
The most common Management, Business, Science and Arts occupations in Sandusky County are Management (2,430 | 8.8%), Community & Social Service (2,204 | 8.0%), Health Diagnosing & Treating (1,552 | 5.6%), Education Instruction & Library (1,429 | 5.1%), and Computers, Engineering & Science (1,034 | 3.7%).
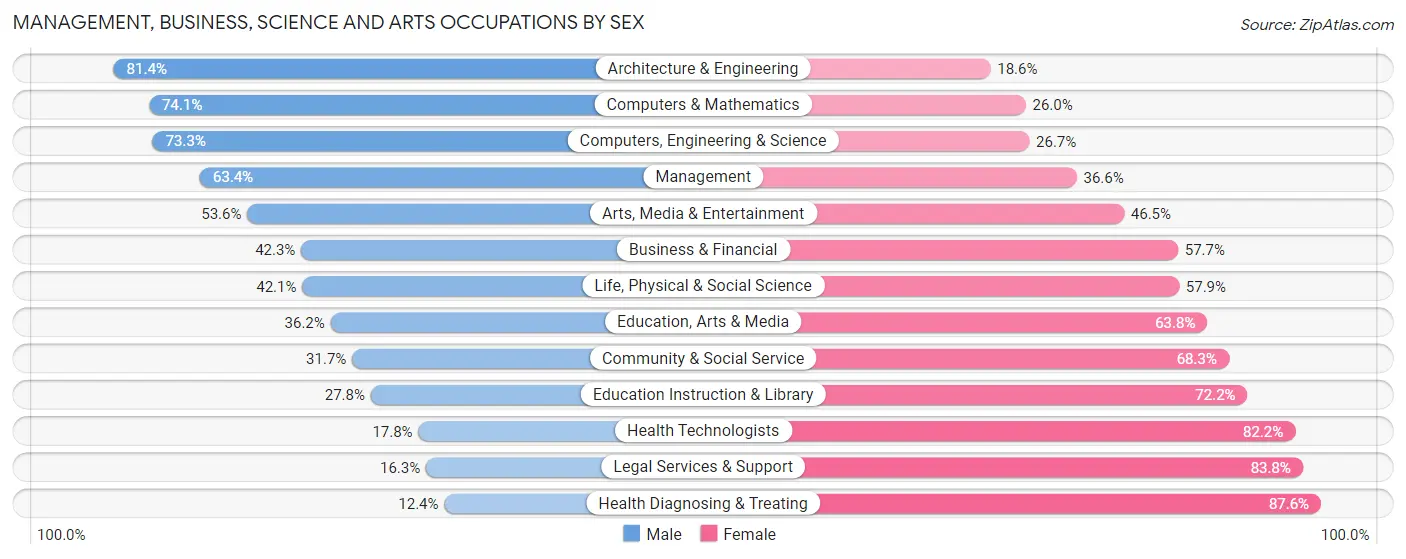
Management, Business, Science and Arts Occupations by Sex
Within the Management, Business, Science and Arts occupations in Sandusky County, the most male-oriented occupations are Architecture & Engineering (81.4%), Computers & Mathematics (74.1%), and Computers, Engineering & Science (73.3%), while the most female-oriented occupations are Health Diagnosing & Treating (87.6%), Legal Services & Support (83.8%), and Health Technologists (82.2%).
| Occupation | Male | Female |
| Management | 1,541 (63.4%) | 889 (36.6%) |
| Business & Financial | 327 (42.3%) | 446 (57.7%) |
| Computers, Engineering & Science | 758 (73.3%) | 276 (26.7%) |
| Computers & Mathematics | 194 (74.1%) | 68 (26.0%) |
| Architecture & Engineering | 495 (81.4%) | 113 (18.6%) |
| Life, Physical & Social Science | 69 (42.1%) | 95 (57.9%) |
| Community & Social Service | 698 (31.7%) | 1,506 (68.3%) |
| Education, Arts & Media | 175 (36.2%) | 309 (63.8%) |
| Legal Services & Support | 13 (16.3%) | 67 (83.8%) |
| Education Instruction & Library | 397 (27.8%) | 1,032 (72.2%) |
| Arts, Media & Entertainment | 113 (53.5%) | 98 (46.5%) |
| Health Diagnosing & Treating | 193 (12.4%) | 1,359 (87.6%) |
| Health Technologists | 178 (17.8%) | 820 (82.2%) |
| Total (Category) | 3,517 (44.0%) | 4,476 (56.0%) |
| Total (Overall) | 14,798 (53.4%) | 12,934 (46.6%) |
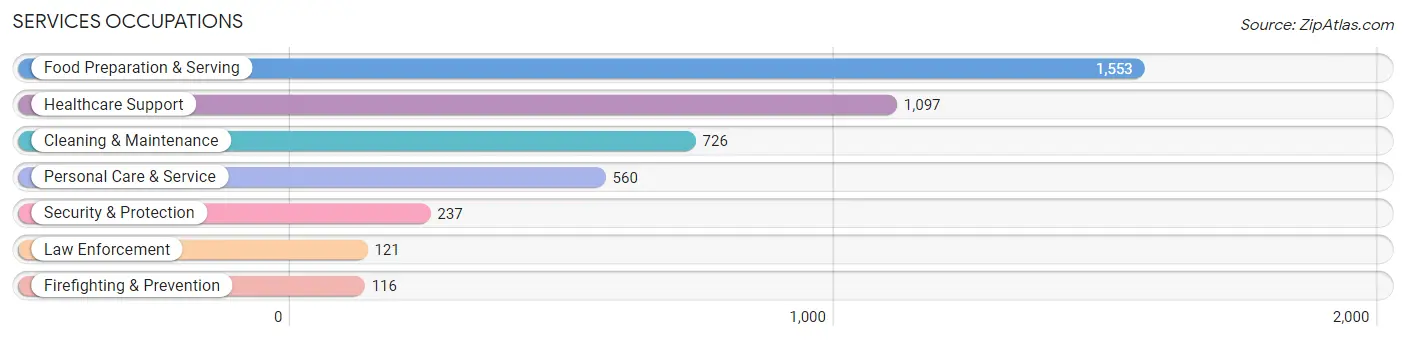
Services Occupations
The most common Services occupations in Sandusky County are Food Preparation & Serving (1,553 | 5.6%), Healthcare Support (1,097 | 4.0%), Cleaning & Maintenance (726 | 2.6%), Personal Care & Service (560 | 2.0%), and Security & Protection (237 | 0.9%).
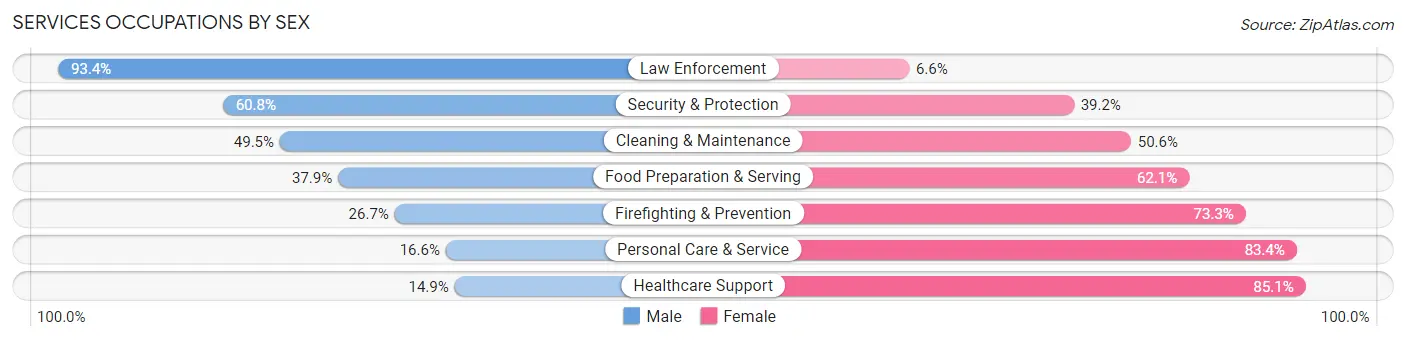
Services Occupations by Sex
Within the Services occupations in Sandusky County, the most male-oriented occupations are Law Enforcement (93.4%), Security & Protection (60.8%), and Cleaning & Maintenance (49.4%), while the most female-oriented occupations are Healthcare Support (85.1%), Personal Care & Service (83.4%), and Firefighting & Prevention (73.3%).
| Occupation | Male | Female |
| Healthcare Support | 163 (14.9%) | 934 (85.1%) |
| Security & Protection | 144 (60.8%) | 93 (39.2%) |
| Firefighting & Prevention | 31 (26.7%) | 85 (73.3%) |
| Law Enforcement | 113 (93.4%) | 8 (6.6%) |
| Food Preparation & Serving | 589 (37.9%) | 964 (62.1%) |
| Cleaning & Maintenance | 359 (49.4%) | 367 (50.5%) |
| Personal Care & Service | 93 (16.6%) | 467 (83.4%) |
| Total (Category) | 1,348 (32.3%) | 2,825 (67.7%) |
| Total (Overall) | 14,798 (53.4%) | 12,934 (46.6%) |
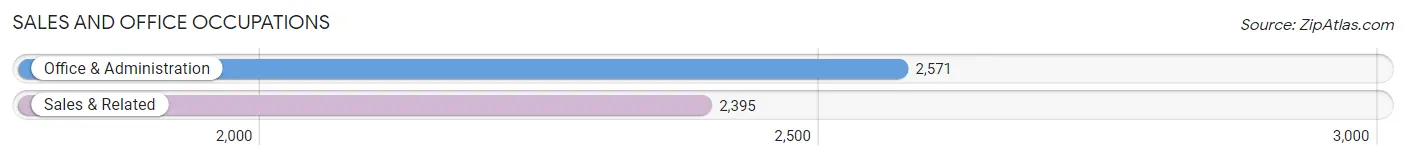
Sales and Office Occupations
The most common Sales and Office occupations in Sandusky County are Office & Administration (2,571 | 9.3%), and Sales & Related (2,395 | 8.6%).
Sales and Office Occupations by Sex
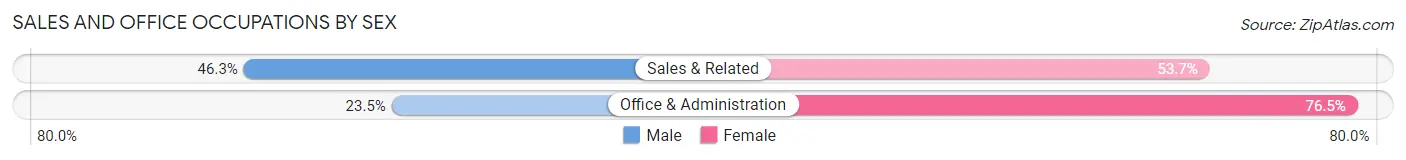
| Occupation | Male | Female |
| Sales & Related | 1,109 (46.3%) | 1,286 (53.7%) |
| Office & Administration | 605 (23.5%) | 1,966 (76.5%) |
| Total (Category) | 1,714 (34.5%) | 3,252 (65.5%) |
| Total (Overall) | 14,798 (53.4%) | 12,934 (46.6%) |
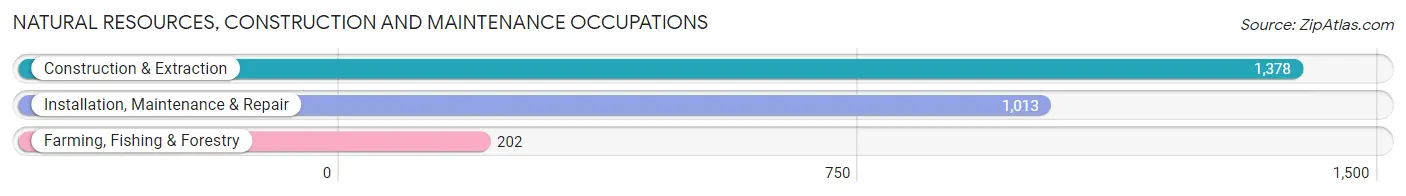
Natural Resources, Construction and Maintenance Occupations
The most common Natural Resources, Construction and Maintenance occupations in Sandusky County are Construction & Extraction (1,378 | 5.0%), Installation, Maintenance & Repair (1,013 | 3.6%), and Farming, Fishing & Forestry (202 | 0.7%).
Natural Resources, Construction and Maintenance Occupations by Sex
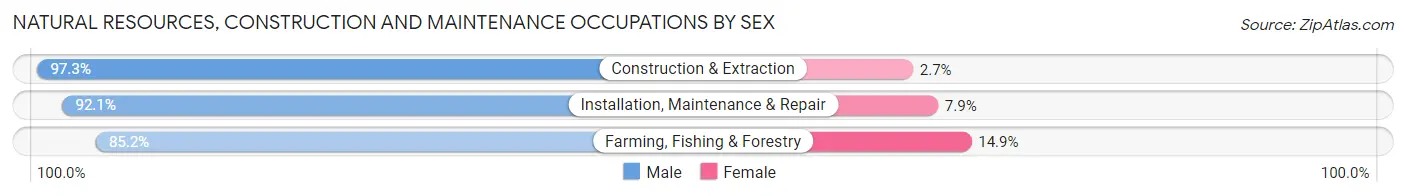
| Occupation | Male | Female |
| Farming, Fishing & Forestry | 172 (85.2%) | 30 (14.8%) |
| Construction & Extraction | 1,341 (97.3%) | 37 (2.7%) |
| Installation, Maintenance & Repair | 933 (92.1%) | 80 (7.9%) |
| Total (Category) | 2,446 (94.3%) | 147 (5.7%) |
| Total (Overall) | 14,798 (53.4%) | 12,934 (46.6%) |
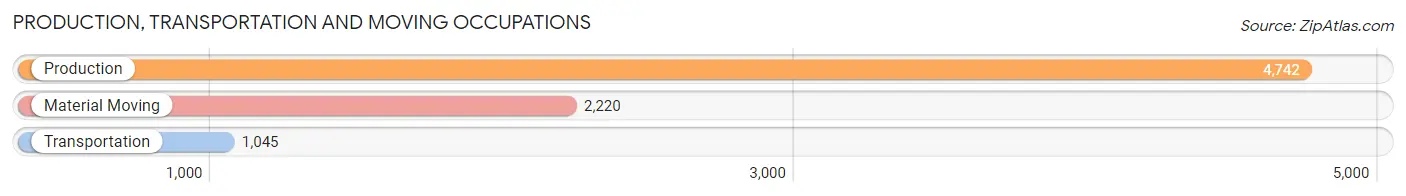
Production, Transportation and Moving Occupations
The most common Production, Transportation and Moving occupations in Sandusky County are Production (4,742 | 17.1%), Material Moving (2,220 | 8.0%), and Transportation (1,045 | 3.8%).
Production, Transportation and Moving Occupations by Sex
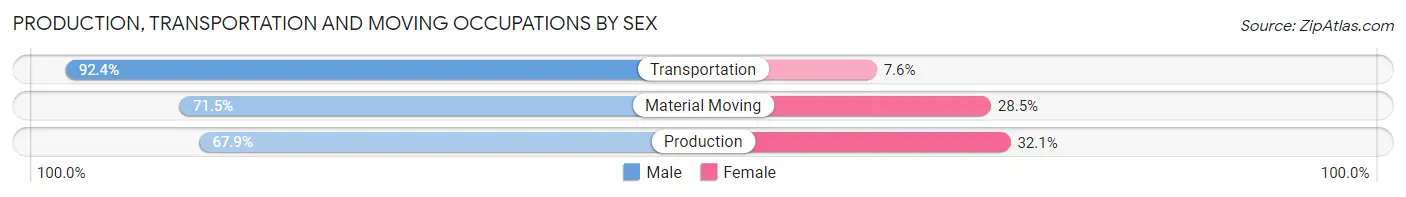
| Occupation | Male | Female |
| Production | 3,220 (67.9%) | 1,522 (32.1%) |
| Transportation | 966 (92.4%) | 79 (7.6%) |
| Material Moving | 1,587 (71.5%) | 633 (28.5%) |
| Total (Category) | 5,773 (72.1%) | 2,234 (27.9%) |
| Total (Overall) | 14,798 (53.4%) | 12,934 (46.6%) |
Employment Industries by Sex in Sandusky County
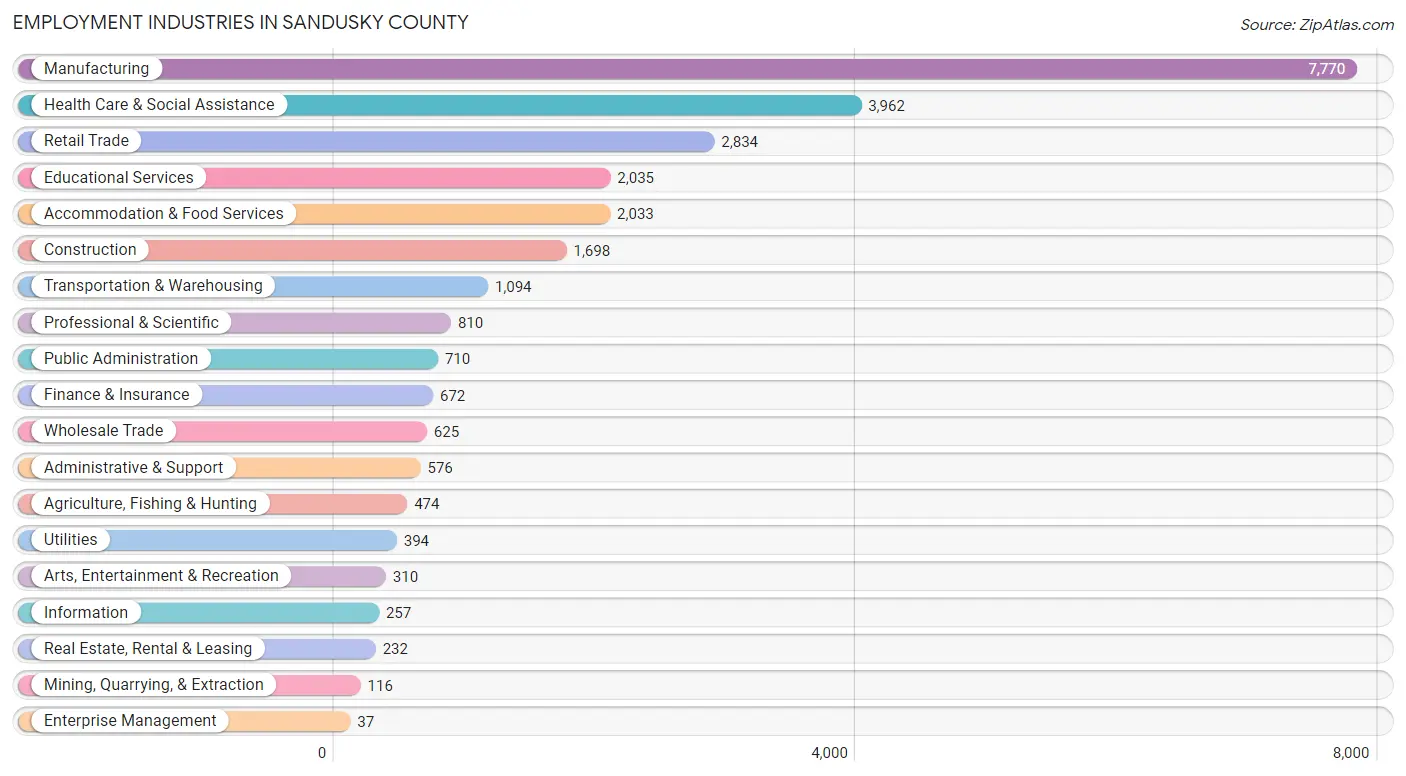
Employment Industries in Sandusky County
The major employment industries in Sandusky County include Manufacturing (7,770 | 28.0%), Health Care & Social Assistance (3,962 | 14.3%), Retail Trade (2,834 | 10.2%), Educational Services (2,035 | 7.3%), and Accommodation & Food Services (2,033 | 7.3%).
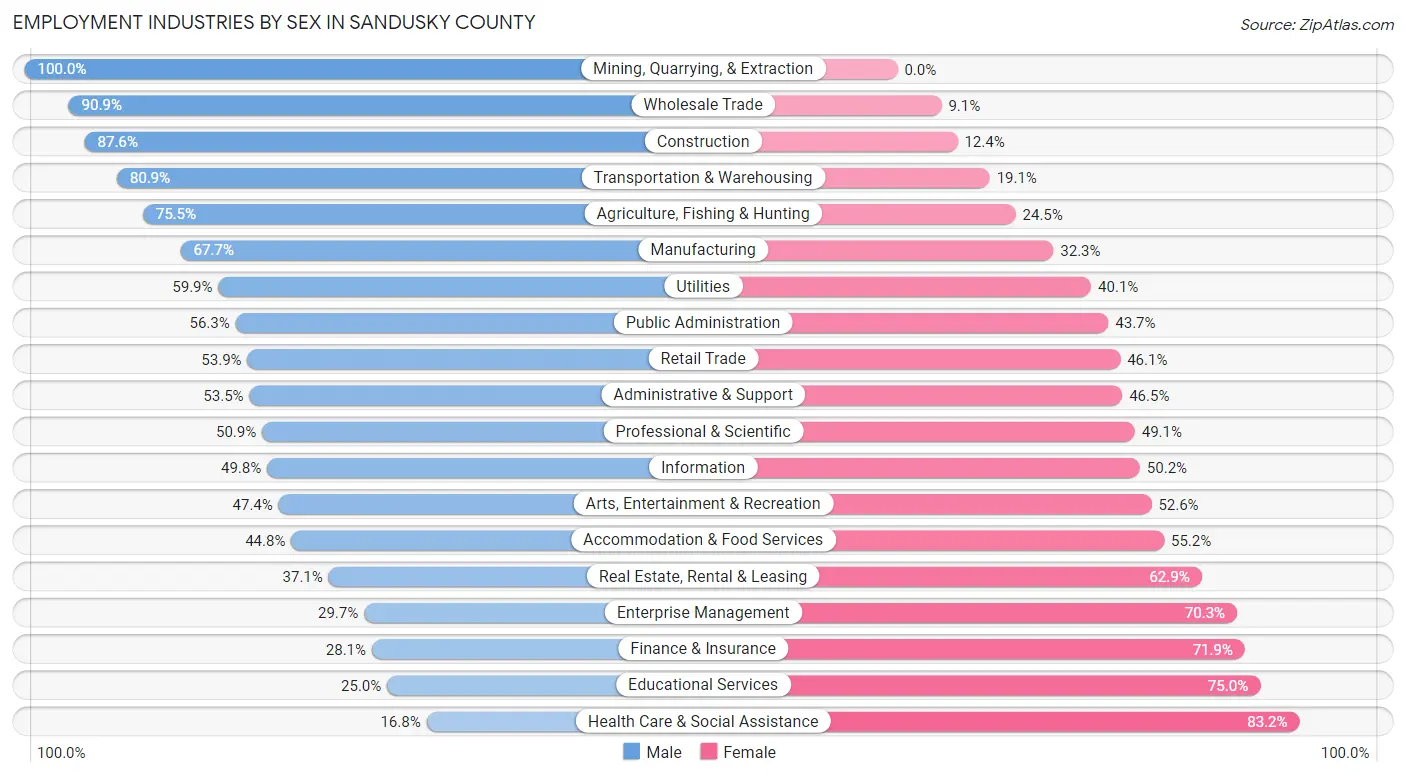
Employment Industries by Sex in Sandusky County
The Sandusky County industries that see more men than women are Mining, Quarrying, & Extraction (100.0%), Wholesale Trade (90.9%), and Construction (87.6%), whereas the industries that tend to have a higher number of women are Health Care & Social Assistance (83.2%), Educational Services (75.0%), and Finance & Insurance (71.9%).
| Industry | Male | Female |
| Agriculture, Fishing & Hunting | 358 (75.5%) | 116 (24.5%) |
| Mining, Quarrying, & Extraction | 116 (100.0%) | 0 (0.0%) |
| Construction | 1,487 (87.6%) | 211 (12.4%) |
| Manufacturing | 5,262 (67.7%) | 2,508 (32.3%) |
| Wholesale Trade | 568 (90.9%) | 57 (9.1%) |
| Retail Trade | 1,527 (53.9%) | 1,307 (46.1%) |
| Transportation & Warehousing | 885 (80.9%) | 209 (19.1%) |
| Utilities | 236 (59.9%) | 158 (40.1%) |
| Information | 128 (49.8%) | 129 (50.2%) |
| Finance & Insurance | 189 (28.1%) | 483 (71.9%) |
| Real Estate, Rental & Leasing | 86 (37.1%) | 146 (62.9%) |
| Professional & Scientific | 412 (50.9%) | 398 (49.1%) |
| Enterprise Management | 11 (29.7%) | 26 (70.3%) |
| Administrative & Support | 308 (53.5%) | 268 (46.5%) |
| Educational Services | 508 (25.0%) | 1,527 (75.0%) |
| Health Care & Social Assistance | 666 (16.8%) | 3,296 (83.2%) |
| Arts, Entertainment & Recreation | 147 (47.4%) | 163 (52.6%) |
| Accommodation & Food Services | 911 (44.8%) | 1,122 (55.2%) |
| Public Administration | 400 (56.3%) | 310 (43.7%) |
| Total | 14,798 (53.4%) | 12,934 (46.6%) |
Education in Sandusky County
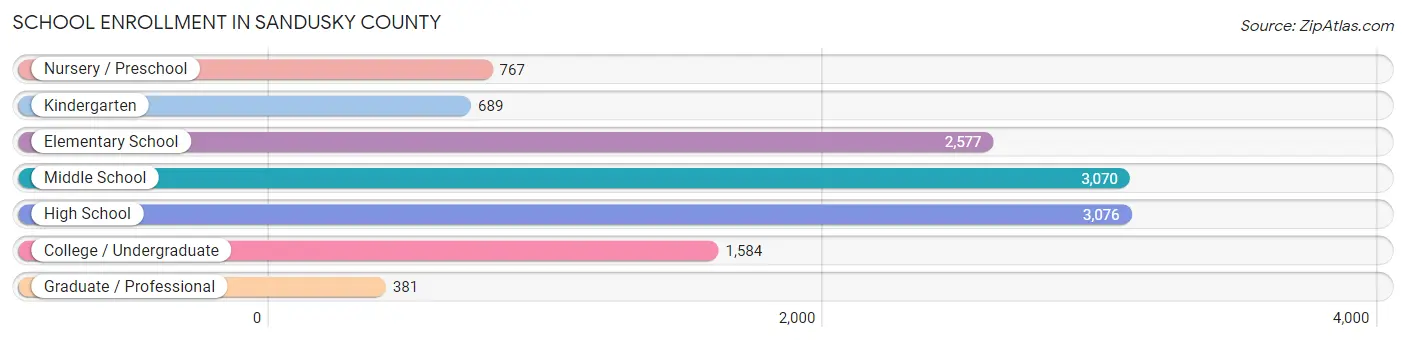
School Enrollment in Sandusky County
The most common levels of schooling among the 12,144 students in Sandusky County are high school (3,076 | 25.3%), middle school (3,070 | 25.3%), and elementary school (2,577 | 21.2%).
| School Level | # Students | % Students |
| Nursery / Preschool | 767 | 6.3% |
| Kindergarten | 689 | 5.7% |
| Elementary School | 2,577 | 21.2% |
| Middle School | 3,070 | 25.3% |
| High School | 3,076 | 25.3% |
| College / Undergraduate | 1,584 | 13.0% |
| Graduate / Professional | 381 | 3.1% |
| Total | 12,144 | 100.0% |
School Enrollment by Age by Funding Source in Sandusky County
Out of a total of 12,144 students who are enrolled in schools in Sandusky County, 1,761 (14.5%) attend a private institution, while the remaining 10,383 (85.5%) are enrolled in public schools. The age group of 3 to 4 year olds has the highest likelihood of being enrolled in private schools, with 133 (28.2% in the age bracket) enrolled. Conversely, the age group of 10 to 14 year olds has the lowest likelihood of being enrolled in a private school, with 3,576 (91.0% in the age bracket) attending a public institution.
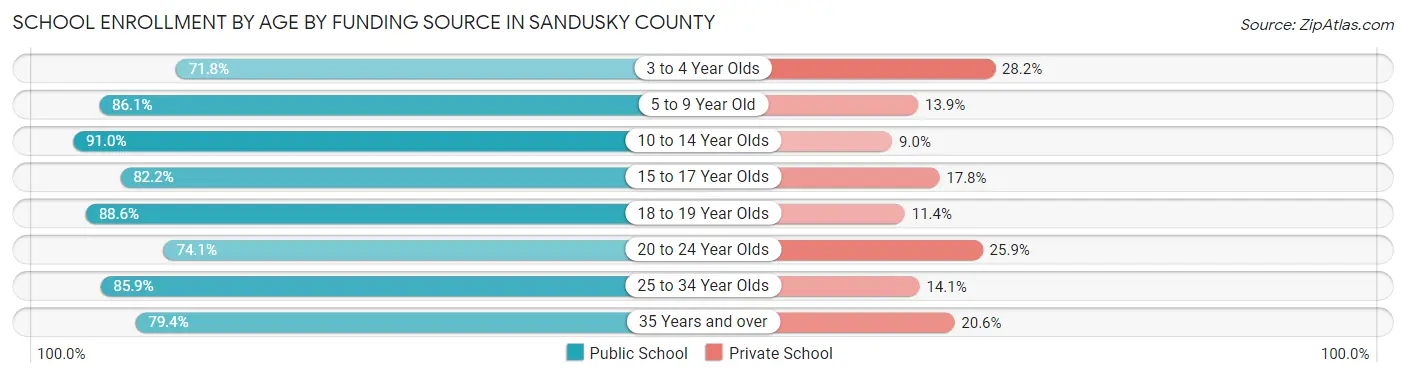
| Age Bracket | Public School | Private School |
| 3 to 4 Year Olds | 339 (71.8%) | 133 (28.2%) |
| 5 to 9 Year Old | 2,570 (86.1%) | 414 (13.9%) |
| 10 to 14 Year Olds | 3,576 (91.0%) | 355 (9.0%) |
| 15 to 17 Year Olds | 1,863 (82.2%) | 404 (17.8%) |
| 18 to 19 Year Olds | 700 (88.6%) | 90 (11.4%) |
| 20 to 24 Year Olds | 564 (74.1%) | 197 (25.9%) |
| 25 to 34 Year Olds | 365 (85.9%) | 60 (14.1%) |
| 35 Years and over | 408 (79.4%) | 106 (20.6%) |
| Total | 10,383 (85.5%) | 1,761 (14.5%) |
Educational Attainment by Field of Study in Sandusky County
Education (2,039 | 25.4%), business (1,804 | 22.4%), science & technology (1,143 | 14.2%), arts & humanities (495 | 6.2%), and engineering (438 | 5.4%) are the most common fields of study among 8,038 individuals in Sandusky County who have obtained a bachelor's degree or higher.
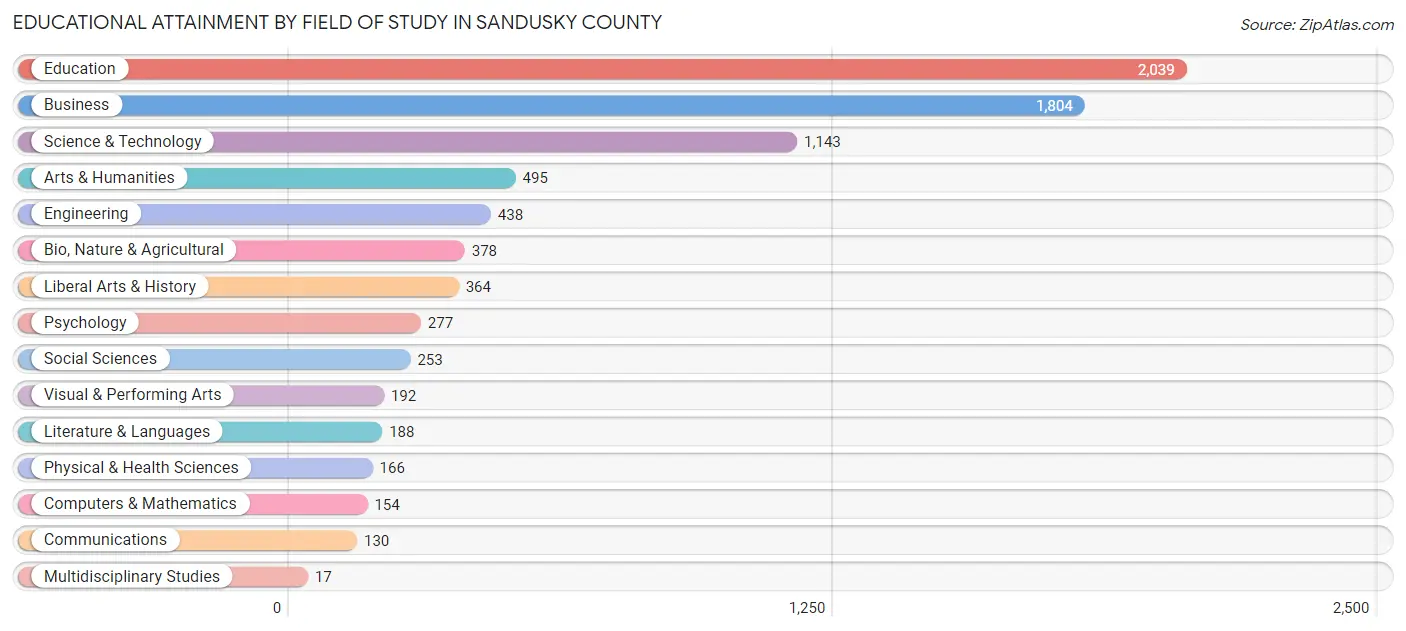
| Field of Study | # Graduates | % Graduates |
| Computers & Mathematics | 154 | 1.9% |
| Bio, Nature & Agricultural | 378 | 4.7% |
| Physical & Health Sciences | 166 | 2.1% |
| Psychology | 277 | 3.5% |
| Social Sciences | 253 | 3.2% |
| Engineering | 438 | 5.4% |
| Multidisciplinary Studies | 17 | 0.2% |
| Science & Technology | 1,143 | 14.2% |
| Business | 1,804 | 22.4% |
| Education | 2,039 | 25.4% |
| Literature & Languages | 188 | 2.3% |
| Liberal Arts & History | 364 | 4.5% |
| Visual & Performing Arts | 192 | 2.4% |
| Communications | 130 | 1.6% |
| Arts & Humanities | 495 | 6.2% |
| Total | 8,038 | 100.0% |
Transportation & Commute in Sandusky County
Vehicle Availability by Sex in Sandusky County
The most prevalent vehicle ownership categories in Sandusky County are males with 2 vehicles (6,327, accounting for 43.9%) and females with 2 vehicles (4,974, making up 50.2%).
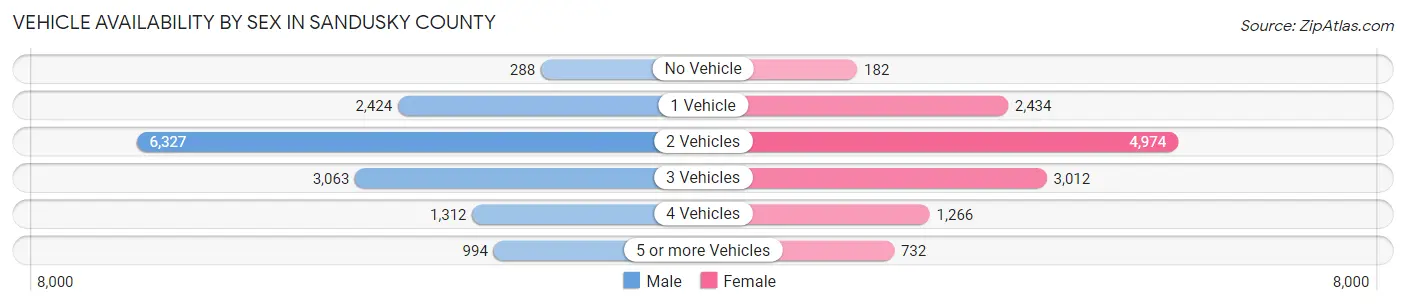
| Vehicles Available | Male | Female |
| No Vehicle | 288 (2.0%) | 182 (1.4%) |
| 1 Vehicle | 2,424 (16.8%) | 2,434 (19.3%) |
| 2 Vehicles | 6,327 (43.9%) | 4,974 (39.5%) |
| 3 Vehicles | 3,063 (21.3%) | 3,012 (23.9%) |
| 4 Vehicles | 1,312 (9.1%) | 1,266 (10.1%) |
| 5 or more Vehicles | 994 (6.9%) | 732 (5.8%) |
| Total | 14,408 (100.0%) | 12,600 (100.0%) |
Commute Time in Sandusky County
The most frequently occuring commute durations in Sandusky County are 10 to 14 minutes (5,154 commuters, 19.6%), 5 to 9 minutes (4,655 commuters, 17.7%), and 15 to 19 minutes (4,118 commuters, 15.7%).
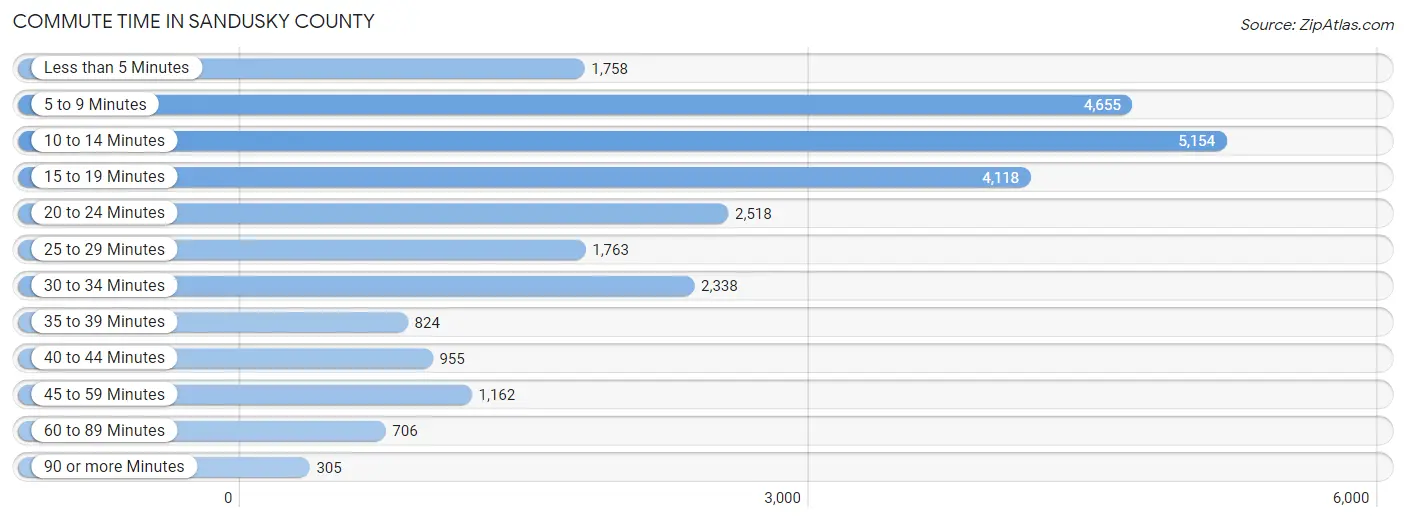
| Commute Time | # Commuters | % Commuters |
| Less than 5 Minutes | 1,758 | 6.7% |
| 5 to 9 Minutes | 4,655 | 17.7% |
| 10 to 14 Minutes | 5,154 | 19.6% |
| 15 to 19 Minutes | 4,118 | 15.7% |
| 20 to 24 Minutes | 2,518 | 9.6% |
| 25 to 29 Minutes | 1,763 | 6.7% |
| 30 to 34 Minutes | 2,338 | 8.9% |
| 35 to 39 Minutes | 824 | 3.1% |
| 40 to 44 Minutes | 955 | 3.6% |
| 45 to 59 Minutes | 1,162 | 4.4% |
| 60 to 89 Minutes | 706 | 2.7% |
| 90 or more Minutes | 305 | 1.2% |
Commute Time by Sex in Sandusky County
The most common commute times in Sandusky County are 10 to 14 minutes (2,711 commuters, 19.1%) for males and 10 to 14 minutes (2,443 commuters, 20.2%) for females.
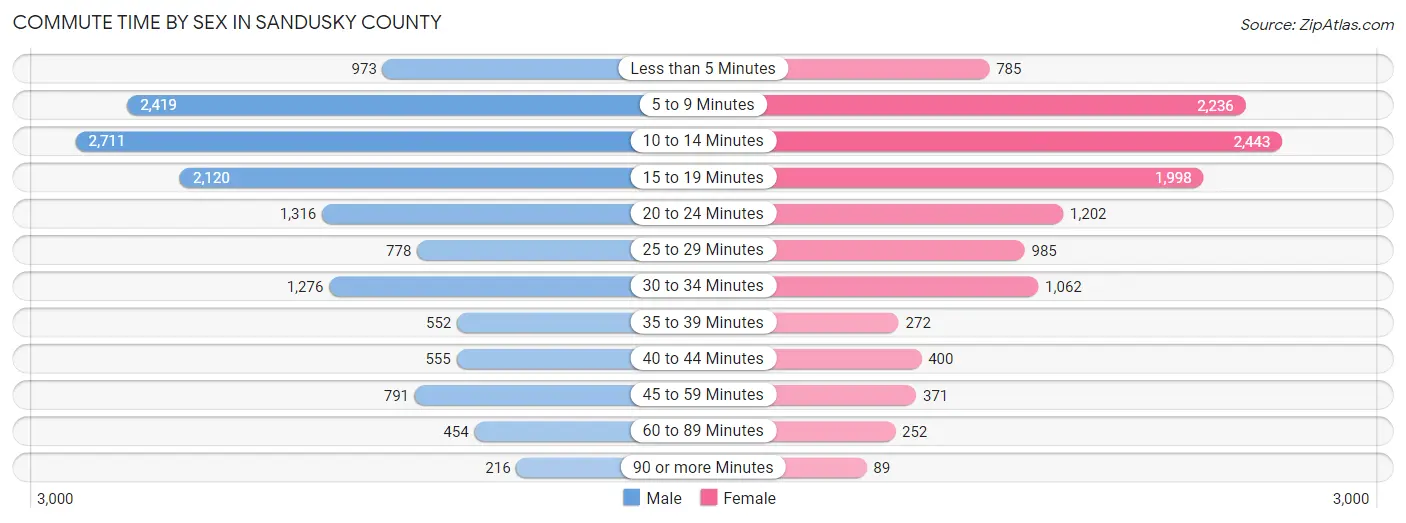
| Commute Time | Male | Female |
| Less than 5 Minutes | 973 (6.9%) | 785 (6.5%) |
| 5 to 9 Minutes | 2,419 (17.1%) | 2,236 (18.5%) |
| 10 to 14 Minutes | 2,711 (19.1%) | 2,443 (20.2%) |
| 15 to 19 Minutes | 2,120 (15.0%) | 1,998 (16.5%) |
| 20 to 24 Minutes | 1,316 (9.3%) | 1,202 (9.9%) |
| 25 to 29 Minutes | 778 (5.5%) | 985 (8.1%) |
| 30 to 34 Minutes | 1,276 (9.0%) | 1,062 (8.8%) |
| 35 to 39 Minutes | 552 (3.9%) | 272 (2.2%) |
| 40 to 44 Minutes | 555 (3.9%) | 400 (3.3%) |
| 45 to 59 Minutes | 791 (5.6%) | 371 (3.1%) |
| 60 to 89 Minutes | 454 (3.2%) | 252 (2.1%) |
| 90 or more Minutes | 216 (1.5%) | 89 (0.7%) |
Time of Departure to Work by Sex in Sandusky County
The most frequent times of departure to work in Sandusky County are 6:00 AM to 6:29 AM (1,944, 13.7%) for males and 7:00 AM to 7:29 AM (1,689, 14.0%) for females.
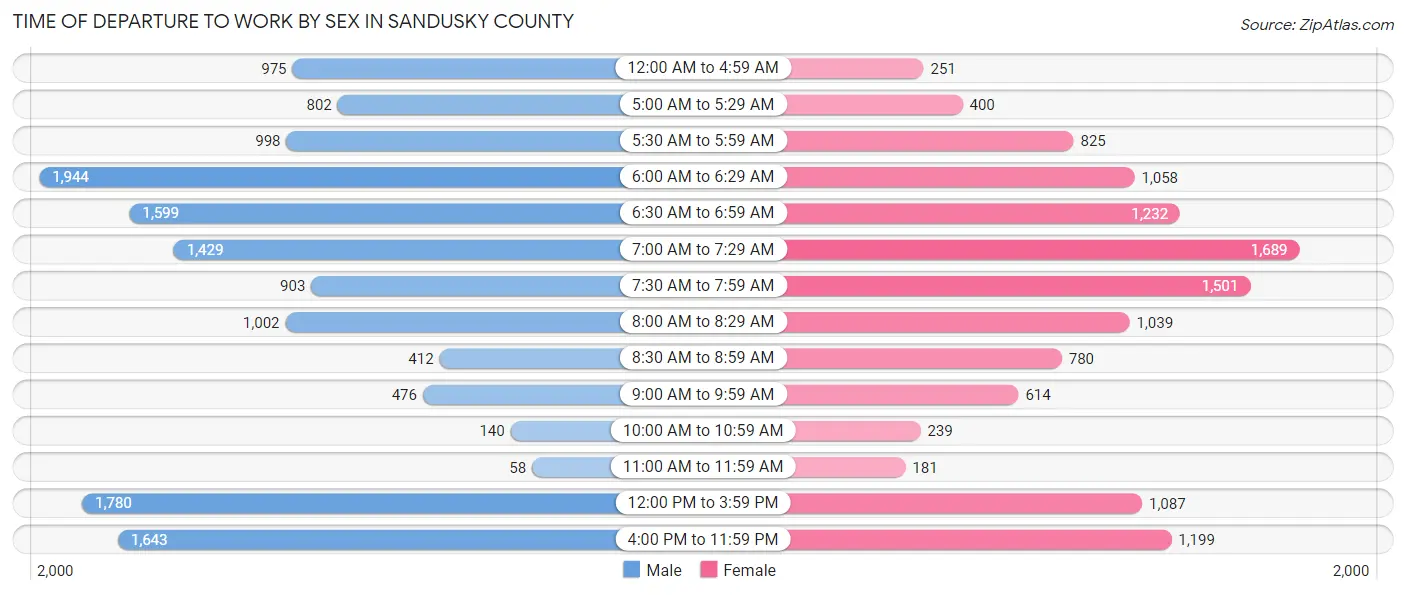
| Time of Departure | Male | Female |
| 12:00 AM to 4:59 AM | 975 (6.9%) | 251 (2.1%) |
| 5:00 AM to 5:29 AM | 802 (5.7%) | 400 (3.3%) |
| 5:30 AM to 5:59 AM | 998 (7.0%) | 825 (6.8%) |
| 6:00 AM to 6:29 AM | 1,944 (13.7%) | 1,058 (8.7%) |
| 6:30 AM to 6:59 AM | 1,599 (11.3%) | 1,232 (10.2%) |
| 7:00 AM to 7:29 AM | 1,429 (10.1%) | 1,689 (14.0%) |
| 7:30 AM to 7:59 AM | 903 (6.4%) | 1,501 (12.4%) |
| 8:00 AM to 8:29 AM | 1,002 (7.1%) | 1,039 (8.6%) |
| 8:30 AM to 8:59 AM | 412 (2.9%) | 780 (6.5%) |
| 9:00 AM to 9:59 AM | 476 (3.4%) | 614 (5.1%) |
| 10:00 AM to 10:59 AM | 140 (1.0%) | 239 (2.0%) |
| 11:00 AM to 11:59 AM | 58 (0.4%) | 181 (1.5%) |
| 12:00 PM to 3:59 PM | 1,780 (12.6%) | 1,087 (9.0%) |
| 4:00 PM to 11:59 PM | 1,643 (11.6%) | 1,199 (9.9%) |
| Total | 14,161 (100.0%) | 12,095 (100.0%) |
Housing Occupancy in Sandusky County
Occupancy by Ownership in Sandusky County
Of the total 24,038 dwellings in Sandusky County, owner-occupied units account for 17,822 (74.1%), while renter-occupied units make up 6,216 (25.9%).
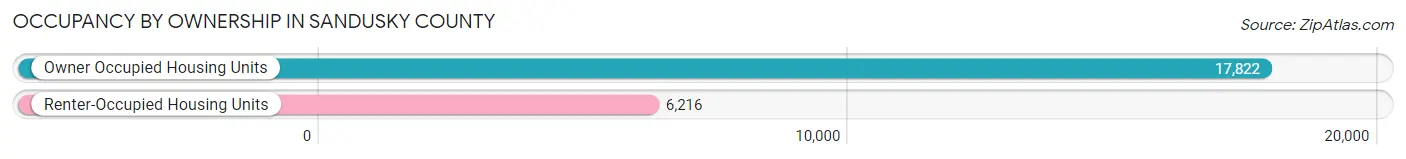
| Occupancy | # Housing Units | % Housing Units |
| Owner Occupied Housing Units | 17,822 | 74.1% |
| Renter-Occupied Housing Units | 6,216 | 25.9% |
| Total Occupied Housing Units | 24,038 | 100.0% |
Occupancy by Household Size in Sandusky County
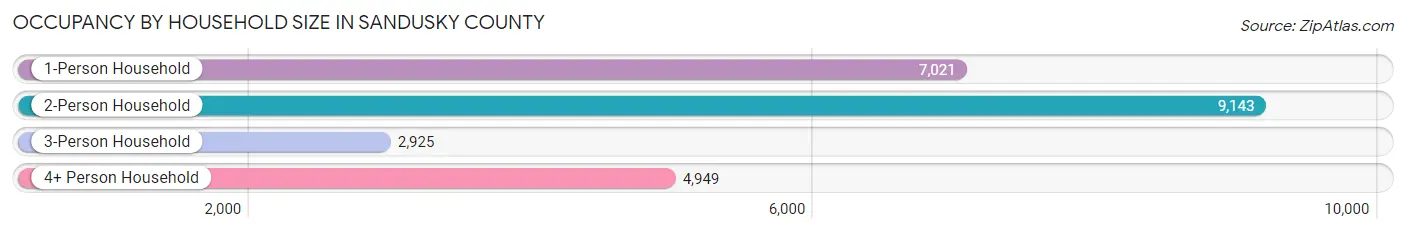
| Household Size | # Housing Units | % Housing Units |
| 1-Person Household | 7,021 | 29.2% |
| 2-Person Household | 9,143 | 38.0% |
| 3-Person Household | 2,925 | 12.2% |
| 4+ Person Household | 4,949 | 20.6% |
| Total Housing Units | 24,038 | 100.0% |
Occupancy by Ownership by Household Size in Sandusky County
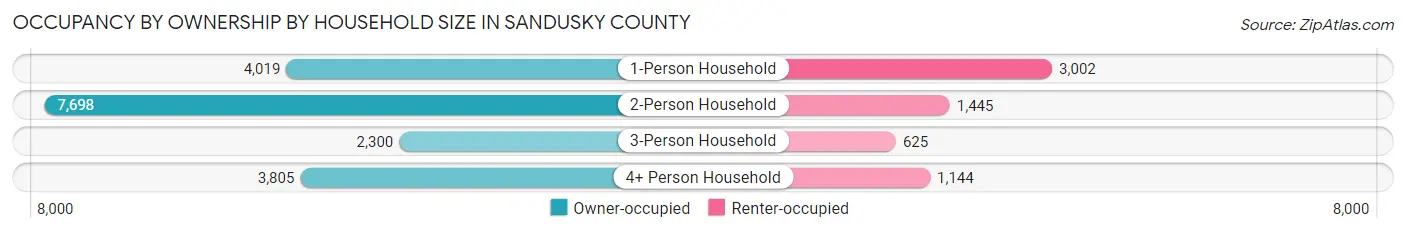
| Household Size | Owner-occupied | Renter-occupied |
| 1-Person Household | 4,019 (57.2%) | 3,002 (42.8%) |
| 2-Person Household | 7,698 (84.2%) | 1,445 (15.8%) |
| 3-Person Household | 2,300 (78.6%) | 625 (21.4%) |
| 4+ Person Household | 3,805 (76.9%) | 1,144 (23.1%) |
| Total Housing Units | 17,822 (74.1%) | 6,216 (25.9%) |
Occupancy by Educational Attainment in Sandusky County
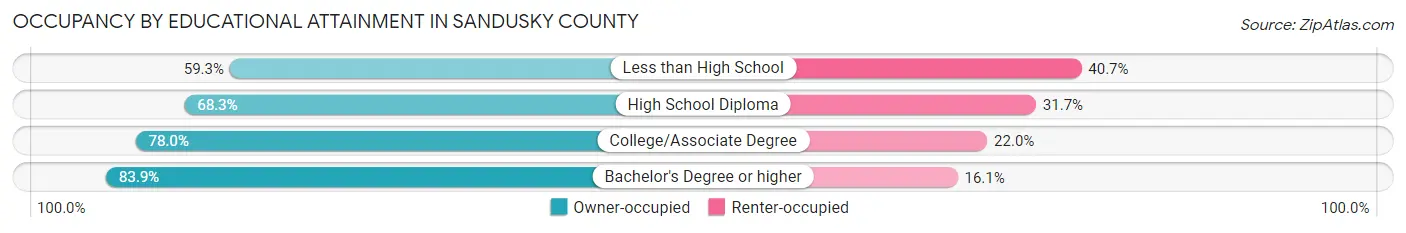
| Household Size | Owner-occupied | Renter-occupied |
| Less than High School | 878 (59.3%) | 602 (40.7%) |
| High School Diploma | 6,494 (68.3%) | 3,010 (31.7%) |
| College/Associate Degree | 6,613 (78.0%) | 1,866 (22.0%) |
| Bachelor's Degree or higher | 3,837 (83.9%) | 738 (16.1%) |
Occupancy by Age of Householder in Sandusky County
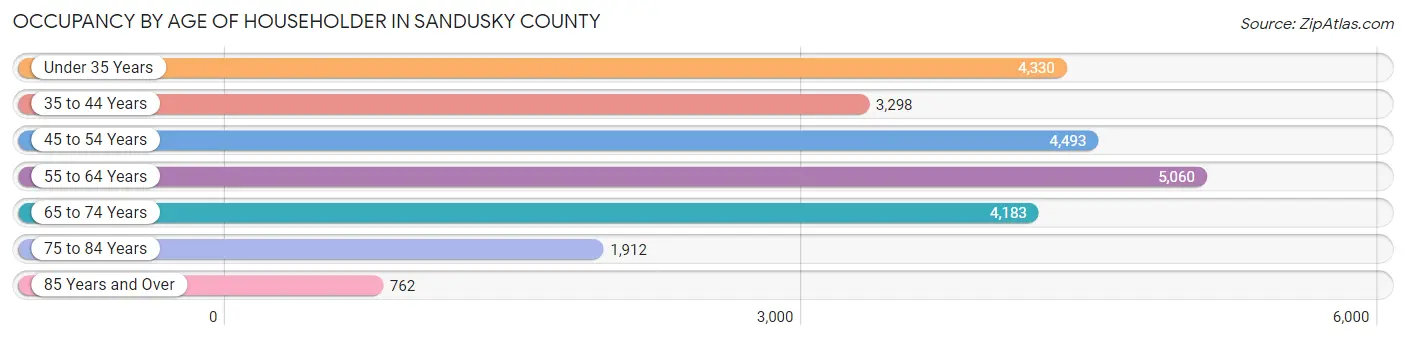
| Age Bracket | # Households | % Households |
| Under 35 Years | 4,330 | 18.0% |
| 35 to 44 Years | 3,298 | 13.7% |
| 45 to 54 Years | 4,493 | 18.7% |
| 55 to 64 Years | 5,060 | 21.0% |
| 65 to 74 Years | 4,183 | 17.4% |
| 75 to 84 Years | 1,912 | 8.0% |
| 85 Years and Over | 762 | 3.2% |
| Total | 24,038 | 100.0% |
Housing Finances in Sandusky County
Median Income by Occupancy in Sandusky County
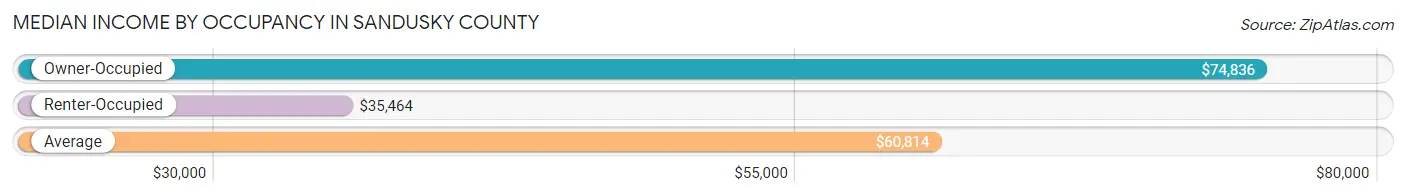
| Occupancy Type | # Households | Median Income |
| Owner-Occupied | 17,822 (74.1%) | $74,836 |
| Renter-Occupied | 6,216 (25.9%) | $35,464 |
| Average | 24,038 (100.0%) | $60,814 |
Occupancy by Householder Income Bracket in Sandusky County
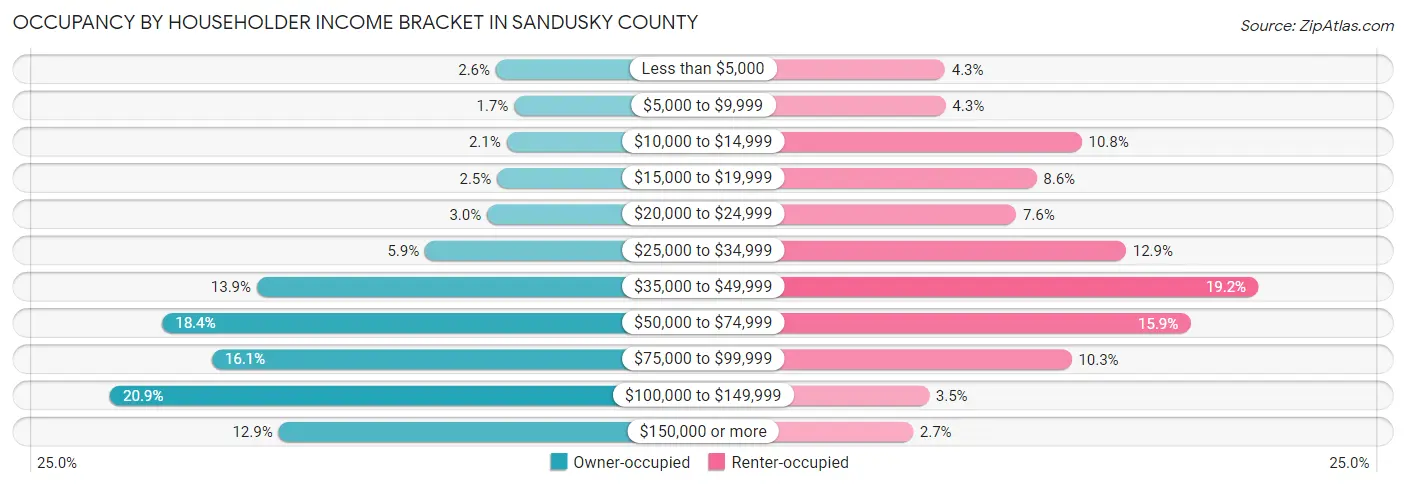
| Income Bracket | Owner-occupied | Renter-occupied |
| Less than $5,000 | 457 (2.6%) | 264 (4.3%) |
| $5,000 to $9,999 | 301 (1.7%) | 266 (4.3%) |
| $10,000 to $14,999 | 365 (2.1%) | 669 (10.8%) |
| $15,000 to $19,999 | 445 (2.5%) | 535 (8.6%) |
| $20,000 to $24,999 | 531 (3.0%) | 475 (7.6%) |
| $25,000 to $34,999 | 1,056 (5.9%) | 800 (12.9%) |
| $35,000 to $49,999 | 2,485 (13.9%) | 1,191 (19.2%) |
| $50,000 to $74,999 | 3,286 (18.4%) | 990 (15.9%) |
| $75,000 to $99,999 | 2,866 (16.1%) | 639 (10.3%) |
| $100,000 to $149,999 | 3,730 (20.9%) | 217 (3.5%) |
| $150,000 or more | 2,300 (12.9%) | 170 (2.7%) |
| Total | 17,822 (100.0%) | 6,216 (100.0%) |
Monthly Housing Cost Tiers in Sandusky County
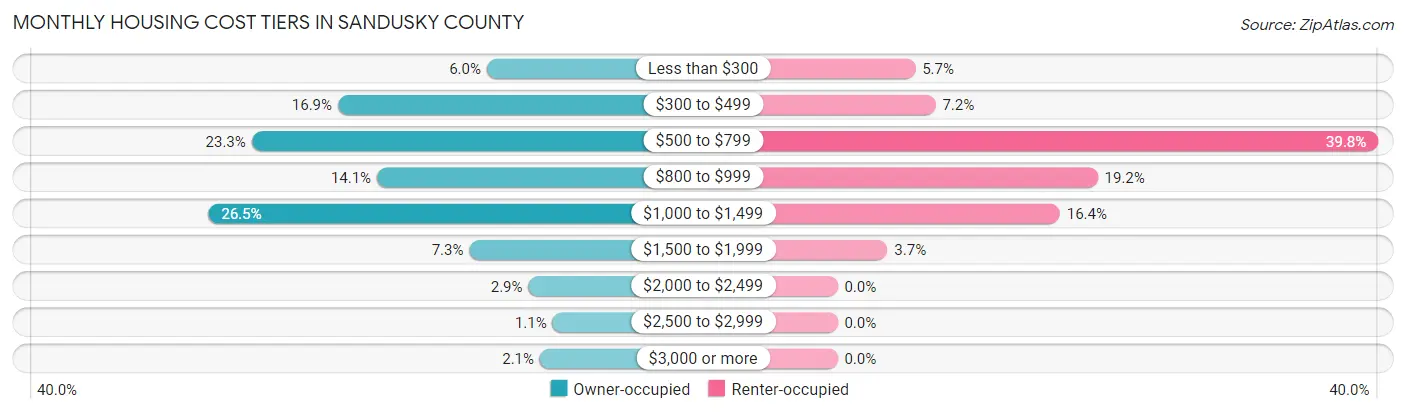
| Monthly Cost | Owner-occupied | Renter-occupied |
| Less than $300 | 1,062 (6.0%) | 356 (5.7%) |
| $300 to $499 | 3,017 (16.9%) | 449 (7.2%) |
| $500 to $799 | 4,149 (23.3%) | 2,475 (39.8%) |
| $800 to $999 | 2,504 (14.1%) | 1,191 (19.2%) |
| $1,000 to $1,499 | 4,717 (26.5%) | 1,018 (16.4%) |
| $1,500 to $1,999 | 1,292 (7.2%) | 229 (3.7%) |
| $2,000 to $2,499 | 516 (2.9%) | 0 (0.0%) |
| $2,500 to $2,999 | 199 (1.1%) | 0 (0.0%) |
| $3,000 or more | 366 (2.1%) | 0 (0.0%) |
| Total | 17,822 (100.0%) | 6,216 (100.0%) |
Physical Housing Characteristics in Sandusky County
Housing Structures in Sandusky County
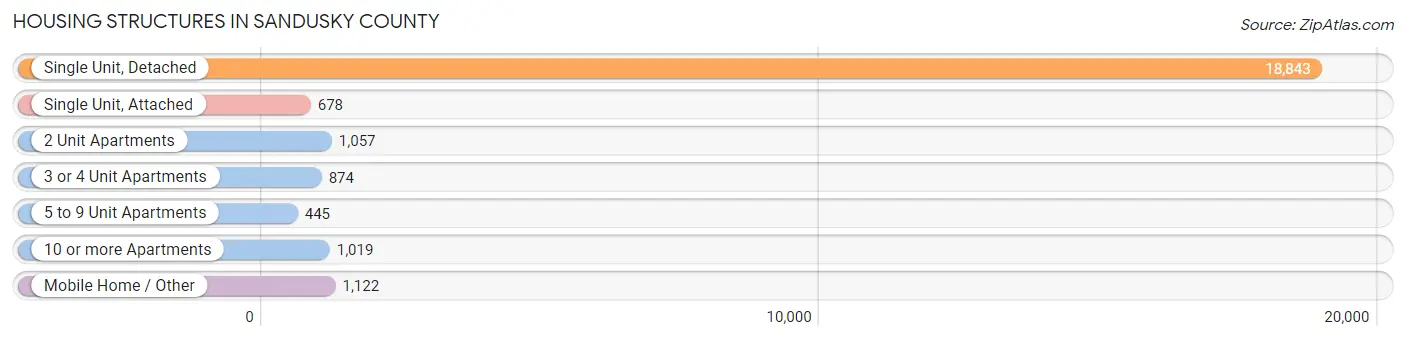
| Structure Type | # Housing Units | % Housing Units |
| Single Unit, Detached | 18,843 | 78.4% |
| Single Unit, Attached | 678 | 2.8% |
| 2 Unit Apartments | 1,057 | 4.4% |
| 3 or 4 Unit Apartments | 874 | 3.6% |
| 5 to 9 Unit Apartments | 445 | 1.8% |
| 10 or more Apartments | 1,019 | 4.2% |
| Mobile Home / Other | 1,122 | 4.7% |
| Total | 24,038 | 100.0% |
Housing Structures by Occupancy in Sandusky County
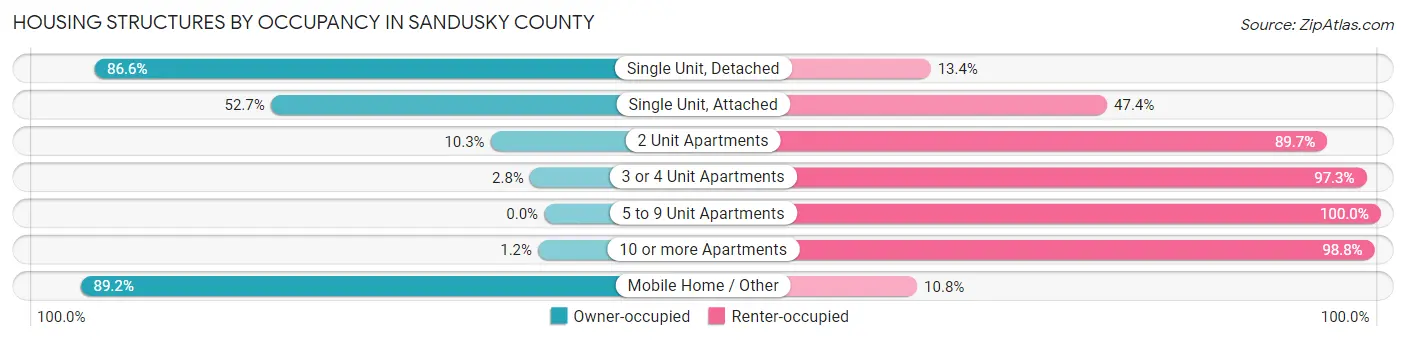
| Structure Type | Owner-occupied | Renter-occupied |
| Single Unit, Detached | 16,319 (86.6%) | 2,524 (13.4%) |
| Single Unit, Attached | 357 (52.6%) | 321 (47.3%) |
| 2 Unit Apartments | 109 (10.3%) | 948 (89.7%) |
| 3 or 4 Unit Apartments | 24 (2.8%) | 850 (97.3%) |
| 5 to 9 Unit Apartments | 0 (0.0%) | 445 (100.0%) |
| 10 or more Apartments | 12 (1.2%) | 1,007 (98.8%) |
| Mobile Home / Other | 1,001 (89.2%) | 121 (10.8%) |
| Total | 17,822 (74.1%) | 6,216 (25.9%) |
Housing Structures by Number of Rooms in Sandusky County
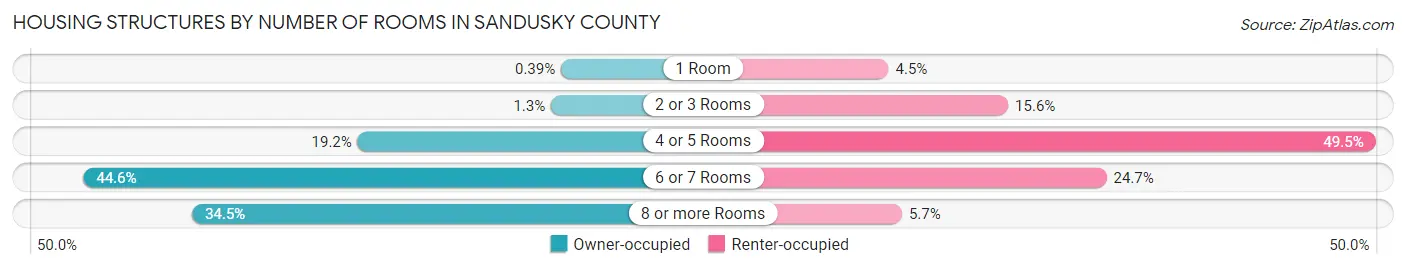
| Number of Rooms | Owner-occupied | Renter-occupied |
| 1 Room | 70 (0.4%) | 280 (4.5%) |
| 2 or 3 Rooms | 234 (1.3%) | 967 (15.6%) |
| 4 or 5 Rooms | 3,422 (19.2%) | 3,079 (49.5%) |
| 6 or 7 Rooms | 7,944 (44.6%) | 1,533 (24.7%) |
| 8 or more Rooms | 6,152 (34.5%) | 357 (5.7%) |
| Total | 17,822 (100.0%) | 6,216 (100.0%) |
Housing Structure by Heating Type in Sandusky County
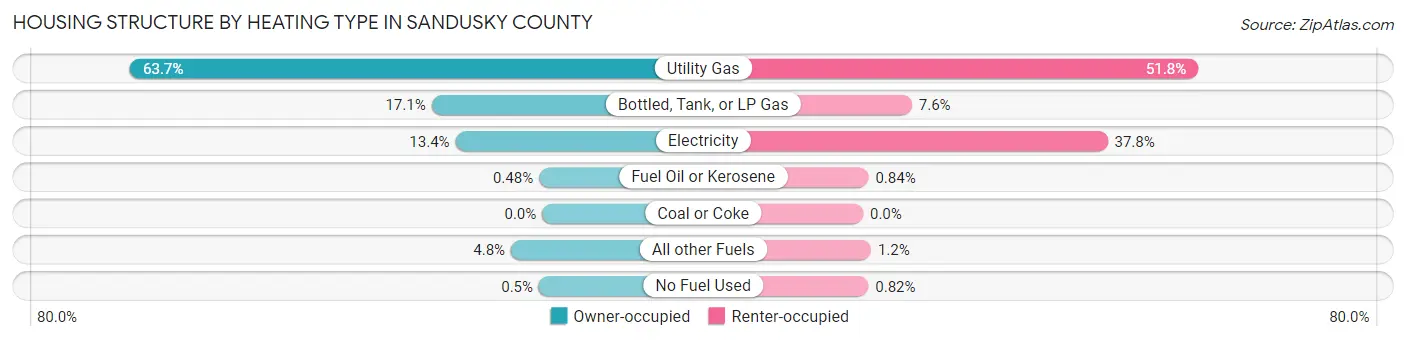
| Heating Type | Owner-occupied | Renter-occupied |
| Utility Gas | 11,353 (63.7%) | 3,219 (51.8%) |
| Bottled, Tank, or LP Gas | 3,047 (17.1%) | 469 (7.5%) |
| Electricity | 2,388 (13.4%) | 2,349 (37.8%) |
| Fuel Oil or Kerosene | 85 (0.5%) | 52 (0.8%) |
| Coal or Coke | 0 (0.0%) | 0 (0.0%) |
| All other Fuels | 859 (4.8%) | 76 (1.2%) |
| No Fuel Used | 90 (0.5%) | 51 (0.8%) |
| Total | 17,822 (100.0%) | 6,216 (100.0%) |
Household Vehicle Usage in Sandusky County
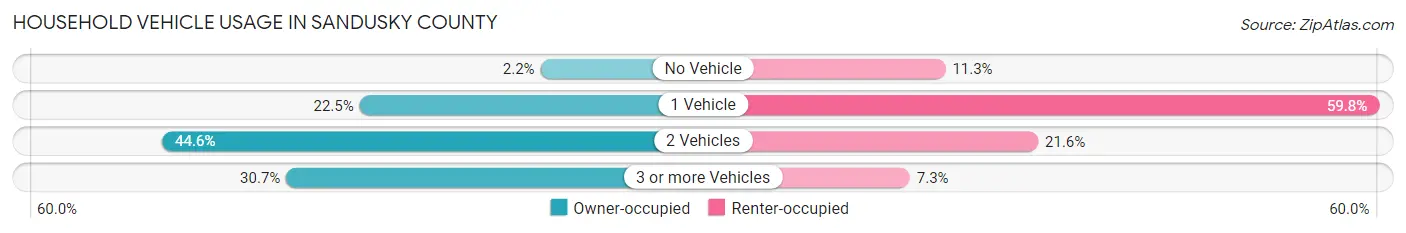
| Vehicles per Household | Owner-occupied | Renter-occupied |
| No Vehicle | 395 (2.2%) | 700 (11.3%) |
| 1 Vehicle | 4,006 (22.5%) | 3,719 (59.8%) |
| 2 Vehicles | 7,949 (44.6%) | 1,345 (21.6%) |
| 3 or more Vehicles | 5,472 (30.7%) | 452 (7.3%) |
| Total | 17,822 (100.0%) | 6,216 (100.0%) |
Real Estate & Mortgages in Sandusky County
Real Estate and Mortgage Overview in Sandusky County
| Characteristic | Without Mortgage | With Mortgage |
| Housing Units | 7,263 | 10,559 |
| Median Property Value | $137,600 | $144,200 |
| Median Household Income | $58,591 | $1,662 |
| Monthly Housing Costs | $484 | $366 |
| Real Estate Taxes | $1,612 | $341 |
Property Value by Mortgage Status in Sandusky County
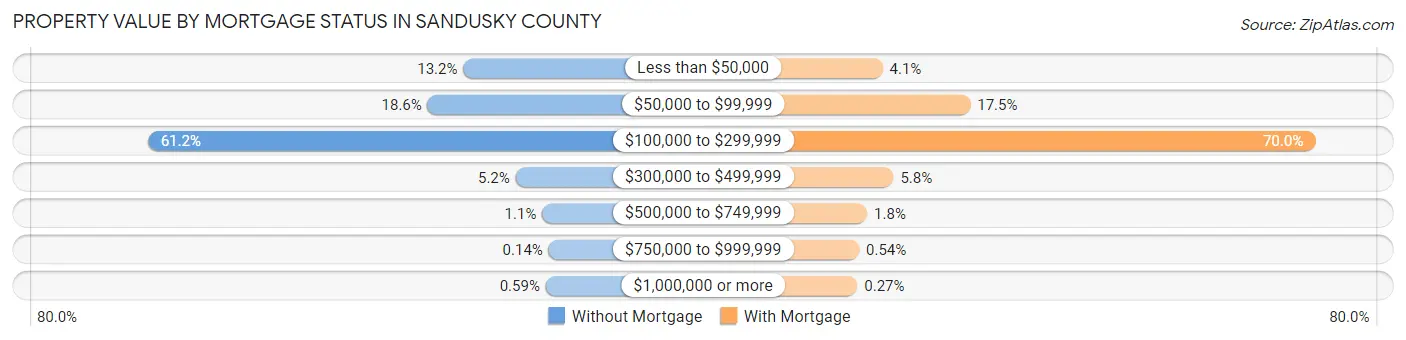
| Property Value | Without Mortgage | With Mortgage |
| Less than $50,000 | 955 (13.2%) | 435 (4.1%) |
| $50,000 to $99,999 | 1,350 (18.6%) | 1,846 (17.5%) |
| $100,000 to $299,999 | 4,448 (61.2%) | 7,395 (70.0%) |
| $300,000 to $499,999 | 376 (5.2%) | 610 (5.8%) |
| $500,000 to $749,999 | 81 (1.1%) | 187 (1.8%) |
| $750,000 to $999,999 | 10 (0.1%) | 57 (0.5%) |
| $1,000,000 or more | 43 (0.6%) | 29 (0.3%) |
| Total | 7,263 (100.0%) | 10,559 (100.0%) |
Household Income by Mortgage Status in Sandusky County
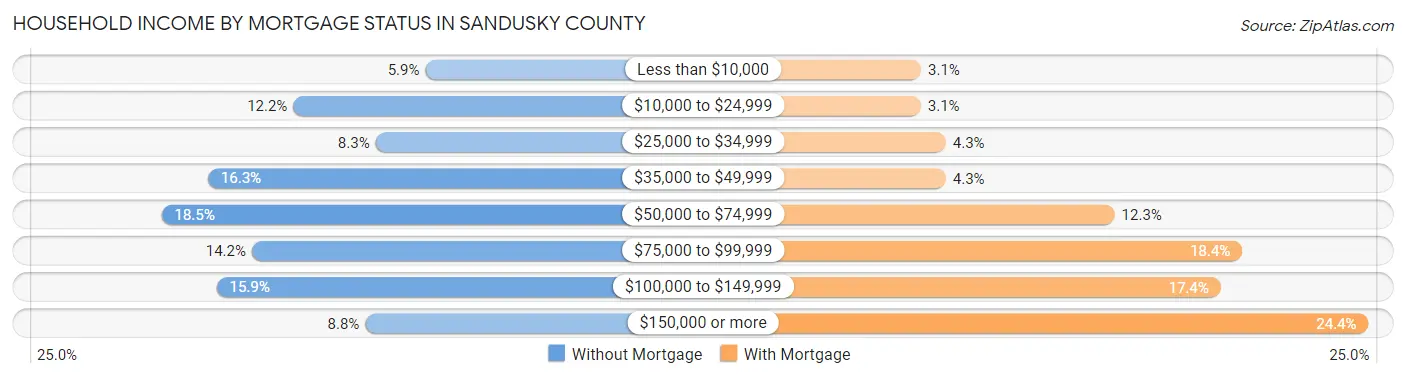
| Household Income | Without Mortgage | With Mortgage |
| Less than $10,000 | 430 (5.9%) | 329 (3.1%) |
| $10,000 to $24,999 | 887 (12.2%) | 328 (3.1%) |
| $25,000 to $34,999 | 602 (8.3%) | 454 (4.3%) |
| $35,000 to $49,999 | 1,182 (16.3%) | 454 (4.3%) |
| $50,000 to $74,999 | 1,342 (18.5%) | 1,303 (12.3%) |
| $75,000 to $99,999 | 1,030 (14.2%) | 1,944 (18.4%) |
| $100,000 to $149,999 | 1,152 (15.9%) | 1,836 (17.4%) |
| $150,000 or more | 638 (8.8%) | 2,578 (24.4%) |
| Total | 7,263 (100.0%) | 10,559 (100.0%) |
Property Value to Household Income Ratio in Sandusky County
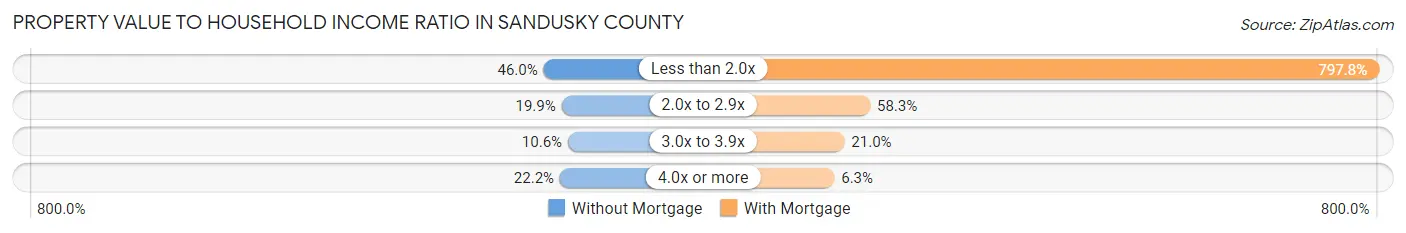
| Value-to-Income Ratio | Without Mortgage | With Mortgage |
| Less than 2.0x | 3,343 (46.0%) | 84,241 (797.8%) |
| 2.0x to 2.9x | 1,447 (19.9%) | 6,159 (58.3%) |
| 3.0x to 3.9x | 771 (10.6%) | 2,221 (21.0%) |
| 4.0x or more | 1,614 (22.2%) | 665 (6.3%) |
| Total | 7,263 (100.0%) | 10,559 (100.0%) |
Real Estate Taxes by Mortgage Status in Sandusky County
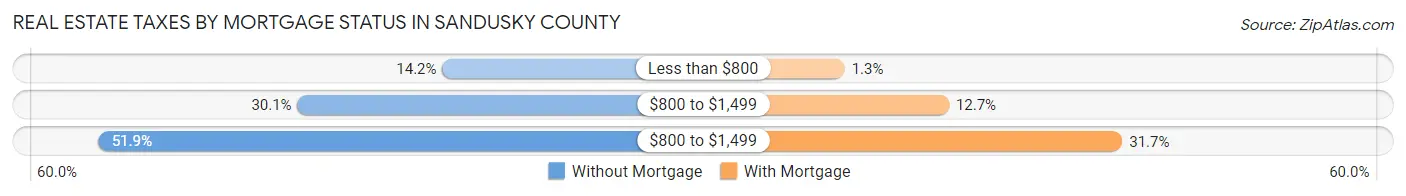
| Property Taxes | Without Mortgage | With Mortgage |
| Less than $800 | 1,033 (14.2%) | 135 (1.3%) |
| $800 to $1,499 | 2,186 (30.1%) | 1,341 (12.7%) |
| $800 to $1,499 | 3,767 (51.9%) | 3,347 (31.7%) |
| Total | 7,263 (100.0%) | 10,559 (100.0%) |
Health & Disability in Sandusky County
Health Insurance Coverage by Age in Sandusky County
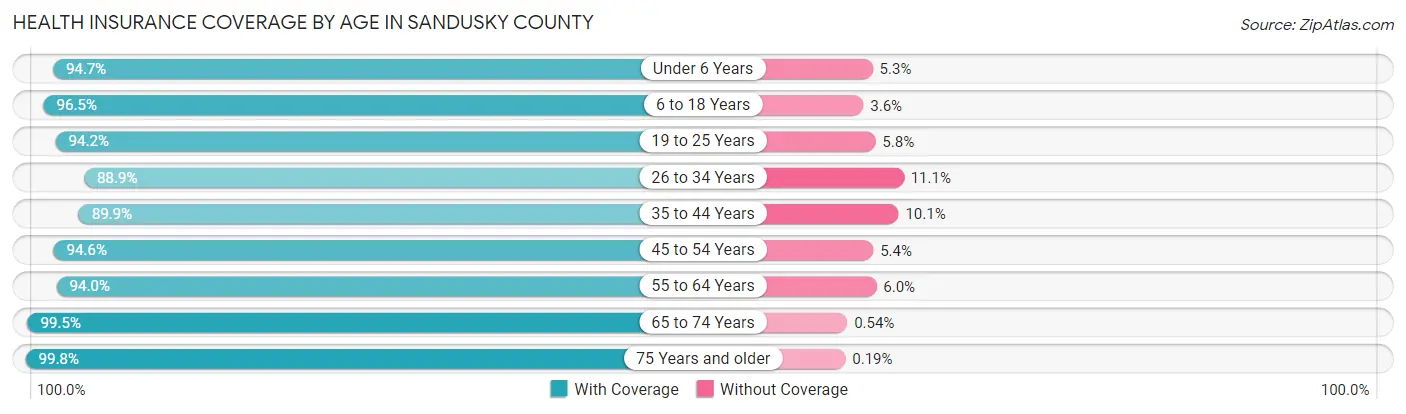
| Age Bracket | With Coverage | Without Coverage |
| Under 6 Years | 3,581 (94.7%) | 200 (5.3%) |
| 6 to 18 Years | 9,372 (96.5%) | 345 (3.5%) |
| 19 to 25 Years | 4,110 (94.2%) | 253 (5.8%) |
| 26 to 34 Years | 5,746 (88.9%) | 716 (11.1%) |
| 35 to 44 Years | 6,189 (89.9%) | 696 (10.1%) |
| 45 to 54 Years | 7,043 (94.6%) | 402 (5.4%) |
| 55 to 64 Years | 8,000 (94.0%) | 509 (6.0%) |
| 65 to 74 Years | 6,595 (99.5%) | 36 (0.5%) |
| 75 Years and older | 4,172 (99.8%) | 8 (0.2%) |
| Total | 54,808 (94.5%) | 3,165 (5.5%) |
Health Insurance Coverage by Citizenship Status in Sandusky County
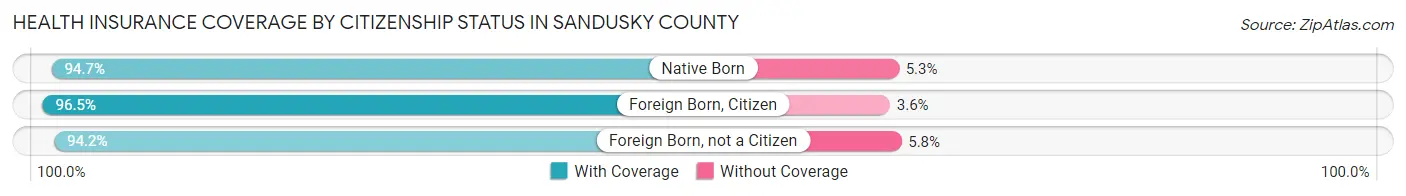
| Citizenship Status | With Coverage | Without Coverage |
| Native Born | 3,581 (94.7%) | 200 (5.3%) |
| Foreign Born, Citizen | 9,372 (96.5%) | 345 (3.5%) |
| Foreign Born, not a Citizen | 4,110 (94.2%) | 253 (5.8%) |
Health Insurance Coverage by Household Income in Sandusky County
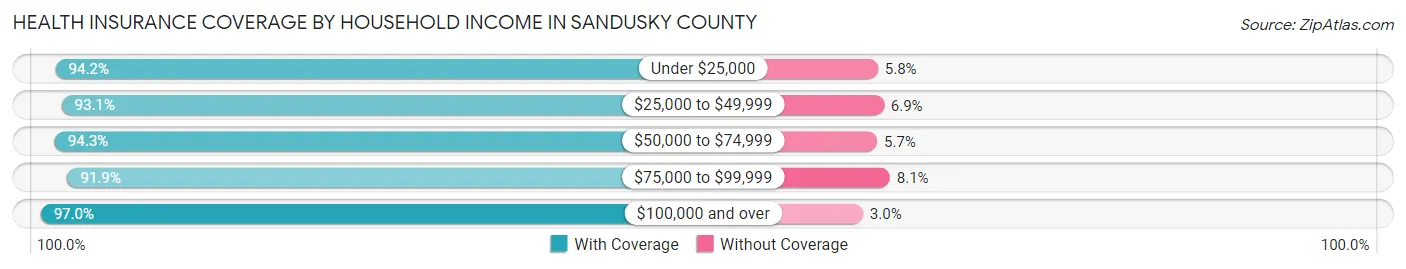
| Household Income | With Coverage | Without Coverage |
| Under $25,000 | 6,584 (94.2%) | 407 (5.8%) |
| $25,000 to $49,999 | 10,109 (93.1%) | 754 (6.9%) |
| $50,000 to $74,999 | 9,332 (94.3%) | 562 (5.7%) |
| $75,000 to $99,999 | 8,783 (91.9%) | 770 (8.1%) |
| $100,000 and over | 19,702 (97.0%) | 614 (3.0%) |
Public vs Private Health Insurance Coverage by Age in Sandusky County
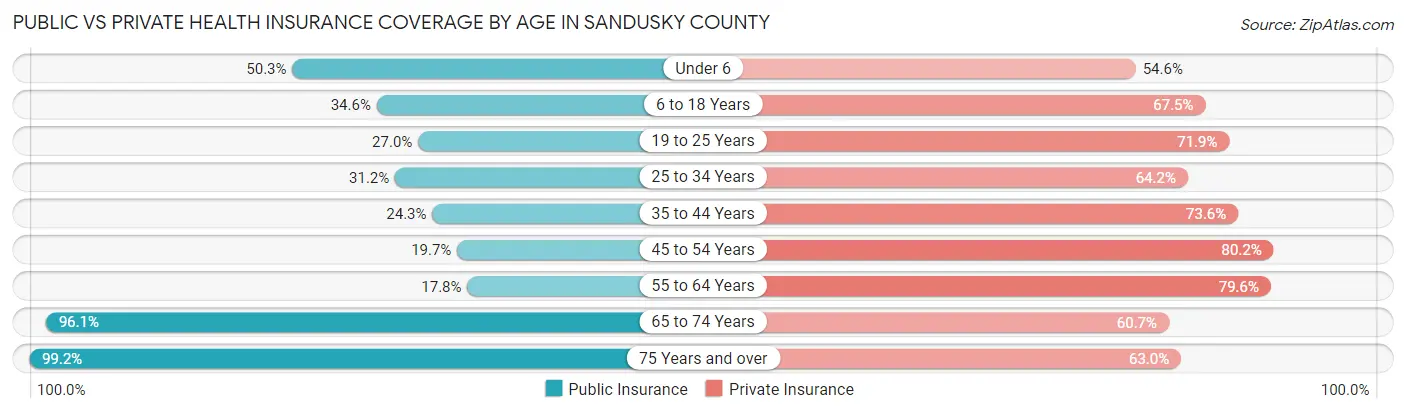
| Age Bracket | Public Insurance | Private Insurance |
| Under 6 | 1,902 (50.3%) | 2,063 (54.6%) |
| 6 to 18 Years | 3,366 (34.6%) | 6,557 (67.5%) |
| 19 to 25 Years | 1,176 (27.0%) | 3,138 (71.9%) |
| 25 to 34 Years | 2,018 (31.2%) | 4,149 (64.2%) |
| 35 to 44 Years | 1,674 (24.3%) | 5,064 (73.6%) |
| 45 to 54 Years | 1,467 (19.7%) | 5,967 (80.1%) |
| 55 to 64 Years | 1,516 (17.8%) | 6,775 (79.6%) |
| 65 to 74 Years | 6,371 (96.1%) | 4,025 (60.7%) |
| 75 Years and over | 4,146 (99.2%) | 2,632 (63.0%) |
| Total | 23,636 (40.8%) | 40,370 (69.6%) |
Disability Status by Sex by Age in Sandusky County
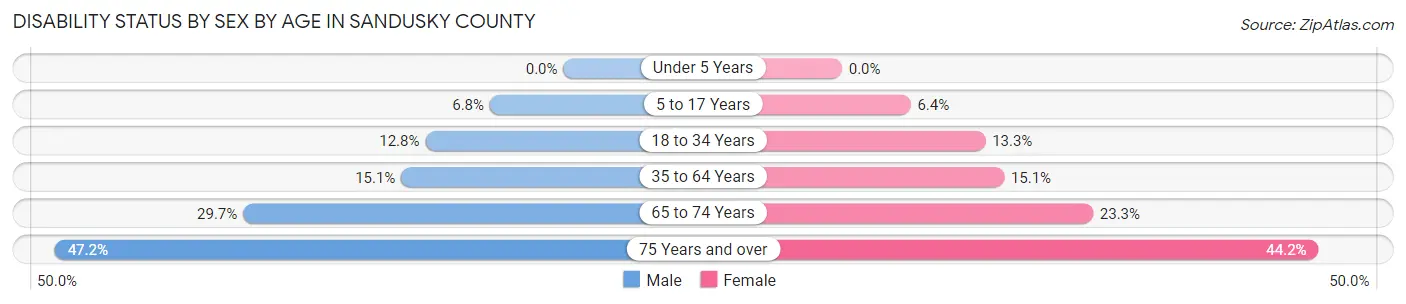
| Age Bracket | Male | Female |
| Under 5 Years | 0 (0.0%) | 0 (0.0%) |
| 5 to 17 Years | 330 (6.8%) | 307 (6.4%) |
| 18 to 34 Years | 749 (12.8%) | 751 (13.3%) |
| 35 to 64 Years | 1,744 (15.0%) | 1,693 (15.0%) |
| 65 to 74 Years | 968 (29.7%) | 786 (23.3%) |
| 75 Years and over | 827 (47.2%) | 1,074 (44.2%) |
Disability Class by Sex by Age in Sandusky County
Disability Class: Hearing Difficulty
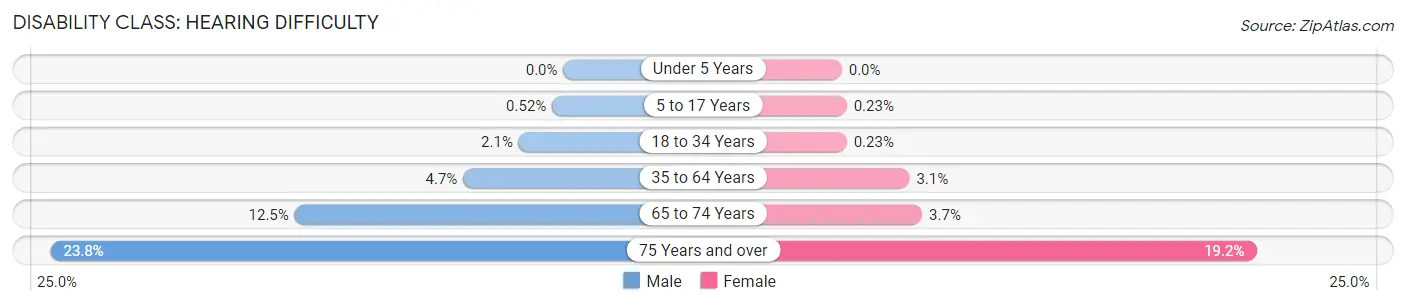
| Age Bracket | Male | Female |
| Under 5 Years | 0 (0.0%) | 0 (0.0%) |
| 5 to 17 Years | 25 (0.5%) | 11 (0.2%) |
| 18 to 34 Years | 121 (2.1%) | 13 (0.2%) |
| 35 to 64 Years | 539 (4.6%) | 353 (3.1%) |
| 65 to 74 Years | 406 (12.5%) | 126 (3.7%) |
| 75 Years and over | 417 (23.8%) | 467 (19.2%) |
Disability Class: Vision Difficulty
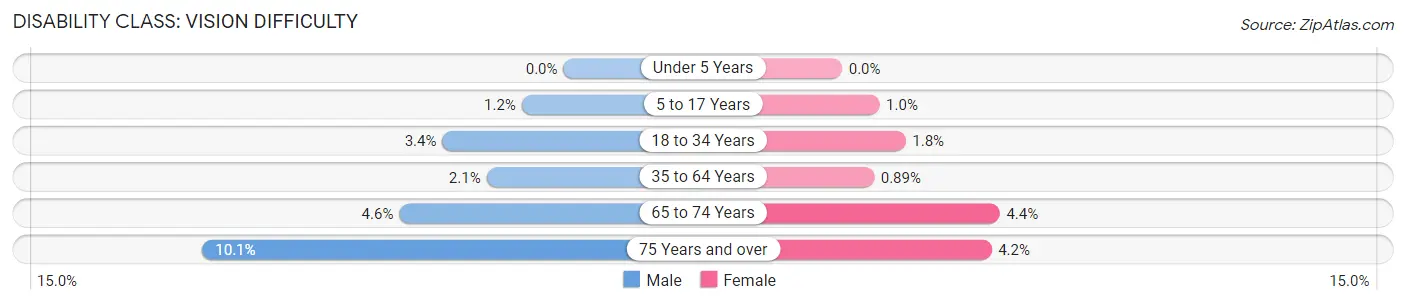
| Age Bracket | Male | Female |
| Under 5 Years | 0 (0.0%) | 0 (0.0%) |
| 5 to 17 Years | 56 (1.2%) | 50 (1.0%) |
| 18 to 34 Years | 197 (3.4%) | 100 (1.8%) |
| 35 to 64 Years | 248 (2.1%) | 100 (0.9%) |
| 65 to 74 Years | 149 (4.6%) | 148 (4.4%) |
| 75 Years and over | 176 (10.1%) | 101 (4.2%) |
Disability Class: Cognitive Difficulty
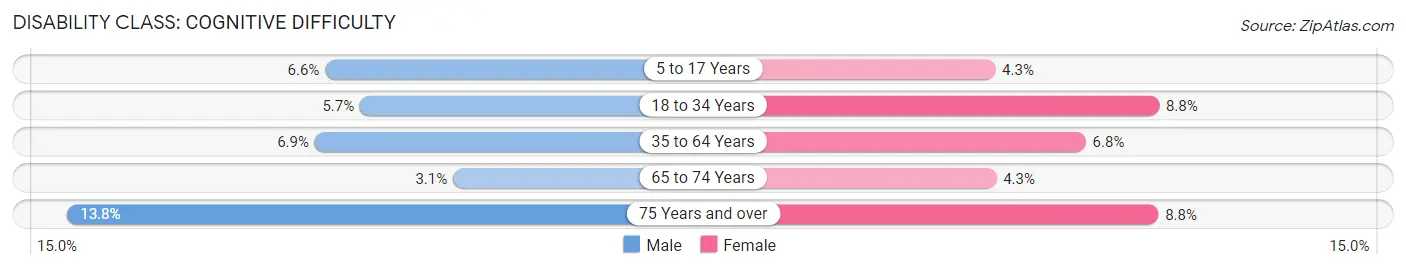
| Age Bracket | Male | Female |
| 5 to 17 Years | 321 (6.6%) | 206 (4.3%) |
| 18 to 34 Years | 331 (5.7%) | 498 (8.8%) |
| 35 to 64 Years | 802 (6.9%) | 764 (6.8%) |
| 65 to 74 Years | 100 (3.1%) | 145 (4.3%) |
| 75 Years and over | 242 (13.8%) | 214 (8.8%) |
Disability Class: Ambulatory Difficulty
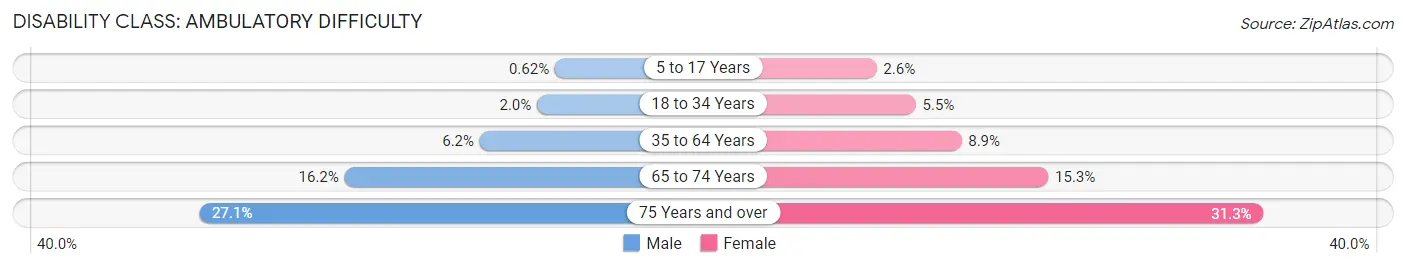
| Age Bracket | Male | Female |
| 5 to 17 Years | 30 (0.6%) | 124 (2.6%) |
| 18 to 34 Years | 114 (1.9%) | 309 (5.5%) |
| 35 to 64 Years | 718 (6.2%) | 998 (8.9%) |
| 65 to 74 Years | 529 (16.2%) | 517 (15.3%) |
| 75 Years and over | 474 (27.1%) | 760 (31.3%) |
Disability Class: Self-Care Difficulty
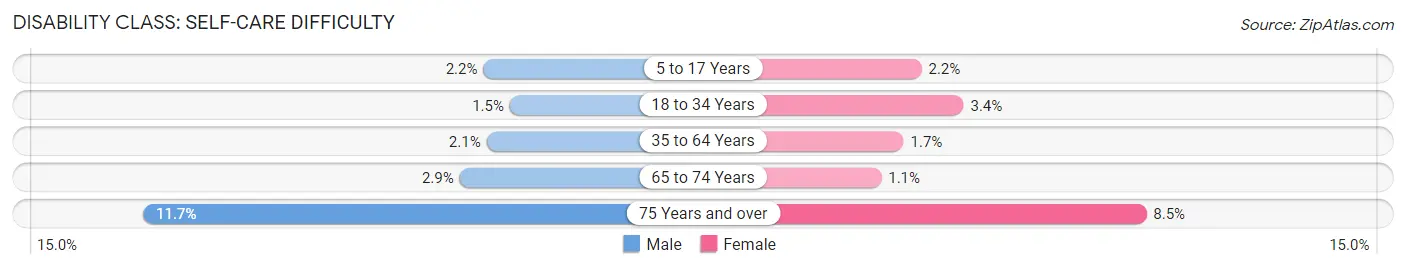
| Age Bracket | Male | Female |
| 5 to 17 Years | 108 (2.2%) | 107 (2.2%) |
| 18 to 34 Years | 87 (1.5%) | 191 (3.4%) |
| 35 to 64 Years | 248 (2.1%) | 194 (1.7%) |
| 65 to 74 Years | 94 (2.9%) | 37 (1.1%) |
| 75 Years and over | 205 (11.7%) | 206 (8.5%) |
Technology Access in Sandusky County
Computing Device Access in Sandusky County
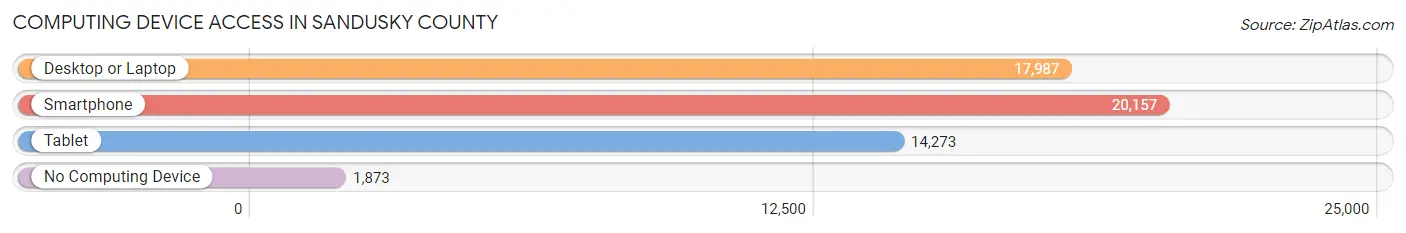
| Device Type | # Households | % Households |
| Desktop or Laptop | 17,987 | 74.8% |
| Smartphone | 20,157 | 83.9% |
| Tablet | 14,273 | 59.4% |
| No Computing Device | 1,873 | 7.8% |
| Total | 24,038 | 100.0% |
Internet Access in Sandusky County
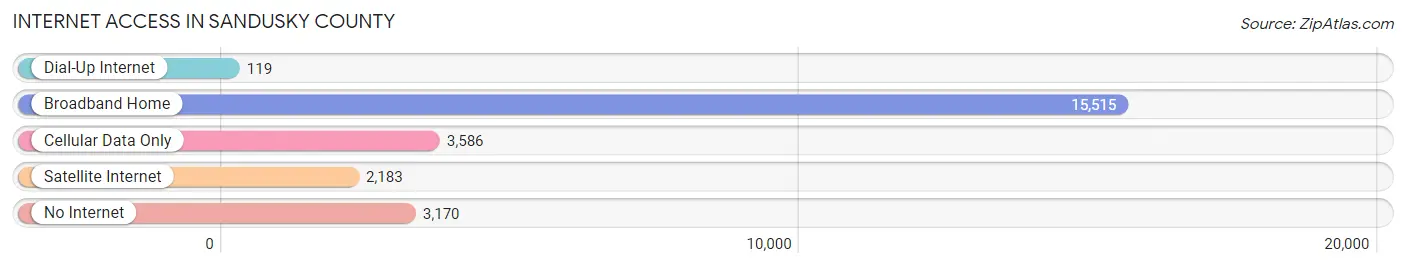
| Internet Type | # Households | % Households |
| Dial-Up Internet | 119 | 0.5% |
| Broadband Home | 15,515 | 64.5% |
| Cellular Data Only | 3,586 | 14.9% |
| Satellite Internet | 2,183 | 9.1% |
| No Internet | 3,170 | 13.2% |
| Total | 24,038 | 100.0% |
Sandusky County Summary
Sandusky County is located in the northwest corner of Ohio, and is part of the Toledo Metropolitan Statistical Area. The county is bordered by Lake Erie to the north, Seneca County to the east, Wood County to the south, and Ottawa County to the west. Sandusky County has a total area of 545 square miles, of which 537 square miles is land and 8 square miles is water.
History
Sandusky County was formed in 1820 from portions of Huron and Seneca counties. It was named after the Native American tribe of the same name, which had inhabited the area for centuries prior to European settlement. The county was originally divided into four townships: Ballville, Green Creek, Riley, and Sandusky.
The first settlers in the county were mostly of German and Irish descent, and they established farms and small businesses. The county was also home to a large number of Native Americans, who were mostly members of the Wyandot tribe.
In the mid-1800s, the county experienced a period of rapid growth and development. The county seat, Fremont, was established in 1824 and quickly became a hub of commerce and industry. The county also saw the construction of the Sandusky and Lake Erie Railroad, which connected the county to the rest of Ohio and the Midwest.
Geography
Sandusky County is located in the northwest corner of Ohio, and is part of the Toledo Metropolitan Statistical Area. The county is bordered by Lake Erie to the north, Seneca County to the east, Wood County to the south, and Ottawa County to the west. Sandusky County has a total area of 545 square miles, of which 537 square miles is land and 8 square miles is water.
The county is mostly flat, with some rolling hills in the northern and eastern parts. The Sandusky River runs through the county, and there are several small lakes and ponds scattered throughout the area. The county is also home to several state parks, including East Harbor State Park, Maumee Bay State Park, and Marblehead Lighthouse State Park.
Economy
Sandusky County’s economy is largely based on manufacturing and agriculture. The county is home to several large manufacturing companies, including Whirlpool Corporation, Owens Corning, and Cooper Tire & Rubber Company. Agriculture is also an important part of the county’s economy, with corn, soybeans, and wheat being the primary crops.
The county is also home to several tourist attractions, including the Cedar Point amusement park, the African Safari Wildlife Park, and the Marblehead Lighthouse. These attractions bring in millions of visitors each year, and help to boost the local economy.
Demographics
As of the 2010 census, Sandusky County had a population of 60,944. The population was spread out with 24.3% under the age of 18, 8.2% from 18 to 24, 28.2% from 25 to 44, 24.3% from 45 to 64, and 14.0% who were 65 years of age or older. The median age was 37.4 years.
The racial makeup of the county was 94.2% White, 2.3% African American, 0.3% Native American, 0.7% Asian, 0.1% Pacific Islander, 0.7% from other races, and 1.7% from two or more races. Hispanic or Latino of any race were 2.3% of the population.
The median income for a household in the county was $45,945, and the median income for a family was $54,945. The per capita income for the county was $22,845. About 8.2% of families and 11.2% of the population were below the poverty line, including 15.2% of those under age 18 and 6.2% of those age 65 or over.
Common Questions
What is Per Capita Income in Sandusky County?
Per Capita income in Sandusky County is $32,788.
What is the Median Family Income in Sandusky County?
Median Family Income in Sandusky County is $80,692.
What is the Median Household income in Sandusky County?
Median Household Income in Sandusky County is $60,814.
What is Income or Wage Gap in Sandusky County?
Income or Wage Gap in Sandusky County is 32.7%.
Women in Sandusky County earn 67.3 cents for every dollar earned by a man.
What is Family Income Deficit in Sandusky County?
Family Income Deficit in Sandusky County is $11,069.
Families that are below poverty line in Sandusky County earn $11,069 less on average than the poverty threshold level.
What is Inequality or Gini Index in Sandusky County?
Inequality or Gini Index in Sandusky County is 0.44.
What is the Total Population of Sandusky County?
Total Population of Sandusky County is 58,885.
What is the Total Male Population of Sandusky County?
Total Male Population of Sandusky County is 29,370.
What is the Total Female Population of Sandusky County?
Total Female Population of Sandusky County is 29,515.
What is the Ratio of Males per 100 Females in Sandusky County?
There are 99.51 Males per 100 Females in Sandusky County.
What is the Ratio of Females per 100 Males in Sandusky County?
There are 100.49 Females per 100 Males in Sandusky County.
What is the Median Population Age in Sandusky County?
Median Population Age in Sandusky County is 42.3 Years.
What is the Average Family Size in Sandusky County
Average Family Size in Sandusky County is 3.0 People.
What is the Average Household Size in Sandusky County
Average Household Size in Sandusky County is 2.4 People.
How Large is the Labor Force in Sandusky County?
There are 29,135 People in the Labor Forcein in Sandusky County.
What is the Percentage of People in the Labor Force in Sandusky County?
60.9% of People are in the Labor Force in Sandusky County.
What is the Unemployment Rate in Sandusky County?
Unemployment Rate in Sandusky County is 4.8%.