Mercer County, OH Map & Demographics
Mercer County Overview
$33,892
PER CAPITA INCOME
$95,357
AVG FAMILY INCOME
$73,278
AVG HOUSEHOLD INCOME
36.7%
WAGE / INCOME GAP [ % ]
63.3¢/ $1
WAGE / INCOME GAP [ $ ]
$8,674
FAMILY INCOME DEFICIT
0.39
INEQUALITY / GINI INDEX
42,321
TOTAL POPULATION
21,467
MALE POPULATION
20,854
FEMALE POPULATION
102.94
MALES / 100 FEMALES
97.14
FEMALES / 100 MALES
39.4
MEDIAN AGE
3.2
AVG FAMILY SIZE
2.6
AVG HOUSEHOLD SIZE
22,303
LABOR FORCE [ PEOPLE ]
68.4%
PERCENT IN LABOR FORCE
2.0%
UNEMPLOYMENT RATE
Income in Mercer County
Income Overview in Mercer County
Per Capita Income in Mercer County is $33,892, while median incomes of families and households are $95,357 and $73,278 respectively.
| Characteristic | Number | Measure |
| Per Capita Income | 42,321 | $33,892 |
| Median Family Income | 10,648 | $95,357 |
| Mean Family Income | 10,648 | $102,844 |
| Median Household Income | 16,022 | $73,278 |
| Mean Household Income | 16,022 | $87,555 |
| Income Deficit | 10,648 | $8,674 |
| Wage / Income Gap (%) | 42,321 | 36.71% |
| Wage / Income Gap ($) | 42,321 | 63.29¢ per $1 |
| Gini / Inequality Index | 42,321 | 0.39 |
Earnings by Sex in Mercer County
Average Earnings in Mercer County are $41,794, $52,283 for men and $33,088 for women, a difference of 36.7%.
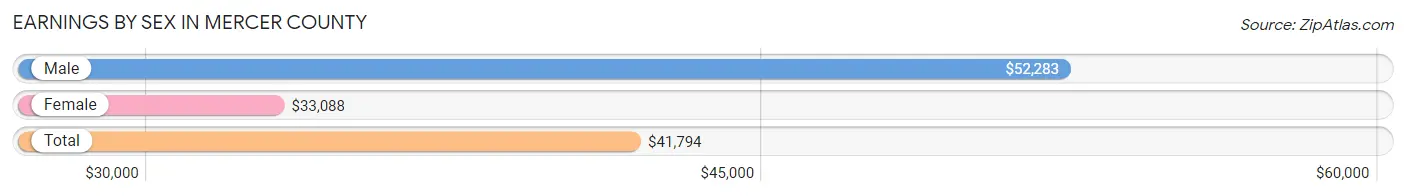
| Sex | Number | Average Earnings |
| Male | 12,405 (53.3%) | $52,283 |
| Female | 10,886 (46.7%) | $33,088 |
| Total | 23,291 (100.0%) | $41,794 |
Earnings by Sex by Income Bracket in Mercer County
The most common earnings brackets in Mercer County are $75,000 to $99,999 for men (1,997 | 16.1%) and $40,000 to $44,999 for women (910 | 8.4%).
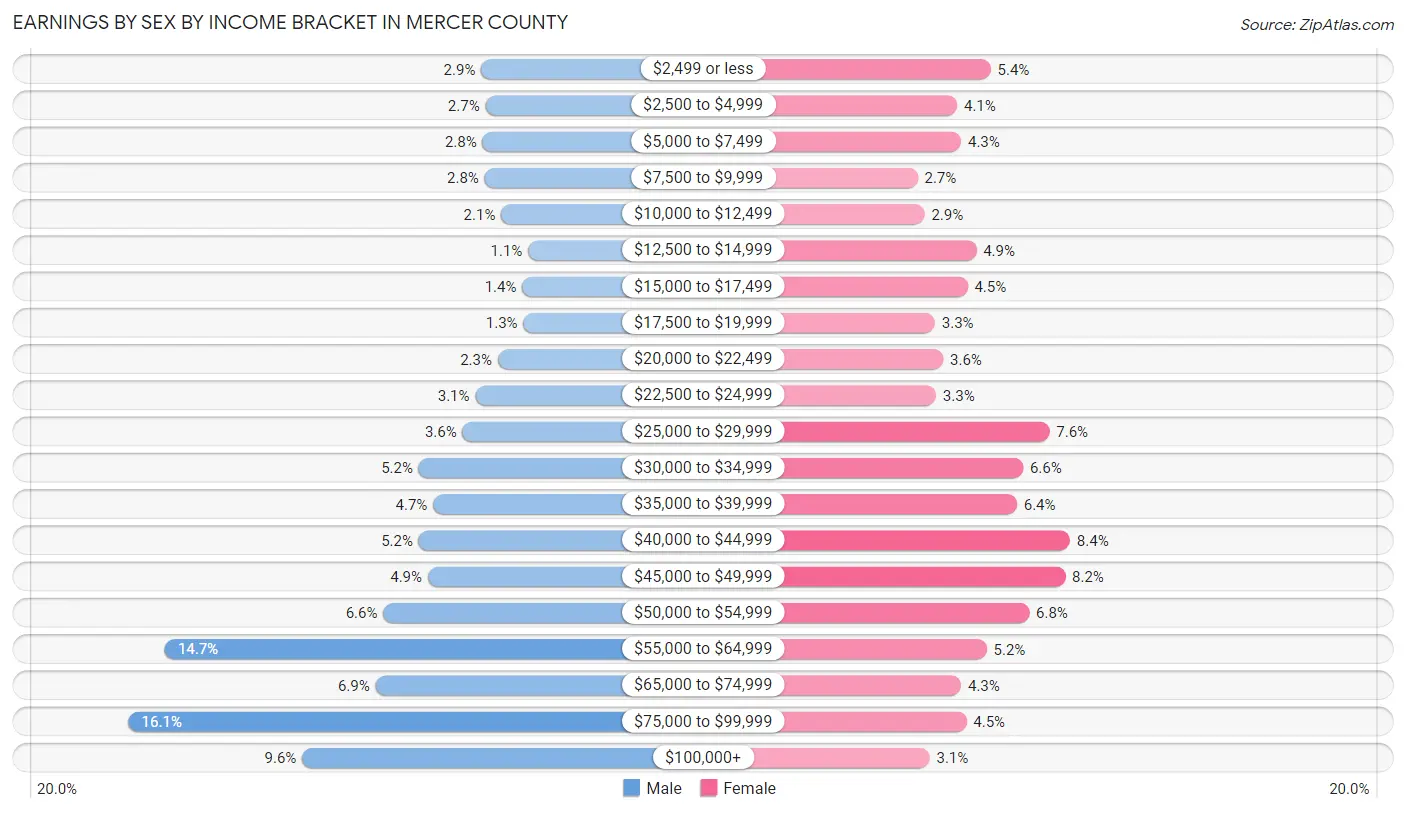
| Income | Male | Female |
| $2,499 or less | 358 (2.9%) | 587 (5.4%) |
| $2,500 to $4,999 | 339 (2.7%) | 450 (4.1%) |
| $5,000 to $7,499 | 352 (2.8%) | 466 (4.3%) |
| $7,500 to $9,999 | 342 (2.8%) | 288 (2.6%) |
| $10,000 to $12,499 | 265 (2.1%) | 317 (2.9%) |
| $12,500 to $14,999 | 140 (1.1%) | 528 (4.9%) |
| $15,000 to $17,499 | 167 (1.3%) | 492 (4.5%) |
| $17,500 to $19,999 | 163 (1.3%) | 359 (3.3%) |
| $20,000 to $22,499 | 281 (2.3%) | 393 (3.6%) |
| $22,500 to $24,999 | 386 (3.1%) | 364 (3.3%) |
| $25,000 to $29,999 | 445 (3.6%) | 826 (7.6%) |
| $30,000 to $34,999 | 649 (5.2%) | 718 (6.6%) |
| $35,000 to $39,999 | 582 (4.7%) | 693 (6.4%) |
| $40,000 to $44,999 | 649 (5.2%) | 910 (8.4%) |
| $45,000 to $49,999 | 607 (4.9%) | 891 (8.2%) |
| $50,000 to $54,999 | 814 (6.6%) | 743 (6.8%) |
| $55,000 to $64,999 | 1,828 (14.7%) | 570 (5.2%) |
| $65,000 to $74,999 | 850 (6.9%) | 466 (4.3%) |
| $75,000 to $99,999 | 1,997 (16.1%) | 488 (4.5%) |
| $100,000+ | 1,191 (9.6%) | 337 (3.1%) |
| Total | 12,405 (100.0%) | 10,886 (100.0%) |
Earnings by Sex by Educational Attainment in Mercer County
Average earnings in Mercer County are $57,134 for men and $37,135 for women, a difference of 35.0%. Men with an educational attainment of bachelor's degree enjoy the highest average annual earnings of $79,720, while those with less than high school education earn the least with $28,571. Women with an educational attainment of graduate degree earn the most with the average annual earnings of $65,521, while those with less than high school education have the smallest earnings of $21,331.
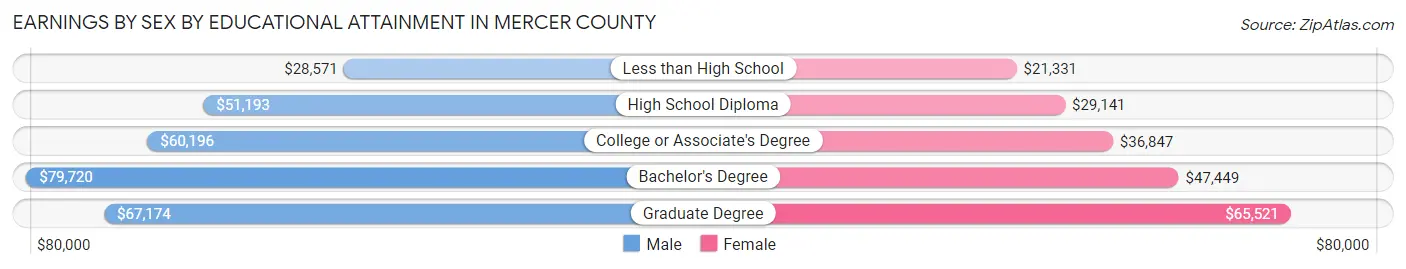
| Educational Attainment | Male Income | Female Income |
| Less than High School | $28,571 | $21,331 |
| High School Diploma | $51,193 | $29,141 |
| College or Associate's Degree | $60,196 | $36,847 |
| Bachelor's Degree | $79,720 | $47,449 |
| Graduate Degree | $67,174 | $65,521 |
| Total | $57,134 | $37,135 |
Family Income in Mercer County
Family Income Brackets in Mercer County
According to the Mercer County family income data, there are 3,503 families falling into the $100,000 to $149,999 income range, which is the most common income bracket and makes up 32.9% of all families. Conversely, the less than $10,000 income bracket is the least frequent group with only 75 families (0.7%) belonging to this category.
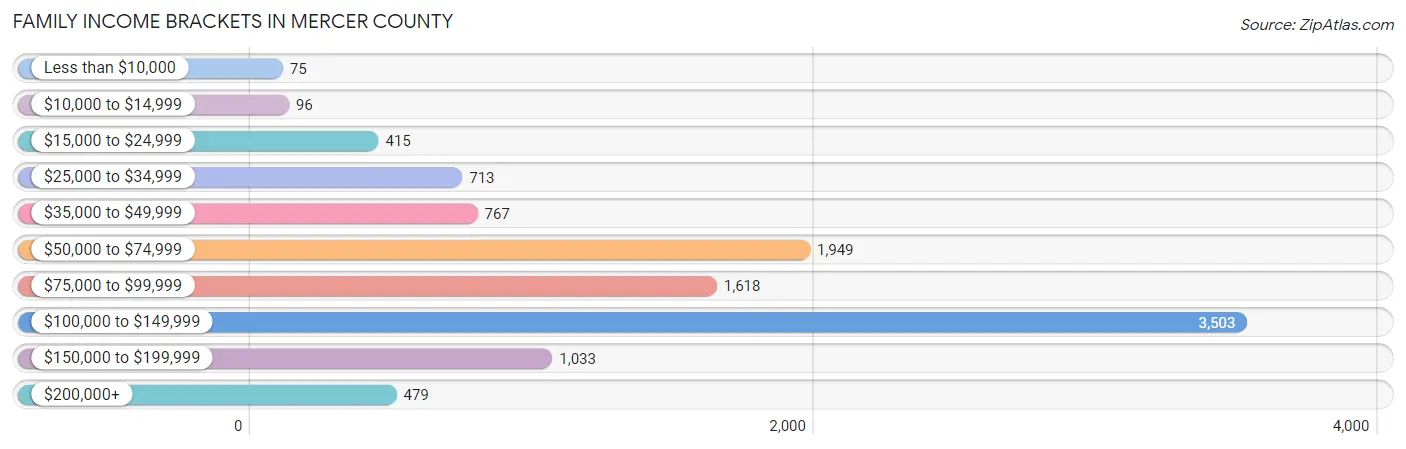
| Income Bracket | # Families | % Families |
| Less than $10,000 | 75 | 0.7% |
| $10,000 to $14,999 | 96 | 0.9% |
| $15,000 to $24,999 | 415 | 3.9% |
| $25,000 to $34,999 | 713 | 6.7% |
| $35,000 to $49,999 | 767 | 7.2% |
| $50,000 to $74,999 | 1,949 | 18.3% |
| $75,000 to $99,999 | 1,618 | 15.2% |
| $100,000 to $149,999 | 3,503 | 32.9% |
| $150,000 to $199,999 | 1,033 | 9.7% |
| $200,000+ | 479 | 4.5% |
Family Income by Famaliy Size in Mercer County
4-person families (1,640 | 15.4%) account for the highest median family income in Mercer County with $122,823 per family, while 2-person families (5,230 | 49.1%) have the highest median income of $36,632 per family member.
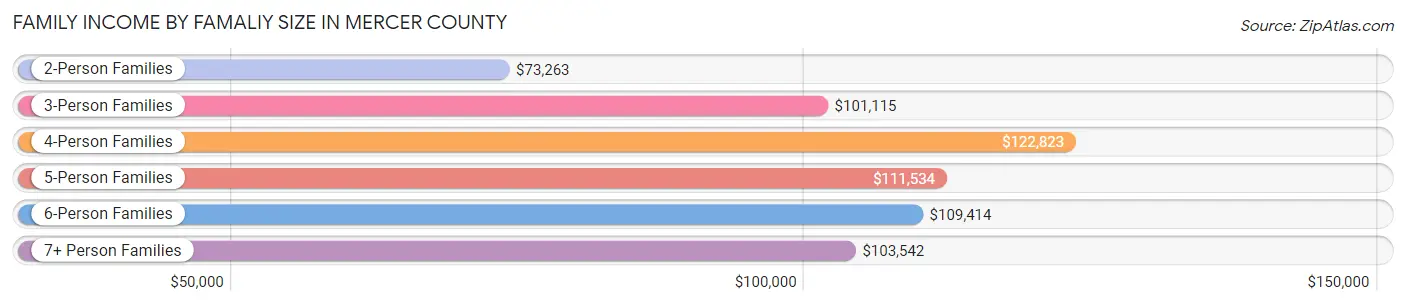
| Income Bracket | # Families | Median Income |
| 2-Person Families | 5,230 (49.1%) | $73,263 |
| 3-Person Families | 1,992 (18.7%) | $101,115 |
| 4-Person Families | 1,640 (15.4%) | $122,823 |
| 5-Person Families | 959 (9.0%) | $111,534 |
| 6-Person Families | 521 (4.9%) | $109,414 |
| 7+ Person Families | 306 (2.9%) | $103,542 |
| Total | 10,648 (100.0%) | $95,357 |
Family Income by Number of Earners in Mercer County
The median family income in Mercer County is $95,357, with families comprising 3+ earners (1,680) having the highest median family income of $142,813, while families with no earners (1,628) have the lowest median family income of $46,434, accounting for 15.8% and 15.3% of families, respectively.
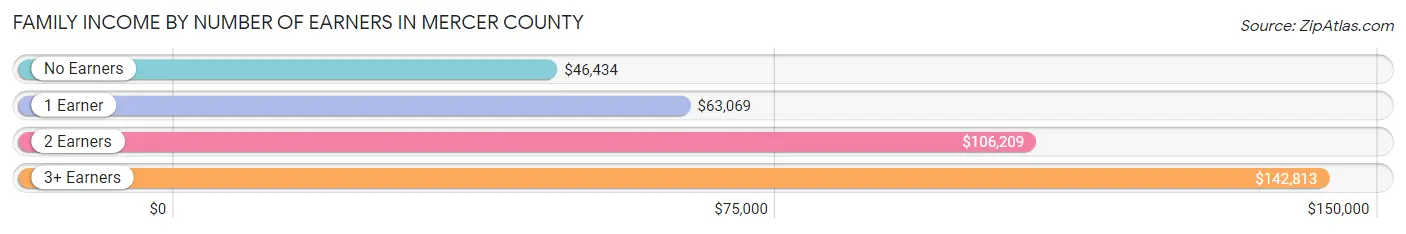
| Number of Earners | # Families | Median Income |
| No Earners | 1,628 (15.3%) | $46,434 |
| 1 Earner | 2,462 (23.1%) | $63,069 |
| 2 Earners | 4,878 (45.8%) | $106,209 |
| 3+ Earners | 1,680 (15.8%) | $142,813 |
| Total | 10,648 (100.0%) | $95,357 |
Household Income in Mercer County
Household Income Brackets in Mercer County
With 3,973 households falling in the category, the $100,000 to $149,999 income range is the most frequent in Mercer County, accounting for 24.8% of all households. In contrast, only 336 households (2.1%) fall into the $10,000 to $14,999 income bracket, making it the least populous group.
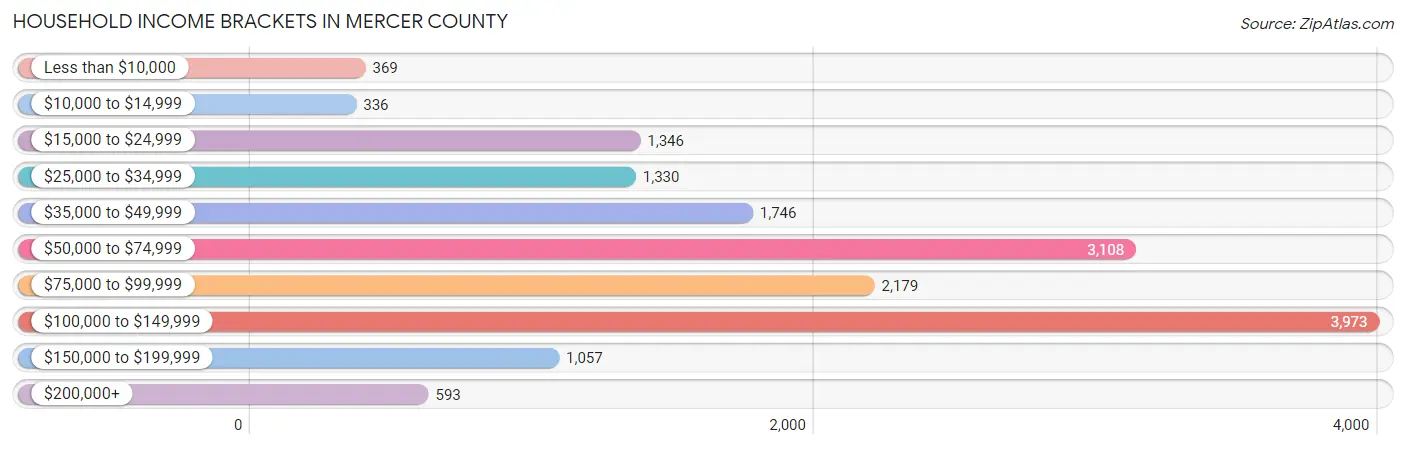
| Income Bracket | # Households | % Households |
| Less than $10,000 | 369 | 2.3% |
| $10,000 to $14,999 | 336 | 2.1% |
| $15,000 to $24,999 | 1,346 | 8.4% |
| $25,000 to $34,999 | 1,330 | 8.3% |
| $35,000 to $49,999 | 1,746 | 10.9% |
| $50,000 to $74,999 | 3,108 | 19.4% |
| $75,000 to $99,999 | 2,179 | 13.6% |
| $100,000 to $149,999 | 3,973 | 24.8% |
| $150,000 to $199,999 | 1,057 | 6.6% |
| $200,000+ | 593 | 3.7% |
Household Income by Householder Age in Mercer County
The median household income in Mercer County is $73,278, with the highest median household income of $94,849 found in the 25 to 44 years age bracket for the primary householder. A total of 4,933 households (30.8%) fall into this category. Meanwhile, the 65+ years age bracket for the primary householder has the lowest median household income of $47,108, with 4,822 households (30.1%) in this group.
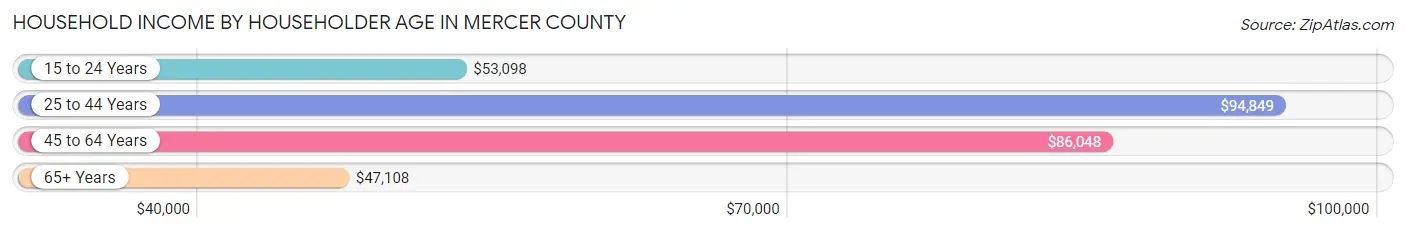
| Income Bracket | # Households | Median Income |
| 15 to 24 Years | 391 (2.4%) | $53,098 |
| 25 to 44 Years | 4,933 (30.8%) | $94,849 |
| 45 to 64 Years | 5,876 (36.7%) | $86,048 |
| 65+ Years | 4,822 (30.1%) | $47,108 |
| Total | 16,022 (100.0%) | $73,278 |
Poverty in Mercer County
Income Below Poverty by Sex and Age in Mercer County
With 5.9% poverty level for males and 6.8% for females among the residents of Mercer County, 6 to 11 year old males and 5 year old females are the most vulnerable to poverty, with 211 males (12.8%) and 24 females (14.5%) in their respective age groups living below the poverty level.
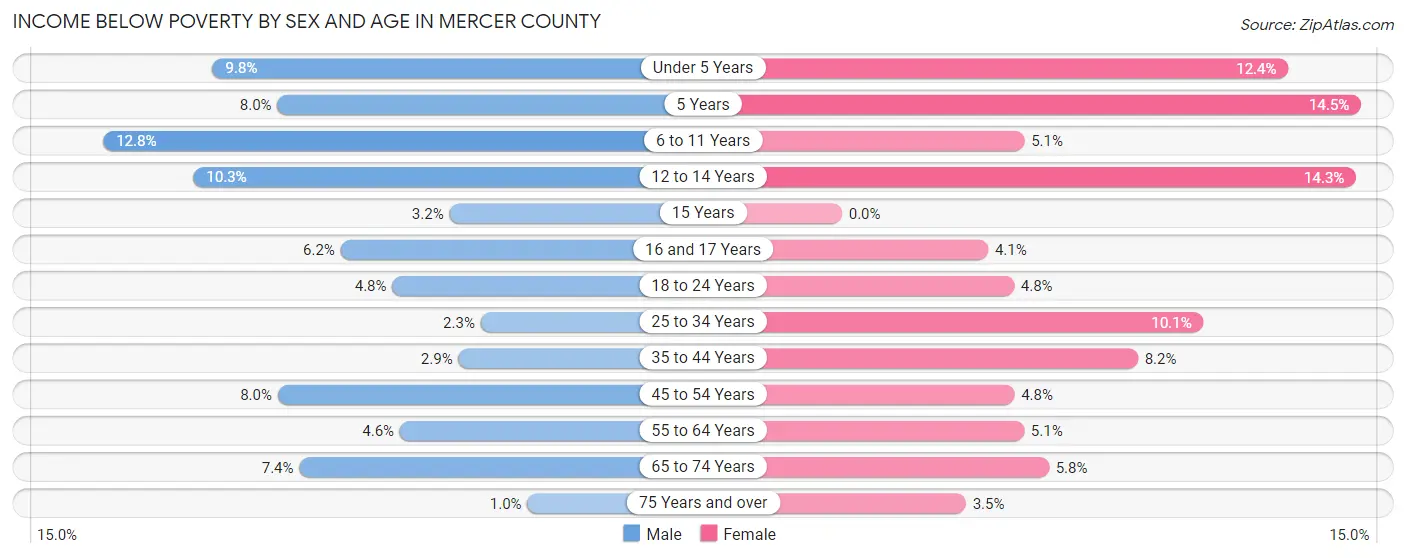
| Age Bracket | Male | Female |
| Under 5 Years | 143 (9.8%) | 191 (12.4%) |
| 5 Years | 23 (8.0%) | 24 (14.5%) |
| 6 to 11 Years | 211 (12.8%) | 86 (5.1%) |
| 12 to 14 Years | 110 (10.3%) | 124 (14.3%) |
| 15 Years | 12 (3.2%) | 0 (0.0%) |
| 16 and 17 Years | 33 (6.2%) | 25 (4.1%) |
| 18 to 24 Years | 87 (4.8%) | 76 (4.8%) |
| 25 to 34 Years | 57 (2.3%) | 226 (10.1%) |
| 35 to 44 Years | 72 (2.9%) | 188 (8.2%) |
| 45 to 54 Years | 190 (8.0%) | 113 (4.8%) |
| 55 to 64 Years | 134 (4.5%) | 147 (5.1%) |
| 65 to 74 Years | 160 (7.3%) | 130 (5.8%) |
| 75 Years and over | 13 (1.0%) | 62 (3.5%) |
| Total | 1,245 (5.9%) | 1,392 (6.8%) |
Income Above Poverty by Sex and Age in Mercer County
According to the poverty statistics in Mercer County, males aged 75 years and over and females aged 15 years are the age groups that are most secure financially, with 99.0% of males and 100.0% of females in these age groups living above the poverty line.
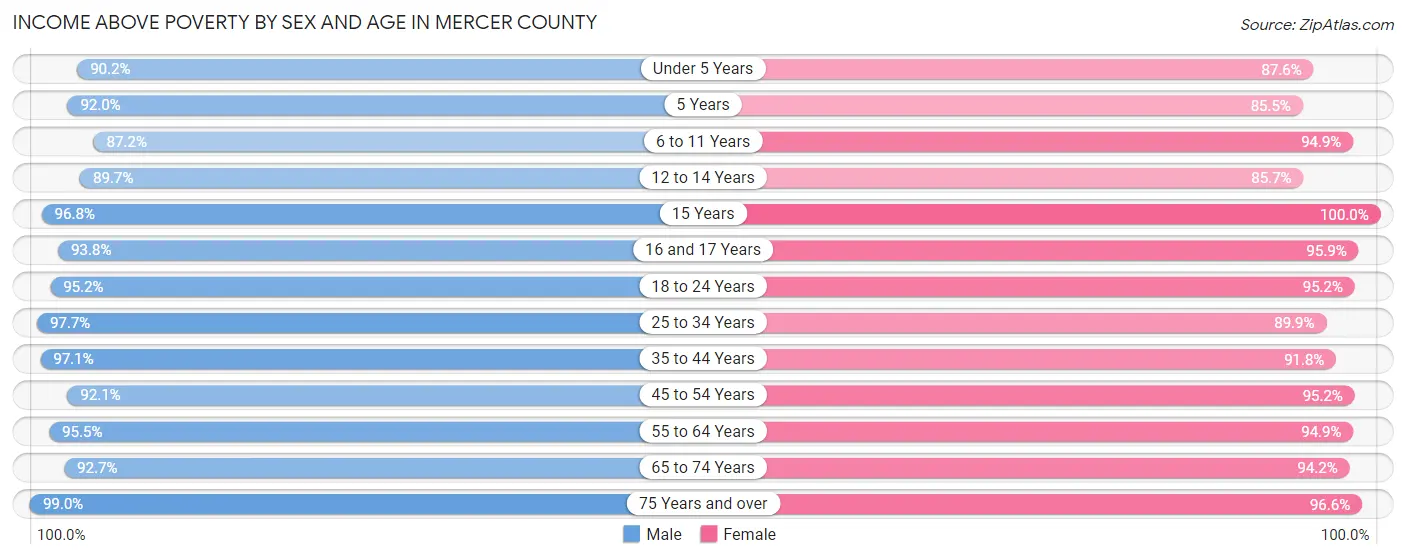
| Age Bracket | Male | Female |
| Under 5 Years | 1,320 (90.2%) | 1,346 (87.6%) |
| 5 Years | 266 (92.0%) | 142 (85.5%) |
| 6 to 11 Years | 1,436 (87.2%) | 1,606 (94.9%) |
| 12 to 14 Years | 958 (89.7%) | 742 (85.7%) |
| 15 Years | 366 (96.8%) | 212 (100.0%) |
| 16 and 17 Years | 499 (93.8%) | 589 (95.9%) |
| 18 to 24 Years | 1,742 (95.2%) | 1,511 (95.2%) |
| 25 to 34 Years | 2,426 (97.7%) | 2,019 (89.9%) |
| 35 to 44 Years | 2,396 (97.1%) | 2,093 (91.8%) |
| 45 to 54 Years | 2,199 (92.0%) | 2,239 (95.2%) |
| 55 to 64 Years | 2,809 (95.5%) | 2,751 (94.9%) |
| 65 to 74 Years | 2,016 (92.6%) | 2,128 (94.2%) |
| 75 Years and over | 1,285 (99.0%) | 1,735 (96.6%) |
| Total | 19,718 (94.1%) | 19,113 (93.2%) |
Income Below Poverty Among Married-Couple Families in Mercer County
The poverty statistics for married-couple families in Mercer County show that 1.5% or 142 of the total 9,223 families live below the poverty line. Families with 5 or more children have the highest poverty rate of 15.2%, comprising of 31 families. On the other hand, families with 1 or 2 children have the lowest poverty rate of 1.0%, which includes 23 families.
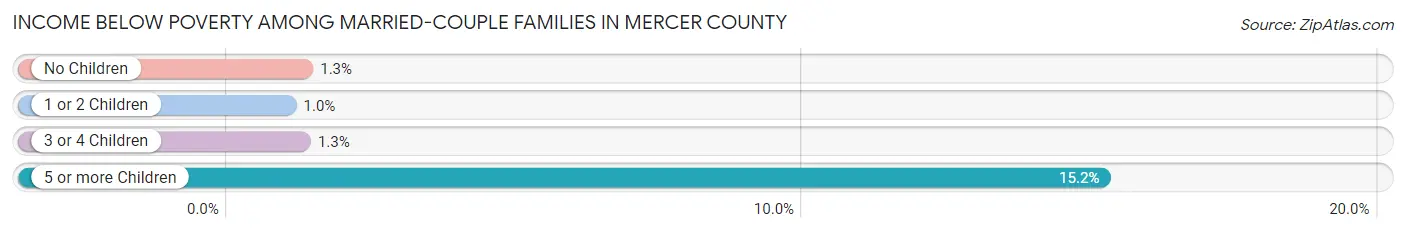
| Children | Above Poverty | Below Poverty |
| No Children | 5,514 (98.7%) | 73 (1.3%) |
| 1 or 2 Children | 2,228 (99.0%) | 23 (1.0%) |
| 3 or 4 Children | 1,166 (98.7%) | 15 (1.3%) |
| 5 or more Children | 173 (84.8%) | 31 (15.2%) |
| Total | 9,081 (98.5%) | 142 (1.5%) |
Income Below Poverty Among Single-Parent Households in Mercer County
According to the poverty data in Mercer County, 3.1% or 17 single-father households and 29.1% or 254 single-mother households are living below the poverty line. Among single-father households, those with 5 or more children have the highest poverty rate, with 2 households (100.0%) experiencing poverty. Likewise, among single-mother households, those with 1 or 2 children have the highest poverty rate, with 201 households (42.9%) falling below the poverty line.
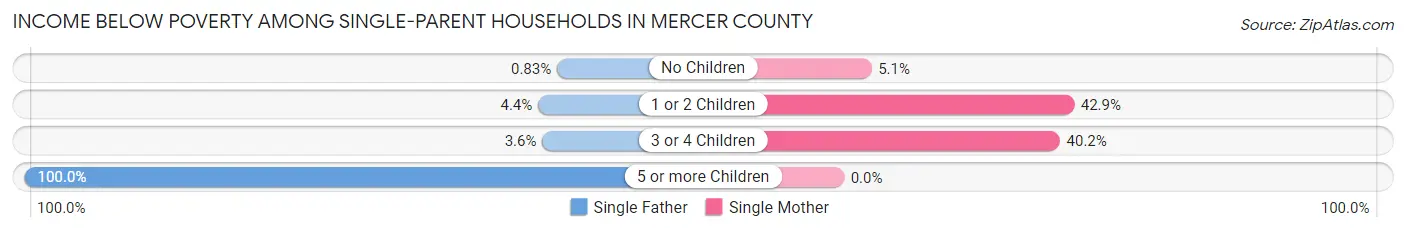
| Children | Single Father | Single Mother |
| No Children | 2 (0.8%) | 16 (5.1%) |
| 1 or 2 Children | 11 (4.3%) | 201 (42.9%) |
| 3 or 4 Children | 2 (3.6%) | 37 (40.2%) |
| 5 or more Children | 2 (100.0%) | 0 (0.0%) |
| Total | 17 (3.1%) | 254 (29.1%) |
Income Below Poverty Among Married-Couple vs Single-Parent Households in Mercer County
The poverty data for Mercer County shows that 142 of the married-couple family households (1.5%) and 271 of the single-parent households (19.0%) are living below the poverty level. Within the married-couple family households, those with 5 or more children have the highest poverty rate, with 31 households (15.2%) falling below the poverty line. Among the single-parent households, those with 5 or more children have the highest poverty rate, with 2 household (100.0%) living below poverty.
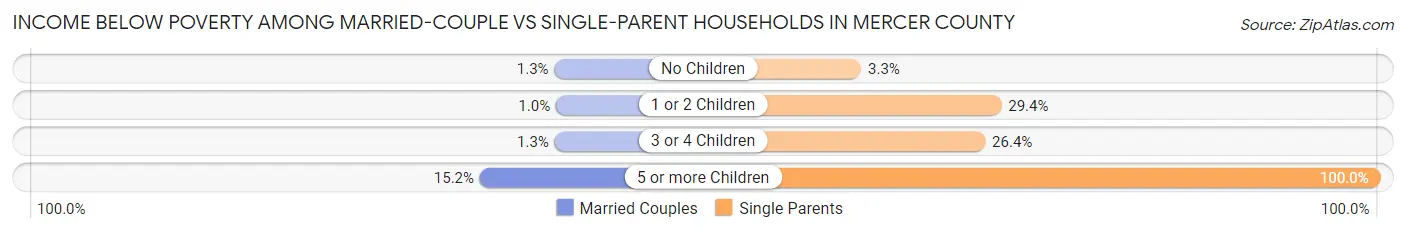
| Children | Married-Couple Families | Single-Parent Households |
| No Children | 73 (1.3%) | 18 (3.3%) |
| 1 or 2 Children | 23 (1.0%) | 212 (29.4%) |
| 3 or 4 Children | 15 (1.3%) | 39 (26.4%) |
| 5 or more Children | 31 (15.2%) | 2 (100.0%) |
| Total | 142 (1.5%) | 271 (19.0%) |
Race in Mercer County
The most populous races in Mercer County are White / Caucasian (40,618 | 96.0%), Two or more Races (897 | 2.1%), and Hispanic or Latino (834 | 2.0%).
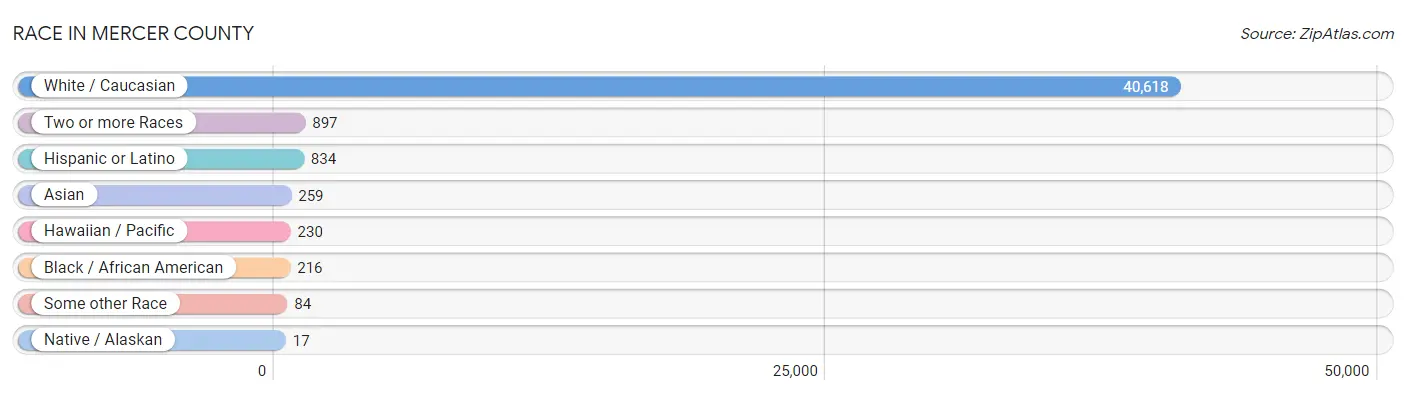
| Race | # Population | % Population |
| Asian | 259 | 0.6% |
| Black / African American | 216 | 0.5% |
| Hawaiian / Pacific | 230 | 0.5% |
| Hispanic or Latino | 834 | 2.0% |
| Native / Alaskan | 17 | 0.0% |
| White / Caucasian | 40,618 | 96.0% |
| Two or more Races | 897 | 2.1% |
| Some other Race | 84 | 0.2% |
| Total | 42,321 | 100.0% |
Ancestry in Mercer County
The most populous ancestries reported in Mercer County are German (22,743 | 53.7%), American (3,823 | 9.0%), Irish (3,276 | 7.7%), English (1,714 | 4.1%), and French (1,134 | 2.7%), together accounting for 77.2% of all Mercer County residents.
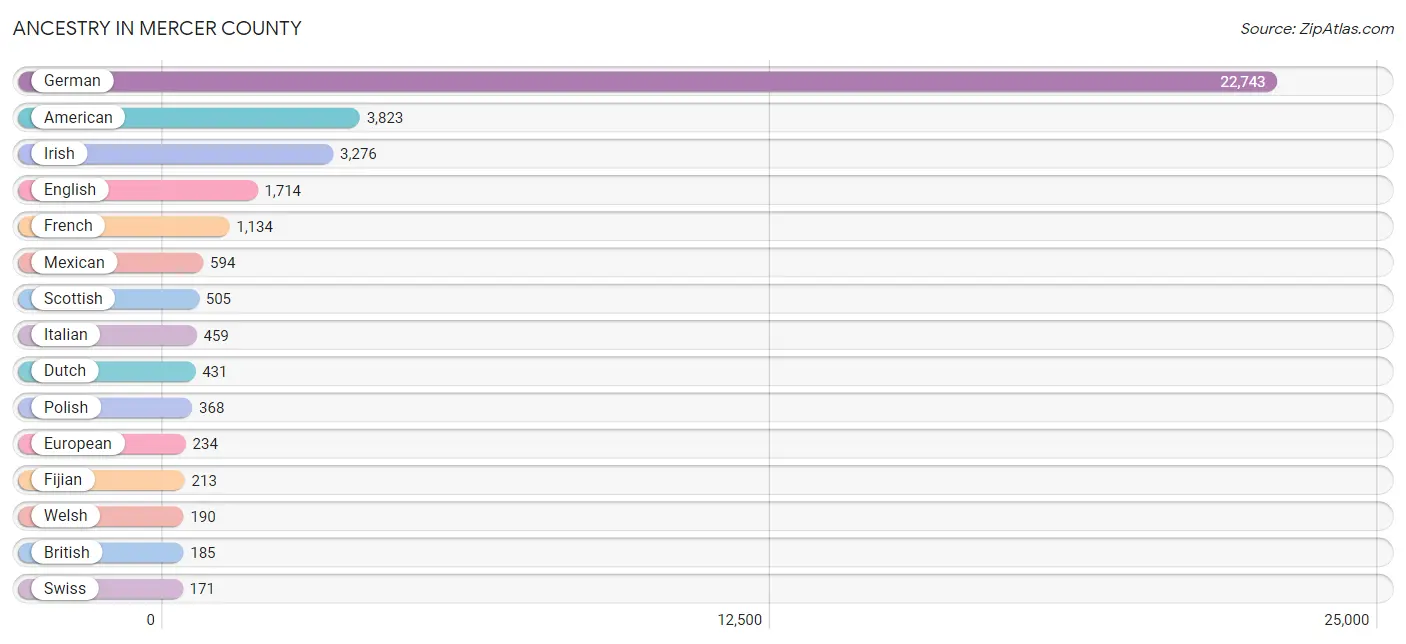
| Ancestry | # Population | % Population |
| African | 2 | 0.0% |
| Alsatian | 26 | 0.1% |
| American | 3,823 | 9.0% |
| Apache | 6 | 0.0% |
| Arab | 15 | 0.0% |
| Australian | 8 | 0.0% |
| Austrian | 12 | 0.0% |
| Belgian | 23 | 0.1% |
| Bhutanese | 21 | 0.1% |
| Blackfeet | 17 | 0.0% |
| British | 185 | 0.4% |
| Burmese | 11 | 0.0% |
| Canadian | 10 | 0.0% |
| Central American | 119 | 0.3% |
| Cherokee | 59 | 0.1% |
| Chickasaw | 26 | 0.1% |
| Chilean | 6 | 0.0% |
| Comanche | 5 | 0.0% |
| Croatian | 9 | 0.0% |
| Cuban | 27 | 0.1% |
| Czech | 55 | 0.1% |
| Czechoslovakian | 30 | 0.1% |
| Danish | 51 | 0.1% |
| Dutch | 431 | 1.0% |
| Eastern European | 37 | 0.1% |
| English | 1,714 | 4.1% |
| European | 234 | 0.5% |
| Fijian | 213 | 0.5% |
| Filipino | 11 | 0.0% |
| Finnish | 3 | 0.0% |
| French | 1,134 | 2.7% |
| French Canadian | 55 | 0.1% |
| German | 22,743 | 53.7% |
| Honduran | 119 | 0.3% |
| Hungarian | 151 | 0.4% |
| Icelander | 3 | 0.0% |
| Indian (Asian) | 11 | 0.0% |
| Irish | 3,276 | 7.7% |
| Italian | 459 | 1.1% |
| Jamaican | 11 | 0.0% |
| Korean | 162 | 0.4% |
| Lebanese | 8 | 0.0% |
| Lithuanian | 7 | 0.0% |
| Macedonian | 13 | 0.0% |
| Mexican | 594 | 1.4% |
| Mexican American Indian | 3 | 0.0% |
| Native Hawaiian | 17 | 0.0% |
| Northern European | 55 | 0.1% |
| Norwegian | 44 | 0.1% |
| Palestinian | 6 | 0.0% |
| Pennsylvania German | 28 | 0.1% |
| Polish | 368 | 0.9% |
| Portuguese | 8 | 0.0% |
| Puerto Rican | 41 | 0.1% |
| Romanian | 65 | 0.2% |
| Russian | 26 | 0.1% |
| Scandinavian | 32 | 0.1% |
| Scotch-Irish | 99 | 0.2% |
| Scottish | 505 | 1.2% |
| Slovak | 42 | 0.1% |
| South American | 6 | 0.0% |
| Spanish | 17 | 0.0% |
| Subsaharan African | 4 | 0.0% |
| Swedish | 14 | 0.0% |
| Swiss | 171 | 0.4% |
| Thai | 84 | 0.2% |
| Welsh | 190 | 0.4% | View All 67 Rows |
Immigrants in Mercer County
The most numerous immigrant groups reported in Mercer County came from Asia (181 | 0.4%), Latin America (173 | 0.4%), Central America (167 | 0.4%), Oceania (150 | 0.4%), and Mexico (145 | 0.3%), together accounting for 1.9% of all Mercer County residents.
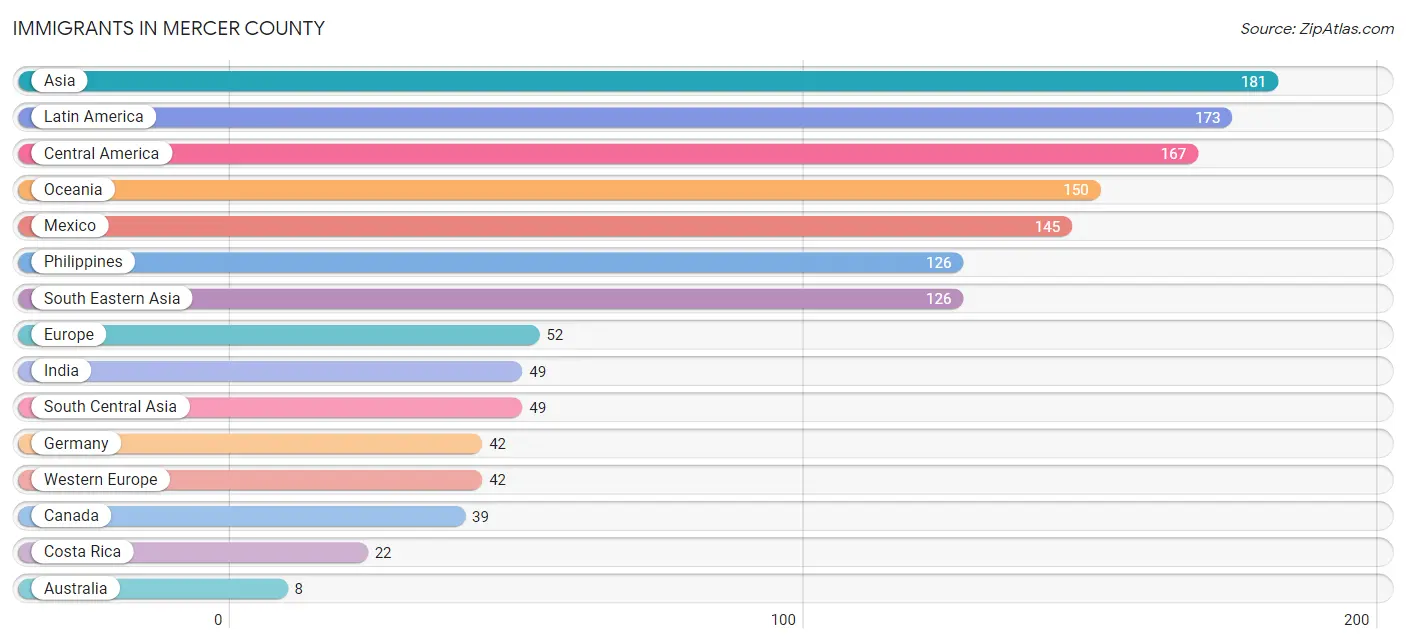
| Immigration Origin | # Population | % Population |
| Asia | 181 | 0.4% |
| Australia | 8 | 0.0% |
| Brazil | 6 | 0.0% |
| Canada | 39 | 0.1% |
| Central America | 167 | 0.4% |
| Costa Rica | 22 | 0.1% |
| Eastern Europe | 4 | 0.0% |
| Europe | 52 | 0.1% |
| Germany | 42 | 0.1% |
| India | 49 | 0.1% |
| Latin America | 173 | 0.4% |
| Mexico | 145 | 0.3% |
| Northern Europe | 6 | 0.0% |
| Oceania | 150 | 0.4% |
| Philippines | 126 | 0.3% |
| Russia | 4 | 0.0% |
| South America | 6 | 0.0% |
| South Central Asia | 49 | 0.1% |
| South Eastern Asia | 126 | 0.3% |
| Western Europe | 42 | 0.1% | View All 20 Rows |
Sex and Age in Mercer County
Sex and Age in Mercer County
The most populous age groups in Mercer County are 10 to 14 Years (1,709 | 8.0%) for men and Under 5 Years (1,630 | 7.8%) for women.
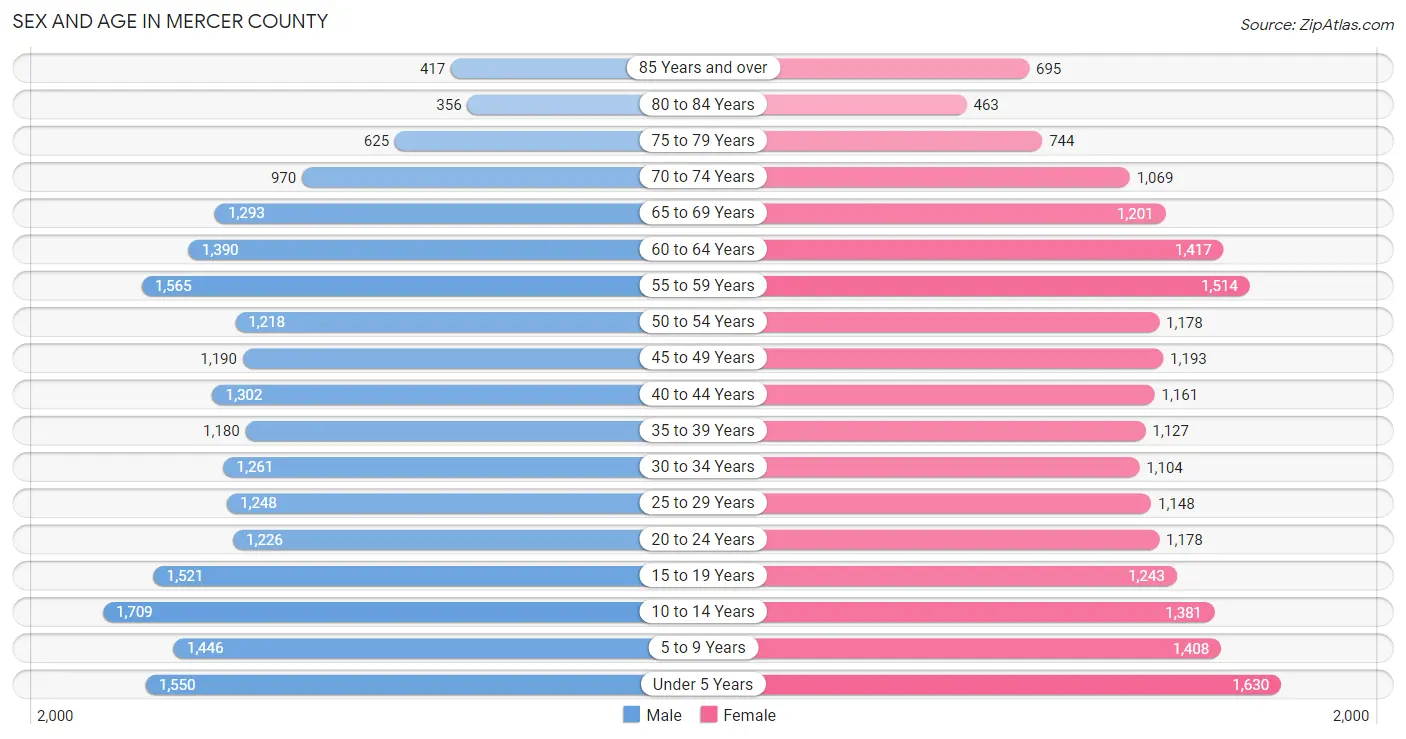
| Age Bracket | Male | Female |
| Under 5 Years | 1,550 (7.2%) | 1,630 (7.8%) |
| 5 to 9 Years | 1,446 (6.7%) | 1,408 (6.8%) |
| 10 to 14 Years | 1,709 (8.0%) | 1,381 (6.6%) |
| 15 to 19 Years | 1,521 (7.1%) | 1,243 (6.0%) |
| 20 to 24 Years | 1,226 (5.7%) | 1,178 (5.7%) |
| 25 to 29 Years | 1,248 (5.8%) | 1,148 (5.5%) |
| 30 to 34 Years | 1,261 (5.9%) | 1,104 (5.3%) |
| 35 to 39 Years | 1,180 (5.5%) | 1,127 (5.4%) |
| 40 to 44 Years | 1,302 (6.1%) | 1,161 (5.6%) |
| 45 to 49 Years | 1,190 (5.5%) | 1,193 (5.7%) |
| 50 to 54 Years | 1,218 (5.7%) | 1,178 (5.7%) |
| 55 to 59 Years | 1,565 (7.3%) | 1,514 (7.3%) |
| 60 to 64 Years | 1,390 (6.5%) | 1,417 (6.8%) |
| 65 to 69 Years | 1,293 (6.0%) | 1,201 (5.8%) |
| 70 to 74 Years | 970 (4.5%) | 1,069 (5.1%) |
| 75 to 79 Years | 625 (2.9%) | 744 (3.6%) |
| 80 to 84 Years | 356 (1.7%) | 463 (2.2%) |
| 85 Years and over | 417 (1.9%) | 695 (3.3%) |
| Total | 21,467 (100.0%) | 20,854 (100.0%) |
Families and Households in Mercer County
Median Family Size in Mercer County
The median family size in Mercer County is 3.21 persons per family, with married-couple families (9,223 | 86.6%) accounting for the largest median family size of 3.26 persons per family. On the other hand, single male/father families (552 | 5.2%) represent the smallest median family size with 2.75 persons per family.
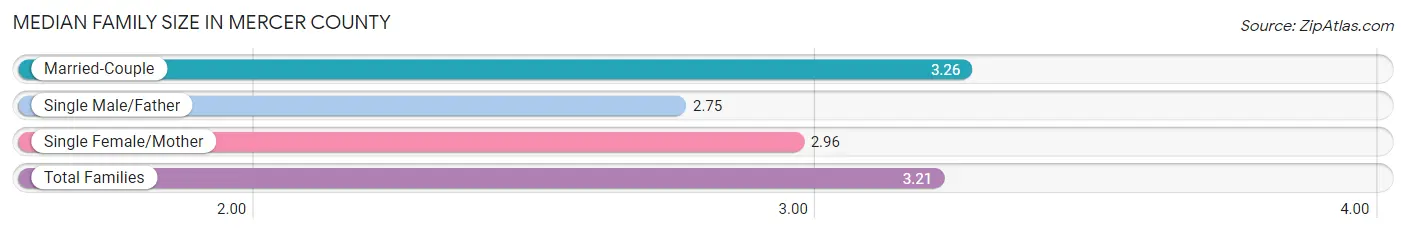
| Family Type | # Families | Family Size |
| Married-Couple | 9,223 (86.6%) | 3.26 |
| Single Male/Father | 552 (5.2%) | 2.75 |
| Single Female/Mother | 873 (8.2%) | 2.96 |
| Total Families | 10,648 (100.0%) | 3.21 |
Median Household Size in Mercer County
The median household size in Mercer County is 2.61 persons per household, with married-couple households (9,223 | 57.6%) accounting for the largest median household size of 3.3 persons per household. non-family households (5,374 | 33.5%) represent the smallest median household size with 1.26 persons per household.
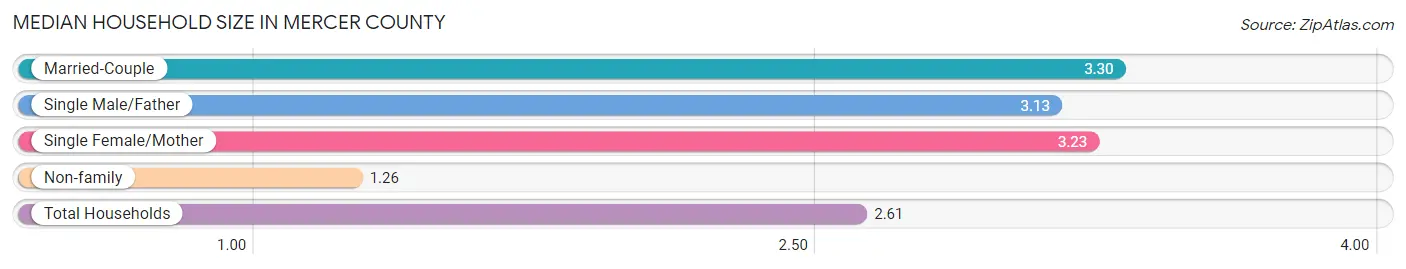
| Household Type | # Households | Household Size |
| Married-Couple | 9,223 (57.6%) | 3.30 |
| Single Male/Father | 552 (3.5%) | 3.13 |
| Single Female/Mother | 873 (5.4%) | 3.23 |
| Non-family | 5,374 (33.5%) | 1.26 |
| Total Households | 16,022 (100.0%) | 2.61 |
Household Size by Marriage Status in Mercer County
Out of a total of 16,022 households in Mercer County, 10,648 (66.5%) are family households, while 5,374 (33.5%) are nonfamily households. The most numerous type of family households are 2-person households, comprising 5,005, and the most common type of nonfamily households are 1-person households, comprising 4,413.
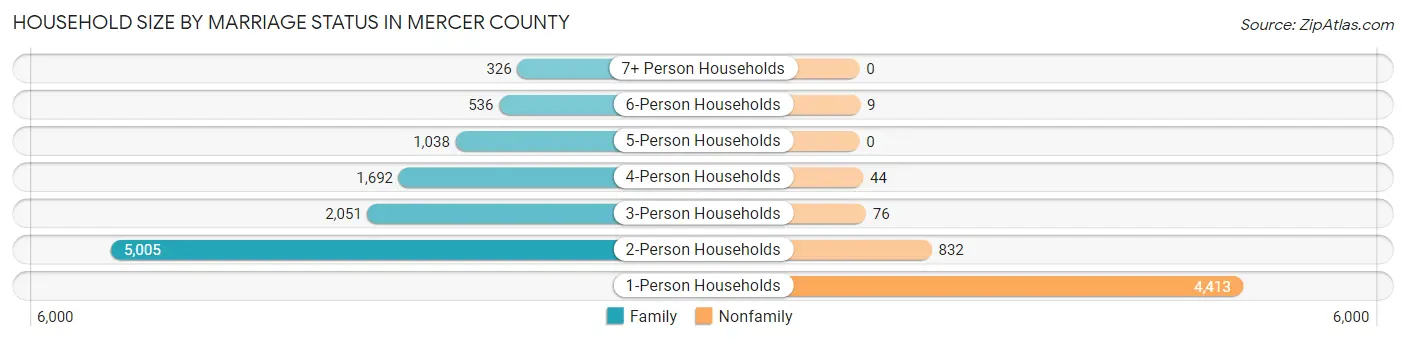
| Household Size | Family Households | Nonfamily Households |
| 1-Person Households | - | 4,413 (27.5%) |
| 2-Person Households | 5,005 (31.2%) | 832 (5.2%) |
| 3-Person Households | 2,051 (12.8%) | 76 (0.5%) |
| 4-Person Households | 1,692 (10.6%) | 44 (0.3%) |
| 5-Person Households | 1,038 (6.5%) | 0 (0.0%) |
| 6-Person Households | 536 (3.4%) | 9 (0.1%) |
| 7+ Person Households | 326 (2.0%) | 0 (0.0%) |
| Total | 10,648 (66.5%) | 5,374 (33.5%) |
Female Fertility in Mercer County
Fertility by Age in Mercer County
Average fertility rate in Mercer County is 75.0 births per 1,000 women. Women in the age bracket of 20 to 34 years have the highest fertility rate with 150.0 births per 1,000 women. Women in the age bracket of 20 to 34 years acount for 81.6% of all women with births.
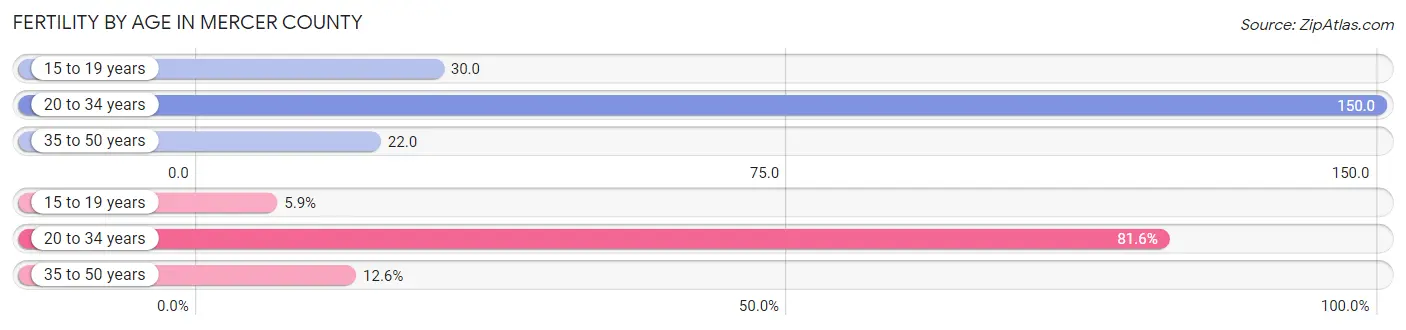
| Age Bracket | Women with Births | Births / 1,000 Women |
| 15 to 19 years | 37 (5.9%) | 30.0 |
| 20 to 34 years | 513 (81.6%) | 150.0 |
| 35 to 50 years | 79 (12.6%) | 22.0 |
| Total | 629 (100.0%) | 75.0 |
Fertility by Age by Marriage Status in Mercer County
77.6% of women with births (629) in Mercer County are married. The highest percentage of unmarried women with births falls into 15 to 19 years age bracket with 78.4% of them unmarried at the time of birth, while the lowest percentage of unmarried women with births belong to 20 to 34 years age bracket with 16.6% of them unmarried.
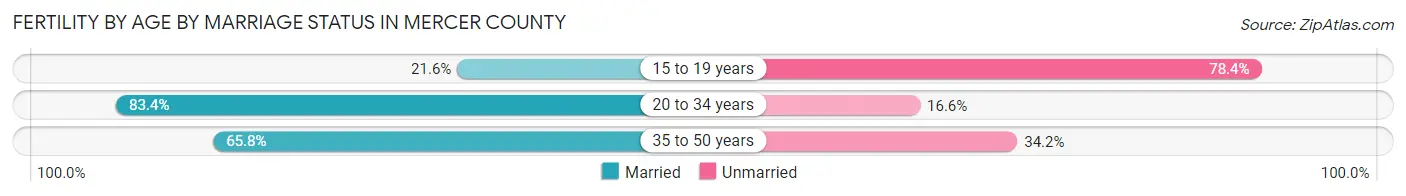
| Age Bracket | Married | Unmarried |
| 15 to 19 years | 8 (21.6%) | 29 (78.4%) |
| 20 to 34 years | 428 (83.4%) | 85 (16.6%) |
| 35 to 50 years | 52 (65.8%) | 27 (34.2%) |
| Total | 488 (77.6%) | 141 (22.4%) |
Fertility by Education in Mercer County
Average fertility rate in Mercer County is 75.0 births per 1,000 women. Women with the education attainment of graduate degree have the highest fertility rate of 134.0 births per 1,000 women, while women with the education attainment of less than high school have the lowest fertility at 8.0 births per 1,000 women. Women with the education attainment of college or associate's degree represent 45.6% of all women with births.
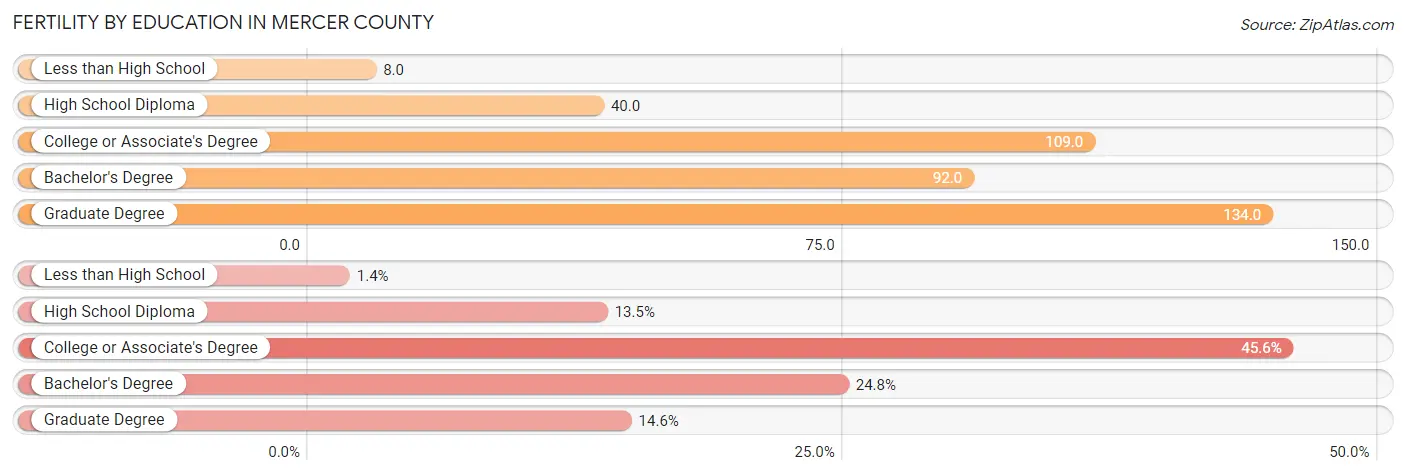
| Educational Attainment | Women with Births | Births / 1,000 Women |
| Less than High School | 9 (1.4%) | 8.0 |
| High School Diploma | 85 (13.5%) | 40.0 |
| College or Associate's Degree | 287 (45.6%) | 109.0 |
| Bachelor's Degree | 156 (24.8%) | 92.0 |
| Graduate Degree | 92 (14.6%) | 134.0 |
| Total | 629 (100.0%) | 75.0 |
Fertility by Education by Marriage Status in Mercer County
22.4% of women with births in Mercer County are unmarried. Women with the educational attainment of bachelor's degree are most likely to be married with 100.0% of them married at childbirth, while women with the educational attainment of high school diploma are least likely to be married with 42.3% of them unmarried at childbirth.
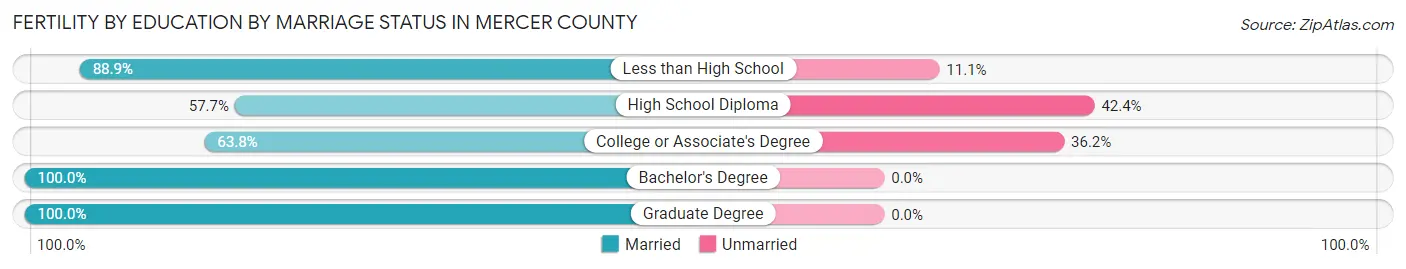
| Educational Attainment | Married | Unmarried |
| Less than High School | 8 (88.9%) | 1 (11.1%) |
| High School Diploma | 49 (57.7%) | 36 (42.3%) |
| College or Associate's Degree | 183 (63.8%) | 104 (36.2%) |
| Bachelor's Degree | 156 (100.0%) | 0 (0.0%) |
| Graduate Degree | 92 (100.0%) | 0 (0.0%) |
| Total | 488 (77.6%) | 141 (22.4%) |
Employment Characteristics in Mercer County
Employment by Class of Employer in Mercer County
Among the 21,473 employed individuals in Mercer County, private company employees (15,575 | 72.5%), local government employees (1,884 | 8.8%), and not-for-profit organizations (1,317 | 6.1%) make up the most common classes of employment.
| Employer Class | # Employees | % Employees |
| Private Company Employees | 15,575 | 72.5% |
| Self-Employed (Incorporated) | 923 | 4.3% |
| Self-Employed (Not Incorporated) | 1,138 | 5.3% |
| Not-for-profit Organizations | 1,317 | 6.1% |
| Local Government Employees | 1,884 | 8.8% |
| State Government Employees | 305 | 1.4% |
| Federal Government Employees | 275 | 1.3% |
| Unpaid Family Workers | 56 | 0.3% |
| Total | 21,473 | 100.0% |
Employment Status by Age in Mercer County
According to the labor force statistics for Mercer County, out of the total population over 16 years of age (32,607), 68.4% or 22,303 individuals are in the labor force, with 2.0% or 446 of them unemployed. The age group with the highest labor force participation rate is 25 to 29 years, with 93.3% or 2,235 individuals in the labor force. Within the labor force, the 25 to 29 years age range has the highest percentage of unemployed individuals, with 3.9% or 87 of them being unemployed.
| Age Bracket | In Labor Force | Unemployed |
| 16 to 19 Years | 1,261 (58.0%) | 3 (0.2%) |
| 20 to 24 Years | 2,137 (88.9%) | 68 (3.2%) |
| 25 to 29 Years | 2,235 (93.3%) | 87 (3.9%) |
| 30 to 34 Years | 2,152 (91.0%) | 37 (1.7%) |
| 35 to 44 Years | 4,293 (90.0%) | 107 (2.5%) |
| 45 to 54 Years | 4,287 (89.7%) | 90 (2.1%) |
| 55 to 59 Years | 2,552 (82.9%) | 18 (0.7%) |
| 60 to 64 Years | 1,858 (66.2%) | 0 (0.0%) |
| 65 to 74 Years | 1,251 (27.6%) | 38 (3.0%) |
| 75 Years and over | 267 (8.1%) | 0 (0.0%) |
| Total | 22,303 (68.4%) | 446 (2.0%) |
Employment Status by Educational Attainment in Mercer County
According to labor force statistics for Mercer County, 86.0% of individuals (17,369) out of the total population between 25 and 64 years of age (20,196) are in the labor force, with 1.9% or 330 of them being unemployed. The group with the highest labor force participation rate are those with the educational attainment of bachelor's degree or higher, with 91.8% or 4,437 individuals in the labor force. Within the labor force, individuals with less than high school education have the highest percentage of unemployment, with 4.0% or 27 of them being unemployed.
| Educational Attainment | In Labor Force | Unemployed |
| Less than High School | 669 (62.7%) | 43 (4.0%) |
| High School Diploma | 6,509 (82.3%) | 166 (2.1%) |
| College / Associate Degree | 5,761 (90.2%) | 179 (2.8%) |
| Bachelor's Degree or higher | 4,437 (91.8%) | 10 (0.2%) |
| Total | 17,369 (86.0%) | 384 (1.9%) |
Employment Occupations by Sex in Mercer County
Management, Business, Science and Arts Occupations
The most common Management, Business, Science and Arts occupations in Mercer County are Management (2,052 | 9.4%), Community & Social Service (1,582 | 7.2%), Health Diagnosing & Treating (1,366 | 6.3%), Computers, Engineering & Science (1,076 | 4.9%), and Education Instruction & Library (1,072 | 4.9%).
Management, Business, Science and Arts Occupations by Sex
Within the Management, Business, Science and Arts occupations in Mercer County, the most male-oriented occupations are Architecture & Engineering (88.9%), Computers & Mathematics (74.4%), and Computers, Engineering & Science (73.4%), while the most female-oriented occupations are Health Technologists (90.5%), Health Diagnosing & Treating (90.3%), and Education Instruction & Library (84.3%).
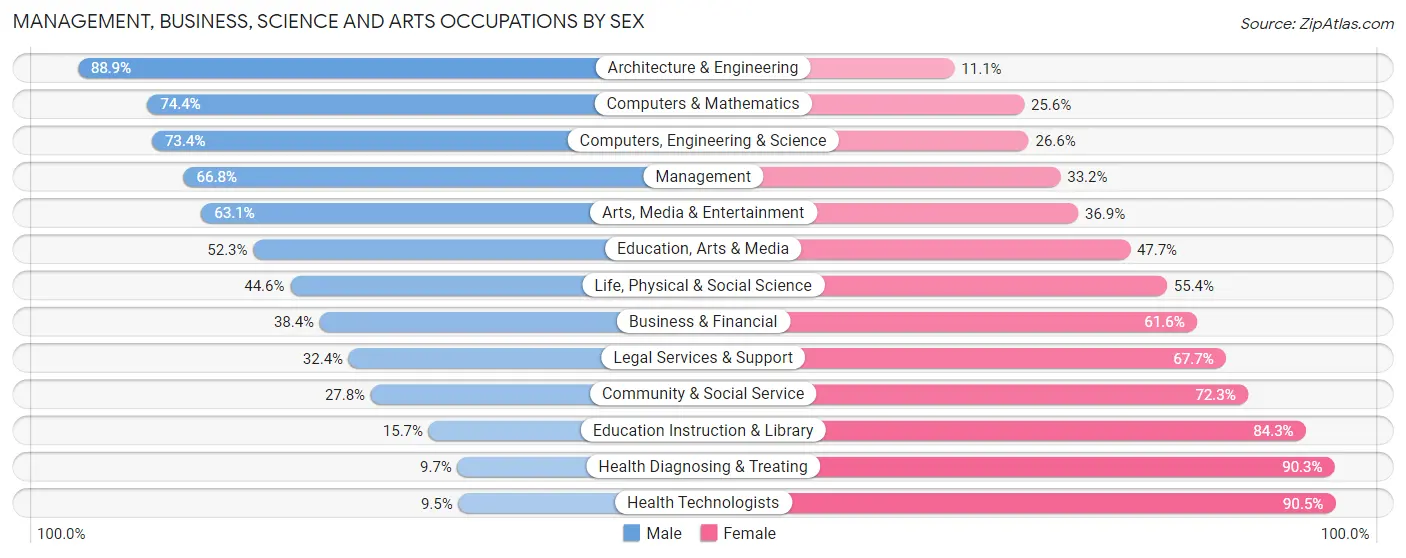
| Occupation | Male | Female |
| Management | 1,371 (66.8%) | 681 (33.2%) |
| Business & Financial | 271 (38.4%) | 435 (61.6%) |
| Computers, Engineering & Science | 790 (73.4%) | 286 (26.6%) |
| Computers & Mathematics | 267 (74.4%) | 92 (25.6%) |
| Architecture & Engineering | 408 (88.9%) | 51 (11.1%) |
| Life, Physical & Social Science | 115 (44.6%) | 143 (55.4%) |
| Community & Social Service | 439 (27.8%) | 1,143 (72.3%) |
| Education, Arts & Media | 195 (52.3%) | 178 (47.7%) |
| Legal Services & Support | 11 (32.4%) | 23 (67.6%) |
| Education Instruction & Library | 168 (15.7%) | 904 (84.3%) |
| Arts, Media & Entertainment | 65 (63.1%) | 38 (36.9%) |
| Health Diagnosing & Treating | 132 (9.7%) | 1,234 (90.3%) |
| Health Technologists | 92 (9.5%) | 878 (90.5%) |
| Total (Category) | 3,003 (44.3%) | 3,779 (55.7%) |
| Total (Overall) | 11,645 (53.3%) | 10,181 (46.7%) |
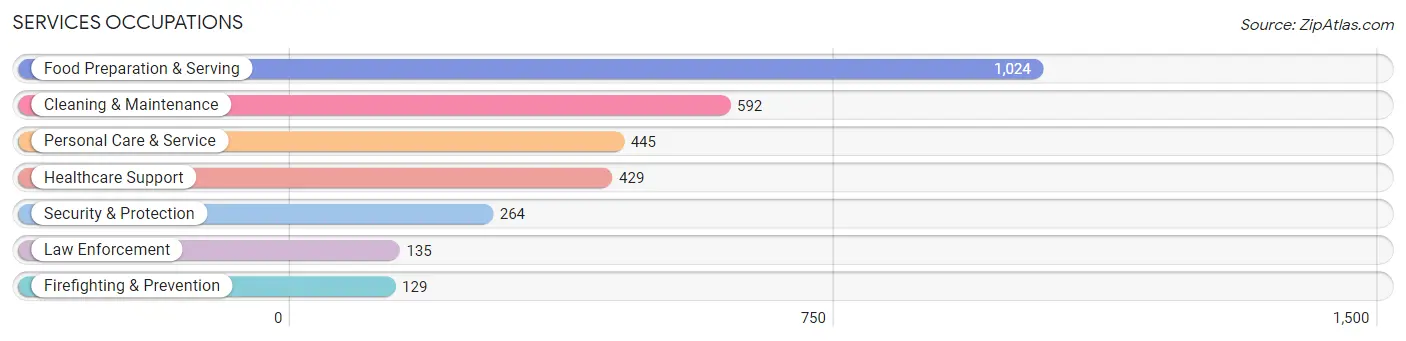
Services Occupations
The most common Services occupations in Mercer County are Food Preparation & Serving (1,024 | 4.7%), Cleaning & Maintenance (592 | 2.7%), Personal Care & Service (445 | 2.0%), Healthcare Support (429 | 2.0%), and Security & Protection (264 | 1.2%).
Services Occupations by Sex
Within the Services occupations in Mercer County, the most male-oriented occupations are Firefighting & Prevention (77.5%), Security & Protection (76.5%), and Law Enforcement (75.6%), while the most female-oriented occupations are Healthcare Support (91.1%), Personal Care & Service (89.0%), and Food Preparation & Serving (71.4%).
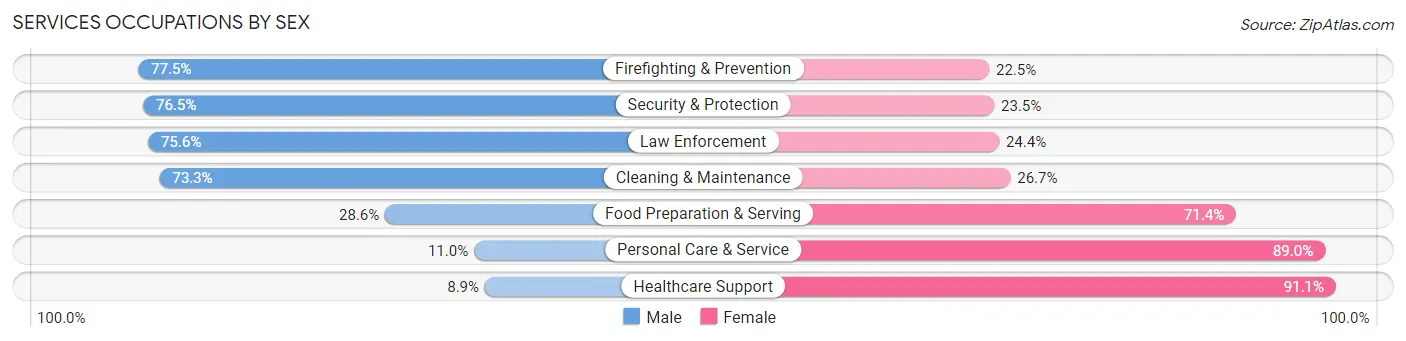
| Occupation | Male | Female |
| Healthcare Support | 38 (8.9%) | 391 (91.1%) |
| Security & Protection | 202 (76.5%) | 62 (23.5%) |
| Firefighting & Prevention | 100 (77.5%) | 29 (22.5%) |
| Law Enforcement | 102 (75.6%) | 33 (24.4%) |
| Food Preparation & Serving | 293 (28.6%) | 731 (71.4%) |
| Cleaning & Maintenance | 434 (73.3%) | 158 (26.7%) |
| Personal Care & Service | 49 (11.0%) | 396 (89.0%) |
| Total (Category) | 1,016 (36.9%) | 1,738 (63.1%) |
| Total (Overall) | 11,645 (53.3%) | 10,181 (46.7%) |
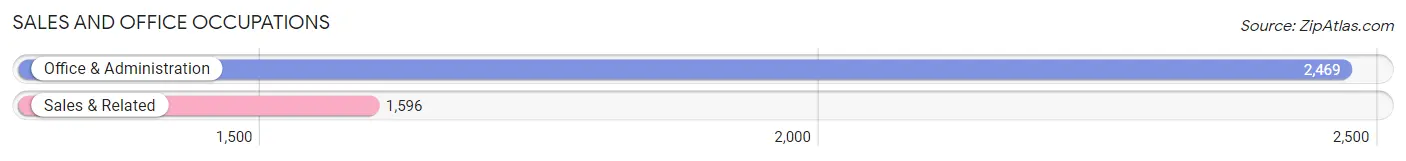
Sales and Office Occupations
The most common Sales and Office occupations in Mercer County are Office & Administration (2,469 | 11.3%), and Sales & Related (1,596 | 7.3%).
Sales and Office Occupations by Sex
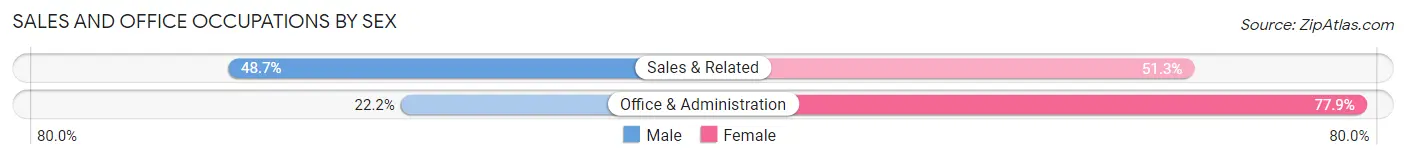
| Occupation | Male | Female |
| Sales & Related | 777 (48.7%) | 819 (51.3%) |
| Office & Administration | 547 (22.2%) | 1,922 (77.8%) |
| Total (Category) | 1,324 (32.6%) | 2,741 (67.4%) |
| Total (Overall) | 11,645 (53.3%) | 10,181 (46.7%) |
Natural Resources, Construction and Maintenance Occupations
The most common Natural Resources, Construction and Maintenance occupations in Mercer County are Construction & Extraction (886 | 4.1%), Installation, Maintenance & Repair (724 | 3.3%), and Farming, Fishing & Forestry (366 | 1.7%).
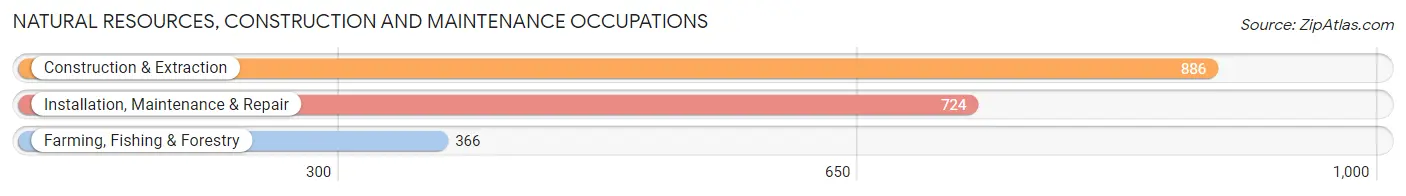
Natural Resources, Construction and Maintenance Occupations by Sex

| Occupation | Male | Female |
| Farming, Fishing & Forestry | 273 (74.6%) | 93 (25.4%) |
| Construction & Extraction | 885 (99.9%) | 1 (0.1%) |
| Installation, Maintenance & Repair | 724 (100.0%) | 0 (0.0%) |
| Total (Category) | 1,882 (95.2%) | 94 (4.8%) |
| Total (Overall) | 11,645 (53.3%) | 10,181 (46.7%) |
Production, Transportation and Moving Occupations
The most common Production, Transportation and Moving occupations in Mercer County are Production (3,802 | 17.4%), Material Moving (1,635 | 7.5%), and Transportation (812 | 3.7%).
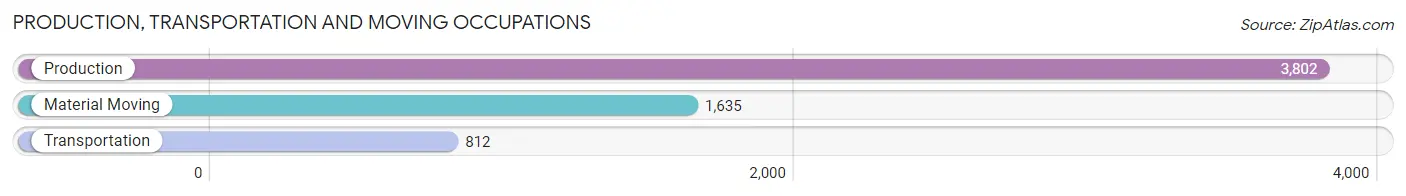
Production, Transportation and Moving Occupations by Sex
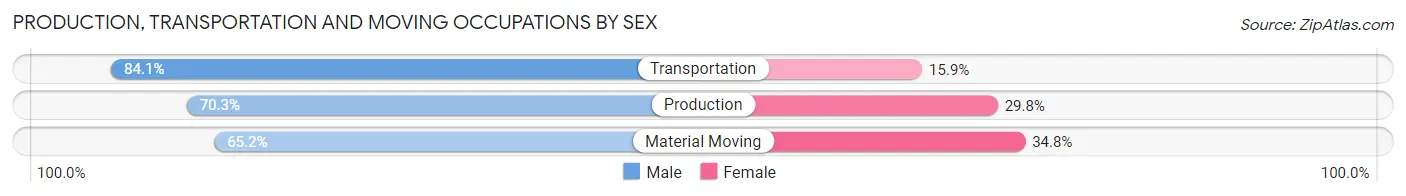
| Occupation | Male | Female |
| Production | 2,671 (70.3%) | 1,131 (29.7%) |
| Transportation | 683 (84.1%) | 129 (15.9%) |
| Material Moving | 1,066 (65.2%) | 569 (34.8%) |
| Total (Category) | 4,420 (70.7%) | 1,829 (29.3%) |
| Total (Overall) | 11,645 (53.3%) | 10,181 (46.7%) |
Employment Industries by Sex in Mercer County
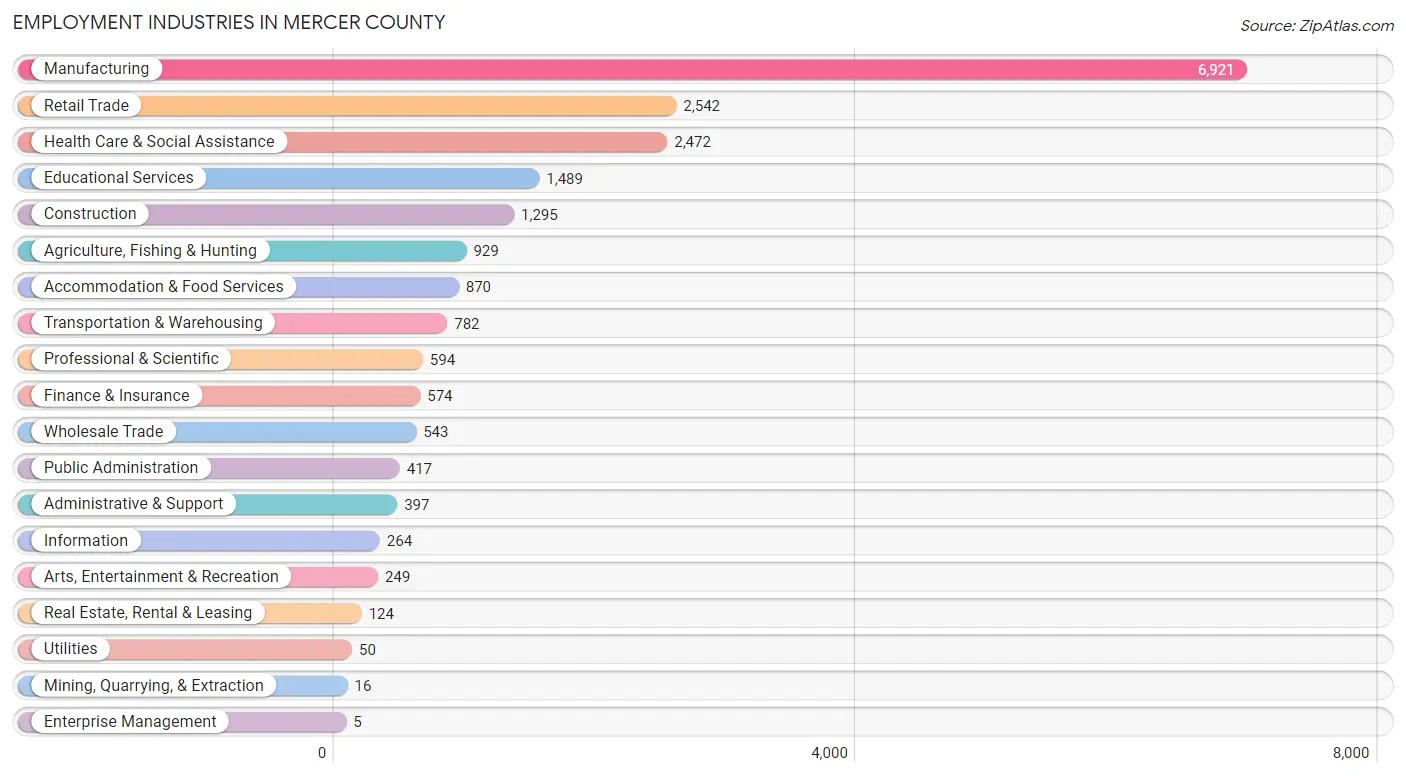
Employment Industries in Mercer County
The major employment industries in Mercer County include Manufacturing (6,921 | 31.7%), Retail Trade (2,542 | 11.7%), Health Care & Social Assistance (2,472 | 11.3%), Educational Services (1,489 | 6.8%), and Construction (1,295 | 5.9%).
Employment Industries by Sex in Mercer County
The Mercer County industries that see more men than women are Mining, Quarrying, & Extraction (100.0%), Utilities (100.0%), and Construction (86.7%), whereas the industries that tend to have a higher number of women are Health Care & Social Assistance (88.1%), Educational Services (76.5%), and Finance & Insurance (73.3%).
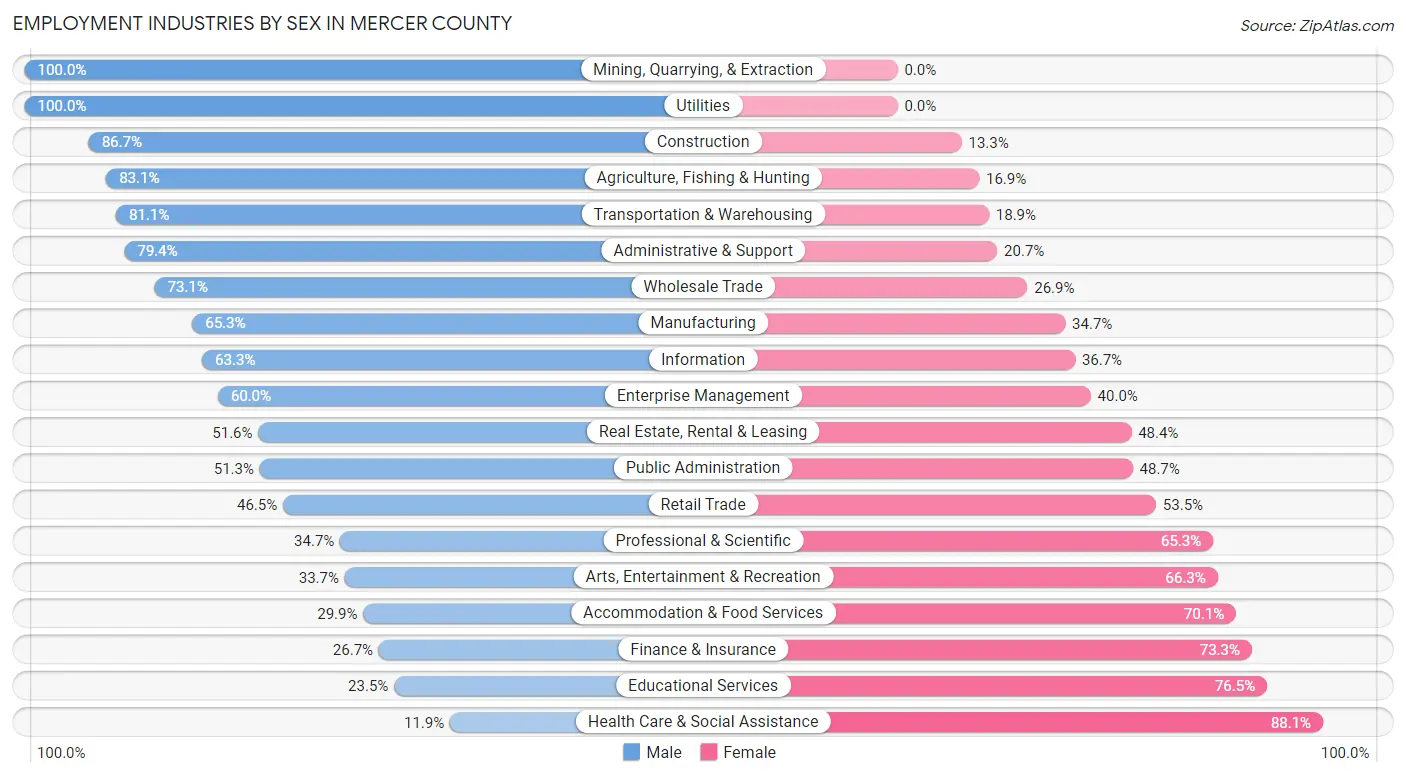
| Industry | Male | Female |
| Agriculture, Fishing & Hunting | 772 (83.1%) | 157 (16.9%) |
| Mining, Quarrying, & Extraction | 16 (100.0%) | 0 (0.0%) |
| Construction | 1,123 (86.7%) | 172 (13.3%) |
| Manufacturing | 4,518 (65.3%) | 2,403 (34.7%) |
| Wholesale Trade | 397 (73.1%) | 146 (26.9%) |
| Retail Trade | 1,182 (46.5%) | 1,360 (53.5%) |
| Transportation & Warehousing | 634 (81.1%) | 148 (18.9%) |
| Utilities | 50 (100.0%) | 0 (0.0%) |
| Information | 167 (63.3%) | 97 (36.7%) |
| Finance & Insurance | 153 (26.7%) | 421 (73.3%) |
| Real Estate, Rental & Leasing | 64 (51.6%) | 60 (48.4%) |
| Professional & Scientific | 206 (34.7%) | 388 (65.3%) |
| Enterprise Management | 3 (60.0%) | 2 (40.0%) |
| Administrative & Support | 315 (79.3%) | 82 (20.6%) |
| Educational Services | 350 (23.5%) | 1,139 (76.5%) |
| Health Care & Social Assistance | 295 (11.9%) | 2,177 (88.1%) |
| Arts, Entertainment & Recreation | 84 (33.7%) | 165 (66.3%) |
| Accommodation & Food Services | 260 (29.9%) | 610 (70.1%) |
| Public Administration | 214 (51.3%) | 203 (48.7%) |
| Total | 11,645 (53.3%) | 10,181 (46.7%) |
Education in Mercer County
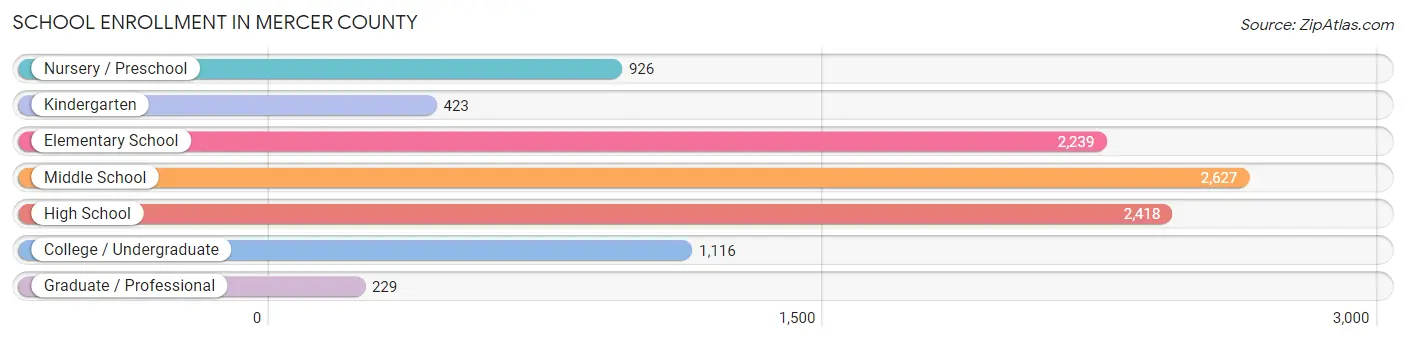
School Enrollment in Mercer County
The most common levels of schooling among the 9,978 students in Mercer County are middle school (2,627 | 26.3%), high school (2,418 | 24.2%), and elementary school (2,239 | 22.4%).
| School Level | # Students | % Students |
| Nursery / Preschool | 926 | 9.3% |
| Kindergarten | 423 | 4.2% |
| Elementary School | 2,239 | 22.4% |
| Middle School | 2,627 | 26.3% |
| High School | 2,418 | 24.2% |
| College / Undergraduate | 1,116 | 11.2% |
| Graduate / Professional | 229 | 2.3% |
| Total | 9,978 | 100.0% |
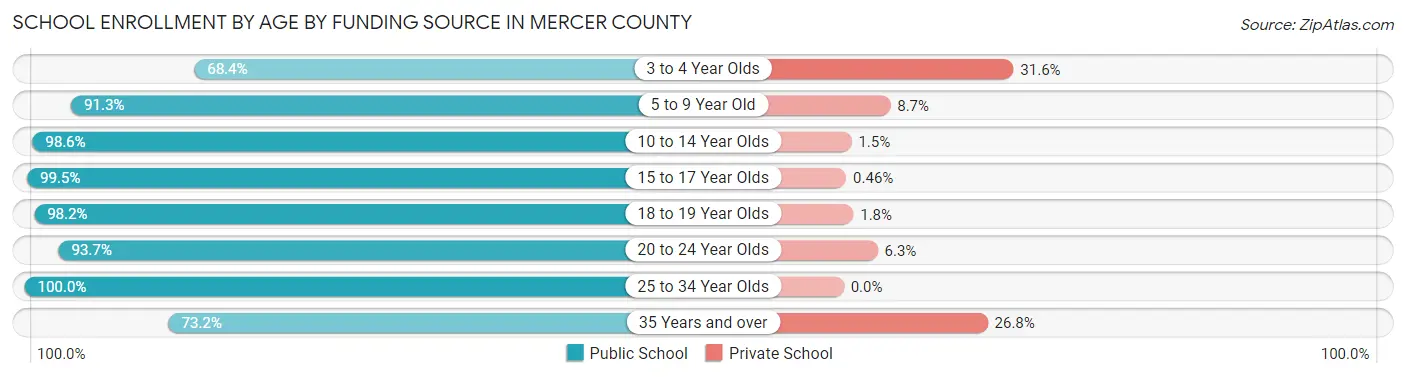
School Enrollment by Age by Funding Source in Mercer County
Out of a total of 9,978 students who are enrolled in schools in Mercer County, 589 (5.9%) attend a private institution, while the remaining 9,389 (94.1%) are enrolled in public schools. The age group of 3 to 4 year olds has the highest likelihood of being enrolled in private schools, with 203 (31.6% in the age bracket) enrolled. Conversely, the age group of 25 to 34 year olds has the lowest likelihood of being enrolled in a private school, with 315 (100.0% in the age bracket) attending a public institution.
| Age Bracket | Public School | Private School |
| 3 to 4 Year Olds | 439 (68.4%) | 203 (31.6%) |
| 5 to 9 Year Old | 2,484 (91.3%) | 236 (8.7%) |
| 10 to 14 Year Olds | 2,987 (98.6%) | 44 (1.5%) |
| 15 to 17 Year Olds | 1,716 (99.5%) | 8 (0.5%) |
| 18 to 19 Year Olds | 715 (98.2%) | 13 (1.8%) |
| 20 to 24 Year Olds | 637 (93.7%) | 43 (6.3%) |
| 25 to 34 Year Olds | 315 (100.0%) | 0 (0.0%) |
| 35 Years and over | 101 (73.2%) | 37 (26.8%) |
| Total | 9,389 (94.1%) | 589 (5.9%) |
Educational Attainment by Field of Study in Mercer County
Education (1,487 | 25.2%), business (1,250 | 21.1%), science & technology (813 | 13.8%), engineering (574 | 9.7%), and bio, nature & agricultural (499 | 8.4%) are the most common fields of study among 5,911 individuals in Mercer County who have obtained a bachelor's degree or higher.
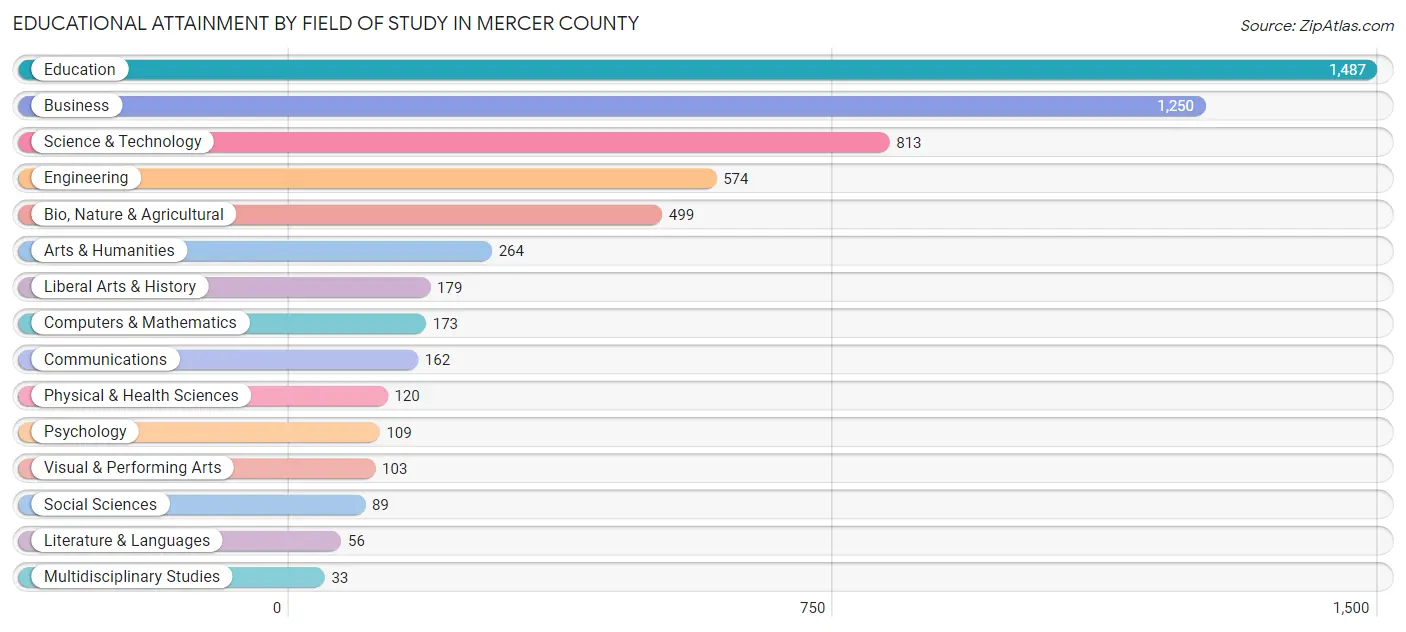
| Field of Study | # Graduates | % Graduates |
| Computers & Mathematics | 173 | 2.9% |
| Bio, Nature & Agricultural | 499 | 8.4% |
| Physical & Health Sciences | 120 | 2.0% |
| Psychology | 109 | 1.8% |
| Social Sciences | 89 | 1.5% |
| Engineering | 574 | 9.7% |
| Multidisciplinary Studies | 33 | 0.6% |
| Science & Technology | 813 | 13.8% |
| Business | 1,250 | 21.1% |
| Education | 1,487 | 25.2% |
| Literature & Languages | 56 | 0.9% |
| Liberal Arts & History | 179 | 3.0% |
| Visual & Performing Arts | 103 | 1.7% |
| Communications | 162 | 2.7% |
| Arts & Humanities | 264 | 4.5% |
| Total | 5,911 | 100.0% |
Transportation & Commute in Mercer County
Vehicle Availability by Sex in Mercer County
The most prevalent vehicle ownership categories in Mercer County are males with 2 vehicles (4,128, accounting for 36.0%) and females with 2 vehicles (3,430, making up 41.5%).
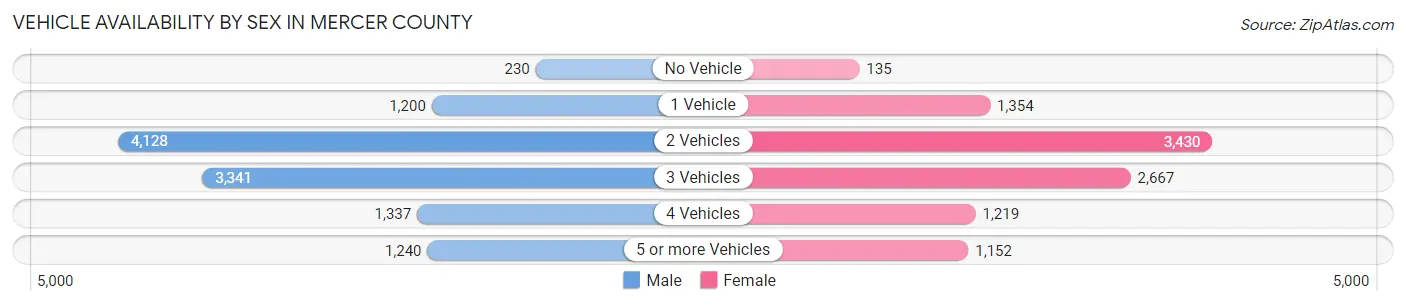
| Vehicles Available | Male | Female |
| No Vehicle | 230 (2.0%) | 135 (1.4%) |
| 1 Vehicle | 1,200 (10.5%) | 1,354 (13.6%) |
| 2 Vehicles | 4,128 (36.0%) | 3,430 (34.4%) |
| 3 Vehicles | 3,341 (29.1%) | 2,667 (26.8%) |
| 4 Vehicles | 1,337 (11.7%) | 1,219 (12.2%) |
| 5 or more Vehicles | 1,240 (10.8%) | 1,152 (11.6%) |
| Total | 11,476 (100.0%) | 9,957 (100.0%) |
Commute Time in Mercer County
The most frequently occuring commute durations in Mercer County are 5 to 9 minutes (4,390 commuters, 21.1%), 15 to 19 minutes (3,435 commuters, 16.5%), and 10 to 14 minutes (3,087 commuters, 14.8%).
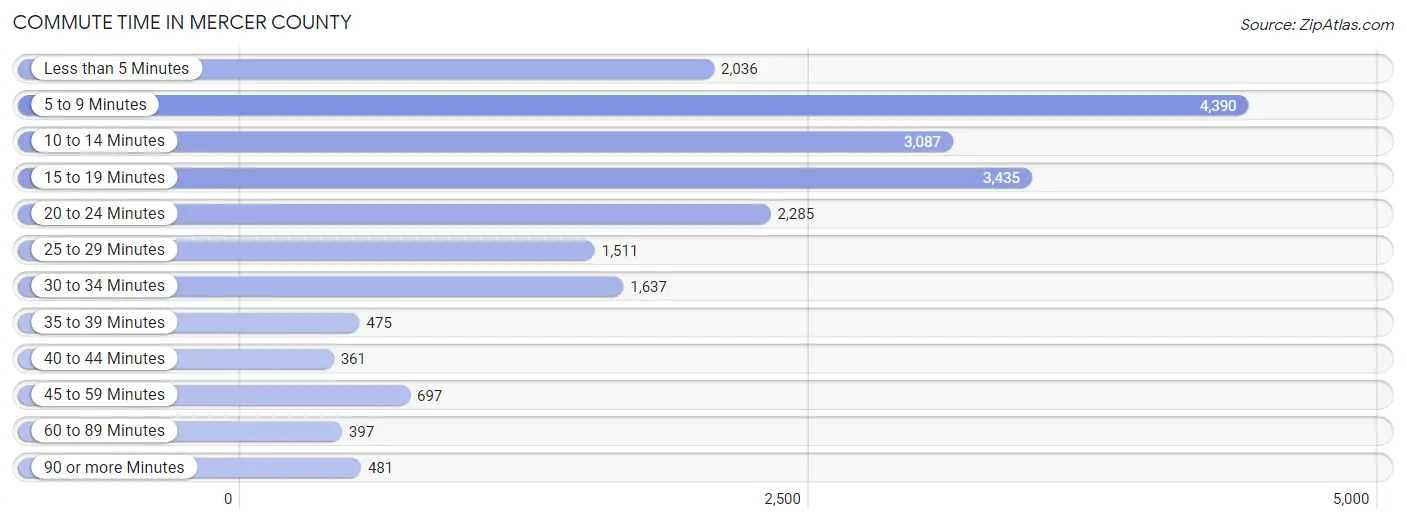
| Commute Time | # Commuters | % Commuters |
| Less than 5 Minutes | 2,036 | 9.8% |
| 5 to 9 Minutes | 4,390 | 21.1% |
| 10 to 14 Minutes | 3,087 | 14.8% |
| 15 to 19 Minutes | 3,435 | 16.5% |
| 20 to 24 Minutes | 2,285 | 11.0% |
| 25 to 29 Minutes | 1,511 | 7.3% |
| 30 to 34 Minutes | 1,637 | 7.9% |
| 35 to 39 Minutes | 475 | 2.3% |
| 40 to 44 Minutes | 361 | 1.7% |
| 45 to 59 Minutes | 697 | 3.4% |
| 60 to 89 Minutes | 397 | 1.9% |
| 90 or more Minutes | 481 | 2.3% |
Commute Time by Sex in Mercer County
The most common commute times in Mercer County are 5 to 9 minutes (2,674 commuters, 24.1%) for males and 5 to 9 minutes (1,716 commuters, 17.7%) for females.
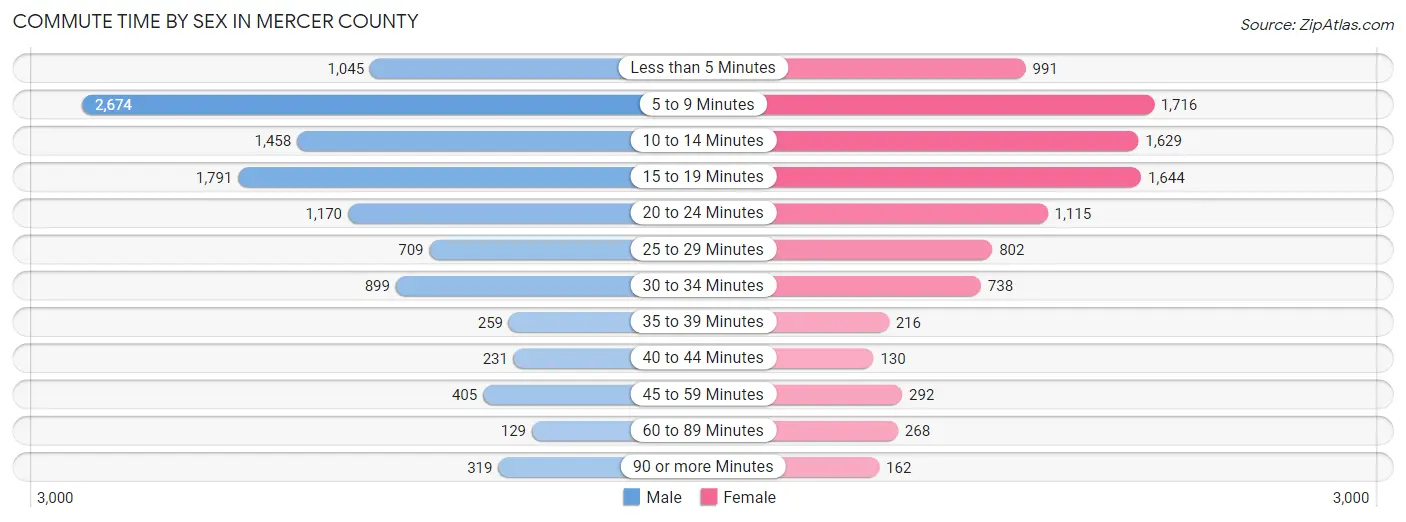
| Commute Time | Male | Female |
| Less than 5 Minutes | 1,045 (9.4%) | 991 (10.2%) |
| 5 to 9 Minutes | 2,674 (24.1%) | 1,716 (17.7%) |
| 10 to 14 Minutes | 1,458 (13.2%) | 1,629 (16.8%) |
| 15 to 19 Minutes | 1,791 (16.2%) | 1,644 (16.9%) |
| 20 to 24 Minutes | 1,170 (10.5%) | 1,115 (11.5%) |
| 25 to 29 Minutes | 709 (6.4%) | 802 (8.3%) |
| 30 to 34 Minutes | 899 (8.1%) | 738 (7.6%) |
| 35 to 39 Minutes | 259 (2.3%) | 216 (2.2%) |
| 40 to 44 Minutes | 231 (2.1%) | 130 (1.3%) |
| 45 to 59 Minutes | 405 (3.6%) | 292 (3.0%) |
| 60 to 89 Minutes | 129 (1.2%) | 268 (2.8%) |
| 90 or more Minutes | 319 (2.9%) | 162 (1.7%) |
Time of Departure to Work by Sex in Mercer County
The most frequent times of departure to work in Mercer County are 6:30 AM to 6:59 AM (1,449, 13.1%) for males and 7:30 AM to 7:59 AM (1,497, 15.4%) for females.
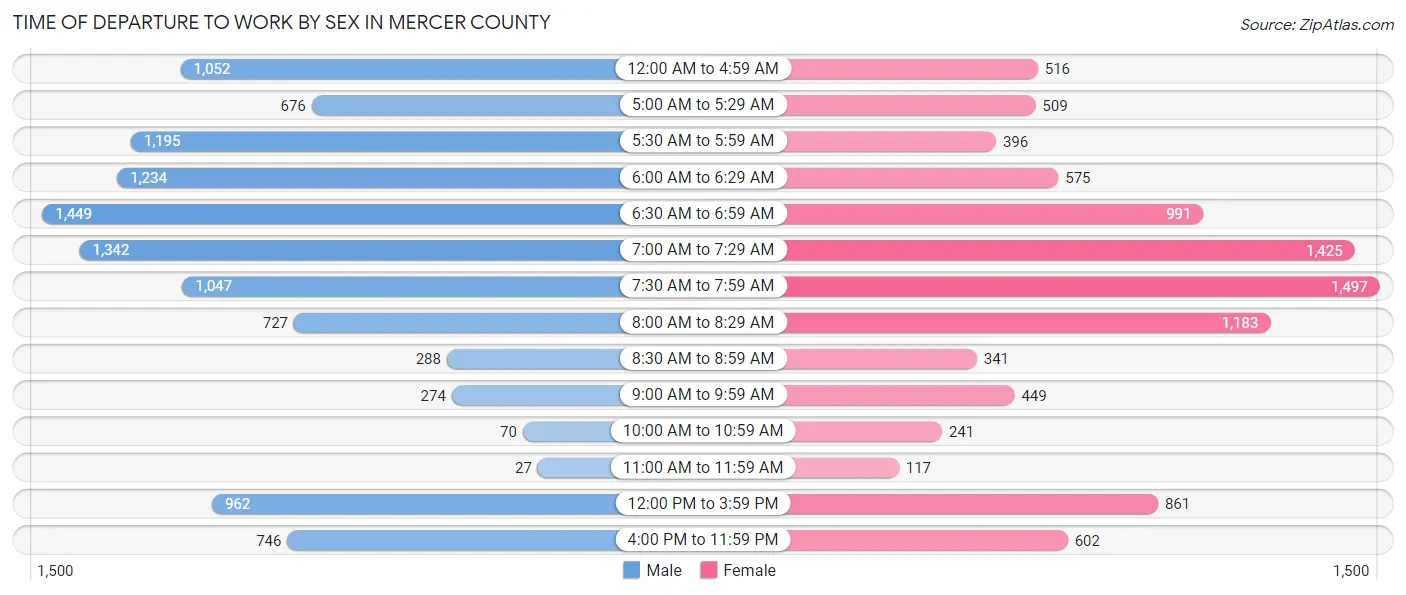
| Time of Departure | Male | Female |
| 12:00 AM to 4:59 AM | 1,052 (9.5%) | 516 (5.3%) |
| 5:00 AM to 5:29 AM | 676 (6.1%) | 509 (5.2%) |
| 5:30 AM to 5:59 AM | 1,195 (10.8%) | 396 (4.1%) |
| 6:00 AM to 6:29 AM | 1,234 (11.1%) | 575 (5.9%) |
| 6:30 AM to 6:59 AM | 1,449 (13.1%) | 991 (10.2%) |
| 7:00 AM to 7:29 AM | 1,342 (12.1%) | 1,425 (14.7%) |
| 7:30 AM to 7:59 AM | 1,047 (9.4%) | 1,497 (15.4%) |
| 8:00 AM to 8:29 AM | 727 (6.6%) | 1,183 (12.2%) |
| 8:30 AM to 8:59 AM | 288 (2.6%) | 341 (3.5%) |
| 9:00 AM to 9:59 AM | 274 (2.5%) | 449 (4.6%) |
| 10:00 AM to 10:59 AM | 70 (0.6%) | 241 (2.5%) |
| 11:00 AM to 11:59 AM | 27 (0.2%) | 117 (1.2%) |
| 12:00 PM to 3:59 PM | 962 (8.7%) | 861 (8.9%) |
| 4:00 PM to 11:59 PM | 746 (6.7%) | 602 (6.2%) |
| Total | 11,089 (100.0%) | 9,703 (100.0%) |
Housing Occupancy in Mercer County
Occupancy by Ownership in Mercer County
Of the total 16,022 dwellings in Mercer County, owner-occupied units account for 12,623 (78.8%), while renter-occupied units make up 3,399 (21.2%).
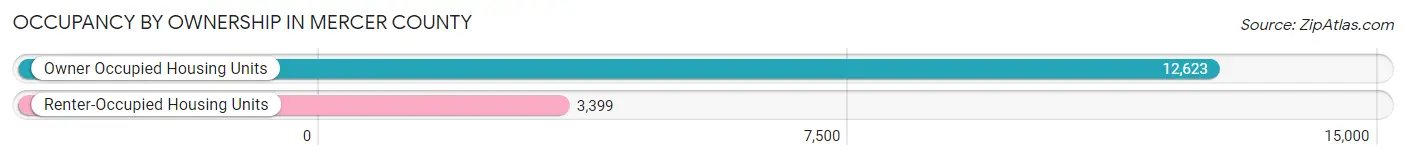
| Occupancy | # Housing Units | % Housing Units |
| Owner Occupied Housing Units | 12,623 | 78.8% |
| Renter-Occupied Housing Units | 3,399 | 21.2% |
| Total Occupied Housing Units | 16,022 | 100.0% |
Occupancy by Household Size in Mercer County
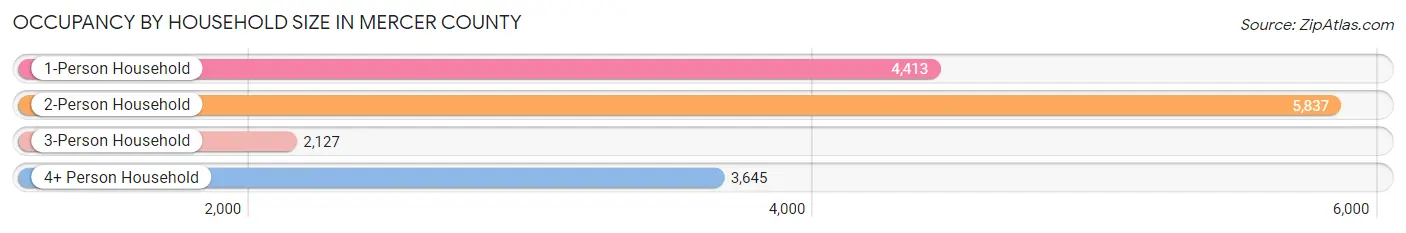
| Household Size | # Housing Units | % Housing Units |
| 1-Person Household | 4,413 | 27.5% |
| 2-Person Household | 5,837 | 36.4% |
| 3-Person Household | 2,127 | 13.3% |
| 4+ Person Household | 3,645 | 22.8% |
| Total Housing Units | 16,022 | 100.0% |
Occupancy by Ownership by Household Size in Mercer County
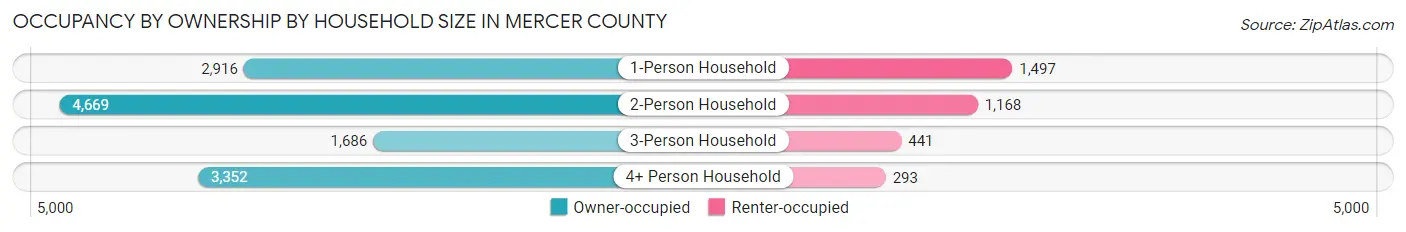
| Household Size | Owner-occupied | Renter-occupied |
| 1-Person Household | 2,916 (66.1%) | 1,497 (33.9%) |
| 2-Person Household | 4,669 (80.0%) | 1,168 (20.0%) |
| 3-Person Household | 1,686 (79.3%) | 441 (20.7%) |
| 4+ Person Household | 3,352 (92.0%) | 293 (8.0%) |
| Total Housing Units | 12,623 (78.8%) | 3,399 (21.2%) |
Occupancy by Educational Attainment in Mercer County
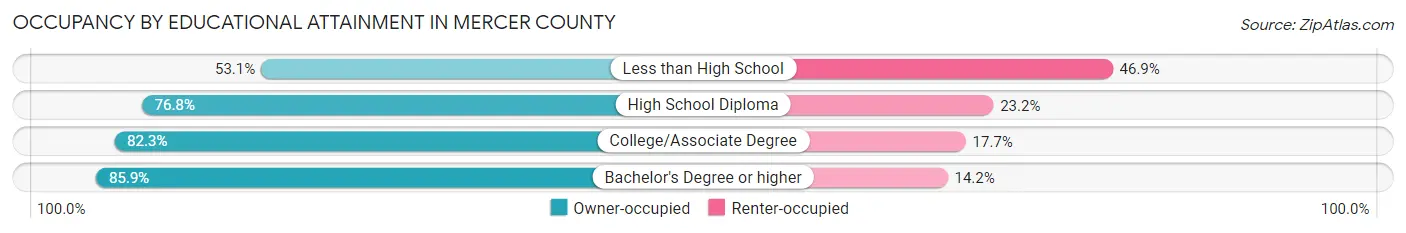
| Household Size | Owner-occupied | Renter-occupied |
| Less than High School | 579 (53.1%) | 511 (46.9%) |
| High School Diploma | 5,061 (76.8%) | 1,530 (23.2%) |
| College/Associate Degree | 4,076 (82.3%) | 879 (17.7%) |
| Bachelor's Degree or higher | 2,907 (85.9%) | 479 (14.1%) |
Occupancy by Age of Householder in Mercer County
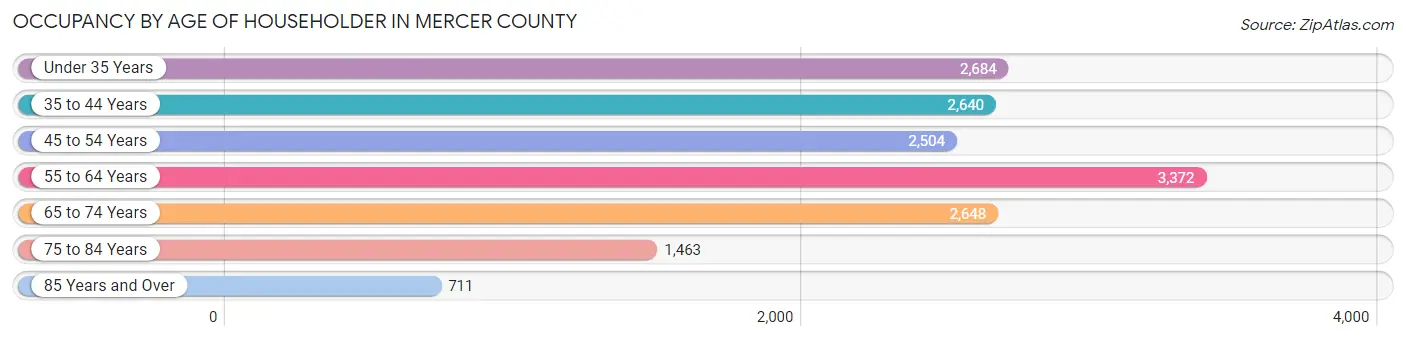
| Age Bracket | # Households | % Households |
| Under 35 Years | 2,684 | 16.8% |
| 35 to 44 Years | 2,640 | 16.5% |
| 45 to 54 Years | 2,504 | 15.6% |
| 55 to 64 Years | 3,372 | 21.0% |
| 65 to 74 Years | 2,648 | 16.5% |
| 75 to 84 Years | 1,463 | 9.1% |
| 85 Years and Over | 711 | 4.4% |
| Total | 16,022 | 100.0% |
Housing Finances in Mercer County
Median Income by Occupancy in Mercer County
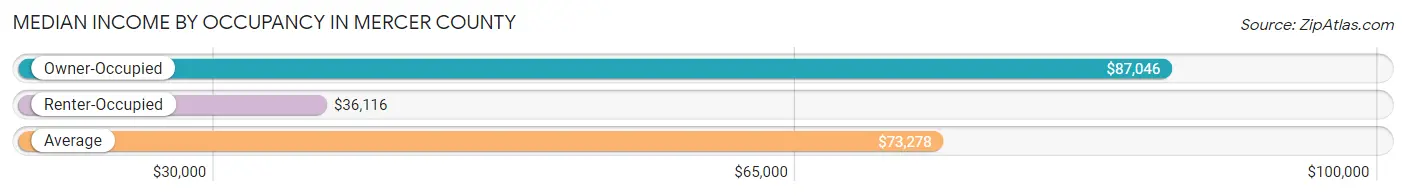
| Occupancy Type | # Households | Median Income |
| Owner-Occupied | 12,623 (78.8%) | $87,046 |
| Renter-Occupied | 3,399 (21.2%) | $36,116 |
| Average | 16,022 (100.0%) | $73,278 |
Occupancy by Householder Income Bracket in Mercer County
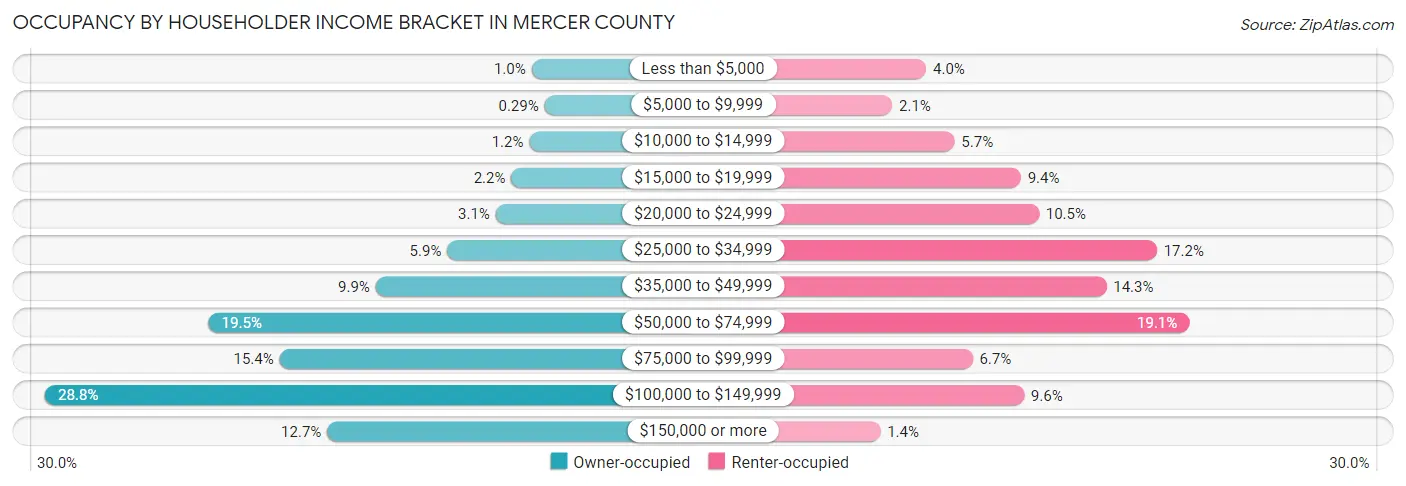
| Income Bracket | Owner-occupied | Renter-occupied |
| Less than $5,000 | 130 (1.0%) | 137 (4.0%) |
| $5,000 to $9,999 | 36 (0.3%) | 71 (2.1%) |
| $10,000 to $14,999 | 147 (1.2%) | 192 (5.7%) |
| $15,000 to $19,999 | 276 (2.2%) | 321 (9.4%) |
| $20,000 to $24,999 | 389 (3.1%) | 356 (10.5%) |
| $25,000 to $34,999 | 739 (5.9%) | 585 (17.2%) |
| $35,000 to $49,999 | 1,255 (9.9%) | 487 (14.3%) |
| $50,000 to $74,999 | 2,459 (19.5%) | 648 (19.1%) |
| $75,000 to $99,999 | 1,948 (15.4%) | 227 (6.7%) |
| $100,000 to $149,999 | 3,639 (28.8%) | 327 (9.6%) |
| $150,000 or more | 1,605 (12.7%) | 48 (1.4%) |
| Total | 12,623 (100.0%) | 3,399 (100.0%) |
Monthly Housing Cost Tiers in Mercer County
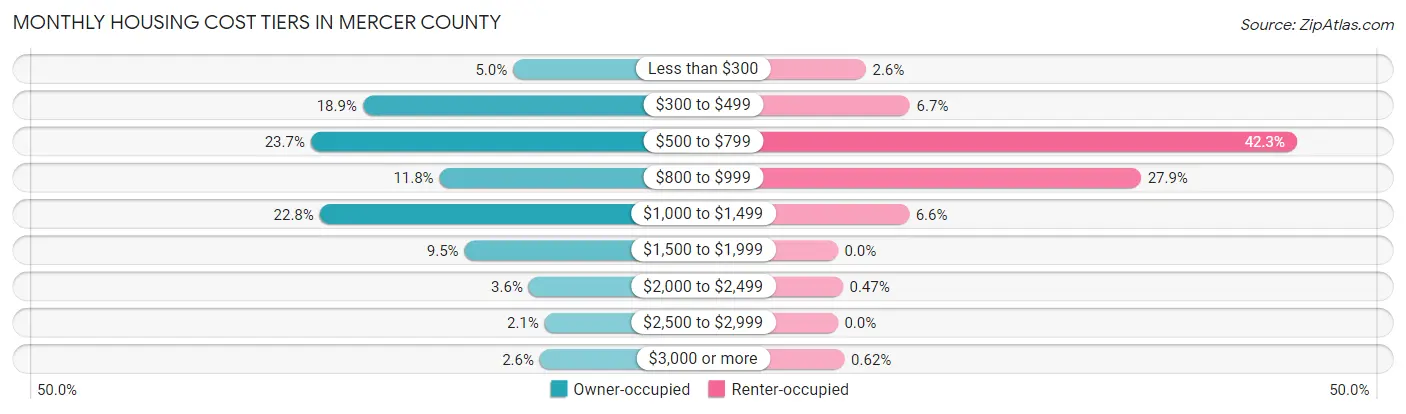
| Monthly Cost | Owner-occupied | Renter-occupied |
| Less than $300 | 635 (5.0%) | 88 (2.6%) |
| $300 to $499 | 2,382 (18.9%) | 226 (6.7%) |
| $500 to $799 | 2,986 (23.7%) | 1,437 (42.3%) |
| $800 to $999 | 1,491 (11.8%) | 949 (27.9%) |
| $1,000 to $1,499 | 2,883 (22.8%) | 223 (6.6%) |
| $1,500 to $1,999 | 1,200 (9.5%) | 0 (0.0%) |
| $2,000 to $2,499 | 453 (3.6%) | 16 (0.5%) |
| $2,500 to $2,999 | 269 (2.1%) | 0 (0.0%) |
| $3,000 or more | 324 (2.6%) | 21 (0.6%) |
| Total | 12,623 (100.0%) | 3,399 (100.0%) |
Physical Housing Characteristics in Mercer County
Housing Structures in Mercer County
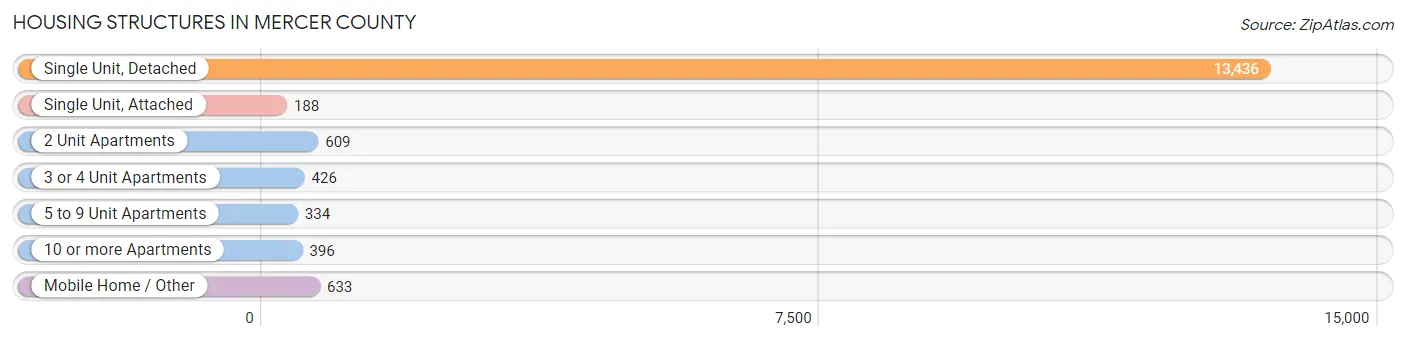
| Structure Type | # Housing Units | % Housing Units |
| Single Unit, Detached | 13,436 | 83.9% |
| Single Unit, Attached | 188 | 1.2% |
| 2 Unit Apartments | 609 | 3.8% |
| 3 or 4 Unit Apartments | 426 | 2.7% |
| 5 to 9 Unit Apartments | 334 | 2.1% |
| 10 or more Apartments | 396 | 2.5% |
| Mobile Home / Other | 633 | 4.0% |
| Total | 16,022 | 100.0% |
Housing Structures by Occupancy in Mercer County
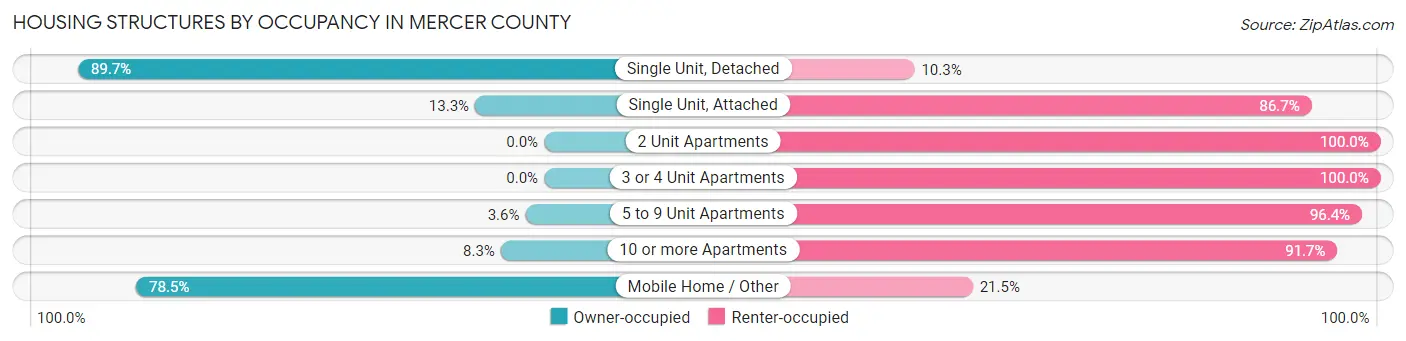
| Structure Type | Owner-occupied | Renter-occupied |
| Single Unit, Detached | 12,056 (89.7%) | 1,380 (10.3%) |
| Single Unit, Attached | 25 (13.3%) | 163 (86.7%) |
| 2 Unit Apartments | 0 (0.0%) | 609 (100.0%) |
| 3 or 4 Unit Apartments | 0 (0.0%) | 426 (100.0%) |
| 5 to 9 Unit Apartments | 12 (3.6%) | 322 (96.4%) |
| 10 or more Apartments | 33 (8.3%) | 363 (91.7%) |
| Mobile Home / Other | 497 (78.5%) | 136 (21.5%) |
| Total | 12,623 (78.8%) | 3,399 (21.2%) |
Housing Structures by Number of Rooms in Mercer County
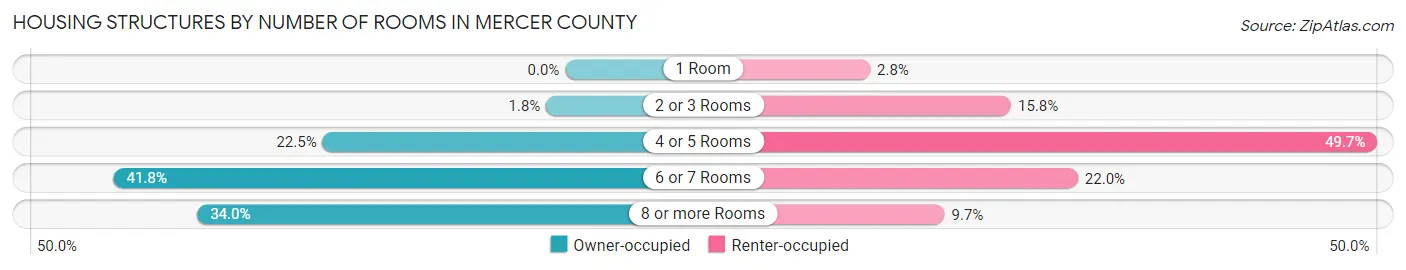
| Number of Rooms | Owner-occupied | Renter-occupied |
| 1 Room | 0 (0.0%) | 95 (2.8%) |
| 2 or 3 Rooms | 222 (1.8%) | 538 (15.8%) |
| 4 or 5 Rooms | 2,834 (22.5%) | 1,689 (49.7%) |
| 6 or 7 Rooms | 5,272 (41.8%) | 748 (22.0%) |
| 8 or more Rooms | 4,295 (34.0%) | 329 (9.7%) |
| Total | 12,623 (100.0%) | 3,399 (100.0%) |
Housing Structure by Heating Type in Mercer County
| Heating Type | Owner-occupied | Renter-occupied |
| Utility Gas | 6,014 (47.6%) | 1,578 (46.4%) |
| Bottled, Tank, or LP Gas | 2,762 (21.9%) | 395 (11.6%) |
| Electricity | 2,905 (23.0%) | 1,276 (37.5%) |
| Fuel Oil or Kerosene | 314 (2.5%) | 51 (1.5%) |
| Coal or Coke | 0 (0.0%) | 0 (0.0%) |
| All other Fuels | 503 (4.0%) | 64 (1.9%) |
| No Fuel Used | 125 (1.0%) | 35 (1.0%) |
| Total | 12,623 (100.0%) | 3,399 (100.0%) |
Household Vehicle Usage in Mercer County
| Vehicles per Household | Owner-occupied | Renter-occupied |
| No Vehicle | 217 (1.7%) | 480 (14.1%) |
| 1 Vehicle | 2,425 (19.2%) | 1,748 (51.4%) |
| 2 Vehicles | 5,113 (40.5%) | 805 (23.7%) |
| 3 or more Vehicles | 4,868 (38.6%) | 366 (10.8%) |
| Total | 12,623 (100.0%) | 3,399 (100.0%) |
Real Estate & Mortgages in Mercer County
Real Estate and Mortgage Overview in Mercer County
| Characteristic | Without Mortgage | With Mortgage |
| Housing Units | 6,030 | 6,593 |
| Median Property Value | $185,700 | $197,200 |
| Median Household Income | $69,664 | $1,010 |
| Monthly Housing Costs | $508 | $321 |
| Real Estate Taxes | $2,141 | $121 |
Property Value by Mortgage Status in Mercer County
| Property Value | Without Mortgage | With Mortgage |
| Less than $50,000 | 539 (8.9%) | 98 (1.5%) |
| $50,000 to $99,999 | 781 (13.0%) | 655 (9.9%) |
| $100,000 to $299,999 | 3,089 (51.2%) | 4,280 (64.9%) |
| $300,000 to $499,999 | 1,186 (19.7%) | 1,200 (18.2%) |
| $500,000 to $749,999 | 344 (5.7%) | 179 (2.7%) |
| $750,000 to $999,999 | 39 (0.6%) | 16 (0.2%) |
| $1,000,000 or more | 52 (0.9%) | 165 (2.5%) |
| Total | 6,030 (100.0%) | 6,593 (100.0%) |
Household Income by Mortgage Status in Mercer County
| Household Income | Without Mortgage | With Mortgage |
| Less than $10,000 | 116 (1.9%) | 252 (3.8%) |
| $10,000 to $24,999 | 627 (10.4%) | 50 (0.8%) |
| $25,000 to $34,999 | 559 (9.3%) | 185 (2.8%) |
| $35,000 to $49,999 | 771 (12.8%) | 180 (2.7%) |
| $50,000 to $74,999 | 1,260 (20.9%) | 484 (7.3%) |
| $75,000 to $99,999 | 843 (14.0%) | 1,199 (18.2%) |
| $100,000 to $149,999 | 1,259 (20.9%) | 1,105 (16.8%) |
| $150,000 or more | 595 (9.9%) | 2,380 (36.1%) |
| Total | 6,030 (100.0%) | 6,593 (100.0%) |
Property Value to Household Income Ratio in Mercer County
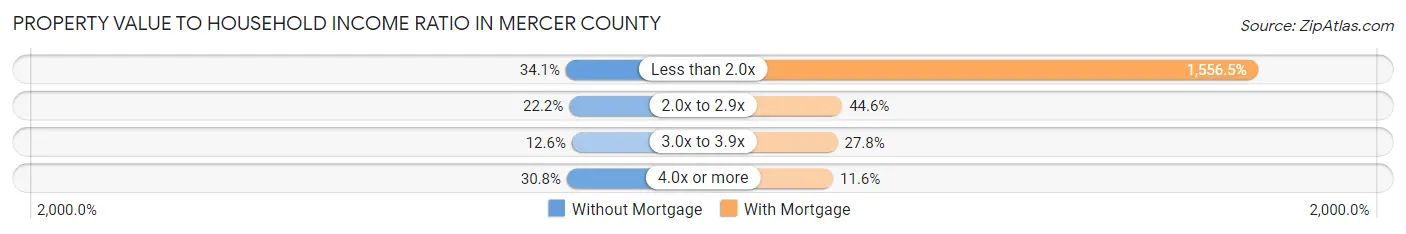
| Value-to-Income Ratio | Without Mortgage | With Mortgage |
| Less than 2.0x | 2,057 (34.1%) | 102,623 (1,556.5%) |
| 2.0x to 2.9x | 1,340 (22.2%) | 2,941 (44.6%) |
| 3.0x to 3.9x | 762 (12.6%) | 1,830 (27.8%) |
| 4.0x or more | 1,854 (30.7%) | 766 (11.6%) |
| Total | 6,030 (100.0%) | 6,593 (100.0%) |
Real Estate Taxes by Mortgage Status in Mercer County
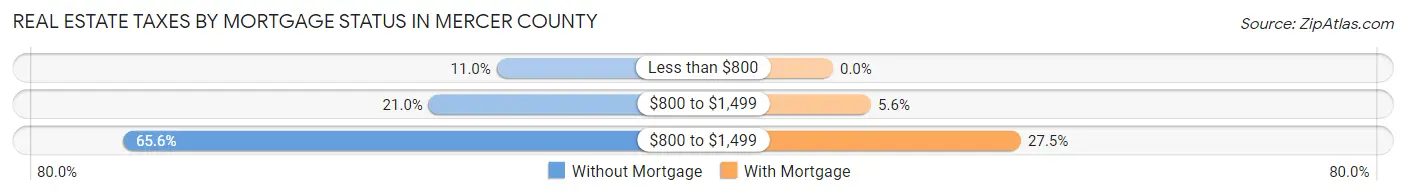
| Property Taxes | Without Mortgage | With Mortgage |
| Less than $800 | 665 (11.0%) | 0 (0.0%) |
| $800 to $1,499 | 1,264 (21.0%) | 367 (5.6%) |
| $800 to $1,499 | 3,957 (65.6%) | 1,812 (27.5%) |
| Total | 6,030 (100.0%) | 6,593 (100.0%) |
Health & Disability in Mercer County
Health Insurance Coverage by Age in Mercer County
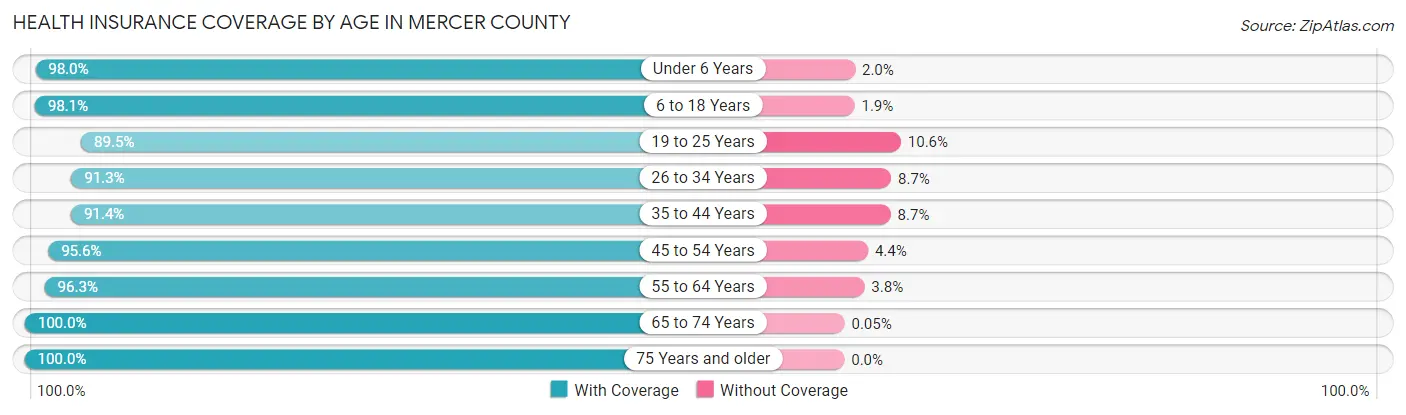
| Age Bracket | With Coverage | Without Coverage |
| Under 6 Years | 3,570 (98.0%) | 73 (2.0%) |
| 6 to 18 Years | 7,660 (98.1%) | 149 (1.9%) |
| 19 to 25 Years | 2,883 (89.4%) | 340 (10.5%) |
| 26 to 34 Years | 3,958 (91.3%) | 378 (8.7%) |
| 35 to 44 Years | 4,317 (91.3%) | 409 (8.6%) |
| 45 to 54 Years | 4,532 (95.6%) | 209 (4.4%) |
| 55 to 64 Years | 5,622 (96.3%) | 219 (3.7%) |
| 65 to 74 Years | 4,432 (100.0%) | 2 (0.1%) |
| 75 Years and older | 3,095 (100.0%) | 0 (0.0%) |
| Total | 40,069 (95.8%) | 1,779 (4.3%) |
Health Insurance Coverage by Citizenship Status in Mercer County
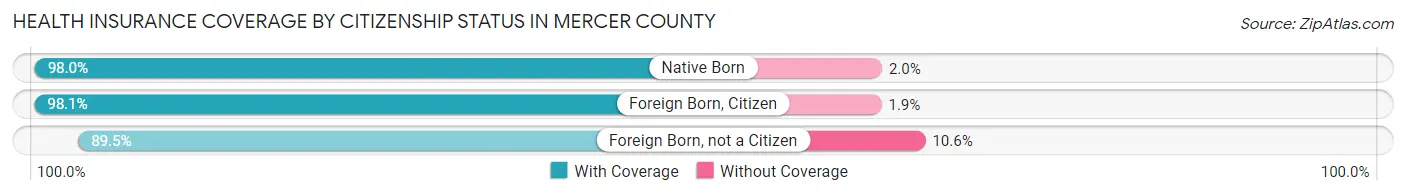
| Citizenship Status | With Coverage | Without Coverage |
| Native Born | 3,570 (98.0%) | 73 (2.0%) |
| Foreign Born, Citizen | 7,660 (98.1%) | 149 (1.9%) |
| Foreign Born, not a Citizen | 2,883 (89.4%) | 340 (10.5%) |
Health Insurance Coverage by Household Income in Mercer County
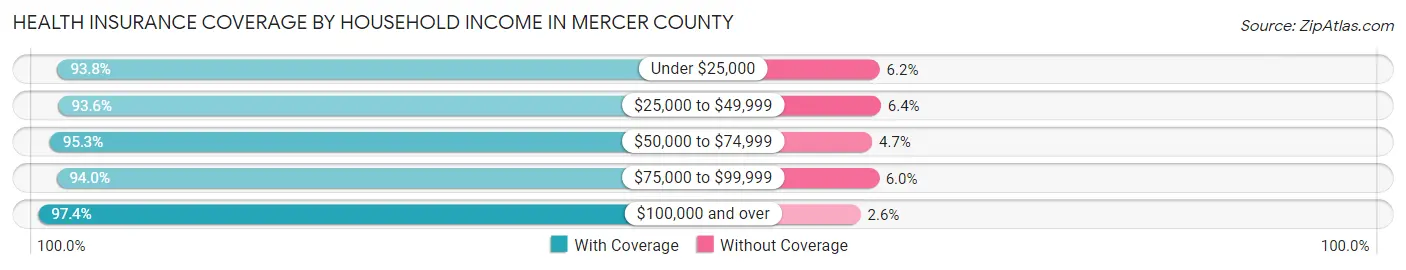
| Household Income | With Coverage | Without Coverage |
| Under $25,000 | 2,710 (93.8%) | 178 (6.2%) |
| $25,000 to $49,999 | 5,485 (93.6%) | 374 (6.4%) |
| $50,000 to $74,999 | 6,728 (95.3%) | 335 (4.7%) |
| $75,000 to $99,999 | 5,868 (94.0%) | 373 (6.0%) |
| $100,000 and over | 19,190 (97.4%) | 509 (2.6%) |
Public vs Private Health Insurance Coverage by Age in Mercer County
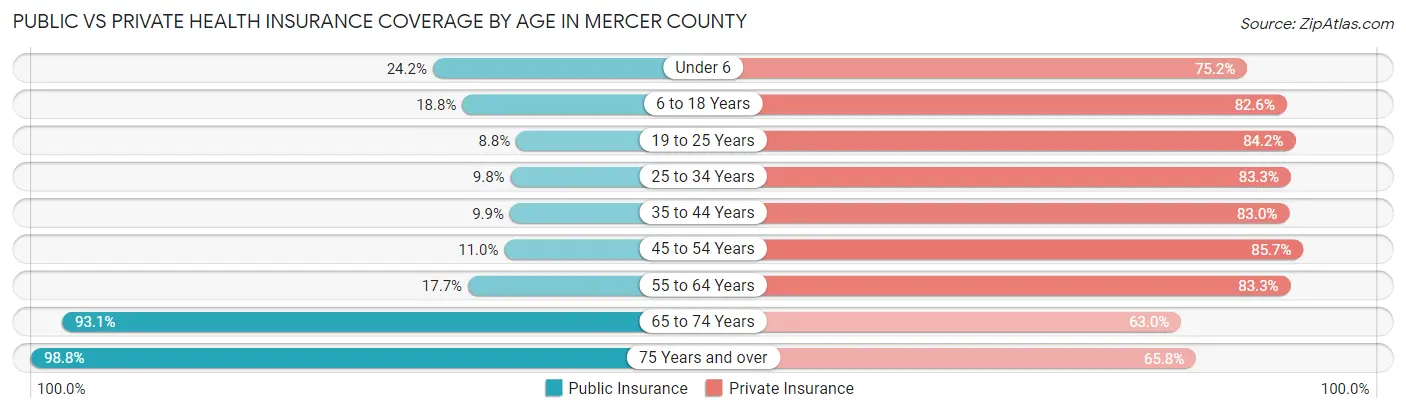
| Age Bracket | Public Insurance | Private Insurance |
| Under 6 | 883 (24.2%) | 2,741 (75.2%) |
| 6 to 18 Years | 1,466 (18.8%) | 6,449 (82.6%) |
| 19 to 25 Years | 283 (8.8%) | 2,712 (84.2%) |
| 25 to 34 Years | 426 (9.8%) | 3,613 (83.3%) |
| 35 to 44 Years | 470 (9.9%) | 3,924 (83.0%) |
| 45 to 54 Years | 520 (11.0%) | 4,061 (85.7%) |
| 55 to 64 Years | 1,035 (17.7%) | 4,863 (83.3%) |
| 65 to 74 Years | 4,126 (93.0%) | 2,793 (63.0%) |
| 75 Years and over | 3,058 (98.8%) | 2,035 (65.7%) |
| Total | 12,267 (29.3%) | 33,191 (79.3%) |
Disability Status by Sex by Age in Mercer County
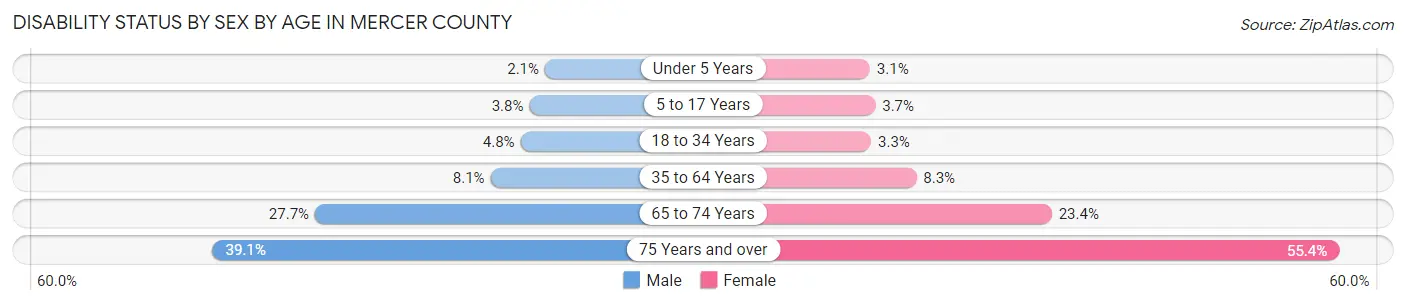
| Age Bracket | Male | Female |
| Under 5 Years | 32 (2.1%) | 51 (3.1%) |
| 5 to 17 Years | 154 (3.8%) | 135 (3.7%) |
| 18 to 34 Years | 206 (4.8%) | 125 (3.3%) |
| 35 to 64 Years | 633 (8.1%) | 623 (8.3%) |
| 65 to 74 Years | 602 (27.7%) | 528 (23.4%) |
| 75 Years and over | 507 (39.1%) | 995 (55.4%) |
Disability Class by Sex by Age in Mercer County
Disability Class: Hearing Difficulty

| Age Bracket | Male | Female |
| Under 5 Years | 32 (2.1%) | 51 (3.1%) |
| 5 to 17 Years | 49 (1.2%) | 48 (1.3%) |
| 18 to 34 Years | 49 (1.1%) | 45 (1.2%) |
| 35 to 64 Years | 113 (1.5%) | 71 (0.9%) |
| 65 to 74 Years | 323 (14.8%) | 173 (7.7%) |
| 75 Years and over | 215 (16.6%) | 366 (20.4%) |
Disability Class: Vision Difficulty
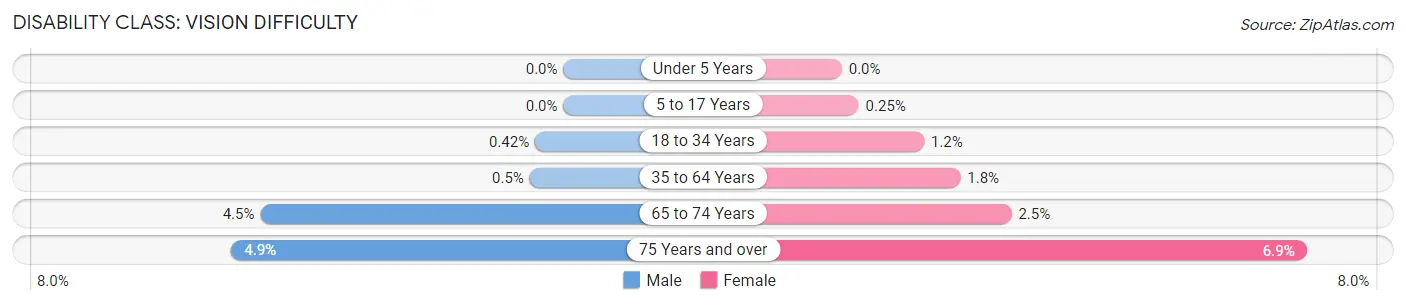
| Age Bracket | Male | Female |
| Under 5 Years | 0 (0.0%) | 0 (0.0%) |
| 5 to 17 Years | 0 (0.0%) | 9 (0.3%) |
| 18 to 34 Years | 18 (0.4%) | 47 (1.2%) |
| 35 to 64 Years | 39 (0.5%) | 132 (1.8%) |
| 65 to 74 Years | 98 (4.5%) | 57 (2.5%) |
| 75 Years and over | 64 (4.9%) | 124 (6.9%) |
Disability Class: Cognitive Difficulty
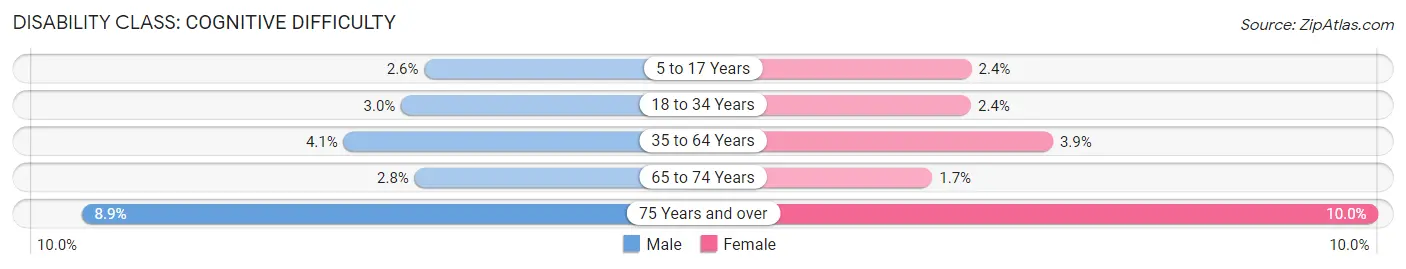
| Age Bracket | Male | Female |
| 5 to 17 Years | 105 (2.6%) | 87 (2.4%) |
| 18 to 34 Years | 130 (3.0%) | 92 (2.4%) |
| 35 to 64 Years | 318 (4.1%) | 294 (3.9%) |
| 65 to 74 Years | 60 (2.8%) | 38 (1.7%) |
| 75 Years and over | 116 (8.9%) | 179 (10.0%) |
Disability Class: Ambulatory Difficulty
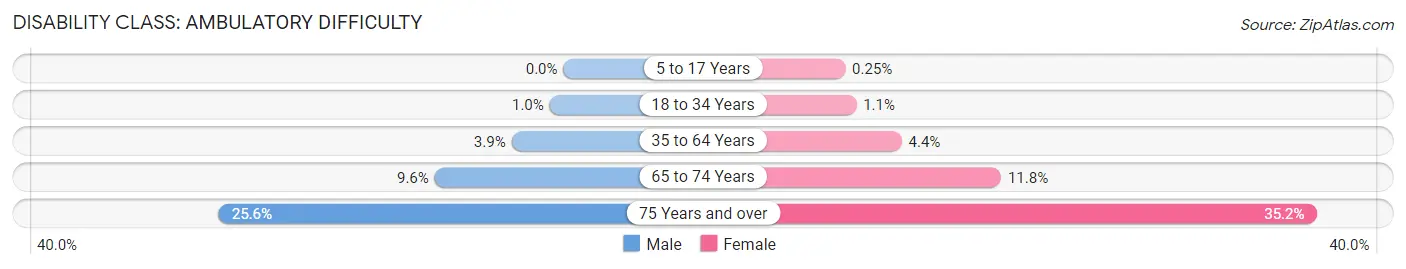
| Age Bracket | Male | Female |
| 5 to 17 Years | 0 (0.0%) | 9 (0.3%) |
| 18 to 34 Years | 44 (1.0%) | 41 (1.1%) |
| 35 to 64 Years | 300 (3.8%) | 333 (4.4%) |
| 65 to 74 Years | 208 (9.6%) | 267 (11.8%) |
| 75 Years and over | 332 (25.6%) | 633 (35.2%) |
Disability Class: Self-Care Difficulty
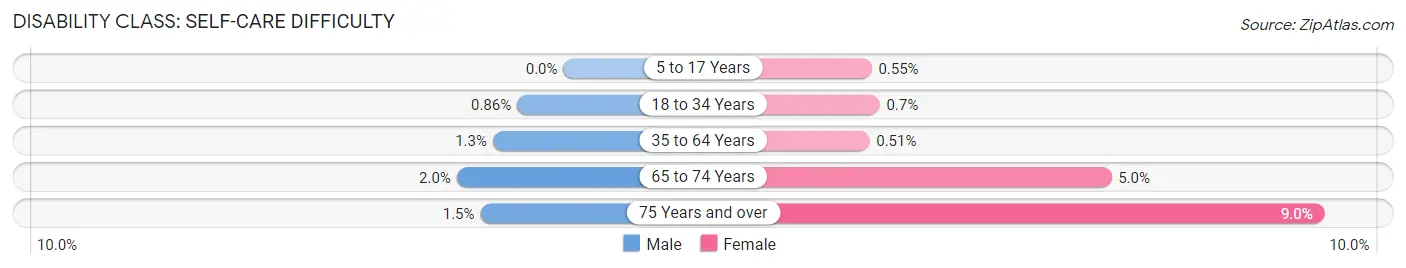
| Age Bracket | Male | Female |
| 5 to 17 Years | 0 (0.0%) | 20 (0.5%) |
| 18 to 34 Years | 37 (0.9%) | 27 (0.7%) |
| 35 to 64 Years | 102 (1.3%) | 38 (0.5%) |
| 65 to 74 Years | 43 (2.0%) | 113 (5.0%) |
| 75 Years and over | 20 (1.5%) | 161 (9.0%) |
Technology Access in Mercer County
Computing Device Access in Mercer County
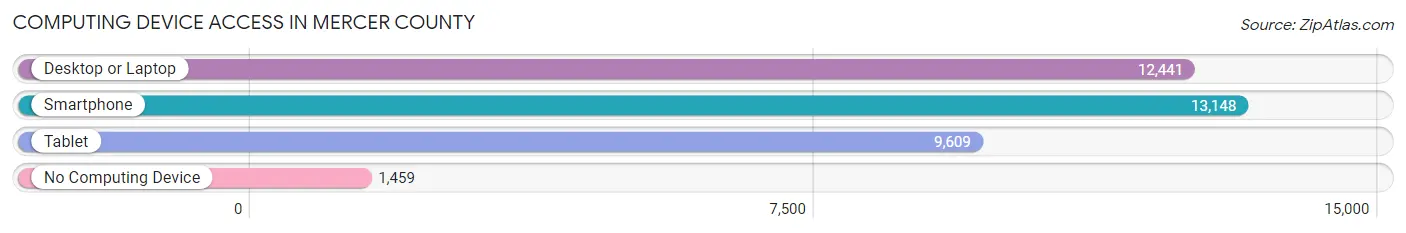
| Device Type | # Households | % Households |
| Desktop or Laptop | 12,441 | 77.6% |
| Smartphone | 13,148 | 82.1% |
| Tablet | 9,609 | 60.0% |
| No Computing Device | 1,459 | 9.1% |
| Total | 16,022 | 100.0% |
Internet Access in Mercer County
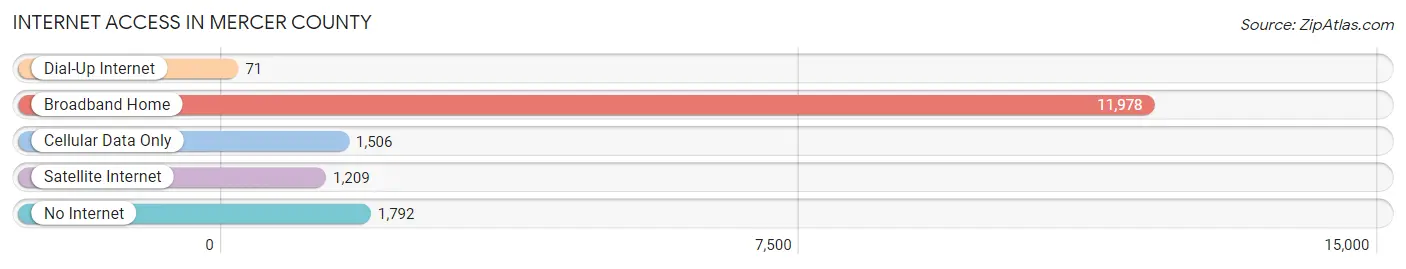
| Internet Type | # Households | % Households |
| Dial-Up Internet | 71 | 0.4% |
| Broadband Home | 11,978 | 74.8% |
| Cellular Data Only | 1,506 | 9.4% |
| Satellite Internet | 1,209 | 7.5% |
| No Internet | 1,792 | 11.2% |
| Total | 16,022 | 100.0% |
Mercer County Summary
Mercer County, Ohio is located in the western part of the state, and is part of the Great Lakes region. It is bordered by Auglaize County to the north, Van Wert County to the east, Darke County to the south, and Allen County to the west. The county seat is Celina, and the largest city is Coldwater. The county was established in 1820 and named after General Hugh Mercer, a Revolutionary War hero.
Geography
Mercer County is located in the western part of Ohio, and is part of the Great Lakes region. It is bordered by Auglaize County to the north, Van Wert County to the east, Darke County to the south, and Allen County to the west. The county has a total area of 437 square miles, of which 434 square miles is land and 3 square miles is water. The terrain is mostly flat, with some rolling hills in the northern part of the county. The highest point in the county is located in the northern part, at an elevation of 1,068 feet.
The county is home to several bodies of water, including Grand Lake St. Marys, Wabash River, and St. Marys River. Grand Lake St. Marys is the largest lake in the county, and is a popular destination for fishing, boating, and swimming. The Wabash River is a major tributary of the Ohio River, and is used for recreational activities such as canoeing and kayaking. The St. Marys River is a smaller tributary of the Wabash River, and is also used for recreational activities.
Economy
The economy of Mercer County is largely based on agriculture and manufacturing. The county is home to several large farms, which produce a variety of crops, including corn, soybeans, wheat, and hay. The county is also home to several manufacturing companies, which produce a variety of products, including automotive parts, furniture, and plastics.
The county is also home to several small businesses, which provide goods and services to the local community. These businesses include restaurants, retail stores, and professional services. The county is also home to several tourist attractions, including Grand Lake St. Marys, the Mercer County Historical Society, and the Mercer County Fairgrounds.
Demographics
As of the 2010 census, the population of Mercer County was 40,814. The population density was 93.3 people per square mile. The racial makeup of the county was 95.3% White, 0.7% African American, 0.3% Native American, 0.4% Asian, 0.1% Pacific Islander, 1.7% from other races, and 1.4% from two or more races. Hispanic or Latino of any race were 3.3% of the population.
The median income for a household in the county was $45,837, and the median income for a family was $54,837. The per capita income for the county was $21,837. About 8.3% of families and 11.2% of the population were below the poverty line, including 15.2% of those under age 18 and 8.2% of those age 65 or over.
Mercer County is served by several school districts, including Celina City Schools, Coldwater Exempted Village Schools, Fort Recovery Local Schools, and St. Henry Local Schools. The county is also home to several higher education institutions, including Wright State University-Lake Campus, Ohio State University-Lima, and Rhodes State College.
Common Questions
What is Per Capita Income in Mercer County?
Per Capita income in Mercer County is $33,892.
What is the Median Family Income in Mercer County?
Median Family Income in Mercer County is $95,357.
What is the Median Household income in Mercer County?
Median Household Income in Mercer County is $73,278.
What is Income or Wage Gap in Mercer County?
Income or Wage Gap in Mercer County is 36.7%.
Women in Mercer County earn 63.3 cents for every dollar earned by a man.
What is Family Income Deficit in Mercer County?
Family Income Deficit in Mercer County is $8,674.
Families that are below poverty line in Mercer County earn $8,674 less on average than the poverty threshold level.
What is Inequality or Gini Index in Mercer County?
Inequality or Gini Index in Mercer County is 0.39.
What is the Total Population of Mercer County?
Total Population of Mercer County is 42,321.
What is the Total Male Population of Mercer County?
Total Male Population of Mercer County is 21,467.
What is the Total Female Population of Mercer County?
Total Female Population of Mercer County is 20,854.
What is the Ratio of Males per 100 Females in Mercer County?
There are 102.94 Males per 100 Females in Mercer County.
What is the Ratio of Females per 100 Males in Mercer County?
There are 97.14 Females per 100 Males in Mercer County.
What is the Median Population Age in Mercer County?
Median Population Age in Mercer County is 39.4 Years.
What is the Average Family Size in Mercer County
Average Family Size in Mercer County is 3.2 People.
What is the Average Household Size in Mercer County
Average Household Size in Mercer County is 2.6 People.
How Large is the Labor Force in Mercer County?
There are 22,303 People in the Labor Forcein in Mercer County.
What is the Percentage of People in the Labor Force in Mercer County?
68.4% of People are in the Labor Force in Mercer County.
What is the Unemployment Rate in Mercer County?
Unemployment Rate in Mercer County is 2.0%.