Huron County, OH Map & Demographics
Huron County Map
Huron County Overview
$30,792
PER CAPITA INCOME
$76,785
AVG FAMILY INCOME
$64,144
AVG HOUSEHOLD INCOME
31.9%
WAGE / INCOME GAP [ % ]
68.1¢/ $1
WAGE / INCOME GAP [ $ ]
$9,566
FAMILY INCOME DEFICIT
0.40
INEQUALITY / GINI INDEX
58,518
TOTAL POPULATION
29,037
MALE POPULATION
29,481
FEMALE POPULATION
98.49
MALES / 100 FEMALES
101.53
FEMALES / 100 MALES
40.1
MEDIAN AGE
3.1
AVG FAMILY SIZE
2.5
AVG HOUSEHOLD SIZE
28,640
LABOR FORCE [ PEOPLE ]
61.9%
PERCENT IN LABOR FORCE
4.4%
UNEMPLOYMENT RATE
Income in Huron County
Income Overview in Huron County
Per Capita Income in Huron County is $30,792, while median incomes of families and households are $76,785 and $64,144 respectively.
| Characteristic | Number | Measure |
| Per Capita Income | 58,518 | $30,792 |
| Median Family Income | 14,682 | $76,785 |
| Mean Family Income | 14,682 | $88,415 |
| Median Household Income | 23,096 | $64,144 |
| Mean Household Income | 23,096 | $76,402 |
| Income Deficit | 14,682 | $9,566 |
| Wage / Income Gap (%) | 58,518 | 31.89% |
| Wage / Income Gap ($) | 58,518 | 68.11¢ per $1 |
| Gini / Inequality Index | 58,518 | 0.40 |
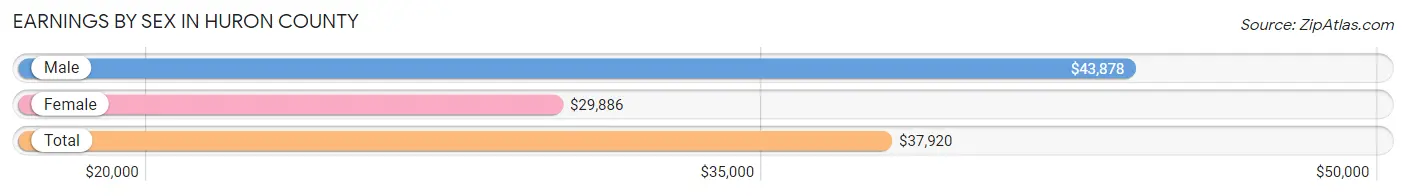
Earnings by Sex in Huron County
Average Earnings in Huron County are $37,920, $43,878 for men and $29,886 for women, a difference of 31.9%.
| Sex | Number | Average Earnings |
| Male | 16,509 (53.9%) | $43,878 |
| Female | 14,121 (46.1%) | $29,886 |
| Total | 30,630 (100.0%) | $37,920 |
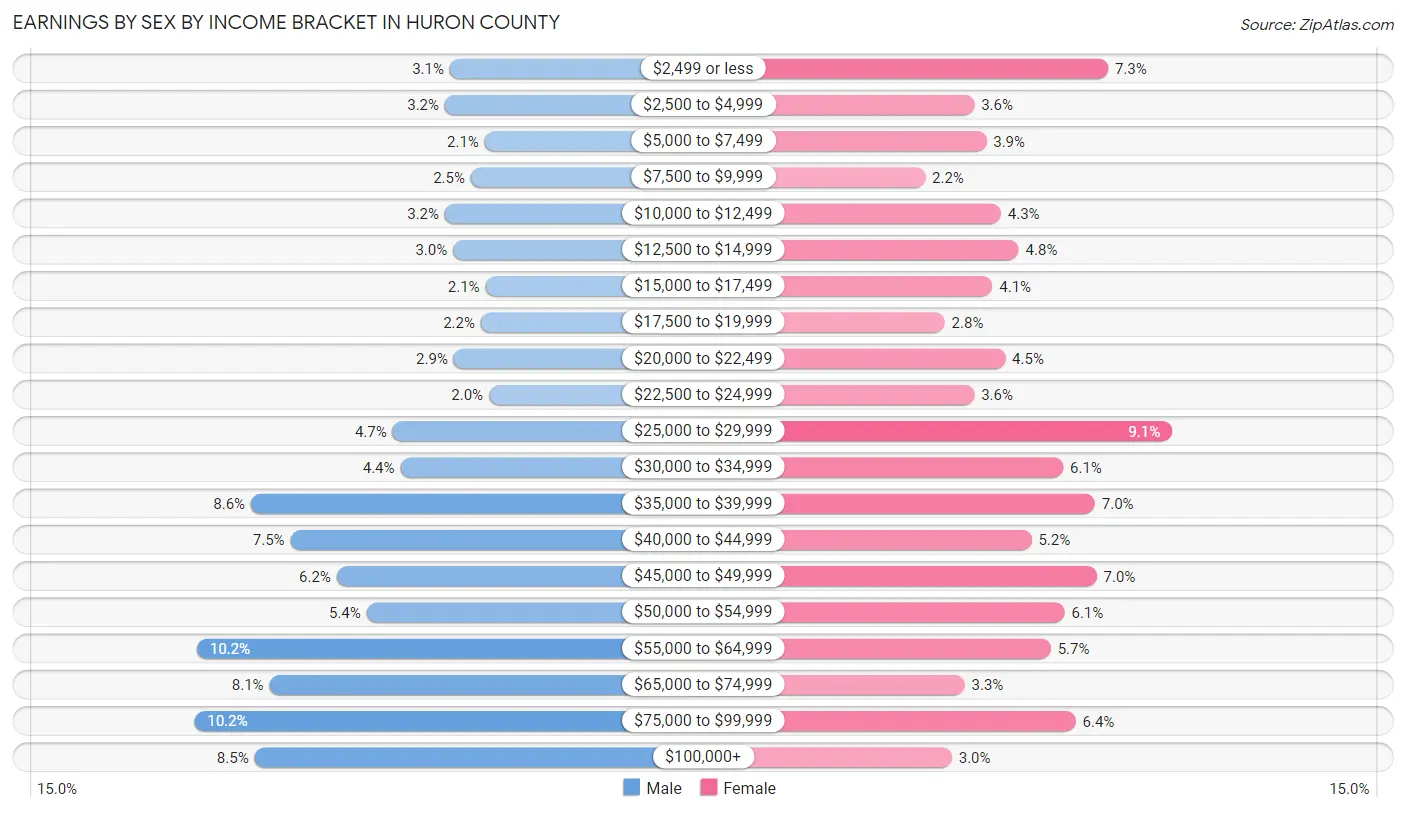
Earnings by Sex by Income Bracket in Huron County
The most common earnings brackets in Huron County are $75,000 to $99,999 for men (1,689 | 10.2%) and $25,000 to $29,999 for women (1,290 | 9.1%).
| Income | Male | Female |
| $2,499 or less | 504 (3.0%) | 1,036 (7.3%) |
| $2,500 to $4,999 | 527 (3.2%) | 506 (3.6%) |
| $5,000 to $7,499 | 341 (2.1%) | 554 (3.9%) |
| $7,500 to $9,999 | 406 (2.5%) | 310 (2.2%) |
| $10,000 to $12,499 | 527 (3.2%) | 612 (4.3%) |
| $12,500 to $14,999 | 489 (3.0%) | 682 (4.8%) |
| $15,000 to $17,499 | 338 (2.1%) | 577 (4.1%) |
| $17,500 to $19,999 | 360 (2.2%) | 389 (2.8%) |
| $20,000 to $22,499 | 486 (2.9%) | 628 (4.4%) |
| $22,500 to $24,999 | 322 (1.9%) | 505 (3.6%) |
| $25,000 to $29,999 | 770 (4.7%) | 1,290 (9.1%) |
| $30,000 to $34,999 | 733 (4.4%) | 859 (6.1%) |
| $35,000 to $39,999 | 1,427 (8.6%) | 984 (7.0%) |
| $40,000 to $44,999 | 1,243 (7.5%) | 733 (5.2%) |
| $45,000 to $49,999 | 1,029 (6.2%) | 992 (7.0%) |
| $50,000 to $54,999 | 890 (5.4%) | 864 (6.1%) |
| $55,000 to $64,999 | 1,678 (10.2%) | 809 (5.7%) |
| $65,000 to $74,999 | 1,340 (8.1%) | 467 (3.3%) |
| $75,000 to $99,999 | 1,689 (10.2%) | 908 (6.4%) |
| $100,000+ | 1,410 (8.5%) | 416 (2.9%) |
| Total | 16,509 (100.0%) | 14,121 (100.0%) |
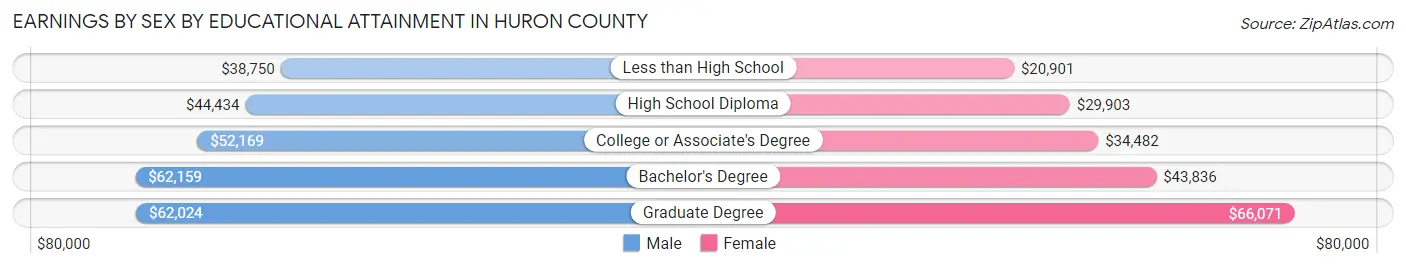
Earnings by Sex by Educational Attainment in Huron County
Average earnings in Huron County are $47,306 for men and $34,818 for women, a difference of 26.4%. Men with an educational attainment of bachelor's degree enjoy the highest average annual earnings of $62,159, while those with less than high school education earn the least with $38,750. Women with an educational attainment of graduate degree earn the most with the average annual earnings of $66,071, while those with less than high school education have the smallest earnings of $20,901.
| Educational Attainment | Male Income | Female Income |
| Less than High School | $38,750 | $20,901 |
| High School Diploma | $44,434 | $29,903 |
| College or Associate's Degree | $52,169 | $34,482 |
| Bachelor's Degree | $62,159 | $43,836 |
| Graduate Degree | $62,024 | $66,071 |
| Total | $47,306 | $34,818 |
Family Income in Huron County
Family Income Brackets in Huron County
According to the Huron County family income data, there are 3,186 families falling into the $50,000 to $74,999 income range, which is the most common income bracket and makes up 21.7% of all families. Conversely, the $10,000 to $14,999 income bracket is the least frequent group with only 235 families (1.6%) belonging to this category.
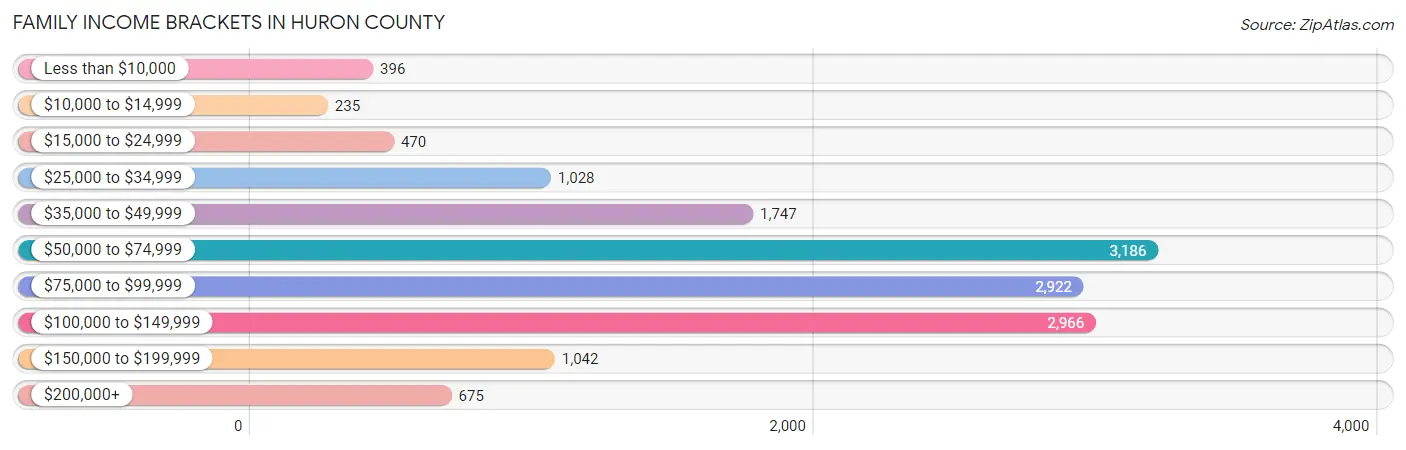
| Income Bracket | # Families | % Families |
| Less than $10,000 | 396 | 2.7% |
| $10,000 to $14,999 | 235 | 1.6% |
| $15,000 to $24,999 | 470 | 3.2% |
| $25,000 to $34,999 | 1,028 | 7.0% |
| $35,000 to $49,999 | 1,747 | 11.9% |
| $50,000 to $74,999 | 3,186 | 21.7% |
| $75,000 to $99,999 | 2,922 | 19.9% |
| $100,000 to $149,999 | 2,966 | 20.2% |
| $150,000 to $199,999 | 1,042 | 7.1% |
| $200,000+ | 675 | 4.6% |
Family Income by Famaliy Size in Huron County
7+ person families (236 | 1.6%) account for the highest median family income in Huron County with $167,639 per family, while 2-person families (6,900 | 47.0%) have the highest median income of $33,258 per family member.
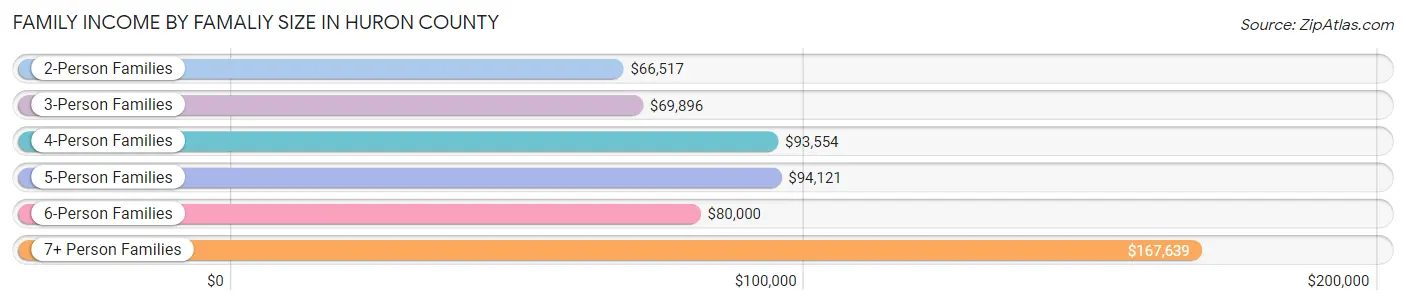
| Income Bracket | # Families | Median Income |
| 2-Person Families | 6,900 (47.0%) | $66,517 |
| 3-Person Families | 3,178 (21.6%) | $69,896 |
| 4-Person Families | 2,975 (20.3%) | $93,554 |
| 5-Person Families | 1,039 (7.1%) | $94,121 |
| 6-Person Families | 354 (2.4%) | $80,000 |
| 7+ Person Families | 236 (1.6%) | $167,639 |
| Total | 14,682 (100.0%) | $76,785 |
Family Income by Number of Earners in Huron County
The median family income in Huron County is $76,785, with families comprising 3+ earners (2,004) having the highest median family income of $125,000, while families with no earners (2,264) have the lowest median family income of $44,481, accounting for 13.7% and 15.4% of families, respectively.
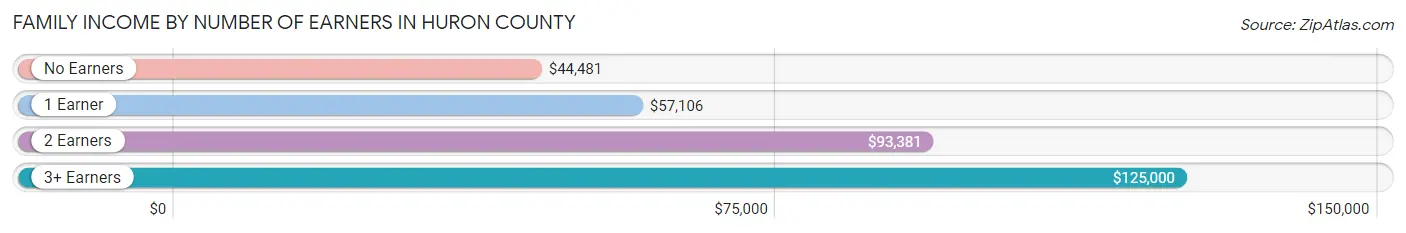
| Number of Earners | # Families | Median Income |
| No Earners | 2,264 (15.4%) | $44,481 |
| 1 Earner | 4,917 (33.5%) | $57,106 |
| 2 Earners | 5,497 (37.4%) | $93,381 |
| 3+ Earners | 2,004 (13.7%) | $125,000 |
| Total | 14,682 (100.0%) | $76,785 |
Household Income in Huron County
Household Income Brackets in Huron County
With 4,665 households falling in the category, the $50,000 to $74,999 income range is the most frequent in Huron County, accounting for 20.2% of all households. In contrast, only 785 households (3.4%) fall into the $200,000+ income bracket, making it the least populous group.
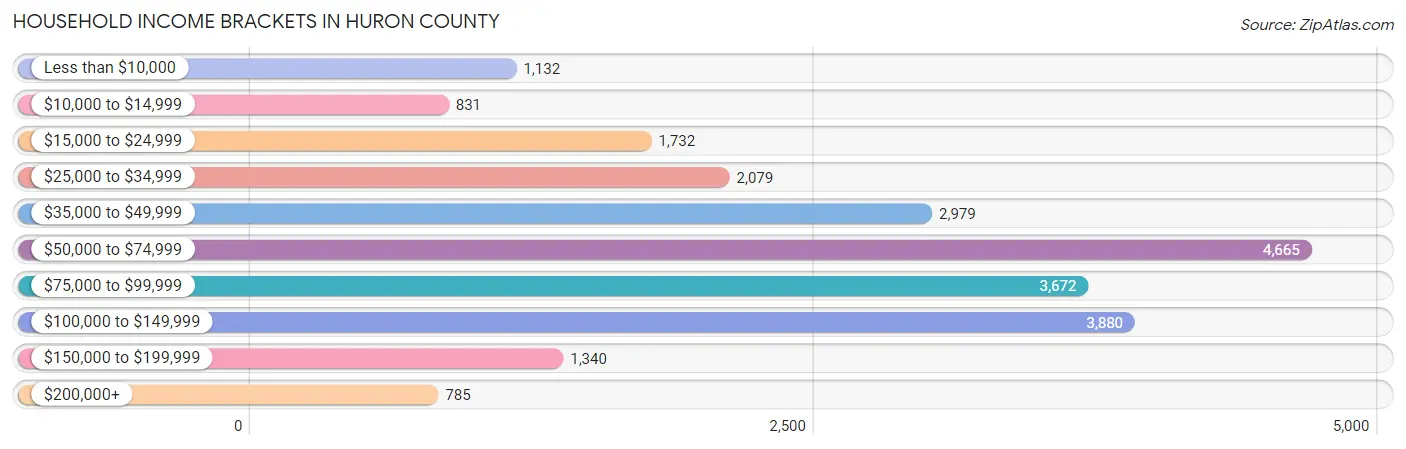
| Income Bracket | # Households | % Households |
| Less than $10,000 | 1,132 | 4.9% |
| $10,000 to $14,999 | 831 | 3.6% |
| $15,000 to $24,999 | 1,732 | 7.5% |
| $25,000 to $34,999 | 2,079 | 9.0% |
| $35,000 to $49,999 | 2,979 | 12.9% |
| $50,000 to $74,999 | 4,665 | 20.2% |
| $75,000 to $99,999 | 3,672 | 15.9% |
| $100,000 to $149,999 | 3,880 | 16.8% |
| $150,000 to $199,999 | 1,340 | 5.8% |
| $200,000+ | 785 | 3.4% |
Household Income by Householder Age in Huron County
The median household income in Huron County is $64,144, with the highest median household income of $72,352 found in the 45 to 64 years age bracket for the primary householder. A total of 8,717 households (37.7%) fall into this category. Meanwhile, the 65+ years age bracket for the primary householder has the lowest median household income of $46,048, with 6,606 households (28.6%) in this group.
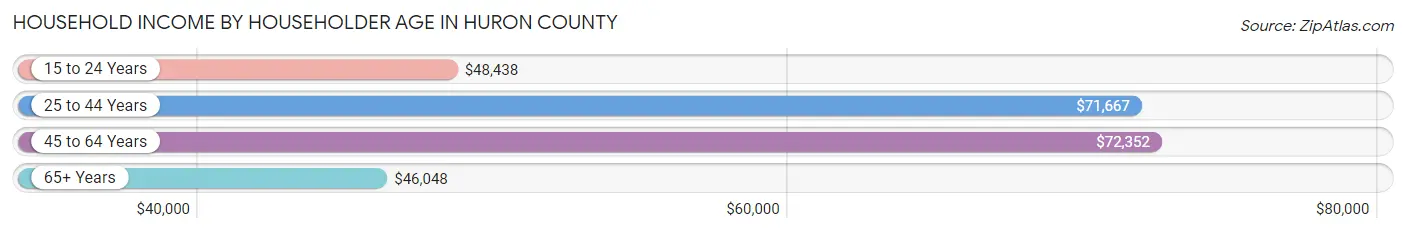
| Income Bracket | # Households | Median Income |
| 15 to 24 Years | 559 (2.4%) | $48,438 |
| 25 to 44 Years | 7,214 (31.2%) | $71,667 |
| 45 to 64 Years | 8,717 (37.7%) | $72,352 |
| 65+ Years | 6,606 (28.6%) | $46,048 |
| Total | 23,096 (100.0%) | $64,144 |
Poverty in Huron County
Income Below Poverty by Sex and Age in Huron County
With 9.1% poverty level for males and 12.9% for females among the residents of Huron County, 16 and 17 year old males and 6 to 11 year old females are the most vulnerable to poverty, with 133 males (16.1%) and 550 females (24.6%) in their respective age groups living below the poverty level.
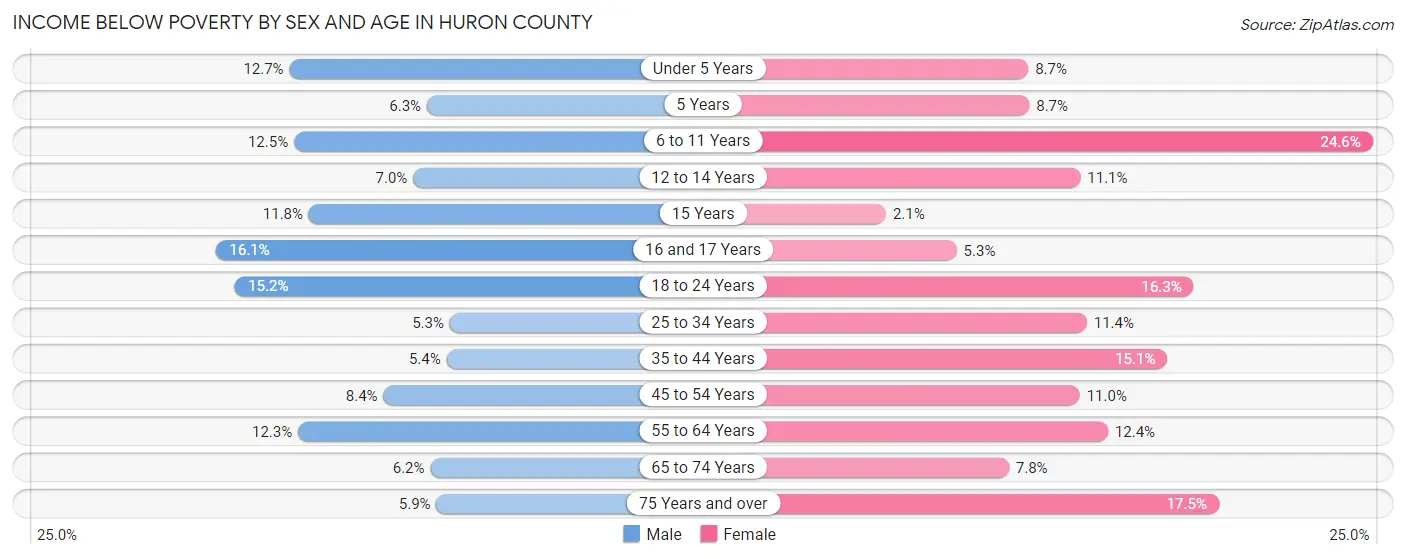
| Age Bracket | Male | Female |
| Under 5 Years | 209 (12.7%) | 147 (8.6%) |
| 5 Years | 21 (6.3%) | 30 (8.7%) |
| 6 to 11 Years | 287 (12.5%) | 550 (24.6%) |
| 12 to 14 Years | 99 (7.0%) | 129 (11.1%) |
| 15 Years | 49 (11.8%) | 9 (2.1%) |
| 16 and 17 Years | 133 (16.1%) | 44 (5.3%) |
| 18 to 24 Years | 367 (15.2%) | 369 (16.3%) |
| 25 to 34 Years | 196 (5.3%) | 380 (11.4%) |
| 35 to 44 Years | 185 (5.4%) | 539 (15.1%) |
| 45 to 54 Years | 314 (8.4%) | 388 (11.0%) |
| 55 to 64 Years | 482 (12.3%) | 506 (12.3%) |
| 65 to 74 Years | 189 (6.2%) | 254 (7.7%) |
| 75 Years and over | 95 (5.9%) | 380 (17.5%) |
| Total | 2,626 (9.1%) | 3,725 (12.9%) |
Income Above Poverty by Sex and Age in Huron County
According to the poverty statistics in Huron County, males aged 25 to 34 years and females aged 15 years are the age groups that are most secure financially, with 94.7% of males and 98.0% of females in these age groups living above the poverty line.
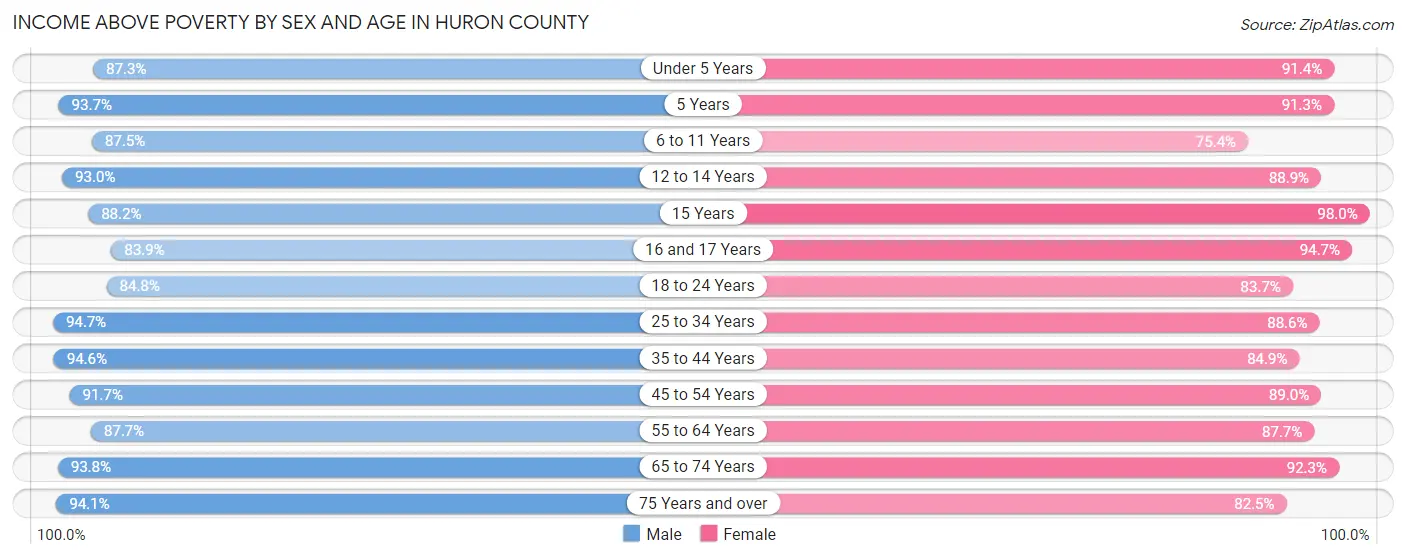
| Age Bracket | Male | Female |
| Under 5 Years | 1,436 (87.3%) | 1,552 (91.3%) |
| 5 Years | 311 (93.7%) | 315 (91.3%) |
| 6 to 11 Years | 2,009 (87.5%) | 1,683 (75.4%) |
| 12 to 14 Years | 1,321 (93.0%) | 1,036 (88.9%) |
| 15 Years | 366 (88.2%) | 431 (98.0%) |
| 16 and 17 Years | 693 (83.9%) | 782 (94.7%) |
| 18 to 24 Years | 2,043 (84.8%) | 1,892 (83.7%) |
| 25 to 34 Years | 3,526 (94.7%) | 2,963 (88.6%) |
| 35 to 44 Years | 3,231 (94.6%) | 3,030 (84.9%) |
| 45 to 54 Years | 3,447 (91.6%) | 3,128 (89.0%) |
| 55 to 64 Years | 3,435 (87.7%) | 3,591 (87.6%) |
| 65 to 74 Years | 2,875 (93.8%) | 3,023 (92.2%) |
| 75 Years and over | 1,518 (94.1%) | 1,793 (82.5%) |
| Total | 26,211 (90.9%) | 25,219 (87.1%) |
Income Below Poverty Among Married-Couple Families in Huron County
The poverty statistics for married-couple families in Huron County show that 3.0% or 316 of the total 10,679 families live below the poverty line. Families with no children have the highest poverty rate of 3.5%, comprising of 224 families. On the other hand, families with 5 or more children have the lowest poverty rate of 0.0%, which includes 0 families.
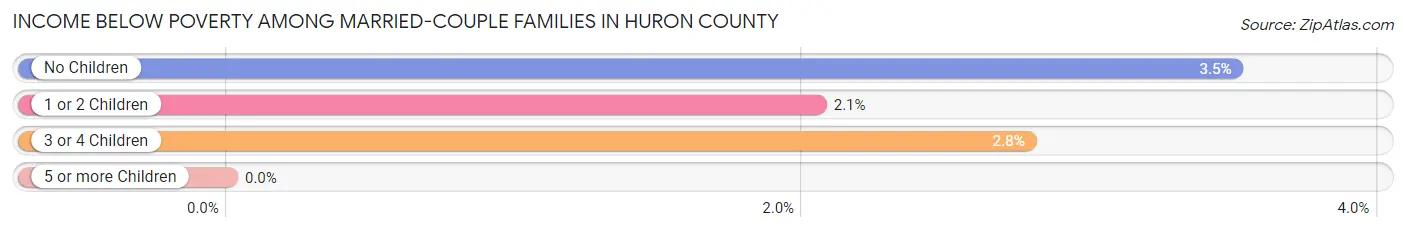
| Children | Above Poverty | Below Poverty |
| No Children | 6,169 (96.5%) | 224 (3.5%) |
| 1 or 2 Children | 3,397 (98.0%) | 71 (2.1%) |
| 3 or 4 Children | 734 (97.2%) | 21 (2.8%) |
| 5 or more Children | 63 (100.0%) | 0 (0.0%) |
| Total | 10,363 (97.0%) | 316 (3.0%) |
Income Below Poverty Among Single-Parent Households in Huron County
According to the poverty data in Huron County, 15.0% or 215 single-father households and 24.7% or 634 single-mother households are living below the poverty line. Among single-father households, those with 3 or 4 children have the highest poverty rate, with 46 households (47.4%) experiencing poverty. Likewise, among single-mother households, those with 3 or 4 children have the highest poverty rate, with 174 households (40.9%) falling below the poverty line.
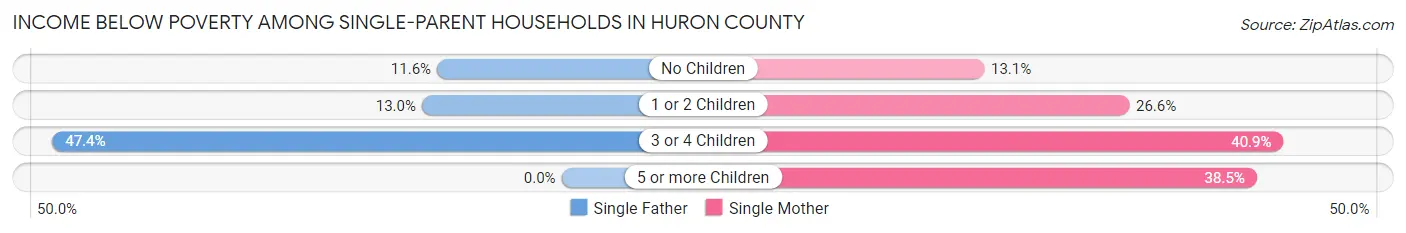
| Children | Single Father | Single Mother |
| No Children | 42 (11.6%) | 109 (13.1%) |
| 1 or 2 Children | 127 (13.0%) | 341 (26.6%) |
| 3 or 4 Children | 46 (47.4%) | 174 (40.9%) |
| 5 or more Children | 0 (0.0%) | 10 (38.5%) |
| Total | 215 (15.0%) | 634 (24.7%) |
Income Below Poverty Among Married-Couple vs Single-Parent Households in Huron County
The poverty data for Huron County shows that 316 of the married-couple family households (3.0%) and 849 of the single-parent households (21.2%) are living below the poverty level. Within the married-couple family households, those with no children have the highest poverty rate, with 224 households (3.5%) falling below the poverty line. Among the single-parent households, those with 3 or 4 children have the highest poverty rate, with 220 household (42.1%) living below poverty.
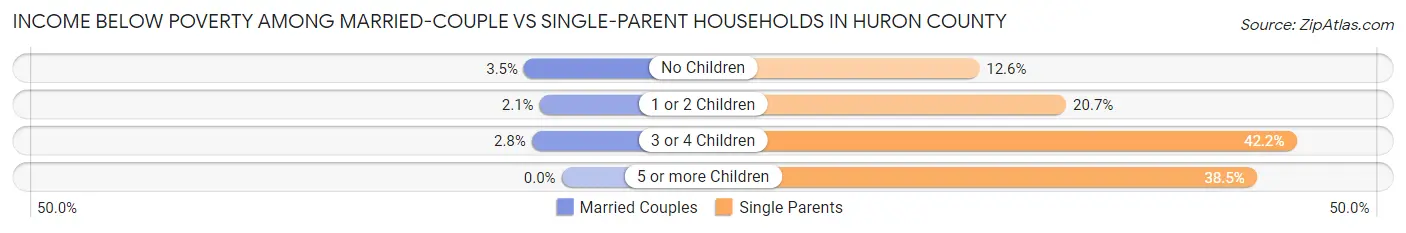
| Children | Married-Couple Families | Single-Parent Households |
| No Children | 224 (3.5%) | 151 (12.6%) |
| 1 or 2 Children | 71 (2.1%) | 468 (20.7%) |
| 3 or 4 Children | 21 (2.8%) | 220 (42.1%) |
| 5 or more Children | 0 (0.0%) | 10 (38.5%) |
| Total | 316 (3.0%) | 849 (21.2%) |
Race in Huron County
The most populous races in Huron County are White / Caucasian (54,431 | 93.0%), Hispanic or Latino (4,069 | 7.0%), and Two or more Races (2,689 | 4.6%).
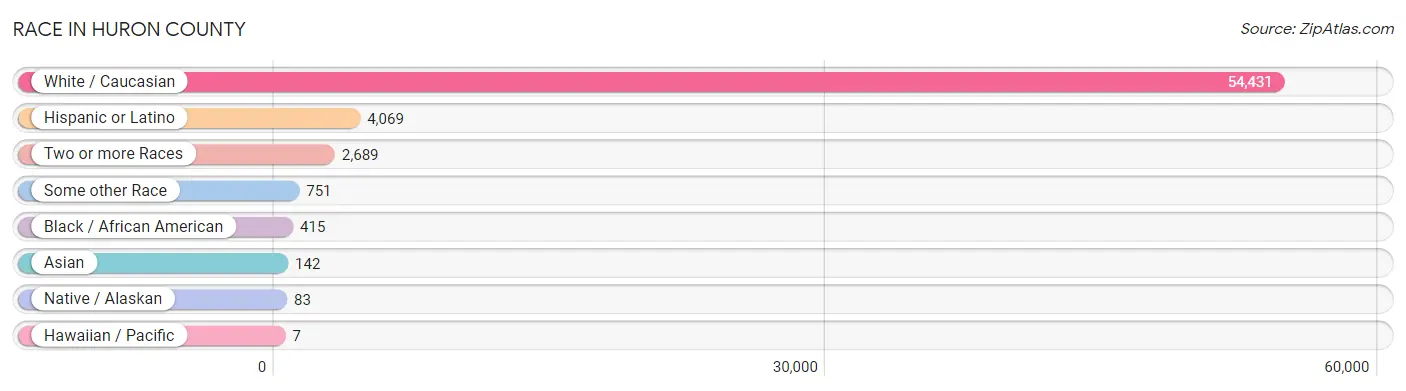
| Race | # Population | % Population |
| Asian | 142 | 0.2% |
| Black / African American | 415 | 0.7% |
| Hawaiian / Pacific | 7 | 0.0% |
| Hispanic or Latino | 4,069 | 7.0% |
| Native / Alaskan | 83 | 0.1% |
| White / Caucasian | 54,431 | 93.0% |
| Two or more Races | 2,689 | 4.6% |
| Some other Race | 751 | 1.3% |
| Total | 58,518 | 100.0% |
Ancestry in Huron County
The most populous ancestries reported in Huron County are German (16,933 | 28.9%), English (8,130 | 13.9%), Irish (6,797 | 11.6%), American (4,512 | 7.7%), and Mexican (2,932 | 5.0%), together accounting for 67.2% of all Huron County residents.
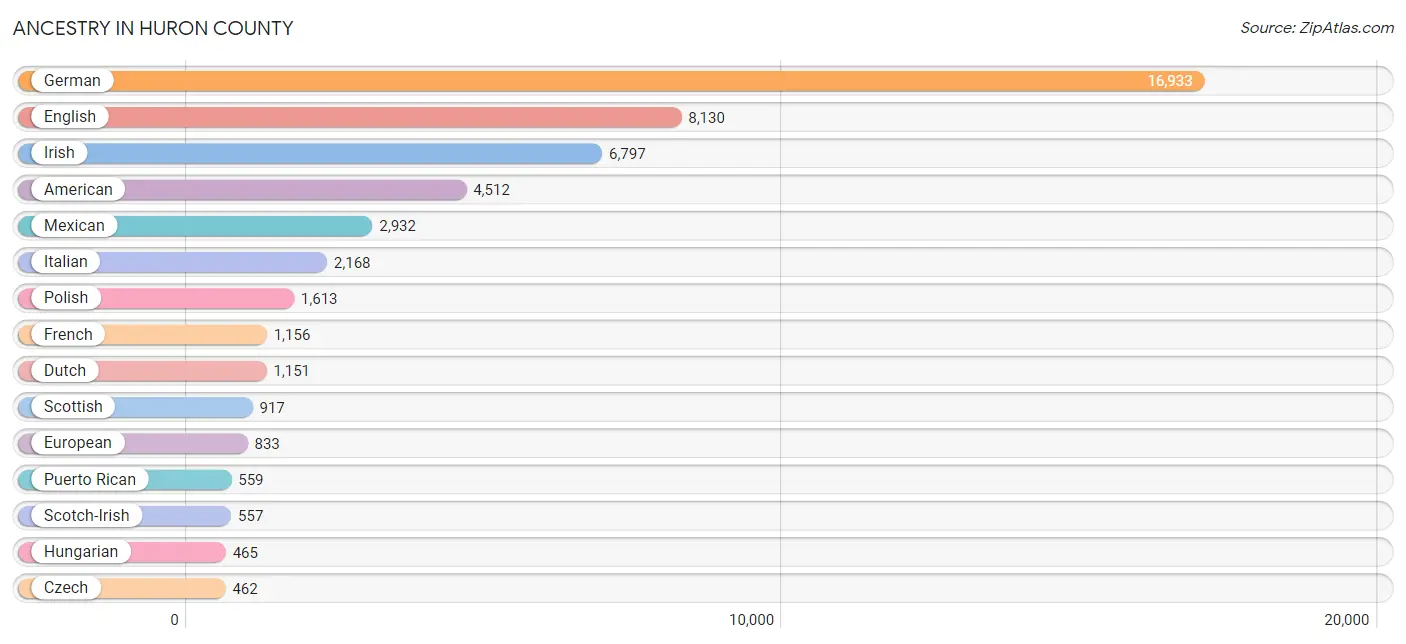
| Ancestry | # Population | % Population |
| African | 20 | 0.0% |
| American | 4,512 | 7.7% |
| Arab | 39 | 0.1% |
| Argentinean | 43 | 0.1% |
| Australian | 14 | 0.0% |
| Austrian | 32 | 0.1% |
| Belgian | 51 | 0.1% |
| Blackfeet | 36 | 0.1% |
| Bolivian | 3 | 0.0% |
| British | 190 | 0.3% |
| Burmese | 59 | 0.1% |
| Central American | 39 | 0.1% |
| Cherokee | 222 | 0.4% |
| Croatian | 9 | 0.0% |
| Cuban | 3 | 0.0% |
| Czech | 462 | 0.8% |
| Czechoslovakian | 113 | 0.2% |
| Danish | 156 | 0.3% |
| Dominican | 71 | 0.1% |
| Dutch | 1,151 | 2.0% |
| Eastern European | 92 | 0.2% |
| Egyptian | 11 | 0.0% |
| English | 8,130 | 13.9% |
| European | 833 | 1.4% |
| Filipino | 42 | 0.1% |
| Finnish | 14 | 0.0% |
| French | 1,156 | 2.0% |
| French Canadian | 37 | 0.1% |
| German | 16,933 | 28.9% |
| Greek | 100 | 0.2% |
| Guatemalan | 24 | 0.0% |
| Hungarian | 465 | 0.8% |
| Icelander | 2 | 0.0% |
| Indian (Asian) | 11 | 0.0% |
| Inupiat | 22 | 0.0% |
| Irish | 6,797 | 11.6% |
| Iroquois | 49 | 0.1% |
| Italian | 2,168 | 3.7% |
| Laotian | 36 | 0.1% |
| Lebanese | 28 | 0.1% |
| Lithuanian | 58 | 0.1% |
| Luxembourger | 17 | 0.0% |
| Mexican | 2,932 | 5.0% |
| Mexican American Indian | 31 | 0.1% |
| Native Hawaiian | 7 | 0.0% |
| Navajo | 12 | 0.0% |
| Nicaraguan | 15 | 0.0% |
| Nigerian | 18 | 0.0% |
| Northern European | 82 | 0.1% |
| Norwegian | 151 | 0.3% |
| Pennsylvania German | 102 | 0.2% |
| Peruvian | 18 | 0.0% |
| Polish | 1,613 | 2.8% |
| Portuguese | 97 | 0.2% |
| Puerto Rican | 559 | 1.0% |
| Romanian | 70 | 0.1% |
| Russian | 139 | 0.2% |
| Samoan | 9 | 0.0% |
| Scandinavian | 27 | 0.1% |
| Scotch-Irish | 557 | 0.9% |
| Scottish | 917 | 1.6% |
| Serbian | 30 | 0.1% |
| Slavic | 21 | 0.0% |
| Slovak | 220 | 0.4% |
| Slovene | 40 | 0.1% |
| South American | 75 | 0.1% |
| Spaniard | 118 | 0.2% |
| Subsaharan African | 38 | 0.1% |
| Swedish | 352 | 0.6% |
| Swiss | 368 | 0.6% |
| Thai | 135 | 0.2% |
| Ukrainian | 135 | 0.2% |
| Venezuelan | 11 | 0.0% |
| Welsh | 222 | 0.4% |
| Yugoslavian | 74 | 0.1% | View All 75 Rows |
Immigrants in Huron County
The most numerous immigrant groups reported in Huron County came from Latin America (629 | 1.1%), Central America (554 | 0.9%), Mexico (526 | 0.9%), Asia (142 | 0.2%), and South America (75 | 0.1%), together accounting for 3.3% of all Huron County residents.
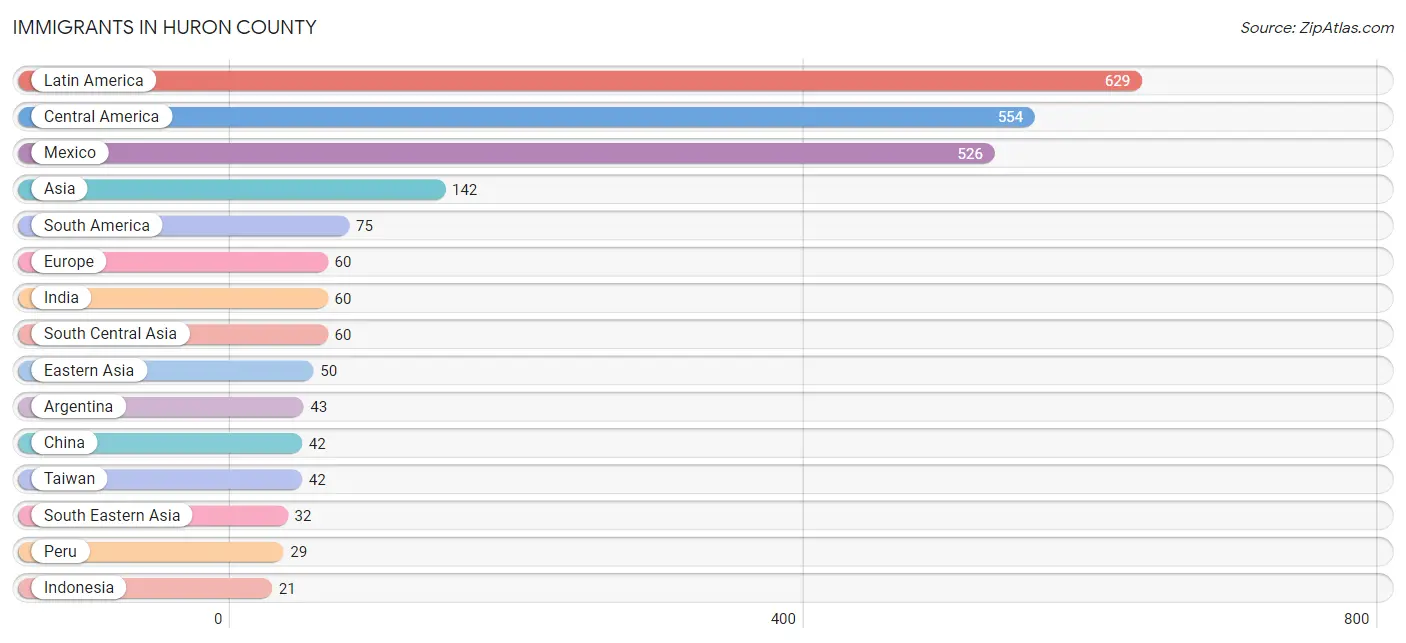
| Immigration Origin | # Population | % Population |
| Africa | 17 | 0.0% |
| Argentina | 43 | 0.1% |
| Asia | 142 | 0.2% |
| Australia | 2 | 0.0% |
| Bolivia | 3 | 0.0% |
| Canada | 12 | 0.0% |
| Central America | 554 | 0.9% |
| China | 42 | 0.1% |
| Congo | 17 | 0.0% |
| Eastern Asia | 50 | 0.1% |
| Eastern Europe | 11 | 0.0% |
| England | 19 | 0.0% |
| Europe | 60 | 0.1% |
| Germany | 19 | 0.0% |
| Guatemala | 13 | 0.0% |
| India | 60 | 0.1% |
| Indonesia | 21 | 0.0% |
| Italy | 11 | 0.0% |
| Japan | 8 | 0.0% |
| Latin America | 629 | 1.1% |
| Mexico | 526 | 0.9% |
| Middle Africa | 17 | 0.0% |
| Nicaragua | 15 | 0.0% |
| Northern Europe | 19 | 0.0% |
| Oceania | 2 | 0.0% |
| Peru | 29 | 0.1% |
| Philippines | 11 | 0.0% |
| Poland | 11 | 0.0% |
| South America | 75 | 0.1% |
| South Central Asia | 60 | 0.1% |
| South Eastern Asia | 32 | 0.1% |
| Southern Europe | 11 | 0.0% |
| Taiwan | 42 | 0.1% |
| Western Europe | 19 | 0.0% | View All 34 Rows |
Sex and Age in Huron County
Sex and Age in Huron County
The most populous age groups in Huron County are 10 to 14 Years (2,233 | 7.7%) for men and 60 to 64 Years (2,099 | 7.1%) for women.
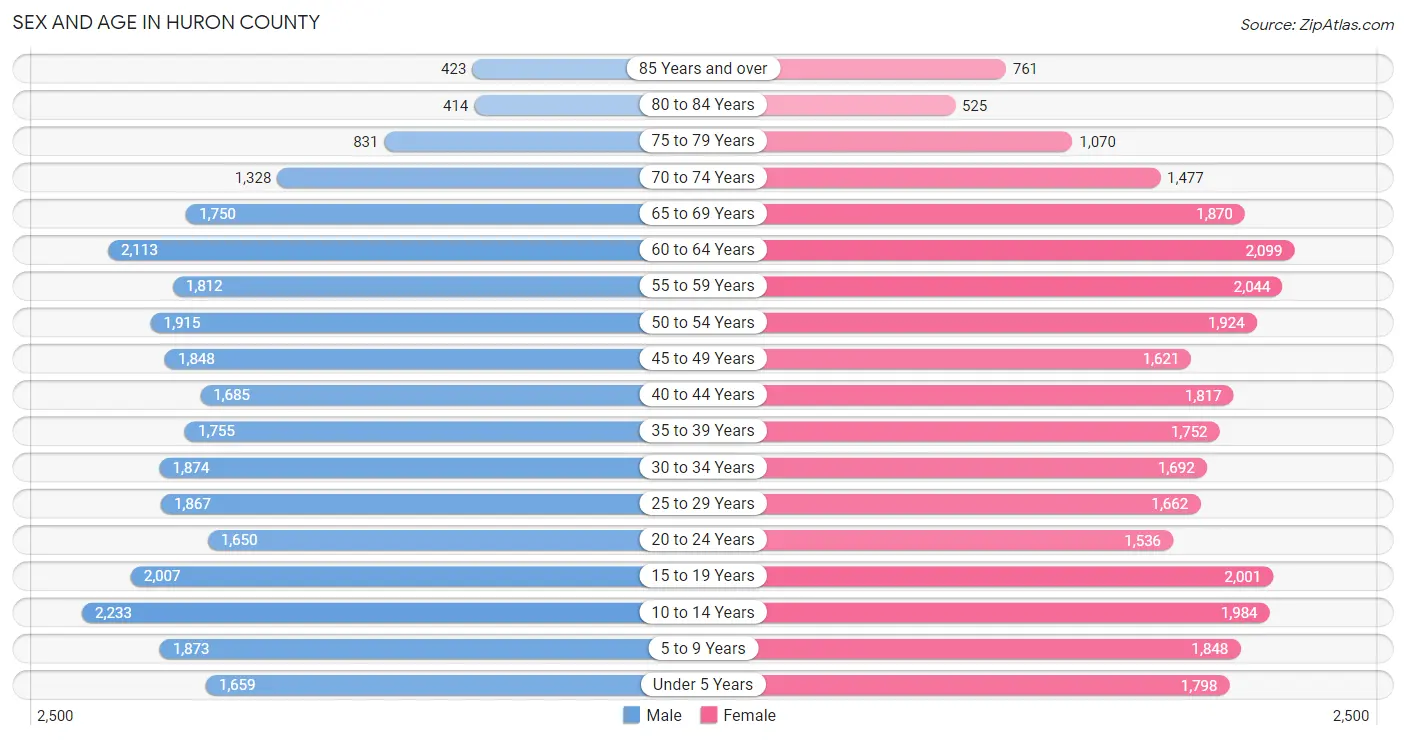
| Age Bracket | Male | Female |
| Under 5 Years | 1,659 (5.7%) | 1,798 (6.1%) |
| 5 to 9 Years | 1,873 (6.5%) | 1,848 (6.3%) |
| 10 to 14 Years | 2,233 (7.7%) | 1,984 (6.7%) |
| 15 to 19 Years | 2,007 (6.9%) | 2,001 (6.8%) |
| 20 to 24 Years | 1,650 (5.7%) | 1,536 (5.2%) |
| 25 to 29 Years | 1,867 (6.4%) | 1,662 (5.6%) |
| 30 to 34 Years | 1,874 (6.5%) | 1,692 (5.7%) |
| 35 to 39 Years | 1,755 (6.0%) | 1,752 (5.9%) |
| 40 to 44 Years | 1,685 (5.8%) | 1,817 (6.2%) |
| 45 to 49 Years | 1,848 (6.4%) | 1,621 (5.5%) |
| 50 to 54 Years | 1,915 (6.6%) | 1,924 (6.5%) |
| 55 to 59 Years | 1,812 (6.2%) | 2,044 (6.9%) |
| 60 to 64 Years | 2,113 (7.3%) | 2,099 (7.1%) |
| 65 to 69 Years | 1,750 (6.0%) | 1,870 (6.3%) |
| 70 to 74 Years | 1,328 (4.6%) | 1,477 (5.0%) |
| 75 to 79 Years | 831 (2.9%) | 1,070 (3.6%) |
| 80 to 84 Years | 414 (1.4%) | 525 (1.8%) |
| 85 Years and over | 423 (1.5%) | 761 (2.6%) |
| Total | 29,037 (100.0%) | 29,481 (100.0%) |
Families and Households in Huron County
Median Family Size in Huron County
The median family size in Huron County is 3.14 persons per family, with married-couple families (10,679 | 72.7%) accounting for the largest median family size of 3.18 persons per family. On the other hand, single male/father families (1,435 | 9.8%) represent the smallest median family size with 2.99 persons per family.
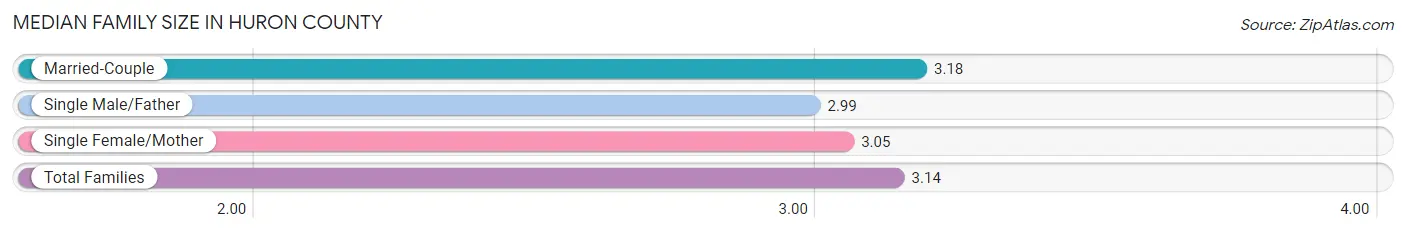
| Family Type | # Families | Family Size |
| Married-Couple | 10,679 (72.7%) | 3.18 |
| Single Male/Father | 1,435 (9.8%) | 2.99 |
| Single Female/Mother | 2,568 (17.5%) | 3.05 |
| Total Families | 14,682 (100.0%) | 3.14 |
Median Household Size in Huron County
The median household size in Huron County is 2.50 persons per household, with single male/father households (1,435 | 6.2%) accounting for the largest median household size of 3.39 persons per household. non-family households (8,414 | 36.4%) represent the smallest median household size with 1.21 persons per household.
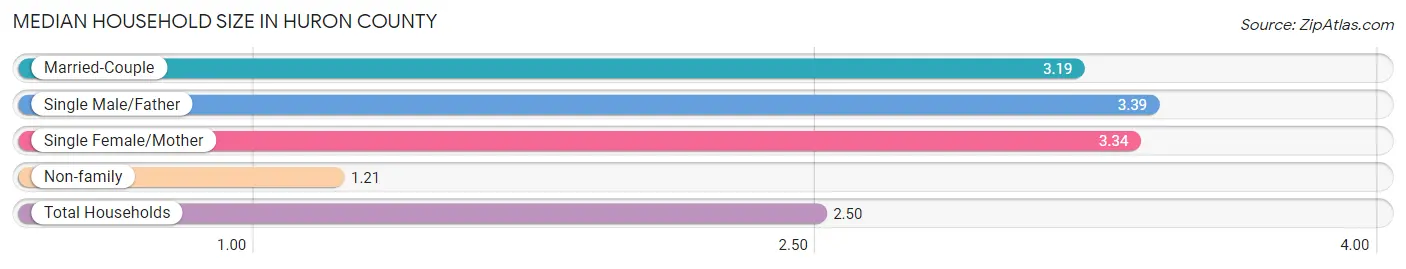
| Household Type | # Households | Household Size |
| Married-Couple | 10,679 (46.2%) | 3.19 |
| Single Male/Father | 1,435 (6.2%) | 3.39 |
| Single Female/Mother | 2,568 (11.1%) | 3.34 |
| Non-family | 8,414 (36.4%) | 1.21 |
| Total Households | 23,096 (100.0%) | 2.50 |
Household Size by Marriage Status in Huron County
Out of a total of 23,096 households in Huron County, 14,682 (63.6%) are family households, while 8,414 (36.4%) are nonfamily households. The most numerous type of family households are 2-person households, comprising 6,297, and the most common type of nonfamily households are 1-person households, comprising 7,029.
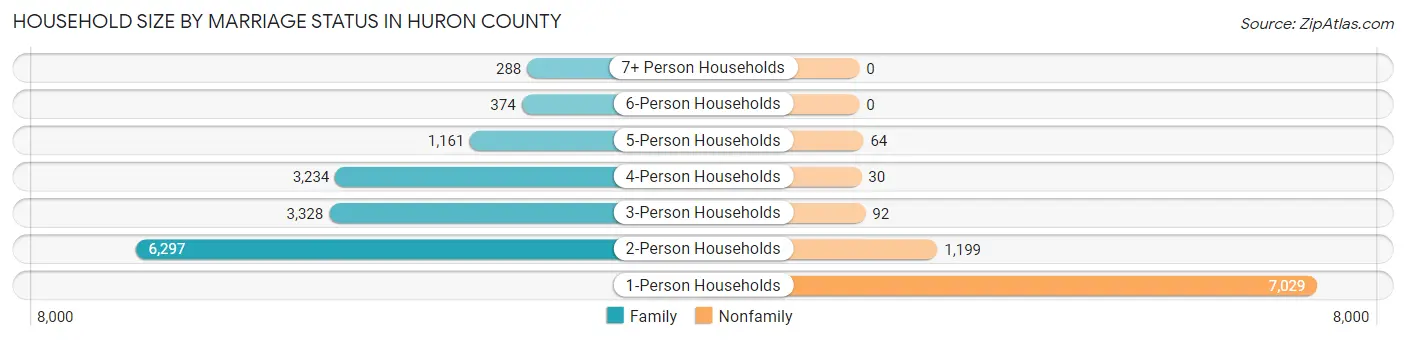
| Household Size | Family Households | Nonfamily Households |
| 1-Person Households | - | 7,029 (30.4%) |
| 2-Person Households | 6,297 (27.3%) | 1,199 (5.2%) |
| 3-Person Households | 3,328 (14.4%) | 92 (0.4%) |
| 4-Person Households | 3,234 (14.0%) | 30 (0.1%) |
| 5-Person Households | 1,161 (5.0%) | 64 (0.3%) |
| 6-Person Households | 374 (1.6%) | 0 (0.0%) |
| 7+ Person Households | 288 (1.3%) | 0 (0.0%) |
| Total | 14,682 (63.6%) | 8,414 (36.4%) |
Female Fertility in Huron County
Fertility by Age in Huron County
Average fertility rate in Huron County is 52.0 births per 1,000 women. Women in the age bracket of 20 to 34 years have the highest fertility rate with 100.0 births per 1,000 women. Women in the age bracket of 20 to 34 years acount for 75.0% of all women with births.
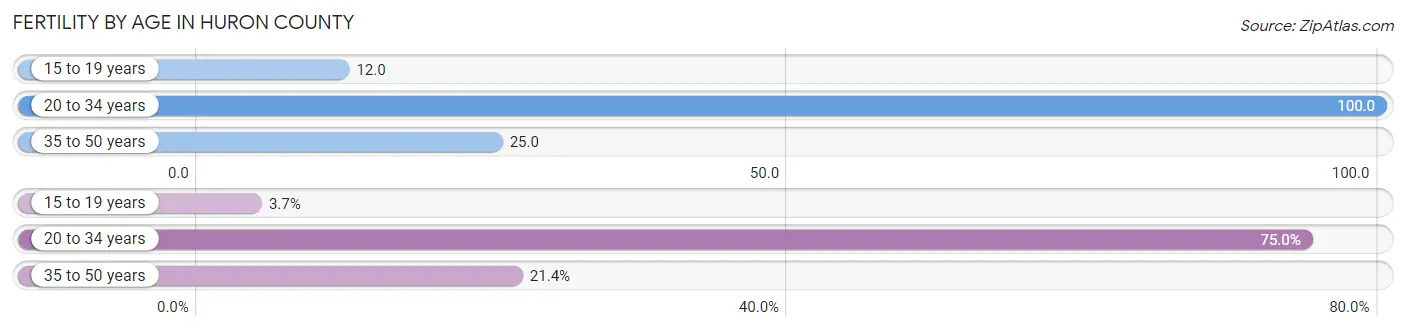
| Age Bracket | Women with Births | Births / 1,000 Women |
| 15 to 19 years | 24 (3.7%) | 12.0 |
| 20 to 34 years | 491 (75.0%) | 100.0 |
| 35 to 50 years | 140 (21.4%) | 25.0 |
| Total | 655 (100.0%) | 52.0 |
Fertility by Age by Marriage Status in Huron County
50.1% of women with births (655) in Huron County are married. The highest percentage of unmarried women with births falls into 15 to 19 years age bracket with 100.0% of them unmarried at the time of birth, while the lowest percentage of unmarried women with births belong to 20 to 34 years age bracket with 44.4% of them unmarried.
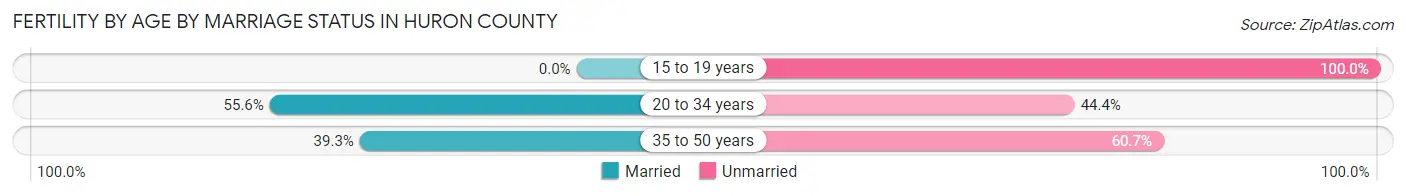
| Age Bracket | Married | Unmarried |
| 15 to 19 years | 0 (0.0%) | 24 (100.0%) |
| 20 to 34 years | 273 (55.6%) | 218 (44.4%) |
| 35 to 50 years | 55 (39.3%) | 85 (60.7%) |
| Total | 328 (50.1%) | 327 (49.9%) |
Fertility by Education in Huron County
Average fertility rate in Huron County is 52.0 births per 1,000 women. Women with the education attainment of college or associate's degree have the highest fertility rate of 77.0 births per 1,000 women, while women with the education attainment of graduate degree have the lowest fertility at 24.0 births per 1,000 women. Women with the education attainment of college or associate's degree represent 47.9% of all women with births.
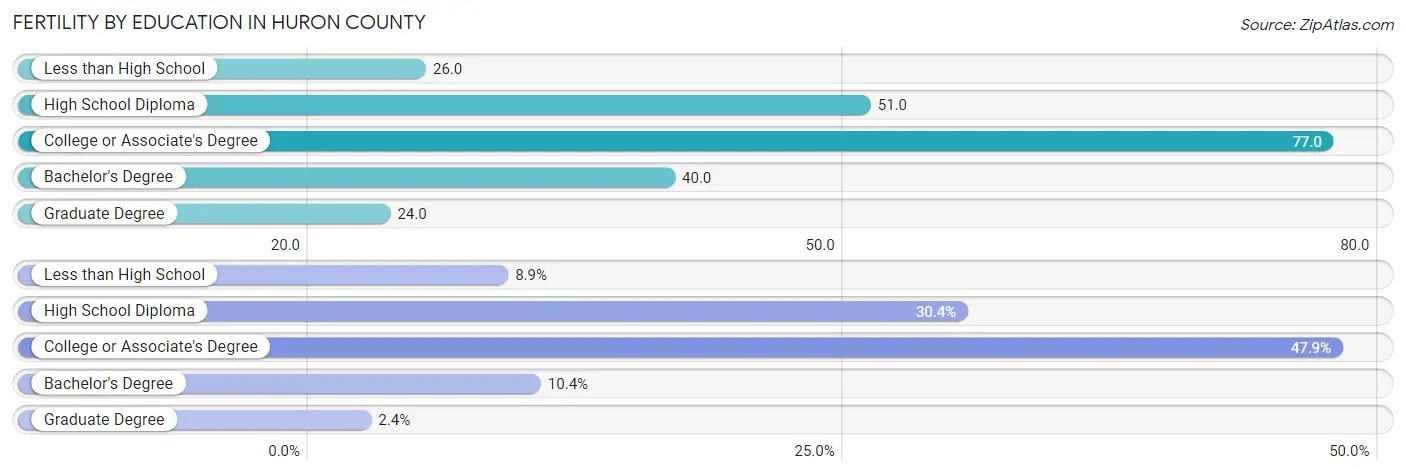
| Educational Attainment | Women with Births | Births / 1,000 Women |
| Less than High School | 58 (8.8%) | 26.0 |
| High School Diploma | 199 (30.4%) | 51.0 |
| College or Associate's Degree | 314 (47.9%) | 77.0 |
| Bachelor's Degree | 68 (10.4%) | 40.0 |
| Graduate Degree | 16 (2.4%) | 24.0 |
| Total | 655 (100.0%) | 52.0 |
Fertility by Education by Marriage Status in Huron County
49.9% of women with births in Huron County are unmarried. Women with the educational attainment of graduate degree are most likely to be married with 100.0% of them married at childbirth, while women with the educational attainment of less than high school are least likely to be married with 79.3% of them unmarried at childbirth.
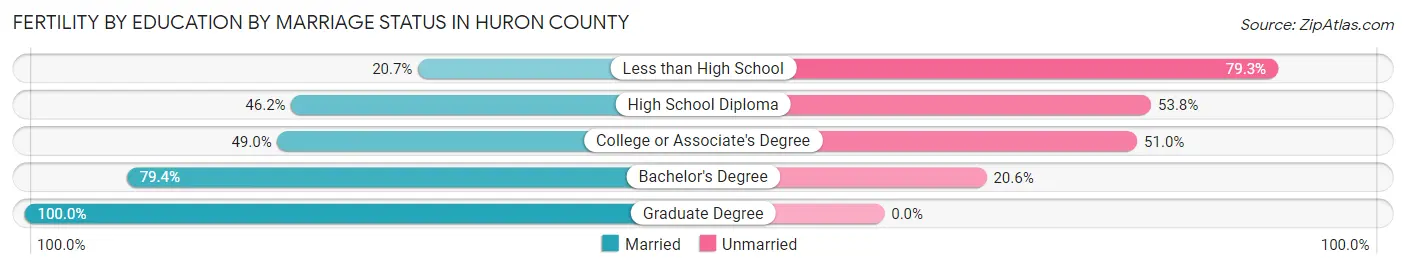
| Educational Attainment | Married | Unmarried |
| Less than High School | 12 (20.7%) | 46 (79.3%) |
| High School Diploma | 92 (46.2%) | 107 (53.8%) |
| College or Associate's Degree | 154 (49.0%) | 160 (51.0%) |
| Bachelor's Degree | 54 (79.4%) | 14 (20.6%) |
| Graduate Degree | 16 (100.0%) | 0 (0.0%) |
| Total | 328 (50.1%) | 327 (49.9%) |
Employment Characteristics in Huron County
Employment by Class of Employer in Huron County
Among the 26,975 employed individuals in Huron County, private company employees (19,900 | 73.8%), not-for-profit organizations (2,094 | 7.8%), and local government employees (1,905 | 7.1%) make up the most common classes of employment.
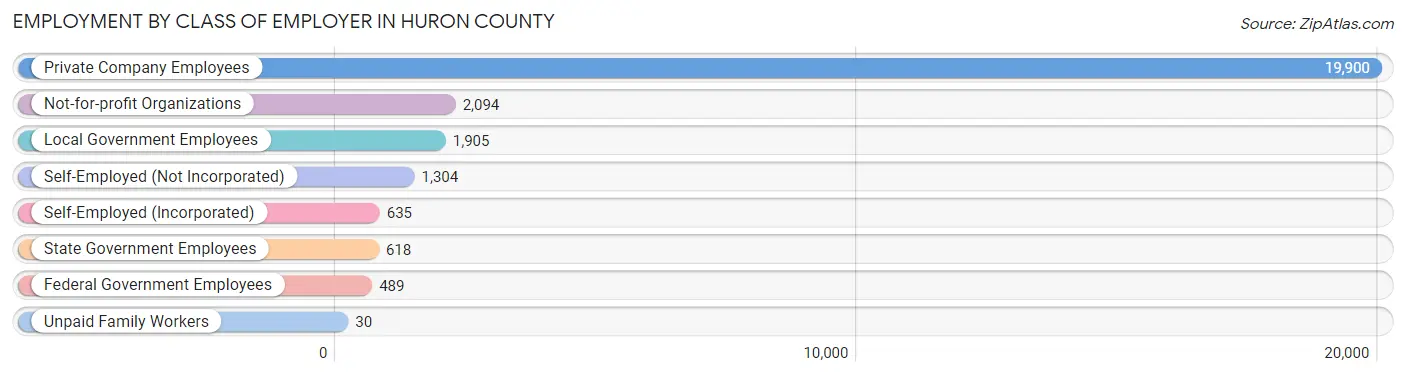
| Employer Class | # Employees | % Employees |
| Private Company Employees | 19,900 | 73.8% |
| Self-Employed (Incorporated) | 635 | 2.4% |
| Self-Employed (Not Incorporated) | 1,304 | 4.8% |
| Not-for-profit Organizations | 2,094 | 7.8% |
| Local Government Employees | 1,905 | 7.1% |
| State Government Employees | 618 | 2.3% |
| Federal Government Employees | 489 | 1.8% |
| Unpaid Family Workers | 30 | 0.1% |
| Total | 26,975 | 100.0% |
Employment Status by Age in Huron County
According to the labor force statistics for Huron County, out of the total population over 16 years of age (46,268), 61.9% or 28,640 individuals are in the labor force, with 4.4% or 1,260 of them unemployed. The age group with the highest labor force participation rate is 30 to 34 years, with 88.4% or 3,152 individuals in the labor force. Within the labor force, the 60 to 64 years age range has the highest percentage of unemployed individuals, with 7.3% or 159 of them being unemployed.
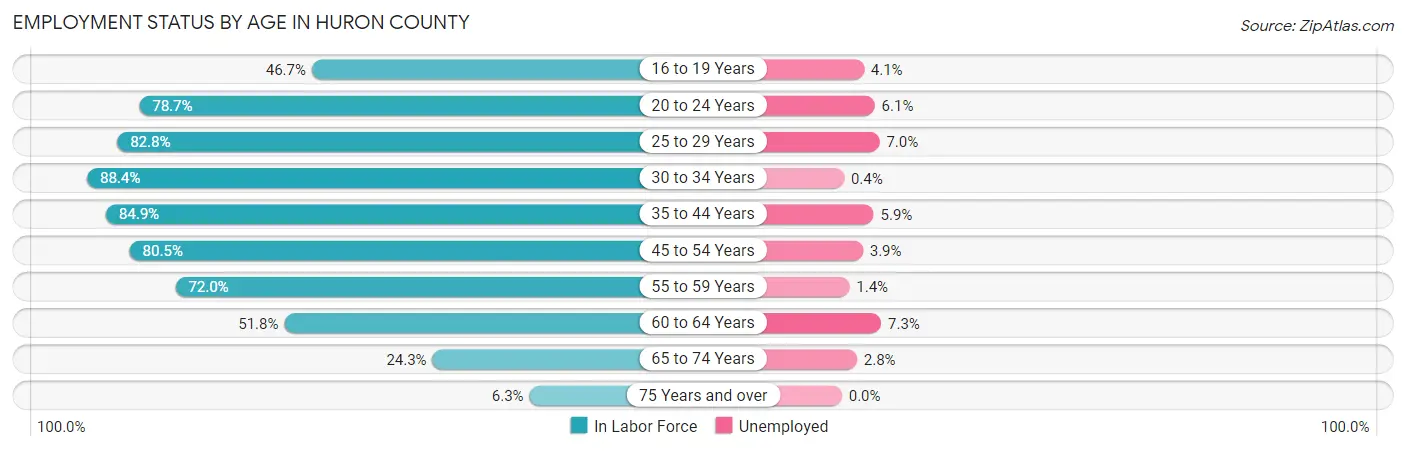
| Age Bracket | In Labor Force | Unemployed |
| 16 to 19 Years | 1,472 (46.7%) | 60 (4.1%) |
| 20 to 24 Years | 2,507 (78.7%) | 153 (6.1%) |
| 25 to 29 Years | 2,922 (82.8%) | 205 (7.0%) |
| 30 to 34 Years | 3,152 (88.4%) | 13 (0.4%) |
| 35 to 44 Years | 5,951 (84.9%) | 351 (5.9%) |
| 45 to 54 Years | 5,883 (80.5%) | 229 (3.9%) |
| 55 to 59 Years | 2,776 (72.0%) | 39 (1.4%) |
| 60 to 64 Years | 2,182 (51.8%) | 159 (7.3%) |
| 65 to 74 Years | 1,561 (24.3%) | 44 (2.8%) |
| 75 Years and over | 254 (6.3%) | 0 (0.0%) |
| Total | 28,640 (61.9%) | 1,260 (4.4%) |
Employment Status by Educational Attainment in Huron County
According to labor force statistics for Huron County, 77.6% of individuals (22,876) out of the total population between 25 and 64 years of age (29,480) are in the labor force, with 4.3% or 984 of them being unemployed. The group with the highest labor force participation rate are those with the educational attainment of bachelor's degree or higher, with 89.4% or 4,318 individuals in the labor force. Within the labor force, individuals with less than high school education have the highest percentage of unemployment, with 15.6% or 265 of them being unemployed.
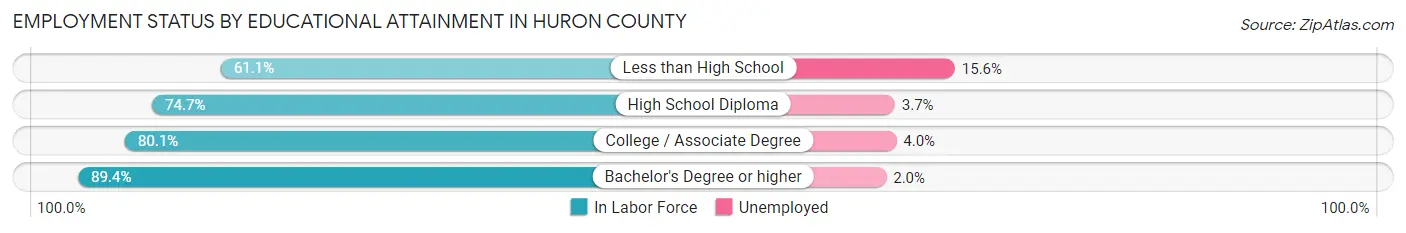
| Educational Attainment | In Labor Force | Unemployed |
| Less than High School | 1,696 (61.1%) | 433 (15.6%) |
| High School Diploma | 9,293 (74.7%) | 460 (3.7%) |
| College / Associate Degree | 7,557 (80.1%) | 377 (4.0%) |
| Bachelor's Degree or higher | 4,318 (89.4%) | 97 (2.0%) |
| Total | 22,876 (77.6%) | 1,268 (4.3%) |
Employment Occupations by Sex in Huron County
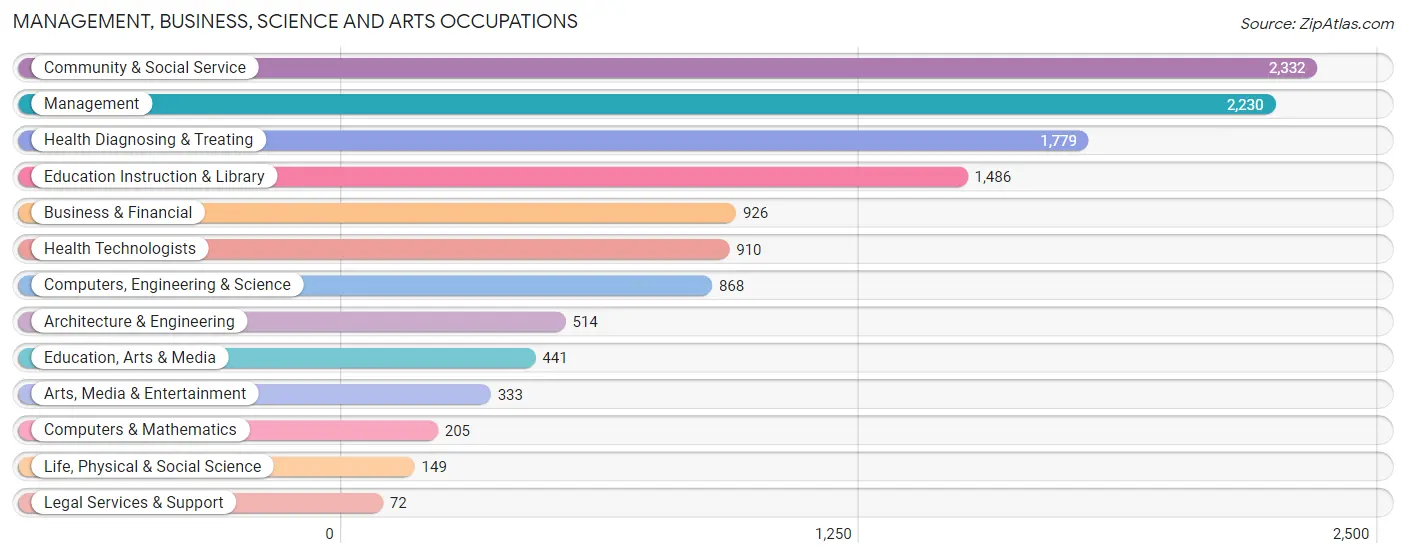
Management, Business, Science and Arts Occupations
The most common Management, Business, Science and Arts occupations in Huron County are Community & Social Service (2,332 | 8.5%), Management (2,230 | 8.1%), Health Diagnosing & Treating (1,779 | 6.5%), Education Instruction & Library (1,486 | 5.4%), and Business & Financial (926 | 3.4%).
Management, Business, Science and Arts Occupations by Sex
Within the Management, Business, Science and Arts occupations in Huron County, the most male-oriented occupations are Arts, Media & Entertainment (79.0%), Architecture & Engineering (77.4%), and Computers & Mathematics (75.6%), while the most female-oriented occupations are Legal Services & Support (88.9%), Education Instruction & Library (77.5%), and Health Diagnosing & Treating (77.5%).
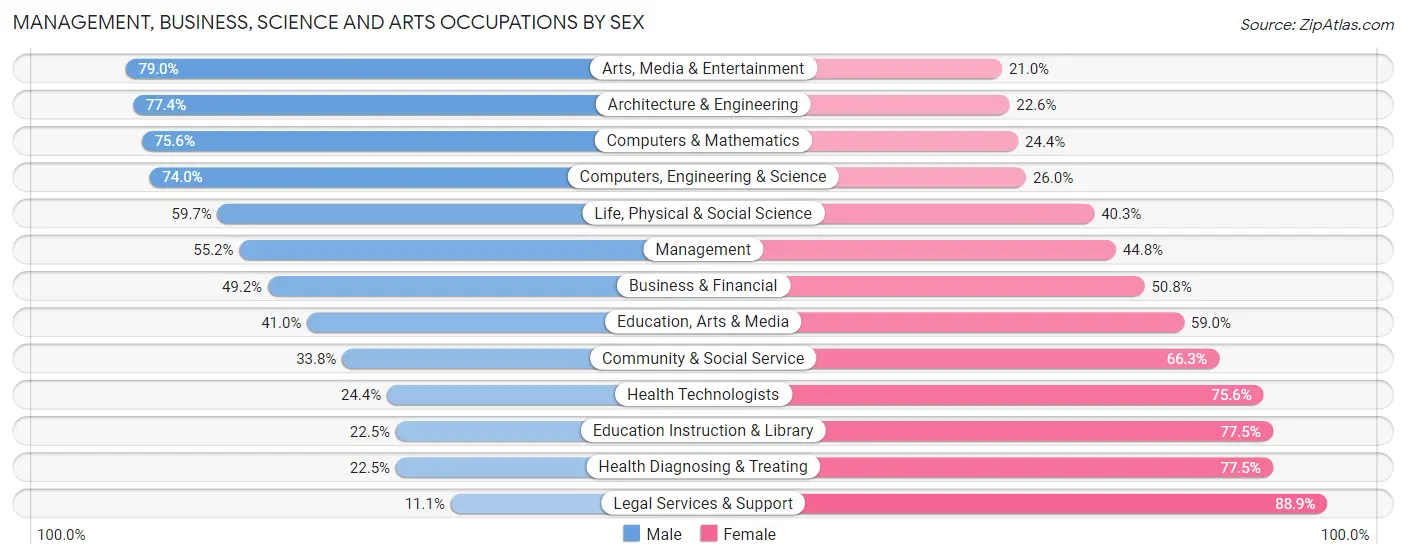
| Occupation | Male | Female |
| Management | 1,231 (55.2%) | 999 (44.8%) |
| Business & Financial | 456 (49.2%) | 470 (50.8%) |
| Computers, Engineering & Science | 642 (74.0%) | 226 (26.0%) |
| Computers & Mathematics | 155 (75.6%) | 50 (24.4%) |
| Architecture & Engineering | 398 (77.4%) | 116 (22.6%) |
| Life, Physical & Social Science | 89 (59.7%) | 60 (40.3%) |
| Community & Social Service | 787 (33.8%) | 1,545 (66.2%) |
| Education, Arts & Media | 181 (41.0%) | 260 (59.0%) |
| Legal Services & Support | 8 (11.1%) | 64 (88.9%) |
| Education Instruction & Library | 335 (22.5%) | 1,151 (77.5%) |
| Arts, Media & Entertainment | 263 (79.0%) | 70 (21.0%) |
| Health Diagnosing & Treating | 401 (22.5%) | 1,378 (77.5%) |
| Health Technologists | 222 (24.4%) | 688 (75.6%) |
| Total (Category) | 3,517 (43.2%) | 4,618 (56.8%) |
| Total (Overall) | 14,760 (53.9%) | 12,635 (46.1%) |
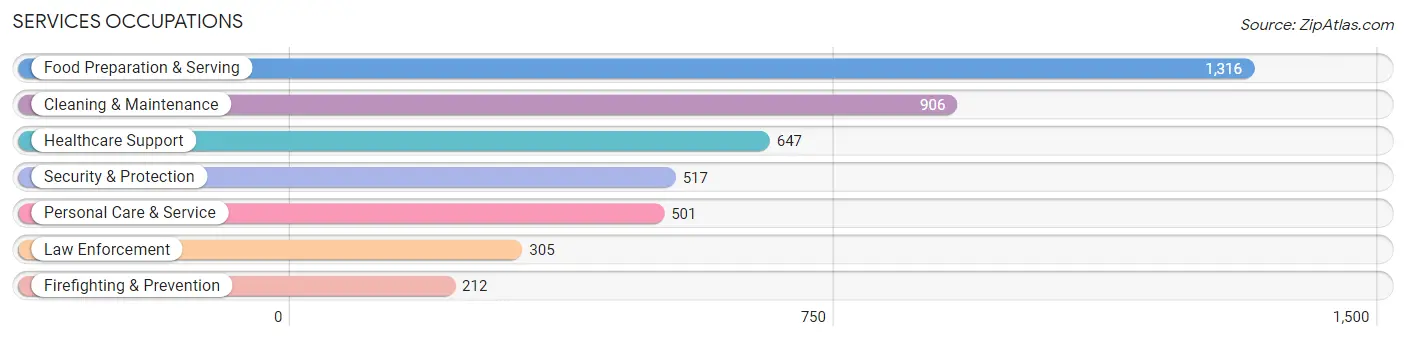
Services Occupations
The most common Services occupations in Huron County are Food Preparation & Serving (1,316 | 4.8%), Cleaning & Maintenance (906 | 3.3%), Healthcare Support (647 | 2.4%), Security & Protection (517 | 1.9%), and Personal Care & Service (501 | 1.8%).
Services Occupations by Sex
Within the Services occupations in Huron County, the most male-oriented occupations are Firefighting & Prevention (91.0%), Security & Protection (85.5%), and Law Enforcement (81.6%), while the most female-oriented occupations are Healthcare Support (99.4%), Personal Care & Service (89.2%), and Food Preparation & Serving (70.1%).
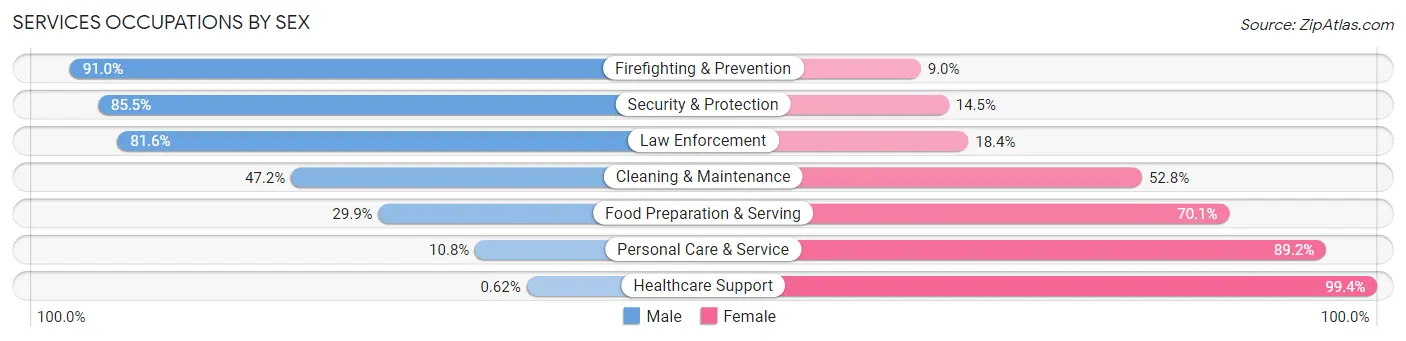
| Occupation | Male | Female |
| Healthcare Support | 4 (0.6%) | 643 (99.4%) |
| Security & Protection | 442 (85.5%) | 75 (14.5%) |
| Firefighting & Prevention | 193 (91.0%) | 19 (9.0%) |
| Law Enforcement | 249 (81.6%) | 56 (18.4%) |
| Food Preparation & Serving | 394 (29.9%) | 922 (70.1%) |
| Cleaning & Maintenance | 428 (47.2%) | 478 (52.8%) |
| Personal Care & Service | 54 (10.8%) | 447 (89.2%) |
| Total (Category) | 1,322 (34.0%) | 2,565 (66.0%) |
| Total (Overall) | 14,760 (53.9%) | 12,635 (46.1%) |
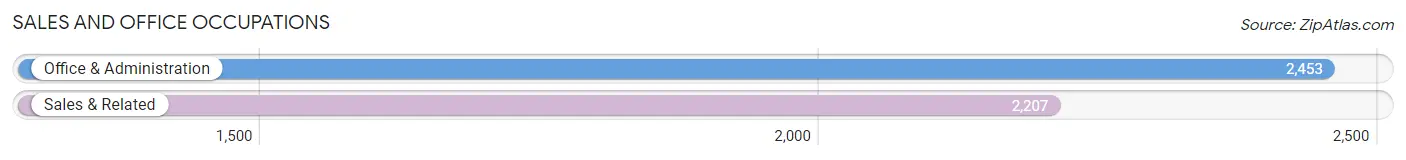
Sales and Office Occupations
The most common Sales and Office occupations in Huron County are Office & Administration (2,453 | 8.9%), and Sales & Related (2,207 | 8.1%).
Sales and Office Occupations by Sex
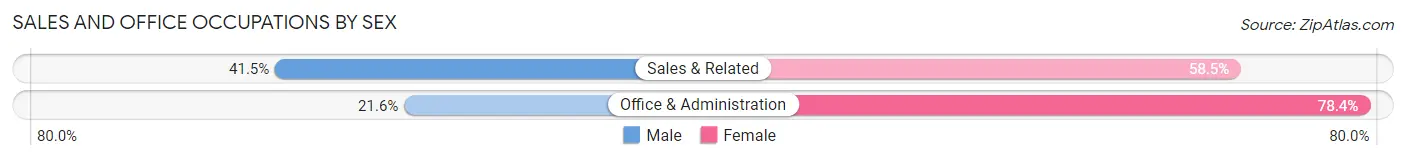
| Occupation | Male | Female |
| Sales & Related | 915 (41.5%) | 1,292 (58.5%) |
| Office & Administration | 530 (21.6%) | 1,923 (78.4%) |
| Total (Category) | 1,445 (31.0%) | 3,215 (69.0%) |
| Total (Overall) | 14,760 (53.9%) | 12,635 (46.1%) |
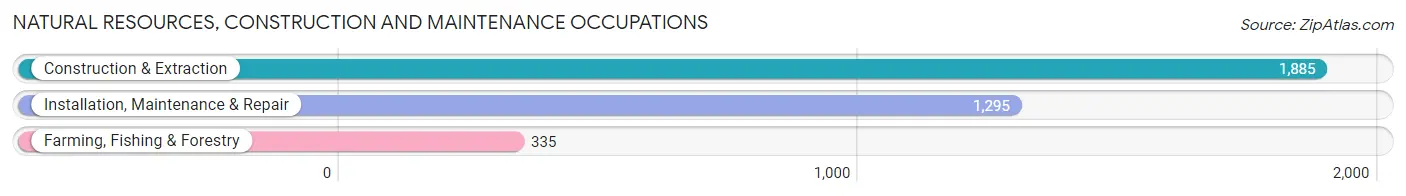
Natural Resources, Construction and Maintenance Occupations
The most common Natural Resources, Construction and Maintenance occupations in Huron County are Construction & Extraction (1,885 | 6.9%), Installation, Maintenance & Repair (1,295 | 4.7%), and Farming, Fishing & Forestry (335 | 1.2%).
Natural Resources, Construction and Maintenance Occupations by Sex
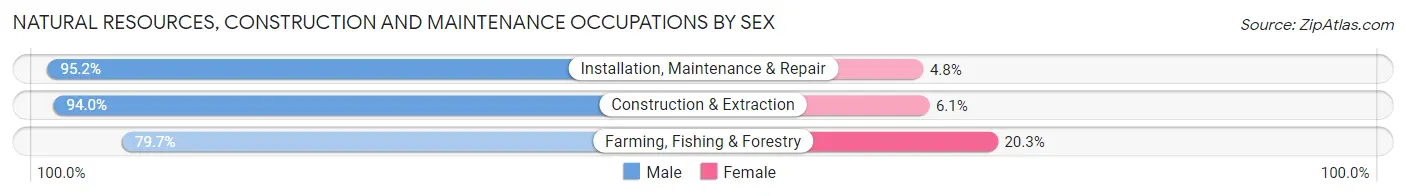
| Occupation | Male | Female |
| Farming, Fishing & Forestry | 267 (79.7%) | 68 (20.3%) |
| Construction & Extraction | 1,771 (94.0%) | 114 (6.0%) |
| Installation, Maintenance & Repair | 1,233 (95.2%) | 62 (4.8%) |
| Total (Category) | 3,271 (93.1%) | 244 (6.9%) |
| Total (Overall) | 14,760 (53.9%) | 12,635 (46.1%) |
Production, Transportation and Moving Occupations
The most common Production, Transportation and Moving occupations in Huron County are Production (3,878 | 14.2%), Transportation (1,692 | 6.2%), and Material Moving (1,628 | 5.9%).
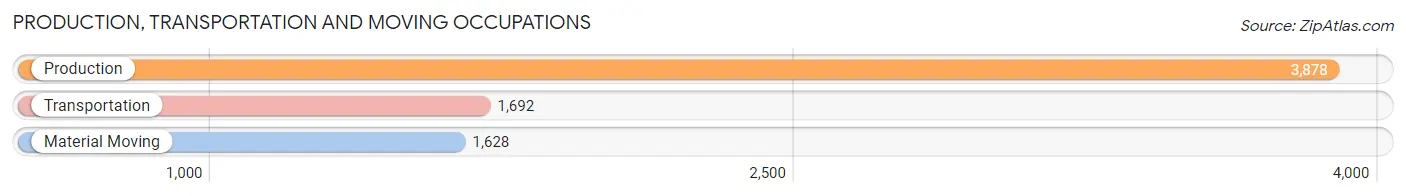
Production, Transportation and Moving Occupations by Sex
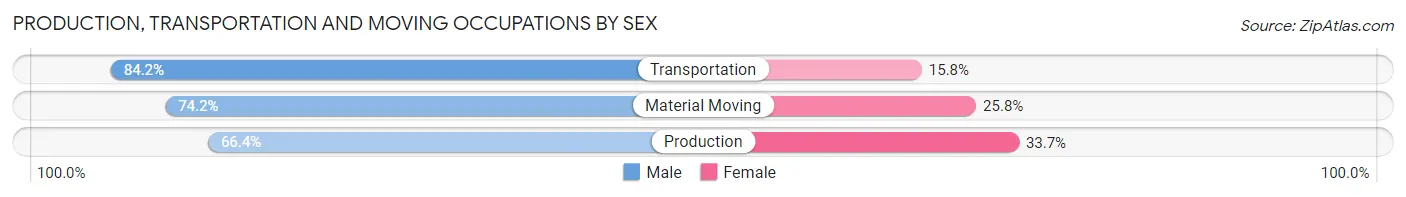
| Occupation | Male | Female |
| Production | 2,573 (66.3%) | 1,305 (33.7%) |
| Transportation | 1,424 (84.2%) | 268 (15.8%) |
| Material Moving | 1,208 (74.2%) | 420 (25.8%) |
| Total (Category) | 5,205 (72.3%) | 1,993 (27.7%) |
| Total (Overall) | 14,760 (53.9%) | 12,635 (46.1%) |
Employment Industries by Sex in Huron County
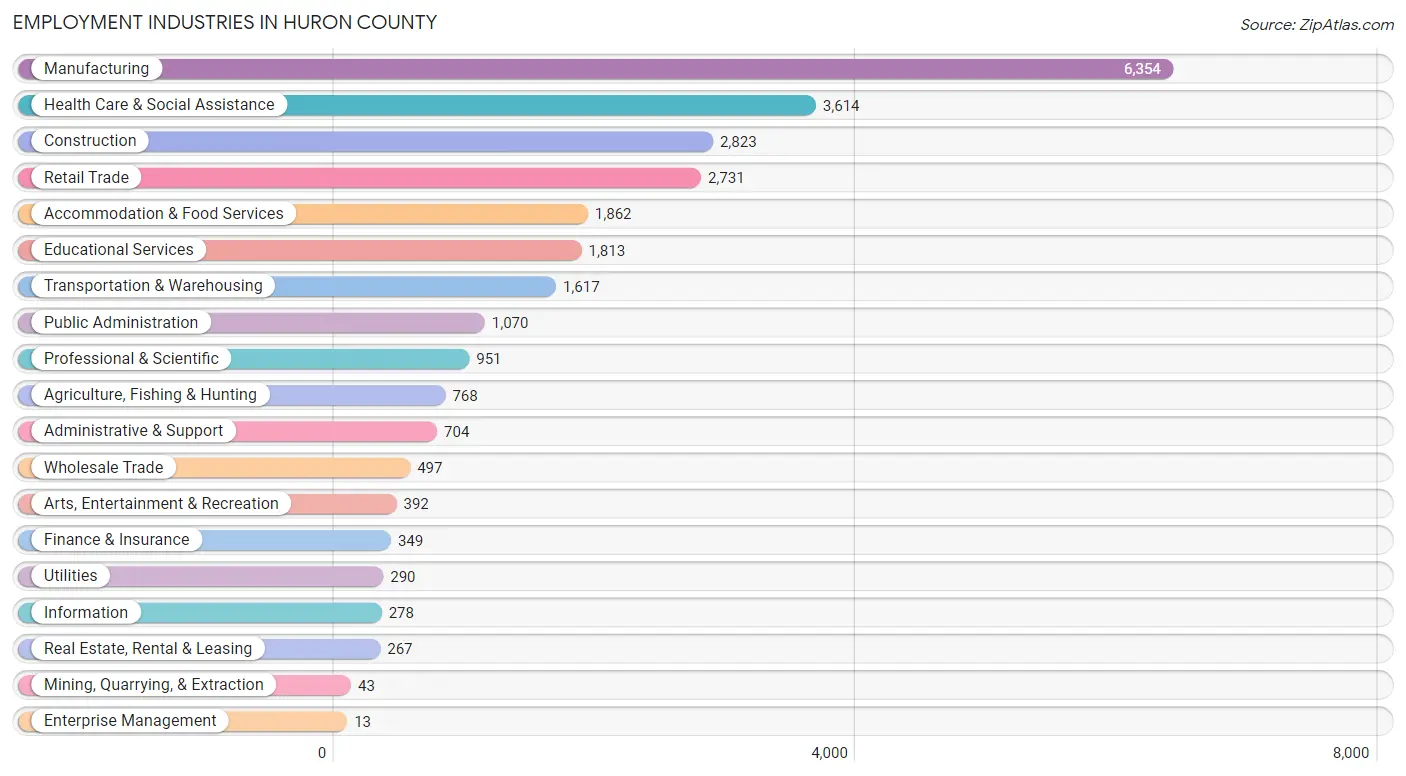
Employment Industries in Huron County
The major employment industries in Huron County include Manufacturing (6,354 | 23.2%), Health Care & Social Assistance (3,614 | 13.2%), Construction (2,823 | 10.3%), Retail Trade (2,731 | 10.0%), and Accommodation & Food Services (1,862 | 6.8%).
Employment Industries by Sex in Huron County
The Huron County industries that see more men than women are Construction (89.7%), Utilities (88.3%), and Wholesale Trade (80.7%), whereas the industries that tend to have a higher number of women are Enterprise Management (100.0%), Health Care & Social Assistance (83.8%), and Educational Services (69.3%).
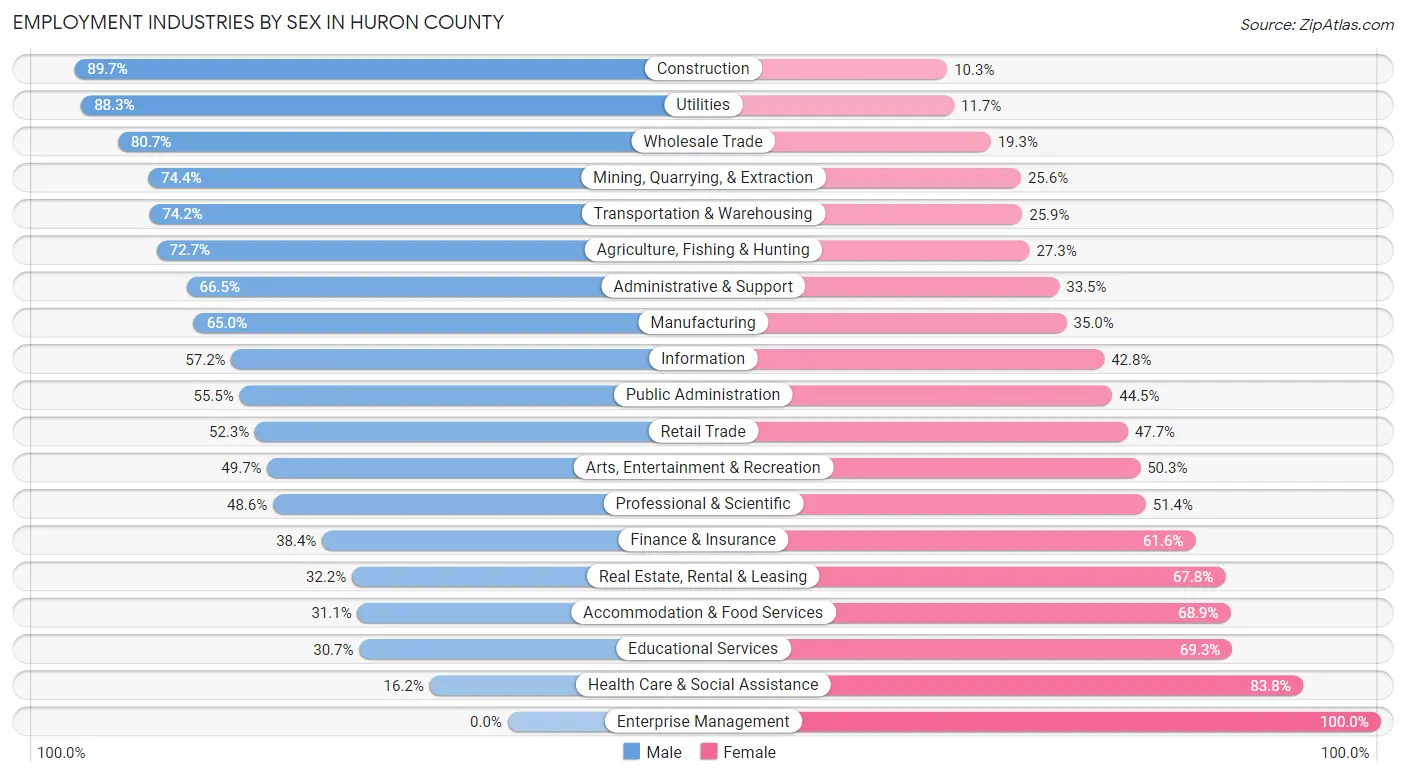
| Industry | Male | Female |
| Agriculture, Fishing & Hunting | 558 (72.7%) | 210 (27.3%) |
| Mining, Quarrying, & Extraction | 32 (74.4%) | 11 (25.6%) |
| Construction | 2,532 (89.7%) | 291 (10.3%) |
| Manufacturing | 4,129 (65.0%) | 2,225 (35.0%) |
| Wholesale Trade | 401 (80.7%) | 96 (19.3%) |
| Retail Trade | 1,428 (52.3%) | 1,303 (47.7%) |
| Transportation & Warehousing | 1,199 (74.2%) | 418 (25.9%) |
| Utilities | 256 (88.3%) | 34 (11.7%) |
| Information | 159 (57.2%) | 119 (42.8%) |
| Finance & Insurance | 134 (38.4%) | 215 (61.6%) |
| Real Estate, Rental & Leasing | 86 (32.2%) | 181 (67.8%) |
| Professional & Scientific | 462 (48.6%) | 489 (51.4%) |
| Enterprise Management | 0 (0.0%) | 13 (100.0%) |
| Administrative & Support | 468 (66.5%) | 236 (33.5%) |
| Educational Services | 557 (30.7%) | 1,256 (69.3%) |
| Health Care & Social Assistance | 584 (16.2%) | 3,030 (83.8%) |
| Arts, Entertainment & Recreation | 195 (49.7%) | 197 (50.3%) |
| Accommodation & Food Services | 579 (31.1%) | 1,283 (68.9%) |
| Public Administration | 594 (55.5%) | 476 (44.5%) |
| Total | 14,760 (53.9%) | 12,635 (46.1%) |
Education in Huron County
School Enrollment in Huron County
The most common levels of schooling among the 13,143 students in Huron County are middle school (3,362 | 25.6%), high school (3,152 | 24.0%), and elementary school (2,954 | 22.5%).
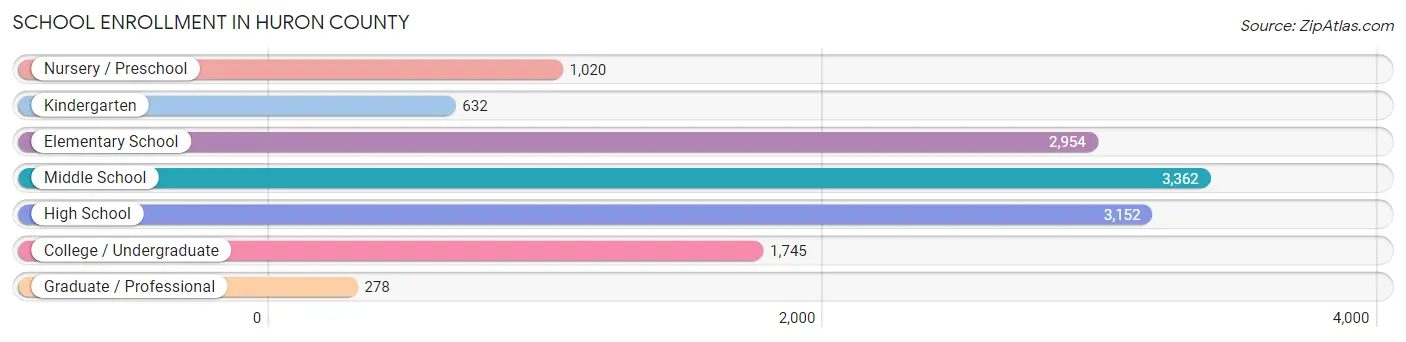
| School Level | # Students | % Students |
| Nursery / Preschool | 1,020 | 7.8% |
| Kindergarten | 632 | 4.8% |
| Elementary School | 2,954 | 22.5% |
| Middle School | 3,362 | 25.6% |
| High School | 3,152 | 24.0% |
| College / Undergraduate | 1,745 | 13.3% |
| Graduate / Professional | 278 | 2.1% |
| Total | 13,143 | 100.0% |
School Enrollment by Age by Funding Source in Huron County
Out of a total of 13,143 students who are enrolled in schools in Huron County, 2,011 (15.3%) attend a private institution, while the remaining 11,132 (84.7%) are enrolled in public schools. The age group of 3 to 4 year olds has the highest likelihood of being enrolled in private schools, with 216 (29.0% in the age bracket) enrolled. Conversely, the age group of 15 to 17 year olds has the lowest likelihood of being enrolled in a private school, with 2,121 (91.3% in the age bracket) attending a public institution.
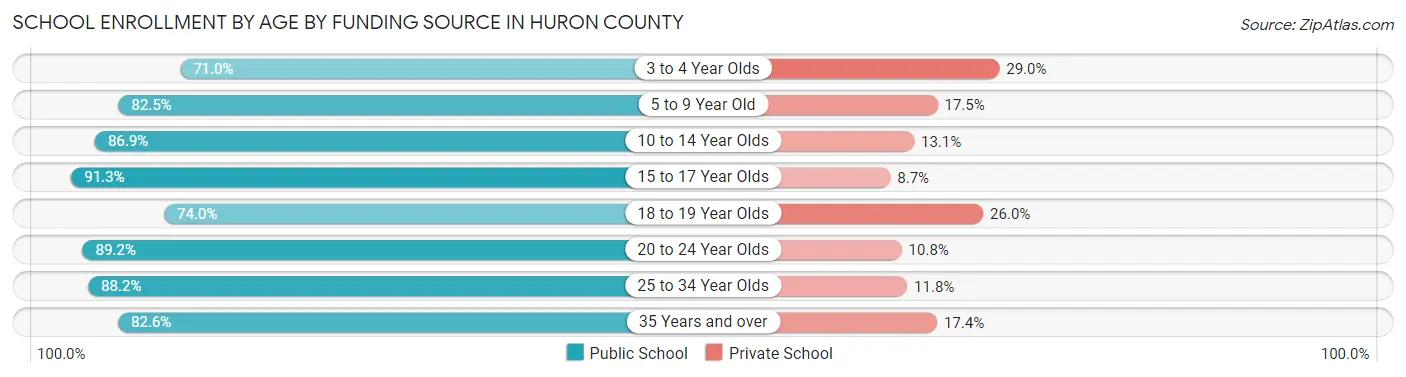
| Age Bracket | Public School | Private School |
| 3 to 4 Year Olds | 529 (71.0%) | 216 (29.0%) |
| 5 to 9 Year Old | 2,767 (82.5%) | 586 (17.5%) |
| 10 to 14 Year Olds | 3,553 (86.9%) | 536 (13.1%) |
| 15 to 17 Year Olds | 2,121 (91.3%) | 202 (8.7%) |
| 18 to 19 Year Olds | 681 (74.0%) | 239 (26.0%) |
| 20 to 24 Year Olds | 512 (89.2%) | 62 (10.8%) |
| 25 to 34 Year Olds | 477 (88.2%) | 64 (11.8%) |
| 35 Years and over | 494 (82.6%) | 104 (17.4%) |
| Total | 11,132 (84.7%) | 2,011 (15.3%) |
Educational Attainment by Field of Study in Huron County
Education (1,584 | 23.7%), business (1,340 | 20.1%), science & technology (755 | 11.3%), arts & humanities (716 | 10.7%), and bio, nature & agricultural (388 | 5.8%) are the most common fields of study among 6,676 individuals in Huron County who have obtained a bachelor's degree or higher.
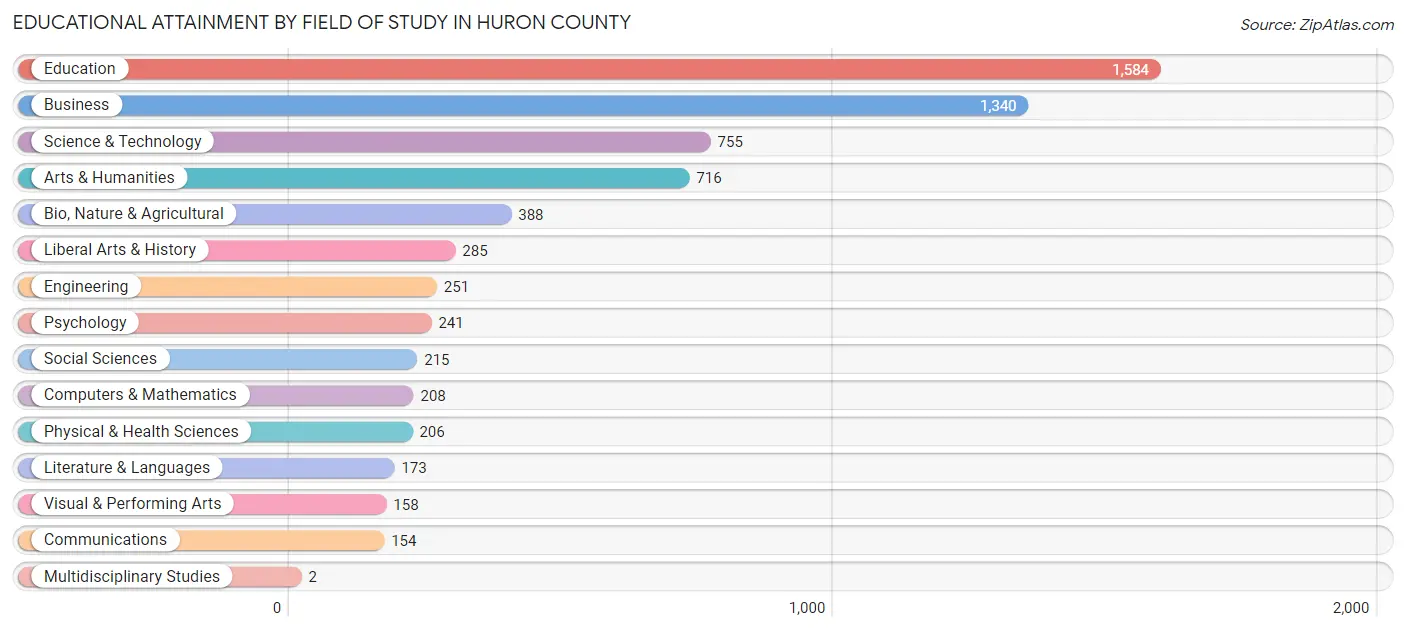
| Field of Study | # Graduates | % Graduates |
| Computers & Mathematics | 208 | 3.1% |
| Bio, Nature & Agricultural | 388 | 5.8% |
| Physical & Health Sciences | 206 | 3.1% |
| Psychology | 241 | 3.6% |
| Social Sciences | 215 | 3.2% |
| Engineering | 251 | 3.8% |
| Multidisciplinary Studies | 2 | 0.0% |
| Science & Technology | 755 | 11.3% |
| Business | 1,340 | 20.1% |
| Education | 1,584 | 23.7% |
| Literature & Languages | 173 | 2.6% |
| Liberal Arts & History | 285 | 4.3% |
| Visual & Performing Arts | 158 | 2.4% |
| Communications | 154 | 2.3% |
| Arts & Humanities | 716 | 10.7% |
| Total | 6,676 | 100.0% |
Transportation & Commute in Huron County
Vehicle Availability by Sex in Huron County
The most prevalent vehicle ownership categories in Huron County are males with 2 vehicles (4,949, accounting for 34.1%) and females with 2 vehicles (4,618, making up 40.0%).
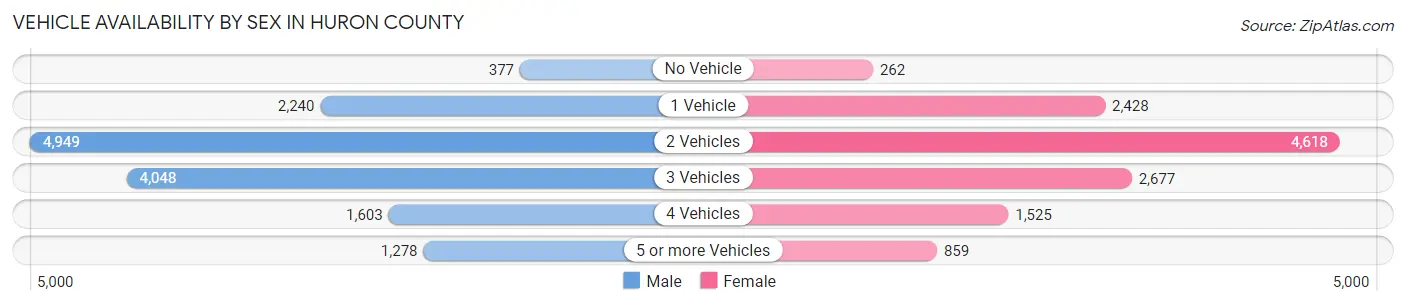
| Vehicles Available | Male | Female |
| No Vehicle | 377 (2.6%) | 262 (2.1%) |
| 1 Vehicle | 2,240 (15.4%) | 2,428 (19.6%) |
| 2 Vehicles | 4,949 (34.1%) | 4,618 (37.3%) |
| 3 Vehicles | 4,048 (27.9%) | 2,677 (21.6%) |
| 4 Vehicles | 1,603 (11.1%) | 1,525 (12.3%) |
| 5 or more Vehicles | 1,278 (8.8%) | 859 (6.9%) |
| Total | 14,495 (100.0%) | 12,369 (100.0%) |
Commute Time in Huron County
The most frequently occuring commute durations in Huron County are 10 to 14 minutes (4,246 commuters, 16.4%), 5 to 9 minutes (4,190 commuters, 16.2%), and 20 to 24 minutes (3,078 commuters, 11.9%).
| Commute Time | # Commuters | % Commuters |
| Less than 5 Minutes | 1,667 | 6.4% |
| 5 to 9 Minutes | 4,190 | 16.2% |
| 10 to 14 Minutes | 4,246 | 16.4% |
| 15 to 19 Minutes | 2,679 | 10.3% |
| 20 to 24 Minutes | 3,078 | 11.9% |
| 25 to 29 Minutes | 2,227 | 8.6% |
| 30 to 34 Minutes | 2,955 | 11.4% |
| 35 to 39 Minutes | 793 | 3.1% |
| 40 to 44 Minutes | 842 | 3.3% |
| 45 to 59 Minutes | 1,524 | 5.9% |
| 60 to 89 Minutes | 1,294 | 5.0% |
| 90 or more Minutes | 383 | 1.5% |
Commute Time by Sex in Huron County
The most common commute times in Huron County are 10 to 14 minutes (2,329 commuters, 16.4%) for males and 5 to 9 minutes (1,922 commuters, 16.4%) for females.
| Commute Time | Male | Female |
| Less than 5 Minutes | 843 (5.9%) | 824 (7.0%) |
| 5 to 9 Minutes | 2,268 (16.0%) | 1,922 (16.4%) |
| 10 to 14 Minutes | 2,329 (16.4%) | 1,917 (16.4%) |
| 15 to 19 Minutes | 1,574 (11.1%) | 1,105 (9.5%) |
| 20 to 24 Minutes | 1,561 (11.0%) | 1,517 (13.0%) |
| 25 to 29 Minutes | 1,167 (8.2%) | 1,060 (9.1%) |
| 30 to 34 Minutes | 1,717 (12.1%) | 1,238 (10.6%) |
| 35 to 39 Minutes | 448 (3.2%) | 345 (2.9%) |
| 40 to 44 Minutes | 387 (2.7%) | 455 (3.9%) |
| 45 to 59 Minutes | 828 (5.8%) | 696 (5.9%) |
| 60 to 89 Minutes | 840 (5.9%) | 454 (3.9%) |
| 90 or more Minutes | 219 (1.5%) | 164 (1.4%) |
Time of Departure to Work by Sex in Huron County
The most frequent times of departure to work in Huron County are 7:00 AM to 7:29 AM (1,701, 12.0%) for males and 7:30 AM to 7:59 AM (1,552, 13.3%) for females.
| Time of Departure | Male | Female |
| 12:00 AM to 4:59 AM | 1,411 (10.0%) | 291 (2.5%) |
| 5:00 AM to 5:29 AM | 987 (7.0%) | 598 (5.1%) |
| 5:30 AM to 5:59 AM | 1,123 (7.9%) | 605 (5.2%) |
| 6:00 AM to 6:29 AM | 1,640 (11.6%) | 984 (8.4%) |
| 6:30 AM to 6:59 AM | 1,554 (11.0%) | 1,527 (13.1%) |
| 7:00 AM to 7:29 AM | 1,701 (12.0%) | 1,482 (12.7%) |
| 7:30 AM to 7:59 AM | 1,196 (8.4%) | 1,552 (13.3%) |
| 8:00 AM to 8:29 AM | 853 (6.0%) | 909 (7.8%) |
| 8:30 AM to 8:59 AM | 403 (2.8%) | 474 (4.1%) |
| 9:00 AM to 9:59 AM | 500 (3.5%) | 562 (4.8%) |
| 10:00 AM to 10:59 AM | 45 (0.3%) | 520 (4.4%) |
| 11:00 AM to 11:59 AM | 218 (1.5%) | 141 (1.2%) |
| 12:00 PM to 3:59 PM | 1,382 (9.8%) | 1,043 (8.9%) |
| 4:00 PM to 11:59 PM | 1,168 (8.2%) | 1,009 (8.6%) |
| Total | 14,181 (100.0%) | 11,697 (100.0%) |
Housing Occupancy in Huron County
Occupancy by Ownership in Huron County
Of the total 23,096 dwellings in Huron County, owner-occupied units account for 16,952 (73.4%), while renter-occupied units make up 6,144 (26.6%).
| Occupancy | # Housing Units | % Housing Units |
| Owner Occupied Housing Units | 16,952 | 73.4% |
| Renter-Occupied Housing Units | 6,144 | 26.6% |
| Total Occupied Housing Units | 23,096 | 100.0% |
Occupancy by Household Size in Huron County
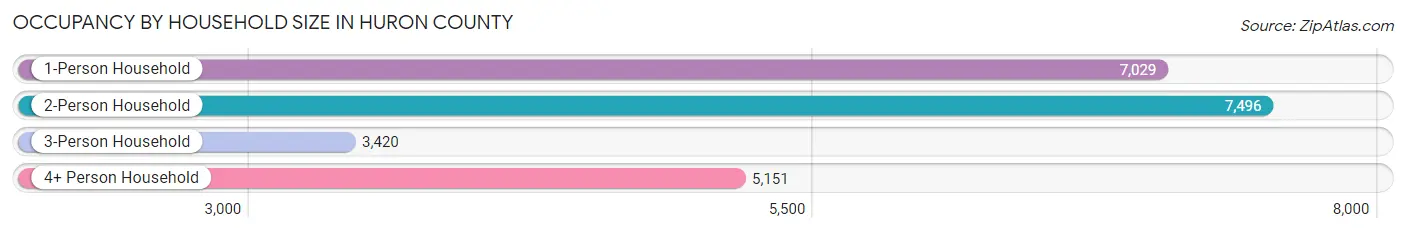
| Household Size | # Housing Units | % Housing Units |
| 1-Person Household | 7,029 | 30.4% |
| 2-Person Household | 7,496 | 32.5% |
| 3-Person Household | 3,420 | 14.8% |
| 4+ Person Household | 5,151 | 22.3% |
| Total Housing Units | 23,096 | 100.0% |
Occupancy by Ownership by Household Size in Huron County
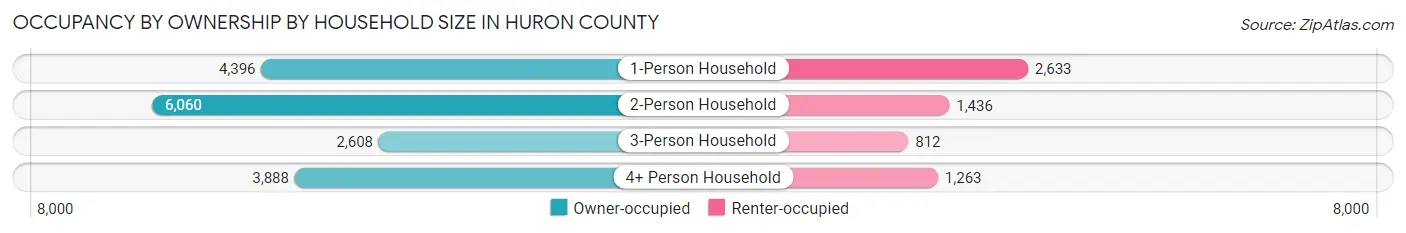
| Household Size | Owner-occupied | Renter-occupied |
| 1-Person Household | 4,396 (62.5%) | 2,633 (37.5%) |
| 2-Person Household | 6,060 (80.8%) | 1,436 (19.2%) |
| 3-Person Household | 2,608 (76.3%) | 812 (23.7%) |
| 4+ Person Household | 3,888 (75.5%) | 1,263 (24.5%) |
| Total Housing Units | 16,952 (73.4%) | 6,144 (26.6%) |
Occupancy by Educational Attainment in Huron County
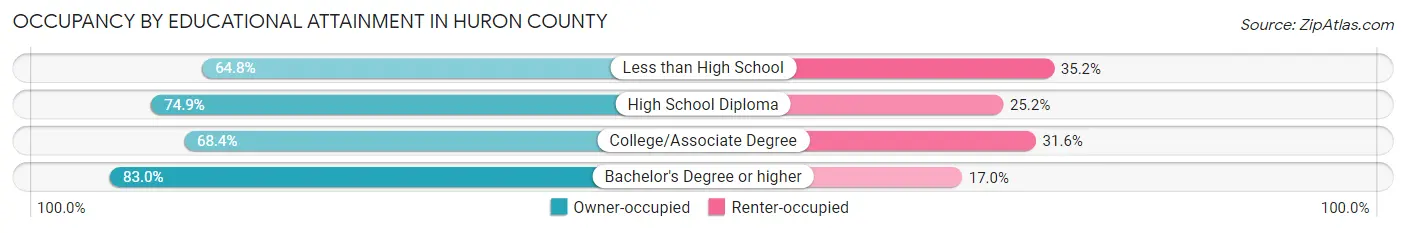
| Household Size | Owner-occupied | Renter-occupied |
| Less than High School | 1,129 (64.8%) | 614 (35.2%) |
| High School Diploma | 7,790 (74.9%) | 2,618 (25.2%) |
| College/Associate Degree | 4,925 (68.4%) | 2,277 (31.6%) |
| Bachelor's Degree or higher | 3,108 (83.0%) | 635 (17.0%) |
Occupancy by Age of Householder in Huron County
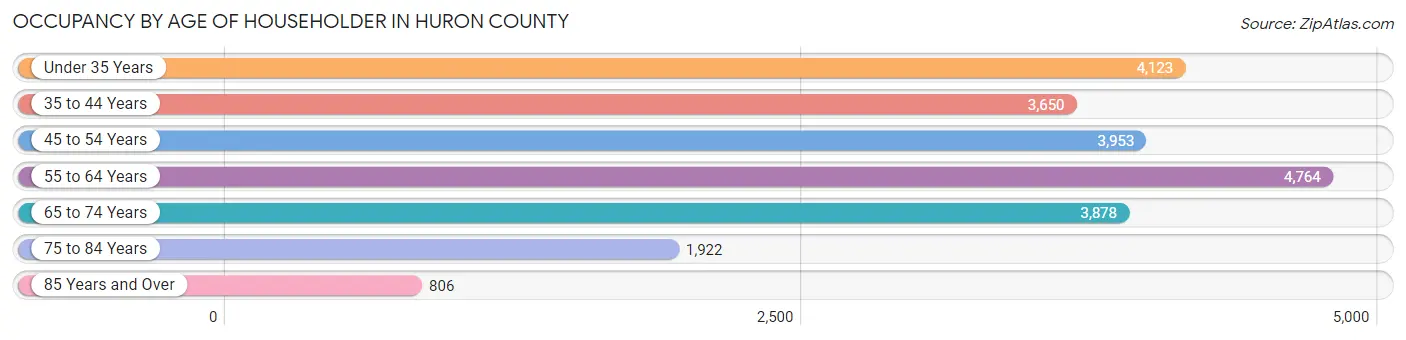
| Age Bracket | # Households | % Households |
| Under 35 Years | 4,123 | 17.8% |
| 35 to 44 Years | 3,650 | 15.8% |
| 45 to 54 Years | 3,953 | 17.1% |
| 55 to 64 Years | 4,764 | 20.6% |
| 65 to 74 Years | 3,878 | 16.8% |
| 75 to 84 Years | 1,922 | 8.3% |
| 85 Years and Over | 806 | 3.5% |
| Total | 23,096 | 100.0% |
Housing Finances in Huron County
Median Income by Occupancy in Huron County
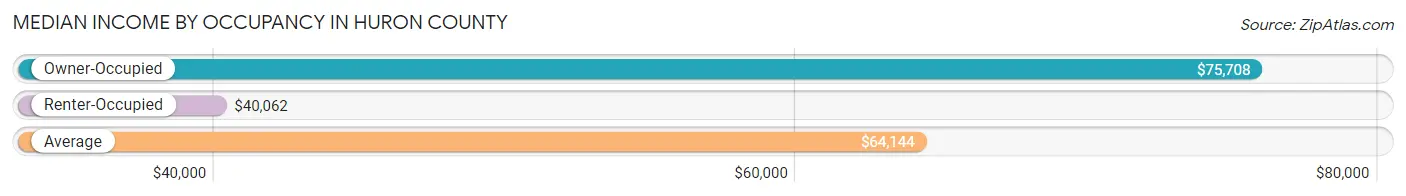
| Occupancy Type | # Households | Median Income |
| Owner-Occupied | 16,952 (73.4%) | $75,708 |
| Renter-Occupied | 6,144 (26.6%) | $40,062 |
| Average | 23,096 (100.0%) | $64,144 |
Occupancy by Householder Income Bracket in Huron County
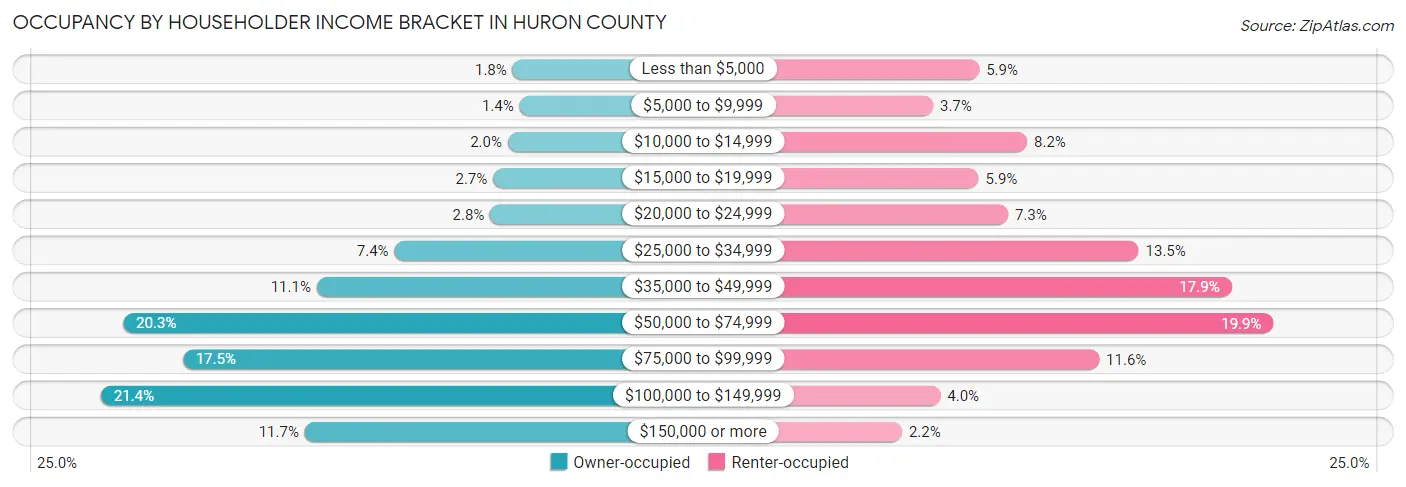
| Income Bracket | Owner-occupied | Renter-occupied |
| Less than $5,000 | 299 (1.8%) | 362 (5.9%) |
| $5,000 to $9,999 | 243 (1.4%) | 227 (3.7%) |
| $10,000 to $14,999 | 338 (2.0%) | 502 (8.2%) |
| $15,000 to $19,999 | 456 (2.7%) | 360 (5.9%) |
| $20,000 to $24,999 | 480 (2.8%) | 446 (7.3%) |
| $25,000 to $34,999 | 1,252 (7.4%) | 828 (13.5%) |
| $35,000 to $49,999 | 1,880 (11.1%) | 1,100 (17.9%) |
| $50,000 to $74,999 | 3,443 (20.3%) | 1,222 (19.9%) |
| $75,000 to $99,999 | 2,961 (17.5%) | 713 (11.6%) |
| $100,000 to $149,999 | 3,623 (21.4%) | 248 (4.0%) |
| $150,000 or more | 1,977 (11.7%) | 136 (2.2%) |
| Total | 16,952 (100.0%) | 6,144 (100.0%) |
Monthly Housing Cost Tiers in Huron County
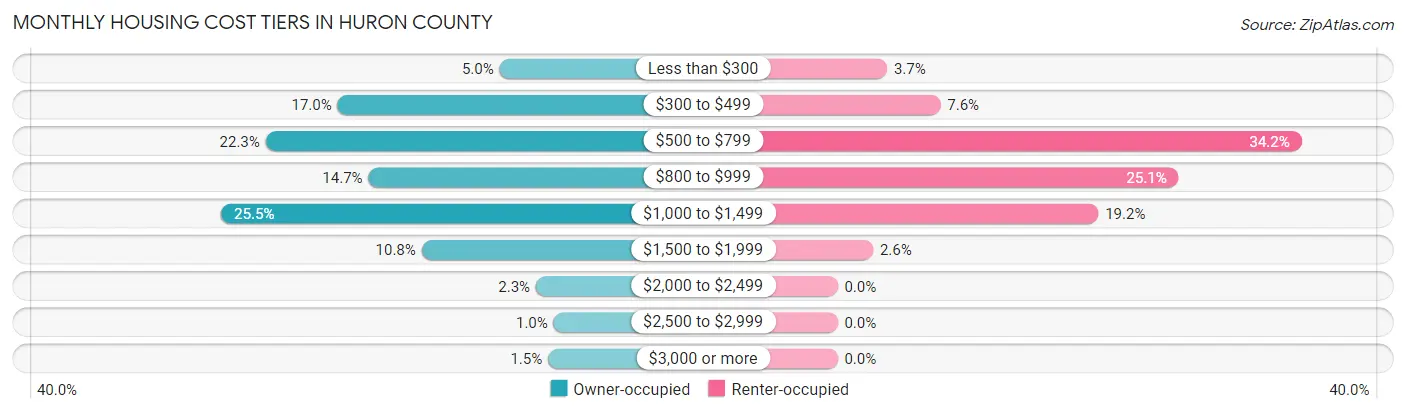
| Monthly Cost | Owner-occupied | Renter-occupied |
| Less than $300 | 851 (5.0%) | 224 (3.6%) |
| $300 to $499 | 2,873 (17.0%) | 466 (7.6%) |
| $500 to $799 | 3,771 (22.3%) | 2,100 (34.2%) |
| $800 to $999 | 2,488 (14.7%) | 1,544 (25.1%) |
| $1,000 to $1,499 | 4,326 (25.5%) | 1,180 (19.2%) |
| $1,500 to $1,999 | 1,824 (10.8%) | 161 (2.6%) |
| $2,000 to $2,499 | 396 (2.3%) | 0 (0.0%) |
| $2,500 to $2,999 | 177 (1.0%) | 0 (0.0%) |
| $3,000 or more | 246 (1.5%) | 0 (0.0%) |
| Total | 16,952 (100.0%) | 6,144 (100.0%) |
Physical Housing Characteristics in Huron County
Housing Structures in Huron County
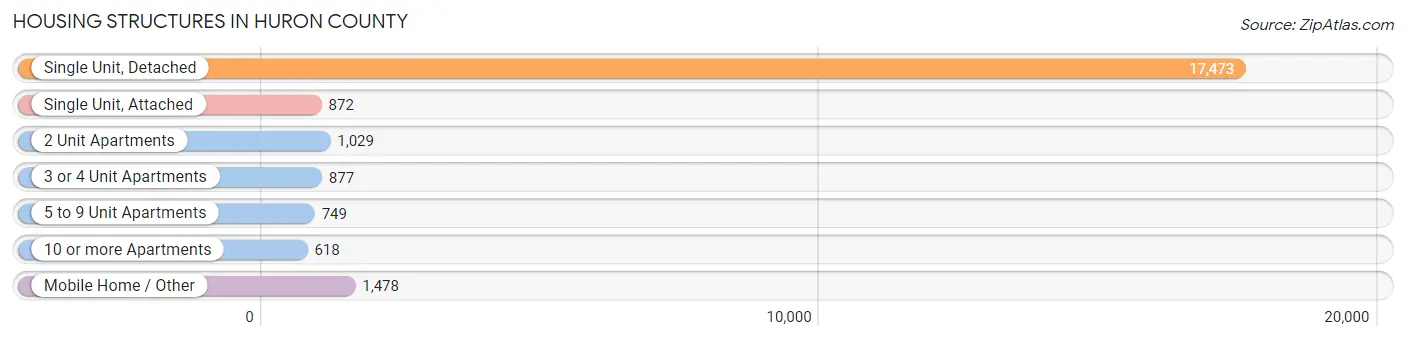
| Structure Type | # Housing Units | % Housing Units |
| Single Unit, Detached | 17,473 | 75.6% |
| Single Unit, Attached | 872 | 3.8% |
| 2 Unit Apartments | 1,029 | 4.5% |
| 3 or 4 Unit Apartments | 877 | 3.8% |
| 5 to 9 Unit Apartments | 749 | 3.2% |
| 10 or more Apartments | 618 | 2.7% |
| Mobile Home / Other | 1,478 | 6.4% |
| Total | 23,096 | 100.0% |
Housing Structures by Occupancy in Huron County
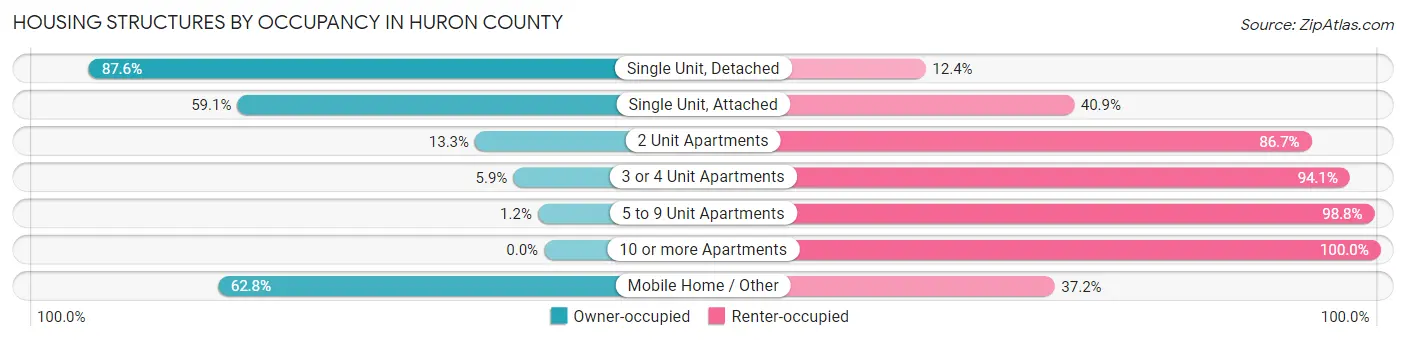
| Structure Type | Owner-occupied | Renter-occupied |
| Single Unit, Detached | 15,311 (87.6%) | 2,162 (12.4%) |
| Single Unit, Attached | 515 (59.1%) | 357 (40.9%) |
| 2 Unit Apartments | 137 (13.3%) | 892 (86.7%) |
| 3 or 4 Unit Apartments | 52 (5.9%) | 825 (94.1%) |
| 5 to 9 Unit Apartments | 9 (1.2%) | 740 (98.8%) |
| 10 or more Apartments | 0 (0.0%) | 618 (100.0%) |
| Mobile Home / Other | 928 (62.8%) | 550 (37.2%) |
| Total | 16,952 (73.4%) | 6,144 (26.6%) |
Housing Structures by Number of Rooms in Huron County
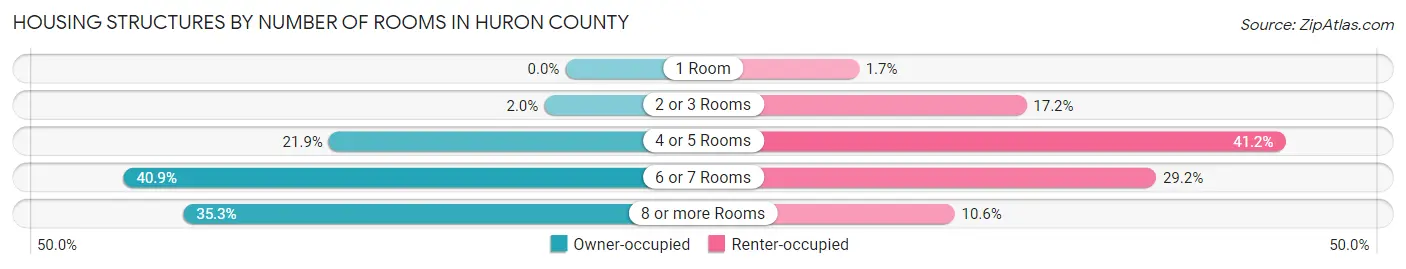
| Number of Rooms | Owner-occupied | Renter-occupied |
| 1 Room | 0 (0.0%) | 107 (1.7%) |
| 2 or 3 Rooms | 330 (1.9%) | 1,059 (17.2%) |
| 4 or 5 Rooms | 3,709 (21.9%) | 2,531 (41.2%) |
| 6 or 7 Rooms | 6,925 (40.8%) | 1,796 (29.2%) |
| 8 or more Rooms | 5,988 (35.3%) | 651 (10.6%) |
| Total | 16,952 (100.0%) | 6,144 (100.0%) |
Housing Structure by Heating Type in Huron County
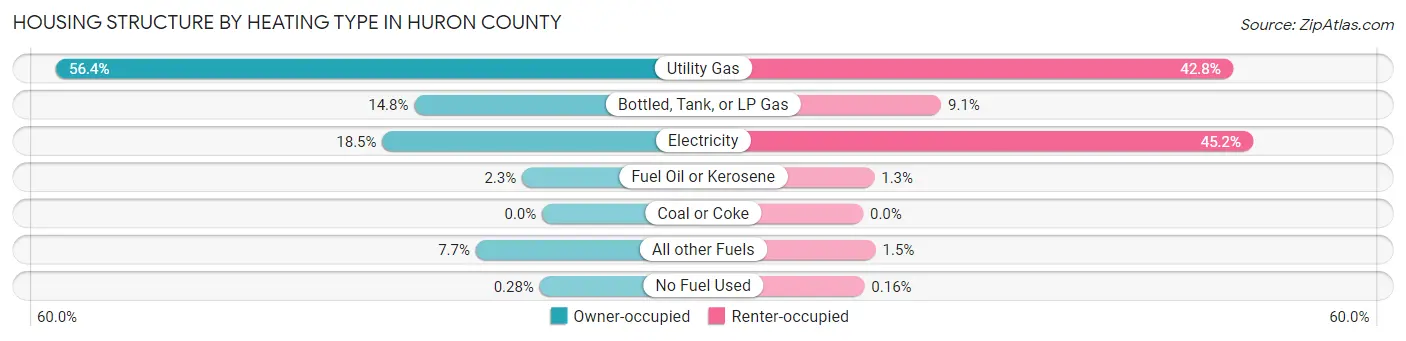
| Heating Type | Owner-occupied | Renter-occupied |
| Utility Gas | 9,552 (56.4%) | 2,632 (42.8%) |
| Bottled, Tank, or LP Gas | 2,513 (14.8%) | 556 (9.0%) |
| Electricity | 3,140 (18.5%) | 2,776 (45.2%) |
| Fuel Oil or Kerosene | 395 (2.3%) | 80 (1.3%) |
| Coal or Coke | 0 (0.0%) | 0 (0.0%) |
| All other Fuels | 1,304 (7.7%) | 90 (1.5%) |
| No Fuel Used | 48 (0.3%) | 10 (0.2%) |
| Total | 16,952 (100.0%) | 6,144 (100.0%) |
Household Vehicle Usage in Huron County
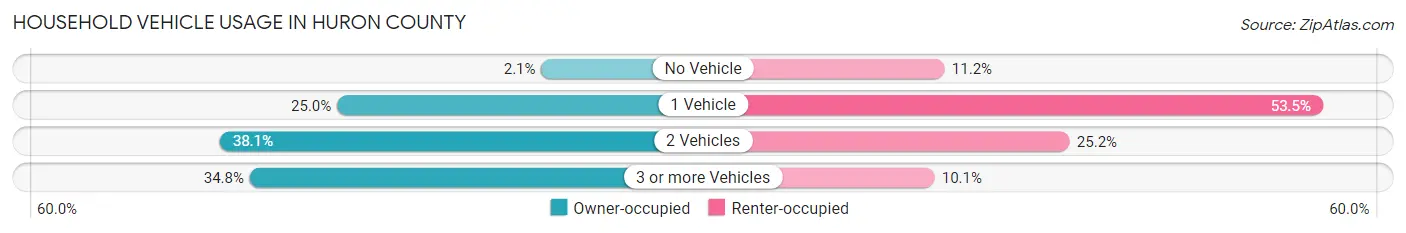
| Vehicles per Household | Owner-occupied | Renter-occupied |
| No Vehicle | 357 (2.1%) | 688 (11.2%) |
| 1 Vehicle | 4,237 (25.0%) | 3,289 (53.5%) |
| 2 Vehicles | 6,464 (38.1%) | 1,548 (25.2%) |
| 3 or more Vehicles | 5,894 (34.8%) | 619 (10.1%) |
| Total | 16,952 (100.0%) | 6,144 (100.0%) |
Real Estate & Mortgages in Huron County
Real Estate and Mortgage Overview in Huron County
| Characteristic | Without Mortgage | With Mortgage |
| Housing Units | 6,703 | 10,249 |
| Median Property Value | $149,500 | $152,800 |
| Median Household Income | $60,790 | $1,437 |
| Monthly Housing Costs | $488 | $246 |
| Real Estate Taxes | $1,597 | $226 |
Property Value by Mortgage Status in Huron County
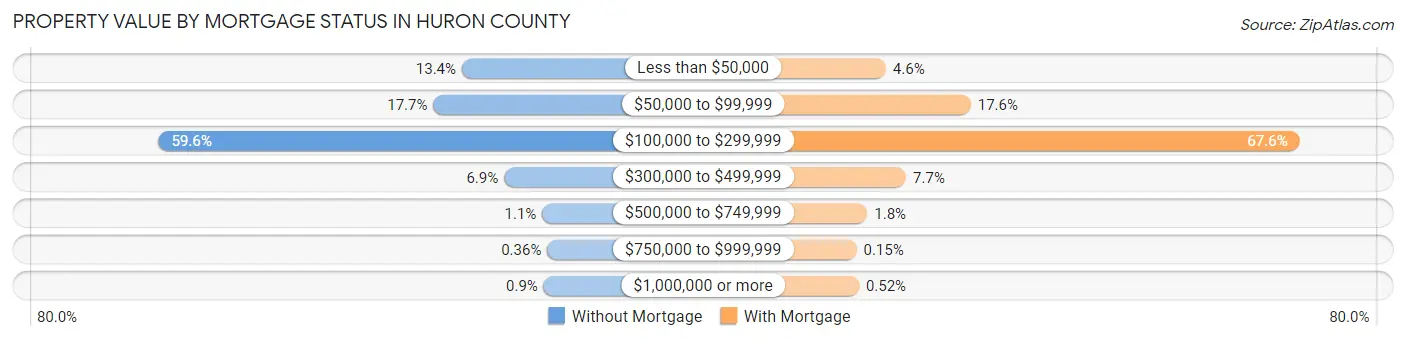
| Property Value | Without Mortgage | With Mortgage |
| Less than $50,000 | 896 (13.4%) | 475 (4.6%) |
| $50,000 to $99,999 | 1,188 (17.7%) | 1,800 (17.6%) |
| $100,000 to $299,999 | 3,994 (59.6%) | 6,932 (67.6%) |
| $300,000 to $499,999 | 465 (6.9%) | 790 (7.7%) |
| $500,000 to $749,999 | 76 (1.1%) | 184 (1.8%) |
| $750,000 to $999,999 | 24 (0.4%) | 15 (0.2%) |
| $1,000,000 or more | 60 (0.9%) | 53 (0.5%) |
| Total | 6,703 (100.0%) | 10,249 (100.0%) |
Household Income by Mortgage Status in Huron County
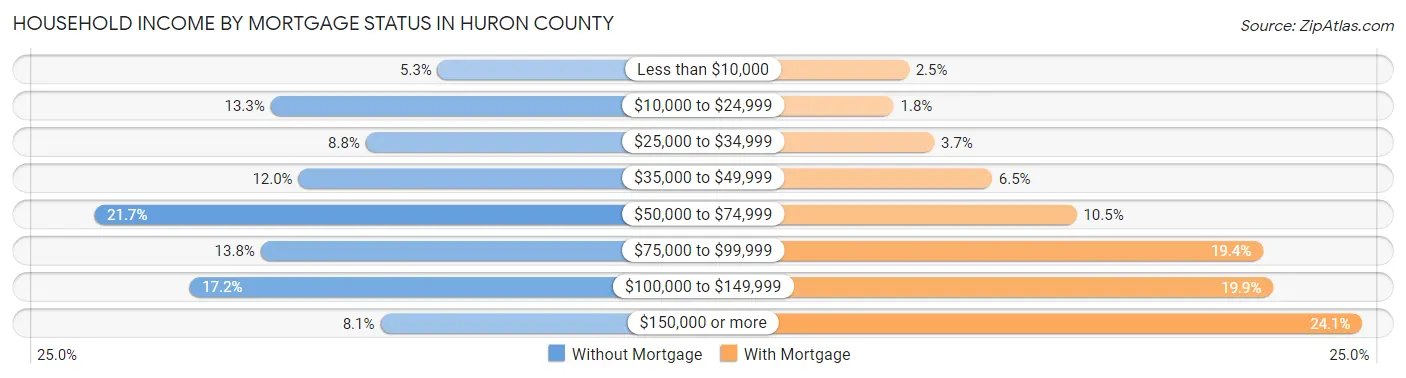
| Household Income | Without Mortgage | With Mortgage |
| Less than $10,000 | 357 (5.3%) | 259 (2.5%) |
| $10,000 to $24,999 | 891 (13.3%) | 185 (1.8%) |
| $25,000 to $34,999 | 587 (8.8%) | 383 (3.7%) |
| $35,000 to $49,999 | 802 (12.0%) | 665 (6.5%) |
| $50,000 to $74,999 | 1,454 (21.7%) | 1,078 (10.5%) |
| $75,000 to $99,999 | 922 (13.8%) | 1,989 (19.4%) |
| $100,000 to $149,999 | 1,150 (17.2%) | 2,039 (19.9%) |
| $150,000 or more | 540 (8.1%) | 2,473 (24.1%) |
| Total | 6,703 (100.0%) | 10,249 (100.0%) |
Property Value to Household Income Ratio in Huron County
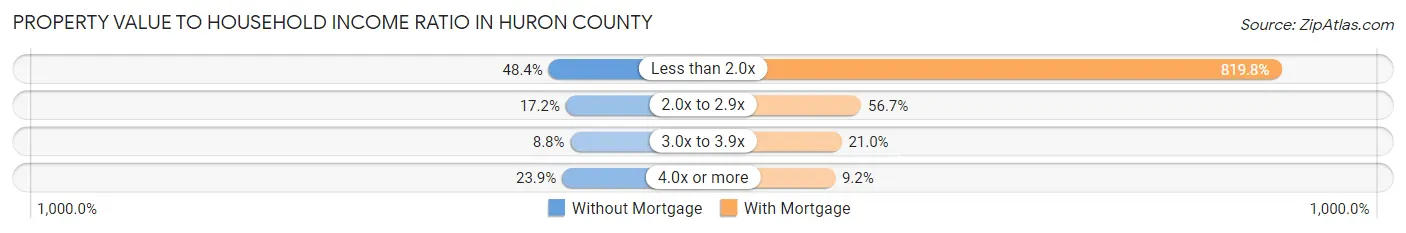
| Value-to-Income Ratio | Without Mortgage | With Mortgage |
| Less than 2.0x | 3,242 (48.4%) | 84,022 (819.8%) |
| 2.0x to 2.9x | 1,154 (17.2%) | 5,808 (56.7%) |
| 3.0x to 3.9x | 591 (8.8%) | 2,148 (21.0%) |
| 4.0x or more | 1,604 (23.9%) | 942 (9.2%) |
| Total | 6,703 (100.0%) | 10,249 (100.0%) |
Real Estate Taxes by Mortgage Status in Huron County
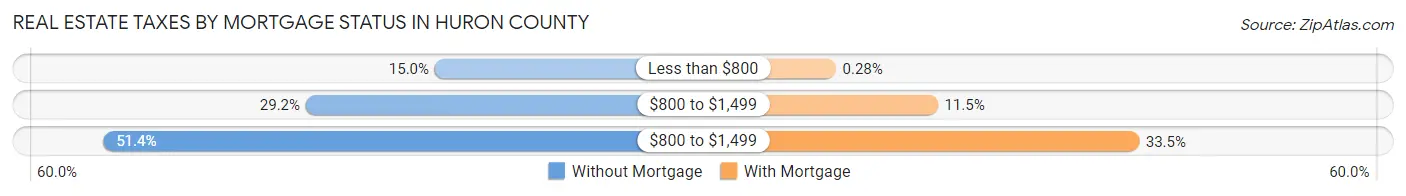
| Property Taxes | Without Mortgage | With Mortgage |
| Less than $800 | 1,008 (15.0%) | 29 (0.3%) |
| $800 to $1,499 | 1,956 (29.2%) | 1,174 (11.5%) |
| $800 to $1,499 | 3,444 (51.4%) | 3,434 (33.5%) |
| Total | 6,703 (100.0%) | 10,249 (100.0%) |
Health & Disability in Huron County
Health Insurance Coverage by Age in Huron County
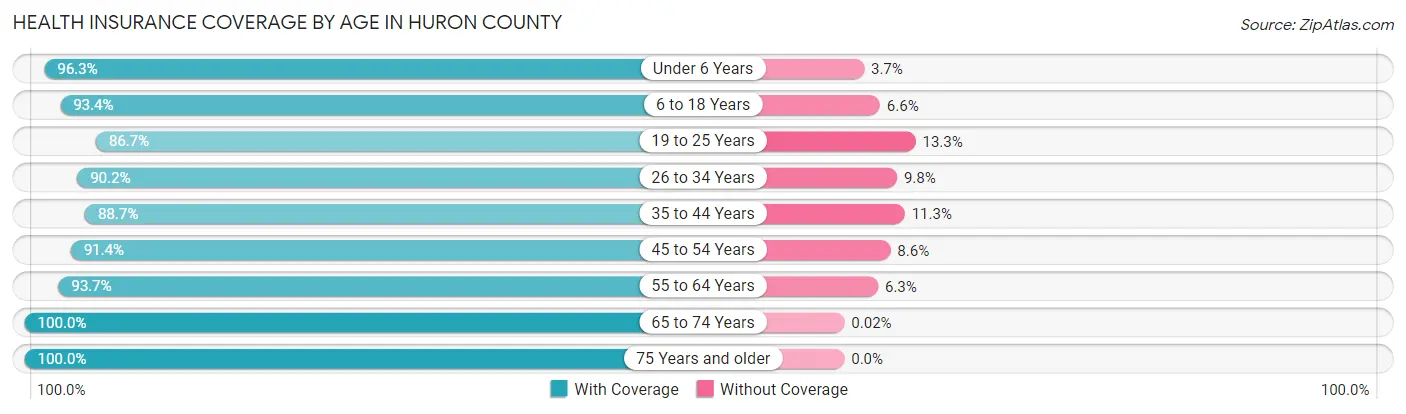
| Age Bracket | With Coverage | Without Coverage |
| Under 6 Years | 3,982 (96.3%) | 152 (3.7%) |
| 6 to 18 Years | 10,004 (93.4%) | 711 (6.6%) |
| 19 to 25 Years | 3,864 (86.7%) | 592 (13.3%) |
| 26 to 34 Years | 5,700 (90.2%) | 621 (9.8%) |
| 35 to 44 Years | 6,198 (88.7%) | 787 (11.3%) |
| 45 to 54 Years | 6,651 (91.4%) | 626 (8.6%) |
| 55 to 64 Years | 7,510 (93.7%) | 504 (6.3%) |
| 65 to 74 Years | 6,340 (100.0%) | 1 (0.0%) |
| 75 Years and older | 3,786 (100.0%) | 0 (0.0%) |
| Total | 54,035 (93.1%) | 3,994 (6.9%) |
Health Insurance Coverage by Citizenship Status in Huron County
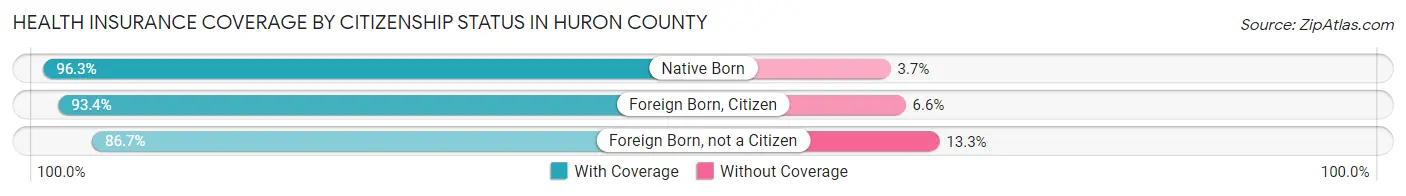
| Citizenship Status | With Coverage | Without Coverage |
| Native Born | 3,982 (96.3%) | 152 (3.7%) |
| Foreign Born, Citizen | 10,004 (93.4%) | 711 (6.6%) |
| Foreign Born, not a Citizen | 3,864 (86.7%) | 592 (13.3%) |
Health Insurance Coverage by Household Income in Huron County
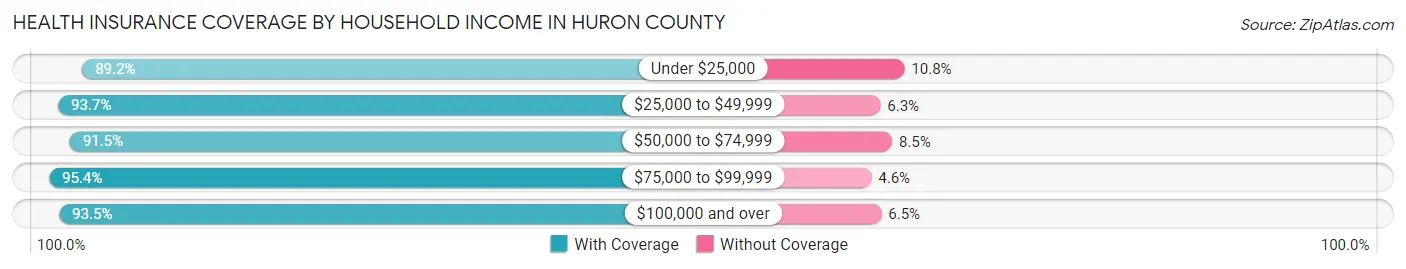
| Household Income | With Coverage | Without Coverage |
| Under $25,000 | 5,036 (89.2%) | 610 (10.8%) |
| $25,000 to $49,999 | 9,707 (93.7%) | 651 (6.3%) |
| $50,000 to $74,999 | 10,696 (91.5%) | 991 (8.5%) |
| $75,000 to $99,999 | 10,215 (95.4%) | 492 (4.6%) |
| $100,000 and over | 18,036 (93.5%) | 1,249 (6.5%) |
Public vs Private Health Insurance Coverage by Age in Huron County
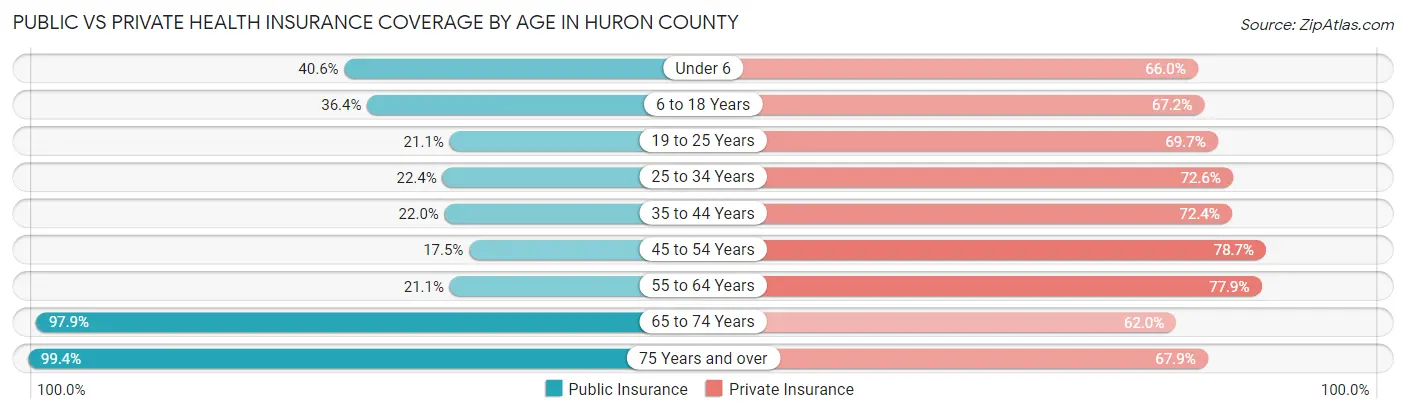
| Age Bracket | Public Insurance | Private Insurance |
| Under 6 | 1,680 (40.6%) | 2,729 (66.0%) |
| 6 to 18 Years | 3,899 (36.4%) | 7,204 (67.2%) |
| 19 to 25 Years | 940 (21.1%) | 3,107 (69.7%) |
| 25 to 34 Years | 1,417 (22.4%) | 4,586 (72.6%) |
| 35 to 44 Years | 1,539 (22.0%) | 5,054 (72.4%) |
| 45 to 54 Years | 1,272 (17.5%) | 5,727 (78.7%) |
| 55 to 64 Years | 1,689 (21.1%) | 6,240 (77.9%) |
| 65 to 74 Years | 6,210 (97.9%) | 3,934 (62.0%) |
| 75 Years and over | 3,763 (99.4%) | 2,570 (67.9%) |
| Total | 22,409 (38.6%) | 41,151 (70.9%) |
Disability Status by Sex by Age in Huron County
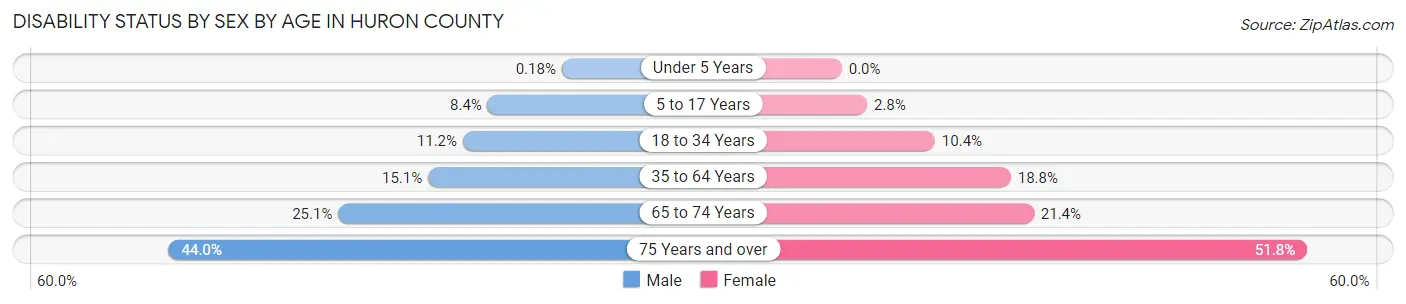
| Age Bracket | Male | Female |
| Under 5 Years | 3 (0.2%) | 0 (0.0%) |
| 5 to 17 Years | 451 (8.4%) | 143 (2.8%) |
| 18 to 34 Years | 685 (11.2%) | 581 (10.4%) |
| 35 to 64 Years | 1,672 (15.1%) | 2,105 (18.8%) |
| 65 to 74 Years | 768 (25.1%) | 701 (21.4%) |
| 75 Years and over | 709 (44.0%) | 1,126 (51.8%) |
Disability Class by Sex by Age in Huron County
Disability Class: Hearing Difficulty
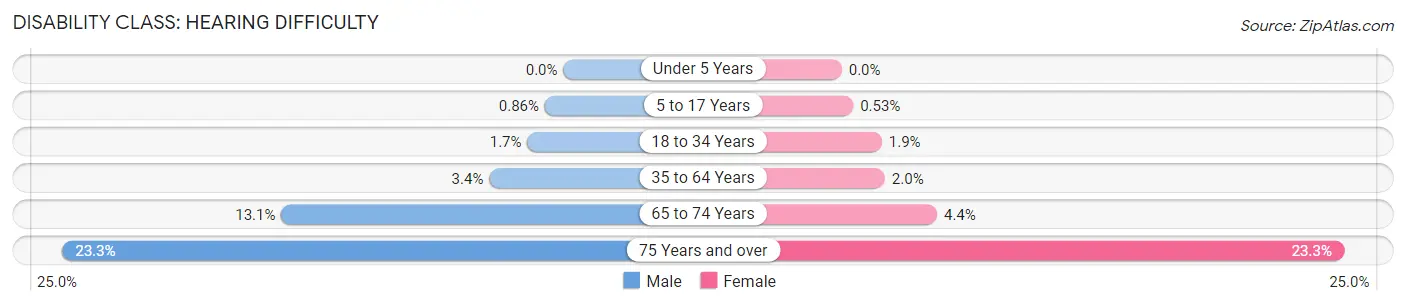
| Age Bracket | Male | Female |
| Under 5 Years | 0 (0.0%) | 0 (0.0%) |
| 5 to 17 Years | 46 (0.9%) | 27 (0.5%) |
| 18 to 34 Years | 102 (1.7%) | 104 (1.9%) |
| 35 to 64 Years | 382 (3.4%) | 224 (2.0%) |
| 65 to 74 Years | 401 (13.1%) | 145 (4.4%) |
| 75 Years and over | 375 (23.3%) | 506 (23.3%) |
Disability Class: Vision Difficulty
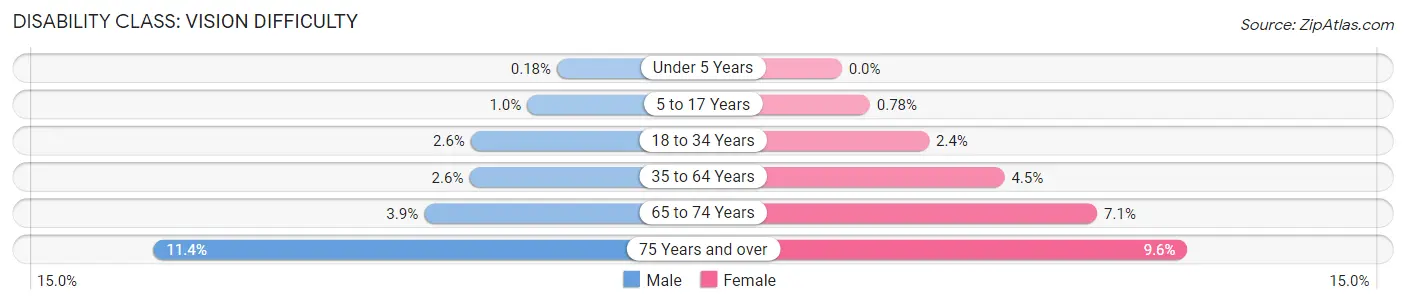
| Age Bracket | Male | Female |
| Under 5 Years | 3 (0.2%) | 0 (0.0%) |
| 5 to 17 Years | 54 (1.0%) | 40 (0.8%) |
| 18 to 34 Years | 158 (2.6%) | 136 (2.4%) |
| 35 to 64 Years | 291 (2.6%) | 506 (4.5%) |
| 65 to 74 Years | 119 (3.9%) | 233 (7.1%) |
| 75 Years and over | 184 (11.4%) | 209 (9.6%) |
Disability Class: Cognitive Difficulty
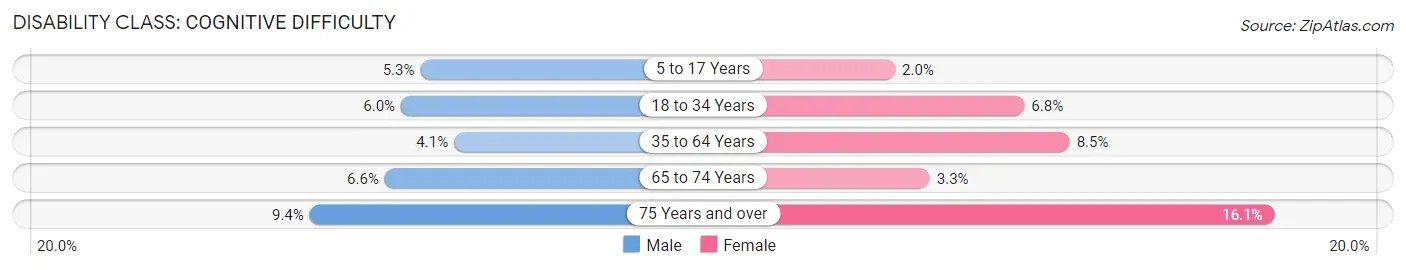
| Age Bracket | Male | Female |
| 5 to 17 Years | 284 (5.3%) | 101 (2.0%) |
| 18 to 34 Years | 369 (6.0%) | 380 (6.8%) |
| 35 to 64 Years | 450 (4.1%) | 946 (8.5%) |
| 65 to 74 Years | 203 (6.6%) | 107 (3.3%) |
| 75 Years and over | 152 (9.4%) | 349 (16.1%) |
Disability Class: Ambulatory Difficulty
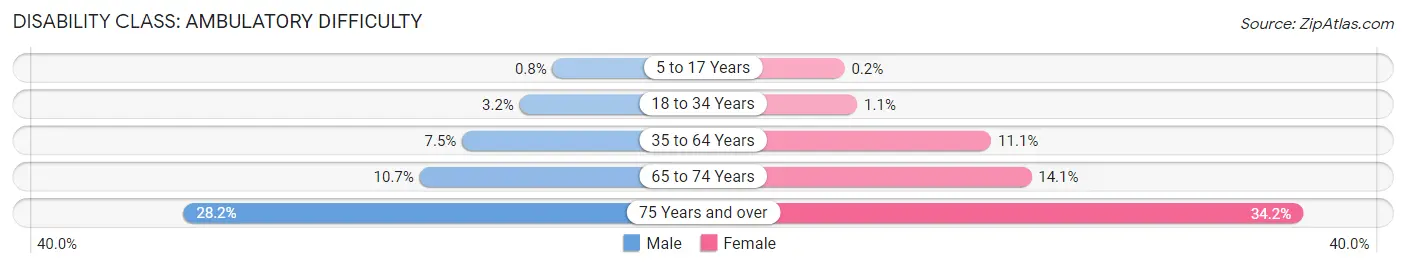
| Age Bracket | Male | Female |
| 5 to 17 Years | 43 (0.8%) | 10 (0.2%) |
| 18 to 34 Years | 198 (3.2%) | 64 (1.1%) |
| 35 to 64 Years | 833 (7.5%) | 1,240 (11.1%) |
| 65 to 74 Years | 327 (10.7%) | 461 (14.1%) |
| 75 Years and over | 455 (28.2%) | 744 (34.2%) |
Disability Class: Self-Care Difficulty
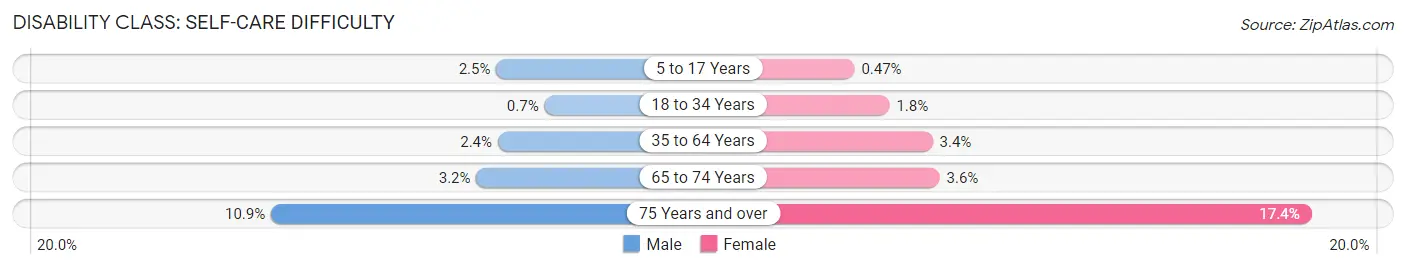
| Age Bracket | Male | Female |
| 5 to 17 Years | 133 (2.5%) | 24 (0.5%) |
| 18 to 34 Years | 43 (0.7%) | 99 (1.8%) |
| 35 to 64 Years | 270 (2.4%) | 377 (3.4%) |
| 65 to 74 Years | 99 (3.2%) | 119 (3.6%) |
| 75 Years and over | 175 (10.8%) | 379 (17.4%) |
Technology Access in Huron County
Computing Device Access in Huron County
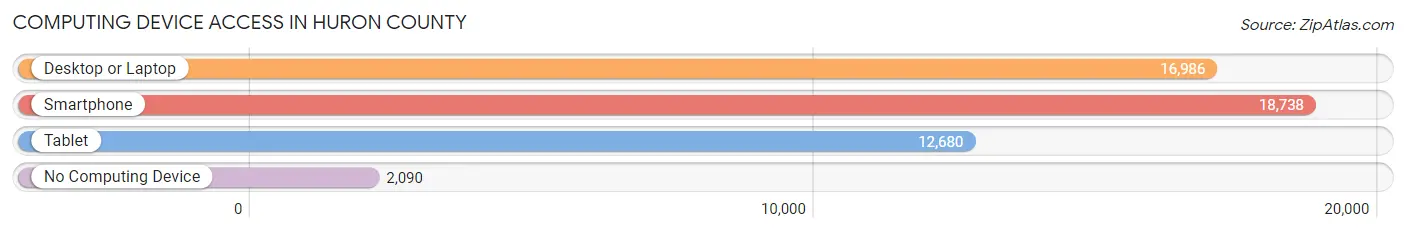
| Device Type | # Households | % Households |
| Desktop or Laptop | 16,986 | 73.6% |
| Smartphone | 18,738 | 81.1% |
| Tablet | 12,680 | 54.9% |
| No Computing Device | 2,090 | 9.0% |
| Total | 23,096 | 100.0% |
Internet Access in Huron County
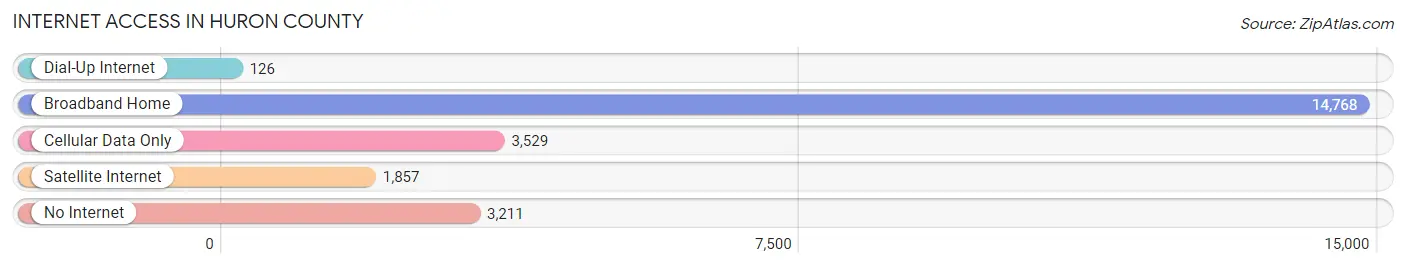
| Internet Type | # Households | % Households |
| Dial-Up Internet | 126 | 0.5% |
| Broadband Home | 14,768 | 63.9% |
| Cellular Data Only | 3,529 | 15.3% |
| Satellite Internet | 1,857 | 8.0% |
| No Internet | 3,211 | 13.9% |
| Total | 23,096 | 100.0% |
Huron County Summary
Huron County is located in the north central region of Ohio, along the shores of Lake Erie. It is bordered by Erie, Lorain, Ashland, Richland, Crawford, and Seneca counties. The county seat is Norwalk, and the largest city is Willard. The county was established in 1809 and named after the Huron Indians, who were the original inhabitants of the area.
Geography
Huron County covers an area of 545 square miles, making it the 33rd largest county in Ohio. The county is mostly flat, with some rolling hills in the northern and western parts. The terrain is mostly agricultural, with some wooded areas. The county is drained by the Huron River, which flows through the county from north to south. The county is also home to several small lakes, including Lake Erie, which forms the county's eastern border.
Climate
Huron County has a humid continental climate, with cold winters and hot, humid summers. The average annual temperature is around 50°F, with average highs in the summer reaching around 80°F and average lows in the winter reaching around 20°F. The average annual precipitation is around 40 inches, with most of it falling in the spring and summer months.
Demographics
As of the 2010 census, Huron County had a population of 59,626. The population density was 109 people per square mile. The racial makeup of the county was 94.3% White, 2.3% African American, 0.4% Native American, 0.7% Asian, 0.1% Pacific Islander, 0.7% from other races, and 1.5% from two or more races. Hispanic or Latino of any race were 2.2% of the population.
Economy
Agriculture is the main economic activity in Huron County. The county is home to several large farms, and the main crops grown are corn, soybeans, wheat, and hay. Livestock production is also important, with dairy and beef cattle being the main animals raised.
Manufacturing is also an important part of the county's economy. The main industries are automotive, plastics, and food processing. The county is also home to several large companies, including Whirlpool Corporation, which has a large manufacturing plant in Clyde.
The county is also home to several tourist attractions, including the Huron County Fairgrounds, the Huron County Historical Society Museum, and the Huron County Nature Center.
Conclusion
Huron County is a rural county located in north central Ohio, along the shores of Lake Erie. The county is mostly agricultural, with some manufacturing and tourism. The county is home to several large farms, and the main crops grown are corn, soybeans, wheat, and hay. Manufacturing is also an important part of the county's economy, with the main industries being automotive, plastics, and food processing. The county is also home to several tourist attractions, including the Huron County Fairgrounds, the Huron County Historical Society Museum, and the Huron County Nature Center.
Common Questions
What is Per Capita Income in Huron County?
Per Capita income in Huron County is $30,792.
What is the Median Family Income in Huron County?
Median Family Income in Huron County is $76,785.
What is the Median Household income in Huron County?
Median Household Income in Huron County is $64,144.
What is Income or Wage Gap in Huron County?
Income or Wage Gap in Huron County is 31.9%.
Women in Huron County earn 68.1 cents for every dollar earned by a man.
What is Family Income Deficit in Huron County?
Family Income Deficit in Huron County is $9,566.
Families that are below poverty line in Huron County earn $9,566 less on average than the poverty threshold level.
What is Inequality or Gini Index in Huron County?
Inequality or Gini Index in Huron County is 0.40.
What is the Total Population of Huron County?
Total Population of Huron County is 58,518.
What is the Total Male Population of Huron County?
Total Male Population of Huron County is 29,037.
What is the Total Female Population of Huron County?
Total Female Population of Huron County is 29,481.
What is the Ratio of Males per 100 Females in Huron County?
There are 98.49 Males per 100 Females in Huron County.
What is the Ratio of Females per 100 Males in Huron County?
There are 101.53 Females per 100 Males in Huron County.
What is the Median Population Age in Huron County?
Median Population Age in Huron County is 40.1 Years.
What is the Average Family Size in Huron County
Average Family Size in Huron County is 3.1 People.
What is the Average Household Size in Huron County
Average Household Size in Huron County is 2.5 People.
How Large is the Labor Force in Huron County?
There are 28,640 People in the Labor Forcein in Huron County.
What is the Percentage of People in the Labor Force in Huron County?
61.9% of People are in the Labor Force in Huron County.
What is the Unemployment Rate in Huron County?
Unemployment Rate in Huron County is 4.4%.