Hancock County, OH Map & Demographics
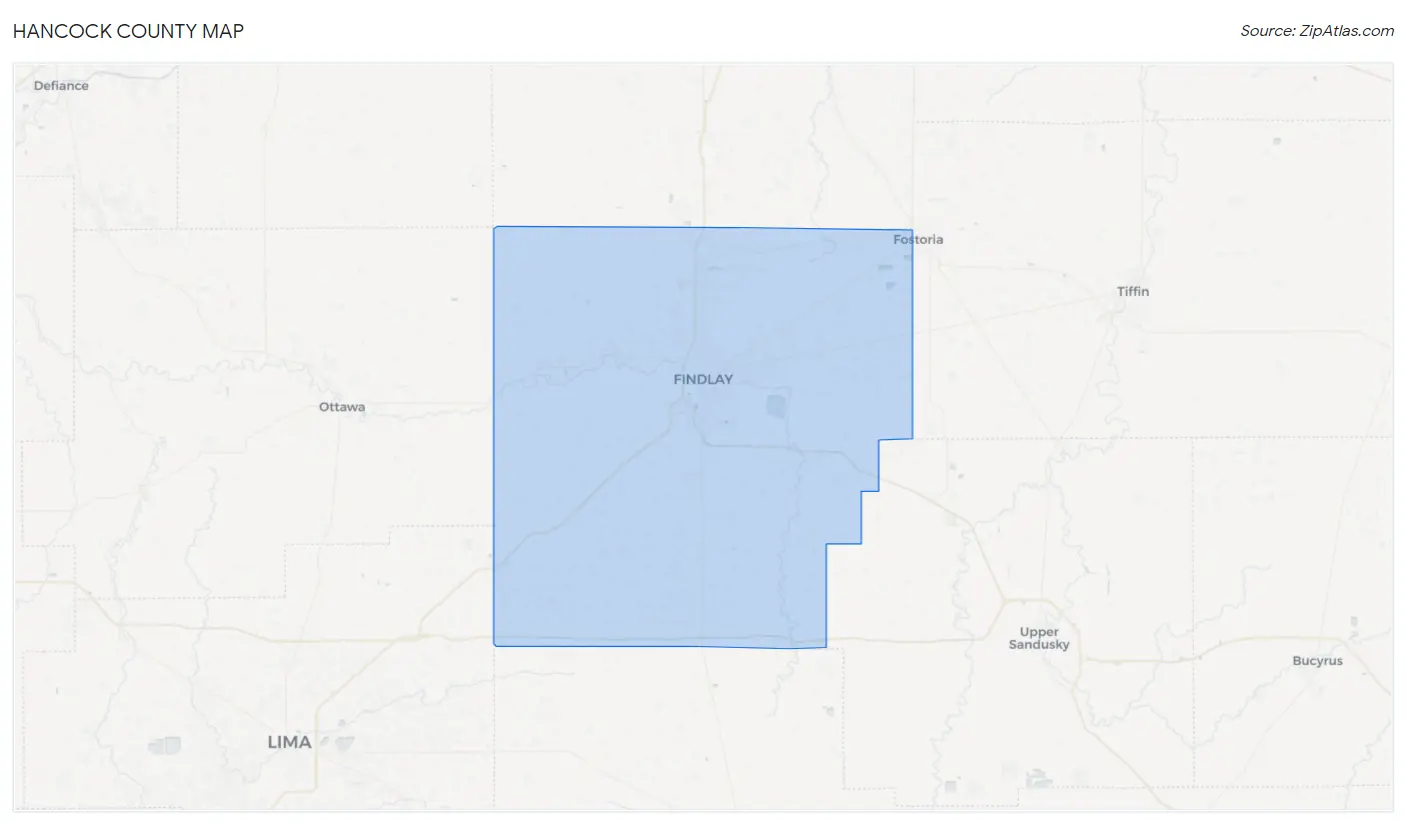
Hancock County Map
Hancock County Overview
$37,479
PER CAPITA INCOME
$88,135
AVG FAMILY INCOME
$67,006
AVG HOUSEHOLD INCOME
34.1%
WAGE / INCOME GAP [ % ]
65.9¢/ $1
WAGE / INCOME GAP [ $ ]
$11,058
FAMILY INCOME DEFICIT
0.44
INEQUALITY / GINI INDEX
75,072
TOTAL POPULATION
37,079
MALE POPULATION
37,993
FEMALE POPULATION
97.59
MALES / 100 FEMALES
102.47
FEMALES / 100 MALES
39.4
MEDIAN AGE
2.9
AVG FAMILY SIZE
2.3
AVG HOUSEHOLD SIZE
39,071
LABOR FORCE [ PEOPLE ]
64.5%
PERCENT IN LABOR FORCE
3.7%
UNEMPLOYMENT RATE
Income in Hancock County
Income Overview in Hancock County
Per Capita Income in Hancock County is $37,479, while median incomes of families and households are $88,135 and $67,006 respectively.
| Characteristic | Number | Measure |
| Per Capita Income | 75,072 | $37,479 |
| Median Family Income | 19,218 | $88,135 |
| Mean Family Income | 19,218 | $108,520 |
| Median Household Income | 31,343 | $67,006 |
| Mean Household Income | 31,343 | $88,362 |
| Income Deficit | 19,218 | $11,058 |
| Wage / Income Gap (%) | 75,072 | 34.07% |
| Wage / Income Gap ($) | 75,072 | 65.93¢ per $1 |
| Gini / Inequality Index | 75,072 | 0.44 |
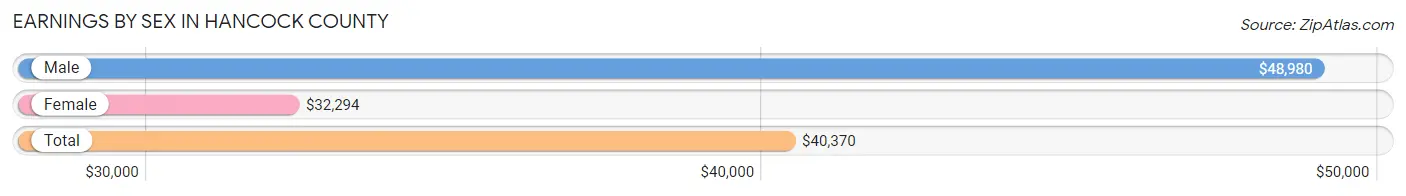
Earnings by Sex in Hancock County
Average Earnings in Hancock County are $40,370, $48,980 for men and $32,294 for women, a difference of 34.1%.
| Sex | Number | Average Earnings |
| Male | 21,877 (53.0%) | $48,980 |
| Female | 19,371 (47.0%) | $32,294 |
| Total | 41,248 (100.0%) | $40,370 |
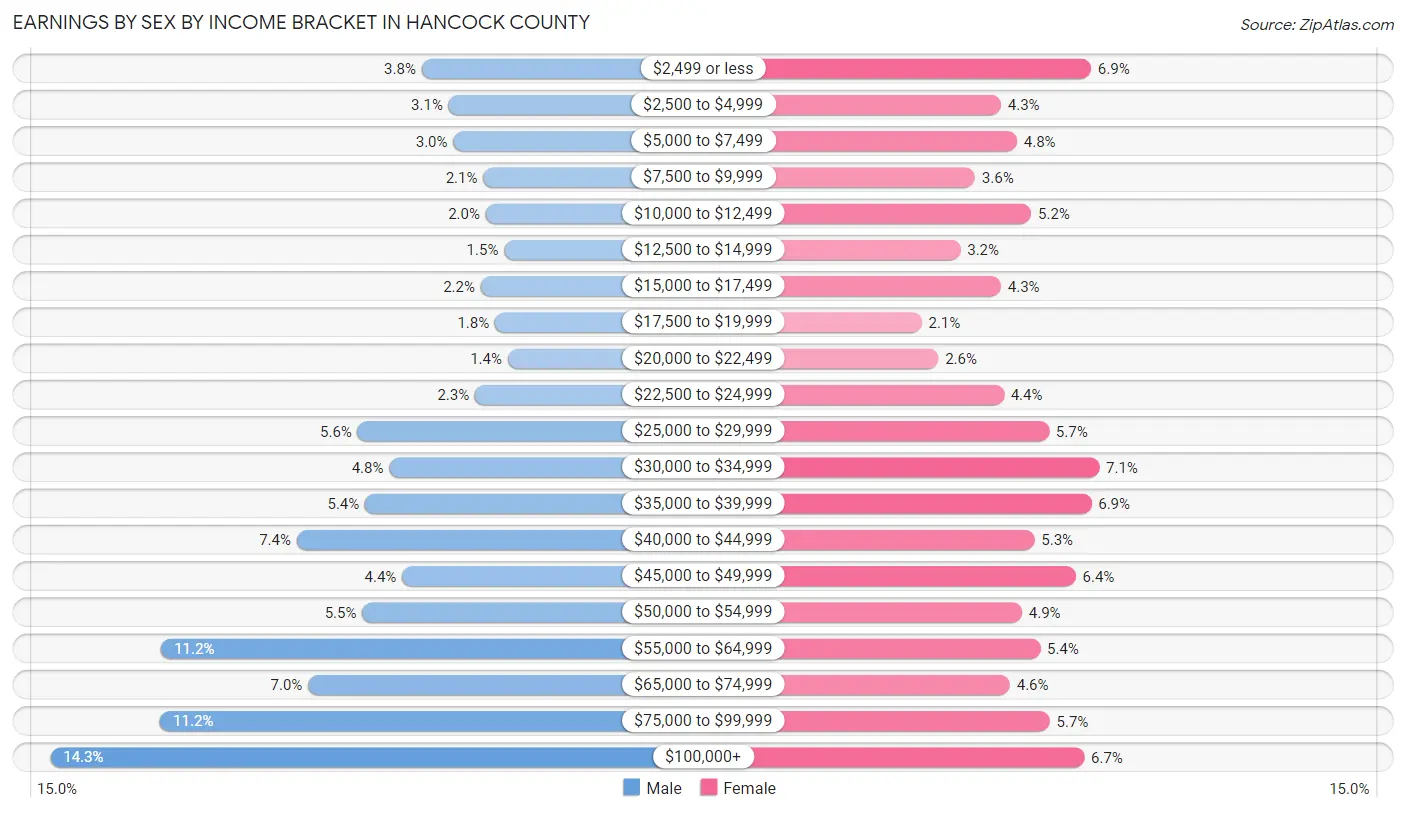
Earnings by Sex by Income Bracket in Hancock County
The most common earnings brackets in Hancock County are $100,000+ for men (3,123 | 14.3%) and $30,000 to $34,999 for women (1,373 | 7.1%).
| Income | Male | Female |
| $2,499 or less | 841 (3.8%) | 1,329 (6.9%) |
| $2,500 to $4,999 | 673 (3.1%) | 839 (4.3%) |
| $5,000 to $7,499 | 646 (2.9%) | 926 (4.8%) |
| $7,500 to $9,999 | 461 (2.1%) | 698 (3.6%) |
| $10,000 to $12,499 | 446 (2.0%) | 1,003 (5.2%) |
| $12,500 to $14,999 | 333 (1.5%) | 618 (3.2%) |
| $15,000 to $17,499 | 478 (2.2%) | 839 (4.3%) |
| $17,500 to $19,999 | 389 (1.8%) | 406 (2.1%) |
| $20,000 to $22,499 | 310 (1.4%) | 498 (2.6%) |
| $22,500 to $24,999 | 513 (2.3%) | 855 (4.4%) |
| $25,000 to $29,999 | 1,234 (5.6%) | 1,101 (5.7%) |
| $30,000 to $34,999 | 1,039 (4.8%) | 1,373 (7.1%) |
| $35,000 to $39,999 | 1,188 (5.4%) | 1,331 (6.9%) |
| $40,000 to $44,999 | 1,609 (7.3%) | 1,021 (5.3%) |
| $45,000 to $49,999 | 960 (4.4%) | 1,246 (6.4%) |
| $50,000 to $54,999 | 1,206 (5.5%) | 953 (4.9%) |
| $55,000 to $64,999 | 2,442 (11.2%) | 1,051 (5.4%) |
| $65,000 to $74,999 | 1,537 (7.0%) | 888 (4.6%) |
| $75,000 to $99,999 | 2,449 (11.2%) | 1,104 (5.7%) |
| $100,000+ | 3,123 (14.3%) | 1,292 (6.7%) |
| Total | 21,877 (100.0%) | 19,371 (100.0%) |
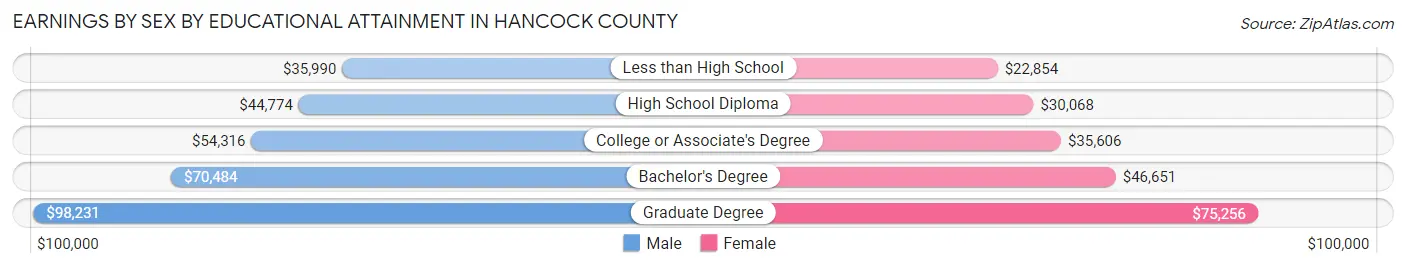
Earnings by Sex by Educational Attainment in Hancock County
Average earnings in Hancock County are $55,742 for men and $38,536 for women, a difference of 30.9%. Men with an educational attainment of graduate degree enjoy the highest average annual earnings of $98,231, while those with less than high school education earn the least with $35,990. Women with an educational attainment of graduate degree earn the most with the average annual earnings of $75,256, while those with less than high school education have the smallest earnings of $22,854.
| Educational Attainment | Male Income | Female Income |
| Less than High School | $35,990 | $22,854 |
| High School Diploma | $44,774 | $30,068 |
| College or Associate's Degree | $54,316 | $35,606 |
| Bachelor's Degree | $70,484 | $46,651 |
| Graduate Degree | $98,231 | $75,256 |
| Total | $55,742 | $38,536 |
Family Income in Hancock County
Family Income Brackets in Hancock County
According to the Hancock County family income data, there are 4,382 families falling into the $100,000 to $149,999 income range, which is the most common income bracket and makes up 22.8% of all families. Conversely, the $10,000 to $14,999 income bracket is the least frequent group with only 307 families (1.6%) belonging to this category.
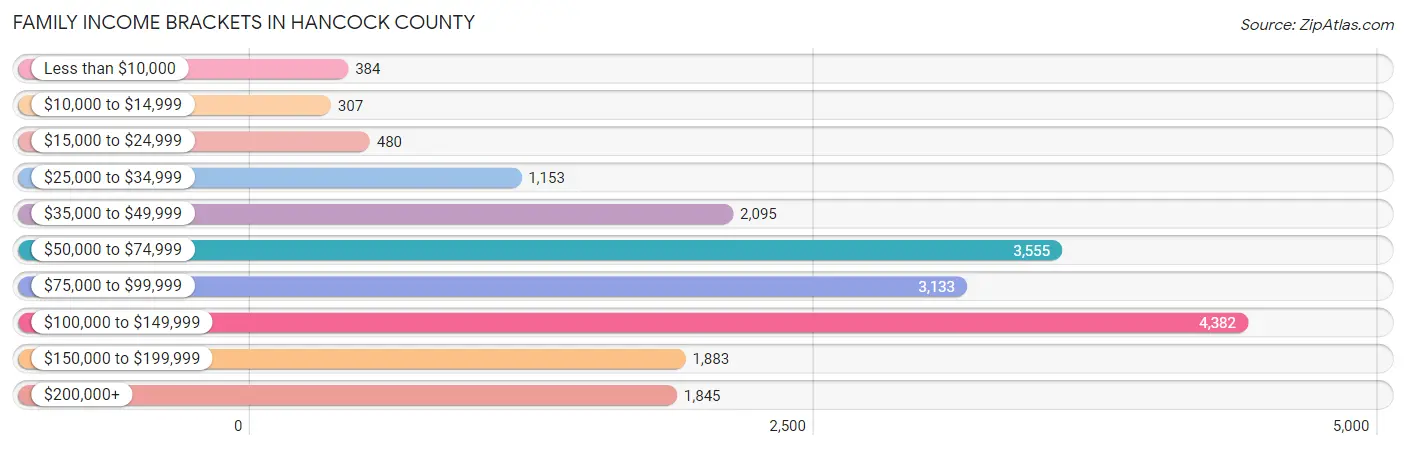
| Income Bracket | # Families | % Families |
| Less than $10,000 | 384 | 2.0% |
| $10,000 to $14,999 | 307 | 1.6% |
| $15,000 to $24,999 | 480 | 2.5% |
| $25,000 to $34,999 | 1,153 | 6.0% |
| $35,000 to $49,999 | 2,095 | 10.9% |
| $50,000 to $74,999 | 3,555 | 18.5% |
| $75,000 to $99,999 | 3,133 | 16.3% |
| $100,000 to $149,999 | 4,382 | 22.8% |
| $150,000 to $199,999 | 1,883 | 9.8% |
| $200,000+ | 1,845 | 9.6% |
Family Income by Famaliy Size in Hancock County
7+ person families (139 | 0.7%) account for the highest median family income in Hancock County with $135,313 per family, while 2-person families (9,839 | 51.2%) have the highest median income of $38,354 per family member.
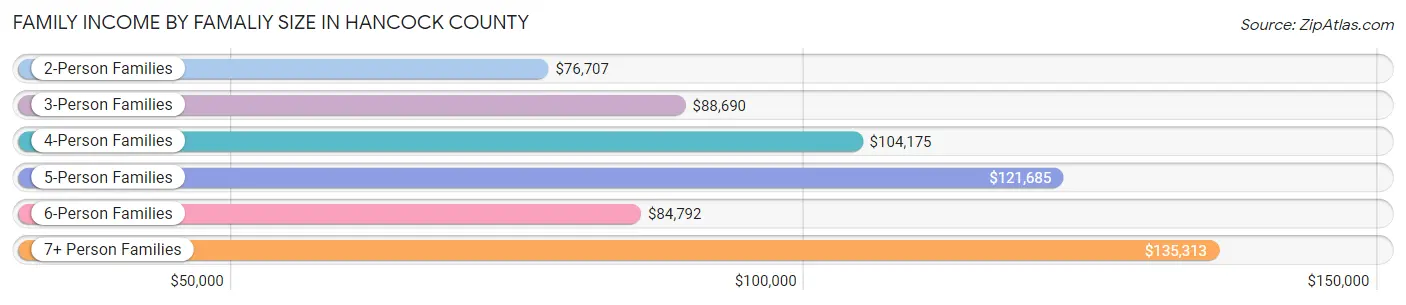
| Income Bracket | # Families | Median Income |
| 2-Person Families | 9,839 (51.2%) | $76,707 |
| 3-Person Families | 3,840 (20.0%) | $88,690 |
| 4-Person Families | 3,294 (17.1%) | $104,175 |
| 5-Person Families | 1,763 (9.2%) | $121,685 |
| 6-Person Families | 343 (1.8%) | $84,792 |
| 7+ Person Families | 139 (0.7%) | $135,313 |
| Total | 19,218 (100.0%) | $88,135 |
Family Income by Number of Earners in Hancock County
The median family income in Hancock County is $88,135, with families comprising 3+ earners (2,120) having the highest median family income of $134,118, while families with no earners (2,736) have the lowest median family income of $49,382, accounting for 11.0% and 14.2% of families, respectively.
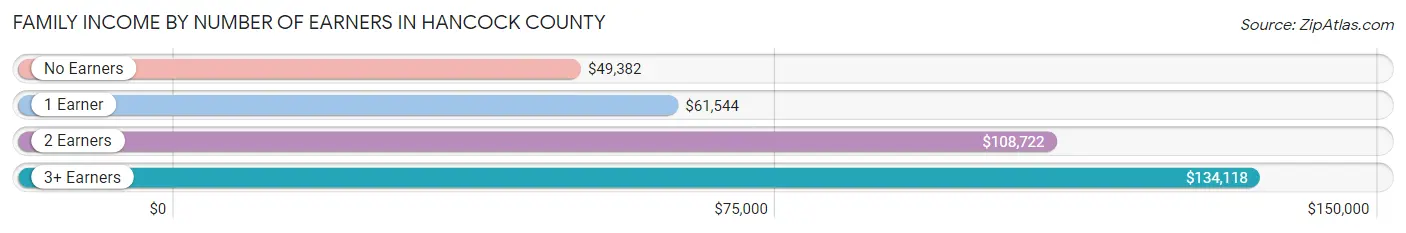
| Number of Earners | # Families | Median Income |
| No Earners | 2,736 (14.2%) | $49,382 |
| 1 Earner | 6,226 (32.4%) | $61,544 |
| 2 Earners | 8,136 (42.3%) | $108,722 |
| 3+ Earners | 2,120 (11.0%) | $134,118 |
| Total | 19,218 (100.0%) | $88,135 |
Household Income in Hancock County
Household Income Brackets in Hancock County
With 5,736 households falling in the category, the $50,000 to $74,999 income range is the most frequent in Hancock County, accounting for 18.3% of all households. In contrast, only 972 households (3.1%) fall into the less than $10,000 income bracket, making it the least populous group.
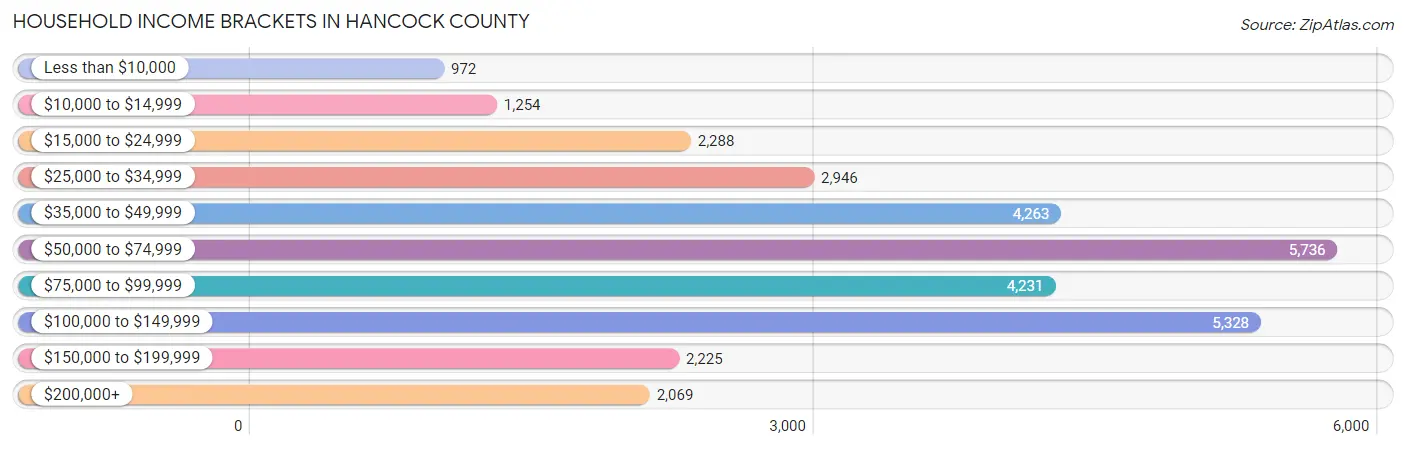
| Income Bracket | # Households | % Households |
| Less than $10,000 | 972 | 3.1% |
| $10,000 to $14,999 | 1,254 | 4.0% |
| $15,000 to $24,999 | 2,288 | 7.3% |
| $25,000 to $34,999 | 2,946 | 9.4% |
| $35,000 to $49,999 | 4,263 | 13.6% |
| $50,000 to $74,999 | 5,736 | 18.3% |
| $75,000 to $99,999 | 4,231 | 13.5% |
| $100,000 to $149,999 | 5,328 | 17.0% |
| $150,000 to $199,999 | 2,225 | 7.1% |
| $200,000+ | 2,069 | 6.6% |
Household Income by Householder Age in Hancock County
The median household income in Hancock County is $67,006, with the highest median household income of $83,739 found in the 45 to 64 years age bracket for the primary householder. A total of 11,224 households (35.8%) fall into this category. Meanwhile, the 15 to 24 years age bracket for the primary householder has the lowest median household income of $29,809, with 1,667 households (5.3%) in this group.
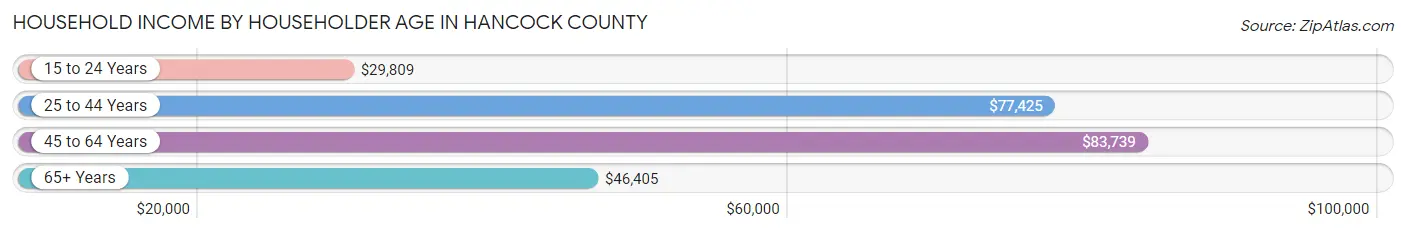
| Income Bracket | # Households | Median Income |
| 15 to 24 Years | 1,667 (5.3%) | $29,809 |
| 25 to 44 Years | 9,757 (31.1%) | $77,425 |
| 45 to 64 Years | 11,224 (35.8%) | $83,739 |
| 65+ Years | 8,695 (27.7%) | $46,405 |
| Total | 31,343 (100.0%) | $67,006 |
Poverty in Hancock County
Income Below Poverty by Sex and Age in Hancock County
With 7.5% poverty level for males and 13.6% for females among the residents of Hancock County, 5 year old males and 18 to 24 year old females are the most vulnerable to poverty, with 78 males (18.4%) and 859 females (29.3%) in their respective age groups living below the poverty level.
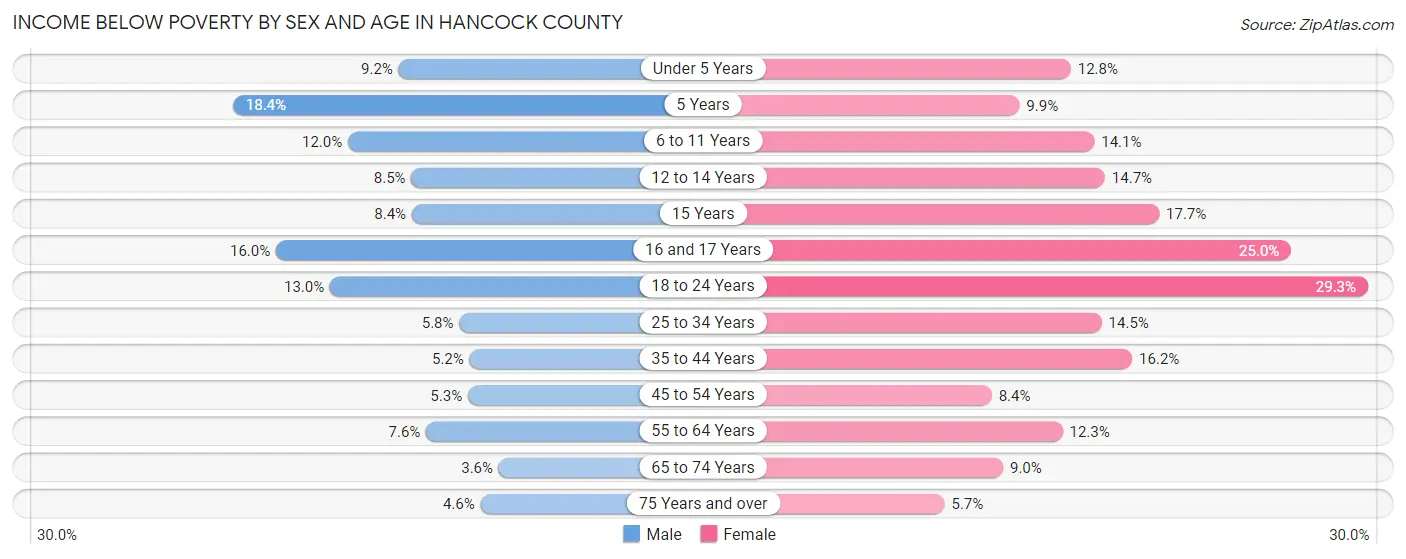
| Age Bracket | Male | Female |
| Under 5 Years | 195 (9.2%) | 301 (12.8%) |
| 5 Years | 78 (18.4%) | 61 (9.9%) |
| 6 to 11 Years | 324 (12.0%) | 345 (14.1%) |
| 12 to 14 Years | 114 (8.5%) | 186 (14.6%) |
| 15 Years | 49 (8.4%) | 76 (17.7%) |
| 16 and 17 Years | 141 (16.0%) | 256 (25.0%) |
| 18 to 24 Years | 440 (13.0%) | 859 (29.3%) |
| 25 to 34 Years | 295 (5.8%) | 680 (14.5%) |
| 35 to 44 Years | 239 (5.2%) | 691 (16.2%) |
| 45 to 54 Years | 247 (5.3%) | 377 (8.4%) |
| 55 to 64 Years | 378 (7.6%) | 608 (12.3%) |
| 65 to 74 Years | 131 (3.6%) | 362 (9.0%) |
| 75 Years and over | 98 (4.6%) | 177 (5.7%) |
| Total | 2,729 (7.5%) | 4,979 (13.6%) |
Income Above Poverty by Sex and Age in Hancock County
According to the poverty statistics in Hancock County, males aged 65 to 74 years and females aged 75 years and over are the age groups that are most secure financially, with 96.4% of males and 94.3% of females in these age groups living above the poverty line.
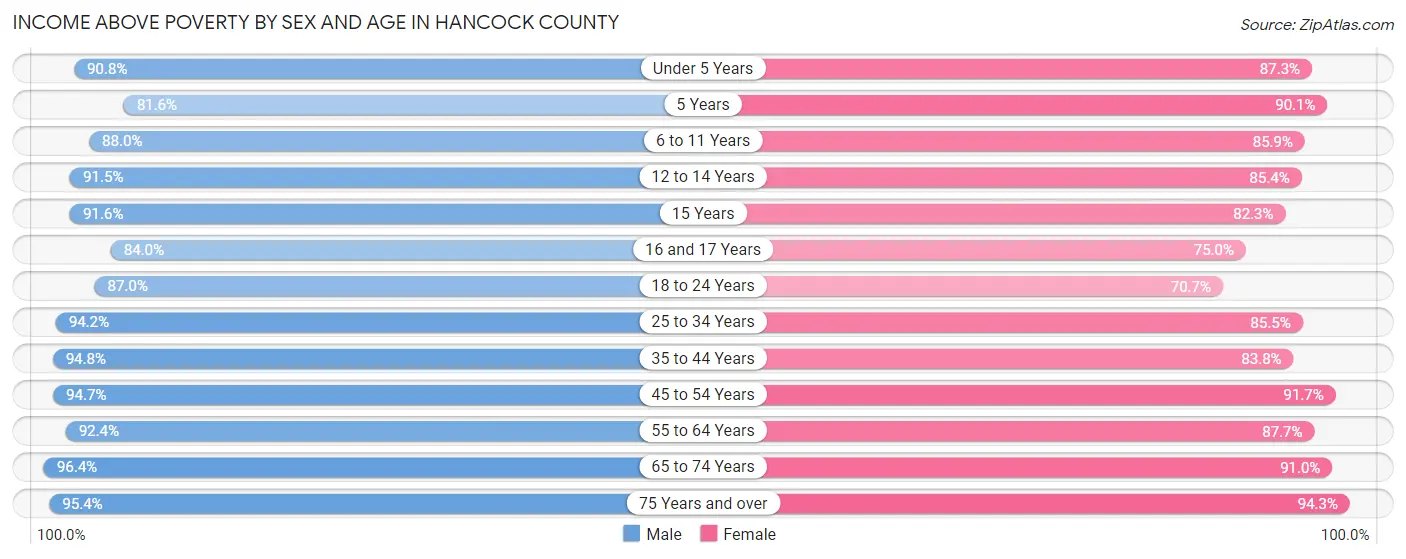
| Age Bracket | Male | Female |
| Under 5 Years | 1,931 (90.8%) | 2,059 (87.3%) |
| 5 Years | 346 (81.6%) | 556 (90.1%) |
| 6 to 11 Years | 2,379 (88.0%) | 2,108 (85.9%) |
| 12 to 14 Years | 1,234 (91.5%) | 1,084 (85.4%) |
| 15 Years | 532 (91.6%) | 354 (82.3%) |
| 16 and 17 Years | 740 (84.0%) | 767 (75.0%) |
| 18 to 24 Years | 2,947 (87.0%) | 2,074 (70.7%) |
| 25 to 34 Years | 4,799 (94.2%) | 4,019 (85.5%) |
| 35 to 44 Years | 4,341 (94.8%) | 3,582 (83.8%) |
| 45 to 54 Years | 4,403 (94.7%) | 4,136 (91.6%) |
| 55 to 64 Years | 4,568 (92.4%) | 4,339 (87.7%) |
| 65 to 74 Years | 3,516 (96.4%) | 3,667 (91.0%) |
| 75 Years and over | 2,026 (95.4%) | 2,916 (94.3%) |
| Total | 33,762 (92.5%) | 31,661 (86.4%) |
Income Below Poverty Among Married-Couple Families in Hancock County
The poverty statistics for married-couple families in Hancock County show that 3.2% or 478 of the total 14,768 families live below the poverty line. Families with 3 or 4 children have the highest poverty rate of 12.6%, comprising of 187 families. On the other hand, families with no children have the lowest poverty rate of 1.5%, which includes 131 families.
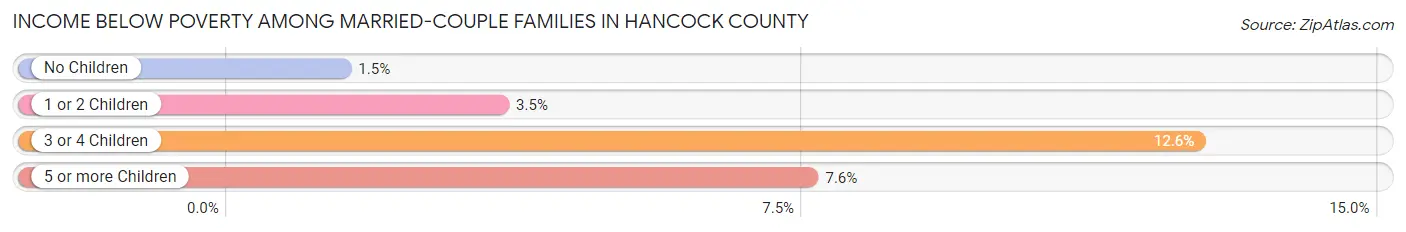
| Children | Above Poverty | Below Poverty |
| No Children | 8,714 (98.5%) | 131 (1.5%) |
| 1 or 2 Children | 4,223 (96.5%) | 155 (3.5%) |
| 3 or 4 Children | 1,292 (87.4%) | 187 (12.6%) |
| 5 or more Children | 61 (92.4%) | 5 (7.6%) |
| Total | 14,290 (96.8%) | 478 (3.2%) |
Income Below Poverty Among Single-Parent Households in Hancock County
According to the poverty data in Hancock County, 6.8% or 98 single-father households and 19.4% or 584 single-mother households are living below the poverty line. Among single-father households, those with 1 or 2 children have the highest poverty rate, with 91 households (12.5%) experiencing poverty. Likewise, among single-mother households, those with 5 or more children have the highest poverty rate, with 11 households (100.0%) falling below the poverty line.
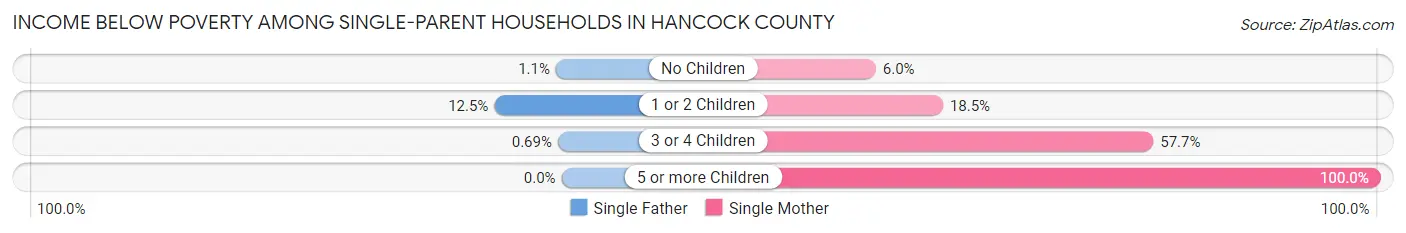
| Children | Single Father | Single Mother |
| No Children | 6 (1.1%) | 62 (6.0%) |
| 1 or 2 Children | 91 (12.5%) | 293 (18.5%) |
| 3 or 4 Children | 1 (0.7%) | 218 (57.7%) |
| 5 or more Children | 0 (0.0%) | 11 (100.0%) |
| Total | 98 (6.8%) | 584 (19.4%) |
Income Below Poverty Among Married-Couple vs Single-Parent Households in Hancock County
The poverty data for Hancock County shows that 478 of the married-couple family households (3.2%) and 682 of the single-parent households (15.3%) are living below the poverty level. Within the married-couple family households, those with 3 or 4 children have the highest poverty rate, with 187 households (12.6%) falling below the poverty line. Among the single-parent households, those with 5 or more children have the highest poverty rate, with 11 household (78.6%) living below poverty.
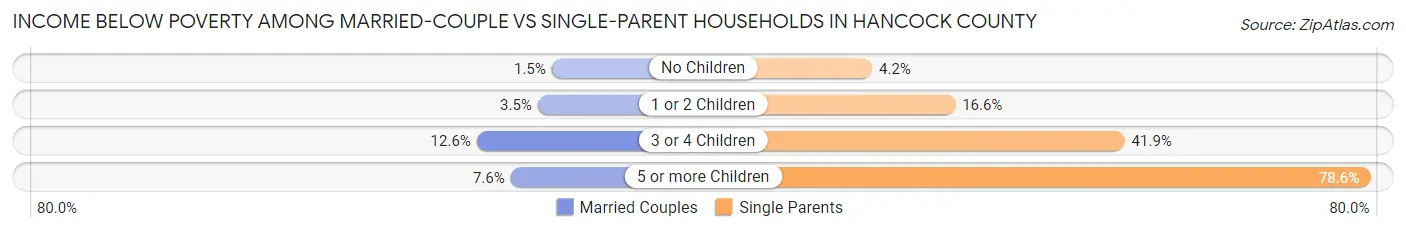
| Children | Married-Couple Families | Single-Parent Households |
| No Children | 131 (1.5%) | 68 (4.2%) |
| 1 or 2 Children | 155 (3.5%) | 384 (16.6%) |
| 3 or 4 Children | 187 (12.6%) | 219 (41.9%) |
| 5 or more Children | 5 (7.6%) | 11 (78.6%) |
| Total | 478 (3.2%) | 682 (15.3%) |
Race in Hancock County
The most populous races in Hancock County are White / Caucasian (68,037 | 90.6%), Hispanic or Latino (4,514 | 6.0%), and Two or more Races (2,573 | 3.4%).
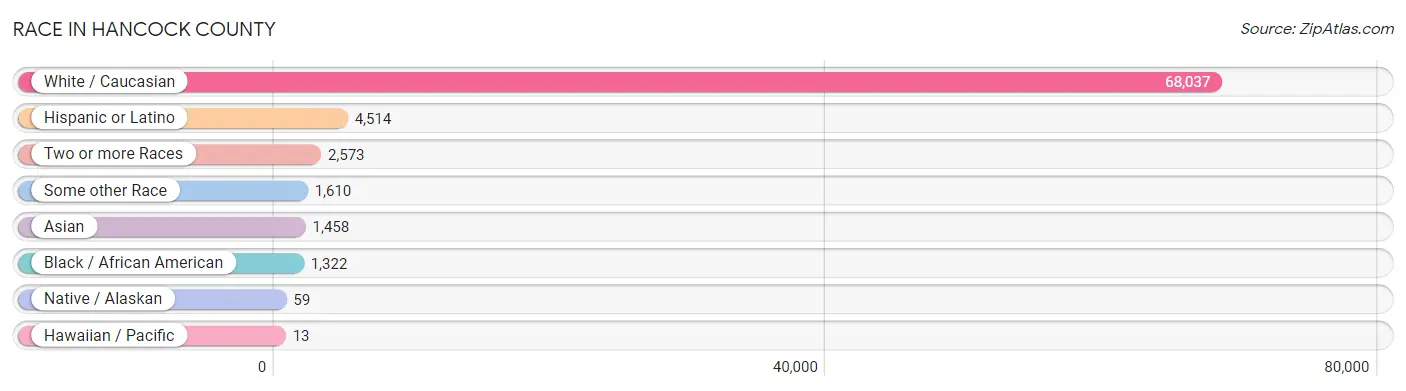
| Race | # Population | % Population |
| Asian | 1,458 | 1.9% |
| Black / African American | 1,322 | 1.8% |
| Hawaiian / Pacific | 13 | 0.0% |
| Hispanic or Latino | 4,514 | 6.0% |
| Native / Alaskan | 59 | 0.1% |
| White / Caucasian | 68,037 | 90.6% |
| Two or more Races | 2,573 | 3.4% |
| Some other Race | 1,610 | 2.1% |
| Total | 75,072 | 100.0% |
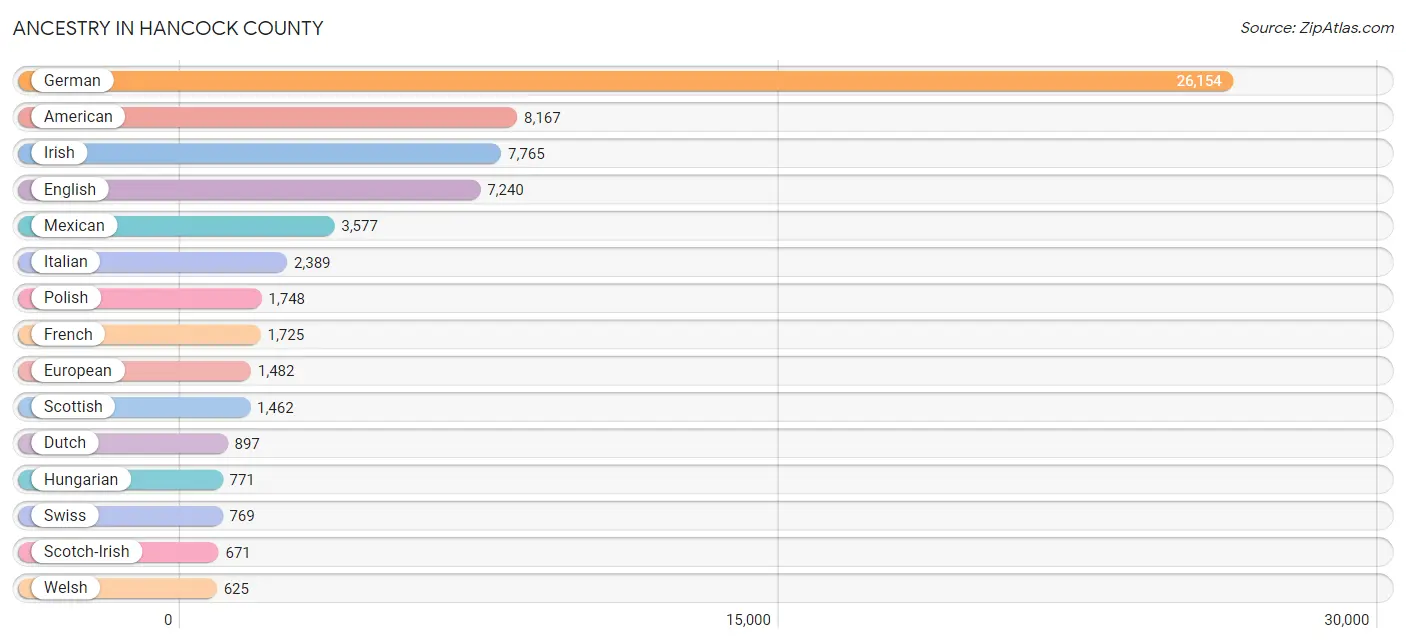
Ancestry in Hancock County
The most populous ancestries reported in Hancock County are German (26,154 | 34.8%), American (8,167 | 10.9%), Irish (7,765 | 10.3%), English (7,240 | 9.6%), and Mexican (3,577 | 4.8%), together accounting for 70.5% of all Hancock County residents.
| Ancestry | # Population | % Population |
| African | 189 | 0.3% |
| American | 8,167 | 10.9% |
| Arab | 473 | 0.6% |
| Armenian | 9 | 0.0% |
| Austrian | 31 | 0.0% |
| Barbadian | 9 | 0.0% |
| Belgian | 231 | 0.3% |
| Bhutanese | 345 | 0.5% |
| Blackfeet | 36 | 0.1% |
| British | 418 | 0.6% |
| British West Indian | 21 | 0.0% |
| Bulgarian | 15 | 0.0% |
| Burmese | 42 | 0.1% |
| Canadian | 37 | 0.1% |
| Carpatho Rusyn | 23 | 0.0% |
| Central American | 149 | 0.2% |
| Cherokee | 114 | 0.2% |
| Chilean | 4 | 0.0% |
| Chippewa | 34 | 0.1% |
| Choctaw | 10 | 0.0% |
| Colombian | 19 | 0.0% |
| Croatian | 39 | 0.1% |
| Cuban | 24 | 0.0% |
| Czech | 303 | 0.4% |
| Czechoslovakian | 66 | 0.1% |
| Danish | 209 | 0.3% |
| Dutch | 897 | 1.2% |
| Eastern European | 175 | 0.2% |
| Ecuadorian | 35 | 0.1% |
| English | 7,240 | 9.6% |
| Ethiopian | 3 | 0.0% |
| European | 1,482 | 2.0% |
| Filipino | 11 | 0.0% |
| Finnish | 116 | 0.2% |
| French | 1,725 | 2.3% |
| French American Indian | 23 | 0.0% |
| French Canadian | 119 | 0.2% |
| German | 26,154 | 34.8% |
| German Russian | 70 | 0.1% |
| Ghanaian | 28 | 0.0% |
| Greek | 461 | 0.6% |
| Guatemalan | 2 | 0.0% |
| Guyanese | 8 | 0.0% |
| Honduran | 49 | 0.1% |
| Hungarian | 771 | 1.0% |
| Icelander | 10 | 0.0% |
| Indian (Asian) | 513 | 0.7% |
| Irish | 7,765 | 10.3% |
| Iroquois | 32 | 0.0% |
| Italian | 2,389 | 3.2% |
| Jamaican | 11 | 0.0% |
| Jordanian | 54 | 0.1% |
| Kenyan | 40 | 0.1% |
| Korean | 206 | 0.3% |
| Lebanese | 112 | 0.2% |
| Liberian | 168 | 0.2% |
| Lithuanian | 72 | 0.1% |
| Lumbee | 16 | 0.0% |
| Luxembourger | 11 | 0.0% |
| Malaysian | 216 | 0.3% |
| Mexican | 3,577 | 4.8% |
| Mexican American Indian | 15 | 0.0% |
| Mongolian | 21 | 0.0% |
| Northern European | 58 | 0.1% |
| Norwegian | 170 | 0.2% |
| Ottawa | 5 | 0.0% |
| Palestinian | 6 | 0.0% |
| Panamanian | 5 | 0.0% |
| Pennsylvania German | 91 | 0.1% |
| Peruvian | 21 | 0.0% |
| Polish | 1,748 | 2.3% |
| Portuguese | 109 | 0.2% |
| Puerto Rican | 371 | 0.5% |
| Romanian | 84 | 0.1% |
| Russian | 85 | 0.1% |
| Salvadoran | 93 | 0.1% |
| Scandinavian | 228 | 0.3% |
| Scotch-Irish | 671 | 0.9% |
| Scottish | 1,462 | 1.9% |
| Serbian | 33 | 0.0% |
| Sioux | 2 | 0.0% |
| Slavic | 8 | 0.0% |
| Slovak | 247 | 0.3% |
| Slovene | 20 | 0.0% |
| South American | 192 | 0.3% |
| Spaniard | 30 | 0.0% |
| Spanish | 89 | 0.1% |
| Spanish American | 24 | 0.0% |
| Sri Lankan | 171 | 0.2% |
| Subsaharan African | 428 | 0.6% |
| Swedish | 325 | 0.4% |
| Swiss | 769 | 1.0% |
| Syrian | 42 | 0.1% |
| Thai | 184 | 0.3% |
| Tohono O'Odham | 1 | 0.0% |
| Tongan | 13 | 0.0% |
| Turkish | 11 | 0.0% |
| Ukrainian | 117 | 0.2% |
| Venezuelan | 113 | 0.2% |
| Welsh | 625 | 0.8% |
| Yugoslavian | 15 | 0.0% | View All 101 Rows |
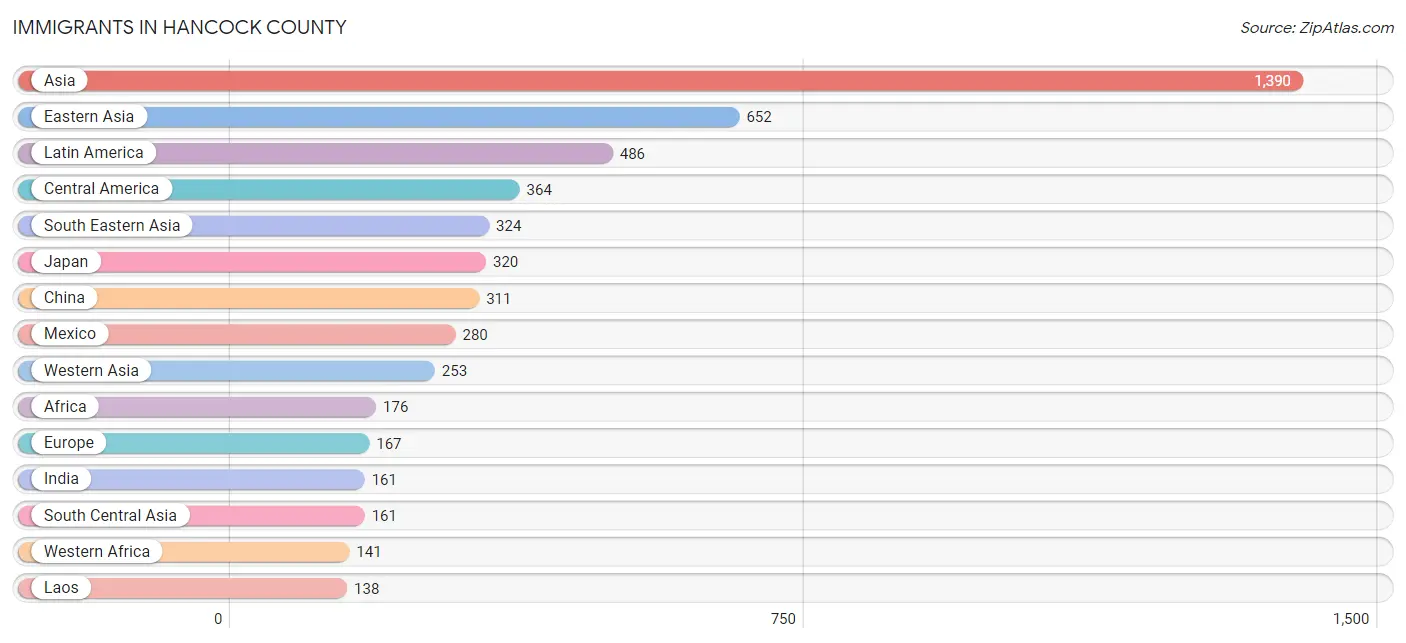
Immigrants in Hancock County
The most numerous immigrant groups reported in Hancock County came from Asia (1,390 | 1.8%), Eastern Asia (652 | 0.9%), Latin America (486 | 0.6%), Central America (364 | 0.5%), and South Eastern Asia (324 | 0.4%), together accounting for 4.3% of all Hancock County residents.
| Immigration Origin | # Population | % Population |
| Africa | 176 | 0.2% |
| Asia | 1,390 | 1.8% |
| Barbados | 9 | 0.0% |
| Belize | 21 | 0.0% |
| Brazil | 42 | 0.1% |
| Canada | 20 | 0.0% |
| Caribbean | 9 | 0.0% |
| Central America | 364 | 0.5% |
| China | 311 | 0.4% |
| Colombia | 19 | 0.0% |
| Eastern Africa | 24 | 0.0% |
| Eastern Asia | 652 | 0.9% |
| Eastern Europe | 17 | 0.0% |
| Ecuador | 35 | 0.1% |
| El Salvador | 24 | 0.0% |
| England | 2 | 0.0% |
| Ethiopia | 3 | 0.0% |
| Europe | 167 | 0.2% |
| France | 10 | 0.0% |
| Germany | 41 | 0.1% |
| Ghana | 24 | 0.0% |
| Guatemala | 2 | 0.0% |
| Honduras | 36 | 0.1% |
| Hong Kong | 8 | 0.0% |
| India | 161 | 0.2% |
| Iraq | 81 | 0.1% |
| Japan | 320 | 0.4% |
| Kenya | 21 | 0.0% |
| Korea | 21 | 0.0% |
| Kuwait | 15 | 0.0% |
| Laos | 138 | 0.2% |
| Latin America | 486 | 0.6% |
| Lebanon | 25 | 0.0% |
| Liberia | 96 | 0.1% |
| Mexico | 280 | 0.4% |
| Netherlands | 2 | 0.0% |
| Northern Africa | 11 | 0.0% |
| Northern Europe | 17 | 0.0% |
| Panama | 1 | 0.0% |
| Peru | 17 | 0.0% |
| Philippines | 76 | 0.1% |
| Portugal | 76 | 0.1% |
| Romania | 11 | 0.0% |
| Russia | 6 | 0.0% |
| Saudi Arabia | 132 | 0.2% |
| Scotland | 15 | 0.0% |
| Sierra Leone | 21 | 0.0% |
| South America | 113 | 0.2% |
| South Central Asia | 161 | 0.2% |
| South Eastern Asia | 324 | 0.4% |
| Southern Europe | 80 | 0.1% |
| Spain | 4 | 0.0% |
| Thailand | 37 | 0.1% |
| Vietnam | 73 | 0.1% |
| Western Africa | 141 | 0.2% |
| Western Asia | 253 | 0.3% |
| Western Europe | 53 | 0.1% | View All 57 Rows |
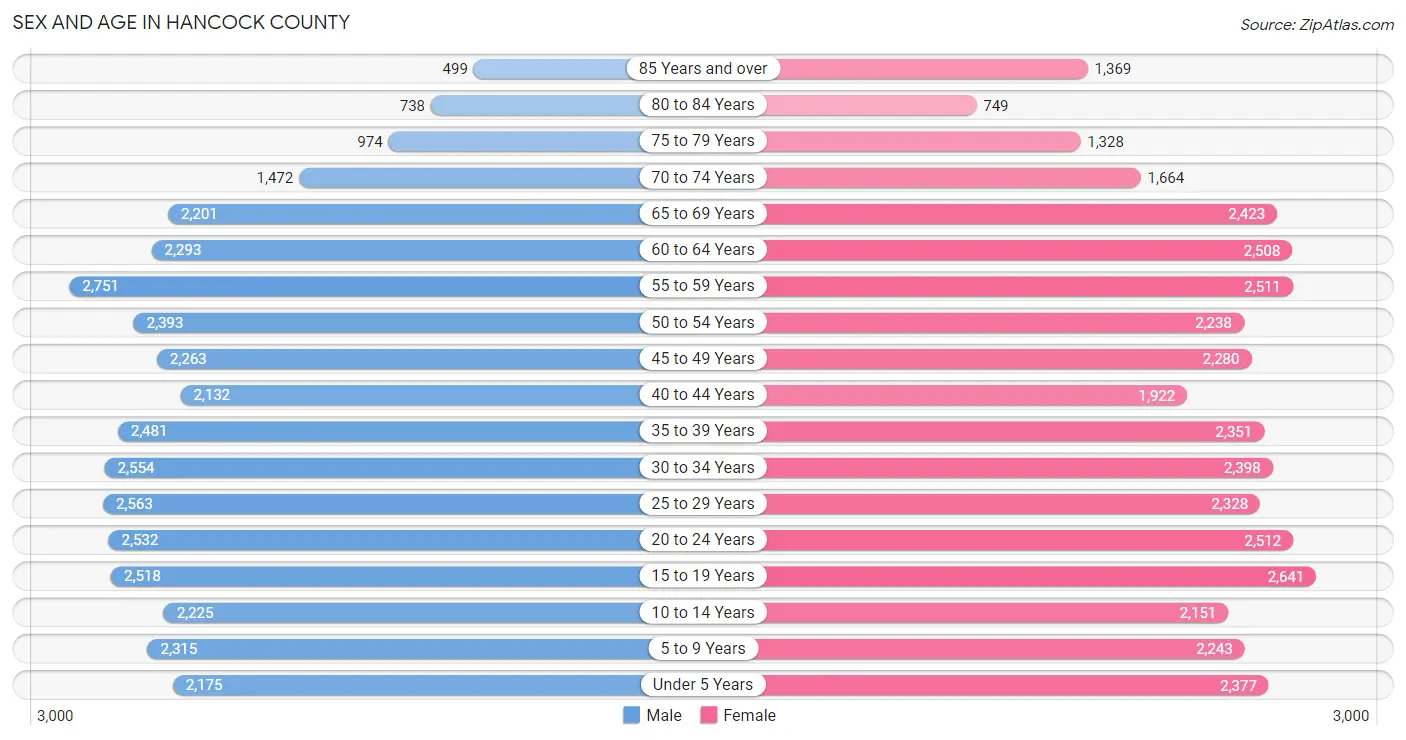
Sex and Age in Hancock County
Sex and Age in Hancock County
The most populous age groups in Hancock County are 55 to 59 Years (2,751 | 7.4%) for men and 15 to 19 Years (2,641 | 7.0%) for women.
| Age Bracket | Male | Female |
| Under 5 Years | 2,175 (5.9%) | 2,377 (6.3%) |
| 5 to 9 Years | 2,315 (6.2%) | 2,243 (5.9%) |
| 10 to 14 Years | 2,225 (6.0%) | 2,151 (5.7%) |
| 15 to 19 Years | 2,518 (6.8%) | 2,641 (7.0%) |
| 20 to 24 Years | 2,532 (6.8%) | 2,512 (6.6%) |
| 25 to 29 Years | 2,563 (6.9%) | 2,328 (6.1%) |
| 30 to 34 Years | 2,554 (6.9%) | 2,398 (6.3%) |
| 35 to 39 Years | 2,481 (6.7%) | 2,351 (6.2%) |
| 40 to 44 Years | 2,132 (5.8%) | 1,922 (5.1%) |
| 45 to 49 Years | 2,263 (6.1%) | 2,280 (6.0%) |
| 50 to 54 Years | 2,393 (6.5%) | 2,238 (5.9%) |
| 55 to 59 Years | 2,751 (7.4%) | 2,511 (6.6%) |
| 60 to 64 Years | 2,293 (6.2%) | 2,508 (6.6%) |
| 65 to 69 Years | 2,201 (5.9%) | 2,423 (6.4%) |
| 70 to 74 Years | 1,472 (4.0%) | 1,664 (4.4%) |
| 75 to 79 Years | 974 (2.6%) | 1,328 (3.5%) |
| 80 to 84 Years | 738 (2.0%) | 749 (2.0%) |
| 85 Years and over | 499 (1.3%) | 1,369 (3.6%) |
| Total | 37,079 (100.0%) | 37,993 (100.0%) |
Families and Households in Hancock County
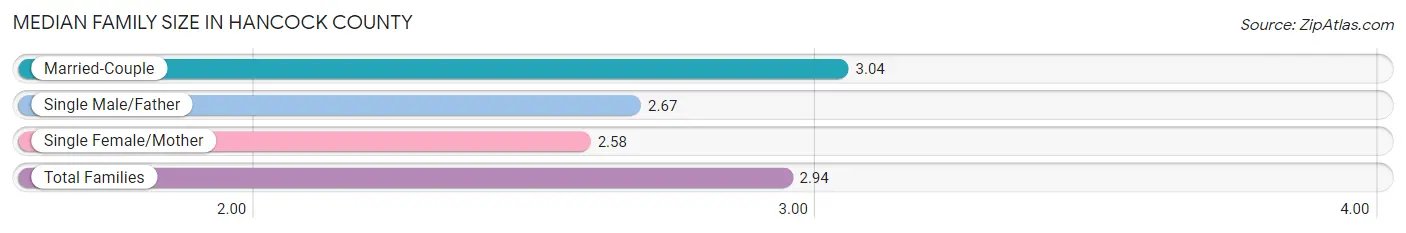
Median Family Size in Hancock County
The median family size in Hancock County is 2.94 persons per family, with married-couple families (14,768 | 76.8%) accounting for the largest median family size of 3.04 persons per family. On the other hand, single female/mother families (3,009 | 15.7%) represent the smallest median family size with 2.58 persons per family.
| Family Type | # Families | Family Size |
| Married-Couple | 14,768 (76.8%) | 3.04 |
| Single Male/Father | 1,441 (7.5%) | 2.67 |
| Single Female/Mother | 3,009 (15.7%) | 2.58 |
| Total Families | 19,218 (100.0%) | 2.94 |
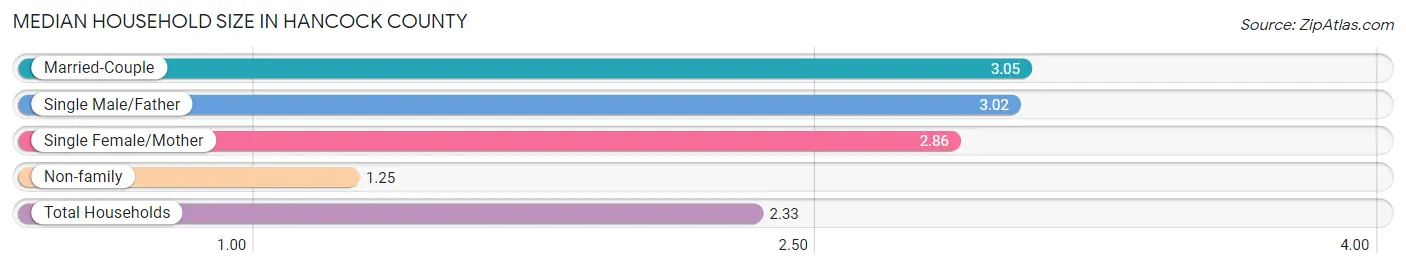
Median Household Size in Hancock County
The median household size in Hancock County is 2.33 persons per household, with married-couple households (14,768 | 47.1%) accounting for the largest median household size of 3.05 persons per household. non-family households (12,125 | 38.7%) represent the smallest median household size with 1.25 persons per household.
| Household Type | # Households | Household Size |
| Married-Couple | 14,768 (47.1%) | 3.05 |
| Single Male/Father | 1,441 (4.6%) | 3.02 |
| Single Female/Mother | 3,009 (9.6%) | 2.86 |
| Non-family | 12,125 (38.7%) | 1.25 |
| Total Households | 31,343 (100.0%) | 2.33 |
Household Size by Marriage Status in Hancock County
Out of a total of 31,343 households in Hancock County, 19,218 (61.3%) are family households, while 12,125 (38.7%) are nonfamily households. The most numerous type of family households are 2-person households, comprising 9,348, and the most common type of nonfamily households are 1-person households, comprising 9,968.
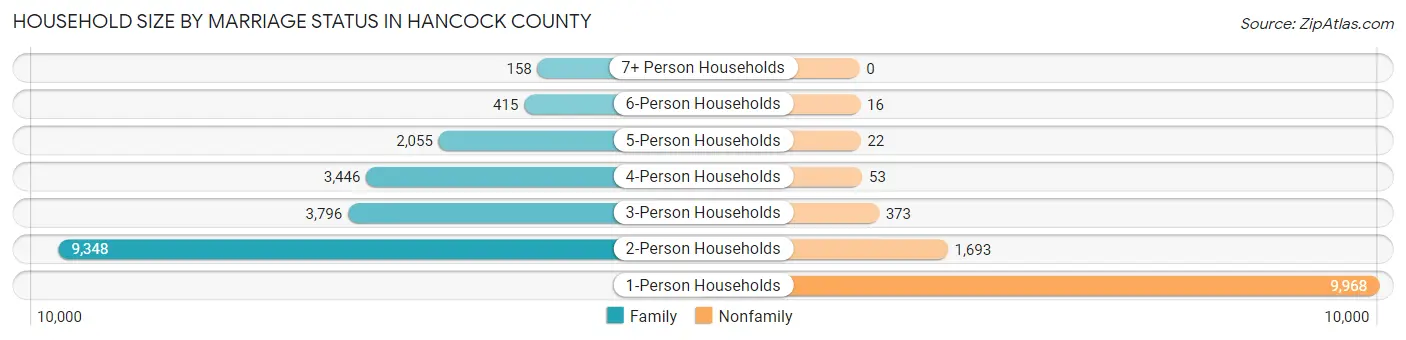
| Household Size | Family Households | Nonfamily Households |
| 1-Person Households | - | 9,968 (31.8%) |
| 2-Person Households | 9,348 (29.8%) | 1,693 (5.4%) |
| 3-Person Households | 3,796 (12.1%) | 373 (1.2%) |
| 4-Person Households | 3,446 (11.0%) | 53 (0.2%) |
| 5-Person Households | 2,055 (6.6%) | 22 (0.1%) |
| 6-Person Households | 415 (1.3%) | 16 (0.1%) |
| 7+ Person Households | 158 (0.5%) | 0 (0.0%) |
| Total | 19,218 (61.3%) | 12,125 (38.7%) |
Female Fertility in Hancock County
Fertility by Age in Hancock County
Average fertility rate in Hancock County is 37.0 births per 1,000 women. Women in the age bracket of 20 to 34 years have the highest fertility rate with 79.0 births per 1,000 women. Women in the age bracket of 20 to 34 years acount for 91.0% of all women with births.
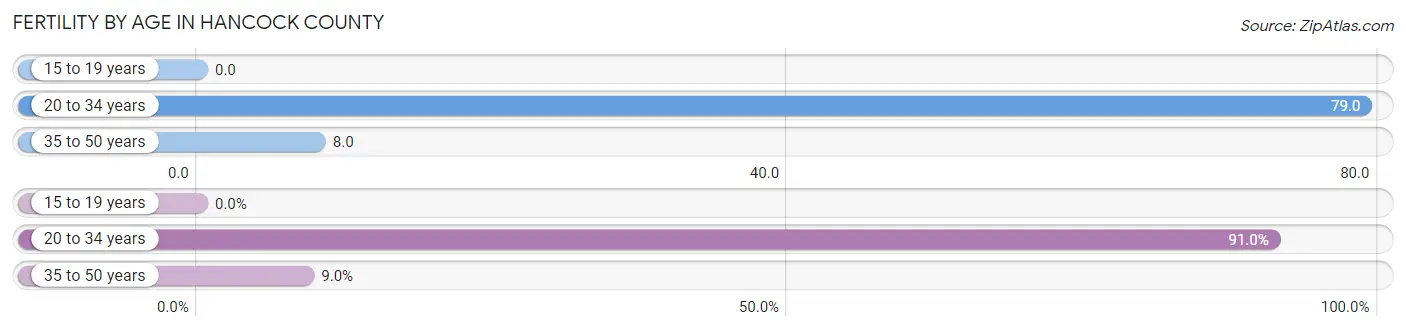
| Age Bracket | Women with Births | Births / 1,000 Women |
| 15 to 19 years | 0 (0.0%) | 0.0 |
| 20 to 34 years | 575 (91.0%) | 79.0 |
| 35 to 50 years | 57 (9.0%) | 8.0 |
| Total | 632 (100.0%) | 37.0 |
Fertility by Age by Marriage Status in Hancock County
90.0% of women with births (632) in Hancock County are married. The highest percentage of unmarried women with births falls into 20 to 34 years age bracket with 11.0% of them unmarried at the time of birth, while the lowest percentage of unmarried women with births belong to 35 to 50 years age bracket with 0.0% of them unmarried.
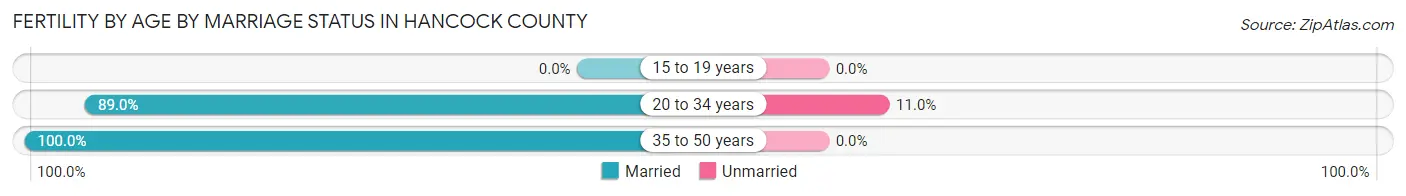
| Age Bracket | Married | Unmarried |
| 15 to 19 years | 0 (0.0%) | 0 (0.0%) |
| 20 to 34 years | 512 (89.0%) | 63 (11.0%) |
| 35 to 50 years | 57 (100.0%) | 0 (0.0%) |
| Total | 569 (90.0%) | 63 (10.0%) |
Fertility by Education in Hancock County
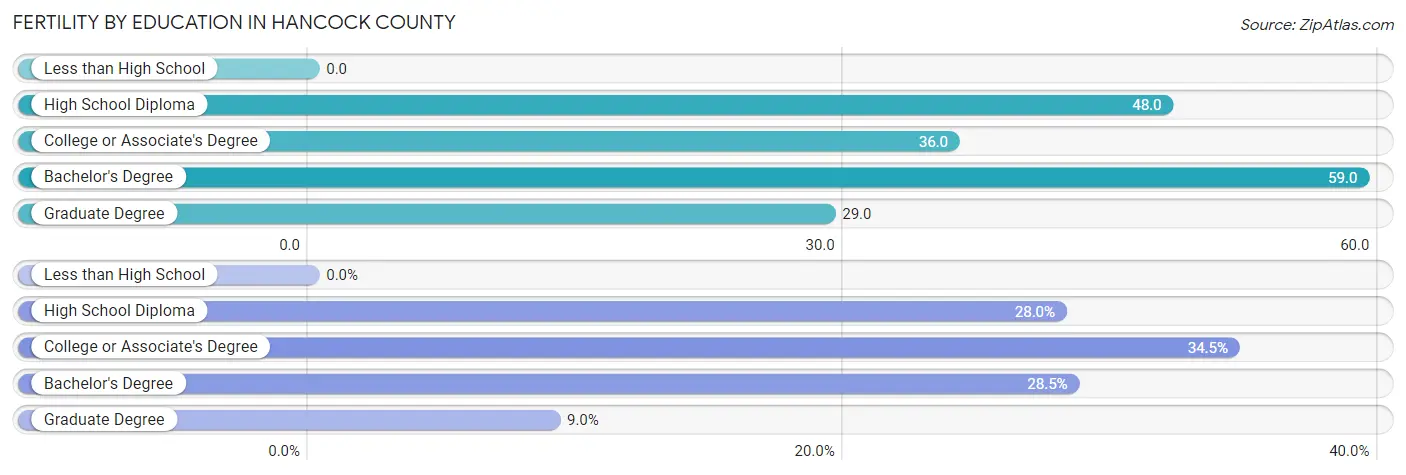
| Educational Attainment | Women with Births | Births / 1,000 Women |
| Less than High School | 0 (0.0%) | 0.0 |
| High School Diploma | 177 (28.0%) | 48.0 |
| College or Associate's Degree | 218 (34.5%) | 36.0 |
| Bachelor's Degree | 180 (28.5%) | 59.0 |
| Graduate Degree | 57 (9.0%) | 29.0 |
| Total | 632 (100.0%) | 37.0 |
Fertility by Education by Marriage Status in Hancock County
10.0% of women with births in Hancock County are unmarried. Women with the educational attainment of bachelor's degree are most likely to be married with 100.0% of them married at childbirth, while women with the educational attainment of college or associate's degree are least likely to be married with 22.9% of them unmarried at childbirth.
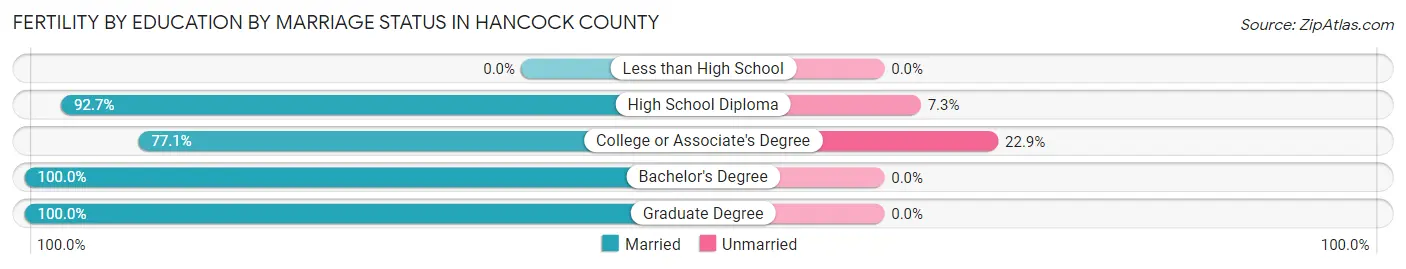
| Educational Attainment | Married | Unmarried |
| Less than High School | 0 (0.0%) | 0 (0.0%) |
| High School Diploma | 164 (92.7%) | 13 (7.3%) |
| College or Associate's Degree | 168 (77.1%) | 50 (22.9%) |
| Bachelor's Degree | 180 (100.0%) | 0 (0.0%) |
| Graduate Degree | 57 (100.0%) | 0 (0.0%) |
| Total | 569 (90.0%) | 63 (10.0%) |
Employment Characteristics in Hancock County
Employment by Class of Employer in Hancock County
Among the 36,806 employed individuals in Hancock County, private company employees (26,925 | 73.2%), not-for-profit organizations (3,629 | 9.9%), and local government employees (2,602 | 7.1%) make up the most common classes of employment.
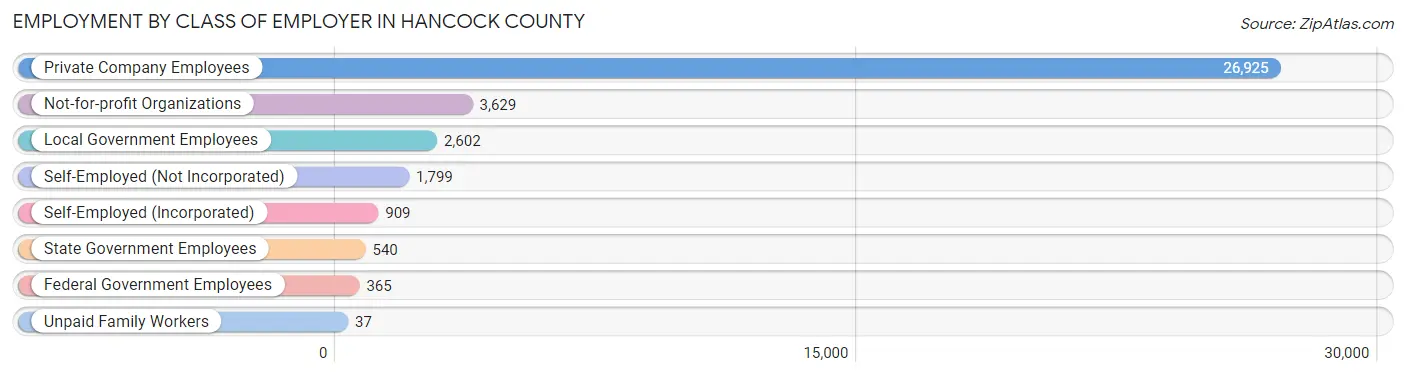
| Employer Class | # Employees | % Employees |
| Private Company Employees | 26,925 | 73.2% |
| Self-Employed (Incorporated) | 909 | 2.5% |
| Self-Employed (Not Incorporated) | 1,799 | 4.9% |
| Not-for-profit Organizations | 3,629 | 9.9% |
| Local Government Employees | 2,602 | 7.1% |
| State Government Employees | 540 | 1.5% |
| Federal Government Employees | 365 | 1.0% |
| Unpaid Family Workers | 37 | 0.1% |
| Total | 36,806 | 100.0% |
Employment Status by Age in Hancock County
According to the labor force statistics for Hancock County, out of the total population over 16 years of age (60,575), 64.5% or 39,071 individuals are in the labor force, with 3.7% or 1,446 of them unemployed. The age group with the highest labor force participation rate is 45 to 54 years, with 86.7% or 7,954 individuals in the labor force. Within the labor force, the 16 to 19 years age range has the highest percentage of unemployed individuals, with 11.8% or 280 of them being unemployed.
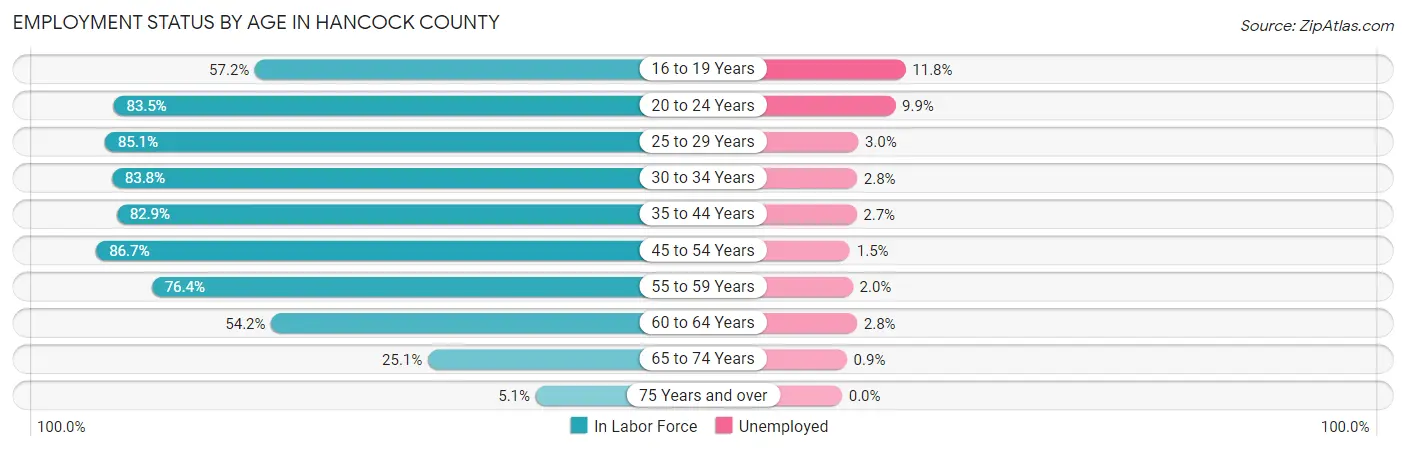
| Age Bracket | In Labor Force | Unemployed |
| 16 to 19 Years | 2,373 (57.2%) | 280 (11.8%) |
| 20 to 24 Years | 4,212 (83.5%) | 417 (9.9%) |
| 25 to 29 Years | 4,162 (85.1%) | 125 (3.0%) |
| 30 to 34 Years | 4,150 (83.8%) | 116 (2.8%) |
| 35 to 44 Years | 7,366 (82.9%) | 199 (2.7%) |
| 45 to 54 Years | 7,954 (86.7%) | 119 (1.5%) |
| 55 to 59 Years | 4,020 (76.4%) | 80 (2.0%) |
| 60 to 64 Years | 2,602 (54.2%) | 73 (2.8%) |
| 65 to 74 Years | 1,948 (25.1%) | 18 (0.9%) |
| 75 Years and over | 289 (5.1%) | 0 (0.0%) |
| Total | 39,071 (64.5%) | 1,446 (3.7%) |
Employment Status by Educational Attainment in Hancock County
According to labor force statistics for Hancock County, 79.7% of individuals (30,259) out of the total population between 25 and 64 years of age (37,966) are in the labor force, with 2.4% or 726 of them being unemployed. The group with the highest labor force participation rate are those with the educational attainment of bachelor's degree or higher, with 84.7% or 10,241 individuals in the labor force. Within the labor force, individuals with less than high school education have the highest percentage of unemployment, with 6.1% or 63 of them being unemployed.
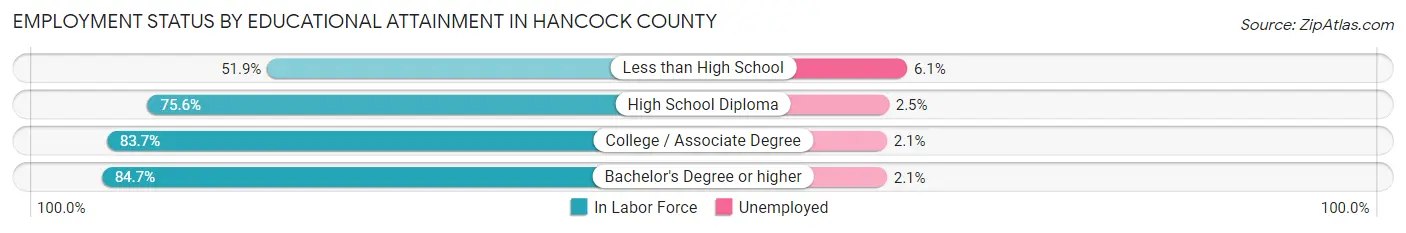
| Educational Attainment | In Labor Force | Unemployed |
| Less than High School | 1,032 (51.9%) | 121 (6.1%) |
| High School Diploma | 9,448 (75.6%) | 312 (2.5%) |
| College / Associate Degree | 9,533 (83.7%) | 239 (2.1%) |
| Bachelor's Degree or higher | 10,241 (84.7%) | 254 (2.1%) |
| Total | 30,259 (79.7%) | 911 (2.4%) |
Employment Occupations by Sex in Hancock County
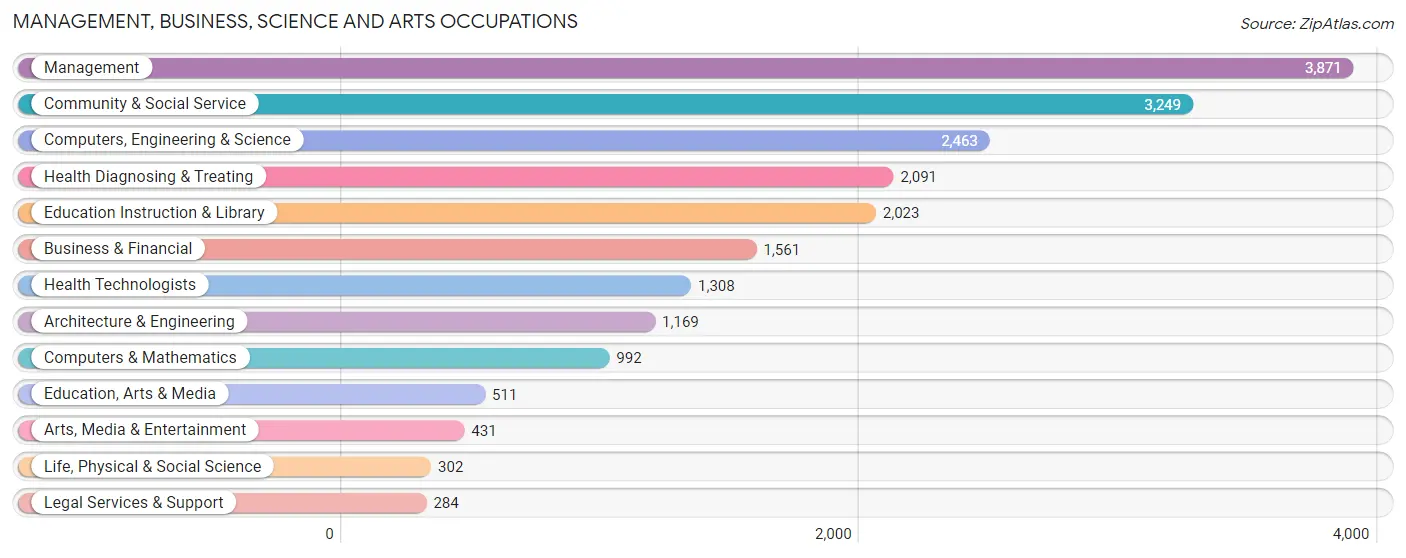
Management, Business, Science and Arts Occupations
The most common Management, Business, Science and Arts occupations in Hancock County are Management (3,871 | 10.3%), Community & Social Service (3,249 | 8.6%), Computers, Engineering & Science (2,463 | 6.6%), Health Diagnosing & Treating (2,091 | 5.6%), and Education Instruction & Library (2,023 | 5.4%).
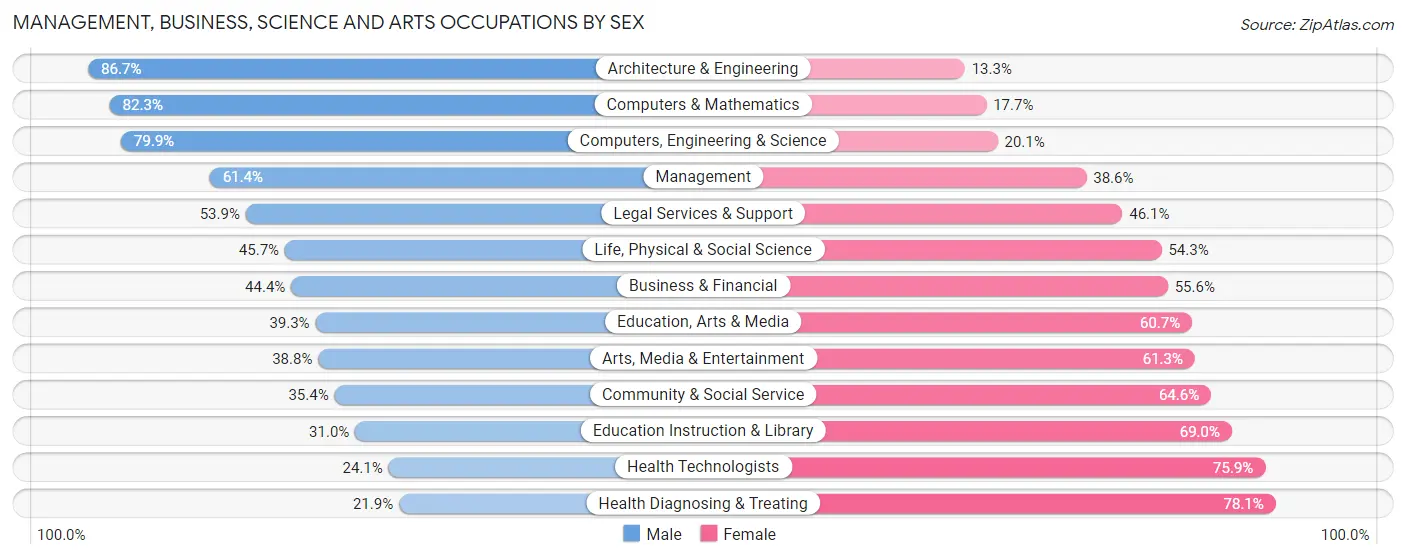
Management, Business, Science and Arts Occupations by Sex
Within the Management, Business, Science and Arts occupations in Hancock County, the most male-oriented occupations are Architecture & Engineering (86.7%), Computers & Mathematics (82.3%), and Computers, Engineering & Science (79.9%), while the most female-oriented occupations are Health Diagnosing & Treating (78.1%), Health Technologists (75.9%), and Education Instruction & Library (69.0%).
| Occupation | Male | Female |
| Management | 2,376 (61.4%) | 1,495 (38.6%) |
| Business & Financial | 693 (44.4%) | 868 (55.6%) |
| Computers, Engineering & Science | 1,968 (79.9%) | 495 (20.1%) |
| Computers & Mathematics | 816 (82.3%) | 176 (17.7%) |
| Architecture & Engineering | 1,014 (86.7%) | 155 (13.3%) |
| Life, Physical & Social Science | 138 (45.7%) | 164 (54.3%) |
| Community & Social Service | 1,149 (35.4%) | 2,100 (64.6%) |
| Education, Arts & Media | 201 (39.3%) | 310 (60.7%) |
| Legal Services & Support | 153 (53.9%) | 131 (46.1%) |
| Education Instruction & Library | 628 (31.0%) | 1,395 (69.0%) |
| Arts, Media & Entertainment | 167 (38.8%) | 264 (61.3%) |
| Health Diagnosing & Treating | 458 (21.9%) | 1,633 (78.1%) |
| Health Technologists | 315 (24.1%) | 993 (75.9%) |
| Total (Category) | 6,644 (50.2%) | 6,591 (49.8%) |
| Total (Overall) | 20,300 (54.0%) | 17,300 (46.0%) |
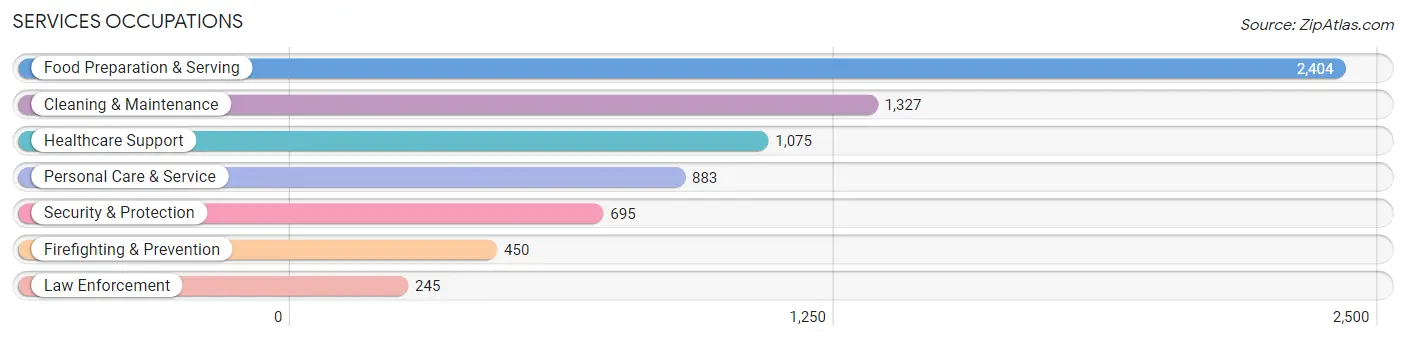
Services Occupations
The most common Services occupations in Hancock County are Food Preparation & Serving (2,404 | 6.4%), Cleaning & Maintenance (1,327 | 3.5%), Healthcare Support (1,075 | 2.9%), Personal Care & Service (883 | 2.4%), and Security & Protection (695 | 1.8%).
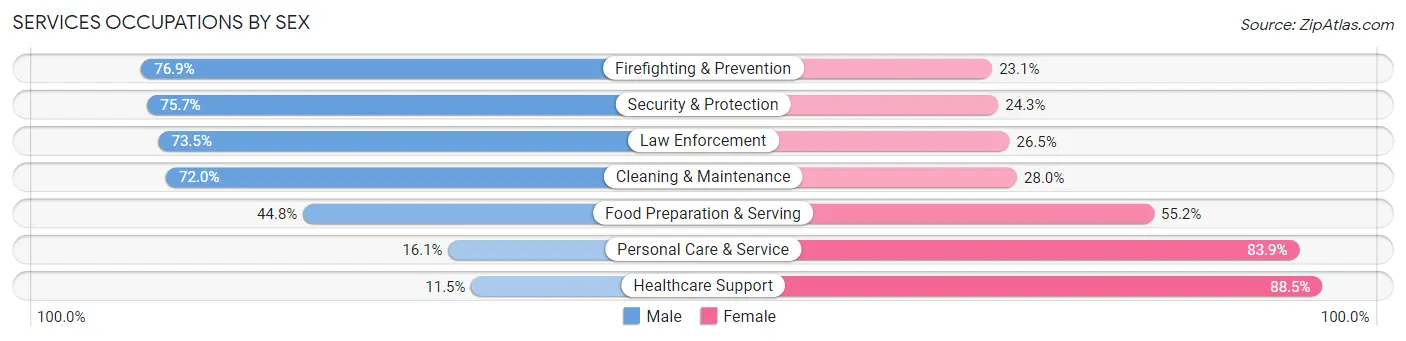
Services Occupations by Sex
Within the Services occupations in Hancock County, the most male-oriented occupations are Firefighting & Prevention (76.9%), Security & Protection (75.7%), and Law Enforcement (73.5%), while the most female-oriented occupations are Healthcare Support (88.5%), Personal Care & Service (83.9%), and Food Preparation & Serving (55.2%).
| Occupation | Male | Female |
| Healthcare Support | 124 (11.5%) | 951 (88.5%) |
| Security & Protection | 526 (75.7%) | 169 (24.3%) |
| Firefighting & Prevention | 346 (76.9%) | 104 (23.1%) |
| Law Enforcement | 180 (73.5%) | 65 (26.5%) |
| Food Preparation & Serving | 1,078 (44.8%) | 1,326 (55.2%) |
| Cleaning & Maintenance | 955 (72.0%) | 372 (28.0%) |
| Personal Care & Service | 142 (16.1%) | 741 (83.9%) |
| Total (Category) | 2,825 (44.3%) | 3,559 (55.7%) |
| Total (Overall) | 20,300 (54.0%) | 17,300 (46.0%) |
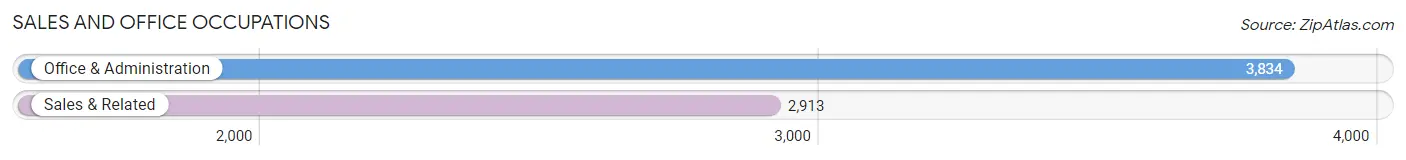
Sales and Office Occupations
The most common Sales and Office occupations in Hancock County are Office & Administration (3,834 | 10.2%), and Sales & Related (2,913 | 7.7%).
Sales and Office Occupations by Sex
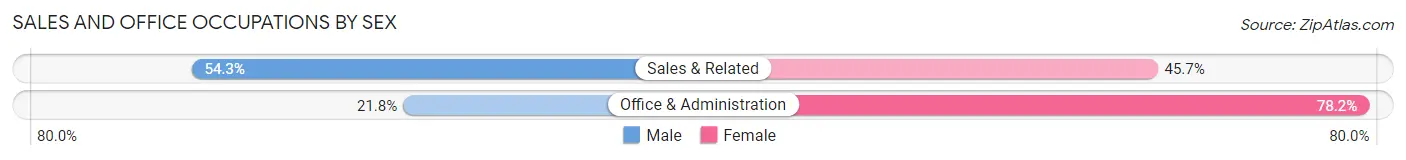
| Occupation | Male | Female |
| Sales & Related | 1,582 (54.3%) | 1,331 (45.7%) |
| Office & Administration | 835 (21.8%) | 2,999 (78.2%) |
| Total (Category) | 2,417 (35.8%) | 4,330 (64.2%) |
| Total (Overall) | 20,300 (54.0%) | 17,300 (46.0%) |
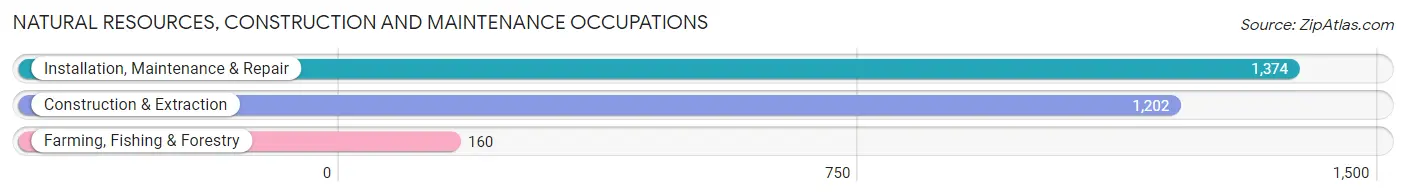
Natural Resources, Construction and Maintenance Occupations
The most common Natural Resources, Construction and Maintenance occupations in Hancock County are Installation, Maintenance & Repair (1,374 | 3.6%), Construction & Extraction (1,202 | 3.2%), and Farming, Fishing & Forestry (160 | 0.4%).
Natural Resources, Construction and Maintenance Occupations by Sex
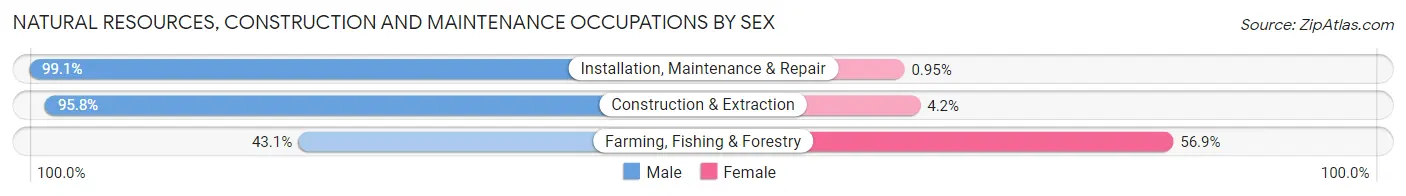
| Occupation | Male | Female |
| Farming, Fishing & Forestry | 69 (43.1%) | 91 (56.9%) |
| Construction & Extraction | 1,151 (95.8%) | 51 (4.2%) |
| Installation, Maintenance & Repair | 1,361 (99.1%) | 13 (0.9%) |
| Total (Category) | 2,581 (94.3%) | 155 (5.7%) |
| Total (Overall) | 20,300 (54.0%) | 17,300 (46.0%) |
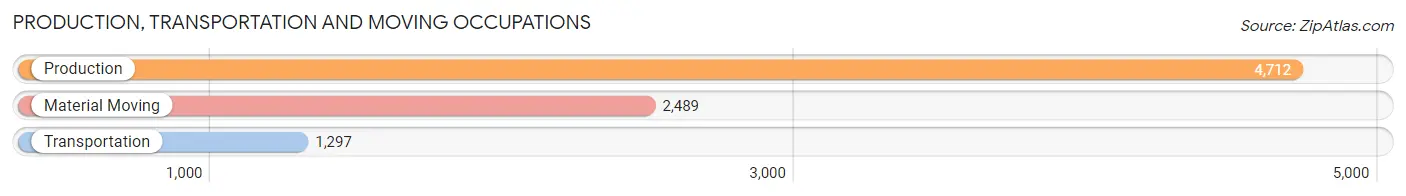
Production, Transportation and Moving Occupations
The most common Production, Transportation and Moving occupations in Hancock County are Production (4,712 | 12.5%), Material Moving (2,489 | 6.6%), and Transportation (1,297 | 3.5%).
Production, Transportation and Moving Occupations by Sex
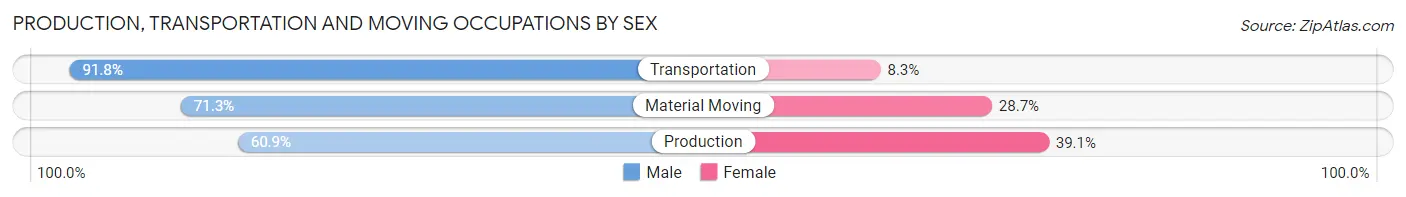
| Occupation | Male | Female |
| Production | 2,868 (60.9%) | 1,844 (39.1%) |
| Transportation | 1,190 (91.7%) | 107 (8.3%) |
| Material Moving | 1,775 (71.3%) | 714 (28.7%) |
| Total (Category) | 5,833 (68.6%) | 2,665 (31.4%) |
| Total (Overall) | 20,300 (54.0%) | 17,300 (46.0%) |
Employment Industries by Sex in Hancock County
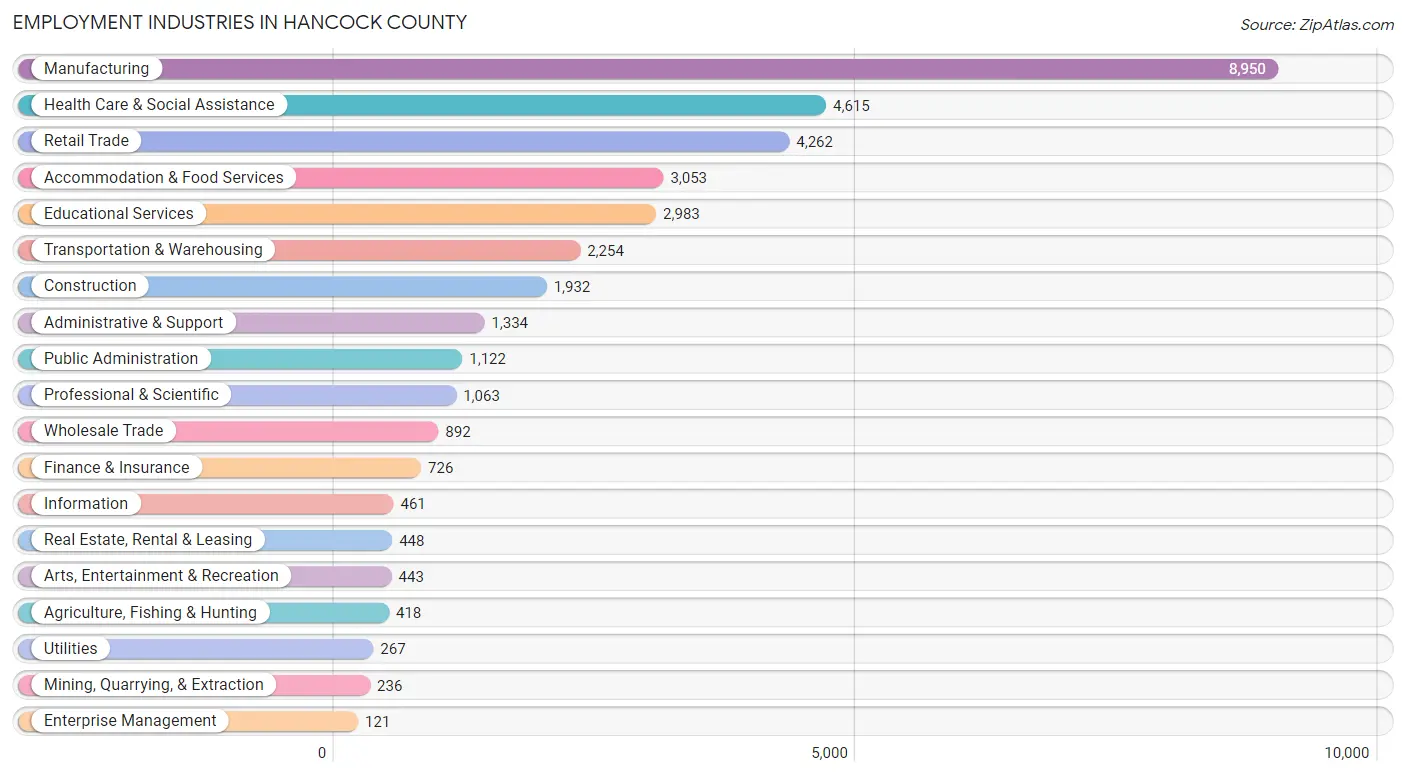
Employment Industries in Hancock County
The major employment industries in Hancock County include Manufacturing (8,950 | 23.8%), Health Care & Social Assistance (4,615 | 12.3%), Retail Trade (4,262 | 11.3%), Accommodation & Food Services (3,053 | 8.1%), and Educational Services (2,983 | 7.9%).
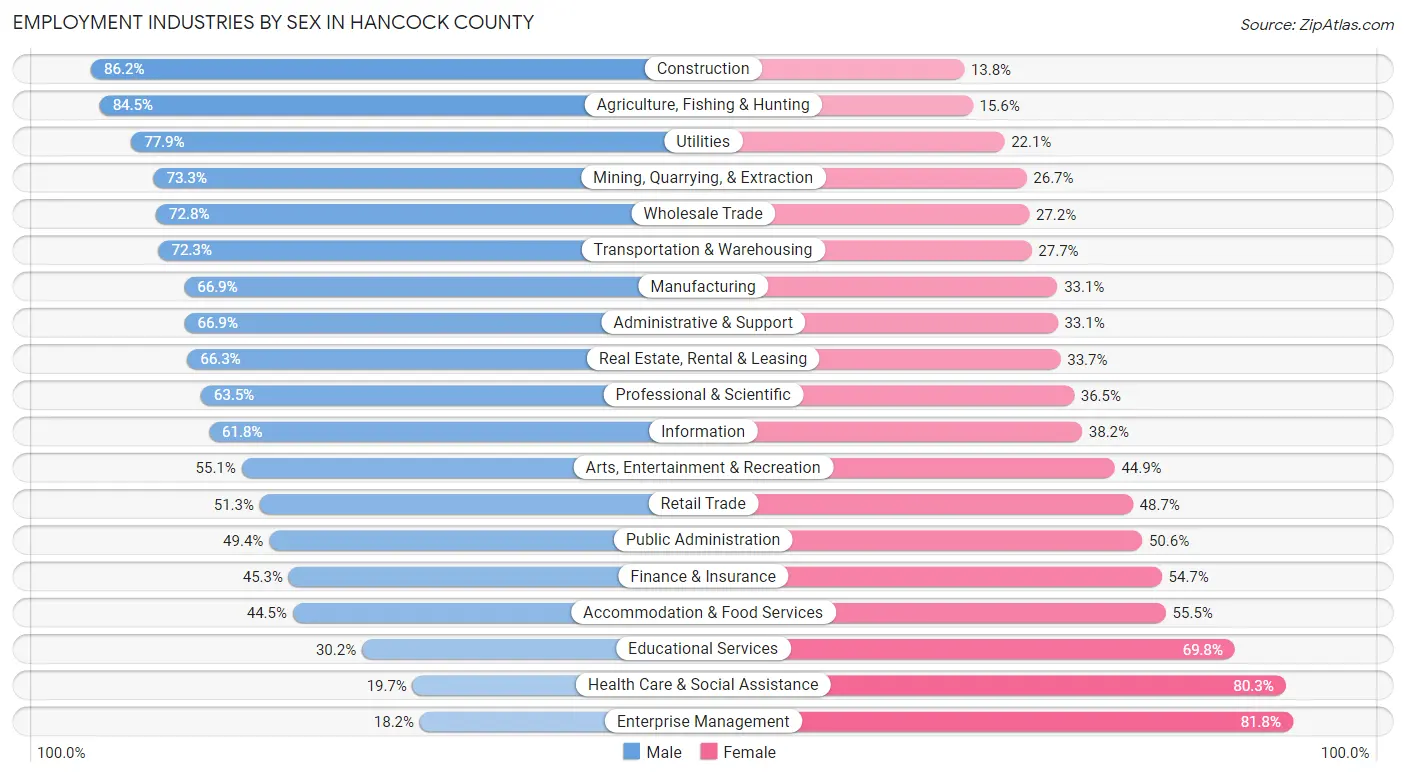
Employment Industries by Sex in Hancock County
The Hancock County industries that see more men than women are Construction (86.2%), Agriculture, Fishing & Hunting (84.5%), and Utilities (77.9%), whereas the industries that tend to have a higher number of women are Enterprise Management (81.8%), Health Care & Social Assistance (80.3%), and Educational Services (69.8%).
| Industry | Male | Female |
| Agriculture, Fishing & Hunting | 353 (84.5%) | 65 (15.5%) |
| Mining, Quarrying, & Extraction | 173 (73.3%) | 63 (26.7%) |
| Construction | 1,666 (86.2%) | 266 (13.8%) |
| Manufacturing | 5,990 (66.9%) | 2,960 (33.1%) |
| Wholesale Trade | 649 (72.8%) | 243 (27.2%) |
| Retail Trade | 2,187 (51.3%) | 2,075 (48.7%) |
| Transportation & Warehousing | 1,629 (72.3%) | 625 (27.7%) |
| Utilities | 208 (77.9%) | 59 (22.1%) |
| Information | 285 (61.8%) | 176 (38.2%) |
| Finance & Insurance | 329 (45.3%) | 397 (54.7%) |
| Real Estate, Rental & Leasing | 297 (66.3%) | 151 (33.7%) |
| Professional & Scientific | 675 (63.5%) | 388 (36.5%) |
| Enterprise Management | 22 (18.2%) | 99 (81.8%) |
| Administrative & Support | 892 (66.9%) | 442 (33.1%) |
| Educational Services | 900 (30.2%) | 2,083 (69.8%) |
| Health Care & Social Assistance | 908 (19.7%) | 3,707 (80.3%) |
| Arts, Entertainment & Recreation | 244 (55.1%) | 199 (44.9%) |
| Accommodation & Food Services | 1,358 (44.5%) | 1,695 (55.5%) |
| Public Administration | 554 (49.4%) | 568 (50.6%) |
| Total | 20,300 (54.0%) | 17,300 (46.0%) |
Education in Hancock County
School Enrollment in Hancock County
The most common levels of schooling among the 17,510 students in Hancock County are high school (3,822 | 21.8%), college / undergraduate (3,673 | 21.0%), and middle school (3,645 | 20.8%).
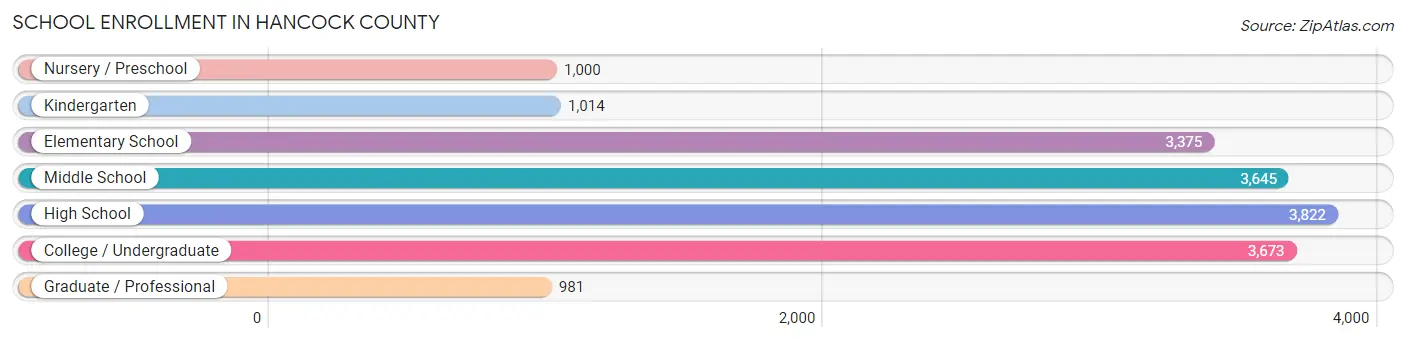
| School Level | # Students | % Students |
| Nursery / Preschool | 1,000 | 5.7% |
| Kindergarten | 1,014 | 5.8% |
| Elementary School | 3,375 | 19.3% |
| Middle School | 3,645 | 20.8% |
| High School | 3,822 | 21.8% |
| College / Undergraduate | 3,673 | 21.0% |
| Graduate / Professional | 981 | 5.6% |
| Total | 17,510 | 100.0% |
School Enrollment by Age by Funding Source in Hancock County
Out of a total of 17,510 students who are enrolled in schools in Hancock County, 3,660 (20.9%) attend a private institution, while the remaining 13,850 (79.1%) are enrolled in public schools. The age group of 20 to 24 year olds has the highest likelihood of being enrolled in private schools, with 1,199 (60.0% in the age bracket) enrolled. Conversely, the age group of 10 to 14 year olds has the lowest likelihood of being enrolled in a private school, with 4,160 (95.6% in the age bracket) attending a public institution.
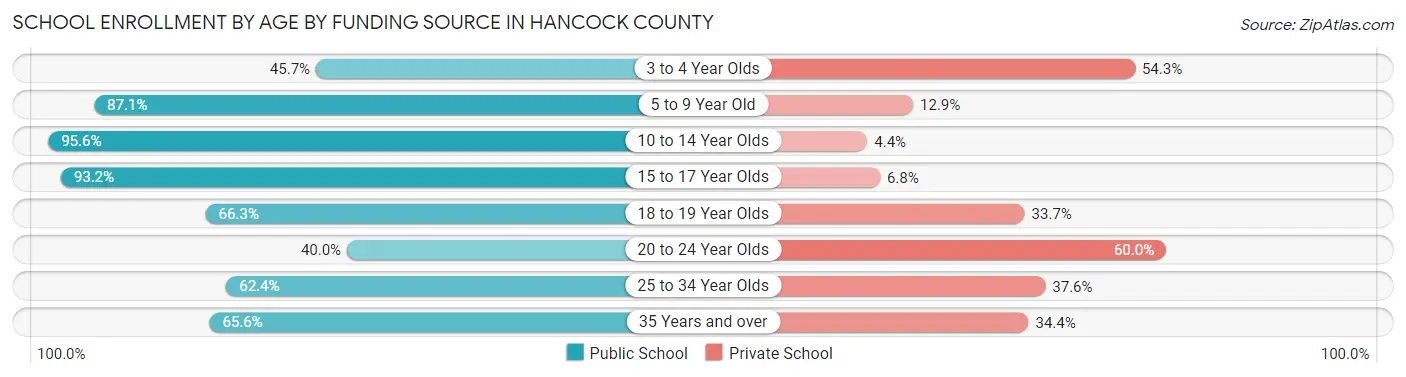
| Age Bracket | Public School | Private School |
| 3 to 4 Year Olds | 258 (45.7%) | 306 (54.3%) |
| 5 to 9 Year Old | 3,694 (87.1%) | 549 (12.9%) |
| 10 to 14 Year Olds | 4,160 (95.6%) | 192 (4.4%) |
| 15 to 17 Year Olds | 2,688 (93.2%) | 195 (6.8%) |
| 18 to 19 Year Olds | 1,117 (66.3%) | 568 (33.7%) |
| 20 to 24 Year Olds | 798 (40.0%) | 1,199 (60.0%) |
| 25 to 34 Year Olds | 796 (62.4%) | 479 (37.6%) |
| 35 Years and over | 335 (65.6%) | 176 (34.4%) |
| Total | 13,850 (79.1%) | 3,660 (20.9%) |
Educational Attainment by Field of Study in Hancock County
Business (3,352 | 21.3%), education (2,955 | 18.8%), science & technology (1,668 | 10.6%), engineering (1,557 | 9.9%), and arts & humanities (1,050 | 6.7%) are the most common fields of study among 15,715 individuals in Hancock County who have obtained a bachelor's degree or higher.
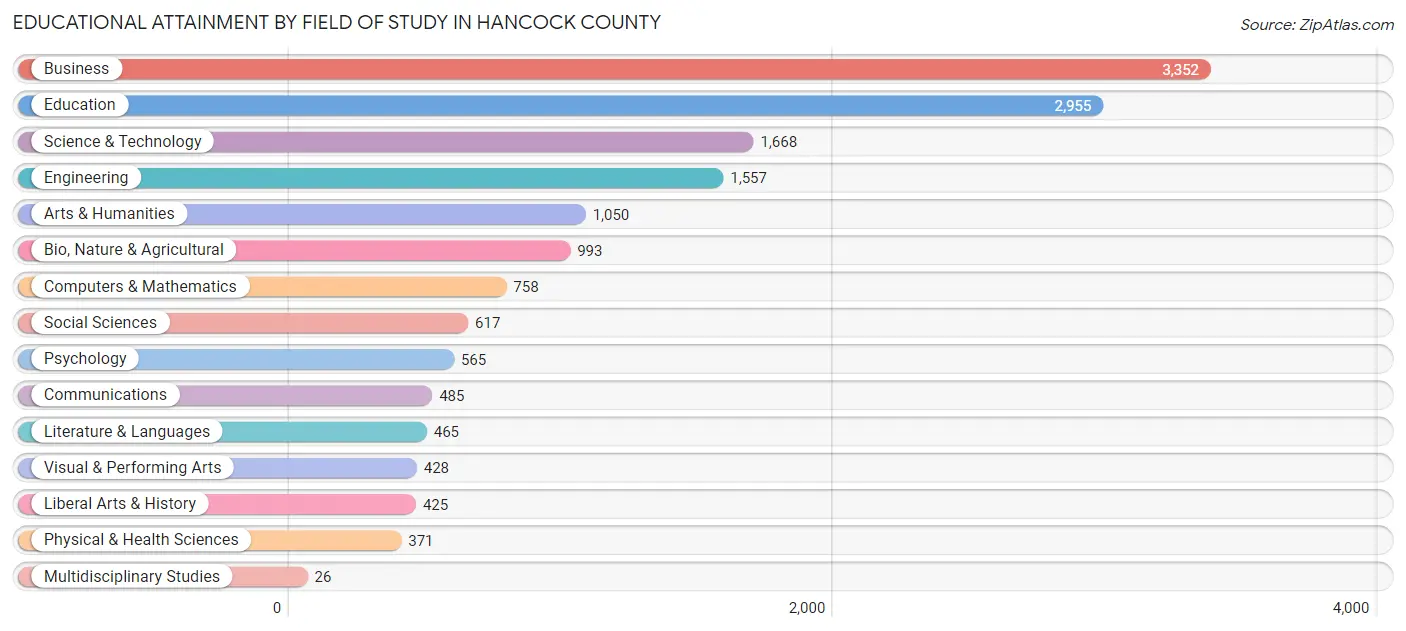
| Field of Study | # Graduates | % Graduates |
| Computers & Mathematics | 758 | 4.8% |
| Bio, Nature & Agricultural | 993 | 6.3% |
| Physical & Health Sciences | 371 | 2.4% |
| Psychology | 565 | 3.6% |
| Social Sciences | 617 | 3.9% |
| Engineering | 1,557 | 9.9% |
| Multidisciplinary Studies | 26 | 0.2% |
| Science & Technology | 1,668 | 10.6% |
| Business | 3,352 | 21.3% |
| Education | 2,955 | 18.8% |
| Literature & Languages | 465 | 3.0% |
| Liberal Arts & History | 425 | 2.7% |
| Visual & Performing Arts | 428 | 2.7% |
| Communications | 485 | 3.1% |
| Arts & Humanities | 1,050 | 6.7% |
| Total | 15,715 | 100.0% |
Transportation & Commute in Hancock County
Vehicle Availability by Sex in Hancock County
The most prevalent vehicle ownership categories in Hancock County are males with 2 vehicles (8,941, accounting for 45.0%) and females with 2 vehicles (6,904, making up 54.3%).
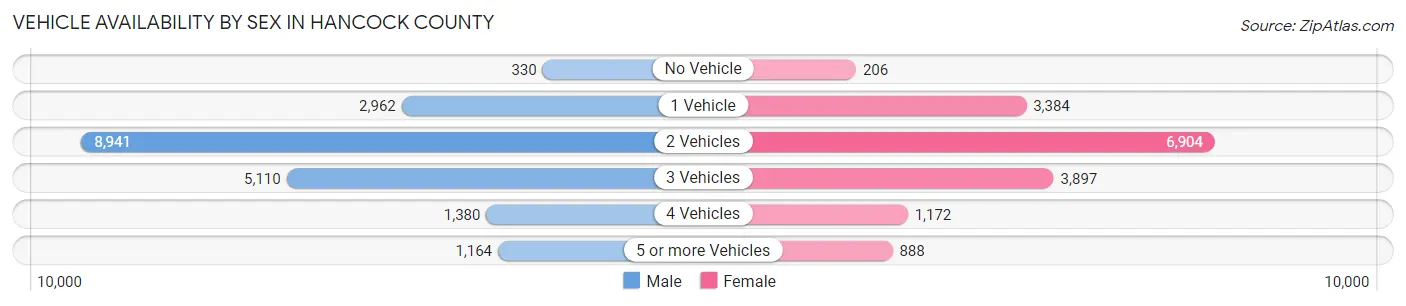
| Vehicles Available | Male | Female |
| No Vehicle | 330 (1.7%) | 206 (1.3%) |
| 1 Vehicle | 2,962 (14.9%) | 3,384 (20.6%) |
| 2 Vehicles | 8,941 (45.0%) | 6,904 (42.0%) |
| 3 Vehicles | 5,110 (25.7%) | 3,897 (23.7%) |
| 4 Vehicles | 1,380 (6.9%) | 1,172 (7.1%) |
| 5 or more Vehicles | 1,164 (5.9%) | 888 (5.4%) |
| Total | 19,887 (100.0%) | 16,451 (100.0%) |
Commute Time in Hancock County
The most frequently occuring commute durations in Hancock County are 10 to 14 minutes (7,983 commuters, 23.3%), 5 to 9 minutes (6,994 commuters, 20.4%), and 15 to 19 minutes (6,749 commuters, 19.7%).
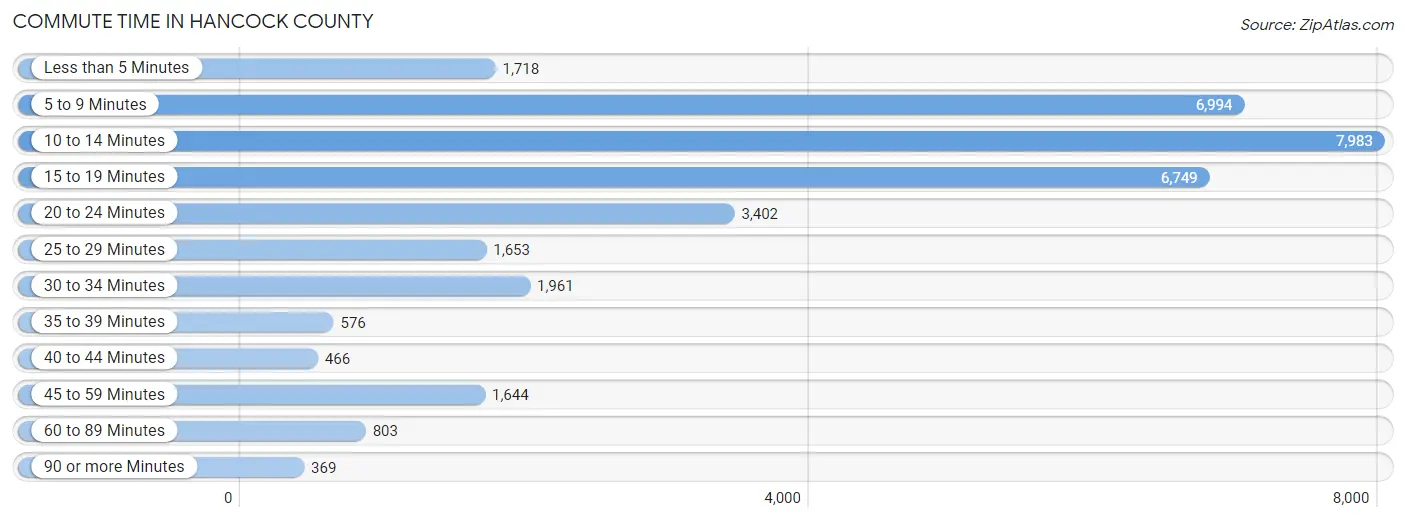
| Commute Time | # Commuters | % Commuters |
| Less than 5 Minutes | 1,718 | 5.0% |
| 5 to 9 Minutes | 6,994 | 20.4% |
| 10 to 14 Minutes | 7,983 | 23.3% |
| 15 to 19 Minutes | 6,749 | 19.7% |
| 20 to 24 Minutes | 3,402 | 9.9% |
| 25 to 29 Minutes | 1,653 | 4.8% |
| 30 to 34 Minutes | 1,961 | 5.7% |
| 35 to 39 Minutes | 576 | 1.7% |
| 40 to 44 Minutes | 466 | 1.4% |
| 45 to 59 Minutes | 1,644 | 4.8% |
| 60 to 89 Minutes | 803 | 2.3% |
| 90 or more Minutes | 369 | 1.1% |
Commute Time by Sex in Hancock County
The most common commute times in Hancock County are 10 to 14 minutes (4,469 commuters, 23.6%) for males and 10 to 14 minutes (3,514 commuters, 22.9%) for females.
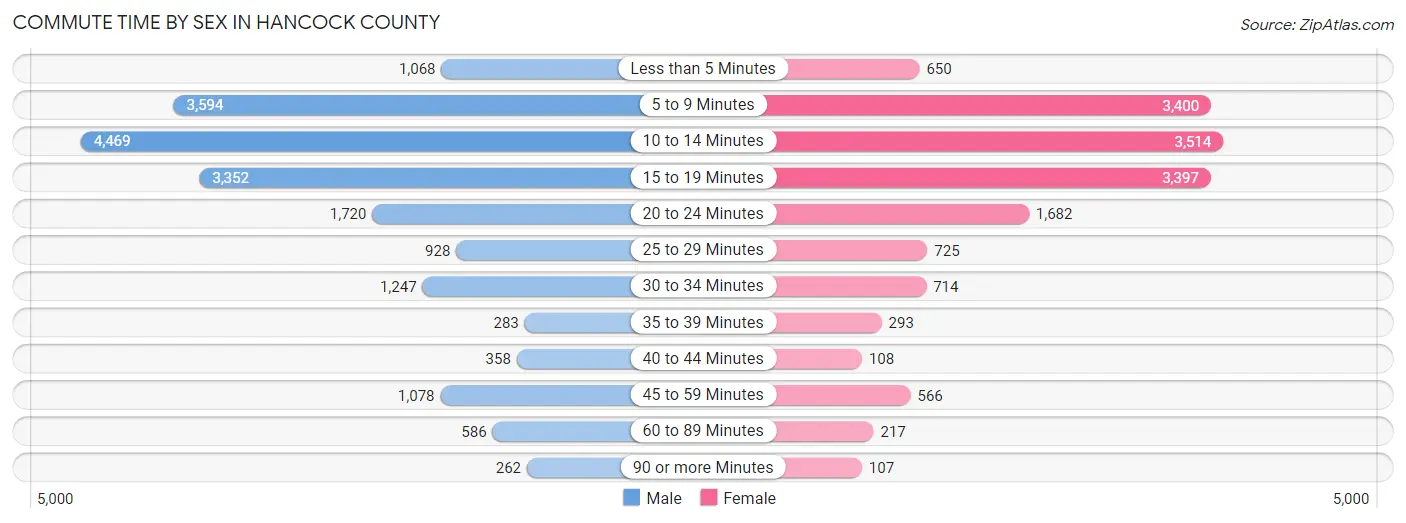
| Commute Time | Male | Female |
| Less than 5 Minutes | 1,068 (5.6%) | 650 (4.2%) |
| 5 to 9 Minutes | 3,594 (19.0%) | 3,400 (22.1%) |
| 10 to 14 Minutes | 4,469 (23.6%) | 3,514 (22.9%) |
| 15 to 19 Minutes | 3,352 (17.7%) | 3,397 (22.1%) |
| 20 to 24 Minutes | 1,720 (9.1%) | 1,682 (10.9%) |
| 25 to 29 Minutes | 928 (4.9%) | 725 (4.7%) |
| 30 to 34 Minutes | 1,247 (6.6%) | 714 (4.6%) |
| 35 to 39 Minutes | 283 (1.5%) | 293 (1.9%) |
| 40 to 44 Minutes | 358 (1.9%) | 108 (0.7%) |
| 45 to 59 Minutes | 1,078 (5.7%) | 566 (3.7%) |
| 60 to 89 Minutes | 586 (3.1%) | 217 (1.4%) |
| 90 or more Minutes | 262 (1.4%) | 107 (0.7%) |
Time of Departure to Work by Sex in Hancock County
The most frequent times of departure to work in Hancock County are 7:30 AM to 7:59 AM (2,449, 12.9%) for males and 7:30 AM to 7:59 AM (2,134, 13.9%) for females.
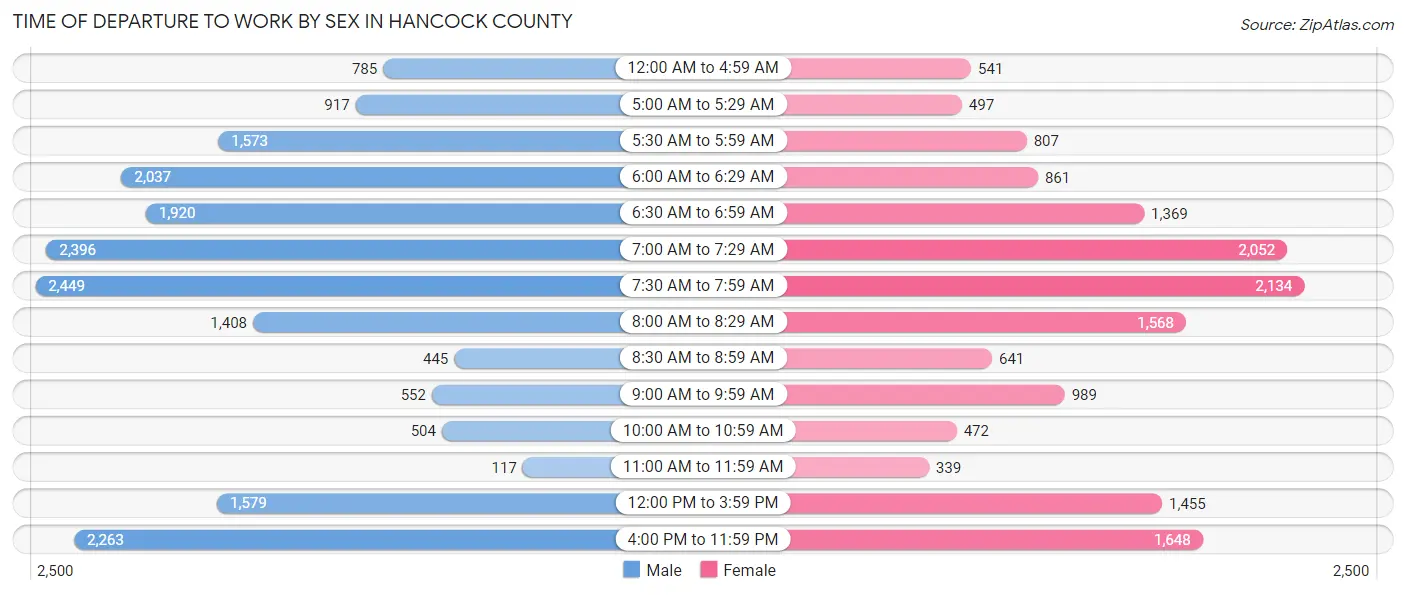
| Time of Departure | Male | Female |
| 12:00 AM to 4:59 AM | 785 (4.1%) | 541 (3.5%) |
| 5:00 AM to 5:29 AM | 917 (4.8%) | 497 (3.2%) |
| 5:30 AM to 5:59 AM | 1,573 (8.3%) | 807 (5.2%) |
| 6:00 AM to 6:29 AM | 2,037 (10.7%) | 861 (5.6%) |
| 6:30 AM to 6:59 AM | 1,920 (10.1%) | 1,369 (8.9%) |
| 7:00 AM to 7:29 AM | 2,396 (12.7%) | 2,052 (13.4%) |
| 7:30 AM to 7:59 AM | 2,449 (12.9%) | 2,134 (13.9%) |
| 8:00 AM to 8:29 AM | 1,408 (7.4%) | 1,568 (10.2%) |
| 8:30 AM to 8:59 AM | 445 (2.4%) | 641 (4.2%) |
| 9:00 AM to 9:59 AM | 552 (2.9%) | 989 (6.4%) |
| 10:00 AM to 10:59 AM | 504 (2.7%) | 472 (3.1%) |
| 11:00 AM to 11:59 AM | 117 (0.6%) | 339 (2.2%) |
| 12:00 PM to 3:59 PM | 1,579 (8.3%) | 1,455 (9.5%) |
| 4:00 PM to 11:59 PM | 2,263 (11.9%) | 1,648 (10.7%) |
| Total | 18,945 (100.0%) | 15,373 (100.0%) |
Housing Occupancy in Hancock County
Occupancy by Ownership in Hancock County
Of the total 31,343 dwellings in Hancock County, owner-occupied units account for 21,580 (68.9%), while renter-occupied units make up 9,763 (31.1%).
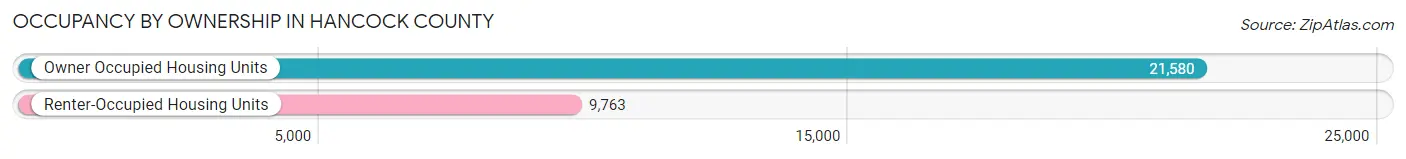
| Occupancy | # Housing Units | % Housing Units |
| Owner Occupied Housing Units | 21,580 | 68.9% |
| Renter-Occupied Housing Units | 9,763 | 31.1% |
| Total Occupied Housing Units | 31,343 | 100.0% |
Occupancy by Household Size in Hancock County
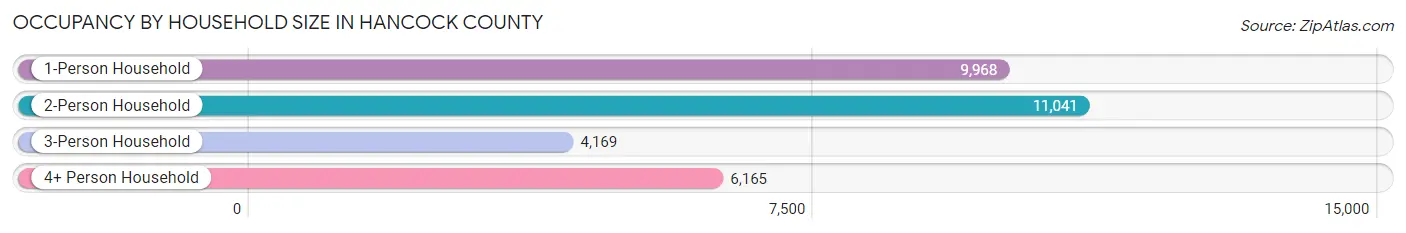
| Household Size | # Housing Units | % Housing Units |
| 1-Person Household | 9,968 | 31.8% |
| 2-Person Household | 11,041 | 35.2% |
| 3-Person Household | 4,169 | 13.3% |
| 4+ Person Household | 6,165 | 19.7% |
| Total Housing Units | 31,343 | 100.0% |
Occupancy by Ownership by Household Size in Hancock County
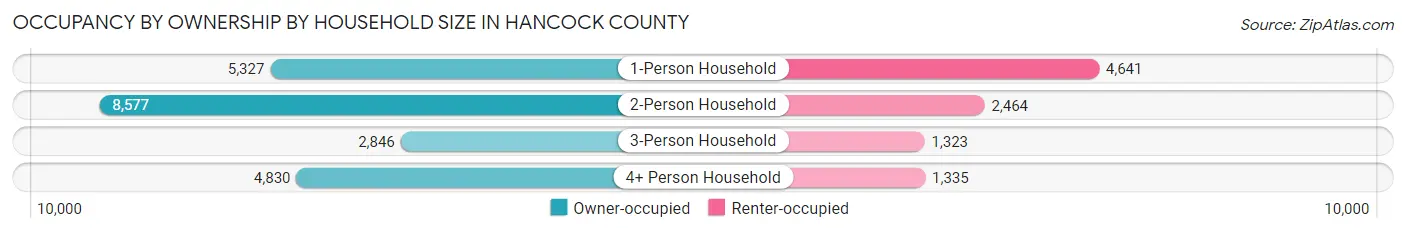
| Household Size | Owner-occupied | Renter-occupied |
| 1-Person Household | 5,327 (53.4%) | 4,641 (46.6%) |
| 2-Person Household | 8,577 (77.7%) | 2,464 (22.3%) |
| 3-Person Household | 2,846 (68.3%) | 1,323 (31.7%) |
| 4+ Person Household | 4,830 (78.3%) | 1,335 (21.6%) |
| Total Housing Units | 21,580 (68.9%) | 9,763 (31.1%) |
Occupancy by Educational Attainment in Hancock County
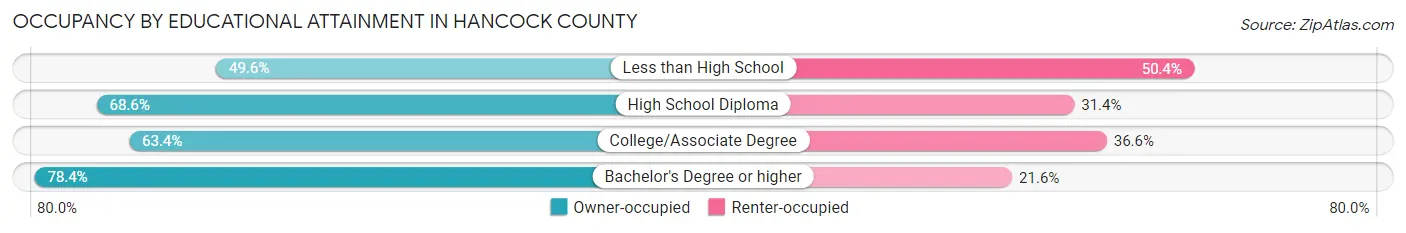
| Household Size | Owner-occupied | Renter-occupied |
| Less than High School | 855 (49.6%) | 868 (50.4%) |
| High School Diploma | 7,286 (68.6%) | 3,338 (31.4%) |
| College/Associate Degree | 6,164 (63.4%) | 3,556 (36.6%) |
| Bachelor's Degree or higher | 7,275 (78.4%) | 2,001 (21.6%) |
Occupancy by Age of Householder in Hancock County
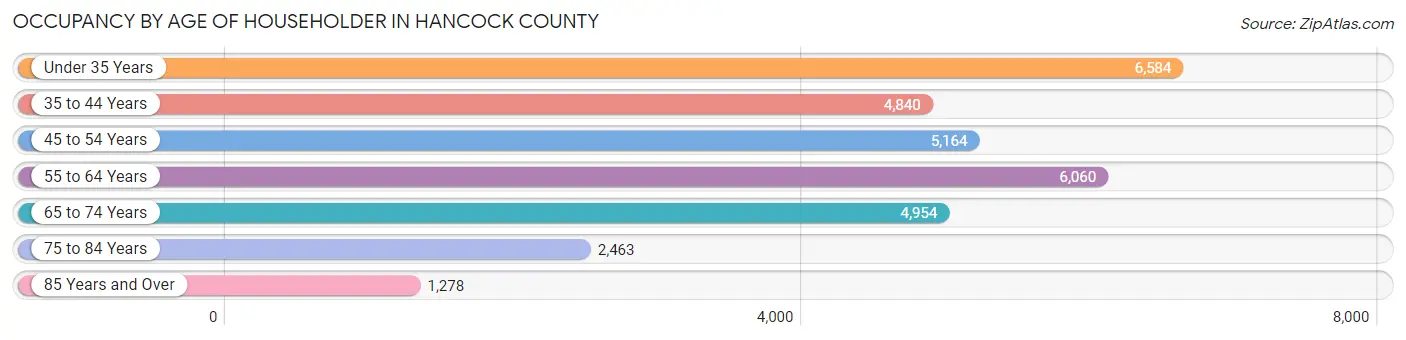
| Age Bracket | # Households | % Households |
| Under 35 Years | 6,584 | 21.0% |
| 35 to 44 Years | 4,840 | 15.4% |
| 45 to 54 Years | 5,164 | 16.5% |
| 55 to 64 Years | 6,060 | 19.3% |
| 65 to 74 Years | 4,954 | 15.8% |
| 75 to 84 Years | 2,463 | 7.9% |
| 85 Years and Over | 1,278 | 4.1% |
| Total | 31,343 | 100.0% |
Housing Finances in Hancock County
Median Income by Occupancy in Hancock County
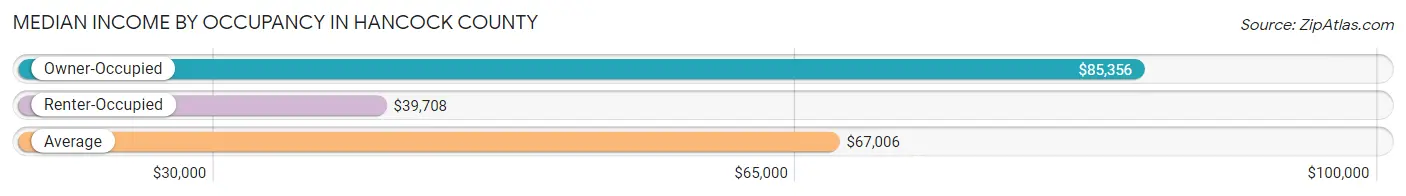
| Occupancy Type | # Households | Median Income |
| Owner-Occupied | 21,580 (68.9%) | $85,356 |
| Renter-Occupied | 9,763 (31.1%) | $39,708 |
| Average | 31,343 (100.0%) | $67,006 |
Occupancy by Householder Income Bracket in Hancock County
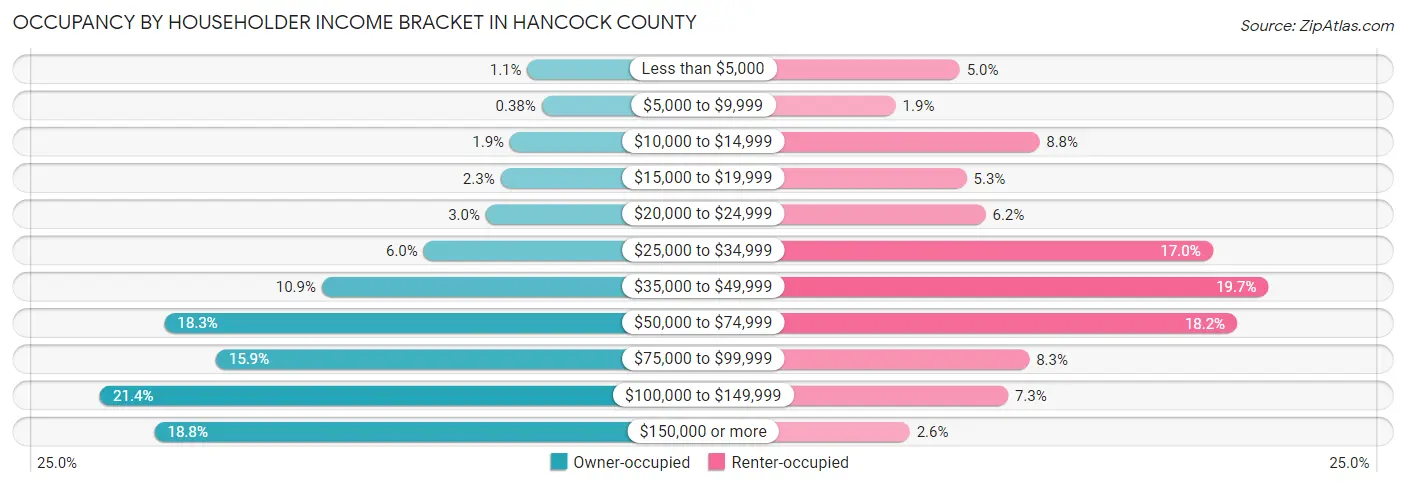
| Income Bracket | Owner-occupied | Renter-occupied |
| Less than $5,000 | 229 (1.1%) | 484 (5.0%) |
| $5,000 to $9,999 | 81 (0.4%) | 186 (1.9%) |
| $10,000 to $14,999 | 408 (1.9%) | 854 (8.7%) |
| $15,000 to $19,999 | 506 (2.3%) | 516 (5.3%) |
| $20,000 to $24,999 | 655 (3.0%) | 604 (6.2%) |
| $25,000 to $34,999 | 1,294 (6.0%) | 1,660 (17.0%) |
| $35,000 to $49,999 | 2,342 (10.8%) | 1,918 (19.7%) |
| $50,000 to $74,999 | 3,958 (18.3%) | 1,773 (18.2%) |
| $75,000 to $99,999 | 3,430 (15.9%) | 807 (8.3%) |
| $100,000 to $149,999 | 4,618 (21.4%) | 709 (7.3%) |
| $150,000 or more | 4,059 (18.8%) | 252 (2.6%) |
| Total | 21,580 (100.0%) | 9,763 (100.0%) |
Monthly Housing Cost Tiers in Hancock County
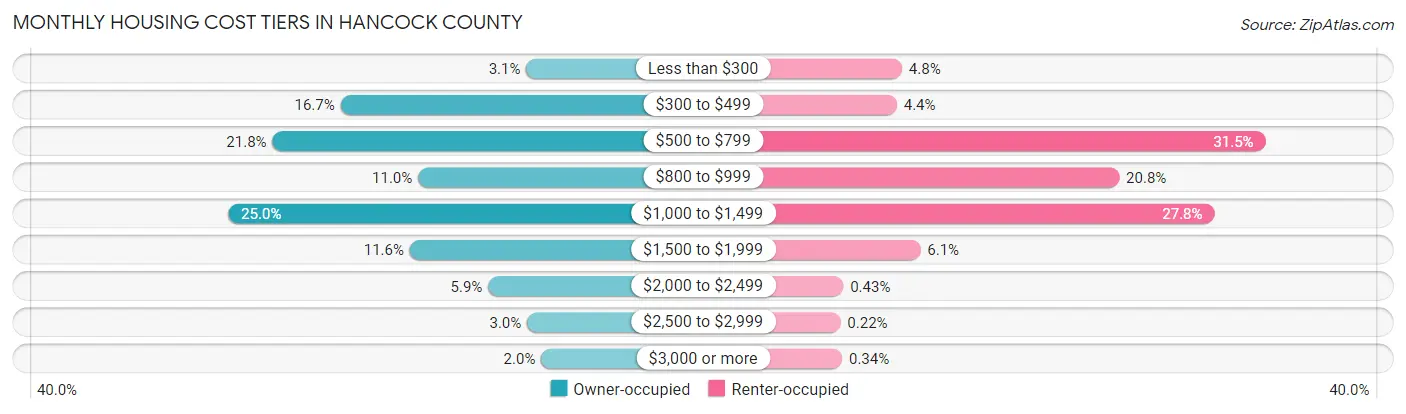
| Monthly Cost | Owner-occupied | Renter-occupied |
| Less than $300 | 659 (3.0%) | 464 (4.8%) |
| $300 to $499 | 3,610 (16.7%) | 427 (4.4%) |
| $500 to $799 | 4,694 (21.7%) | 3,077 (31.5%) |
| $800 to $999 | 2,378 (11.0%) | 2,026 (20.7%) |
| $1,000 to $1,499 | 5,398 (25.0%) | 2,710 (27.8%) |
| $1,500 to $1,999 | 2,510 (11.6%) | 597 (6.1%) |
| $2,000 to $2,499 | 1,264 (5.9%) | 42 (0.4%) |
| $2,500 to $2,999 | 646 (3.0%) | 21 (0.2%) |
| $3,000 or more | 421 (1.9%) | 33 (0.3%) |
| Total | 21,580 (100.0%) | 9,763 (100.0%) |
Physical Housing Characteristics in Hancock County
Housing Structures in Hancock County
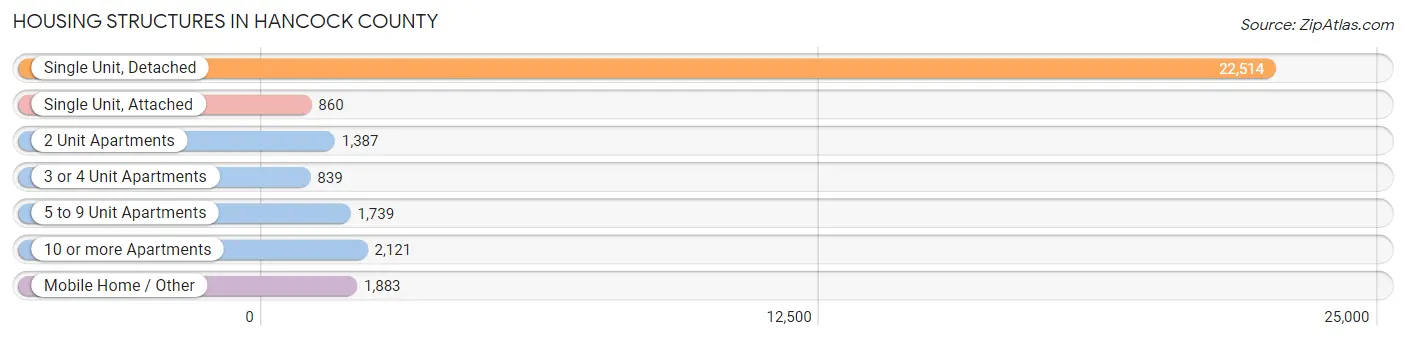
| Structure Type | # Housing Units | % Housing Units |
| Single Unit, Detached | 22,514 | 71.8% |
| Single Unit, Attached | 860 | 2.7% |
| 2 Unit Apartments | 1,387 | 4.4% |
| 3 or 4 Unit Apartments | 839 | 2.7% |
| 5 to 9 Unit Apartments | 1,739 | 5.6% |
| 10 or more Apartments | 2,121 | 6.8% |
| Mobile Home / Other | 1,883 | 6.0% |
| Total | 31,343 | 100.0% |
Housing Structures by Occupancy in Hancock County
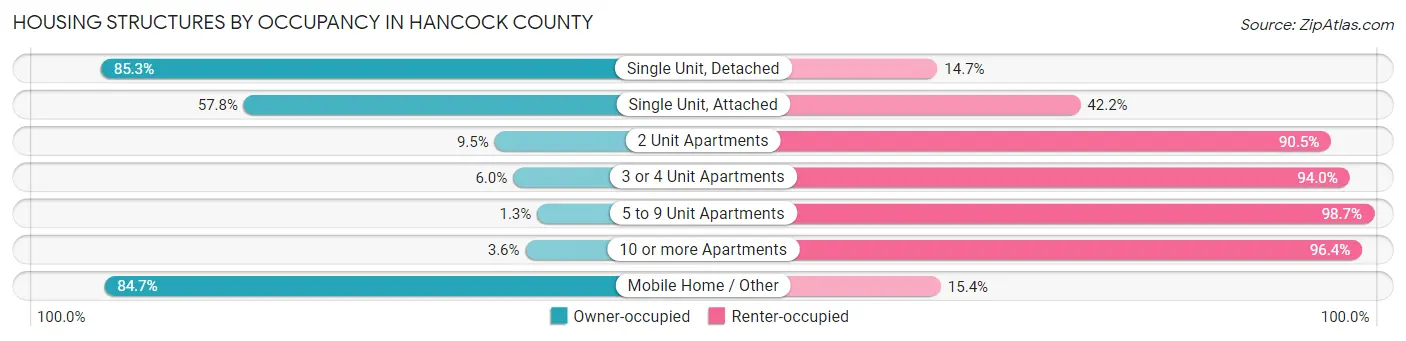
| Structure Type | Owner-occupied | Renter-occupied |
| Single Unit, Detached | 19,208 (85.3%) | 3,306 (14.7%) |
| Single Unit, Attached | 497 (57.8%) | 363 (42.2%) |
| 2 Unit Apartments | 132 (9.5%) | 1,255 (90.5%) |
| 3 or 4 Unit Apartments | 50 (6.0%) | 789 (94.0%) |
| 5 to 9 Unit Apartments | 23 (1.3%) | 1,716 (98.7%) |
| 10 or more Apartments | 76 (3.6%) | 2,045 (96.4%) |
| Mobile Home / Other | 1,594 (84.7%) | 289 (15.3%) |
| Total | 21,580 (68.9%) | 9,763 (31.1%) |
Housing Structures by Number of Rooms in Hancock County
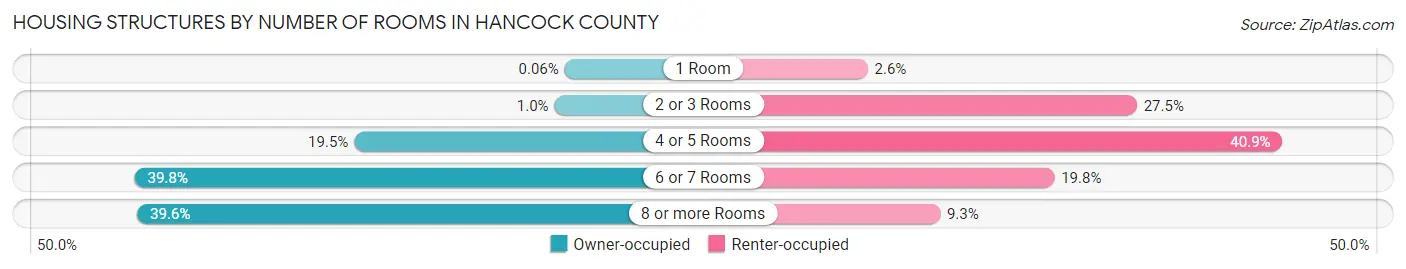
| Number of Rooms | Owner-occupied | Renter-occupied |
| 1 Room | 14 (0.1%) | 250 (2.6%) |
| 2 or 3 Rooms | 216 (1.0%) | 2,680 (27.5%) |
| 4 or 5 Rooms | 4,212 (19.5%) | 3,995 (40.9%) |
| 6 or 7 Rooms | 8,595 (39.8%) | 1,935 (19.8%) |
| 8 or more Rooms | 8,543 (39.6%) | 903 (9.2%) |
| Total | 21,580 (100.0%) | 9,763 (100.0%) |
Housing Structure by Heating Type in Hancock County
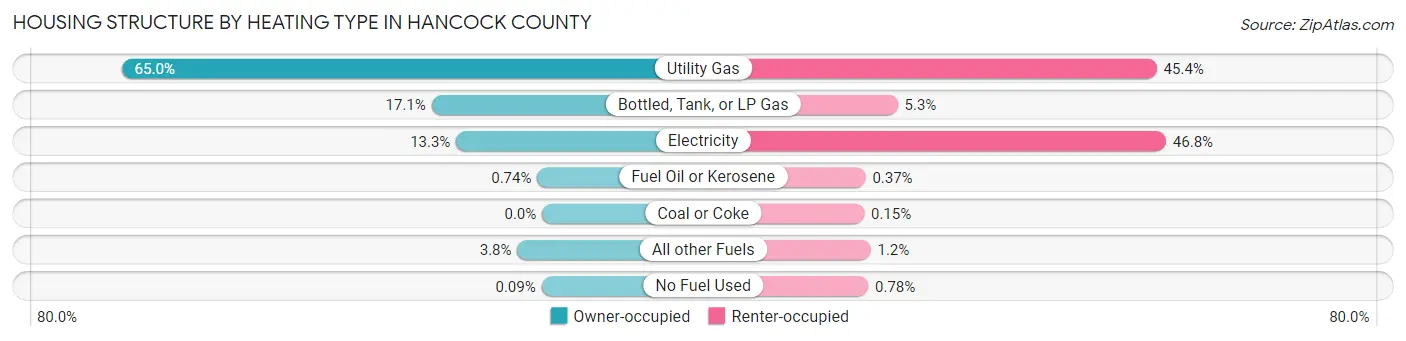
| Heating Type | Owner-occupied | Renter-occupied |
| Utility Gas | 14,025 (65.0%) | 4,431 (45.4%) |
| Bottled, Tank, or LP Gas | 3,687 (17.1%) | 521 (5.3%) |
| Electricity | 2,866 (13.3%) | 4,571 (46.8%) |
| Fuel Oil or Kerosene | 159 (0.7%) | 36 (0.4%) |
| Coal or Coke | 0 (0.0%) | 15 (0.2%) |
| All other Fuels | 824 (3.8%) | 113 (1.2%) |
| No Fuel Used | 19 (0.1%) | 76 (0.8%) |
| Total | 21,580 (100.0%) | 9,763 (100.0%) |
Household Vehicle Usage in Hancock County
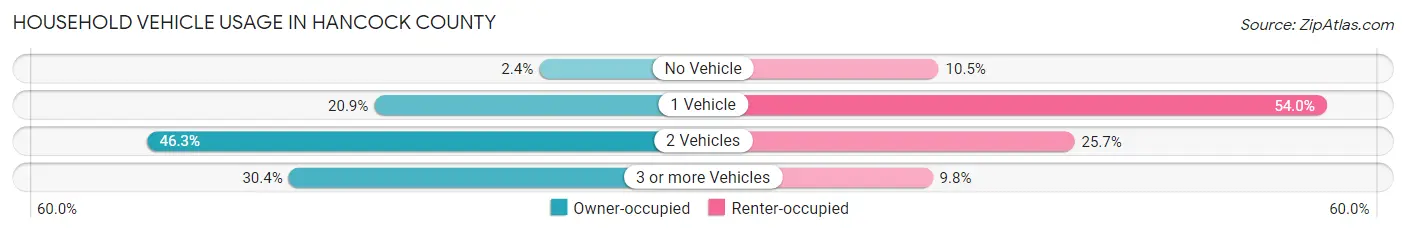
| Vehicles per Household | Owner-occupied | Renter-occupied |
| No Vehicle | 514 (2.4%) | 1,025 (10.5%) |
| 1 Vehicle | 4,500 (20.8%) | 5,267 (53.9%) |
| 2 Vehicles | 9,998 (46.3%) | 2,511 (25.7%) |
| 3 or more Vehicles | 6,568 (30.4%) | 960 (9.8%) |
| Total | 21,580 (100.0%) | 9,763 (100.0%) |
Real Estate & Mortgages in Hancock County
Real Estate and Mortgage Overview in Hancock County
| Characteristic | Without Mortgage | With Mortgage |
| Housing Units | 8,714 | 12,866 |
| Median Property Value | $169,800 | $186,400 |
| Median Household Income | $61,851 | $2,809 |
| Monthly Housing Costs | $514 | $333 |
| Real Estate Taxes | $1,716 | $239 |
Property Value by Mortgage Status in Hancock County
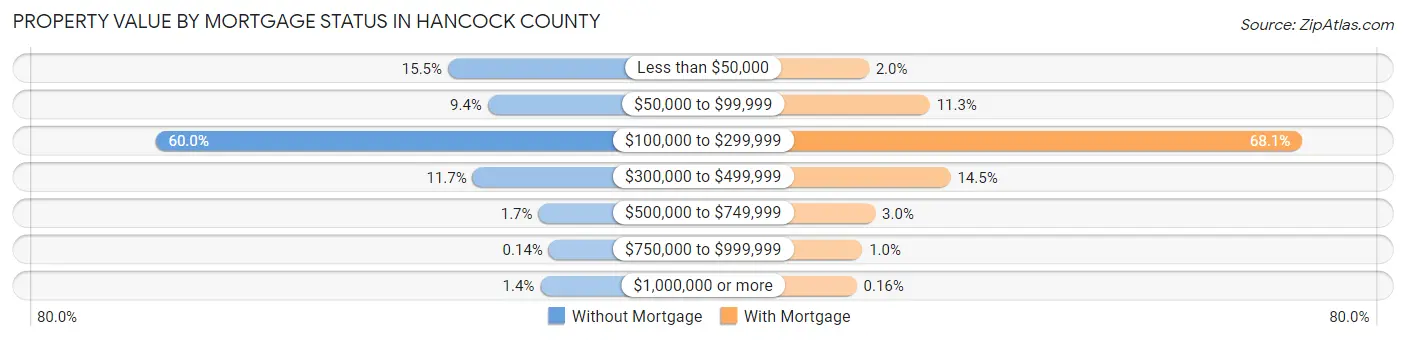
| Property Value | Without Mortgage | With Mortgage |
| Less than $50,000 | 1,351 (15.5%) | 258 (2.0%) |
| $50,000 to $99,999 | 822 (9.4%) | 1,454 (11.3%) |
| $100,000 to $299,999 | 5,232 (60.0%) | 8,755 (68.0%) |
| $300,000 to $499,999 | 1,023 (11.7%) | 1,862 (14.5%) |
| $500,000 to $749,999 | 149 (1.7%) | 385 (3.0%) |
| $750,000 to $999,999 | 12 (0.1%) | 131 (1.0%) |
| $1,000,000 or more | 125 (1.4%) | 21 (0.2%) |
| Total | 8,714 (100.0%) | 12,866 (100.0%) |
Household Income by Mortgage Status in Hancock County
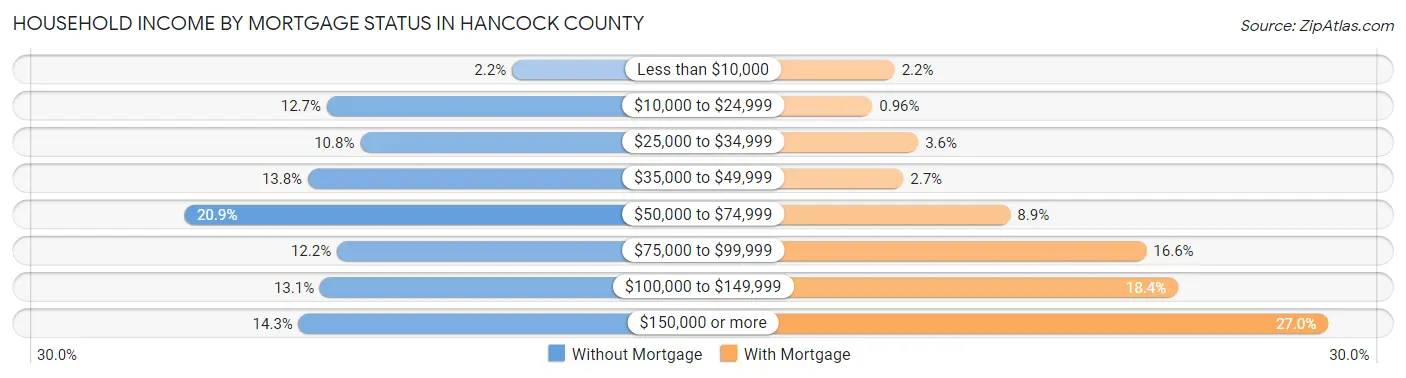
| Household Income | Without Mortgage | With Mortgage |
| Less than $10,000 | 187 (2.1%) | 288 (2.2%) |
| $10,000 to $24,999 | 1,109 (12.7%) | 123 (1.0%) |
| $25,000 to $34,999 | 943 (10.8%) | 460 (3.6%) |
| $35,000 to $49,999 | 1,203 (13.8%) | 351 (2.7%) |
| $50,000 to $74,999 | 1,820 (20.9%) | 1,139 (8.8%) |
| $75,000 to $99,999 | 1,059 (12.1%) | 2,138 (16.6%) |
| $100,000 to $149,999 | 1,143 (13.1%) | 2,371 (18.4%) |
| $150,000 or more | 1,250 (14.3%) | 3,475 (27.0%) |
| Total | 8,714 (100.0%) | 12,866 (100.0%) |
Property Value to Household Income Ratio in Hancock County
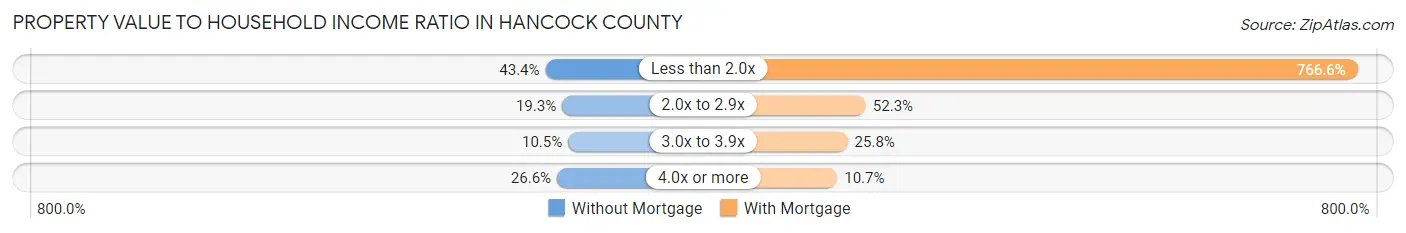
| Value-to-Income Ratio | Without Mortgage | With Mortgage |
| Less than 2.0x | 3,783 (43.4%) | 98,631 (766.6%) |
| 2.0x to 2.9x | 1,678 (19.3%) | 6,732 (52.3%) |
| 3.0x to 3.9x | 914 (10.5%) | 3,313 (25.8%) |
| 4.0x or more | 2,320 (26.6%) | 1,381 (10.7%) |
| Total | 8,714 (100.0%) | 12,866 (100.0%) |
Real Estate Taxes by Mortgage Status in Hancock County
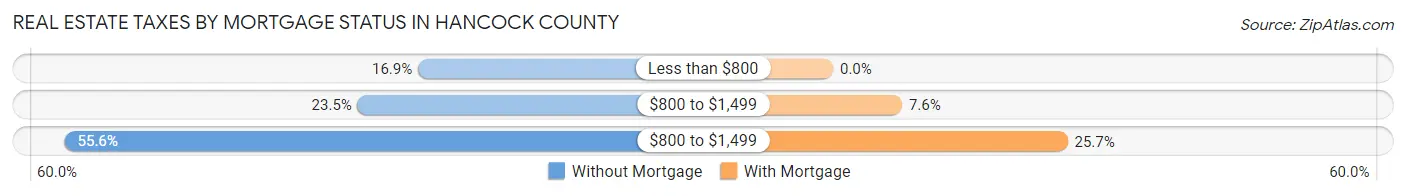
| Property Taxes | Without Mortgage | With Mortgage |
| Less than $800 | 1,471 (16.9%) | 0 (0.0%) |
| $800 to $1,499 | 2,048 (23.5%) | 971 (7.5%) |
| $800 to $1,499 | 4,846 (55.6%) | 3,306 (25.7%) |
| Total | 8,714 (100.0%) | 12,866 (100.0%) |
Health & Disability in Hancock County
Health Insurance Coverage by Age in Hancock County
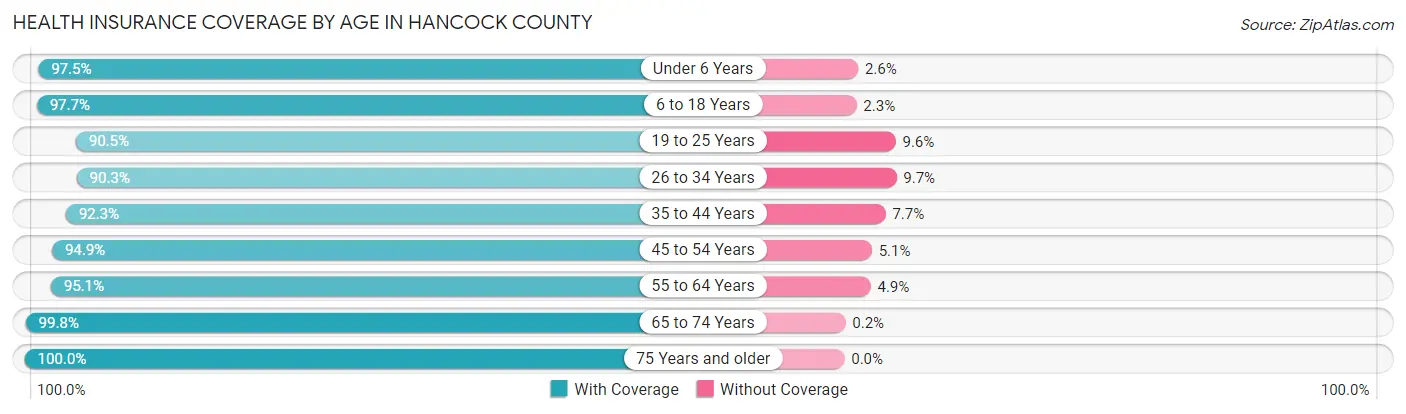
| Age Bracket | With Coverage | Without Coverage |
| Under 6 Years | 5,496 (97.5%) | 144 (2.5%) |
| 6 to 18 Years | 11,697 (97.7%) | 271 (2.3%) |
| 19 to 25 Years | 6,527 (90.4%) | 689 (9.6%) |
| 26 to 34 Years | 7,768 (90.3%) | 835 (9.7%) |
| 35 to 44 Years | 8,173 (92.3%) | 680 (7.7%) |
| 45 to 54 Years | 8,695 (94.9%) | 468 (5.1%) |
| 55 to 64 Years | 9,409 (95.1%) | 484 (4.9%) |
| 65 to 74 Years | 7,661 (99.8%) | 15 (0.2%) |
| 75 Years and older | 5,217 (100.0%) | 0 (0.0%) |
| Total | 70,643 (95.2%) | 3,586 (4.8%) |
Health Insurance Coverage by Citizenship Status in Hancock County
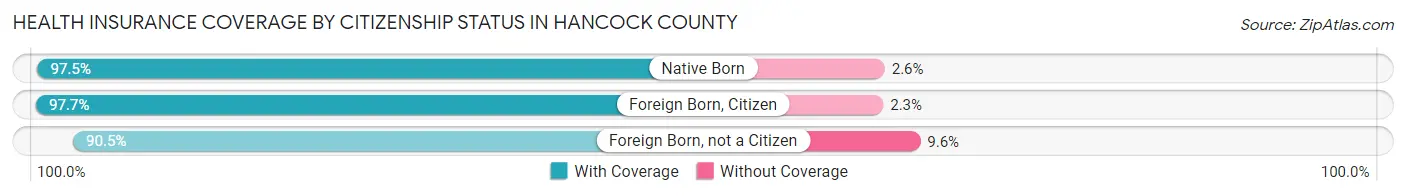
| Citizenship Status | With Coverage | Without Coverage |
| Native Born | 5,496 (97.5%) | 144 (2.5%) |
| Foreign Born, Citizen | 11,697 (97.7%) | 271 (2.3%) |
| Foreign Born, not a Citizen | 6,527 (90.4%) | 689 (9.6%) |
Health Insurance Coverage by Household Income in Hancock County
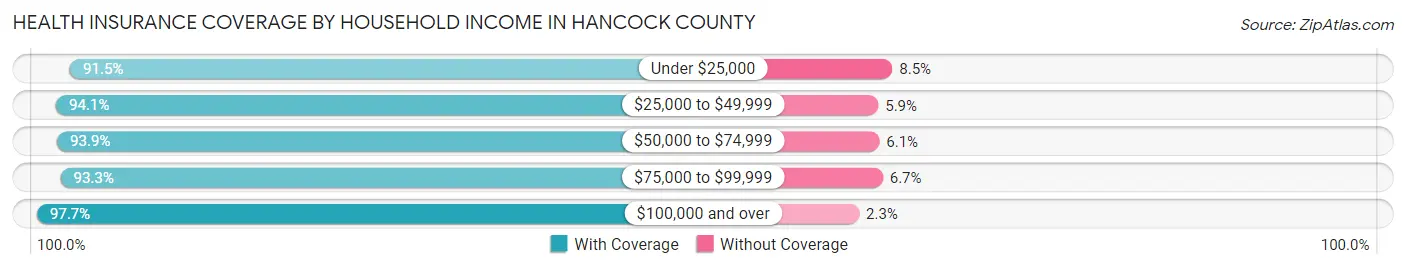
| Household Income | With Coverage | Without Coverage |
| Under $25,000 | 6,031 (91.5%) | 563 (8.5%) |
| $25,000 to $49,999 | 12,145 (94.1%) | 762 (5.9%) |
| $50,000 to $74,999 | 12,355 (93.9%) | 802 (6.1%) |
| $75,000 to $99,999 | 10,176 (93.3%) | 735 (6.7%) |
| $100,000 and over | 28,890 (97.7%) | 680 (2.3%) |
Public vs Private Health Insurance Coverage by Age in Hancock County
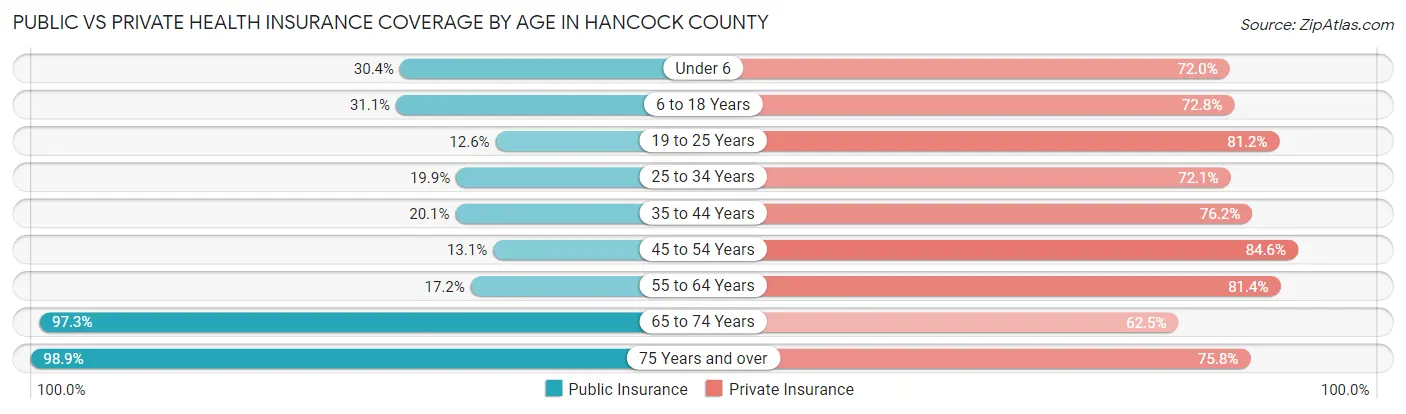
| Age Bracket | Public Insurance | Private Insurance |
| Under 6 | 1,712 (30.3%) | 4,059 (72.0%) |
| 6 to 18 Years | 3,719 (31.1%) | 8,711 (72.8%) |
| 19 to 25 Years | 910 (12.6%) | 5,860 (81.2%) |
| 25 to 34 Years | 1,715 (19.9%) | 6,203 (72.1%) |
| 35 to 44 Years | 1,775 (20.1%) | 6,742 (76.1%) |
| 45 to 54 Years | 1,197 (13.1%) | 7,756 (84.6%) |
| 55 to 64 Years | 1,704 (17.2%) | 8,050 (81.4%) |
| 65 to 74 Years | 7,469 (97.3%) | 4,794 (62.5%) |
| 75 Years and over | 5,161 (98.9%) | 3,954 (75.8%) |
| Total | 25,362 (34.2%) | 56,129 (75.6%) |
Disability Status by Sex by Age in Hancock County
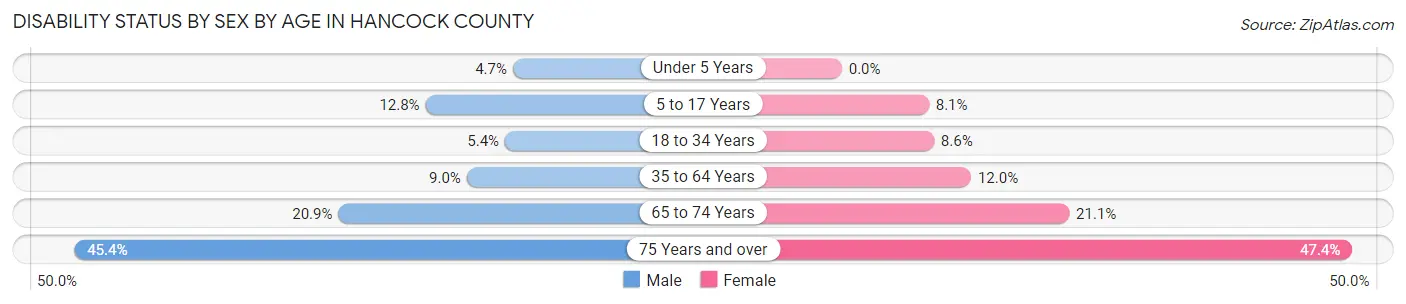
| Age Bracket | Male | Female |
| Under 5 Years | 102 (4.7%) | 0 (0.0%) |
| 5 to 17 Years | 769 (12.8%) | 472 (8.1%) |
| 18 to 34 Years | 467 (5.4%) | 718 (8.6%) |
| 35 to 64 Years | 1,272 (9.0%) | 1,647 (12.0%) |
| 65 to 74 Years | 762 (20.9%) | 850 (21.1%) |
| 75 Years and over | 964 (45.4%) | 1,465 (47.4%) |
Disability Class by Sex by Age in Hancock County
Disability Class: Hearing Difficulty
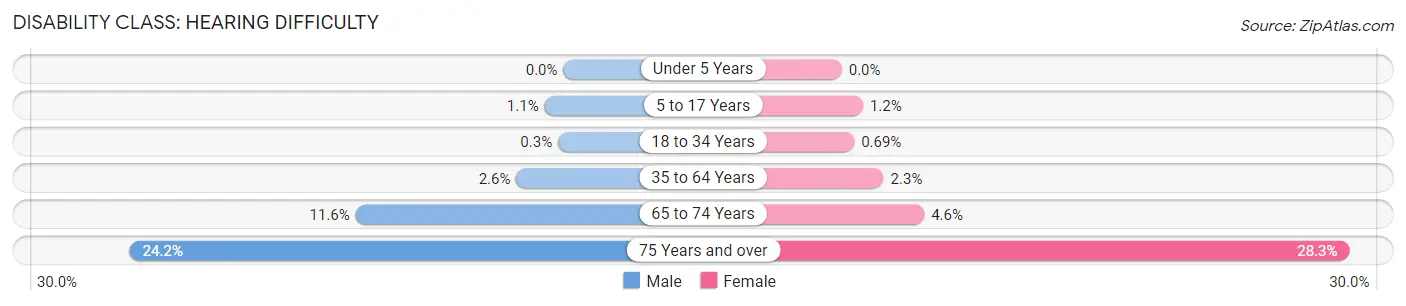
| Age Bracket | Male | Female |
| Under 5 Years | 0 (0.0%) | 0 (0.0%) |
| 5 to 17 Years | 63 (1.1%) | 69 (1.2%) |
| 18 to 34 Years | 26 (0.3%) | 58 (0.7%) |
| 35 to 64 Years | 372 (2.6%) | 320 (2.3%) |
| 65 to 74 Years | 422 (11.6%) | 185 (4.6%) |
| 75 Years and over | 513 (24.1%) | 874 (28.3%) |
Disability Class: Vision Difficulty
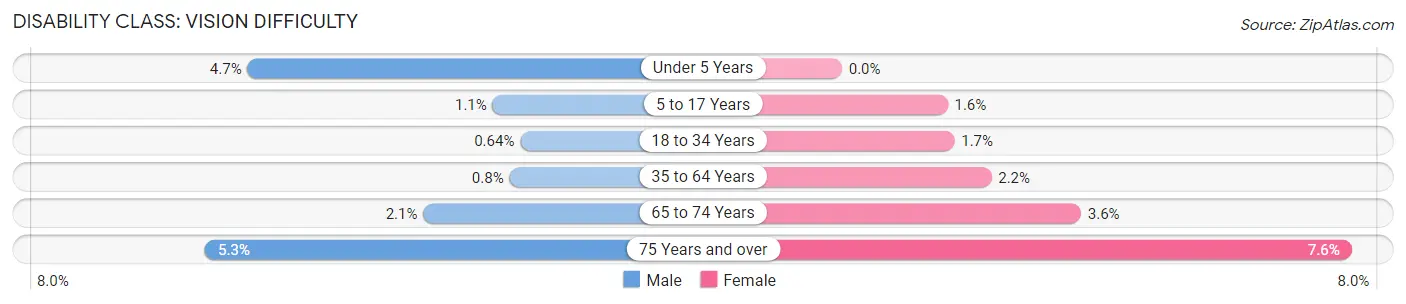
| Age Bracket | Male | Female |
| Under 5 Years | 102 (4.7%) | 0 (0.0%) |
| 5 to 17 Years | 63 (1.1%) | 92 (1.6%) |
| 18 to 34 Years | 55 (0.6%) | 140 (1.7%) |
| 35 to 64 Years | 113 (0.8%) | 305 (2.2%) |
| 65 to 74 Years | 76 (2.1%) | 143 (3.5%) |
| 75 Years and over | 113 (5.3%) | 234 (7.6%) |
Disability Class: Cognitive Difficulty
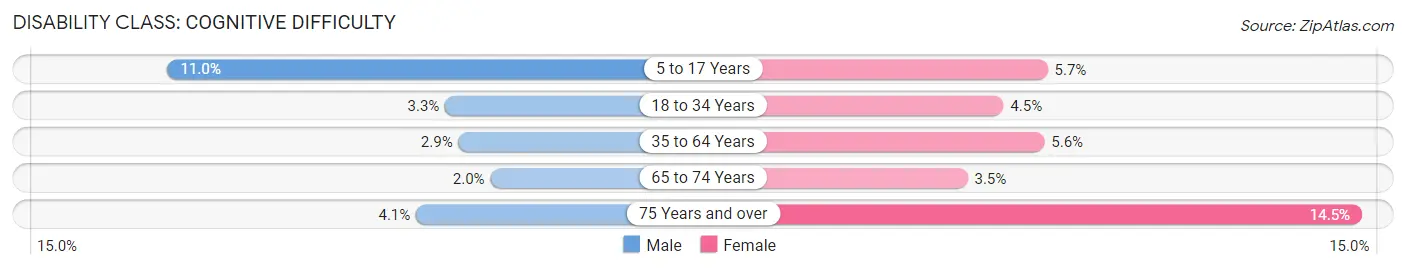
| Age Bracket | Male | Female |
| 5 to 17 Years | 662 (11.0%) | 335 (5.7%) |
| 18 to 34 Years | 284 (3.3%) | 378 (4.5%) |
| 35 to 64 Years | 414 (2.9%) | 774 (5.6%) |
| 65 to 74 Years | 74 (2.0%) | 141 (3.5%) |
| 75 Years and over | 87 (4.1%) | 448 (14.5%) |
Disability Class: Ambulatory Difficulty
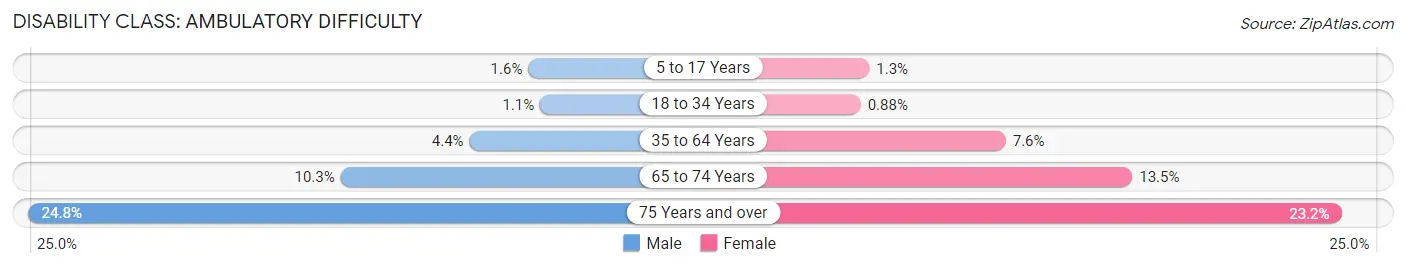
| Age Bracket | Male | Female |
| 5 to 17 Years | 98 (1.6%) | 75 (1.3%) |
| 18 to 34 Years | 93 (1.1%) | 74 (0.9%) |
| 35 to 64 Years | 618 (4.4%) | 1,045 (7.6%) |
| 65 to 74 Years | 377 (10.3%) | 543 (13.5%) |
| 75 Years and over | 527 (24.8%) | 717 (23.2%) |
Disability Class: Self-Care Difficulty
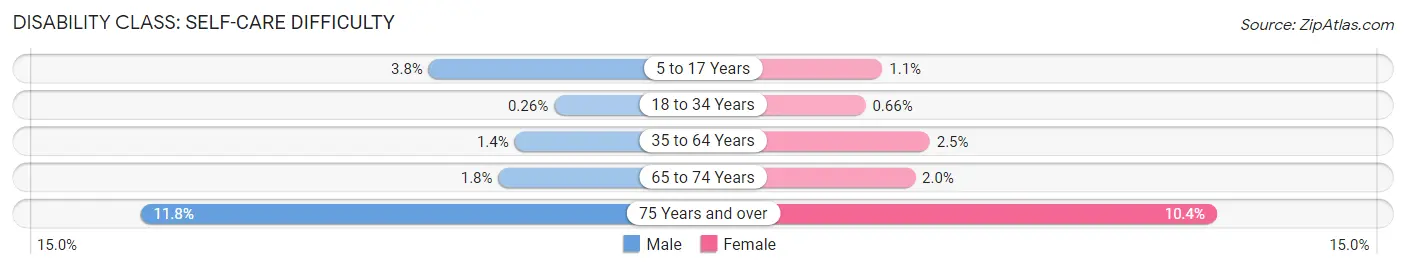
| Age Bracket | Male | Female |
| 5 to 17 Years | 225 (3.7%) | 66 (1.1%) |
| 18 to 34 Years | 22 (0.3%) | 55 (0.7%) |
| 35 to 64 Years | 193 (1.4%) | 336 (2.5%) |
| 65 to 74 Years | 66 (1.8%) | 82 (2.0%) |
| 75 Years and over | 250 (11.8%) | 323 (10.4%) |
Technology Access in Hancock County
Computing Device Access in Hancock County
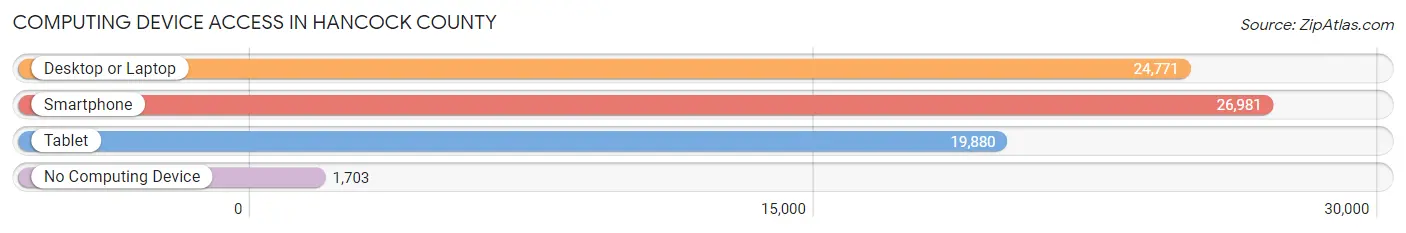
| Device Type | # Households | % Households |
| Desktop or Laptop | 24,771 | 79.0% |
| Smartphone | 26,981 | 86.1% |
| Tablet | 19,880 | 63.4% |
| No Computing Device | 1,703 | 5.4% |
| Total | 31,343 | 100.0% |
Internet Access in Hancock County
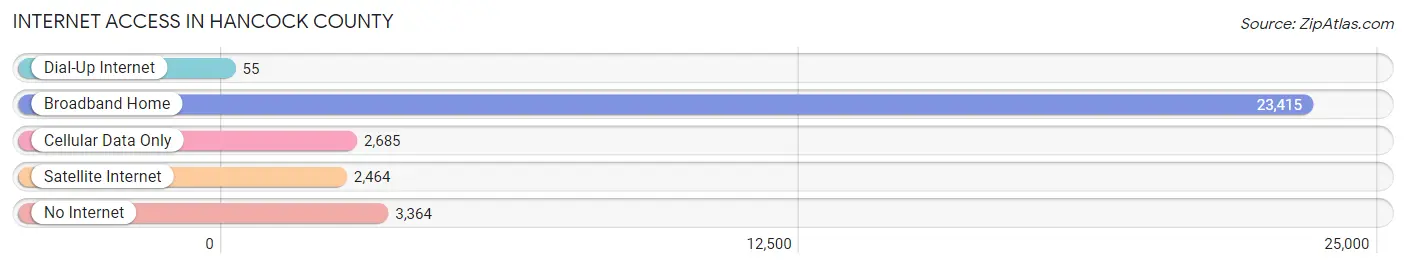
| Internet Type | # Households | % Households |
| Dial-Up Internet | 55 | 0.2% |
| Broadband Home | 23,415 | 74.7% |
| Cellular Data Only | 2,685 | 8.6% |
| Satellite Internet | 2,464 | 7.9% |
| No Internet | 3,364 | 10.7% |
| Total | 31,343 | 100.0% |
Hancock County Summary
Hancock County is located in the northwestern corner of the state of Ohio, and is part of the Toledo Metropolitan Statistical Area. The county was established in 1820 and named after John Hancock, the first signer of the Declaration of Independence. The county seat is Findlay, and the county is home to a population of 74,782 people, according to the 2010 census.
Geography
Hancock County is located in the northwestern corner of Ohio, and is bordered by Wood County to the north, Seneca County to the east, Wyandot County to the south, and Putnam County to the west. The county covers an area of 437 square miles, and is mostly flat, with some rolling hills in the northern part of the county. The Blanchard River runs through the county, and is a major tributary of the Maumee River. The county is also home to several small lakes, including Lake La Su An, Lake Cascades, and Lake Blanchard.
Demographics
According to the 2010 census, Hancock County had a population of 74,782 people. The racial makeup of the county was 94.2% White, 2.3% African American, 0.4% Native American, 0.7% Asian, 0.1% Pacific Islander, 0.7% from other races, and 1.6% from two or more races. Hispanic or Latino of any race were 2.2% of the population.
The median household income in Hancock County was $45,945, and the median family income was $54,945. The per capita income was $22,845. About 8.7% of families and 11.3% of the population were below the poverty line, including 15.2% of those under age 18 and 6.7% of those age 65 or over.
Economy
Hancock County is home to a diverse economy, with a mix of manufacturing, agriculture, and service industries. The county is home to several large employers, including Marathon Petroleum Corporation, Cooper Tire & Rubber Company, Whirlpool Corporation, and the Findlay Automotive Group. The county is also home to several small businesses, including restaurants, retail stores, and professional services.
Agriculture is an important part of the county's economy, with corn, soybeans, and wheat being the main crops. Livestock production is also important, with cattle, hogs, and poultry being the main animals raised.
The county is also home to several tourist attractions, including the Hancock Historical Museum, the Findlay Village Mall, and the Blanchard River Nature Preserve.
Conclusion
Hancock County is a diverse and vibrant county located in the northwestern corner of Ohio. The county is home to a population of 74,782 people, and is home to a diverse economy, with a mix of manufacturing, agriculture, and service industries. The county is also home to several tourist attractions, making it a great place to visit and explore.
Common Questions
What is Per Capita Income in Hancock County?
Per Capita income in Hancock County is $37,479.
What is the Median Family Income in Hancock County?
Median Family Income in Hancock County is $88,135.
What is the Median Household income in Hancock County?
Median Household Income in Hancock County is $67,006.
What is Income or Wage Gap in Hancock County?
Income or Wage Gap in Hancock County is 34.1%.
Women in Hancock County earn 65.9 cents for every dollar earned by a man.
What is Family Income Deficit in Hancock County?
Family Income Deficit in Hancock County is $11,058.
Families that are below poverty line in Hancock County earn $11,058 less on average than the poverty threshold level.
What is Inequality or Gini Index in Hancock County?
Inequality or Gini Index in Hancock County is 0.44.
What is the Total Population of Hancock County?
Total Population of Hancock County is 75,072.
What is the Total Male Population of Hancock County?
Total Male Population of Hancock County is 37,079.
What is the Total Female Population of Hancock County?
Total Female Population of Hancock County is 37,993.
What is the Ratio of Males per 100 Females in Hancock County?
There are 97.59 Males per 100 Females in Hancock County.
What is the Ratio of Females per 100 Males in Hancock County?
There are 102.47 Females per 100 Males in Hancock County.
What is the Median Population Age in Hancock County?
Median Population Age in Hancock County is 39.4 Years.
What is the Average Family Size in Hancock County
Average Family Size in Hancock County is 2.9 People.
What is the Average Household Size in Hancock County
Average Household Size in Hancock County is 2.3 People.
How Large is the Labor Force in Hancock County?
There are 39,071 People in the Labor Forcein in Hancock County.
What is the Percentage of People in the Labor Force in Hancock County?
64.5% of People are in the Labor Force in Hancock County.
What is the Unemployment Rate in Hancock County?
Unemployment Rate in Hancock County is 3.7%.