Defiance County, OH Map & Demographics
Defiance County Map
Defiance County Overview
$33,533
PER CAPITA INCOME
$81,947
AVG FAMILY INCOME
$69,302
AVG HOUSEHOLD INCOME
31.4%
WAGE / INCOME GAP [ % ]
68.6¢/ $1
WAGE / INCOME GAP [ $ ]
$9,723
FAMILY INCOME DEFICIT
0.40
INEQUALITY / GINI INDEX
38,300
TOTAL POPULATION
19,277
MALE POPULATION
19,023
FEMALE POPULATION
101.34
MALES / 100 FEMALES
98.68
FEMALES / 100 MALES
40.8
MEDIAN AGE
3.0
AVG FAMILY SIZE
2.5
AVG HOUSEHOLD SIZE
19,786
LABOR FORCE [ PEOPLE ]
64.6%
PERCENT IN LABOR FORCE
4.9%
UNEMPLOYMENT RATE
Income in Defiance County
Income Overview in Defiance County
Per Capita Income in Defiance County is $33,533, while median incomes of families and households are $81,947 and $69,302 respectively.
| Characteristic | Number | Measure |
| Per Capita Income | 38,300 | $33,533 |
| Median Family Income | 10,323 | $81,947 |
| Mean Family Income | 10,323 | $94,028 |
| Median Household Income | 15,262 | $69,302 |
| Mean Household Income | 15,262 | $83,014 |
| Income Deficit | 10,323 | $9,723 |
| Wage / Income Gap (%) | 38,300 | 31.43% |
| Wage / Income Gap ($) | 38,300 | 68.57¢ per $1 |
| Gini / Inequality Index | 38,300 | 0.40 |
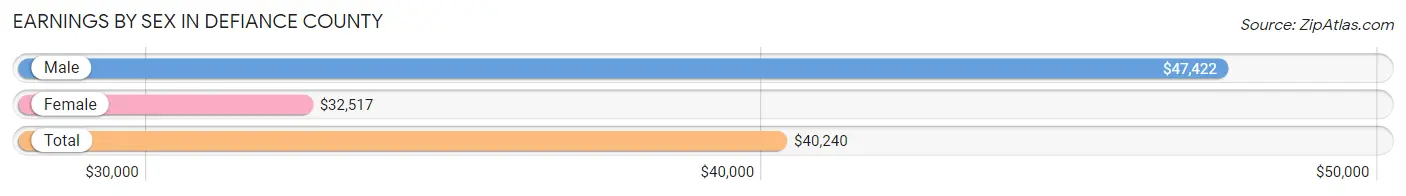
Earnings by Sex in Defiance County
Average Earnings in Defiance County are $40,240, $47,422 for men and $32,517 for women, a difference of 31.4%.
| Sex | Number | Average Earnings |
| Male | 11,049 (53.9%) | $47,422 |
| Female | 9,433 (46.1%) | $32,517 |
| Total | 20,482 (100.0%) | $40,240 |
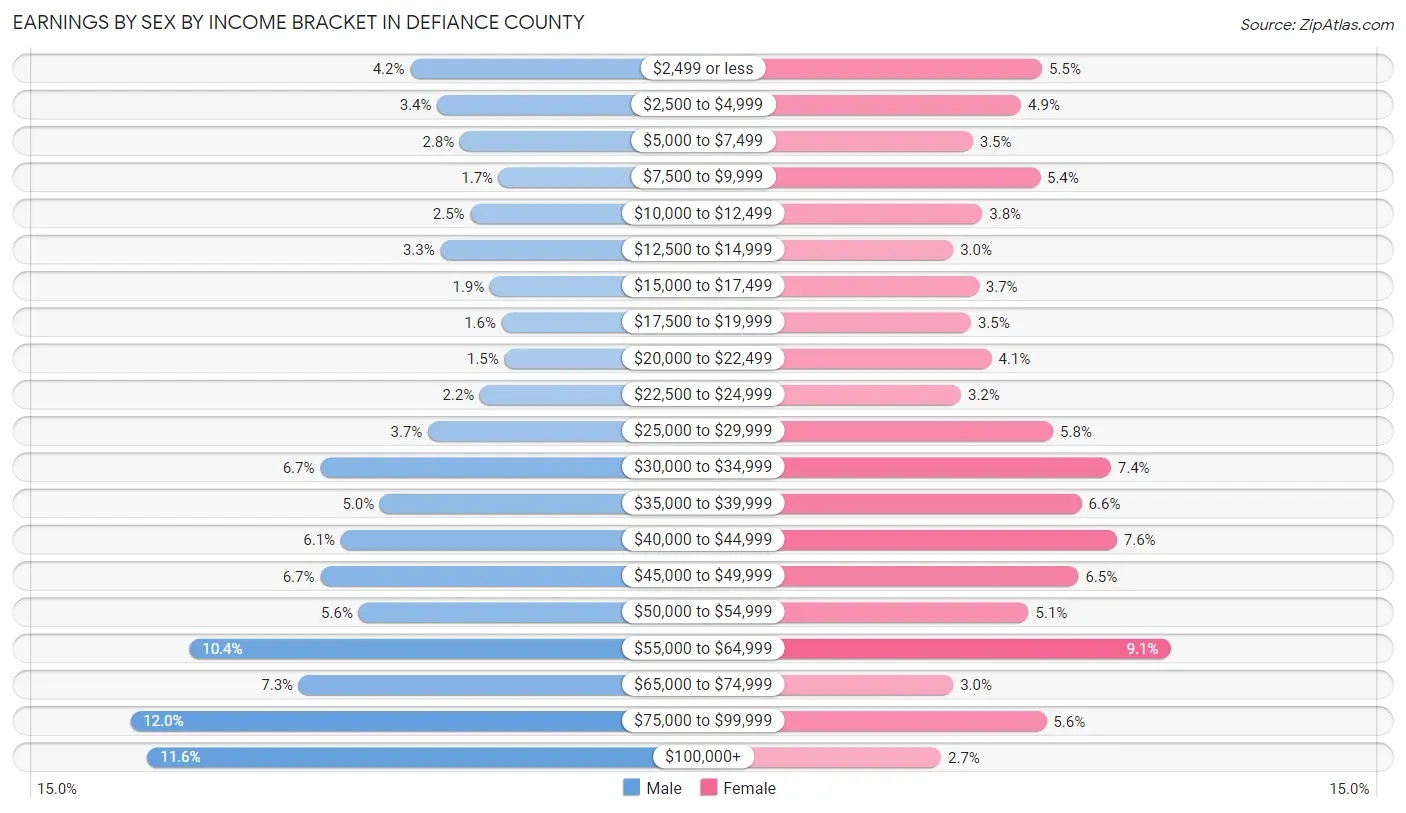
Earnings by Sex by Income Bracket in Defiance County
The most common earnings brackets in Defiance County are $75,000 to $99,999 for men (1,329 | 12.0%) and $55,000 to $64,999 for women (857 | 9.1%).
| Income | Male | Female |
| $2,499 or less | 460 (4.2%) | 518 (5.5%) |
| $2,500 to $4,999 | 376 (3.4%) | 462 (4.9%) |
| $5,000 to $7,499 | 305 (2.8%) | 334 (3.5%) |
| $7,500 to $9,999 | 184 (1.7%) | 512 (5.4%) |
| $10,000 to $12,499 | 273 (2.5%) | 359 (3.8%) |
| $12,500 to $14,999 | 366 (3.3%) | 282 (3.0%) |
| $15,000 to $17,499 | 212 (1.9%) | 350 (3.7%) |
| $17,500 to $19,999 | 176 (1.6%) | 329 (3.5%) |
| $20,000 to $22,499 | 167 (1.5%) | 384 (4.1%) |
| $22,500 to $24,999 | 243 (2.2%) | 303 (3.2%) |
| $25,000 to $29,999 | 404 (3.7%) | 547 (5.8%) |
| $30,000 to $34,999 | 739 (6.7%) | 700 (7.4%) |
| $35,000 to $39,999 | 554 (5.0%) | 623 (6.6%) |
| $40,000 to $44,999 | 675 (6.1%) | 716 (7.6%) |
| $45,000 to $49,999 | 739 (6.7%) | 614 (6.5%) |
| $50,000 to $54,999 | 620 (5.6%) | 482 (5.1%) |
| $55,000 to $64,999 | 1,146 (10.4%) | 857 (9.1%) |
| $65,000 to $74,999 | 805 (7.3%) | 282 (3.0%) |
| $75,000 to $99,999 | 1,329 (12.0%) | 529 (5.6%) |
| $100,000+ | 1,276 (11.6%) | 250 (2.6%) |
| Total | 11,049 (100.0%) | 9,433 (100.0%) |
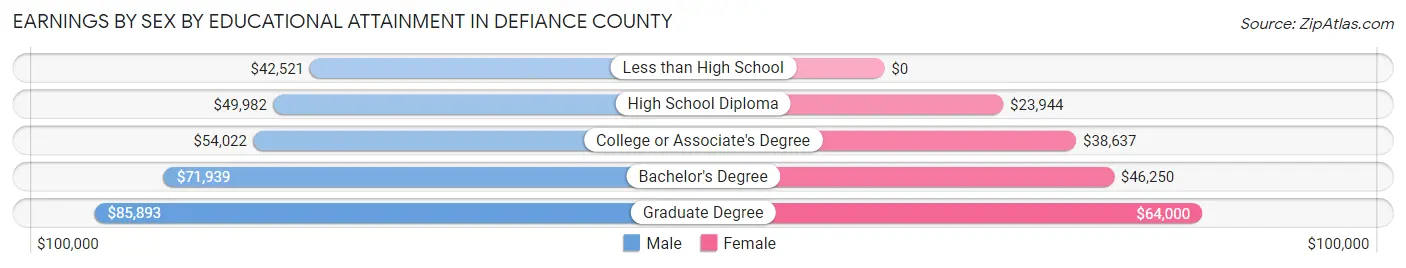
Earnings by Sex by Educational Attainment in Defiance County
Average earnings in Defiance County are $53,116 for men and $36,196 for women, a difference of 31.9%. Men with an educational attainment of graduate degree enjoy the highest average annual earnings of $85,893, while those with less than high school education earn the least with $42,521. Women with an educational attainment of graduate degree earn the most with the average annual earnings of $64,000, while those with high school diploma education have the smallest earnings of $23,944.
| Educational Attainment | Male Income | Female Income |
| Less than High School | $42,521 | $0 |
| High School Diploma | $49,982 | $23,944 |
| College or Associate's Degree | $54,022 | $38,637 |
| Bachelor's Degree | $71,939 | $46,250 |
| Graduate Degree | $85,893 | $64,000 |
| Total | $53,116 | $36,196 |
Family Income in Defiance County
Family Income Brackets in Defiance County
According to the Defiance County family income data, there are 2,519 families falling into the $100,000 to $149,999 income range, which is the most common income bracket and makes up 24.4% of all families. Conversely, the $10,000 to $14,999 income bracket is the least frequent group with only 134 families (1.3%) belonging to this category.
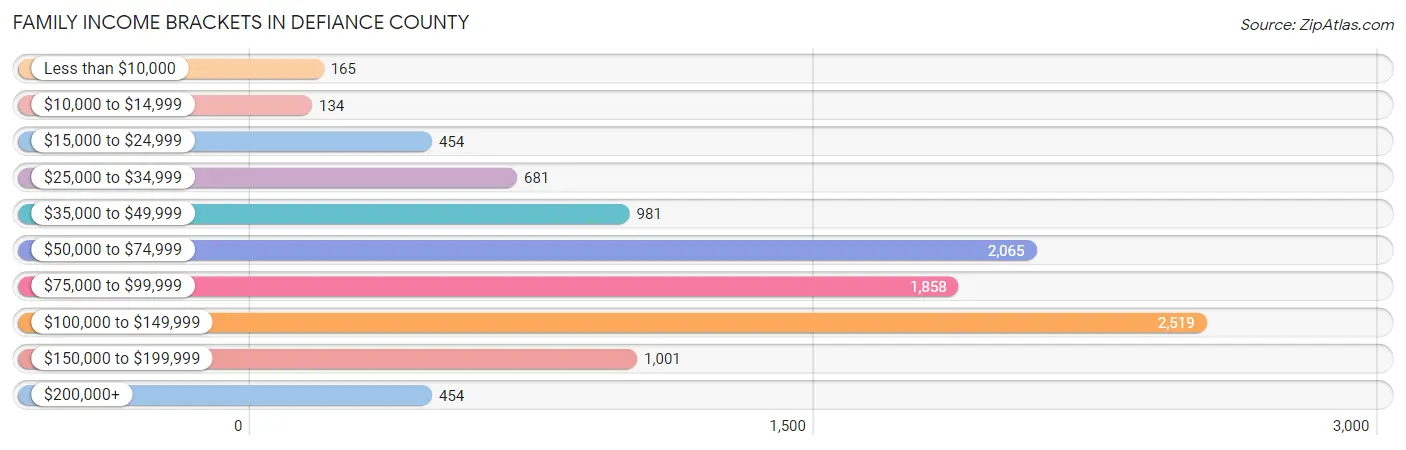
| Income Bracket | # Families | % Families |
| Less than $10,000 | 165 | 1.6% |
| $10,000 to $14,999 | 134 | 1.3% |
| $15,000 to $24,999 | 454 | 4.4% |
| $25,000 to $34,999 | 681 | 6.6% |
| $35,000 to $49,999 | 981 | 9.5% |
| $50,000 to $74,999 | 2,065 | 20.0% |
| $75,000 to $99,999 | 1,858 | 18.0% |
| $100,000 to $149,999 | 2,519 | 24.4% |
| $150,000 to $199,999 | 1,001 | 9.7% |
| $200,000+ | 454 | 4.4% |
Family Income by Famaliy Size in Defiance County
6-person families (310 | 3.0%) account for the highest median family income in Defiance County with $141,250 per family, while 2-person families (5,685 | 55.1%) have the highest median income of $37,085 per family member.
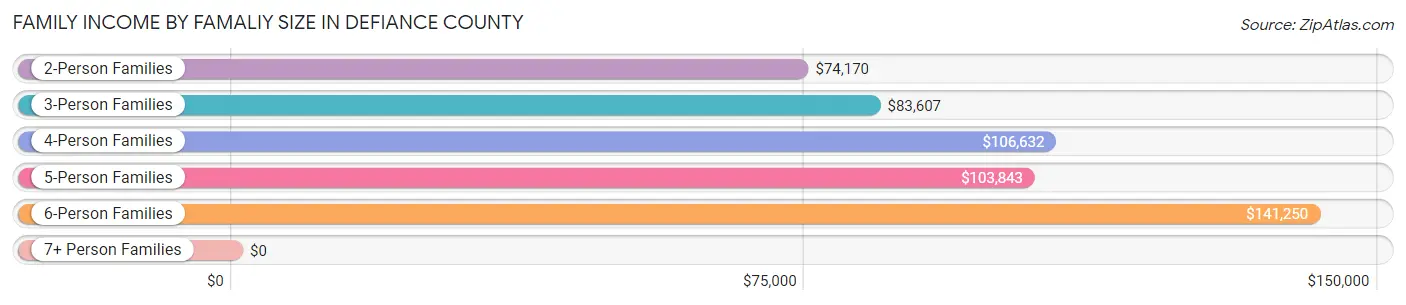
| Income Bracket | # Families | Median Income |
| 2-Person Families | 5,685 (55.1%) | $74,170 |
| 3-Person Families | 1,819 (17.6%) | $83,607 |
| 4-Person Families | 1,712 (16.6%) | $106,632 |
| 5-Person Families | 656 (6.4%) | $103,843 |
| 6-Person Families | 310 (3.0%) | $141,250 |
| 7+ Person Families | 141 (1.4%) | $0 |
| Total | 10,323 (100.0%) | $81,947 |
Family Income by Number of Earners in Defiance County
The median family income in Defiance County is $81,947, with families comprising 3+ earners (849) having the highest median family income of $142,625, while families with no earners (1,725) have the lowest median family income of $52,756, accounting for 8.2% and 16.7% of families, respectively.
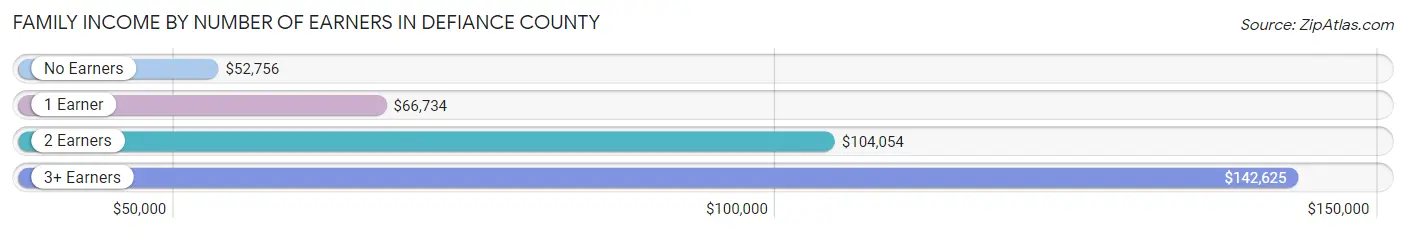
| Number of Earners | # Families | Median Income |
| No Earners | 1,725 (16.7%) | $52,756 |
| 1 Earner | 3,151 (30.5%) | $66,734 |
| 2 Earners | 4,598 (44.5%) | $104,054 |
| 3+ Earners | 849 (8.2%) | $142,625 |
| Total | 10,323 (100.0%) | $81,947 |
Household Income in Defiance County
Household Income Brackets in Defiance County
With 3,052 households falling in the category, the $50,000 to $74,999 income range is the most frequent in Defiance County, accounting for 20.0% of all households. In contrast, only 382 households (2.5%) fall into the less than $10,000 income bracket, making it the least populous group.
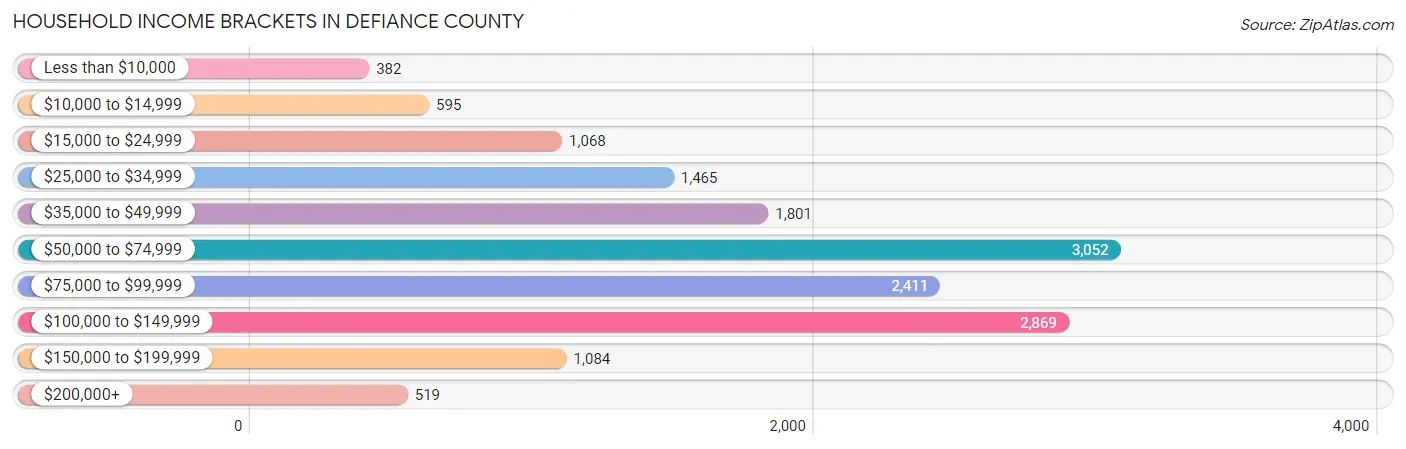
| Income Bracket | # Households | % Households |
| Less than $10,000 | 382 | 2.5% |
| $10,000 to $14,999 | 595 | 3.9% |
| $15,000 to $24,999 | 1,068 | 7.0% |
| $25,000 to $34,999 | 1,465 | 9.6% |
| $35,000 to $49,999 | 1,801 | 11.8% |
| $50,000 to $74,999 | 3,052 | 20.0% |
| $75,000 to $99,999 | 2,411 | 15.8% |
| $100,000 to $149,999 | 2,869 | 18.8% |
| $150,000 to $199,999 | 1,084 | 7.1% |
| $200,000+ | 519 | 3.4% |
Household Income by Householder Age in Defiance County
The median household income in Defiance County is $69,302, with the highest median household income of $84,103 found in the 45 to 64 years age bracket for the primary householder. A total of 5,563 households (36.4%) fall into this category. Meanwhile, the 15 to 24 years age bracket for the primary householder has the lowest median household income of $45,909, with 562 households (3.7%) in this group.
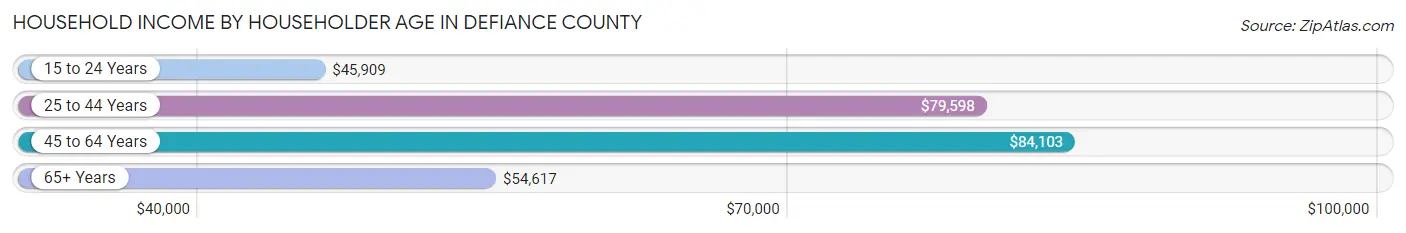
| Income Bracket | # Households | Median Income |
| 15 to 24 Years | 562 (3.7%) | $45,909 |
| 25 to 44 Years | 4,795 (31.4%) | $79,598 |
| 45 to 64 Years | 5,563 (36.4%) | $84,103 |
| 65+ Years | 4,342 (28.4%) | $54,617 |
| Total | 15,262 (100.0%) | $69,302 |
Poverty in Defiance County
Income Below Poverty by Sex and Age in Defiance County
With 9.0% poverty level for males and 12.0% for females among the residents of Defiance County, under 5 year old males and 16 and 17 year old females are the most vulnerable to poverty, with 219 males (19.2%) and 148 females (34.7%) in their respective age groups living below the poverty level.
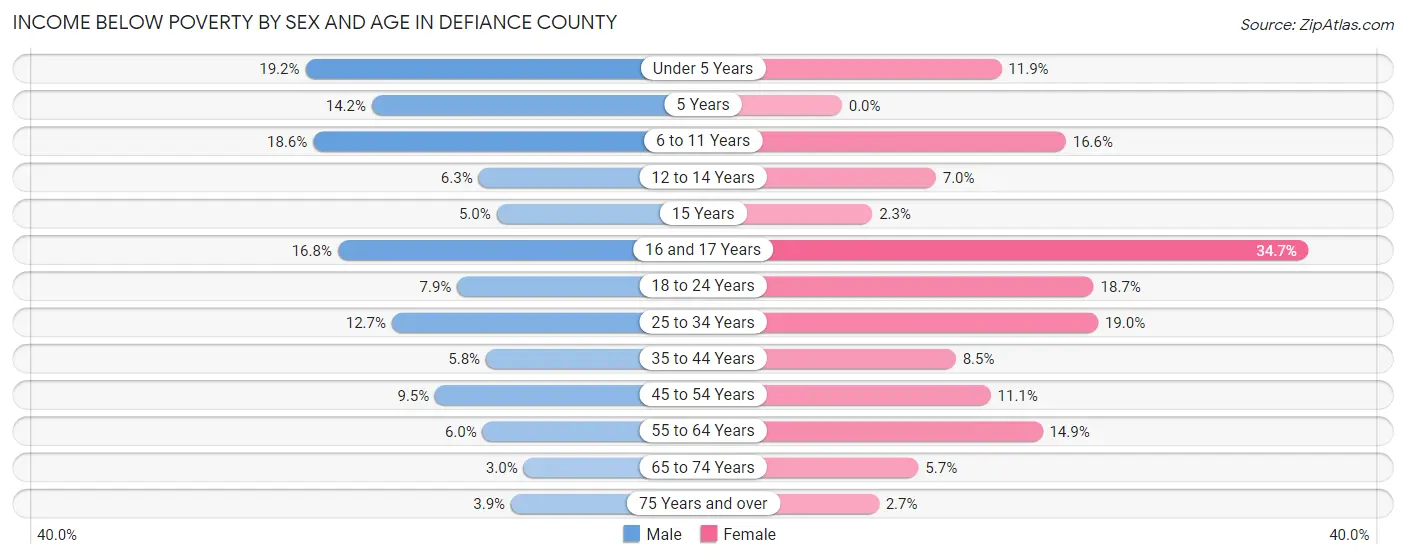
| Age Bracket | Male | Female |
| Under 5 Years | 219 (19.2%) | 117 (11.8%) |
| 5 Years | 30 (14.2%) | 0 (0.0%) |
| 6 to 11 Years | 246 (18.6%) | 234 (16.6%) |
| 12 to 14 Years | 59 (6.3%) | 44 (7.0%) |
| 15 Years | 14 (5.0%) | 7 (2.3%) |
| 16 and 17 Years | 100 (16.8%) | 148 (34.7%) |
| 18 to 24 Years | 122 (7.9%) | 284 (18.7%) |
| 25 to 34 Years | 300 (12.7%) | 402 (19.0%) |
| 35 to 44 Years | 136 (5.8%) | 211 (8.5%) |
| 45 to 54 Years | 224 (9.5%) | 234 (11.1%) |
| 55 to 64 Years | 153 (6.0%) | 392 (14.9%) |
| 65 to 74 Years | 62 (3.0%) | 122 (5.7%) |
| 75 Years and over | 47 (3.9%) | 43 (2.7%) |
| Total | 1,712 (9.0%) | 2,238 (12.0%) |
Income Above Poverty by Sex and Age in Defiance County
According to the poverty statistics in Defiance County, males aged 65 to 74 years and females aged 5 years are the age groups that are most secure financially, with 97.0% of males and 100.0% of females in these age groups living above the poverty line.
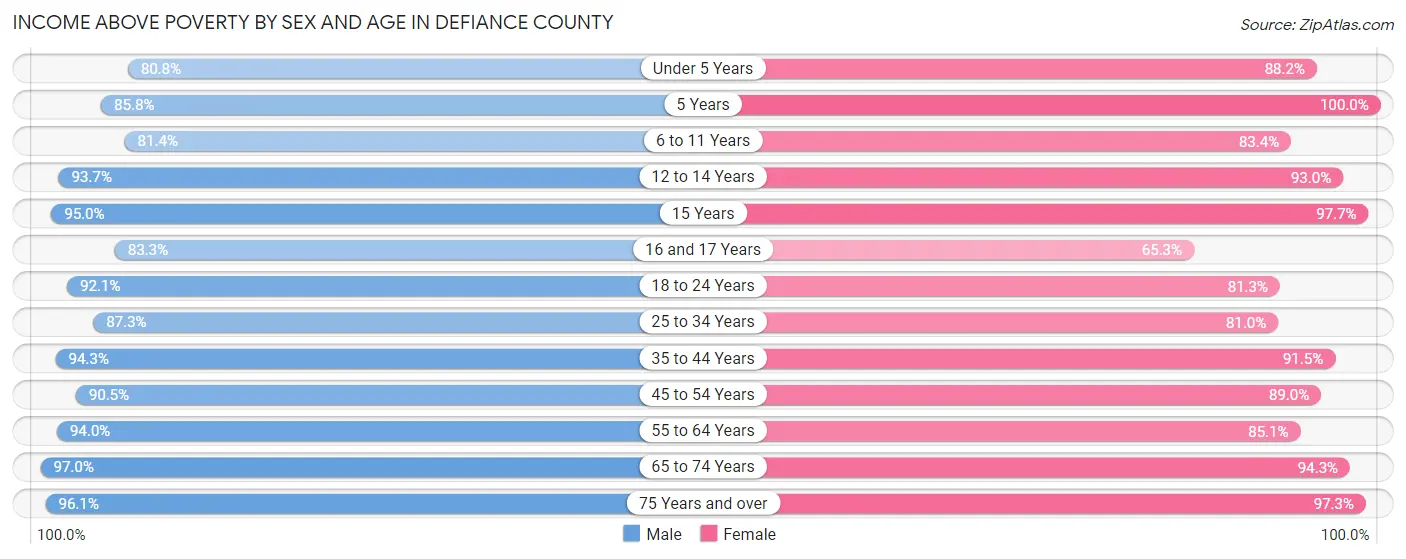
| Age Bracket | Male | Female |
| Under 5 Years | 924 (80.8%) | 870 (88.1%) |
| 5 Years | 181 (85.8%) | 216 (100.0%) |
| 6 to 11 Years | 1,078 (81.4%) | 1,173 (83.4%) |
| 12 to 14 Years | 878 (93.7%) | 586 (93.0%) |
| 15 Years | 268 (95.0%) | 303 (97.7%) |
| 16 and 17 Years | 497 (83.3%) | 279 (65.3%) |
| 18 to 24 Years | 1,426 (92.1%) | 1,235 (81.3%) |
| 25 to 34 Years | 2,055 (87.3%) | 1,712 (81.0%) |
| 35 to 44 Years | 2,231 (94.3%) | 2,284 (91.5%) |
| 45 to 54 Years | 2,128 (90.5%) | 1,883 (88.9%) |
| 55 to 64 Years | 2,395 (94.0%) | 2,239 (85.1%) |
| 65 to 74 Years | 2,033 (97.0%) | 2,022 (94.3%) |
| 75 Years and over | 1,160 (96.1%) | 1,525 (97.3%) |
| Total | 17,254 (91.0%) | 16,327 (87.9%) |
Income Below Poverty Among Married-Couple Families in Defiance County
The poverty statistics for married-couple families in Defiance County show that 3.3% or 271 of the total 8,160 families live below the poverty line. Families with 5 or more children have the highest poverty rate of 29.6%, comprising of 32 families. On the other hand, families with no children have the lowest poverty rate of 2.7%, which includes 148 families.
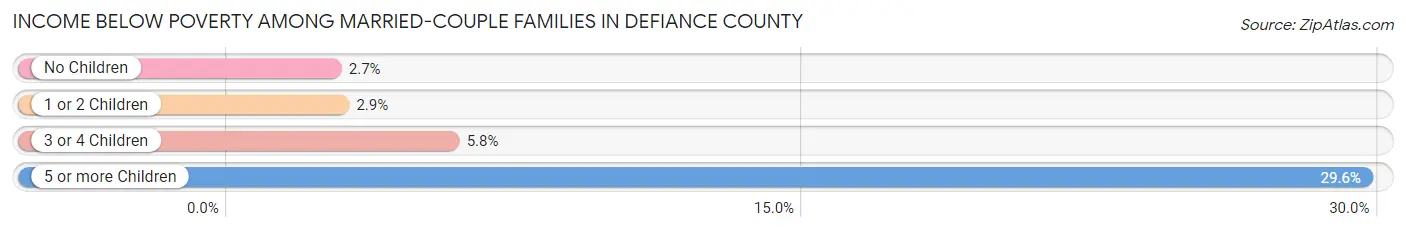
| Children | Above Poverty | Below Poverty |
| No Children | 5,310 (97.3%) | 148 (2.7%) |
| 1 or 2 Children | 1,999 (97.1%) | 60 (2.9%) |
| 3 or 4 Children | 504 (94.2%) | 31 (5.8%) |
| 5 or more Children | 76 (70.4%) | 32 (29.6%) |
| Total | 7,889 (96.7%) | 271 (3.3%) |
Income Below Poverty Among Single-Parent Households in Defiance County
According to the poverty data in Defiance County, 16.1% or 142 single-father households and 20.0% or 256 single-mother households are living below the poverty line. Among single-father households, those with 1 or 2 children have the highest poverty rate, with 140 households (21.5%) experiencing poverty. Likewise, among single-mother households, those with 3 or 4 children have the highest poverty rate, with 97 households (49.0%) falling below the poverty line.
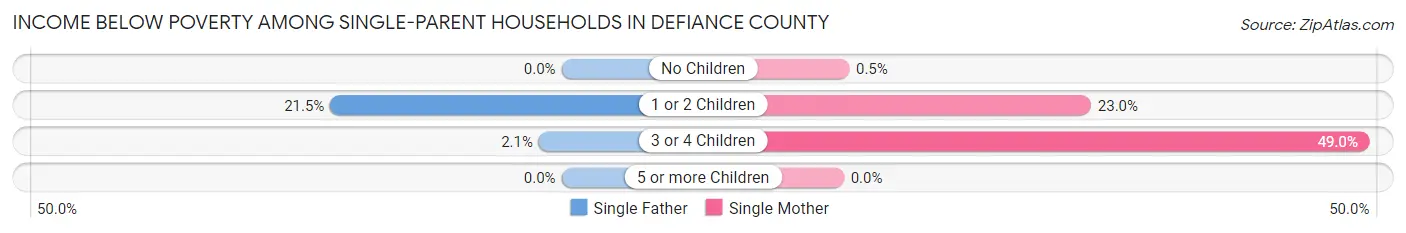
| Children | Single Father | Single Mother |
| No Children | 0 (0.0%) | 2 (0.5%) |
| 1 or 2 Children | 140 (21.5%) | 157 (23.0%) |
| 3 or 4 Children | 2 (2.1%) | 97 (49.0%) |
| 5 or more Children | 0 (0.0%) | 0 (0.0%) |
| Total | 142 (16.1%) | 256 (20.0%) |
Income Below Poverty Among Married-Couple vs Single-Parent Households in Defiance County
The poverty data for Defiance County shows that 271 of the married-couple family households (3.3%) and 398 of the single-parent households (18.4%) are living below the poverty level. Within the married-couple family households, those with 5 or more children have the highest poverty rate, with 32 households (29.6%) falling below the poverty line. Among the single-parent households, those with 3 or 4 children have the highest poverty rate, with 99 household (33.8%) living below poverty.
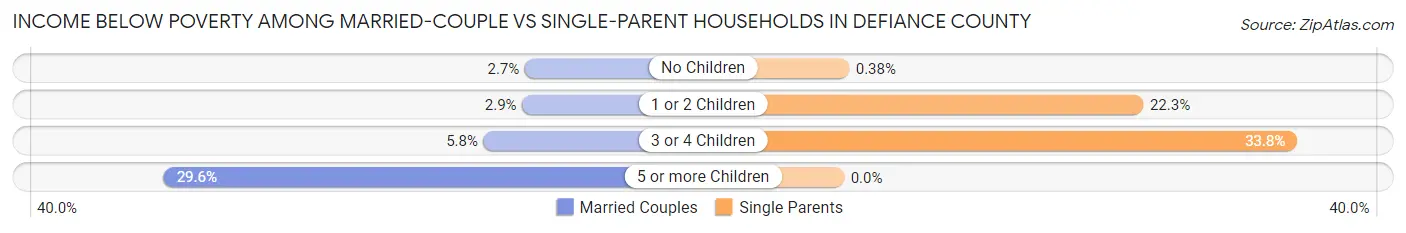
| Children | Married-Couple Families | Single-Parent Households |
| No Children | 148 (2.7%) | 2 (0.4%) |
| 1 or 2 Children | 60 (2.9%) | 297 (22.3%) |
| 3 or 4 Children | 31 (5.8%) | 99 (33.8%) |
| 5 or more Children | 32 (29.6%) | 0 (0.0%) |
| Total | 271 (3.3%) | 398 (18.4%) |
Race in Defiance County
The most populous races in Defiance County are White / Caucasian (34,054 | 88.9%), Hispanic or Latino (4,105 | 10.7%), and Two or more Races (2,073 | 5.4%).
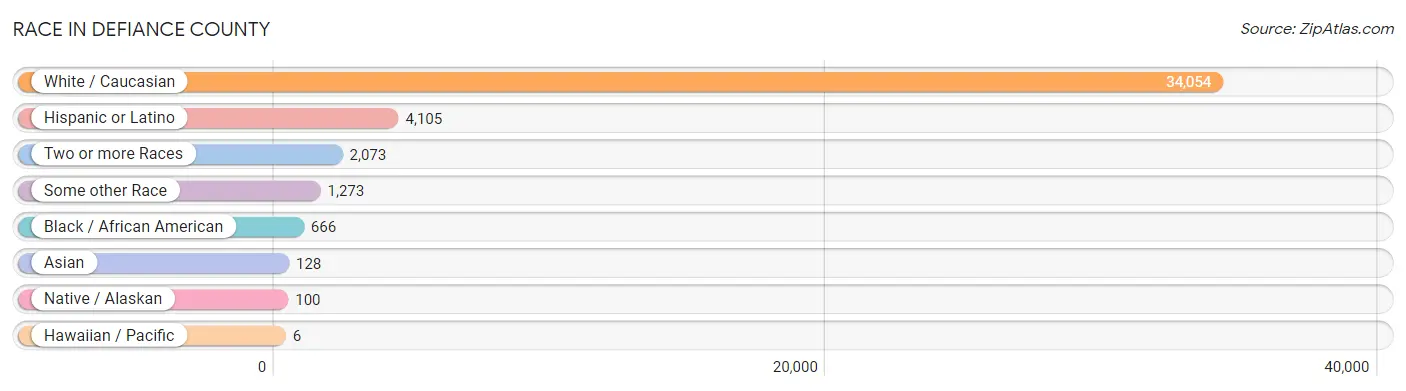
| Race | # Population | % Population |
| Asian | 128 | 0.3% |
| Black / African American | 666 | 1.7% |
| Hawaiian / Pacific | 6 | 0.0% |
| Hispanic or Latino | 4,105 | 10.7% |
| Native / Alaskan | 100 | 0.3% |
| White / Caucasian | 34,054 | 88.9% |
| Two or more Races | 2,073 | 5.4% |
| Some other Race | 1,273 | 3.3% |
| Total | 38,300 | 100.0% |
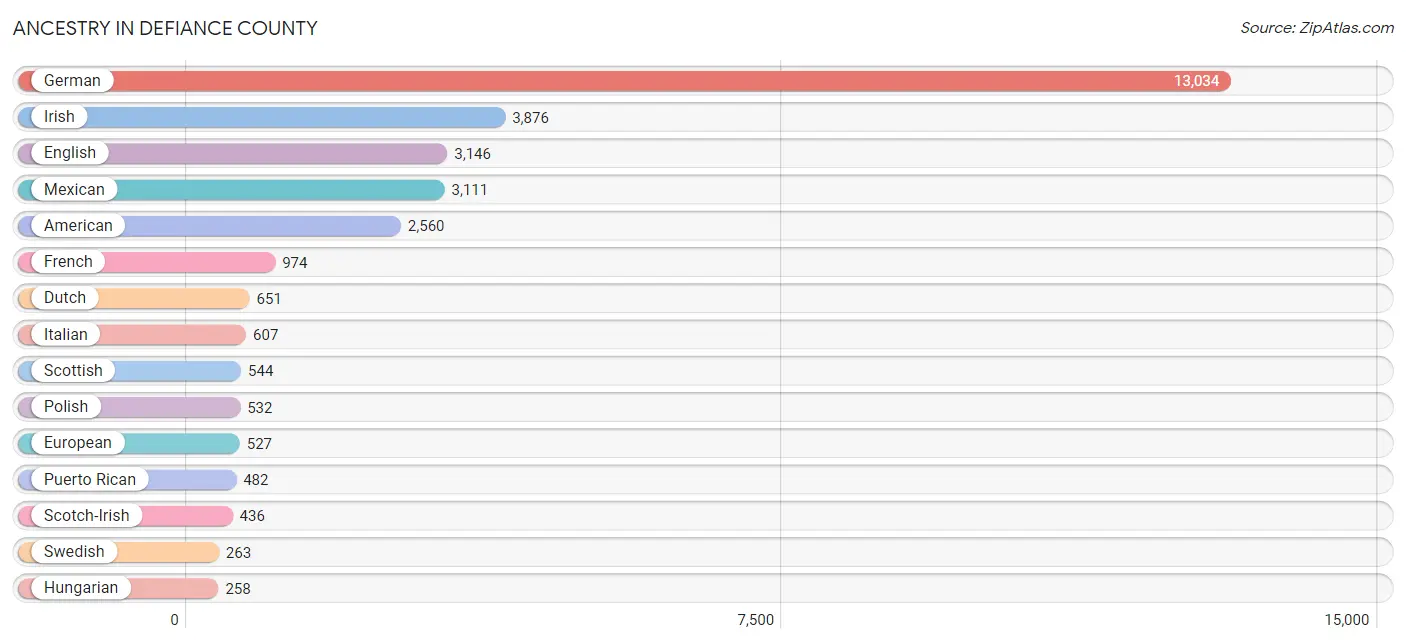
Ancestry in Defiance County
The most populous ancestries reported in Defiance County are German (13,034 | 34.0%), Irish (3,876 | 10.1%), English (3,146 | 8.2%), Mexican (3,111 | 8.1%), and American (2,560 | 6.7%), together accounting for 67.2% of all Defiance County residents.
| Ancestry | # Population | % Population |
| African | 188 | 0.5% |
| American | 2,560 | 6.7% |
| Apache | 14 | 0.0% |
| Arab | 9 | 0.0% |
| Armenian | 22 | 0.1% |
| Austrian | 86 | 0.2% |
| Belgian | 225 | 0.6% |
| Bhutanese | 92 | 0.2% |
| British | 250 | 0.6% |
| Burmese | 76 | 0.2% |
| Canadian | 1 | 0.0% |
| Central American | 107 | 0.3% |
| Cherokee | 96 | 0.3% |
| Chippewa | 8 | 0.0% |
| Colombian | 20 | 0.1% |
| Costa Rican | 10 | 0.0% |
| Creek | 3 | 0.0% |
| Cuban | 59 | 0.2% |
| Czech | 254 | 0.7% |
| Czechoslovakian | 66 | 0.2% |
| Danish | 33 | 0.1% |
| Dominican | 54 | 0.1% |
| Dutch | 651 | 1.7% |
| Eastern European | 10 | 0.0% |
| English | 3,146 | 8.2% |
| European | 527 | 1.4% |
| French | 974 | 2.5% |
| French American Indian | 4 | 0.0% |
| French Canadian | 21 | 0.1% |
| German | 13,034 | 34.0% |
| Greek | 42 | 0.1% |
| Honduran | 12 | 0.0% |
| Hungarian | 258 | 0.7% |
| Indian (Asian) | 14 | 0.0% |
| Irish | 3,876 | 10.1% |
| Italian | 607 | 1.6% |
| Korean | 106 | 0.3% |
| Maltese | 13 | 0.0% |
| Mexican | 3,111 | 8.1% |
| Native Hawaiian | 33 | 0.1% |
| Northern European | 43 | 0.1% |
| Norwegian | 112 | 0.3% |
| Pennsylvania German | 33 | 0.1% |
| Polish | 532 | 1.4% |
| Puerto Rican | 482 | 1.3% |
| Russian | 202 | 0.5% |
| Salvadoran | 85 | 0.2% |
| Samoan | 6 | 0.0% |
| Scandinavian | 56 | 0.2% |
| Scotch-Irish | 436 | 1.1% |
| Scottish | 544 | 1.4% |
| Serbian | 38 | 0.1% |
| Sioux | 21 | 0.1% |
| Slovak | 34 | 0.1% |
| South American | 48 | 0.1% |
| Spaniard | 81 | 0.2% |
| Spanish | 21 | 0.1% |
| Spanish American | 7 | 0.0% |
| Spanish American Indian | 10 | 0.0% |
| Subsaharan African | 188 | 0.5% |
| Swedish | 263 | 0.7% |
| Swiss | 207 | 0.5% |
| Syrian | 9 | 0.0% |
| Thai | 27 | 0.1% |
| U.S. Virgin Islander | 55 | 0.1% |
| Ukrainian | 8 | 0.0% |
| Venezuelan | 28 | 0.1% |
| Welsh | 175 | 0.5% |
| West Indian | 7 | 0.0% |
| Yaqui | 19 | 0.1% |
| Yugoslavian | 10 | 0.0% | View All 71 Rows |
Immigrants in Defiance County
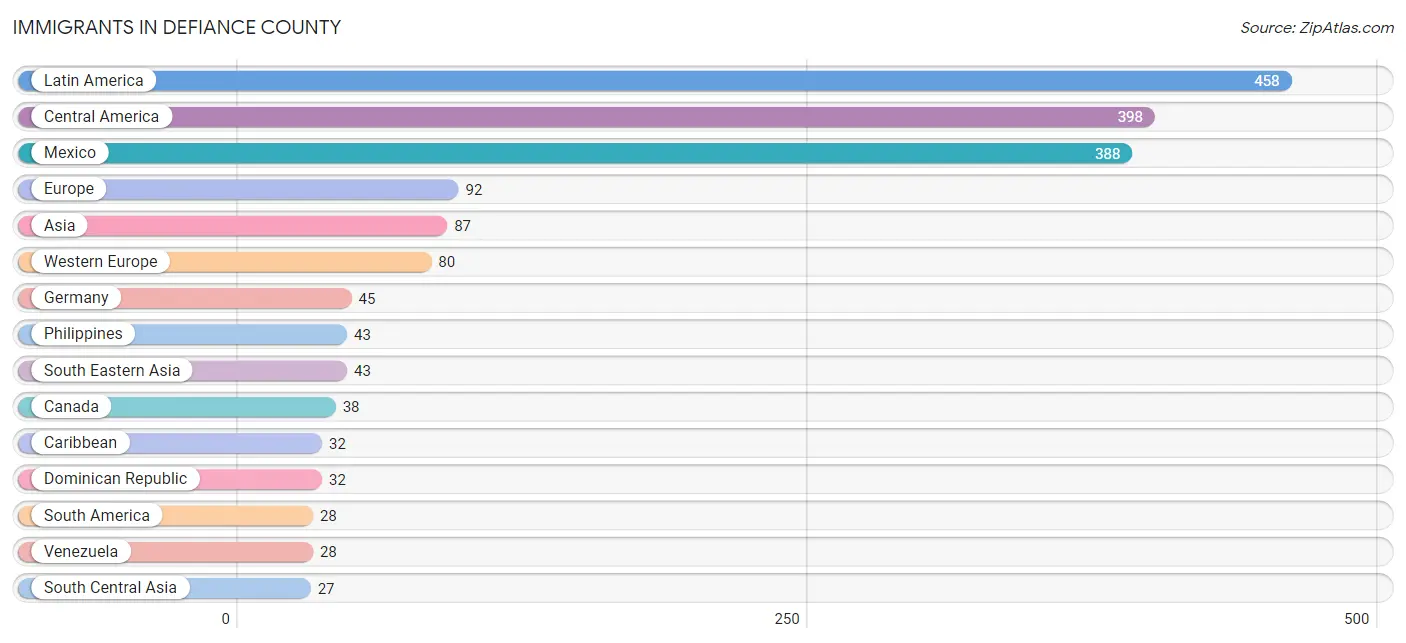
The most numerous immigrant groups reported in Defiance County came from Latin America (458 | 1.2%), Central America (398 | 1.0%), Mexico (388 | 1.0%), Europe (92 | 0.2%), and Asia (87 | 0.2%), together accounting for 3.7% of all Defiance County residents.
| Immigration Origin | # Population | % Population |
| Africa | 26 | 0.1% |
| Asia | 87 | 0.2% |
| Canada | 38 | 0.1% |
| Caribbean | 32 | 0.1% |
| Central America | 398 | 1.0% |
| China | 3 | 0.0% |
| Costa Rica | 10 | 0.0% |
| Croatia | 8 | 0.0% |
| Dominican Republic | 32 | 0.1% |
| Eastern Africa | 26 | 0.1% |
| Eastern Asia | 17 | 0.0% |
| Eastern Europe | 8 | 0.0% |
| England | 4 | 0.0% |
| Eritrea | 15 | 0.0% |
| Ethiopia | 8 | 0.0% |
| Europe | 92 | 0.2% |
| France | 10 | 0.0% |
| Germany | 45 | 0.1% |
| India | 15 | 0.0% |
| Japan | 9 | 0.0% |
| Kenya | 3 | 0.0% |
| Korea | 5 | 0.0% |
| Latin America | 458 | 1.2% |
| Mexico | 388 | 1.0% |
| Nepal | 5 | 0.0% |
| Netherlands | 25 | 0.1% |
| Northern Europe | 4 | 0.0% |
| Pakistan | 7 | 0.0% |
| Philippines | 43 | 0.1% |
| South America | 28 | 0.1% |
| South Central Asia | 27 | 0.1% |
| South Eastern Asia | 43 | 0.1% |
| Venezuela | 28 | 0.1% |
| Western Europe | 80 | 0.2% | View All 34 Rows |
Sex and Age in Defiance County
Sex and Age in Defiance County
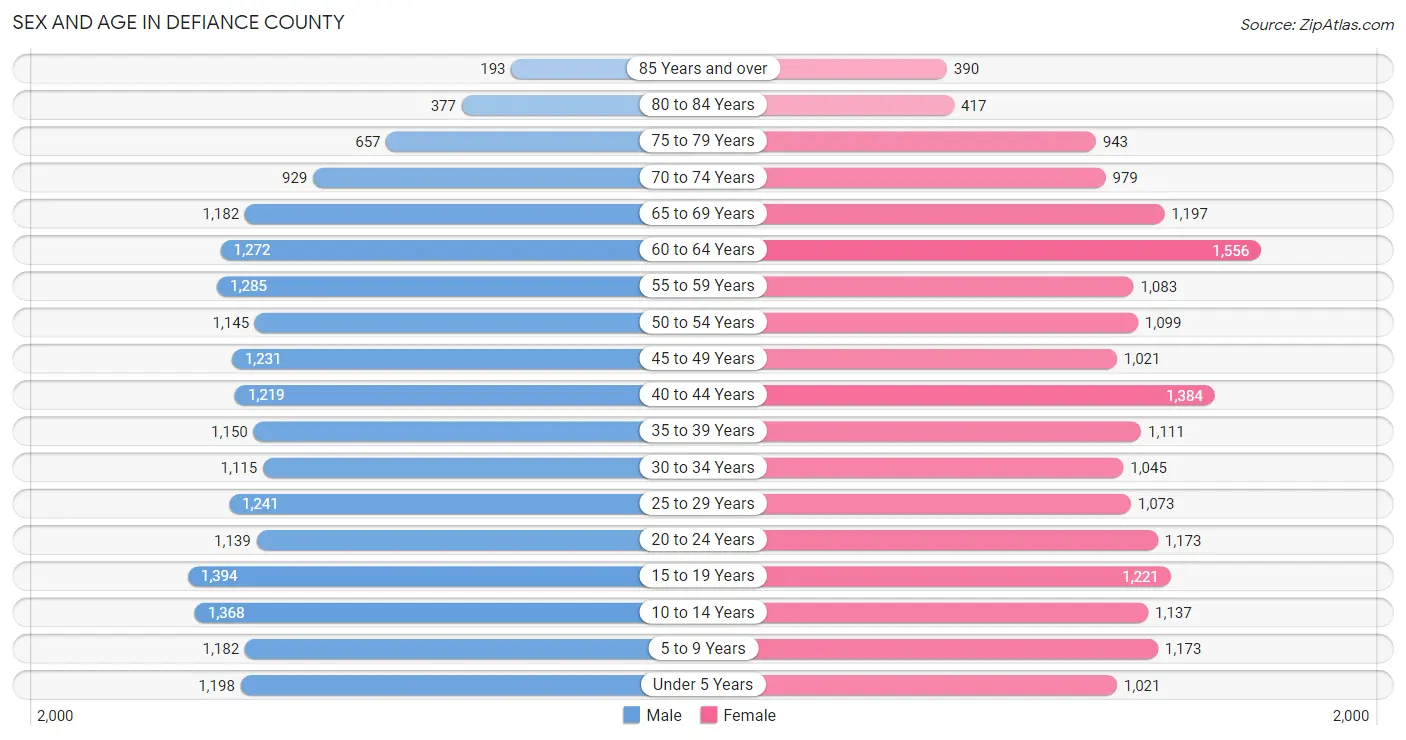
The most populous age groups in Defiance County are 15 to 19 Years (1,394 | 7.2%) for men and 60 to 64 Years (1,556 | 8.2%) for women.
| Age Bracket | Male | Female |
| Under 5 Years | 1,198 (6.2%) | 1,021 (5.4%) |
| 5 to 9 Years | 1,182 (6.1%) | 1,173 (6.2%) |
| 10 to 14 Years | 1,368 (7.1%) | 1,137 (6.0%) |
| 15 to 19 Years | 1,394 (7.2%) | 1,221 (6.4%) |
| 20 to 24 Years | 1,139 (5.9%) | 1,173 (6.2%) |
| 25 to 29 Years | 1,241 (6.4%) | 1,073 (5.6%) |
| 30 to 34 Years | 1,115 (5.8%) | 1,045 (5.5%) |
| 35 to 39 Years | 1,150 (6.0%) | 1,111 (5.8%) |
| 40 to 44 Years | 1,219 (6.3%) | 1,384 (7.3%) |
| 45 to 49 Years | 1,231 (6.4%) | 1,021 (5.4%) |
| 50 to 54 Years | 1,145 (5.9%) | 1,099 (5.8%) |
| 55 to 59 Years | 1,285 (6.7%) | 1,083 (5.7%) |
| 60 to 64 Years | 1,272 (6.6%) | 1,556 (8.2%) |
| 65 to 69 Years | 1,182 (6.1%) | 1,197 (6.3%) |
| 70 to 74 Years | 929 (4.8%) | 979 (5.1%) |
| 75 to 79 Years | 657 (3.4%) | 943 (5.0%) |
| 80 to 84 Years | 377 (2.0%) | 417 (2.2%) |
| 85 Years and over | 193 (1.0%) | 390 (2.1%) |
| Total | 19,277 (100.0%) | 19,023 (100.0%) |
Families and Households in Defiance County
Median Family Size in Defiance County
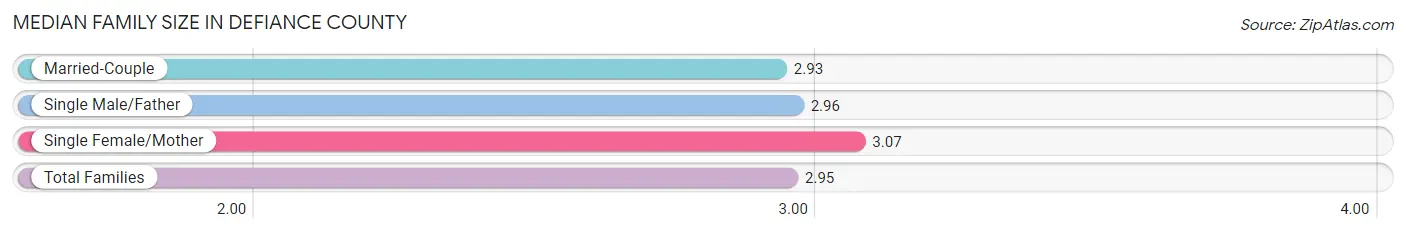
The median family size in Defiance County is 2.95 persons per family, with single female/mother families (1,281 | 12.4%) accounting for the largest median family size of 3.07 persons per family. On the other hand, married-couple families (8,160 | 79.0%) represent the smallest median family size with 2.93 persons per family.
| Family Type | # Families | Family Size |
| Married-Couple | 8,160 (79.0%) | 2.93 |
| Single Male/Father | 882 (8.5%) | 2.96 |
| Single Female/Mother | 1,281 (12.4%) | 3.07 |
| Total Families | 10,323 (100.0%) | 2.95 |
Median Household Size in Defiance County
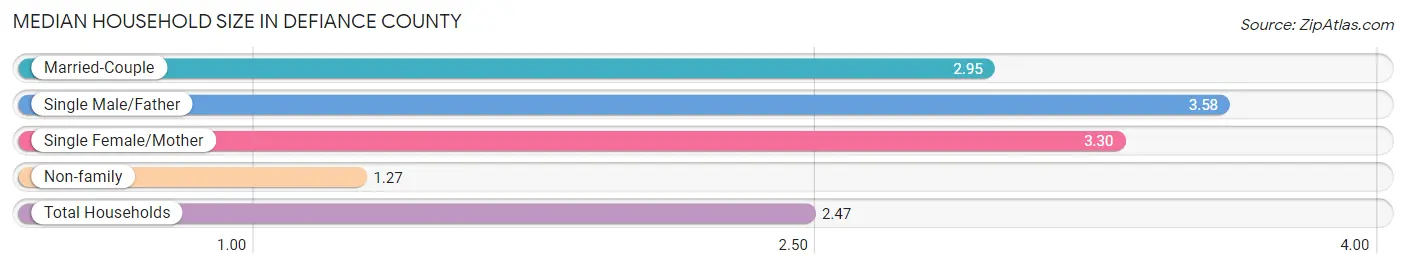
The median household size in Defiance County is 2.47 persons per household, with single male/father households (882 | 5.8%) accounting for the largest median household size of 3.58 persons per household. non-family households (4,939 | 32.4%) represent the smallest median household size with 1.27 persons per household.
| Household Type | # Households | Household Size |
| Married-Couple | 8,160 (53.5%) | 2.95 |
| Single Male/Father | 882 (5.8%) | 3.58 |
| Single Female/Mother | 1,281 (8.4%) | 3.30 |
| Non-family | 4,939 (32.4%) | 1.27 |
| Total Households | 15,262 (100.0%) | 2.47 |
Household Size by Marriage Status in Defiance County
Out of a total of 15,262 households in Defiance County, 10,323 (67.6%) are family households, while 4,939 (32.4%) are nonfamily households. The most numerous type of family households are 2-person households, comprising 5,250, and the most common type of nonfamily households are 1-person households, comprising 3,983.
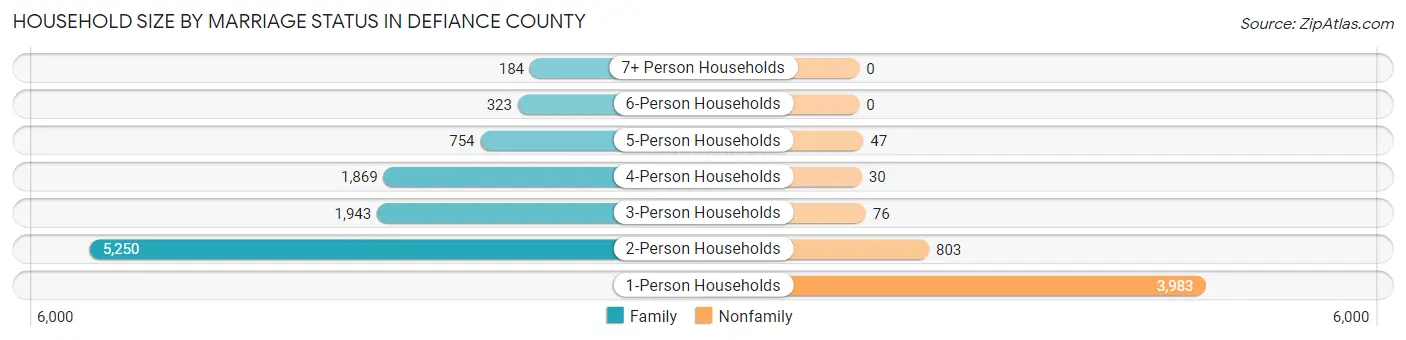
| Household Size | Family Households | Nonfamily Households |
| 1-Person Households | - | 3,983 (26.1%) |
| 2-Person Households | 5,250 (34.4%) | 803 (5.3%) |
| 3-Person Households | 1,943 (12.7%) | 76 (0.5%) |
| 4-Person Households | 1,869 (12.2%) | 30 (0.2%) |
| 5-Person Households | 754 (4.9%) | 47 (0.3%) |
| 6-Person Households | 323 (2.1%) | 0 (0.0%) |
| 7+ Person Households | 184 (1.2%) | 0 (0.0%) |
| Total | 10,323 (67.6%) | 4,939 (32.4%) |
Female Fertility in Defiance County
Fertility by Age in Defiance County
Average fertility rate in Defiance County is 67.0 births per 1,000 women. Women in the age bracket of 20 to 34 years have the highest fertility rate with 131.0 births per 1,000 women. Women in the age bracket of 20 to 34 years acount for 79.1% of all women with births.
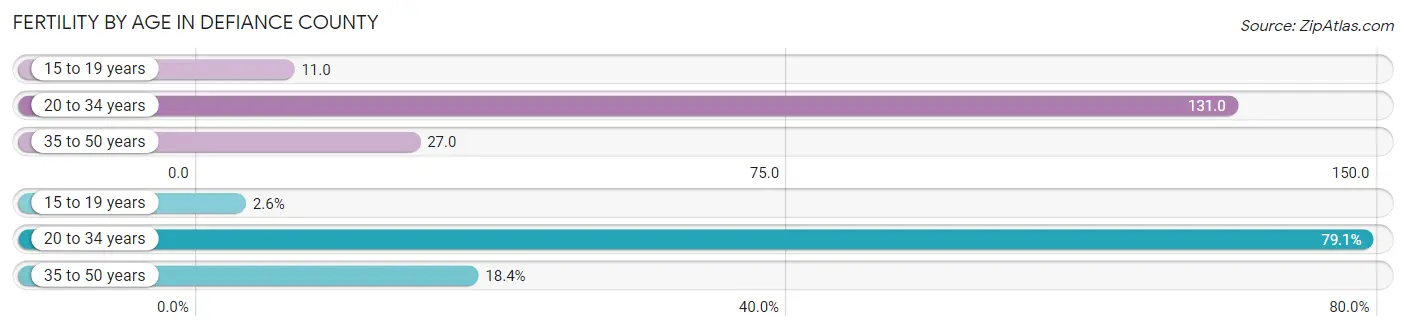
| Age Bracket | Women with Births | Births / 1,000 Women |
| 15 to 19 years | 14 (2.6%) | 11.0 |
| 20 to 34 years | 431 (79.1%) | 131.0 |
| 35 to 50 years | 100 (18.3%) | 27.0 |
| Total | 545 (100.0%) | 67.0 |
Fertility by Age by Marriage Status in Defiance County
84.6% of women with births (545) in Defiance County are married. The highest percentage of unmarried women with births falls into 20 to 34 years age bracket with 16.9% of them unmarried at the time of birth, while the lowest percentage of unmarried women with births belong to 15 to 19 years age bracket with 0.0% of them unmarried.
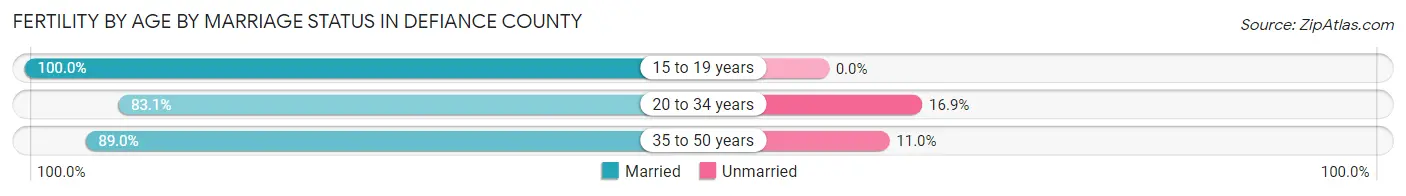
| Age Bracket | Married | Unmarried |
| 15 to 19 years | 14 (100.0%) | 0 (0.0%) |
| 20 to 34 years | 358 (83.1%) | 73 (16.9%) |
| 35 to 50 years | 89 (89.0%) | 11 (11.0%) |
| Total | 461 (84.6%) | 84 (15.4%) |
Fertility by Education in Defiance County
Average fertility rate in Defiance County is 67.0 births per 1,000 women. Women with the education attainment of bachelor's degree have the highest fertility rate of 139.0 births per 1,000 women, while women with the education attainment of less than high school have the lowest fertility at 7.0 births per 1,000 women. Women with the education attainment of bachelor's degree represent 32.7% of all women with births.
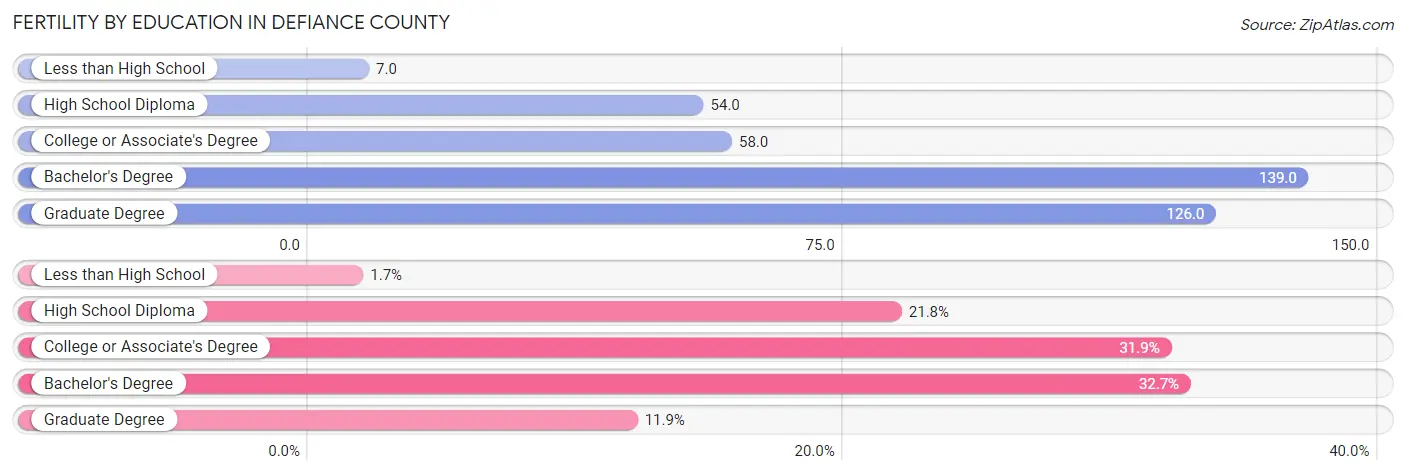
| Educational Attainment | Women with Births | Births / 1,000 Women |
| Less than High School | 9 (1.7%) | 7.0 |
| High School Diploma | 119 (21.8%) | 54.0 |
| College or Associate's Degree | 174 (31.9%) | 58.0 |
| Bachelor's Degree | 178 (32.7%) | 139.0 |
| Graduate Degree | 65 (11.9%) | 126.0 |
| Total | 545 (100.0%) | 67.0 |
Fertility by Education by Marriage Status in Defiance County
15.4% of women with births in Defiance County are unmarried. Women with the educational attainment of less than high school are most likely to be married with 100.0% of them married at childbirth, while women with the educational attainment of high school diploma are least likely to be married with 70.6% of them unmarried at childbirth.
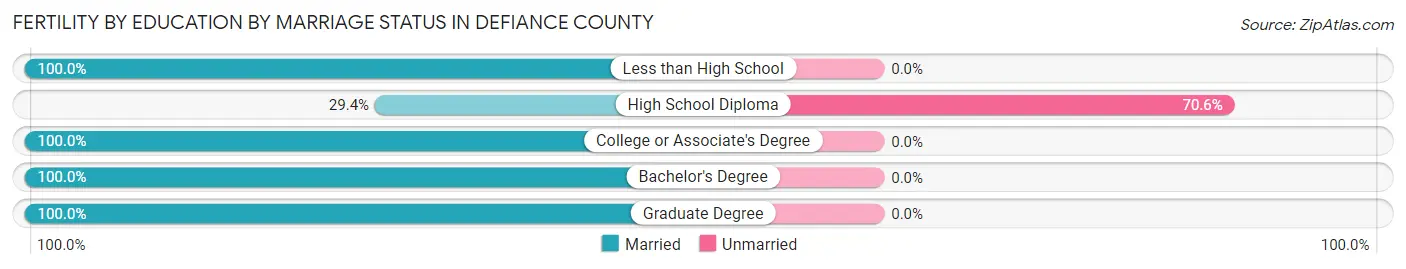
| Educational Attainment | Married | Unmarried |
| Less than High School | 9 (100.0%) | 0 (0.0%) |
| High School Diploma | 35 (29.4%) | 84 (70.6%) |
| College or Associate's Degree | 174 (100.0%) | 0 (0.0%) |
| Bachelor's Degree | 178 (100.0%) | 0 (0.0%) |
| Graduate Degree | 65 (100.0%) | 0 (0.0%) |
| Total | 461 (84.6%) | 84 (15.4%) |
Employment Characteristics in Defiance County
Employment by Class of Employer in Defiance County
Among the 18,548 employed individuals in Defiance County, private company employees (13,409 | 72.3%), not-for-profit organizations (1,586 | 8.6%), and local government employees (1,528 | 8.2%) make up the most common classes of employment.
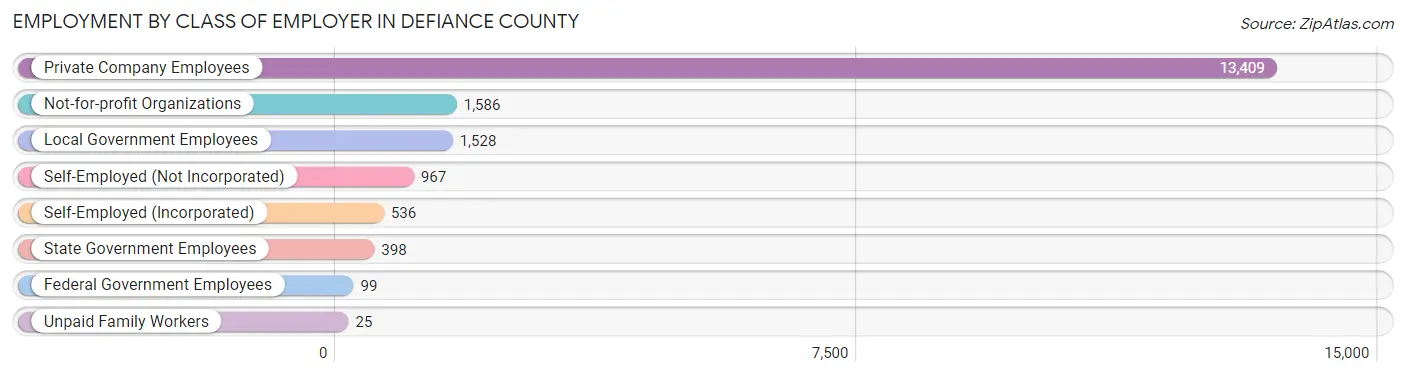
| Employer Class | # Employees | % Employees |
| Private Company Employees | 13,409 | 72.3% |
| Self-Employed (Incorporated) | 536 | 2.9% |
| Self-Employed (Not Incorporated) | 967 | 5.2% |
| Not-for-profit Organizations | 1,586 | 8.6% |
| Local Government Employees | 1,528 | 8.2% |
| State Government Employees | 398 | 2.1% |
| Federal Government Employees | 99 | 0.5% |
| Unpaid Family Workers | 25 | 0.1% |
| Total | 18,548 | 100.0% |
Employment Status by Age in Defiance County
According to the labor force statistics for Defiance County, out of the total population over 16 years of age (30,629), 64.6% or 19,786 individuals are in the labor force, with 4.9% or 970 of them unemployed. The age group with the highest labor force participation rate is 35 to 44 years, with 92.7% or 4,509 individuals in the labor force. Within the labor force, the 16 to 19 years age range has the highest percentage of unemployed individuals, with 20.8% or 197 of them being unemployed.
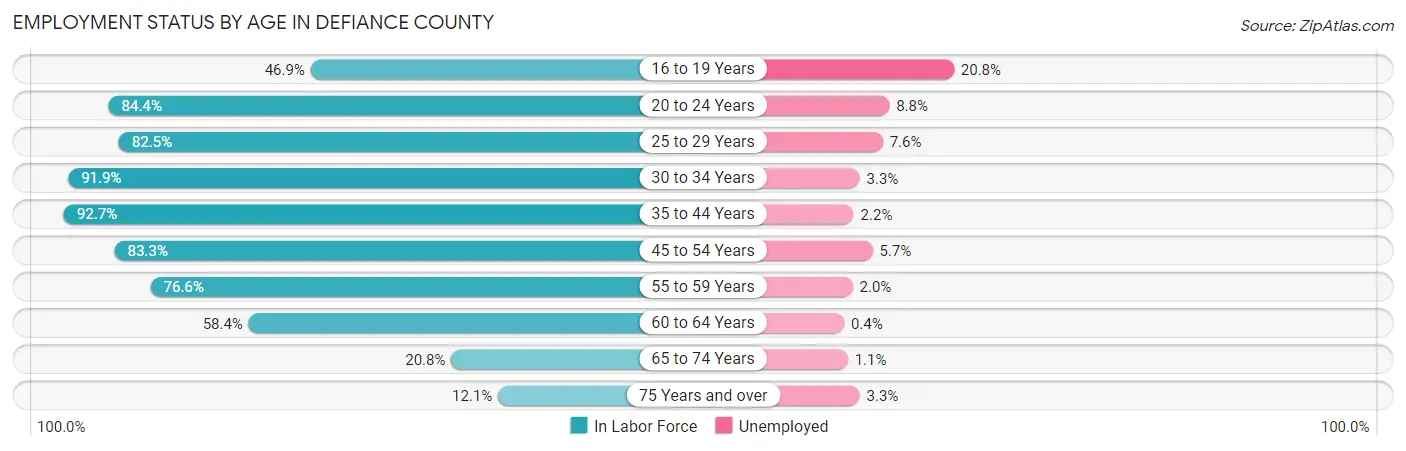
| Age Bracket | In Labor Force | Unemployed |
| 16 to 19 Years | 949 (46.9%) | 197 (20.8%) |
| 20 to 24 Years | 1,951 (84.4%) | 172 (8.8%) |
| 25 to 29 Years | 1,909 (82.5%) | 145 (7.6%) |
| 30 to 34 Years | 1,985 (91.9%) | 66 (3.3%) |
| 35 to 44 Years | 4,509 (92.7%) | 99 (2.2%) |
| 45 to 54 Years | 3,745 (83.3%) | 213 (5.7%) |
| 55 to 59 Years | 1,814 (76.6%) | 36 (2.0%) |
| 60 to 64 Years | 1,652 (58.4%) | 7 (0.4%) |
| 65 to 74 Years | 892 (20.8%) | 10 (1.1%) |
| 75 Years and over | 360 (12.1%) | 12 (3.3%) |
| Total | 19,786 (64.6%) | 970 (4.9%) |
Employment Status by Educational Attainment in Defiance County
According to labor force statistics for Defiance County, 82.1% of individuals (15,624) out of the total population between 25 and 64 years of age (19,030) are in the labor force, with 3.6% or 562 of them being unemployed. The group with the highest labor force participation rate are those with the educational attainment of bachelor's degree or higher, with 89.3% or 3,543 individuals in the labor force. Within the labor force, individuals with high school diploma education have the highest percentage of unemployment, with 4.6% or 258 of them being unemployed.
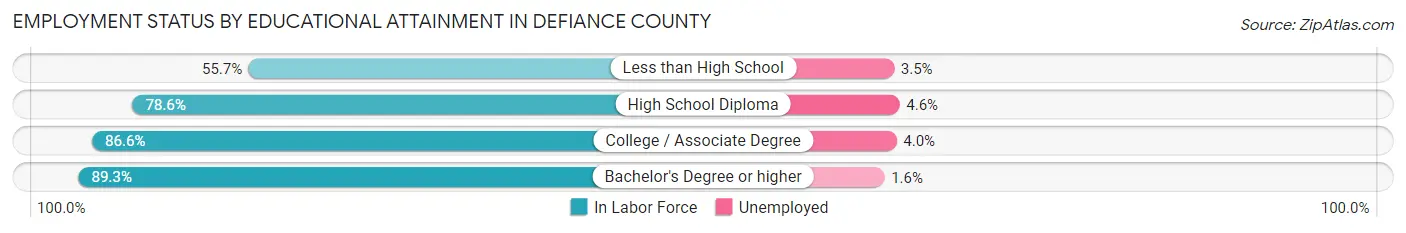
| Educational Attainment | In Labor Force | Unemployed |
| Less than High School | 716 (55.7%) | 45 (3.5%) |
| High School Diploma | 5,605 (78.6%) | 328 (4.6%) |
| College / Associate Degree | 5,755 (86.6%) | 266 (4.0%) |
| Bachelor's Degree or higher | 3,543 (89.3%) | 63 (1.6%) |
| Total | 15,624 (82.1%) | 685 (3.6%) |
Employment Occupations by Sex in Defiance County
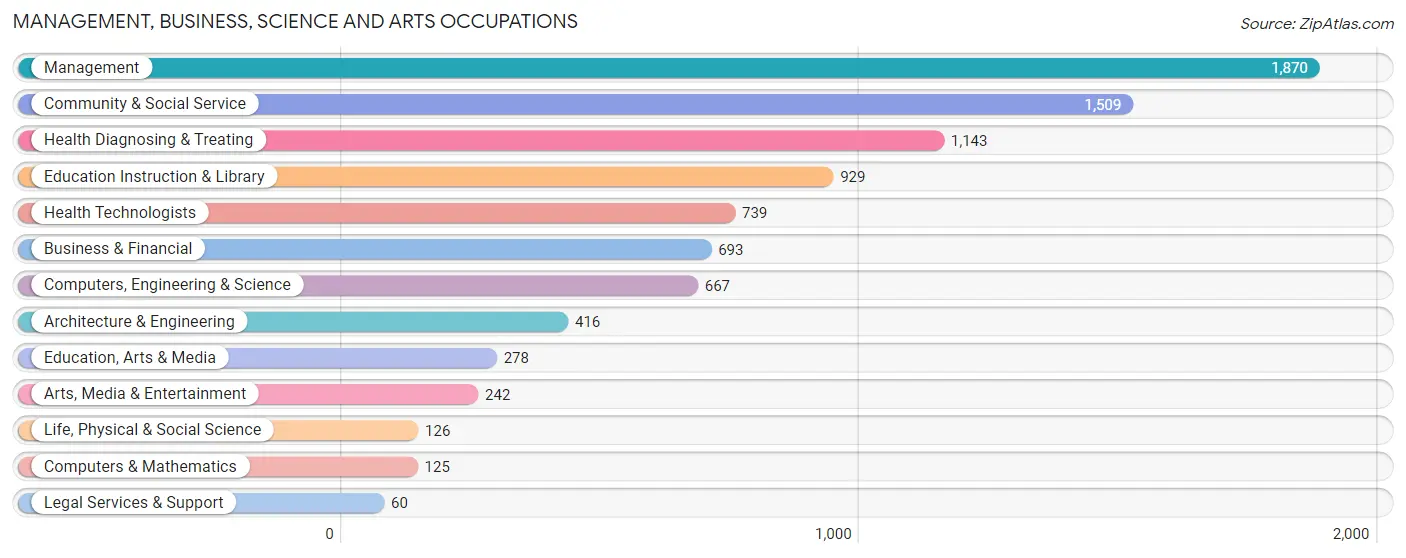
Management, Business, Science and Arts Occupations
The most common Management, Business, Science and Arts occupations in Defiance County are Management (1,870 | 9.9%), Community & Social Service (1,509 | 8.0%), Health Diagnosing & Treating (1,143 | 6.1%), Education Instruction & Library (929 | 4.9%), and Health Technologists (739 | 3.9%).
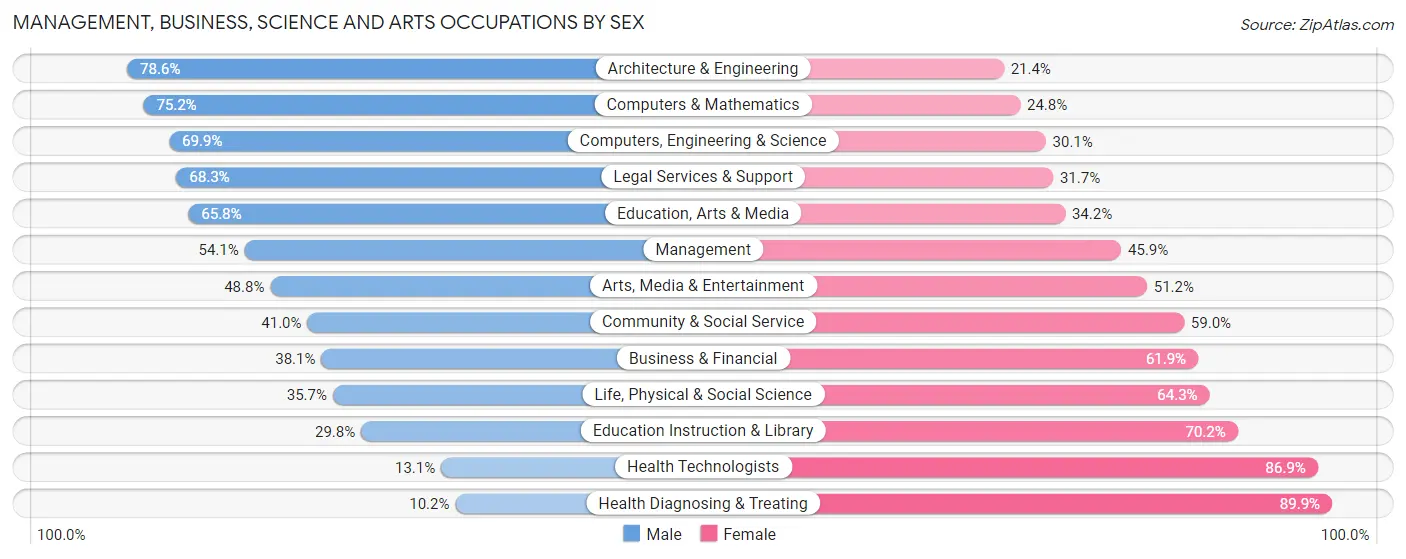
Management, Business, Science and Arts Occupations by Sex
Within the Management, Business, Science and Arts occupations in Defiance County, the most male-oriented occupations are Architecture & Engineering (78.6%), Computers & Mathematics (75.2%), and Computers, Engineering & Science (69.9%), while the most female-oriented occupations are Health Diagnosing & Treating (89.8%), Health Technologists (86.9%), and Education Instruction & Library (70.2%).
| Occupation | Male | Female |
| Management | 1,012 (54.1%) | 858 (45.9%) |
| Business & Financial | 264 (38.1%) | 429 (61.9%) |
| Computers, Engineering & Science | 466 (69.9%) | 201 (30.1%) |
| Computers & Mathematics | 94 (75.2%) | 31 (24.8%) |
| Architecture & Engineering | 327 (78.6%) | 89 (21.4%) |
| Life, Physical & Social Science | 45 (35.7%) | 81 (64.3%) |
| Community & Social Service | 619 (41.0%) | 890 (59.0%) |
| Education, Arts & Media | 183 (65.8%) | 95 (34.2%) |
| Legal Services & Support | 41 (68.3%) | 19 (31.7%) |
| Education Instruction & Library | 277 (29.8%) | 652 (70.2%) |
| Arts, Media & Entertainment | 118 (48.8%) | 124 (51.2%) |
| Health Diagnosing & Treating | 116 (10.2%) | 1,027 (89.8%) |
| Health Technologists | 97 (13.1%) | 642 (86.9%) |
| Total (Category) | 2,477 (42.1%) | 3,405 (57.9%) |
| Total (Overall) | 10,261 (54.5%) | 8,552 (45.5%) |
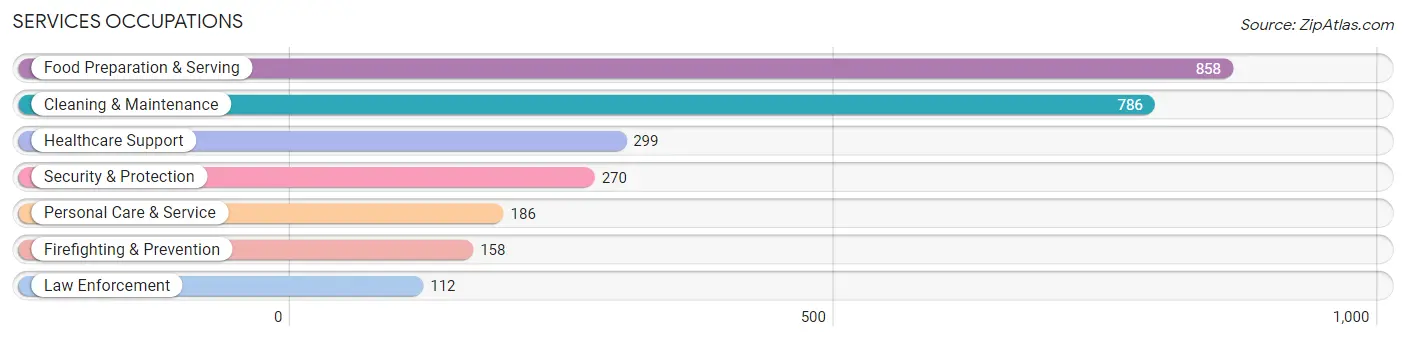
Services Occupations
The most common Services occupations in Defiance County are Food Preparation & Serving (858 | 4.6%), Cleaning & Maintenance (786 | 4.2%), Healthcare Support (299 | 1.6%), Security & Protection (270 | 1.4%), and Personal Care & Service (186 | 1.0%).
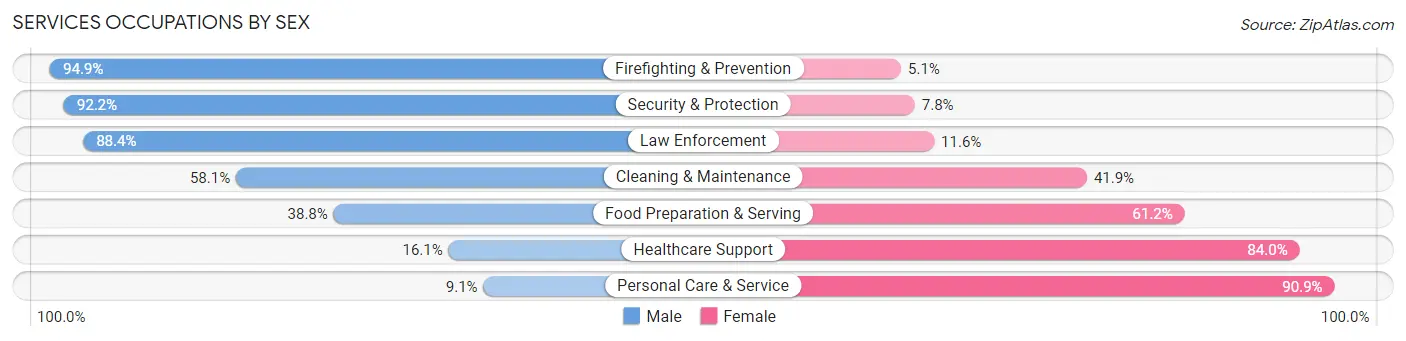
Services Occupations by Sex
Within the Services occupations in Defiance County, the most male-oriented occupations are Firefighting & Prevention (94.9%), Security & Protection (92.2%), and Law Enforcement (88.4%), while the most female-oriented occupations are Personal Care & Service (90.9%), Healthcare Support (84.0%), and Food Preparation & Serving (61.2%).
| Occupation | Male | Female |
| Healthcare Support | 48 (16.1%) | 251 (84.0%) |
| Security & Protection | 249 (92.2%) | 21 (7.8%) |
| Firefighting & Prevention | 150 (94.9%) | 8 (5.1%) |
| Law Enforcement | 99 (88.4%) | 13 (11.6%) |
| Food Preparation & Serving | 333 (38.8%) | 525 (61.2%) |
| Cleaning & Maintenance | 457 (58.1%) | 329 (41.9%) |
| Personal Care & Service | 17 (9.1%) | 169 (90.9%) |
| Total (Category) | 1,104 (46.0%) | 1,295 (54.0%) |
| Total (Overall) | 10,261 (54.5%) | 8,552 (45.5%) |
Sales and Office Occupations
The most common Sales and Office occupations in Defiance County are Office & Administration (1,824 | 9.7%), and Sales & Related (1,613 | 8.6%).
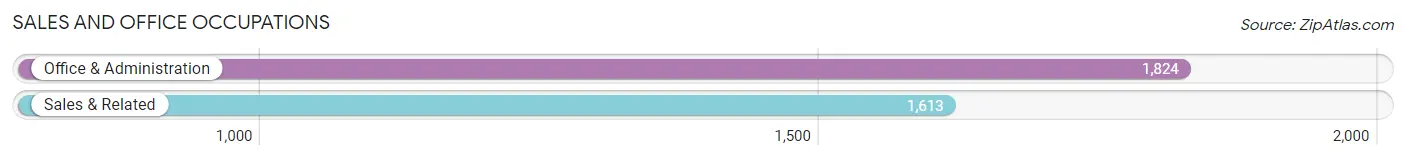
Sales and Office Occupations by Sex

| Occupation | Male | Female |
| Sales & Related | 654 (40.6%) | 959 (59.5%) |
| Office & Administration | 332 (18.2%) | 1,492 (81.8%) |
| Total (Category) | 986 (28.7%) | 2,451 (71.3%) |
| Total (Overall) | 10,261 (54.5%) | 8,552 (45.5%) |
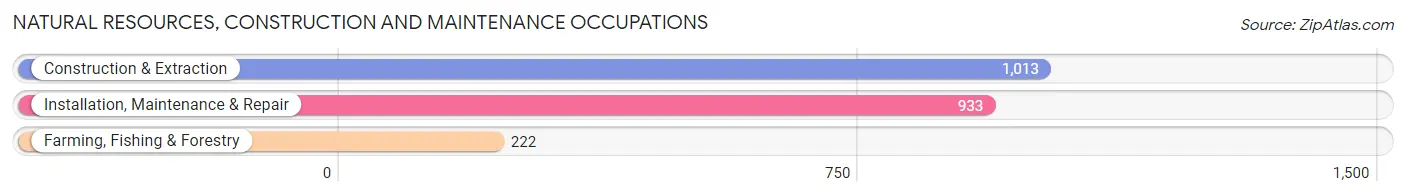
Natural Resources, Construction and Maintenance Occupations
The most common Natural Resources, Construction and Maintenance occupations in Defiance County are Construction & Extraction (1,013 | 5.4%), Installation, Maintenance & Repair (933 | 5.0%), and Farming, Fishing & Forestry (222 | 1.2%).
Natural Resources, Construction and Maintenance Occupations by Sex
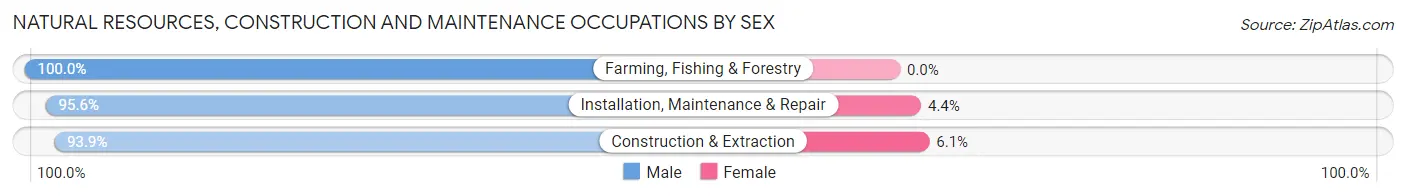
| Occupation | Male | Female |
| Farming, Fishing & Forestry | 222 (100.0%) | 0 (0.0%) |
| Construction & Extraction | 951 (93.9%) | 62 (6.1%) |
| Installation, Maintenance & Repair | 892 (95.6%) | 41 (4.4%) |
| Total (Category) | 2,065 (95.3%) | 103 (4.8%) |
| Total (Overall) | 10,261 (54.5%) | 8,552 (45.5%) |
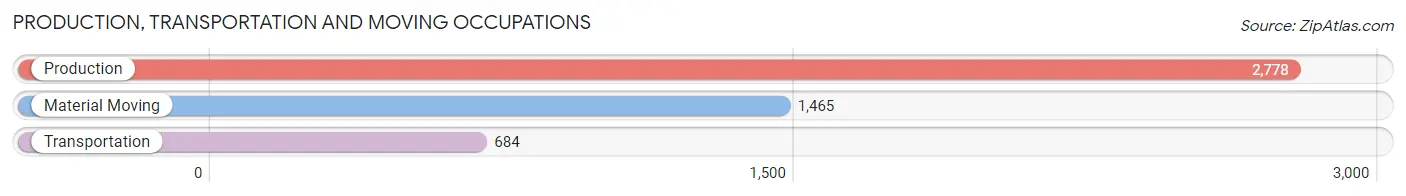
Production, Transportation and Moving Occupations
The most common Production, Transportation and Moving occupations in Defiance County are Production (2,778 | 14.8%), Material Moving (1,465 | 7.8%), and Transportation (684 | 3.6%).
Production, Transportation and Moving Occupations by Sex
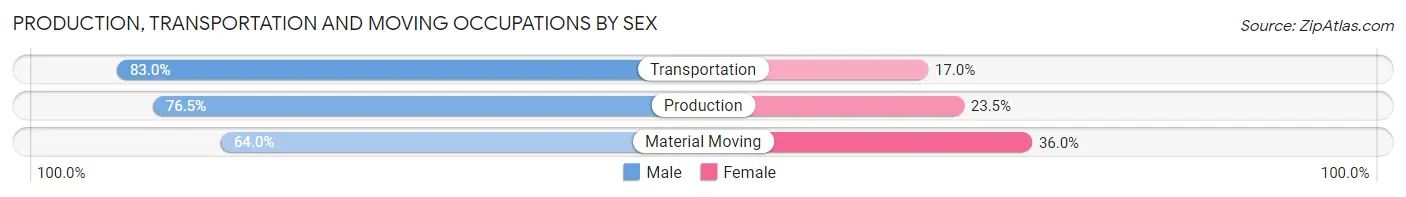
| Occupation | Male | Female |
| Production | 2,124 (76.5%) | 654 (23.5%) |
| Transportation | 568 (83.0%) | 116 (17.0%) |
| Material Moving | 937 (64.0%) | 528 (36.0%) |
| Total (Category) | 3,629 (73.7%) | 1,298 (26.3%) |
| Total (Overall) | 10,261 (54.5%) | 8,552 (45.5%) |
Employment Industries by Sex in Defiance County
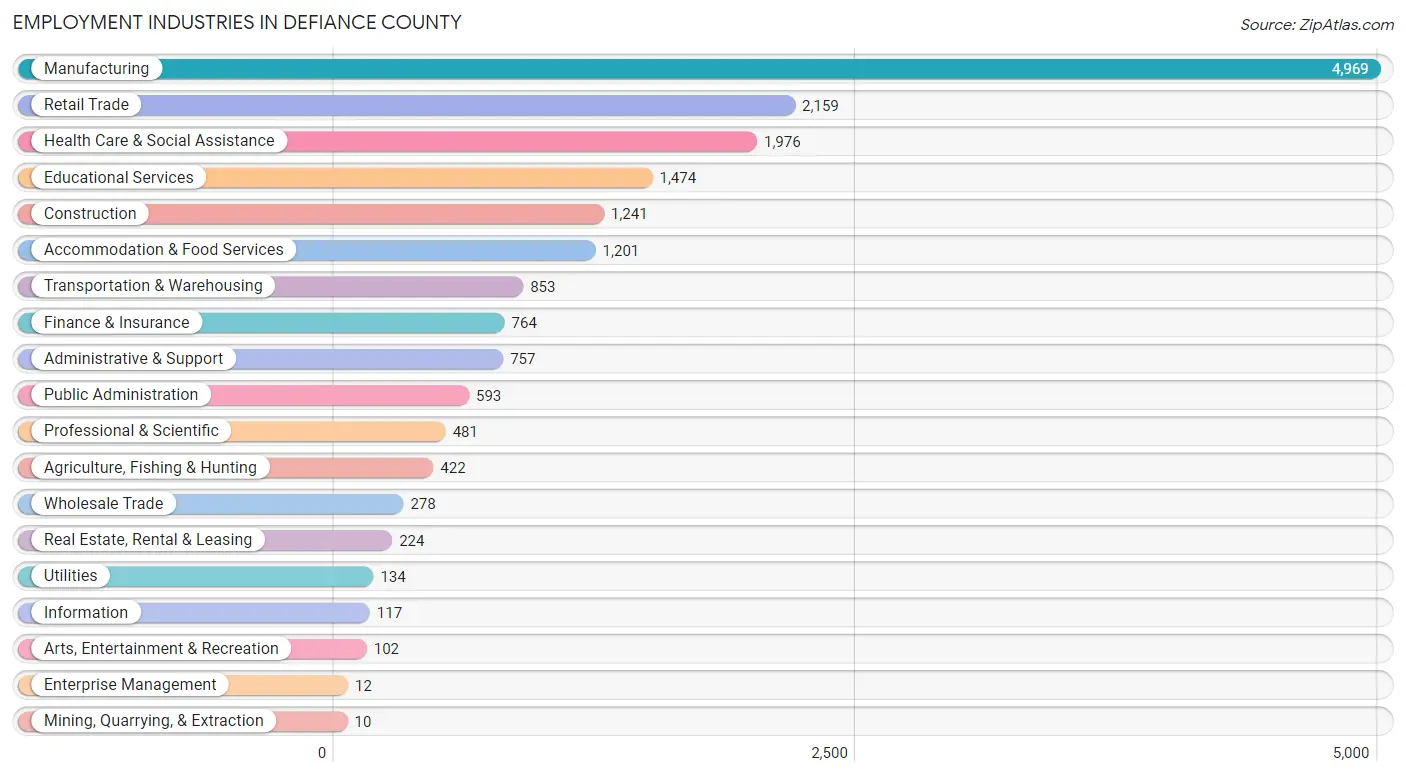
Employment Industries in Defiance County
The major employment industries in Defiance County include Manufacturing (4,969 | 26.4%), Retail Trade (2,159 | 11.5%), Health Care & Social Assistance (1,976 | 10.5%), Educational Services (1,474 | 7.8%), and Construction (1,241 | 6.6%).
Employment Industries by Sex in Defiance County
The Defiance County industries that see more men than women are Mining, Quarrying, & Extraction (100.0%), Agriculture, Fishing & Hunting (93.1%), and Construction (88.8%), whereas the industries that tend to have a higher number of women are Enterprise Management (100.0%), Finance & Insurance (85.9%), and Health Care & Social Assistance (85.2%).
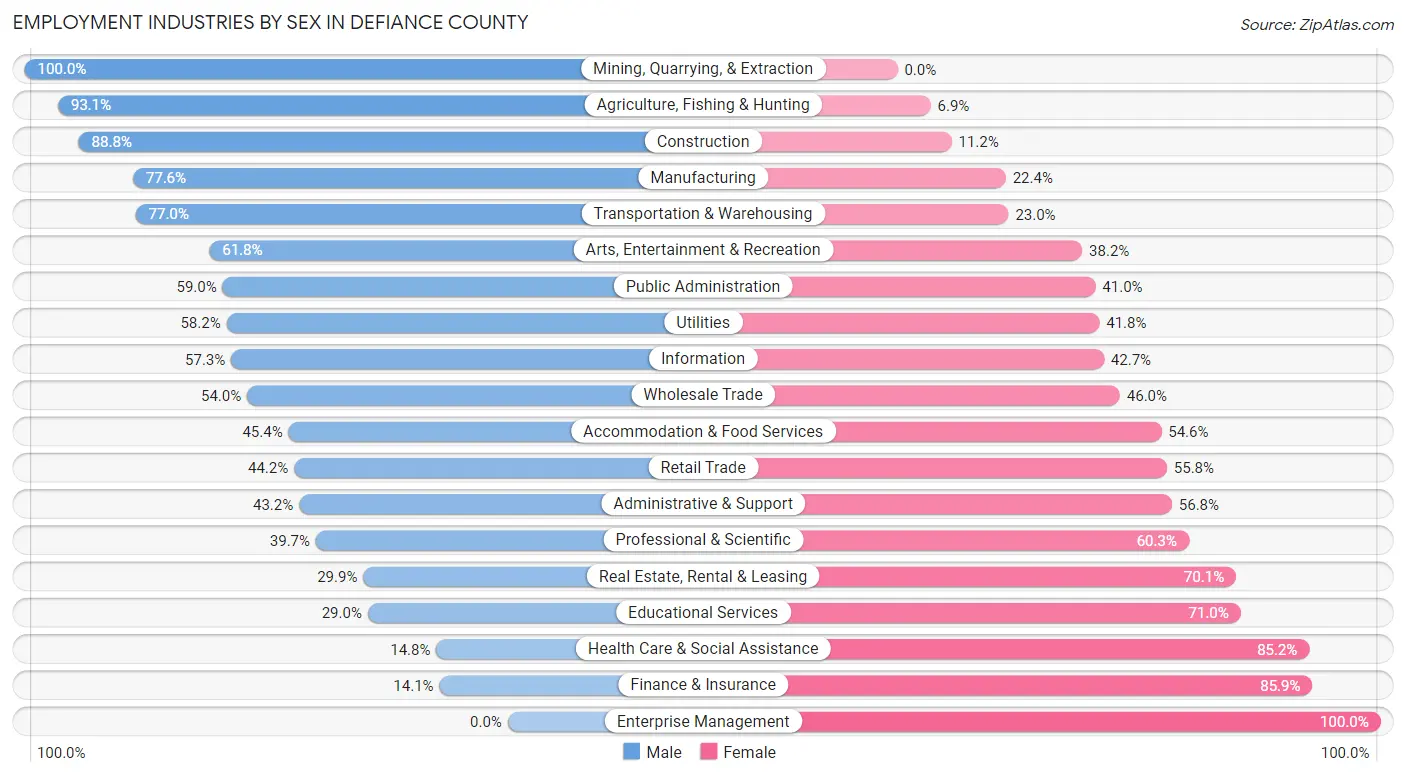
| Industry | Male | Female |
| Agriculture, Fishing & Hunting | 393 (93.1%) | 29 (6.9%) |
| Mining, Quarrying, & Extraction | 10 (100.0%) | 0 (0.0%) |
| Construction | 1,102 (88.8%) | 139 (11.2%) |
| Manufacturing | 3,855 (77.6%) | 1,114 (22.4%) |
| Wholesale Trade | 150 (54.0%) | 128 (46.0%) |
| Retail Trade | 955 (44.2%) | 1,204 (55.8%) |
| Transportation & Warehousing | 657 (77.0%) | 196 (23.0%) |
| Utilities | 78 (58.2%) | 56 (41.8%) |
| Information | 67 (57.3%) | 50 (42.7%) |
| Finance & Insurance | 108 (14.1%) | 656 (85.9%) |
| Real Estate, Rental & Leasing | 67 (29.9%) | 157 (70.1%) |
| Professional & Scientific | 191 (39.7%) | 290 (60.3%) |
| Enterprise Management | 0 (0.0%) | 12 (100.0%) |
| Administrative & Support | 327 (43.2%) | 430 (56.8%) |
| Educational Services | 427 (29.0%) | 1,047 (71.0%) |
| Health Care & Social Assistance | 292 (14.8%) | 1,684 (85.2%) |
| Arts, Entertainment & Recreation | 63 (61.8%) | 39 (38.2%) |
| Accommodation & Food Services | 545 (45.4%) | 656 (54.6%) |
| Public Administration | 350 (59.0%) | 243 (41.0%) |
| Total | 10,261 (54.5%) | 8,552 (45.5%) |
Education in Defiance County
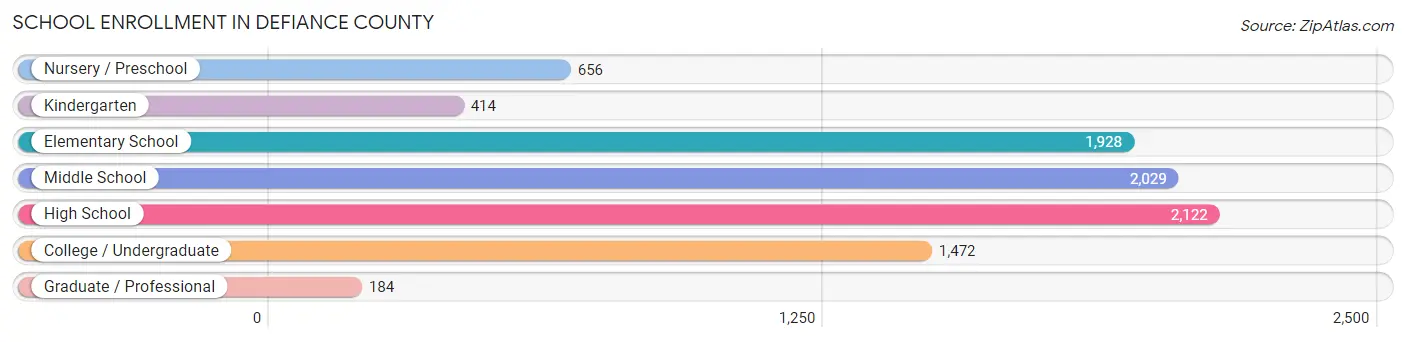
School Enrollment in Defiance County
The most common levels of schooling among the 8,805 students in Defiance County are high school (2,122 | 24.1%), middle school (2,029 | 23.0%), and elementary school (1,928 | 21.9%).
| School Level | # Students | % Students |
| Nursery / Preschool | 656 | 7.4% |
| Kindergarten | 414 | 4.7% |
| Elementary School | 1,928 | 21.9% |
| Middle School | 2,029 | 23.0% |
| High School | 2,122 | 24.1% |
| College / Undergraduate | 1,472 | 16.7% |
| Graduate / Professional | 184 | 2.1% |
| Total | 8,805 | 100.0% |
School Enrollment by Age by Funding Source in Defiance County
Out of a total of 8,805 students who are enrolled in schools in Defiance County, 1,541 (17.5%) attend a private institution, while the remaining 7,264 (82.5%) are enrolled in public schools. The age group of 20 to 24 year olds has the highest likelihood of being enrolled in private schools, with 347 (54.5% in the age bracket) enrolled. Conversely, the age group of 15 to 17 year olds has the lowest likelihood of being enrolled in a private school, with 1,540 (96.6% in the age bracket) attending a public institution.
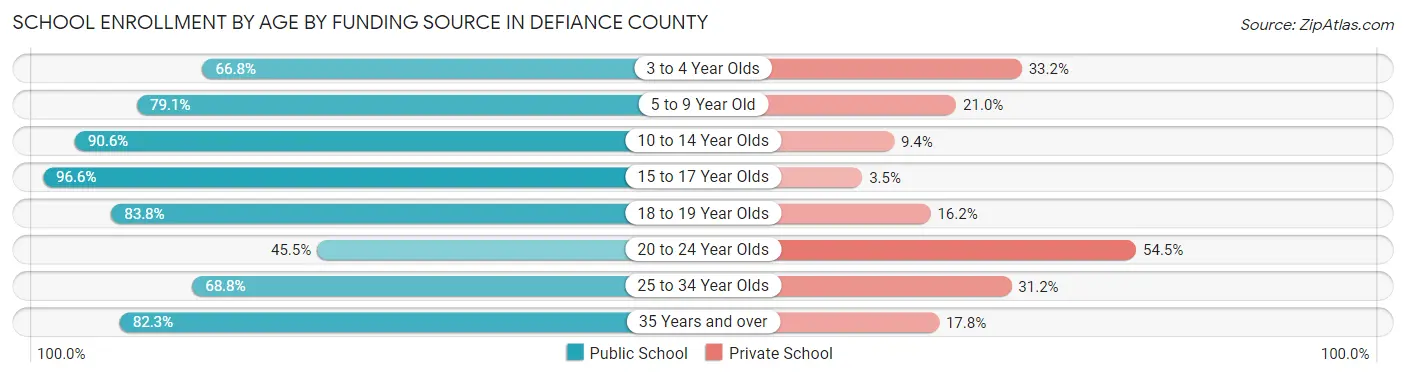
| Age Bracket | Public School | Private School |
| 3 to 4 Year Olds | 276 (66.8%) | 137 (33.2%) |
| 5 to 9 Year Old | 1,709 (79.0%) | 453 (20.9%) |
| 10 to 14 Year Olds | 2,260 (90.6%) | 234 (9.4%) |
| 15 to 17 Year Olds | 1,540 (96.6%) | 55 (3.5%) |
| 18 to 19 Year Olds | 643 (83.8%) | 124 (16.2%) |
| 20 to 24 Year Olds | 290 (45.5%) | 347 (54.5%) |
| 25 to 34 Year Olds | 317 (68.8%) | 144 (31.2%) |
| 35 Years and over | 227 (82.3%) | 49 (17.7%) |
| Total | 7,264 (82.5%) | 1,541 (17.5%) |
Educational Attainment by Field of Study in Defiance County
Education (1,360 | 26.1%), business (1,222 | 23.4%), science & technology (592 | 11.4%), arts & humanities (321 | 6.2%), and engineering (299 | 5.7%) are the most common fields of study among 5,214 individuals in Defiance County who have obtained a bachelor's degree or higher.
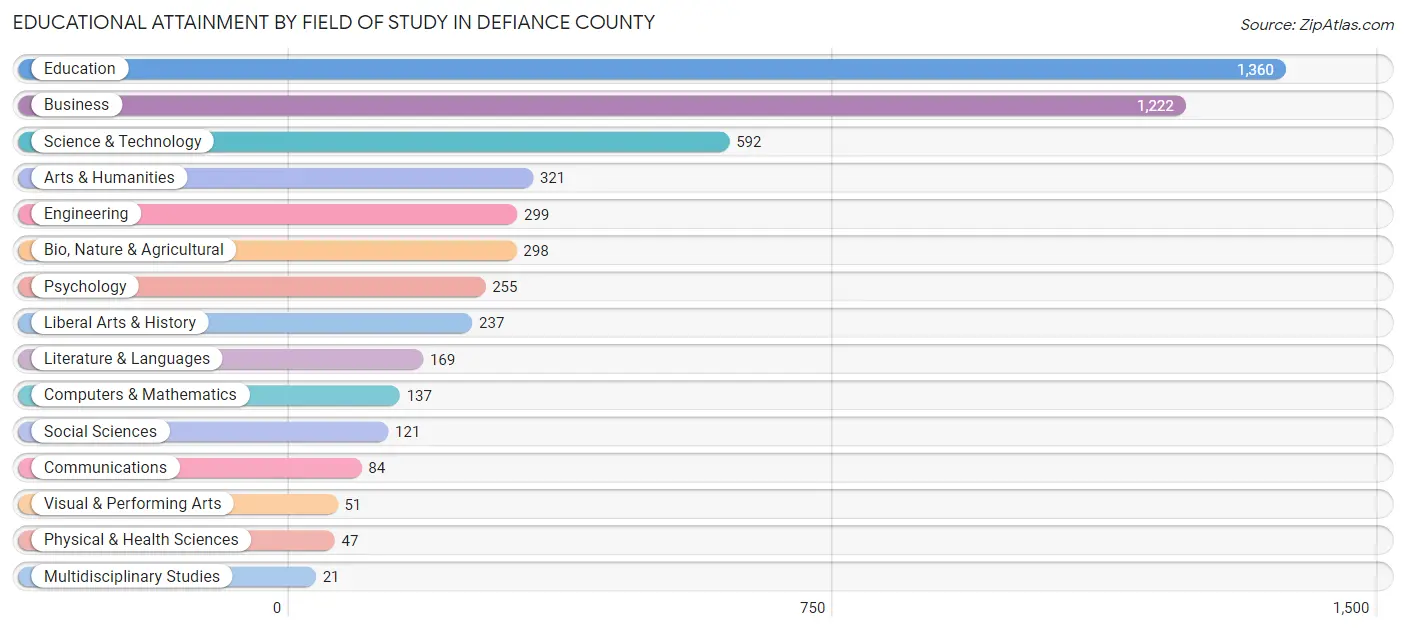
| Field of Study | # Graduates | % Graduates |
| Computers & Mathematics | 137 | 2.6% |
| Bio, Nature & Agricultural | 298 | 5.7% |
| Physical & Health Sciences | 47 | 0.9% |
| Psychology | 255 | 4.9% |
| Social Sciences | 121 | 2.3% |
| Engineering | 299 | 5.7% |
| Multidisciplinary Studies | 21 | 0.4% |
| Science & Technology | 592 | 11.4% |
| Business | 1,222 | 23.4% |
| Education | 1,360 | 26.1% |
| Literature & Languages | 169 | 3.2% |
| Liberal Arts & History | 237 | 4.5% |
| Visual & Performing Arts | 51 | 1.0% |
| Communications | 84 | 1.6% |
| Arts & Humanities | 321 | 6.2% |
| Total | 5,214 | 100.0% |
Transportation & Commute in Defiance County
Vehicle Availability by Sex in Defiance County
The most prevalent vehicle ownership categories in Defiance County are males with 2 vehicles (4,618, accounting for 45.8%) and females with 2 vehicles (3,894, making up 55.3%).
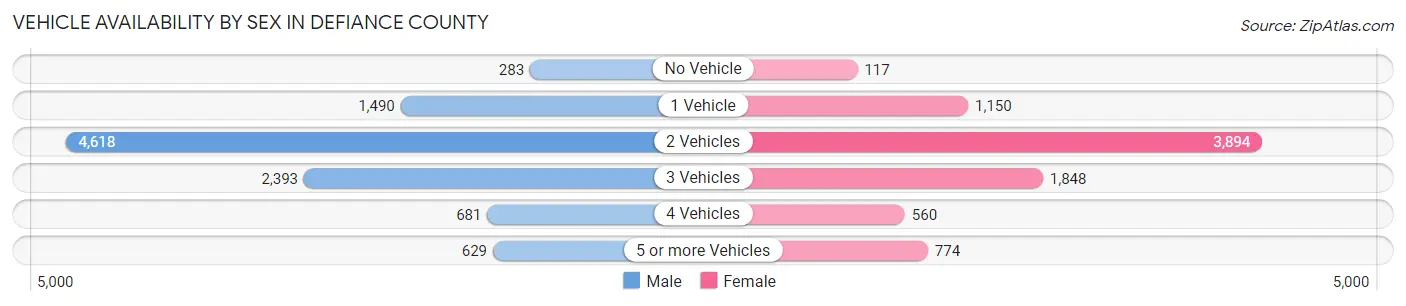
| Vehicles Available | Male | Female |
| No Vehicle | 283 (2.8%) | 117 (1.4%) |
| 1 Vehicle | 1,490 (14.8%) | 1,150 (13.8%) |
| 2 Vehicles | 4,618 (45.8%) | 3,894 (46.7%) |
| 3 Vehicles | 2,393 (23.7%) | 1,848 (22.2%) |
| 4 Vehicles | 681 (6.8%) | 560 (6.7%) |
| 5 or more Vehicles | 629 (6.2%) | 774 (9.3%) |
| Total | 10,094 (100.0%) | 8,343 (100.0%) |
Commute Time in Defiance County
The most frequently occuring commute durations in Defiance County are 10 to 14 minutes (3,324 commuters, 18.7%), 15 to 19 minutes (2,830 commuters, 15.9%), and 5 to 9 minutes (2,601 commuters, 14.6%).
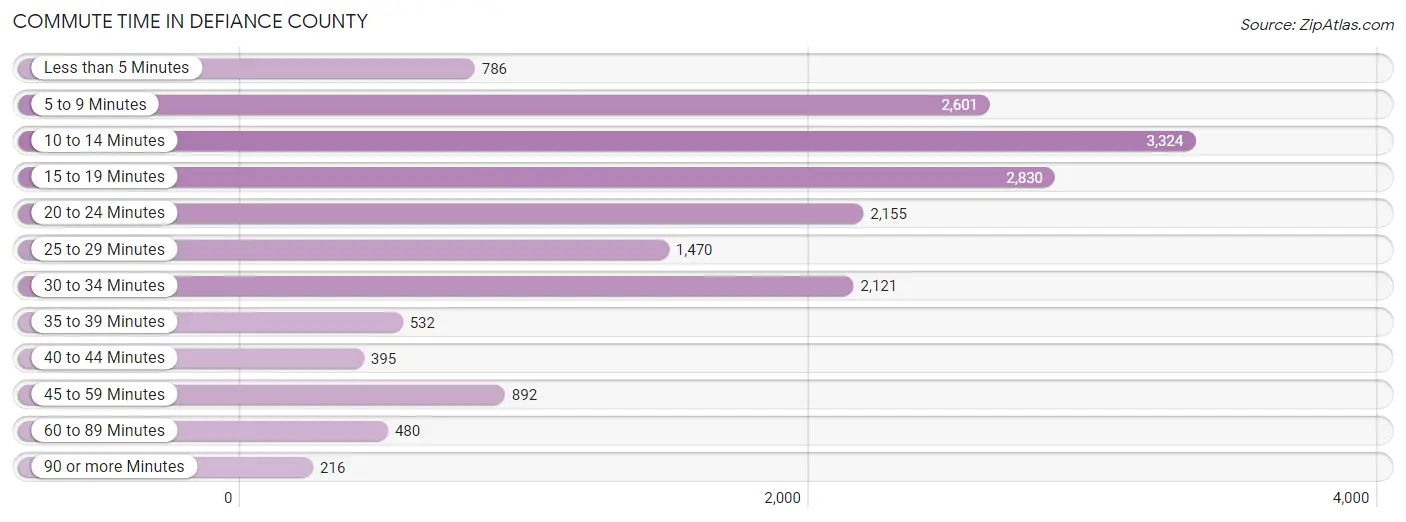
| Commute Time | # Commuters | % Commuters |
| Less than 5 Minutes | 786 | 4.4% |
| 5 to 9 Minutes | 2,601 | 14.6% |
| 10 to 14 Minutes | 3,324 | 18.7% |
| 15 to 19 Minutes | 2,830 | 15.9% |
| 20 to 24 Minutes | 2,155 | 12.1% |
| 25 to 29 Minutes | 1,470 | 8.3% |
| 30 to 34 Minutes | 2,121 | 11.9% |
| 35 to 39 Minutes | 532 | 3.0% |
| 40 to 44 Minutes | 395 | 2.2% |
| 45 to 59 Minutes | 892 | 5.0% |
| 60 to 89 Minutes | 480 | 2.7% |
| 90 or more Minutes | 216 | 1.2% |
Commute Time by Sex in Defiance County
The most common commute times in Defiance County are 10 to 14 minutes (1,697 commuters, 17.3%) for males and 10 to 14 minutes (1,627 commuters, 20.4%) for females.
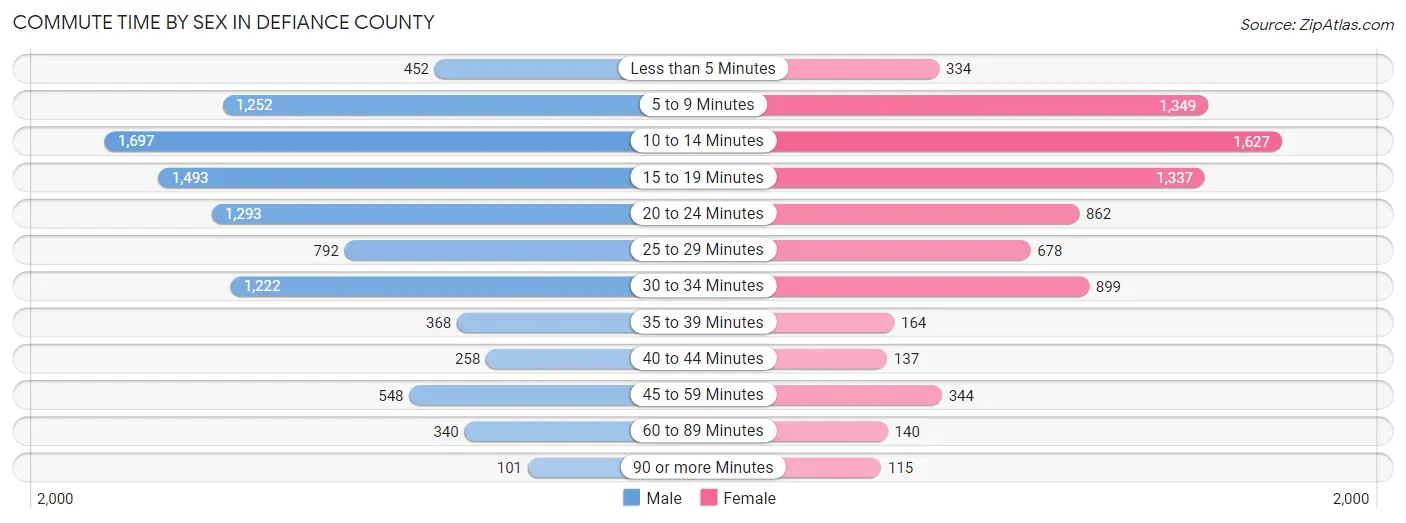
| Commute Time | Male | Female |
| Less than 5 Minutes | 452 (4.6%) | 334 (4.2%) |
| 5 to 9 Minutes | 1,252 (12.8%) | 1,349 (16.9%) |
| 10 to 14 Minutes | 1,697 (17.3%) | 1,627 (20.4%) |
| 15 to 19 Minutes | 1,493 (15.2%) | 1,337 (16.7%) |
| 20 to 24 Minutes | 1,293 (13.2%) | 862 (10.8%) |
| 25 to 29 Minutes | 792 (8.1%) | 678 (8.5%) |
| 30 to 34 Minutes | 1,222 (12.4%) | 899 (11.3%) |
| 35 to 39 Minutes | 368 (3.7%) | 164 (2.1%) |
| 40 to 44 Minutes | 258 (2.6%) | 137 (1.7%) |
| 45 to 59 Minutes | 548 (5.6%) | 344 (4.3%) |
| 60 to 89 Minutes | 340 (3.5%) | 140 (1.8%) |
| 90 or more Minutes | 101 (1.0%) | 115 (1.4%) |
Time of Departure to Work by Sex in Defiance County
The most frequent times of departure to work in Defiance County are 6:00 AM to 6:29 AM (1,257, 12.8%) for males and 7:00 AM to 7:29 AM (1,311, 16.4%) for females.
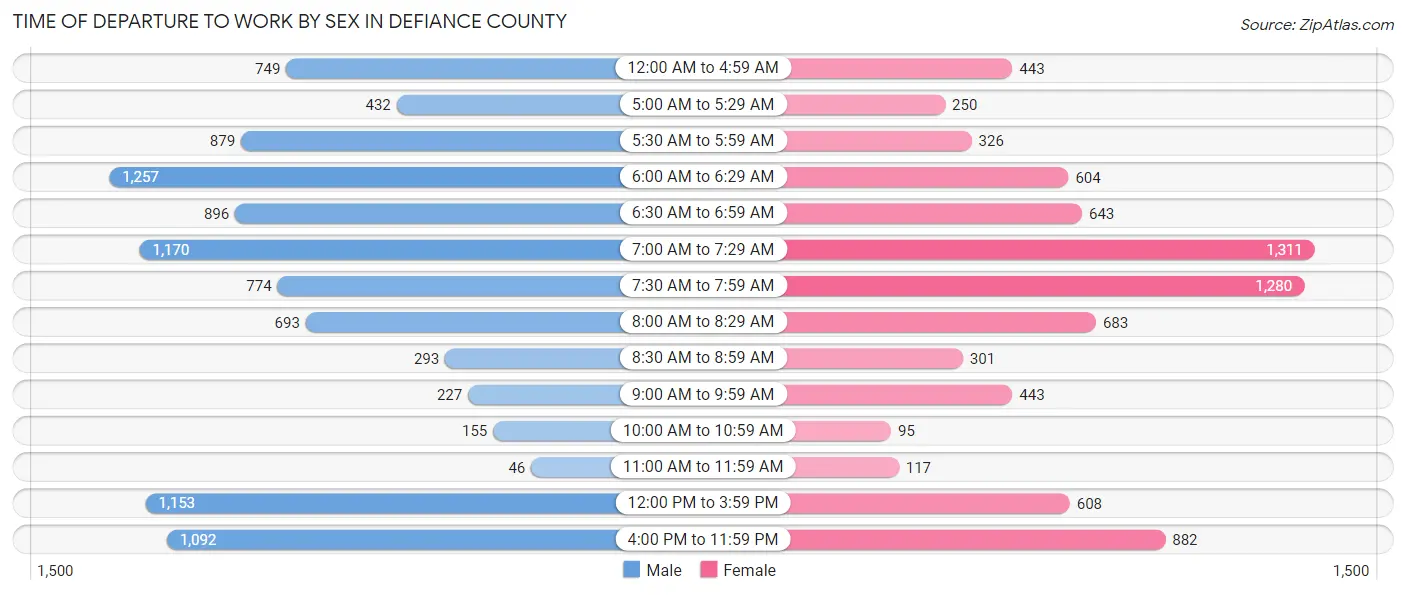
| Time of Departure | Male | Female |
| 12:00 AM to 4:59 AM | 749 (7.6%) | 443 (5.6%) |
| 5:00 AM to 5:29 AM | 432 (4.4%) | 250 (3.1%) |
| 5:30 AM to 5:59 AM | 879 (8.9%) | 326 (4.1%) |
| 6:00 AM to 6:29 AM | 1,257 (12.8%) | 604 (7.6%) |
| 6:30 AM to 6:59 AM | 896 (9.1%) | 643 (8.1%) |
| 7:00 AM to 7:29 AM | 1,170 (11.9%) | 1,311 (16.4%) |
| 7:30 AM to 7:59 AM | 774 (7.9%) | 1,280 (16.0%) |
| 8:00 AM to 8:29 AM | 693 (7.1%) | 683 (8.6%) |
| 8:30 AM to 8:59 AM | 293 (3.0%) | 301 (3.8%) |
| 9:00 AM to 9:59 AM | 227 (2.3%) | 443 (5.6%) |
| 10:00 AM to 10:59 AM | 155 (1.6%) | 95 (1.2%) |
| 11:00 AM to 11:59 AM | 46 (0.5%) | 117 (1.5%) |
| 12:00 PM to 3:59 PM | 1,153 (11.7%) | 608 (7.6%) |
| 4:00 PM to 11:59 PM | 1,092 (11.1%) | 882 (11.0%) |
| Total | 9,816 (100.0%) | 7,986 (100.0%) |
Housing Occupancy in Defiance County
Occupancy by Ownership in Defiance County
Of the total 15,262 dwellings in Defiance County, owner-occupied units account for 11,814 (77.4%), while renter-occupied units make up 3,448 (22.6%).
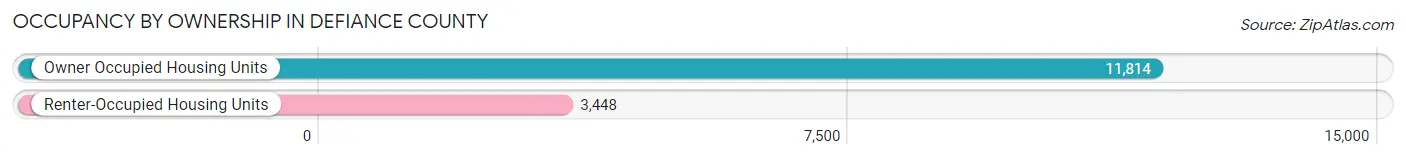
| Occupancy | # Housing Units | % Housing Units |
| Owner Occupied Housing Units | 11,814 | 77.4% |
| Renter-Occupied Housing Units | 3,448 | 22.6% |
| Total Occupied Housing Units | 15,262 | 100.0% |
Occupancy by Household Size in Defiance County
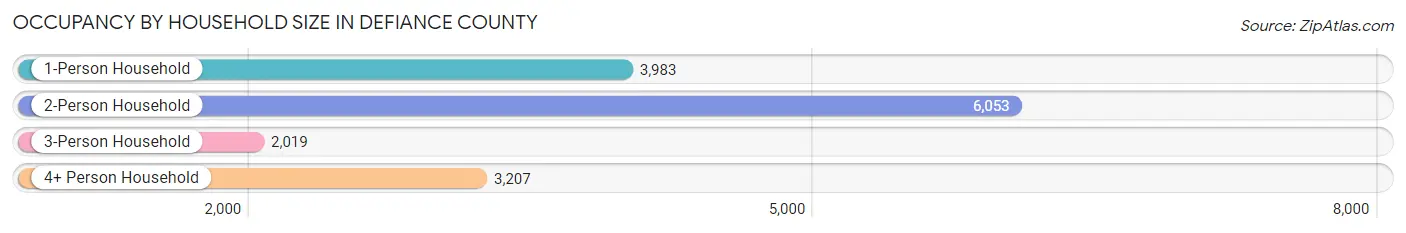
| Household Size | # Housing Units | % Housing Units |
| 1-Person Household | 3,983 | 26.1% |
| 2-Person Household | 6,053 | 39.7% |
| 3-Person Household | 2,019 | 13.2% |
| 4+ Person Household | 3,207 | 21.0% |
| Total Housing Units | 15,262 | 100.0% |
Occupancy by Ownership by Household Size in Defiance County
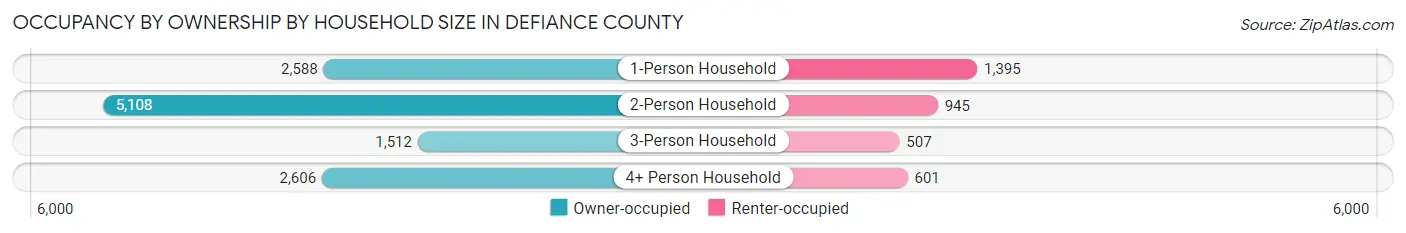
| Household Size | Owner-occupied | Renter-occupied |
| 1-Person Household | 2,588 (65.0%) | 1,395 (35.0%) |
| 2-Person Household | 5,108 (84.4%) | 945 (15.6%) |
| 3-Person Household | 1,512 (74.9%) | 507 (25.1%) |
| 4+ Person Household | 2,606 (81.3%) | 601 (18.7%) |
| Total Housing Units | 11,814 (77.4%) | 3,448 (22.6%) |
Occupancy by Educational Attainment in Defiance County
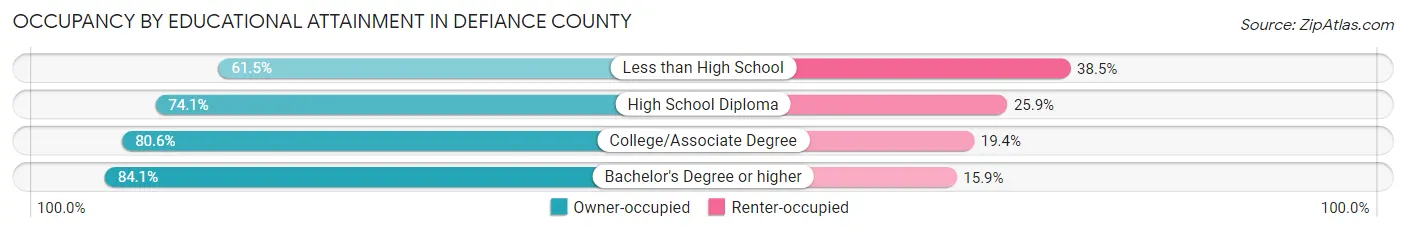
| Household Size | Owner-occupied | Renter-occupied |
| Less than High School | 712 (61.5%) | 445 (38.5%) |
| High School Diploma | 4,293 (74.1%) | 1,503 (25.9%) |
| College/Associate Degree | 4,164 (80.6%) | 1,000 (19.4%) |
| Bachelor's Degree or higher | 2,645 (84.1%) | 500 (15.9%) |
Occupancy by Age of Householder in Defiance County
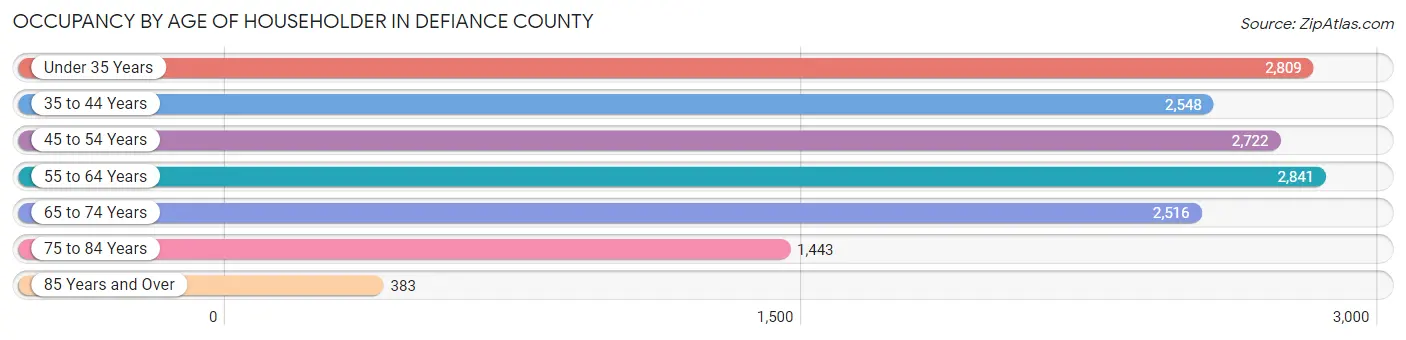
| Age Bracket | # Households | % Households |
| Under 35 Years | 2,809 | 18.4% |
| 35 to 44 Years | 2,548 | 16.7% |
| 45 to 54 Years | 2,722 | 17.8% |
| 55 to 64 Years | 2,841 | 18.6% |
| 65 to 74 Years | 2,516 | 16.5% |
| 75 to 84 Years | 1,443 | 9.5% |
| 85 Years and Over | 383 | 2.5% |
| Total | 15,262 | 100.0% |
Housing Finances in Defiance County
Median Income by Occupancy in Defiance County
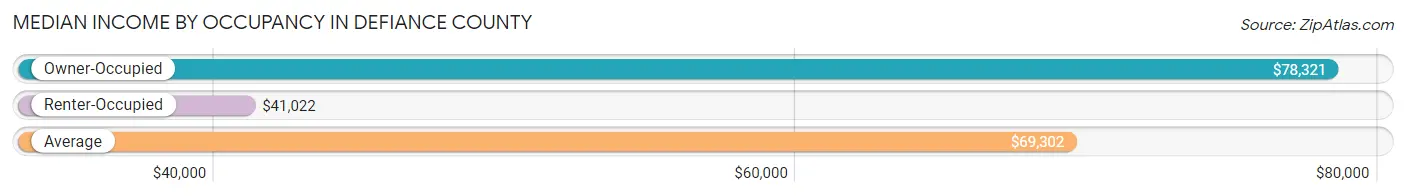
| Occupancy Type | # Households | Median Income |
| Owner-Occupied | 11,814 (77.4%) | $78,321 |
| Renter-Occupied | 3,448 (22.6%) | $41,022 |
| Average | 15,262 (100.0%) | $69,302 |
Occupancy by Householder Income Bracket in Defiance County
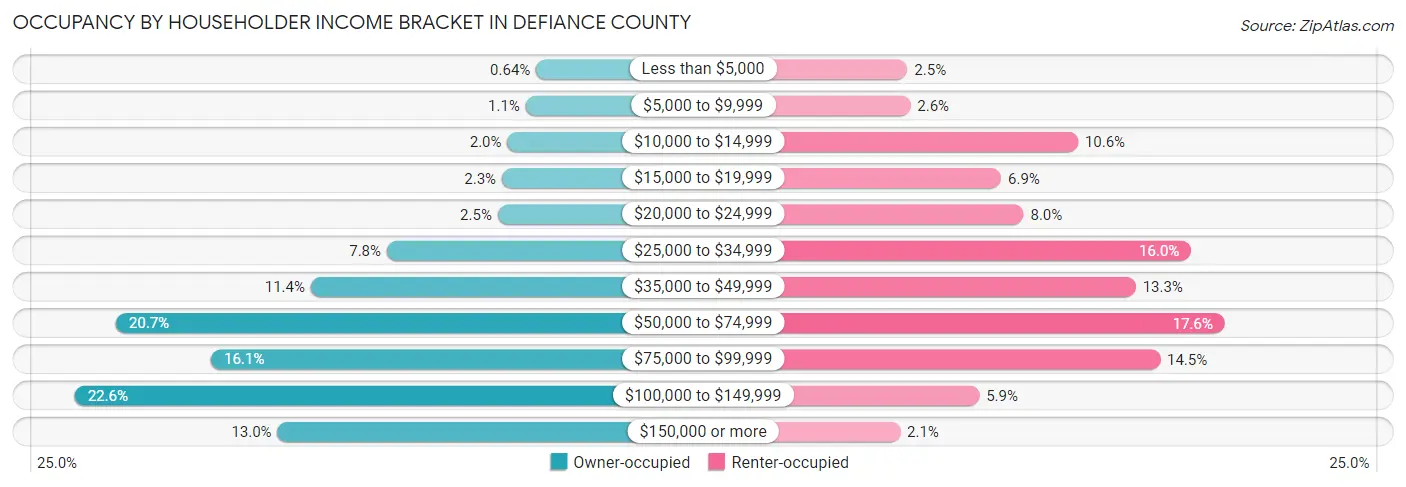
| Income Bracket | Owner-occupied | Renter-occupied |
| Less than $5,000 | 76 (0.6%) | 85 (2.5%) |
| $5,000 to $9,999 | 135 (1.1%) | 90 (2.6%) |
| $10,000 to $14,999 | 237 (2.0%) | 365 (10.6%) |
| $15,000 to $19,999 | 268 (2.3%) | 239 (6.9%) |
| $20,000 to $24,999 | 292 (2.5%) | 276 (8.0%) |
| $25,000 to $34,999 | 916 (7.7%) | 551 (16.0%) |
| $35,000 to $49,999 | 1,343 (11.4%) | 460 (13.3%) |
| $50,000 to $74,999 | 2,440 (20.6%) | 606 (17.6%) |
| $75,000 to $99,999 | 1,905 (16.1%) | 500 (14.5%) |
| $100,000 to $149,999 | 2,671 (22.6%) | 203 (5.9%) |
| $150,000 or more | 1,531 (13.0%) | 73 (2.1%) |
| Total | 11,814 (100.0%) | 3,448 (100.0%) |
Monthly Housing Cost Tiers in Defiance County
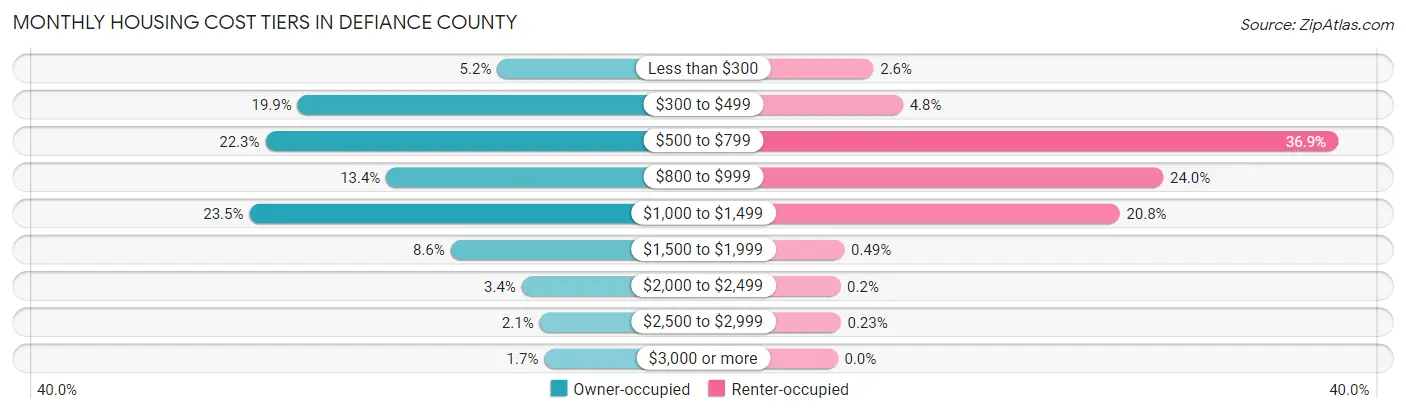
| Monthly Cost | Owner-occupied | Renter-occupied |
| Less than $300 | 613 (5.2%) | 91 (2.6%) |
| $300 to $499 | 2,351 (19.9%) | 166 (4.8%) |
| $500 to $799 | 2,631 (22.3%) | 1,271 (36.9%) |
| $800 to $999 | 1,579 (13.4%) | 827 (24.0%) |
| $1,000 to $1,499 | 2,770 (23.4%) | 716 (20.8%) |
| $1,500 to $1,999 | 1,020 (8.6%) | 17 (0.5%) |
| $2,000 to $2,499 | 400 (3.4%) | 7 (0.2%) |
| $2,500 to $2,999 | 246 (2.1%) | 8 (0.2%) |
| $3,000 or more | 204 (1.7%) | 0 (0.0%) |
| Total | 11,814 (100.0%) | 3,448 (100.0%) |
Physical Housing Characteristics in Defiance County
Housing Structures in Defiance County
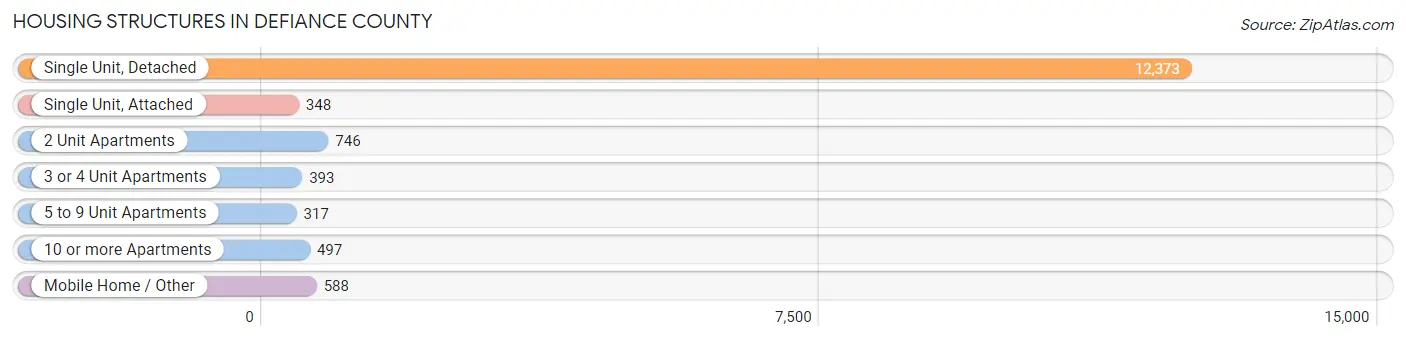
| Structure Type | # Housing Units | % Housing Units |
| Single Unit, Detached | 12,373 | 81.1% |
| Single Unit, Attached | 348 | 2.3% |
| 2 Unit Apartments | 746 | 4.9% |
| 3 or 4 Unit Apartments | 393 | 2.6% |
| 5 to 9 Unit Apartments | 317 | 2.1% |
| 10 or more Apartments | 497 | 3.3% |
| Mobile Home / Other | 588 | 3.8% |
| Total | 15,262 | 100.0% |
Housing Structures by Occupancy in Defiance County
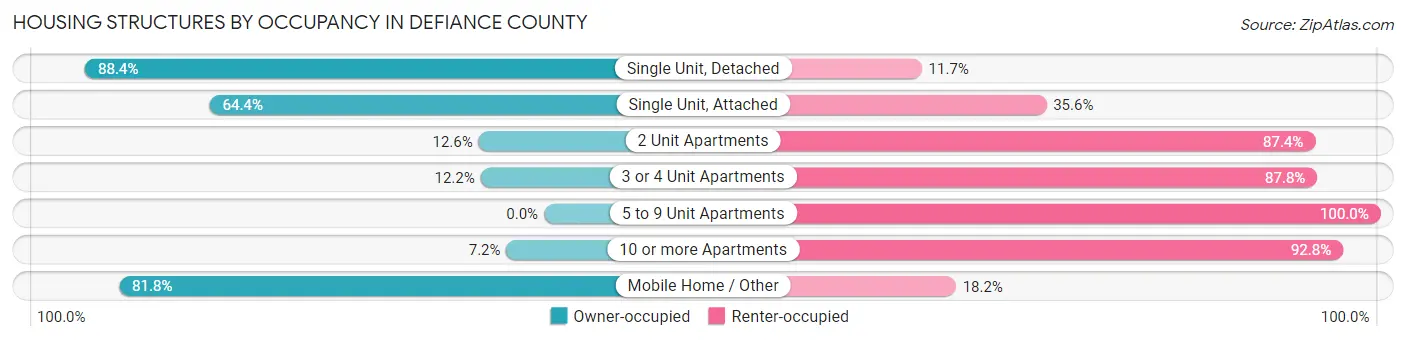
| Structure Type | Owner-occupied | Renter-occupied |
| Single Unit, Detached | 10,931 (88.3%) | 1,442 (11.7%) |
| Single Unit, Attached | 224 (64.4%) | 124 (35.6%) |
| 2 Unit Apartments | 94 (12.6%) | 652 (87.4%) |
| 3 or 4 Unit Apartments | 48 (12.2%) | 345 (87.8%) |
| 5 to 9 Unit Apartments | 0 (0.0%) | 317 (100.0%) |
| 10 or more Apartments | 36 (7.2%) | 461 (92.8%) |
| Mobile Home / Other | 481 (81.8%) | 107 (18.2%) |
| Total | 11,814 (77.4%) | 3,448 (22.6%) |
Housing Structures by Number of Rooms in Defiance County
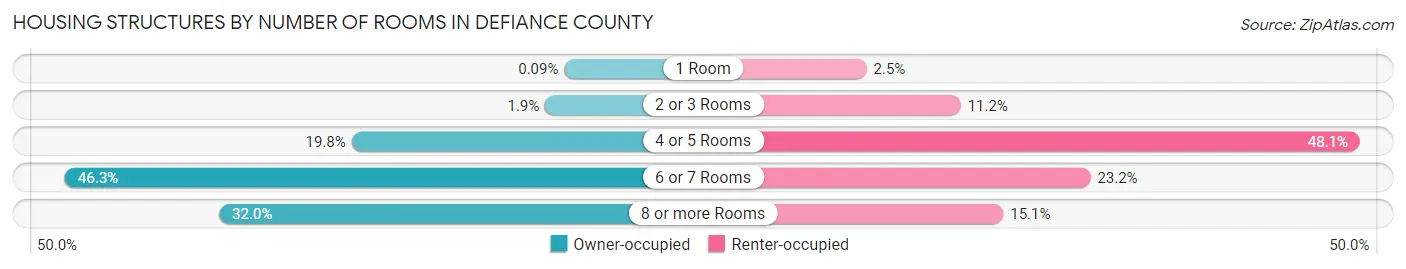
| Number of Rooms | Owner-occupied | Renter-occupied |
| 1 Room | 11 (0.1%) | 85 (2.5%) |
| 2 or 3 Rooms | 220 (1.9%) | 385 (11.2%) |
| 4 or 5 Rooms | 2,335 (19.8%) | 1,658 (48.1%) |
| 6 or 7 Rooms | 5,466 (46.3%) | 799 (23.2%) |
| 8 or more Rooms | 3,782 (32.0%) | 521 (15.1%) |
| Total | 11,814 (100.0%) | 3,448 (100.0%) |
Housing Structure by Heating Type in Defiance County
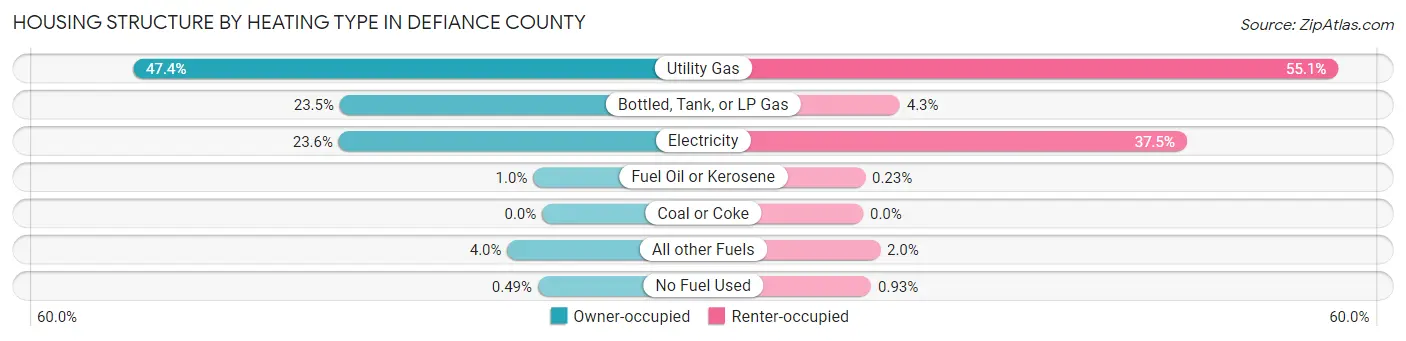
| Heating Type | Owner-occupied | Renter-occupied |
| Utility Gas | 5,603 (47.4%) | 1,899 (55.1%) |
| Bottled, Tank, or LP Gas | 2,771 (23.5%) | 147 (4.3%) |
| Electricity | 2,784 (23.6%) | 1,294 (37.5%) |
| Fuel Oil or Kerosene | 122 (1.0%) | 8 (0.2%) |
| Coal or Coke | 0 (0.0%) | 0 (0.0%) |
| All other Fuels | 476 (4.0%) | 68 (2.0%) |
| No Fuel Used | 58 (0.5%) | 32 (0.9%) |
| Total | 11,814 (100.0%) | 3,448 (100.0%) |
Household Vehicle Usage in Defiance County
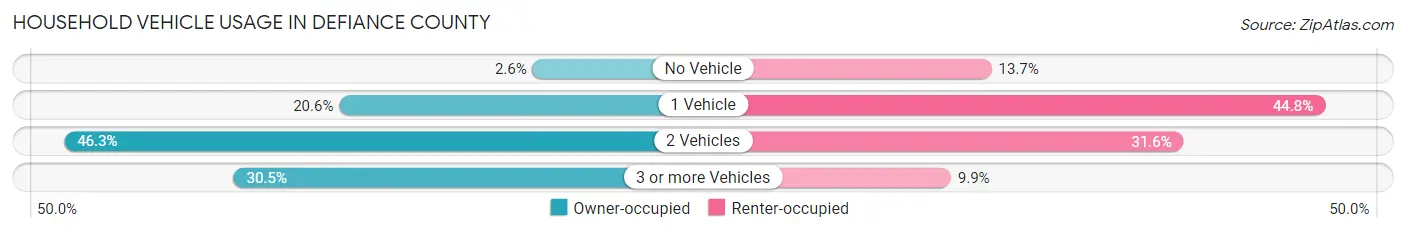
| Vehicles per Household | Owner-occupied | Renter-occupied |
| No Vehicle | 305 (2.6%) | 472 (13.7%) |
| 1 Vehicle | 2,437 (20.6%) | 1,545 (44.8%) |
| 2 Vehicles | 5,470 (46.3%) | 1,090 (31.6%) |
| 3 or more Vehicles | 3,602 (30.5%) | 341 (9.9%) |
| Total | 11,814 (100.0%) | 3,448 (100.0%) |
Real Estate & Mortgages in Defiance County
Real Estate and Mortgage Overview in Defiance County
| Characteristic | Without Mortgage | With Mortgage |
| Housing Units | 5,037 | 6,777 |
| Median Property Value | $145,800 | $148,700 |
| Median Household Income | $63,487 | $1,139 |
| Monthly Housing Costs | $478 | $195 |
| Real Estate Taxes | $1,705 | $149 |
Property Value by Mortgage Status in Defiance County
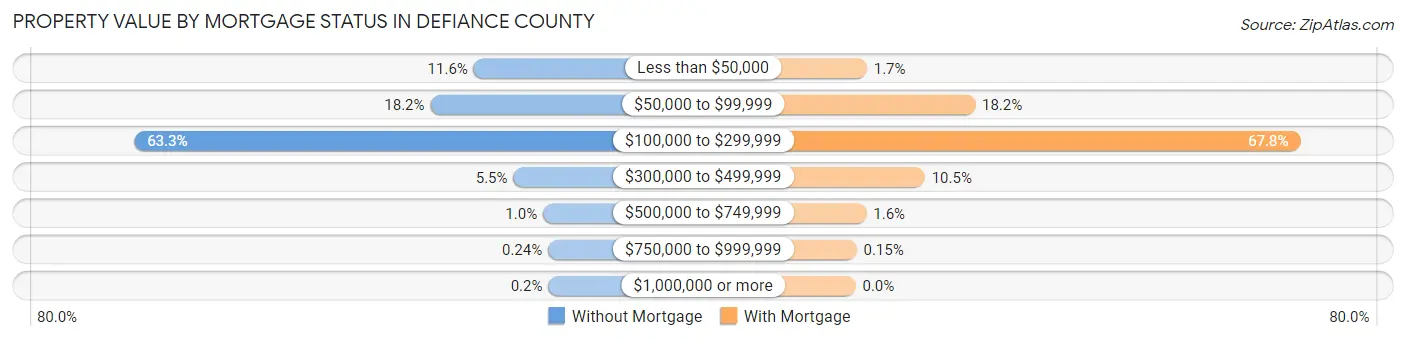
| Property Value | Without Mortgage | With Mortgage |
| Less than $50,000 | 583 (11.6%) | 116 (1.7%) |
| $50,000 to $99,999 | 915 (18.2%) | 1,234 (18.2%) |
| $100,000 to $299,999 | 3,188 (63.3%) | 4,592 (67.8%) |
| $300,000 to $499,999 | 278 (5.5%) | 714 (10.5%) |
| $500,000 to $749,999 | 51 (1.0%) | 111 (1.6%) |
| $750,000 to $999,999 | 12 (0.2%) | 10 (0.2%) |
| $1,000,000 or more | 10 (0.2%) | 0 (0.0%) |
| Total | 5,037 (100.0%) | 6,777 (100.0%) |
Household Income by Mortgage Status in Defiance County
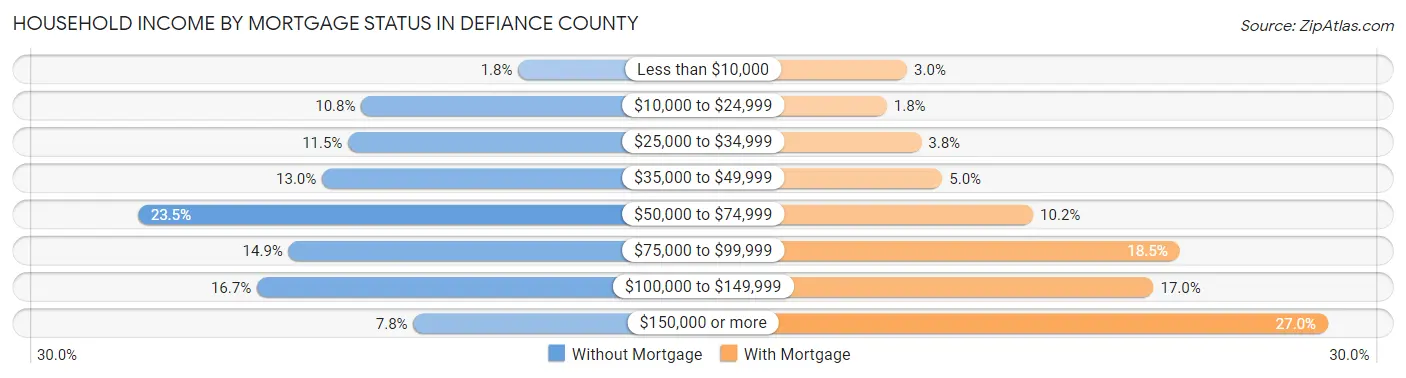
| Household Income | Without Mortgage | With Mortgage |
| Less than $10,000 | 90 (1.8%) | 200 (2.9%) |
| $10,000 to $24,999 | 542 (10.8%) | 121 (1.8%) |
| $25,000 to $34,999 | 580 (11.5%) | 255 (3.8%) |
| $35,000 to $49,999 | 655 (13.0%) | 336 (5.0%) |
| $50,000 to $74,999 | 1,185 (23.5%) | 688 (10.2%) |
| $75,000 to $99,999 | 751 (14.9%) | 1,255 (18.5%) |
| $100,000 to $149,999 | 842 (16.7%) | 1,154 (17.0%) |
| $150,000 or more | 392 (7.8%) | 1,829 (27.0%) |
| Total | 5,037 (100.0%) | 6,777 (100.0%) |
Property Value to Household Income Ratio in Defiance County
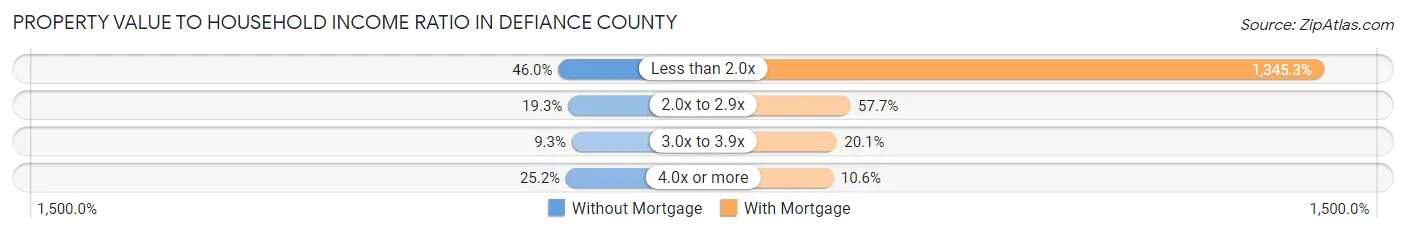
| Value-to-Income Ratio | Without Mortgage | With Mortgage |
| Less than 2.0x | 2,317 (46.0%) | 91,169 (1,345.3%) |
| 2.0x to 2.9x | 971 (19.3%) | 3,910 (57.7%) |
| 3.0x to 3.9x | 467 (9.3%) | 1,363 (20.1%) |
| 4.0x or more | 1,271 (25.2%) | 715 (10.5%) |
| Total | 5,037 (100.0%) | 6,777 (100.0%) |
Real Estate Taxes by Mortgage Status in Defiance County
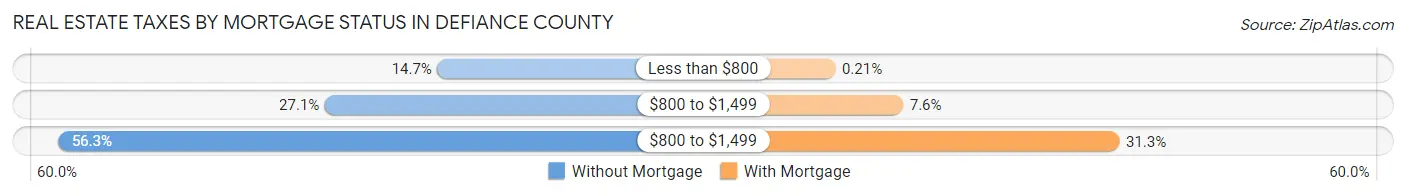
| Property Taxes | Without Mortgage | With Mortgage |
| Less than $800 | 742 (14.7%) | 14 (0.2%) |
| $800 to $1,499 | 1,363 (27.1%) | 518 (7.6%) |
| $800 to $1,499 | 2,834 (56.3%) | 2,124 (31.3%) |
| Total | 5,037 (100.0%) | 6,777 (100.0%) |
Health & Disability in Defiance County
Health Insurance Coverage by Age in Defiance County
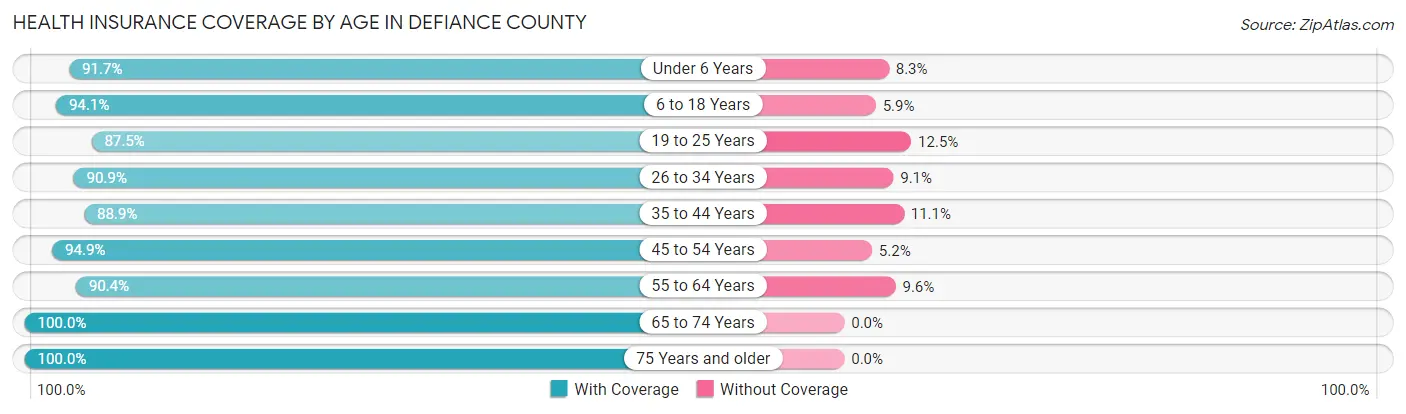
| Age Bracket | With Coverage | Without Coverage |
| Under 6 Years | 2,434 (91.7%) | 220 (8.3%) |
| 6 to 18 Years | 6,220 (94.1%) | 387 (5.9%) |
| 19 to 25 Years | 2,772 (87.5%) | 395 (12.5%) |
| 26 to 34 Years | 3,676 (90.9%) | 370 (9.1%) |
| 35 to 44 Years | 4,323 (88.9%) | 539 (11.1%) |
| 45 to 54 Years | 4,239 (94.9%) | 230 (5.1%) |
| 55 to 64 Years | 4,684 (90.4%) | 495 (9.6%) |
| 65 to 74 Years | 4,239 (100.0%) | 0 (0.0%) |
| 75 Years and older | 2,775 (100.0%) | 0 (0.0%) |
| Total | 35,362 (93.1%) | 2,636 (6.9%) |
Health Insurance Coverage by Citizenship Status in Defiance County
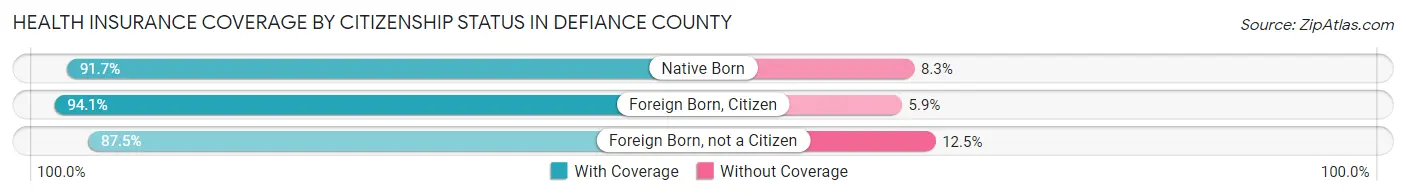
| Citizenship Status | With Coverage | Without Coverage |
| Native Born | 2,434 (91.7%) | 220 (8.3%) |
| Foreign Born, Citizen | 6,220 (94.1%) | 387 (5.9%) |
| Foreign Born, not a Citizen | 2,772 (87.5%) | 395 (12.5%) |
Health Insurance Coverage by Household Income in Defiance County
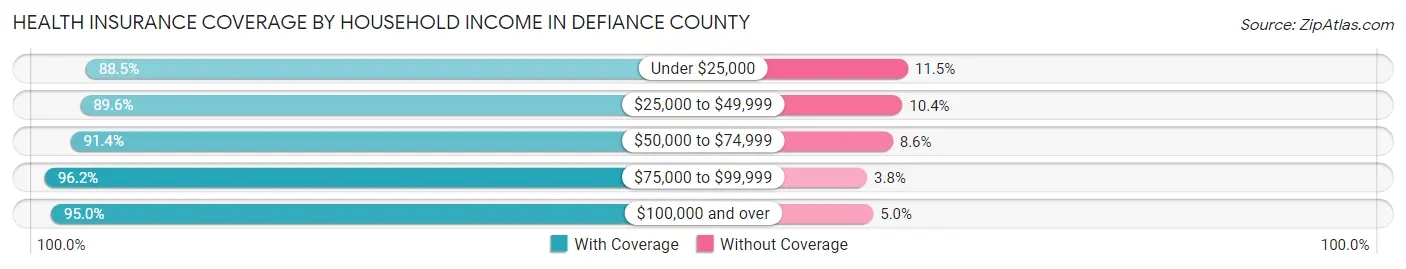
| Household Income | With Coverage | Without Coverage |
| Under $25,000 | 3,212 (88.5%) | 416 (11.5%) |
| $25,000 to $49,999 | 5,390 (89.6%) | 627 (10.4%) |
| $50,000 to $74,999 | 6,755 (91.4%) | 637 (8.6%) |
| $75,000 to $99,999 | 5,915 (96.2%) | 234 (3.8%) |
| $100,000 and over | 13,806 (95.0%) | 720 (5.0%) |
Public vs Private Health Insurance Coverage by Age in Defiance County
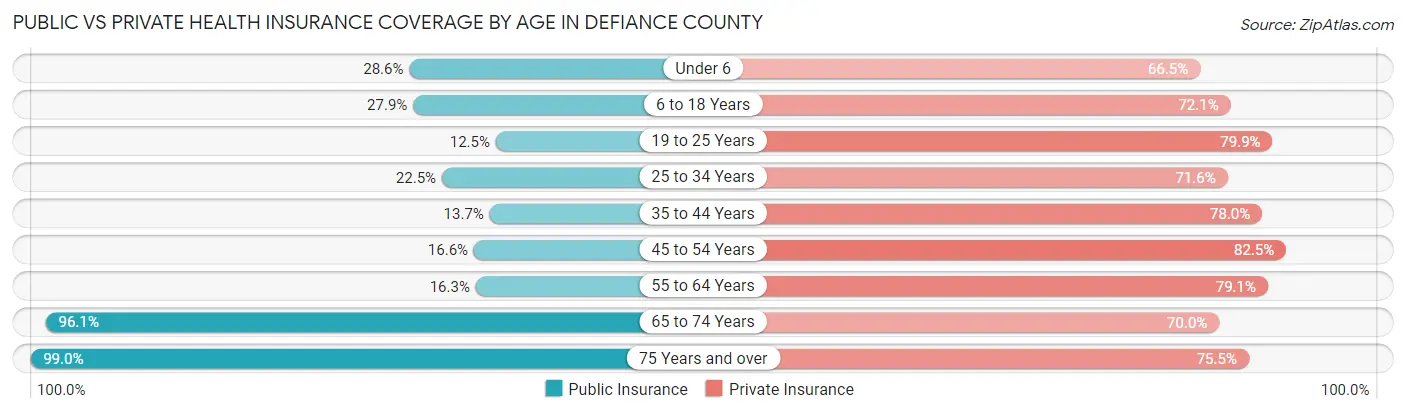
| Age Bracket | Public Insurance | Private Insurance |
| Under 6 | 759 (28.6%) | 1,765 (66.5%) |
| 6 to 18 Years | 1,842 (27.9%) | 4,766 (72.1%) |
| 19 to 25 Years | 397 (12.5%) | 2,531 (79.9%) |
| 25 to 34 Years | 912 (22.5%) | 2,896 (71.6%) |
| 35 to 44 Years | 665 (13.7%) | 3,793 (78.0%) |
| 45 to 54 Years | 742 (16.6%) | 3,685 (82.5%) |
| 55 to 64 Years | 842 (16.3%) | 4,095 (79.1%) |
| 65 to 74 Years | 4,074 (96.1%) | 2,969 (70.0%) |
| 75 Years and over | 2,746 (99.0%) | 2,096 (75.5%) |
| Total | 12,979 (34.2%) | 28,596 (75.3%) |
Disability Status by Sex by Age in Defiance County
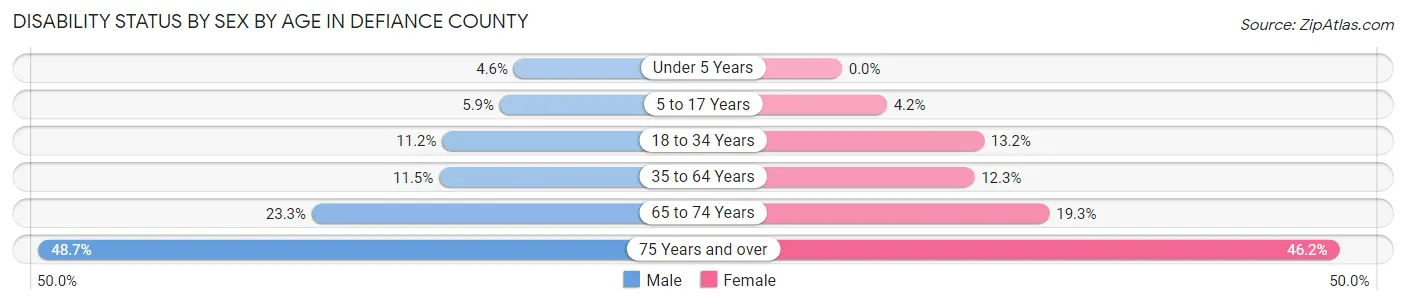
| Age Bracket | Male | Female |
| Under 5 Years | 55 (4.6%) | 0 (0.0%) |
| 5 to 17 Years | 202 (5.9%) | 127 (4.2%) |
| 18 to 34 Years | 450 (11.2%) | 497 (13.2%) |
| 35 to 64 Years | 838 (11.5%) | 890 (12.3%) |
| 65 to 74 Years | 489 (23.3%) | 413 (19.3%) |
| 75 Years and over | 588 (48.7%) | 724 (46.2%) |
Disability Class by Sex by Age in Defiance County
Disability Class: Hearing Difficulty
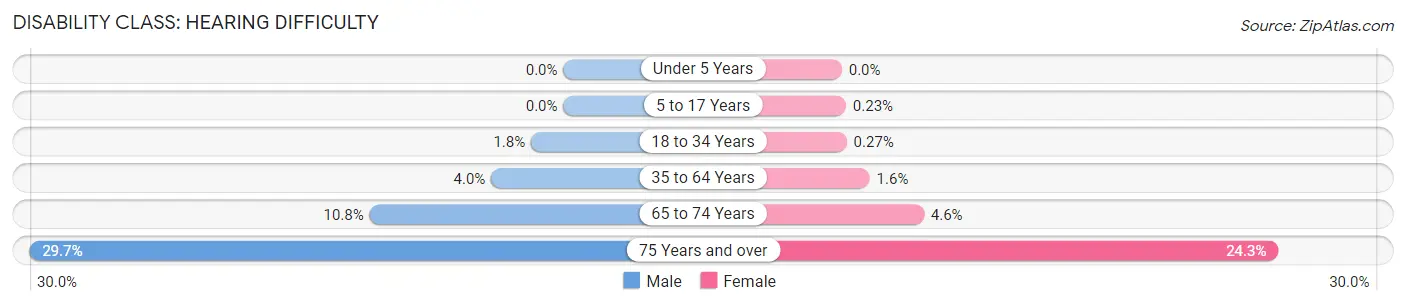
| Age Bracket | Male | Female |
| Under 5 Years | 0 (0.0%) | 0 (0.0%) |
| 5 to 17 Years | 0 (0.0%) | 7 (0.2%) |
| 18 to 34 Years | 72 (1.8%) | 10 (0.3%) |
| 35 to 64 Years | 292 (4.0%) | 112 (1.5%) |
| 65 to 74 Years | 226 (10.8%) | 98 (4.6%) |
| 75 Years and over | 359 (29.7%) | 381 (24.3%) |
Disability Class: Vision Difficulty
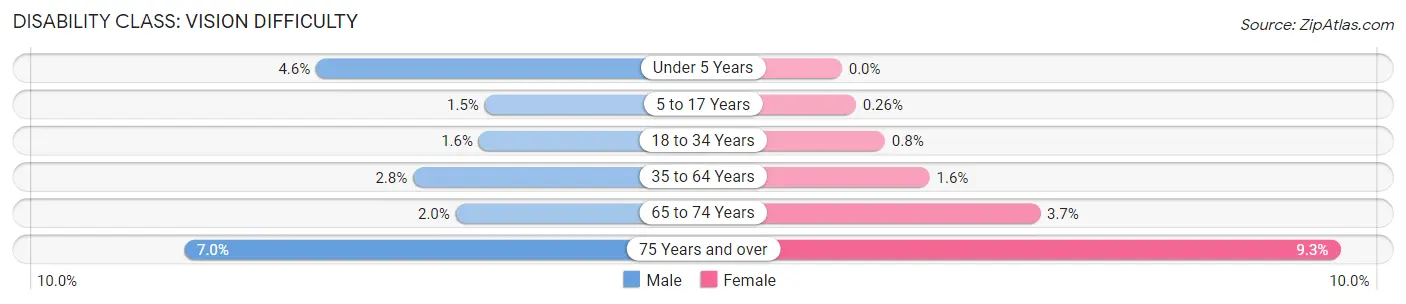
| Age Bracket | Male | Female |
| Under 5 Years | 55 (4.6%) | 0 (0.0%) |
| 5 to 17 Years | 50 (1.5%) | 8 (0.3%) |
| 18 to 34 Years | 63 (1.6%) | 30 (0.8%) |
| 35 to 64 Years | 203 (2.8%) | 118 (1.6%) |
| 65 to 74 Years | 42 (2.0%) | 79 (3.7%) |
| 75 Years and over | 85 (7.0%) | 145 (9.2%) |
Disability Class: Cognitive Difficulty
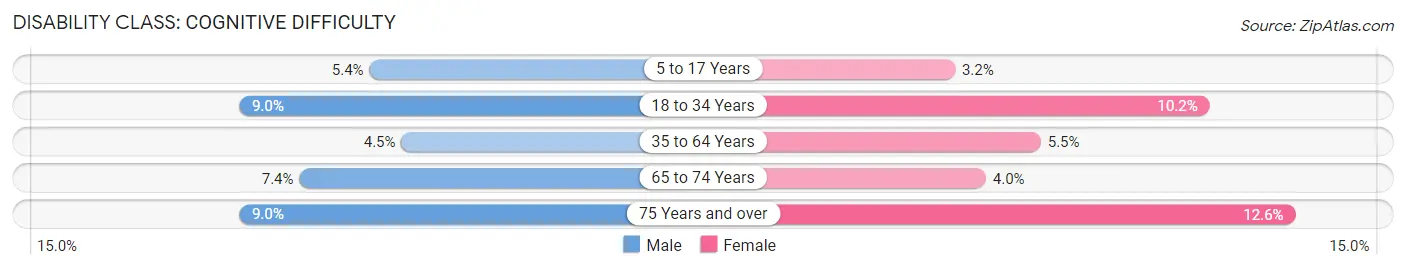
| Age Bracket | Male | Female |
| 5 to 17 Years | 185 (5.4%) | 96 (3.2%) |
| 18 to 34 Years | 362 (9.0%) | 386 (10.2%) |
| 35 to 64 Years | 328 (4.5%) | 401 (5.5%) |
| 65 to 74 Years | 154 (7.3%) | 86 (4.0%) |
| 75 Years and over | 109 (9.0%) | 198 (12.6%) |
Disability Class: Ambulatory Difficulty
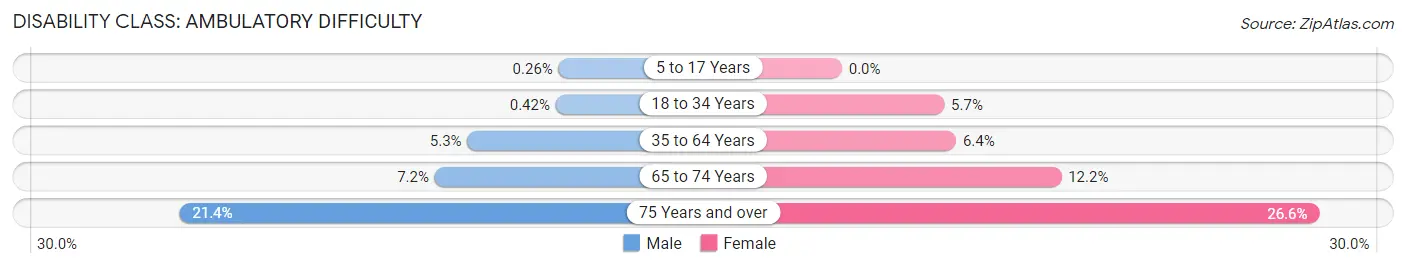
| Age Bracket | Male | Female |
| 5 to 17 Years | 9 (0.3%) | 0 (0.0%) |
| 18 to 34 Years | 17 (0.4%) | 215 (5.7%) |
| 35 to 64 Years | 388 (5.3%) | 461 (6.4%) |
| 65 to 74 Years | 150 (7.2%) | 262 (12.2%) |
| 75 Years and over | 258 (21.4%) | 417 (26.6%) |
Disability Class: Self-Care Difficulty
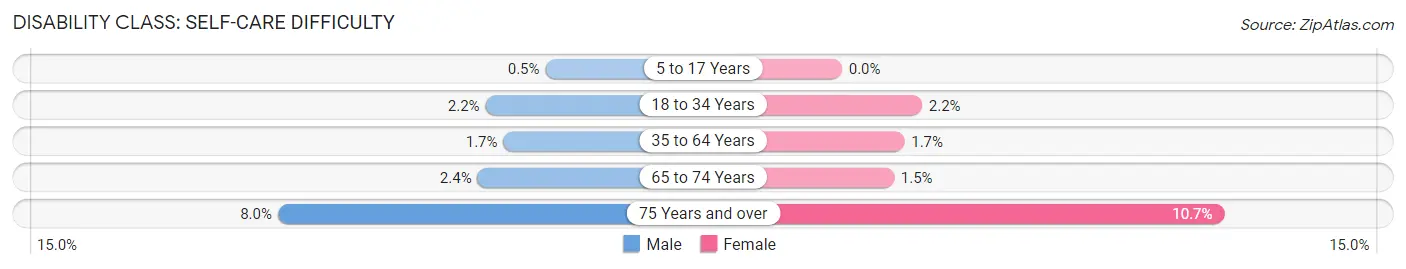
| Age Bracket | Male | Female |
| 5 to 17 Years | 17 (0.5%) | 0 (0.0%) |
| 18 to 34 Years | 87 (2.2%) | 84 (2.2%) |
| 35 to 64 Years | 121 (1.7%) | 126 (1.7%) |
| 65 to 74 Years | 50 (2.4%) | 31 (1.5%) |
| 75 Years and over | 96 (8.0%) | 167 (10.6%) |
Technology Access in Defiance County
Computing Device Access in Defiance County
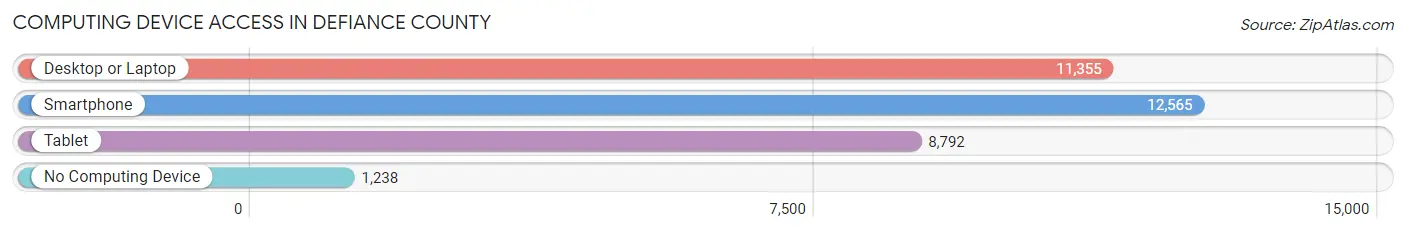
| Device Type | # Households | % Households |
| Desktop or Laptop | 11,355 | 74.4% |
| Smartphone | 12,565 | 82.3% |
| Tablet | 8,792 | 57.6% |
| No Computing Device | 1,238 | 8.1% |
| Total | 15,262 | 100.0% |
Internet Access in Defiance County
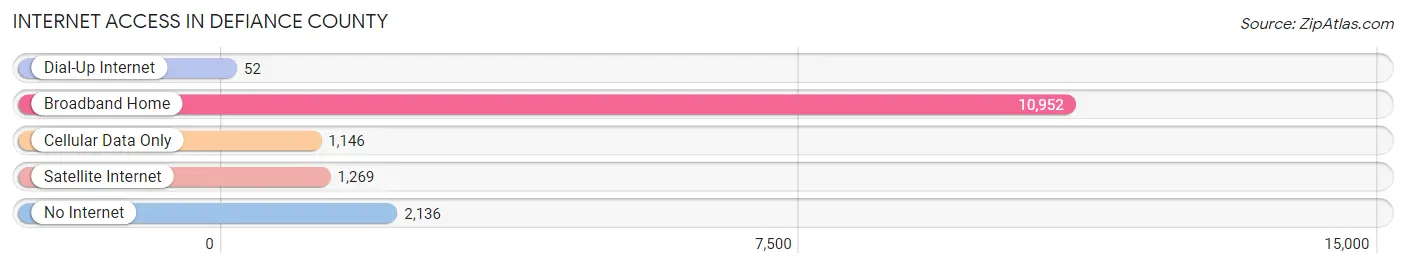
| Internet Type | # Households | % Households |
| Dial-Up Internet | 52 | 0.3% |
| Broadband Home | 10,952 | 71.8% |
| Cellular Data Only | 1,146 | 7.5% |
| Satellite Internet | 1,269 | 8.3% |
| No Internet | 2,136 | 14.0% |
| Total | 15,262 | 100.0% |
Defiance County Summary
Defiance County, Ohio is located in the northwestern corner of the state, and is bordered by Michigan, Indiana, and Williams County. It is part of the Toledo Metropolitan Statistical Area, and is the second-largest county in the state. The county seat is Defiance, and the population was 38,158 at the 2010 census.
Geography
Defiance County is located in the northwestern corner of Ohio, and is bordered by Michigan, Indiana, and Williams County. It is part of the Toledo Metropolitan Statistical Area, and is the second-largest county in the state. The county has a total area of 545 square miles, of which 543 square miles is land and 2.2 square miles is water. The county is mostly flat, with some rolling hills in the northern and eastern parts. The Maumee River runs through the county, and there are several small lakes and ponds scattered throughout.
Demographics
As of the 2010 census, there were 38,158 people, 14,845 households, and 10,541 families residing in the county. The population density was 70 people per square mile. There were 16,093 housing units at an average density of 29 per square mile. The racial makeup of the county was 94.2% White, 1.3% African American, 0.3% Native American, 0.5% Asian, 0.1% Pacific Islander, 1.7% from other races, and 1.9% from two or more races. Hispanic or Latino of any race were 4.2% of the population.
There were 14,845 households, out of which 32.2% had children under the age of 18 living with them, 54.2% were married couples living together, 11.2% had a female householder with no husband present, and 29.7% were non-families. 24.7% of all households were made up of individuals, and 10.2% had someone living alone who was 65 years of age or older. The average household size was 2.54 and the average family size was 3.02.
The median age in the county was 38.3 years. 25.2% of residents were under the age of 18; 8.2% were between the ages of 18 and 24; 24.2% were from 25 to 44; 27.2% were from 45 to 64; and 15.2% were 65 years of age or older. The gender makeup of the county was 48.3% male and 51.7% female.
Economy
Defiance County has a diverse economy, with a mix of manufacturing, agriculture, and service industries. The county is home to several large employers, including Defiance Metal Products, Defiance Machine, and Defiance Plastics. The county is also home to several smaller businesses, including a number of retail stores, restaurants, and other service-oriented businesses.
Agriculture is an important part of the county's economy, with corn, soybeans, and wheat being the primary crops. Livestock production is also important, with beef and dairy cattle, hogs, and poultry being raised in the county.
The county is also home to several tourist attractions, including the Defiance County Historical Society Museum, the Defiance County Fairgrounds, and the Defiance County Park.
Conclusion
Defiance County, Ohio is a diverse and vibrant county located in the northwestern corner of the state. It is part of the Toledo Metropolitan Statistical Area, and is the second-largest county in the state. The county has a total area of 545 square miles, and is mostly flat, with some rolling hills in the northern and eastern parts. The population was 38,158 at the 2010 census, and the county has a diverse economy, with a mix of manufacturing, agriculture, and service industries. Agriculture is an important part of the county's economy, and the county is also home to several tourist attractions.
Common Questions
What is Per Capita Income in Defiance County?
Per Capita income in Defiance County is $33,533.
What is the Median Family Income in Defiance County?
Median Family Income in Defiance County is $81,947.
What is the Median Household income in Defiance County?
Median Household Income in Defiance County is $69,302.
What is Income or Wage Gap in Defiance County?
Income or Wage Gap in Defiance County is 31.4%.
Women in Defiance County earn 68.6 cents for every dollar earned by a man.
What is Family Income Deficit in Defiance County?
Family Income Deficit in Defiance County is $9,723.
Families that are below poverty line in Defiance County earn $9,723 less on average than the poverty threshold level.
What is Inequality or Gini Index in Defiance County?
Inequality or Gini Index in Defiance County is 0.40.
What is the Total Population of Defiance County?
Total Population of Defiance County is 38,300.
What is the Total Male Population of Defiance County?
Total Male Population of Defiance County is 19,277.
What is the Total Female Population of Defiance County?
Total Female Population of Defiance County is 19,023.
What is the Ratio of Males per 100 Females in Defiance County?
There are 101.34 Males per 100 Females in Defiance County.
What is the Ratio of Females per 100 Males in Defiance County?
There are 98.68 Females per 100 Males in Defiance County.
What is the Median Population Age in Defiance County?
Median Population Age in Defiance County is 40.8 Years.
What is the Average Family Size in Defiance County
Average Family Size in Defiance County is 3.0 People.
What is the Average Household Size in Defiance County
Average Household Size in Defiance County is 2.5 People.
How Large is the Labor Force in Defiance County?
There are 19,786 People in the Labor Forcein in Defiance County.
What is the Percentage of People in the Labor Force in Defiance County?
64.6% of People are in the Labor Force in Defiance County.
What is the Unemployment Rate in Defiance County?
Unemployment Rate in Defiance County is 4.9%.