Carroll County, OH Map & Demographics
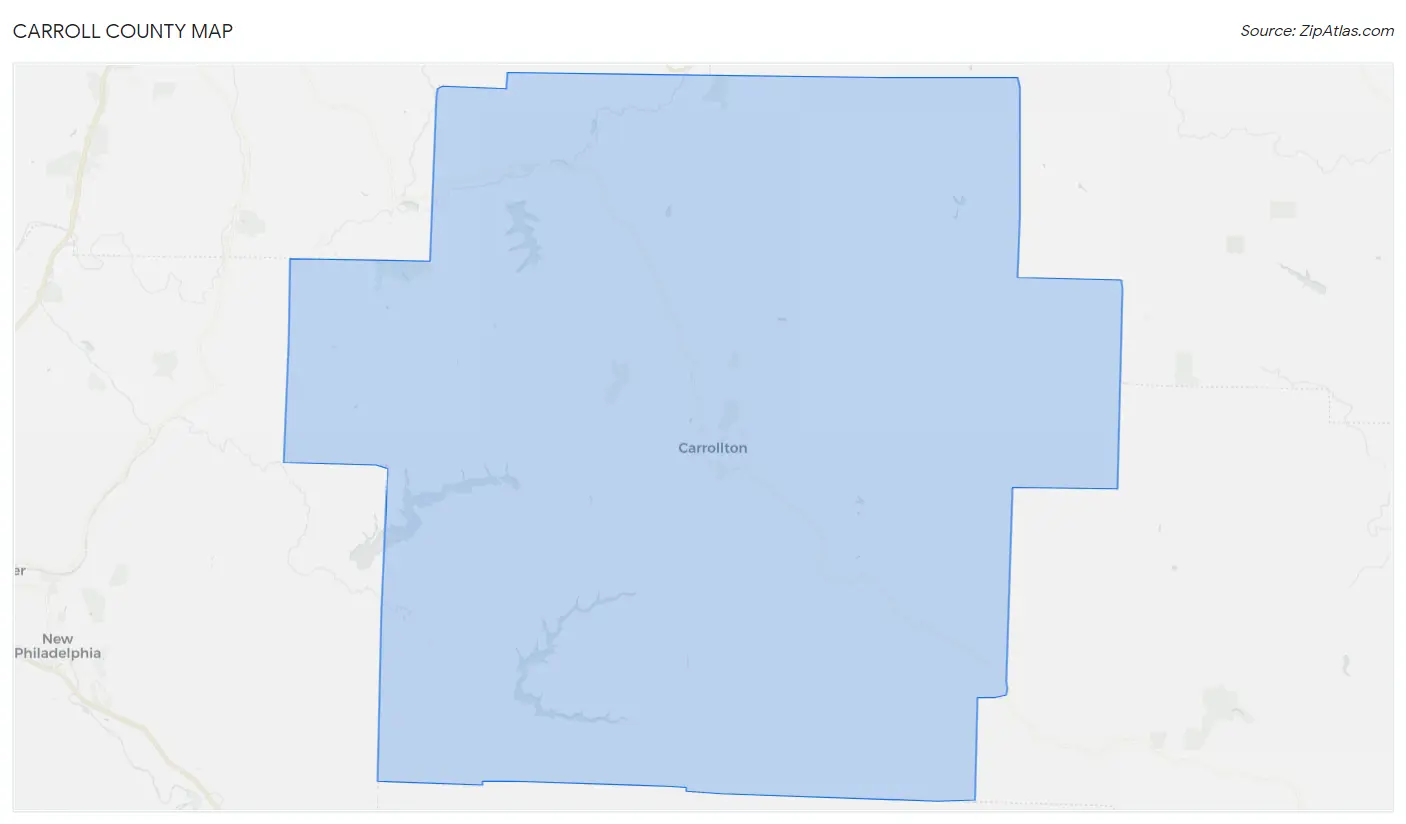
Carroll County Map
Carroll County Overview
$33,798
PER CAPITA INCOME
$72,685
AVG FAMILY INCOME
$59,872
AVG HOUSEHOLD INCOME
36.5%
WAGE / INCOME GAP [ % ]
63.5¢/ $1
WAGE / INCOME GAP [ $ ]
$12,540
FAMILY INCOME DEFICIT
0.44
INEQUALITY / GINI INDEX
26,761
TOTAL POPULATION
13,653
MALE POPULATION
13,108
FEMALE POPULATION
104.16
MALES / 100 FEMALES
96.01
FEMALES / 100 MALES
45.9
MEDIAN AGE
2.9
AVG FAMILY SIZE
2.3
AVG HOUSEHOLD SIZE
12,396
LABOR FORCE [ PEOPLE ]
56.3%
PERCENT IN LABOR FORCE
3.9%
UNEMPLOYMENT RATE
Income in Carroll County
Income Overview in Carroll County
Per Capita Income in Carroll County is $33,798, while median incomes of families and households are $72,685 and $59,872 respectively.
| Characteristic | Number | Measure |
| Per Capita Income | 26,761 | $33,798 |
| Median Family Income | 7,381 | $72,685 |
| Mean Family Income | 7,381 | $92,136 |
| Median Household Income | 11,355 | $59,872 |
| Mean Household Income | 11,355 | $78,349 |
| Income Deficit | 7,381 | $12,540 |
| Wage / Income Gap (%) | 26,761 | 36.46% |
| Wage / Income Gap ($) | 26,761 | 63.54¢ per $1 |
| Gini / Inequality Index | 26,761 | 0.44 |
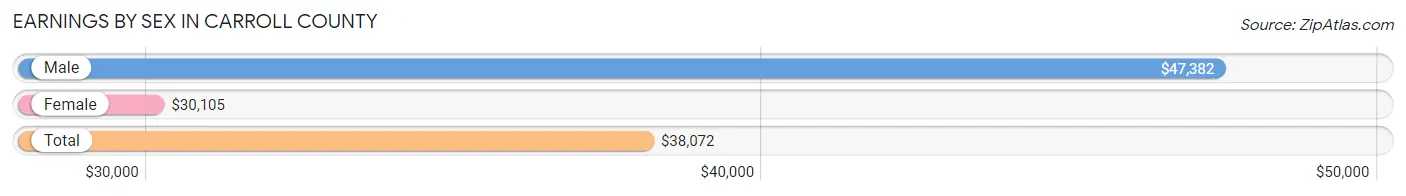
Earnings by Sex in Carroll County
Average Earnings in Carroll County are $38,072, $47,382 for men and $30,105 for women, a difference of 36.5%.
| Sex | Number | Average Earnings |
| Male | 7,211 (55.3%) | $47,382 |
| Female | 5,831 (44.7%) | $30,105 |
| Total | 13,042 (100.0%) | $38,072 |
Earnings by Sex by Income Bracket in Carroll County
The most common earnings brackets in Carroll County are $100,000+ for men (1,005 | 13.9%) and $25,000 to $29,999 for women (464 | 8.0%).
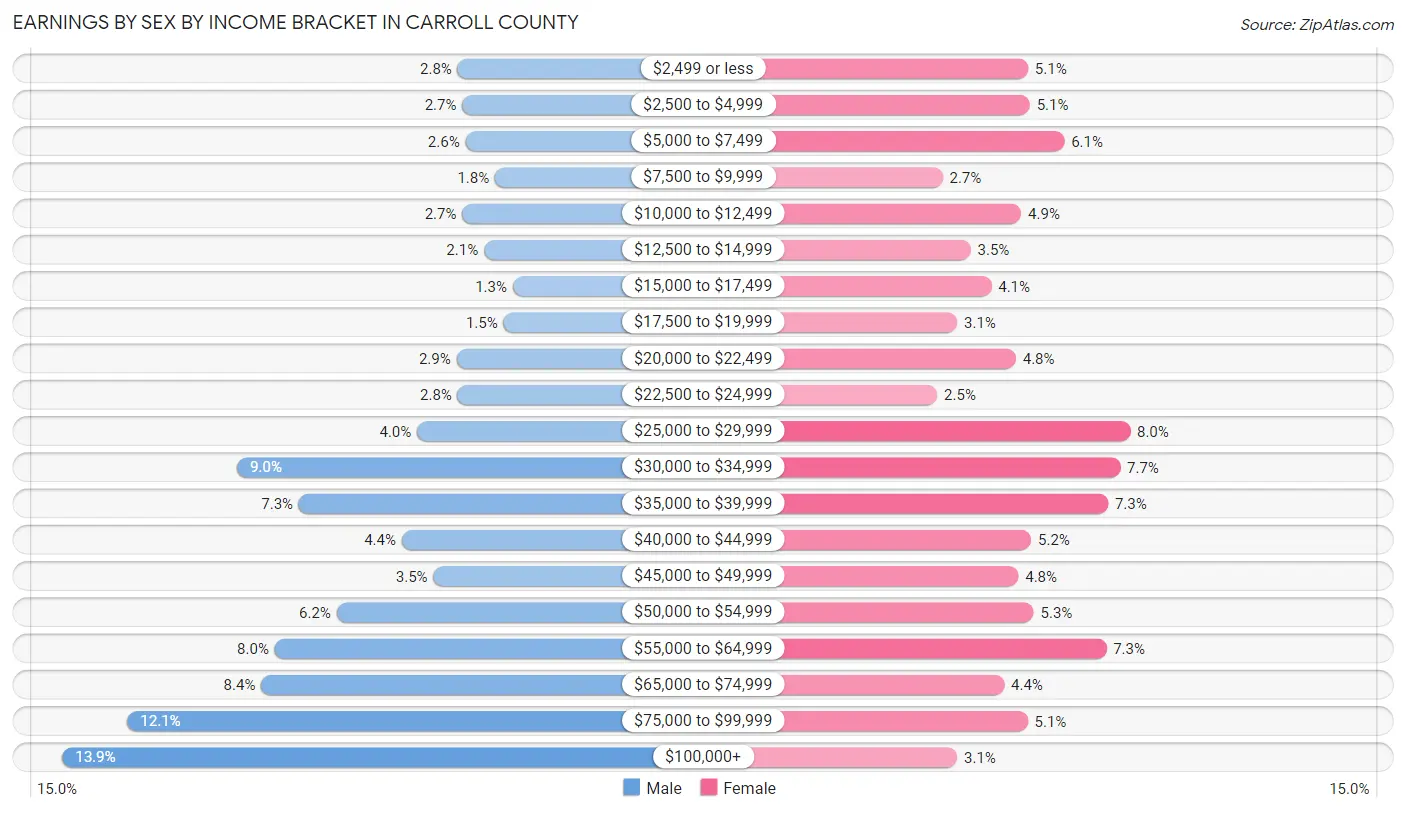
| Income | Male | Female |
| $2,499 or less | 204 (2.8%) | 297 (5.1%) |
| $2,500 to $4,999 | 195 (2.7%) | 300 (5.1%) |
| $5,000 to $7,499 | 188 (2.6%) | 356 (6.1%) |
| $7,500 to $9,999 | 128 (1.8%) | 157 (2.7%) |
| $10,000 to $12,499 | 195 (2.7%) | 286 (4.9%) |
| $12,500 to $14,999 | 151 (2.1%) | 203 (3.5%) |
| $15,000 to $17,499 | 92 (1.3%) | 237 (4.1%) |
| $17,500 to $19,999 | 111 (1.5%) | 181 (3.1%) |
| $20,000 to $22,499 | 206 (2.9%) | 277 (4.8%) |
| $22,500 to $24,999 | 204 (2.8%) | 148 (2.5%) |
| $25,000 to $29,999 | 286 (4.0%) | 464 (8.0%) |
| $30,000 to $34,999 | 651 (9.0%) | 448 (7.7%) |
| $35,000 to $39,999 | 526 (7.3%) | 428 (7.3%) |
| $40,000 to $44,999 | 317 (4.4%) | 302 (5.2%) |
| $45,000 to $49,999 | 253 (3.5%) | 281 (4.8%) |
| $50,000 to $54,999 | 449 (6.2%) | 306 (5.2%) |
| $55,000 to $64,999 | 575 (8.0%) | 425 (7.3%) |
| $65,000 to $74,999 | 602 (8.4%) | 258 (4.4%) |
| $75,000 to $99,999 | 873 (12.1%) | 296 (5.1%) |
| $100,000+ | 1,005 (13.9%) | 181 (3.1%) |
| Total | 7,211 (100.0%) | 5,831 (100.0%) |
Earnings by Sex by Educational Attainment in Carroll County
Average earnings in Carroll County are $52,188 for men and $33,863 for women, a difference of 35.1%. Men with an educational attainment of bachelor's degree enjoy the highest average annual earnings of $87,308, while those with high school diploma education earn the least with $42,417. Women with an educational attainment of graduate degree earn the most with the average annual earnings of $79,844, while those with less than high school education have the smallest earnings of $17,574.
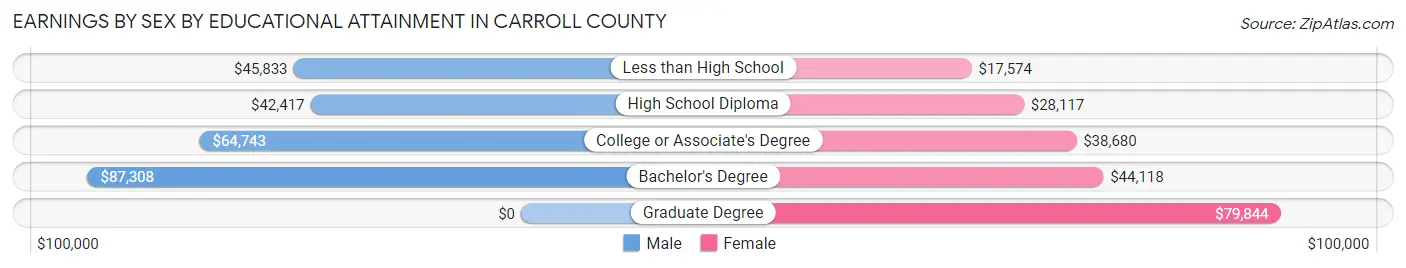
| Educational Attainment | Male Income | Female Income |
| Less than High School | $45,833 | $17,574 |
| High School Diploma | $42,417 | $28,117 |
| College or Associate's Degree | $64,743 | $38,680 |
| Bachelor's Degree | $87,308 | $44,118 |
| Graduate Degree | - | - |
| Total | $52,188 | $33,863 |
Family Income in Carroll County
Family Income Brackets in Carroll County
According to the Carroll County family income data, there are 1,712 families falling into the $50,000 to $74,999 income range, which is the most common income bracket and makes up 23.2% of all families. Conversely, the $10,000 to $14,999 income bracket is the least frequent group with only 170 families (2.3%) belonging to this category.
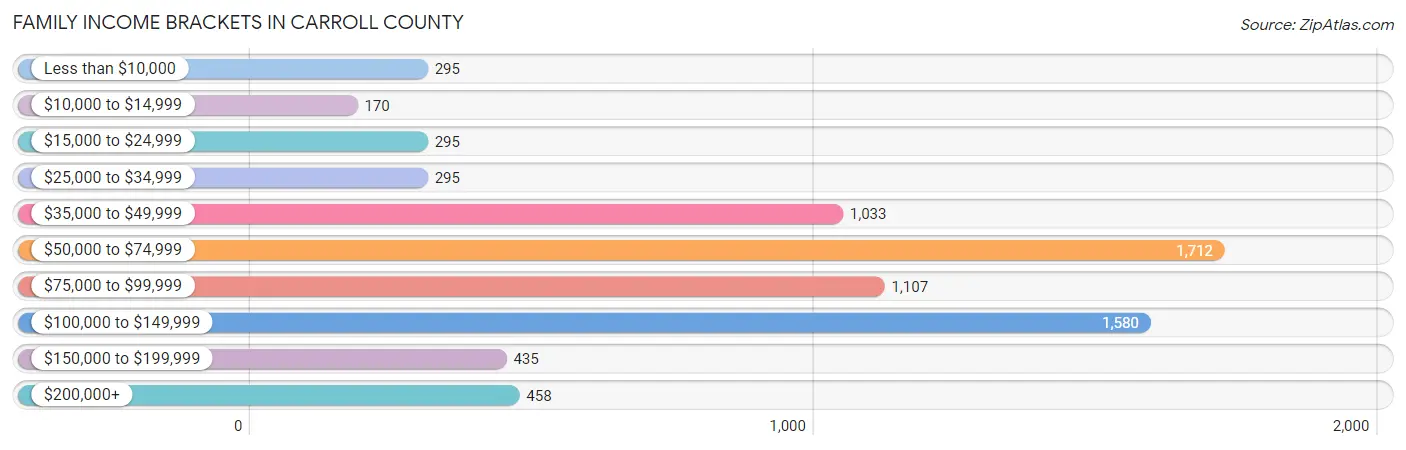
| Income Bracket | # Families | % Families |
| Less than $10,000 | 295 | 4.0% |
| $10,000 to $14,999 | 170 | 2.3% |
| $15,000 to $24,999 | 295 | 4.0% |
| $25,000 to $34,999 | 295 | 4.0% |
| $35,000 to $49,999 | 1,033 | 14.0% |
| $50,000 to $74,999 | 1,712 | 23.2% |
| $75,000 to $99,999 | 1,107 | 15.0% |
| $100,000 to $149,999 | 1,580 | 21.4% |
| $150,000 to $199,999 | 435 | 5.9% |
| $200,000+ | 458 | 6.2% |
Family Income by Famaliy Size in Carroll County
7+ person families (119 | 1.6%) account for the highest median family income in Carroll County with $102,099 per family, while 2-person families (3,807 | 51.6%) have the highest median income of $33,238 per family member.
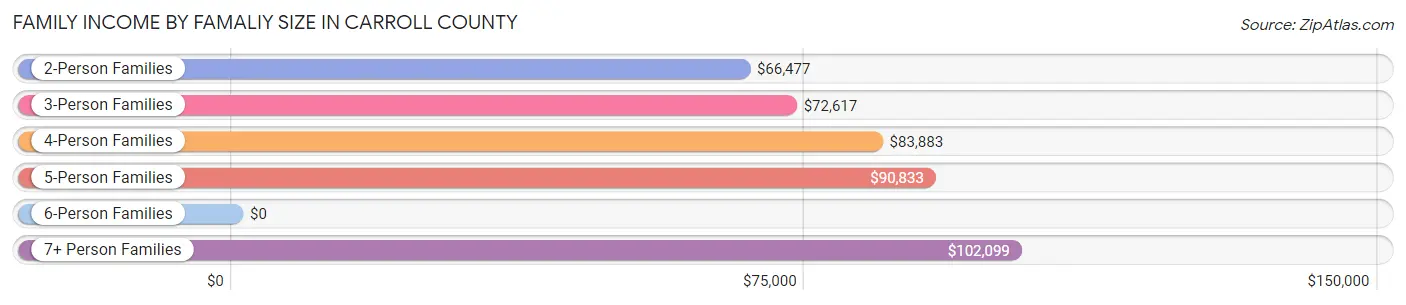
| Income Bracket | # Families | Median Income |
| 2-Person Families | 3,807 (51.6%) | $66,477 |
| 3-Person Families | 1,657 (22.5%) | $72,617 |
| 4-Person Families | 950 (12.9%) | $83,883 |
| 5-Person Families | 640 (8.7%) | $90,833 |
| 6-Person Families | 208 (2.8%) | $0 |
| 7+ Person Families | 119 (1.6%) | $102,099 |
| Total | 7,381 (100.0%) | $72,685 |
Family Income by Number of Earners in Carroll County
The median family income in Carroll County is $72,685, with families comprising 3+ earners (645) having the highest median family income of $137,269, while families with no earners (1,568) have the lowest median family income of $49,450, accounting for 8.7% and 21.2% of families, respectively.
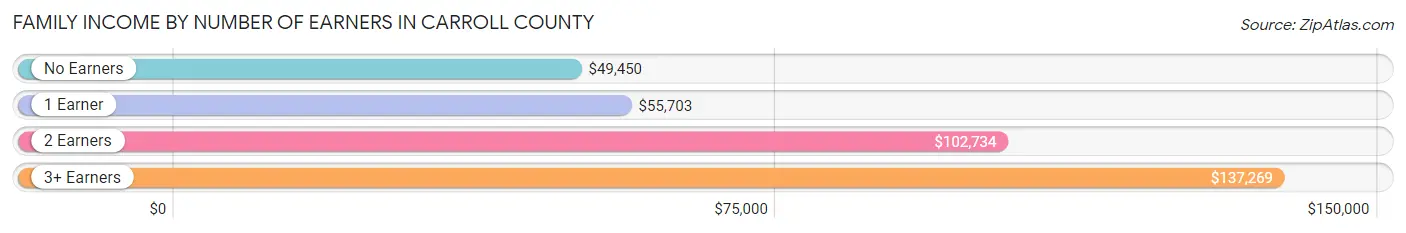
| Number of Earners | # Families | Median Income |
| No Earners | 1,568 (21.2%) | $49,450 |
| 1 Earner | 2,445 (33.1%) | $55,703 |
| 2 Earners | 2,723 (36.9%) | $102,734 |
| 3+ Earners | 645 (8.7%) | $137,269 |
| Total | 7,381 (100.0%) | $72,685 |
Household Income in Carroll County
Household Income Brackets in Carroll County
With 2,487 households falling in the category, the $50,000 to $74,999 income range is the most frequent in Carroll County, accounting for 21.9% of all households. In contrast, only 409 households (3.6%) fall into the $10,000 to $14,999 income bracket, making it the least populous group.
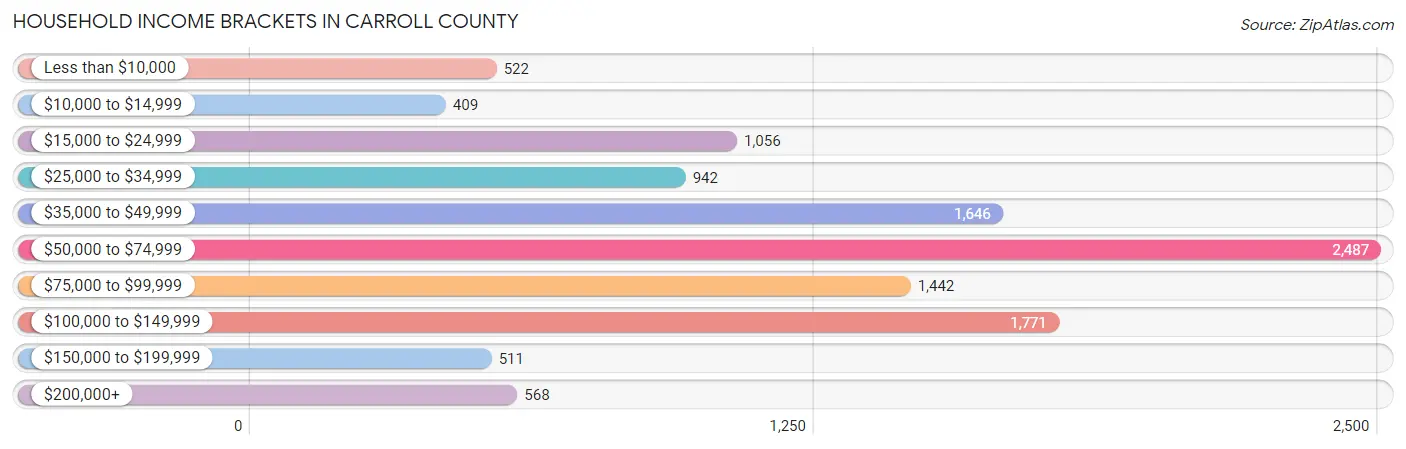
| Income Bracket | # Households | % Households |
| Less than $10,000 | 522 | 4.6% |
| $10,000 to $14,999 | 409 | 3.6% |
| $15,000 to $24,999 | 1,056 | 9.3% |
| $25,000 to $34,999 | 942 | 8.3% |
| $35,000 to $49,999 | 1,646 | 14.5% |
| $50,000 to $74,999 | 2,487 | 21.9% |
| $75,000 to $99,999 | 1,442 | 12.7% |
| $100,000 to $149,999 | 1,771 | 15.6% |
| $150,000 to $199,999 | 511 | 4.5% |
| $200,000+ | 568 | 5.0% |
Household Income by Householder Age in Carroll County
The median household income in Carroll County is $59,872, with the highest median household income of $75,395 found in the 25 to 44 years age bracket for the primary householder. A total of 2,670 households (23.5%) fall into this category. Meanwhile, the 15 to 24 years age bracket for the primary householder has the lowest median household income of $46,458, with 510 households (4.5%) in this group.
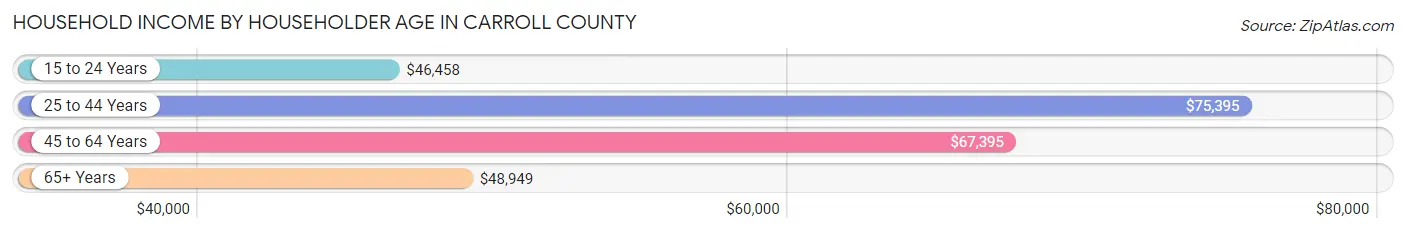
| Income Bracket | # Households | Median Income |
| 15 to 24 Years | 510 (4.5%) | $46,458 |
| 25 to 44 Years | 2,670 (23.5%) | $75,395 |
| 45 to 64 Years | 4,666 (41.1%) | $67,395 |
| 65+ Years | 3,509 (30.9%) | $48,949 |
| Total | 11,355 (100.0%) | $59,872 |
Poverty in Carroll County
Income Below Poverty by Sex and Age in Carroll County
With 10.2% poverty level for males and 14.3% for females among the residents of Carroll County, 5 year old males and 6 to 11 year old females are the most vulnerable to poverty, with 79 males (29.8%) and 233 females (26.5%) in their respective age groups living below the poverty level.
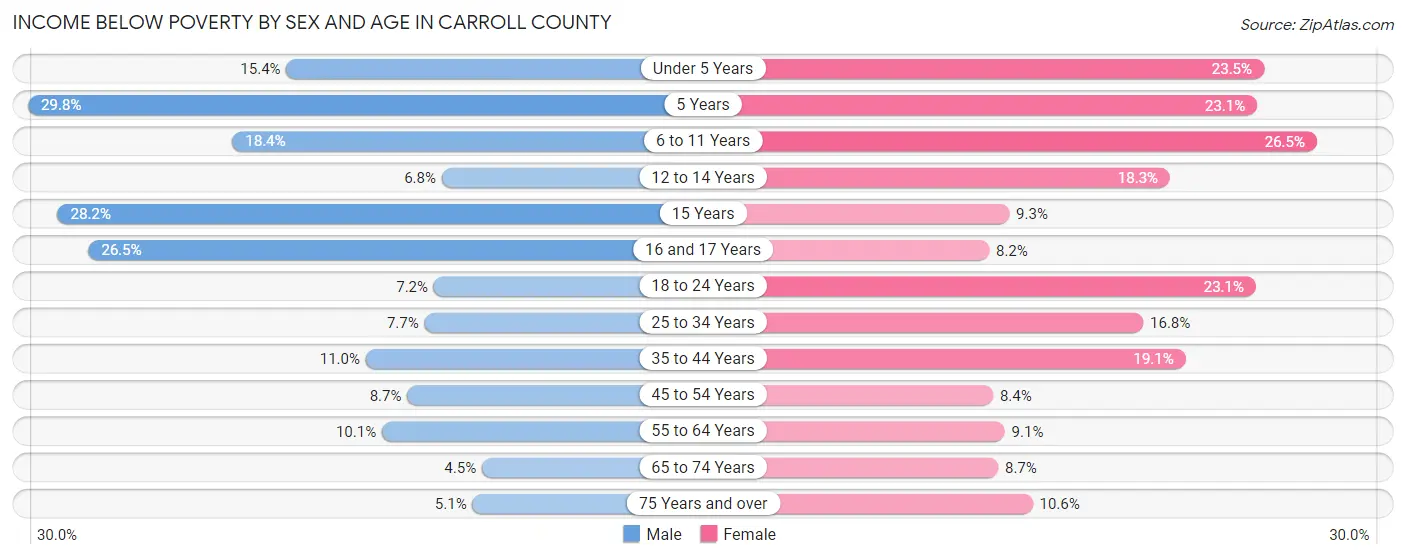
| Age Bracket | Male | Female |
| Under 5 Years | 101 (15.4%) | 149 (23.5%) |
| 5 Years | 79 (29.8%) | 37 (23.1%) |
| 6 to 11 Years | 160 (18.4%) | 233 (26.5%) |
| 12 to 14 Years | 31 (6.8%) | 59 (18.3%) |
| 15 Years | 49 (28.2%) | 11 (9.3%) |
| 16 and 17 Years | 96 (26.5%) | 31 (8.2%) |
| 18 to 24 Years | 81 (7.2%) | 216 (23.1%) |
| 25 to 34 Years | 107 (7.7%) | 229 (16.8%) |
| 35 to 44 Years | 163 (11.0%) | 266 (19.1%) |
| 45 to 54 Years | 154 (8.7%) | 139 (8.4%) |
| 55 to 64 Years | 220 (10.1%) | 189 (9.1%) |
| 65 to 74 Years | 80 (4.5%) | 150 (8.7%) |
| 75 Years and over | 49 (5.1%) | 127 (10.6%) |
| Total | 1,370 (10.2%) | 1,836 (14.3%) |
Income Above Poverty by Sex and Age in Carroll County
According to the poverty statistics in Carroll County, males aged 65 to 74 years and females aged 16 and 17 years are the age groups that are most secure financially, with 95.5% of males and 91.8% of females in these age groups living above the poverty line.
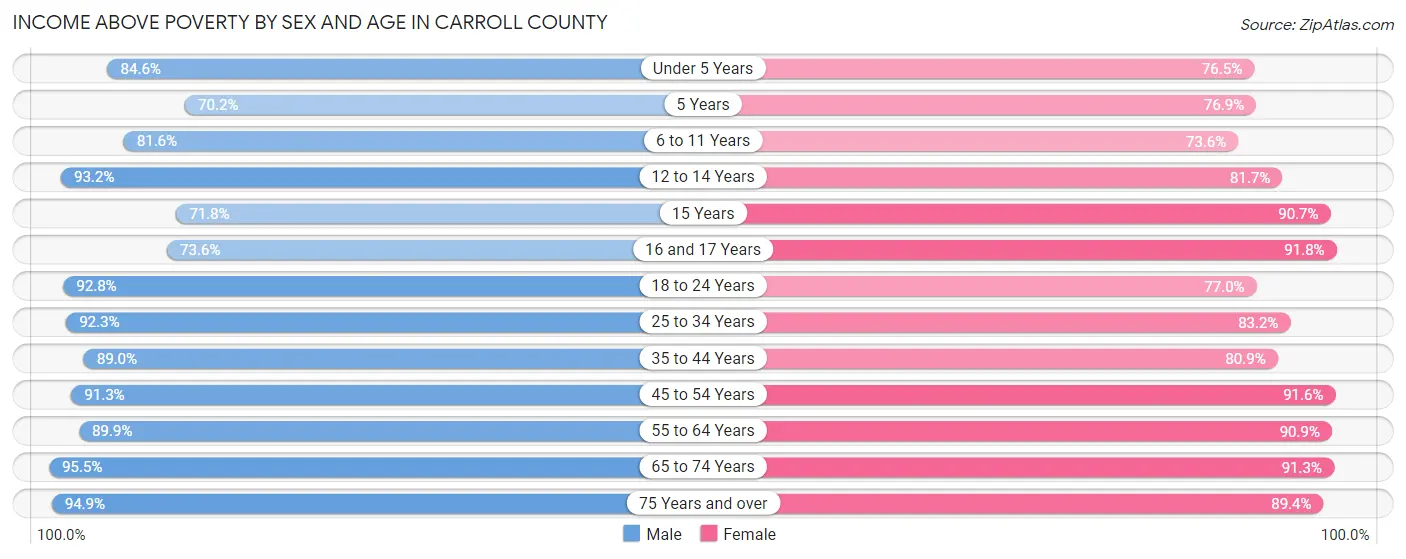
| Age Bracket | Male | Female |
| Under 5 Years | 554 (84.6%) | 485 (76.5%) |
| 5 Years | 186 (70.2%) | 123 (76.9%) |
| 6 to 11 Years | 708 (81.6%) | 648 (73.6%) |
| 12 to 14 Years | 427 (93.2%) | 264 (81.7%) |
| 15 Years | 125 (71.8%) | 107 (90.7%) |
| 16 and 17 Years | 267 (73.6%) | 347 (91.8%) |
| 18 to 24 Years | 1,042 (92.8%) | 721 (76.9%) |
| 25 to 34 Years | 1,278 (92.3%) | 1,136 (83.2%) |
| 35 to 44 Years | 1,319 (89.0%) | 1,124 (80.9%) |
| 45 to 54 Years | 1,618 (91.3%) | 1,512 (91.6%) |
| 55 to 64 Years | 1,958 (89.9%) | 1,894 (90.9%) |
| 65 to 74 Years | 1,685 (95.5%) | 1,575 (91.3%) |
| 75 Years and over | 920 (94.9%) | 1,069 (89.4%) |
| Total | 12,087 (89.8%) | 11,005 (85.7%) |
Income Below Poverty Among Married-Couple Families in Carroll County
The poverty statistics for married-couple families in Carroll County show that 4.1% or 242 of the total 5,934 families live below the poverty line. Families with 3 or 4 children have the highest poverty rate of 10.3%, comprising of 52 families. On the other hand, families with 5 or more children have the lowest poverty rate of 0.0%, which includes 0 families.
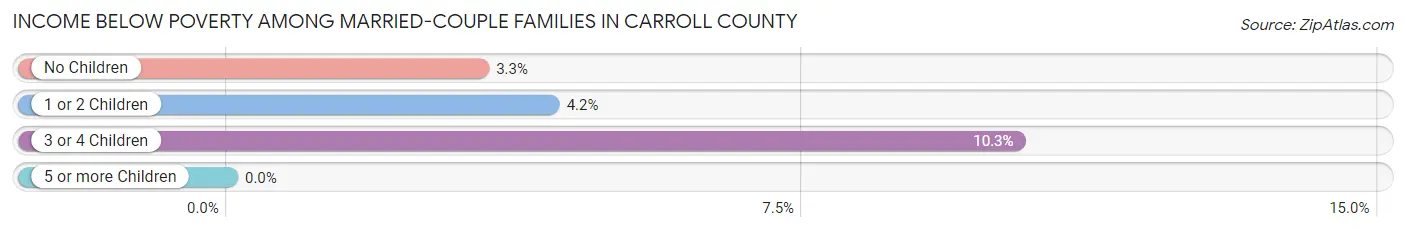
| Children | Above Poverty | Below Poverty |
| No Children | 3,831 (96.7%) | 130 (3.3%) |
| 1 or 2 Children | 1,369 (95.8%) | 60 (4.2%) |
| 3 or 4 Children | 454 (89.7%) | 52 (10.3%) |
| 5 or more Children | 38 (100.0%) | 0 (0.0%) |
| Total | 5,692 (95.9%) | 242 (4.1%) |
Income Below Poverty Among Single-Parent Households in Carroll County
According to the poverty data in Carroll County, 8.7% or 46 single-father households and 42.8% or 393 single-mother households are living below the poverty line. Among single-father households, those with 1 or 2 children have the highest poverty rate, with 32 households (19.3%) experiencing poverty. Likewise, among single-mother households, those with 3 or 4 children have the highest poverty rate, with 119 households (92.2%) falling below the poverty line.
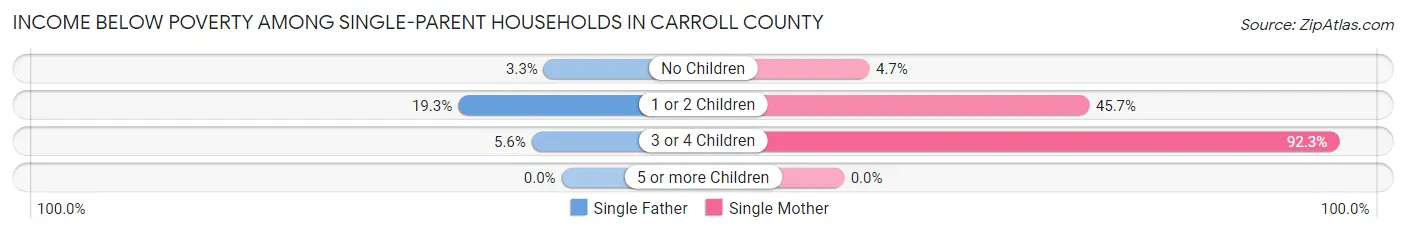
| Children | Single Father | Single Mother |
| No Children | 9 (3.3%) | 10 (4.7%) |
| 1 or 2 Children | 32 (19.3%) | 264 (45.7%) |
| 3 or 4 Children | 5 (5.6%) | 119 (92.2%) |
| 5 or more Children | 0 (0.0%) | 0 (0.0%) |
| Total | 46 (8.7%) | 393 (42.8%) |
Income Below Poverty Among Married-Couple vs Single-Parent Households in Carroll County
The poverty data for Carroll County shows that 242 of the married-couple family households (4.1%) and 439 of the single-parent households (30.3%) are living below the poverty level. Within the married-couple family households, those with 3 or 4 children have the highest poverty rate, with 52 households (10.3%) falling below the poverty line. Among the single-parent households, those with 3 or 4 children have the highest poverty rate, with 124 household (56.6%) living below poverty.
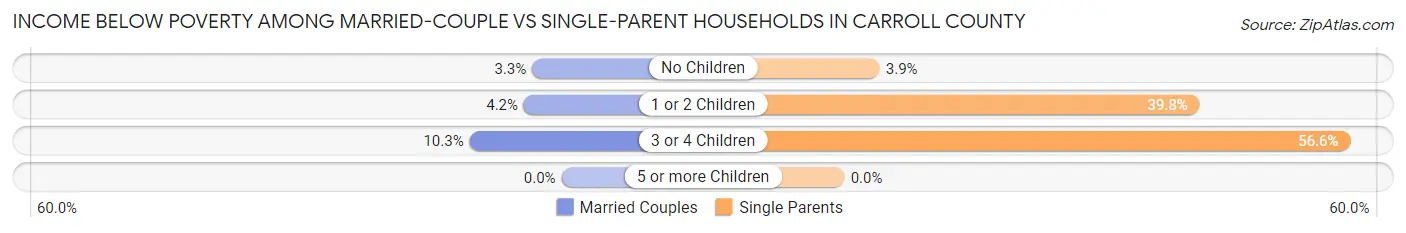
| Children | Married-Couple Families | Single-Parent Households |
| No Children | 130 (3.3%) | 19 (3.9%) |
| 1 or 2 Children | 60 (4.2%) | 296 (39.8%) |
| 3 or 4 Children | 52 (10.3%) | 124 (56.6%) |
| 5 or more Children | 0 (0.0%) | 0 (0.0%) |
| Total | 242 (4.1%) | 439 (30.3%) |
Race in Carroll County
The most populous races in Carroll County are White / Caucasian (25,531 | 95.4%), Two or more Races (915 | 3.4%), and Hispanic or Latino (372 | 1.4%).
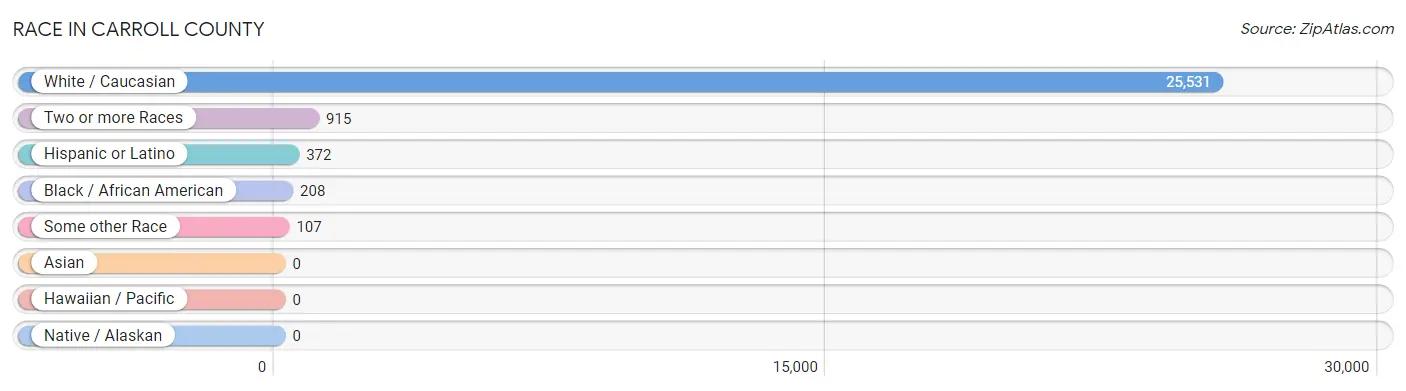
| Race | # Population | % Population |
| Asian | 0 | 0.0% |
| Black / African American | 208 | 0.8% |
| Hawaiian / Pacific | 0 | 0.0% |
| Hispanic or Latino | 372 | 1.4% |
| Native / Alaskan | 0 | 0.0% |
| White / Caucasian | 25,531 | 95.4% |
| Two or more Races | 915 | 3.4% |
| Some other Race | 107 | 0.4% |
| Total | 26,761 | 100.0% |
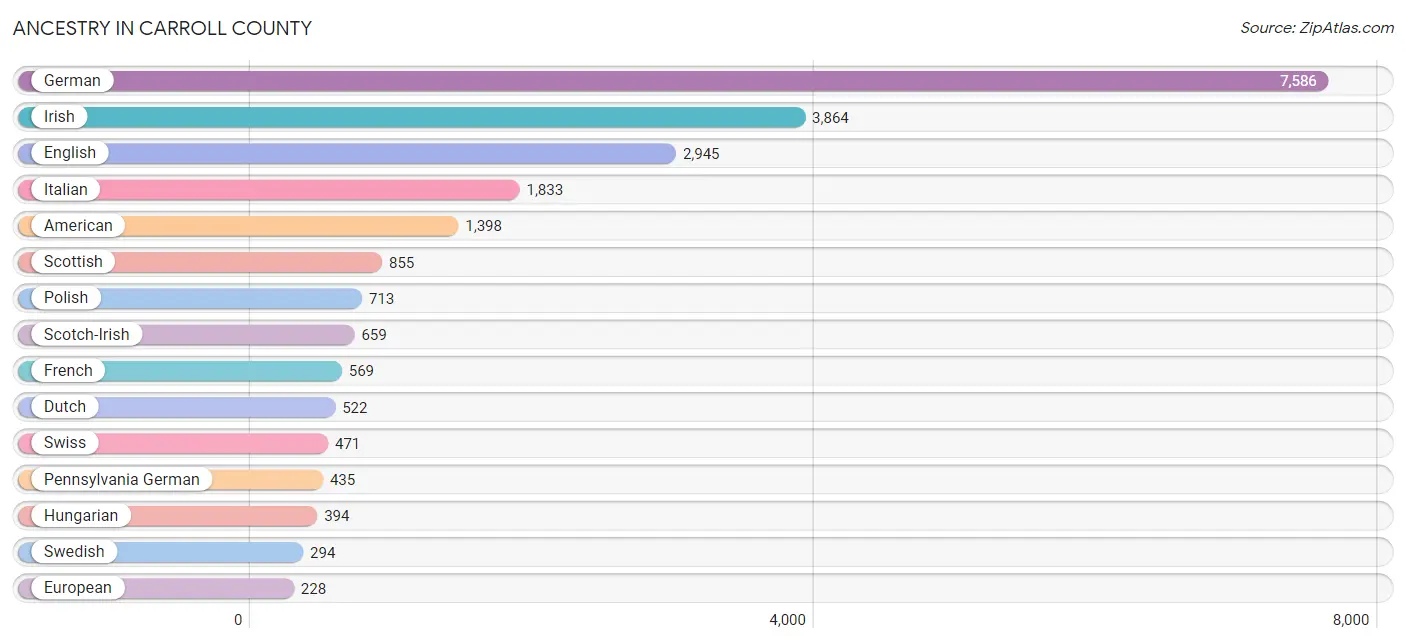
Ancestry in Carroll County
The most populous ancestries reported in Carroll County are German (7,586 | 28.3%), Irish (3,864 | 14.4%), English (2,945 | 11.0%), Italian (1,833 | 6.9%), and American (1,398 | 5.2%), together accounting for 65.9% of all Carroll County residents.
| Ancestry | # Population | % Population |
| American | 1,398 | 5.2% |
| Arab | 53 | 0.2% |
| Austrian | 51 | 0.2% |
| Belgian | 6 | 0.0% |
| Blackfeet | 7 | 0.0% |
| British | 55 | 0.2% |
| Canadian | 3 | 0.0% |
| Central American | 1 | 0.0% |
| Central American Indian | 1 | 0.0% |
| Cherokee | 12 | 0.0% |
| Cheyenne | 95 | 0.4% |
| Colombian | 13 | 0.1% |
| Croatian | 87 | 0.3% |
| Czech | 62 | 0.2% |
| Czechoslovakian | 18 | 0.1% |
| Danish | 80 | 0.3% |
| Dominican | 45 | 0.2% |
| Dutch | 522 | 1.9% |
| English | 2,945 | 11.0% |
| European | 228 | 0.9% |
| Finnish | 12 | 0.0% |
| French | 569 | 2.1% |
| French Canadian | 6 | 0.0% |
| German | 7,586 | 28.3% |
| Greek | 89 | 0.3% |
| Hungarian | 394 | 1.5% |
| Iraqi | 3 | 0.0% |
| Irish | 3,864 | 14.4% |
| Italian | 1,833 | 6.9% |
| Jamaican | 25 | 0.1% |
| Korean | 35 | 0.1% |
| Lebanese | 44 | 0.2% |
| Lithuanian | 25 | 0.1% |
| Mexican | 102 | 0.4% |
| Nigerian | 3 | 0.0% |
| Northern European | 16 | 0.1% |
| Norwegian | 99 | 0.4% |
| Pennsylvania German | 435 | 1.6% |
| Polish | 713 | 2.7% |
| Portuguese | 79 | 0.3% |
| Puerto Rican | 79 | 0.3% |
| Romanian | 79 | 0.3% |
| Russian | 49 | 0.2% |
| Salvadoran | 1 | 0.0% |
| Scandinavian | 57 | 0.2% |
| Scotch-Irish | 659 | 2.5% |
| Scottish | 855 | 3.2% |
| Serbian | 28 | 0.1% |
| Slavic | 16 | 0.1% |
| Slovak | 165 | 0.6% |
| Slovene | 112 | 0.4% |
| South American | 13 | 0.1% |
| Spaniard | 14 | 0.1% |
| Spanish | 118 | 0.4% |
| Subsaharan African | 30 | 0.1% |
| Swedish | 294 | 1.1% |
| Swiss | 471 | 1.8% |
| Trinidadian and Tobagonian | 7 | 0.0% |
| Turkish | 31 | 0.1% |
| Welsh | 199 | 0.7% |
| Yugoslavian | 4 | 0.0% | View All 61 Rows |
Immigrants in Carroll County
The most numerous immigrant groups reported in Carroll County came from Europe (47 | 0.2%), Central America (44 | 0.2%), Latin America (44 | 0.2%), Western Europe (32 | 0.1%), and El Salvador (28 | 0.1%), together accounting for 0.7% of all Carroll County residents.
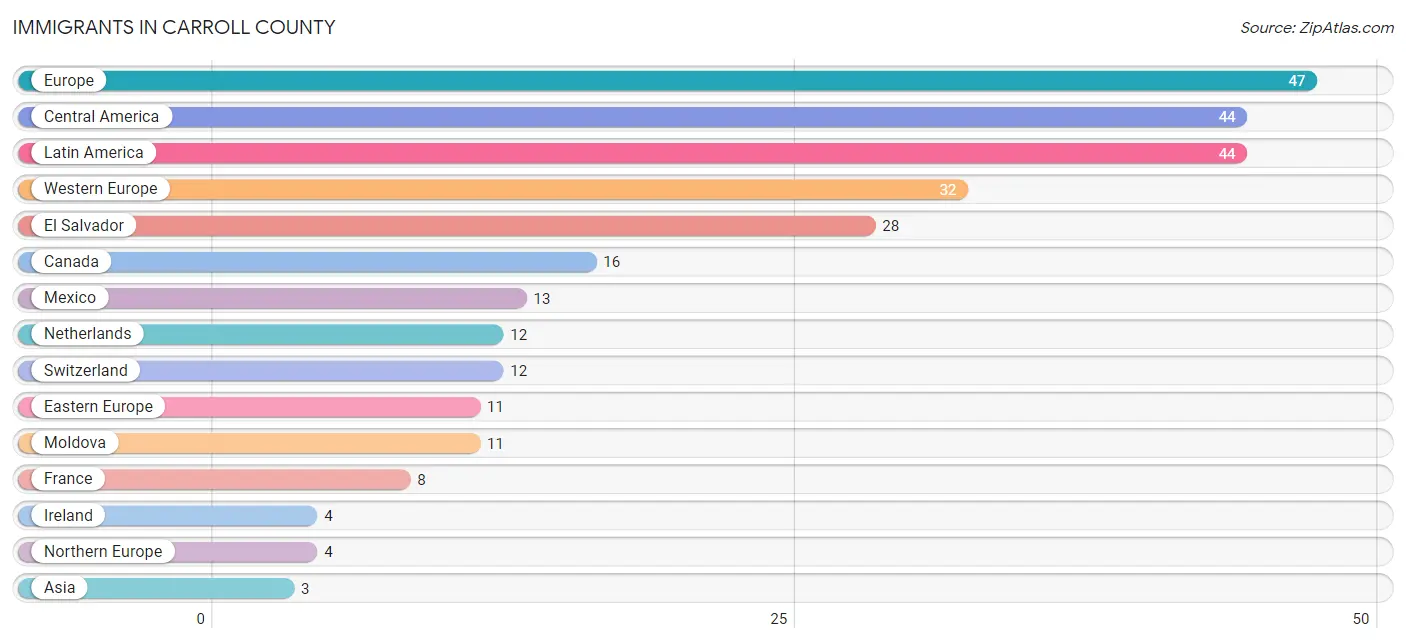
| Immigration Origin | # Population | % Population |
| Asia | 3 | 0.0% |
| Canada | 16 | 0.1% |
| Central America | 44 | 0.2% |
| Eastern Europe | 11 | 0.0% |
| El Salvador | 28 | 0.1% |
| Europe | 47 | 0.2% |
| France | 8 | 0.0% |
| Guatemala | 3 | 0.0% |
| Iraq | 3 | 0.0% |
| Ireland | 4 | 0.0% |
| Latin America | 44 | 0.2% |
| Mexico | 13 | 0.1% |
| Moldova | 11 | 0.0% |
| Netherlands | 12 | 0.0% |
| Northern Europe | 4 | 0.0% |
| Switzerland | 12 | 0.0% |
| Western Asia | 3 | 0.0% |
| Western Europe | 32 | 0.1% | View All 18 Rows |
Sex and Age in Carroll County
Sex and Age in Carroll County
The most populous age groups in Carroll County are 55 to 59 Years (1,181 | 8.6%) for men and 55 to 59 Years (1,143 | 8.7%) for women.
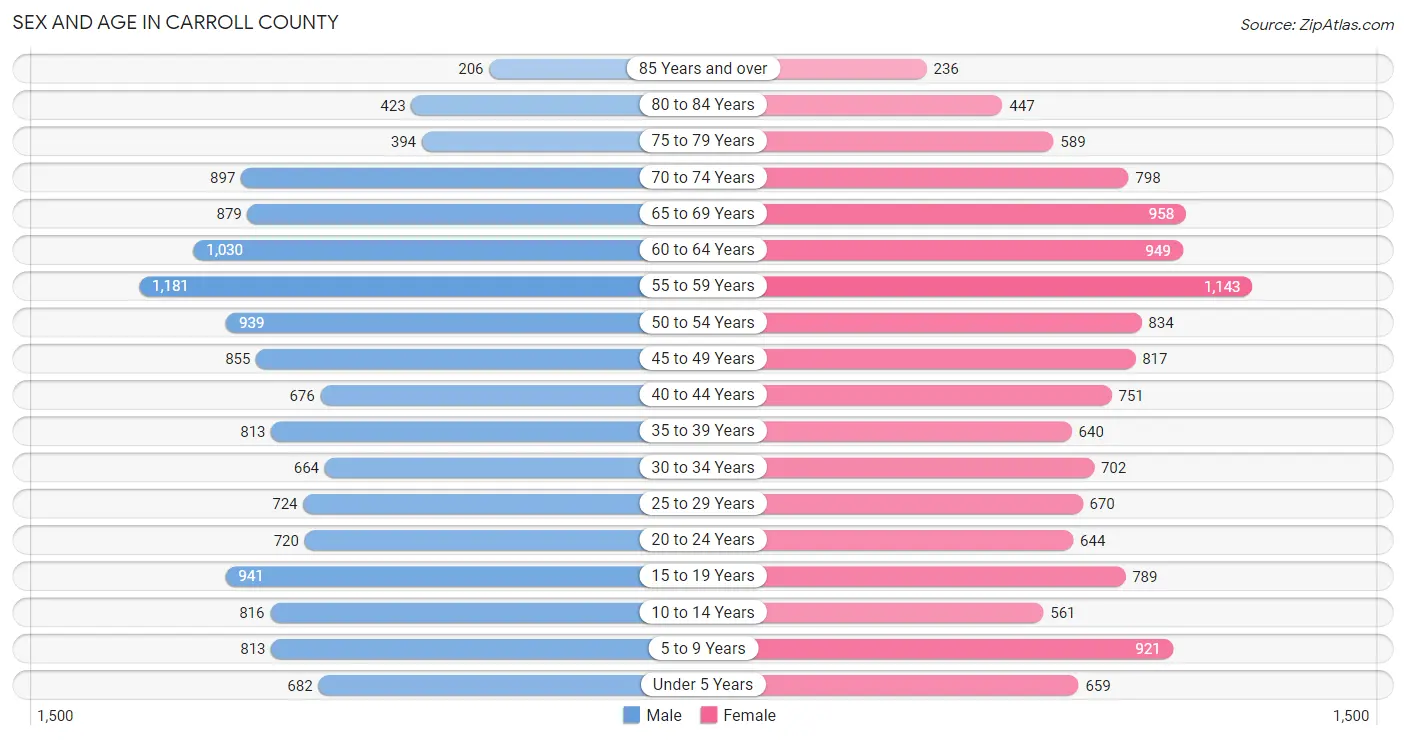
| Age Bracket | Male | Female |
| Under 5 Years | 682 (5.0%) | 659 (5.0%) |
| 5 to 9 Years | 813 (5.9%) | 921 (7.0%) |
| 10 to 14 Years | 816 (6.0%) | 561 (4.3%) |
| 15 to 19 Years | 941 (6.9%) | 789 (6.0%) |
| 20 to 24 Years | 720 (5.3%) | 644 (4.9%) |
| 25 to 29 Years | 724 (5.3%) | 670 (5.1%) |
| 30 to 34 Years | 664 (4.9%) | 702 (5.4%) |
| 35 to 39 Years | 813 (5.9%) | 640 (4.9%) |
| 40 to 44 Years | 676 (5.0%) | 751 (5.7%) |
| 45 to 49 Years | 855 (6.3%) | 817 (6.2%) |
| 50 to 54 Years | 939 (6.9%) | 834 (6.4%) |
| 55 to 59 Years | 1,181 (8.6%) | 1,143 (8.7%) |
| 60 to 64 Years | 1,030 (7.5%) | 949 (7.2%) |
| 65 to 69 Years | 879 (6.4%) | 958 (7.3%) |
| 70 to 74 Years | 897 (6.6%) | 798 (6.1%) |
| 75 to 79 Years | 394 (2.9%) | 589 (4.5%) |
| 80 to 84 Years | 423 (3.1%) | 447 (3.4%) |
| 85 Years and over | 206 (1.5%) | 236 (1.8%) |
| Total | 13,653 (100.0%) | 13,108 (100.0%) |
Families and Households in Carroll County
Median Family Size in Carroll County
The median family size in Carroll County is 2.86 persons per family, with married-couple families (5,934 | 80.4%) accounting for the largest median family size of 2.9 persons per family. On the other hand, single male/father families (528 | 7.1%) represent the smallest median family size with 2.55 persons per family.
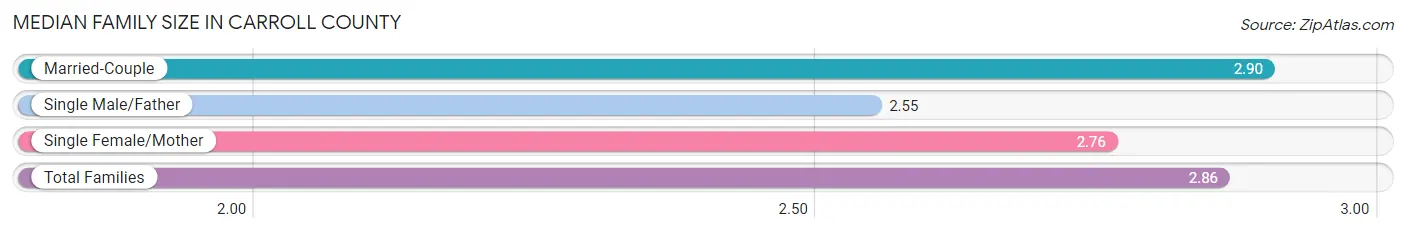
| Family Type | # Families | Family Size |
| Married-Couple | 5,934 (80.4%) | 2.90 |
| Single Male/Father | 528 (7.1%) | 2.55 |
| Single Female/Mother | 919 (12.4%) | 2.76 |
| Total Families | 7,381 (100.0%) | 2.86 |
Median Household Size in Carroll County
The median household size in Carroll County is 2.32 persons per household, with single female/mother households (919 | 8.1%) accounting for the largest median household size of 3.24 persons per household. non-family households (3,974 | 35.0%) represent the smallest median household size with 1.16 persons per household.
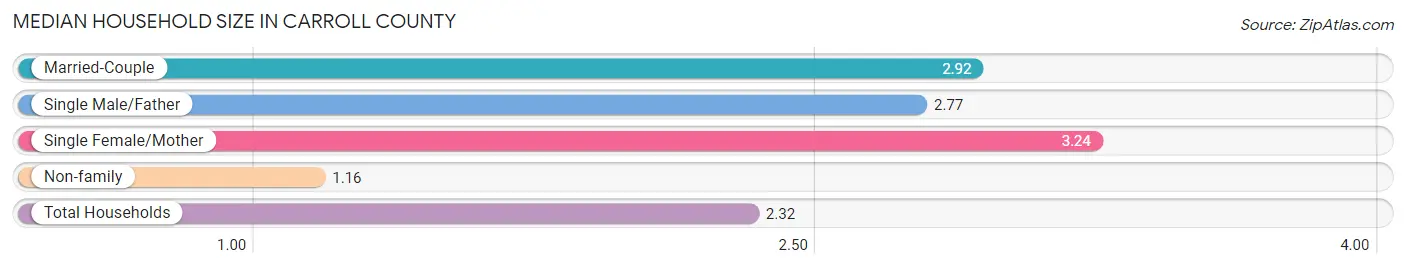
| Household Type | # Households | Household Size |
| Married-Couple | 5,934 (52.3%) | 2.92 |
| Single Male/Father | 528 (4.6%) | 2.77 |
| Single Female/Mother | 919 (8.1%) | 3.24 |
| Non-family | 3,974 (35.0%) | 1.16 |
| Total Households | 11,355 (100.0%) | 2.32 |
Household Size by Marriage Status in Carroll County
Out of a total of 11,355 households in Carroll County, 7,381 (65.0%) are family households, while 3,974 (35.0%) are nonfamily households. The most numerous type of family households are 2-person households, comprising 3,688, and the most common type of nonfamily households are 1-person households, comprising 3,362.
| Household Size | Family Households | Nonfamily Households |
| 1-Person Households | - | 3,362 (29.6%) |
| 2-Person Households | 3,688 (32.5%) | 574 (5.1%) |
| 3-Person Households | 1,613 (14.2%) | 30 (0.3%) |
| 4-Person Households | 934 (8.2%) | 8 (0.1%) |
| 5-Person Households | 704 (6.2%) | 0 (0.0%) |
| 6-Person Households | 286 (2.5%) | 0 (0.0%) |
| 7+ Person Households | 156 (1.4%) | 0 (0.0%) |
| Total | 7,381 (65.0%) | 3,974 (35.0%) |
Female Fertility in Carroll County
Fertility by Age in Carroll County
Average fertility rate in Carroll County is 73.0 births per 1,000 women. Women in the age bracket of 20 to 34 years have the highest fertility rate with 176.0 births per 1,000 women. Women in the age bracket of 20 to 34 years acount for 93.9% of all women with births.
| Age Bracket | Women with Births | Births / 1,000 Women |
| 15 to 19 years | 3 (0.8%) | 4.0 |
| 20 to 34 years | 355 (93.9%) | 176.0 |
| 35 to 50 years | 20 (5.3%) | 8.0 |
| Total | 378 (100.0%) | 73.0 |
Fertility by Age by Marriage Status in Carroll County
79.4% of women with births (378) in Carroll County are married. The highest percentage of unmarried women with births falls into 15 to 19 years age bracket with 100.0% of them unmarried at the time of birth, while the lowest percentage of unmarried women with births belong to 35 to 50 years age bracket with 15.0% of them unmarried.
| Age Bracket | Married | Unmarried |
| 15 to 19 years | 0 (0.0%) | 3 (100.0%) |
| 20 to 34 years | 283 (79.7%) | 72 (20.3%) |
| 35 to 50 years | 17 (85.0%) | 3 (15.0%) |
| Total | 300 (79.4%) | 78 (20.6%) |
Fertility by Education in Carroll County
| Educational Attainment | Women with Births | Births / 1,000 Women |
| Less than High School | 97 (25.7%) | 103.0 |
| High School Diploma | 114 (30.2%) | 70.0 |
| College or Associate's Degree | 119 (31.5%) | 64.0 |
| Bachelor's Degree | 48 (12.7%) | 89.0 |
| Graduate Degree | 0 (0.0%) | 0.0 |
| Total | 378 (100.0%) | 73.0 |
Fertility by Education by Marriage Status in Carroll County
20.6% of women with births in Carroll County are unmarried. Women with the educational attainment of less than high school are most likely to be married with 100.0% of them married at childbirth, while women with the educational attainment of college or associate's degree are least likely to be married with 40.3% of them unmarried at childbirth.
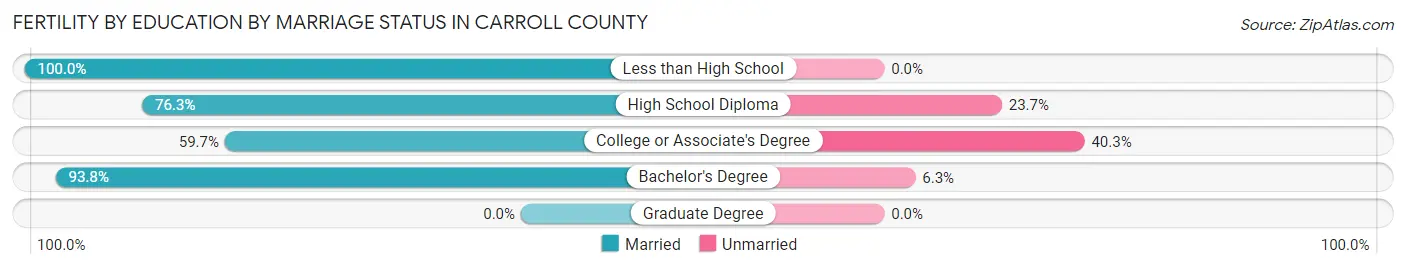
| Educational Attainment | Married | Unmarried |
| Less than High School | 97 (100.0%) | 0 (0.0%) |
| High School Diploma | 87 (76.3%) | 27 (23.7%) |
| College or Associate's Degree | 71 (59.7%) | 48 (40.3%) |
| Bachelor's Degree | 45 (93.8%) | 3 (6.2%) |
| Graduate Degree | 0 (0.0%) | 0 (0.0%) |
| Total | 300 (79.4%) | 78 (20.6%) |
Employment Characteristics in Carroll County
Employment by Class of Employer in Carroll County
Among the 11,572 employed individuals in Carroll County, private company employees (8,071 | 69.8%), local government employees (1,042 | 9.0%), and self-employed (not incorporated) (862 | 7.4%) make up the most common classes of employment.
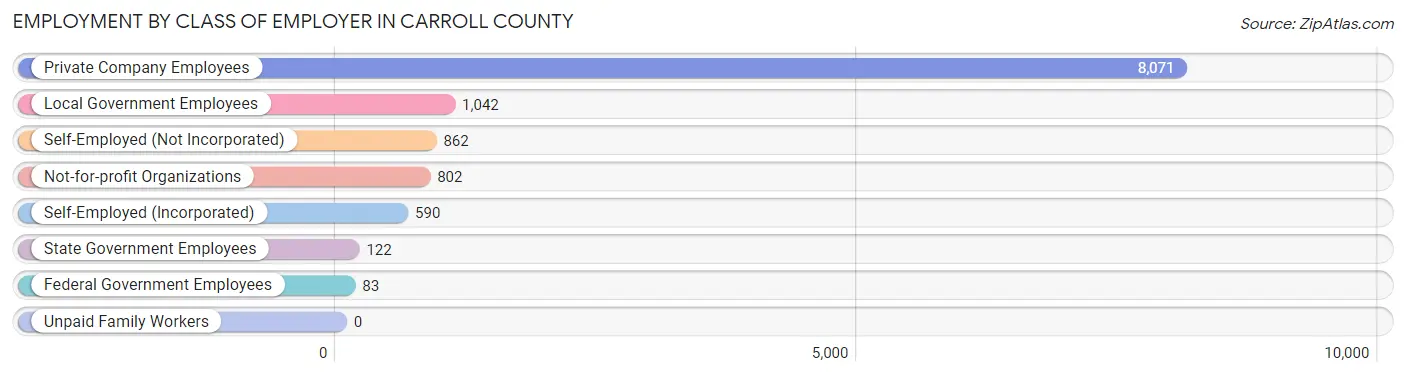
| Employer Class | # Employees | % Employees |
| Private Company Employees | 8,071 | 69.8% |
| Self-Employed (Incorporated) | 590 | 5.1% |
| Self-Employed (Not Incorporated) | 862 | 7.4% |
| Not-for-profit Organizations | 802 | 6.9% |
| Local Government Employees | 1,042 | 9.0% |
| State Government Employees | 122 | 1.1% |
| Federal Government Employees | 83 | 0.7% |
| Unpaid Family Workers | 0 | 0.0% |
| Total | 11,572 | 100.0% |
Employment Status by Age in Carroll County
According to the labor force statistics for Carroll County, out of the total population over 16 years of age (22,017), 56.3% or 12,396 individuals are in the labor force, with 3.9% or 483 of them unemployed. The age group with the highest labor force participation rate is 20 to 24 years, with 88.6% or 1,209 individuals in the labor force. Within the labor force, the 16 to 19 years age range has the highest percentage of unemployed individuals, with 18.7% or 102 of them being unemployed.
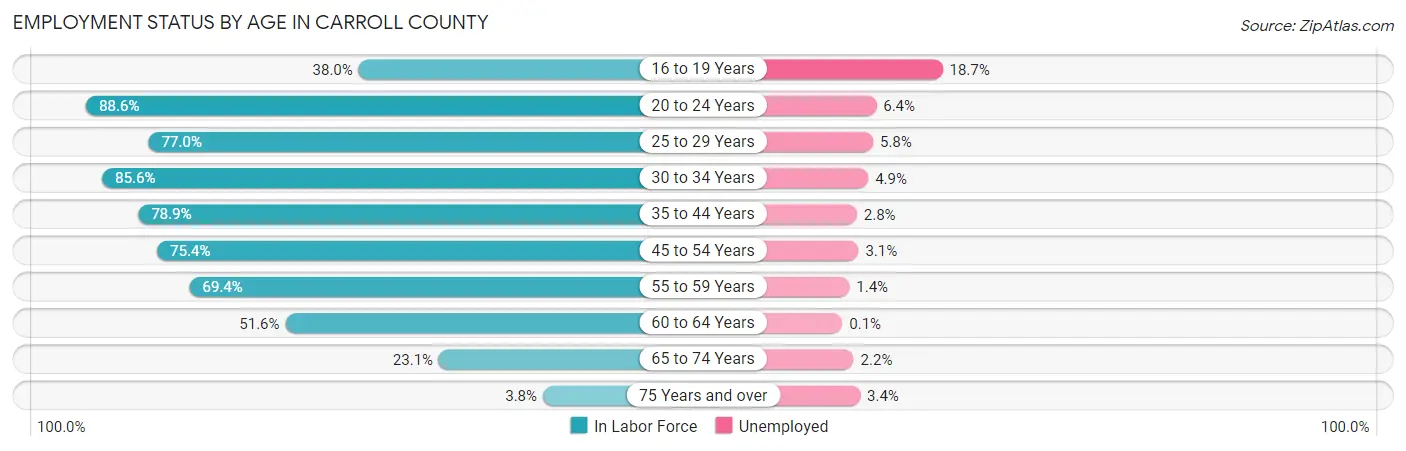
| Age Bracket | In Labor Force | Unemployed |
| 16 to 19 Years | 546 (38.0%) | 102 (18.7%) |
| 20 to 24 Years | 1,209 (88.6%) | 77 (6.4%) |
| 25 to 29 Years | 1,073 (77.0%) | 62 (5.8%) |
| 30 to 34 Years | 1,169 (85.6%) | 57 (4.9%) |
| 35 to 44 Years | 2,272 (78.9%) | 64 (2.8%) |
| 45 to 54 Years | 2,598 (75.4%) | 81 (3.1%) |
| 55 to 59 Years | 1,613 (69.4%) | 23 (1.4%) |
| 60 to 64 Years | 1,021 (51.6%) | 1 (0.1%) |
| 65 to 74 Years | 816 (23.1%) | 18 (2.2%) |
| 75 Years and over | 87 (3.8%) | 3 (3.4%) |
| Total | 12,396 (56.3%) | 483 (3.9%) |
Employment Status by Educational Attainment in Carroll County
According to labor force statistics for Carroll County, 72.8% of individuals (9,746) out of the total population between 25 and 64 years of age (13,388) are in the labor force, with 2.9% or 283 of them being unemployed. The group with the highest labor force participation rate are those with the educational attainment of bachelor's degree or higher, with 90.6% or 1,646 individuals in the labor force. Within the labor force, individuals with high school diploma education have the highest percentage of unemployment, with 4.6% or 195 of them being unemployed.
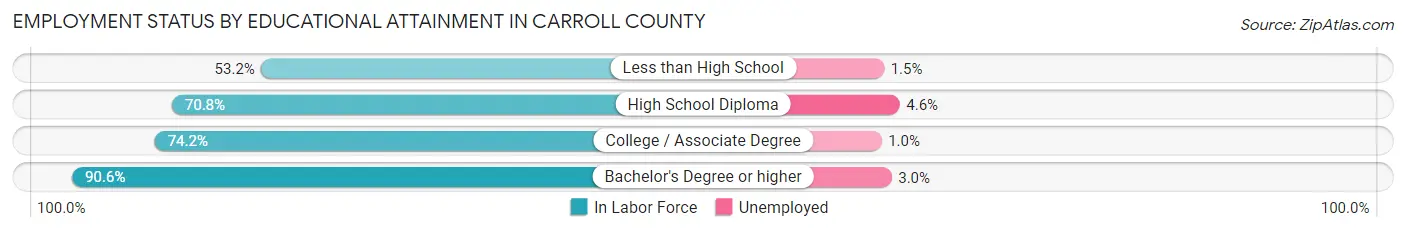
| Educational Attainment | In Labor Force | Unemployed |
| Less than High School | 717 (53.2%) | 20 (1.5%) |
| High School Diploma | 4,248 (70.8%) | 276 (4.6%) |
| College / Associate Degree | 3,133 (74.2%) | 42 (1.0%) |
| Bachelor's Degree or higher | 1,646 (90.6%) | 55 (3.0%) |
| Total | 9,746 (72.8%) | 388 (2.9%) |
Employment Occupations by Sex in Carroll County
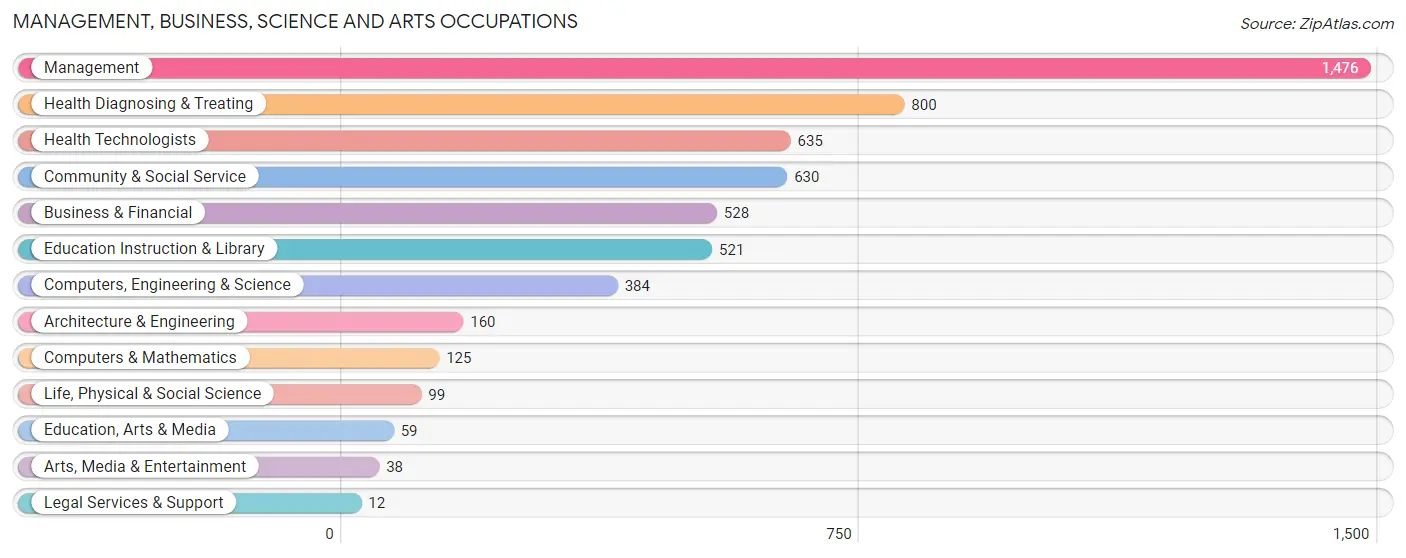
Management, Business, Science and Arts Occupations
The most common Management, Business, Science and Arts occupations in Carroll County are Management (1,476 | 12.4%), Health Diagnosing & Treating (800 | 6.7%), Health Technologists (635 | 5.3%), Community & Social Service (630 | 5.3%), and Business & Financial (528 | 4.4%).
Management, Business, Science and Arts Occupations by Sex
Within the Management, Business, Science and Arts occupations in Carroll County, the most male-oriented occupations are Architecture & Engineering (95.6%), Management (67.8%), and Computers, Engineering & Science (66.4%), while the most female-oriented occupations are Legal Services & Support (100.0%), Health Diagnosing & Treating (94.9%), and Health Technologists (94.7%).
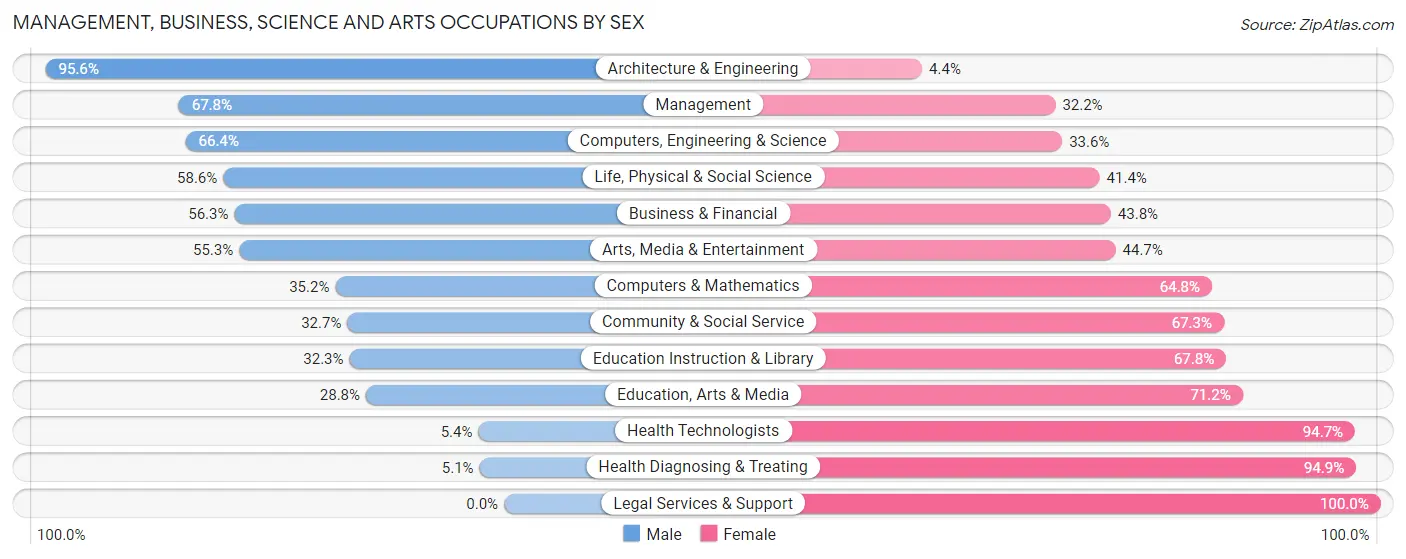
| Occupation | Male | Female |
| Management | 1,001 (67.8%) | 475 (32.2%) |
| Business & Financial | 297 (56.2%) | 231 (43.8%) |
| Computers, Engineering & Science | 255 (66.4%) | 129 (33.6%) |
| Computers & Mathematics | 44 (35.2%) | 81 (64.8%) |
| Architecture & Engineering | 153 (95.6%) | 7 (4.4%) |
| Life, Physical & Social Science | 58 (58.6%) | 41 (41.4%) |
| Community & Social Service | 206 (32.7%) | 424 (67.3%) |
| Education, Arts & Media | 17 (28.8%) | 42 (71.2%) |
| Legal Services & Support | 0 (0.0%) | 12 (100.0%) |
| Education Instruction & Library | 168 (32.3%) | 353 (67.7%) |
| Arts, Media & Entertainment | 21 (55.3%) | 17 (44.7%) |
| Health Diagnosing & Treating | 41 (5.1%) | 759 (94.9%) |
| Health Technologists | 34 (5.3%) | 601 (94.7%) |
| Total (Category) | 1,800 (47.1%) | 2,018 (52.8%) |
| Total (Overall) | 6,533 (54.8%) | 5,383 (45.2%) |
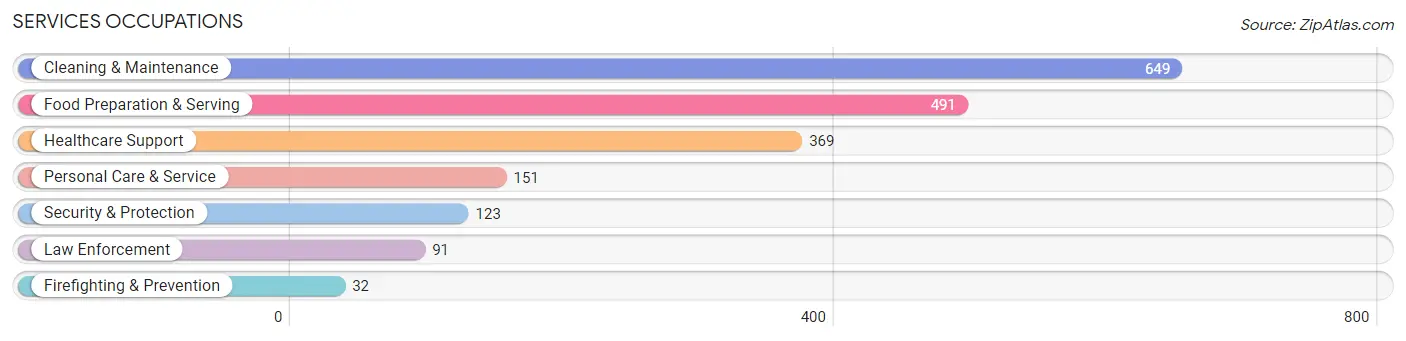
Services Occupations
The most common Services occupations in Carroll County are Cleaning & Maintenance (649 | 5.4%), Food Preparation & Serving (491 | 4.1%), Healthcare Support (369 | 3.1%), Personal Care & Service (151 | 1.3%), and Security & Protection (123 | 1.0%).
Services Occupations by Sex
Within the Services occupations in Carroll County, the most male-oriented occupations are Cleaning & Maintenance (70.4%), Law Enforcement (39.6%), and Security & Protection (35.8%), while the most female-oriented occupations are Healthcare Support (93.8%), Personal Care & Service (93.4%), and Firefighting & Prevention (75.0%).
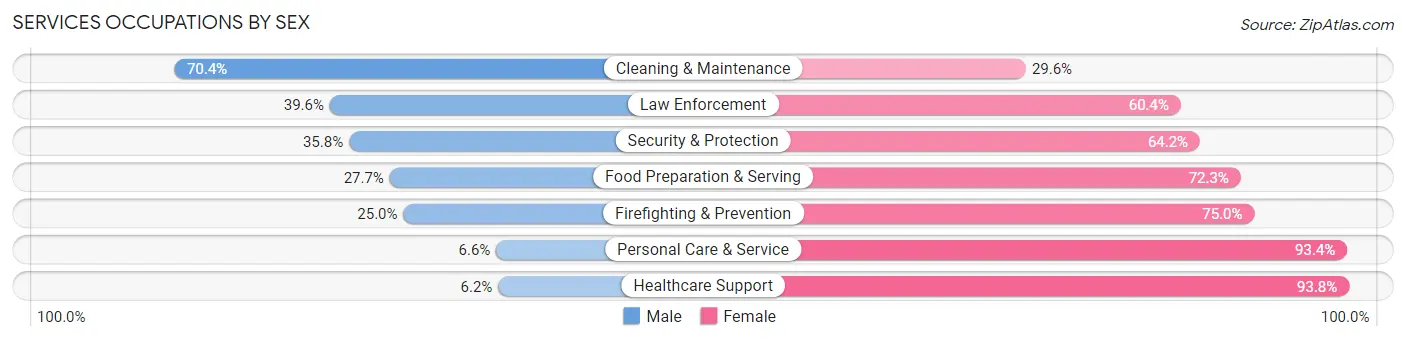
| Occupation | Male | Female |
| Healthcare Support | 23 (6.2%) | 346 (93.8%) |
| Security & Protection | 44 (35.8%) | 79 (64.2%) |
| Firefighting & Prevention | 8 (25.0%) | 24 (75.0%) |
| Law Enforcement | 36 (39.6%) | 55 (60.4%) |
| Food Preparation & Serving | 136 (27.7%) | 355 (72.3%) |
| Cleaning & Maintenance | 457 (70.4%) | 192 (29.6%) |
| Personal Care & Service | 10 (6.6%) | 141 (93.4%) |
| Total (Category) | 670 (37.6%) | 1,113 (62.4%) |
| Total (Overall) | 6,533 (54.8%) | 5,383 (45.2%) |
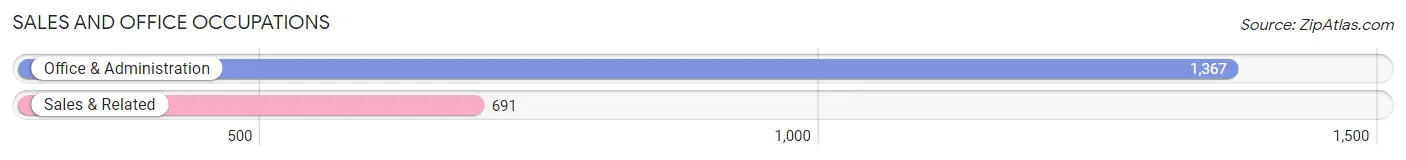
Sales and Office Occupations
The most common Sales and Office occupations in Carroll County are Office & Administration (1,367 | 11.5%), and Sales & Related (691 | 5.8%).
Sales and Office Occupations by Sex
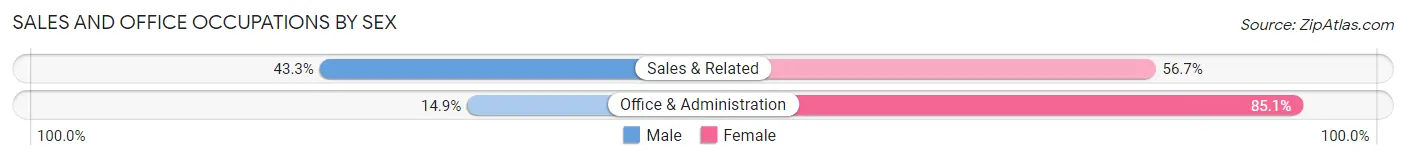
| Occupation | Male | Female |
| Sales & Related | 299 (43.3%) | 392 (56.7%) |
| Office & Administration | 204 (14.9%) | 1,163 (85.1%) |
| Total (Category) | 503 (24.4%) | 1,555 (75.6%) |
| Total (Overall) | 6,533 (54.8%) | 5,383 (45.2%) |
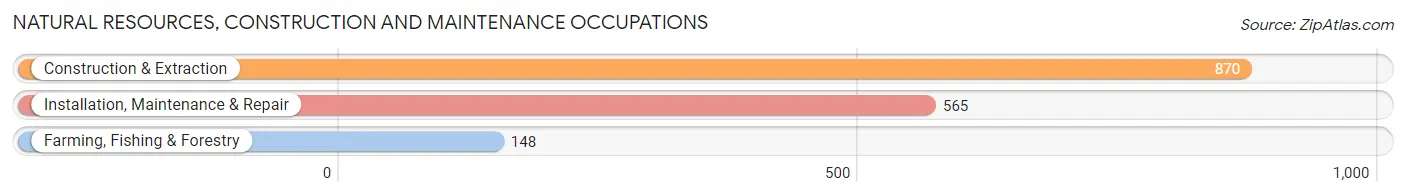
Natural Resources, Construction and Maintenance Occupations
The most common Natural Resources, Construction and Maintenance occupations in Carroll County are Construction & Extraction (870 | 7.3%), Installation, Maintenance & Repair (565 | 4.7%), and Farming, Fishing & Forestry (148 | 1.2%).
Natural Resources, Construction and Maintenance Occupations by Sex
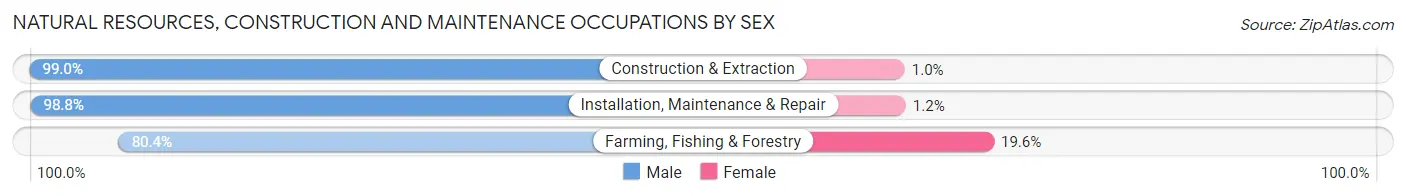
| Occupation | Male | Female |
| Farming, Fishing & Forestry | 119 (80.4%) | 29 (19.6%) |
| Construction & Extraction | 861 (99.0%) | 9 (1.0%) |
| Installation, Maintenance & Repair | 558 (98.8%) | 7 (1.2%) |
| Total (Category) | 1,538 (97.2%) | 45 (2.8%) |
| Total (Overall) | 6,533 (54.8%) | 5,383 (45.2%) |
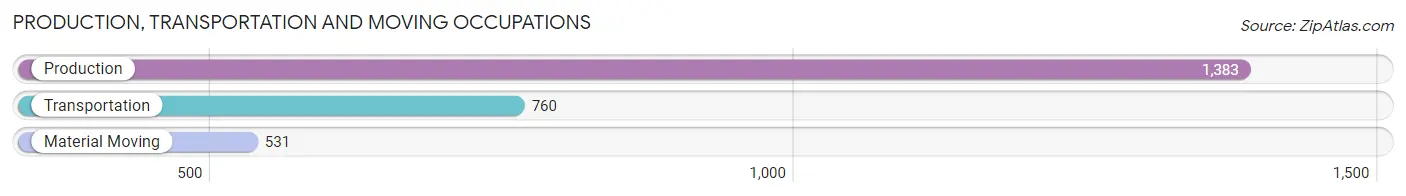
Production, Transportation and Moving Occupations
The most common Production, Transportation and Moving occupations in Carroll County are Production (1,383 | 11.6%), Transportation (760 | 6.4%), and Material Moving (531 | 4.5%).
Production, Transportation and Moving Occupations by Sex
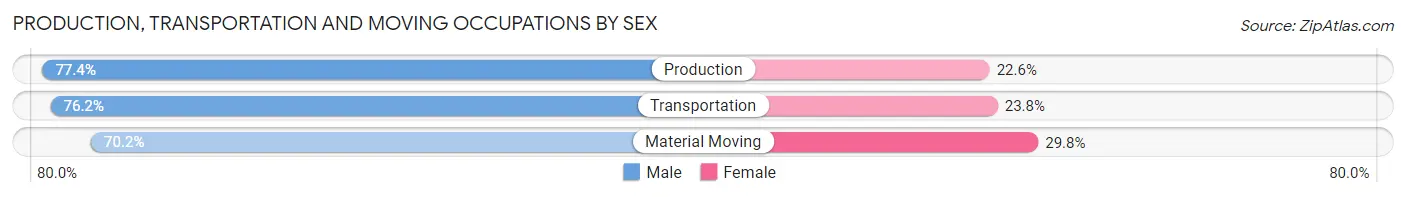
| Occupation | Male | Female |
| Production | 1,070 (77.4%) | 313 (22.6%) |
| Transportation | 579 (76.2%) | 181 (23.8%) |
| Material Moving | 373 (70.2%) | 158 (29.8%) |
| Total (Category) | 2,022 (75.6%) | 652 (24.4%) |
| Total (Overall) | 6,533 (54.8%) | 5,383 (45.2%) |
Employment Industries by Sex in Carroll County
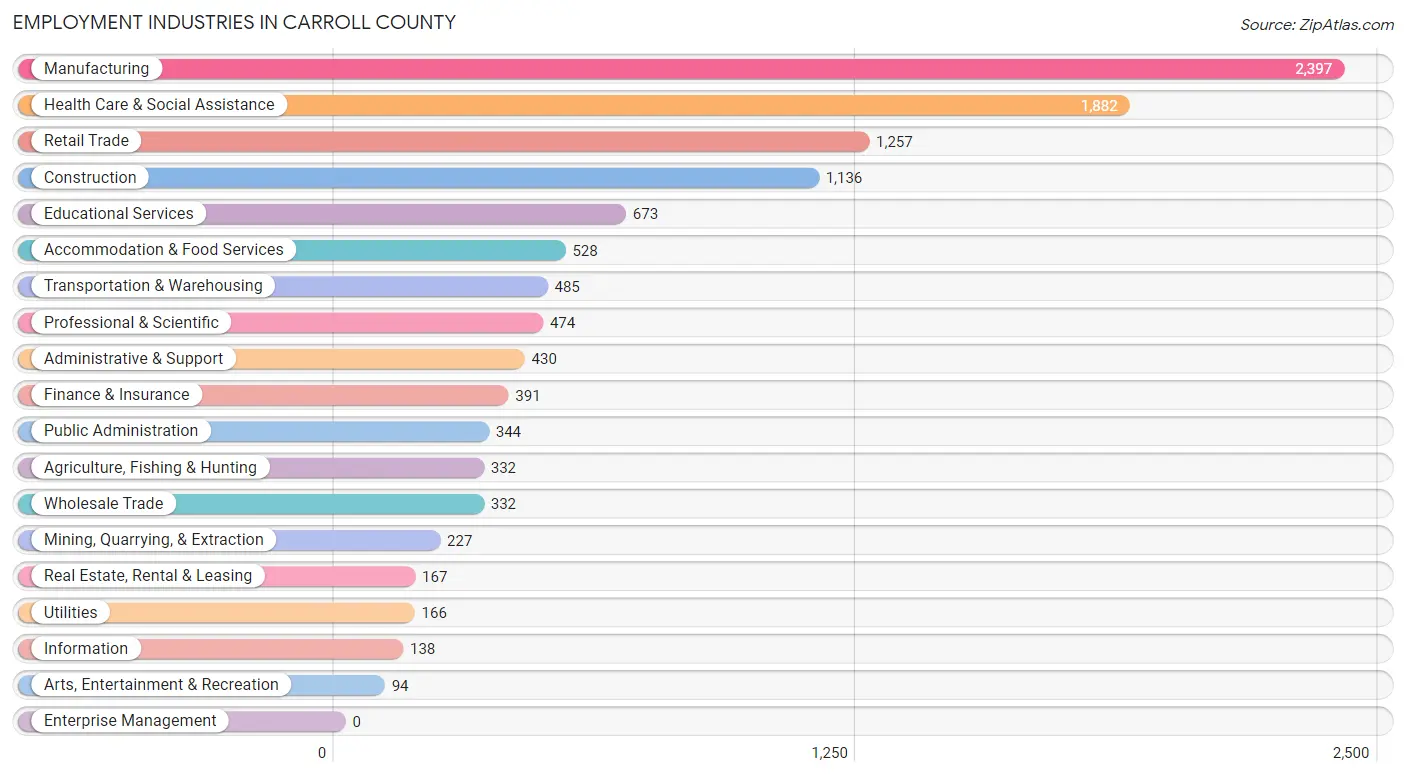
Employment Industries in Carroll County
The major employment industries in Carroll County include Manufacturing (2,397 | 20.1%), Health Care & Social Assistance (1,882 | 15.8%), Retail Trade (1,257 | 10.5%), Construction (1,136 | 9.5%), and Educational Services (673 | 5.7%).
Employment Industries by Sex in Carroll County
The Carroll County industries that see more men than women are Utilities (100.0%), Arts, Entertainment & Recreation (100.0%), and Mining, Quarrying, & Extraction (96.9%), whereas the industries that tend to have a higher number of women are Health Care & Social Assistance (92.9%), Finance & Insurance (89.3%), and Educational Services (74.2%).
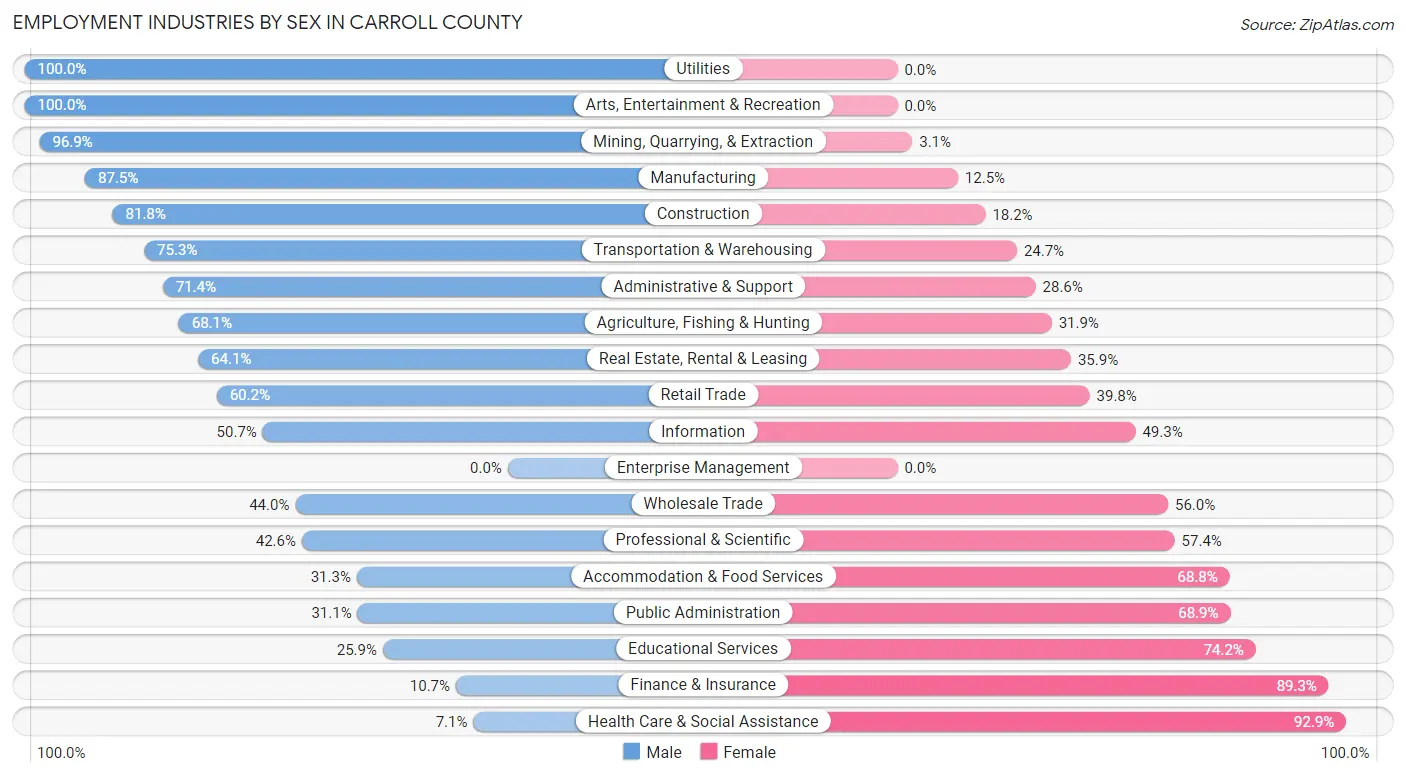
| Industry | Male | Female |
| Agriculture, Fishing & Hunting | 226 (68.1%) | 106 (31.9%) |
| Mining, Quarrying, & Extraction | 220 (96.9%) | 7 (3.1%) |
| Construction | 929 (81.8%) | 207 (18.2%) |
| Manufacturing | 2,097 (87.5%) | 300 (12.5%) |
| Wholesale Trade | 146 (44.0%) | 186 (56.0%) |
| Retail Trade | 757 (60.2%) | 500 (39.8%) |
| Transportation & Warehousing | 365 (75.3%) | 120 (24.7%) |
| Utilities | 166 (100.0%) | 0 (0.0%) |
| Information | 70 (50.7%) | 68 (49.3%) |
| Finance & Insurance | 42 (10.7%) | 349 (89.3%) |
| Real Estate, Rental & Leasing | 107 (64.1%) | 60 (35.9%) |
| Professional & Scientific | 202 (42.6%) | 272 (57.4%) |
| Enterprise Management | 0 (0.0%) | 0 (0.0%) |
| Administrative & Support | 307 (71.4%) | 123 (28.6%) |
| Educational Services | 174 (25.9%) | 499 (74.2%) |
| Health Care & Social Assistance | 134 (7.1%) | 1,748 (92.9%) |
| Arts, Entertainment & Recreation | 94 (100.0%) | 0 (0.0%) |
| Accommodation & Food Services | 165 (31.2%) | 363 (68.8%) |
| Public Administration | 107 (31.1%) | 237 (68.9%) |
| Total | 6,533 (54.8%) | 5,383 (45.2%) |
Education in Carroll County
School Enrollment in Carroll County
The most common levels of schooling among the 5,163 students in Carroll County are high school (1,354 | 26.2%), middle school (1,206 | 23.4%), and elementary school (1,089 | 21.1%).
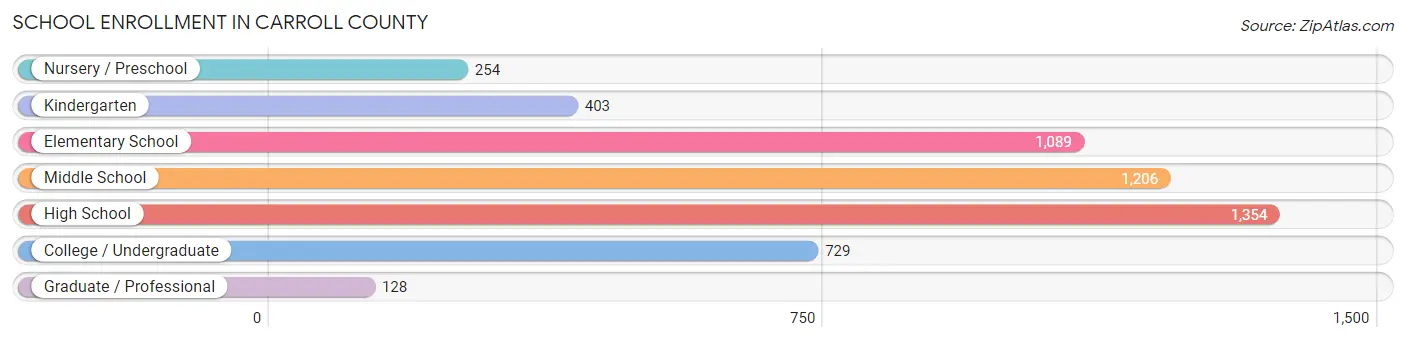
| School Level | # Students | % Students |
| Nursery / Preschool | 254 | 4.9% |
| Kindergarten | 403 | 7.8% |
| Elementary School | 1,089 | 21.1% |
| Middle School | 1,206 | 23.4% |
| High School | 1,354 | 26.2% |
| College / Undergraduate | 729 | 14.1% |
| Graduate / Professional | 128 | 2.5% |
| Total | 5,163 | 100.0% |
School Enrollment by Age by Funding Source in Carroll County
Out of a total of 5,163 students who are enrolled in schools in Carroll County, 795 (15.4%) attend a private institution, while the remaining 4,368 (84.6%) are enrolled in public schools. The age group of 5 to 9 year old has the highest likelihood of being enrolled in private schools, with 321 (21.4% in the age bracket) enrolled. Conversely, the age group of 15 to 17 year olds has the lowest likelihood of being enrolled in a private school, with 832 (92.2% in the age bracket) attending a public institution.
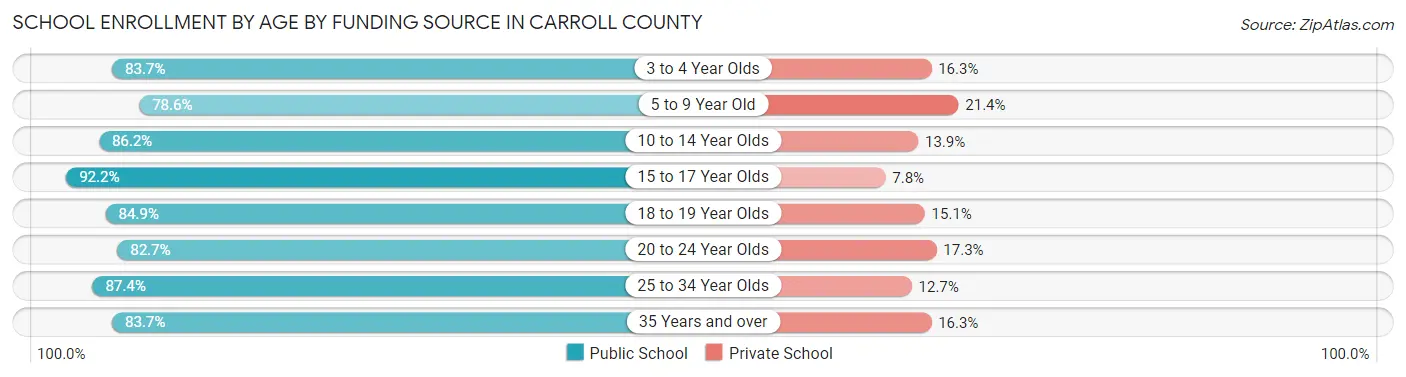
| Age Bracket | Public School | Private School |
| 3 to 4 Year Olds | 118 (83.7%) | 23 (16.3%) |
| 5 to 9 Year Old | 1,182 (78.6%) | 321 (21.4%) |
| 10 to 14 Year Olds | 1,163 (86.2%) | 187 (13.9%) |
| 15 to 17 Year Olds | 832 (92.2%) | 70 (7.8%) |
| 18 to 19 Year Olds | 422 (84.9%) | 75 (15.1%) |
| 20 to 24 Year Olds | 206 (82.7%) | 43 (17.3%) |
| 25 to 34 Year Olds | 214 (87.4%) | 31 (12.7%) |
| 35 Years and over | 231 (83.7%) | 45 (16.3%) |
| Total | 4,368 (84.6%) | 795 (15.4%) |
Educational Attainment by Field of Study in Carroll County
Education (704 | 25.5%), science & technology (527 | 19.1%), business (399 | 14.4%), bio, nature & agricultural (215 | 7.8%), and computers & mathematics (172 | 6.2%) are the most common fields of study among 2,766 individuals in Carroll County who have obtained a bachelor's degree or higher.
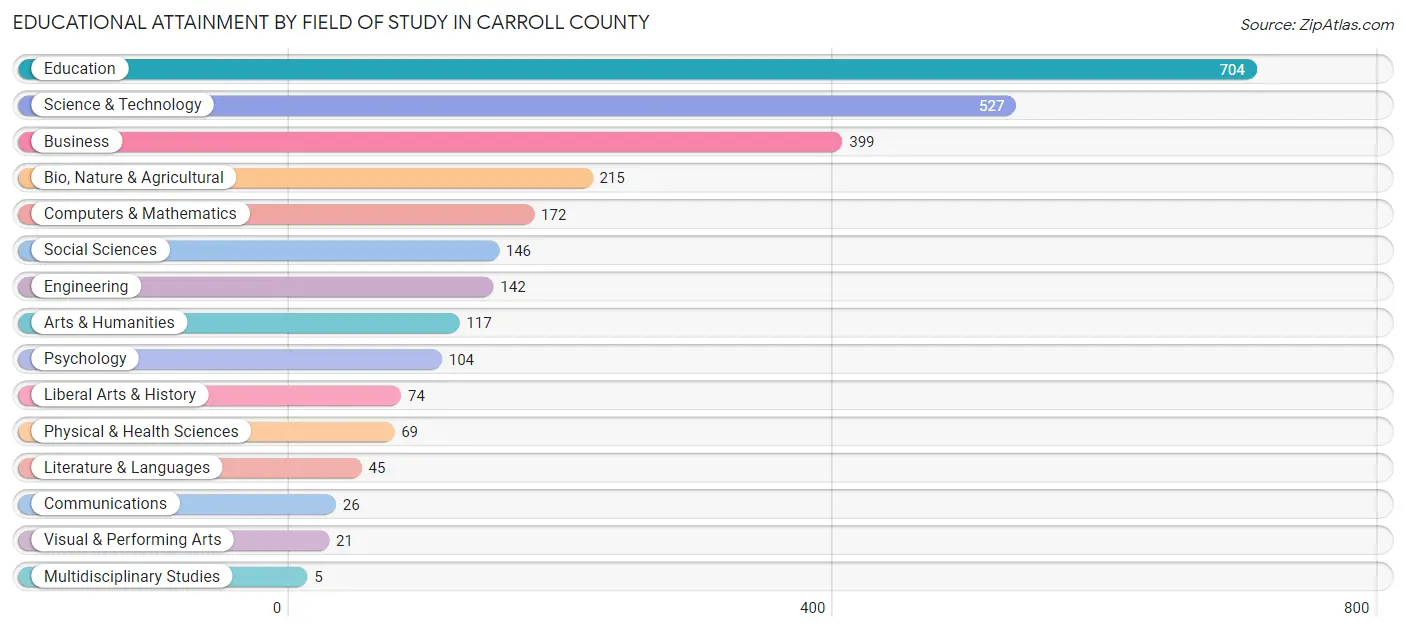
| Field of Study | # Graduates | % Graduates |
| Computers & Mathematics | 172 | 6.2% |
| Bio, Nature & Agricultural | 215 | 7.8% |
| Physical & Health Sciences | 69 | 2.5% |
| Psychology | 104 | 3.8% |
| Social Sciences | 146 | 5.3% |
| Engineering | 142 | 5.1% |
| Multidisciplinary Studies | 5 | 0.2% |
| Science & Technology | 527 | 19.1% |
| Business | 399 | 14.4% |
| Education | 704 | 25.5% |
| Literature & Languages | 45 | 1.6% |
| Liberal Arts & History | 74 | 2.7% |
| Visual & Performing Arts | 21 | 0.8% |
| Communications | 26 | 0.9% |
| Arts & Humanities | 117 | 4.2% |
| Total | 2,766 | 100.0% |
Transportation & Commute in Carroll County
Vehicle Availability by Sex in Carroll County
The most prevalent vehicle ownership categories in Carroll County are males with 2 vehicles (2,450, accounting for 38.6%) and females with 2 vehicles (1,927, making up 47.0%).
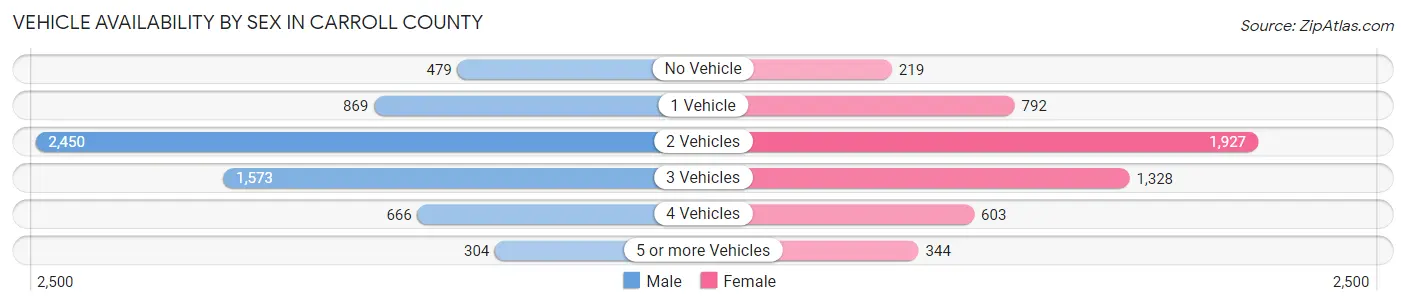
| Vehicles Available | Male | Female |
| No Vehicle | 479 (7.5%) | 219 (4.2%) |
| 1 Vehicle | 869 (13.7%) | 792 (15.2%) |
| 2 Vehicles | 2,450 (38.6%) | 1,927 (37.0%) |
| 3 Vehicles | 1,573 (24.8%) | 1,328 (25.5%) |
| 4 Vehicles | 666 (10.5%) | 603 (11.6%) |
| 5 or more Vehicles | 304 (4.8%) | 344 (6.6%) |
| Total | 6,341 (100.0%) | 5,213 (100.0%) |
Commute Time in Carroll County
The most frequently occuring commute durations in Carroll County are 15 to 19 minutes (1,440 commuters, 13.4%), 5 to 9 minutes (1,409 commuters, 13.1%), and 45 to 59 minutes (1,031 commuters, 9.6%).
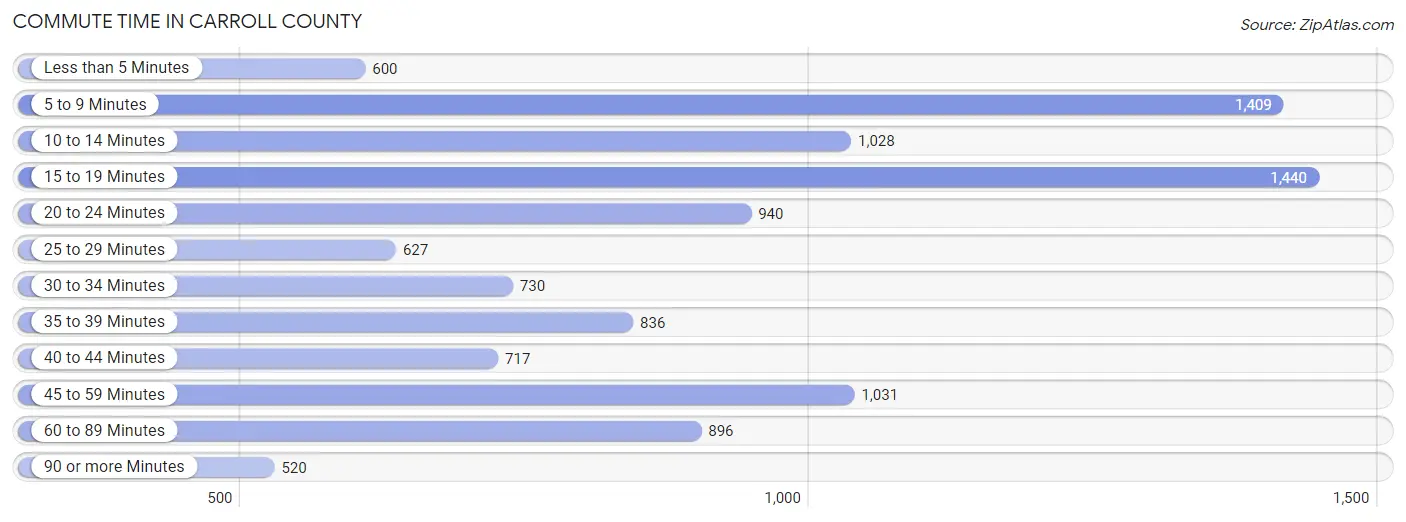
| Commute Time | # Commuters | % Commuters |
| Less than 5 Minutes | 600 | 5.6% |
| 5 to 9 Minutes | 1,409 | 13.1% |
| 10 to 14 Minutes | 1,028 | 9.5% |
| 15 to 19 Minutes | 1,440 | 13.4% |
| 20 to 24 Minutes | 940 | 8.7% |
| 25 to 29 Minutes | 627 | 5.8% |
| 30 to 34 Minutes | 730 | 6.8% |
| 35 to 39 Minutes | 836 | 7.8% |
| 40 to 44 Minutes | 717 | 6.7% |
| 45 to 59 Minutes | 1,031 | 9.6% |
| 60 to 89 Minutes | 896 | 8.3% |
| 90 or more Minutes | 520 | 4.8% |
Commute Time by Sex in Carroll County
The most common commute times in Carroll County are 5 to 9 minutes (697 commuters, 11.9%) for males and 15 to 19 minutes (765 commuters, 15.6%) for females.
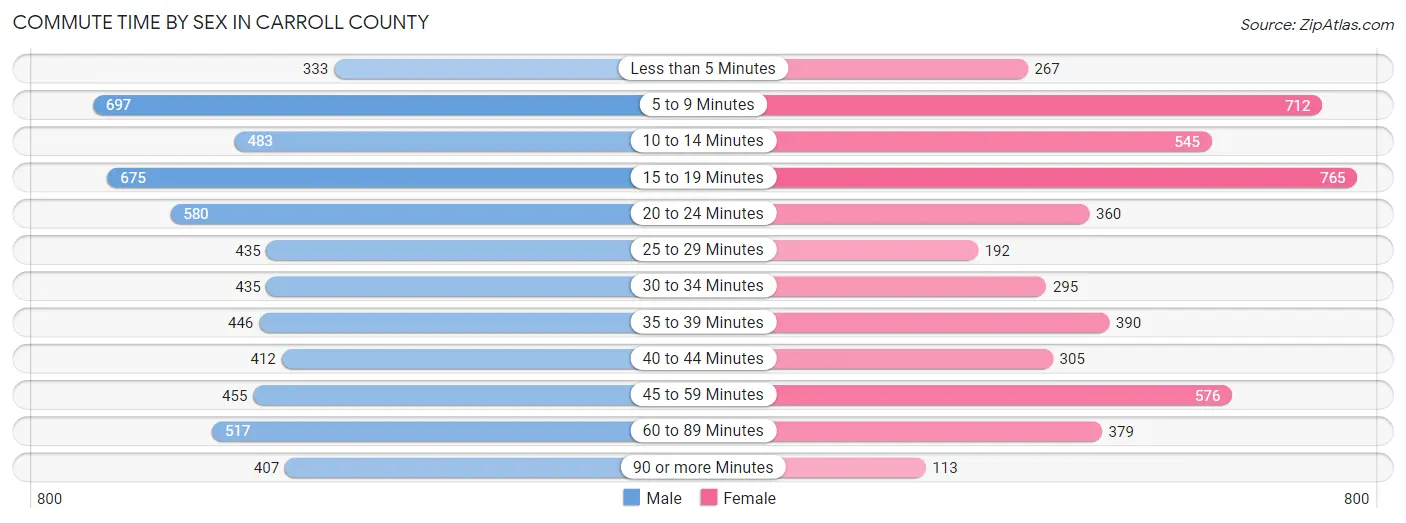
| Commute Time | Male | Female |
| Less than 5 Minutes | 333 (5.7%) | 267 (5.4%) |
| 5 to 9 Minutes | 697 (11.9%) | 712 (14.5%) |
| 10 to 14 Minutes | 483 (8.2%) | 545 (11.1%) |
| 15 to 19 Minutes | 675 (11.5%) | 765 (15.6%) |
| 20 to 24 Minutes | 580 (9.9%) | 360 (7.3%) |
| 25 to 29 Minutes | 435 (7.4%) | 192 (3.9%) |
| 30 to 34 Minutes | 435 (7.4%) | 295 (6.0%) |
| 35 to 39 Minutes | 446 (7.6%) | 390 (8.0%) |
| 40 to 44 Minutes | 412 (7.0%) | 305 (6.2%) |
| 45 to 59 Minutes | 455 (7.7%) | 576 (11.8%) |
| 60 to 89 Minutes | 517 (8.8%) | 379 (7.7%) |
| 90 or more Minutes | 407 (6.9%) | 113 (2.3%) |
Time of Departure to Work by Sex in Carroll County
The most frequent times of departure to work in Carroll County are 6:30 AM to 6:59 AM (912, 15.5%) for males and 7:00 AM to 7:29 AM (703, 14.3%) for females.
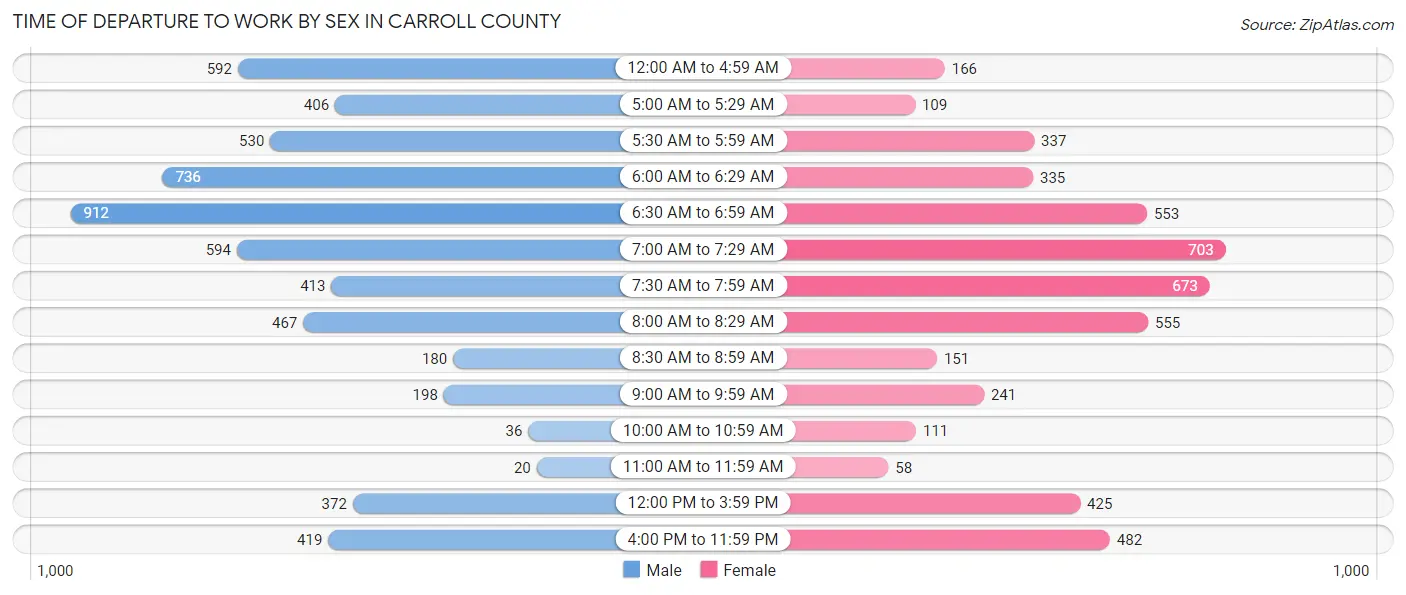
| Time of Departure | Male | Female |
| 12:00 AM to 4:59 AM | 592 (10.1%) | 166 (3.4%) |
| 5:00 AM to 5:29 AM | 406 (6.9%) | 109 (2.2%) |
| 5:30 AM to 5:59 AM | 530 (9.0%) | 337 (6.9%) |
| 6:00 AM to 6:29 AM | 736 (12.5%) | 335 (6.8%) |
| 6:30 AM to 6:59 AM | 912 (15.5%) | 553 (11.3%) |
| 7:00 AM to 7:29 AM | 594 (10.1%) | 703 (14.3%) |
| 7:30 AM to 7:59 AM | 413 (7.0%) | 673 (13.7%) |
| 8:00 AM to 8:29 AM | 467 (8.0%) | 555 (11.3%) |
| 8:30 AM to 8:59 AM | 180 (3.1%) | 151 (3.1%) |
| 9:00 AM to 9:59 AM | 198 (3.4%) | 241 (4.9%) |
| 10:00 AM to 10:59 AM | 36 (0.6%) | 111 (2.3%) |
| 11:00 AM to 11:59 AM | 20 (0.3%) | 58 (1.2%) |
| 12:00 PM to 3:59 PM | 372 (6.3%) | 425 (8.7%) |
| 4:00 PM to 11:59 PM | 419 (7.1%) | 482 (9.8%) |
| Total | 5,875 (100.0%) | 4,899 (100.0%) |
Housing Occupancy in Carroll County
Occupancy by Ownership in Carroll County
Of the total 11,355 dwellings in Carroll County, owner-occupied units account for 8,695 (76.6%), while renter-occupied units make up 2,660 (23.4%).
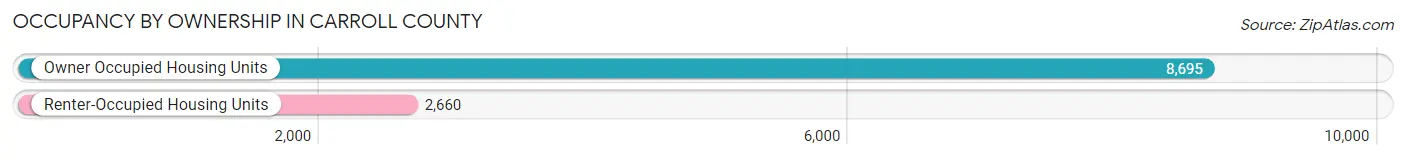
| Occupancy | # Housing Units | % Housing Units |
| Owner Occupied Housing Units | 8,695 | 76.6% |
| Renter-Occupied Housing Units | 2,660 | 23.4% |
| Total Occupied Housing Units | 11,355 | 100.0% |
Occupancy by Household Size in Carroll County
| Household Size | # Housing Units | % Housing Units |
| 1-Person Household | 3,362 | 29.6% |
| 2-Person Household | 4,262 | 37.5% |
| 3-Person Household | 1,643 | 14.5% |
| 4+ Person Household | 2,088 | 18.4% |
| Total Housing Units | 11,355 | 100.0% |
Occupancy by Ownership by Household Size in Carroll County
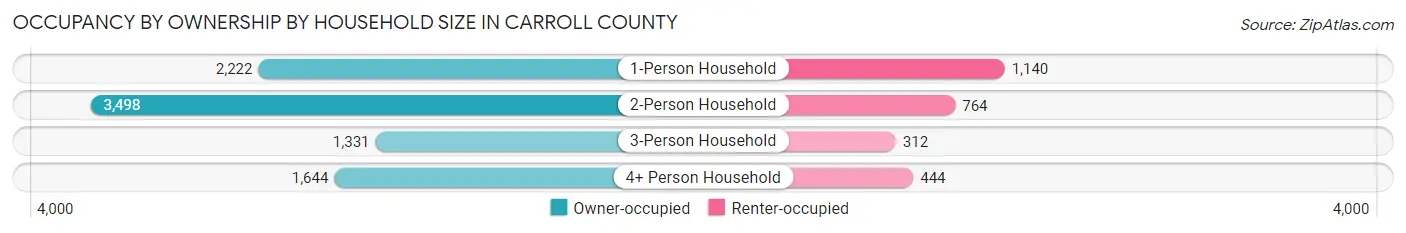
| Household Size | Owner-occupied | Renter-occupied |
| 1-Person Household | 2,222 (66.1%) | 1,140 (33.9%) |
| 2-Person Household | 3,498 (82.1%) | 764 (17.9%) |
| 3-Person Household | 1,331 (81.0%) | 312 (19.0%) |
| 4+ Person Household | 1,644 (78.7%) | 444 (21.3%) |
| Total Housing Units | 8,695 (76.6%) | 2,660 (23.4%) |
Occupancy by Educational Attainment in Carroll County
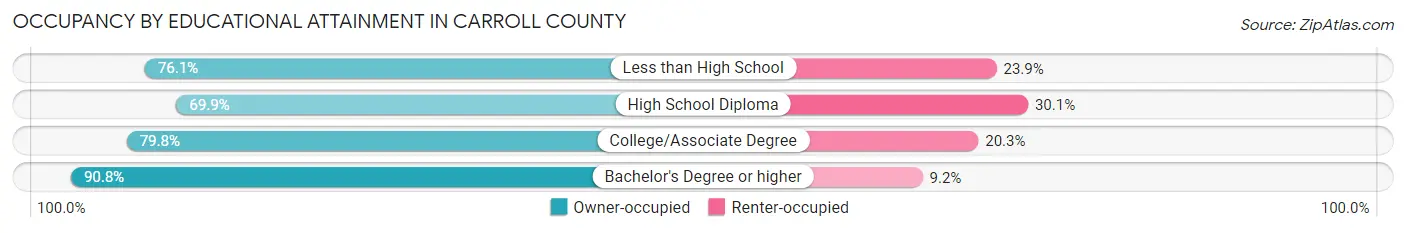
| Household Size | Owner-occupied | Renter-occupied |
| Less than High School | 785 (76.1%) | 246 (23.9%) |
| High School Diploma | 3,516 (69.9%) | 1,514 (30.1%) |
| College/Associate Degree | 2,982 (79.7%) | 757 (20.3%) |
| Bachelor's Degree or higher | 1,412 (90.8%) | 143 (9.2%) |
Occupancy by Age of Householder in Carroll County
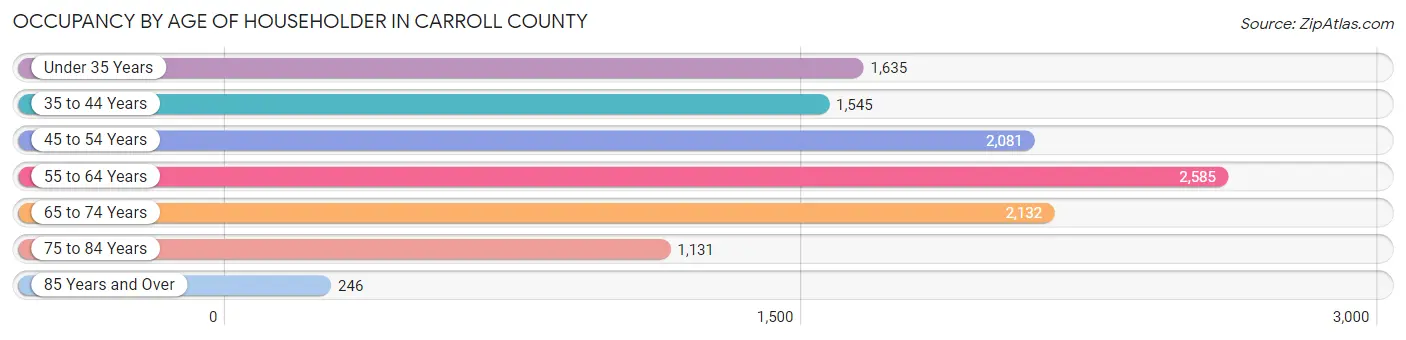
| Age Bracket | # Households | % Households |
| Under 35 Years | 1,635 | 14.4% |
| 35 to 44 Years | 1,545 | 13.6% |
| 45 to 54 Years | 2,081 | 18.3% |
| 55 to 64 Years | 2,585 | 22.8% |
| 65 to 74 Years | 2,132 | 18.8% |
| 75 to 84 Years | 1,131 | 10.0% |
| 85 Years and Over | 246 | 2.2% |
| Total | 11,355 | 100.0% |
Housing Finances in Carroll County
Median Income by Occupancy in Carroll County
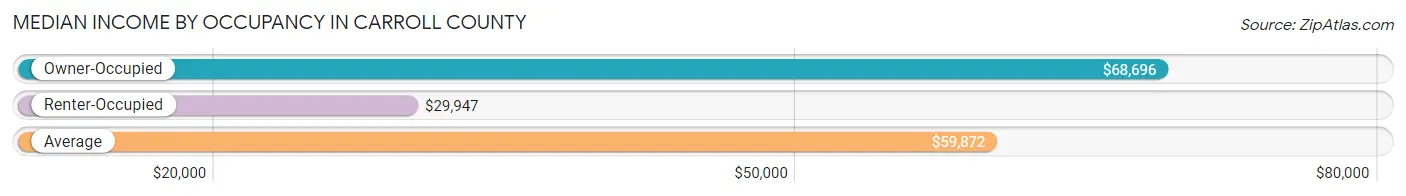
| Occupancy Type | # Households | Median Income |
| Owner-Occupied | 8,695 (76.6%) | $68,696 |
| Renter-Occupied | 2,660 (23.4%) | $29,947 |
| Average | 11,355 (100.0%) | $59,872 |
Occupancy by Householder Income Bracket in Carroll County
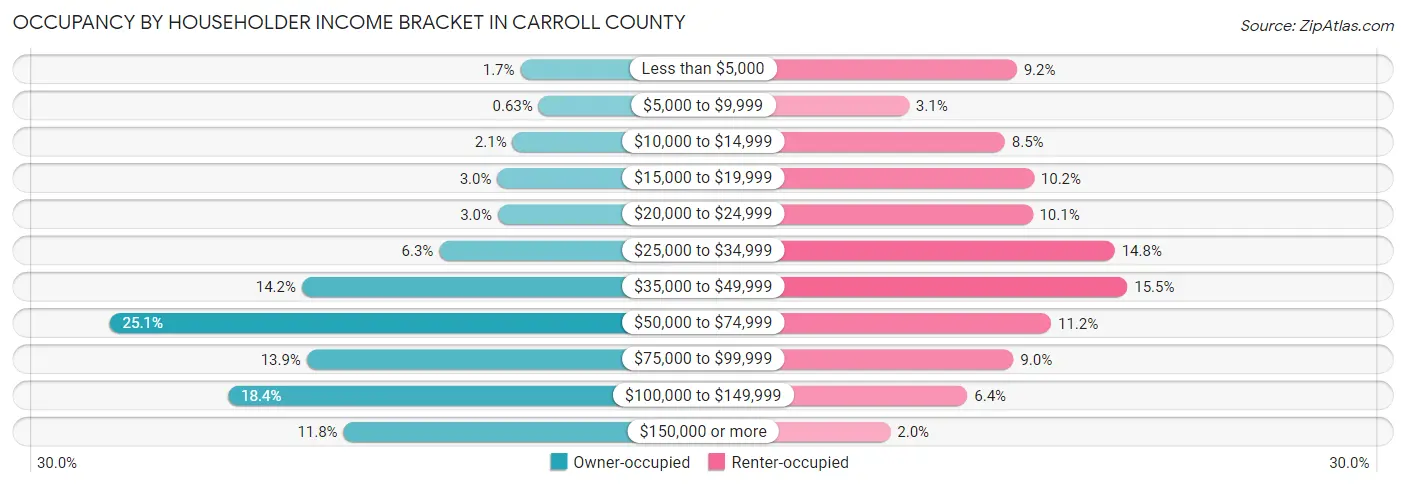
| Income Bracket | Owner-occupied | Renter-occupied |
| Less than $5,000 | 145 (1.7%) | 245 (9.2%) |
| $5,000 to $9,999 | 55 (0.6%) | 81 (3.0%) |
| $10,000 to $14,999 | 184 (2.1%) | 227 (8.5%) |
| $15,000 to $19,999 | 260 (3.0%) | 271 (10.2%) |
| $20,000 to $24,999 | 257 (3.0%) | 269 (10.1%) |
| $25,000 to $34,999 | 549 (6.3%) | 394 (14.8%) |
| $35,000 to $49,999 | 1,231 (14.2%) | 413 (15.5%) |
| $50,000 to $74,999 | 2,186 (25.1%) | 297 (11.2%) |
| $75,000 to $99,999 | 1,207 (13.9%) | 240 (9.0%) |
| $100,000 to $149,999 | 1,597 (18.4%) | 170 (6.4%) |
| $150,000 or more | 1,024 (11.8%) | 53 (2.0%) |
| Total | 8,695 (100.0%) | 2,660 (100.0%) |
Monthly Housing Cost Tiers in Carroll County
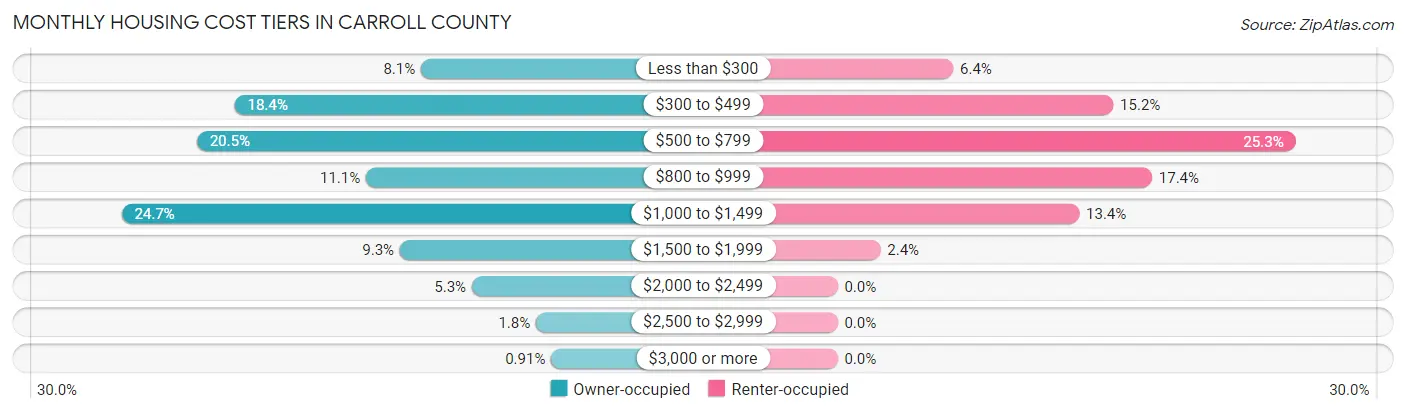
| Monthly Cost | Owner-occupied | Renter-occupied |
| Less than $300 | 704 (8.1%) | 170 (6.4%) |
| $300 to $499 | 1,600 (18.4%) | 405 (15.2%) |
| $500 to $799 | 1,782 (20.5%) | 673 (25.3%) |
| $800 to $999 | 969 (11.1%) | 462 (17.4%) |
| $1,000 to $1,499 | 2,143 (24.6%) | 355 (13.4%) |
| $1,500 to $1,999 | 806 (9.3%) | 63 (2.4%) |
| $2,000 to $2,499 | 460 (5.3%) | 0 (0.0%) |
| $2,500 to $2,999 | 152 (1.8%) | 0 (0.0%) |
| $3,000 or more | 79 (0.9%) | 0 (0.0%) |
| Total | 8,695 (100.0%) | 2,660 (100.0%) |
Physical Housing Characteristics in Carroll County
Housing Structures in Carroll County
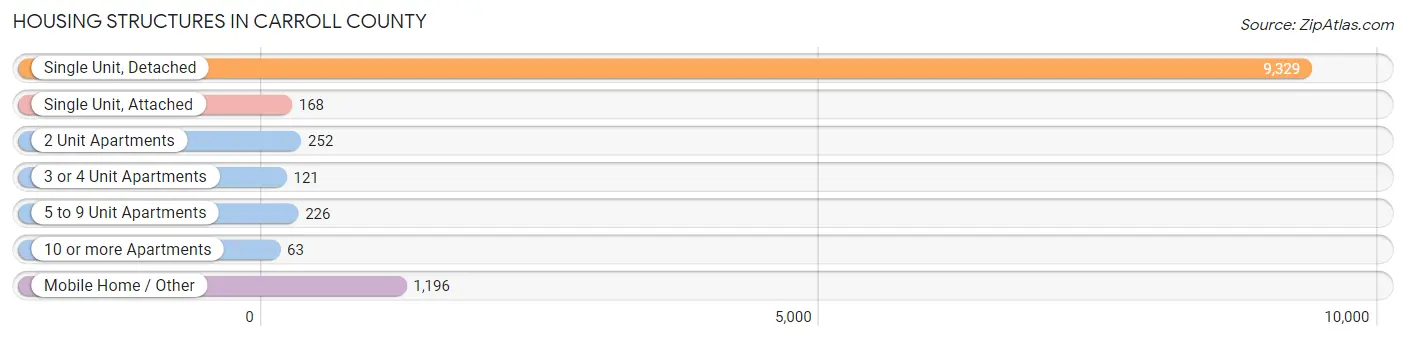
| Structure Type | # Housing Units | % Housing Units |
| Single Unit, Detached | 9,329 | 82.2% |
| Single Unit, Attached | 168 | 1.5% |
| 2 Unit Apartments | 252 | 2.2% |
| 3 or 4 Unit Apartments | 121 | 1.1% |
| 5 to 9 Unit Apartments | 226 | 2.0% |
| 10 or more Apartments | 63 | 0.5% |
| Mobile Home / Other | 1,196 | 10.5% |
| Total | 11,355 | 100.0% |
Housing Structures by Occupancy in Carroll County
| Structure Type | Owner-occupied | Renter-occupied |
| Single Unit, Detached | 7,724 (82.8%) | 1,605 (17.2%) |
| Single Unit, Attached | 145 (86.3%) | 23 (13.7%) |
| 2 Unit Apartments | 33 (13.1%) | 219 (86.9%) |
| 3 or 4 Unit Apartments | 9 (7.4%) | 112 (92.6%) |
| 5 to 9 Unit Apartments | 9 (4.0%) | 217 (96.0%) |
| 10 or more Apartments | 0 (0.0%) | 63 (100.0%) |
| Mobile Home / Other | 775 (64.8%) | 421 (35.2%) |
| Total | 8,695 (76.6%) | 2,660 (23.4%) |
Housing Structures by Number of Rooms in Carroll County
| Number of Rooms | Owner-occupied | Renter-occupied |
| 1 Room | 7 (0.1%) | 48 (1.8%) |
| 2 or 3 Rooms | 133 (1.5%) | 559 (21.0%) |
| 4 or 5 Rooms | 2,360 (27.1%) | 1,104 (41.5%) |
| 6 or 7 Rooms | 4,147 (47.7%) | 671 (25.2%) |
| 8 or more Rooms | 2,048 (23.5%) | 278 (10.4%) |
| Total | 8,695 (100.0%) | 2,660 (100.0%) |
Housing Structure by Heating Type in Carroll County
| Heating Type | Owner-occupied | Renter-occupied |
| Utility Gas | 3,426 (39.4%) | 802 (30.1%) |
| Bottled, Tank, or LP Gas | 1,049 (12.1%) | 261 (9.8%) |
| Electricity | 1,892 (21.8%) | 1,010 (38.0%) |
| Fuel Oil or Kerosene | 1,010 (11.6%) | 338 (12.7%) |
| Coal or Coke | 90 (1.0%) | 12 (0.4%) |
| All other Fuels | 1,188 (13.7%) | 237 (8.9%) |
| No Fuel Used | 40 (0.5%) | 0 (0.0%) |
| Total | 8,695 (100.0%) | 2,660 (100.0%) |
Household Vehicle Usage in Carroll County
| Vehicles per Household | Owner-occupied | Renter-occupied |
| No Vehicle | 510 (5.9%) | 283 (10.6%) |
| 1 Vehicle | 1,798 (20.7%) | 1,346 (50.6%) |
| 2 Vehicles | 3,449 (39.7%) | 733 (27.6%) |
| 3 or more Vehicles | 2,938 (33.8%) | 298 (11.2%) |
| Total | 8,695 (100.0%) | 2,660 (100.0%) |
Real Estate & Mortgages in Carroll County
Real Estate and Mortgage Overview in Carroll County
| Characteristic | Without Mortgage | With Mortgage |
| Housing Units | 3,802 | 4,893 |
| Median Property Value | $142,500 | $165,900 |
| Median Household Income | $56,392 | $685 |
| Monthly Housing Costs | $455 | $79 |
| Real Estate Taxes | $1,411 | $66 |
Property Value by Mortgage Status in Carroll County
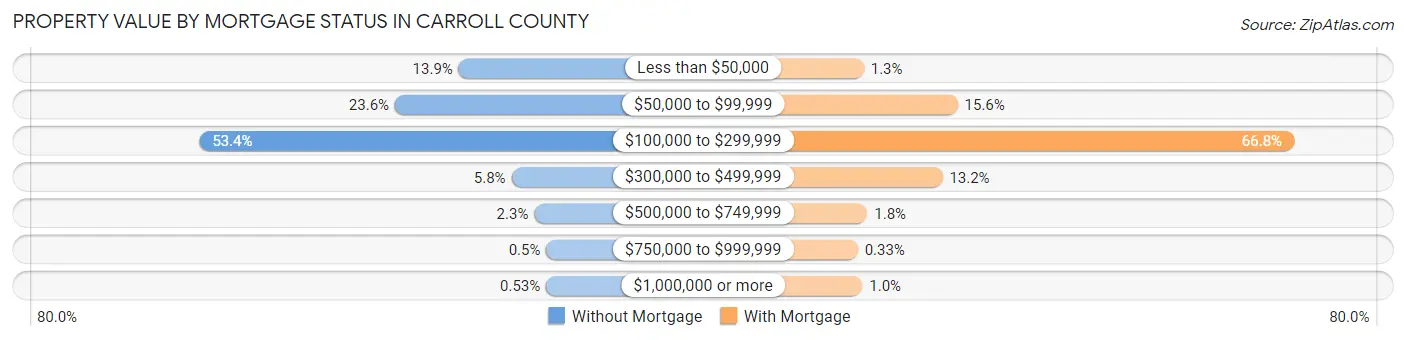
| Property Value | Without Mortgage | With Mortgage |
| Less than $50,000 | 527 (13.9%) | 61 (1.3%) |
| $50,000 to $99,999 | 896 (23.6%) | 761 (15.5%) |
| $100,000 to $299,999 | 2,030 (53.4%) | 3,268 (66.8%) |
| $300,000 to $499,999 | 221 (5.8%) | 648 (13.2%) |
| $500,000 to $749,999 | 89 (2.3%) | 88 (1.8%) |
| $750,000 to $999,999 | 19 (0.5%) | 16 (0.3%) |
| $1,000,000 or more | 20 (0.5%) | 51 (1.0%) |
| Total | 3,802 (100.0%) | 4,893 (100.0%) |
Household Income by Mortgage Status in Carroll County
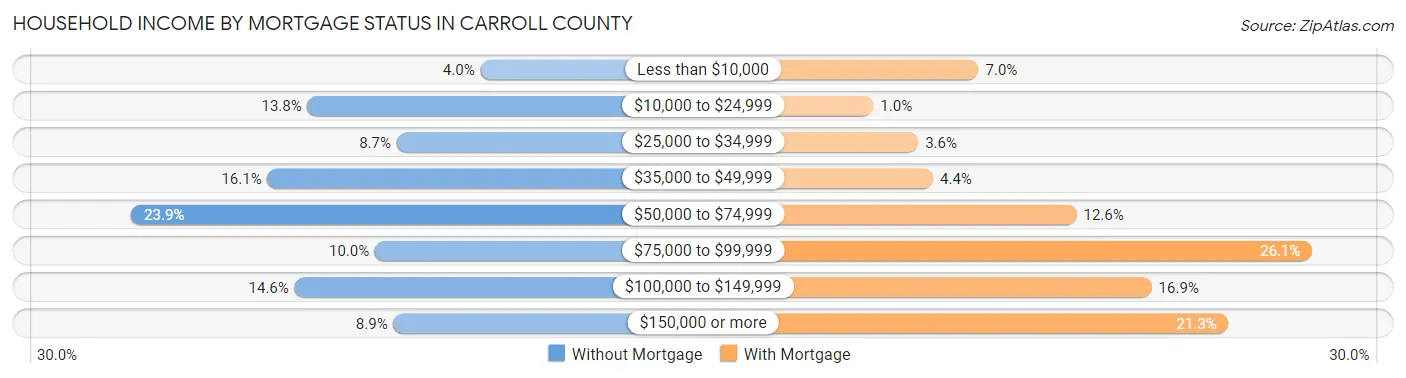
| Household Income | Without Mortgage | With Mortgage |
| Less than $10,000 | 150 (4.0%) | 344 (7.0%) |
| $10,000 to $24,999 | 526 (13.8%) | 50 (1.0%) |
| $25,000 to $34,999 | 332 (8.7%) | 175 (3.6%) |
| $35,000 to $49,999 | 613 (16.1%) | 217 (4.4%) |
| $50,000 to $74,999 | 909 (23.9%) | 618 (12.6%) |
| $75,000 to $99,999 | 379 (10.0%) | 1,277 (26.1%) |
| $100,000 to $149,999 | 554 (14.6%) | 828 (16.9%) |
| $150,000 or more | 339 (8.9%) | 1,043 (21.3%) |
| Total | 3,802 (100.0%) | 4,893 (100.0%) |
Property Value to Household Income Ratio in Carroll County
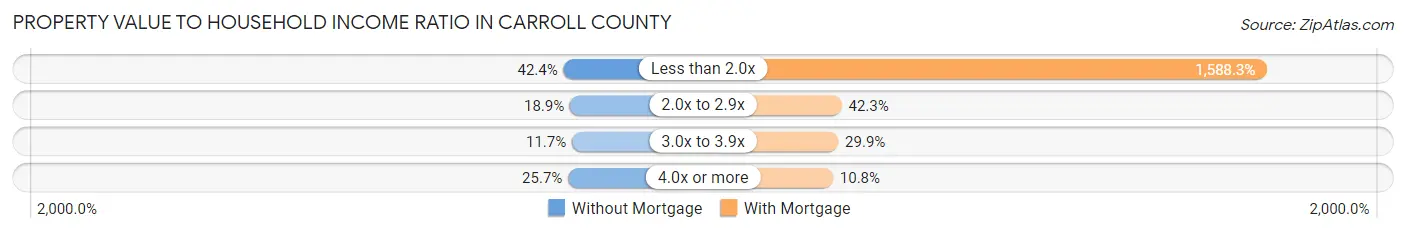
| Value-to-Income Ratio | Without Mortgage | With Mortgage |
| Less than 2.0x | 1,610 (42.3%) | 77,716 (1,588.3%) |
| 2.0x to 2.9x | 719 (18.9%) | 2,069 (42.3%) |
| 3.0x to 3.9x | 444 (11.7%) | 1,463 (29.9%) |
| 4.0x or more | 978 (25.7%) | 527 (10.8%) |
| Total | 3,802 (100.0%) | 4,893 (100.0%) |
Real Estate Taxes by Mortgage Status in Carroll County
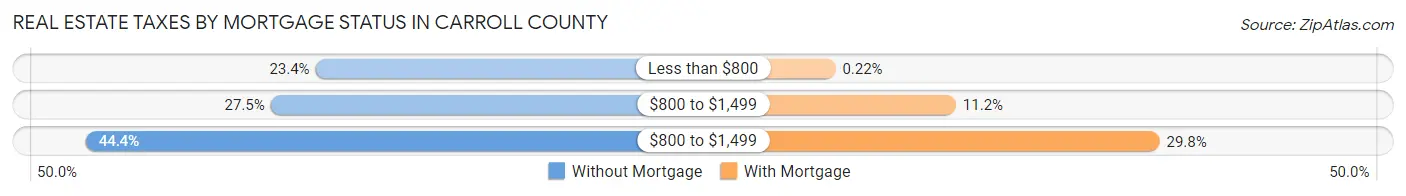
| Property Taxes | Without Mortgage | With Mortgage |
| Less than $800 | 891 (23.4%) | 11 (0.2%) |
| $800 to $1,499 | 1,047 (27.5%) | 549 (11.2%) |
| $800 to $1,499 | 1,688 (44.4%) | 1,459 (29.8%) |
| Total | 3,802 (100.0%) | 4,893 (100.0%) |
Health & Disability in Carroll County
Health Insurance Coverage by Age in Carroll County
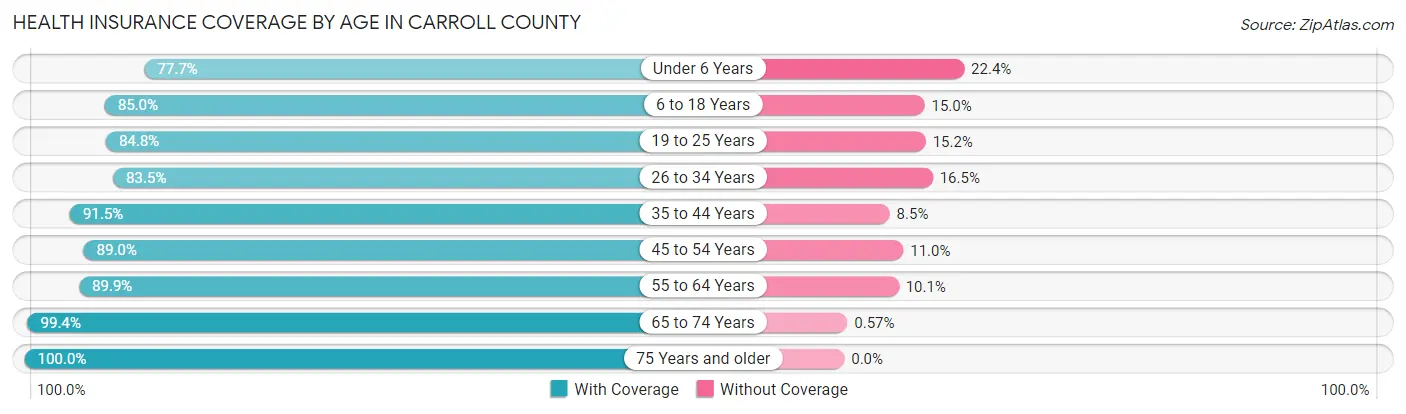
| Age Bracket | With Coverage | Without Coverage |
| Under 6 Years | 1,397 (77.6%) | 402 (22.4%) |
| 6 to 18 Years | 3,497 (85.0%) | 615 (15.0%) |
| 19 to 25 Years | 1,609 (84.8%) | 288 (15.2%) |
| 26 to 34 Years | 2,077 (83.5%) | 410 (16.5%) |
| 35 to 44 Years | 2,629 (91.5%) | 243 (8.5%) |
| 45 to 54 Years | 3,046 (89.0%) | 377 (11.0%) |
| 55 to 64 Years | 3,829 (89.9%) | 432 (10.1%) |
| 65 to 74 Years | 3,470 (99.4%) | 20 (0.6%) |
| 75 Years and older | 2,165 (100.0%) | 0 (0.0%) |
| Total | 23,719 (89.5%) | 2,787 (10.5%) |
Health Insurance Coverage by Citizenship Status in Carroll County
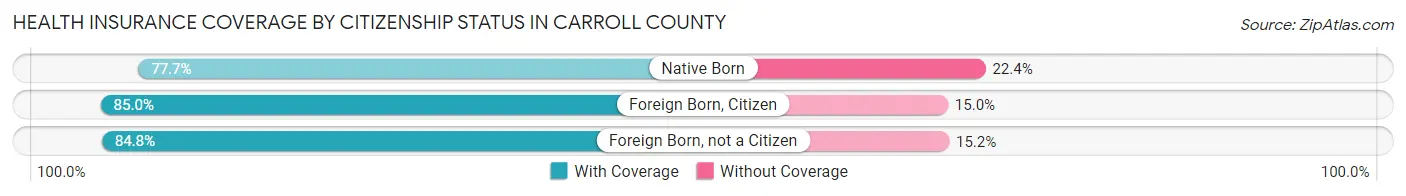
| Citizenship Status | With Coverage | Without Coverage |
| Native Born | 1,397 (77.6%) | 402 (22.4%) |
| Foreign Born, Citizen | 3,497 (85.0%) | 615 (15.0%) |
| Foreign Born, not a Citizen | 1,609 (84.8%) | 288 (15.2%) |
Health Insurance Coverage by Household Income in Carroll County
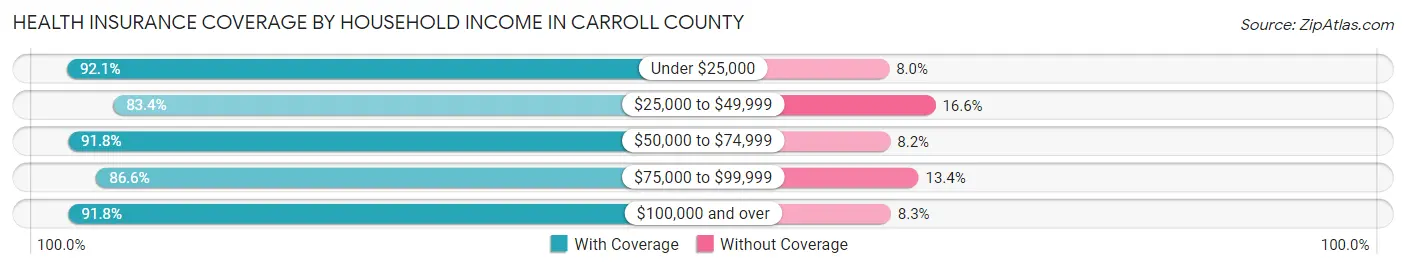
| Household Income | With Coverage | Without Coverage |
| Under $25,000 | 2,883 (92.0%) | 249 (8.0%) |
| $25,000 to $49,999 | 4,236 (83.4%) | 844 (16.6%) |
| $50,000 to $74,999 | 5,063 (91.8%) | 450 (8.2%) |
| $75,000 to $99,999 | 3,292 (86.6%) | 511 (13.4%) |
| $100,000 and over | 8,103 (91.7%) | 729 (8.3%) |
Public vs Private Health Insurance Coverage by Age in Carroll County
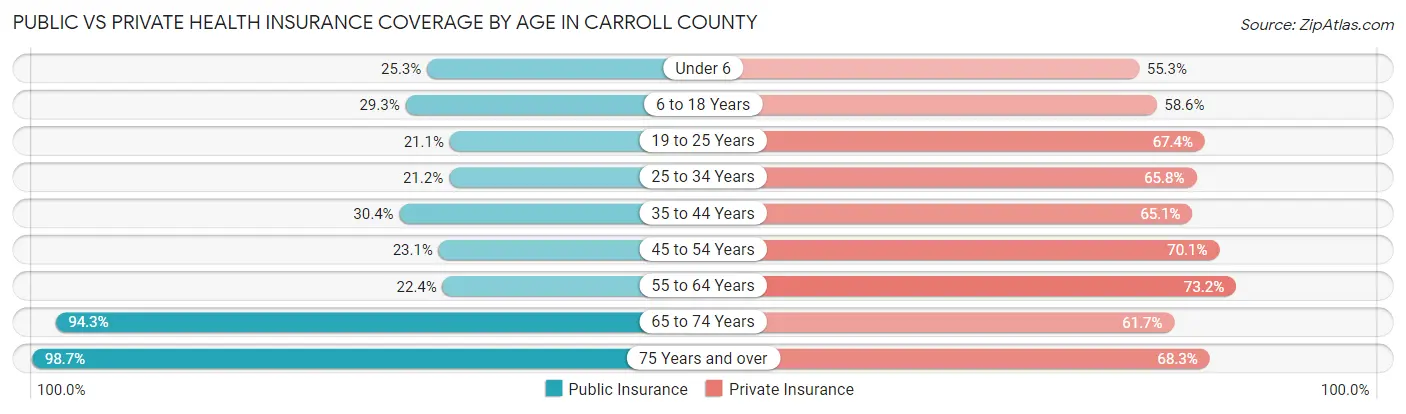
| Age Bracket | Public Insurance | Private Insurance |
| Under 6 | 455 (25.3%) | 995 (55.3%) |
| 6 to 18 Years | 1,205 (29.3%) | 2,408 (58.6%) |
| 19 to 25 Years | 400 (21.1%) | 1,278 (67.4%) |
| 25 to 34 Years | 528 (21.2%) | 1,636 (65.8%) |
| 35 to 44 Years | 874 (30.4%) | 1,869 (65.1%) |
| 45 to 54 Years | 792 (23.1%) | 2,399 (70.1%) |
| 55 to 64 Years | 955 (22.4%) | 3,118 (73.2%) |
| 65 to 74 Years | 3,291 (94.3%) | 2,154 (61.7%) |
| 75 Years and over | 2,136 (98.7%) | 1,478 (68.3%) |
| Total | 10,636 (40.1%) | 17,335 (65.4%) |
Disability Status by Sex by Age in Carroll County
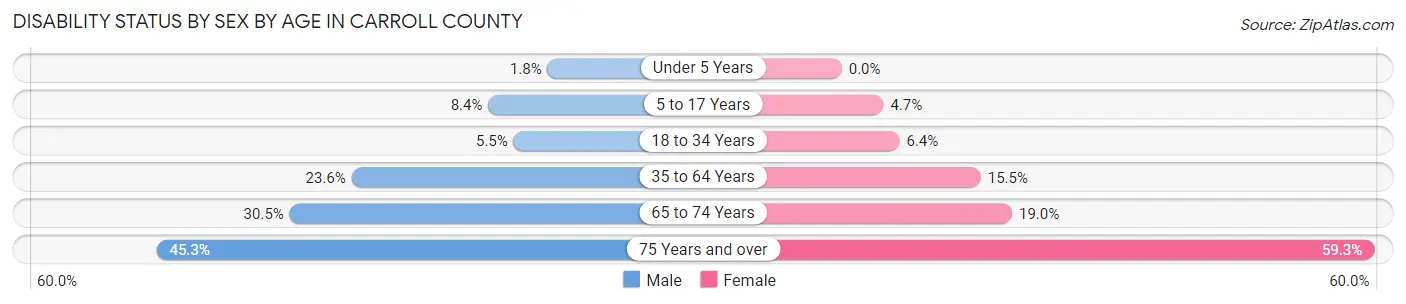
| Age Bracket | Male | Female |
| Under 5 Years | 12 (1.8%) | 0 (0.0%) |
| 5 to 17 Years | 181 (8.4%) | 92 (4.6%) |
| 18 to 34 Years | 139 (5.5%) | 148 (6.4%) |
| 35 to 64 Years | 1,281 (23.6%) | 793 (15.5%) |
| 65 to 74 Years | 538 (30.5%) | 327 (19.0%) |
| 75 Years and over | 439 (45.3%) | 709 (59.3%) |
Disability Class by Sex by Age in Carroll County
Disability Class: Hearing Difficulty
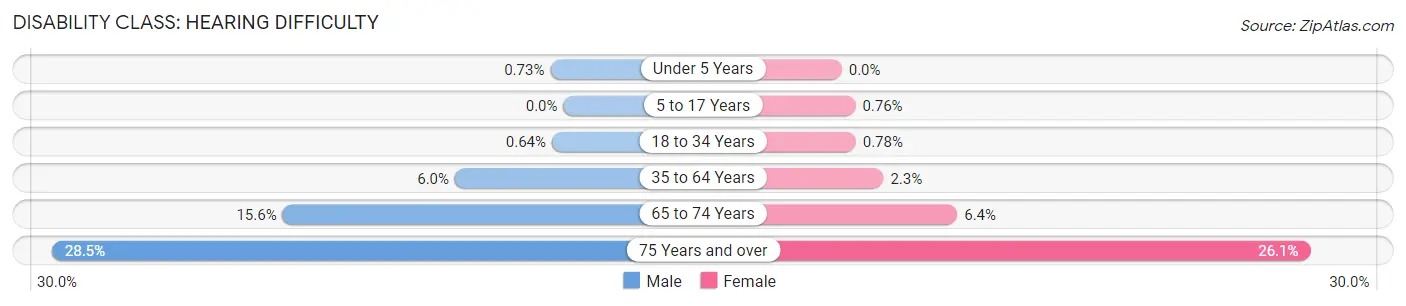
| Age Bracket | Male | Female |
| Under 5 Years | 5 (0.7%) | 0 (0.0%) |
| 5 to 17 Years | 0 (0.0%) | 15 (0.8%) |
| 18 to 34 Years | 16 (0.6%) | 18 (0.8%) |
| 35 to 64 Years | 328 (6.0%) | 119 (2.3%) |
| 65 to 74 Years | 276 (15.6%) | 111 (6.4%) |
| 75 Years and over | 276 (28.5%) | 312 (26.1%) |
Disability Class: Vision Difficulty
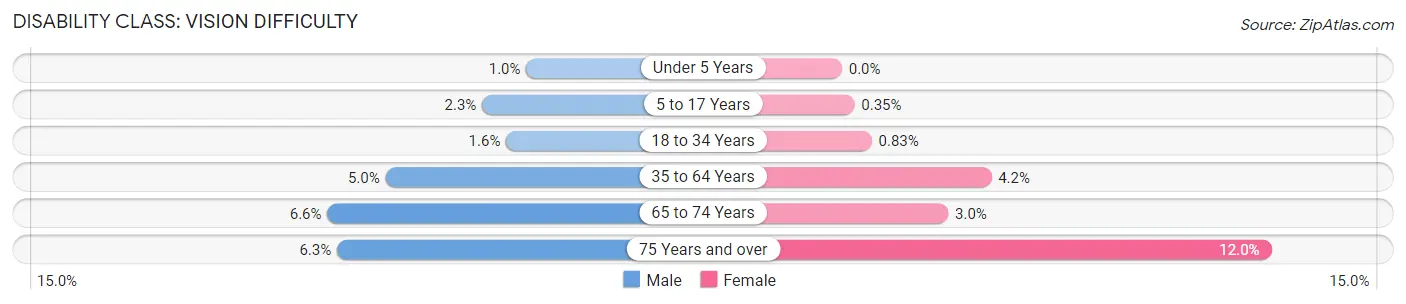
| Age Bracket | Male | Female |
| Under 5 Years | 7 (1.0%) | 0 (0.0%) |
| 5 to 17 Years | 49 (2.3%) | 7 (0.4%) |
| 18 to 34 Years | 40 (1.6%) | 19 (0.8%) |
| 35 to 64 Years | 269 (5.0%) | 213 (4.2%) |
| 65 to 74 Years | 116 (6.6%) | 51 (3.0%) |
| 75 Years and over | 61 (6.3%) | 143 (12.0%) |
Disability Class: Cognitive Difficulty
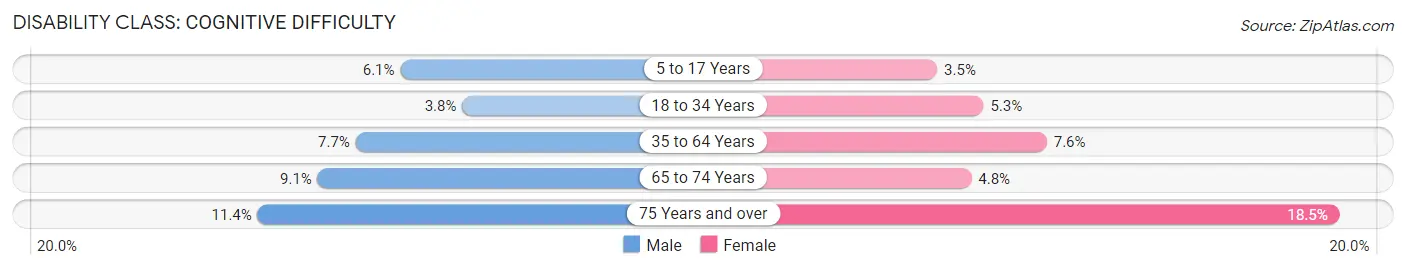
| Age Bracket | Male | Female |
| 5 to 17 Years | 131 (6.0%) | 70 (3.5%) |
| 18 to 34 Years | 94 (3.7%) | 121 (5.3%) |
| 35 to 64 Years | 419 (7.7%) | 390 (7.6%) |
| 65 to 74 Years | 161 (9.1%) | 83 (4.8%) |
| 75 Years and over | 110 (11.4%) | 221 (18.5%) |
Disability Class: Ambulatory Difficulty
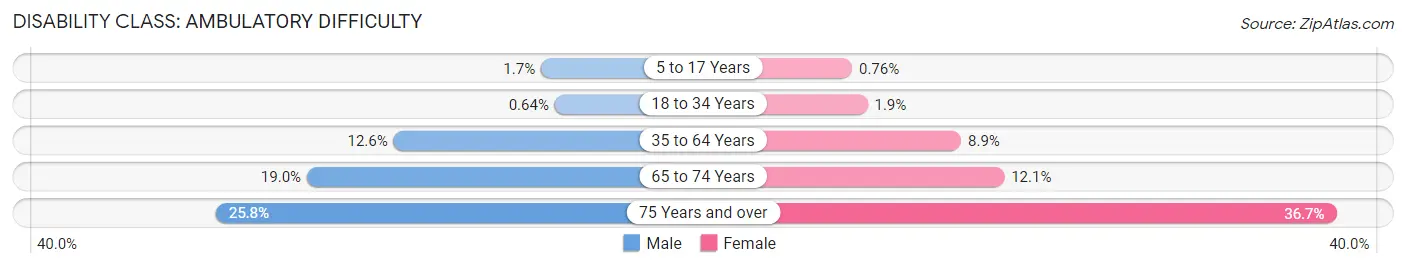
| Age Bracket | Male | Female |
| 5 to 17 Years | 36 (1.7%) | 15 (0.8%) |
| 18 to 34 Years | 16 (0.6%) | 44 (1.9%) |
| 35 to 64 Years | 685 (12.6%) | 454 (8.9%) |
| 65 to 74 Years | 336 (19.0%) | 208 (12.1%) |
| 75 Years and over | 250 (25.8%) | 439 (36.7%) |
Disability Class: Self-Care Difficulty
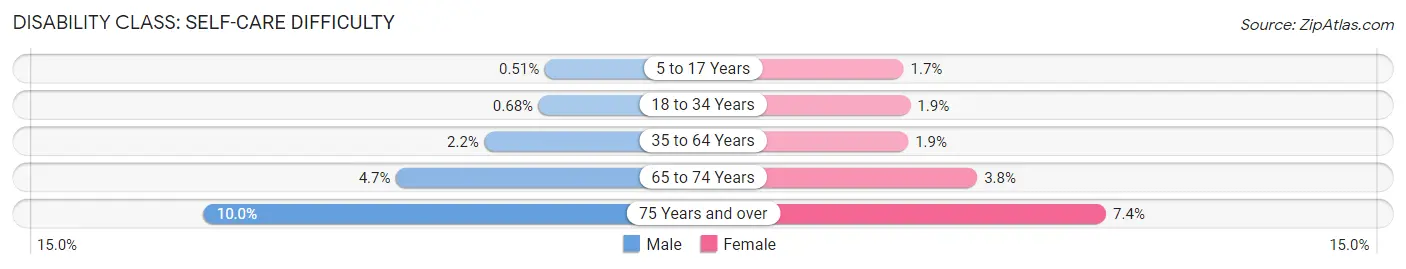
| Age Bracket | Male | Female |
| 5 to 17 Years | 11 (0.5%) | 34 (1.7%) |
| 18 to 34 Years | 17 (0.7%) | 44 (1.9%) |
| 35 to 64 Years | 119 (2.2%) | 95 (1.8%) |
| 65 to 74 Years | 82 (4.6%) | 65 (3.8%) |
| 75 Years and over | 97 (10.0%) | 88 (7.4%) |
Technology Access in Carroll County
Computing Device Access in Carroll County
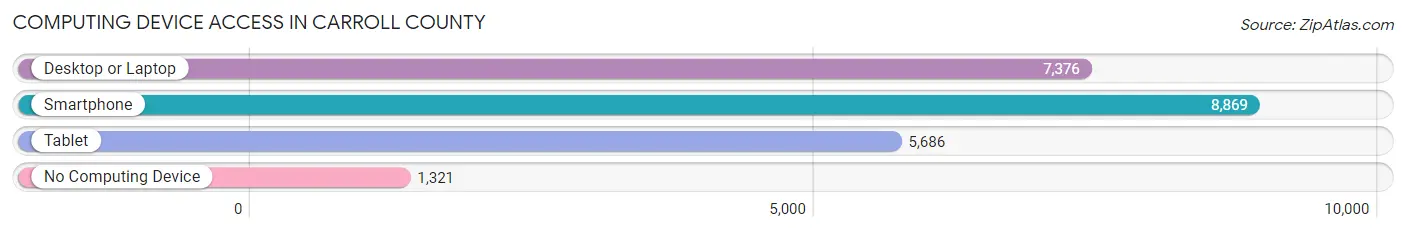
| Device Type | # Households | % Households |
| Desktop or Laptop | 7,376 | 65.0% |
| Smartphone | 8,869 | 78.1% |
| Tablet | 5,686 | 50.1% |
| No Computing Device | 1,321 | 11.6% |
| Total | 11,355 | 100.0% |
Internet Access in Carroll County
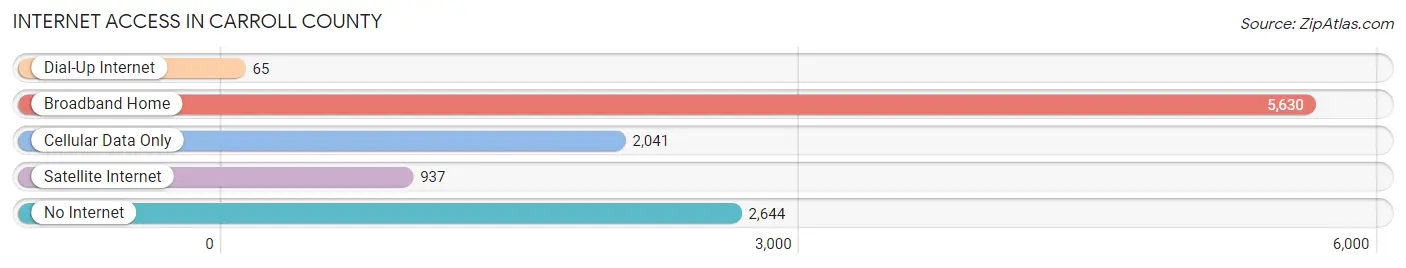
| Internet Type | # Households | % Households |
| Dial-Up Internet | 65 | 0.6% |
| Broadband Home | 5,630 | 49.6% |
| Cellular Data Only | 2,041 | 18.0% |
| Satellite Internet | 937 | 8.3% |
| No Internet | 2,644 | 23.3% |
| Total | 11,355 | 100.0% |
Carroll County Summary
Carroll County is located in the northeastern part of the state of Ohio, and is part of the greater Cleveland metropolitan area. It is bordered by Stark County to the north, Columbiana County to the east, Harrison County to the south, and Tuscarawas County to the west. The county seat is Carrollton, and the county has a total area of 437 square miles.
History
Carroll County was formed in 1833 from parts of Columbiana, Stark, and Tuscarawas counties. It was named after Charles Carroll of Carrollton, the last surviving signer of the Declaration of Independence. The county was originally settled by German and Irish immigrants, and the first settlers arrived in 1807. The county was primarily agricultural, and the main crops were wheat, corn, and oats.
In the late 19th century, the county experienced a period of industrialization, with the development of coal mining, oil production, and manufacturing. The county also became a center for the production of glass, pottery, and furniture. The county was also home to several large dairy farms.
Geography
Carroll County is located in the Appalachian Plateau region of Ohio. The terrain is mostly rolling hills, with some flat areas in the northern part of the county. The county is drained by the Tuscarawas River and its tributaries. The highest point in the county is located in the northern part of the county, at an elevation of 1,092 feet.
The climate of Carroll County is humid continental, with cold winters and hot, humid summers. The average annual temperature is around 50 degrees Fahrenheit, and the average annual precipitation is around 40 inches.
Economy
The economy of Carroll County is largely based on agriculture and manufacturing. The county is home to several large dairy farms, and the main crops are corn, wheat, and oats. The county is also home to several manufacturing companies, including a glass factory, a pottery factory, and a furniture factory.
The county also has a growing tourism industry, with several attractions, including the Carroll County Historical Society Museum, the Carroll County Fairgrounds, and the Atwood Lake Resort.
Demographics
As of the 2010 census, the population of Carroll County was 28,836. The racial makeup of the county was 95.3% White, 1.3% African American, 0.3% Native American, 0.5% Asian, 0.1% Pacific Islander, 1.2% from other races, and 1.3% from two or more races. Hispanic or Latino of any race were 2.7% of the population.
The median household income in the county was $45,845, and the median family income was $54,845. The per capita income was $21,845. About 11.3% of the population was below the poverty line.
Common Questions
What is Per Capita Income in Carroll County?
Per Capita income in Carroll County is $33,798.
What is the Median Family Income in Carroll County?
Median Family Income in Carroll County is $72,685.
What is the Median Household income in Carroll County?
Median Household Income in Carroll County is $59,872.
What is Income or Wage Gap in Carroll County?
Income or Wage Gap in Carroll County is 36.5%.
Women in Carroll County earn 63.5 cents for every dollar earned by a man.
What is Family Income Deficit in Carroll County?
Family Income Deficit in Carroll County is $12,540.
Families that are below poverty line in Carroll County earn $12,540 less on average than the poverty threshold level.
What is Inequality or Gini Index in Carroll County?
Inequality or Gini Index in Carroll County is 0.44.
What is the Total Population of Carroll County?
Total Population of Carroll County is 26,761.
What is the Total Male Population of Carroll County?
Total Male Population of Carroll County is 13,653.
What is the Total Female Population of Carroll County?
Total Female Population of Carroll County is 13,108.
What is the Ratio of Males per 100 Females in Carroll County?
There are 104.16 Males per 100 Females in Carroll County.
What is the Ratio of Females per 100 Males in Carroll County?
There are 96.01 Females per 100 Males in Carroll County.
What is the Median Population Age in Carroll County?
Median Population Age in Carroll County is 45.9 Years.
What is the Average Family Size in Carroll County
Average Family Size in Carroll County is 2.9 People.
What is the Average Household Size in Carroll County
Average Household Size in Carroll County is 2.3 People.
How Large is the Labor Force in Carroll County?
There are 12,396 People in the Labor Forcein in Carroll County.
What is the Percentage of People in the Labor Force in Carroll County?
56.3% of People are in the Labor Force in Carroll County.
What is the Unemployment Rate in Carroll County?
Unemployment Rate in Carroll County is 3.9%.