Brown County, OH Map & Demographics
Brown County Map
Brown County Overview
$31,823
PER CAPITA INCOME
$78,695
AVG FAMILY INCOME
$66,677
AVG HOUSEHOLD INCOME
39.1%
WAGE / INCOME GAP [ % ]
60.9¢/ $1
WAGE / INCOME GAP [ $ ]
$10,236
FAMILY INCOME DEFICIT
0.44
INEQUALITY / GINI INDEX
43,715
TOTAL POPULATION
21,791
MALE POPULATION
21,924
FEMALE POPULATION
99.39
MALES / 100 FEMALES
100.61
FEMALES / 100 MALES
41.9
MEDIAN AGE
3.1
AVG FAMILY SIZE
2.5
AVG HOUSEHOLD SIZE
19,948
LABOR FORCE [ PEOPLE ]
57.0%
PERCENT IN LABOR FORCE
4.4%
UNEMPLOYMENT RATE
Income in Brown County
Income Overview in Brown County
Per Capita Income in Brown County is $31,823, while median incomes of families and households are $78,695 and $66,677 respectively.
| Characteristic | Number | Measure |
| Per Capita Income | 43,715 | $31,823 |
| Median Family Income | 11,579 | $78,695 |
| Mean Family Income | 11,579 | $94,602 |
| Median Household Income | 16,958 | $66,677 |
| Mean Household Income | 16,958 | $80,682 |
| Income Deficit | 11,579 | $10,236 |
| Wage / Income Gap (%) | 43,715 | 39.10% |
| Wage / Income Gap ($) | 43,715 | 60.90¢ per $1 |
| Gini / Inequality Index | 43,715 | 0.44 |
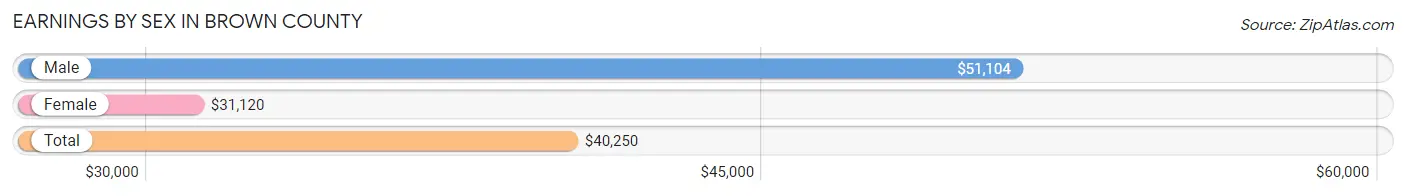
Earnings by Sex in Brown County
Average Earnings in Brown County are $40,250, $51,104 for men and $31,120 for women, a difference of 39.1%.
| Sex | Number | Average Earnings |
| Male | 10,787 (51.7%) | $51,104 |
| Female | 10,074 (48.3%) | $31,120 |
| Total | 20,861 (100.0%) | $40,250 |
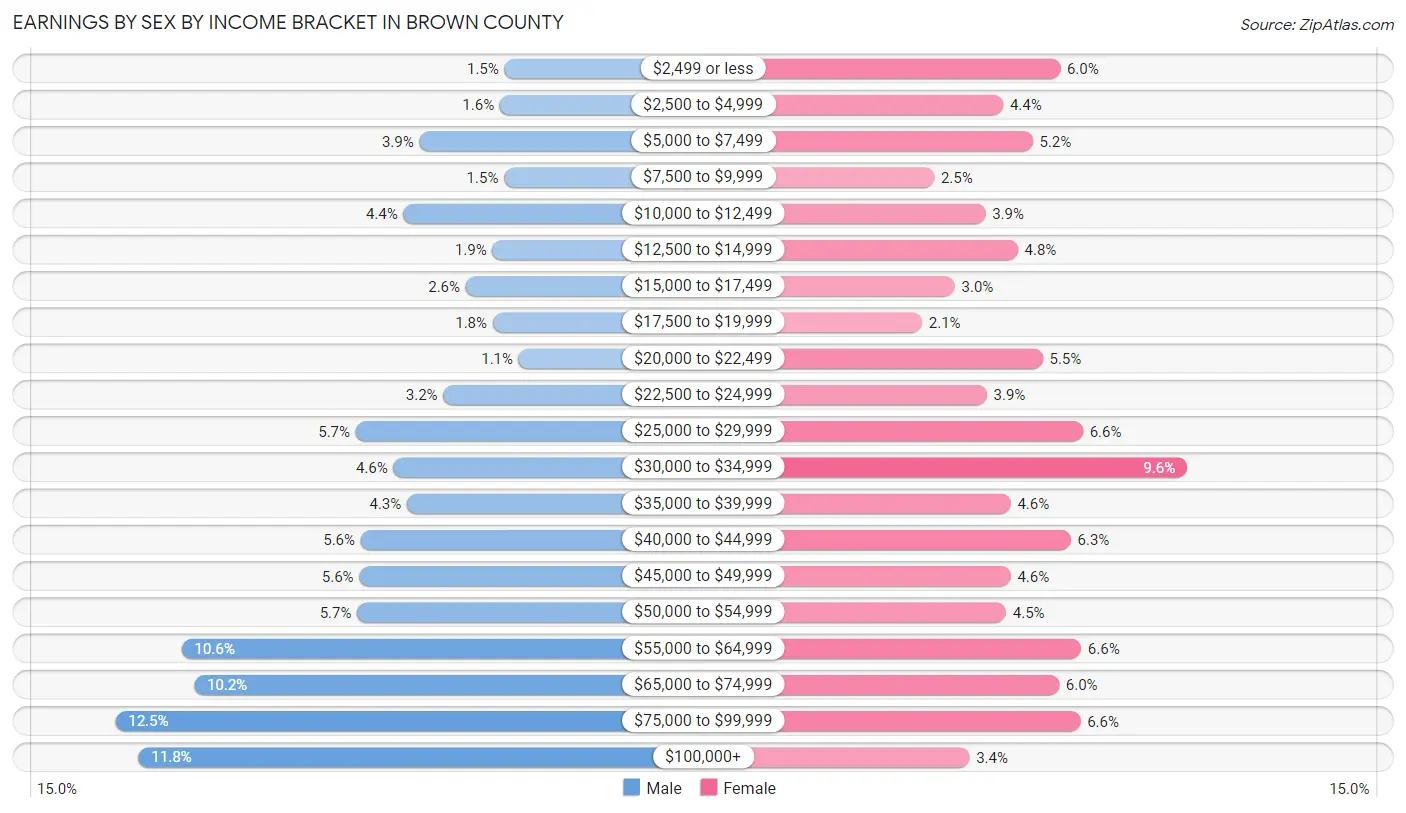
Earnings by Sex by Income Bracket in Brown County
The most common earnings brackets in Brown County are $75,000 to $99,999 for men (1,343 | 12.4%) and $30,000 to $34,999 for women (963 | 9.6%).
| Income | Male | Female |
| $2,499 or less | 163 (1.5%) | 603 (6.0%) |
| $2,500 to $4,999 | 177 (1.6%) | 442 (4.4%) |
| $5,000 to $7,499 | 421 (3.9%) | 526 (5.2%) |
| $7,500 to $9,999 | 164 (1.5%) | 247 (2.5%) |
| $10,000 to $12,499 | 469 (4.3%) | 392 (3.9%) |
| $12,500 to $14,999 | 200 (1.8%) | 484 (4.8%) |
| $15,000 to $17,499 | 281 (2.6%) | 305 (3.0%) |
| $17,500 to $19,999 | 198 (1.8%) | 213 (2.1%) |
| $20,000 to $22,499 | 120 (1.1%) | 554 (5.5%) |
| $22,500 to $24,999 | 348 (3.2%) | 396 (3.9%) |
| $25,000 to $29,999 | 614 (5.7%) | 668 (6.6%) |
| $30,000 to $34,999 | 499 (4.6%) | 963 (9.6%) |
| $35,000 to $39,999 | 458 (4.3%) | 463 (4.6%) |
| $40,000 to $44,999 | 599 (5.6%) | 634 (6.3%) |
| $45,000 to $49,999 | 603 (5.6%) | 463 (4.6%) |
| $50,000 to $54,999 | 610 (5.7%) | 450 (4.5%) |
| $55,000 to $64,999 | 1,142 (10.6%) | 663 (6.6%) |
| $65,000 to $74,999 | 1,105 (10.2%) | 600 (6.0%) |
| $75,000 to $99,999 | 1,343 (12.4%) | 661 (6.6%) |
| $100,000+ | 1,273 (11.8%) | 347 (3.4%) |
| Total | 10,787 (100.0%) | 10,074 (100.0%) |
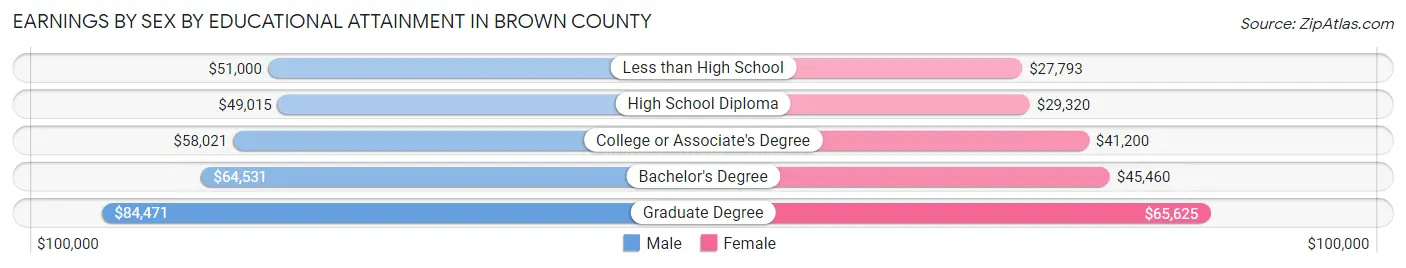
Earnings by Sex by Educational Attainment in Brown County
Average earnings in Brown County are $55,201 for men and $34,838 for women, a difference of 36.9%. Men with an educational attainment of graduate degree enjoy the highest average annual earnings of $84,471, while those with high school diploma education earn the least with $49,015. Women with an educational attainment of graduate degree earn the most with the average annual earnings of $65,625, while those with less than high school education have the smallest earnings of $27,793.
| Educational Attainment | Male Income | Female Income |
| Less than High School | $51,000 | $27,793 |
| High School Diploma | $49,015 | $29,320 |
| College or Associate's Degree | $58,021 | $41,200 |
| Bachelor's Degree | $64,531 | $45,460 |
| Graduate Degree | $84,471 | $65,625 |
| Total | $55,201 | $34,838 |
Family Income in Brown County
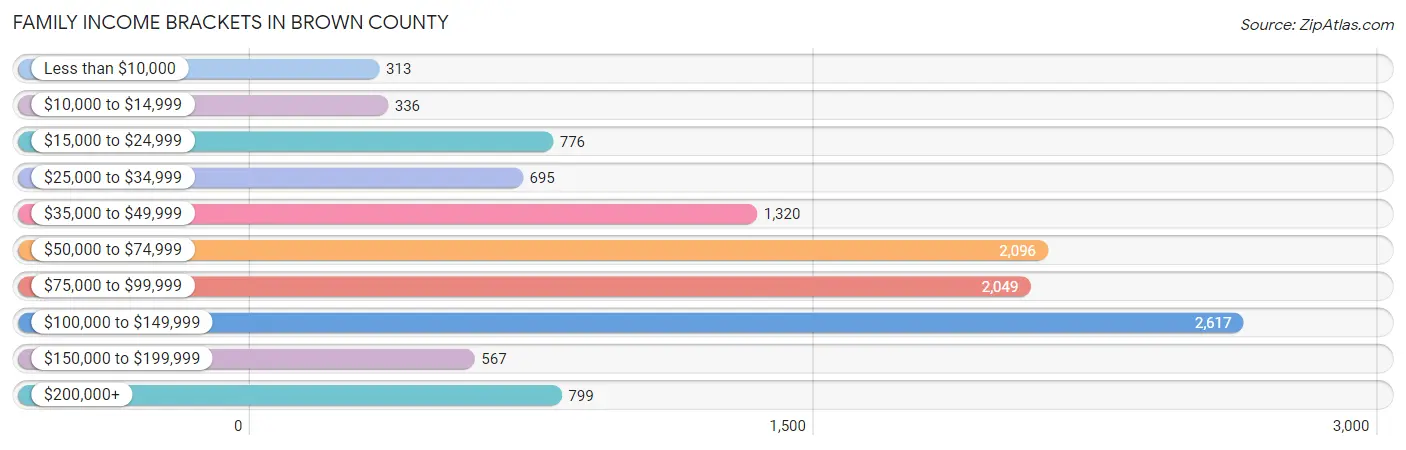
Family Income Brackets in Brown County
According to the Brown County family income data, there are 2,617 families falling into the $100,000 to $149,999 income range, which is the most common income bracket and makes up 22.6% of all families. Conversely, the less than $10,000 income bracket is the least frequent group with only 313 families (2.7%) belonging to this category.
| Income Bracket | # Families | % Families |
| Less than $10,000 | 313 | 2.7% |
| $10,000 to $14,999 | 336 | 2.9% |
| $15,000 to $24,999 | 776 | 6.7% |
| $25,000 to $34,999 | 695 | 6.0% |
| $35,000 to $49,999 | 1,320 | 11.4% |
| $50,000 to $74,999 | 2,096 | 18.1% |
| $75,000 to $99,999 | 2,049 | 17.7% |
| $100,000 to $149,999 | 2,617 | 22.6% |
| $150,000 to $199,999 | 567 | 4.9% |
| $200,000+ | 799 | 6.9% |
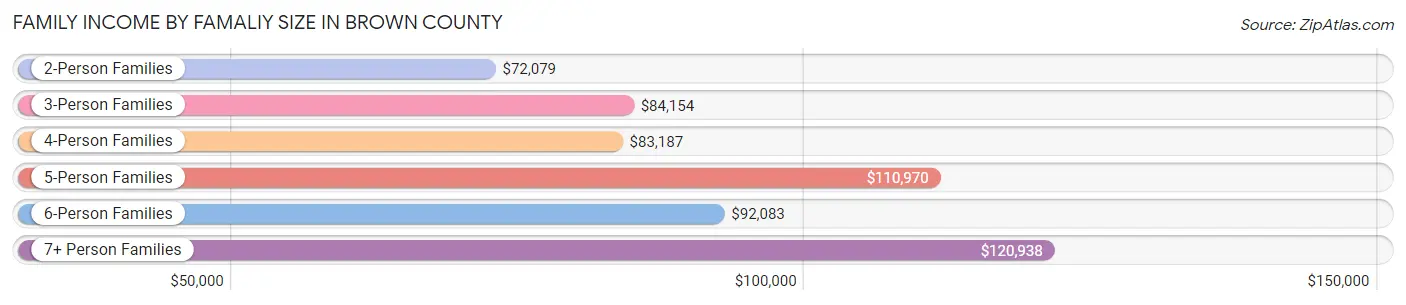
Family Income by Famaliy Size in Brown County
7+ person families (235 | 2.0%) account for the highest median family income in Brown County with $120,938 per family, while 2-person families (5,714 | 49.3%) have the highest median income of $36,040 per family member.
| Income Bracket | # Families | Median Income |
| 2-Person Families | 5,714 (49.3%) | $72,079 |
| 3-Person Families | 2,590 (22.4%) | $84,154 |
| 4-Person Families | 1,697 (14.7%) | $83,187 |
| 5-Person Families | 897 (7.7%) | $110,970 |
| 6-Person Families | 446 (3.8%) | $92,083 |
| 7+ Person Families | 235 (2.0%) | $120,938 |
| Total | 11,579 (100.0%) | $78,695 |
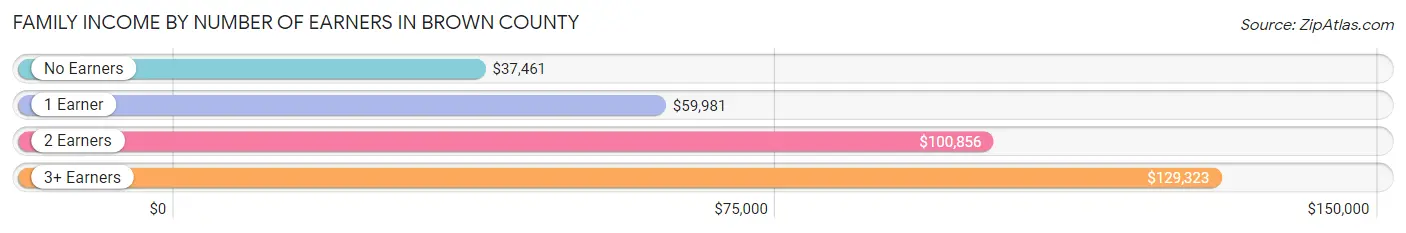
Family Income by Number of Earners in Brown County
The median family income in Brown County is $78,695, with families comprising 3+ earners (1,493) having the highest median family income of $129,323, while families with no earners (2,288) have the lowest median family income of $37,461, accounting for 12.9% and 19.8% of families, respectively.
| Number of Earners | # Families | Median Income |
| No Earners | 2,288 (19.8%) | $37,461 |
| 1 Earner | 4,001 (34.5%) | $59,981 |
| 2 Earners | 3,797 (32.8%) | $100,856 |
| 3+ Earners | 1,493 (12.9%) | $129,323 |
| Total | 11,579 (100.0%) | $78,695 |
Household Income in Brown County
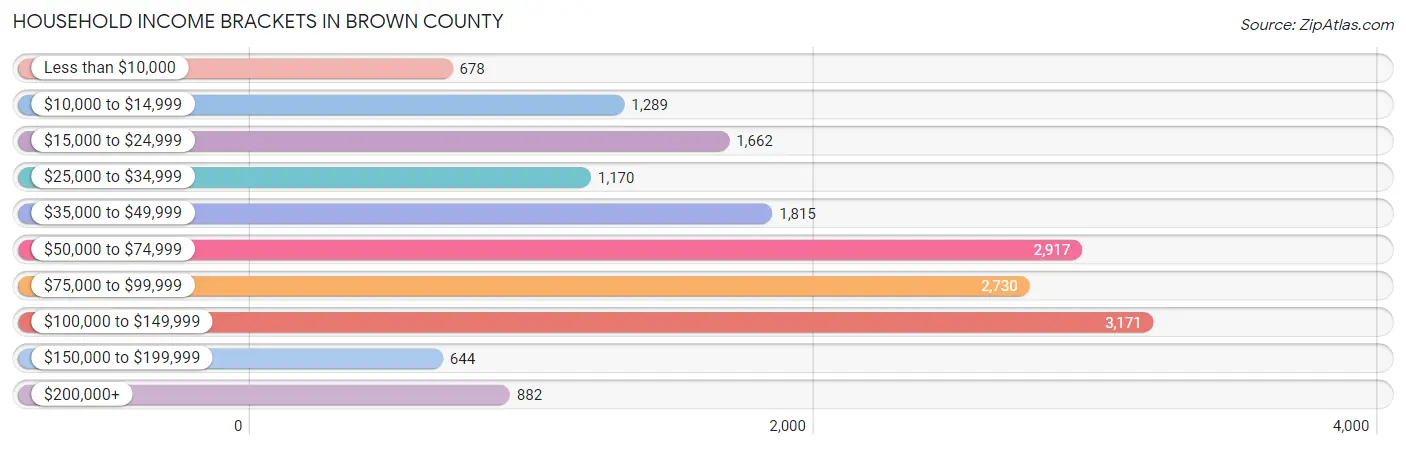
Household Income Brackets in Brown County
With 3,171 households falling in the category, the $100,000 to $149,999 income range is the most frequent in Brown County, accounting for 18.7% of all households. In contrast, only 644 households (3.8%) fall into the $150,000 to $199,999 income bracket, making it the least populous group.
| Income Bracket | # Households | % Households |
| Less than $10,000 | 678 | 4.0% |
| $10,000 to $14,999 | 1,289 | 7.6% |
| $15,000 to $24,999 | 1,662 | 9.8% |
| $25,000 to $34,999 | 1,170 | 6.9% |
| $35,000 to $49,999 | 1,815 | 10.7% |
| $50,000 to $74,999 | 2,917 | 17.2% |
| $75,000 to $99,999 | 2,730 | 16.1% |
| $100,000 to $149,999 | 3,171 | 18.7% |
| $150,000 to $199,999 | 644 | 3.8% |
| $200,000+ | 882 | 5.2% |
Household Income by Householder Age in Brown County
The median household income in Brown County is $66,677, with the highest median household income of $82,524 found in the 25 to 44 years age bracket for the primary householder. A total of 4,635 households (27.3%) fall into this category. Meanwhile, the 65+ years age bracket for the primary householder has the lowest median household income of $44,811, with 5,168 households (30.5%) in this group.
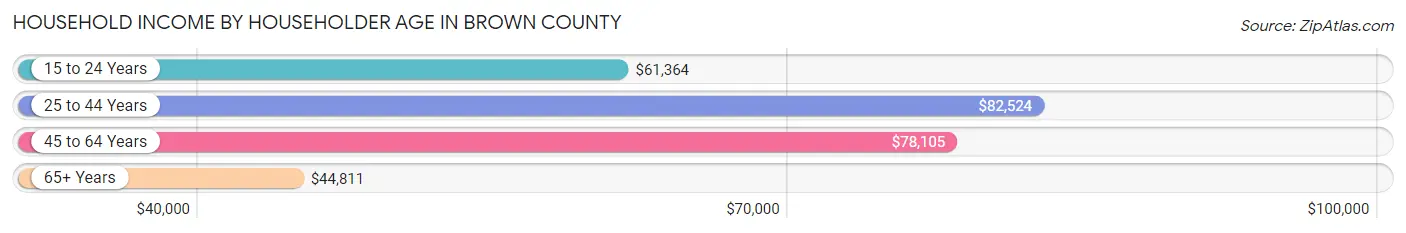
| Income Bracket | # Households | Median Income |
| 15 to 24 Years | 432 (2.5%) | $61,364 |
| 25 to 44 Years | 4,635 (27.3%) | $82,524 |
| 45 to 64 Years | 6,723 (39.7%) | $78,105 |
| 65+ Years | 5,168 (30.5%) | $44,811 |
| Total | 16,958 (100.0%) | $66,677 |
Poverty in Brown County
Income Below Poverty by Sex and Age in Brown County
With 14.3% poverty level for males and 17.5% for females among the residents of Brown County, 12 to 14 year old males and 5 year old females are the most vulnerable to poverty, with 231 males (24.4%) and 68 females (40.7%) in their respective age groups living below the poverty level.
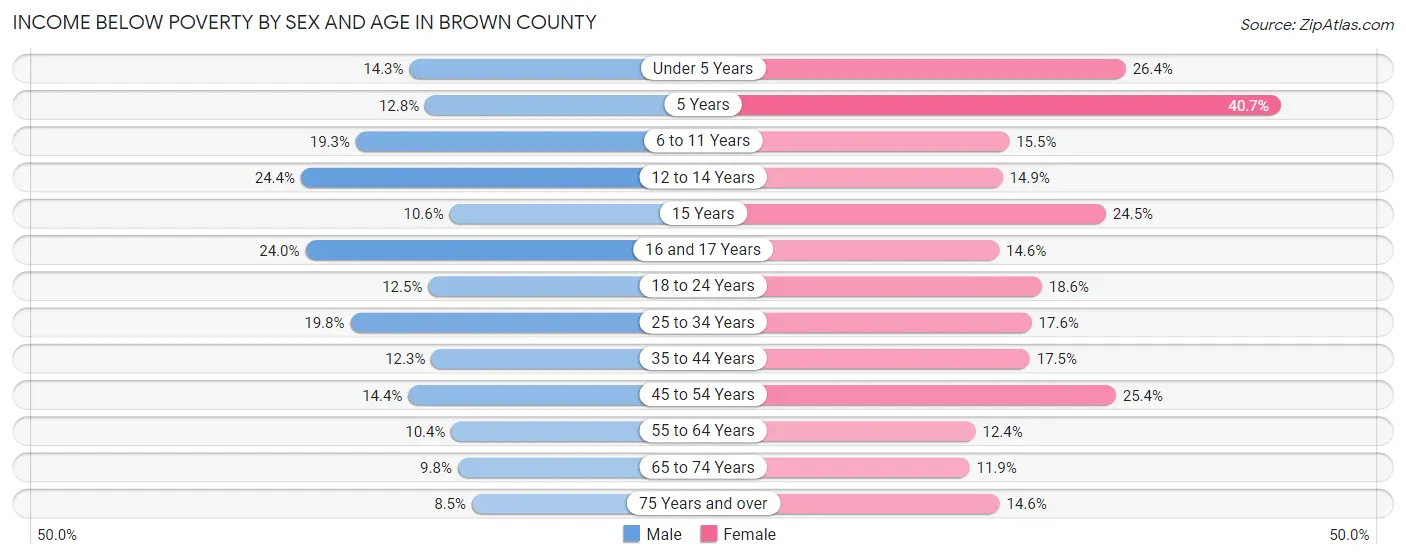
| Age Bracket | Male | Female |
| Under 5 Years | 168 (14.3%) | 331 (26.4%) |
| 5 Years | 43 (12.8%) | 68 (40.7%) |
| 6 to 11 Years | 288 (19.3%) | 248 (15.5%) |
| 12 to 14 Years | 231 (24.4%) | 139 (14.9%) |
| 15 Years | 19 (10.6%) | 100 (24.5%) |
| 16 and 17 Years | 189 (23.9%) | 68 (14.6%) |
| 18 to 24 Years | 206 (12.5%) | 296 (18.6%) |
| 25 to 34 Years | 503 (19.8%) | 441 (17.6%) |
| 35 to 44 Years | 321 (12.3%) | 447 (17.4%) |
| 45 to 54 Years | 409 (14.4%) | 702 (25.4%) |
| 55 to 64 Years | 339 (10.4%) | 402 (12.4%) |
| 65 to 74 Years | 220 (9.8%) | 281 (11.9%) |
| 75 Years and over | 101 (8.5%) | 269 (14.6%) |
| Total | 3,037 (14.3%) | 3,792 (17.5%) |
Income Above Poverty by Sex and Age in Brown County
According to the poverty statistics in Brown County, males aged 75 years and over and females aged 65 to 74 years are the age groups that are most secure financially, with 91.5% of males and 88.1% of females in these age groups living above the poverty line.
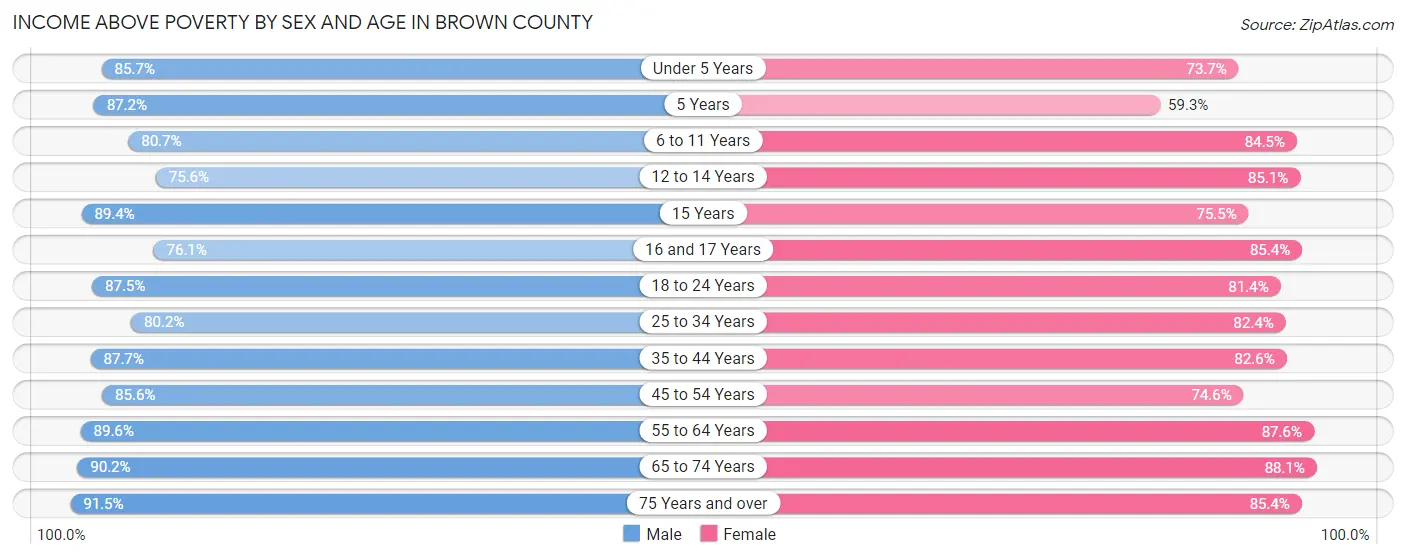
| Age Bracket | Male | Female |
| Under 5 Years | 1,008 (85.7%) | 925 (73.7%) |
| 5 Years | 292 (87.2%) | 99 (59.3%) |
| 6 to 11 Years | 1,207 (80.7%) | 1,348 (84.5%) |
| 12 to 14 Years | 717 (75.6%) | 792 (85.1%) |
| 15 Years | 161 (89.4%) | 308 (75.5%) |
| 16 and 17 Years | 600 (76.0%) | 398 (85.4%) |
| 18 to 24 Years | 1,437 (87.5%) | 1,298 (81.4%) |
| 25 to 34 Years | 2,041 (80.2%) | 2,062 (82.4%) |
| 35 to 44 Years | 2,297 (87.7%) | 2,115 (82.6%) |
| 45 to 54 Years | 2,432 (85.6%) | 2,058 (74.6%) |
| 55 to 64 Years | 2,920 (89.6%) | 2,837 (87.6%) |
| 65 to 74 Years | 2,024 (90.2%) | 2,088 (88.1%) |
| 75 Years and over | 1,089 (91.5%) | 1,569 (85.4%) |
| Total | 18,225 (85.7%) | 17,897 (82.5%) |
Income Below Poverty Among Married-Couple Families in Brown County
The poverty statistics for married-couple families in Brown County show that 7.6% or 663 of the total 8,694 families live below the poverty line. Families with 3 or 4 children have the highest poverty rate of 21.4%, comprising of 185 families. On the other hand, families with no children have the lowest poverty rate of 5.8%, which includes 319 families.
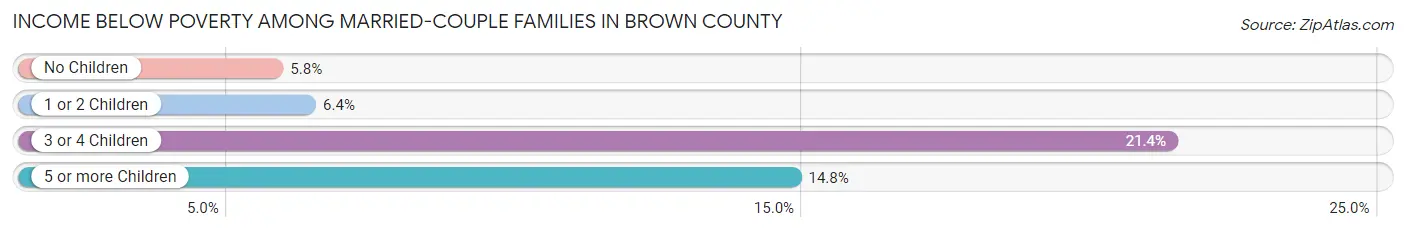
| Children | Above Poverty | Below Poverty |
| No Children | 5,190 (94.2%) | 319 (5.8%) |
| 1 or 2 Children | 2,045 (93.6%) | 139 (6.4%) |
| 3 or 4 Children | 681 (78.6%) | 185 (21.4%) |
| 5 or more Children | 115 (85.2%) | 20 (14.8%) |
| Total | 8,031 (92.4%) | 663 (7.6%) |
Income Below Poverty Among Single-Parent Households in Brown County
According to the poverty data in Brown County, 3.6% or 34 single-father households and 32.4% or 627 single-mother households are living below the poverty line. Among single-father households, those with 3 or 4 children have the highest poverty rate, with 9 households (7.8%) experiencing poverty. Likewise, among single-mother households, those with 3 or 4 children have the highest poverty rate, with 149 households (49.5%) falling below the poverty line.
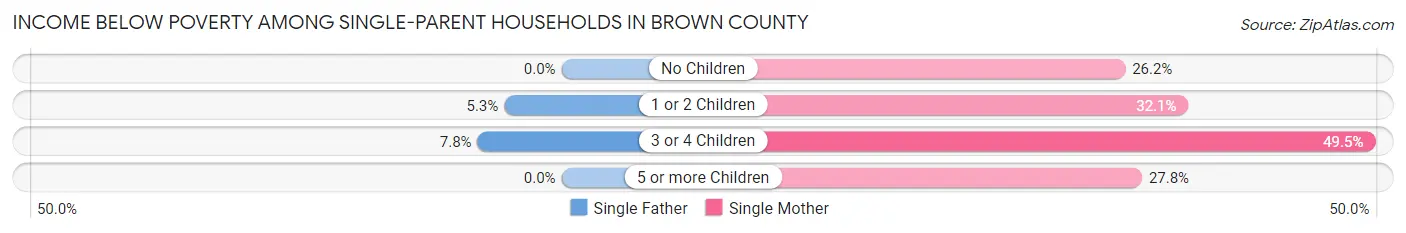
| Children | Single Father | Single Mother |
| No Children | 0 (0.0%) | 204 (26.2%) |
| 1 or 2 Children | 25 (5.3%) | 269 (32.1%) |
| 3 or 4 Children | 9 (7.8%) | 149 (49.5%) |
| 5 or more Children | 0 (0.0%) | 5 (27.8%) |
| Total | 34 (3.6%) | 627 (32.4%) |
Income Below Poverty Among Married-Couple vs Single-Parent Households in Brown County
The poverty data for Brown County shows that 663 of the married-couple family households (7.6%) and 661 of the single-parent households (22.9%) are living below the poverty level. Within the married-couple family households, those with 3 or 4 children have the highest poverty rate, with 185 households (21.4%) falling below the poverty line. Among the single-parent households, those with 3 or 4 children have the highest poverty rate, with 158 household (38.0%) living below poverty.
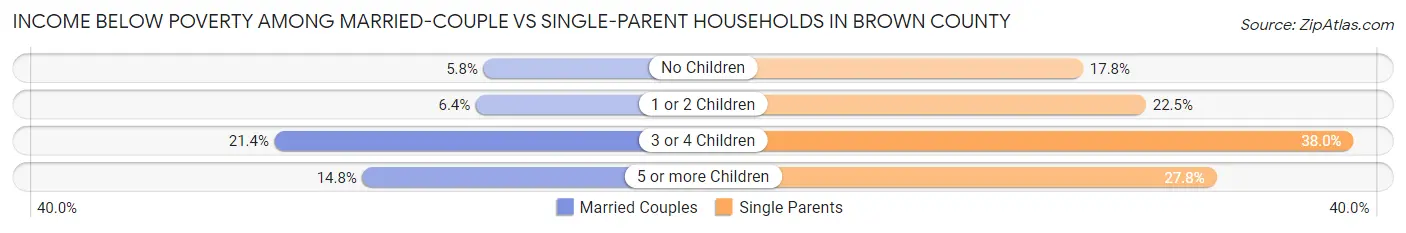
| Children | Married-Couple Families | Single-Parent Households |
| No Children | 319 (5.8%) | 204 (17.8%) |
| 1 or 2 Children | 139 (6.4%) | 294 (22.5%) |
| 3 or 4 Children | 185 (21.4%) | 158 (38.0%) |
| 5 or more Children | 20 (14.8%) | 5 (27.8%) |
| Total | 663 (7.6%) | 661 (22.9%) |
Race in Brown County
The most populous races in Brown County are White / Caucasian (42,178 | 96.5%), Two or more Races (842 | 1.9%), and Hispanic or Latino (545 | 1.3%).
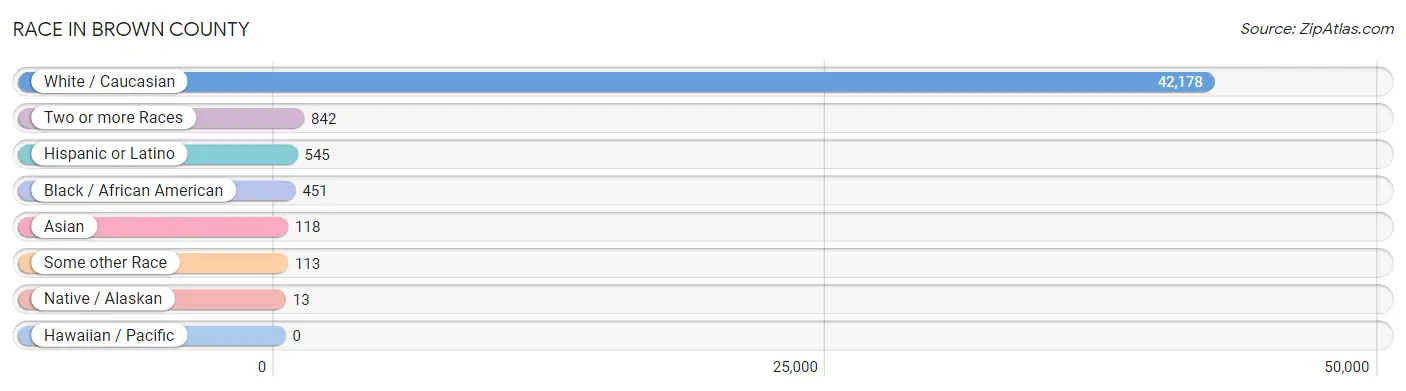
| Race | # Population | % Population |
| Asian | 118 | 0.3% |
| Black / African American | 451 | 1.0% |
| Hawaiian / Pacific | 0 | 0.0% |
| Hispanic or Latino | 545 | 1.3% |
| Native / Alaskan | 13 | 0.0% |
| White / Caucasian | 42,178 | 96.5% |
| Two or more Races | 842 | 1.9% |
| Some other Race | 113 | 0.3% |
| Total | 43,715 | 100.0% |
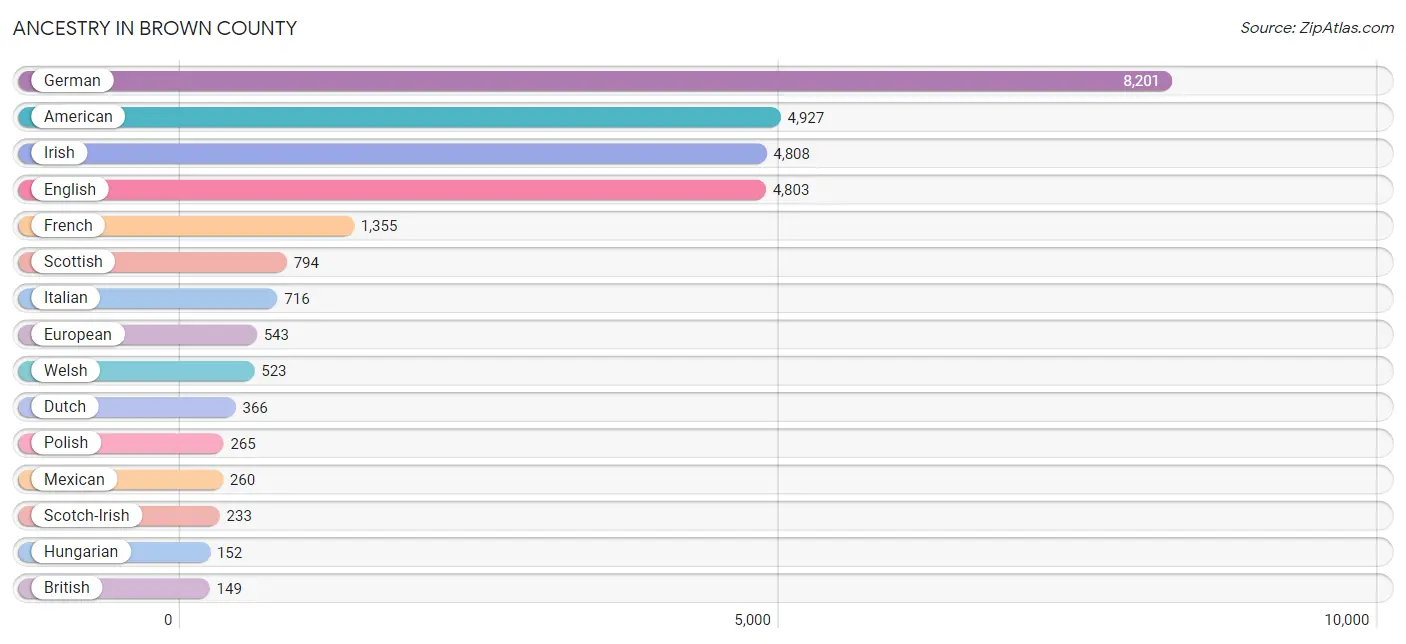
Ancestry in Brown County
The most populous ancestries reported in Brown County are German (8,201 | 18.8%), American (4,927 | 11.3%), Irish (4,808 | 11.0%), English (4,803 | 11.0%), and French (1,355 | 3.1%), together accounting for 55.1% of all Brown County residents.
| Ancestry | # Population | % Population |
| African | 2 | 0.0% |
| Albanian | 18 | 0.0% |
| American | 4,927 | 11.3% |
| Arab | 108 | 0.3% |
| Australian | 18 | 0.0% |
| Austrian | 8 | 0.0% |
| Belgian | 17 | 0.0% |
| Blackfeet | 8 | 0.0% |
| British | 149 | 0.3% |
| Burmese | 3 | 0.0% |
| Canadian | 24 | 0.1% |
| Central American | 83 | 0.2% |
| Cherokee | 125 | 0.3% |
| Chippewa | 4 | 0.0% |
| Croatian | 16 | 0.0% |
| Cuban | 3 | 0.0% |
| Czech | 29 | 0.1% |
| Dutch | 366 | 0.8% |
| Eastern European | 32 | 0.1% |
| English | 4,803 | 11.0% |
| European | 543 | 1.2% |
| Finnish | 116 | 0.3% |
| French | 1,355 | 3.1% |
| French American Indian | 1 | 0.0% |
| French Canadian | 106 | 0.2% |
| German | 8,201 | 18.8% |
| Greek | 4 | 0.0% |
| Hungarian | 152 | 0.4% |
| Indian (Asian) | 9 | 0.0% |
| Irish | 4,808 | 11.0% |
| Iroquois | 5 | 0.0% |
| Italian | 716 | 1.6% |
| Korean | 51 | 0.1% |
| Lebanese | 20 | 0.1% |
| Lithuanian | 14 | 0.0% |
| Mexican | 260 | 0.6% |
| Mexican American Indian | 2 | 0.0% |
| Moroccan | 88 | 0.2% |
| Northern European | 66 | 0.2% |
| Norwegian | 71 | 0.2% |
| Pakistani | 12 | 0.0% |
| Polish | 265 | 0.6% |
| Portuguese | 16 | 0.0% |
| Puerto Rican | 57 | 0.1% |
| Puget Sound Salish | 5 | 0.0% |
| Russian | 10 | 0.0% |
| Salvadoran | 83 | 0.2% |
| Scandinavian | 51 | 0.1% |
| Scotch-Irish | 233 | 0.5% |
| Scottish | 794 | 1.8% |
| Sioux | 6 | 0.0% |
| Slavic | 11 | 0.0% |
| Slovak | 42 | 0.1% |
| Subsaharan African | 2 | 0.0% |
| Swedish | 34 | 0.1% |
| Swiss | 49 | 0.1% |
| Trinidadian and Tobagonian | 30 | 0.1% |
| Ukrainian | 26 | 0.1% |
| Welsh | 523 | 1.2% | View All 59 Rows |
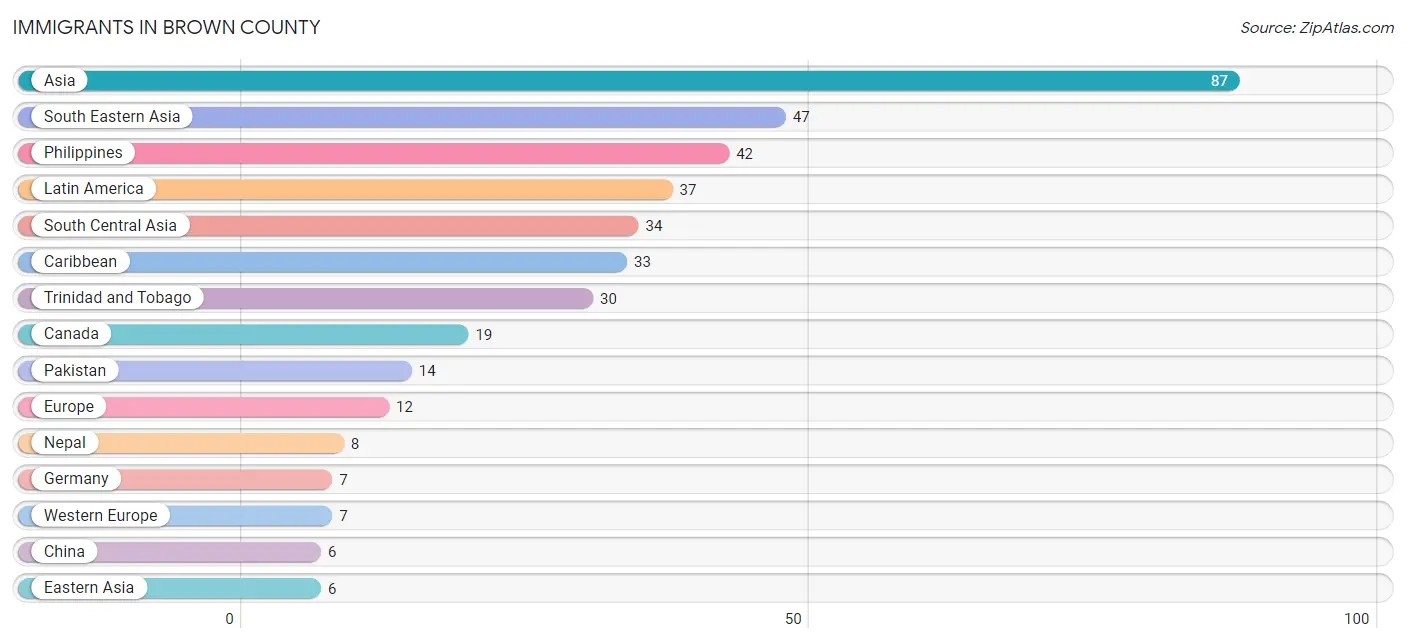
Immigrants in Brown County
The most numerous immigrant groups reported in Brown County came from Asia (87 | 0.2%), South Eastern Asia (47 | 0.1%), Philippines (42 | 0.1%), Latin America (37 | 0.1%), and South Central Asia (34 | 0.1%), together accounting for 0.6% of all Brown County residents.
| Immigration Origin | # Population | % Population |
| Asia | 87 | 0.2% |
| Canada | 19 | 0.0% |
| Caribbean | 33 | 0.1% |
| Central America | 4 | 0.0% |
| China | 6 | 0.0% |
| Dominican Republic | 3 | 0.0% |
| Eastern Asia | 6 | 0.0% |
| England | 5 | 0.0% |
| Europe | 12 | 0.0% |
| Germany | 7 | 0.0% |
| Latin America | 37 | 0.1% |
| Mexico | 4 | 0.0% |
| Nepal | 8 | 0.0% |
| Northern Europe | 5 | 0.0% |
| Pakistan | 14 | 0.0% |
| Philippines | 42 | 0.1% |
| South Central Asia | 34 | 0.1% |
| South Eastern Asia | 47 | 0.1% |
| Thailand | 5 | 0.0% |
| Trinidad and Tobago | 30 | 0.1% |
| Western Europe | 7 | 0.0% | View All 21 Rows |
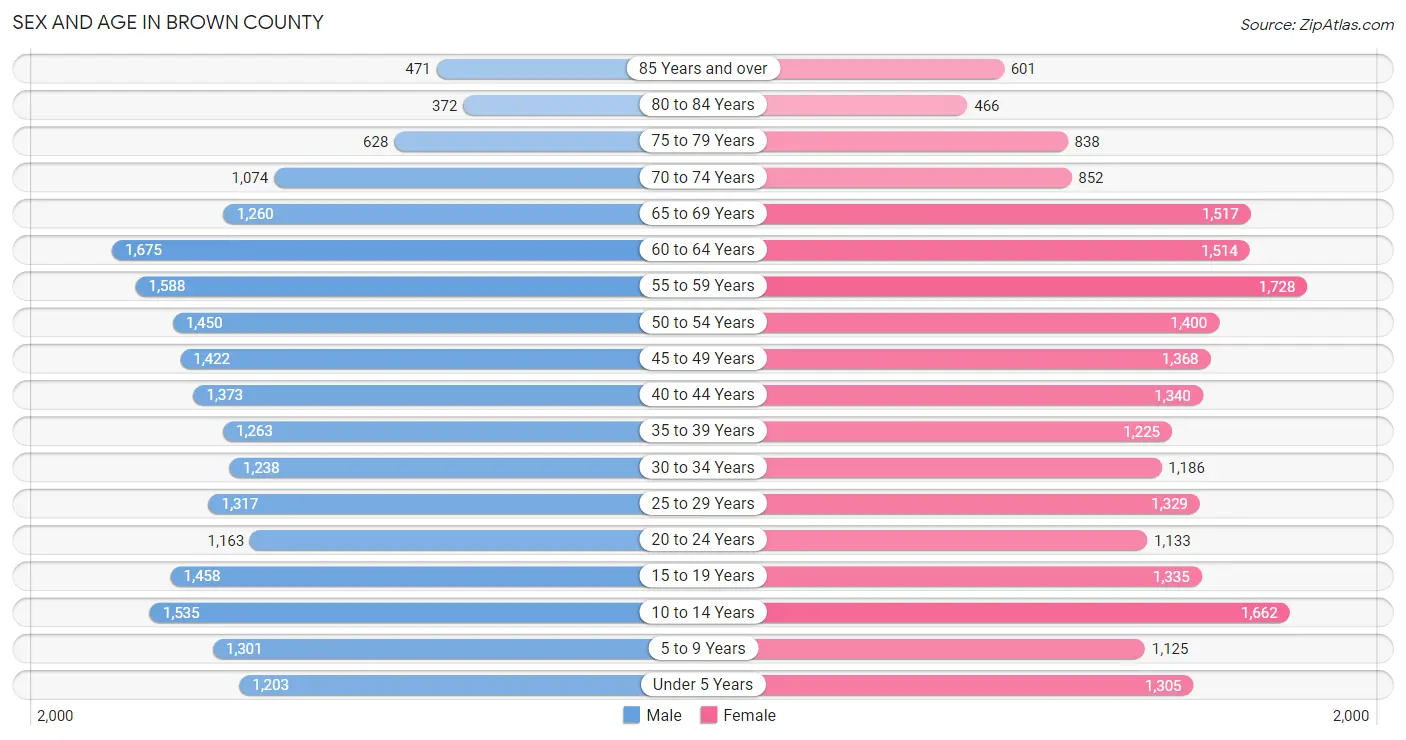
Sex and Age in Brown County
Sex and Age in Brown County
The most populous age groups in Brown County are 60 to 64 Years (1,675 | 7.7%) for men and 55 to 59 Years (1,728 | 7.9%) for women.
| Age Bracket | Male | Female |
| Under 5 Years | 1,203 (5.5%) | 1,305 (5.9%) |
| 5 to 9 Years | 1,301 (6.0%) | 1,125 (5.1%) |
| 10 to 14 Years | 1,535 (7.0%) | 1,662 (7.6%) |
| 15 to 19 Years | 1,458 (6.7%) | 1,335 (6.1%) |
| 20 to 24 Years | 1,163 (5.3%) | 1,133 (5.2%) |
| 25 to 29 Years | 1,317 (6.0%) | 1,329 (6.1%) |
| 30 to 34 Years | 1,238 (5.7%) | 1,186 (5.4%) |
| 35 to 39 Years | 1,263 (5.8%) | 1,225 (5.6%) |
| 40 to 44 Years | 1,373 (6.3%) | 1,340 (6.1%) |
| 45 to 49 Years | 1,422 (6.5%) | 1,368 (6.2%) |
| 50 to 54 Years | 1,450 (6.7%) | 1,400 (6.4%) |
| 55 to 59 Years | 1,588 (7.3%) | 1,728 (7.9%) |
| 60 to 64 Years | 1,675 (7.7%) | 1,514 (6.9%) |
| 65 to 69 Years | 1,260 (5.8%) | 1,517 (6.9%) |
| 70 to 74 Years | 1,074 (4.9%) | 852 (3.9%) |
| 75 to 79 Years | 628 (2.9%) | 838 (3.8%) |
| 80 to 84 Years | 372 (1.7%) | 466 (2.1%) |
| 85 Years and over | 471 (2.2%) | 601 (2.7%) |
| Total | 21,791 (100.0%) | 21,924 (100.0%) |
Families and Households in Brown County
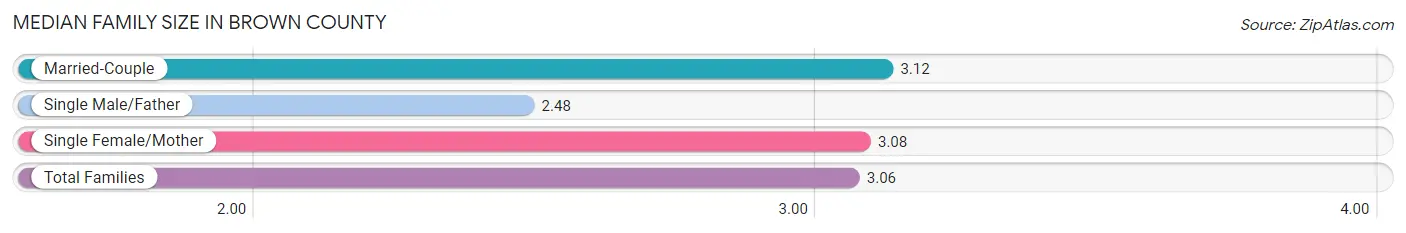
Median Family Size in Brown County
The median family size in Brown County is 3.06 persons per family, with married-couple families (8,694 | 75.1%) accounting for the largest median family size of 3.12 persons per family. On the other hand, single male/father families (950 | 8.2%) represent the smallest median family size with 2.48 persons per family.
| Family Type | # Families | Family Size |
| Married-Couple | 8,694 (75.1%) | 3.12 |
| Single Male/Father | 950 (8.2%) | 2.48 |
| Single Female/Mother | 1,935 (16.7%) | 3.08 |
| Total Families | 11,579 (100.0%) | 3.06 |
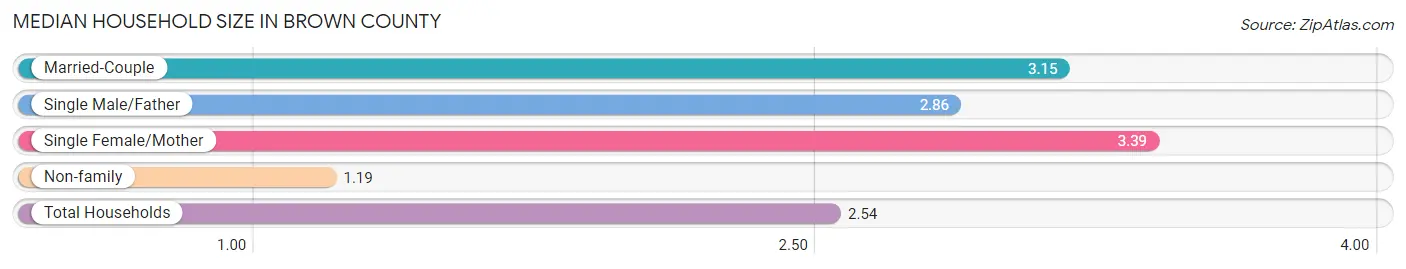
Median Household Size in Brown County
The median household size in Brown County is 2.54 persons per household, with single female/mother households (1,935 | 11.4%) accounting for the largest median household size of 3.39 persons per household. non-family households (5,379 | 31.7%) represent the smallest median household size with 1.19 persons per household.
| Household Type | # Households | Household Size |
| Married-Couple | 8,694 (51.3%) | 3.15 |
| Single Male/Father | 950 (5.6%) | 2.86 |
| Single Female/Mother | 1,935 (11.4%) | 3.39 |
| Non-family | 5,379 (31.7%) | 1.19 |
| Total Households | 16,958 (100.0%) | 2.54 |
Household Size by Marriage Status in Brown County
Out of a total of 16,958 households in Brown County, 11,579 (68.3%) are family households, while 5,379 (31.7%) are nonfamily households. The most numerous type of family households are 2-person households, comprising 5,237, and the most common type of nonfamily households are 1-person households, comprising 4,470.
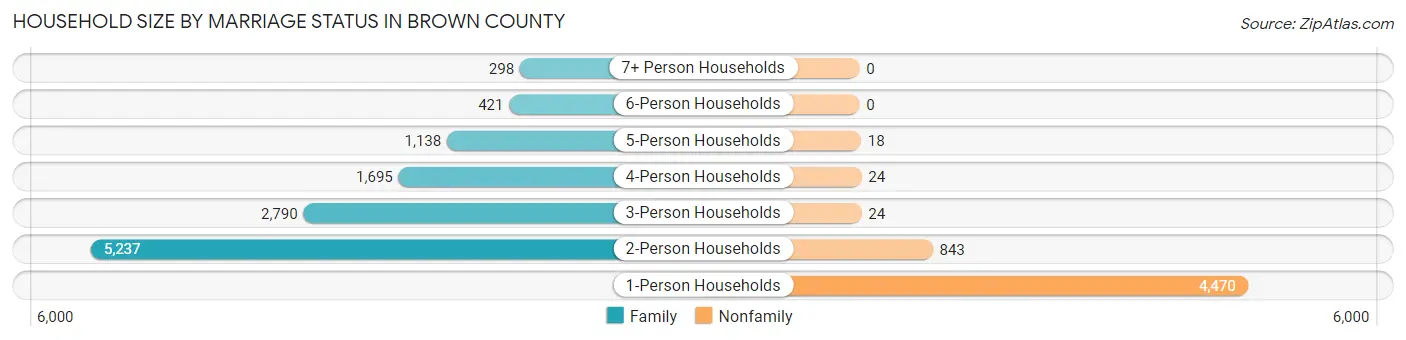
| Household Size | Family Households | Nonfamily Households |
| 1-Person Households | - | 4,470 (26.4%) |
| 2-Person Households | 5,237 (30.9%) | 843 (5.0%) |
| 3-Person Households | 2,790 (16.5%) | 24 (0.1%) |
| 4-Person Households | 1,695 (10.0%) | 24 (0.1%) |
| 5-Person Households | 1,138 (6.7%) | 18 (0.1%) |
| 6-Person Households | 421 (2.5%) | 0 (0.0%) |
| 7+ Person Households | 298 (1.8%) | 0 (0.0%) |
| Total | 11,579 (68.3%) | 5,379 (31.7%) |
Female Fertility in Brown County
Fertility by Age in Brown County
Average fertility rate in Brown County is 54.0 births per 1,000 women. Women in the age bracket of 20 to 34 years have the highest fertility rate with 127.0 births per 1,000 women. Women in the age bracket of 20 to 34 years acount for 91.9% of all women with births.
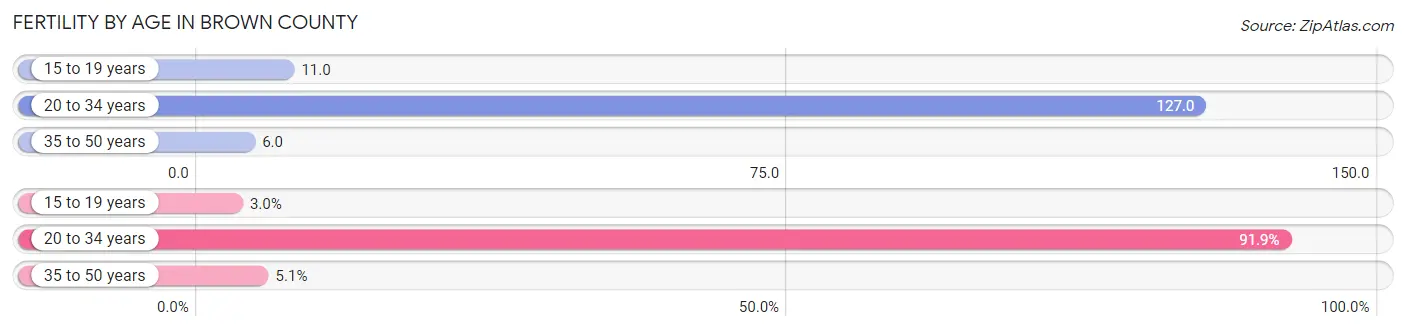
| Age Bracket | Women with Births | Births / 1,000 Women |
| 15 to 19 years | 15 (3.0%) | 11.0 |
| 20 to 34 years | 465 (91.9%) | 127.0 |
| 35 to 50 years | 26 (5.1%) | 6.0 |
| Total | 506 (100.0%) | 54.0 |
Fertility by Age by Marriage Status in Brown County
56.3% of women with births (506) in Brown County are married. The highest percentage of unmarried women with births falls into 15 to 19 years age bracket with 100.0% of them unmarried at the time of birth, while the lowest percentage of unmarried women with births belong to 20 to 34 years age bracket with 41.5% of them unmarried.
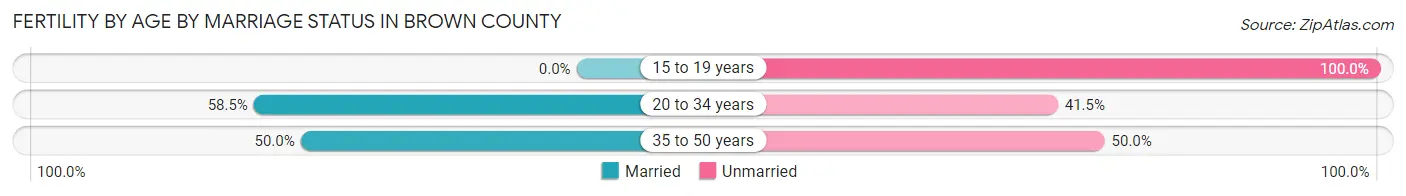
| Age Bracket | Married | Unmarried |
| 15 to 19 years | 0 (0.0%) | 15 (100.0%) |
| 20 to 34 years | 272 (58.5%) | 193 (41.5%) |
| 35 to 50 years | 13 (50.0%) | 13 (50.0%) |
| Total | 285 (56.3%) | 221 (43.7%) |
Fertility by Education in Brown County
Average fertility rate in Brown County is 54.0 births per 1,000 women. Women with the education attainment of high school diploma have the highest fertility rate of 73.0 births per 1,000 women, while women with the education attainment of less than high school have the lowest fertility at 12.0 births per 1,000 women. Women with the education attainment of high school diploma represent 45.5% of all women with births.
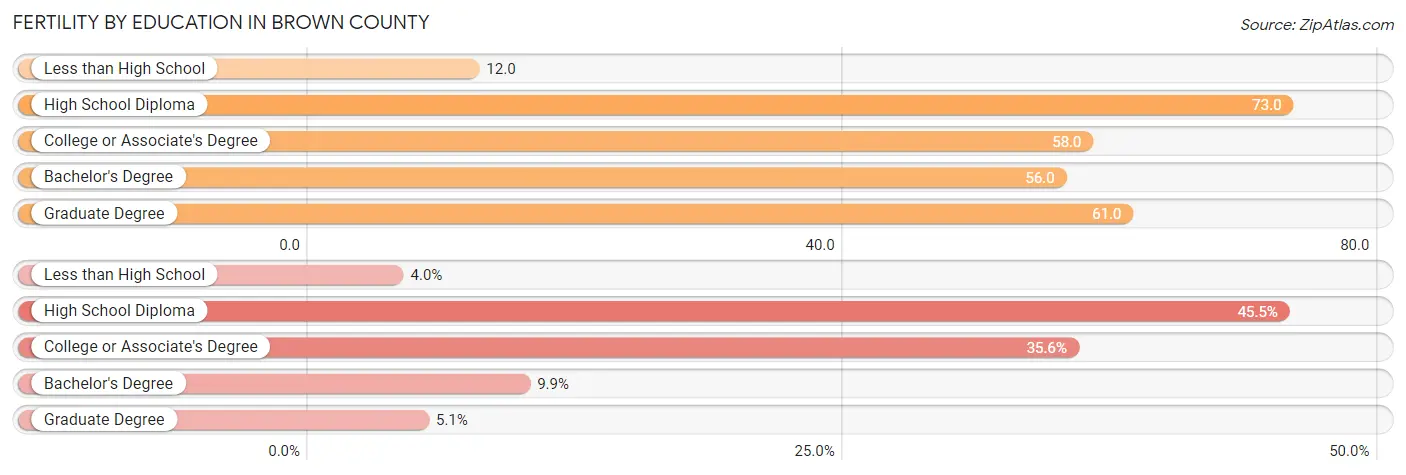
| Educational Attainment | Women with Births | Births / 1,000 Women |
| Less than High School | 20 (4.0%) | 12.0 |
| High School Diploma | 230 (45.5%) | 73.0 |
| College or Associate's Degree | 180 (35.6%) | 58.0 |
| Bachelor's Degree | 50 (9.9%) | 56.0 |
| Graduate Degree | 26 (5.1%) | 61.0 |
| Total | 506 (100.0%) | 54.0 |
Fertility by Education by Marriage Status in Brown County
43.7% of women with births in Brown County are unmarried. Women with the educational attainment of graduate degree are most likely to be married with 100.0% of them married at childbirth, while women with the educational attainment of high school diploma are least likely to be married with 60.4% of them unmarried at childbirth.
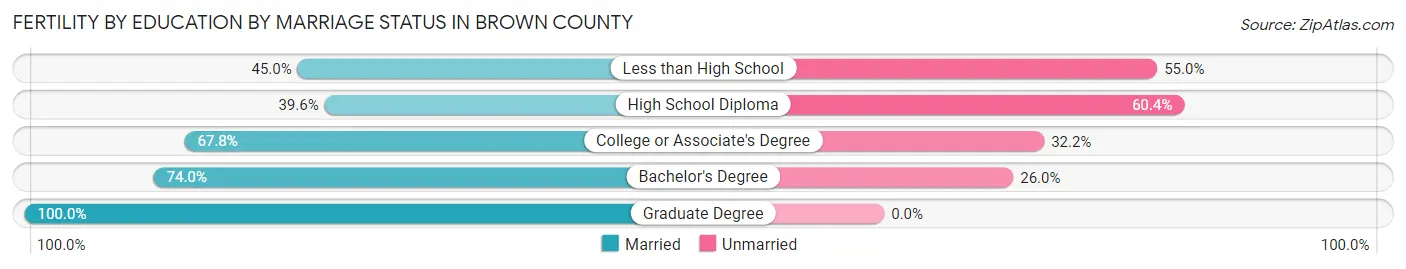
| Educational Attainment | Married | Unmarried |
| Less than High School | 9 (45.0%) | 11 (55.0%) |
| High School Diploma | 91 (39.6%) | 139 (60.4%) |
| College or Associate's Degree | 122 (67.8%) | 58 (32.2%) |
| Bachelor's Degree | 37 (74.0%) | 13 (26.0%) |
| Graduate Degree | 26 (100.0%) | 0 (0.0%) |
| Total | 285 (56.3%) | 221 (43.7%) |
Employment Characteristics in Brown County
Employment by Class of Employer in Brown County
Among the 18,800 employed individuals in Brown County, private company employees (13,532 | 72.0%), local government employees (1,660 | 8.8%), and self-employed (not incorporated) (1,102 | 5.9%) make up the most common classes of employment.
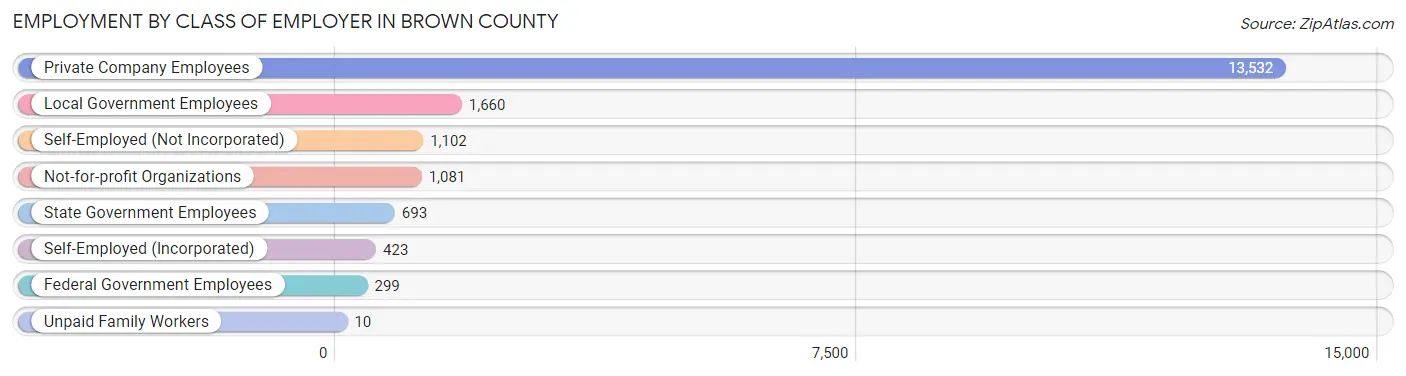
| Employer Class | # Employees | % Employees |
| Private Company Employees | 13,532 | 72.0% |
| Self-Employed (Incorporated) | 423 | 2.2% |
| Self-Employed (Not Incorporated) | 1,102 | 5.9% |
| Not-for-profit Organizations | 1,081 | 5.8% |
| Local Government Employees | 1,660 | 8.8% |
| State Government Employees | 693 | 3.7% |
| Federal Government Employees | 299 | 1.6% |
| Unpaid Family Workers | 10 | 0.1% |
| Total | 18,800 | 100.0% |
Employment Status by Age in Brown County
According to the labor force statistics for Brown County, out of the total population over 16 years of age (34,996), 57.0% or 19,948 individuals are in the labor force, with 4.4% or 878 of them unemployed. The age group with the highest labor force participation rate is 30 to 34 years, with 84.2% or 2,041 individuals in the labor force. Within the labor force, the 16 to 19 years age range has the highest percentage of unemployed individuals, with 14.4% or 146 of them being unemployed.
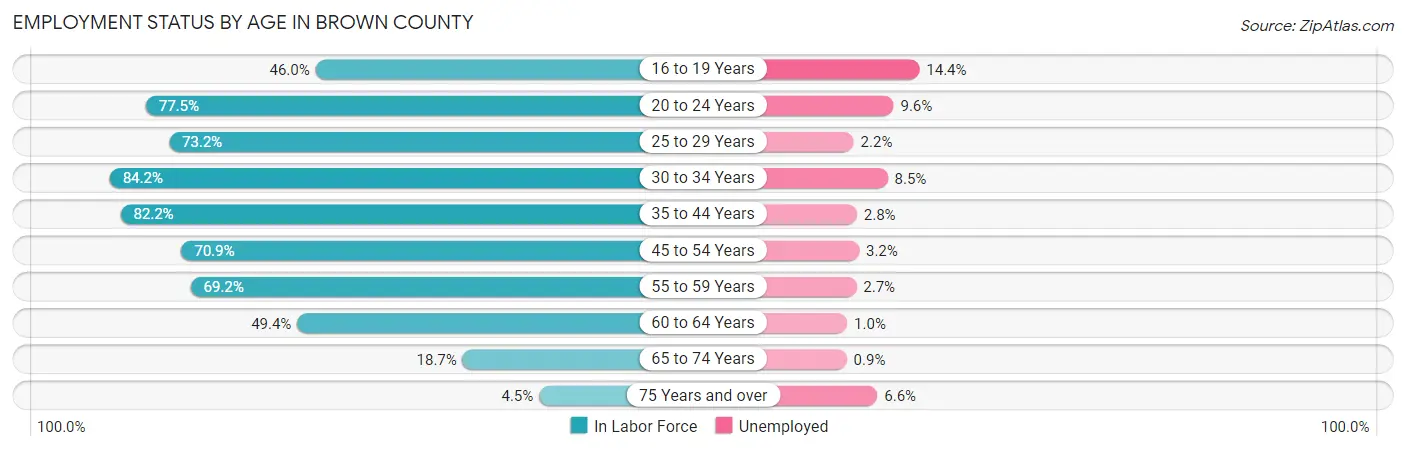
| Age Bracket | In Labor Force | Unemployed |
| 16 to 19 Years | 1,014 (46.0%) | 146 (14.4%) |
| 20 to 24 Years | 1,779 (77.5%) | 171 (9.6%) |
| 25 to 29 Years | 1,937 (73.2%) | 43 (2.2%) |
| 30 to 34 Years | 2,041 (84.2%) | 173 (8.5%) |
| 35 to 44 Years | 4,275 (82.2%) | 120 (2.8%) |
| 45 to 54 Years | 3,999 (70.9%) | 128 (3.2%) |
| 55 to 59 Years | 2,295 (69.2%) | 62 (2.7%) |
| 60 to 64 Years | 1,575 (49.4%) | 16 (1.0%) |
| 65 to 74 Years | 879 (18.7%) | 8 (0.9%) |
| 75 Years and over | 152 (4.5%) | 10 (6.6%) |
| Total | 19,948 (57.0%) | 878 (4.4%) |
Employment Status by Educational Attainment in Brown County
According to labor force statistics for Brown County, 71.9% of individuals (16,117) out of the total population between 25 and 64 years of age (22,416) are in the labor force, with 3.3% or 532 of them being unemployed. The group with the highest labor force participation rate are those with the educational attainment of bachelor's degree or higher, with 90.5% or 3,024 individuals in the labor force. Within the labor force, individuals with less than high school education have the highest percentage of unemployment, with 18.5% or 219 of them being unemployed.
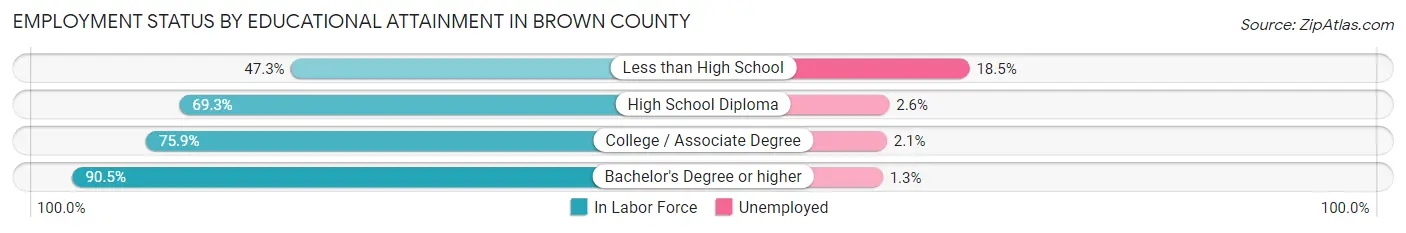
| Educational Attainment | In Labor Force | Unemployed |
| Less than High School | 1,185 (47.3%) | 464 (18.5%) |
| High School Diploma | 6,921 (69.3%) | 260 (2.6%) |
| College / Associate Degree | 4,996 (75.9%) | 138 (2.1%) |
| Bachelor's Degree or higher | 3,024 (90.5%) | 43 (1.3%) |
| Total | 16,117 (71.9%) | 740 (3.3%) |
Employment Occupations by Sex in Brown County
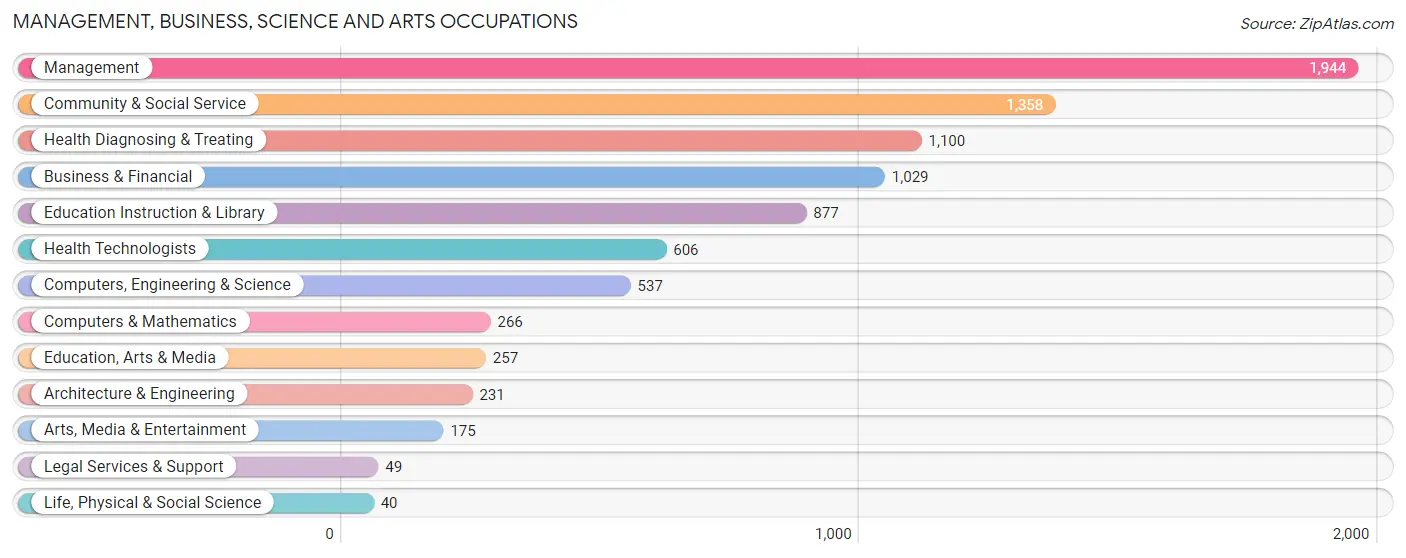
Management, Business, Science and Arts Occupations
The most common Management, Business, Science and Arts occupations in Brown County are Management (1,944 | 10.2%), Community & Social Service (1,358 | 7.1%), Health Diagnosing & Treating (1,100 | 5.8%), Business & Financial (1,029 | 5.4%), and Education Instruction & Library (877 | 4.6%).
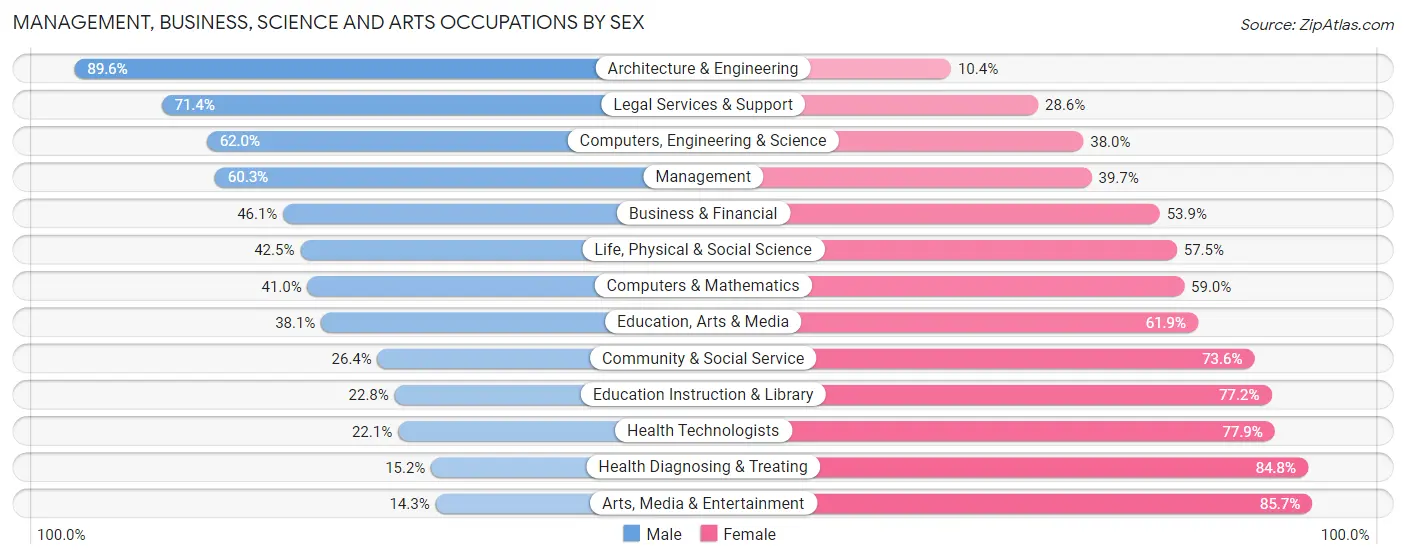
Management, Business, Science and Arts Occupations by Sex
Within the Management, Business, Science and Arts occupations in Brown County, the most male-oriented occupations are Architecture & Engineering (89.6%), Legal Services & Support (71.4%), and Computers, Engineering & Science (62.0%), while the most female-oriented occupations are Arts, Media & Entertainment (85.7%), Health Diagnosing & Treating (84.8%), and Health Technologists (77.9%).
| Occupation | Male | Female |
| Management | 1,172 (60.3%) | 772 (39.7%) |
| Business & Financial | 474 (46.1%) | 555 (53.9%) |
| Computers, Engineering & Science | 333 (62.0%) | 204 (38.0%) |
| Computers & Mathematics | 109 (41.0%) | 157 (59.0%) |
| Architecture & Engineering | 207 (89.6%) | 24 (10.4%) |
| Life, Physical & Social Science | 17 (42.5%) | 23 (57.5%) |
| Community & Social Service | 358 (26.4%) | 1,000 (73.6%) |
| Education, Arts & Media | 98 (38.1%) | 159 (61.9%) |
| Legal Services & Support | 35 (71.4%) | 14 (28.6%) |
| Education Instruction & Library | 200 (22.8%) | 677 (77.2%) |
| Arts, Media & Entertainment | 25 (14.3%) | 150 (85.7%) |
| Health Diagnosing & Treating | 167 (15.2%) | 933 (84.8%) |
| Health Technologists | 134 (22.1%) | 472 (77.9%) |
| Total (Category) | 2,504 (42.0%) | 3,464 (58.0%) |
| Total (Overall) | 9,945 (52.1%) | 9,135 (47.9%) |
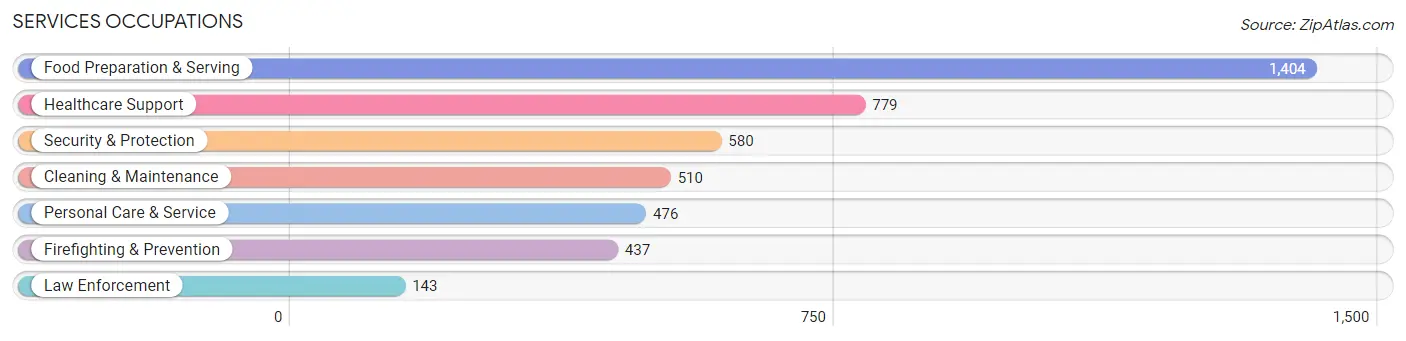
Services Occupations
The most common Services occupations in Brown County are Food Preparation & Serving (1,404 | 7.4%), Healthcare Support (779 | 4.1%), Security & Protection (580 | 3.0%), Cleaning & Maintenance (510 | 2.7%), and Personal Care & Service (476 | 2.5%).
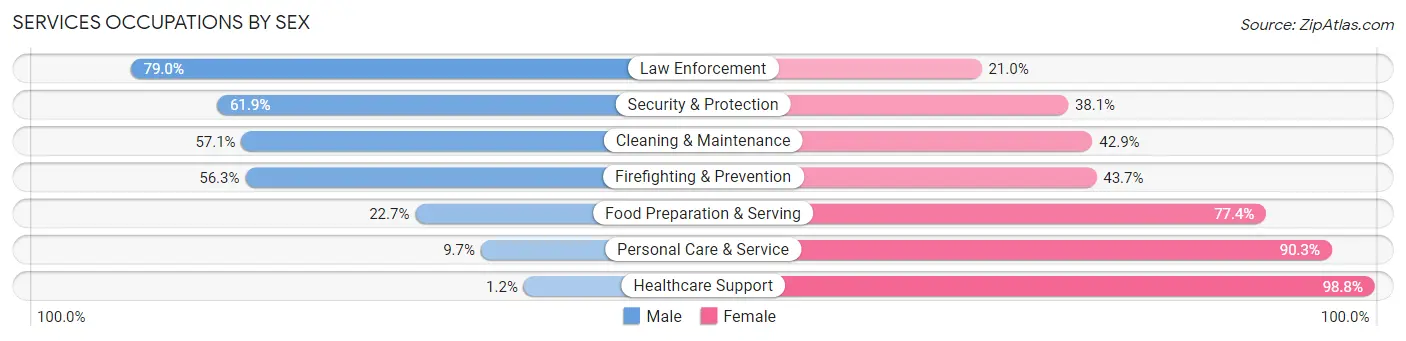
Services Occupations by Sex
Within the Services occupations in Brown County, the most male-oriented occupations are Law Enforcement (79.0%), Security & Protection (61.9%), and Cleaning & Maintenance (57.1%), while the most female-oriented occupations are Healthcare Support (98.8%), Personal Care & Service (90.3%), and Food Preparation & Serving (77.3%).
| Occupation | Male | Female |
| Healthcare Support | 9 (1.2%) | 770 (98.8%) |
| Security & Protection | 359 (61.9%) | 221 (38.1%) |
| Firefighting & Prevention | 246 (56.3%) | 191 (43.7%) |
| Law Enforcement | 113 (79.0%) | 30 (21.0%) |
| Food Preparation & Serving | 318 (22.7%) | 1,086 (77.3%) |
| Cleaning & Maintenance | 291 (57.1%) | 219 (42.9%) |
| Personal Care & Service | 46 (9.7%) | 430 (90.3%) |
| Total (Category) | 1,023 (27.3%) | 2,726 (72.7%) |
| Total (Overall) | 9,945 (52.1%) | 9,135 (47.9%) |
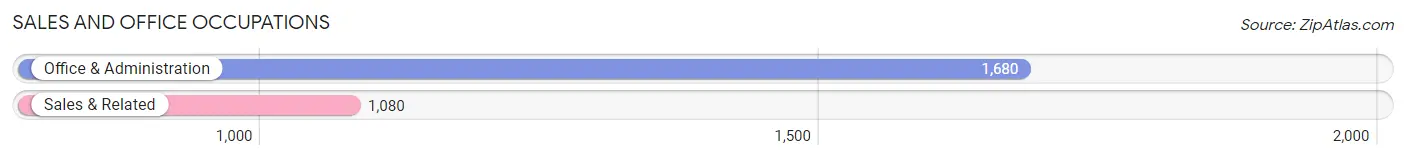
Sales and Office Occupations
The most common Sales and Office occupations in Brown County are Office & Administration (1,680 | 8.8%), and Sales & Related (1,080 | 5.7%).
Sales and Office Occupations by Sex
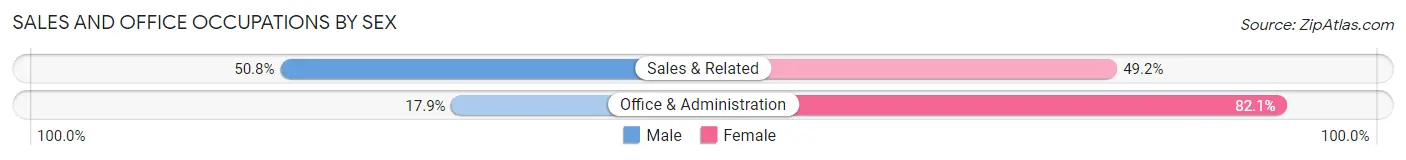
| Occupation | Male | Female |
| Sales & Related | 549 (50.8%) | 531 (49.2%) |
| Office & Administration | 301 (17.9%) | 1,379 (82.1%) |
| Total (Category) | 850 (30.8%) | 1,910 (69.2%) |
| Total (Overall) | 9,945 (52.1%) | 9,135 (47.9%) |
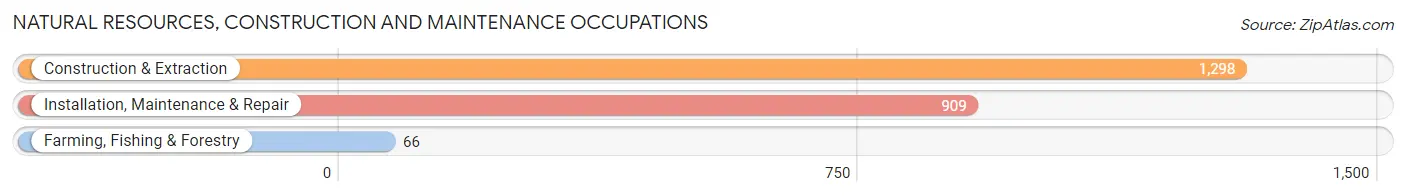
Natural Resources, Construction and Maintenance Occupations
The most common Natural Resources, Construction and Maintenance occupations in Brown County are Construction & Extraction (1,298 | 6.8%), Installation, Maintenance & Repair (909 | 4.8%), and Farming, Fishing & Forestry (66 | 0.4%).
Natural Resources, Construction and Maintenance Occupations by Sex
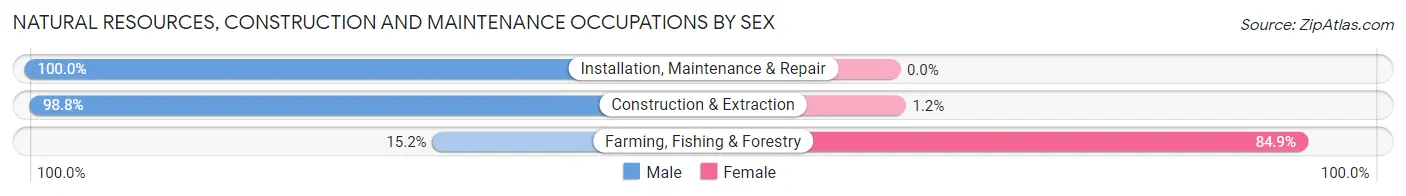
| Occupation | Male | Female |
| Farming, Fishing & Forestry | 10 (15.1%) | 56 (84.9%) |
| Construction & Extraction | 1,283 (98.8%) | 15 (1.2%) |
| Installation, Maintenance & Repair | 909 (100.0%) | 0 (0.0%) |
| Total (Category) | 2,202 (96.9%) | 71 (3.1%) |
| Total (Overall) | 9,945 (52.1%) | 9,135 (47.9%) |
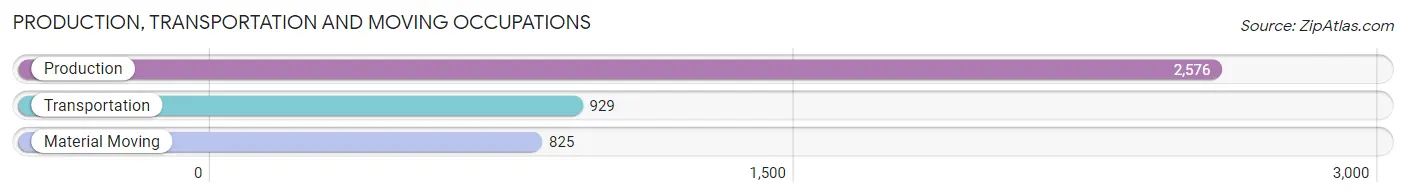
Production, Transportation and Moving Occupations
The most common Production, Transportation and Moving occupations in Brown County are Production (2,576 | 13.5%), Transportation (929 | 4.9%), and Material Moving (825 | 4.3%).
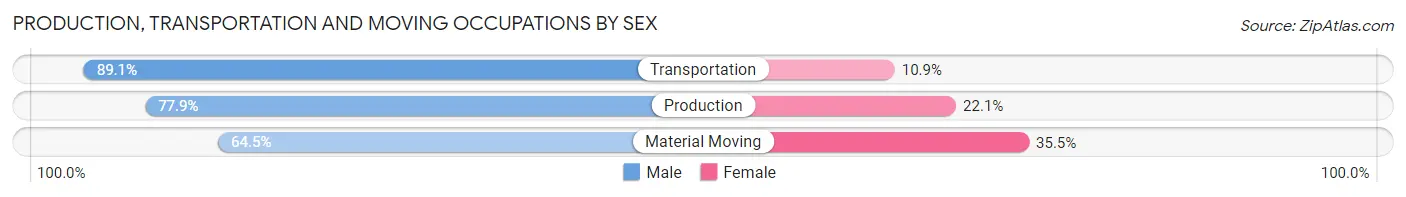
Production, Transportation and Moving Occupations by Sex
| Occupation | Male | Female |
| Production | 2,006 (77.9%) | 570 (22.1%) |
| Transportation | 828 (89.1%) | 101 (10.9%) |
| Material Moving | 532 (64.5%) | 293 (35.5%) |
| Total (Category) | 3,366 (77.7%) | 964 (22.3%) |
| Total (Overall) | 9,945 (52.1%) | 9,135 (47.9%) |
Employment Industries by Sex in Brown County
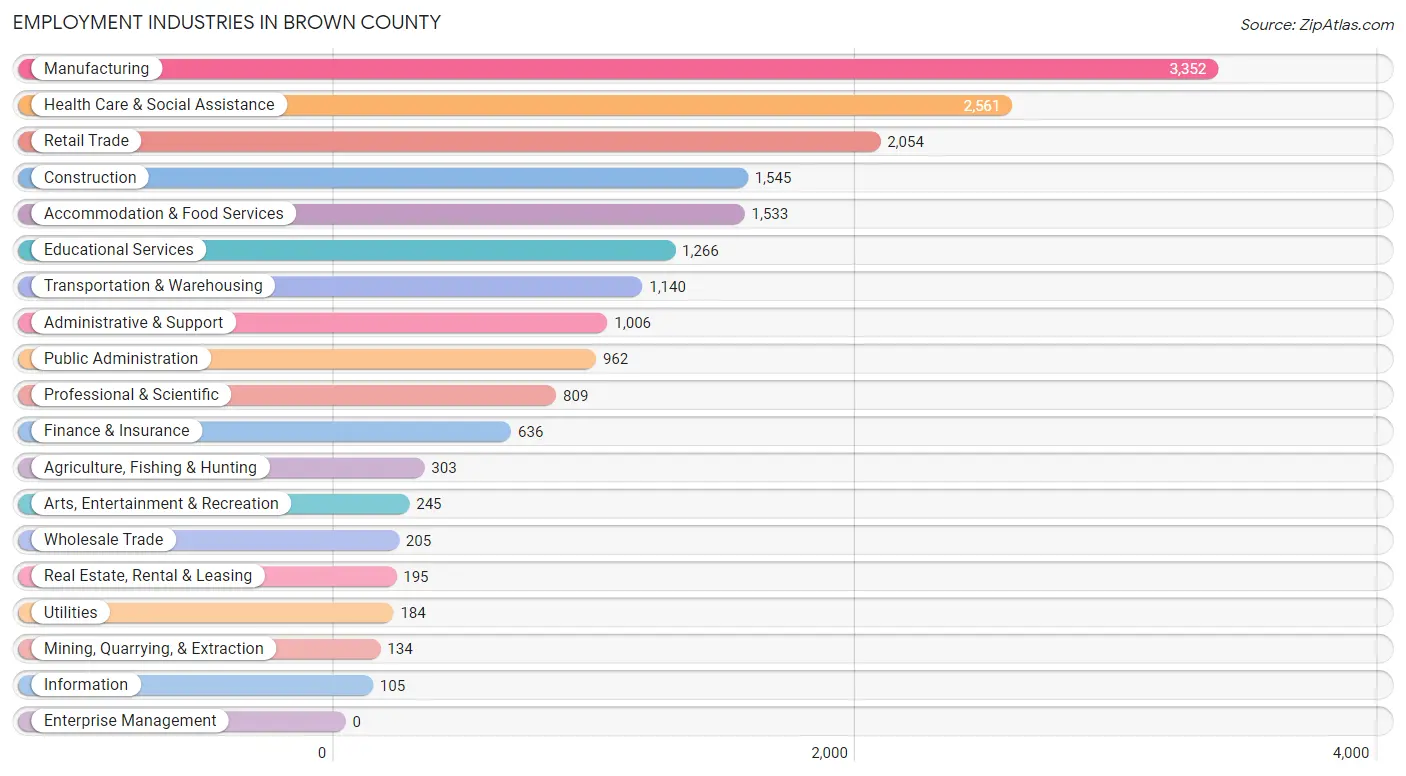
Employment Industries in Brown County
The major employment industries in Brown County include Manufacturing (3,352 | 17.6%), Health Care & Social Assistance (2,561 | 13.4%), Retail Trade (2,054 | 10.8%), Construction (1,545 | 8.1%), and Accommodation & Food Services (1,533 | 8.0%).
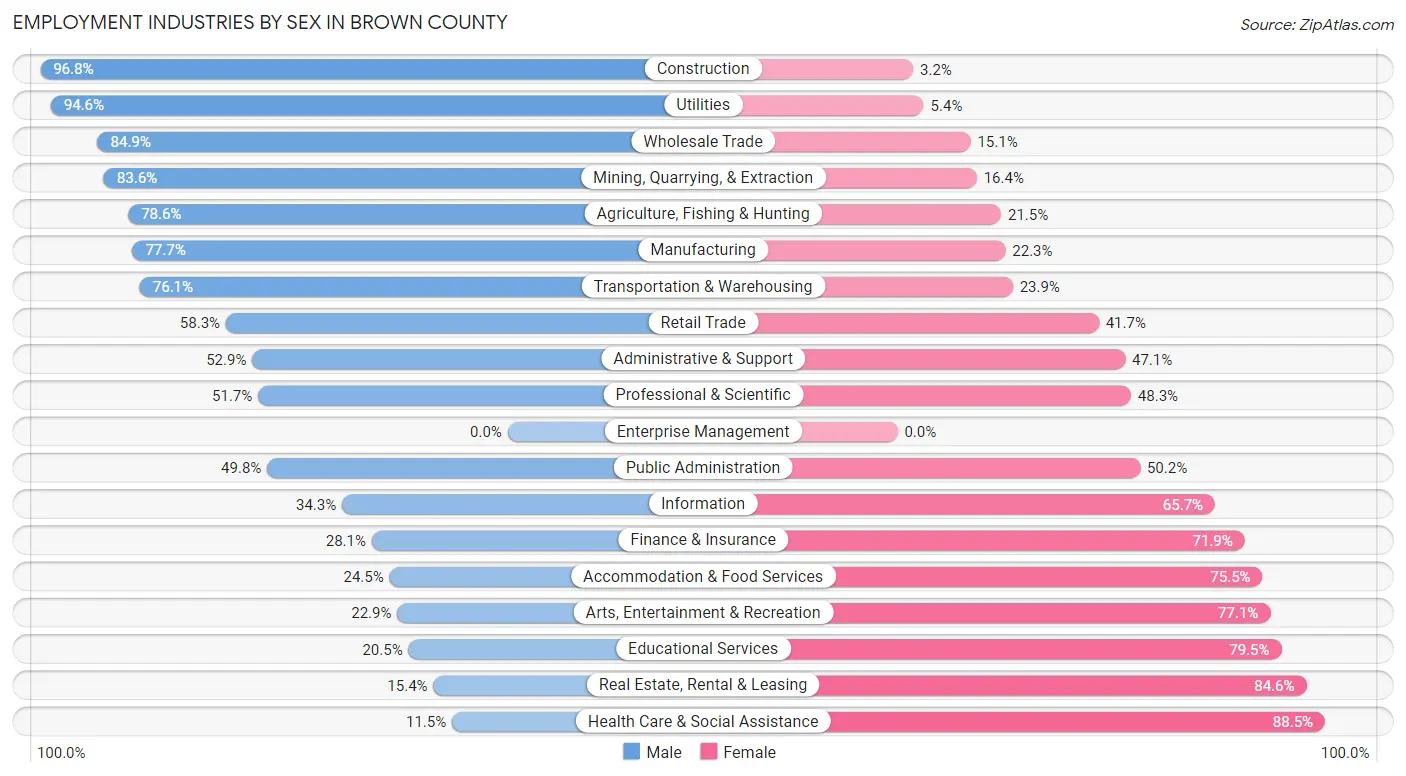
Employment Industries by Sex in Brown County
The Brown County industries that see more men than women are Construction (96.8%), Utilities (94.6%), and Wholesale Trade (84.9%), whereas the industries that tend to have a higher number of women are Health Care & Social Assistance (88.5%), Real Estate, Rental & Leasing (84.6%), and Educational Services (79.5%).
| Industry | Male | Female |
| Agriculture, Fishing & Hunting | 238 (78.5%) | 65 (21.4%) |
| Mining, Quarrying, & Extraction | 112 (83.6%) | 22 (16.4%) |
| Construction | 1,495 (96.8%) | 50 (3.2%) |
| Manufacturing | 2,603 (77.7%) | 749 (22.3%) |
| Wholesale Trade | 174 (84.9%) | 31 (15.1%) |
| Retail Trade | 1,198 (58.3%) | 856 (41.7%) |
| Transportation & Warehousing | 868 (76.1%) | 272 (23.9%) |
| Utilities | 174 (94.6%) | 10 (5.4%) |
| Information | 36 (34.3%) | 69 (65.7%) |
| Finance & Insurance | 179 (28.1%) | 457 (71.9%) |
| Real Estate, Rental & Leasing | 30 (15.4%) | 165 (84.6%) |
| Professional & Scientific | 418 (51.7%) | 391 (48.3%) |
| Enterprise Management | 0 (0.0%) | 0 (0.0%) |
| Administrative & Support | 532 (52.9%) | 474 (47.1%) |
| Educational Services | 260 (20.5%) | 1,006 (79.5%) |
| Health Care & Social Assistance | 295 (11.5%) | 2,266 (88.5%) |
| Arts, Entertainment & Recreation | 56 (22.9%) | 189 (77.1%) |
| Accommodation & Food Services | 375 (24.5%) | 1,158 (75.5%) |
| Public Administration | 479 (49.8%) | 483 (50.2%) |
| Total | 9,945 (52.1%) | 9,135 (47.9%) |
Education in Brown County
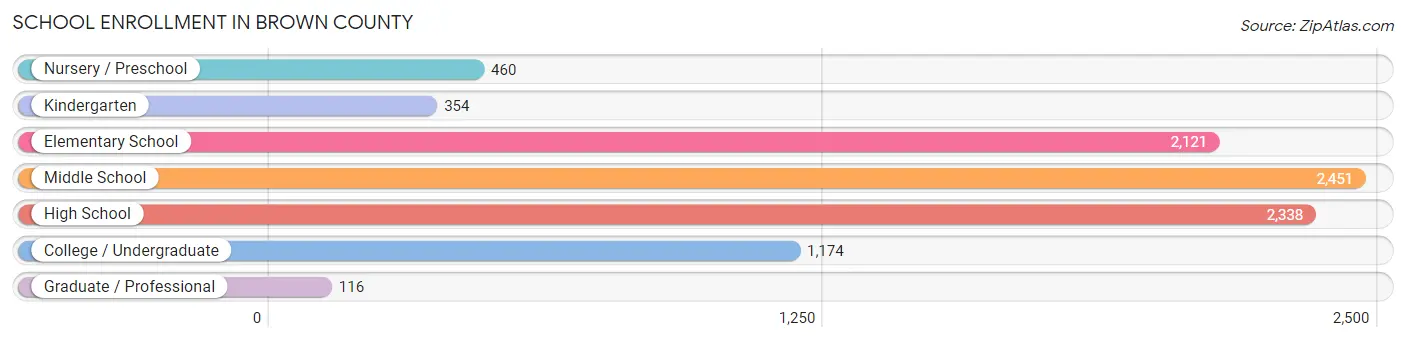
School Enrollment in Brown County
The most common levels of schooling among the 9,014 students in Brown County are middle school (2,451 | 27.2%), high school (2,338 | 25.9%), and elementary school (2,121 | 23.5%).
| School Level | # Students | % Students |
| Nursery / Preschool | 460 | 5.1% |
| Kindergarten | 354 | 3.9% |
| Elementary School | 2,121 | 23.5% |
| Middle School | 2,451 | 27.2% |
| High School | 2,338 | 25.9% |
| College / Undergraduate | 1,174 | 13.0% |
| Graduate / Professional | 116 | 1.3% |
| Total | 9,014 | 100.0% |
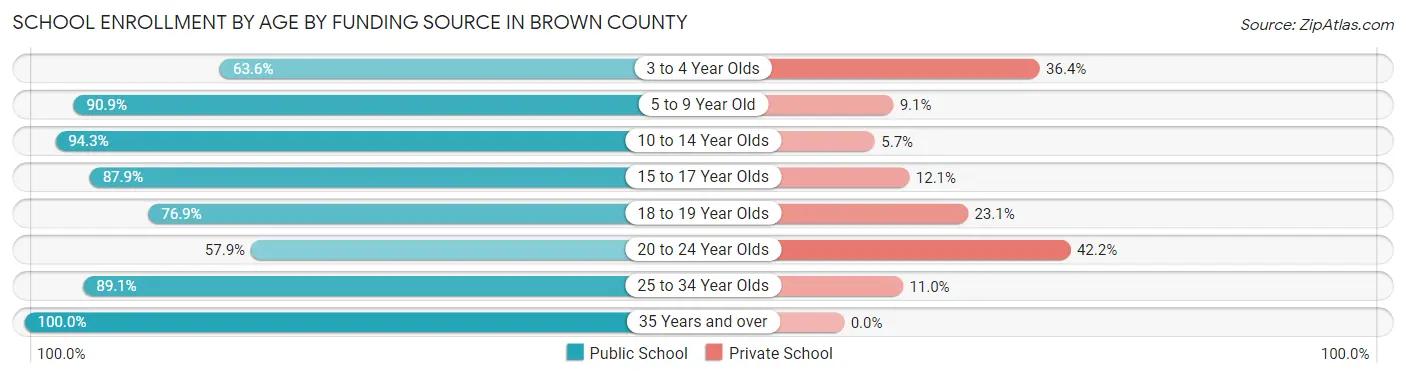
School Enrollment by Age by Funding Source in Brown County
Out of a total of 9,014 students who are enrolled in schools in Brown County, 1,136 (12.6%) attend a private institution, while the remaining 7,878 (87.4%) are enrolled in public schools. The age group of 20 to 24 year olds has the highest likelihood of being enrolled in private schools, with 263 (42.1% in the age bracket) enrolled. Conversely, the age group of 35 years and over has the lowest likelihood of being enrolled in a private school, with 248 (100.0% in the age bracket) attending a public institution.
| Age Bracket | Public School | Private School |
| 3 to 4 Year Olds | 255 (63.6%) | 146 (36.4%) |
| 5 to 9 Year Old | 1,932 (90.9%) | 194 (9.1%) |
| 10 to 14 Year Olds | 2,873 (94.3%) | 174 (5.7%) |
| 15 to 17 Year Olds | 1,577 (87.9%) | 218 (12.1%) |
| 18 to 19 Year Olds | 377 (76.9%) | 113 (23.1%) |
| 20 to 24 Year Olds | 361 (57.9%) | 263 (42.1%) |
| 25 to 34 Year Olds | 252 (89.0%) | 31 (11.0%) |
| 35 Years and over | 248 (100.0%) | 0 (0.0%) |
| Total | 7,878 (87.4%) | 1,136 (12.6%) |
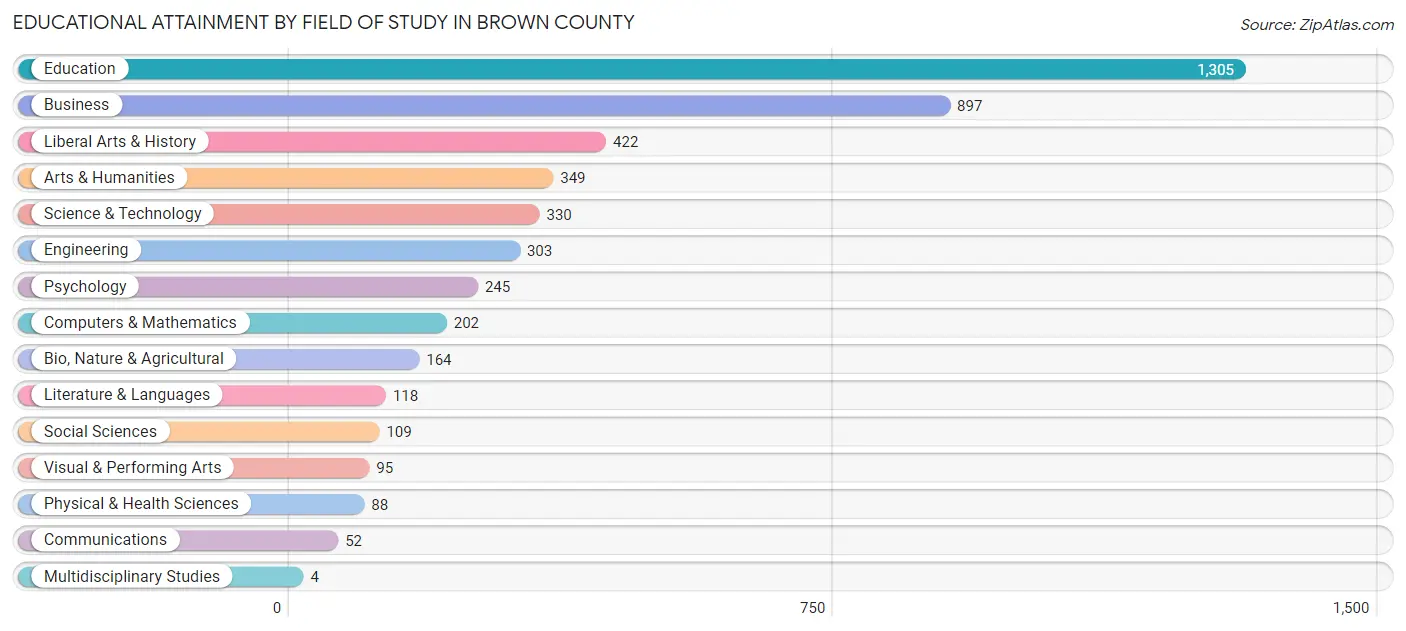
Educational Attainment by Field of Study in Brown County
Education (1,305 | 27.9%), business (897 | 19.2%), liberal arts & history (422 | 9.0%), arts & humanities (349 | 7.4%), and science & technology (330 | 7.0%) are the most common fields of study among 4,683 individuals in Brown County who have obtained a bachelor's degree or higher.
| Field of Study | # Graduates | % Graduates |
| Computers & Mathematics | 202 | 4.3% |
| Bio, Nature & Agricultural | 164 | 3.5% |
| Physical & Health Sciences | 88 | 1.9% |
| Psychology | 245 | 5.2% |
| Social Sciences | 109 | 2.3% |
| Engineering | 303 | 6.5% |
| Multidisciplinary Studies | 4 | 0.1% |
| Science & Technology | 330 | 7.0% |
| Business | 897 | 19.2% |
| Education | 1,305 | 27.9% |
| Literature & Languages | 118 | 2.5% |
| Liberal Arts & History | 422 | 9.0% |
| Visual & Performing Arts | 95 | 2.0% |
| Communications | 52 | 1.1% |
| Arts & Humanities | 349 | 7.4% |
| Total | 4,683 | 100.0% |
Transportation & Commute in Brown County
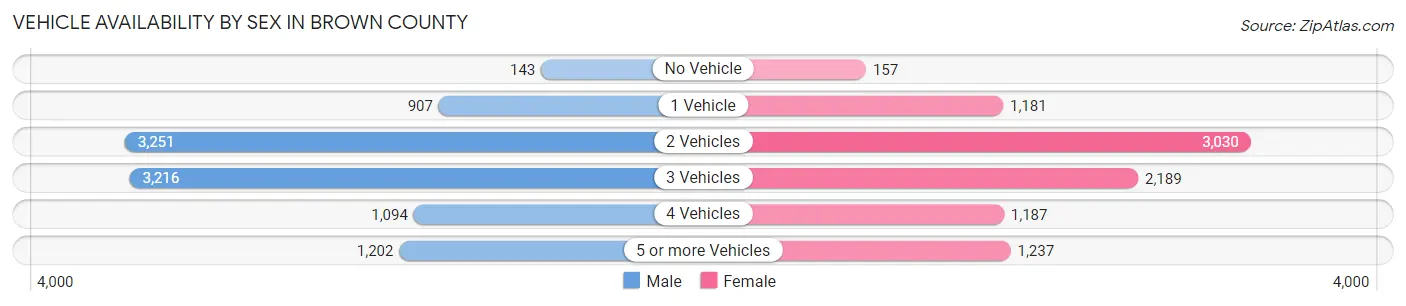
Vehicle Availability by Sex in Brown County
The most prevalent vehicle ownership categories in Brown County are males with 2 vehicles (3,251, accounting for 33.1%) and females with 2 vehicles (3,030, making up 36.2%).
| Vehicles Available | Male | Female |
| No Vehicle | 143 (1.5%) | 157 (1.8%) |
| 1 Vehicle | 907 (9.2%) | 1,181 (13.2%) |
| 2 Vehicles | 3,251 (33.1%) | 3,030 (33.7%) |
| 3 Vehicles | 3,216 (32.8%) | 2,189 (24.4%) |
| 4 Vehicles | 1,094 (11.2%) | 1,187 (13.2%) |
| 5 or more Vehicles | 1,202 (12.2%) | 1,237 (13.8%) |
| Total | 9,813 (100.0%) | 8,981 (100.0%) |
Commute Time in Brown County
The most frequently occuring commute durations in Brown County are 60 to 89 minutes (2,821 commuters, 15.9%), 30 to 34 minutes (2,546 commuters, 14.3%), and 45 to 59 minutes (2,387 commuters, 13.4%).
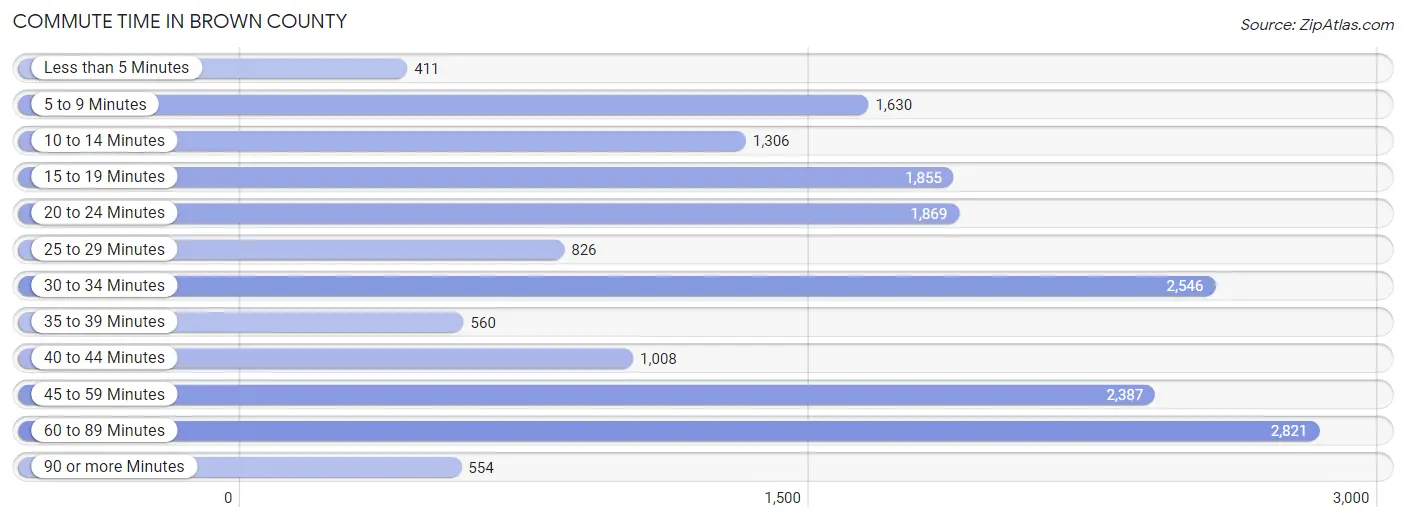
| Commute Time | # Commuters | % Commuters |
| Less than 5 Minutes | 411 | 2.3% |
| 5 to 9 Minutes | 1,630 | 9.2% |
| 10 to 14 Minutes | 1,306 | 7.3% |
| 15 to 19 Minutes | 1,855 | 10.4% |
| 20 to 24 Minutes | 1,869 | 10.5% |
| 25 to 29 Minutes | 826 | 4.6% |
| 30 to 34 Minutes | 2,546 | 14.3% |
| 35 to 39 Minutes | 560 | 3.2% |
| 40 to 44 Minutes | 1,008 | 5.7% |
| 45 to 59 Minutes | 2,387 | 13.4% |
| 60 to 89 Minutes | 2,821 | 15.9% |
| 90 or more Minutes | 554 | 3.1% |
Commute Time by Sex in Brown County
The most common commute times in Brown County are 60 to 89 minutes (2,029 commuters, 21.8%) for males and 30 to 34 minutes (1,249 commuters, 14.7%) for females.
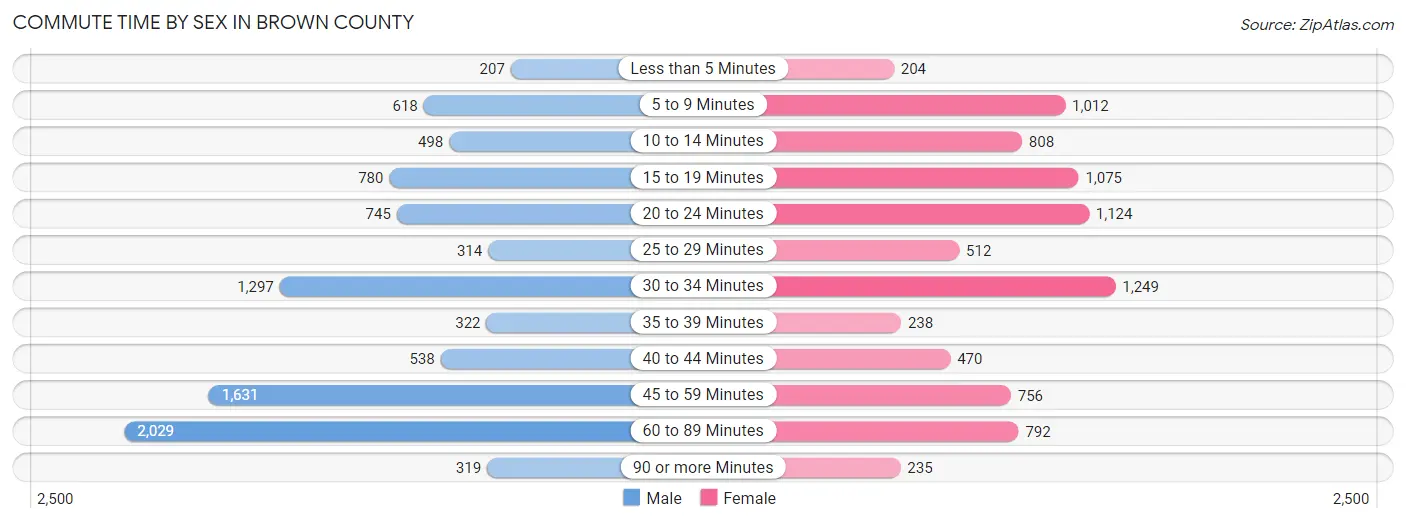
| Commute Time | Male | Female |
| Less than 5 Minutes | 207 (2.2%) | 204 (2.4%) |
| 5 to 9 Minutes | 618 (6.7%) | 1,012 (11.9%) |
| 10 to 14 Minutes | 498 (5.4%) | 808 (9.5%) |
| 15 to 19 Minutes | 780 (8.4%) | 1,075 (12.7%) |
| 20 to 24 Minutes | 745 (8.0%) | 1,124 (13.3%) |
| 25 to 29 Minutes | 314 (3.4%) | 512 (6.0%) |
| 30 to 34 Minutes | 1,297 (14.0%) | 1,249 (14.7%) |
| 35 to 39 Minutes | 322 (3.5%) | 238 (2.8%) |
| 40 to 44 Minutes | 538 (5.8%) | 470 (5.6%) |
| 45 to 59 Minutes | 1,631 (17.5%) | 756 (8.9%) |
| 60 to 89 Minutes | 2,029 (21.8%) | 792 (9.3%) |
| 90 or more Minutes | 319 (3.4%) | 235 (2.8%) |
Time of Departure to Work by Sex in Brown County
The most frequent times of departure to work in Brown County are 12:00 AM to 4:59 AM (1,355, 14.6%) for males and 7:30 AM to 7:59 AM (963, 11.4%) for females.
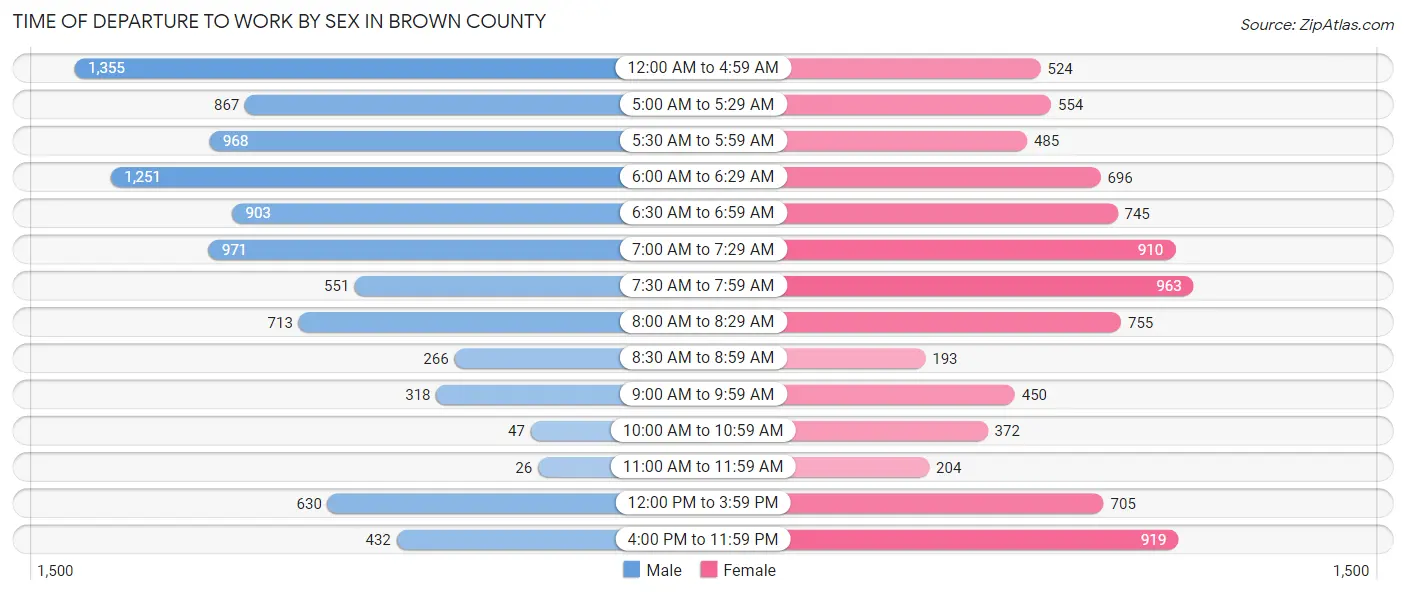
| Time of Departure | Male | Female |
| 12:00 AM to 4:59 AM | 1,355 (14.6%) | 524 (6.2%) |
| 5:00 AM to 5:29 AM | 867 (9.3%) | 554 (6.5%) |
| 5:30 AM to 5:59 AM | 968 (10.4%) | 485 (5.7%) |
| 6:00 AM to 6:29 AM | 1,251 (13.5%) | 696 (8.2%) |
| 6:30 AM to 6:59 AM | 903 (9.7%) | 745 (8.8%) |
| 7:00 AM to 7:29 AM | 971 (10.4%) | 910 (10.7%) |
| 7:30 AM to 7:59 AM | 551 (5.9%) | 963 (11.4%) |
| 8:00 AM to 8:29 AM | 713 (7.7%) | 755 (8.9%) |
| 8:30 AM to 8:59 AM | 266 (2.9%) | 193 (2.3%) |
| 9:00 AM to 9:59 AM | 318 (3.4%) | 450 (5.3%) |
| 10:00 AM to 10:59 AM | 47 (0.5%) | 372 (4.4%) |
| 11:00 AM to 11:59 AM | 26 (0.3%) | 204 (2.4%) |
| 12:00 PM to 3:59 PM | 630 (6.8%) | 705 (8.3%) |
| 4:00 PM to 11:59 PM | 432 (4.6%) | 919 (10.8%) |
| Total | 9,298 (100.0%) | 8,475 (100.0%) |
Housing Occupancy in Brown County
Occupancy by Ownership in Brown County
Of the total 16,958 dwellings in Brown County, owner-occupied units account for 12,647 (74.6%), while renter-occupied units make up 4,311 (25.4%).
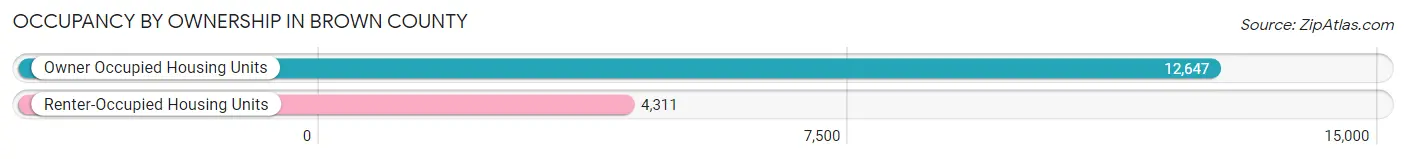
| Occupancy | # Housing Units | % Housing Units |
| Owner Occupied Housing Units | 12,647 | 74.6% |
| Renter-Occupied Housing Units | 4,311 | 25.4% |
| Total Occupied Housing Units | 16,958 | 100.0% |
Occupancy by Household Size in Brown County
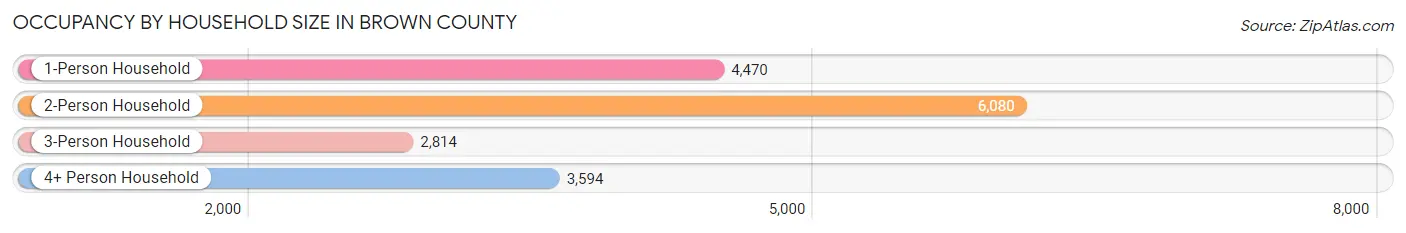
| Household Size | # Housing Units | % Housing Units |
| 1-Person Household | 4,470 | 26.4% |
| 2-Person Household | 6,080 | 35.8% |
| 3-Person Household | 2,814 | 16.6% |
| 4+ Person Household | 3,594 | 21.2% |
| Total Housing Units | 16,958 | 100.0% |
Occupancy by Ownership by Household Size in Brown County
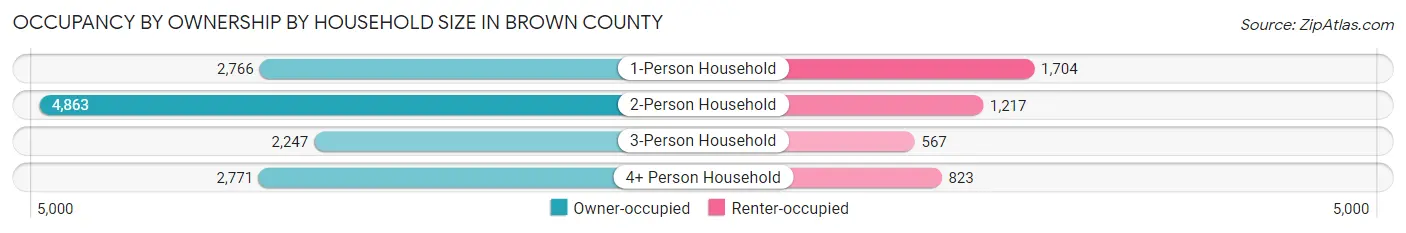
| Household Size | Owner-occupied | Renter-occupied |
| 1-Person Household | 2,766 (61.9%) | 1,704 (38.1%) |
| 2-Person Household | 4,863 (80.0%) | 1,217 (20.0%) |
| 3-Person Household | 2,247 (79.8%) | 567 (20.2%) |
| 4+ Person Household | 2,771 (77.1%) | 823 (22.9%) |
| Total Housing Units | 12,647 (74.6%) | 4,311 (25.4%) |
Occupancy by Educational Attainment in Brown County
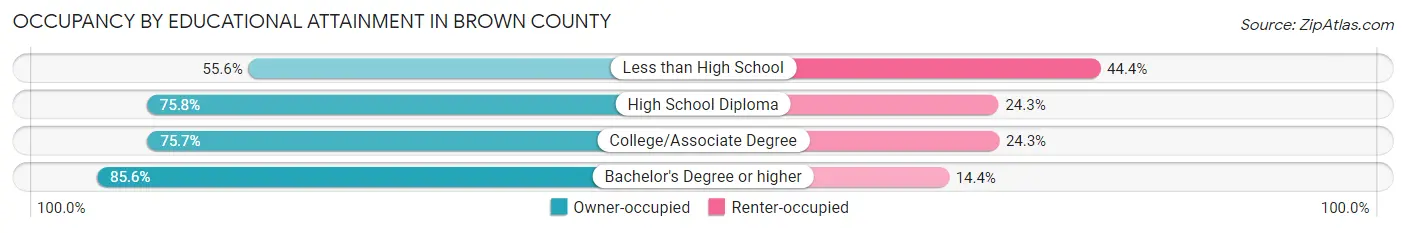
| Household Size | Owner-occupied | Renter-occupied |
| Less than High School | 1,192 (55.6%) | 952 (44.4%) |
| High School Diploma | 5,329 (75.7%) | 1,706 (24.2%) |
| College/Associate Degree | 4,060 (75.7%) | 1,306 (24.3%) |
| Bachelor's Degree or higher | 2,066 (85.6%) | 347 (14.4%) |
Occupancy by Age of Householder in Brown County
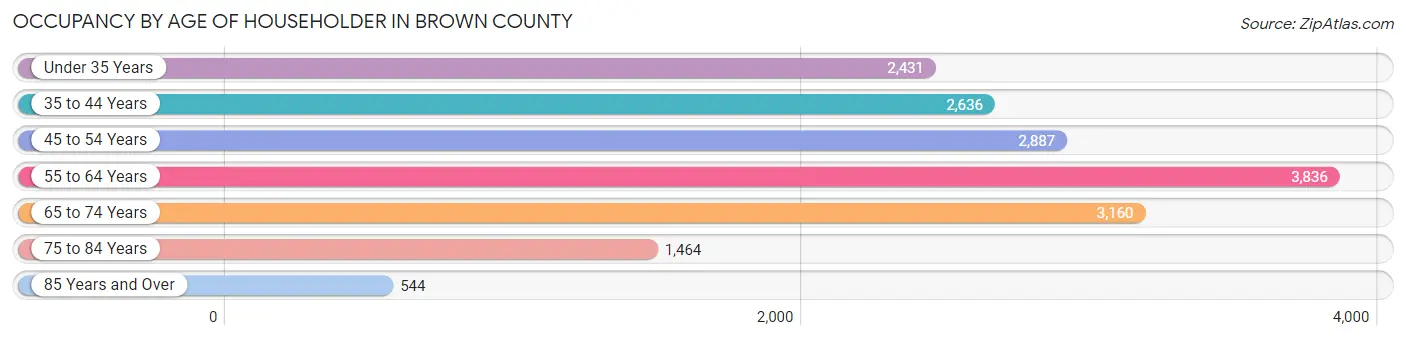
| Age Bracket | # Households | % Households |
| Under 35 Years | 2,431 | 14.3% |
| 35 to 44 Years | 2,636 | 15.5% |
| 45 to 54 Years | 2,887 | 17.0% |
| 55 to 64 Years | 3,836 | 22.6% |
| 65 to 74 Years | 3,160 | 18.6% |
| 75 to 84 Years | 1,464 | 8.6% |
| 85 Years and Over | 544 | 3.2% |
| Total | 16,958 | 100.0% |
Housing Finances in Brown County
Median Income by Occupancy in Brown County
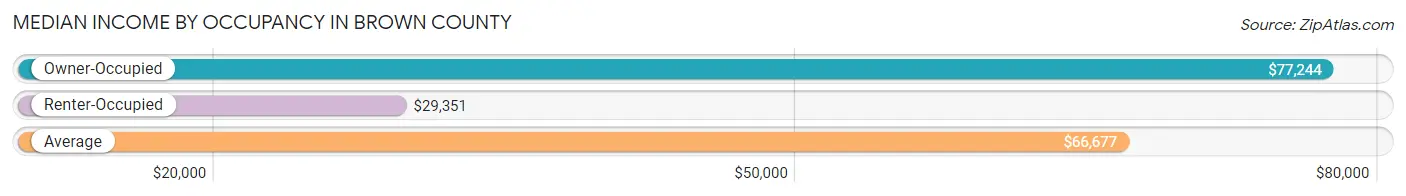
| Occupancy Type | # Households | Median Income |
| Owner-Occupied | 12,647 (74.6%) | $77,244 |
| Renter-Occupied | 4,311 (25.4%) | $29,351 |
| Average | 16,958 (100.0%) | $66,677 |
Occupancy by Householder Income Bracket in Brown County
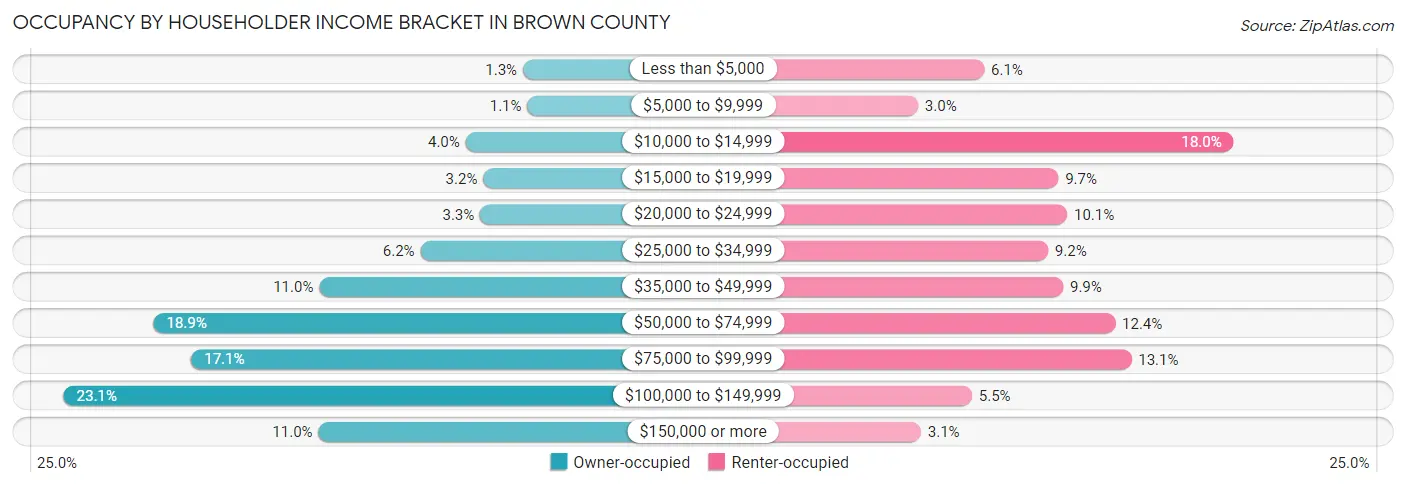
| Income Bracket | Owner-occupied | Renter-occupied |
| Less than $5,000 | 160 (1.3%) | 264 (6.1%) |
| $5,000 to $9,999 | 134 (1.1%) | 128 (3.0%) |
| $10,000 to $14,999 | 506 (4.0%) | 776 (18.0%) |
| $15,000 to $19,999 | 400 (3.2%) | 416 (9.7%) |
| $20,000 to $24,999 | 419 (3.3%) | 434 (10.1%) |
| $25,000 to $34,999 | 778 (6.1%) | 395 (9.2%) |
| $35,000 to $49,999 | 1,388 (11.0%) | 426 (9.9%) |
| $50,000 to $74,999 | 2,385 (18.9%) | 533 (12.4%) |
| $75,000 to $99,999 | 2,158 (17.1%) | 566 (13.1%) |
| $100,000 to $149,999 | 2,926 (23.1%) | 239 (5.5%) |
| $150,000 or more | 1,393 (11.0%) | 134 (3.1%) |
| Total | 12,647 (100.0%) | 4,311 (100.0%) |
Monthly Housing Cost Tiers in Brown County
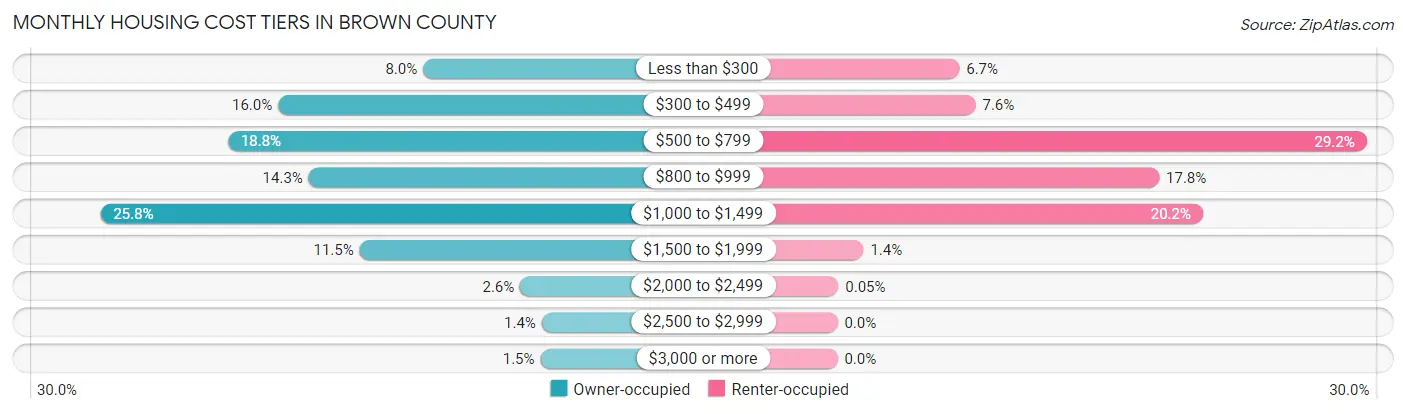
| Monthly Cost | Owner-occupied | Renter-occupied |
| Less than $300 | 1,011 (8.0%) | 290 (6.7%) |
| $300 to $499 | 2,024 (16.0%) | 329 (7.6%) |
| $500 to $799 | 2,375 (18.8%) | 1,260 (29.2%) |
| $800 to $999 | 1,810 (14.3%) | 766 (17.8%) |
| $1,000 to $1,499 | 3,266 (25.8%) | 870 (20.2%) |
| $1,500 to $1,999 | 1,455 (11.5%) | 62 (1.4%) |
| $2,000 to $2,499 | 333 (2.6%) | 2 (0.1%) |
| $2,500 to $2,999 | 182 (1.4%) | 0 (0.0%) |
| $3,000 or more | 191 (1.5%) | 0 (0.0%) |
| Total | 12,647 (100.0%) | 4,311 (100.0%) |
Physical Housing Characteristics in Brown County
Housing Structures in Brown County
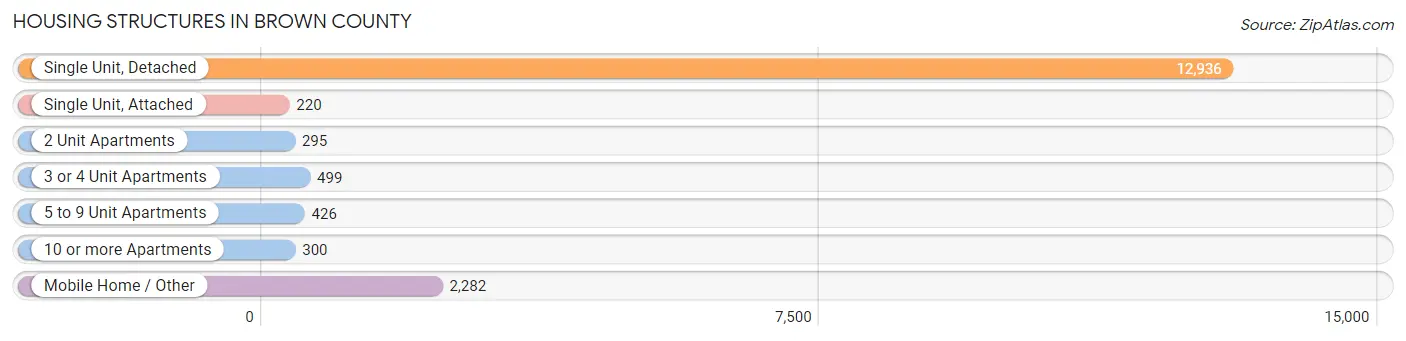
| Structure Type | # Housing Units | % Housing Units |
| Single Unit, Detached | 12,936 | 76.3% |
| Single Unit, Attached | 220 | 1.3% |
| 2 Unit Apartments | 295 | 1.7% |
| 3 or 4 Unit Apartments | 499 | 2.9% |
| 5 to 9 Unit Apartments | 426 | 2.5% |
| 10 or more Apartments | 300 | 1.8% |
| Mobile Home / Other | 2,282 | 13.5% |
| Total | 16,958 | 100.0% |
Housing Structures by Occupancy in Brown County
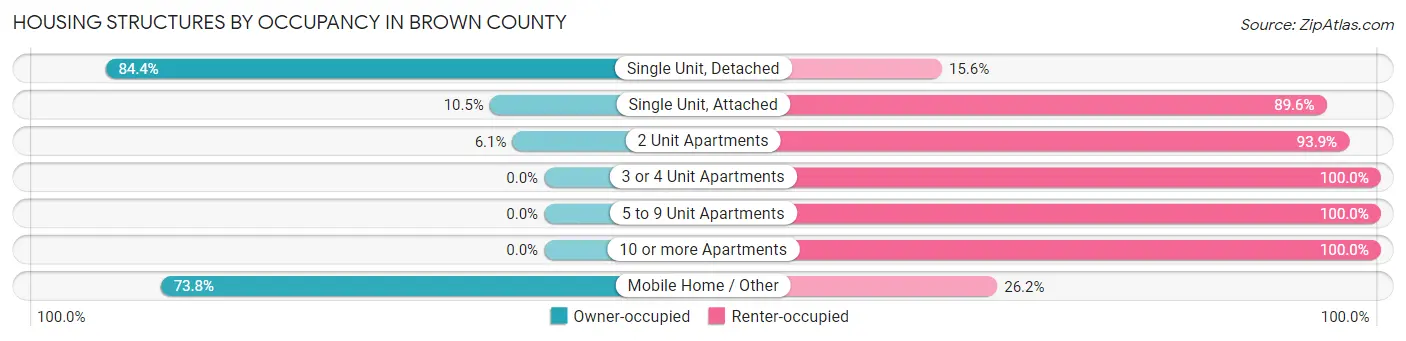
| Structure Type | Owner-occupied | Renter-occupied |
| Single Unit, Detached | 10,922 (84.4%) | 2,014 (15.6%) |
| Single Unit, Attached | 23 (10.4%) | 197 (89.5%) |
| 2 Unit Apartments | 18 (6.1%) | 277 (93.9%) |
| 3 or 4 Unit Apartments | 0 (0.0%) | 499 (100.0%) |
| 5 to 9 Unit Apartments | 0 (0.0%) | 426 (100.0%) |
| 10 or more Apartments | 0 (0.0%) | 300 (100.0%) |
| Mobile Home / Other | 1,684 (73.8%) | 598 (26.2%) |
| Total | 12,647 (74.6%) | 4,311 (25.4%) |
Housing Structures by Number of Rooms in Brown County
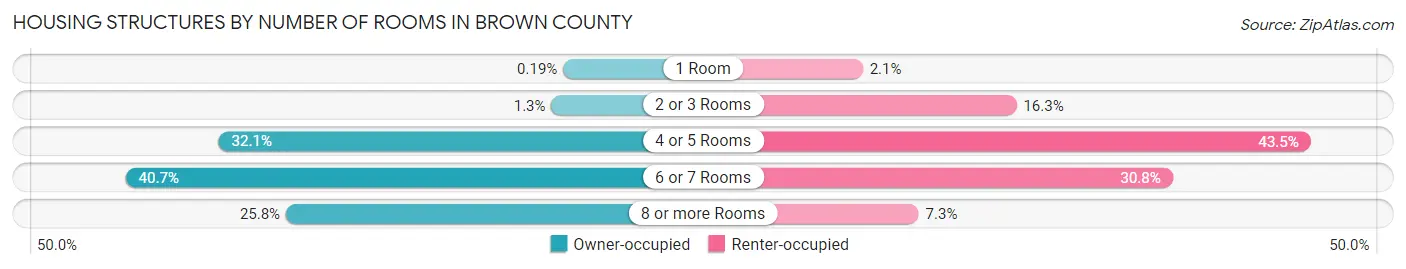
| Number of Rooms | Owner-occupied | Renter-occupied |
| 1 Room | 24 (0.2%) | 91 (2.1%) |
| 2 or 3 Rooms | 162 (1.3%) | 704 (16.3%) |
| 4 or 5 Rooms | 4,053 (32.1%) | 1,876 (43.5%) |
| 6 or 7 Rooms | 5,141 (40.6%) | 1,326 (30.8%) |
| 8 or more Rooms | 3,267 (25.8%) | 314 (7.3%) |
| Total | 12,647 (100.0%) | 4,311 (100.0%) |
Housing Structure by Heating Type in Brown County
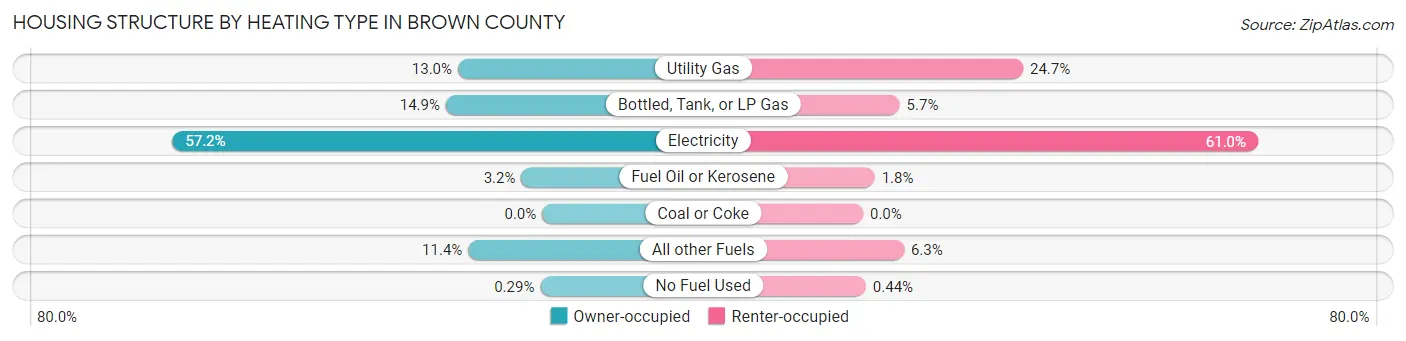
| Heating Type | Owner-occupied | Renter-occupied |
| Utility Gas | 1,647 (13.0%) | 1,066 (24.7%) |
| Bottled, Tank, or LP Gas | 1,883 (14.9%) | 244 (5.7%) |
| Electricity | 7,228 (57.2%) | 2,631 (61.0%) |
| Fuel Oil or Kerosene | 406 (3.2%) | 78 (1.8%) |
| Coal or Coke | 0 (0.0%) | 0 (0.0%) |
| All other Fuels | 1,446 (11.4%) | 273 (6.3%) |
| No Fuel Used | 37 (0.3%) | 19 (0.4%) |
| Total | 12,647 (100.0%) | 4,311 (100.0%) |
Household Vehicle Usage in Brown County
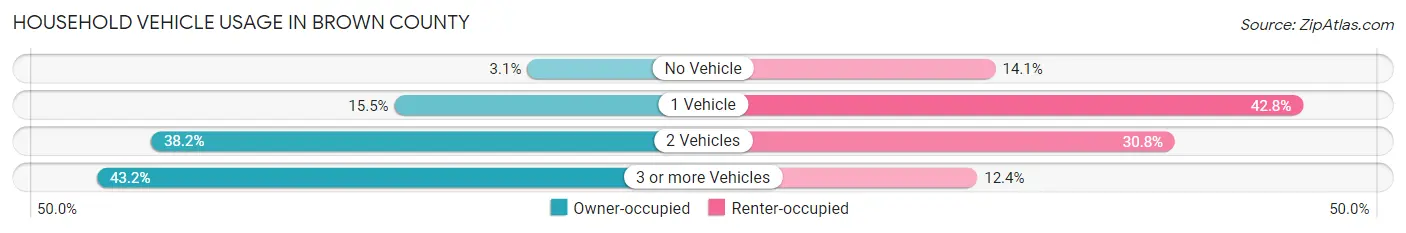
| Vehicles per Household | Owner-occupied | Renter-occupied |
| No Vehicle | 389 (3.1%) | 606 (14.1%) |
| 1 Vehicle | 1,958 (15.5%) | 1,844 (42.8%) |
| 2 Vehicles | 4,831 (38.2%) | 1,328 (30.8%) |
| 3 or more Vehicles | 5,469 (43.2%) | 533 (12.4%) |
| Total | 12,647 (100.0%) | 4,311 (100.0%) |
Real Estate & Mortgages in Brown County
Real Estate and Mortgage Overview in Brown County
| Characteristic | Without Mortgage | With Mortgage |
| Housing Units | 5,082 | 7,565 |
| Median Property Value | $151,300 | $175,300 |
| Median Household Income | $60,945 | $976 |
| Monthly Housing Costs | $459 | $191 |
| Real Estate Taxes | $1,344 | $106 |
Property Value by Mortgage Status in Brown County
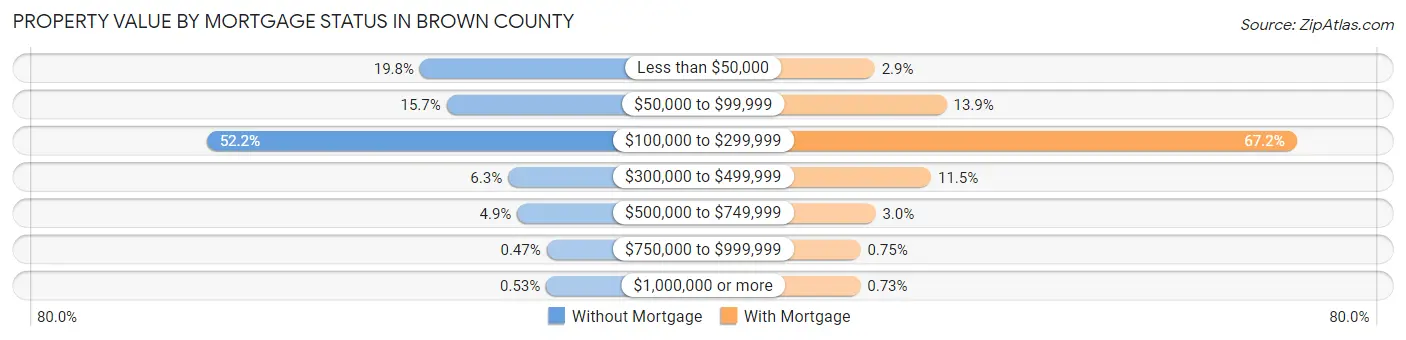
| Property Value | Without Mortgage | With Mortgage |
| Less than $50,000 | 1,005 (19.8%) | 221 (2.9%) |
| $50,000 to $99,999 | 798 (15.7%) | 1,049 (13.9%) |
| $100,000 to $299,999 | 2,655 (52.2%) | 5,083 (67.2%) |
| $300,000 to $499,999 | 322 (6.3%) | 871 (11.5%) |
| $500,000 to $749,999 | 251 (4.9%) | 229 (3.0%) |
| $750,000 to $999,999 | 24 (0.5%) | 57 (0.7%) |
| $1,000,000 or more | 27 (0.5%) | 55 (0.7%) |
| Total | 5,082 (100.0%) | 7,565 (100.0%) |
Household Income by Mortgage Status in Brown County
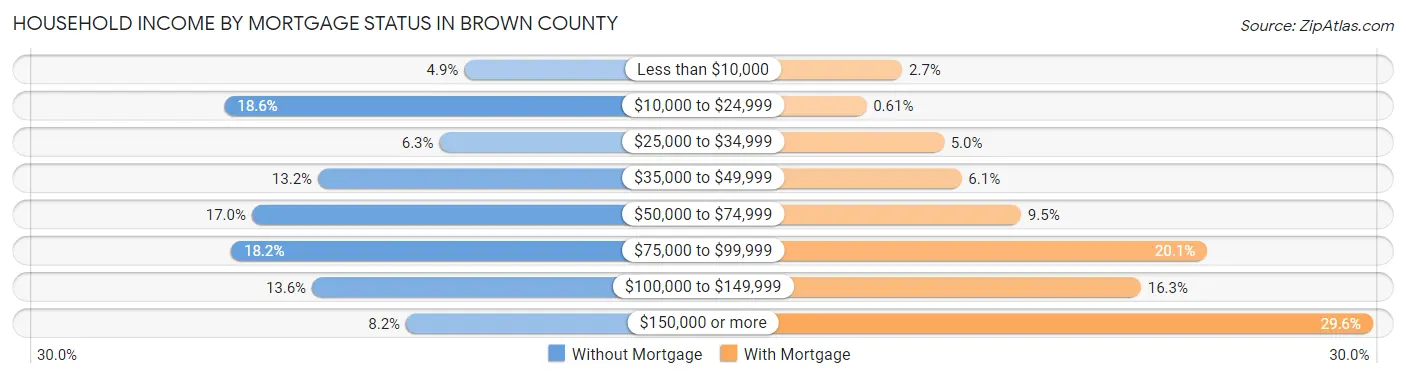
| Household Income | Without Mortgage | With Mortgage |
| Less than $10,000 | 248 (4.9%) | 201 (2.7%) |
| $10,000 to $24,999 | 944 (18.6%) | 46 (0.6%) |
| $25,000 to $34,999 | 320 (6.3%) | 381 (5.0%) |
| $35,000 to $49,999 | 673 (13.2%) | 458 (6.0%) |
| $50,000 to $74,999 | 865 (17.0%) | 715 (9.5%) |
| $75,000 to $99,999 | 925 (18.2%) | 1,520 (20.1%) |
| $100,000 to $149,999 | 690 (13.6%) | 1,233 (16.3%) |
| $150,000 or more | 417 (8.2%) | 2,236 (29.6%) |
| Total | 5,082 (100.0%) | 7,565 (100.0%) |
Property Value to Household Income Ratio in Brown County
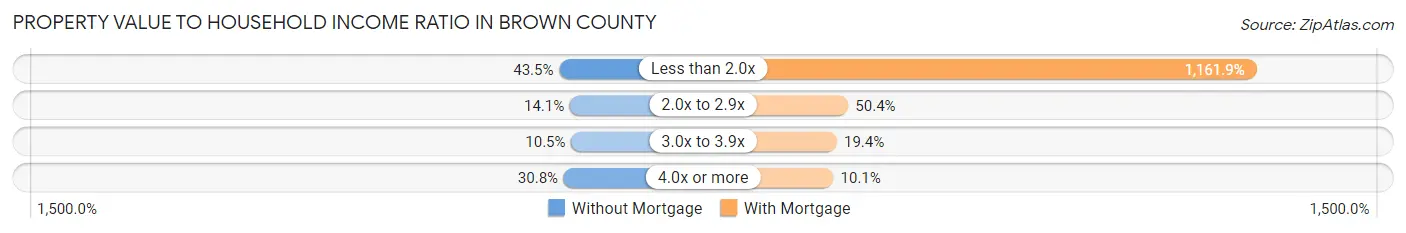
| Value-to-Income Ratio | Without Mortgage | With Mortgage |
| Less than 2.0x | 2,208 (43.4%) | 87,901 (1,161.9%) |
| 2.0x to 2.9x | 715 (14.1%) | 3,815 (50.4%) |
| 3.0x to 3.9x | 534 (10.5%) | 1,466 (19.4%) |
| 4.0x or more | 1,566 (30.8%) | 761 (10.1%) |
| Total | 5,082 (100.0%) | 7,565 (100.0%) |
Real Estate Taxes by Mortgage Status in Brown County
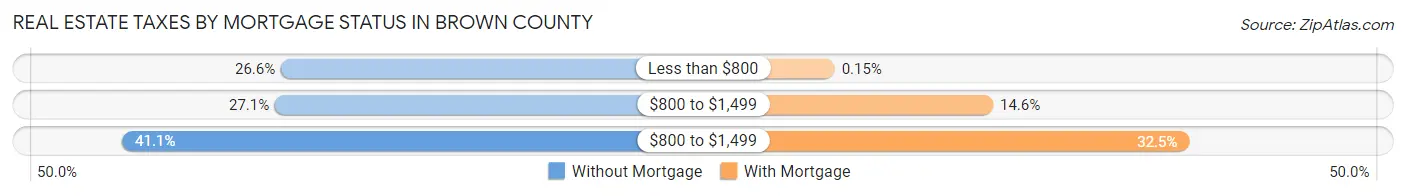
| Property Taxes | Without Mortgage | With Mortgage |
| Less than $800 | 1,351 (26.6%) | 11 (0.2%) |
| $800 to $1,499 | 1,379 (27.1%) | 1,105 (14.6%) |
| $800 to $1,499 | 2,088 (41.1%) | 2,461 (32.5%) |
| Total | 5,082 (100.0%) | 7,565 (100.0%) |
Health & Disability in Brown County
Health Insurance Coverage by Age in Brown County
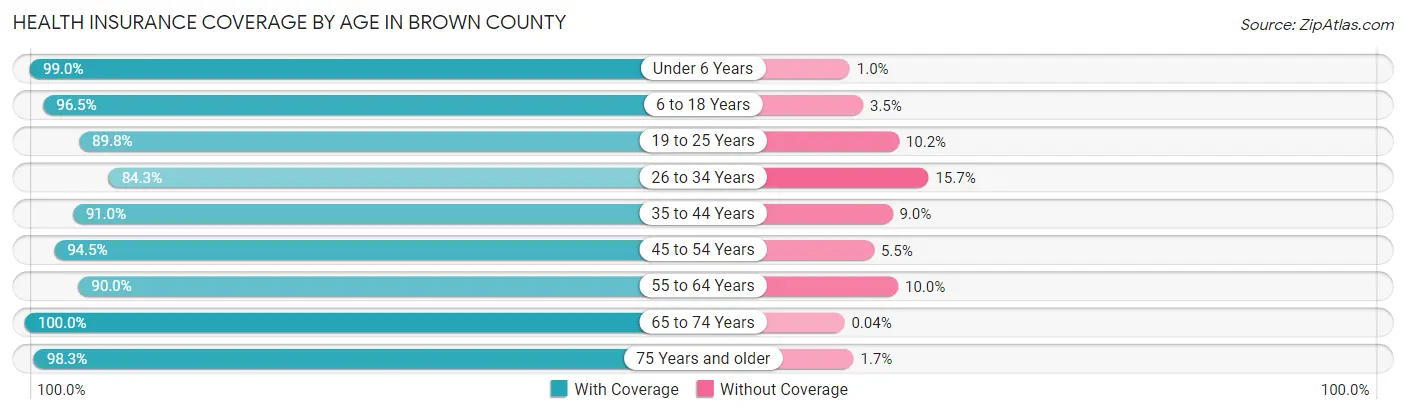
| Age Bracket | With Coverage | Without Coverage |
| Under 6 Years | 2,979 (99.0%) | 31 (1.0%) |
| 6 to 18 Years | 7,344 (96.5%) | 266 (3.5%) |
| 19 to 25 Years | 2,787 (89.8%) | 316 (10.2%) |
| 26 to 34 Years | 3,823 (84.3%) | 712 (15.7%) |
| 35 to 44 Years | 4,715 (91.0%) | 465 (9.0%) |
| 45 to 54 Years | 5,291 (94.5%) | 310 (5.5%) |
| 55 to 64 Years | 5,846 (90.0%) | 652 (10.0%) |
| 65 to 74 Years | 4,611 (100.0%) | 2 (0.0%) |
| 75 Years and older | 2,976 (98.3%) | 52 (1.7%) |
| Total | 40,372 (93.5%) | 2,806 (6.5%) |
Health Insurance Coverage by Citizenship Status in Brown County
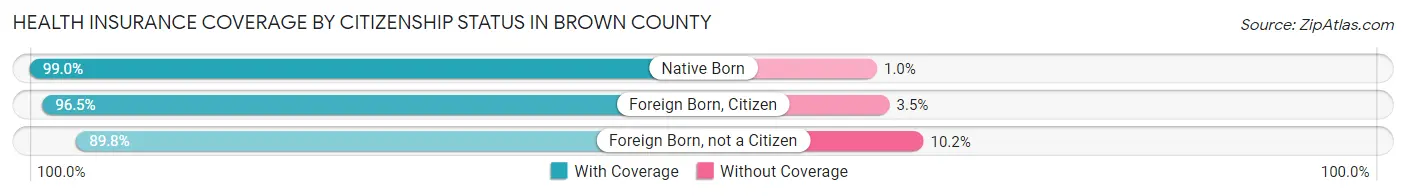
| Citizenship Status | With Coverage | Without Coverage |
| Native Born | 2,979 (99.0%) | 31 (1.0%) |
| Foreign Born, Citizen | 7,344 (96.5%) | 266 (3.5%) |
| Foreign Born, not a Citizen | 2,787 (89.8%) | 316 (10.2%) |
Health Insurance Coverage by Household Income in Brown County
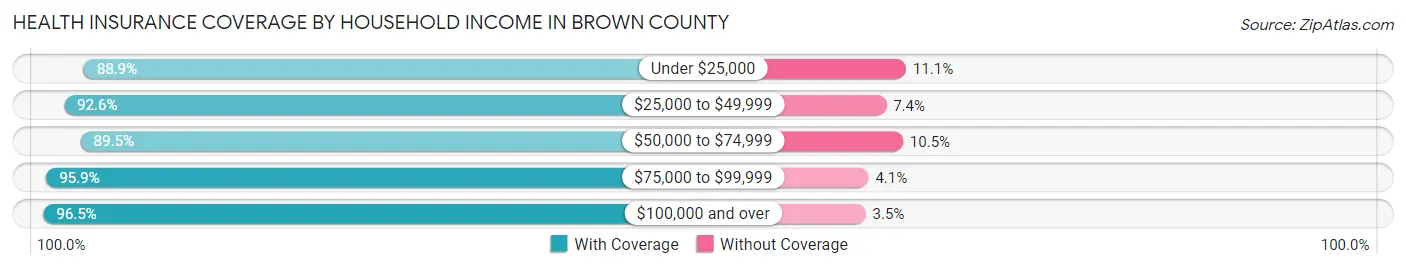
| Household Income | With Coverage | Without Coverage |
| Under $25,000 | 5,708 (88.9%) | 713 (11.1%) |
| $25,000 to $49,999 | 6,668 (92.6%) | 532 (7.4%) |
| $50,000 to $74,999 | 6,165 (89.5%) | 724 (10.5%) |
| $75,000 to $99,999 | 7,001 (95.9%) | 296 (4.1%) |
| $100,000 and over | 14,779 (96.5%) | 540 (3.5%) |
Public vs Private Health Insurance Coverage by Age in Brown County
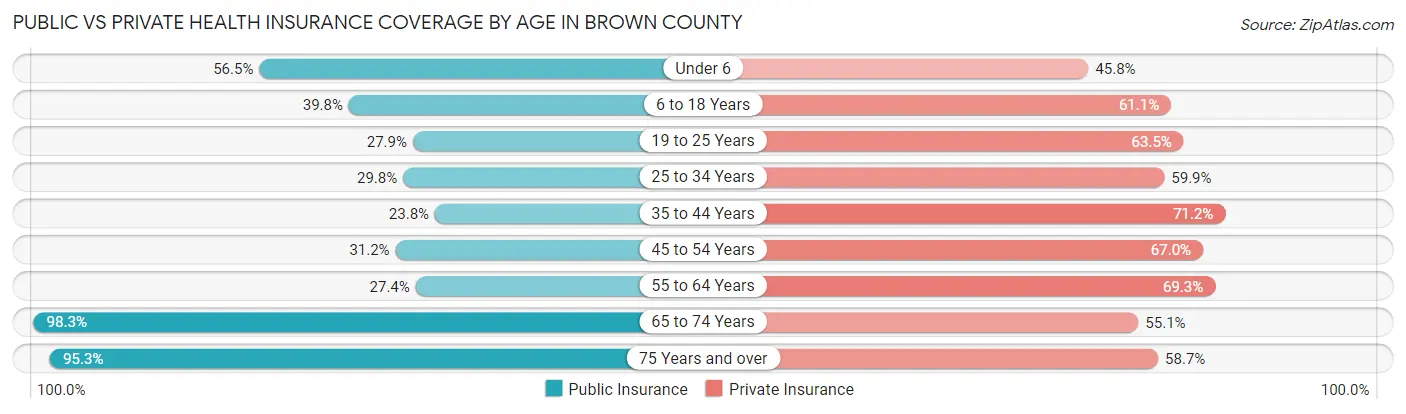
| Age Bracket | Public Insurance | Private Insurance |
| Under 6 | 1,699 (56.5%) | 1,378 (45.8%) |
| 6 to 18 Years | 3,031 (39.8%) | 4,650 (61.1%) |
| 19 to 25 Years | 867 (27.9%) | 1,969 (63.4%) |
| 25 to 34 Years | 1,349 (29.7%) | 2,715 (59.9%) |
| 35 to 44 Years | 1,235 (23.8%) | 3,686 (71.2%) |
| 45 to 54 Years | 1,746 (31.2%) | 3,754 (67.0%) |
| 55 to 64 Years | 1,782 (27.4%) | 4,501 (69.3%) |
| 65 to 74 Years | 4,535 (98.3%) | 2,540 (55.1%) |
| 75 Years and over | 2,885 (95.3%) | 1,778 (58.7%) |
| Total | 19,129 (44.3%) | 26,971 (62.5%) |
Disability Status by Sex by Age in Brown County
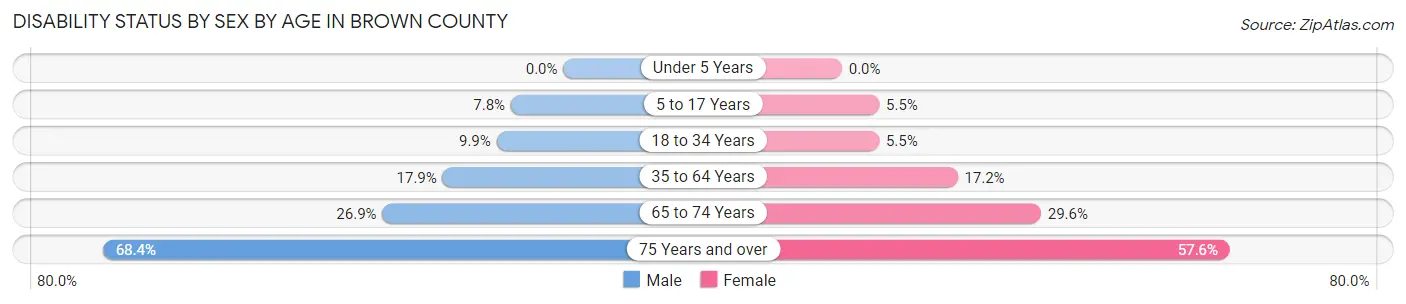
| Age Bracket | Male | Female |
| Under 5 Years | 0 (0.0%) | 0 (0.0%) |
| 5 to 17 Years | 296 (7.8%) | 203 (5.5%) |
| 18 to 34 Years | 415 (9.9%) | 226 (5.5%) |
| 35 to 64 Years | 1,563 (17.9%) | 1,470 (17.2%) |
| 65 to 74 Years | 603 (26.9%) | 700 (29.5%) |
| 75 Years and over | 814 (68.4%) | 1,059 (57.6%) |
Disability Class by Sex by Age in Brown County
Disability Class: Hearing Difficulty
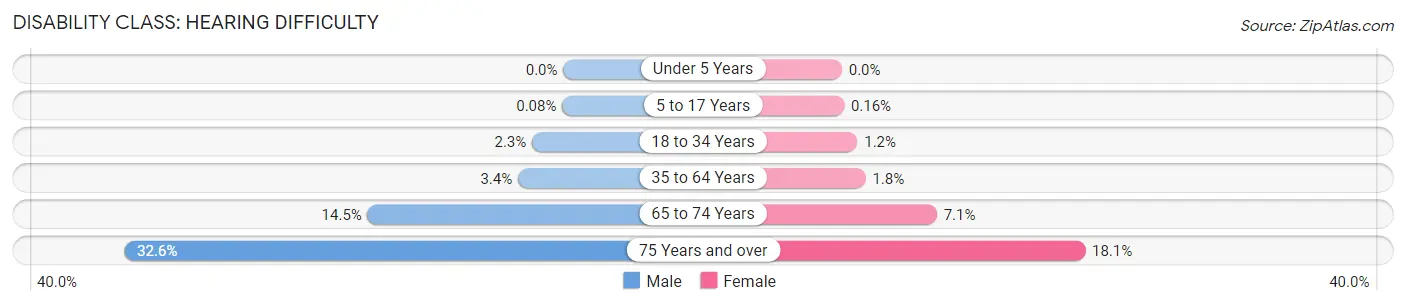
| Age Bracket | Male | Female |
| Under 5 Years | 0 (0.0%) | 0 (0.0%) |
| 5 to 17 Years | 3 (0.1%) | 6 (0.2%) |
| 18 to 34 Years | 97 (2.3%) | 47 (1.1%) |
| 35 to 64 Years | 293 (3.4%) | 151 (1.8%) |
| 65 to 74 Years | 326 (14.5%) | 167 (7.0%) |
| 75 Years and over | 388 (32.6%) | 332 (18.1%) |
Disability Class: Vision Difficulty
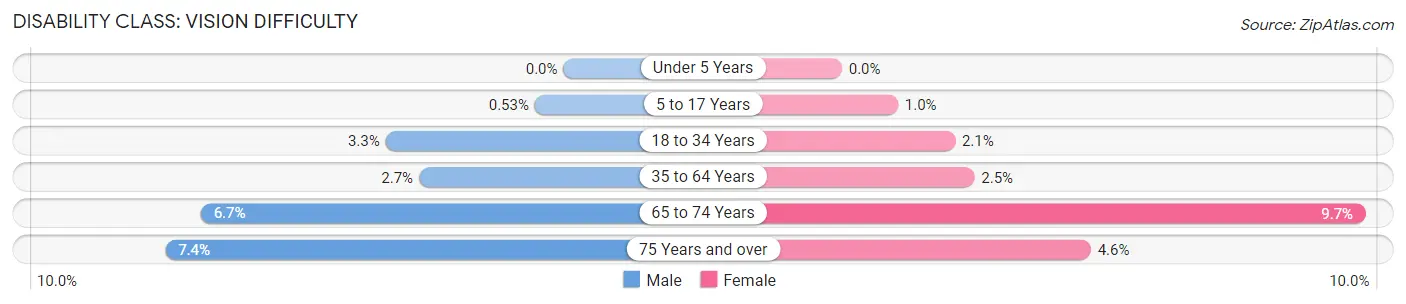
| Age Bracket | Male | Female |
| Under 5 Years | 0 (0.0%) | 0 (0.0%) |
| 5 to 17 Years | 20 (0.5%) | 38 (1.0%) |
| 18 to 34 Years | 138 (3.3%) | 86 (2.1%) |
| 35 to 64 Years | 234 (2.7%) | 211 (2.5%) |
| 65 to 74 Years | 151 (6.7%) | 230 (9.7%) |
| 75 Years and over | 88 (7.4%) | 85 (4.6%) |
Disability Class: Cognitive Difficulty
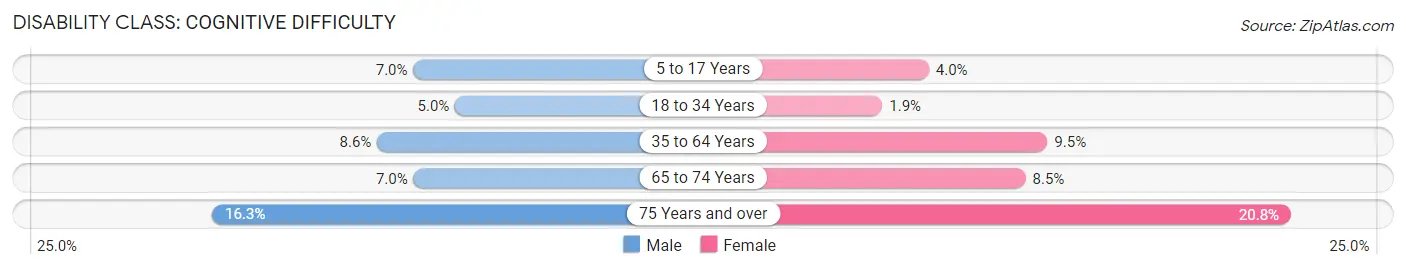
| Age Bracket | Male | Female |
| 5 to 17 Years | 265 (7.0%) | 148 (4.0%) |
| 18 to 34 Years | 210 (5.0%) | 77 (1.9%) |
| 35 to 64 Years | 753 (8.6%) | 817 (9.5%) |
| 65 to 74 Years | 156 (7.0%) | 202 (8.5%) |
| 75 Years and over | 194 (16.3%) | 383 (20.8%) |
Disability Class: Ambulatory Difficulty
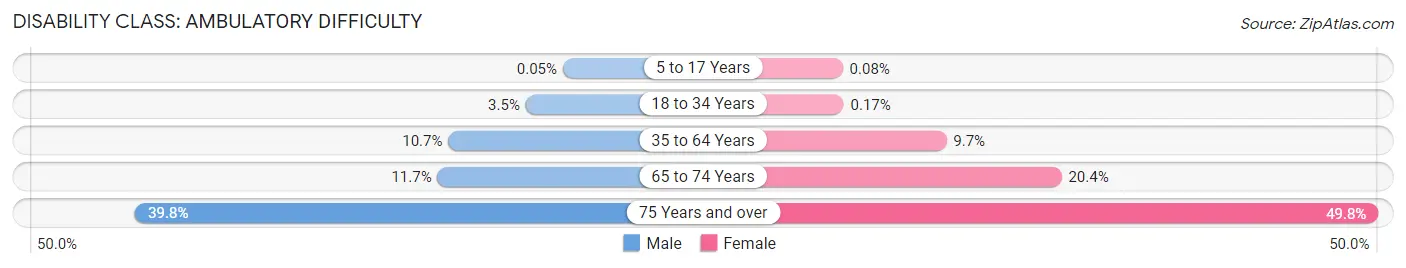
| Age Bracket | Male | Female |
| 5 to 17 Years | 2 (0.1%) | 3 (0.1%) |
| 18 to 34 Years | 146 (3.5%) | 7 (0.2%) |
| 35 to 64 Years | 931 (10.7%) | 830 (9.7%) |
| 65 to 74 Years | 262 (11.7%) | 483 (20.4%) |
| 75 Years and over | 473 (39.8%) | 915 (49.8%) |
Disability Class: Self-Care Difficulty
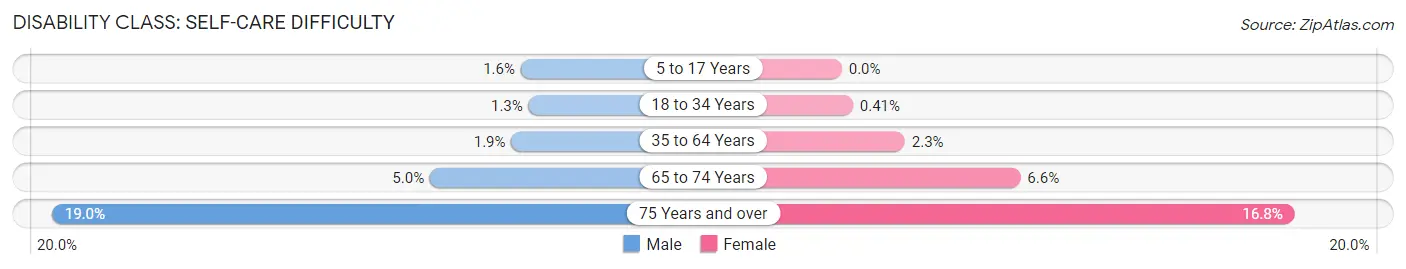
| Age Bracket | Male | Female |
| 5 to 17 Years | 60 (1.6%) | 0 (0.0%) |
| 18 to 34 Years | 54 (1.3%) | 17 (0.4%) |
| 35 to 64 Years | 168 (1.9%) | 200 (2.3%) |
| 65 to 74 Years | 111 (5.0%) | 157 (6.6%) |
| 75 Years and over | 226 (19.0%) | 309 (16.8%) |
Technology Access in Brown County
Computing Device Access in Brown County
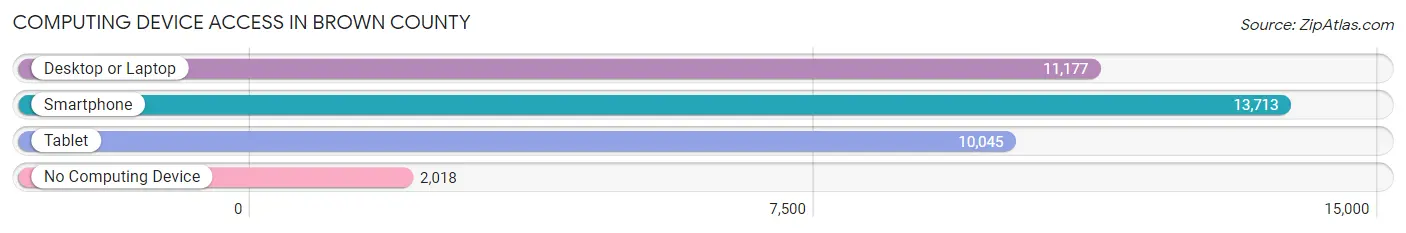
| Device Type | # Households | % Households |
| Desktop or Laptop | 11,177 | 65.9% |
| Smartphone | 13,713 | 80.9% |
| Tablet | 10,045 | 59.2% |
| No Computing Device | 2,018 | 11.9% |
| Total | 16,958 | 100.0% |
Internet Access in Brown County
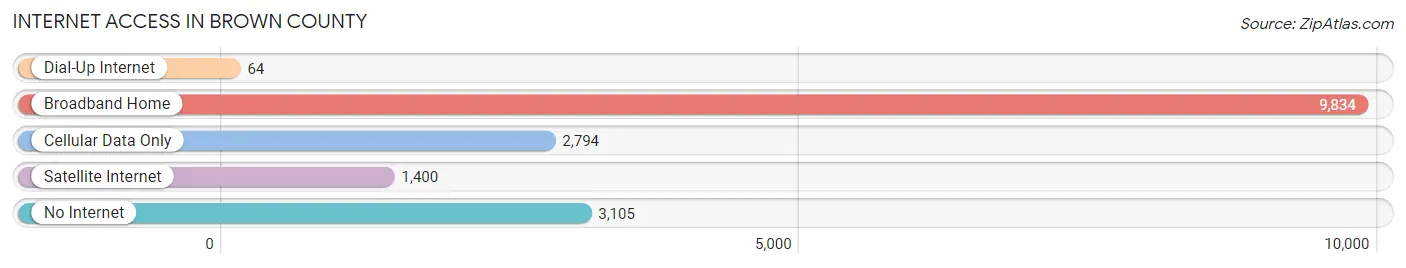
| Internet Type | # Households | % Households |
| Dial-Up Internet | 64 | 0.4% |
| Broadband Home | 9,834 | 58.0% |
| Cellular Data Only | 2,794 | 16.5% |
| Satellite Internet | 1,400 | 8.3% |
| No Internet | 3,105 | 18.3% |
| Total | 16,958 | 100.0% |
Brown County Summary
Brown County, Ohio is located in the southwestern part of the state, and is bordered by Adams, Clermont, Highland, and Clinton counties. The county seat is Georgetown, and the county was named after Jacob Brown, a major general in the War of 1812. The county has a total area of 437 square miles, of which 434 square miles is land and 3 square miles is water.
Geography
Brown County is located in the Appalachian Plateau region of Ohio, and is characterized by rolling hills and valleys. The county is drained by the East Fork of the Little Miami River, which flows through the county from north to south. The highest point in the county is located in the southwestern corner, at an elevation of 1,068 feet. The county is mostly forested, with the majority of the land being used for agricultural purposes.
Demographics
As of the 2010 census, the population of Brown County was 44,846, with a population density of 103 people per square mile. The racial makeup of the county was 95.3% White, 1.3% African American, 0.3% Native American, 0.5% Asian, 0.1% Pacific Islander, 1.2% from other races, and 1.3% from two or more races. Hispanic or Latino of any race were 2.7% of the population.
The median income for a household in the county was $41,945, and the median income for a family was $50,945. The per capita income for the county was $20,945. About 11.2% of families and 14.3% of the population were below the poverty line, including 19.2% of those under age 18 and 8.7% of those age 65 or over.
Economy
The economy of Brown County is largely based on agriculture, with the majority of the land being used for farming. The county is home to several large farms, including the Brown County Farm Bureau, which is the largest farm in the county. Other major industries in the county include manufacturing, retail, and tourism.
The county is home to several large employers, including Brown County Hospital, Brown County Schools, and Brown County Public Library. The county is also home to several small businesses, including restaurants, shops, and other services.
Brown County is also home to several tourist attractions, including the Brown County State Park, which is the largest state park in Ohio. The park is home to several hiking trails, camping sites, and other recreational activities. The county is also home to several wineries, breweries, and distilleries, as well as several historic sites.
Conclusion
Brown County, Ohio is a rural county located in the southwestern part of the state. The county is characterized by rolling hills and valleys, and is mostly forested. The county has a population of 44,846, and the economy is largely based on agriculture. The county is home to several large employers, as well as several tourist attractions.
Common Questions
What is Per Capita Income in Brown County?
Per Capita income in Brown County is $31,823.
What is the Median Family Income in Brown County?
Median Family Income in Brown County is $78,695.
What is the Median Household income in Brown County?
Median Household Income in Brown County is $66,677.
What is Income or Wage Gap in Brown County?
Income or Wage Gap in Brown County is 39.1%.
Women in Brown County earn 60.9 cents for every dollar earned by a man.
What is Family Income Deficit in Brown County?
Family Income Deficit in Brown County is $10,236.
Families that are below poverty line in Brown County earn $10,236 less on average than the poverty threshold level.
What is Inequality or Gini Index in Brown County?
Inequality or Gini Index in Brown County is 0.44.
What is the Total Population of Brown County?
Total Population of Brown County is 43,715.
What is the Total Male Population of Brown County?
Total Male Population of Brown County is 21,791.
What is the Total Female Population of Brown County?
Total Female Population of Brown County is 21,924.
What is the Ratio of Males per 100 Females in Brown County?
There are 99.39 Males per 100 Females in Brown County.
What is the Ratio of Females per 100 Males in Brown County?
There are 100.61 Females per 100 Males in Brown County.
What is the Median Population Age in Brown County?
Median Population Age in Brown County is 41.9 Years.
What is the Average Family Size in Brown County
Average Family Size in Brown County is 3.1 People.
What is the Average Household Size in Brown County
Average Household Size in Brown County is 2.5 People.
How Large is the Labor Force in Brown County?
There are 19,948 People in the Labor Forcein in Brown County.
What is the Percentage of People in the Labor Force in Brown County?
57.0% of People are in the Labor Force in Brown County.
What is the Unemployment Rate in Brown County?
Unemployment Rate in Brown County is 4.4%.