Ashland County, OH Map & Demographics
Ashland County Map
Ashland County Overview
$30,303
PER CAPITA INCOME
$76,715
AVG FAMILY INCOME
$62,254
AVG HOUSEHOLD INCOME
37.3%
WAGE / INCOME GAP [ % ]
62.7¢/ $1
WAGE / INCOME GAP [ $ ]
$11,582
FAMILY INCOME DEFICIT
0.40
INEQUALITY / GINI INDEX
52,522
TOTAL POPULATION
26,094
MALE POPULATION
26,428
FEMALE POPULATION
98.74
MALES / 100 FEMALES
101.28
FEMALES / 100 MALES
41.5
MEDIAN AGE
3.0
AVG FAMILY SIZE
2.5
AVG HOUSEHOLD SIZE
25,677
LABOR FORCE [ PEOPLE ]
60.7%
PERCENT IN LABOR FORCE
3.7%
UNEMPLOYMENT RATE
Income in Ashland County
Income Overview in Ashland County
Per Capita Income in Ashland County is $30,303, while median incomes of families and households are $76,715 and $62,254 respectively.
| Characteristic | Number | Measure |
| Per Capita Income | 52,522 | $30,303 |
| Median Family Income | 13,681 | $76,715 |
| Mean Family Income | 13,681 | $89,722 |
| Median Household Income | 20,478 | $62,254 |
| Mean Household Income | 20,478 | $76,439 |
| Income Deficit | 13,681 | $11,582 |
| Wage / Income Gap (%) | 52,522 | 37.32% |
| Wage / Income Gap ($) | 52,522 | 62.68¢ per $1 |
| Gini / Inequality Index | 52,522 | 0.40 |
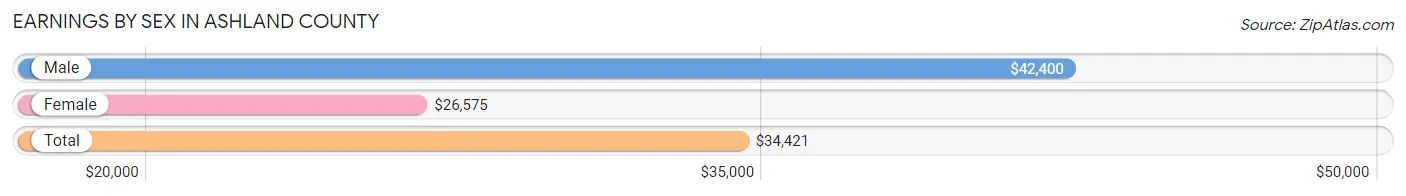
Earnings by Sex in Ashland County
Average Earnings in Ashland County are $34,421, $42,400 for men and $26,575 for women, a difference of 37.3%.
| Sex | Number | Average Earnings |
| Male | 14,643 (54.0%) | $42,400 |
| Female | 12,493 (46.0%) | $26,575 |
| Total | 27,136 (100.0%) | $34,421 |
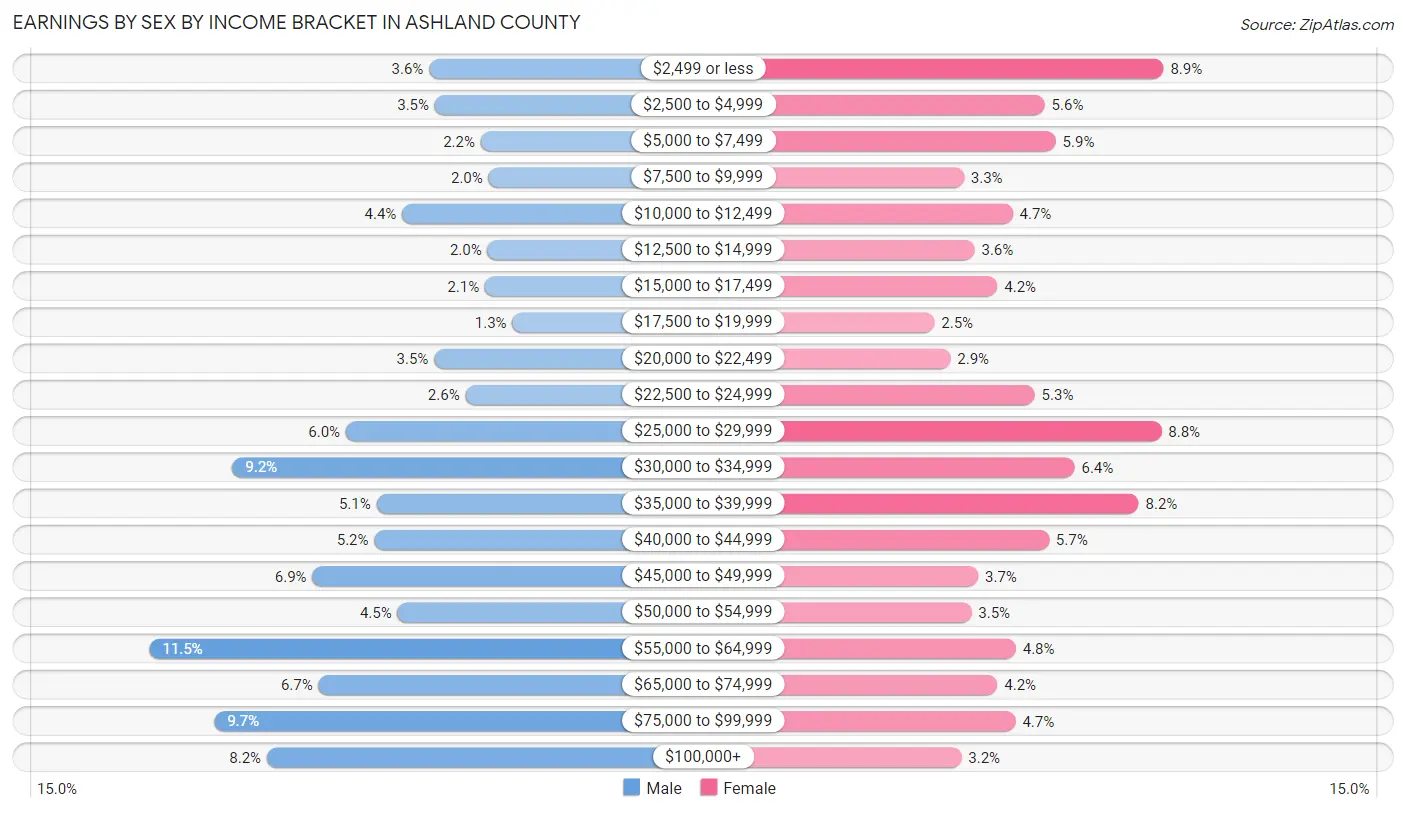
Earnings by Sex by Income Bracket in Ashland County
The most common earnings brackets in Ashland County are $55,000 to $64,999 for men (1,683 | 11.5%) and $2,499 or less for women (1,112 | 8.9%).
| Income | Male | Female |
| $2,499 or less | 531 (3.6%) | 1,112 (8.9%) |
| $2,500 to $4,999 | 508 (3.5%) | 694 (5.6%) |
| $5,000 to $7,499 | 319 (2.2%) | 733 (5.9%) |
| $7,500 to $9,999 | 287 (2.0%) | 411 (3.3%) |
| $10,000 to $12,499 | 643 (4.4%) | 582 (4.7%) |
| $12,500 to $14,999 | 291 (2.0%) | 448 (3.6%) |
| $15,000 to $17,499 | 302 (2.1%) | 528 (4.2%) |
| $17,500 to $19,999 | 189 (1.3%) | 307 (2.5%) |
| $20,000 to $22,499 | 511 (3.5%) | 364 (2.9%) |
| $22,500 to $24,999 | 382 (2.6%) | 660 (5.3%) |
| $25,000 to $29,999 | 874 (6.0%) | 1,105 (8.8%) |
| $30,000 to $34,999 | 1,342 (9.2%) | 800 (6.4%) |
| $35,000 to $39,999 | 748 (5.1%) | 1,025 (8.2%) |
| $40,000 to $44,999 | 757 (5.2%) | 710 (5.7%) |
| $45,000 to $49,999 | 1,012 (6.9%) | 461 (3.7%) |
| $50,000 to $54,999 | 662 (4.5%) | 437 (3.5%) |
| $55,000 to $64,999 | 1,683 (11.5%) | 594 (4.8%) |
| $65,000 to $74,999 | 987 (6.7%) | 528 (4.2%) |
| $75,000 to $99,999 | 1,416 (9.7%) | 592 (4.7%) |
| $100,000+ | 1,199 (8.2%) | 402 (3.2%) |
| Total | 14,643 (100.0%) | 12,493 (100.0%) |
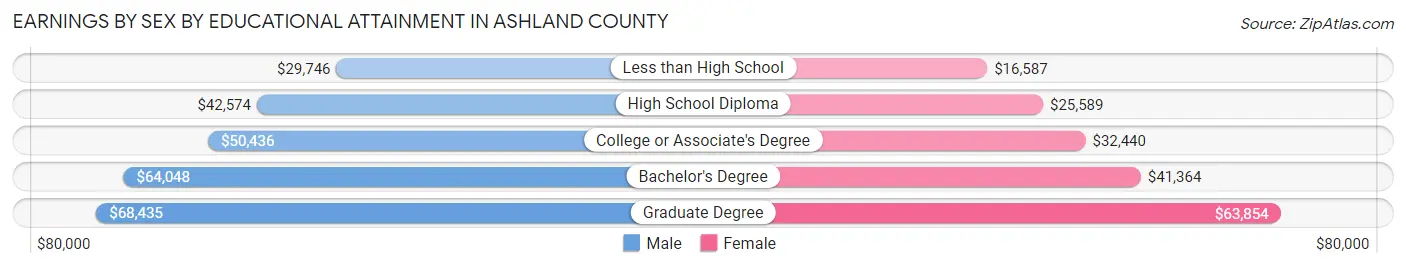
Earnings by Sex by Educational Attainment in Ashland County
Average earnings in Ashland County are $48,561 for men and $33,235 for women, a difference of 31.6%. Men with an educational attainment of graduate degree enjoy the highest average annual earnings of $68,435, while those with less than high school education earn the least with $29,746. Women with an educational attainment of graduate degree earn the most with the average annual earnings of $63,854, while those with less than high school education have the smallest earnings of $16,587.
| Educational Attainment | Male Income | Female Income |
| Less than High School | $29,746 | $16,587 |
| High School Diploma | $42,574 | $25,589 |
| College or Associate's Degree | $50,436 | $32,440 |
| Bachelor's Degree | $64,048 | $41,364 |
| Graduate Degree | $68,435 | $63,854 |
| Total | $48,561 | $33,235 |
Family Income in Ashland County
Family Income Brackets in Ashland County
According to the Ashland County family income data, there are 3,215 families falling into the $50,000 to $74,999 income range, which is the most common income bracket and makes up 23.5% of all families. Conversely, the less than $10,000 income bracket is the least frequent group with only 233 families (1.7%) belonging to this category.
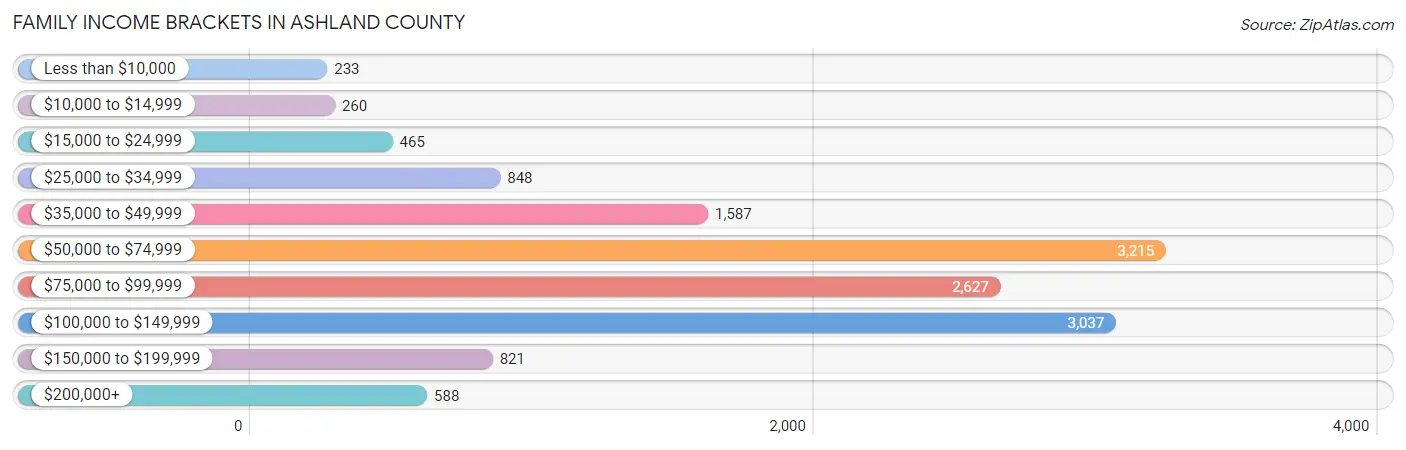
| Income Bracket | # Families | % Families |
| Less than $10,000 | 233 | 1.7% |
| $10,000 to $14,999 | 260 | 1.9% |
| $15,000 to $24,999 | 465 | 3.4% |
| $25,000 to $34,999 | 848 | 6.2% |
| $35,000 to $49,999 | 1,587 | 11.6% |
| $50,000 to $74,999 | 3,215 | 23.5% |
| $75,000 to $99,999 | 2,627 | 19.2% |
| $100,000 to $149,999 | 3,037 | 22.2% |
| $150,000 to $199,999 | 821 | 6.0% |
| $200,000+ | 588 | 4.3% |
Family Income by Famaliy Size in Ashland County
6-person families (357 | 2.6%) account for the highest median family income in Ashland County with $102,773 per family, while 2-person families (7,730 | 56.5%) have the highest median income of $34,482 per family member.
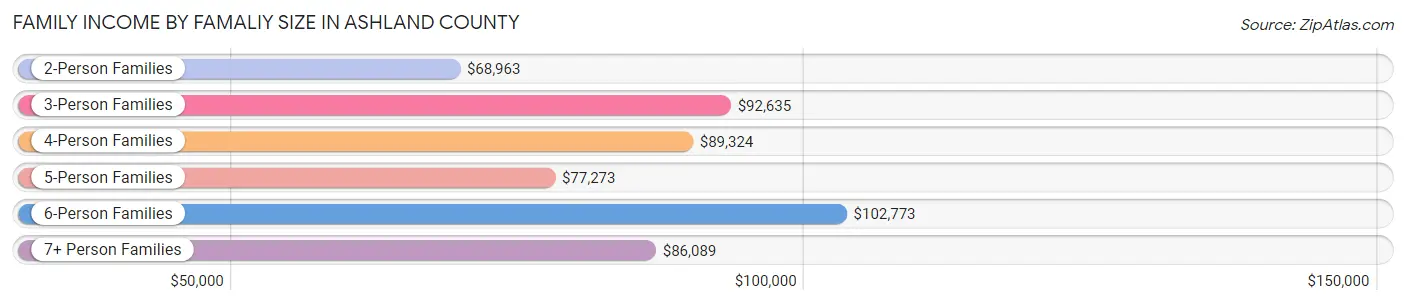
| Income Bracket | # Families | Median Income |
| 2-Person Families | 7,730 (56.5%) | $68,963 |
| 3-Person Families | 2,623 (19.2%) | $92,635 |
| 4-Person Families | 1,646 (12.0%) | $89,324 |
| 5-Person Families | 968 (7.1%) | $77,273 |
| 6-Person Families | 357 (2.6%) | $102,773 |
| 7+ Person Families | 357 (2.6%) | $86,089 |
| Total | 13,681 (100.0%) | $76,715 |
Family Income by Number of Earners in Ashland County
The median family income in Ashland County is $76,715, with families comprising 3+ earners (1,275) having the highest median family income of $115,529, while families with no earners (2,435) have the lowest median family income of $49,984, accounting for 9.3% and 17.8% of families, respectively.
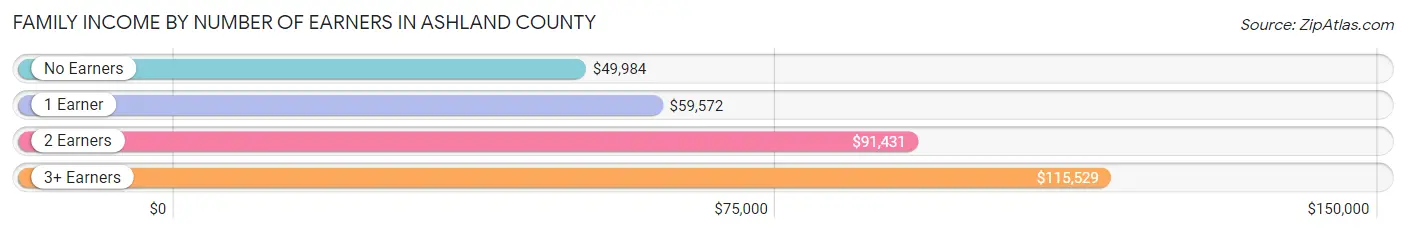
| Number of Earners | # Families | Median Income |
| No Earners | 2,435 (17.8%) | $49,984 |
| 1 Earner | 4,019 (29.4%) | $59,572 |
| 2 Earners | 5,952 (43.5%) | $91,431 |
| 3+ Earners | 1,275 (9.3%) | $115,529 |
| Total | 13,681 (100.0%) | $76,715 |
Household Income in Ashland County
Household Income Brackets in Ashland County
With 4,239 households falling in the category, the $50,000 to $74,999 income range is the most frequent in Ashland County, accounting for 20.7% of all households. In contrast, only 635 households (3.1%) fall into the less than $10,000 income bracket, making it the least populous group.
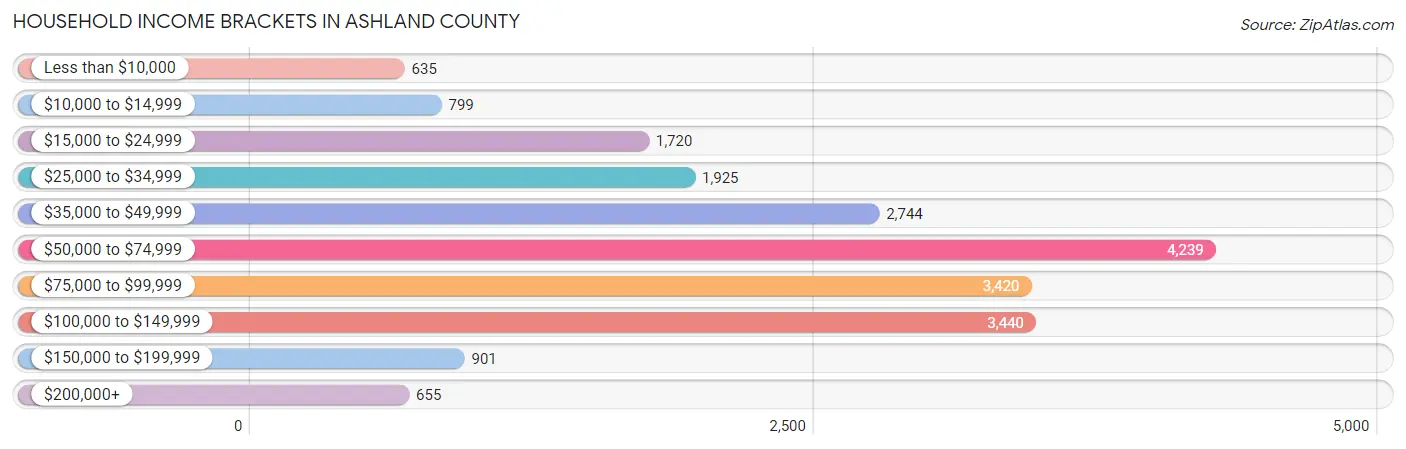
| Income Bracket | # Households | % Households |
| Less than $10,000 | 635 | 3.1% |
| $10,000 to $14,999 | 799 | 3.9% |
| $15,000 to $24,999 | 1,720 | 8.4% |
| $25,000 to $34,999 | 1,925 | 9.4% |
| $35,000 to $49,999 | 2,744 | 13.4% |
| $50,000 to $74,999 | 4,239 | 20.7% |
| $75,000 to $99,999 | 3,420 | 16.7% |
| $100,000 to $149,999 | 3,440 | 16.8% |
| $150,000 to $199,999 | 901 | 4.4% |
| $200,000+ | 655 | 3.2% |
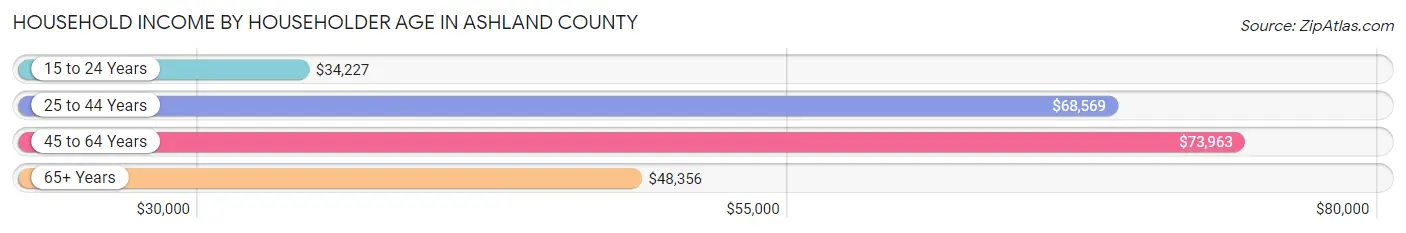
Household Income by Householder Age in Ashland County
The median household income in Ashland County is $62,254, with the highest median household income of $73,963 found in the 45 to 64 years age bracket for the primary householder. A total of 7,918 households (38.7%) fall into this category. Meanwhile, the 15 to 24 years age bracket for the primary householder has the lowest median household income of $34,227, with 788 households (3.8%) in this group.
| Income Bracket | # Households | Median Income |
| 15 to 24 Years | 788 (3.8%) | $34,227 |
| 25 to 44 Years | 5,613 (27.4%) | $68,569 |
| 45 to 64 Years | 7,918 (38.7%) | $73,963 |
| 65+ Years | 6,159 (30.1%) | $48,356 |
| Total | 20,478 (100.0%) | $62,254 |
Poverty in Ashland County
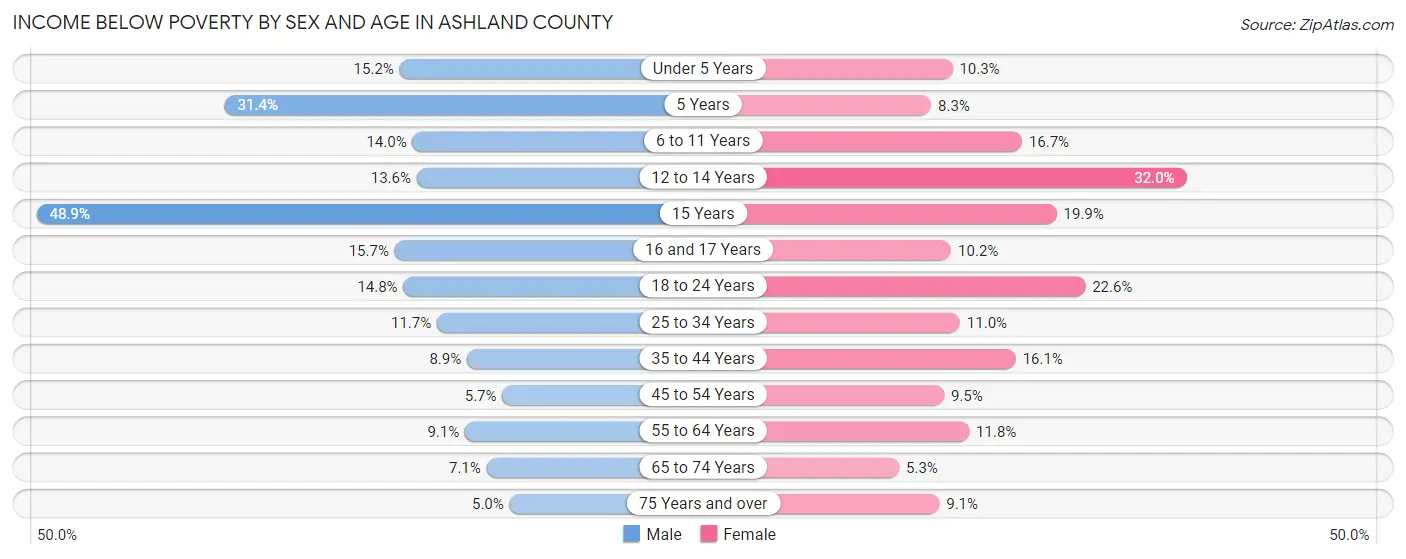
Income Below Poverty by Sex and Age in Ashland County
With 10.9% poverty level for males and 12.6% for females among the residents of Ashland County, 15 year old males and 12 to 14 year old females are the most vulnerable to poverty, with 199 males (48.9%) and 291 females (32.0%) in their respective age groups living below the poverty level.
| Age Bracket | Male | Female |
| Under 5 Years | 209 (15.2%) | 142 (10.3%) |
| 5 Years | 77 (31.4%) | 31 (8.3%) |
| 6 to 11 Years | 305 (14.0%) | 301 (16.7%) |
| 12 to 14 Years | 134 (13.6%) | 291 (32.0%) |
| 15 Years | 199 (48.9%) | 54 (19.9%) |
| 16 and 17 Years | 108 (15.7%) | 86 (10.2%) |
| 18 to 24 Years | 321 (14.8%) | 396 (22.6%) |
| 25 to 34 Years | 346 (11.7%) | 321 (11.0%) |
| 35 to 44 Years | 265 (8.9%) | 465 (16.1%) |
| 45 to 54 Years | 191 (5.7%) | 301 (9.5%) |
| 55 to 64 Years | 321 (9.1%) | 429 (11.8%) |
| 65 to 74 Years | 199 (7.1%) | 161 (5.3%) |
| 75 Years and over | 85 (5.0%) | 212 (9.0%) |
| Total | 2,760 (10.9%) | 3,190 (12.6%) |
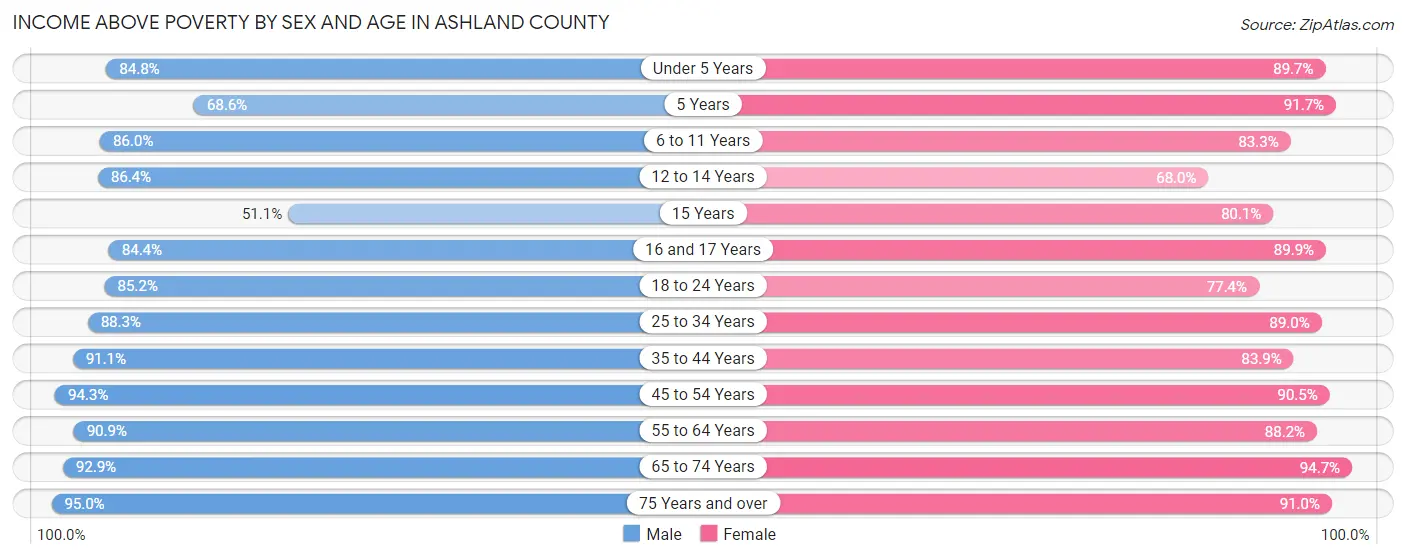
Income Above Poverty by Sex and Age in Ashland County
According to the poverty statistics in Ashland County, males aged 75 years and over and females aged 65 to 74 years are the age groups that are most secure financially, with 95.0% of males and 94.7% of females in these age groups living above the poverty line.
| Age Bracket | Male | Female |
| Under 5 Years | 1,167 (84.8%) | 1,240 (89.7%) |
| 5 Years | 168 (68.6%) | 343 (91.7%) |
| 6 to 11 Years | 1,873 (86.0%) | 1,499 (83.3%) |
| 12 to 14 Years | 851 (86.4%) | 619 (68.0%) |
| 15 Years | 208 (51.1%) | 217 (80.1%) |
| 16 and 17 Years | 582 (84.4%) | 761 (89.8%) |
| 18 to 24 Years | 1,842 (85.2%) | 1,357 (77.4%) |
| 25 to 34 Years | 2,607 (88.3%) | 2,609 (89.0%) |
| 35 to 44 Years | 2,699 (91.1%) | 2,416 (83.9%) |
| 45 to 54 Years | 3,185 (94.3%) | 2,873 (90.5%) |
| 55 to 64 Years | 3,199 (90.9%) | 3,199 (88.2%) |
| 65 to 74 Years | 2,595 (92.9%) | 2,863 (94.7%) |
| 75 Years and over | 1,617 (95.0%) | 2,131 (90.9%) |
| Total | 22,593 (89.1%) | 22,127 (87.4%) |
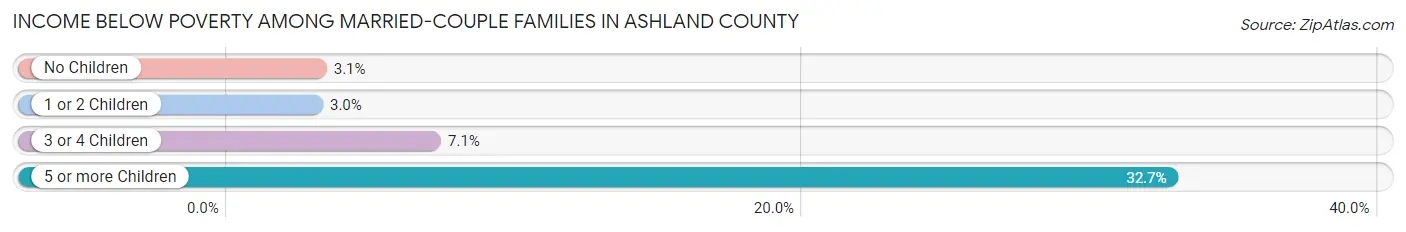
Income Below Poverty Among Married-Couple Families in Ashland County
The poverty statistics for married-couple families in Ashland County show that 4.0% or 442 of the total 11,121 families live below the poverty line. Families with 5 or more children have the highest poverty rate of 32.7%, comprising of 74 families. On the other hand, families with 1 or 2 children have the lowest poverty rate of 3.0%, which includes 80 families.
| Children | Above Poverty | Below Poverty |
| No Children | 7,087 (96.9%) | 226 (3.1%) |
| 1 or 2 Children | 2,625 (97.0%) | 80 (3.0%) |
| 3 or 4 Children | 815 (92.9%) | 62 (7.1%) |
| 5 or more Children | 152 (67.3%) | 74 (32.7%) |
| Total | 10,679 (96.0%) | 442 (4.0%) |
Income Below Poverty Among Single-Parent Households in Ashland County
According to the poverty data in Ashland County, 6.9% or 57 single-father households and 21.7% or 376 single-mother households are living below the poverty line. Among single-father households, those with 3 or 4 children have the highest poverty rate, with 1 households (25.0%) experiencing poverty. Likewise, among single-mother households, those with 5 or more children have the highest poverty rate, with 43 households (100.0%) falling below the poverty line.
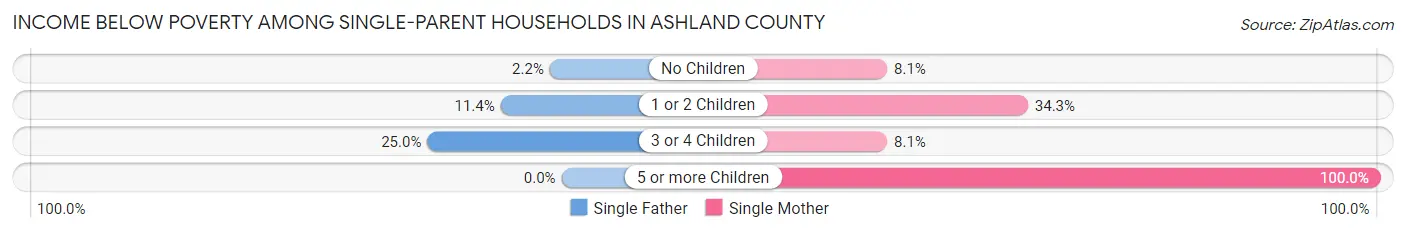
| Children | Single Father | Single Mother |
| No Children | 9 (2.2%) | 65 (8.1%) |
| 1 or 2 Children | 47 (11.4%) | 257 (34.3%) |
| 3 or 4 Children | 1 (25.0%) | 11 (8.1%) |
| 5 or more Children | 0 (0.0%) | 43 (100.0%) |
| Total | 57 (6.9%) | 376 (21.7%) |
Income Below Poverty Among Married-Couple vs Single-Parent Households in Ashland County
The poverty data for Ashland County shows that 442 of the married-couple family households (4.0%) and 433 of the single-parent households (16.9%) are living below the poverty level. Within the married-couple family households, those with 5 or more children have the highest poverty rate, with 74 households (32.7%) falling below the poverty line. Among the single-parent households, those with 5 or more children have the highest poverty rate, with 43 household (100.0%) living below poverty.
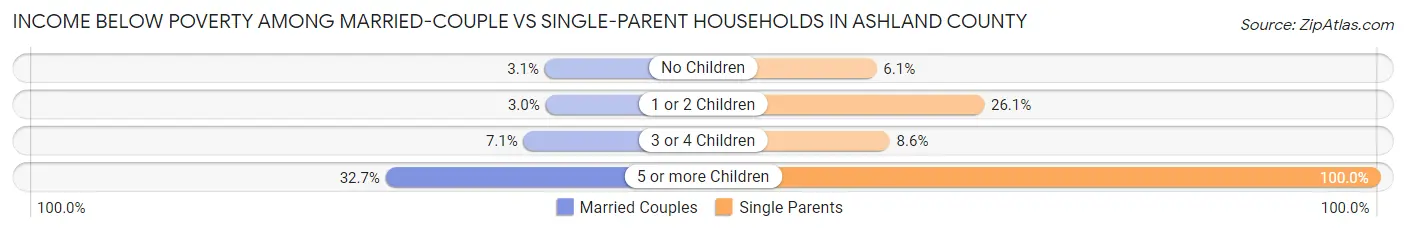
| Children | Married-Couple Families | Single-Parent Households |
| No Children | 226 (3.1%) | 74 (6.1%) |
| 1 or 2 Children | 80 (3.0%) | 304 (26.1%) |
| 3 or 4 Children | 62 (7.1%) | 12 (8.6%) |
| 5 or more Children | 74 (32.7%) | 43 (100.0%) |
| Total | 442 (4.0%) | 433 (16.9%) |
Race in Ashland County
The most populous races in Ashland County are White / Caucasian (50,178 | 95.5%), Two or more Races (1,367 | 2.6%), and Hispanic or Latino (883 | 1.7%).
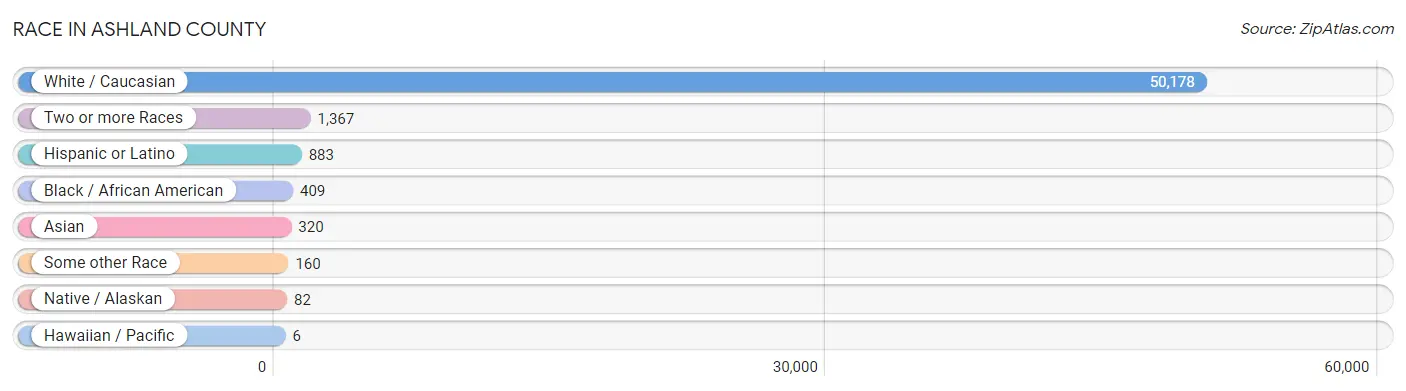
| Race | # Population | % Population |
| Asian | 320 | 0.6% |
| Black / African American | 409 | 0.8% |
| Hawaiian / Pacific | 6 | 0.0% |
| Hispanic or Latino | 883 | 1.7% |
| Native / Alaskan | 82 | 0.2% |
| White / Caucasian | 50,178 | 95.5% |
| Two or more Races | 1,367 | 2.6% |
| Some other Race | 160 | 0.3% |
| Total | 52,522 | 100.0% |
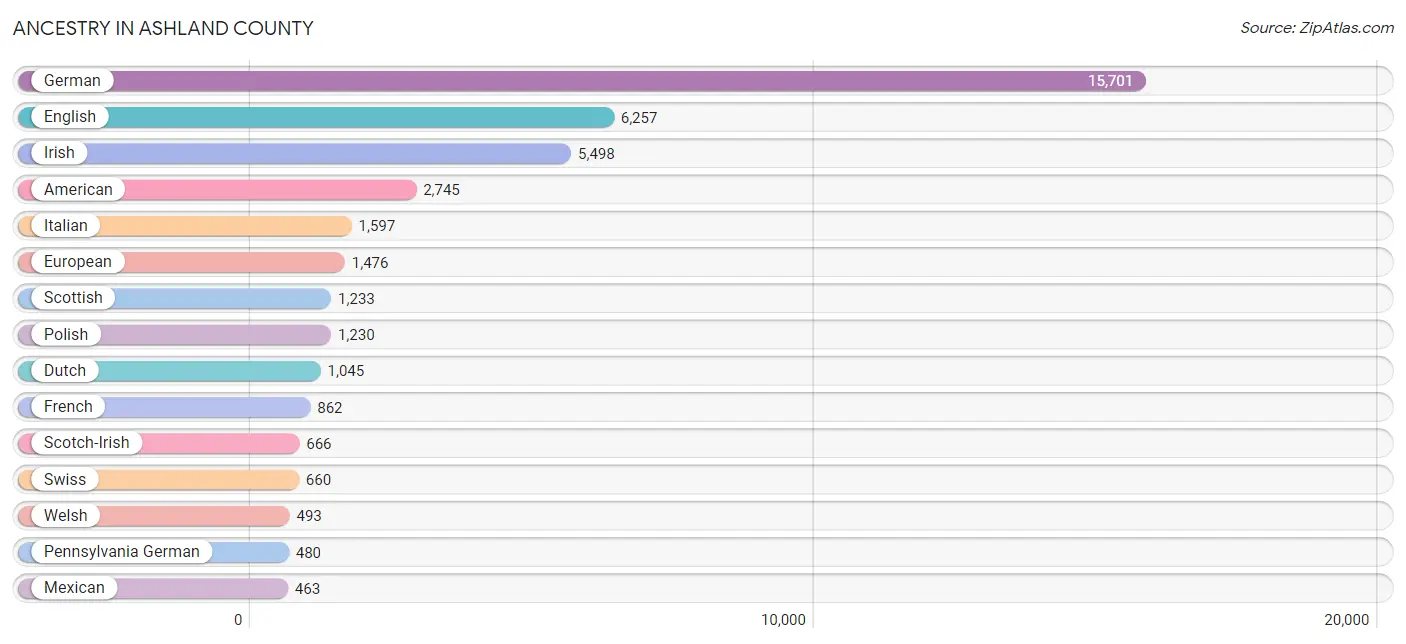
Ancestry in Ashland County
The most populous ancestries reported in Ashland County are German (15,701 | 29.9%), English (6,257 | 11.9%), Irish (5,498 | 10.5%), American (2,745 | 5.2%), and Italian (1,597 | 3.0%), together accounting for 60.5% of all Ashland County residents.
| Ancestry | # Population | % Population |
| Aleut | 2 | 0.0% |
| American | 2,745 | 5.2% |
| Arab | 297 | 0.6% |
| Armenian | 8 | 0.0% |
| Australian | 109 | 0.2% |
| Austrian | 101 | 0.2% |
| Belgian | 94 | 0.2% |
| Bhutanese | 33 | 0.1% |
| Blackfeet | 6 | 0.0% |
| British | 301 | 0.6% |
| Burmese | 32 | 0.1% |
| Canadian | 17 | 0.0% |
| Carpatho Rusyn | 6 | 0.0% |
| Central American | 37 | 0.1% |
| Cherokee | 178 | 0.3% |
| Chippewa | 32 | 0.1% |
| Costa Rican | 28 | 0.1% |
| Creek | 2 | 0.0% |
| Croatian | 14 | 0.0% |
| Czech | 227 | 0.4% |
| Czechoslovakian | 363 | 0.7% |
| Danish | 55 | 0.1% |
| Delaware | 3 | 0.0% |
| Dutch | 1,045 | 2.0% |
| Eastern European | 179 | 0.3% |
| English | 6,257 | 11.9% |
| European | 1,476 | 2.8% |
| Finnish | 44 | 0.1% |
| French | 862 | 1.6% |
| French American Indian | 2 | 0.0% |
| French Canadian | 20 | 0.0% |
| German | 15,701 | 29.9% |
| Greek | 32 | 0.1% |
| Guamanian / Chamorro | 9 | 0.0% |
| Guatemalan | 9 | 0.0% |
| Hungarian | 460 | 0.9% |
| Icelander | 20 | 0.0% |
| Indian (Asian) | 123 | 0.2% |
| Iranian | 8 | 0.0% |
| Irish | 5,498 | 10.5% |
| Iroquois | 9 | 0.0% |
| Italian | 1,597 | 3.0% |
| Jamaican | 33 | 0.1% |
| Japanese | 129 | 0.3% |
| Jordanian | 12 | 0.0% |
| Korean | 169 | 0.3% |
| Latvian | 7 | 0.0% |
| Lebanese | 270 | 0.5% |
| Lithuanian | 43 | 0.1% |
| Macedonian | 2 | 0.0% |
| Malaysian | 68 | 0.1% |
| Mexican | 463 | 0.9% |
| Northern European | 109 | 0.2% |
| Norwegian | 173 | 0.3% |
| Pakistani | 83 | 0.2% |
| Pennsylvania German | 480 | 0.9% |
| Peruvian | 38 | 0.1% |
| Polish | 1,230 | 2.3% |
| Portuguese | 44 | 0.1% |
| Puerto Rican | 261 | 0.5% |
| Romanian | 20 | 0.0% |
| Russian | 134 | 0.3% |
| Samoan | 6 | 0.0% |
| Scandinavian | 117 | 0.2% |
| Scotch-Irish | 666 | 1.3% |
| Scottish | 1,233 | 2.4% |
| Sioux | 6 | 0.0% |
| Slavic | 36 | 0.1% |
| Slovak | 145 | 0.3% |
| Slovene | 71 | 0.1% |
| South American | 53 | 0.1% |
| Spaniard | 11 | 0.0% |
| Sri Lankan | 24 | 0.1% |
| Subsaharan African | 2 | 0.0% |
| Swedish | 215 | 0.4% |
| Swiss | 660 | 1.3% |
| Syrian | 15 | 0.0% |
| Thai | 14 | 0.0% |
| Turkish | 3 | 0.0% |
| Ugandan | 2 | 0.0% |
| Ukrainian | 148 | 0.3% |
| Venezuelan | 15 | 0.0% |
| Welsh | 493 | 0.9% |
| Yugoslavian | 7 | 0.0% | View All 84 Rows |
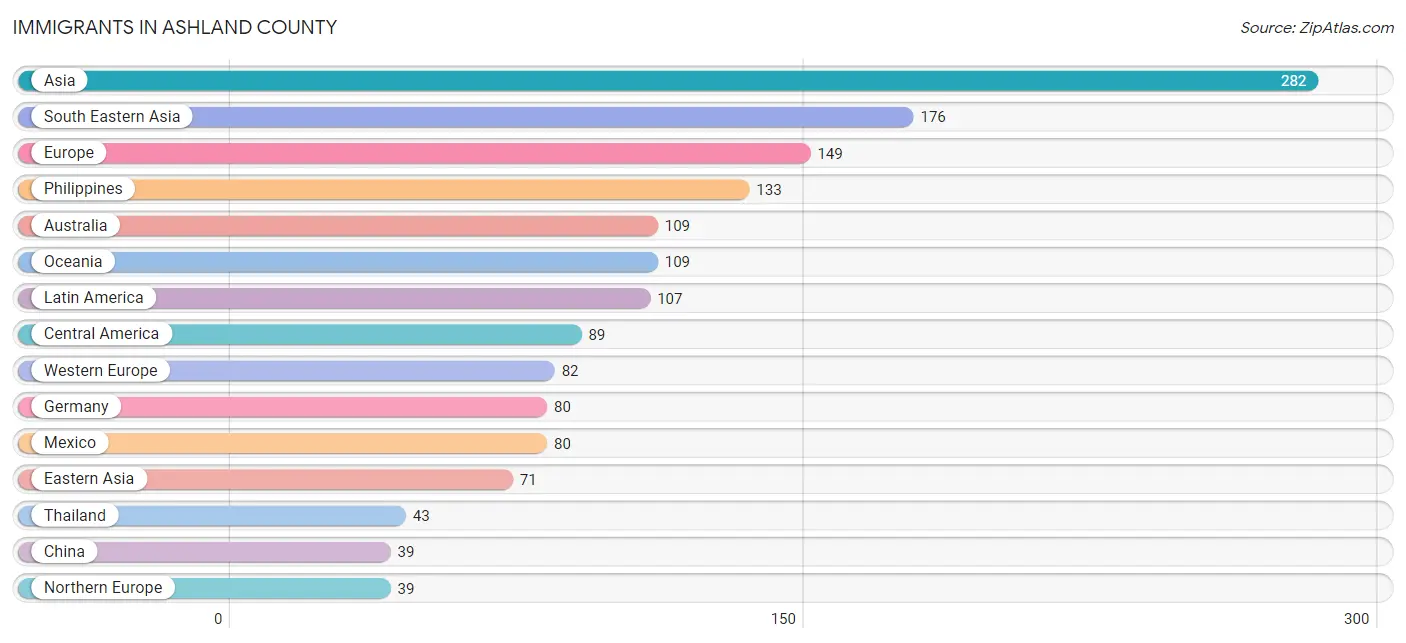
Immigrants in Ashland County
The most numerous immigrant groups reported in Ashland County came from Asia (282 | 0.5%), South Eastern Asia (176 | 0.3%), Europe (149 | 0.3%), Philippines (133 | 0.3%), and Australia (109 | 0.2%), together accounting for 1.6% of all Ashland County residents.
| Immigration Origin | # Population | % Population |
| Africa | 2 | 0.0% |
| Asia | 282 | 0.5% |
| Australia | 109 | 0.2% |
| Canada | 16 | 0.0% |
| Central America | 89 | 0.2% |
| China | 39 | 0.1% |
| Eastern Africa | 2 | 0.0% |
| Eastern Asia | 71 | 0.1% |
| Eastern Europe | 12 | 0.0% |
| England | 25 | 0.1% |
| Europe | 149 | 0.3% |
| Germany | 80 | 0.2% |
| Greece | 16 | 0.0% |
| Guatemala | 9 | 0.0% |
| India | 15 | 0.0% |
| Iran | 8 | 0.0% |
| Japan | 21 | 0.0% |
| Korea | 11 | 0.0% |
| Kuwait | 12 | 0.0% |
| Latin America | 107 | 0.2% |
| Mexico | 80 | 0.2% |
| Netherlands | 2 | 0.0% |
| Northern Europe | 39 | 0.1% |
| Oceania | 109 | 0.2% |
| Peru | 18 | 0.0% |
| Philippines | 133 | 0.3% |
| Russia | 12 | 0.0% |
| South America | 18 | 0.0% |
| South Central Asia | 23 | 0.0% |
| South Eastern Asia | 176 | 0.3% |
| Southern Europe | 16 | 0.0% |
| Taiwan | 24 | 0.1% |
| Thailand | 43 | 0.1% |
| Uganda | 2 | 0.0% |
| Western Asia | 12 | 0.0% |
| Western Europe | 82 | 0.2% | View All 36 Rows |
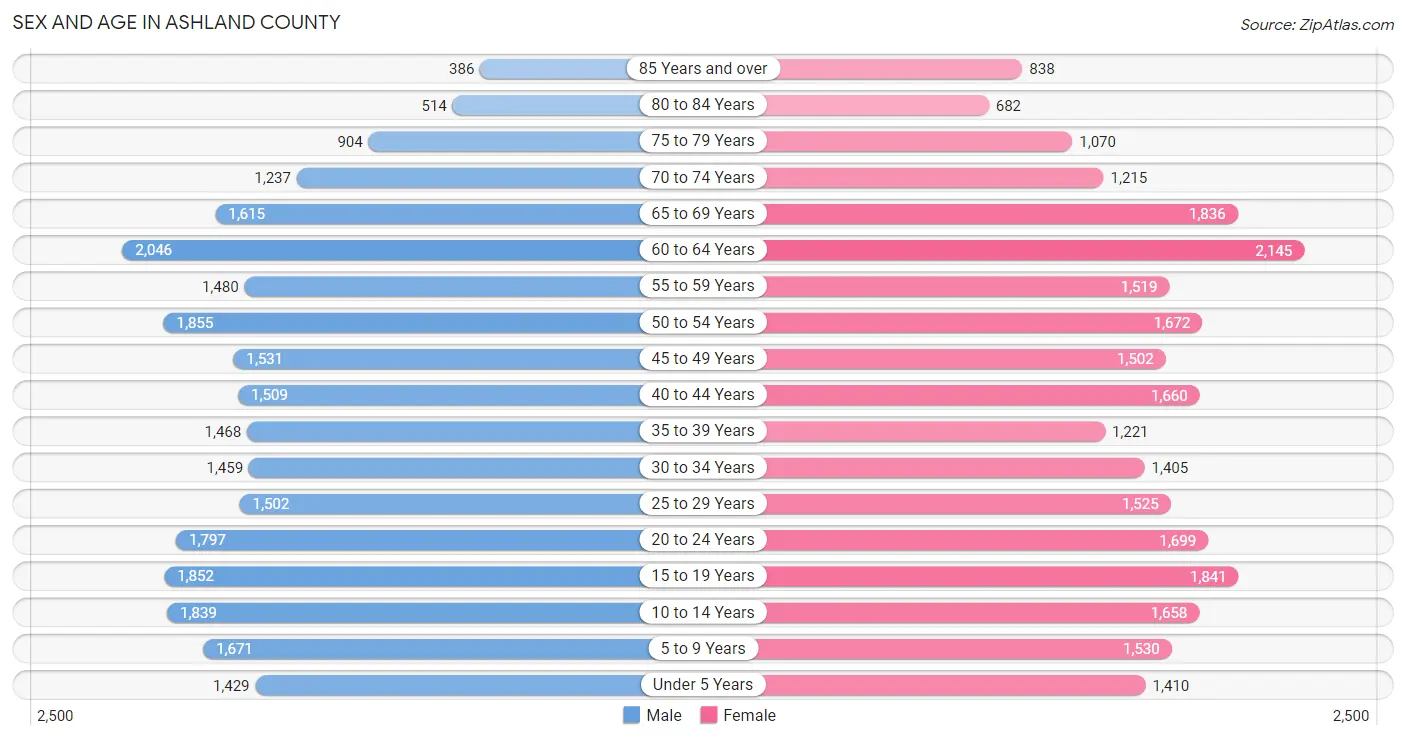
Sex and Age in Ashland County
Sex and Age in Ashland County
The most populous age groups in Ashland County are 60 to 64 Years (2,046 | 7.8%) for men and 60 to 64 Years (2,145 | 8.1%) for women.
| Age Bracket | Male | Female |
| Under 5 Years | 1,429 (5.5%) | 1,410 (5.3%) |
| 5 to 9 Years | 1,671 (6.4%) | 1,530 (5.8%) |
| 10 to 14 Years | 1,839 (7.0%) | 1,658 (6.3%) |
| 15 to 19 Years | 1,852 (7.1%) | 1,841 (7.0%) |
| 20 to 24 Years | 1,797 (6.9%) | 1,699 (6.4%) |
| 25 to 29 Years | 1,502 (5.8%) | 1,525 (5.8%) |
| 30 to 34 Years | 1,459 (5.6%) | 1,405 (5.3%) |
| 35 to 39 Years | 1,468 (5.6%) | 1,221 (4.6%) |
| 40 to 44 Years | 1,509 (5.8%) | 1,660 (6.3%) |
| 45 to 49 Years | 1,531 (5.9%) | 1,502 (5.7%) |
| 50 to 54 Years | 1,855 (7.1%) | 1,672 (6.3%) |
| 55 to 59 Years | 1,480 (5.7%) | 1,519 (5.8%) |
| 60 to 64 Years | 2,046 (7.8%) | 2,145 (8.1%) |
| 65 to 69 Years | 1,615 (6.2%) | 1,836 (7.0%) |
| 70 to 74 Years | 1,237 (4.7%) | 1,215 (4.6%) |
| 75 to 79 Years | 904 (3.5%) | 1,070 (4.1%) |
| 80 to 84 Years | 514 (2.0%) | 682 (2.6%) |
| 85 Years and over | 386 (1.5%) | 838 (3.2%) |
| Total | 26,094 (100.0%) | 26,428 (100.0%) |
Families and Households in Ashland County
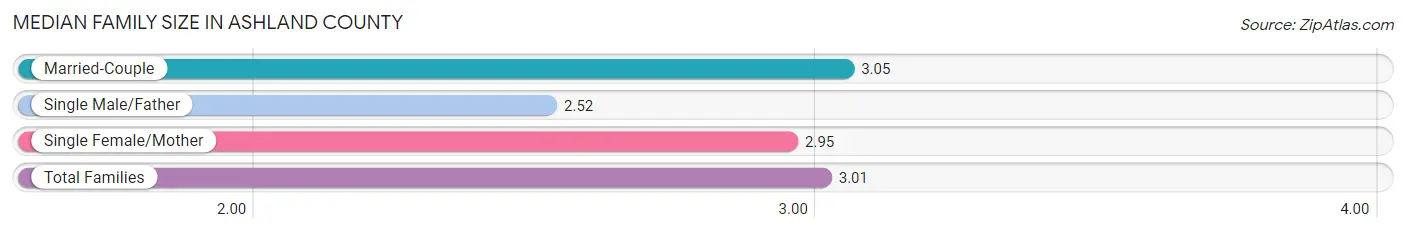
Median Family Size in Ashland County
The median family size in Ashland County is 3.01 persons per family, with married-couple families (11,121 | 81.3%) accounting for the largest median family size of 3.05 persons per family. On the other hand, single male/father families (829 | 6.1%) represent the smallest median family size with 2.52 persons per family.
| Family Type | # Families | Family Size |
| Married-Couple | 11,121 (81.3%) | 3.05 |
| Single Male/Father | 829 (6.1%) | 2.52 |
| Single Female/Mother | 1,731 (12.7%) | 2.95 |
| Total Families | 13,681 (100.0%) | 3.01 |
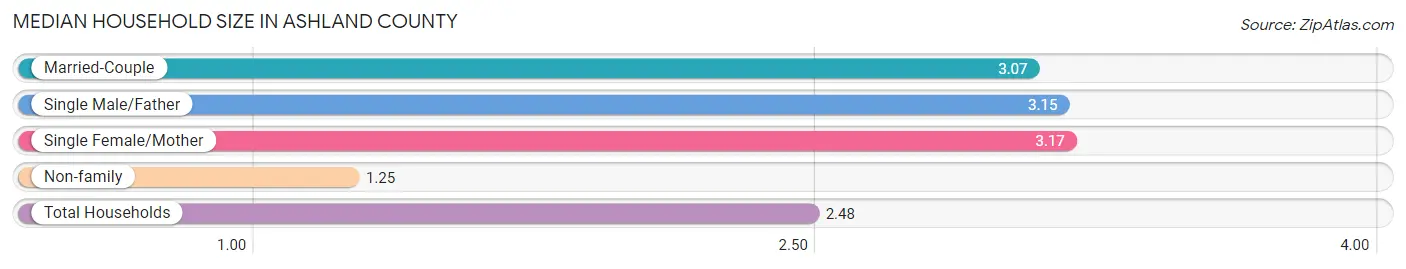
Median Household Size in Ashland County
The median household size in Ashland County is 2.48 persons per household, with single female/mother households (1,731 | 8.5%) accounting for the largest median household size of 3.17 persons per household. non-family households (6,797 | 33.2%) represent the smallest median household size with 1.25 persons per household.
| Household Type | # Households | Household Size |
| Married-Couple | 11,121 (54.3%) | 3.07 |
| Single Male/Father | 829 (4.1%) | 3.15 |
| Single Female/Mother | 1,731 (8.5%) | 3.17 |
| Non-family | 6,797 (33.2%) | 1.25 |
| Total Households | 20,478 (100.0%) | 2.48 |
Household Size by Marriage Status in Ashland County
Out of a total of 20,478 households in Ashland County, 13,681 (66.8%) are family households, while 6,797 (33.2%) are nonfamily households. The most numerous type of family households are 2-person households, comprising 7,154, and the most common type of nonfamily households are 1-person households, comprising 5,529.
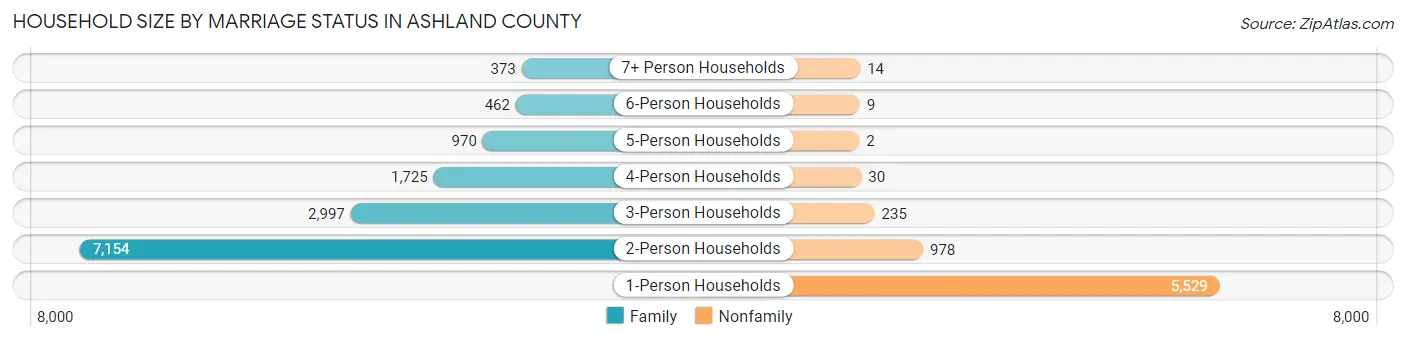
| Household Size | Family Households | Nonfamily Households |
| 1-Person Households | - | 5,529 (27.0%) |
| 2-Person Households | 7,154 (34.9%) | 978 (4.8%) |
| 3-Person Households | 2,997 (14.6%) | 235 (1.1%) |
| 4-Person Households | 1,725 (8.4%) | 30 (0.2%) |
| 5-Person Households | 970 (4.7%) | 2 (0.0%) |
| 6-Person Households | 462 (2.3%) | 9 (0.0%) |
| 7+ Person Households | 373 (1.8%) | 14 (0.1%) |
| Total | 13,681 (66.8%) | 6,797 (33.2%) |
Female Fertility in Ashland County
Fertility by Age in Ashland County
Average fertility rate in Ashland County is 66.0 births per 1,000 women. Women in the age bracket of 20 to 34 years have the highest fertility rate with 116.0 births per 1,000 women. Women in the age bracket of 20 to 34 years acount for 74.2% of all women with births.
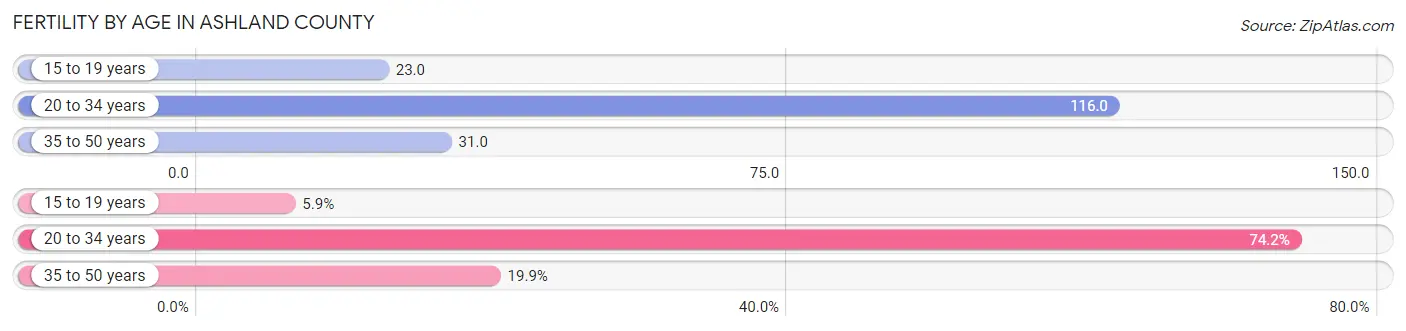
| Age Bracket | Women with Births | Births / 1,000 Women |
| 15 to 19 years | 43 (5.9%) | 23.0 |
| 20 to 34 years | 538 (74.2%) | 116.0 |
| 35 to 50 years | 144 (19.9%) | 31.0 |
| Total | 725 (100.0%) | 66.0 |
Fertility by Age by Marriage Status in Ashland County
73.0% of women with births (725) in Ashland County are married. The highest percentage of unmarried women with births falls into 15 to 19 years age bracket with 100.0% of them unmarried at the time of birth, while the lowest percentage of unmarried women with births belong to 35 to 50 years age bracket with 0.0% of them unmarried.
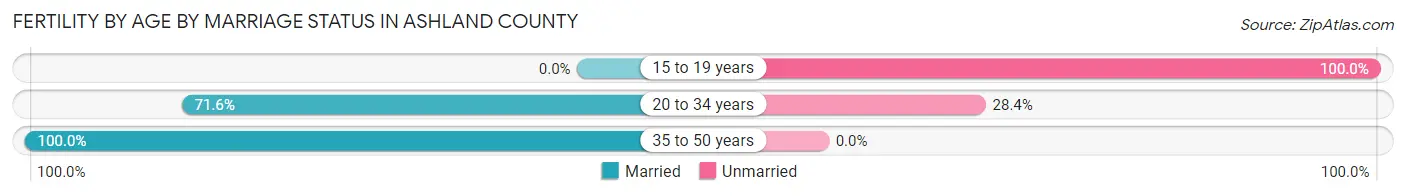
| Age Bracket | Married | Unmarried |
| 15 to 19 years | 0 (0.0%) | 43 (100.0%) |
| 20 to 34 years | 385 (71.6%) | 153 (28.4%) |
| 35 to 50 years | 144 (100.0%) | 0 (0.0%) |
| Total | 529 (73.0%) | 196 (27.0%) |
Fertility by Education in Ashland County
Average fertility rate in Ashland County is 66.0 births per 1,000 women. Women with the education attainment of less than high school have the highest fertility rate of 108.0 births per 1,000 women, while women with the education attainment of high school diploma have the lowest fertility at 52.0 births per 1,000 women. Women with the education attainment of less than high school represent 29.9% of all women with births.
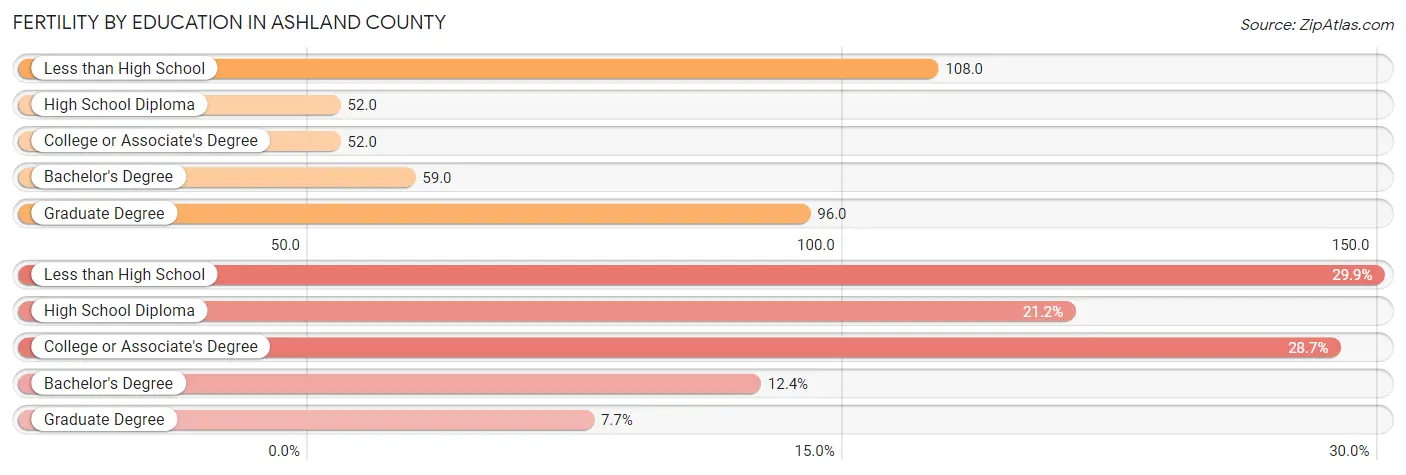
| Educational Attainment | Women with Births | Births / 1,000 Women |
| Less than High School | 217 (29.9%) | 108.0 |
| High School Diploma | 154 (21.2%) | 52.0 |
| College or Associate's Degree | 208 (28.7%) | 52.0 |
| Bachelor's Degree | 90 (12.4%) | 59.0 |
| Graduate Degree | 56 (7.7%) | 96.0 |
| Total | 725 (100.0%) | 66.0 |
Fertility by Education by Marriage Status in Ashland County
27.0% of women with births in Ashland County are unmarried. Women with the educational attainment of bachelor's degree are most likely to be married with 100.0% of them married at childbirth, while women with the educational attainment of high school diploma are least likely to be married with 65.6% of them unmarried at childbirth.
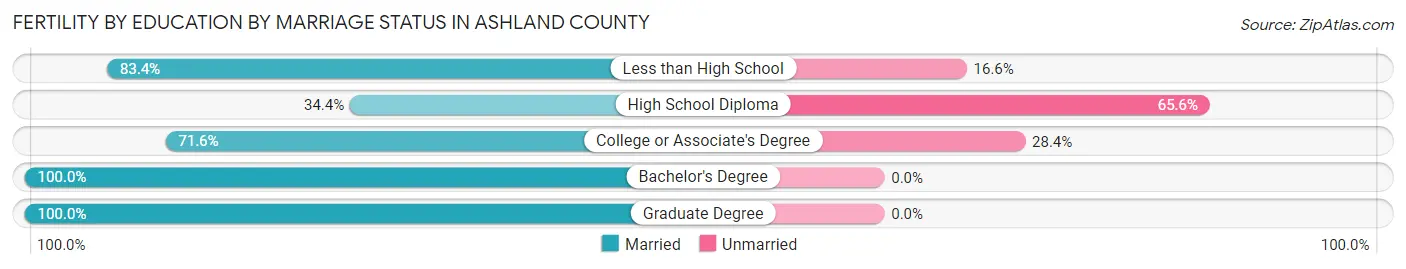
| Educational Attainment | Married | Unmarried |
| Less than High School | 181 (83.4%) | 36 (16.6%) |
| High School Diploma | 53 (34.4%) | 101 (65.6%) |
| College or Associate's Degree | 149 (71.6%) | 59 (28.4%) |
| Bachelor's Degree | 90 (100.0%) | 0 (0.0%) |
| Graduate Degree | 56 (100.0%) | 0 (0.0%) |
| Total | 529 (73.0%) | 196 (27.0%) |
Employment Characteristics in Ashland County
Employment by Class of Employer in Ashland County
Among the 24,322 employed individuals in Ashland County, private company employees (17,653 | 72.6%), not-for-profit organizations (2,207 | 9.1%), and local government employees (1,800 | 7.4%) make up the most common classes of employment.
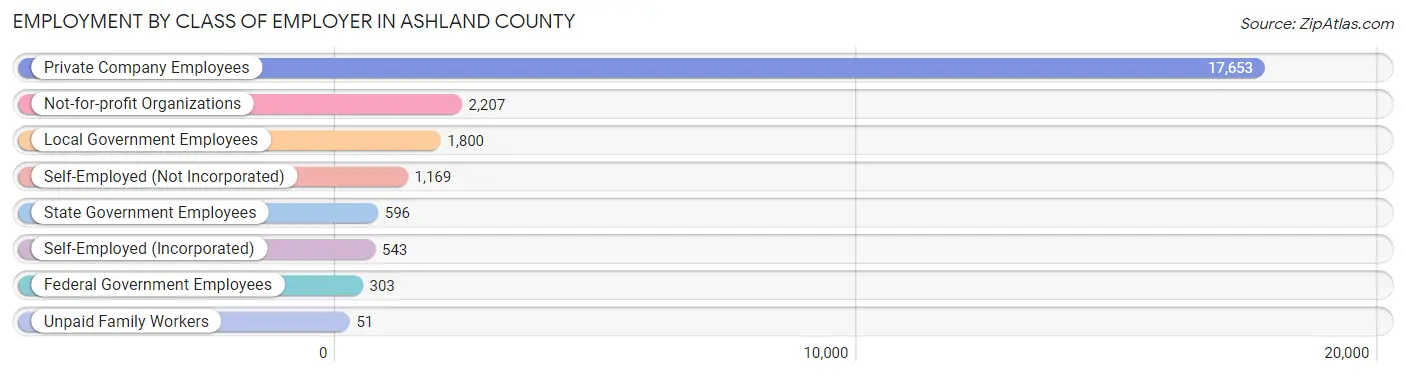
| Employer Class | # Employees | % Employees |
| Private Company Employees | 17,653 | 72.6% |
| Self-Employed (Incorporated) | 543 | 2.2% |
| Self-Employed (Not Incorporated) | 1,169 | 4.8% |
| Not-for-profit Organizations | 2,207 | 9.1% |
| Local Government Employees | 1,800 | 7.4% |
| State Government Employees | 596 | 2.5% |
| Federal Government Employees | 303 | 1.3% |
| Unpaid Family Workers | 51 | 0.2% |
| Total | 24,322 | 100.0% |
Employment Status by Age in Ashland County
According to the labor force statistics for Ashland County, out of the total population over 16 years of age (42,302), 60.7% or 25,677 individuals are in the labor force, with 3.7% or 950 of them unemployed. The age group with the highest labor force participation rate is 45 to 54 years, with 84.7% or 5,556 individuals in the labor force. Within the labor force, the 75 years and over age range has the highest percentage of unemployed individuals, with 14.9% or 22 of them being unemployed.
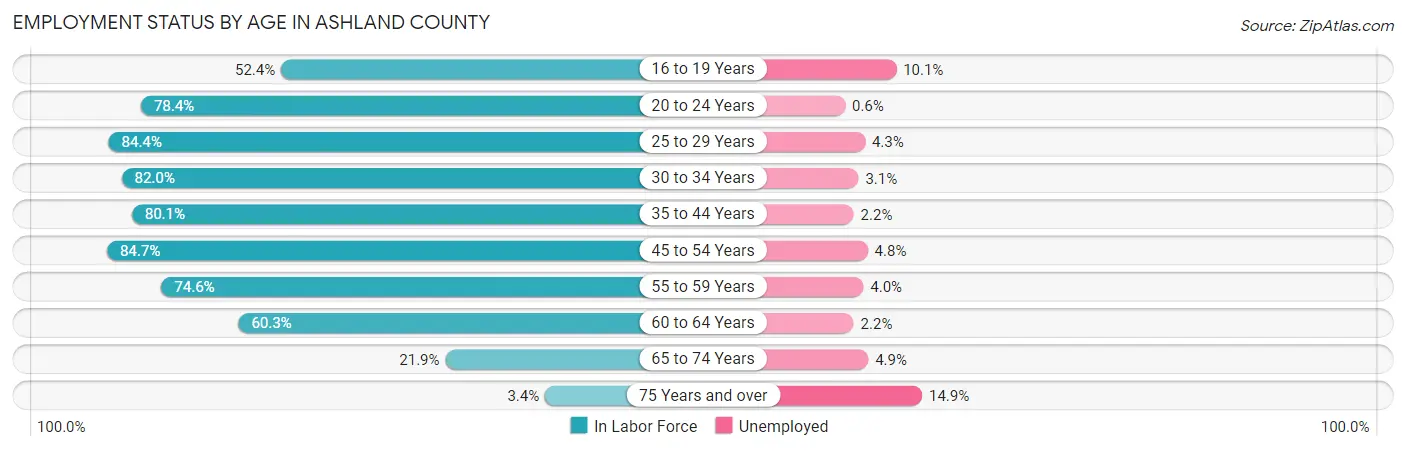
| Age Bracket | In Labor Force | Unemployed |
| 16 to 19 Years | 1,577 (52.4%) | 159 (10.1%) |
| 20 to 24 Years | 2,741 (78.4%) | 16 (0.6%) |
| 25 to 29 Years | 2,555 (84.4%) | 110 (4.3%) |
| 30 to 34 Years | 2,348 (82.0%) | 73 (3.1%) |
| 35 to 44 Years | 4,692 (80.1%) | 103 (2.2%) |
| 45 to 54 Years | 5,556 (84.7%) | 267 (4.8%) |
| 55 to 59 Years | 2,237 (74.6%) | 89 (4.0%) |
| 60 to 64 Years | 2,527 (60.3%) | 56 (2.2%) |
| 65 to 74 Years | 1,293 (21.9%) | 63 (4.9%) |
| 75 Years and over | 149 (3.4%) | 22 (14.9%) |
| Total | 25,677 (60.7%) | 950 (3.7%) |
Employment Status by Educational Attainment in Ashland County
According to labor force statistics for Ashland County, 78.1% of individuals (19,915) out of the total population between 25 and 64 years of age (25,499) are in the labor force, with 3.5% or 697 of them being unemployed. The group with the highest labor force participation rate are those with the educational attainment of bachelor's degree or higher, with 86.2% or 4,985 individuals in the labor force. Within the labor force, individuals with high school diploma education have the highest percentage of unemployment, with 4.2% or 324 of them being unemployed.
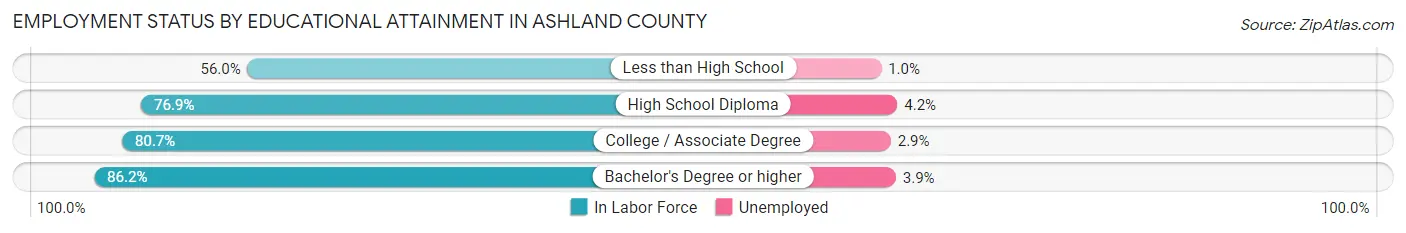
| Educational Attainment | In Labor Force | Unemployed |
| Less than High School | 1,355 (56.0%) | 24 (1.0%) |
| High School Diploma | 7,720 (76.9%) | 422 (4.2%) |
| College / Associate Degree | 5,856 (80.7%) | 210 (2.9%) |
| Bachelor's Degree or higher | 4,985 (86.2%) | 226 (3.9%) |
| Total | 19,915 (78.1%) | 892 (3.5%) |
Employment Occupations by Sex in Ashland County
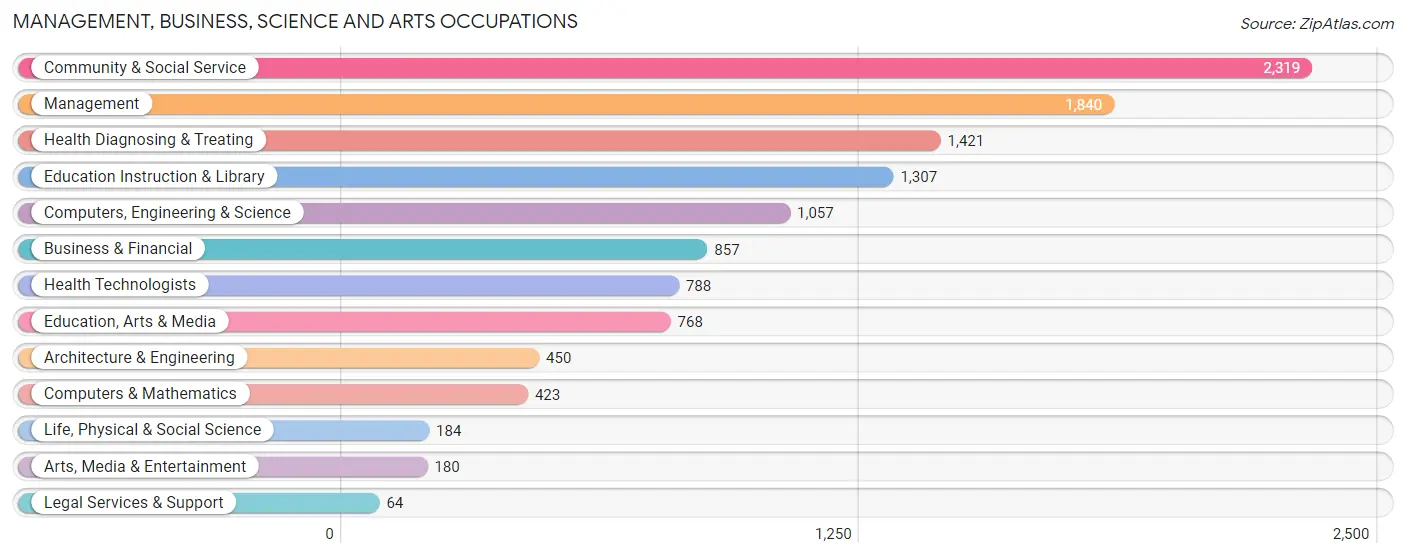
Management, Business, Science and Arts Occupations
The most common Management, Business, Science and Arts occupations in Ashland County are Community & Social Service (2,319 | 9.4%), Management (1,840 | 7.4%), Health Diagnosing & Treating (1,421 | 5.8%), Education Instruction & Library (1,307 | 5.3%), and Computers, Engineering & Science (1,057 | 4.3%).
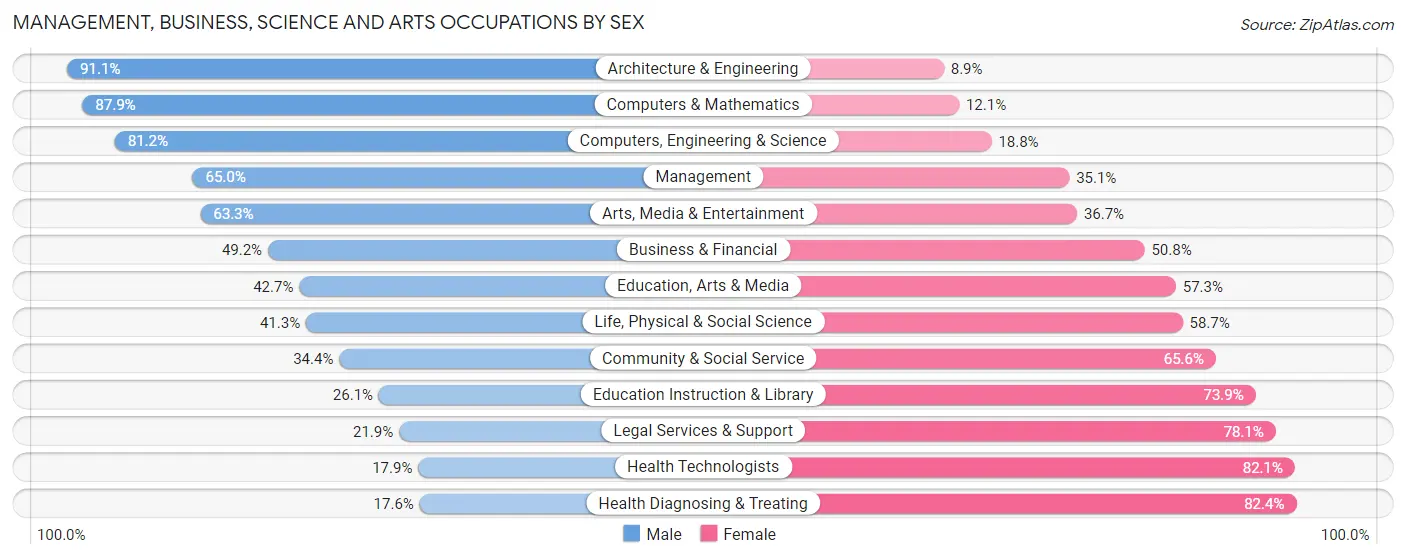
Management, Business, Science and Arts Occupations by Sex
Within the Management, Business, Science and Arts occupations in Ashland County, the most male-oriented occupations are Architecture & Engineering (91.1%), Computers & Mathematics (87.9%), and Computers, Engineering & Science (81.2%), while the most female-oriented occupations are Health Diagnosing & Treating (82.4%), Health Technologists (82.1%), and Legal Services & Support (78.1%).
| Occupation | Male | Female |
| Management | 1,195 (64.9%) | 645 (35.0%) |
| Business & Financial | 422 (49.2%) | 435 (50.8%) |
| Computers, Engineering & Science | 858 (81.2%) | 199 (18.8%) |
| Computers & Mathematics | 372 (87.9%) | 51 (12.1%) |
| Architecture & Engineering | 410 (91.1%) | 40 (8.9%) |
| Life, Physical & Social Science | 76 (41.3%) | 108 (58.7%) |
| Community & Social Service | 797 (34.4%) | 1,522 (65.6%) |
| Education, Arts & Media | 328 (42.7%) | 440 (57.3%) |
| Legal Services & Support | 14 (21.9%) | 50 (78.1%) |
| Education Instruction & Library | 341 (26.1%) | 966 (73.9%) |
| Arts, Media & Entertainment | 114 (63.3%) | 66 (36.7%) |
| Health Diagnosing & Treating | 250 (17.6%) | 1,171 (82.4%) |
| Health Technologists | 141 (17.9%) | 647 (82.1%) |
| Total (Category) | 3,522 (47.0%) | 3,972 (53.0%) |
| Total (Overall) | 13,476 (54.5%) | 11,231 (45.5%) |
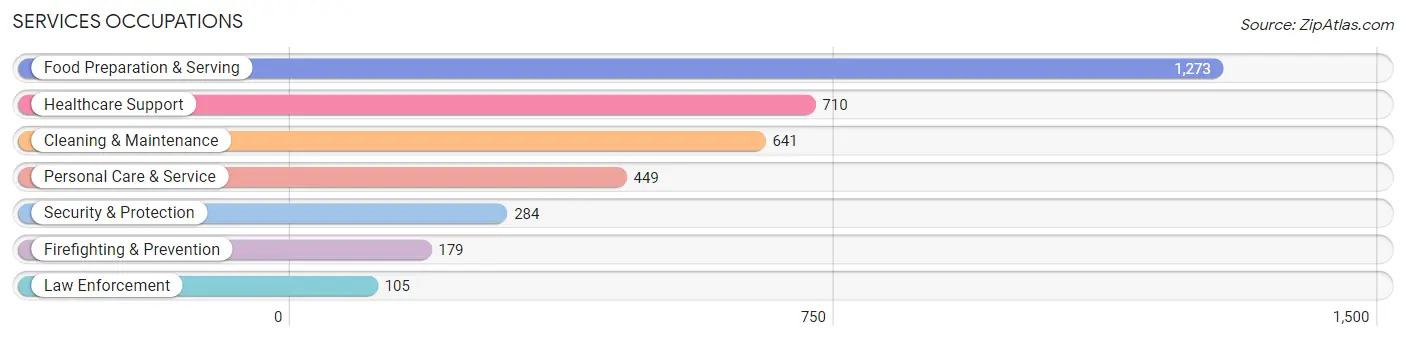
Services Occupations
The most common Services occupations in Ashland County are Food Preparation & Serving (1,273 | 5.1%), Healthcare Support (710 | 2.9%), Cleaning & Maintenance (641 | 2.6%), Personal Care & Service (449 | 1.8%), and Security & Protection (284 | 1.1%).
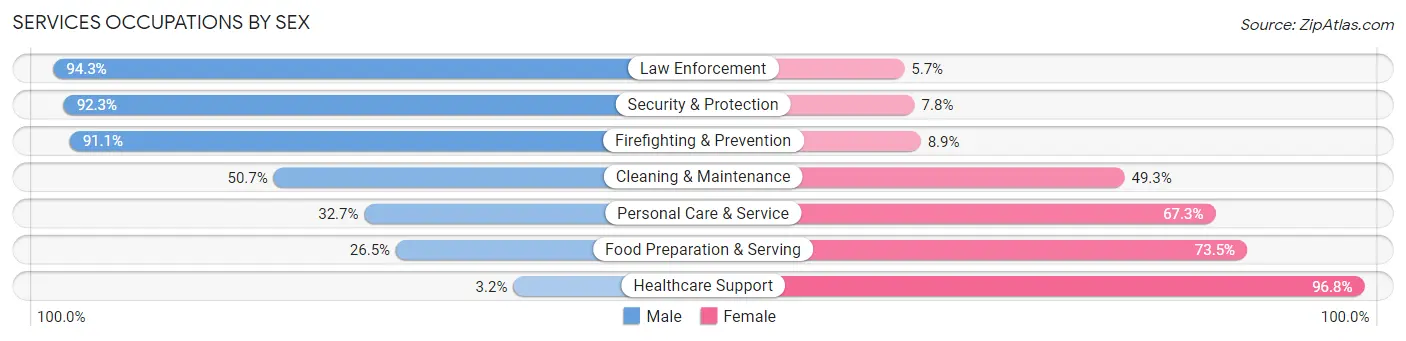
Services Occupations by Sex
Within the Services occupations in Ashland County, the most male-oriented occupations are Law Enforcement (94.3%), Security & Protection (92.2%), and Firefighting & Prevention (91.1%), while the most female-oriented occupations are Healthcare Support (96.8%), Food Preparation & Serving (73.5%), and Personal Care & Service (67.3%).
| Occupation | Male | Female |
| Healthcare Support | 23 (3.2%) | 687 (96.8%) |
| Security & Protection | 262 (92.2%) | 22 (7.7%) |
| Firefighting & Prevention | 163 (91.1%) | 16 (8.9%) |
| Law Enforcement | 99 (94.3%) | 6 (5.7%) |
| Food Preparation & Serving | 337 (26.5%) | 936 (73.5%) |
| Cleaning & Maintenance | 325 (50.7%) | 316 (49.3%) |
| Personal Care & Service | 147 (32.7%) | 302 (67.3%) |
| Total (Category) | 1,094 (32.6%) | 2,263 (67.4%) |
| Total (Overall) | 13,476 (54.5%) | 11,231 (45.5%) |
Sales and Office Occupations
The most common Sales and Office occupations in Ashland County are Office & Administration (2,804 | 11.4%), and Sales & Related (2,432 | 9.8%).

Sales and Office Occupations by Sex
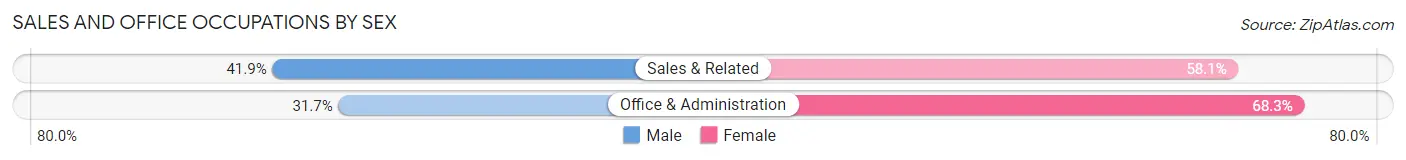
| Occupation | Male | Female |
| Sales & Related | 1,018 (41.9%) | 1,414 (58.1%) |
| Office & Administration | 889 (31.7%) | 1,915 (68.3%) |
| Total (Category) | 1,907 (36.4%) | 3,329 (63.6%) |
| Total (Overall) | 13,476 (54.5%) | 11,231 (45.5%) |
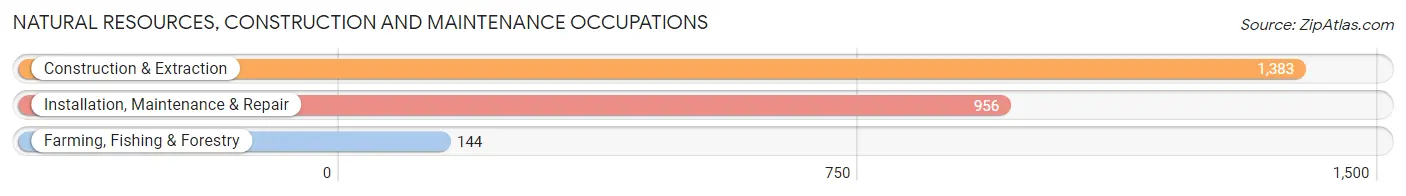
Natural Resources, Construction and Maintenance Occupations
The most common Natural Resources, Construction and Maintenance occupations in Ashland County are Construction & Extraction (1,383 | 5.6%), Installation, Maintenance & Repair (956 | 3.9%), and Farming, Fishing & Forestry (144 | 0.6%).
Natural Resources, Construction and Maintenance Occupations by Sex
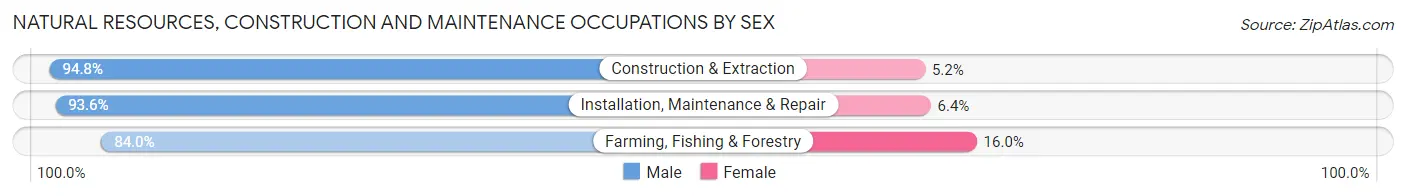
| Occupation | Male | Female |
| Farming, Fishing & Forestry | 121 (84.0%) | 23 (16.0%) |
| Construction & Extraction | 1,311 (94.8%) | 72 (5.2%) |
| Installation, Maintenance & Repair | 895 (93.6%) | 61 (6.4%) |
| Total (Category) | 2,327 (93.7%) | 156 (6.3%) |
| Total (Overall) | 13,476 (54.5%) | 11,231 (45.5%) |
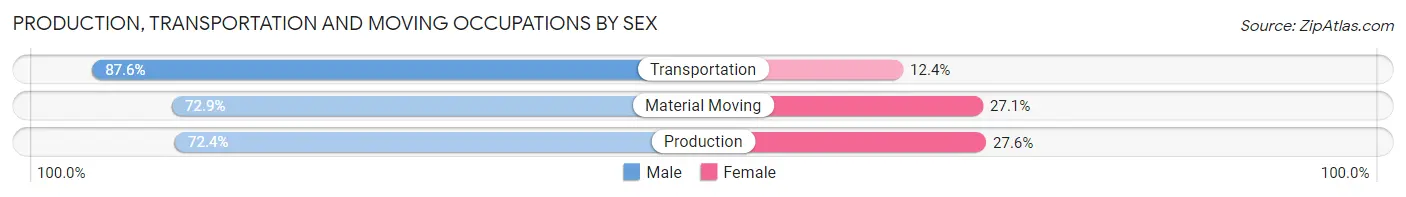
Production, Transportation and Moving Occupations
The most common Production, Transportation and Moving occupations in Ashland County are Production (3,275 | 13.3%), Material Moving (1,710 | 6.9%), and Transportation (1,152 | 4.7%).
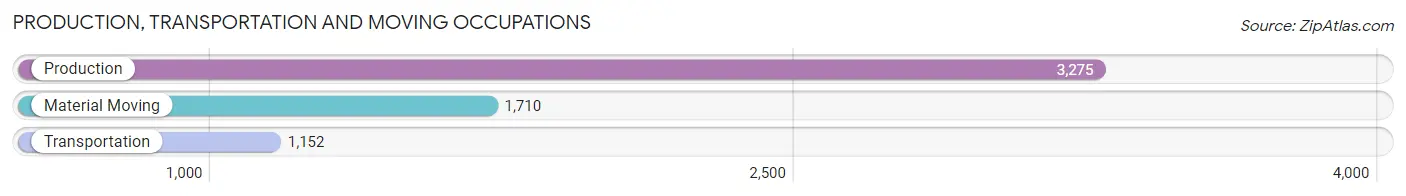
Production, Transportation and Moving Occupations by Sex
| Occupation | Male | Female |
| Production | 2,370 (72.4%) | 905 (27.6%) |
| Transportation | 1,009 (87.6%) | 143 (12.4%) |
| Material Moving | 1,247 (72.9%) | 463 (27.1%) |
| Total (Category) | 4,626 (75.4%) | 1,511 (24.6%) |
| Total (Overall) | 13,476 (54.5%) | 11,231 (45.5%) |
Employment Industries by Sex in Ashland County
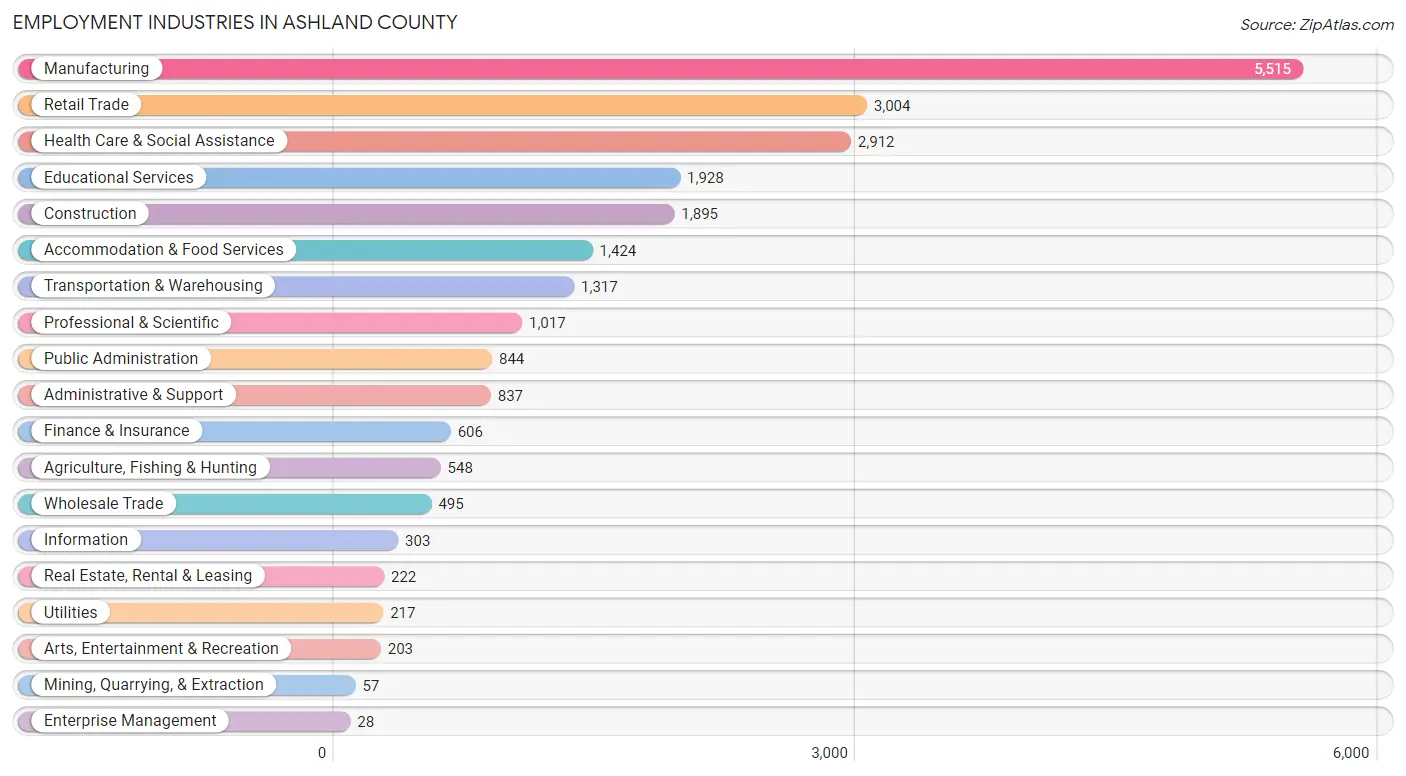
Employment Industries in Ashland County
The major employment industries in Ashland County include Manufacturing (5,515 | 22.3%), Retail Trade (3,004 | 12.2%), Health Care & Social Assistance (2,912 | 11.8%), Educational Services (1,928 | 7.8%), and Construction (1,895 | 7.7%).
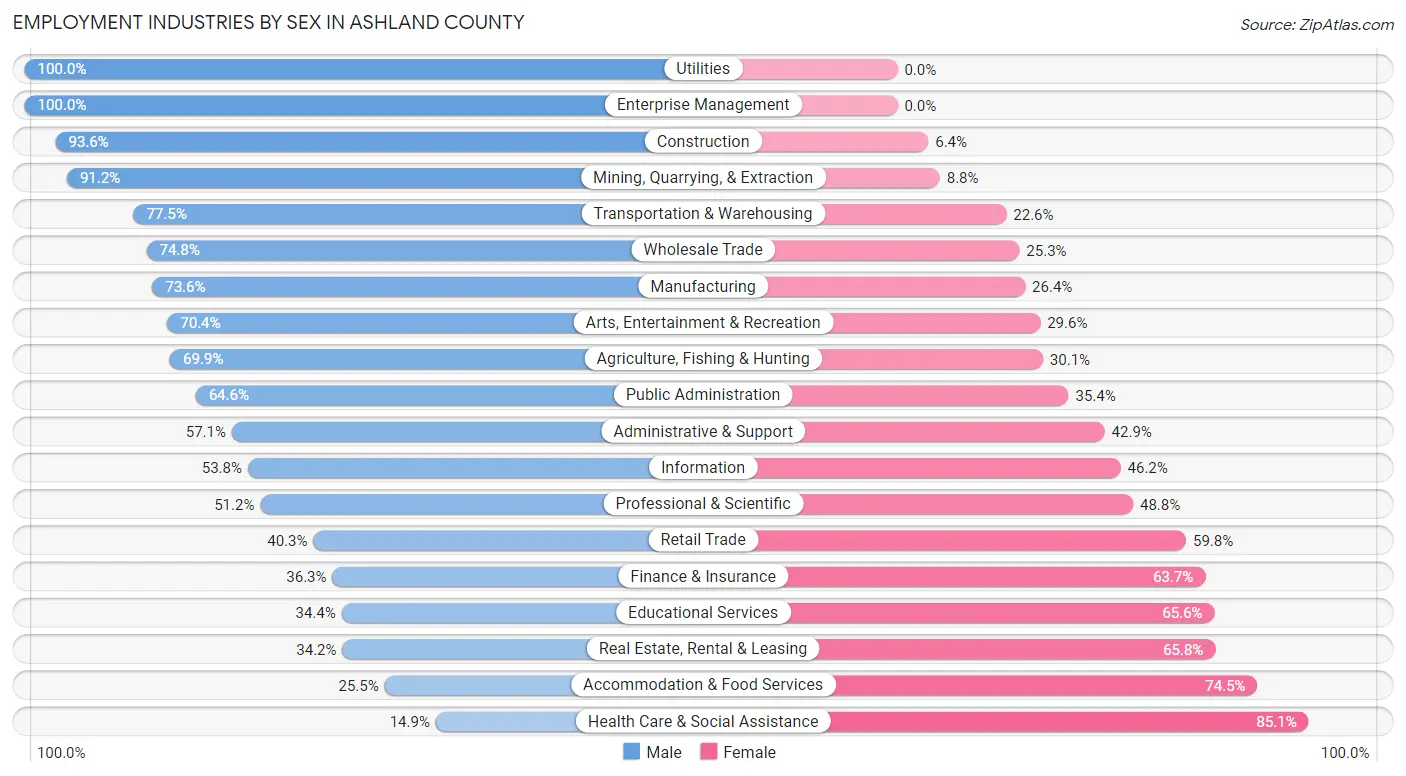
Employment Industries by Sex in Ashland County
The Ashland County industries that see more men than women are Utilities (100.0%), Enterprise Management (100.0%), and Construction (93.6%), whereas the industries that tend to have a higher number of women are Health Care & Social Assistance (85.1%), Accommodation & Food Services (74.5%), and Real Estate, Rental & Leasing (65.8%).
| Industry | Male | Female |
| Agriculture, Fishing & Hunting | 383 (69.9%) | 165 (30.1%) |
| Mining, Quarrying, & Extraction | 52 (91.2%) | 5 (8.8%) |
| Construction | 1,774 (93.6%) | 121 (6.4%) |
| Manufacturing | 4,057 (73.6%) | 1,458 (26.4%) |
| Wholesale Trade | 370 (74.8%) | 125 (25.3%) |
| Retail Trade | 1,209 (40.3%) | 1,795 (59.8%) |
| Transportation & Warehousing | 1,020 (77.4%) | 297 (22.6%) |
| Utilities | 217 (100.0%) | 0 (0.0%) |
| Information | 163 (53.8%) | 140 (46.2%) |
| Finance & Insurance | 220 (36.3%) | 386 (63.7%) |
| Real Estate, Rental & Leasing | 76 (34.2%) | 146 (65.8%) |
| Professional & Scientific | 521 (51.2%) | 496 (48.8%) |
| Enterprise Management | 28 (100.0%) | 0 (0.0%) |
| Administrative & Support | 478 (57.1%) | 359 (42.9%) |
| Educational Services | 663 (34.4%) | 1,265 (65.6%) |
| Health Care & Social Assistance | 434 (14.9%) | 2,478 (85.1%) |
| Arts, Entertainment & Recreation | 143 (70.4%) | 60 (29.6%) |
| Accommodation & Food Services | 363 (25.5%) | 1,061 (74.5%) |
| Public Administration | 545 (64.6%) | 299 (35.4%) |
| Total | 13,476 (54.5%) | 11,231 (45.5%) |
Education in Ashland County
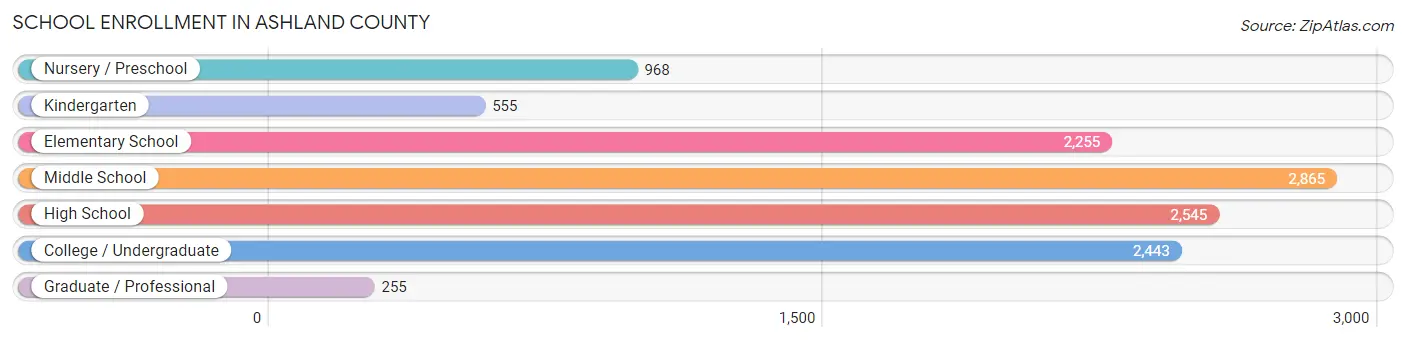
School Enrollment in Ashland County
The most common levels of schooling among the 11,886 students in Ashland County are middle school (2,865 | 24.1%), high school (2,545 | 21.4%), and college / undergraduate (2,443 | 20.5%).
| School Level | # Students | % Students |
| Nursery / Preschool | 968 | 8.1% |
| Kindergarten | 555 | 4.7% |
| Elementary School | 2,255 | 19.0% |
| Middle School | 2,865 | 24.1% |
| High School | 2,545 | 21.4% |
| College / Undergraduate | 2,443 | 20.5% |
| Graduate / Professional | 255 | 2.1% |
| Total | 11,886 | 100.0% |
School Enrollment by Age by Funding Source in Ashland County
Out of a total of 11,886 students who are enrolled in schools in Ashland County, 3,542 (29.8%) attend a private institution, while the remaining 8,344 (70.2%) are enrolled in public schools. The age group of 20 to 24 year olds has the highest likelihood of being enrolled in private schools, with 970 (75.0% in the age bracket) enrolled. Conversely, the age group of 15 to 17 year olds has the lowest likelihood of being enrolled in a private school, with 1,874 (89.7% in the age bracket) attending a public institution.
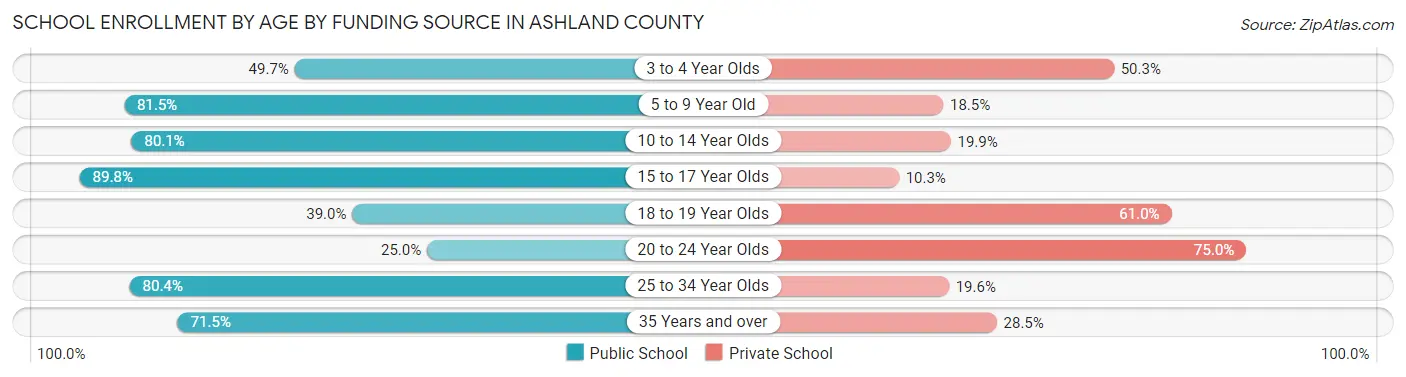
| Age Bracket | Public School | Private School |
| 3 to 4 Year Olds | 326 (49.7%) | 330 (50.3%) |
| 5 to 9 Year Old | 2,249 (81.5%) | 511 (18.5%) |
| 10 to 14 Year Olds | 2,648 (80.1%) | 658 (19.9%) |
| 15 to 17 Year Olds | 1,874 (89.7%) | 214 (10.2%) |
| 18 to 19 Year Olds | 450 (39.0%) | 705 (61.0%) |
| 20 to 24 Year Olds | 324 (25.0%) | 970 (75.0%) |
| 25 to 34 Year Olds | 222 (80.4%) | 54 (19.6%) |
| 35 Years and over | 251 (71.5%) | 100 (28.5%) |
| Total | 8,344 (70.2%) | 3,542 (29.8%) |
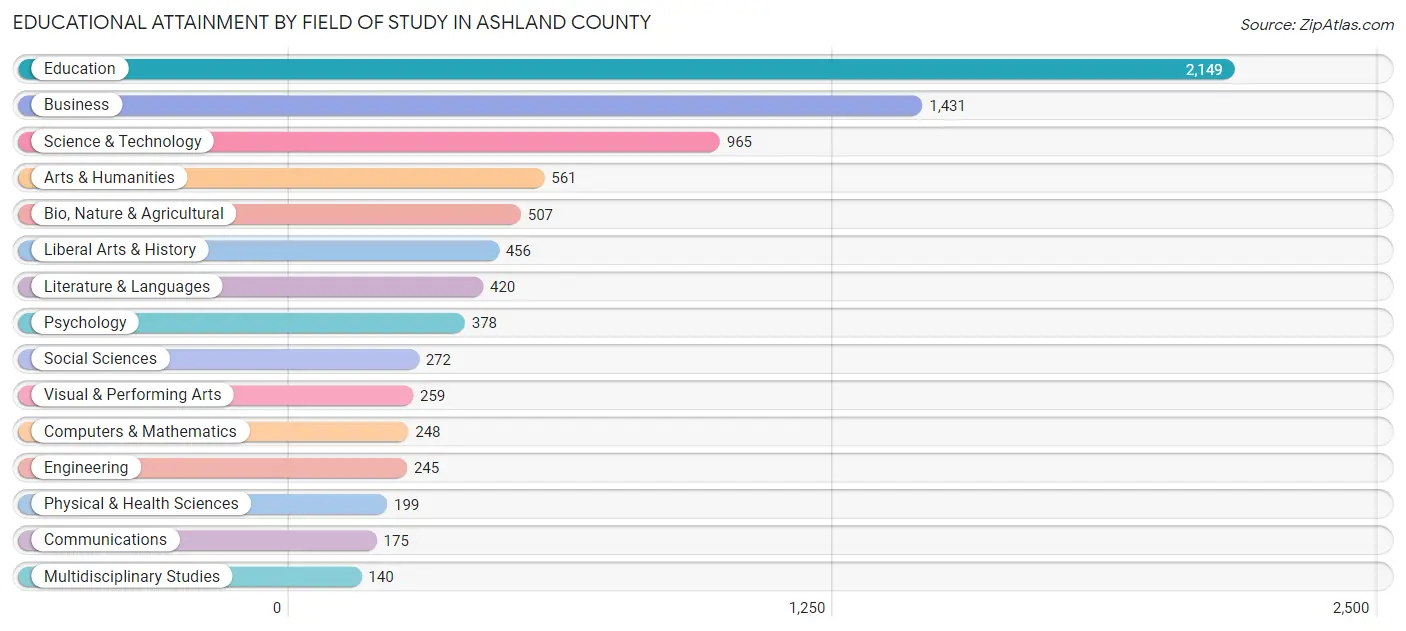
Educational Attainment by Field of Study in Ashland County
Education (2,149 | 25.6%), business (1,431 | 17.0%), science & technology (965 | 11.5%), arts & humanities (561 | 6.7%), and bio, nature & agricultural (507 | 6.0%) are the most common fields of study among 8,405 individuals in Ashland County who have obtained a bachelor's degree or higher.
| Field of Study | # Graduates | % Graduates |
| Computers & Mathematics | 248 | 2.9% |
| Bio, Nature & Agricultural | 507 | 6.0% |
| Physical & Health Sciences | 199 | 2.4% |
| Psychology | 378 | 4.5% |
| Social Sciences | 272 | 3.2% |
| Engineering | 245 | 2.9% |
| Multidisciplinary Studies | 140 | 1.7% |
| Science & Technology | 965 | 11.5% |
| Business | 1,431 | 17.0% |
| Education | 2,149 | 25.6% |
| Literature & Languages | 420 | 5.0% |
| Liberal Arts & History | 456 | 5.4% |
| Visual & Performing Arts | 259 | 3.1% |
| Communications | 175 | 2.1% |
| Arts & Humanities | 561 | 6.7% |
| Total | 8,405 | 100.0% |
Transportation & Commute in Ashland County
Vehicle Availability by Sex in Ashland County
The most prevalent vehicle ownership categories in Ashland County are males with 2 vehicles (5,135, accounting for 39.0%) and females with 2 vehicles (4,431, making up 48.3%).
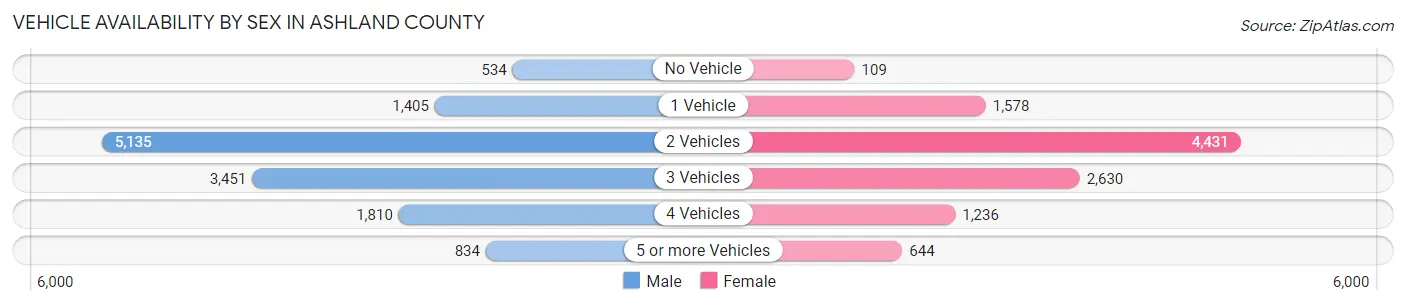
| Vehicles Available | Male | Female |
| No Vehicle | 534 (4.1%) | 109 (1.0%) |
| 1 Vehicle | 1,405 (10.7%) | 1,578 (14.8%) |
| 2 Vehicles | 5,135 (39.0%) | 4,431 (41.7%) |
| 3 Vehicles | 3,451 (26.2%) | 2,630 (24.7%) |
| 4 Vehicles | 1,810 (13.7%) | 1,236 (11.6%) |
| 5 or more Vehicles | 834 (6.3%) | 644 (6.1%) |
| Total | 13,169 (100.0%) | 10,628 (100.0%) |
Commute Time in Ashland County
The most frequently occuring commute durations in Ashland County are 5 to 9 minutes (3,956 commuters, 17.2%), 10 to 14 minutes (3,592 commuters, 15.7%), and 20 to 24 minutes (2,753 commuters, 12.0%).
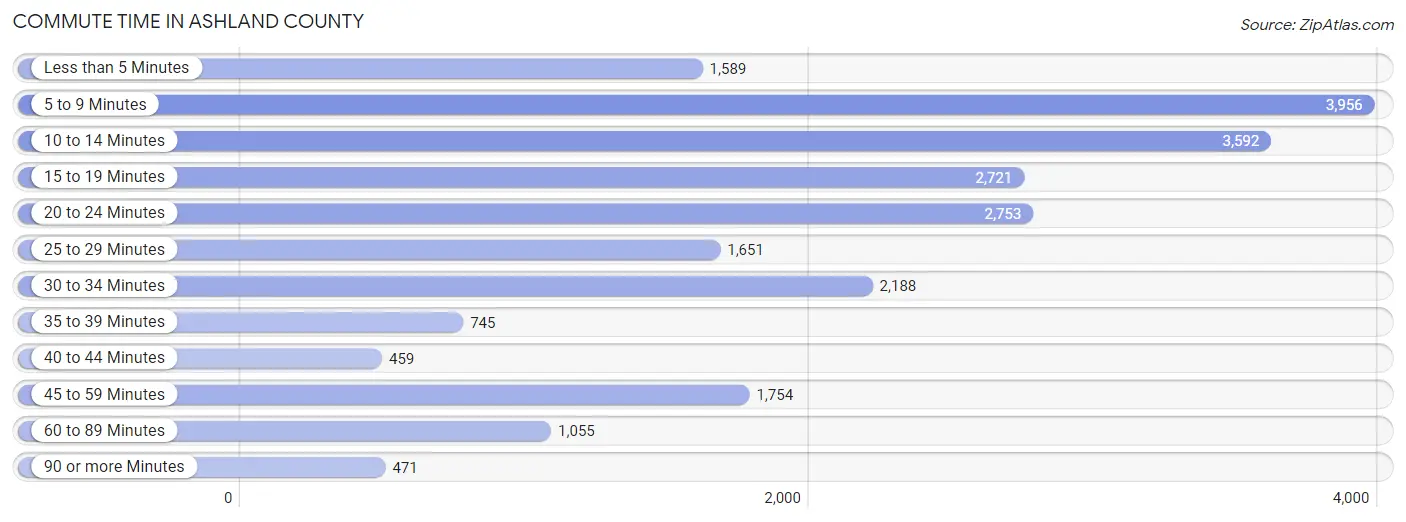
| Commute Time | # Commuters | % Commuters |
| Less than 5 Minutes | 1,589 | 6.9% |
| 5 to 9 Minutes | 3,956 | 17.2% |
| 10 to 14 Minutes | 3,592 | 15.7% |
| 15 to 19 Minutes | 2,721 | 11.9% |
| 20 to 24 Minutes | 2,753 | 12.0% |
| 25 to 29 Minutes | 1,651 | 7.2% |
| 30 to 34 Minutes | 2,188 | 9.5% |
| 35 to 39 Minutes | 745 | 3.3% |
| 40 to 44 Minutes | 459 | 2.0% |
| 45 to 59 Minutes | 1,754 | 7.6% |
| 60 to 89 Minutes | 1,055 | 4.6% |
| 90 or more Minutes | 471 | 2.1% |
Commute Time by Sex in Ashland County
The most common commute times in Ashland County are 5 to 9 minutes (2,067 commuters, 16.4%) for males and 5 to 9 minutes (1,889 commuters, 18.3%) for females.
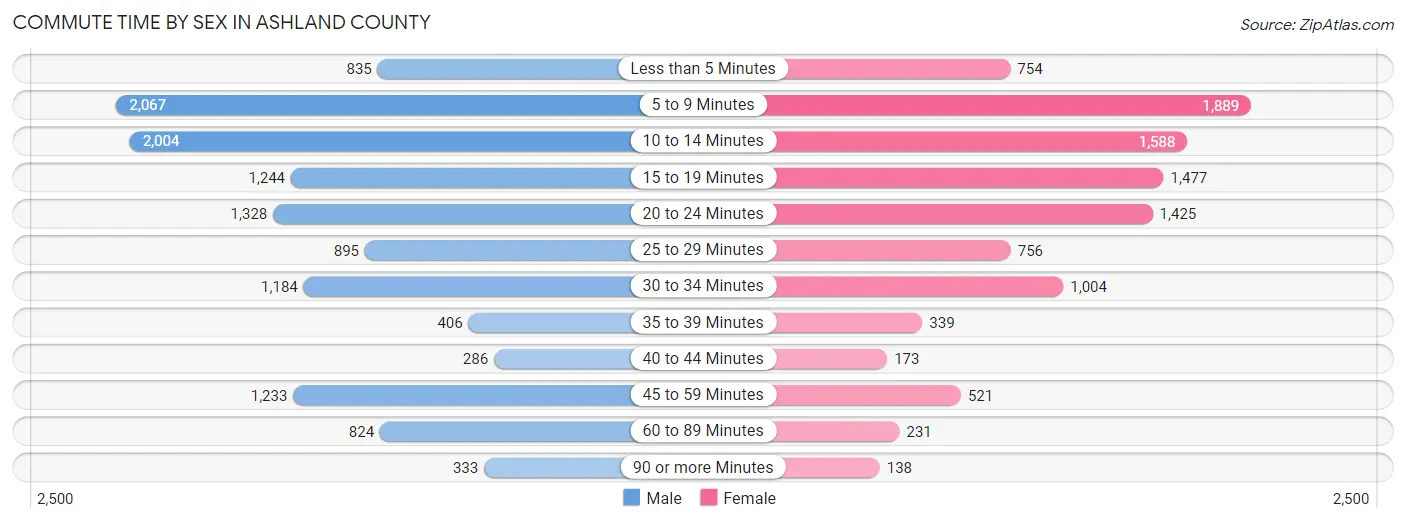
| Commute Time | Male | Female |
| Less than 5 Minutes | 835 (6.6%) | 754 (7.3%) |
| 5 to 9 Minutes | 2,067 (16.4%) | 1,889 (18.3%) |
| 10 to 14 Minutes | 2,004 (15.9%) | 1,588 (15.4%) |
| 15 to 19 Minutes | 1,244 (9.8%) | 1,477 (14.3%) |
| 20 to 24 Minutes | 1,328 (10.5%) | 1,425 (13.8%) |
| 25 to 29 Minutes | 895 (7.1%) | 756 (7.3%) |
| 30 to 34 Minutes | 1,184 (9.4%) | 1,004 (9.8%) |
| 35 to 39 Minutes | 406 (3.2%) | 339 (3.3%) |
| 40 to 44 Minutes | 286 (2.3%) | 173 (1.7%) |
| 45 to 59 Minutes | 1,233 (9.8%) | 521 (5.1%) |
| 60 to 89 Minutes | 824 (6.5%) | 231 (2.2%) |
| 90 or more Minutes | 333 (2.6%) | 138 (1.3%) |
Time of Departure to Work by Sex in Ashland County
The most frequent times of departure to work in Ashland County are 6:30 AM to 6:59 AM (1,885, 14.9%) for males and 7:30 AM to 7:59 AM (1,471, 14.3%) for females.
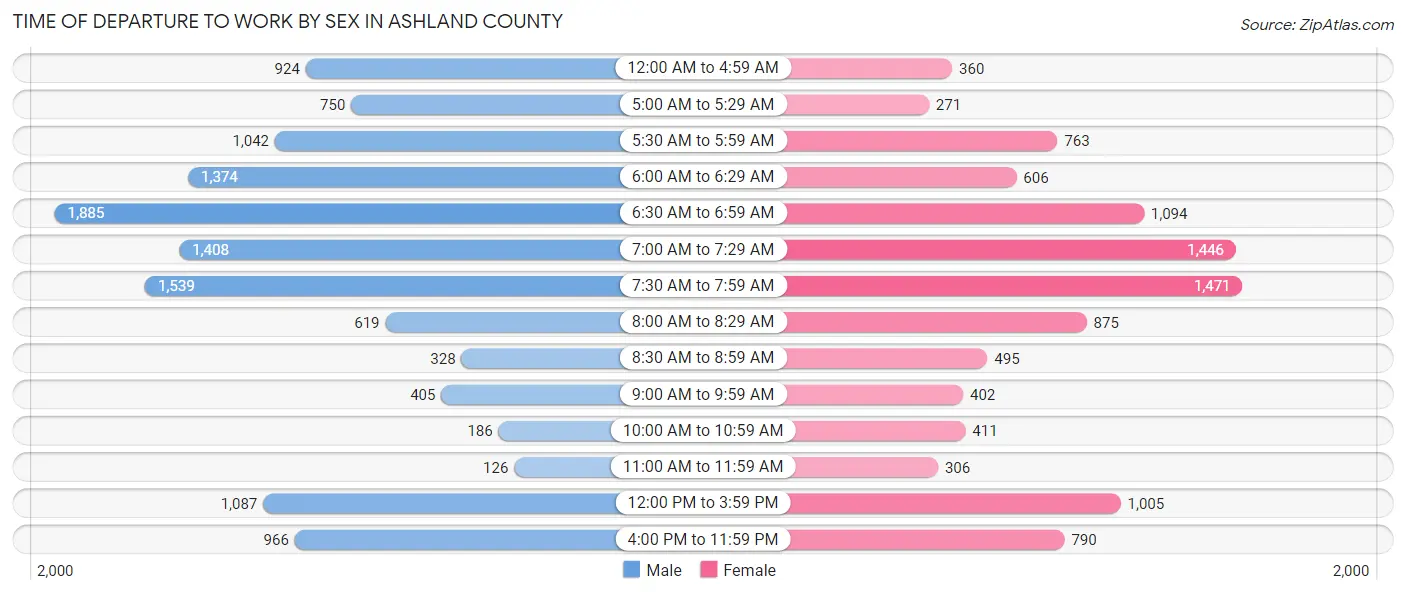
| Time of Departure | Male | Female |
| 12:00 AM to 4:59 AM | 924 (7.3%) | 360 (3.5%) |
| 5:00 AM to 5:29 AM | 750 (5.9%) | 271 (2.6%) |
| 5:30 AM to 5:59 AM | 1,042 (8.2%) | 763 (7.4%) |
| 6:00 AM to 6:29 AM | 1,374 (10.9%) | 606 (5.9%) |
| 6:30 AM to 6:59 AM | 1,885 (14.9%) | 1,094 (10.6%) |
| 7:00 AM to 7:29 AM | 1,408 (11.1%) | 1,446 (14.1%) |
| 7:30 AM to 7:59 AM | 1,539 (12.2%) | 1,471 (14.3%) |
| 8:00 AM to 8:29 AM | 619 (4.9%) | 875 (8.5%) |
| 8:30 AM to 8:59 AM | 328 (2.6%) | 495 (4.8%) |
| 9:00 AM to 9:59 AM | 405 (3.2%) | 402 (3.9%) |
| 10:00 AM to 10:59 AM | 186 (1.5%) | 411 (4.0%) |
| 11:00 AM to 11:59 AM | 126 (1.0%) | 306 (3.0%) |
| 12:00 PM to 3:59 PM | 1,087 (8.6%) | 1,005 (9.8%) |
| 4:00 PM to 11:59 PM | 966 (7.6%) | 790 (7.7%) |
| Total | 12,639 (100.0%) | 10,295 (100.0%) |
Housing Occupancy in Ashland County
Occupancy by Ownership in Ashland County
Of the total 20,478 dwellings in Ashland County, owner-occupied units account for 15,954 (77.9%), while renter-occupied units make up 4,524 (22.1%).
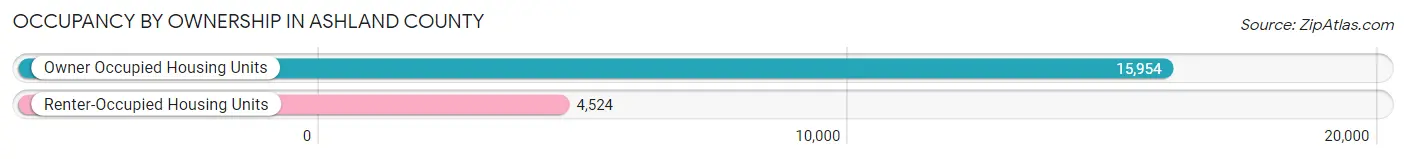
| Occupancy | # Housing Units | % Housing Units |
| Owner Occupied Housing Units | 15,954 | 77.9% |
| Renter-Occupied Housing Units | 4,524 | 22.1% |
| Total Occupied Housing Units | 20,478 | 100.0% |
Occupancy by Household Size in Ashland County
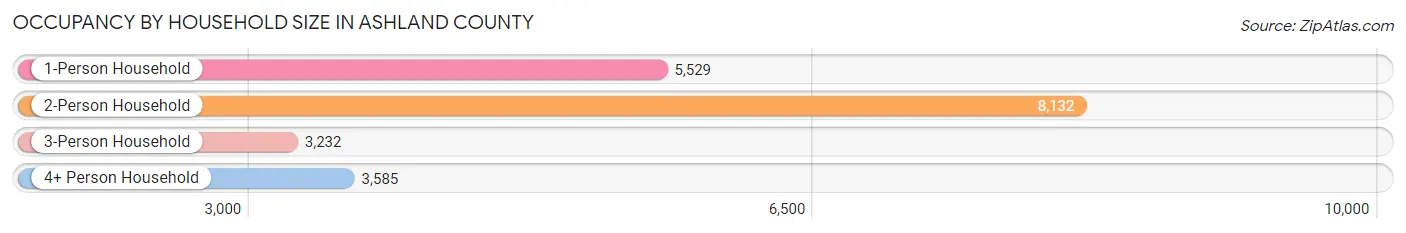
| Household Size | # Housing Units | % Housing Units |
| 1-Person Household | 5,529 | 27.0% |
| 2-Person Household | 8,132 | 39.7% |
| 3-Person Household | 3,232 | 15.8% |
| 4+ Person Household | 3,585 | 17.5% |
| Total Housing Units | 20,478 | 100.0% |
Occupancy by Ownership by Household Size in Ashland County
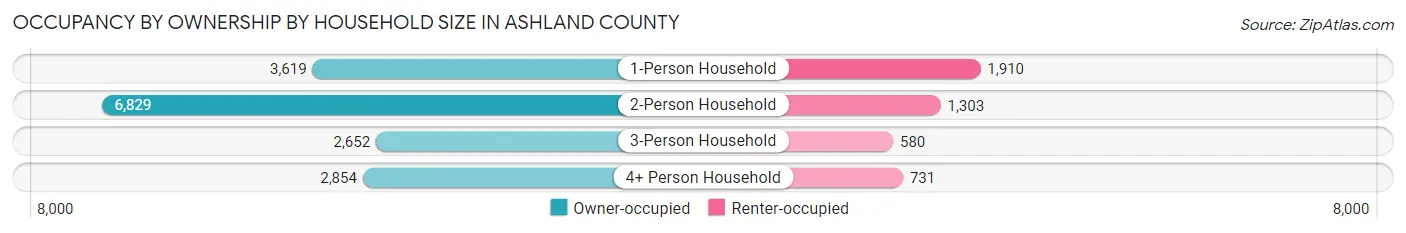
| Household Size | Owner-occupied | Renter-occupied |
| 1-Person Household | 3,619 (65.4%) | 1,910 (34.5%) |
| 2-Person Household | 6,829 (84.0%) | 1,303 (16.0%) |
| 3-Person Household | 2,652 (82.1%) | 580 (17.9%) |
| 4+ Person Household | 2,854 (79.6%) | 731 (20.4%) |
| Total Housing Units | 15,954 (77.9%) | 4,524 (22.1%) |
Occupancy by Educational Attainment in Ashland County
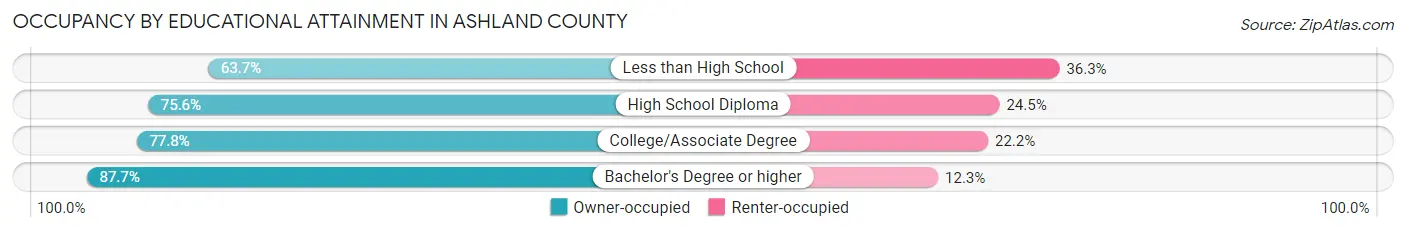
| Household Size | Owner-occupied | Renter-occupied |
| Less than High School | 1,219 (63.7%) | 696 (36.3%) |
| High School Diploma | 6,219 (75.5%) | 2,013 (24.4%) |
| College/Associate Degree | 4,294 (77.8%) | 1,224 (22.2%) |
| Bachelor's Degree or higher | 4,222 (87.7%) | 591 (12.3%) |
Occupancy by Age of Householder in Ashland County
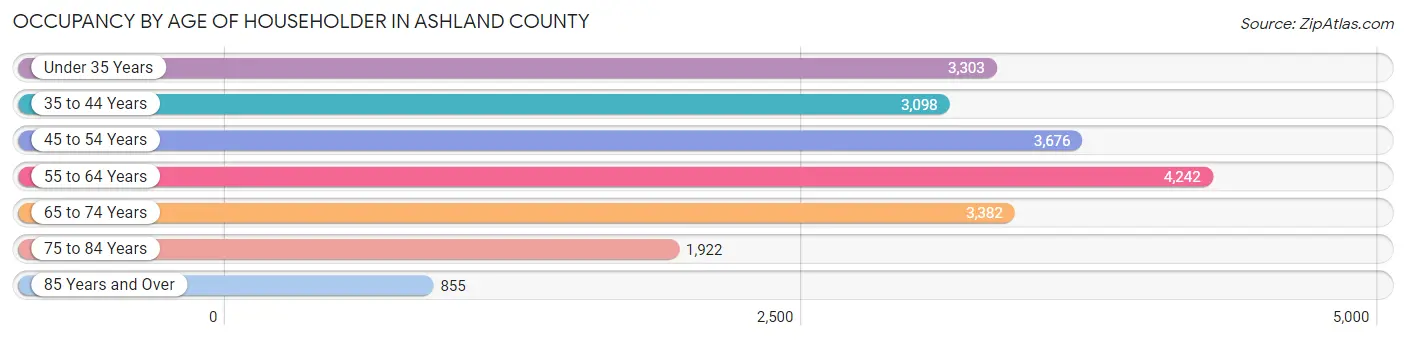
| Age Bracket | # Households | % Households |
| Under 35 Years | 3,303 | 16.1% |
| 35 to 44 Years | 3,098 | 15.1% |
| 45 to 54 Years | 3,676 | 17.9% |
| 55 to 64 Years | 4,242 | 20.7% |
| 65 to 74 Years | 3,382 | 16.5% |
| 75 to 84 Years | 1,922 | 9.4% |
| 85 Years and Over | 855 | 4.2% |
| Total | 20,478 | 100.0% |
Housing Finances in Ashland County
Median Income by Occupancy in Ashland County
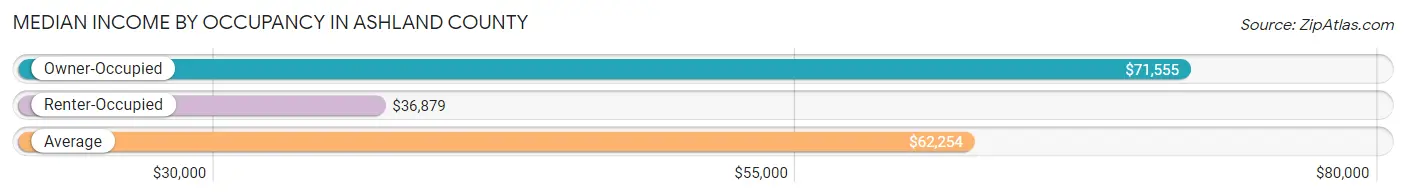
| Occupancy Type | # Households | Median Income |
| Owner-Occupied | 15,954 (77.9%) | $71,555 |
| Renter-Occupied | 4,524 (22.1%) | $36,879 |
| Average | 20,478 (100.0%) | $62,254 |
Occupancy by Householder Income Bracket in Ashland County
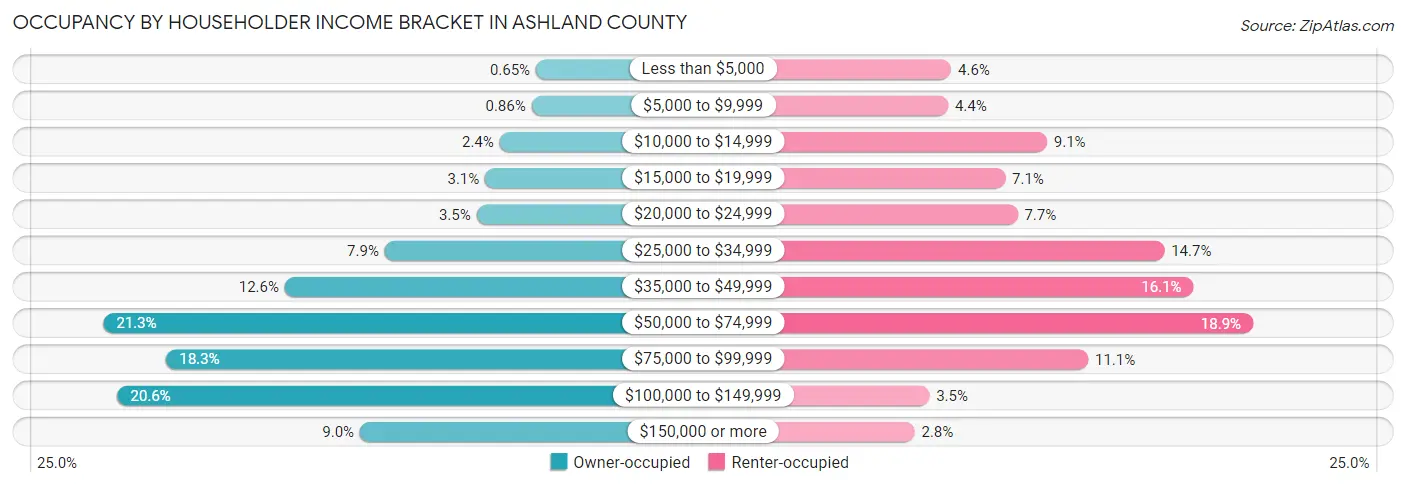
| Income Bracket | Owner-occupied | Renter-occupied |
| Less than $5,000 | 103 (0.6%) | 206 (4.5%) |
| $5,000 to $9,999 | 137 (0.9%) | 199 (4.4%) |
| $10,000 to $14,999 | 379 (2.4%) | 412 (9.1%) |
| $15,000 to $19,999 | 490 (3.1%) | 322 (7.1%) |
| $20,000 to $24,999 | 555 (3.5%) | 349 (7.7%) |
| $25,000 to $34,999 | 1,252 (7.9%) | 665 (14.7%) |
| $35,000 to $49,999 | 2,012 (12.6%) | 728 (16.1%) |
| $50,000 to $74,999 | 3,391 (21.2%) | 856 (18.9%) |
| $75,000 to $99,999 | 2,911 (18.2%) | 501 (11.1%) |
| $100,000 to $149,999 | 3,284 (20.6%) | 159 (3.5%) |
| $150,000 or more | 1,440 (9.0%) | 127 (2.8%) |
| Total | 15,954 (100.0%) | 4,524 (100.0%) |
Monthly Housing Cost Tiers in Ashland County
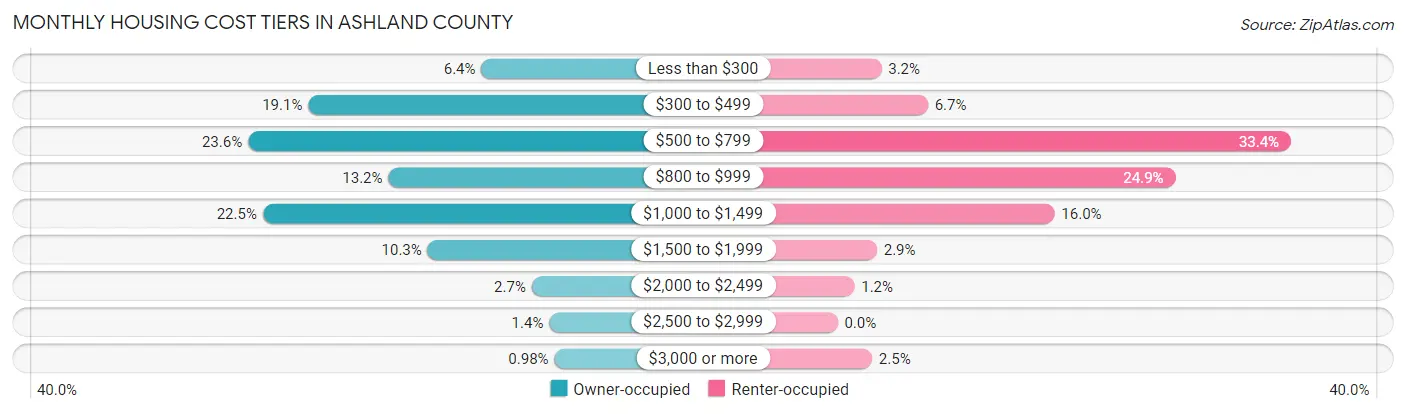
| Monthly Cost | Owner-occupied | Renter-occupied |
| Less than $300 | 1,014 (6.4%) | 146 (3.2%) |
| $300 to $499 | 3,049 (19.1%) | 301 (6.7%) |
| $500 to $799 | 3,757 (23.5%) | 1,511 (33.4%) |
| $800 to $999 | 2,108 (13.2%) | 1,126 (24.9%) |
| $1,000 to $1,499 | 3,583 (22.5%) | 723 (16.0%) |
| $1,500 to $1,999 | 1,647 (10.3%) | 131 (2.9%) |
| $2,000 to $2,499 | 423 (2.6%) | 56 (1.2%) |
| $2,500 to $2,999 | 217 (1.4%) | 0 (0.0%) |
| $3,000 or more | 156 (1.0%) | 115 (2.5%) |
| Total | 15,954 (100.0%) | 4,524 (100.0%) |
Physical Housing Characteristics in Ashland County
Housing Structures in Ashland County
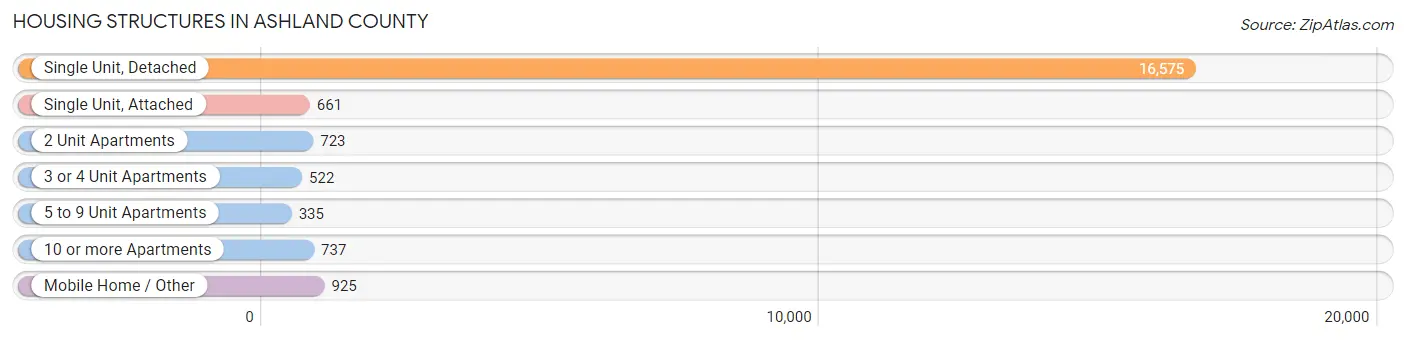
| Structure Type | # Housing Units | % Housing Units |
| Single Unit, Detached | 16,575 | 80.9% |
| Single Unit, Attached | 661 | 3.2% |
| 2 Unit Apartments | 723 | 3.5% |
| 3 or 4 Unit Apartments | 522 | 2.5% |
| 5 to 9 Unit Apartments | 335 | 1.6% |
| 10 or more Apartments | 737 | 3.6% |
| Mobile Home / Other | 925 | 4.5% |
| Total | 20,478 | 100.0% |
Housing Structures by Occupancy in Ashland County
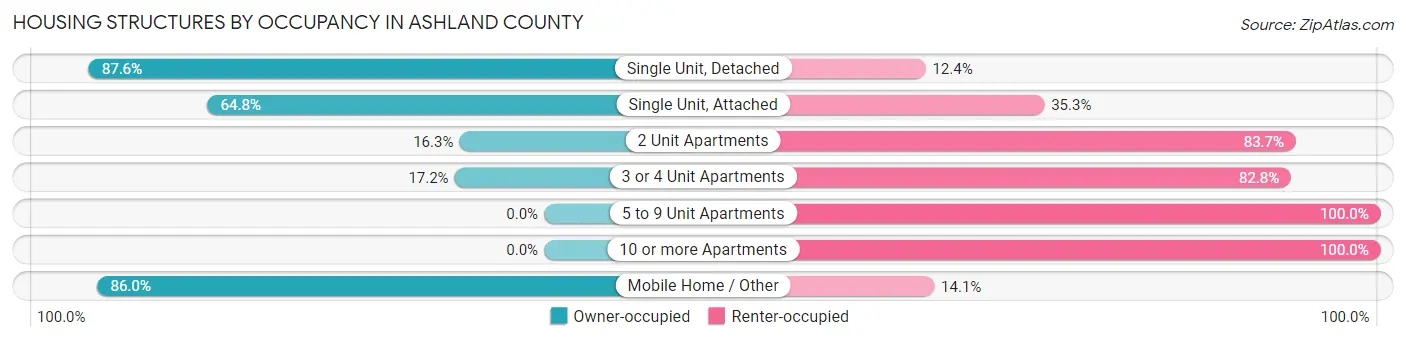
| Structure Type | Owner-occupied | Renter-occupied |
| Single Unit, Detached | 14,523 (87.6%) | 2,052 (12.4%) |
| Single Unit, Attached | 428 (64.7%) | 233 (35.2%) |
| 2 Unit Apartments | 118 (16.3%) | 605 (83.7%) |
| 3 or 4 Unit Apartments | 90 (17.2%) | 432 (82.8%) |
| 5 to 9 Unit Apartments | 0 (0.0%) | 335 (100.0%) |
| 10 or more Apartments | 0 (0.0%) | 737 (100.0%) |
| Mobile Home / Other | 795 (86.0%) | 130 (14.1%) |
| Total | 15,954 (77.9%) | 4,524 (22.1%) |
Housing Structures by Number of Rooms in Ashland County
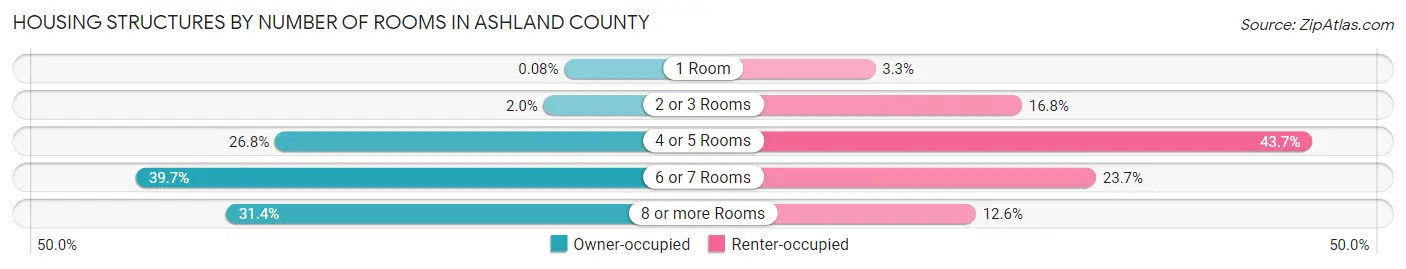
| Number of Rooms | Owner-occupied | Renter-occupied |
| 1 Room | 12 (0.1%) | 148 (3.3%) |
| 2 or 3 Rooms | 318 (2.0%) | 761 (16.8%) |
| 4 or 5 Rooms | 4,282 (26.8%) | 1,976 (43.7%) |
| 6 or 7 Rooms | 6,336 (39.7%) | 1,071 (23.7%) |
| 8 or more Rooms | 5,006 (31.4%) | 568 (12.6%) |
| Total | 15,954 (100.0%) | 4,524 (100.0%) |
Housing Structure by Heating Type in Ashland County
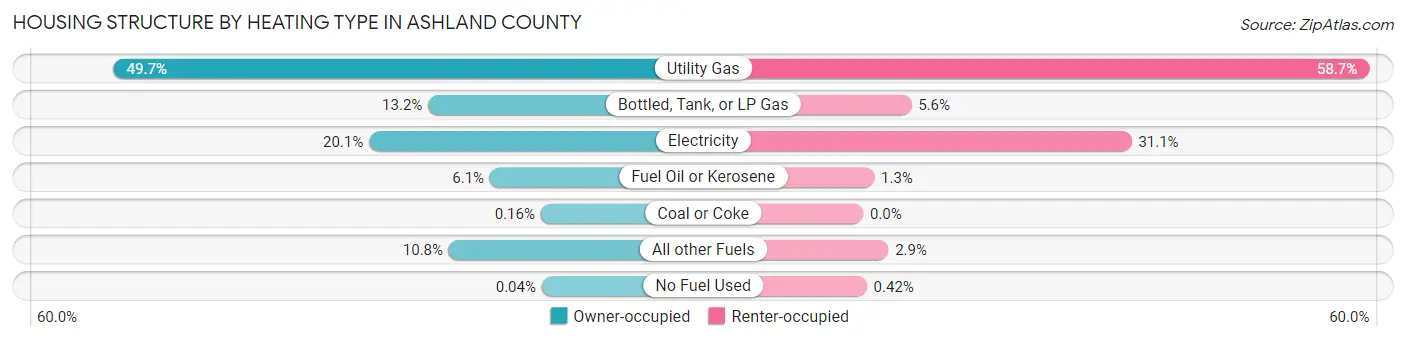
| Heating Type | Owner-occupied | Renter-occupied |
| Utility Gas | 7,924 (49.7%) | 2,654 (58.7%) |
| Bottled, Tank, or LP Gas | 2,107 (13.2%) | 253 (5.6%) |
| Electricity | 3,201 (20.1%) | 1,408 (31.1%) |
| Fuel Oil or Kerosene | 965 (6.0%) | 58 (1.3%) |
| Coal or Coke | 26 (0.2%) | 0 (0.0%) |
| All other Fuels | 1,725 (10.8%) | 132 (2.9%) |
| No Fuel Used | 6 (0.0%) | 19 (0.4%) |
| Total | 15,954 (100.0%) | 4,524 (100.0%) |
Household Vehicle Usage in Ashland County
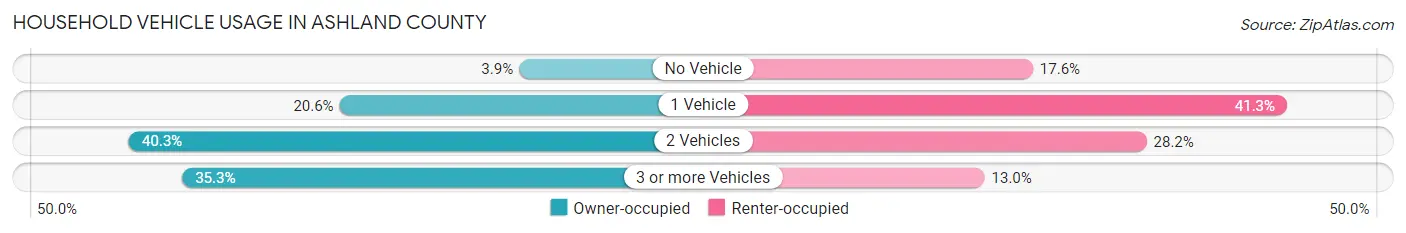
| Vehicles per Household | Owner-occupied | Renter-occupied |
| No Vehicle | 615 (3.8%) | 794 (17.5%) |
| 1 Vehicle | 3,288 (20.6%) | 1,866 (41.2%) |
| 2 Vehicles | 6,423 (40.3%) | 1,274 (28.2%) |
| 3 or more Vehicles | 5,628 (35.3%) | 590 (13.0%) |
| Total | 15,954 (100.0%) | 4,524 (100.0%) |
Real Estate & Mortgages in Ashland County
Real Estate and Mortgage Overview in Ashland County
| Characteristic | Without Mortgage | With Mortgage |
| Housing Units | 6,675 | 9,279 |
| Median Property Value | $157,600 | $166,700 |
| Median Household Income | $59,012 | $1,042 |
| Monthly Housing Costs | $467 | $149 |
| Real Estate Taxes | $1,738 | $221 |
Property Value by Mortgage Status in Ashland County
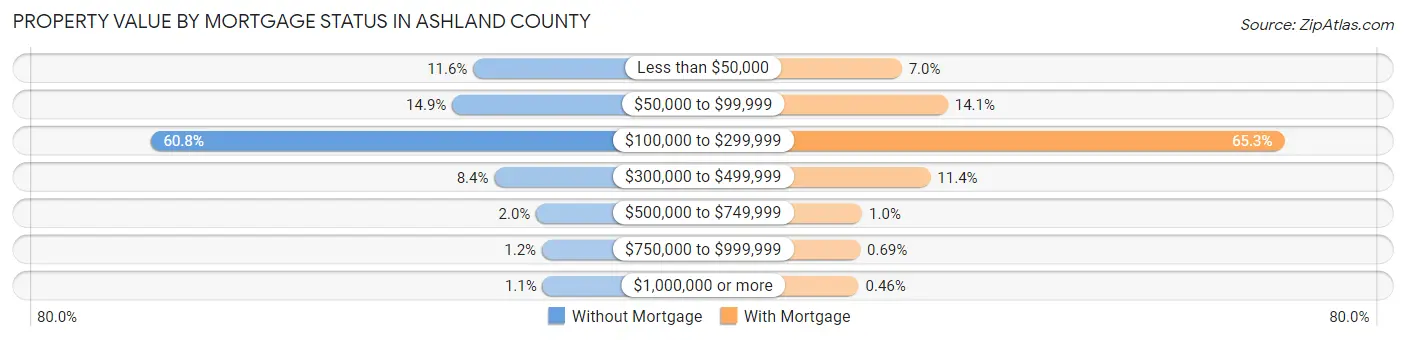
| Property Value | Without Mortgage | With Mortgage |
| Less than $50,000 | 777 (11.6%) | 653 (7.0%) |
| $50,000 to $99,999 | 991 (14.8%) | 1,305 (14.1%) |
| $100,000 to $299,999 | 4,059 (60.8%) | 6,061 (65.3%) |
| $300,000 to $499,999 | 562 (8.4%) | 1,059 (11.4%) |
| $500,000 to $749,999 | 136 (2.0%) | 94 (1.0%) |
| $750,000 to $999,999 | 78 (1.2%) | 64 (0.7%) |
| $1,000,000 or more | 72 (1.1%) | 43 (0.5%) |
| Total | 6,675 (100.0%) | 9,279 (100.0%) |
Household Income by Mortgage Status in Ashland County
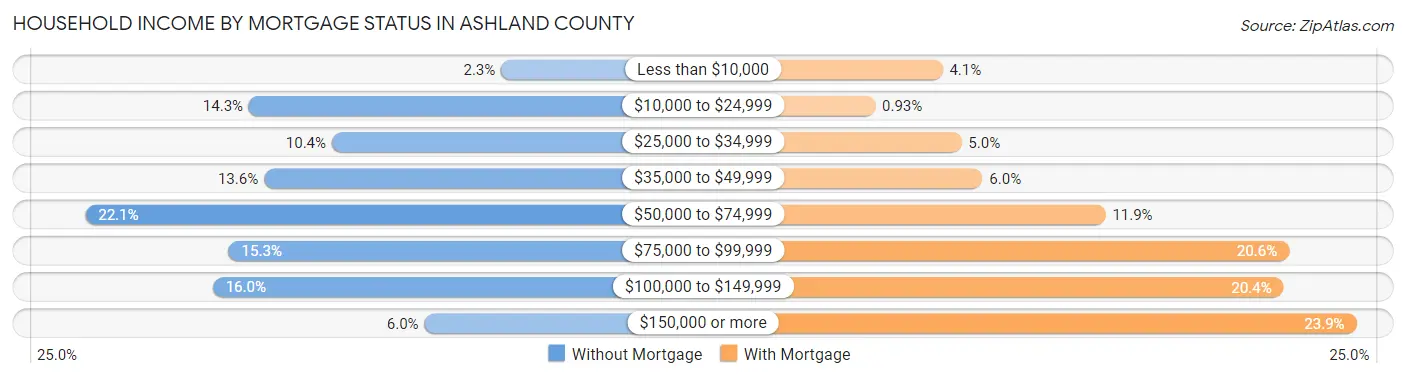
| Household Income | Without Mortgage | With Mortgage |
| Less than $10,000 | 154 (2.3%) | 384 (4.1%) |
| $10,000 to $24,999 | 956 (14.3%) | 86 (0.9%) |
| $25,000 to $34,999 | 692 (10.4%) | 468 (5.0%) |
| $35,000 to $49,999 | 908 (13.6%) | 560 (6.0%) |
| $50,000 to $74,999 | 1,476 (22.1%) | 1,104 (11.9%) |
| $75,000 to $99,999 | 1,020 (15.3%) | 1,915 (20.6%) |
| $100,000 to $149,999 | 1,071 (16.0%) | 1,891 (20.4%) |
| $150,000 or more | 398 (6.0%) | 2,213 (23.8%) |
| Total | 6,675 (100.0%) | 9,279 (100.0%) |
Property Value to Household Income Ratio in Ashland County
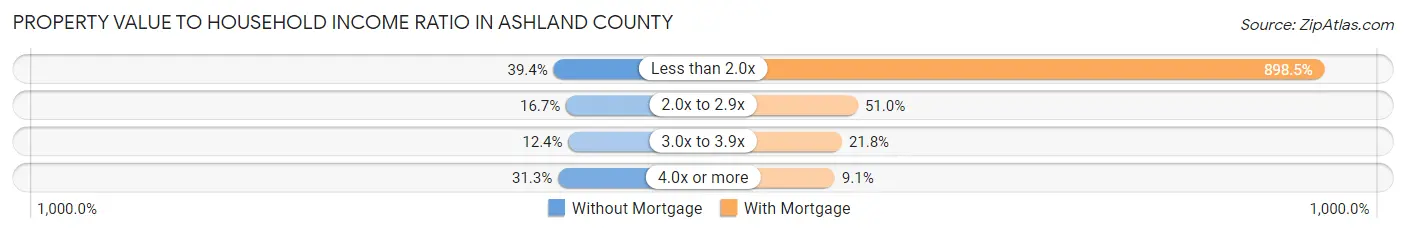
| Value-to-Income Ratio | Without Mortgage | With Mortgage |
| Less than 2.0x | 2,630 (39.4%) | 83,369 (898.5%) |
| 2.0x to 2.9x | 1,112 (16.7%) | 4,731 (51.0%) |
| 3.0x to 3.9x | 829 (12.4%) | 2,026 (21.8%) |
| 4.0x or more | 2,088 (31.3%) | 840 (9.0%) |
| Total | 6,675 (100.0%) | 9,279 (100.0%) |
Real Estate Taxes by Mortgage Status in Ashland County
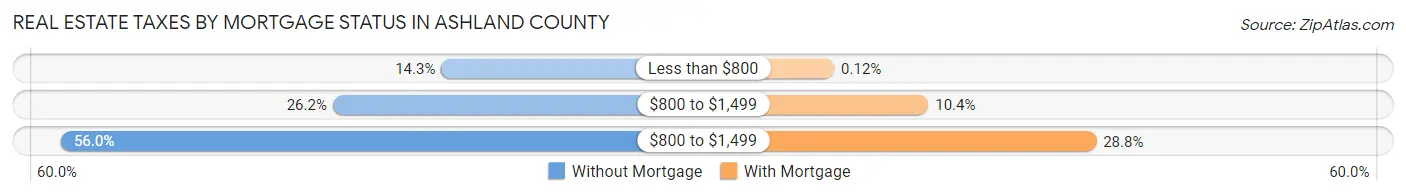
| Property Taxes | Without Mortgage | With Mortgage |
| Less than $800 | 957 (14.3%) | 11 (0.1%) |
| $800 to $1,499 | 1,751 (26.2%) | 969 (10.4%) |
| $800 to $1,499 | 3,739 (56.0%) | 2,676 (28.8%) |
| Total | 6,675 (100.0%) | 9,279 (100.0%) |
Health & Disability in Ashland County
Health Insurance Coverage by Age in Ashland County
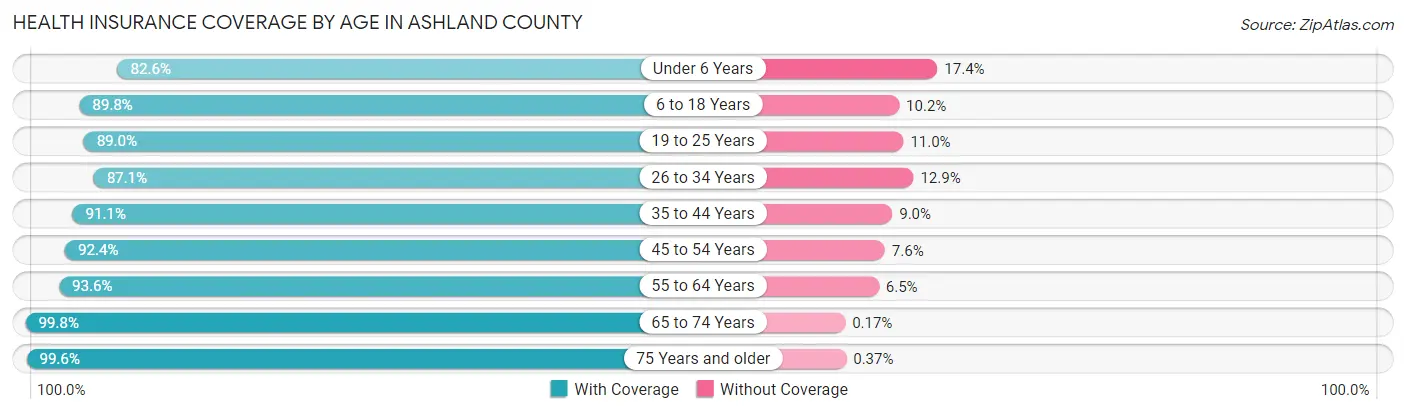
| Age Bracket | With Coverage | Without Coverage |
| Under 6 Years | 2,889 (82.6%) | 607 (17.4%) |
| 6 to 18 Years | 8,084 (89.8%) | 921 (10.2%) |
| 19 to 25 Years | 4,460 (89.0%) | 553 (11.0%) |
| 26 to 34 Years | 4,389 (87.1%) | 650 (12.9%) |
| 35 to 44 Years | 5,322 (91.0%) | 523 (8.9%) |
| 45 to 54 Years | 6,054 (92.4%) | 496 (7.6%) |
| 55 to 64 Years | 6,687 (93.5%) | 461 (6.5%) |
| 65 to 74 Years | 5,808 (99.8%) | 10 (0.2%) |
| 75 Years and older | 4,030 (99.6%) | 15 (0.4%) |
| Total | 47,723 (91.8%) | 4,236 (8.2%) |
Health Insurance Coverage by Citizenship Status in Ashland County

| Citizenship Status | With Coverage | Without Coverage |
| Native Born | 2,889 (82.6%) | 607 (17.4%) |
| Foreign Born, Citizen | 8,084 (89.8%) | 921 (10.2%) |
| Foreign Born, not a Citizen | 4,460 (89.0%) | 553 (11.0%) |
Health Insurance Coverage by Household Income in Ashland County
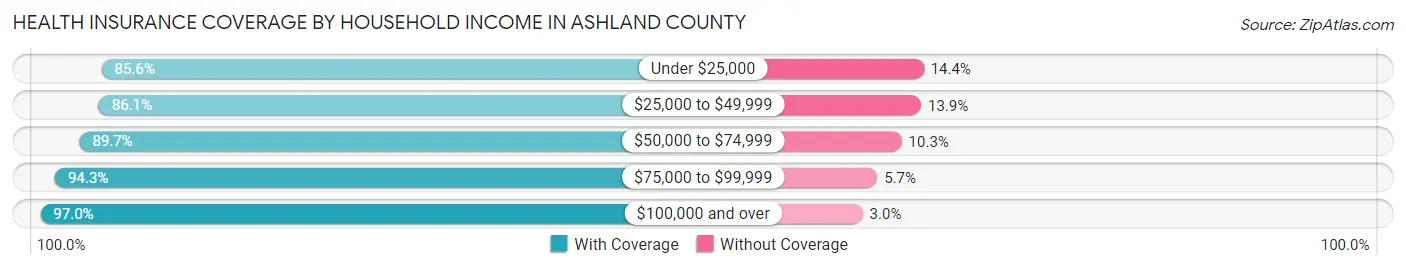
| Household Income | With Coverage | Without Coverage |
| Under $25,000 | 4,799 (85.6%) | 808 (14.4%) |
| $25,000 to $49,999 | 7,942 (86.1%) | 1,283 (13.9%) |
| $50,000 to $74,999 | 9,393 (89.7%) | 1,076 (10.3%) |
| $75,000 to $99,999 | 9,318 (94.3%) | 563 (5.7%) |
| $100,000 and over | 15,139 (97.0%) | 464 (3.0%) |
Public vs Private Health Insurance Coverage by Age in Ashland County
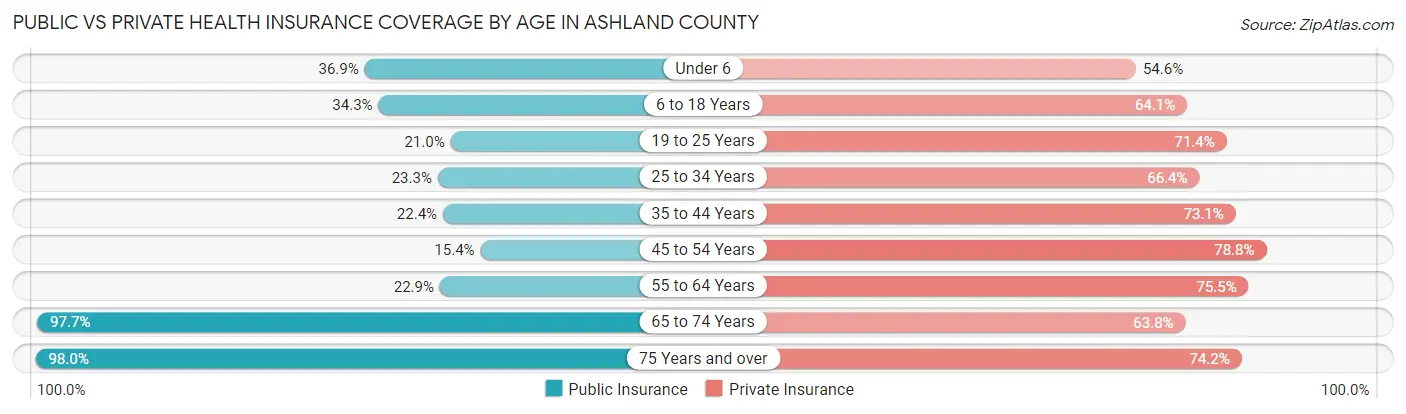
| Age Bracket | Public Insurance | Private Insurance |
| Under 6 | 1,290 (36.9%) | 1,909 (54.6%) |
| 6 to 18 Years | 3,091 (34.3%) | 5,771 (64.1%) |
| 19 to 25 Years | 1,050 (20.9%) | 3,580 (71.4%) |
| 25 to 34 Years | 1,175 (23.3%) | 3,344 (66.4%) |
| 35 to 44 Years | 1,307 (22.4%) | 4,273 (73.1%) |
| 45 to 54 Years | 1,009 (15.4%) | 5,161 (78.8%) |
| 55 to 64 Years | 1,639 (22.9%) | 5,397 (75.5%) |
| 65 to 74 Years | 5,682 (97.7%) | 3,710 (63.8%) |
| 75 Years and over | 3,963 (98.0%) | 3,001 (74.2%) |
| Total | 20,206 (38.9%) | 36,146 (69.6%) |
Disability Status by Sex by Age in Ashland County
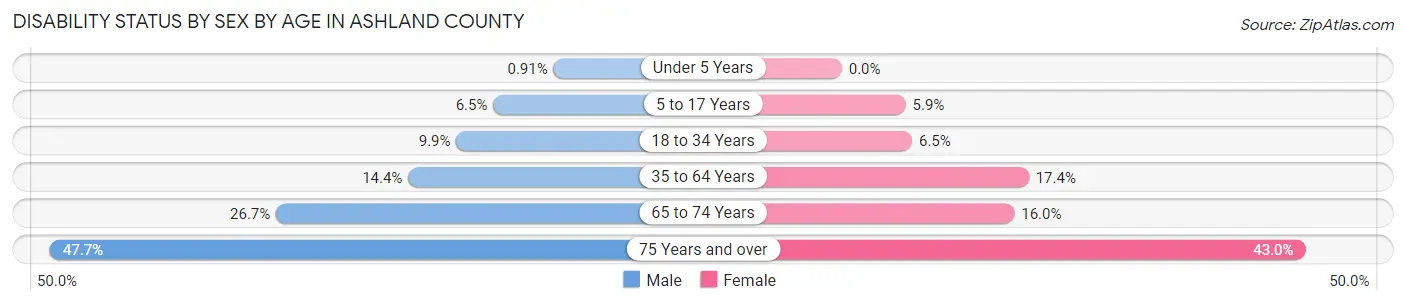
| Age Bracket | Male | Female |
| Under 5 Years | 13 (0.9%) | 0 (0.0%) |
| 5 to 17 Years | 299 (6.5%) | 255 (5.9%) |
| 18 to 34 Years | 542 (9.9%) | 349 (6.5%) |
| 35 to 64 Years | 1,420 (14.4%) | 1,680 (17.3%) |
| 65 to 74 Years | 745 (26.7%) | 484 (16.0%) |
| 75 Years and over | 811 (47.6%) | 1,008 (43.0%) |
Disability Class by Sex by Age in Ashland County
Disability Class: Hearing Difficulty
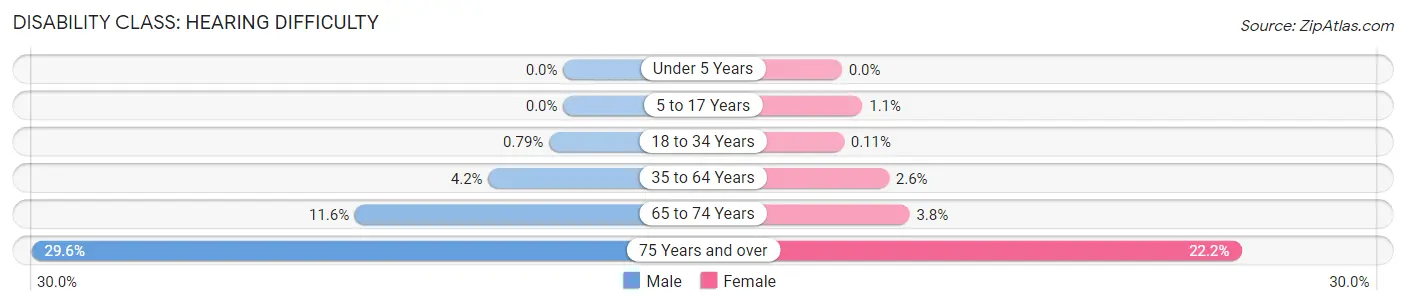
| Age Bracket | Male | Female |
| Under 5 Years | 0 (0.0%) | 0 (0.0%) |
| 5 to 17 Years | 0 (0.0%) | 49 (1.1%) |
| 18 to 34 Years | 43 (0.8%) | 6 (0.1%) |
| 35 to 64 Years | 411 (4.2%) | 254 (2.6%) |
| 65 to 74 Years | 324 (11.6%) | 114 (3.8%) |
| 75 Years and over | 504 (29.6%) | 521 (22.2%) |
Disability Class: Vision Difficulty
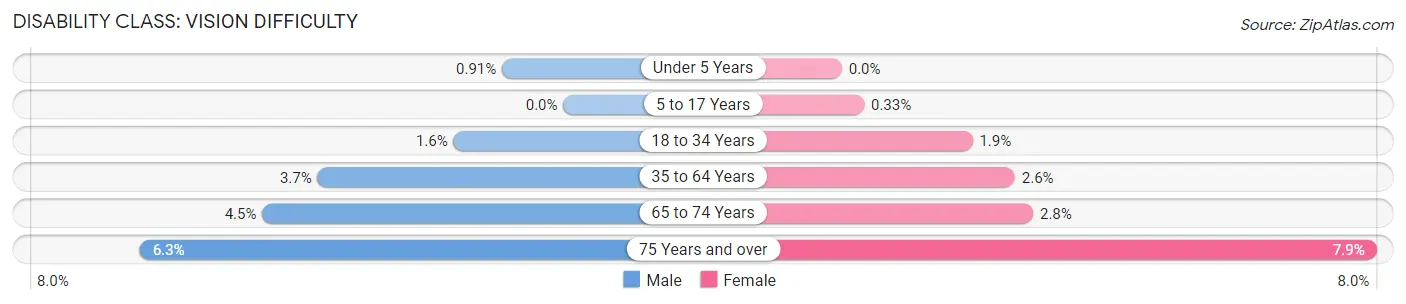
| Age Bracket | Male | Female |
| Under 5 Years | 13 (0.9%) | 0 (0.0%) |
| 5 to 17 Years | 0 (0.0%) | 14 (0.3%) |
| 18 to 34 Years | 89 (1.6%) | 104 (1.9%) |
| 35 to 64 Years | 360 (3.6%) | 249 (2.6%) |
| 65 to 74 Years | 125 (4.5%) | 86 (2.8%) |
| 75 Years and over | 107 (6.3%) | 186 (7.9%) |
Disability Class: Cognitive Difficulty
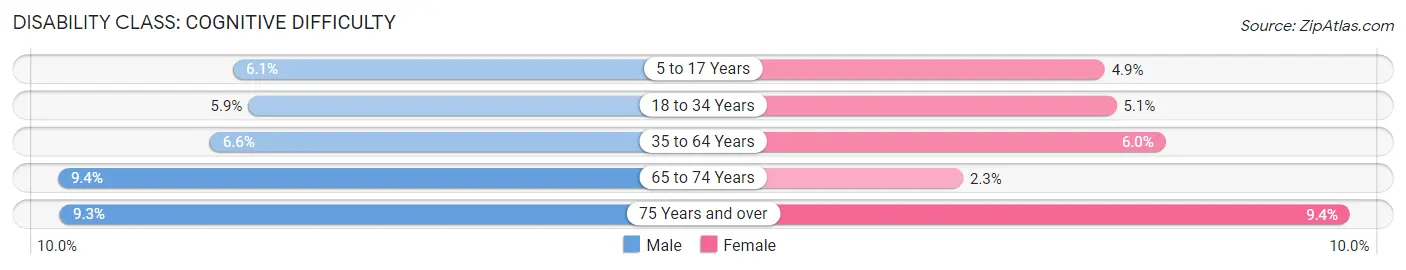
| Age Bracket | Male | Female |
| 5 to 17 Years | 282 (6.1%) | 210 (4.9%) |
| 18 to 34 Years | 319 (5.9%) | 273 (5.1%) |
| 35 to 64 Years | 647 (6.6%) | 582 (6.0%) |
| 65 to 74 Years | 262 (9.4%) | 68 (2.2%) |
| 75 Years and over | 159 (9.3%) | 221 (9.4%) |
Disability Class: Ambulatory Difficulty
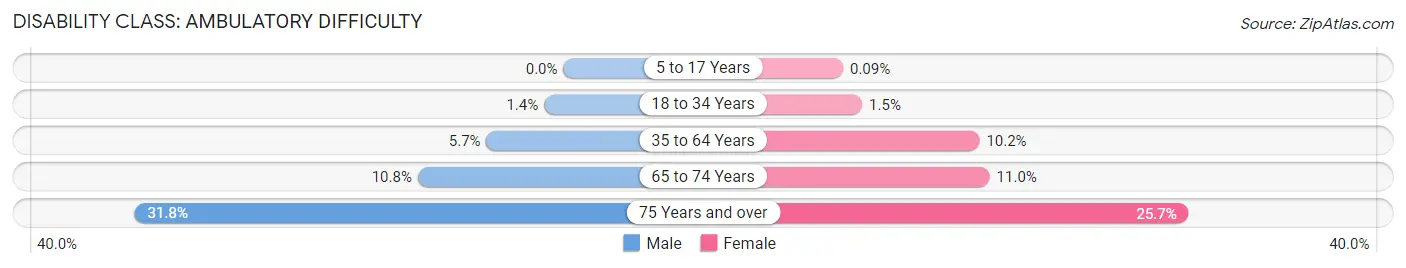
| Age Bracket | Male | Female |
| 5 to 17 Years | 0 (0.0%) | 4 (0.1%) |
| 18 to 34 Years | 78 (1.4%) | 81 (1.5%) |
| 35 to 64 Years | 563 (5.7%) | 990 (10.2%) |
| 65 to 74 Years | 302 (10.8%) | 332 (11.0%) |
| 75 Years and over | 542 (31.8%) | 603 (25.7%) |
Disability Class: Self-Care Difficulty
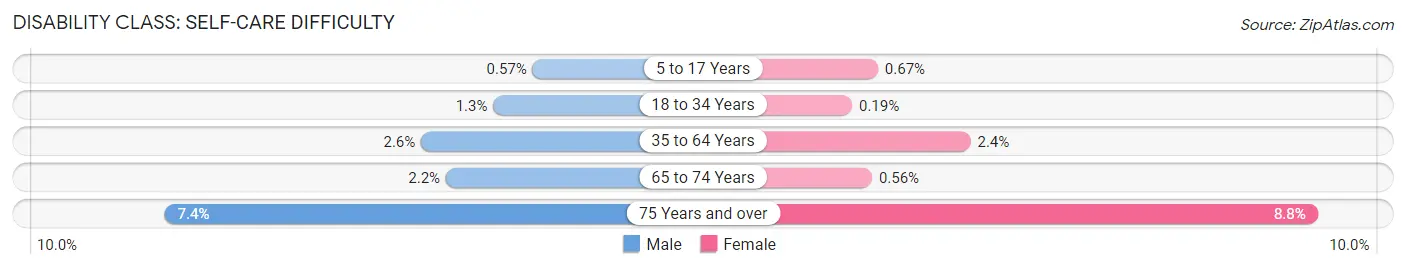
| Age Bracket | Male | Female |
| 5 to 17 Years | 26 (0.6%) | 29 (0.7%) |
| 18 to 34 Years | 71 (1.3%) | 10 (0.2%) |
| 35 to 64 Years | 260 (2.6%) | 231 (2.4%) |
| 65 to 74 Years | 61 (2.2%) | 17 (0.6%) |
| 75 Years and over | 126 (7.4%) | 207 (8.8%) |
Technology Access in Ashland County
Computing Device Access in Ashland County
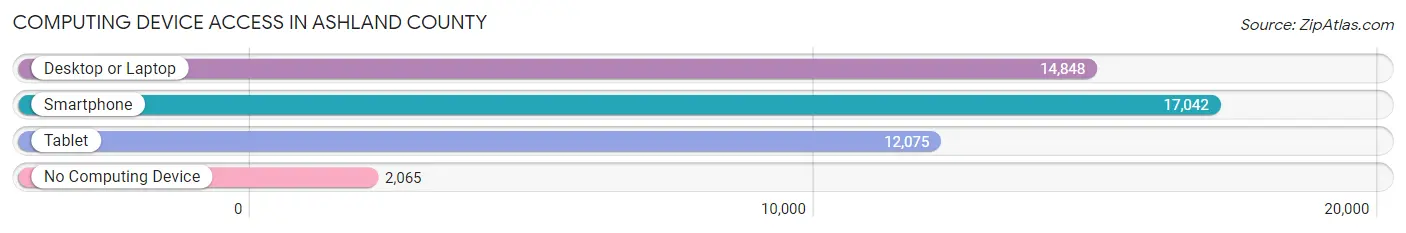
| Device Type | # Households | % Households |
| Desktop or Laptop | 14,848 | 72.5% |
| Smartphone | 17,042 | 83.2% |
| Tablet | 12,075 | 59.0% |
| No Computing Device | 2,065 | 10.1% |
| Total | 20,478 | 100.0% |
Internet Access in Ashland County
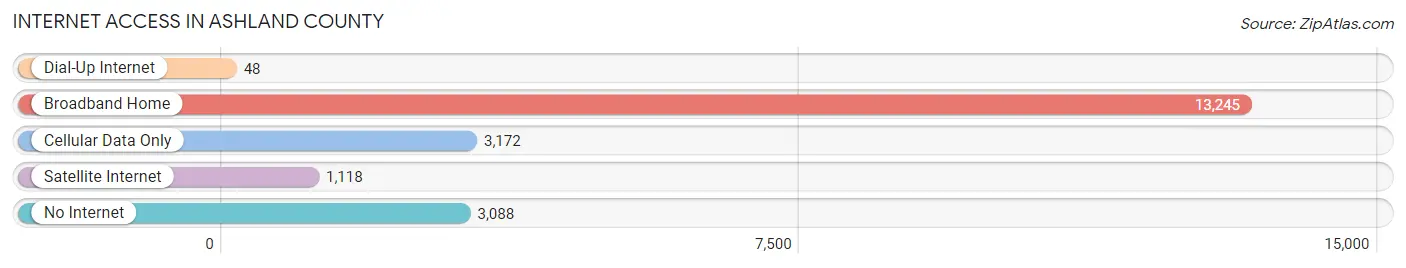
| Internet Type | # Households | % Households |
| Dial-Up Internet | 48 | 0.2% |
| Broadband Home | 13,245 | 64.7% |
| Cellular Data Only | 3,172 | 15.5% |
| Satellite Internet | 1,118 | 5.5% |
| No Internet | 3,088 | 15.1% |
| Total | 20,478 | 100.0% |
Ashland County Summary
Ashland County is located in the north-central region of Ohio, and is part of the Ashland Metropolitan Statistical Area. The county was established in 1846 and is named after the city of Ashland, which was named after the home of Henry Clay, a prominent statesman from Kentucky. The county seat is also located in Ashland. As of the 2010 census, the population of Ashland County was 53,139.
Geography
Ashland County is located in the north-central region of Ohio, and is bordered by Richland County to the north, Wayne County to the east, Holmes County to the south, and Huron County to the west. The county has a total area of 437 square miles, of which 433 square miles is land and 4.2 square miles is water. The county is located in the glaciated Allegheny Plateau region of Ohio, and is characterized by rolling hills and valleys. The county is drained by the Mohican River, which flows through the county from north to south.
The county is home to several state parks and wildlife areas, including Mohican State Park, Pleasant Hill Lake Park, and Clear Fork Reservoir. The county also contains several small lakes, including Lake Fork, Pleasant Hill Lake, and Clear Fork Reservoir.
Economy
The economy of Ashland County is largely based on manufacturing and agriculture. The county is home to several large manufacturing companies, including Rubbermaid, Ashland Inc., and The J.M. Smucker Company. The county is also home to several small businesses, including restaurants, retail stores, and service providers.
Agriculture is also an important part of the economy of Ashland County. The county is home to several large farms, and is a major producer of corn, soybeans, and wheat. The county is also home to several wineries and vineyards, and is a major producer of wine.
Demographics
As of the 2010 census, the population of Ashland County was 53,139, with a population density of 121 people per square mile. The racial makeup of the county was 95.3% White, 1.3% African American, 0.4% Native American, 0.7% Asian, 0.1% Pacific Islander, 0.7% from other races, and 1.5% from two or more races. Hispanic or Latino of any race were 2.2% of the population.
The median income for a household in the county was $41,945, and the median income for a family was $50,945. The per capita income for the county was $20,945. About 11.2% of the population was below the poverty line.
Education
Ashland County is served by the Ashland City School District, which consists of seven elementary schools, two middle schools, and one high school. The county is also home to several private schools, including Ashland Christian School and Ashland University. The county is also home to several colleges and universities, including Ashland University, North Central State College, and Ohio State University-Mansfield.
Conclusion
Ashland County is a rural county located in the north-central region of Ohio. The county is home to several large manufacturing companies, as well as several small businesses and farms. The county is also home to several state parks and wildlife areas, as well as several colleges and universities. The population of Ashland County is largely white, with a median income of $41,945. The county is served by the Ashland City School District, as well as several private schools and colleges.
Common Questions
What is Per Capita Income in Ashland County?
Per Capita income in Ashland County is $30,303.
What is the Median Family Income in Ashland County?
Median Family Income in Ashland County is $76,715.
What is the Median Household income in Ashland County?
Median Household Income in Ashland County is $62,254.
What is Income or Wage Gap in Ashland County?
Income or Wage Gap in Ashland County is 37.3%.
Women in Ashland County earn 62.7 cents for every dollar earned by a man.
What is Family Income Deficit in Ashland County?
Family Income Deficit in Ashland County is $11,582.
Families that are below poverty line in Ashland County earn $11,582 less on average than the poverty threshold level.
What is Inequality or Gini Index in Ashland County?
Inequality or Gini Index in Ashland County is 0.40.
What is the Total Population of Ashland County?
Total Population of Ashland County is 52,522.
What is the Total Male Population of Ashland County?
Total Male Population of Ashland County is 26,094.
What is the Total Female Population of Ashland County?
Total Female Population of Ashland County is 26,428.
What is the Ratio of Males per 100 Females in Ashland County?
There are 98.74 Males per 100 Females in Ashland County.
What is the Ratio of Females per 100 Males in Ashland County?
There are 101.28 Females per 100 Males in Ashland County.
What is the Median Population Age in Ashland County?
Median Population Age in Ashland County is 41.5 Years.
What is the Average Family Size in Ashland County
Average Family Size in Ashland County is 3.0 People.
What is the Average Household Size in Ashland County
Average Household Size in Ashland County is 2.5 People.
How Large is the Labor Force in Ashland County?
There are 25,677 People in the Labor Forcein in Ashland County.
What is the Percentage of People in the Labor Force in Ashland County?
60.7% of People are in the Labor Force in Ashland County.
What is the Unemployment Rate in Ashland County?
Unemployment Rate in Ashland County is 3.7%.