Inez, KY Map & Demographics
Inez Map
Inez Overview
$34,078
PER CAPITA INCOME
$77,083
AVG FAMILY INCOME
$37,159
AVG HOUSEHOLD INCOME
1.8%
WAGE / INCOME GAP [ % ]
98.2¢/ $1
WAGE / INCOME GAP [ $ ]
$6,216
FAMILY INCOME DEFICIT
0.60
INEQUALITY / GINI INDEX
835
TOTAL POPULATION
368
MALE POPULATION
467
FEMALE POPULATION
78.80
MALES / 100 FEMALES
126.90
FEMALES / 100 MALES
51.5
MEDIAN AGE
3.1
AVG FAMILY SIZE
2.5
AVG HOUSEHOLD SIZE
360
LABOR FORCE [ PEOPLE ]
47.6%
PERCENT IN LABOR FORCE
5.6%
UNEMPLOYMENT RATE
Inez Zip Codes
Inez Area Codes
Income in Inez
Income Overview in Inez
Per Capita Income in Inez is $34,078, while median incomes of families and households are $77,083 and $37,159 respectively.
| Characteristic | Number | Measure |
| Per Capita Income | 835 | $34,078 |
| Median Family Income | 156 | $77,083 |
| Mean Family Income | 156 | $131,850 |
| Median Household Income | 285 | $37,159 |
| Mean Household Income | 285 | $82,594 |
| Income Deficit | 156 | $6,216 |
| Wage / Income Gap (%) | 835 | 1.85% |
| Wage / Income Gap ($) | 835 | 98.15¢ per $1 |
| Gini / Inequality Index | 835 | 0.60 |
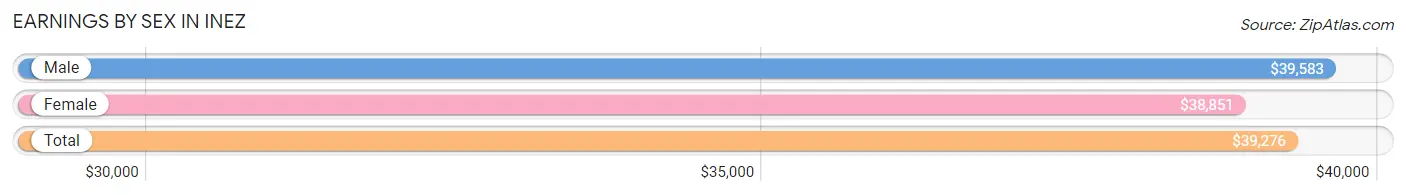
Earnings by Sex in Inez
Average Earnings in Inez are $39,276, $39,583 for men and $38,851 for women, a difference of 1.8%.
| Sex | Number | Average Earnings |
| Male | 179 (49.3%) | $39,583 |
| Female | 184 (50.7%) | $38,851 |
| Total | 363 (100.0%) | $39,276 |
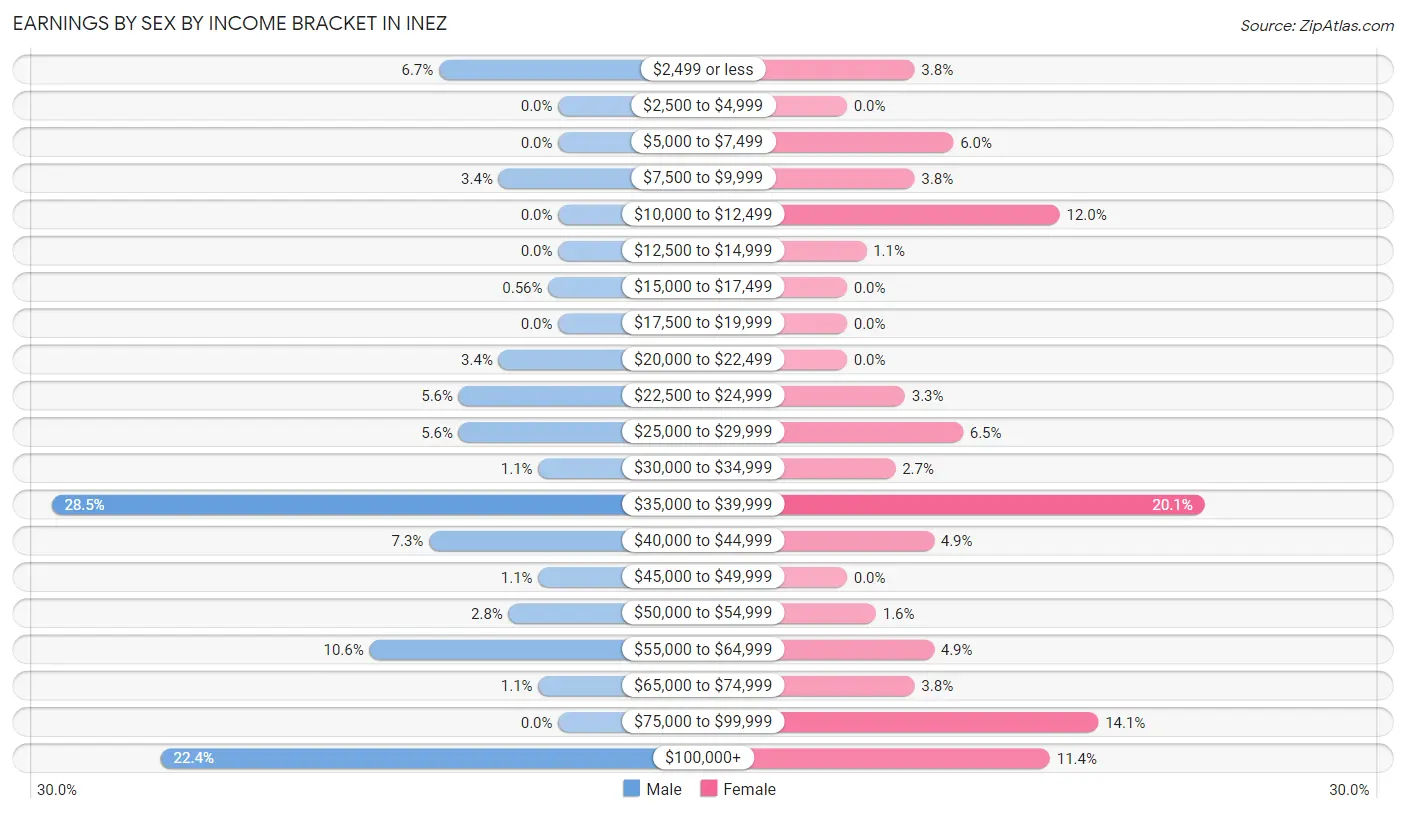
Earnings by Sex by Income Bracket in Inez
The most common earnings brackets in Inez are $35,000 to $39,999 for men (51 | 28.5%) and $35,000 to $39,999 for women (37 | 20.1%).
| Income | Male | Female |
| $2,499 or less | 12 (6.7%) | 7 (3.8%) |
| $2,500 to $4,999 | 0 (0.0%) | 0 (0.0%) |
| $5,000 to $7,499 | 0 (0.0%) | 11 (6.0%) |
| $7,500 to $9,999 | 6 (3.4%) | 7 (3.8%) |
| $10,000 to $12,499 | 0 (0.0%) | 22 (12.0%) |
| $12,500 to $14,999 | 0 (0.0%) | 2 (1.1%) |
| $15,000 to $17,499 | 1 (0.6%) | 0 (0.0%) |
| $17,500 to $19,999 | 0 (0.0%) | 0 (0.0%) |
| $20,000 to $22,499 | 6 (3.4%) | 0 (0.0%) |
| $22,500 to $24,999 | 10 (5.6%) | 6 (3.3%) |
| $25,000 to $29,999 | 10 (5.6%) | 12 (6.5%) |
| $30,000 to $34,999 | 2 (1.1%) | 5 (2.7%) |
| $35,000 to $39,999 | 51 (28.5%) | 37 (20.1%) |
| $40,000 to $44,999 | 13 (7.3%) | 9 (4.9%) |
| $45,000 to $49,999 | 2 (1.1%) | 0 (0.0%) |
| $50,000 to $54,999 | 5 (2.8%) | 3 (1.6%) |
| $55,000 to $64,999 | 19 (10.6%) | 9 (4.9%) |
| $65,000 to $74,999 | 2 (1.1%) | 7 (3.8%) |
| $75,000 to $99,999 | 0 (0.0%) | 26 (14.1%) |
| $100,000+ | 40 (22.4%) | 21 (11.4%) |
| Total | 179 (100.0%) | 184 (100.0%) |
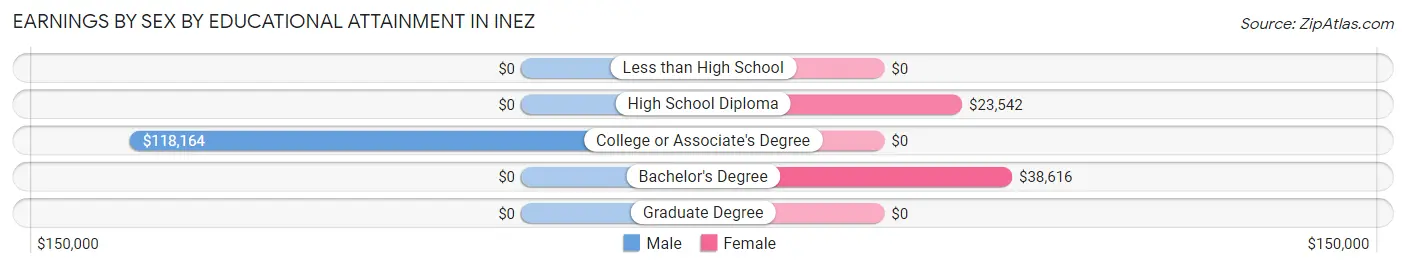
Earnings by Sex by Educational Attainment in Inez
Average earnings in Inez are $39,632 for men and $42,639 for women, a difference of 7.0%. Men with an educational attainment of college or associate's degree enjoy the highest average annual earnings of $118,164, while those with college or associate's degree education earn the least with $118,164. Women with an educational attainment of bachelor's degree earn the most with the average annual earnings of $38,616, while those with high school diploma education have the smallest earnings of $23,542.
| Educational Attainment | Male Income | Female Income |
| Less than High School | - | - |
| High School Diploma | - | - |
| College or Associate's Degree | $118,164 | $0 |
| Bachelor's Degree | - | - |
| Graduate Degree | - | - |
| Total | $39,632 | $42,639 |
Family Income in Inez
Family Income Brackets in Inez
According to the Inez family income data, there are 51 families falling into the $200,000+ income range, which is the most common income bracket and makes up 32.7% of all families.
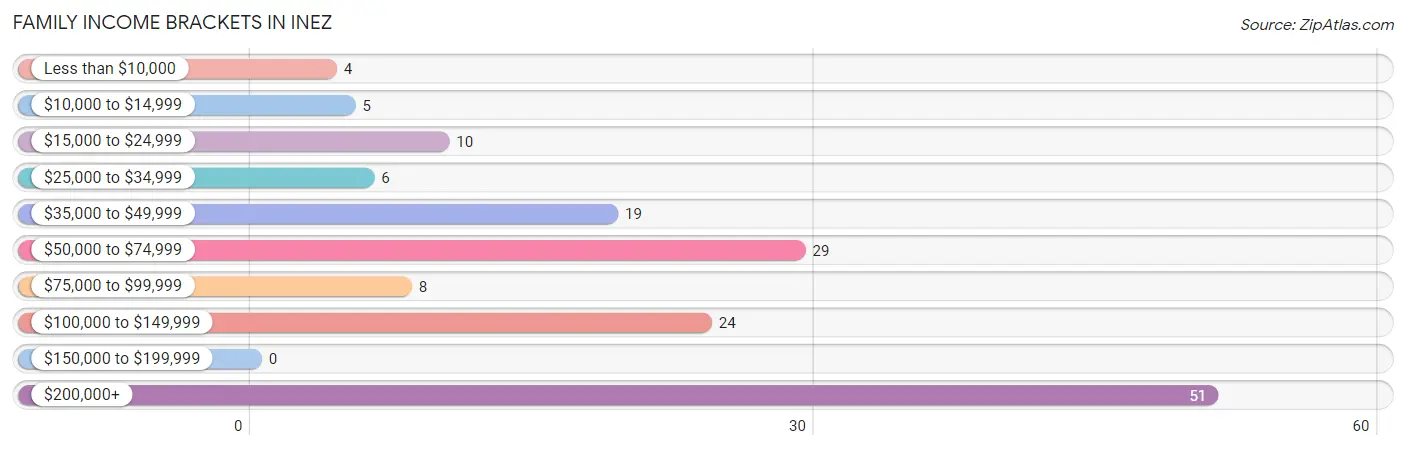
| Income Bracket | # Families | % Families |
| Less than $10,000 | 4 | 2.6% |
| $10,000 to $14,999 | 5 | 3.2% |
| $15,000 to $24,999 | 10 | 6.4% |
| $25,000 to $34,999 | 6 | 3.8% |
| $35,000 to $49,999 | 19 | 12.2% |
| $50,000 to $74,999 | 29 | 18.6% |
| $75,000 to $99,999 | 8 | 5.1% |
| $100,000 to $149,999 | 24 | 15.4% |
| $150,000 to $199,999 | 0 | 0.0% |
| $200,000+ | 51 | 32.7% |
Family Income by Famaliy Size in Inez
5-person families (22 | 14.1%) account for the highest median family income in Inez with $250,001 per family, while 5-person families (22 | 14.1%) have the highest median income of $50,000 per family member.
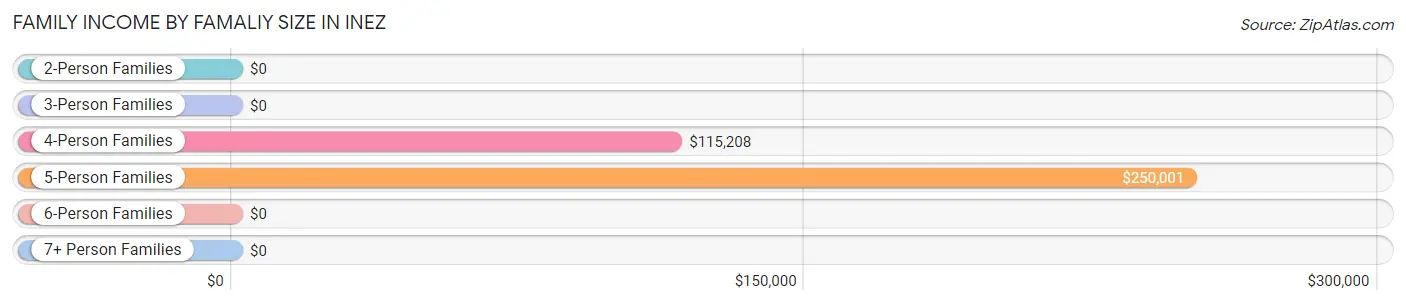
| Income Bracket | # Families | Median Income |
| 2-Person Families | 74 (47.4%) | $0 |
| 3-Person Families | 43 (27.6%) | $0 |
| 4-Person Families | 17 (10.9%) | $115,208 |
| 5-Person Families | 22 (14.1%) | $250,001 |
| 6-Person Families | 0 (0.0%) | $0 |
| 7+ Person Families | 0 (0.0%) | $0 |
| Total | 156 (100.0%) | $77,083 |
Family Income by Number of Earners in Inez
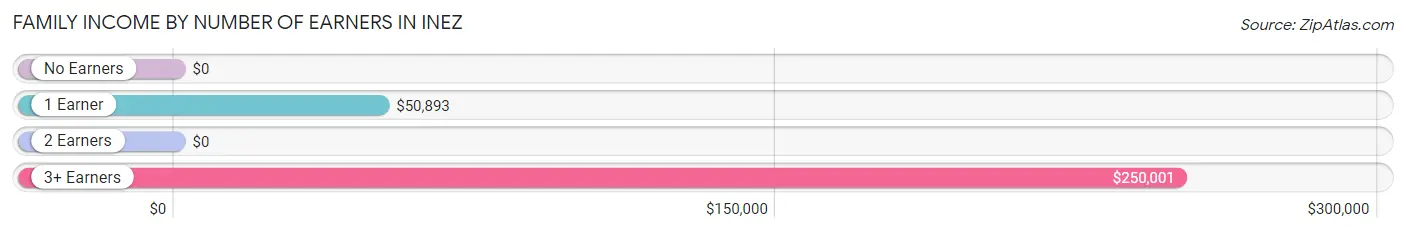
| Number of Earners | # Families | Median Income |
| No Earners | 32 (20.5%) | $0 |
| 1 Earner | 23 (14.7%) | $50,893 |
| 2 Earners | 69 (44.2%) | $0 |
| 3+ Earners | 32 (20.5%) | $250,001 |
| Total | 156 (100.0%) | $77,083 |
Household Income in Inez
Household Income Brackets in Inez
With 51 households falling in the category, the $200,000+ income range is the most frequent in Inez, accounting for 17.9% of all households.
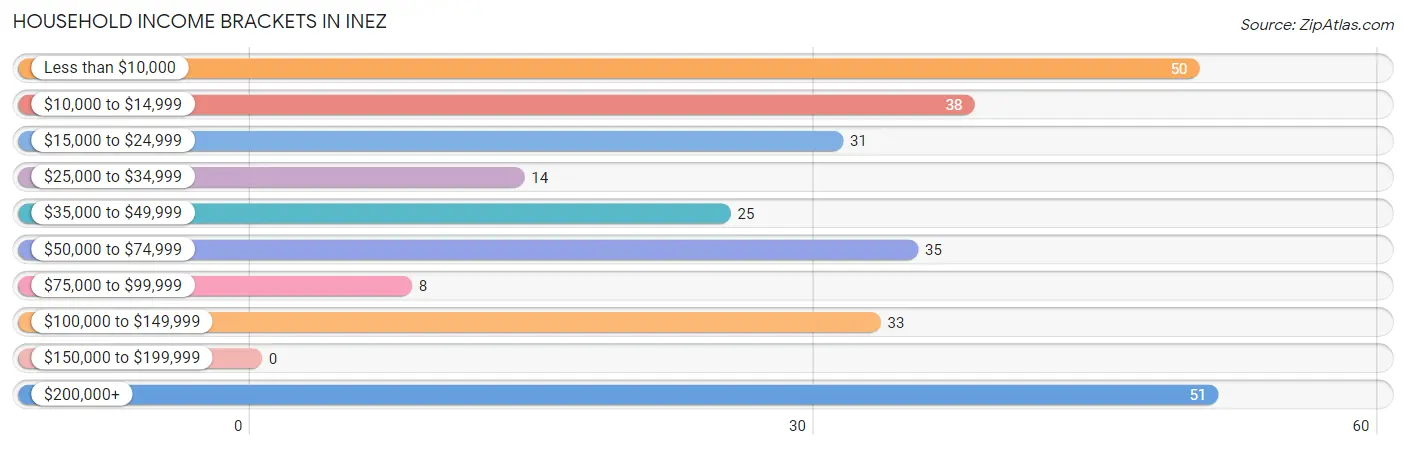
| Income Bracket | # Households | % Households |
| Less than $10,000 | 50 | 17.5% |
| $10,000 to $14,999 | 38 | 13.3% |
| $15,000 to $24,999 | 31 | 10.9% |
| $25,000 to $34,999 | 14 | 4.9% |
| $35,000 to $49,999 | 25 | 8.8% |
| $50,000 to $74,999 | 35 | 12.3% |
| $75,000 to $99,999 | 8 | 2.8% |
| $100,000 to $149,999 | 33 | 11.6% |
| $150,000 to $199,999 | 0 | 0.0% |
| $200,000+ | 51 | 17.9% |
Household Income by Householder Age in Inez
The median household income in Inez is $37,159, with the highest median household income of $13,889 found in the 65+ years age bracket for the primary householder. A total of 86 households (30.2%) fall into this category. Meanwhile, the 15 to 24 years age bracket for the primary householder has the lowest median household income of $0, with 10 households (3.5%) in this group.
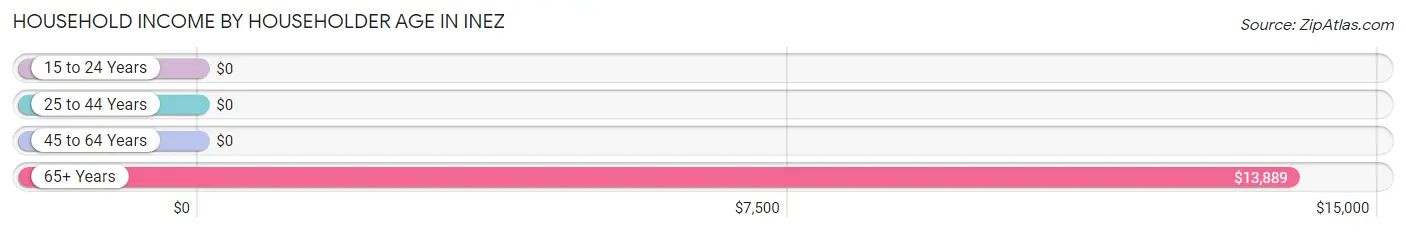
| Income Bracket | # Households | Median Income |
| 15 to 24 Years | 10 (3.5%) | $0 |
| 25 to 44 Years | 62 (21.7%) | $0 |
| 45 to 64 Years | 127 (44.6%) | $0 |
| 65+ Years | 86 (30.2%) | $13,889 |
| Total | 285 (100.0%) | $37,159 |
Poverty in Inez
Income Below Poverty by Sex and Age in Inez
With 21.9% poverty level for males and 26.7% for females among the residents of Inez, 75 year old and over males and 75 year old and over females are the most vulnerable to poverty, with 8 males (72.7%) and 17 females (60.7%) in their respective age groups living below the poverty level.
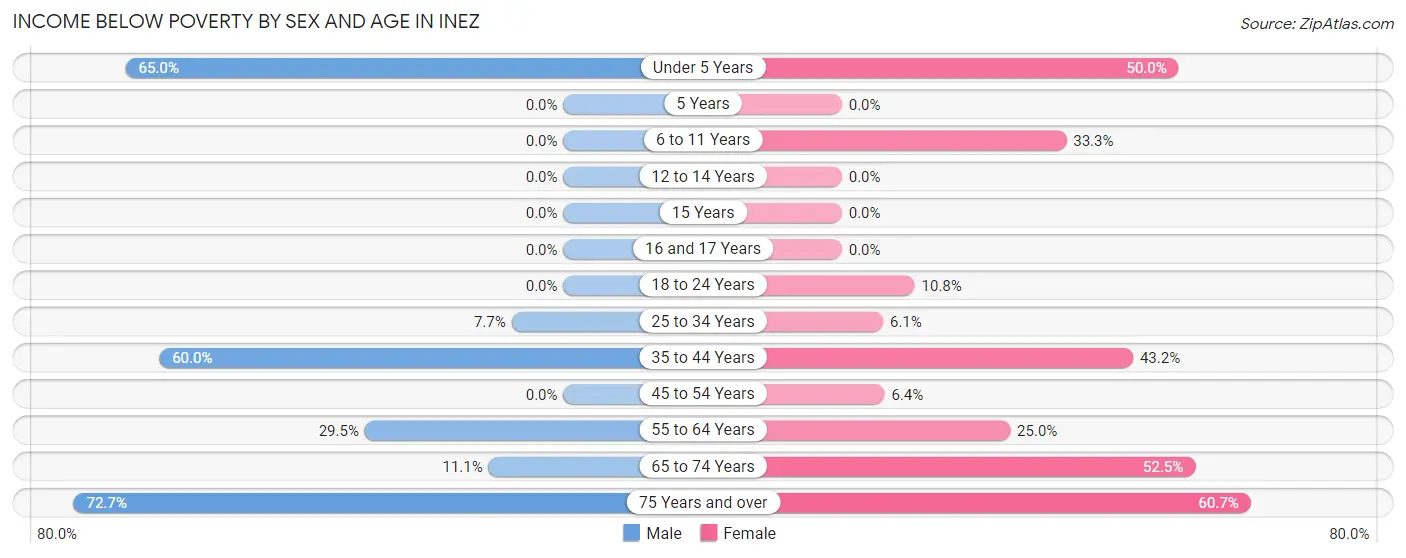
| Age Bracket | Male | Female |
| Under 5 Years | 13 (65.0%) | 3 (50.0%) |
| 5 Years | 0 (0.0%) | 0 (0.0%) |
| 6 to 11 Years | 0 (0.0%) | 4 (33.3%) |
| 12 to 14 Years | 0 (0.0%) | 0 (0.0%) |
| 15 Years | 0 (0.0%) | 0 (0.0%) |
| 16 and 17 Years | 0 (0.0%) | 0 (0.0%) |
| 18 to 24 Years | 0 (0.0%) | 4 (10.8%) |
| 25 to 34 Years | 5 (7.7%) | 3 (6.1%) |
| 35 to 44 Years | 24 (60.0%) | 16 (43.2%) |
| 45 to 54 Years | 0 (0.0%) | 4 (6.4%) |
| 55 to 64 Years | 23 (29.5%) | 15 (25.0%) |
| 65 to 74 Years | 2 (11.1%) | 32 (52.5%) |
| 75 Years and over | 8 (72.7%) | 17 (60.7%) |
| Total | 75 (21.9%) | 98 (26.7%) |
Income Above Poverty by Sex and Age in Inez
According to the poverty statistics in Inez, males aged 5 years and females aged 5 years are the age groups that are most secure financially, with 100.0% of males and 100.0% of females in these age groups living above the poverty line.
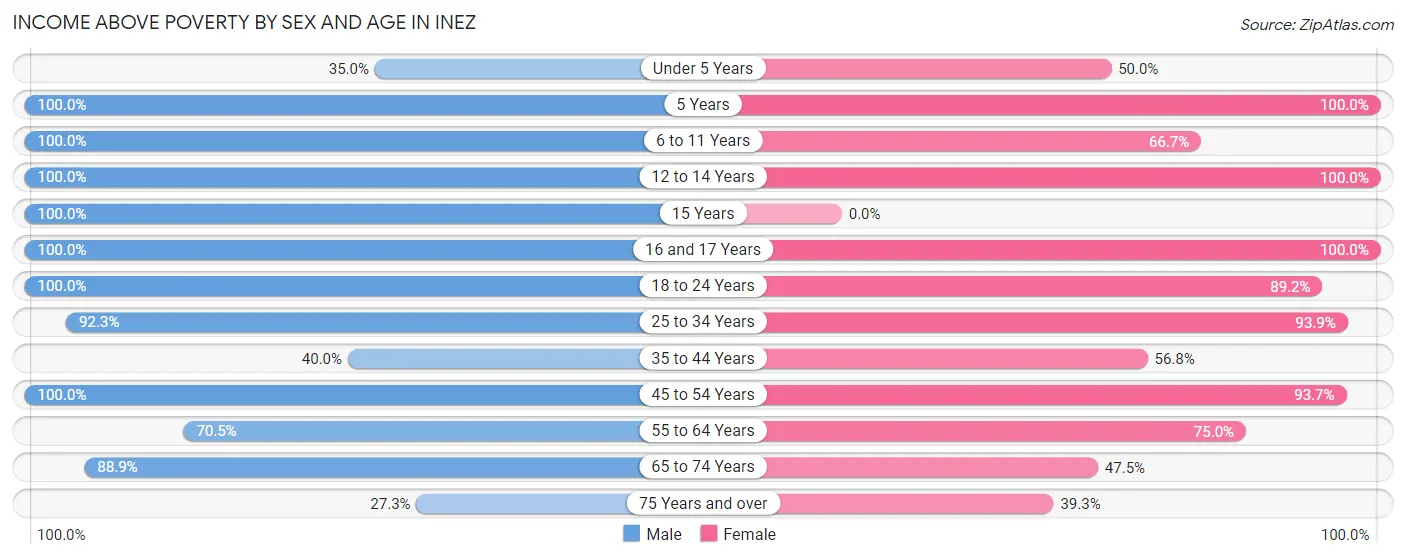
| Age Bracket | Male | Female |
| Under 5 Years | 7 (35.0%) | 3 (50.0%) |
| 5 Years | 16 (100.0%) | 1 (100.0%) |
| 6 to 11 Years | 4 (100.0%) | 8 (66.7%) |
| 12 to 14 Years | 11 (100.0%) | 3 (100.0%) |
| 15 Years | 5 (100.0%) | 0 (0.0%) |
| 16 and 17 Years | 22 (100.0%) | 10 (100.0%) |
| 18 to 24 Years | 18 (100.0%) | 33 (89.2%) |
| 25 to 34 Years | 60 (92.3%) | 46 (93.9%) |
| 35 to 44 Years | 16 (40.0%) | 21 (56.8%) |
| 45 to 54 Years | 35 (100.0%) | 59 (93.6%) |
| 55 to 64 Years | 55 (70.5%) | 45 (75.0%) |
| 65 to 74 Years | 16 (88.9%) | 29 (47.5%) |
| 75 Years and over | 3 (27.3%) | 11 (39.3%) |
| Total | 268 (78.1%) | 269 (73.3%) |
Income Below Poverty Among Married-Couple Families in Inez
The poverty statistics for married-couple families in Inez show that 8.1% or 10 of the total 123 families live below the poverty line. Families with 3 or 4 children have the highest poverty rate of 100.0%, comprising of 3 families. On the other hand, families with no children have the lowest poverty rate of 1.5%, which includes 1 families.
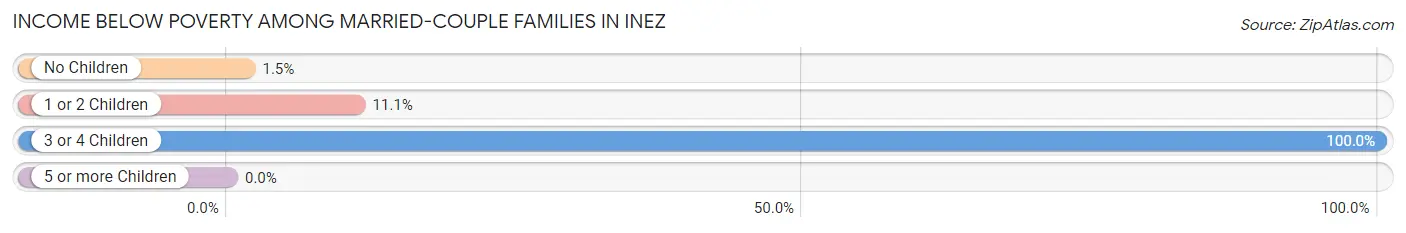
| Children | Above Poverty | Below Poverty |
| No Children | 65 (98.5%) | 1 (1.5%) |
| 1 or 2 Children | 48 (88.9%) | 6 (11.1%) |
| 3 or 4 Children | 0 (0.0%) | 3 (100.0%) |
| 5 or more Children | 0 (0.0%) | 0 (0.0%) |
| Total | 113 (91.9%) | 10 (8.1%) |
Income Below Poverty Among Single-Parent Households in Inez
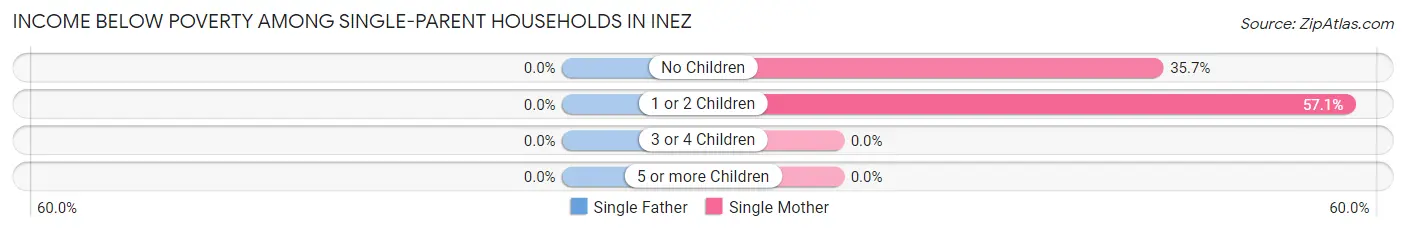
| Children | Single Father | Single Mother |
| No Children | 0 (0.0%) | 5 (35.7%) |
| 1 or 2 Children | 0 (0.0%) | 4 (57.1%) |
| 3 or 4 Children | 0 (0.0%) | 0 (0.0%) |
| 5 or more Children | 0 (0.0%) | 0 (0.0%) |
| Total | 0 (0.0%) | 9 (36.0%) |
Income Below Poverty Among Married-Couple vs Single-Parent Households in Inez
The poverty data for Inez shows that 10 of the married-couple family households (8.1%) and 9 of the single-parent households (27.3%) are living below the poverty level. Within the married-couple family households, those with 3 or 4 children have the highest poverty rate, with 3 households (100.0%) falling below the poverty line. Among the single-parent households, those with 1 or 2 children have the highest poverty rate, with 4 household (57.1%) living below poverty.
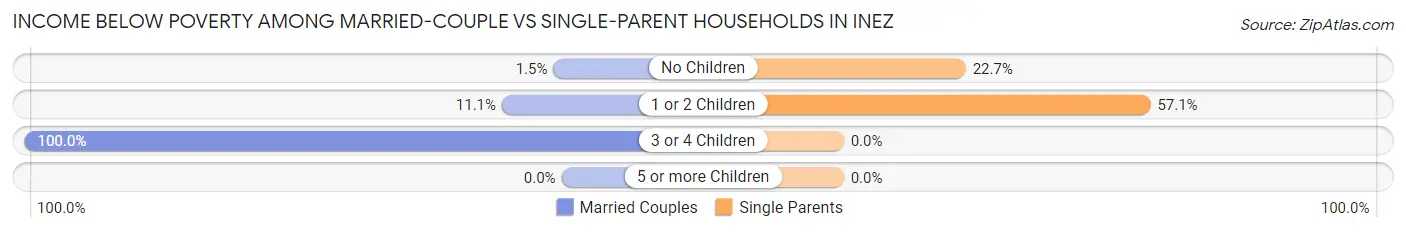
| Children | Married-Couple Families | Single-Parent Households |
| No Children | 1 (1.5%) | 5 (22.7%) |
| 1 or 2 Children | 6 (11.1%) | 4 (57.1%) |
| 3 or 4 Children | 3 (100.0%) | 0 (0.0%) |
| 5 or more Children | 0 (0.0%) | 0 (0.0%) |
| Total | 10 (8.1%) | 9 (27.3%) |
Race in Inez
The most populous races in Inez are White / Caucasian (814 | 97.5%), and Two or more Races (21 | 2.5%).
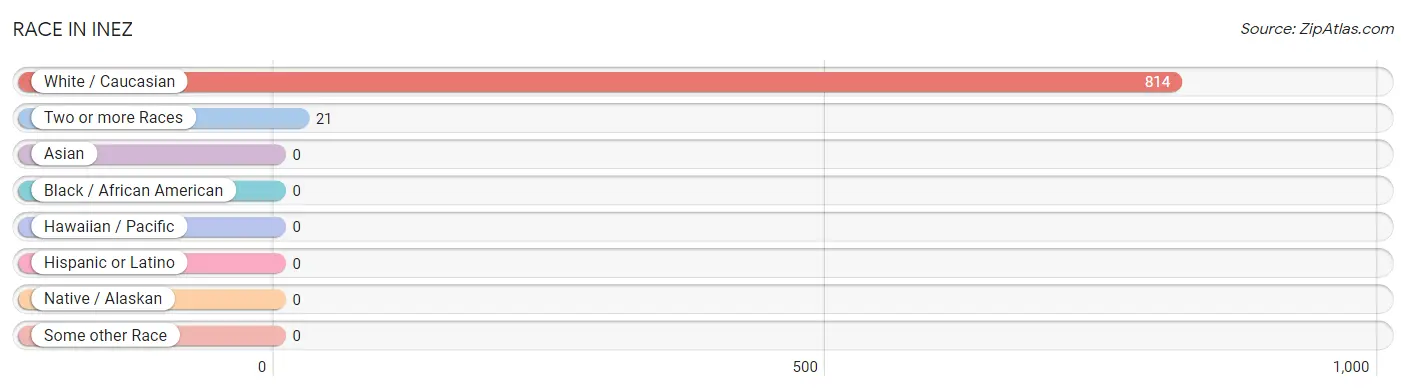
| Race | # Population | % Population |
| Asian | 0 | 0.0% |
| Black / African American | 0 | 0.0% |
| Hawaiian / Pacific | 0 | 0.0% |
| Hispanic or Latino | 0 | 0.0% |
| Native / Alaskan | 0 | 0.0% |
| White / Caucasian | 814 | 97.5% |
| Two or more Races | 21 | 2.5% |
| Some other Race | 0 | 0.0% |
| Total | 835 | 100.0% |
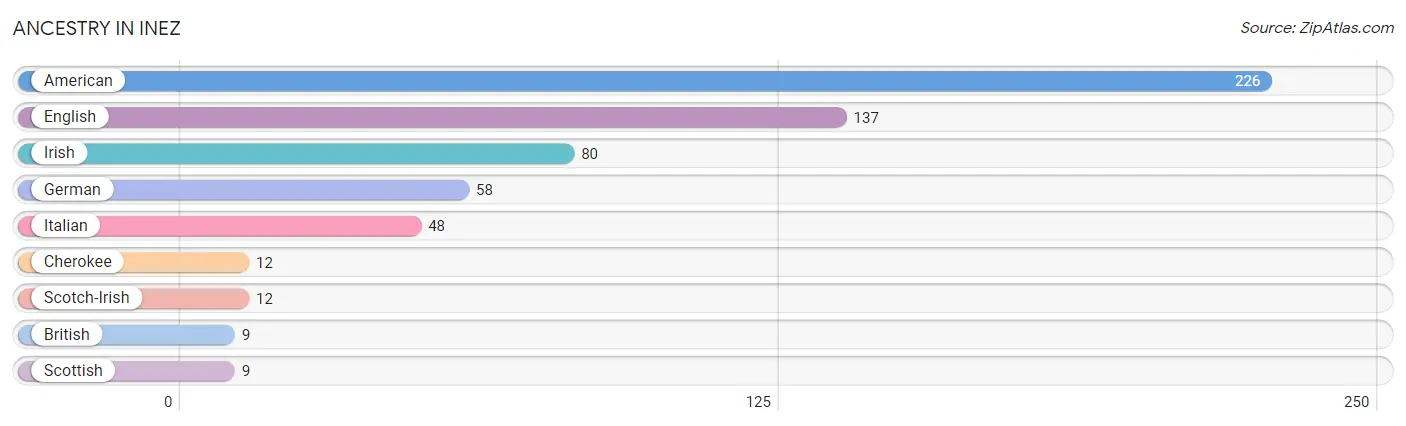
Ancestry in Inez
The most populous ancestries reported in Inez are American (226 | 27.1%), English (137 | 16.4%), Irish (80 | 9.6%), German (58 | 7.0%), and Italian (48 | 5.8%), together accounting for 65.8% of all Inez residents.
| Ancestry | # Population | % Population |
| American | 226 | 27.1% |
| British | 9 | 1.1% |
| Cherokee | 12 | 1.4% |
| English | 137 | 16.4% |
| German | 58 | 7.0% |
| Irish | 80 | 9.6% |
| Italian | 48 | 5.8% |
| Scotch-Irish | 12 | 1.4% |
| Scottish | 9 | 1.1% | View All 9 Rows |
Immigrants in Inez

| Immigration Origin | # Population | % Population | View All 0 Rows |
Sex and Age in Inez
Sex and Age in Inez
The most populous age groups in Inez are 60 to 64 Years (54 | 14.7%) for men and 65 to 69 Years (77 | 16.5%) for women.
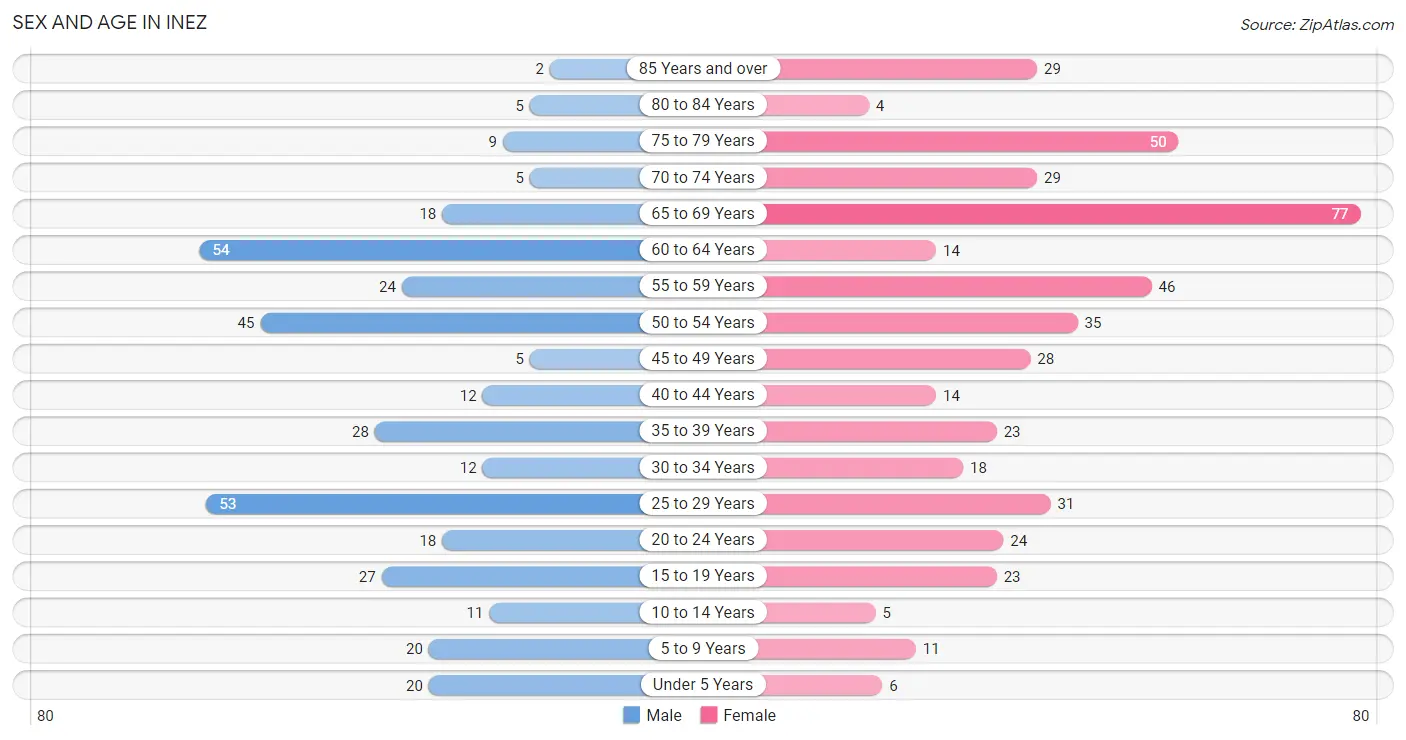
| Age Bracket | Male | Female |
| Under 5 Years | 20 (5.4%) | 6 (1.3%) |
| 5 to 9 Years | 20 (5.4%) | 11 (2.4%) |
| 10 to 14 Years | 11 (3.0%) | 5 (1.1%) |
| 15 to 19 Years | 27 (7.3%) | 23 (4.9%) |
| 20 to 24 Years | 18 (4.9%) | 24 (5.1%) |
| 25 to 29 Years | 53 (14.4%) | 31 (6.6%) |
| 30 to 34 Years | 12 (3.3%) | 18 (3.8%) |
| 35 to 39 Years | 28 (7.6%) | 23 (4.9%) |
| 40 to 44 Years | 12 (3.3%) | 14 (3.0%) |
| 45 to 49 Years | 5 (1.4%) | 28 (6.0%) |
| 50 to 54 Years | 45 (12.2%) | 35 (7.5%) |
| 55 to 59 Years | 24 (6.5%) | 46 (9.9%) |
| 60 to 64 Years | 54 (14.7%) | 14 (3.0%) |
| 65 to 69 Years | 18 (4.9%) | 77 (16.5%) |
| 70 to 74 Years | 5 (1.4%) | 29 (6.2%) |
| 75 to 79 Years | 9 (2.5%) | 50 (10.7%) |
| 80 to 84 Years | 5 (1.4%) | 4 (0.9%) |
| 85 Years and over | 2 (0.5%) | 29 (6.2%) |
| Total | 368 (100.0%) | 467 (100.0%) |
Families and Households in Inez
Median Family Size in Inez
The median family size in Inez is 3.10 persons per family, with single female/mother families (25 | 16.0%) accounting for the largest median family size of 3.76 persons per family. On the other hand, single male/father families (8 | 5.1%) represent the smallest median family size with 2.00 persons per family.
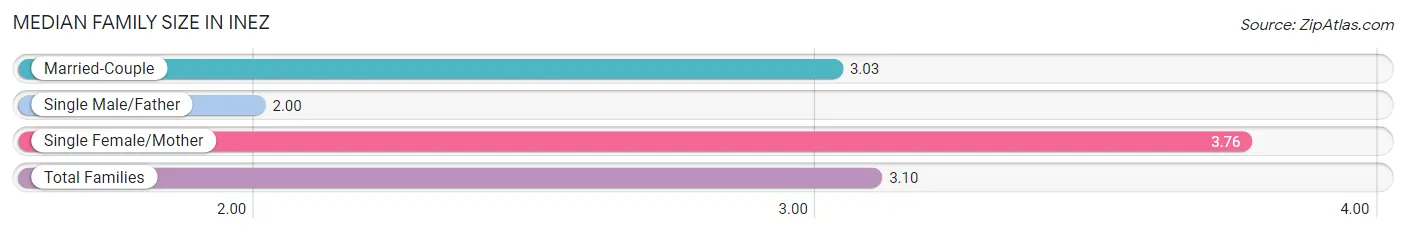
| Family Type | # Families | Family Size |
| Married-Couple | 123 (78.8%) | 3.03 |
| Single Male/Father | 8 (5.1%) | 2.00 |
| Single Female/Mother | 25 (16.0%) | 3.76 |
| Total Families | 156 (100.0%) | 3.10 |
Median Household Size in Inez
The median household size in Inez is 2.49 persons per household, with single female/mother households (25 | 8.8%) accounting for the largest median household size of 3.76 persons per household. non-family households (129 | 45.3%) represent the smallest median household size with 1.71 persons per household.
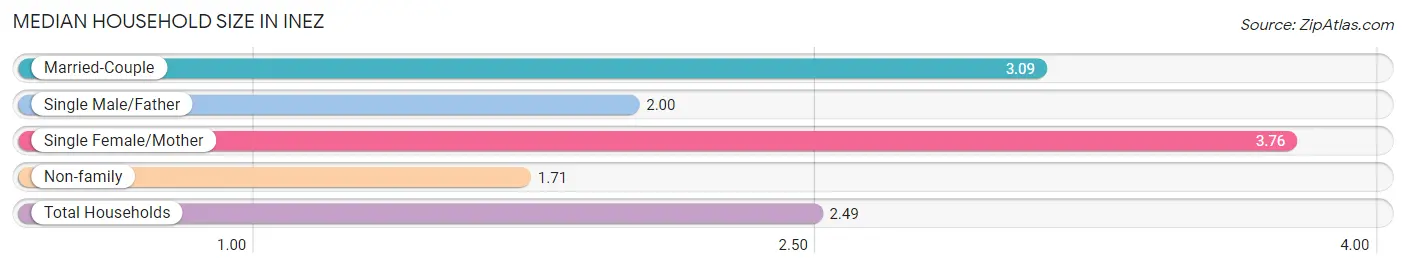
| Household Type | # Households | Household Size |
| Married-Couple | 123 (43.2%) | 3.09 |
| Single Male/Father | 8 (2.8%) | 2.00 |
| Single Female/Mother | 25 (8.8%) | 3.76 |
| Non-family | 129 (45.3%) | 1.71 |
| Total Households | 285 (100.0%) | 2.49 |
Household Size by Marriage Status in Inez
Out of a total of 285 households in Inez, 156 (54.7%) are family households, while 129 (45.3%) are nonfamily households. The most numerous type of family households are 2-person households, comprising 69, and the most common type of nonfamily households are 1-person households, comprising 109.
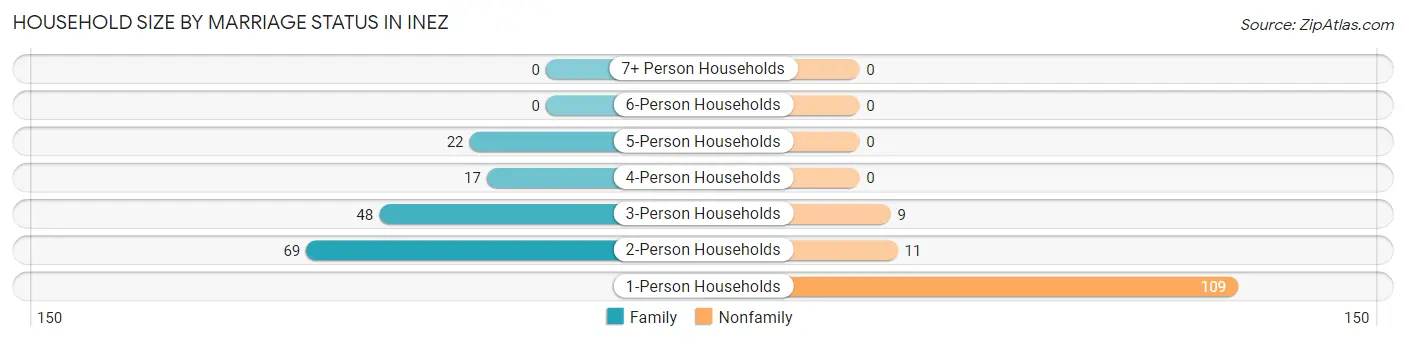
| Household Size | Family Households | Nonfamily Households |
| 1-Person Households | - | 109 (38.3%) |
| 2-Person Households | 69 (24.2%) | 11 (3.9%) |
| 3-Person Households | 48 (16.8%) | 9 (3.2%) |
| 4-Person Households | 17 (6.0%) | 0 (0.0%) |
| 5-Person Households | 22 (7.7%) | 0 (0.0%) |
| 6-Person Households | 0 (0.0%) | 0 (0.0%) |
| 7+ Person Households | 0 (0.0%) | 0 (0.0%) |
| Total | 156 (54.7%) | 129 (45.3%) |
Female Fertility in Inez
Fertility by Age in Inez
Average fertility rate in Inez is 19.0 births per 1,000 women. Women in the age bracket of 20 to 34 years have the highest fertility rate with 41.0 births per 1,000 women. Women in the age bracket of 20 to 34 years acount for 100.0% of all women with births.
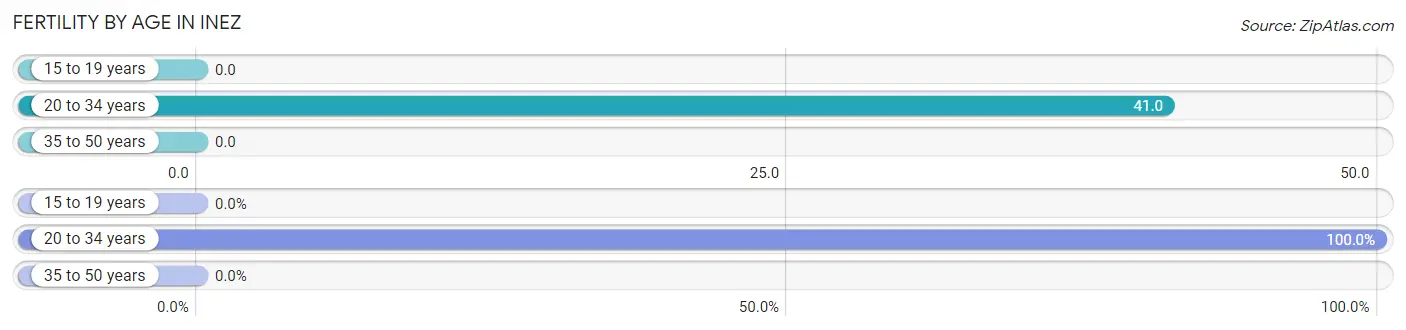
| Age Bracket | Women with Births | Births / 1,000 Women |
| 15 to 19 years | 0 (0.0%) | 0.0 |
| 20 to 34 years | 3 (100.0%) | 41.0 |
| 35 to 50 years | 0 (0.0%) | 0.0 |
| Total | 3 (100.0%) | 19.0 |
Fertility by Age by Marriage Status in Inez
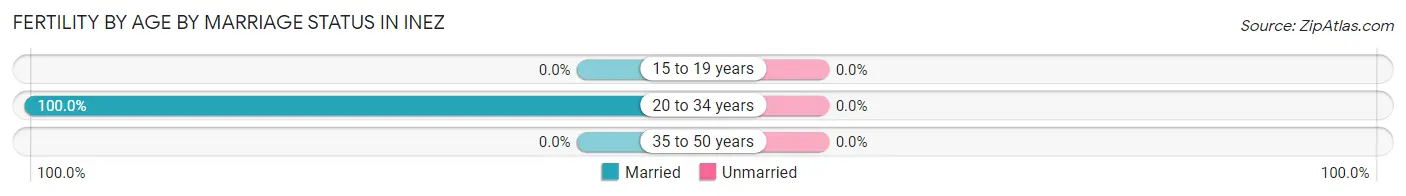
| Age Bracket | Married | Unmarried |
| 15 to 19 years | 0 (0.0%) | 0 (0.0%) |
| 20 to 34 years | 3 (100.0%) | 0 (0.0%) |
| 35 to 50 years | 0 (0.0%) | 0 (0.0%) |
| Total | 3 (100.0%) | 0 (0.0%) |
Fertility by Education in Inez
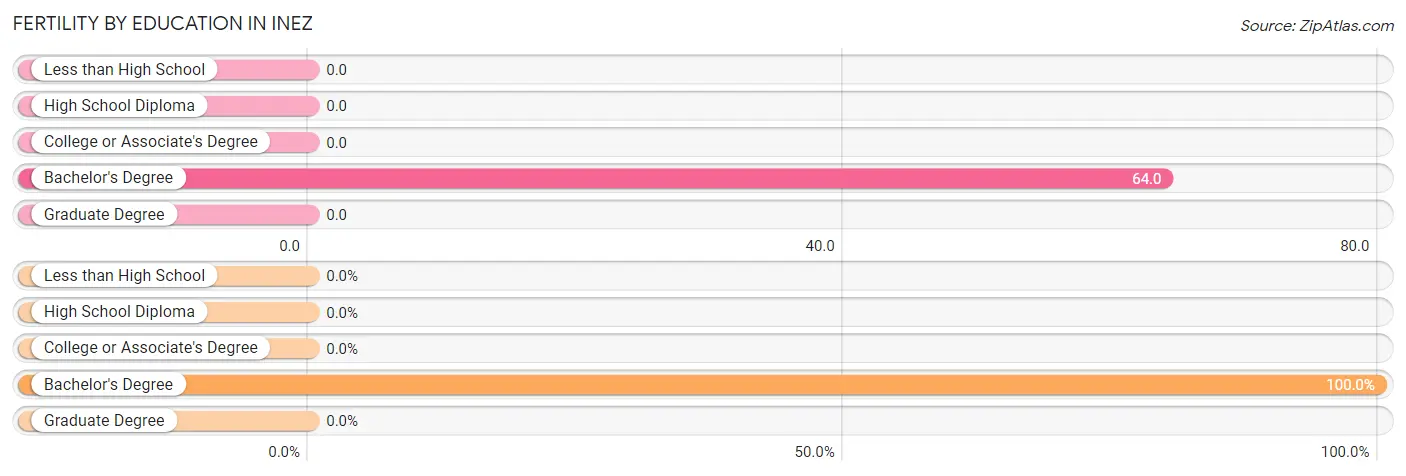
| Educational Attainment | Women with Births | Births / 1,000 Women |
| Less than High School | 0 (0.0%) | 0.0 |
| High School Diploma | 0 (0.0%) | 0.0 |
| College or Associate's Degree | 0 (0.0%) | 0.0 |
| Bachelor's Degree | 3 (100.0%) | 64.0 |
| Graduate Degree | 0 (0.0%) | 0.0 |
| Total | 3 (100.0%) | 19.0 |
Fertility by Education by Marriage Status in Inez
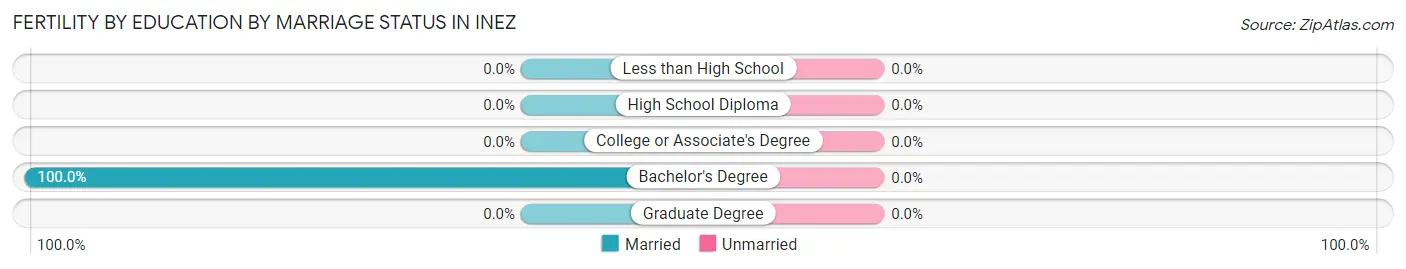
| Educational Attainment | Married | Unmarried |
| Less than High School | 0 (0.0%) | 0 (0.0%) |
| High School Diploma | 0 (0.0%) | 0 (0.0%) |
| College or Associate's Degree | 0 (0.0%) | 0 (0.0%) |
| Bachelor's Degree | 3 (100.0%) | 0 (0.0%) |
| Graduate Degree | 0 (0.0%) | 0 (0.0%) |
| Total | 3 (100.0%) | 0 (0.0%) |
Employment Characteristics in Inez
Employment by Class of Employer in Inez
Among the 337 employed individuals in Inez, private company employees (186 | 55.2%), state government employees (114 | 33.8%), and not-for-profit organizations (18 | 5.3%) make up the most common classes of employment.
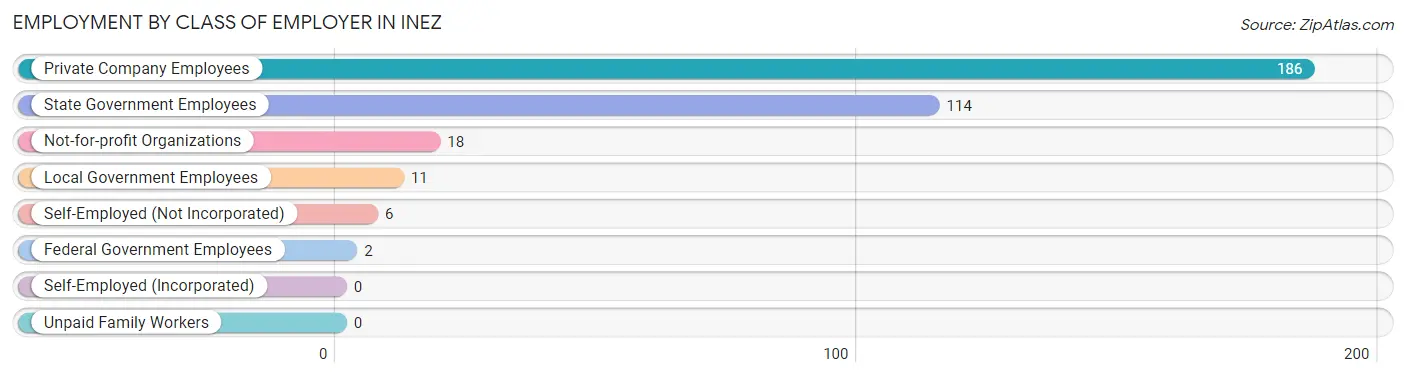
| Employer Class | # Employees | % Employees |
| Private Company Employees | 186 | 55.2% |
| Self-Employed (Incorporated) | 0 | 0.0% |
| Self-Employed (Not Incorporated) | 6 | 1.8% |
| Not-for-profit Organizations | 18 | 5.3% |
| Local Government Employees | 11 | 3.3% |
| State Government Employees | 114 | 33.8% |
| Federal Government Employees | 2 | 0.6% |
| Unpaid Family Workers | 0 | 0.0% |
| Total | 337 | 100.0% |
Employment Status by Age in Inez
According to the labor force statistics for Inez, out of the total population over 16 years of age (757), 47.6% or 360 individuals are in the labor force, with 5.6% or 20 of them unemployed. The age group with the highest labor force participation rate is 25 to 29 years, with 100.0% or 84 individuals in the labor force. Within the labor force, the 65 to 74 years age range has the highest percentage of unemployed individuals, with 30.8% or 4 of them being unemployed.
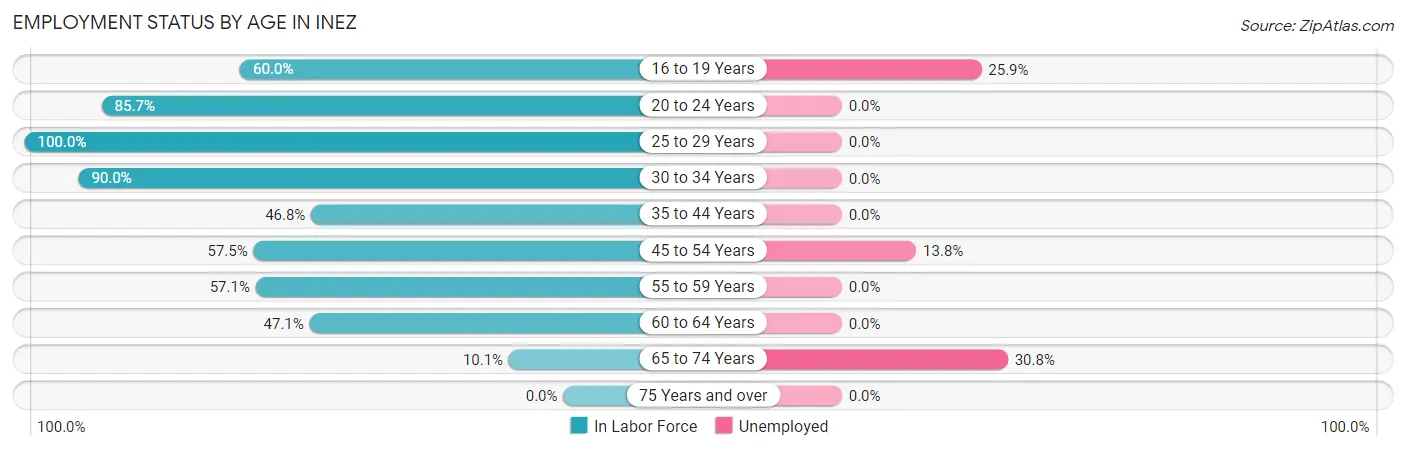
| Age Bracket | In Labor Force | Unemployed |
| 16 to 19 Years | 27 (60.0%) | 7 (25.9%) |
| 20 to 24 Years | 36 (85.7%) | 0 (0.0%) |
| 25 to 29 Years | 84 (100.0%) | 0 (0.0%) |
| 30 to 34 Years | 27 (90.0%) | 0 (0.0%) |
| 35 to 44 Years | 36 (46.8%) | 0 (0.0%) |
| 45 to 54 Years | 65 (57.5%) | 9 (13.8%) |
| 55 to 59 Years | 40 (57.1%) | 0 (0.0%) |
| 60 to 64 Years | 32 (47.1%) | 0 (0.0%) |
| 65 to 74 Years | 13 (10.1%) | 4 (30.8%) |
| 75 Years and over | 0 (0.0%) | 0 (0.0%) |
| Total | 360 (47.6%) | 20 (5.6%) |
Employment Status by Educational Attainment in Inez
According to labor force statistics for Inez, 64.3% of individuals (284) out of the total population between 25 and 64 years of age (442) are in the labor force, with 3.2% or 9 of them being unemployed. The group with the highest labor force participation rate are those with the educational attainment of bachelor's degree or higher, with 88.9% or 112 individuals in the labor force. Within the labor force, individuals with high school diploma education have the highest percentage of unemployment, with 18.0% or 9 of them being unemployed.
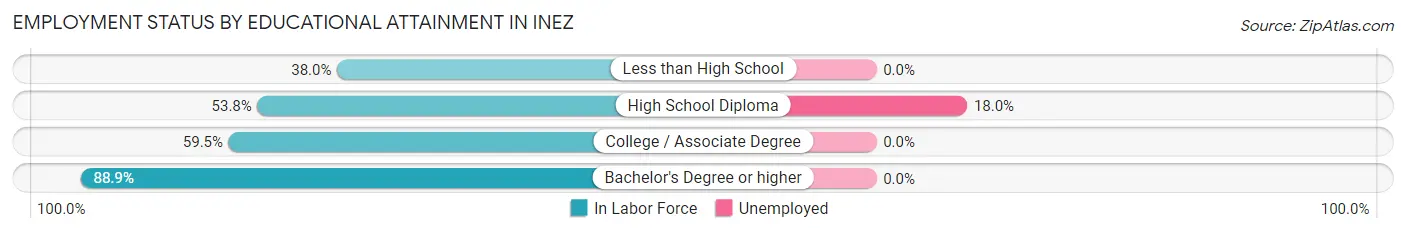
| Educational Attainment | In Labor Force | Unemployed |
| Less than High School | 19 (38.0%) | 0 (0.0%) |
| High School Diploma | 50 (53.8%) | 17 (18.0%) |
| College / Associate Degree | 103 (59.5%) | 0 (0.0%) |
| Bachelor's Degree or higher | 112 (88.9%) | 0 (0.0%) |
| Total | 284 (64.3%) | 14 (3.2%) |
Employment Occupations by Sex in Inez
Management, Business, Science and Arts Occupations
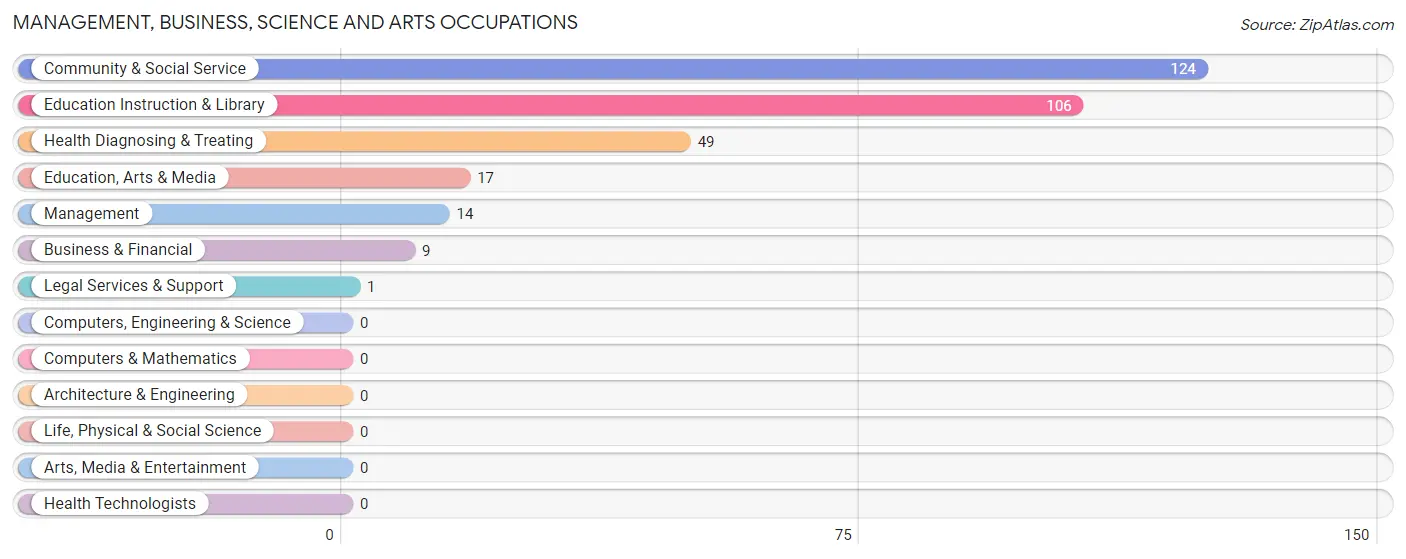
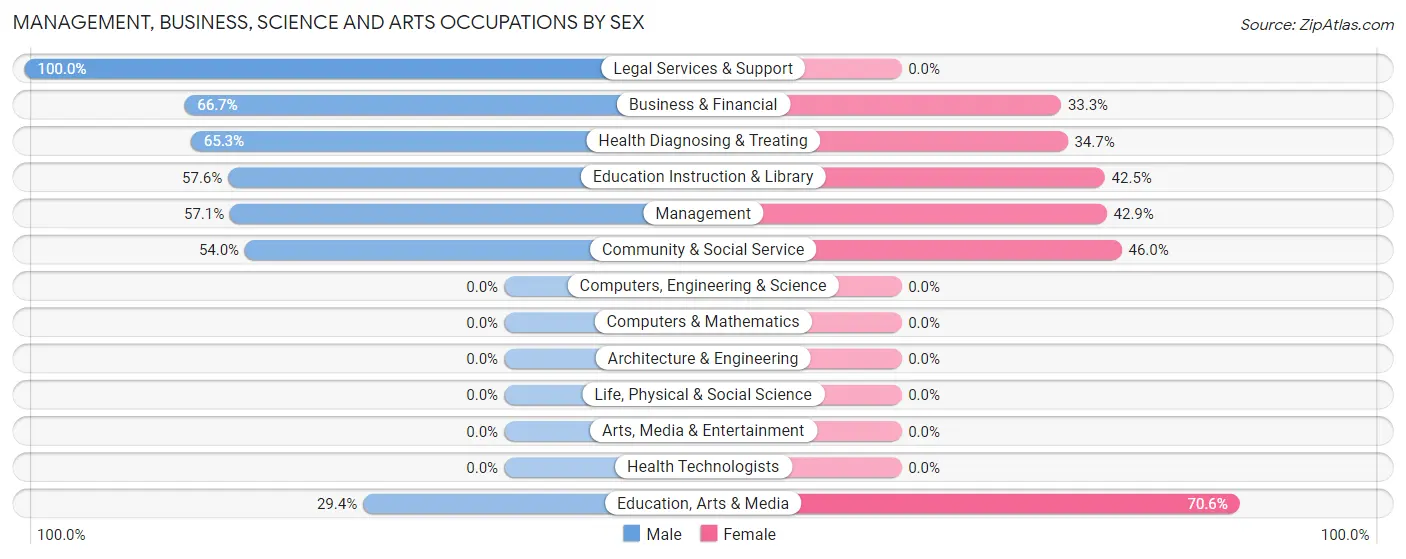
The most common Management, Business, Science and Arts occupations in Inez are Community & Social Service (124 | 36.5%), Education Instruction & Library (106 | 31.2%), Health Diagnosing & Treating (49 | 14.4%), Education, Arts & Media (17 | 5.0%), and Management (14 | 4.1%).
Management, Business, Science and Arts Occupations by Sex
Within the Management, Business, Science and Arts occupations in Inez, the most male-oriented occupations are Legal Services & Support (100.0%), Business & Financial (66.7%), and Health Diagnosing & Treating (65.3%), while the most female-oriented occupations are Education, Arts & Media (70.6%), Community & Social Service (46.0%), and Management (42.9%).
| Occupation | Male | Female |
| Management | 8 (57.1%) | 6 (42.9%) |
| Business & Financial | 6 (66.7%) | 3 (33.3%) |
| Computers, Engineering & Science | 0 (0.0%) | 0 (0.0%) |
| Computers & Mathematics | 0 (0.0%) | 0 (0.0%) |
| Architecture & Engineering | 0 (0.0%) | 0 (0.0%) |
| Life, Physical & Social Science | 0 (0.0%) | 0 (0.0%) |
| Community & Social Service | 67 (54.0%) | 57 (46.0%) |
| Education, Arts & Media | 5 (29.4%) | 12 (70.6%) |
| Legal Services & Support | 1 (100.0%) | 0 (0.0%) |
| Education Instruction & Library | 61 (57.6%) | 45 (42.4%) |
| Arts, Media & Entertainment | 0 (0.0%) | 0 (0.0%) |
| Health Diagnosing & Treating | 32 (65.3%) | 17 (34.7%) |
| Health Technologists | 0 (0.0%) | 0 (0.0%) |
| Total (Category) | 113 (57.7%) | 83 (42.3%) |
| Total (Overall) | 176 (51.8%) | 164 (48.2%) |
Services Occupations
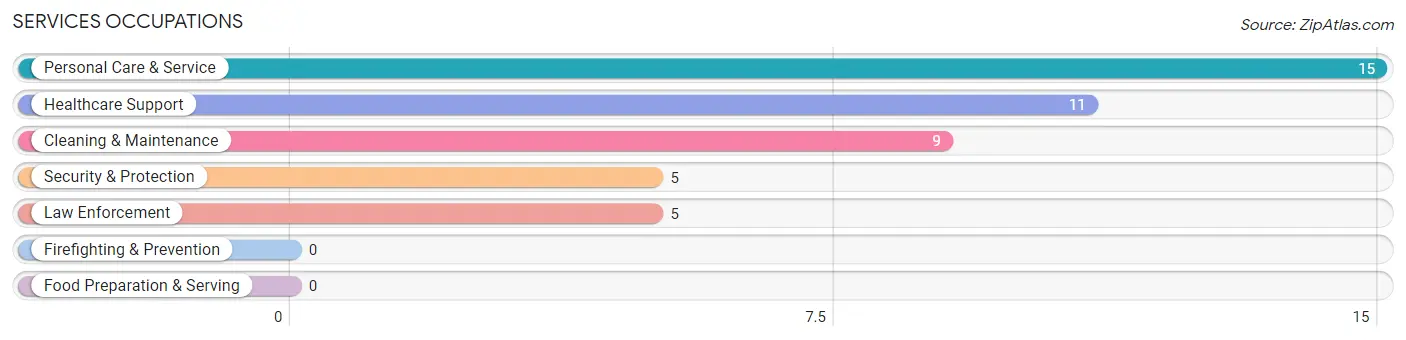
The most common Services occupations in Inez are Personal Care & Service (15 | 4.4%), Healthcare Support (11 | 3.2%), Cleaning & Maintenance (9 | 2.6%), Security & Protection (5 | 1.5%), and Law Enforcement (5 | 1.5%).
Services Occupations by Sex
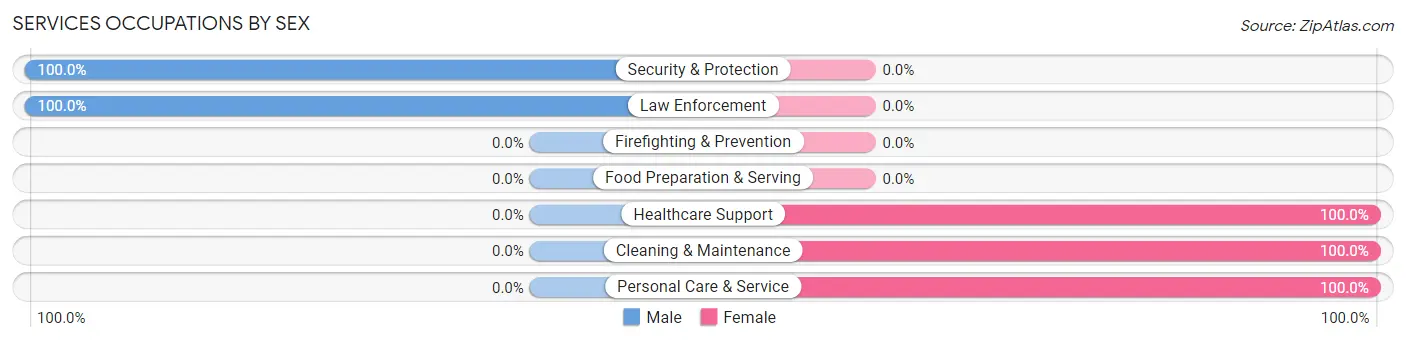
Within the Services occupations in Inez, the most male-oriented occupations are Security & Protection (100.0%), and Law Enforcement (100.0%), while the most female-oriented occupations are Healthcare Support (100.0%), Cleaning & Maintenance (100.0%), and Personal Care & Service (100.0%).
| Occupation | Male | Female |
| Healthcare Support | 0 (0.0%) | 11 (100.0%) |
| Security & Protection | 5 (100.0%) | 0 (0.0%) |
| Firefighting & Prevention | 0 (0.0%) | 0 (0.0%) |
| Law Enforcement | 5 (100.0%) | 0 (0.0%) |
| Food Preparation & Serving | 0 (0.0%) | 0 (0.0%) |
| Cleaning & Maintenance | 0 (0.0%) | 9 (100.0%) |
| Personal Care & Service | 0 (0.0%) | 15 (100.0%) |
| Total (Category) | 5 (12.5%) | 35 (87.5%) |
| Total (Overall) | 176 (51.8%) | 164 (48.2%) |
Sales and Office Occupations
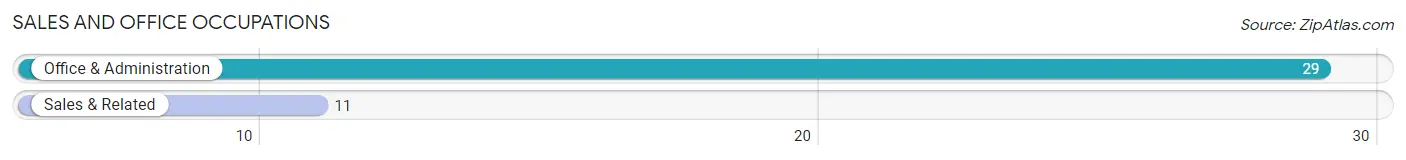
The most common Sales and Office occupations in Inez are Office & Administration (29 | 8.5%), and Sales & Related (11 | 3.2%).
Sales and Office Occupations by Sex
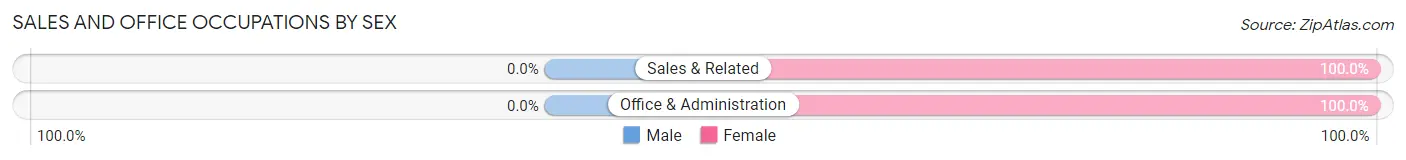
| Occupation | Male | Female |
| Sales & Related | 0 (0.0%) | 11 (100.0%) |
| Office & Administration | 0 (0.0%) | 29 (100.0%) |
| Total (Category) | 0 (0.0%) | 40 (100.0%) |
| Total (Overall) | 176 (51.8%) | 164 (48.2%) |
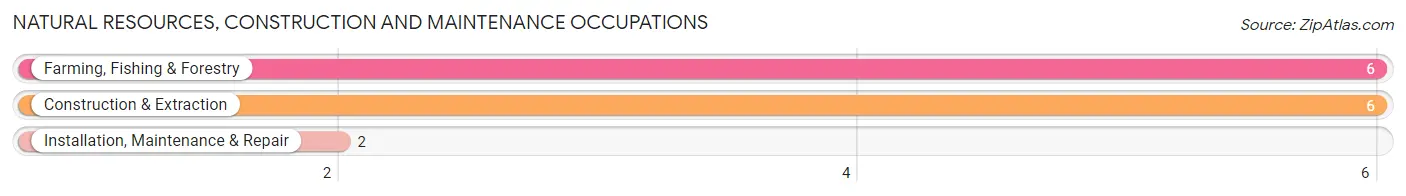
Natural Resources, Construction and Maintenance Occupations
The most common Natural Resources, Construction and Maintenance occupations in Inez are Farming, Fishing & Forestry (6 | 1.8%), Construction & Extraction (6 | 1.8%), and Installation, Maintenance & Repair (2 | 0.6%).
Natural Resources, Construction and Maintenance Occupations by Sex
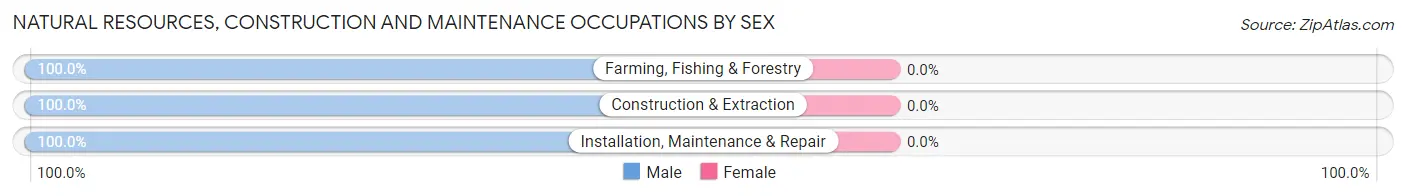
| Occupation | Male | Female |
| Farming, Fishing & Forestry | 6 (100.0%) | 0 (0.0%) |
| Construction & Extraction | 6 (100.0%) | 0 (0.0%) |
| Installation, Maintenance & Repair | 2 (100.0%) | 0 (0.0%) |
| Total (Category) | 14 (100.0%) | 0 (0.0%) |
| Total (Overall) | 176 (51.8%) | 164 (48.2%) |
Production, Transportation and Moving Occupations
The most common Production, Transportation and Moving occupations in Inez are Material Moving (29 | 8.5%), Production (16 | 4.7%), and Transportation (5 | 1.5%).
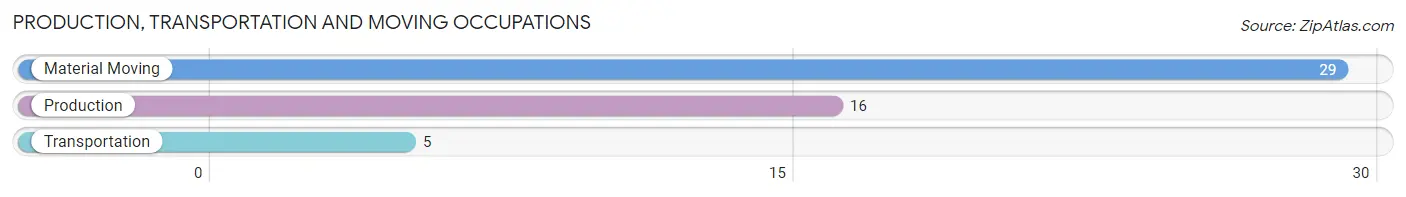
Production, Transportation and Moving Occupations by Sex
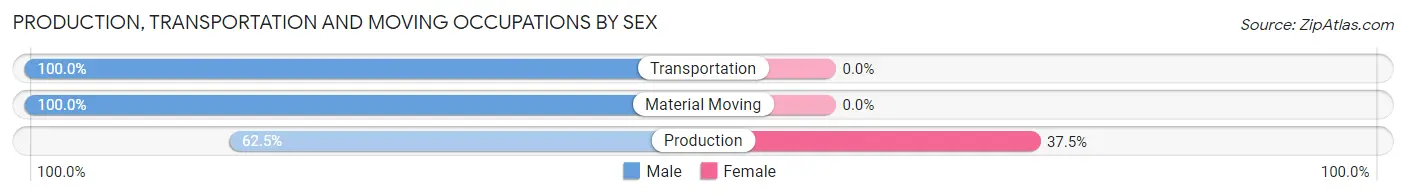
| Occupation | Male | Female |
| Production | 10 (62.5%) | 6 (37.5%) |
| Transportation | 5 (100.0%) | 0 (0.0%) |
| Material Moving | 29 (100.0%) | 0 (0.0%) |
| Total (Category) | 44 (88.0%) | 6 (12.0%) |
| Total (Overall) | 176 (51.8%) | 164 (48.2%) |
Employment Industries by Sex in Inez
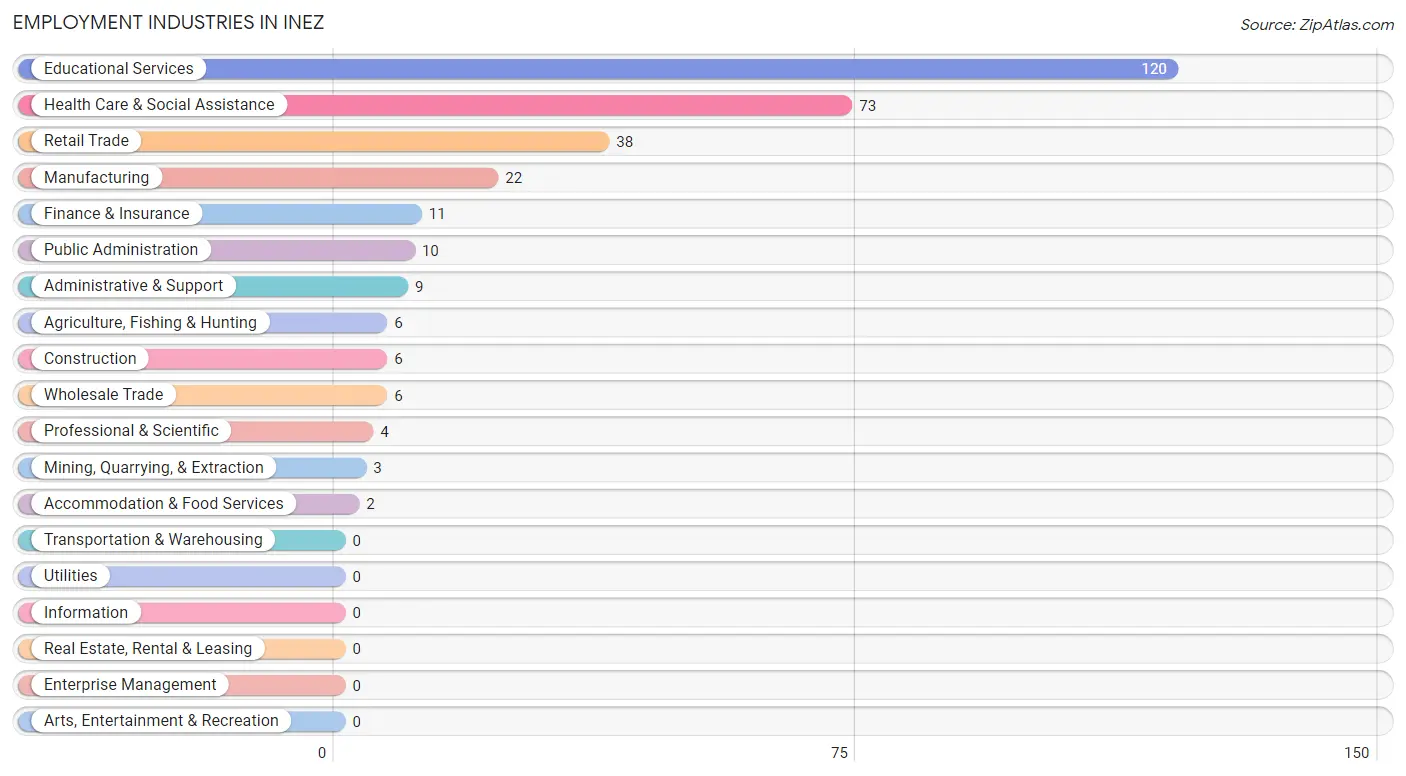
Employment Industries in Inez
The major employment industries in Inez include Educational Services (120 | 35.3%), Health Care & Social Assistance (73 | 21.5%), Retail Trade (38 | 11.2%), Manufacturing (22 | 6.5%), and Finance & Insurance (11 | 3.2%).
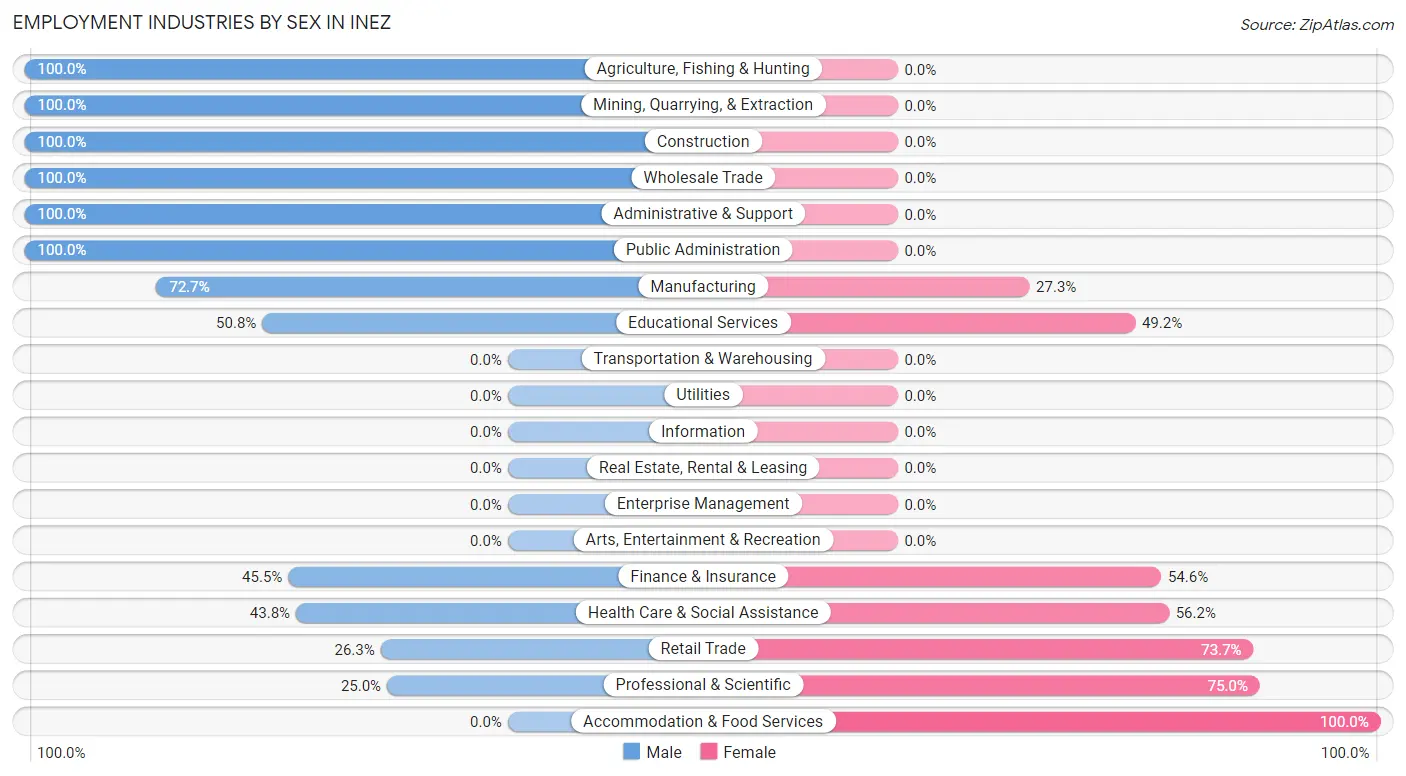
Employment Industries by Sex in Inez
The Inez industries that see more men than women are Agriculture, Fishing & Hunting (100.0%), Mining, Quarrying, & Extraction (100.0%), and Construction (100.0%), whereas the industries that tend to have a higher number of women are Accommodation & Food Services (100.0%), Professional & Scientific (75.0%), and Retail Trade (73.7%).
| Industry | Male | Female |
| Agriculture, Fishing & Hunting | 6 (100.0%) | 0 (0.0%) |
| Mining, Quarrying, & Extraction | 3 (100.0%) | 0 (0.0%) |
| Construction | 6 (100.0%) | 0 (0.0%) |
| Manufacturing | 16 (72.7%) | 6 (27.3%) |
| Wholesale Trade | 6 (100.0%) | 0 (0.0%) |
| Retail Trade | 10 (26.3%) | 28 (73.7%) |
| Transportation & Warehousing | 0 (0.0%) | 0 (0.0%) |
| Utilities | 0 (0.0%) | 0 (0.0%) |
| Information | 0 (0.0%) | 0 (0.0%) |
| Finance & Insurance | 5 (45.5%) | 6 (54.5%) |
| Real Estate, Rental & Leasing | 0 (0.0%) | 0 (0.0%) |
| Professional & Scientific | 1 (25.0%) | 3 (75.0%) |
| Enterprise Management | 0 (0.0%) | 0 (0.0%) |
| Administrative & Support | 9 (100.0%) | 0 (0.0%) |
| Educational Services | 61 (50.8%) | 59 (49.2%) |
| Health Care & Social Assistance | 32 (43.8%) | 41 (56.2%) |
| Arts, Entertainment & Recreation | 0 (0.0%) | 0 (0.0%) |
| Accommodation & Food Services | 0 (0.0%) | 2 (100.0%) |
| Public Administration | 10 (100.0%) | 0 (0.0%) |
| Total | 176 (51.8%) | 164 (48.2%) |
Education in Inez
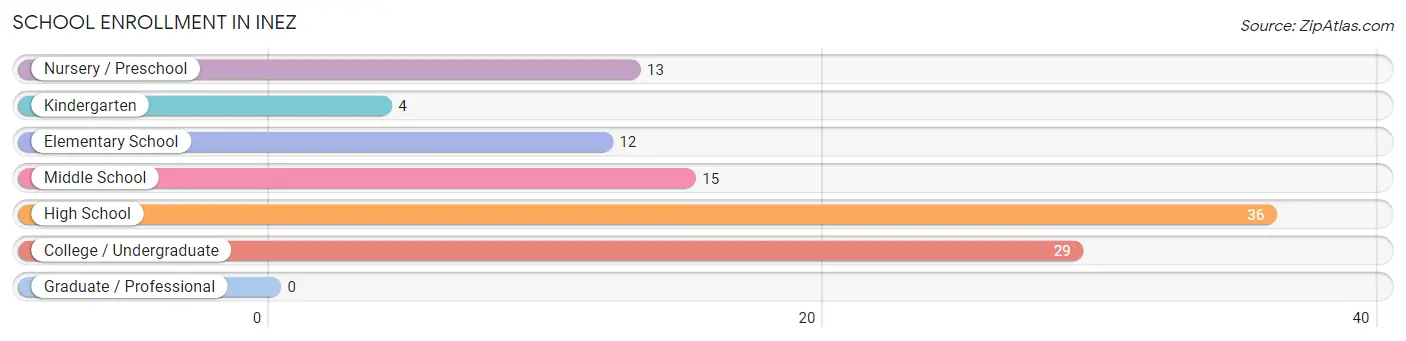
School Enrollment in Inez
The most common levels of schooling among the 109 students in Inez are high school (36 | 33.0%), college / undergraduate (29 | 26.6%), and middle school (15 | 13.8%).
| School Level | # Students | % Students |
| Nursery / Preschool | 13 | 11.9% |
| Kindergarten | 4 | 3.7% |
| Elementary School | 12 | 11.0% |
| Middle School | 15 | 13.8% |
| High School | 36 | 33.0% |
| College / Undergraduate | 29 | 26.6% |
| Graduate / Professional | 0 | 0.0% |
| Total | 109 | 100.0% |
School Enrollment by Age by Funding Source in Inez
Out of a total of 109 students who are enrolled in schools in Inez, 22 (20.2%) attend a private institution, while the remaining 87 (79.8%) are enrolled in public schools. The age group of 18 to 19 year olds has the highest likelihood of being enrolled in private schools, with 11 (84.6% in the age bracket) enrolled. Conversely, the age group of 5 to 9 year old has the lowest likelihood of being enrolled in a private school, with 27 (100.0% in the age bracket) attending a public institution.
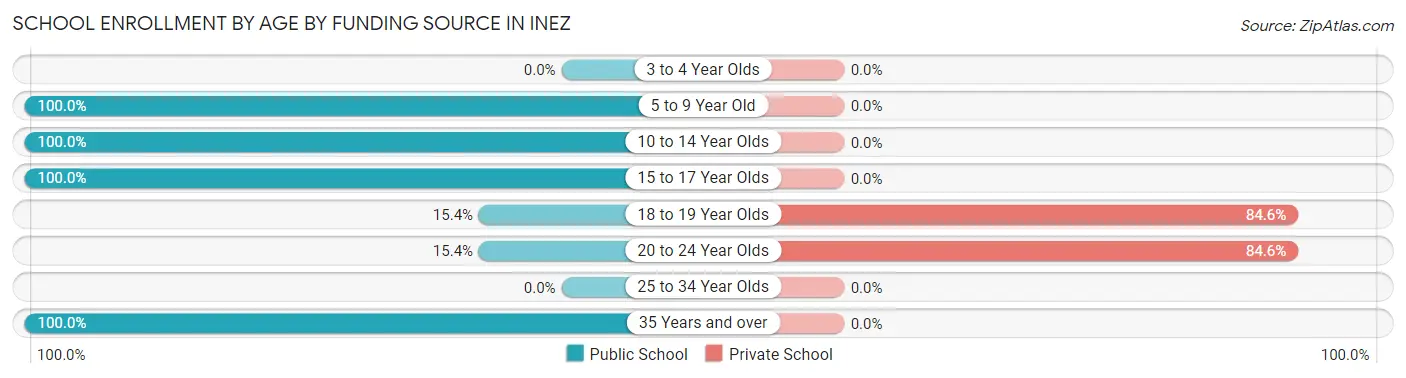
| Age Bracket | Public School | Private School |
| 3 to 4 Year Olds | 0 (0.0%) | 0 (0.0%) |
| 5 to 9 Year Old | 27 (100.0%) | 0 (0.0%) |
| 10 to 14 Year Olds | 16 (100.0%) | 0 (0.0%) |
| 15 to 17 Year Olds | 37 (100.0%) | 0 (0.0%) |
| 18 to 19 Year Olds | 2 (15.4%) | 11 (84.6%) |
| 20 to 24 Year Olds | 2 (15.4%) | 11 (84.6%) |
| 25 to 34 Year Olds | 0 (0.0%) | 0 (0.0%) |
| 35 Years and over | 3 (100.0%) | 0 (0.0%) |
| Total | 87 (79.8%) | 22 (20.2%) |
Educational Attainment by Field of Study in Inez
Communications (48 | 30.2%), psychology (34 | 21.4%), education (21 | 13.2%), liberal arts & history (14 | 8.8%), and science & technology (10 | 6.3%) are the most common fields of study among 159 individuals in Inez who have obtained a bachelor's degree or higher.
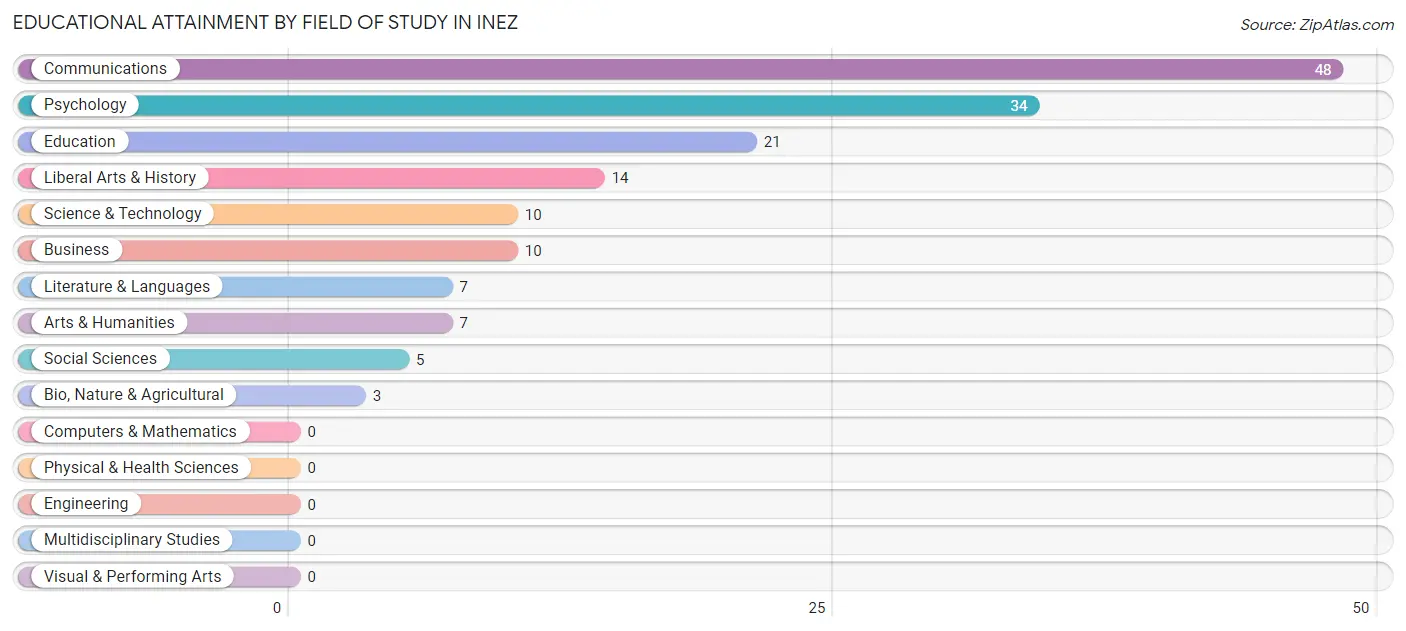
| Field of Study | # Graduates | % Graduates |
| Computers & Mathematics | 0 | 0.0% |
| Bio, Nature & Agricultural | 3 | 1.9% |
| Physical & Health Sciences | 0 | 0.0% |
| Psychology | 34 | 21.4% |
| Social Sciences | 5 | 3.1% |
| Engineering | 0 | 0.0% |
| Multidisciplinary Studies | 0 | 0.0% |
| Science & Technology | 10 | 6.3% |
| Business | 10 | 6.3% |
| Education | 21 | 13.2% |
| Literature & Languages | 7 | 4.4% |
| Liberal Arts & History | 14 | 8.8% |
| Visual & Performing Arts | 0 | 0.0% |
| Communications | 48 | 30.2% |
| Arts & Humanities | 7 | 4.4% |
| Total | 159 | 100.0% |
Transportation & Commute in Inez
Vehicle Availability by Sex in Inez
The most prevalent vehicle ownership categories in Inez are males with 3 vehicles (108, accounting for 61.4%) and females with 3 vehicles (86, making up 67.1%).
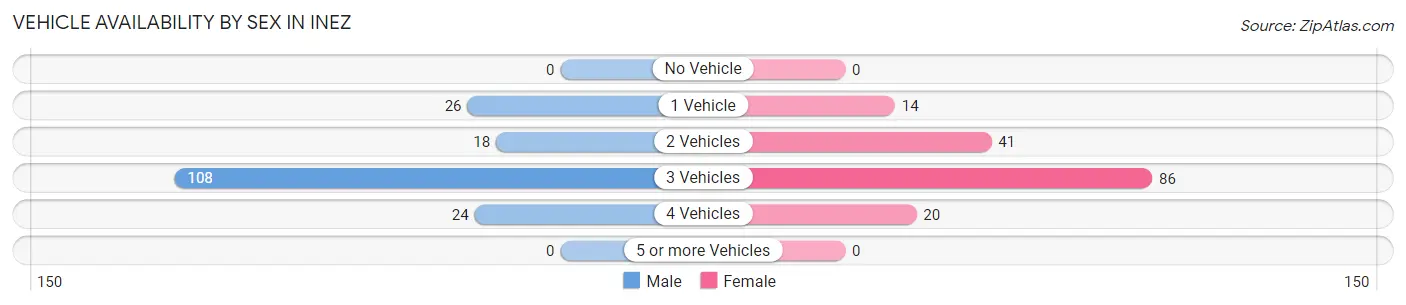
| Vehicles Available | Male | Female |
| No Vehicle | 0 (0.0%) | 0 (0.0%) |
| 1 Vehicle | 26 (14.8%) | 14 (8.7%) |
| 2 Vehicles | 18 (10.2%) | 41 (25.5%) |
| 3 Vehicles | 108 (61.4%) | 86 (53.4%) |
| 4 Vehicles | 24 (13.6%) | 20 (12.4%) |
| 5 or more Vehicles | 0 (0.0%) | 0 (0.0%) |
| Total | 176 (100.0%) | 161 (100.0%) |
Commute Time in Inez
The most frequently occuring commute durations in Inez are 5 to 9 minutes (120 commuters, 36.9%), less than 5 minutes (80 commuters, 24.6%), and 20 to 24 minutes (57 commuters, 17.5%).
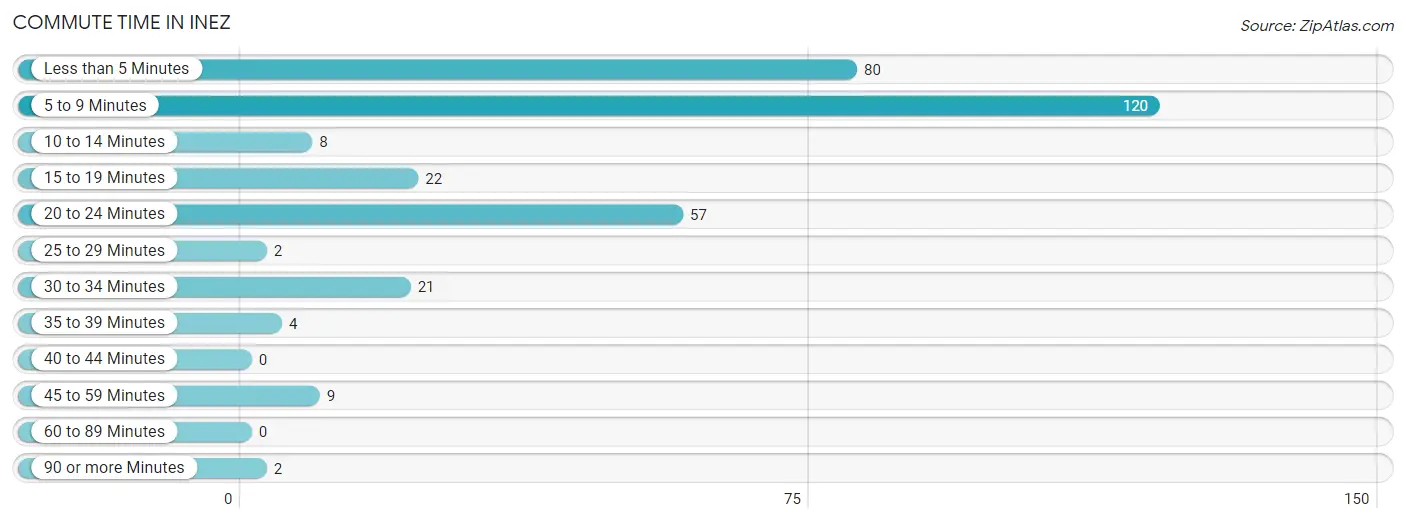
| Commute Time | # Commuters | % Commuters |
| Less than 5 Minutes | 80 | 24.6% |
| 5 to 9 Minutes | 120 | 36.9% |
| 10 to 14 Minutes | 8 | 2.5% |
| 15 to 19 Minutes | 22 | 6.8% |
| 20 to 24 Minutes | 57 | 17.5% |
| 25 to 29 Minutes | 2 | 0.6% |
| 30 to 34 Minutes | 21 | 6.5% |
| 35 to 39 Minutes | 4 | 1.2% |
| 40 to 44 Minutes | 0 | 0.0% |
| 45 to 59 Minutes | 9 | 2.8% |
| 60 to 89 Minutes | 0 | 0.0% |
| 90 or more Minutes | 2 | 0.6% |
Commute Time by Sex in Inez
The most common commute times in Inez are 20 to 24 minutes (54 commuters, 30.7%) for males and 5 to 9 minutes (72 commuters, 48.3%) for females.
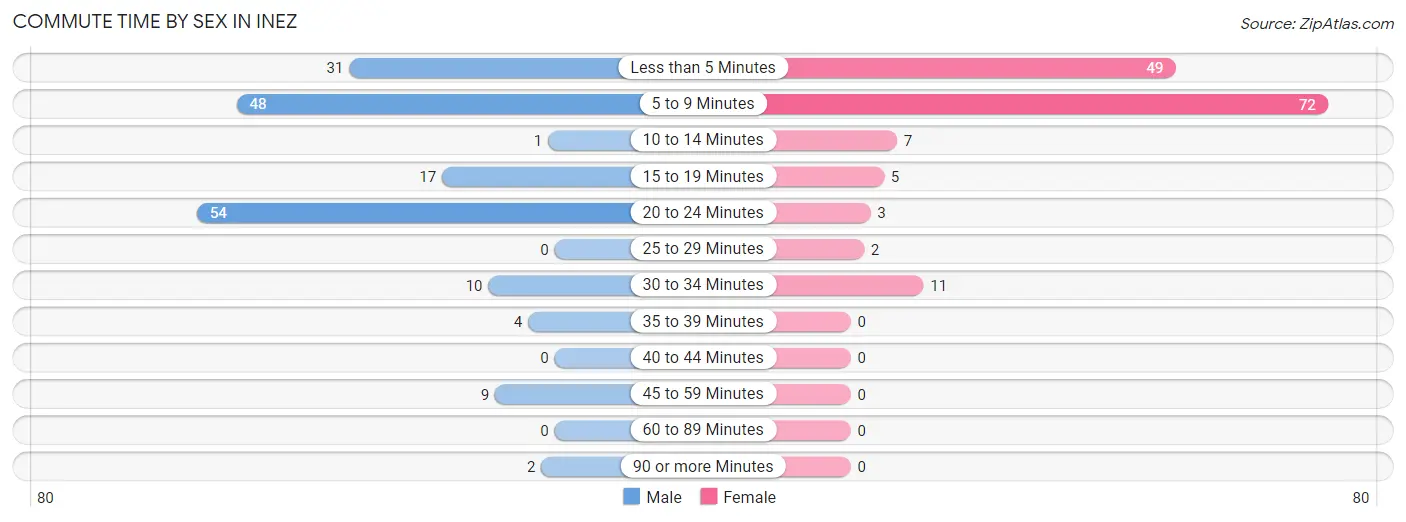
| Commute Time | Male | Female |
| Less than 5 Minutes | 31 (17.6%) | 49 (32.9%) |
| 5 to 9 Minutes | 48 (27.3%) | 72 (48.3%) |
| 10 to 14 Minutes | 1 (0.6%) | 7 (4.7%) |
| 15 to 19 Minutes | 17 (9.7%) | 5 (3.4%) |
| 20 to 24 Minutes | 54 (30.7%) | 3 (2.0%) |
| 25 to 29 Minutes | 0 (0.0%) | 2 (1.3%) |
| 30 to 34 Minutes | 10 (5.7%) | 11 (7.4%) |
| 35 to 39 Minutes | 4 (2.3%) | 0 (0.0%) |
| 40 to 44 Minutes | 0 (0.0%) | 0 (0.0%) |
| 45 to 59 Minutes | 9 (5.1%) | 0 (0.0%) |
| 60 to 89 Minutes | 0 (0.0%) | 0 (0.0%) |
| 90 or more Minutes | 2 (1.1%) | 0 (0.0%) |
Time of Departure to Work by Sex in Inez
The most frequent times of departure to work in Inez are 6:00 AM to 6:29 AM (80, 45.5%) for males and 6:30 AM to 6:59 AM (39, 26.2%) for females.
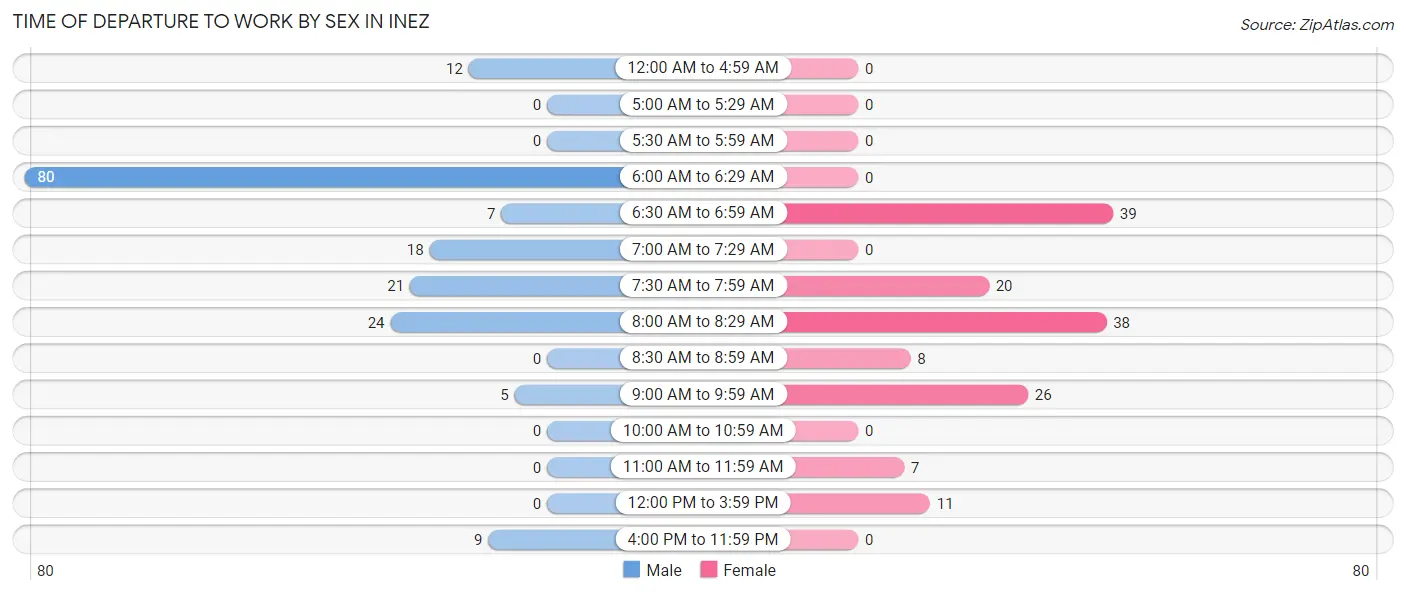
| Time of Departure | Male | Female |
| 12:00 AM to 4:59 AM | 12 (6.8%) | 0 (0.0%) |
| 5:00 AM to 5:29 AM | 0 (0.0%) | 0 (0.0%) |
| 5:30 AM to 5:59 AM | 0 (0.0%) | 0 (0.0%) |
| 6:00 AM to 6:29 AM | 80 (45.5%) | 0 (0.0%) |
| 6:30 AM to 6:59 AM | 7 (4.0%) | 39 (26.2%) |
| 7:00 AM to 7:29 AM | 18 (10.2%) | 0 (0.0%) |
| 7:30 AM to 7:59 AM | 21 (11.9%) | 20 (13.4%) |
| 8:00 AM to 8:29 AM | 24 (13.6%) | 38 (25.5%) |
| 8:30 AM to 8:59 AM | 0 (0.0%) | 8 (5.4%) |
| 9:00 AM to 9:59 AM | 5 (2.8%) | 26 (17.4%) |
| 10:00 AM to 10:59 AM | 0 (0.0%) | 0 (0.0%) |
| 11:00 AM to 11:59 AM | 0 (0.0%) | 7 (4.7%) |
| 12:00 PM to 3:59 PM | 0 (0.0%) | 11 (7.4%) |
| 4:00 PM to 11:59 PM | 9 (5.1%) | 0 (0.0%) |
| Total | 176 (100.0%) | 149 (100.0%) |
Housing Occupancy in Inez
Occupancy by Ownership in Inez
Of the total 285 dwellings in Inez, owner-occupied units account for 160 (56.1%), while renter-occupied units make up 125 (43.9%).
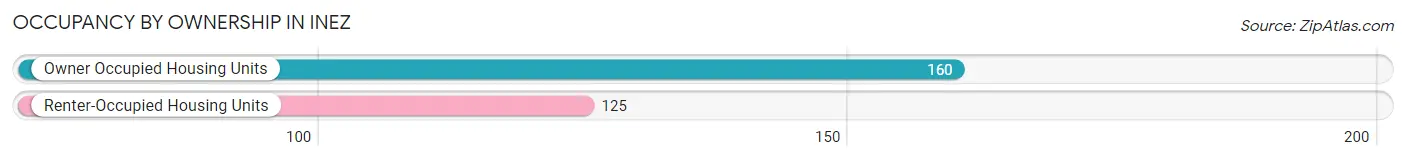
| Occupancy | # Housing Units | % Housing Units |
| Owner Occupied Housing Units | 160 | 56.1% |
| Renter-Occupied Housing Units | 125 | 43.9% |
| Total Occupied Housing Units | 285 | 100.0% |
Occupancy by Household Size in Inez
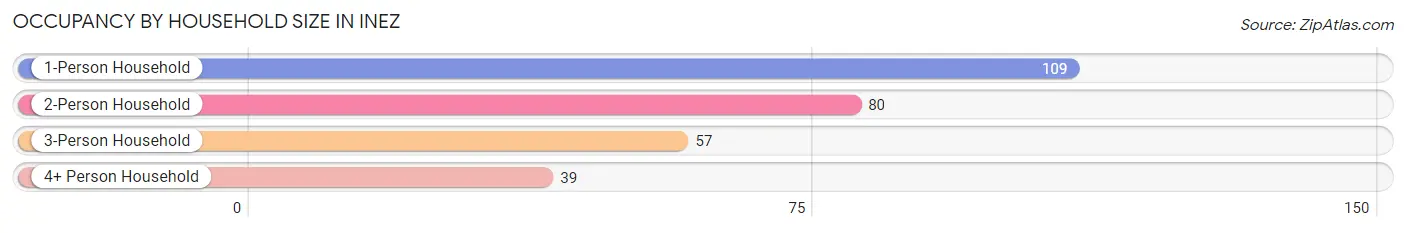
| Household Size | # Housing Units | % Housing Units |
| 1-Person Household | 109 | 38.3% |
| 2-Person Household | 80 | 28.1% |
| 3-Person Household | 57 | 20.0% |
| 4+ Person Household | 39 | 13.7% |
| Total Housing Units | 285 | 100.0% |
Occupancy by Ownership by Household Size in Inez
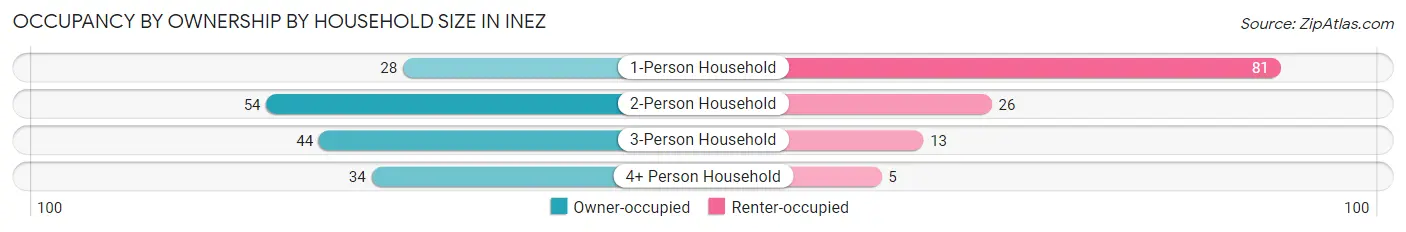
| Household Size | Owner-occupied | Renter-occupied |
| 1-Person Household | 28 (25.7%) | 81 (74.3%) |
| 2-Person Household | 54 (67.5%) | 26 (32.5%) |
| 3-Person Household | 44 (77.2%) | 13 (22.8%) |
| 4+ Person Household | 34 (87.2%) | 5 (12.8%) |
| Total Housing Units | 160 (56.1%) | 125 (43.9%) |
Occupancy by Educational Attainment in Inez
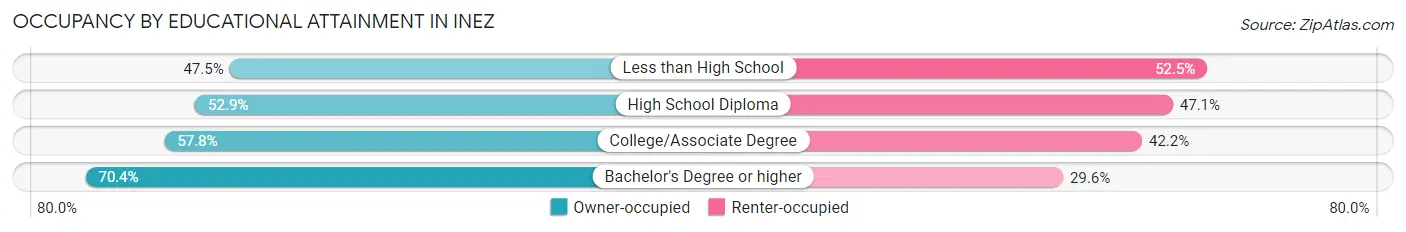
| Household Size | Owner-occupied | Renter-occupied |
| Less than High School | 38 (47.5%) | 42 (52.5%) |
| High School Diploma | 36 (52.9%) | 32 (47.1%) |
| College/Associate Degree | 48 (57.8%) | 35 (42.2%) |
| Bachelor's Degree or higher | 38 (70.4%) | 16 (29.6%) |
Occupancy by Age of Householder in Inez
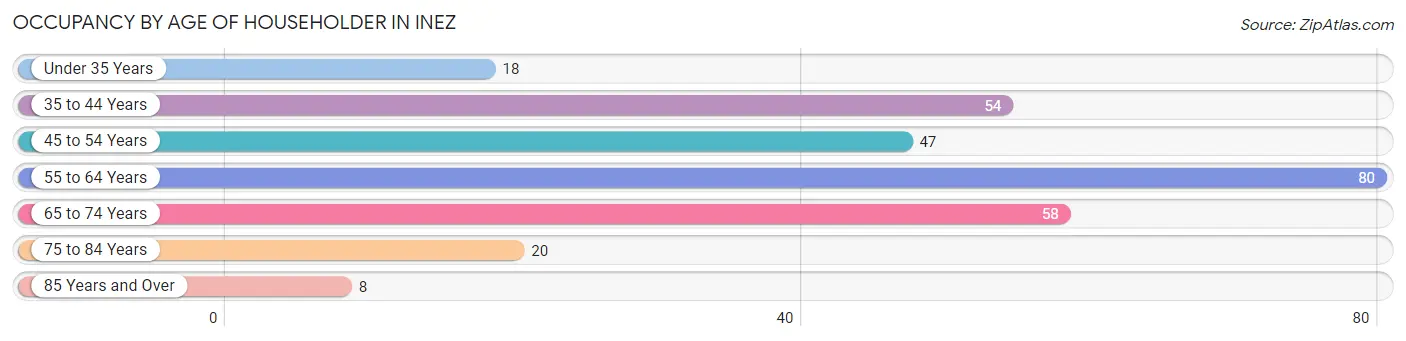
| Age Bracket | # Households | % Households |
| Under 35 Years | 18 | 6.3% |
| 35 to 44 Years | 54 | 19.0% |
| 45 to 54 Years | 47 | 16.5% |
| 55 to 64 Years | 80 | 28.1% |
| 65 to 74 Years | 58 | 20.3% |
| 75 to 84 Years | 20 | 7.0% |
| 85 Years and Over | 8 | 2.8% |
| Total | 285 | 100.0% |
Housing Finances in Inez
Median Income by Occupancy in Inez
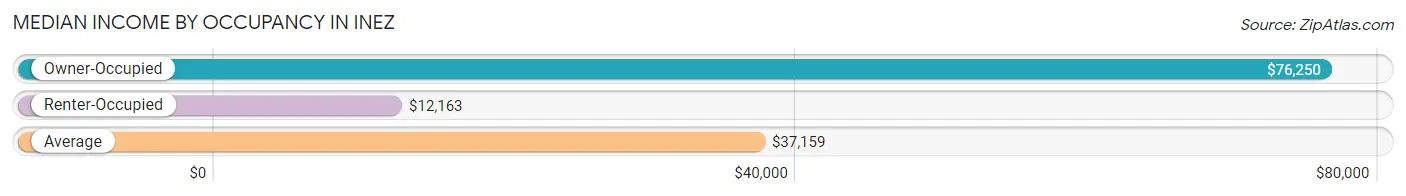
| Occupancy Type | # Households | Median Income |
| Owner-Occupied | 160 (56.1%) | $76,250 |
| Renter-Occupied | 125 (43.9%) | $12,163 |
| Average | 285 (100.0%) | $37,159 |
Occupancy by Householder Income Bracket in Inez
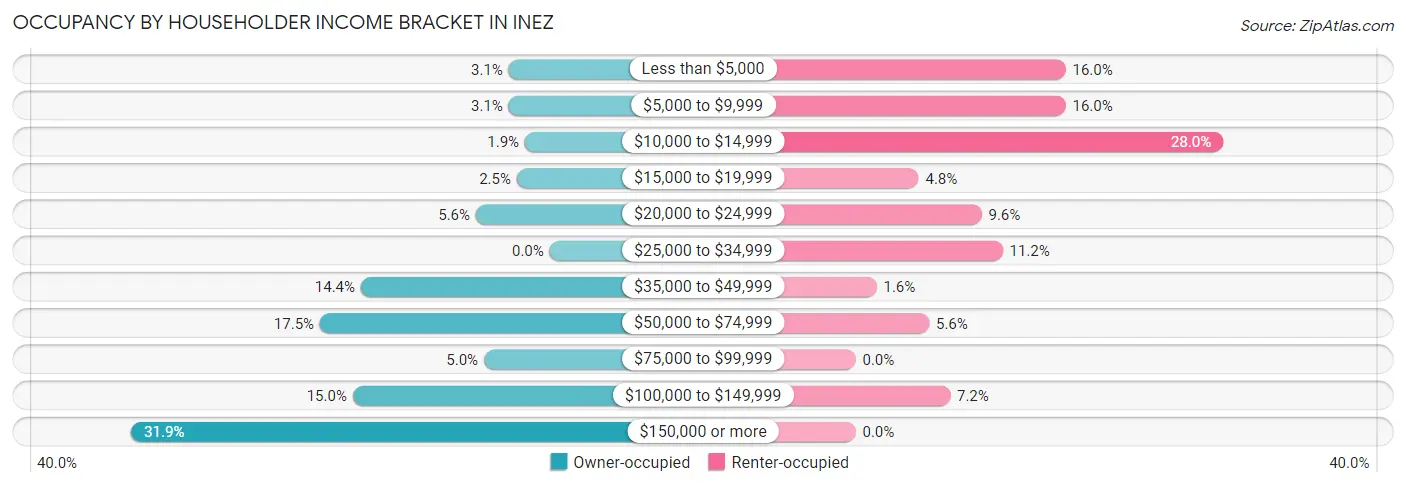
| Income Bracket | Owner-occupied | Renter-occupied |
| Less than $5,000 | 5 (3.1%) | 20 (16.0%) |
| $5,000 to $9,999 | 5 (3.1%) | 20 (16.0%) |
| $10,000 to $14,999 | 3 (1.9%) | 35 (28.0%) |
| $15,000 to $19,999 | 4 (2.5%) | 6 (4.8%) |
| $20,000 to $24,999 | 9 (5.6%) | 12 (9.6%) |
| $25,000 to $34,999 | 0 (0.0%) | 14 (11.2%) |
| $35,000 to $49,999 | 23 (14.4%) | 2 (1.6%) |
| $50,000 to $74,999 | 28 (17.5%) | 7 (5.6%) |
| $75,000 to $99,999 | 8 (5.0%) | 0 (0.0%) |
| $100,000 to $149,999 | 24 (15.0%) | 9 (7.2%) |
| $150,000 or more | 51 (31.9%) | 0 (0.0%) |
| Total | 160 (100.0%) | 125 (100.0%) |
Monthly Housing Cost Tiers in Inez
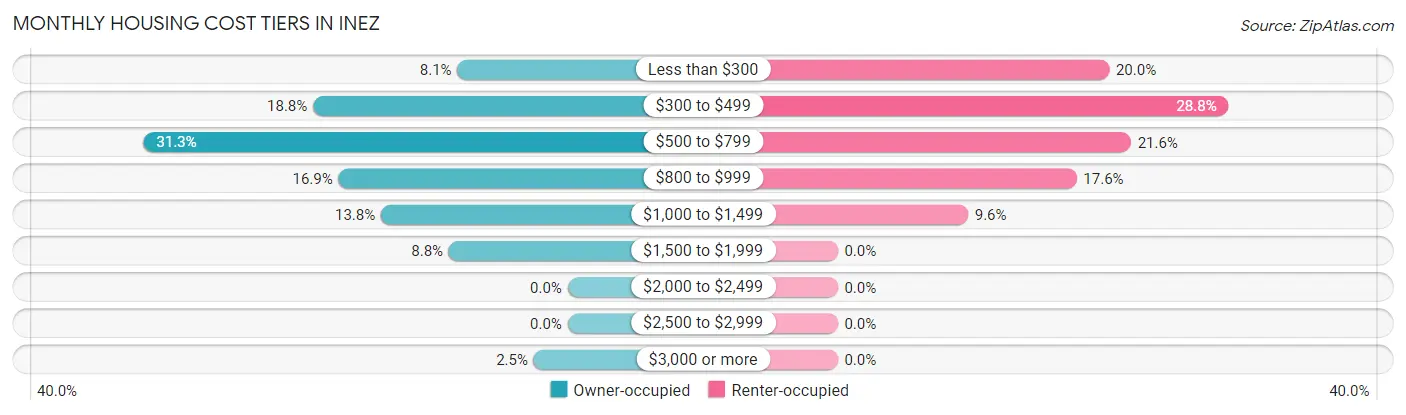
| Monthly Cost | Owner-occupied | Renter-occupied |
| Less than $300 | 13 (8.1%) | 25 (20.0%) |
| $300 to $499 | 30 (18.8%) | 36 (28.8%) |
| $500 to $799 | 50 (31.2%) | 27 (21.6%) |
| $800 to $999 | 27 (16.9%) | 22 (17.6%) |
| $1,000 to $1,499 | 22 (13.8%) | 12 (9.6%) |
| $1,500 to $1,999 | 14 (8.7%) | 0 (0.0%) |
| $2,000 to $2,499 | 0 (0.0%) | 0 (0.0%) |
| $2,500 to $2,999 | 0 (0.0%) | 0 (0.0%) |
| $3,000 or more | 4 (2.5%) | 0 (0.0%) |
| Total | 160 (100.0%) | 125 (100.0%) |
Physical Housing Characteristics in Inez
Housing Structures in Inez
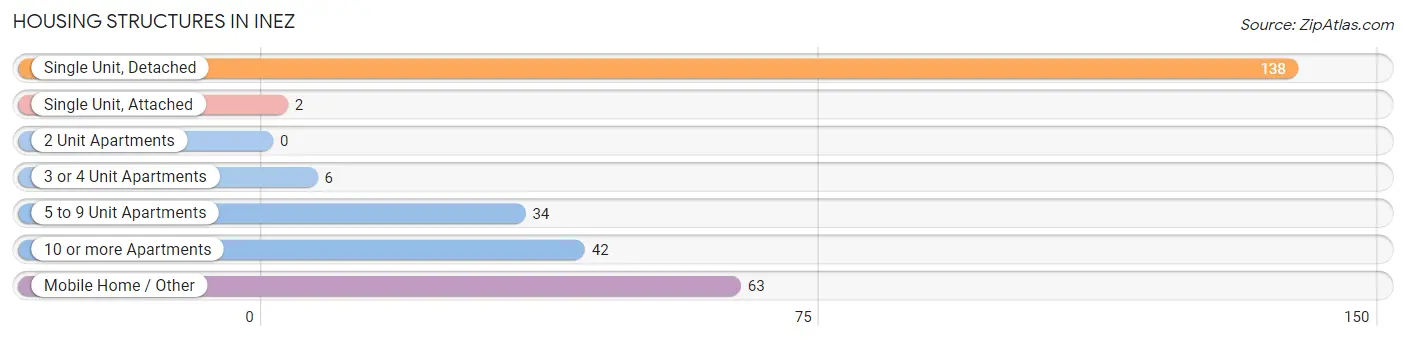
| Structure Type | # Housing Units | % Housing Units |
| Single Unit, Detached | 138 | 48.4% |
| Single Unit, Attached | 2 | 0.7% |
| 2 Unit Apartments | 0 | 0.0% |
| 3 or 4 Unit Apartments | 6 | 2.1% |
| 5 to 9 Unit Apartments | 34 | 11.9% |
| 10 or more Apartments | 42 | 14.7% |
| Mobile Home / Other | 63 | 22.1% |
| Total | 285 | 100.0% |
Housing Structures by Occupancy in Inez
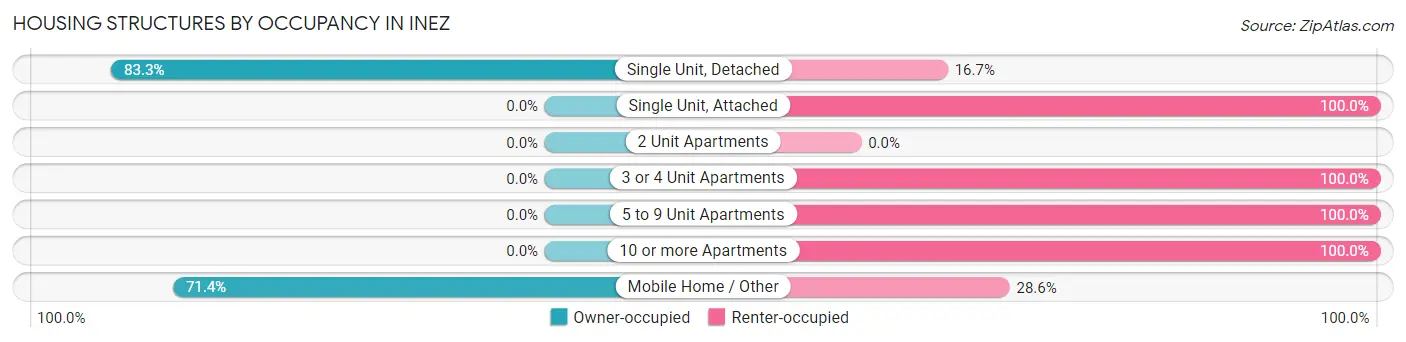
| Structure Type | Owner-occupied | Renter-occupied |
| Single Unit, Detached | 115 (83.3%) | 23 (16.7%) |
| Single Unit, Attached | 0 (0.0%) | 2 (100.0%) |
| 2 Unit Apartments | 0 (0.0%) | 0 (0.0%) |
| 3 or 4 Unit Apartments | 0 (0.0%) | 6 (100.0%) |
| 5 to 9 Unit Apartments | 0 (0.0%) | 34 (100.0%) |
| 10 or more Apartments | 0 (0.0%) | 42 (100.0%) |
| Mobile Home / Other | 45 (71.4%) | 18 (28.6%) |
| Total | 160 (56.1%) | 125 (43.9%) |
Housing Structures by Number of Rooms in Inez
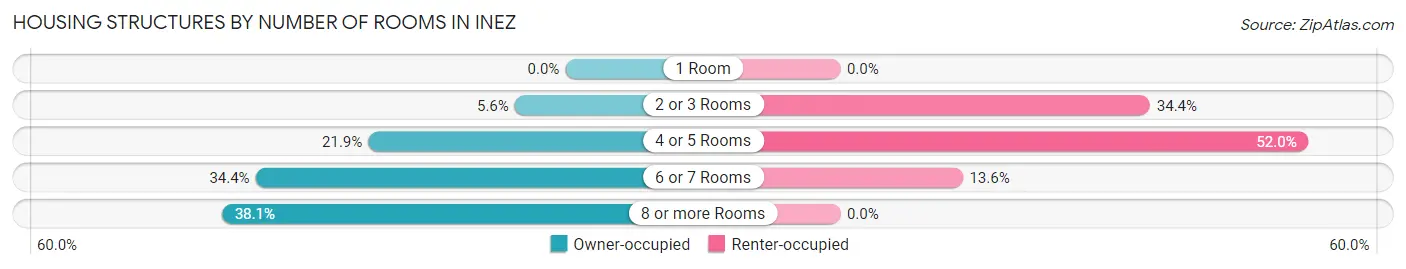
| Number of Rooms | Owner-occupied | Renter-occupied |
| 1 Room | 0 (0.0%) | 0 (0.0%) |
| 2 or 3 Rooms | 9 (5.6%) | 43 (34.4%) |
| 4 or 5 Rooms | 35 (21.9%) | 65 (52.0%) |
| 6 or 7 Rooms | 55 (34.4%) | 17 (13.6%) |
| 8 or more Rooms | 61 (38.1%) | 0 (0.0%) |
| Total | 160 (100.0%) | 125 (100.0%) |
Housing Structure by Heating Type in Inez
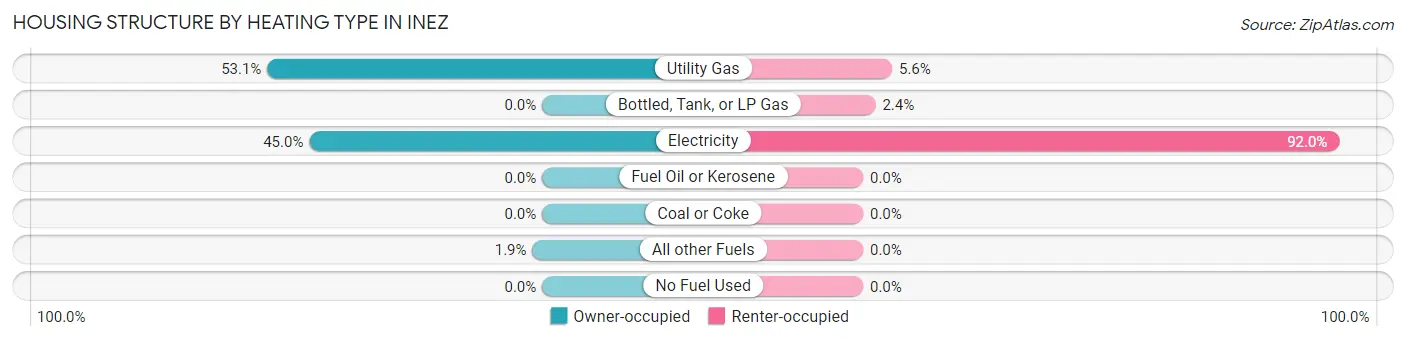
| Heating Type | Owner-occupied | Renter-occupied |
| Utility Gas | 85 (53.1%) | 7 (5.6%) |
| Bottled, Tank, or LP Gas | 0 (0.0%) | 3 (2.4%) |
| Electricity | 72 (45.0%) | 115 (92.0%) |
| Fuel Oil or Kerosene | 0 (0.0%) | 0 (0.0%) |
| Coal or Coke | 0 (0.0%) | 0 (0.0%) |
| All other Fuels | 3 (1.9%) | 0 (0.0%) |
| No Fuel Used | 0 (0.0%) | 0 (0.0%) |
| Total | 160 (100.0%) | 125 (100.0%) |
Household Vehicle Usage in Inez
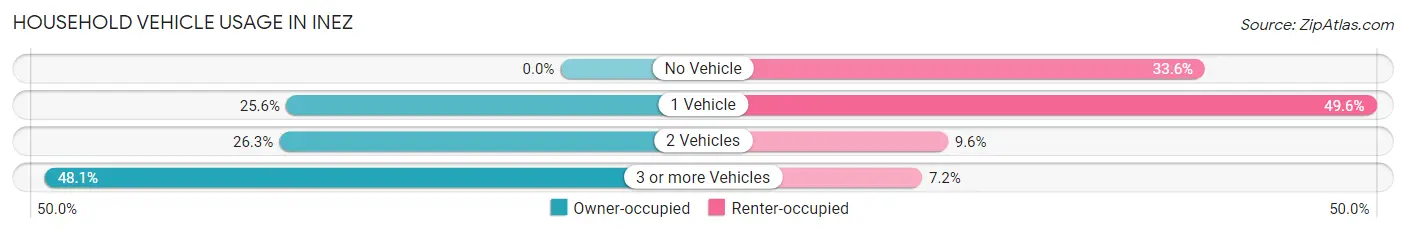
| Vehicles per Household | Owner-occupied | Renter-occupied |
| No Vehicle | 0 (0.0%) | 42 (33.6%) |
| 1 Vehicle | 41 (25.6%) | 62 (49.6%) |
| 2 Vehicles | 42 (26.3%) | 12 (9.6%) |
| 3 or more Vehicles | 77 (48.1%) | 9 (7.2%) |
| Total | 160 (100.0%) | 125 (100.0%) |
Real Estate & Mortgages in Inez
Real Estate and Mortgage Overview in Inez
| Characteristic | Without Mortgage | With Mortgage |
| Housing Units | 93 | 67 |
| Median Property Value | - | - |
| Median Household Income | $64,583 | $24 |
| Monthly Housing Costs | $525 | $4 |
| Real Estate Taxes | $811 | $5 |
Property Value by Mortgage Status in Inez
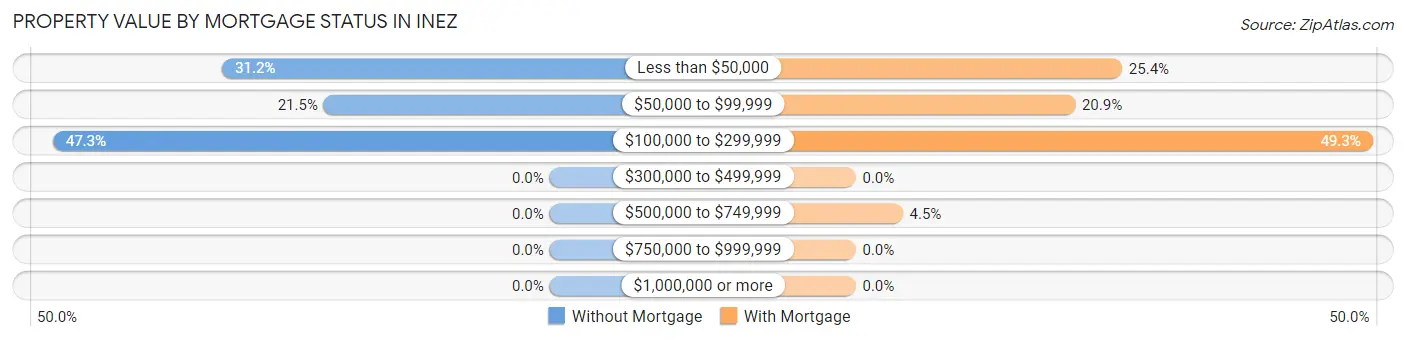
| Property Value | Without Mortgage | With Mortgage |
| Less than $50,000 | 29 (31.2%) | 17 (25.4%) |
| $50,000 to $99,999 | 20 (21.5%) | 14 (20.9%) |
| $100,000 to $299,999 | 44 (47.3%) | 33 (49.2%) |
| $300,000 to $499,999 | 0 (0.0%) | 0 (0.0%) |
| $500,000 to $749,999 | 0 (0.0%) | 3 (4.5%) |
| $750,000 to $999,999 | 0 (0.0%) | 0 (0.0%) |
| $1,000,000 or more | 0 (0.0%) | 0 (0.0%) |
| Total | 93 (100.0%) | 67 (100.0%) |
Household Income by Mortgage Status in Inez
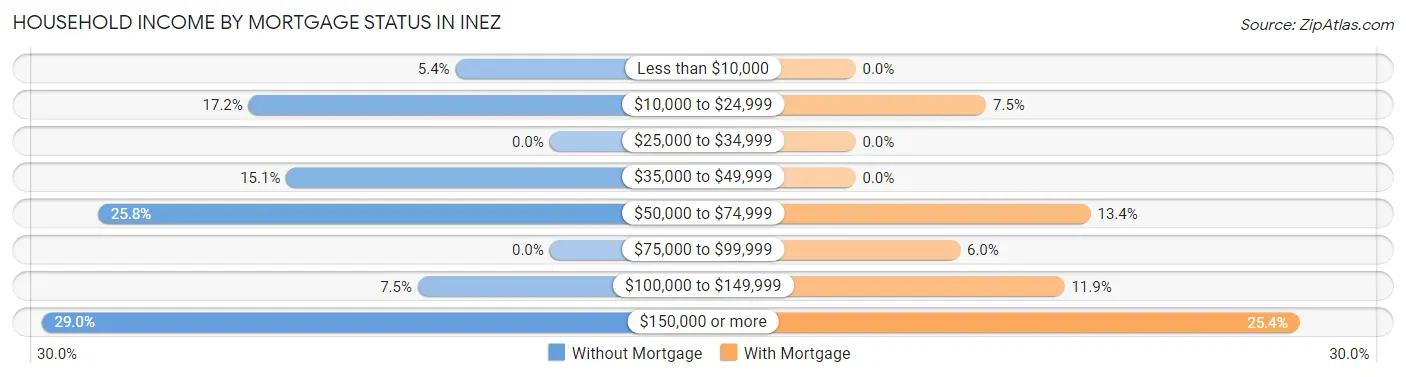
| Household Income | Without Mortgage | With Mortgage |
| Less than $10,000 | 5 (5.4%) | 0 (0.0%) |
| $10,000 to $24,999 | 16 (17.2%) | 5 (7.5%) |
| $25,000 to $34,999 | 0 (0.0%) | 0 (0.0%) |
| $35,000 to $49,999 | 14 (15.0%) | 0 (0.0%) |
| $50,000 to $74,999 | 24 (25.8%) | 9 (13.4%) |
| $75,000 to $99,999 | 0 (0.0%) | 4 (6.0%) |
| $100,000 to $149,999 | 7 (7.5%) | 8 (11.9%) |
| $150,000 or more | 27 (29.0%) | 17 (25.4%) |
| Total | 93 (100.0%) | 67 (100.0%) |
Property Value to Household Income Ratio in Inez
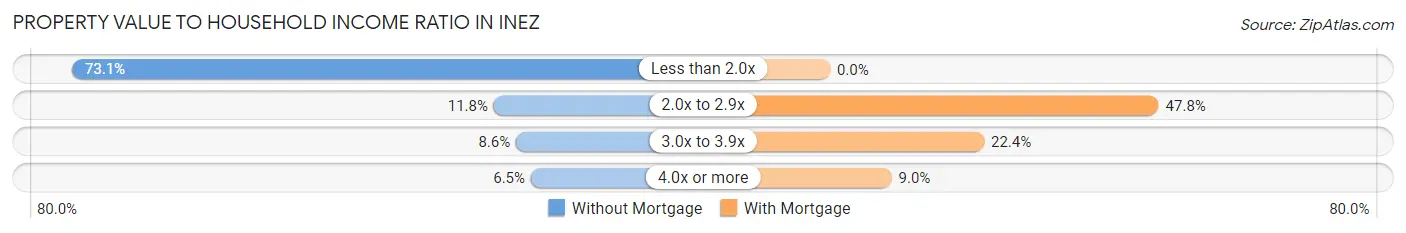
| Value-to-Income Ratio | Without Mortgage | With Mortgage |
| Less than 2.0x | 68 (73.1%) | 0 (0.0%) |
| 2.0x to 2.9x | 11 (11.8%) | 32 (47.8%) |
| 3.0x to 3.9x | 8 (8.6%) | 15 (22.4%) |
| 4.0x or more | 6 (6.5%) | 6 (9.0%) |
| Total | 93 (100.0%) | 67 (100.0%) |
Real Estate Taxes by Mortgage Status in Inez
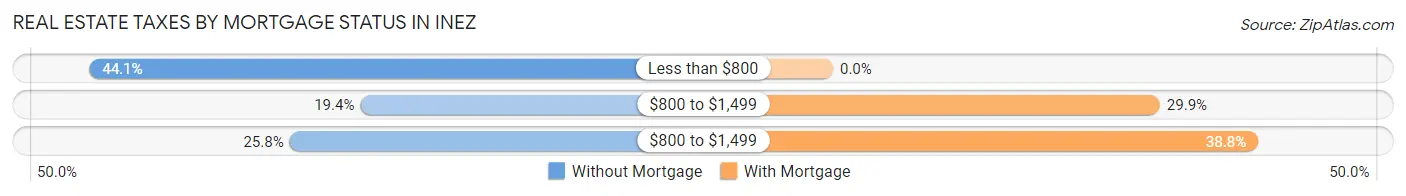
| Property Taxes | Without Mortgage | With Mortgage |
| Less than $800 | 41 (44.1%) | 0 (0.0%) |
| $800 to $1,499 | 18 (19.4%) | 20 (29.8%) |
| $800 to $1,499 | 24 (25.8%) | 26 (38.8%) |
| Total | 93 (100.0%) | 67 (100.0%) |
Health & Disability in Inez
Health Insurance Coverage by Age in Inez
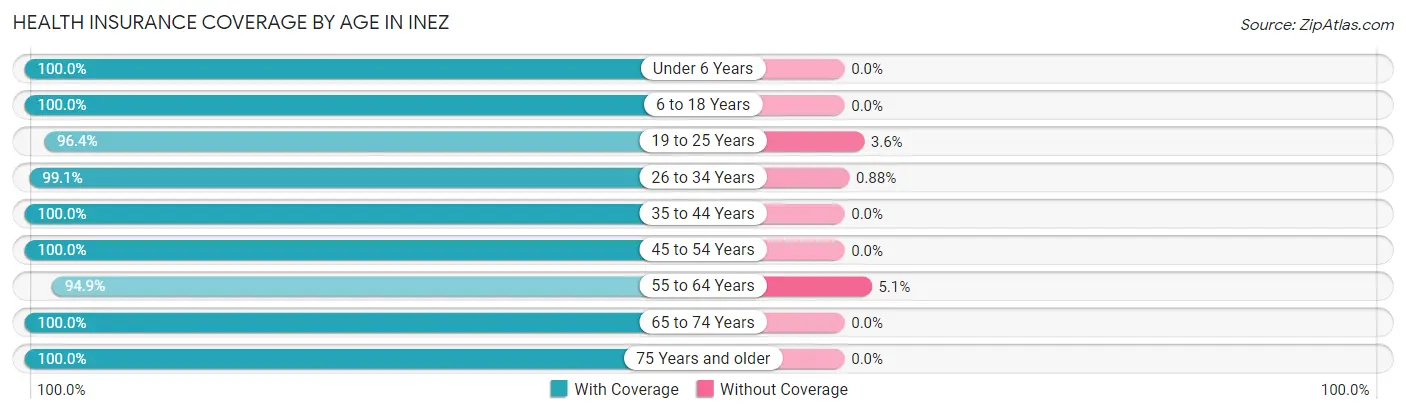
| Age Bracket | With Coverage | Without Coverage |
| Under 6 Years | 43 (100.0%) | 0 (0.0%) |
| 6 to 18 Years | 67 (100.0%) | 0 (0.0%) |
| 19 to 25 Years | 53 (96.4%) | 2 (3.6%) |
| 26 to 34 Years | 113 (99.1%) | 1 (0.9%) |
| 35 to 44 Years | 77 (100.0%) | 0 (0.0%) |
| 45 to 54 Years | 98 (100.0%) | 0 (0.0%) |
| 55 to 64 Years | 131 (94.9%) | 7 (5.1%) |
| 65 to 74 Years | 79 (100.0%) | 0 (0.0%) |
| 75 Years and older | 39 (100.0%) | 0 (0.0%) |
| Total | 700 (98.6%) | 10 (1.4%) |
Health Insurance Coverage by Citizenship Status in Inez
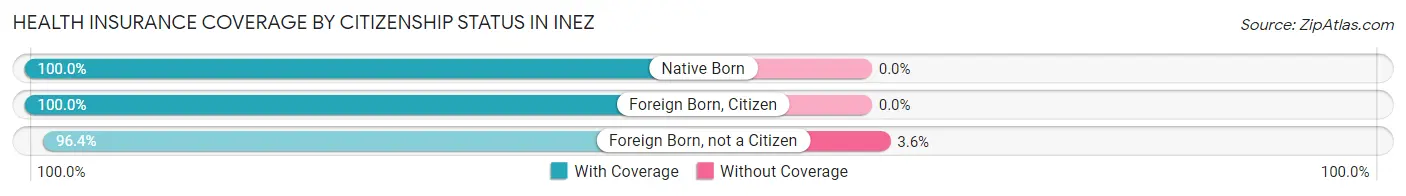
| Citizenship Status | With Coverage | Without Coverage |
| Native Born | 43 (100.0%) | 0 (0.0%) |
| Foreign Born, Citizen | 67 (100.0%) | 0 (0.0%) |
| Foreign Born, not a Citizen | 53 (96.4%) | 2 (3.6%) |
Health Insurance Coverage by Household Income in Inez
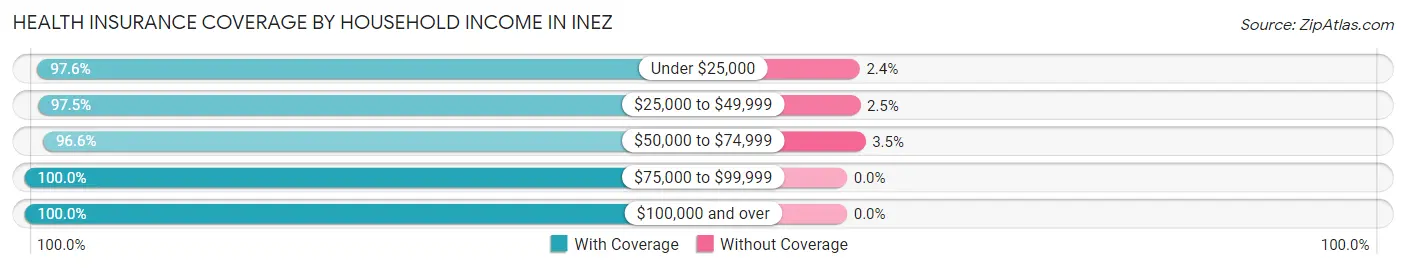
| Household Income | With Coverage | Without Coverage |
| Under $25,000 | 164 (97.6%) | 4 (2.4%) |
| $25,000 to $49,999 | 118 (97.5%) | 3 (2.5%) |
| $50,000 to $74,999 | 84 (96.6%) | 3 (3.5%) |
| $75,000 to $99,999 | 22 (100.0%) | 0 (0.0%) |
| $100,000 and over | 312 (100.0%) | 0 (0.0%) |
Public vs Private Health Insurance Coverage by Age in Inez
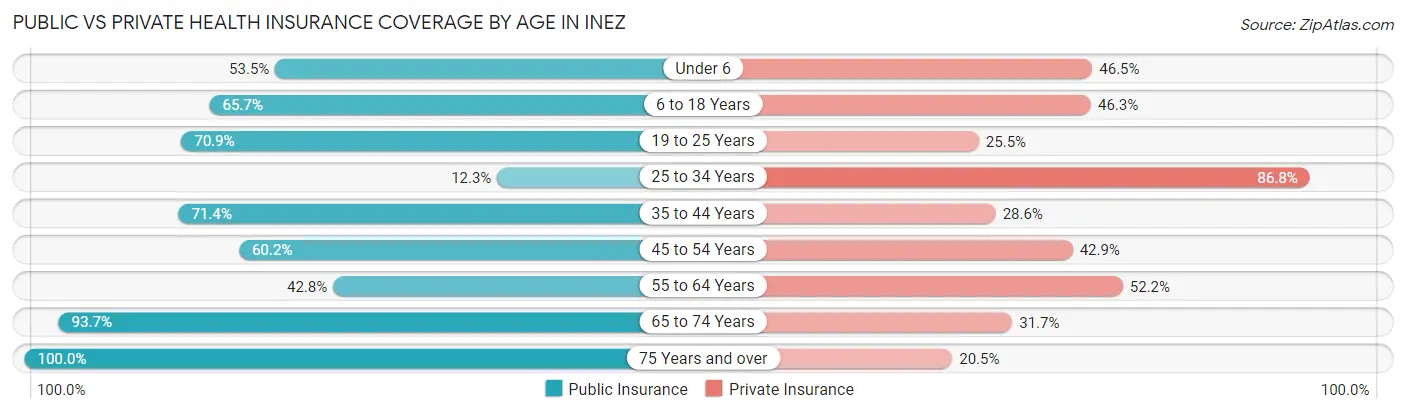
| Age Bracket | Public Insurance | Private Insurance |
| Under 6 | 23 (53.5%) | 20 (46.5%) |
| 6 to 18 Years | 44 (65.7%) | 31 (46.3%) |
| 19 to 25 Years | 39 (70.9%) | 14 (25.5%) |
| 25 to 34 Years | 14 (12.3%) | 99 (86.8%) |
| 35 to 44 Years | 55 (71.4%) | 22 (28.6%) |
| 45 to 54 Years | 59 (60.2%) | 42 (42.9%) |
| 55 to 64 Years | 59 (42.7%) | 72 (52.2%) |
| 65 to 74 Years | 74 (93.7%) | 25 (31.7%) |
| 75 Years and over | 39 (100.0%) | 8 (20.5%) |
| Total | 406 (57.2%) | 333 (46.9%) |
Disability Status by Sex by Age in Inez
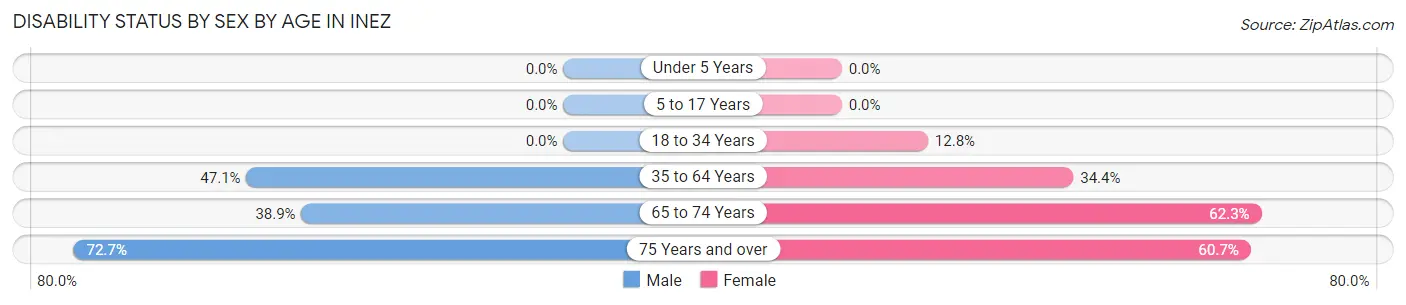
| Age Bracket | Male | Female |
| Under 5 Years | 0 (0.0%) | 0 (0.0%) |
| 5 to 17 Years | 0 (0.0%) | 0 (0.0%) |
| 18 to 34 Years | 0 (0.0%) | 11 (12.8%) |
| 35 to 64 Years | 72 (47.1%) | 55 (34.4%) |
| 65 to 74 Years | 7 (38.9%) | 38 (62.3%) |
| 75 Years and over | 8 (72.7%) | 17 (60.7%) |
Disability Class by Sex by Age in Inez
Disability Class: Hearing Difficulty
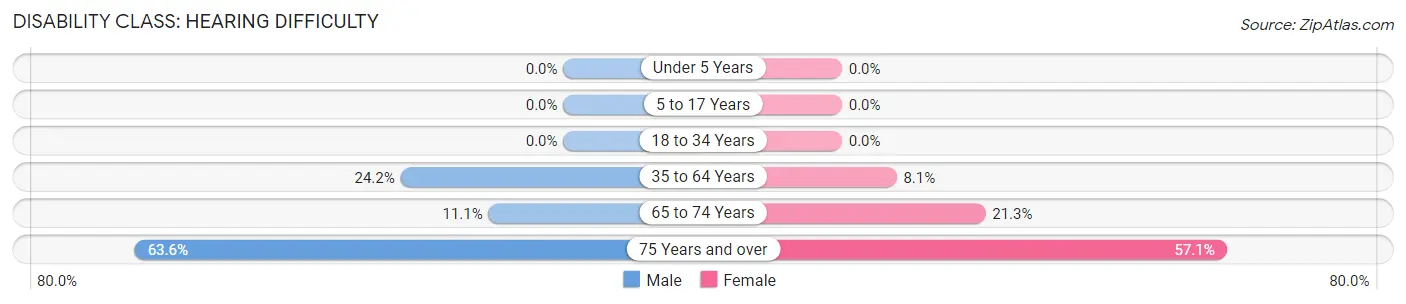
| Age Bracket | Male | Female |
| Under 5 Years | 0 (0.0%) | 0 (0.0%) |
| 5 to 17 Years | 0 (0.0%) | 0 (0.0%) |
| 18 to 34 Years | 0 (0.0%) | 0 (0.0%) |
| 35 to 64 Years | 37 (24.2%) | 13 (8.1%) |
| 65 to 74 Years | 2 (11.1%) | 13 (21.3%) |
| 75 Years and over | 7 (63.6%) | 16 (57.1%) |
Disability Class: Vision Difficulty
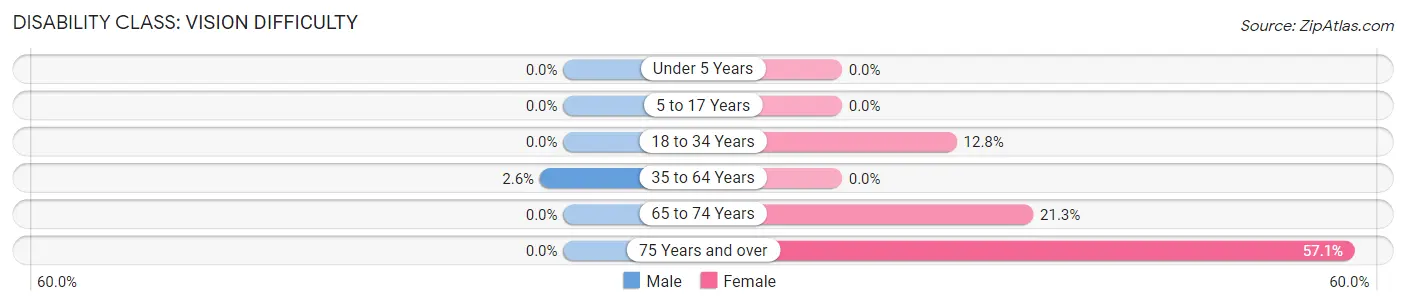
| Age Bracket | Male | Female |
| Under 5 Years | 0 (0.0%) | 0 (0.0%) |
| 5 to 17 Years | 0 (0.0%) | 0 (0.0%) |
| 18 to 34 Years | 0 (0.0%) | 11 (12.8%) |
| 35 to 64 Years | 4 (2.6%) | 0 (0.0%) |
| 65 to 74 Years | 0 (0.0%) | 13 (21.3%) |
| 75 Years and over | 0 (0.0%) | 16 (57.1%) |
Disability Class: Cognitive Difficulty
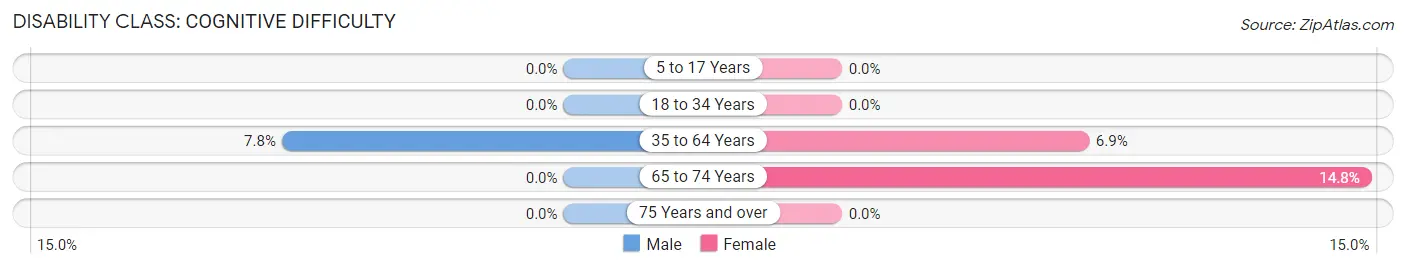
| Age Bracket | Male | Female |
| 5 to 17 Years | 0 (0.0%) | 0 (0.0%) |
| 18 to 34 Years | 0 (0.0%) | 0 (0.0%) |
| 35 to 64 Years | 12 (7.8%) | 11 (6.9%) |
| 65 to 74 Years | 0 (0.0%) | 9 (14.7%) |
| 75 Years and over | 0 (0.0%) | 0 (0.0%) |
Disability Class: Ambulatory Difficulty
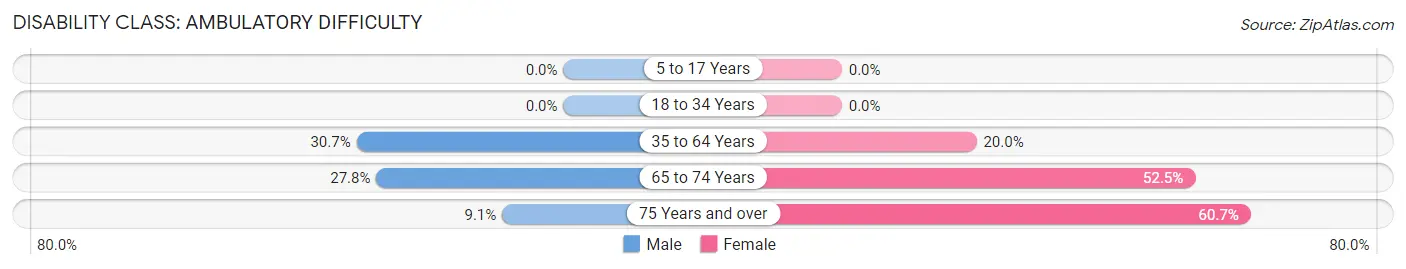
| Age Bracket | Male | Female |
| 5 to 17 Years | 0 (0.0%) | 0 (0.0%) |
| 18 to 34 Years | 0 (0.0%) | 0 (0.0%) |
| 35 to 64 Years | 47 (30.7%) | 32 (20.0%) |
| 65 to 74 Years | 5 (27.8%) | 32 (52.5%) |
| 75 Years and over | 1 (9.1%) | 17 (60.7%) |
Disability Class: Self-Care Difficulty
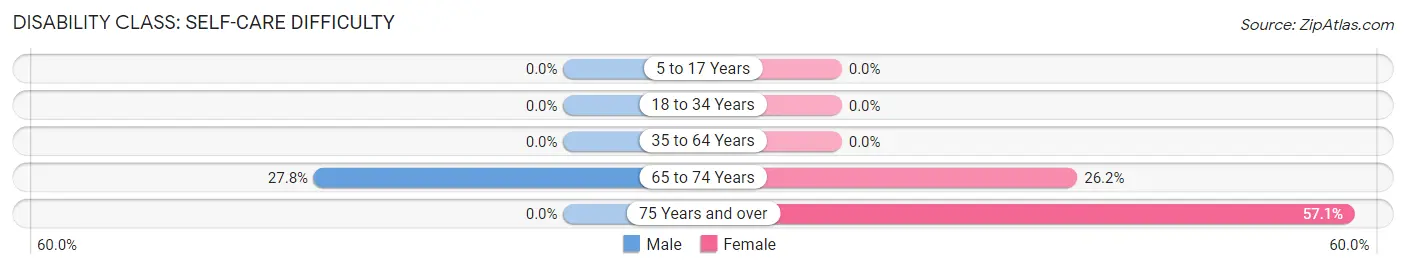
| Age Bracket | Male | Female |
| 5 to 17 Years | 0 (0.0%) | 0 (0.0%) |
| 18 to 34 Years | 0 (0.0%) | 0 (0.0%) |
| 35 to 64 Years | 0 (0.0%) | 0 (0.0%) |
| 65 to 74 Years | 5 (27.8%) | 16 (26.2%) |
| 75 Years and over | 0 (0.0%) | 16 (57.1%) |
Technology Access in Inez
Computing Device Access in Inez
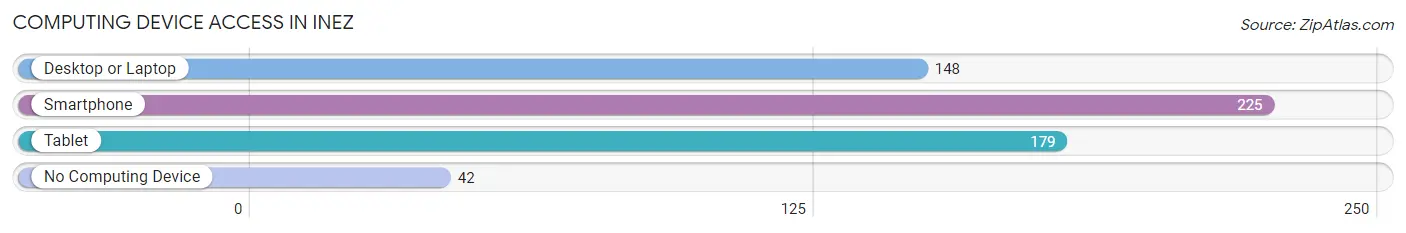
| Device Type | # Households | % Households |
| Desktop or Laptop | 148 | 51.9% |
| Smartphone | 225 | 78.9% |
| Tablet | 179 | 62.8% |
| No Computing Device | 42 | 14.7% |
| Total | 285 | 100.0% |
Internet Access in Inez
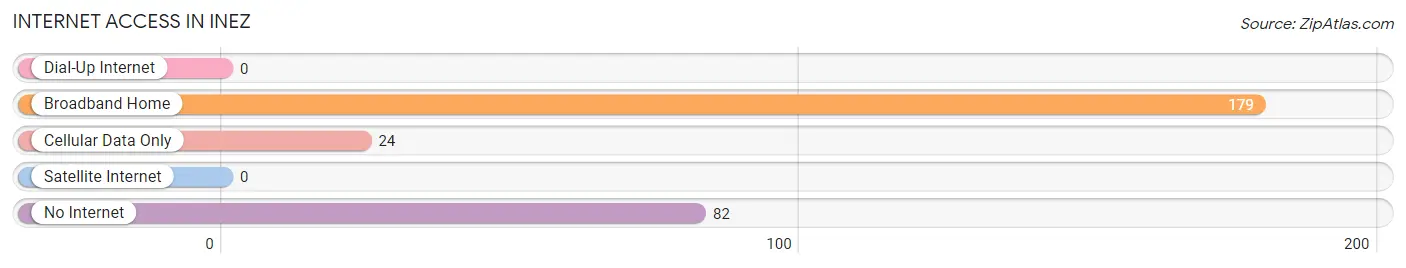
| Internet Type | # Households | % Households |
| Dial-Up Internet | 0 | 0.0% |
| Broadband Home | 179 | 62.8% |
| Cellular Data Only | 24 | 8.4% |
| Satellite Internet | 0 | 0.0% |
| No Internet | 82 | 28.8% |
| Total | 285 | 100.0% |
Inez Summary
Inez is a small town located in Martin County, Kentucky, United States. It is the county seat of Martin County and is located along the Tug Fork River. The population of Inez was 1,619 at the 2010 census.
History
Inez was founded in 1884 and named after Inez, the daughter of a local landowner. The town was incorporated in 1891 and was the first county seat of Martin County. Inez was the site of the first courthouse in the county, which was built in 1887.
The town was a major coal mining center in the early 20th century. The coal industry was the main source of employment for the town's residents. The coal industry declined in the mid-20th century, and the town's population began to decline as well.
Geography
Inez is located at 37°45'25"N 82°25'45"W (37.7569, -82.4292). The town is situated along the Tug Fork River, which forms the border between Kentucky and West Virginia. The town is located in the Appalachian Mountains and is surrounded by rolling hills and forests.
The climate in Inez is humid subtropical, with hot, humid summers and mild winters. The average annual temperature is 57°F (14°C). The average annual precipitation is 45 inches (114 cm).
Economy
The economy of Inez is largely based on agriculture and tourism. The town is home to several small businesses, including restaurants, shops, and a few manufacturing plants. The town is also home to a number of small farms, which produce a variety of crops, including corn, soybeans, and tobacco.
The town is also home to a number of tourist attractions, including the Martin County Historical Museum, the Inez Country Club, and the Inez Country Music Festival.
Demographics
As of the 2010 census, the population of Inez was 1,619. The racial makeup of the town was 97.2% White, 0.9% African American, 0.2% Native American, 0.2% Asian, 0.1% Pacific Islander, 0.4% from other races, and 0.9% from two or more races. Hispanic or Latino of any race were 1.2% of the population.
The median income for a household in Inez was $25,938, and the median income for a family was $31,250. The per capita income for the town was $14,945. About 17.2% of families and 20.2% of the population were below the poverty line, including 28.3% of those under age 18 and 16.2% of those age 65 or over.
Common Questions
What is Per Capita Income in Inez?
Per Capita income in Inez is $34,078.
What is the Median Family Income in Inez?
Median Family Income in Inez is $77,083.
What is the Median Household income in Inez?
Median Household Income in Inez is $37,159.
What is Income or Wage Gap in Inez?
Income or Wage Gap in Inez is 1.8%.
Women in Inez earn 98.2 cents for every dollar earned by a man.
What is Family Income Deficit in Inez?
Family Income Deficit in Inez is $6,216.
Families that are below poverty line in Inez earn $6,216 less on average than the poverty threshold level.
What is Inequality or Gini Index in Inez?
Inequality or Gini Index in Inez is 0.60.
What is the Total Population of Inez?
Total Population of Inez is 835.
What is the Total Male Population of Inez?
Total Male Population of Inez is 368.
What is the Total Female Population of Inez?
Total Female Population of Inez is 467.
What is the Ratio of Males per 100 Females in Inez?
There are 78.80 Males per 100 Females in Inez.
What is the Ratio of Females per 100 Males in Inez?
There are 126.90 Females per 100 Males in Inez.
What is the Median Population Age in Inez?
Median Population Age in Inez is 51.5 Years.
What is the Average Family Size in Inez
Average Family Size in Inez is 3.1 People.
What is the Average Household Size in Inez
Average Household Size in Inez is 2.5 People.
How Large is the Labor Force in Inez?
There are 360 People in the Labor Forcein in Inez.
What is the Percentage of People in the Labor Force in Inez?
47.6% of People are in the Labor Force in Inez.
What is the Unemployment Rate in Inez?
Unemployment Rate in Inez is 5.6%.